GAO United States General Accounting Office Briefing Report to Congressional Requesters ,July 1993 RAILROAD SAFETY Human Factor Accidents and Issues Affecting Engineer Work Schedules

Welcome message from author
This document is posted to help you gain knowledge. Please leave a comment to let me know what you think about it! Share it to your friends and learn new things together.
Transcript
GAO United States General Accounting Office
Briefing Report to Congressional Requesters
,July 1993 RAILROAD SAFETY Human Factor Accidents and Issues Affecting Engineer Work Schedules

- - . - I _ _
GAO United States General Accounting Office Washington, D.C. 20648
Resources, Community, and Economic Development Division
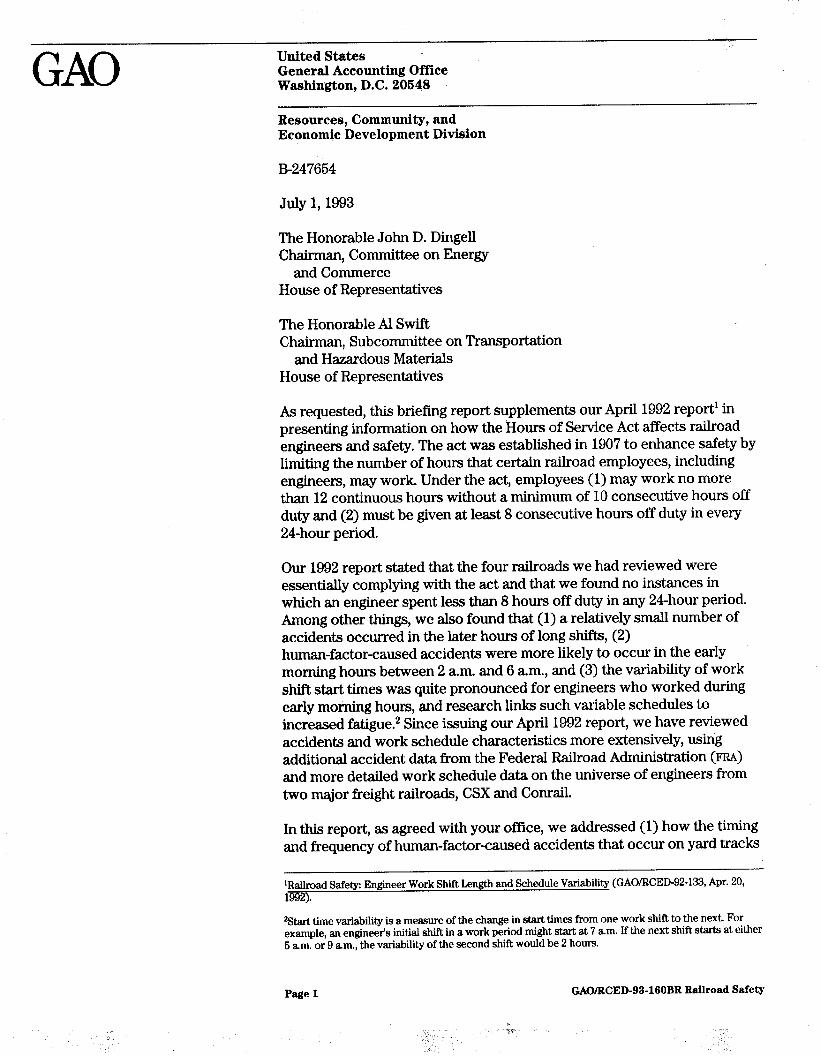
B-247654
July 1,1993
The Honorable John D. Dingell Chairman, Committee on Energy
and Commerce House of Representatives
The Honorable Al Swift Chairman, Subcommittee on Transportation
and Hazardous Materials House of Representatives
As requested, this briefing report supplements our April 1992 report’ in presenting information on how the Hours of Service Act affects railroad engineers and safety. The act was established in 1907 to enhance safety by limiting the number of hours that certain railroad employees, including engineers, may work. Under the act, employees (1) may work no more than 12 continuous hours without a minimum of 10 consecutive hours off duty and (2) must be given at least 8 consecutive hours off duty in every 24-hour period.
Our 1992 report stated that the four railroads we had reviewed were essentially complying with the act and that we found no instances in which an engineer spent less than 8 hours off duty in any 24-hour period. Among other things, we also found that (1) a relatively small number of accidents occurred in the later hours of long shifts, (2) human-factor-caused accidents were more likely to occur in the early morning hours between 2 a.m. and 6 am., and (3) the variability of work shift start times was quite pronounced for engineers who worked during early morning hours, and research links such variable schedules to increased fatiguee2 Since issuing our April 1992 report, we have reviewed accidents and work schedule characteristics more extensively, using additional accident data from the Federal Railroad Administration (FEN) and more detailed work schedule data on the universe of engineers from two major freight railroads, CSX and Conrail.
In this report, as agreed with your office, we addressed (1) how the timing and frequency of human-factor-caused accidents that occur on yard tracks
‘Railroad Safety: Engineer Work Shift Length and Schedule Variability (GAO/RCED-92-133, Apr. 20, 1992).
?3art time variability is a measure of the change in start times from one work shift to the next. For example, an engineer’s initial shift in a work period might start at 7 a.m. If the next shift starts at either 6 am. or 9 am., the variability of the second shift would be 2 hours.
Page 1 GAO/RCED-93-160BR Railroad Safety
B-247654
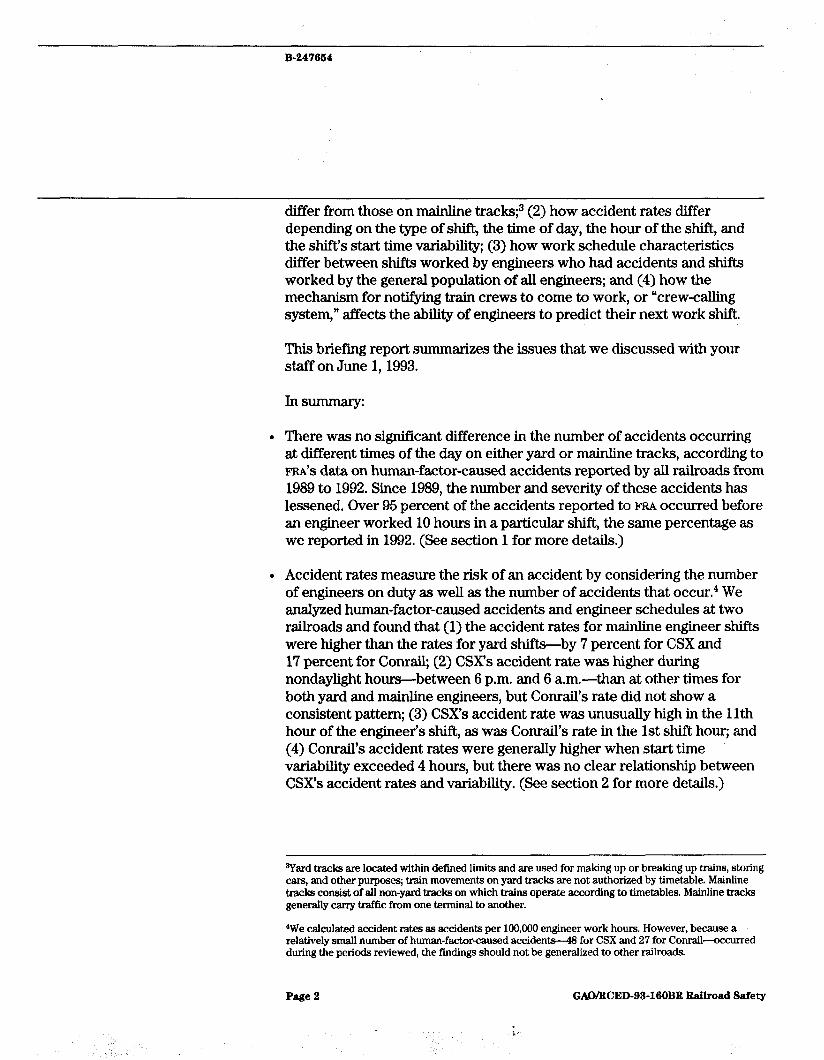
differ from those on mainline trackq3 (2) how accident rates differ depending on the type of shift, the time of day, the hour of the shift, and the shift’s start time variability; (3) how work schedule characteristics differ between shifts worked by engineers who had accidents and shifts worked by the general population of ah engineers; and (4) how the mechanism for notifying train crews to come to work, or “crew-calling system,” affects the ability of engineers to predict their next work shift.
This briefing report summarizes the issues that we discussed with your staff on June 1,1993.
In summary:
l There was no significant difference in the number of accidents occurring at different times of the day on either yard or mainline tracks, according to FRA’S data on human-factor-caused accidents reported by aU railroads from 1989 to 1992. Since 1989, the number and severity of these accidents has lessened. Over 95 percent of the accidents reported to FRA occurred before an engineer worked 10 hours in a particular shift, the same percentage as we reported in 1992. (See section 1 for more details.)
l Accident rates measure the risk of an accident by considering the number of engineers on duty as well as the number of accidents that occur.4 We analyzed human-factor-caused accidents and engineer schedules at two railroads and found that (1) the accident rates for mainline engineer shifts were higher than the rates for yard shifts-by 7 percent for CSX and 17 percent for Conrail; (2) CSX’s accident rate was higher during nondaylight hours-between 6 p.m. and 6 a.m.-than at other times for both yard and mainline engineers, but Conrail’s rate did not show a consistent pattern; (3) CSX’s accident rate was unusually high in the 1 lth hour of the engineer’s shift, as was Conrail’s rate in the 1st shift hour; and (4) Conrail’s accident rates were generally higher when start time variability exceeded 4 hours, but there was no clear relationship between CSX’s accident rates and variability. (See section 2 for more details.)
%rd tracks are located within defined limits and are used for making up or breaking up trains, storing cars, and other purposes; train movements on yard tracks are not authorized by timetable. Mainline tracks consist of all non-yard tracks on which trains operate according to timetables. Mainline tracks generally cany traffic from one terminal to another.
‘We calculated accident rates as accidents per 100,000 engineer work hours. However, because a relatively small number of human-factorcaused accidents--48 for CSX and 27 for Conrail-occurred during the periods reviewed, the findings should not be generalized to other railroads.
Page 2 GAO/RCED-93-160BB Railroad Safety
B-247664
l For the most part, the schedules of engineers who had accidents were no different from the schedules of all engineers at both CSX and Conrail when we analyzed the schedules over 2-week work periods. However, engineers who had accidents had somewhat greater shift variability-as much as 22 percent more on average at Conrail-than engineers in the general population. In addition, mainline shifts had significantly greater start time variability than yard shifts, as measured from the previous shift worked. Yard shifts at Conrail and CSX averaged 1.6 and 2.3 hours of ’ variability, respectively, while mainline shifts averaged 4.7 and 5.2 hours. Also, variability was consistently higher for any shift that included time between 2 a.m. and 6 a.m. This is consistent with the variability estimates included in our 1992 report. (See section 3 for more details.)
l Engineers that do not work regular schedules are called for their next shift about 2 hours before they need to report for work. Besides providing this notification, the crew-calling systems we reviewed also provide information to train crews on anticipated train runs and engineer placement in staffing pools. These systems enable engineers to generally predict their next work shift at least 8 to 12 hours prior to reporting. On occasion, however, unexpected changes such as the rescheduling of trains may change the time that an engineer is called to work. Because engineers make decisions about when they will sleep on the basis of when they anticipate being called to work, they may not be adequately rested when an unexpected scheduling change occurs, This was the case when an engineer and three crew members were killed in a Corona, California, accident when the engineer fell asleep and ran through a stop signal. After his previous shift, the engineer had decided not to sleep until it was closer to his next shift. But he was called to work earlier than expected; as a result, he had been awake for more than 26 hours when he started the new Shift.
Labor union representatives told us that the 2-hour notification window was too short to allow engineers to properly plan their personal activities and sleep time, However, since crew-calling systems generally allow engineers to predict their next work shift at least 8 hours prior to reporting, engineers may plan their personal activities on the basis of that information. We have no clear evidence that fatigue can be reduced and accidents can possibly be avoided by simply adding time to the notification window. (See section 4 for more details.)
Page 3 GAO/RCED-93-160BR Railroad Safety
B-247664
In conducting our review, we anaiyzed FRA’S data base of 3,817 human-factor-caused accidents that occurred between January 1,1989, and December 341992. We also reviewed characteristics of engineer schedules for two railroads, CSX and ConraiL We obtained payroll work schedule data for ah engineers at these railroads for two time periods: July 1,1991, to June 30,1992, for CSX; and July 10,1991, to November 30, 1991, for Conrail. These data bases contained about 750,000 and 187,000 work schedules, respectively.
We also reviewed crew-tailing systems for three major railroads: CSX, Chicago and Northwestern (CNW), and Burlington Northern (BN). Unlike our analyses of work schedule characteristics and human-factor-caused accidents, our work on crew-cahing systems was not based on an analysis of data. (See app. I for more details.)
As requested, we did not discuss the findings of this report with the Association of American Railroads or the Brotherhood of Locomotive Engineers. We did, however, discuss our methodology with officials from these organizations, and they agreed with our approach.
As arranged with your offices, unless you announce its contents earlier, we plan no further distribution of this briefing report until 30 days after the date of this letter. At that time, we will send copies to the Secretary of Transportation; the President, Association of American Raihoads; and the President, Brotherhood of Locomotive Engineers. We wiII make copies available to others on request. Please contact me on (202) 512-6001 if you or your staff have any questions. Other major contributors to this briefing report are listed in appendix II.
Kenneth M. Mead Director, Transportation Issues
Page 4 GAG/WED-93-160BB Railroad Safety

Pa6e 6 GAWBCED-93-160BB Railroad Safety
“. 7 .L, i
Contents
Letter 1 0
Section 1 Little Change in Distribution of Human-Factor-Caused Accidents Since 1989
8
Section 2 Analysis of Accident Rates for Two Major
Accident Rates by Type of Shift Accident Rates by Time of Day Accident Rates by Hour of Shift
Freight Railroads” Accident Rates by Shift Variability
13 13 13 15 16
Section 3 Work Schedule Characteristics for CSX and Conrail Engineers and Shifts
Schedule Characteristics Are Similar for Accident and General Population Engineers
Differences in Variability Are More Pronounced Between Mainline and Yard Shifts
18 18
20
Section 4 Crew-Calling Systems Pooling Arrangements and Engineer Work Scheduling
May Affect Engineers’ Crew Calling Linked to Train Scheduling Predicting Engineer start Times
Ability to Predict Deadheading Affects Predictability of Work Starts
Their Next Work Shift
22 22 23 23 24
Appendix I Scope and Methodology
26 Differences Between Accidents on Mainline and Yard Tracks Differences in Accident Rates ’ Differences in Schedule Characteristics Effect of Crew-Calling Systems on the Ability of Engineers to
Predict Their Next Work Shift
27 27 28 29
Page 6 GAO/WED-93.160BB Bailroad Safety
!
cont43nts
Appendix II 30
Major Contributors to Resources, Community, and Economic Development Division, 30
This Briefing Report Washington, D.C.
Chicago Regional Office 30
Tables Table 1.1: Human-Factor-Caused Accidents, 1989-92 8 Table 1.2: Accidents by Time of Day I 12 Table 3.1: Average Shift Length Over 2-Week Periods, in Hours 18 Table 3.2: Shift Density in a 2-Week Period 18 Table 3.3: Average Variability Over 2-Week Periods, in Hours 19 Table 3.4: Shift Lengths of Mainline vs. Yard Shifts, in Hours 20 Table 3.5: Variability of Mainline vs. Yard Shifts, in Hours 20 Table 1.1: Number and Type of Engineers’ Work Shifts Analyzed 26
Figures Figure 1.1: Distribution of All Accidents by Hour of Engineer’s Shift
9
Figure 1.2: Distribution of Yard Accidents by Hour of Engineer’s Shift
10
Figure 1.3: Distribution of Mainline Accidents by Hour of Engineer’s Shift
11
Figure 2.1: CSX Accident Rates by 4-Hour Time Block 14 Figure 2.2: Conrail Accident Rates by 4Hour Time Block 15 Figure 2.3: Accident Rates by Hour of Shift 16 Figure 2.4: Accident Rates by Shift Variability 17
Abbreviations
AAR
BLEl BN
CNW
FRA GAO
Association of American Railroads Brotherhood of Locomotive Engineers Burlington Northern Railroad Chicago and Northwestern Railroad Federal Railroad Administration General Accounting Office
Page 7 GAO/WED-93-16OBB Railroad Safety
Section 1
Little Change in Distribution of Human-Factor-Caused Accidents Since 1989
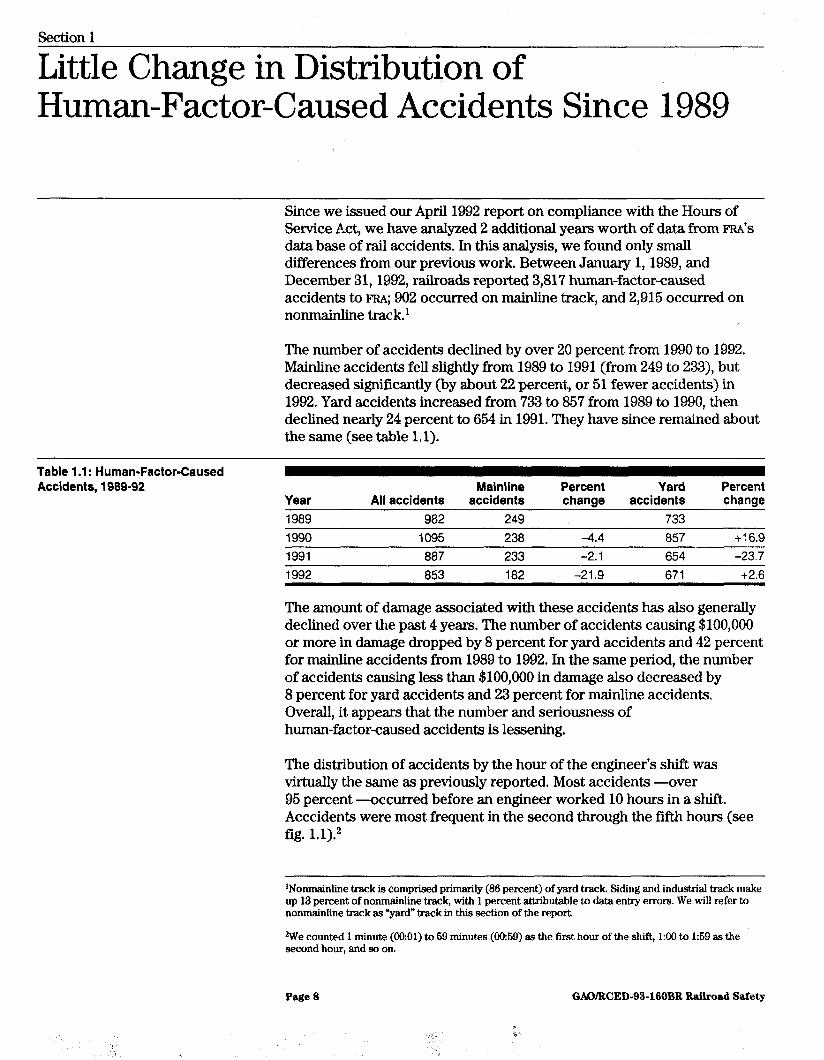
Since we issued our April 1992 report on compliance with the Hours of Service Act, we have analyzed 2 additional years worth of data from FRA’S data base of rail accidents. In this analysis, we found only small differences from our previous work. Between January 1,1989, and December 31,1992, railroads reported 3,817 human-factor-caused accidents to FRA; 902 occurred on mainline track, and 2,915 occurred on nonmainline track.’
The number of accidents declined by over 20 percent from 1990 to 1992. Mainline accidents fell slightly from 1989 to 1991 (from 249 to 233), but decreased significantly (by about 22 percent, or 51 fewer accidents) in 1992. Yard accidents increased from 733 to 857 from 1989 to 1990, then declined nearly 24 percent to 654 in 1991. They have since remained about the same (see table 1.1).
Table 1 .l : Human-Factor-Caused Accidents, 1989-92
Year All accidents Mainline
accidents Percent change
Yard accidents
Percent change
1989 982 249 733 1990 1095 238 -4.4 857 +16.9 1991 887 233 -2.1 654 -23.7
The amount of damage associated with these accidents has also generally declined over the past 4 years. The number of accidents causing $100,000 or more in damage dropped by 8 percent for yard accidents and 42 percent for mainline accidents from 1989 to 1992. In the same period, the number of accidents causing less than $100,000 in damage also decreased by 8 percent for yard accidents and 23 percent for mainline accidents. Overall, it appears that the number and seriousness of human-factorcaused accidents is lessening.
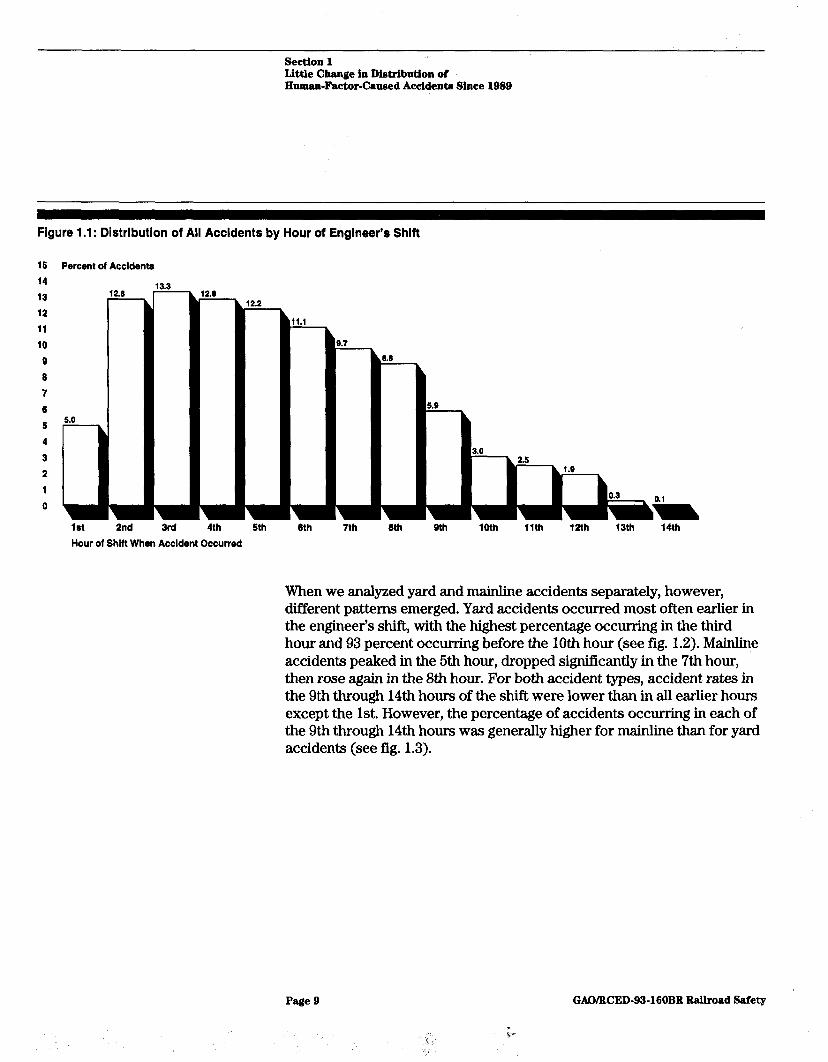
The distribution of accidents by the hour of the engineer’s shift was virtually the same as previously reported. Most accidents -over 95 percent -occurred before an engineer worked 10 hours in a shift. Acccidents were most frequent in the second through the fifth hours (see fig. 1.1).2
‘Nonmainline track is comprised primarily (86 percent) of yard track. Siding and industrial track make up 13 percent of nonmainline track, with 1 percent attributable to data entry errors. We will refer to nonmainline track as “yard” track in this section of the report.
%Ve counted 1 minute (0o:Ol) to 69 minutes (0059) as the first hour of the shift, 1:00 to 1:59 as the second hour, and so on.
Page 8 GAOiJNED-93-160BB Railroad Safe@
section 1 Little Change in Distribution of Human-Factor-Caused Accidents Since 1989
Figure 1 .l : Distribution of All Accidents by Hour of Englneer’s Shift
15 14 13 12 11 10
B 6 7 6 5 4 3 2 1 0
Percent of Accident8
9th 10th 11th 12th 13th 14th Hour of Shift When Accident Occurred
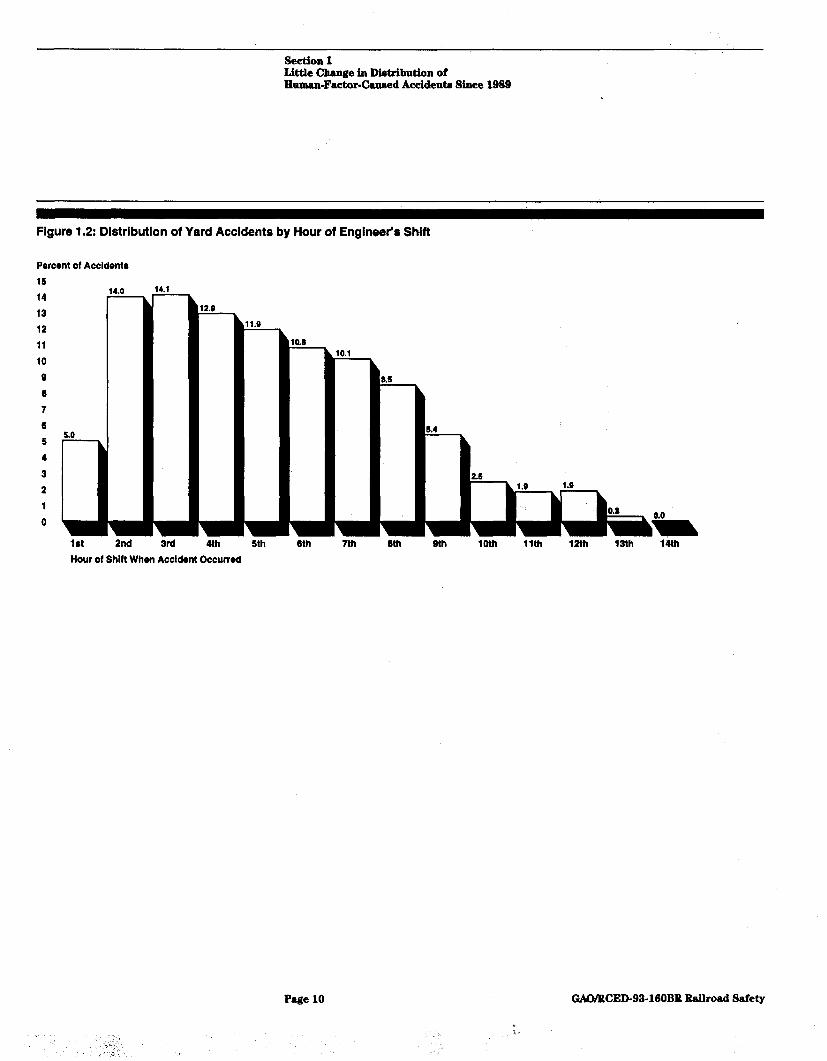
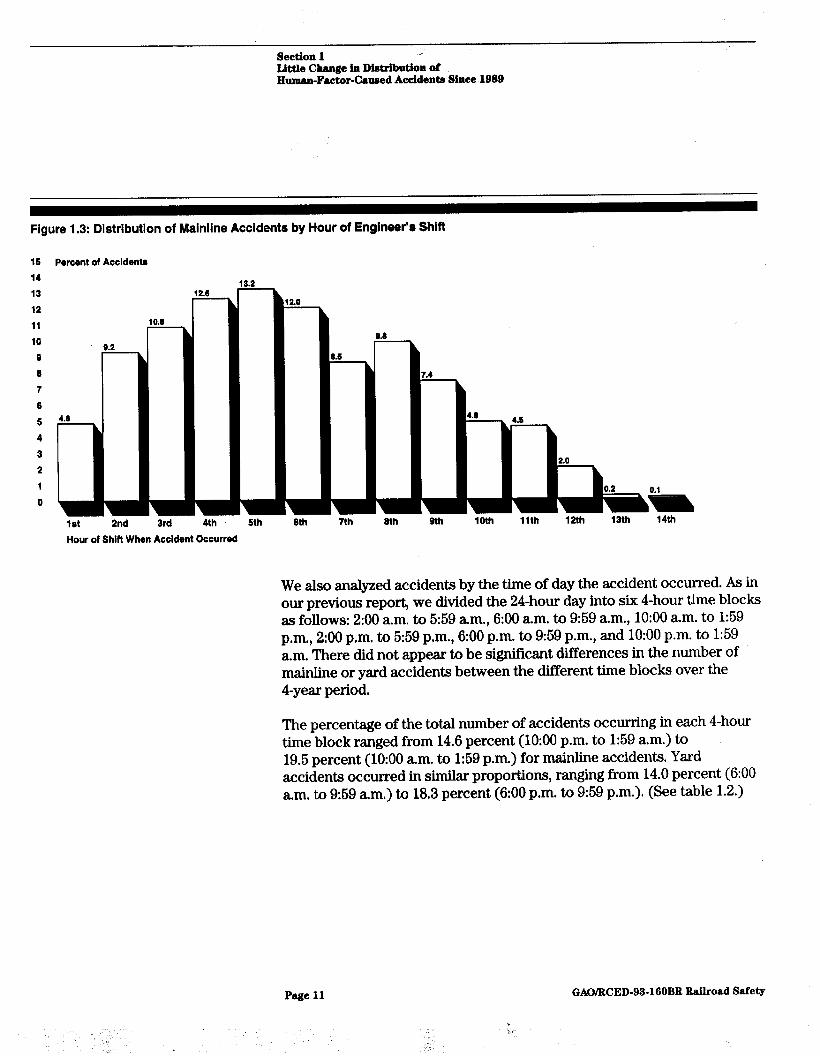
When we analyzed yard and mainline accidents separately, however, different patterns emerged. Yard accidents occurred most often earlier in the engineer’s shift, with the highest percentage occurring in the third hour and 93 percent occurring before the 10th hour (see fig. 1.2). Mainline accidents peaked in the 6th hour, dropped significantly in the 7th hour, then rose again in the 8th hour. For both accident types, accident rates in the 9th through 14th hours of the shift were lower than in all earlier hours except the 1st. However, the percentage of accidents occurring in each of the 9th through 14th hours was generally higher for mainline than for yard accidents (see fig. 1.3).
Page 9 GAO/WED-93-160BB Bailroad Safe@
section1 LittleCbangeinDWributionof E~~~~r-ClnsedAeeidenteS~e1989
Figure 1.2: Dlstributlon of Yard Accidents by Hour of Engineer’s Shift
Percent of Accldentr Percent of Accldentr 15 15 14 14 14.0 14.0
13 13 12 12 11 11 10 10 9 9 0 0 r r 5 5
5.0
4 3 2 1 0
a 1st 2nd 3rd
5.4
5th 9th 10th 11th 12th 13th 14th Hour of Shift When Accident Occurred
Page10 GAO/NED-93.16OBBBailroadSafety
Section 1 Little Change in Dimtribution of Human-Factor-Caused Accidents Since 1989
Figure 1.3: Distribution of Mainline Accidents by Hour of Engineer’s Shift
15 Percent of Accldente 14 13 12 11 10.6
10 a 8 7 8 5 4 3 2 1 0
4th 5th 8th 7th 8th ath 10th 11th 12th 13th 14th
Hour of Shift When Accident Occurred
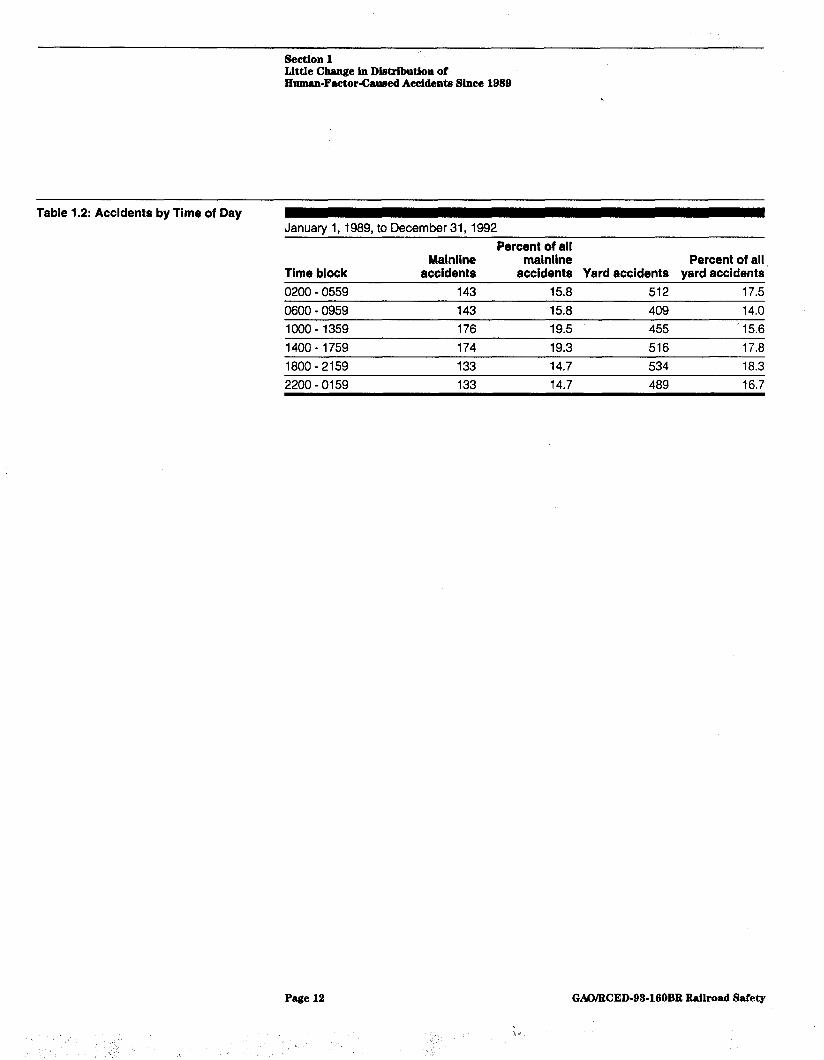
We also analyzed accidents by the time of day the accident occurred. As in our previous report, we divided the 24-hour day into six 4-hour time blocks as follows: 200 a.m. to 5:59 am., 6:00 a.m. to 9:59 a.m., 10:00 a.m. to 1:59 p.m., 2:00 p.m. to 5:59 p.m., 6~00 p.m. to 959 p.m., and 10:00 p.m. to 1:59 a.m. There did not appear to be significant differences in the number of mainline or yard accidents between the different time blocks over the 4-year period.
The percentage of the total number of accidents occurring in each 4-hour time block ranged from 14.6 percent (10:00 p.m. to 1:59 a.m.) to 19.5 percent (10:00 am. to 1:59 p.m.) for mainline accidents. Yard accidents occurred in similar proportions, ranging from 14.0 percent (6:00 a.m. to 959 am.) to 18.3 percent (6:00 p.m. to 9:59 p.m.). (See table 1.2.)
Page 11 GAO/WED-93-160BE Railroad Safety
Section 1 Little Change in Dietibution of Human-Factor-Caused Accidenta Since 1989
Table 1.2: Accidents by lime of Day Januarvl.1989,to December31,1992
lime block 0200-0559 143 15.8 512 17.5
Percent of all Mainline mainline Percent of all
accidents accidents Yard accidents yard accidents
0600-0959 143 15.8 409 14.0 1000-1359 176 19.5 455 '15.6 1400-1759 174 19.3 516 17.8 1800.2159 133 14.7 534 18.3 2200-0159 133 14.7 489 16.7
Page 12 GAD/RCED-93.160BP Bailroad Safety
Section 2
Analysis of Accident Rates for Two Major Freight Railroads
Accident rates (accidents per 100,000 engineer work hours) provide a better understanding of the likelihood of accidents than a straight count of the number of accidents that occur. Using data bases of work schedule information for all engineers, we analyzed accident rates for CSX and Conrail for the time periods covered by the data bases. During these periods, a relatively small number of human-factor-caused accidents occurred -48 (18 mainline and 30 yard) for CSX and 27 (13 mainline and 14 yard) for Conrail. We calculated the accident rates by (1) type of shift (yard or mainline), (2) time of day, (3) hour into shift, and (4) start time variability of the shift.’ Our earlier report contained only estimates of accident rates by time of day.
Accident Rates by 7jpe of Shift
The overall CSX accident rates for the period July 1,1991, to June 30,1992, were 0.70 accidents per 100,000 hours for all types of shifts; 0.68 for yard shifts; and 0.73 for mainline shifts. In comparison, Conrail accident rates were considerably higher between July 10,1991, and November 30,199l. The overall rate was 1.41 accidents per 100,000 hours, while the yard rate was 1.31 and the mainline rate was 1.53. At both railroads, the accident rate was higher for mainline shifts than for yard shifts -by 7 percent for CSX and by 17 percent for Conrail.
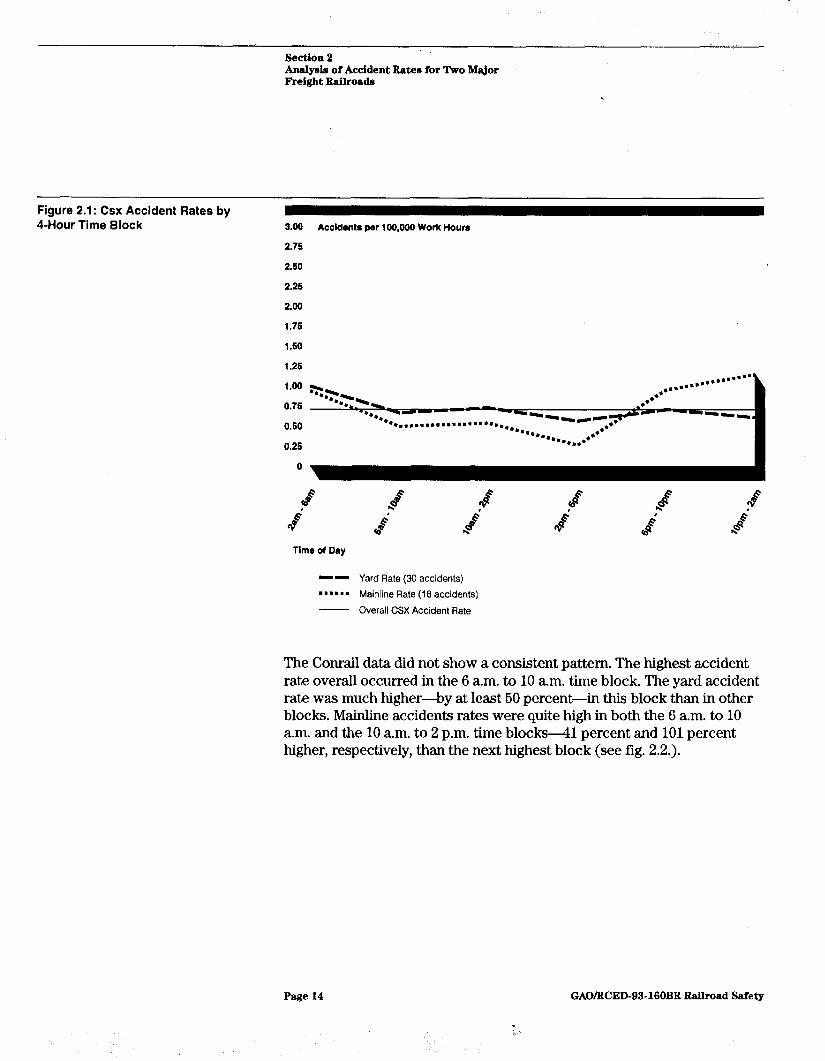
Accident Rates by Time of Day
in calculating when accidents occurred. Here we found that CSX had a higher accident rate for mainline shifts during nondaylight hours between 6 p.m. and 6 a.m. The accident rate for yard engineers was highest in the 2 a.m. to 6 a.m. time period but it was only slightly higher than at other times (see fig. 2.1).
‘The results of our analyses apply only to the time periods covered by the schedule data obtained from each railroad. They should not be generalized to other time periods or other railroads. (See app. I.)
Page 13 GMMWED-93.160BB Bailroad Safety
Section 2 Analysis of Accident Rates for Two Major Freight.R.ailroads
Figure 2.1: Csx Accident Rates by 4-Hour Time Block 3.00 Accidents per 100,000 Work Hours
2.75
2.50
2.25
2.00
1.75
1.50
1.25
. . . . . . . . . . . . . ..~m........
0.25
Time of Day
-- Yard Rate (30 accidents)
.I.-‘. Mainline Rate (18 accidents)
- Overall CSX Accident Rate
The Conrail data did not show a consistent pattern. The highest accident rate overall occurred in the 6 a.m. to 10 am. time block. The yard accident rate was much higher-by at least 50 percent-in this block than in other blocks. Mainline accidents rates were quite high in both the 6 a.m. to 10 a.m. and the 10 a.m. to 2 p.m. time blocks-41 percent and 101 percent higher, respectively, than the next highest block (see fig. 2.2.).
Page 14 GAO/RCED-93-160BB Railroad Safety
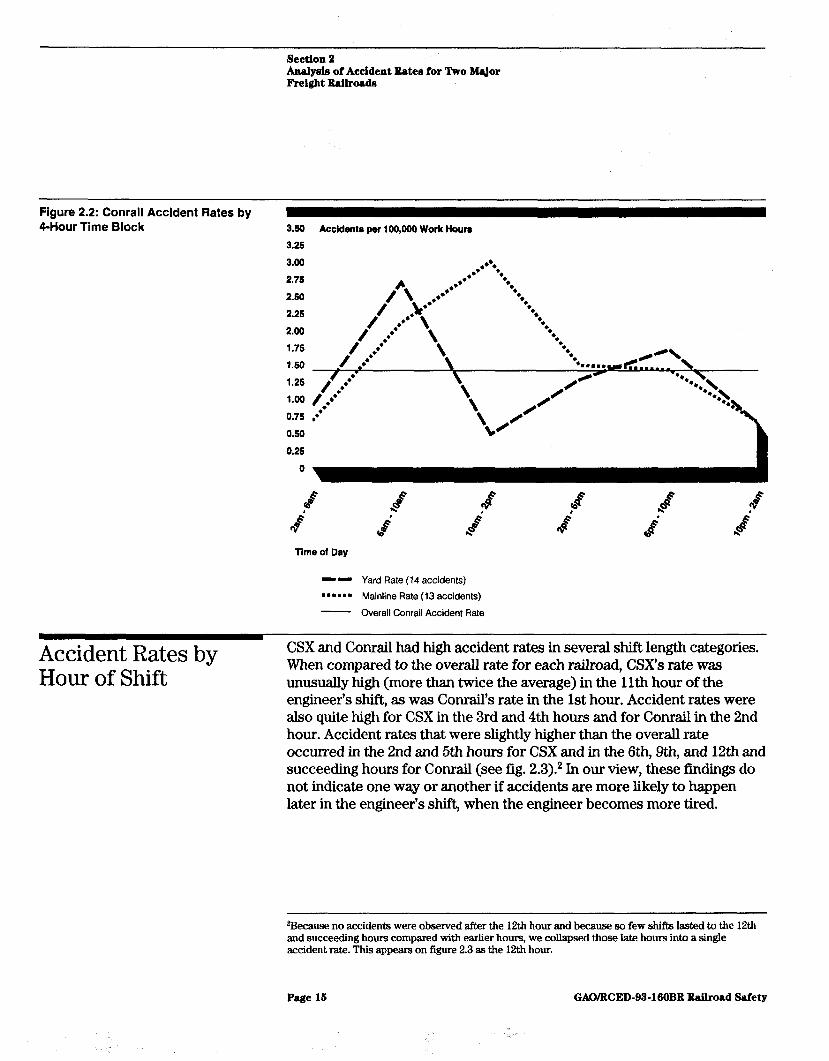
Section 2 Analyeb of Accident Ratee for Two Major Freight Railroads
Figure 2.2: Conrail Accident Rates by 4-Hour Time Block 2.50 Accidents per 100,000 Work Houn
3.25
3.00
2.7s
2.50
Time of Day
-- Yard Rate (14 accidents)
n m..*. Mainline Rate (13 accidents)
- Overall Conrail Accident Rate
Accident Rates by Hour of Shift
CSX and Conrail had high accident rates in several shift length categories. When compared to the overall rate for each railroad, CSX’s rate was unusually high (more than twice the average) in the 1 lth hour of the engineer’s shift, as was Conrail’s rate in the 1st hour. Accident rates were also quite high for CSX in the 3rd and 4th hours and for Conrail in the 2nd hour. Accident rates that were slightly higher than the overall rate occurred in the 2nd and 5th hours for CSX and in the 6th, 9th, and 12th and succeeding hours for Conrail (see fig. 2.3).2 In our view, these findings do not indicate one way or another if accidents are more likely to happen later in the engineer’s shift, when the engineer becomes more tired.
2Because no accidents were observed after the 12th hour and because so few shifts lasted to the 12th and succeeding hours compared with earlier hours, we collapsed those late hours into a single accident rate. Thii appears on figure 2.3 as the 12th hour.
Page 16 GAWRCED-93460BB Railroad Safety
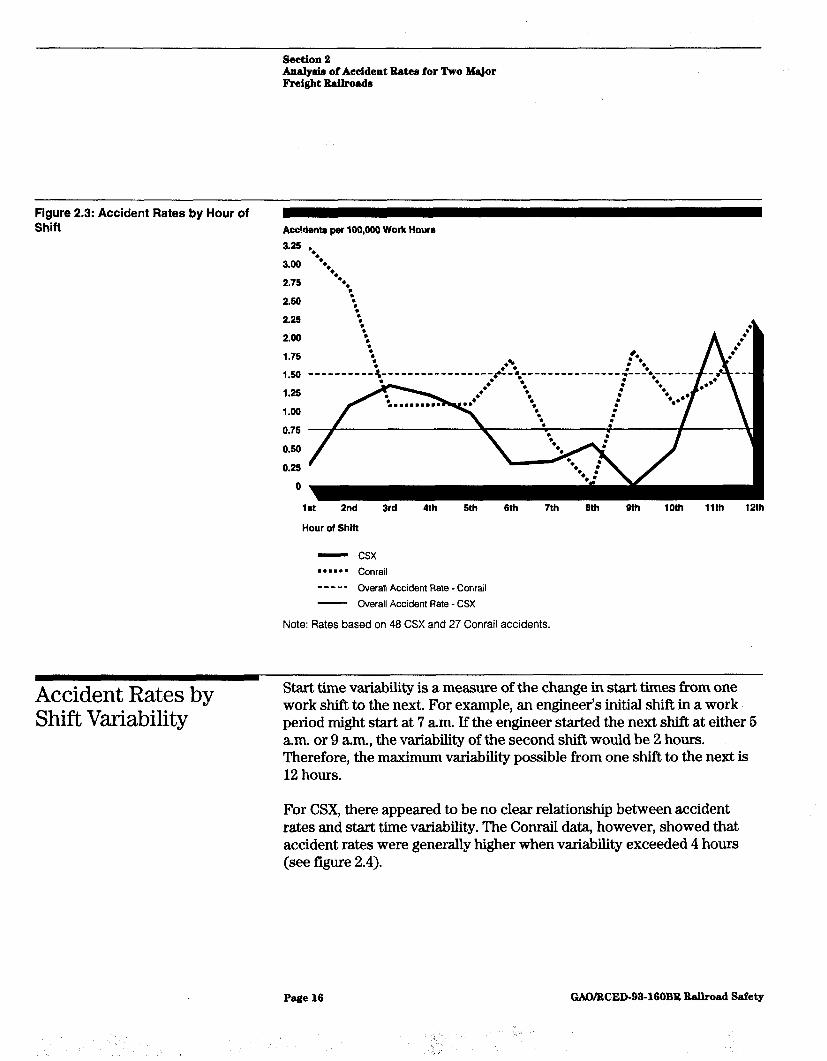
!section 2 Analyh of Accident Rates for Two Major Freight hilroads
Figure 2.3: Accident Rates by Hour of Shift AccMenta per lW,OO6 Work Hours
3.25 **
3.00 l **., 2.75 l *
l *. 2.50
. . T.
2.25 i : % ’ .*
2.00 ‘. .*
1.75 . . l . . l *
1.50 ----------‘r _---------------- &il---------------- <t-t .am----- Al
f t
-, -- ..-_ l *
1.25
1.w
0.75
0.50 \
0.25
0
1st 2nd 3rd 4th 5th 6th 7th 6th 9th 10th 11th 12th
Hour of Shift
- csx ....*m Conrail
- - - - - Overall Accident Rate - Conrail
- Overall Accident Rate - CSX
Note: Rates based on 48 CSX and 27 Conrail accidents.
Accident Rates by Shift Variability
Start time variability is a measure of the change in start times from one work shift to the next. For example, an engineer’s initial shift in a work period might start at 7 a.m. If the engineer started the next shift at either 5 a.m. or 9 a.m., the variability of the second shift would be 2 hours. Therefore, the maximum variability possible from one shift to the next is 12 hours.
For CSX, there appeared to be no dear relationship between accident rates and start time variability. The Conrail data, however, showed that accident rates were generally higher when variability exceeded 4 hours (see figure 2.4).
Page 16 GAOAWED-93-160BR Bailroad Safety
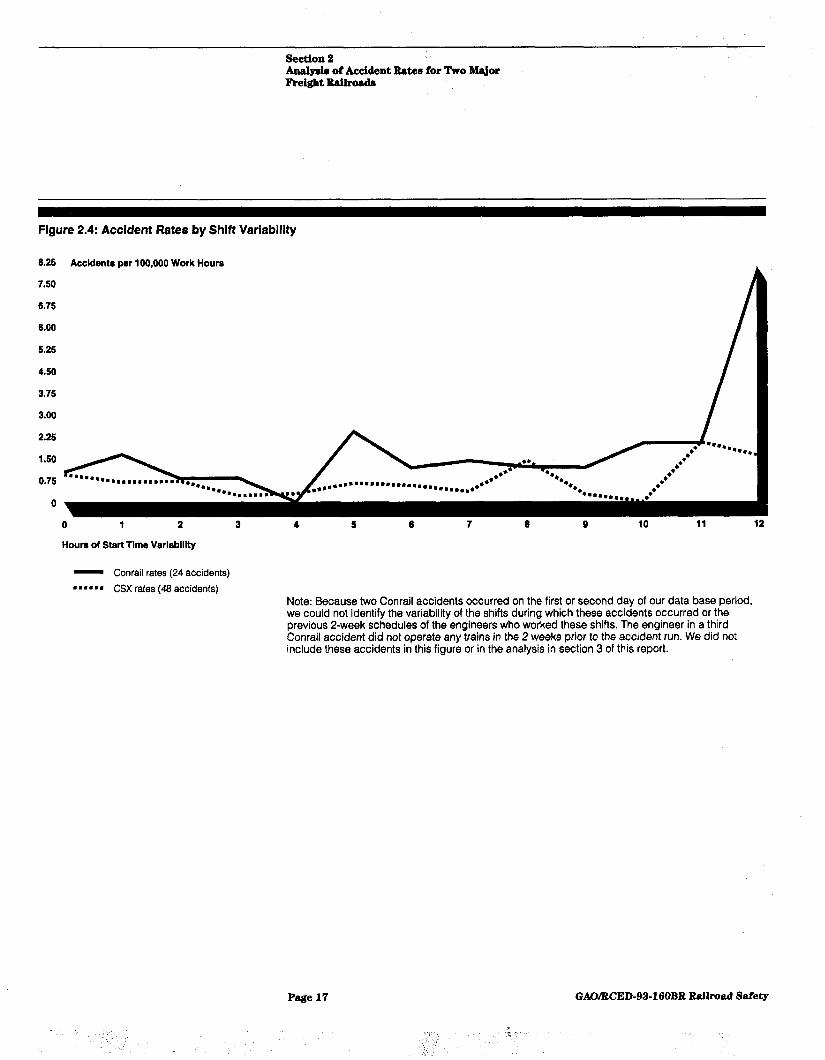
section 2 Analysis of Accident Batee for Two qor Preight ltailrords
Figure 2.4: Accident Rates by Shift Variability
5.25 Accident8 100,000 Work per Hour8
7.50
6.75
6.00
5.25
4.50
3.75
3.00
2.25
1.50
0.75 g.............
0
0 1 2 3 4 5 6 7 6 9 t0 11 12
Hours of Start Time Variability
- Conrail rates (24 accidents)
mmmmm- CSX rates (48 accidents) Note: Because two Conrail accidents occurred on the first or second day of our data base period, we could not identify the variability of the shifts during which these accidents occurred or the previous O-week schedules of the engineers who worked these shifts. The engineer in a third Conrail accident did not operate any trains in the 2 weeks prior to the accident run. We did not include these accidents in this figure or in the analysis in section 3 of this report.
Page 17 GAWBCED-W-MOBE Bailroad Safe*
w . /’ -6,’
:,‘,
Section 3
-Work Schedule Characteristics for CSX and Conrail Engineers and Shifts *
In addition to analyzing accident rates for CSX and Conrail, we also studied characteristics of engineers’ 2week work schedules, including the average shift length, the shift density, and the average start time variability. These characteristics were similar for engineers who had accidents compared to engineers in the general population. We also analyzed the shifts worked on yard trains and mainline trains. Mainline shifts had significantly greater start time variability than yard shifts, as , measured from the previous shift worked. Also, the average start time variability was higher for any shift that included time between 200 a.m. and 6:00 a.m. compared with any shift that did not include that time period. This is consistent with the estimates included in our 1992 report.
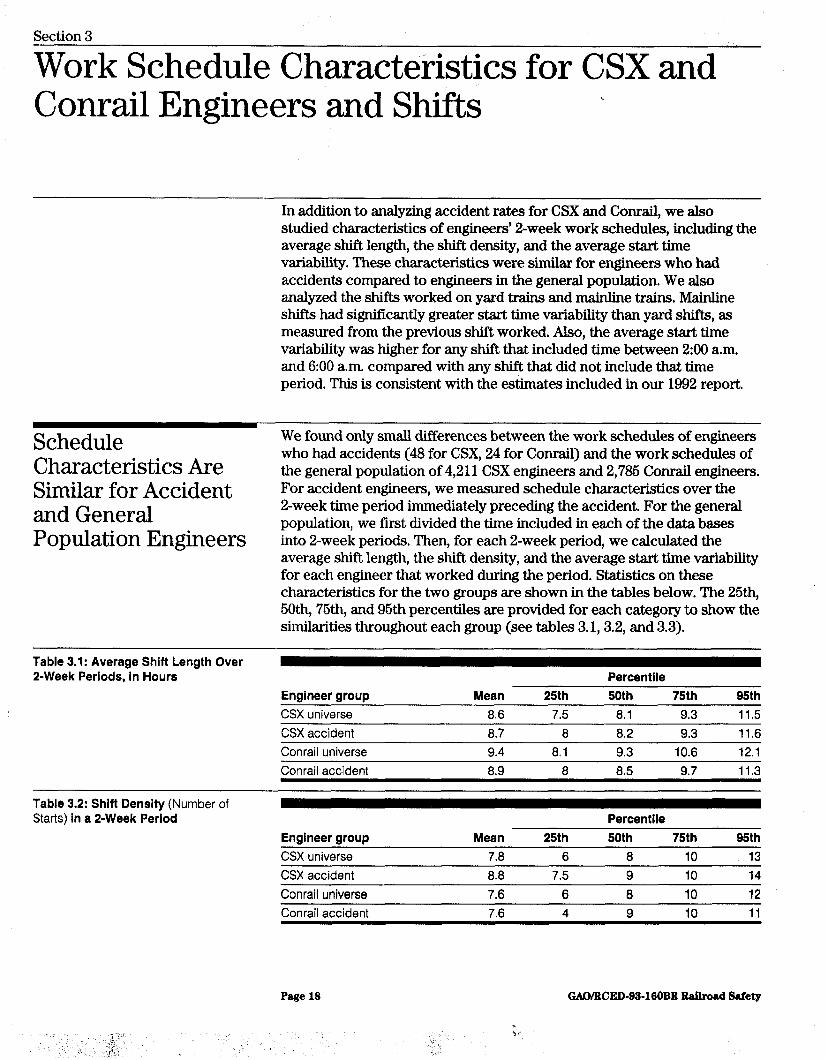
We found only small differences between the work schedules of engineers Schedule Characteristics Are Similar for Accident and General
who had accidents (48 for CSX, 24 for Conrail) and the work schedules of the general population of 4,211 CSX engineers and 2,735 Conrail engineers. For accident engineers, we measured schedule characteristics over the 2-week time period immediately preceding the accident. For the general
Population Engineers population, we first divided the time included in each of the data bases into 2-week periods. Then, for each 2-week period, we calculated the average shift length, the shift density, and the average start time variability for each engineer that worked during the period. Statistics on these characteristics for the two groups are shown in the tables below. The 25th, 5Oth, 75th, and 95th percentiles are provided for each category to show the similarities throughout each group (see tables 3.1,3.2, and 3.3).
Table 3.1: Average Shift Length Over 2-Week Periods, in Hours
Engineer group CSX universe
Mean 25th 8.6 7.5
Percentile 50th 75th 95th
8.1 9.3 11.5 CSX accident 8.7 8 8.2 9.3 11.6 Conrail universe 9.4 8.1 9.3 10.6 12.1 Conrail accident 8.9 8 8.5 9.7 11.3
Table 3.2: Shift Density (Number of Starts) in a 2-Week Period Percentile
Engineer group CSX universe CSX accident
Mean 25th 7.8 6 8.8 7.5
50th 75th 95th 8 10 13 9 10 14
Conrail universe 7.6 6 8 10 12 Conrail accident 7.6 4 9 10 11
Section 9 Work Schedule Cbaracterietia for CSX and Conrail Engineers and Shifta
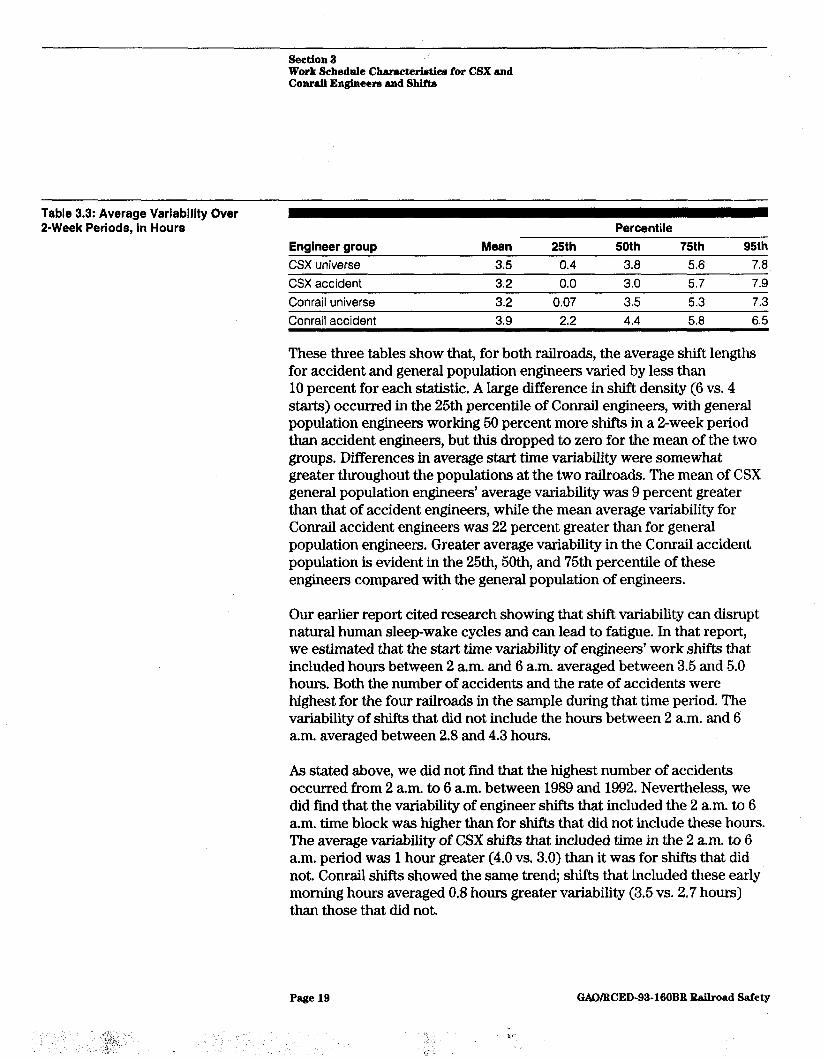
Table 3.3: Average Variability Over P-Week Periods, in Hours
Engineer group Mean 25th CSX universe 3.5 0.4 CSX accident 3.2 0.0
Percentile 50th 75th 95th
3.8 5.6 7.8 3.0 5.7 7.9
Conrail universe 3.2 0.07 3.5 5.3 7.3 Conrail accident 3.9 2.2 4.4 5.8 6.5
These three tables show that, for both railroads, the average shift lengths for accident and general population engineers varied by less than 10 percent for each statistic. A large difference in shift density (6 vs. 4 starts) occurred in the 25th percentile of Conrail engineers, with general population engineers working 50 percent more shifts in a 2-week period than accident engineers, but this dropped to zero for the mean of the two groups. Differences in average start time variability were somewhat greater throughout the populations at the two railroads. The mean of CSX general population engineers’ average variability was 9 percent greater than that of accident engineers, while the mean average variability for Conrail accident engineers was 22 percent greater than for general population engineers. Greater average variability in the Conrail accident population is evident in the 25th, 50th and 75th percentile of these engineers compared with the general population of engineers.
Our earlier report cited research showing that shift variability can disrupt natural human sleep-wake cycles and can lead to fatigue. In that report, we estimated that the start time variability of engineers’ work shifts that included hours between 2 a.m. and 6 a.m. averaged between 3.5 and 5.0 hours. Both the number of accidents and the rate of accidents were highest for the four railroads in the sample during that time period. The variability of shifts that did not include the hours between 2 am. and 6 a.m. averaged between 2.8 and 4.3 hours.
As stated above, we did not find that the highest number of accidents occurred from 2 a.m. to 6 a.m. between 1989 and 1992. Nevertheless, we did find that the variability of engineer shifts that included the 2 a.m. to 6 a.m. time block was higher than for shifts that did not include these hours. The average variability of CSX shifts that included time in the 2 a.m. to 6 a.m. period was 1 hour greater (4.0 vs. 3.0) than it was for shifts that did not. Conrail shifts showed the same trend; shifts that included these early morning hours averaged 0.8 hours greater variability (3.5 vs. 2.7 hours) than those that did not.
GAO/NED-93.160BB Railroad Safety
Section 3 Work Schedule Clmracteristica for CSX and Conrdl Engineers and Shifts
Differences in Variability Are More Pronounced Between Mainline and Yard Shifts
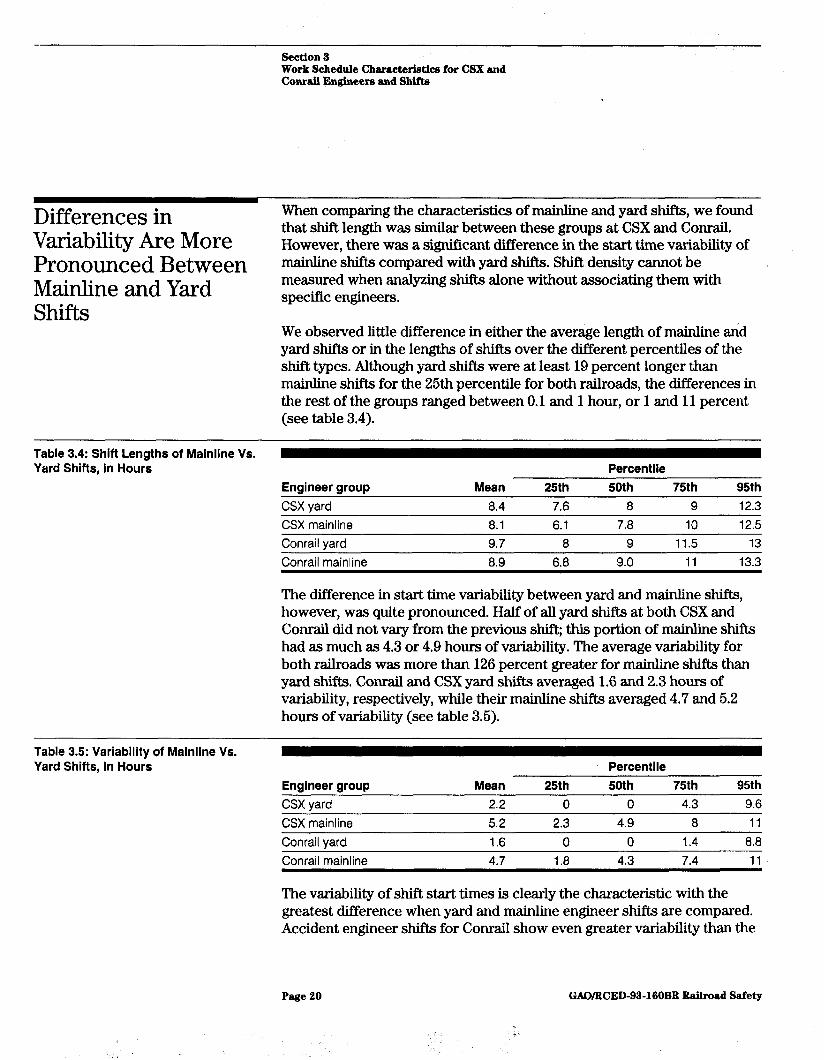
When comparing the characteristics of mainline and yard shifts, we found that shift length was similar between these groups at CSX and Conrail. However, there was a significant difference in the start time variability of mainline shifts compared with yard shifts. Shift density cannot be measured when analyzing shifts alone without associating them with specific engineers.
We observed little difference in either the average length of mainhne and yard shifts or in the lengths of shifts over the different percentiles of the shift types. Although yard shifts were at least 19 percent longer than mainline shifts for the 25th percentile for both railroads, the differences in the rest of the groups ranged between 0.1 and 1 hour, or 1 and 11 percent (see table 3.4).
Table 3.4: Shift Lengths of Mainline VS. Yard Shifts, In Hours
Engineer group Mean 25th Percentile 50th 75th 95th
CSX vard 8.4 7.6 8 9 12.3 CSX mainline 8.1 6.1 7.8 10 12.5 Conrail yard 9.7 8 9 11.5 13 Conrail mainline 8.9 6.8 9.0 11 13.3
The difference in start time variability between yard and mainline shifts, however, was quite pronounced. Half of all yard shifts at both CSX and Conrail did not vary from the previous shift; this portion of mainline shifts had as much as 4.3 or 4.9 hours of variability. The average variability for both railroads was more than 126 percent greater for mainline shifts than yard shifts. Conrail and CSX yard shifts averaged 1.6 and 2.3 hours of variability, respectively, while their mainline shifts averaged 4.7 and 5.2 hours of variability (see table 3.5).
Table 3.5: Variability of Mainline Vs. Yard Shifts, in Hours Percentile
Engineer group CSX yard
Mean 2.2
25th 0
50th 0
75th 4.3
95th 9.6
CSX mainline 5.2 2.3 4.9 8 11 Conrail yard 1.6 0 0 1.4 8.8 Conrail mainline 4.7 1.8 4.3 7.4 11
The variability of shift start times is clearly the characteristic with the greatest difference when yard and mainline engineer shifts are compared. Accident engineer shifts for Conrail show even greater variability than the
Page 20 GAO/RCED-93-160BB Bailroad Safety
Se&ton 3 Work Schedule Characteristics for CSX and Conrail Engineers and Shifts
general population of mainline and yard shifts for that railroad. We calculated the variability of the individual accident shifts and found that the average variability for mainline shifts was 6.60 hours, compared with 2.23 hours for yard shifts. These data indicate that, during this period, variability for Conrail may have been more closely linked to engineer fatigue and possibly to human-factor-caused accidents than average shift length or shift density over a %-week period.
Page 21 GAWRCEDd3-16OBB Bailroad Safety
Section 4
Crew-Calling Systems May mfect Engineers’ Ability to Predict Their Next Work Shift
Crew callers at three railroads -CSX, Burlington Northern (BN), and Chicago and Northwestern (CNW) -were generally able to notify engineers to come to work about 2 hours before their work shifts were scheduled to begin. The crew-calling system provides information to train crews on anticipated train nms and engineer placement in stafhmg pools on a continuous basis; engineers can generally predict whether they will be called to work at least 8 to 12 hours prior to reporting. However, unexpected changes, such as last-minute rescheduling of trains and moving tram crews to other locations to operate trains (called “deadheading”’ ), may change the time that an engineer is called to work. When this occurs, engineers may not plan for and receive adequate rest, and may therefore be fatigued when reporting for work.
Railroads use crew-calling systems to notify engineers to report to work who are not on regular work schedules. These engineers are part of work force “pools” from which eligible engineers are selected on a first-in-first-out basis when a train is ready for operation. The work pools, and the selections from them, take into account an engineer’s eligibility in terms of labor agreement work rules and of meeting the Hours of Service Act requirements. Engineers are not eligible for selection until they have had the act’s required time off-duty since the completion of their previous work shift. The three railroads we reviewed had similar crew-calling systems for (1) notifying engineers of the need to report to work and (2) providing information to engineers for predicting their work shifts.
Pooling Arrangements Engineers generally fall into three categories in terms of their work
and Engineer Work schedules. The first category consists of engineers who work regularly assigned shifts where they start work at the same time each day. This
Scheduling includes the majority of yard engineers and some mainline engineers. A second category, pool engineers, includes most mainline engineers. Because their work corresponds to the scheduling of trains, the starting time for a pool engineer’s work shift is dependent on the volume of train traffic on any given day. This category is heavily dependent on the crew-calling system to ensure that engineers are called in and are available for work when needed. The third category consists of “extra board” engineers who fill in for engineers in the first two categories who are not able to work due to illness, vacation, or other reasons.
‘Deadheading is moving off-duty train personnel from one terminal to another at the railroad’s convenience.
Page 22 GADiTtCED-93-160BB Railroad Safety
Section 4 Crew-Calling SJrstema May Afi’ect Engineera’ Ability to Predict Their Next Work Shift
Pool engineers are assigned to pools that cover a specific territory or railroad operation. The engineers in the pool are assigned to work on a first-in-first-out basis as train runs are scheduled by yardmasters and dispatchers. When an engineer completes a shift and sufficient time has passed to fulfill the Hours of Service Act rest requirements, his or her name goes onto the pool list from which engineers are called to work as needed. The engineer’s name starts at the bottom of the list and moves ,up as engineers that are ahead of him or her are called to work. The position on the list at any give time is known as the engineer’s “standing” in the pool. When the engineer’s name reaches the top of the list, he or she is called to operate the next scheduled train. Crew callers notify engineers to report to work in response to requests for crew from train dispatchers.
Extra board engineers are called to work in the same manner as pool engineers. Their “pool,” however, consists only of the extra board engineers assigned to a specific area. They are called to work on a first-in-first-out basis as needed when there are not sufficient regular or pool engineers available to operate the trams as needed.
Crew Calling Linked to Train Scheduling changes to pool standings, are ultimately dependent on the scheduling of
trains. Train schedules, or “lineups,” are established before the time the trains are expected to run. However, the actual time an engineer is notified to report for duty is about 2 hours before the train’s authorized departure. Crew callers told us that they call engineers about 2 hours prior to the run, as soon as they receive notification from train dispatchers that the train will operate and that a crew is needed.
Anticipated freight train runs are subject to adjustment depending on the volume of traffic currently in the yard, the volume of traffic expected to arrive, including the release of cars from shippers (such as coal cars released by mine operators and power plants), and the availability of train crews. Train schedule changes and updates are continuously transmitted to crew callers. When changes occur, crew callers adjust the time for engineers to report to work accordingly.
Predicting Engineer Start Times
Engineers obtain information from the crew-calling system to plan when they will be called to work. These systems provide information on anticipated train lineups and crew standings. Although train lineups and crew standings are subject to change, the system gives the engineer some
Page 23 GAO/RCED-93-160BB Bailroad Safety
Section 4 Crew-Calling Syetema May Affect Engineers’ Ability to Predict Their Next Work Skif’t
indication of when he or she may be called to start the next shift. Such predictions allow the engineer to make arrangements for personal business and get sufficient rest prior to being called in to work.
The timeliness of the information available to engineers depends to some extent on the way each system stores and uses information. Engineers learn about train lineups and crew standings in a combination of ways. They include calling a voice automated system, viewing the information on remote computer terminals located throughout the system, or speaking to a crew caller. A voice automated system is a computerized data system that can give an engineer’s crew standing and the train lineup after the engineer keys in his identification number over the telephone. Voice automated systems contain the same information as the computers that the crew callers use.
Of the three railroads we reviewed, two used computerized crew-calling systems, while the third used a manual system to track crew standings and train lineups and provide the information to its engineers. The computerized crew-calling systems were updated more frequently and generally provided more timely information to engineers. For example, these systems automatically updated the crew standings in both the computers used by the crew callers and the voice automated system used by the engineers at the same time. Engineers obtaining information from the manual system relied on prerecorded messages which were updated about every 4 hours.
Deadheading Affects Engineers may be deadheaded on a train being operated by another
Predictability of Work working crew because their services are needed elsewhere or because there is no traffic at the location from which the engineer is deadheaded.
starts The decision to deadhead a crew depends on the amount of work to be performed at either the starting or the deadheaded location. Normally, engineers are only deadheaded from away-from-home locations. Also, railroads are limited by labor agreements as to the amount of time the railroad can hold an engineer away from home. He or she may therefore be deadheaded to the home location rather than wait for a train to be scheduled from the away-from-home location.
When an engineer is deadheaded instead of continuing to work at the location he or she origimdly reported to, the next engineer in the pool may be called to work earlier than anticipated. This particularly affects engineers waiting to be called while resting at away-from-home locations.
Page 24 GAO/BCED-93-160BB Railmad Safety
> ,, : b,’ .:. : .I
Seetlon 4 Crew-Calling Syatema May Affect Engineers’ Ability to Predict Their Next Work Skift
Deadheading can affect the crew standings, and consequently lessen the accuracy of engineers’ predictions about when they will be called to work. As a result, the engineer may not be able to properly schedule rest time and may be fatigued when reporting to work.
This situation occurred in the 1990 fatal accident involving two Santa Fe trains in Corona, California. The engineer of the at-fault train had operated a train earlier in the day to an away-from-home location, arriving at 12:40 p.m. He anticipated that he would not be called for duty until the following morning, and therefore he elected to delay going to bed until it was closer to the time he expected to be called back to work. However, three of the crews ahead of him in the standings were deadheaded to another location, and the engineer was called back to work about 10 hours after he had gone off duty. At that point, he had been awake for over 26 hours, prior to which he had slept only about 5 hours. The accident, which killed the engineer and three other crew members, was attributed to the engineer’s failure to stop the train at a stop signal because he was asleep.
As part of this review, we spoke to representatives of the Brotherhood of Locomotive Engineers, the primary U.S. labor union representing railroad engineers. We were consistently told that the 2-hour notification window for the crew-calling systems was too limited to allow engineers to properly plan their personal activities and sleep time. They said that requiring at least 8 hours notice would go far toward reducing fatigue among train crew members. In theory, we agree with this view -more advance notice would allow a critically tired engineer to rest for several hours before reporting for work.
At the same time, we cannot be sure that engineers are tired only because the notification of the time they must report to work may be insufficient. Since crew-calling systems generally allow engineers to predict their next work shift at least 8 hours prior to reporting, engineers may plan their personal activities on the basis of that information. We have no clear evidence that fatigue can be reduced and accidents possibly avoided by simply adding time to the notification window.
Pa6e 26 GAO/RCED-93-160BB Bailroad Safety
Appendix
Scope and Methodology
To achieve our review objectives, we analyzed information from FRA’S accident/incident data base, consisting of 4 years of data (January 1,1989 to December 31,1992) on human-factor-caused accidents. During this period, all railroads reported 3,817 human-factor-caused accidents. The Federal Railroad Administration (FRA) requires that railroads identify the type of track (mainline or yard) on which the accident occurred. We were therefore able to distinguish between these types of accidents in our analyses.
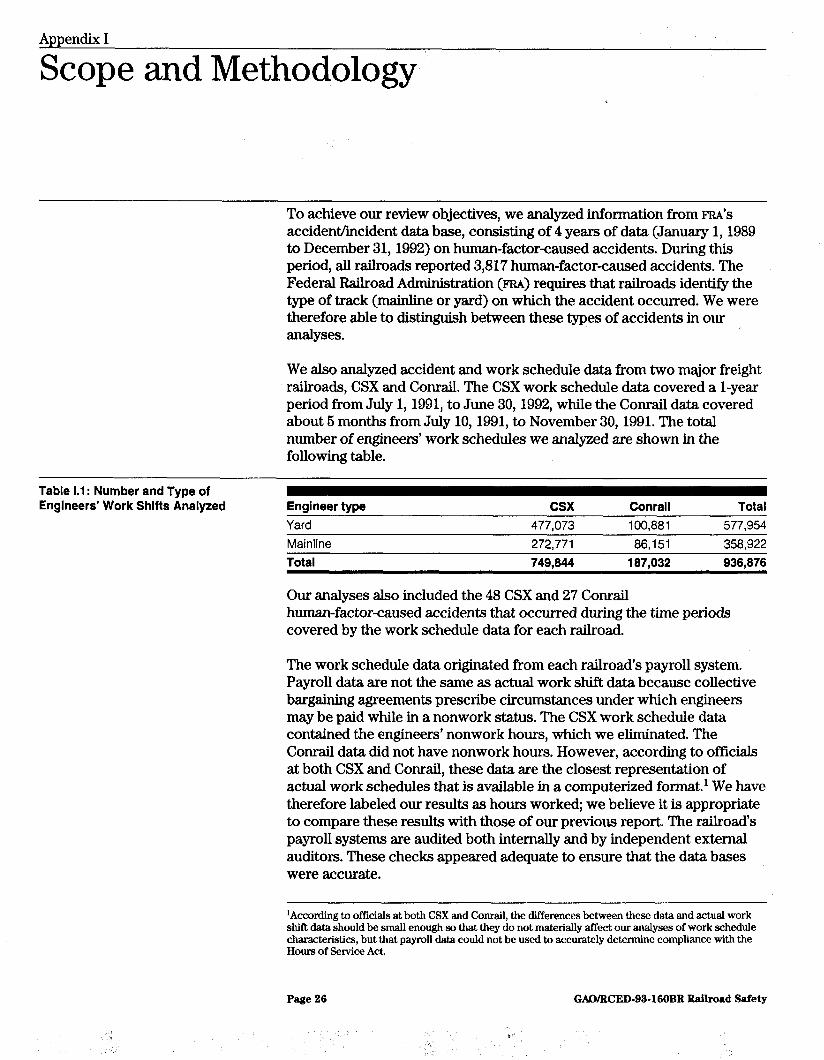
We also analyzed accident and work schedule data from two major freight railroads, CSX and Conrail. The CSX work schedule data covered a l-year period from July 1,1991, to June 30,1992, while the Conrail data covered about 5 months from July 10,1991, to November 30,199l. The total number of engineers’ work schedules we analyzed are shown in the following table.
Table 1.1: Number and Type of Engineers’ Work Shifts Analyzed Engineer type csx
Yard 477,073 Mainline 272,771
Conrail Total 100,881 577,954 86,151 358,922
Total 749.844 187,032 936,876
Our analyses also included the 48 CSX and 27 Conrail human-factor-caused accidents that occurred during the time periods covered by the work schedule data for each railroad.
The work schedule data originated from each railroad’s payroll system. Payroll data are not the same as actual work shift data because collective bargaining agreements prescribe circumstances under which engineers may be paid while in a nonwork status. The CSX work schedule data contained the engineers’ nonwork hours, which we eliminated. The Conrail data did not have nonwork hours. However, according to officials at both CSX and Conrail, these data are the closest representation of actual work schedules that is available in a computerized format.’ We have therefore labeled our results as hours worked; we believe it is appropriate to compare these results with those of our previous report. The railroad’s payroll systems are audited both internally and by independent external auditors. These checks appeared adequate to ensure that the data bases were accurate.
‘According to officials at both CSX and Conrail, the differences between these data and actual work shift data should be small enough so that they do not materially affect our analyses of work schedule characteristics, but that payroll data could not be used to accurately determine compliance with the Hours of Service Act.
Page 26 GMMBCED-93-160BB Bailroad Safety
Appendix I Scope and MethodoIoogy
Differences Between Railroads are required to report to FRA any accident that involves a death,
Accidents on Mainline injury, or damage of at least $6,300. To address our objective of determining the differences between accidents that occur on mainline
and Yard Tracks tracks and accidents on yard tracks, we calculated the number and percentages of accidents that occurred in (1) each hour of an engineer’s shift and (2) each of six 4-hour time blocks during the day.
As in our earlier report, we also considered the start times of the engineers experiencing these accidents in analyzing the accidents. It was necessary to calculate the engineers’ start times because FRA does not require that railroads report when an engineer involved in an accident started work. We performed this calculation by subtracting the number of hours an engineer was on duty at the time of the accident from the time that the accident occurred.
We reviewed the accuracy of FRA’S accident/injury data bases in 1989. During that review, we visited M ’S data entry contractor to identify the types of controls used for ensuring the accuracy of data entry from the reports submitted by the railroads. We observed that contractor personnel performed numerous checks to verify their work. These data checks appeared adequate to ensure that the data base accurately reflected the information reported by the railroads. Therefore, we did not test the contractor’s data entry controls to determine their effectiveness.
Differences in Accident Rates
We analyzed CSX and Conrail shifts separately to address our second objective of determining the differences in accident rates for the type of work shift (mainline vs. yard), the time of day that the accident occurred, the hour of the shift when the accident occurred, and the start time variability of the shift. To determine these accident rates, we calculated the number of human-factor-caused accidents per 100,000 engineer work hours for each railroad for the period covered by the data bases. For example, if one human-factor-caused accident occurred while all engineers worked a total of 100,000 hours, the accident rate would be 1.00, or 1 accident per 100,000 engineer work hours.
CSX provided a list of its engineers involved in human-factor-caused accidents in addition to the engineer identification numbers and train types (mainline or yard) involved in the accident. We used the engineer identification numbers to locate the schedules worked by an accident engineer prior to an accident. We matched these accidents to CSX accidents maintained in the FRA railroad accident data base. We used only
Page 27 GAO/RCED-93-160BB Bailroad Safety
Appenfi 1 Scope and Methodolo.gy
‘
those records for accidents that appeared on the list provided by CSX and also in the FRA database? Although we requested that Conrail provide a similar list, they were unable to do so. As such, we used the accidents contained in FRA’S database and asked Conrail to provide engineer identification numbers and train types.4 We used the resulting list of 48 CSX and 27 Conrail accidents for calculations in sections 2 and 3 of this report.
Because each work shift identified whether the train was mainline or yard, we were able to analyze mainline schedules separately from yard schedules. We assumed that shifts worked on a mainline train reflected the characteristics of a mainline schedule and that shifts worked on a yard train reflected the characteristics of a yard schedule. We classified the schedules of CSX and Conrail engineers experiencing human-factor-caused accidents in the same manner. This means that an accident experienced by a CSX or Conrail engineer while working a mainline or yard shift may have occurred on either a mainline or yard track. This classification of shifts by train type for CSX and Conrail work schedule data differs from our classification of FRA accidents by track type, as described above.
We tested whether the fluctuations in accident rates were statistically significant at the 5 percent level. If a test shows “statistical significance,” it means, in this case, that the fluctuations in accident rates according to the time of day, hour of shift, or start time variability are too large to be ascribed to chance. Our test results show no statistical significance. .
Differences in Schedule Characteristics
To address our third objective, we analyzed the characteristics of engineers’ 2-week work schedules, such as the average shift length, the number of shifts worked, and the average shift start time variability. For the CSX and Conrail accident engineers, we measured these characteristics over the 2-week time period immediately preceding the accident. This a-week time period did not include the accident shift (i.e., the fmal shift in the period was the shift preceding the accident shift). For the general engineer population at each railroad, we measured the characteristics by first dividing the time period of our review into 2-week
%SX provided information that reflected a total of 66 CSX engineers experiencing human-factorcaused accidents during the time period for which we obtained data. After cross-matching this to information maintained in FRA’s railroad accident data base, we were able to use 48 of the accidents originally submitted by CSX.
41n section 2 of this report, we used 27 Conrall accident engineers ln our analyses. In section 3 of this report, we were unable to use three of those accidents because we did not have data available on these engineers for the complete P-week periods that preceded their accidents.
Pa6e 28 GAO/RCED-93460BB Bailroad Safety
* -. h
Appenait I Scope and Methodololty
periods. Then, for each 2-week period, we calculated the average shift length, the number of shifts worked, and the average shift start time variability for each engineer in the general population that worked during the period. We then compared the characteristics of the 2-week periods preceding the accidents experienced by CSX and Conrail engineers with the 2-week periods worked by all engineers. We also compared the average shift length and start time variability of mainline and yard shifts.
To determine the total number of engineer hours worked on shifts with a particular characteristic, we first determined the number of hours on each shift and then summed these hours over all shifts with the characteristic. If a shift was less than or equal to 1 hour in length, we counted it as 1 hour. If a shift was longer than 1 hour but less than or equal to 2 hours, we counted it as 2 hours. Shifts of other lengths were treated similarly.
Effect of Crew-Calling To address the fourth objective of how crew-calling systems affect the
Systems on the Ability ability of engineers to predict their next work shift, we reviewed the systems in place at three major railroads: CSX, CNW, and BN. We
of Engineers to interviewed CSX’s Senior Project Manager for Crew Management Systems,
Predict Their Next CNW'S Crew Management Center Director, and BN’S Manager for
Work Shift Transportation Services.6 Additionally, we interviewed crew callers and observed them as they performed their duties. We looked at crew-calling systems in place at other railroads by reviewing a 1991 report completed by the Volpe National Transportation Systems Center, Issues in Locomotive Crew Management and Scheduling. This study looked at the systems used by: CSX, Conrail, BN, Illinois Central, Soo Line, Southern Pacific, and Union Pacific.
We conducted our review between April 1992 and May 1993 in accordance with generally accepted government auditing standards.
6For the Galesburg, Illinois, location.
Paqe 29 GANFLCED-93-160BB Railroad Safety
Appendix II
Major Contributors to This Briefing Report
Resources, Allen Li, Associate Director
Community, and Ron E. Wood, Assistant Director Deborah L. Justice, Evaluator-In-Charge
Economic Karen E. Bracey, Advisor
Development Division, Washington, D.C.
Chicago Regional Sharon E. Timmins, Staff Evaluator
Office Ruthann R. Balciunas, Staff Evaluator FYank M. Zbylski, Staff Evaluator John Zarem, Advisor
(343840) Page 30
1
GAO/WED-9%160BB Railroad Safety

Ordering Information ~.-
The first copy of each GAO report and testimony is free. Additional copies are $2 each. Orders should be sent to the following address, accompanied by a check or money order made out to the Superintendent of Documents, when necessary. Orders for 100 or more copies to be mailed to a single address are discounted 25 percent.
Orders by mail:
U.S. General Accounting Office P.O. Box 6015 Gaithersburg, MD 20884-6015
or visit:
Room 1000 700 4th St. NW (corner of 4th and G Sts. NW) U.S. General Accounting Office Washington, DC
Orders may also be placed by calling (202 or by using fax number (301) 258-4066.
) 512-6000
PRINTED ON @ RECYCLED PAPER
Related Documents