Tucson Office 3031 West Ina Road Tucson, AZ 85741 Tel 520.297.7723 Fax 520.297.7724 www.tetratech.com Technical Memorandum To: Kathy Arnold From: Seri Park Company: Rosemont Copper Company (RCC) Date: February 23, 2010 Re: Rosemont Traffic Study – Additional Scenarios Doc #: 047/10-320842-5.3 CC: Jamie Sturgess (RCC); Kekoa Anderson (Tetra Tech); and David Krizek (Tetra Tech) 1.0 Introduction Tetra Tech published a comprehensive Traffic Study Report in April of 2009 which was based on the Mine Plan of Operations (MPO). This traffic analysis examined the existing traffic conditions along State Route 83 (AZ-83) and also assessed potential future traffic conditions on AZ-83 associated with the Rosemont Copper Project (Project). The April 2009 traffic study included level of service (LOS) analysis of key intersections and roadway segments along AZ- 83 for the Existing Year, Construction Year, Operations Year 5, and Operations Year 20. The study location and surrounding areas are displayed on Figure 1. Two (2) scenarios, Carpool (Scenario 1) and Partial Carpool (Scenario 2, 75% Carpool), were examined for Operations Year 5 and Year 20. A total of seven (7) key intersections and two (2) highway segments were analyzed. Segment 1 runs from the intersection of AZ-83 and the Interstate 10 (I-10) westbound (WB) on-and off-ramps to the intersection of AZ-83 and East Hidden Valley Road. Segment 2 runs from the intersection of AZ-83 and East Hidden Valley Road to the intersection of AZ-83 and Greaterville Road. Detailed descriptions on study locations and LOS analysis methods are available in the April 2009 traffic report. This Technical Memorandum presents the results of three (3) additional scenarios analyzed as a supplement to the April 2009 Traffic Study Report and their impact on AZ-83. These additional scenarios include: No Carpool (Scenario 3) 50% Carpool (Scenario 4) 50% Carpool with no Copper Concentrate Trucks (Scenario 5) LOS analysis of intersections and roadway segments follow the methodologies presented in the April 2009 Traffic Study Report. Intersection analysis was conducted using SYNCHRO software,

Welcome message from author
This document is posted to help you gain knowledge. Please leave a comment to let me know what you think about it! Share it to your friends and learn new things together.
Transcript

Tucson Office 3031 West Ina Road
Tucson, AZ 85741 Tel 520.297.7723 Fax 520.297.7724
www.tetratech.com
Technical Memorandum
To: Kathy Arnold From: Seri Park
Company: Rosemont Copper Company (RCC) Date: February 23, 2010
Re: Rosemont Traffic Study – Additional Scenarios
Doc #: 047/10-320842-5.3
CC: Jamie Sturgess (RCC);
Kekoa Anderson (Tetra Tech); and
David Krizek (Tetra Tech)
1.0 Introduction Tetra Tech published a comprehensive Traffic Study Report in April of 2009 which was based on the Mine Plan of Operations (MPO). This traffic analysis examined the existing traffic conditions along State Route 83 (AZ-83) and also assessed potential future traffic conditions on AZ-83 associated with the Rosemont Copper Project (Project). The April 2009 traffic study included level of service (LOS) analysis of key intersections and roadway segments along AZ-83 for the Existing Year, Construction Year, Operations Year 5, and Operations Year 20. The study location and surrounding areas are displayed on Figure 1. Two (2) scenarios, Carpool (Scenario 1) and Partial Carpool (Scenario 2, 75% Carpool), were examined for Operations Year 5 and Year 20. A total of seven (7) key intersections and two (2) highway segments were analyzed. Segment 1 runs from the intersection of AZ-83 and the Interstate 10 (I-10) westbound (WB) on-and off-ramps to the intersection of AZ-83 and East Hidden Valley Road. Segment 2 runs from the intersection of AZ-83 and East Hidden Valley Road to the intersection of AZ-83 and Greaterville Road. Detailed descriptions on study locations and LOS analysis methods are available in the April 2009 traffic report.
This Technical Memorandum presents the results of three (3) additional scenarios analyzed as a supplement to the April 2009 Traffic Study Report and their impact on AZ-83. These additional scenarios include:
No Carpool (Scenario 3)
50% Carpool (Scenario 4)
50% Carpool with no Copper Concentrate Trucks (Scenario 5)
LOS analysis of intersections and roadway segments follow the methodologies presented in the April 2009 Traffic Study Report. Intersection analysis was conducted using SYNCHRO software,

2
which utilizes the Intersection Capacity Utilization (ICU) 2003 method. ICU 2003 provides a straight forward method of calculating an intersection's LOS. This method takes the sum of critical movement volume to saturation flow rates. The ICU LOS gives insight into how an intersection is functioning and how much extra capacity is available to handle traffic fluctuations and incidents. Highway segment analysis was conducted using Highway Capacity Software 2000 (HCS2000) which uses the methodology in accordance with the 2000 Highway Capacity Manual (HCM). Most public agencies strive to achieve and maintain a LOS of C or greater in their jurisdiction. Mitigations are discussed where the LOS analysis results show a LOS of D or worse.
Because the Construction Year trips are expected to be identical to the previous April 2009 Traffic Study Report values, LOS analysis results are also expected to be the same for the scenarios analyzed herein. Therefore, only Operations Year 5 and Operations Year 20 were considered for the additional scenarios. Existing Year conditions are also assumed to be the same as presented in the 2009 report.
The remainder of this Technical Memorandum is divided into the following sections:
Section 2.0: Traffic assumptions and future forecasts
Section 3.0: Operations Year 5 LOS Analysis
Section 4.0: Operations Year 20 LOS Analysis
Section 5.0: Analysis of results and potential mitigation measures
Section 6.0: Conclusions
2.0 Future Forecasts Traffic forecasts for this study were based on two (2) components:
Project Trips (trips generated by the Project); and
Background Trips (all other traffic not associated with the Project itself).
Project Trips were based on the estimated potential truck traffic and employee travel patterns. The Rosemont Project Mine Plan of Operations (WestLand, 2007) and Rosemont Copper Project Feasibility Study (M3, 2007, and 2009) were used to obtain information such as daily material delivery rates, truck schedules, and number of employees to apply in the traffic forecasts. In order to generate Background Trips, the average annual population growth rate of Pima County from 1990 to 2006 was used. A total of two (2) future years were considered in the analysis:
Operations Year 5; and
Operations Year 20.
The analysis year periods termed Operations Year 5 and Operations Year 20 represent the operational conditions of the Project at the beginning of years 5 and 20, respectively. Table 2.1

3
summarizes the traffic components for each year analyzed. The traffic volume due to the Project was divided into two (2) categories:
Commuter trips; and
Operations trips.
Commuter trips are trips generated by mine employees and Operations trips are trips generated by trucks. Most of the trips were assumed to originate from the Tucson area (75-80%). The remaining trips were assumed to be generated south of Greaterville Road.
Table 2.1 Future Forecasts
Scenario Year Traffic Operations Year 5 2015 Year 2008 Traffic + Growth Traffic + Operations Year 5 Traffic Operations Year 20 2030 Year 2008 Traffic + Growth Traffic + Operations Year 20 Traffic
Scenario 3 - No Carpool
Under this scenario, it was assumed that every employee would generate a single trip. The truck delivery patterns would follow those specified in the Rosemont Copper Project Feasibility Study (M3, 2007, and 2009). Scenario 3 also yields the highest Project related trips and is therefore considered the most congested scenario associated with the Project. Table 2.2 summarizes the assumptions used in analyzing Scenario 3.

4
Table 2.2 Scenario 3 Assumptions – No Carpool
Period Assumption Reference
Operations Year 5
• Trip generation was based on a typical work week schedule as presented on Figure 8-5 in the Feasibility Study.
• Commuter Trips
o As stated on page 8-4 of the Feasibility Study, an average Project year will consist of 457 employees.
o Each employee will generate a single commuter trip resulting in a total of 457 trips.
• Mine Operation Truck Trips o As stated in Table 6 of the Mine Plan of Operations,
truck trips will consist of 18 trips per hour.
Rosemont Copper Project Feasibility Study [Figure 8-5 page 8-51 (2009) and page 8-4 (2007)]
Operations Year 20
• Trip generation was based on a typical work week schedule as presented on Figure 8-5 of the Feasibility Study.
• Commuter Trips o As stated on page 8-4 of the Feasibility Study, the peak
work force for the Project is estimated to be about 494. Since the SX-EW facility will no longer be in operation at Year 20, the number of employee trips was estimated to be 456.
o Each employee will generate a single commuter trip resulting in a total of 456 trips.
• Mine Operation Truck Trips o As stated in Table 6 of the Mine Plan of Operations,
truck trips will consist of 18 trips per hour.
Rosemont Copper Project Feasibility Study [Figure 8-5 page 8-51 (2009) and page 8-4 (2007)]
Scenario 4 – 50% Carpool
For Scenario 4, it was assumed that 50% of the total employee workforce would carpool at an average rate of five (5) people per van, with the remaining 50% generating a single vehicle commuting trip per employee (i.e., no carpooling). In addition, it was assumed that truck deliveries would occur during peak periods. Table 2.3 lists the assumptions applied to Scenario 4.

5
Table 2.3 Scenario 4 Assumptions – 50% Carpool
Period Assumption Reference
Operations Year 5
• Trip generation was based on a typical work week schedule as presented on Figure 8-5 of the Feasibility Study.
• Commuter Trips o As stated on page 8-4 of the Feasibility Study, an
average Project year will consist of 457 employees. o 50% of the total employees will carpool at an average
rate of 5 people per van, and the remaining 50% of employees will generate a single trip per employee.
• Mine Operation Truck Trips o As stated in Table 6 of the Mine Plan of Operations,
truck trips will consist of 18 trips per hour.
Rosemont Project Mine Plan of Operations [pages 34, 35, and 50 (2007)] Rosemont Copper Project Feasibility Study, [page 8-4 (2007)]
Operations
Year 20
• Trip generation was based on a typical work week schedule as presented on Figure 8-5 of the Feasibility Study.
• Commuter Trips o As stated on page 8-4 of the Feasibility Study, the peak
work force for the Project is estimated to be about 494. Since the SX-EW facility will no longer be in operation at Year 20, the number of employee trips was estimated to be 456.
o 50% of the total employees will carpool at an average rate of 5 people per van, and the remaining 50% of employees will generate a single trip per employee.
• Mine Operation Truck Trips o As stated in Table 6 of the Mine Plan of Operations,
truck trips will consist of 18 trips per hour.
Rosemont Project Mine Plan of Operations [page 34, 53, and 50 (2007)] Rosemont Copper Project Feasibility Study [page 8-4 (2007)]
Scenario 5 – 50% Carpool with no Copper Concentrate Trucks
Scenario 5 is similar to Scenario 4 in that 50% of the total employee workforce would carpool at an average rate of five (5) people per van, with the remaining 50% generating a single vehicle commuting trip per employee (i.e., no carpooling). In addition, it was assumed that truck deliveries would occur during peak periods. The difference between Scenario 4 and Scenario 5 is that copper concentrate would not be transported on AZ-83 under Scenario 5. Copper concentrate would be transported via pipeline to a loadout station on the west side of the Santa Rita Mountains. Table 2.4 lists the assumptions applied to Scenario 5.

6
Table 2.4 Scenario 5 Assumptions – 50% Carpool with no Concentrate Copper Trucks
Period Assumption Reference
Operations Year 5
• Trip generation was based on a typical work week schedule as presented on Figure 8-5 of the Feasibility Study.
• Commuter Trips o As stated on page 8-4 of the Feasibility Study, an
average Project year will consist of 457 employees. o 50% of the total employees will carpool at an average
rate of 5 people per van, and the remaining 50% of employees will generate a single trip per employee.
• Mine Operation Truck Trips o Based on Table 6 of the Mine Plan of Operations and
excluding copper concentrate truck trips on AZ-83, truck trips would consist of 14 trips per hour.
o No copper concentrate truck traffic would be generated on AZ-83. A pipeline would deliver concentrate to the west.
Rosemont Project Mine Plan of Operations [pages 34, 35, and 50 (2007)] Rosemont Copper Project Feasibility Study, [page 8-4 (2007)]
Operations
Year 20
• Trip generation was based on a typical work week schedule as presented in Figure 8-5 in the Feasibility Study.
• Commuter Trips o As stated on page 8-4 of the Feasibility Study, the peak
work force for the Project is estimated to be about 494 employees. Since the SX-EW facility will no longer be in operation at Year 20, the number of employee trips was estimated to be 456.
o 50% of the total employees will carpool at an average rate of 5 people per van, and the remaining 50% of employees will generate a single trip per employee.
• Mine Operation Truck Trips o Based on Table 6 of the Mine Plan of Operations, and
excluding copper concentrate truck trips on AZ-83, truck trips would consist of 14 trips per hour.
o No copper concentrate truck traffic would be generated on AZ-83. A pipeline would deliver concentrate to the west.
Rosemont Project Mine Plan of Operations [pages 34, 53, and 50 (2007)] Rosemont Copper Project Feasibility Study [page 8-4 (2007)]
All the above scenarios are classified as a Category II c development according to ADOT’s “Traffic Impact Analysis for Proposed Development” and Section 240 of ADOT’s “Traffic Engineering Policies, Guidelines, and Procedures”. Therefore, per the ADOT traffic impact study guidelines, mitigations are recommended within 1 mile of the proposed site. The assessment of potential Project traffic impacts on intersections and roadway segments under these scenarios are presented in Sections 3.0 and 4.0.

7
3.0 Operations Year 5 As described in Section 2.0, Operations Year 5 represents the Project’s operational condition at the beginning of Year 5. In order to fully analyze potential Project traffic impacts on AZ-83 and the selected intersections, LOS results were compared to LOS values with the Project not in operation. SYNCHRO and HCS2000 worksheets for Operations Year 5 are included in Attachments 1 and 2, respectively. Tables 3.1, 3.2, 3.4, and 3.5 present the study intersections’ corresponding ICU value and the LOS for Operations Year 5 during non-peak and peak seasons under Scenario 3 (No Carpool). Tables 3.3 and 3.6 describe the highway segment categories, corresponding LOS criteria values, and the LOS for Operations Year 5 under Scenario 3.
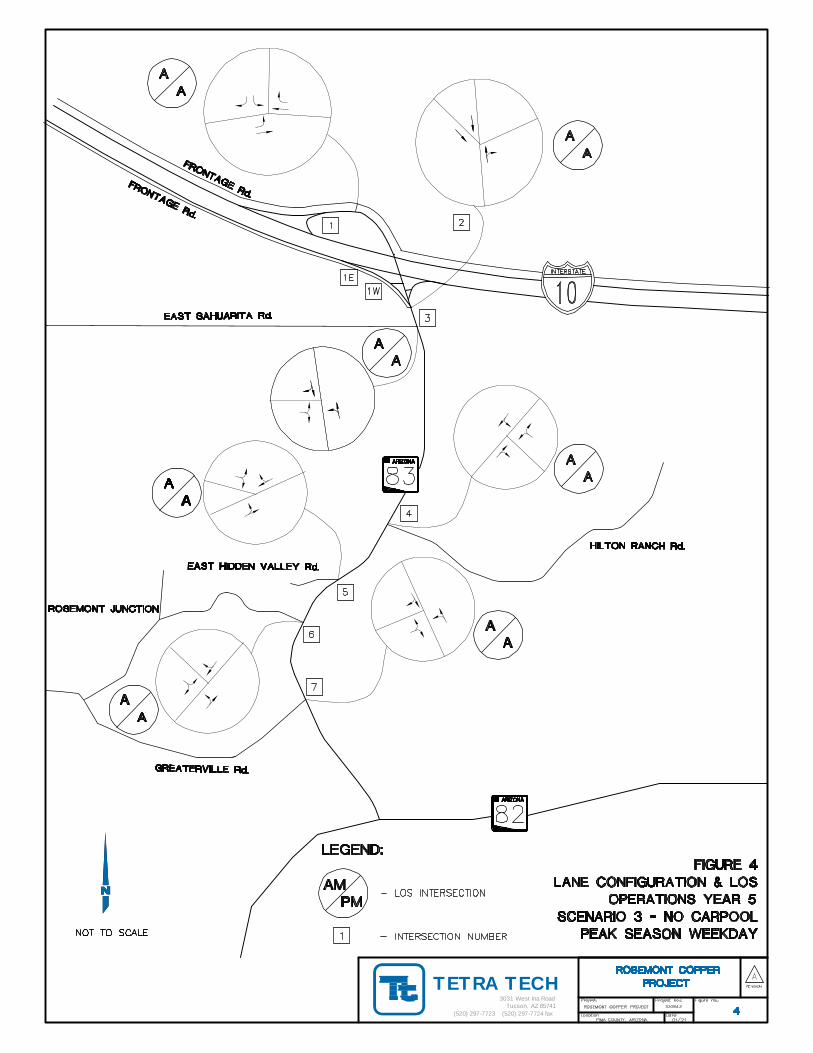
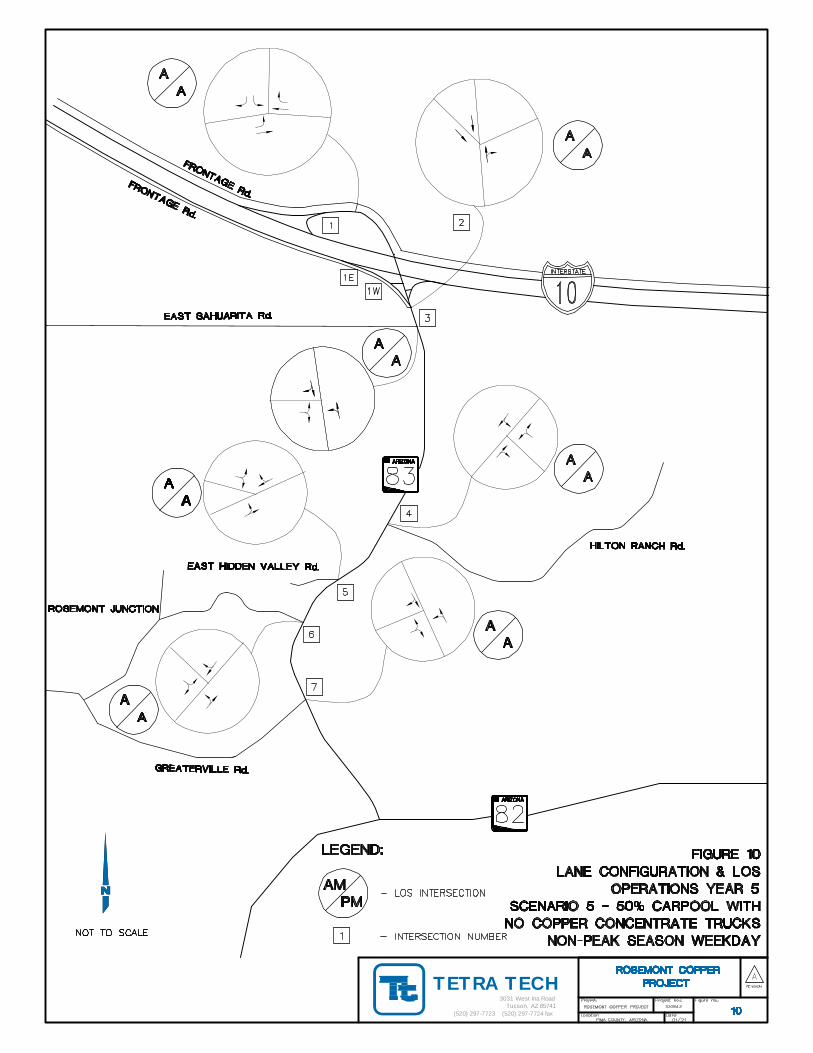
Scenario 4 (50% Carpool) LOS results for intersections and segments are provided in Tables 3.8 through 3.13. For Scenario 5 (50% Carpool with no Copper Concentrate Truck Traffic), LOS results for intersections and segments are provided in Tables 3.15 through 3.20. Tables 3.7, 3.14, and 3.21 present a traffic volume comparison between Project and non-Project related traffic for the Operations Year 5 analysis. Operations Year 5 lane configurations and LOS values for the study area under each scenario are illustrated on Figures 2 through 13.
Scenario 3 – No Carpool
Non-Peak Season For the non-peak season, the traffic forecast results indicate that all LOS criteria values, including intersections and segments, increased due to the Project related traffic under Scenario 3. For intersections, there was an average 54.62% increase in ICU values compared to values with the Project not in operation. As expected, the main increase in ICU values was observed for the intersection of AZ-83 and East Hidden Valley Road. This intersection also showed the highest ICU values. This intersection was designated as the access road to the Project Site for the purpose of this study. Although the overall intersection LOS was at level of A, it is important to note that for the East Hidden Valley Road eastbound approach, the LOS result showed a level of C during weekday AM and PM peak periods (see Attachment 1). This implies traffic turning left/right onto AZ-83 from East Hidden Valley Road would have difficulty making proper turning movements, suggesting the need of mitigation. All the intersection and segment operation levels were at acceptable LOS values for Scenario 3 during Operational Year 5 (Tables 3.1, 3.2, and 3.3).
8
Table 3.1 Intersection LOS Summary – Operations Year 5, Scenario 3, Non-Peak Season Condition (Weekday)
AM Peak Hour PM Peak Hour Intersection
ICU (%) LOS ICU (%) LOS AZ-83 and I-10 Westbound on- and off-ramps 41.2 A 29.6 A AZ-83 and I-10 Eastbound on- and off-ramps 28.3 A 27.9 A
AZ-83 and East Sahuarita Rd. 33.7 A 40.3 A AZ-83 and Hilton Ranch Rd. 34.2 A 21.0 A AZ-83 and Hidden Valley Rd. 49.4 A 47.9 A
AZ-83 and Rosemont Junction 12.4 A 12.2 A AZ-83 and Greaterville Rd. 21.6 A 14.2 A
Table 3.2 Intersection LOS Summary – Operations Year 5, Scenario 3, Non-Peak Season Condition (Weekend)
AM Peak Hour PM Peak Hour Intersection
ICU (%) LOS ICU (%) LOS AZ-83 and I-10 Westbound on- and off-ramps 32.8 A 25.7 A AZ-83 and I-10 Eastbound on- and off-ramps 21.7 A 31.0 A
AZ-83 and East Sahuarita Rd. 26.9 A 40.9 A AZ-83 and Hilton Ranch Rd. 23.8 A 23.9 A AZ-83 and Hidden Valley Rd. 38.2 A 36.9 A
AZ-83 and Rosemont Junction 18.6 A 11.0 A AZ-83 and Greaterville Rd. 16.3 A 24.2 A
Table 3.3 Segment LOS – Operations Year 5, Scenario 3, Non-Peak Season Condition
Weekday Weekend
Segment AM Peak Hour
LOS (% Time Spent Following)
PM Peak Hour
LOS (% Time Spent Following)
AM Peak Hour
LOS (% Time Spent Following)
PM Peak Hour
LOS (% Time Spent Following)
Segment 1 C(63.6) C(65.4) C(62.9) C(64.0) Segment 2 C(67.3) C(66.8) C(61.9) C(61.1)

9
Peak Season Although ICU values for most of the intersections slightly increased compared to non-peak season values, similar intersection LOS patterns were observed during the peak season when compared to the non-peak season for Scenario 3 during Operations Year 5. Furthermore, the ICU increased by 52.30% compared with the no Project condition. For segment LOS results, all LOS’s were at an acceptable level.
Table 3.4 Intersection LOS Summary – Operations Year 5, Scenario 3, Peak Season Condition (Weekday)
AM Peak Hour PM Peak Hour Intersection
ICU (%) LOS ICU (%) LOS AZ-83 and I-10 Westbound on- and off-ramps 31.0 A 30.6 A AZ-83 and I-10 Eastbound on- and off-ramps 20.8 A 21.9 A
AZ-83 and East Sahuarita Rd. 27.3 A 50.4 A AZ-83 and Hilton Ranch Rd. 23.6 A 29.6 A AZ-83 and Hidden Valley Rd. 44.7 A 49.7 A
AZ-83 and Rosemont Junction 21.0 A 15.5 A AZ-83 and Greaterville Rd. 18.5 A 21.1 A
Table 3.5 Intersection LOS Summary – Operations Year 5, Scenario 3, Peak Season Condition (Weekend)
AM Peak Hour PM Peak Hour Intersection
ICU (%) LOS ICU (%) LOS AZ-83 and I-10 Westbound on- and off-ramps 28.6 A 24.2 A AZ-83 and I-10 Eastbound on- and off-ramps 22.3 A 30.2 A
AZ-83 and East Sahuarita Rd. 34.7 A 40.8 A AZ-83 and Hilton Ranch Rd. 16.8 A 23.4 A AZ-83 and Hidden Valley Rd. 36.0 A 42.2 A
AZ-83 and Rosemont Junction 17.4 A 12.1 A AZ-83 and Greaterville Rd. 9.9 A 23.2 A

10
Table 3.6 Segment LOS – Operations Year 5, Scenario 3, Peak Season Condition
Weekday Weekend
Segment AM Peak Hour
LOS (% Time Spent Following)
PM Peak Hour
LOS (% Time Spent Following)
AM Peak Hour
LOS (% Time Spent Following)
PM Peak Hour
LOS (% Time Spent Following)
Segment 1 C(65.6) C(68.9) C(62.7) C(65.4) Segment 2 C(64.8) C(68.0) C(60.4) C(64.1)
Traffic Volume Comparison In order to distinguish the increase in traffic due to population growth versus the Project operation, a traffic volume comparison was completed for Operations Year 5. Table 3.7 summarizes the number of vehicles for the base volume [i.e., Existing Year (2008)] and the predicted number of vehicles related to population growth and the Project. As shown in Table 3.7, the percentage of traffic due to the Project at Operations Year 5, under Scenario 3, ranged from 54.16% to 69.04 % with an average of 57.22%.
Table 3.7 Traffic Volume Comparison for Operations Year 5, Scenario 3
Base Traffic Volume
Population Growth Traffic
Volume
Project Traffic Volume
Total Traffic Volume
Vehicle Type Vehicle Type Vehicle Type Vehicle Type Analysis Period
1 & 2 3,4 & 5 1 & 2 3,4 & 5 1 & 2 3,4 & 5 1 & 2 3,4 & 5
Traffic % from
Project Volume
Weekday AM 160 16 34 3 457 18 651 37 69.04
Weekday PM 212 12 45 3 457 18 714 33 63.59
Weekend AM 222 10 47 2 314 18 583 30 54.16
Operations Year 5,
Non-Peak Season
Weekend PM 250 16 53 3 314 18 617 37 50.76
Weekday AM 194 36 41 8 457 18 692 62 63.00
Weekday PM 290 20 61 4 457 18 808 42 55.88
Weekend AM 212 16 45 3 314 18 571 37 54.61
Operations Year 5, Peak
Season Weekend
PM 290 22 61 5 314 18 665 45 46.76
11
Scenario 4 – 50% Carpool
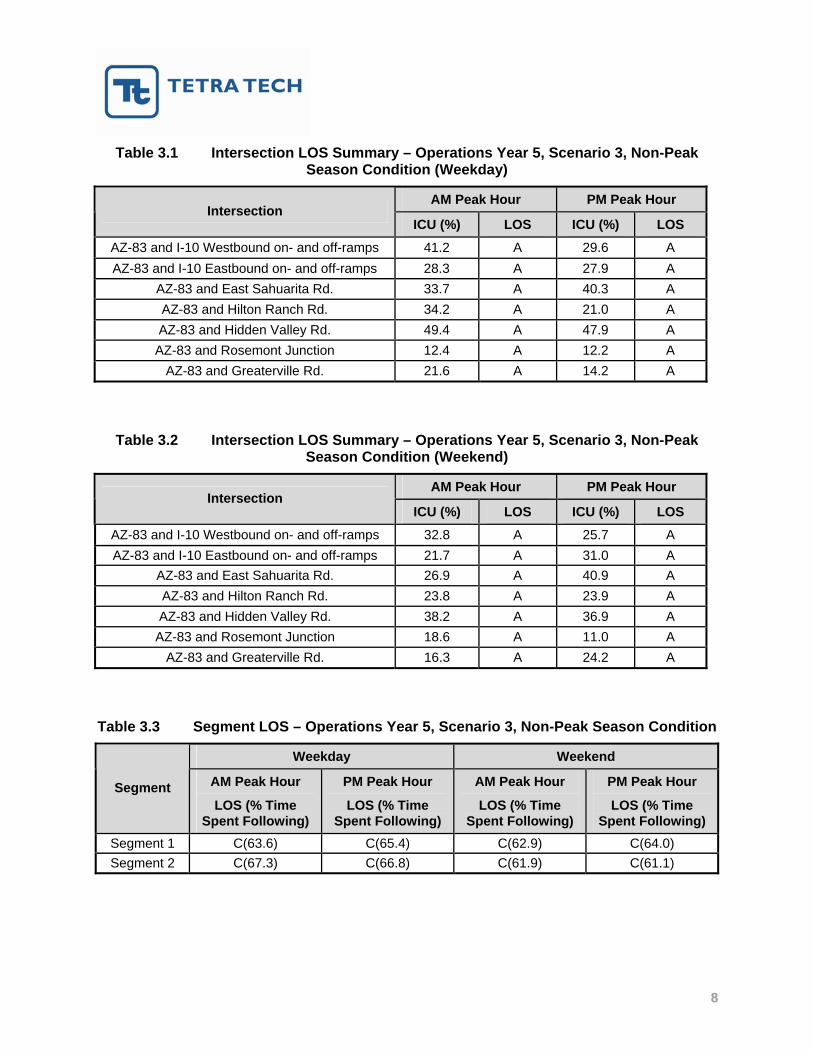
Non-Peak Season The traffic forecast results indicate that all LOS criteria values, including intersections and segments, increased due to Project related traffic under Scenario 4 – 50% Carpool. For the intersections, there was an average increase of 35.52% in ICU values compared to values with the Project not in operation. Similar to Scenario 3, the main increase in ICU values were observed for the intersection of AZ-83 and East Hidden Valley Road. All the intersection and segment operation levels were at acceptable LOS values for Scenario 4 during Operational Year 5 (Tables 3.8, 3.9, and 3.10).
Table 3.8 Intersection LOS Summary – Operations Year 5, Scenario 4, Non-Peak Season Condition (Weekday)
AM Peak Hour PM Peak Hour Intersection
ICU (%) LOS ICU (%) LOS AZ-83 and I-10 Westbound on- and off-ramps 36.9 A 27.3 A AZ-83 and I-10 Eastbound on- and off-ramps 23.2 A 25.6 A
AZ-83 and East Sahuarita Rd. 31.5 A 35.5 A AZ-83 and Hilton Ranch Rd. 29.2 A 18.8 A AZ-83 and Hidden Valley Rd. 38.5 A 37.3 A
AZ-83 and Rosemont Junction 10.7 A 10.6 A AZ-83 and Greaterville Rd. 19.9 A 13.5 A
Table 3.9 Intersection LOS Summary – Operations Year 5, Scenario 4, Non-Peak Season Condition (Weekend)
AM Peak Hour PM Peak Hour Intersection
ICU (%) LOS ICU (%) LOS AZ-83 and I-10 Westbound on- and off-ramps 30.5 A 21.2 A AZ-83 and I-10 Eastbound on- and off-ramps 19.0 A 28.4 A
AZ-83 and East Sahuarita Rd. 24.7 A 36.0 A AZ-83 and Hilton Ranch Rd. 21.1 A 21.2 A AZ-83 and Hidden Valley Rd. 30.9 A 32.8 A
AZ-83 and Rosemont Junction 17.7 A 10.2 A AZ-83 and Greaterville Rd. 15.6 A 23.4 A
12
Table 3.10 Segment LOS – Operations Year 5, Scenario 4, Non-Peak Season Condition
Weekday Weekend
Segment AM Peak Hour
LOS (% Time Spent Following)
PM Peak Hour
LOS (% Time Spent Following)
AM Peak Hour
LOS (% Time Spent Following)
PM Peak Hour
LOS (% Time Spent Following)
Segment 1 C(59.1) C(61.9) C(59.8) C(61.5) Segment 2 C(62.4) C(61.9) C(61.1) C(60.0)
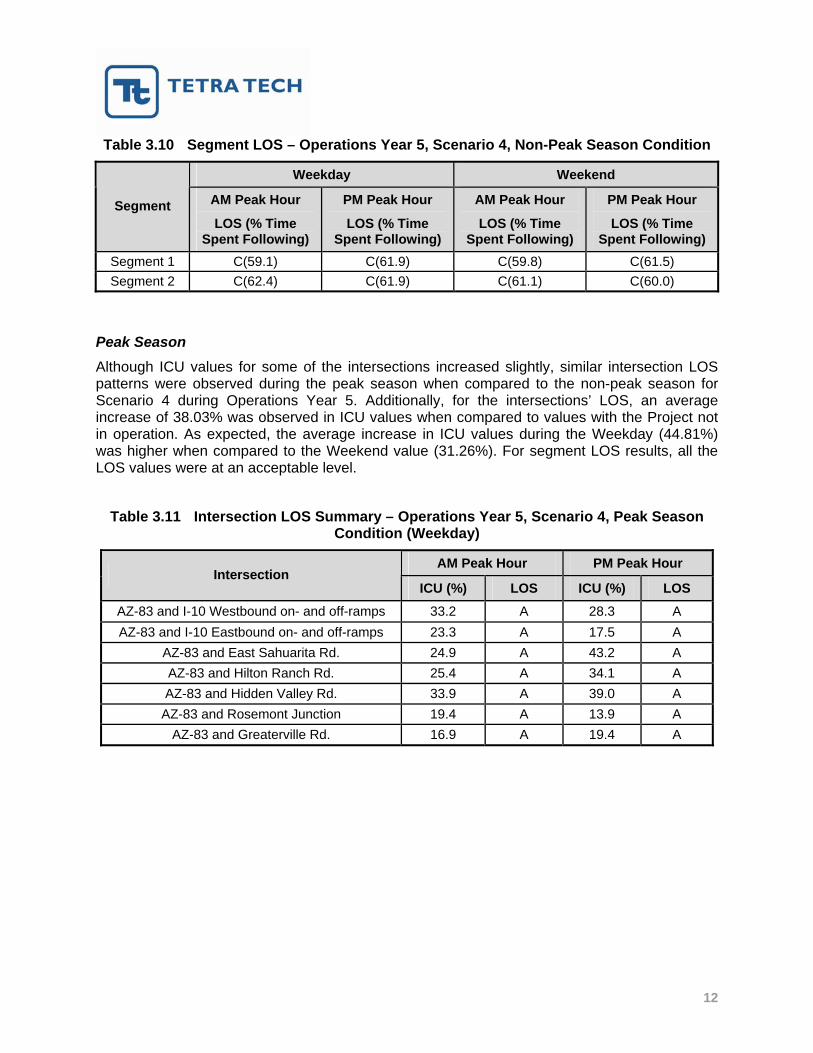
Peak Season Although ICU values for some of the intersections increased slightly, similar intersection LOS patterns were observed during the peak season when compared to the non-peak season for Scenario 4 during Operations Year 5. Additionally, for the intersections’ LOS, an average increase of 38.03% was observed in ICU values when compared to values with the Project not in operation. As expected, the average increase in ICU values during the Weekday (44.81%) was higher when compared to the Weekend value (31.26%). For segment LOS results, all the LOS values were at an acceptable level.
Table 3.11 Intersection LOS Summary – Operations Year 5, Scenario 4, Peak Season Condition (Weekday)
AM Peak Hour PM Peak Hour Intersection
ICU (%) LOS ICU (%) LOS AZ-83 and I-10 Westbound on- and off-ramps 33.2 A 28.3 A AZ-83 and I-10 Eastbound on- and off-ramps 23.3 A 17.5 A
AZ-83 and East Sahuarita Rd. 24.9 A 43.2 A AZ-83 and Hilton Ranch Rd. 25.4 A 34.1 A AZ-83 and Hidden Valley Rd. 33.9 A 39.0 A
AZ-83 and Rosemont Junction 19.4 A 13.9 A AZ-83 and Greaterville Rd. 16.9 A 19.4 A

13
Table 3.12 Intersection LOS Summary – Operations Year 5, Scenario 4, Peak Season Condition (Weekend)
AM Peak Hour PM Peak Hour Intersection
ICU (%) LOS ICU (%) LOS AZ-83 and I-10 Westbound on- and off-ramps 30.8 A 23.3 A AZ-83 and I-10 Eastbound on- and off-ramps 19.5 A 27.6 A
AZ-83 and East Sahuarita Rd. 32.5 A 38.2 A AZ-83 and Hilton Ranch Rd. 20.8 A 21.2 A AZ-83 and Hidden Valley Rd. 23.8 A 34.8 A
AZ-83 and Rosemont Junction 16.5 A 11.2 A AZ-83 and Greaterville Rd. 9.0 A 22.5 A
Table 3.13 Segment LOS – Operations Year 5, Scenario 4, Peak Season Condition
Weekday Weekend
Segment AM Peak Hour
LOS (% Time Spent Following)
PM Peak Hour
LOS (% Time Spent Following)
AM Peak Hour
LOS (% Time Spent Following)
PM Peak Hour
LOS (% Time Spent Following)
Segment 1 C(62.2) C(64.9) C(59.7) C(63.2) Segment 2 C(59.1) C(63.0) C(58.9) C(60.5)
Traffic Volume Comparison Similar to the previous section, a traffic volume comparison was prepared to distinguish the increase in traffic due to population growth versus the Project operation. Table 3.14 summarizes the number of vehicles for the base volume [i.e., Existing Year (2008)] and the predicted number of vehicles related to population growth and the Project. As shown in Table 3.14, the percentage of traffic due to the Project at Operations Year 5, under Scenario 4, ranged from 35.38% to 57.82% with an average of 45.54%.

14
Table 3.14 Traffic Volume Comparison for Operations Year 5, Scenario 4
Base Traffic Volume
Population Growth Traffic
Volume
Project Traffic Volume
Total Traffic Volume
Vehicle Type Vehicle Type Vehicle Type Vehicle Type Analysis Period
1 & 2 3,4 & 5 1 & 2 3,4 & 5 1 & 2 3,4 & 5 1 & 2 3,4 & 5
Traffic % from
Project Volume
Weekday AM 160 16 34 3 274 18 468 37 57.82
Weekday PM 212 12 45 3 274 18 531 33 51.77
Weekend AM 222 10 47 2 209 18 458 30 42.42
Operations Year 5,
Non-Peak Season
Weekend PM 250 16 53 3 209 18 492 37 39.13
Weekday AM 194 36 41 8 274 18 509 62 51.14
Weekday PM 290 20 61 4 274 18 625 42 43.78
Weekend AM 212 16 45 3 209 18 446 37 42.86
Operations Year 5, Peak
Season Weekend
PM 290 22 61 5 209 18 540 45 35.38
Scenario 5 – 50% Carpool with no Copper Concentrate Trucks
Non-Peak Season For Scenario 5, the LOS analysis results closely followed those of Scenario 4. Traffic counts between these two (2) scenarios differed only in four (4) trips due to the reduction of copper concentrate trucks). As expected, the traffic forecast results indicated that all LOS criteria values, including intersections and segments, increased due to the Project related traffic under the Scenario 5 – 50% Carpool with no Copper Concentrate Trucks compared to values with the Project not in operation. For the intersections, there was an average increase of 34.99% in ICU values compared to values with the Project not in operation. Similar to Scenarios 3 and 4, the main increase in ICU values were observed for the intersection of AZ-83 and East Hidden Valley Road. All the intersection and segment operation levels were at acceptable LOS values for Scenario 5 during Operational Year 5 (Tables 3.15, 3.16, and 3.17).

15
Table 3.15 Intersection LOS Summary – Operations Year 5, Scenario 5, Non-Peak Season Condition (Weekday)
AM Peak Hour PM Peak Hour Intersection
ICU (%) LOS ICU (%) LOS AZ-83 and I-10 Westbound on- and off-ramps 36.8 A 27.3 A AZ-83 and I-10 Eastbound on- and off-ramps 23.1 A 25.6 A
AZ-83 and East Sahuarita Rd. 31.5 A 35.4 A AZ-83 and Hilton Ranch Rd. 29.1 A 18.8 A AZ-83 and Hidden Valley Rd. 38.2 A 37.1 A
AZ-83 and Rosemont Junction 10.6 A 10.5 A AZ-83 and Greaterville Rd. 19.9 A 13.5 A
Table 3.16 Intersection LOS Summary – Operations Year 5, Scenario 5, Non-Peak Season Condition (Weekend)
AM Peak Hour PM Peak Hour Intersection
ICU (%) LOS ICU (%) LOS AZ-83 and I-10 Westbound on- and off-ramps 30.4 A 21.2 A AZ-83 and I-10 Eastbound on- and off-ramps 18.9 A 28.4 A
AZ-83 and East Sahuarita Rd. 24.7 A 35.8 A AZ-83 and Hilton Ranch Rd. 21.0 A 21.1 A AZ-83 and Hidden Valley Rd. 30.7 A 32.6 A
AZ-83 and Rosemont Junction 17.7 A 10.2 A AZ-83 and Greaterville Rd. 15.6 A 23.4 A
Table 3.17 Segment LOS – Operations Year 5, Scenario 5, Non-Peak Season Condition
Weekday Weekend
Segment AM Peak Hour
LOS (% Time Spent Following)
PM Peak Hour
LOS (% Time Spent Following)
AM Peak Hour
LOS (% Time Spent Following)
PM Peak Hour
LOS (% Time Spent Following)
Segment 1 C(58.8) C(61.7) C(59.5) C(61.2) Segment 2 C(62.2) C(61.7) C(60.7) C(59.7)

16
Peak Season Similar to the non-peak season analysis results, the peak season LOS results also showed a close pattern to the Scenario 4 peak season LOS analysis results. For the intersections’ LOS, an average increase of 36.84% was observed in ICU values when compared to values with the Project not in operation. As expected, the average increase in ICU values during the Weekday (44.28%) was higher when compared to the Weekend value (29.39%). For segment LOS results, all the LOS values were at an acceptable level.
Table 3.18 Intersection LOS Summary – Operations Year 5, Scenario 5, Peak Season Condition (Weekday)
AM Peak Hour PM Peak Hour Intersection
ICU (%) LOS ICU (%) LOS AZ-83 and I-10 Westbound on- and off-ramps 33.1 A 28.3 A AZ-83 and I-10 Eastbound on- and off-ramps 23.2 A 17.4 A
AZ-83 and East Sahuarita Rd. 24.9 A 43.1 A AZ-83 and Hilton Ranch Rd. 25.2 A 34.1 A AZ-83 and Hidden Valley Rd. 33.7 A 38.8 A
AZ-83 and Rosemont Junction 19.3 A 13.9 A AZ-83 and Greaterville Rd. 16.8 A 19.4 A
Table 3.19 Intersection LOS Summary – Operations Year 5, Scenario 5, Peak Season Condition (Weekend)
AM Peak Hour PM Peak Hour Intersection
ICU (%) LOS ICU (%) LOS AZ-83 and I-10 Westbound on- and off-ramps 26.1 A 23.3 A AZ-83 and I-10 Eastbound on- and off-ramps 19.4 A 27.6 A
AZ-83 and East Sahuarita Rd. 32.5 A 38.1 A AZ-83 and Hilton Ranch Rd. 20.6 A 21.2 A AZ-83 and Hidden Valley Rd. 23.8 A 34.6 A
AZ-83 and Rosemont Junction 16.5 A 11.2 A AZ-83 and Greaterville Rd. 8.9 A 22.5 A

17
Table 3.20 Segment LOS – Operations Year 5, Scenario 5, Peak Season Condition
Weekday Weekend
Segment AM Peak Hour
LOS (% Time Spent Following)
PM Peak Hour
LOS (% Time Spent Following)
AM Peak Hour
LOS (% Time Spent Following)
PM Peak Hour
LOS (% Time Spent Following)
Segment 1 C(61.9) C(64.7) C(59.4) C(63.0) Segment 2 C(58.9) C(62.8) C(58.6) C(60.2)
Traffic Volume Comparison Similar to the previous section, a traffic volume comparison was prepared to distinguish the increase in traffic due to population growth versus the Project operation. Table 3.21 summarizes the number of vehicles for the base volume (i.e., Existing Year (2008)) and the predicted number of vehicles related to population growth and the Project. As shown in Table 3.21, the percentage of traffic due to the Project at Operations Year 5, under Scenario 5, ranged from 34.94% to 57.49% with an average of 45.13%.
Table 3.21 Traffic Volume Comparison for Operations Year 5, Scenario 5
Base Traffic Volume
Population Growth Traffic
Volume
Project Traffic Volume
Total Traffic Volume
Vehicle Type Vehicle Type Vehicle Type Vehicle Type Analysis Period
1 & 2 3,4 & 5 1 & 2 3,4 & 5 1 & 2 3,4 & 5 1 & 2 3,4 & 5
Traffic % from
Project Volume
Weekday AM 160 16 34 3 274 14 468 33 57.49
Weekday PM 212 12 45 3 274 14 531 29 51.43
Weekend AM 222 10 47 2 189 14 458 26 41.94
Operations Year 5,
Non-Peak Season
Weekend PM 250 16 53 3 189 14 492 33 38.67
Weekday AM 194 36 41 8 274 14 509 58 50.79
Weekday PM 290 20 61 4 274 14 625 38 43.44
Weekend AM 212 16 45 3 189 14 446 33 42.38
Operations Year 5, Peak
Season Weekend
PM 290 22 61 5 189 14 540 41 34.94

18
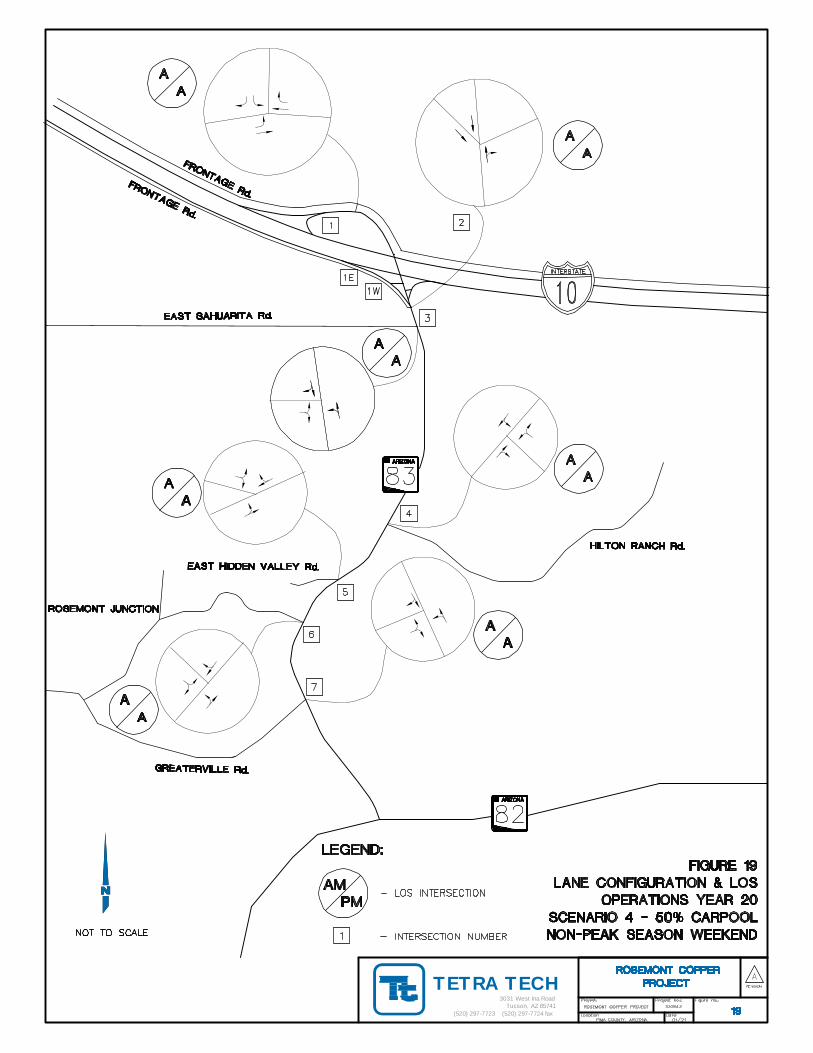
4.0 Operations Year 20 As described in Section 2.0, Operations Year 20 represents the Project’s operational condition at the beginning of Year 20. In order to fully analyze potential Project traffic impacts on AZ-83 and on the selected intersections, LOS results were compared to LOS values with the Project not in operation. Similar to Section 3.0, three (3) scenarios, No Carpool, 50% Carpool, and 50% Carpool with no Copper Concentrate Truck Traffic, were considered for the Operations Year 20 analysis. SYNCHRO and HCS2000 worksheets for Operations Year 20 are included in Attachments 3 and 4, respectively. Tables 4.1, 4.2, 4.4, and 4.5 present the study intersections’ corresponding ICU values and the LOS for Operations Year 20 during non-peak and peak seasons under Scenario 3 (No Carpool). Tables 4.3 and 4.6 describe the highway segment categories, corresponding LOS criteria values, and the LOS for Operations Year 20 under Scenario 3. Scenario 4 (50% Carpool) LOS results are provided in Tables 4.8 through 4.13. Tables 4.15 through 4.20 present intersection and segment LOS analysis results for Scenario 5 (50% Carpool with no Concentrate Truck Traffic). Tables 4.7, 4.14, and 4.21 present a traffic volume comparison between Project and non-Project related traffic for Operations Year 20. Operations Year 20 lane configurations and LOS values for the study area are shown on Figures 14 through 25 for each of the three (3) scenarios.
Scenario 3 – No Carpool
Non-Peak Season Under Scenario 3, average ICU values increased significantly for all seven (7) intersections by 48.93% and 45.68% for weekday and weekend periods, respectively, when compared to ICU values with the Project not in operation. Despite the increase in ICU values, traffic forecasts for the non-peak season were shown to operate at acceptable LOS values for all intersections under Scenario 3, Operations Year 20 (see Tables 4.1 and 4.2). Except for the intersection of AZ-83 and East Hidden Valley Road, all intersections had an LOS of A. This intersection, however, showed a LOS of B with an ICU of 55.3%. A detailed look at the approach LOS for this intersection gave a LOS of C for the eastbound approach leg. This implies that vehicles turning onto AZ-83 from East Hidden Valley Road would have difficulty with turning movements even though the overall intersection performance has a LOS of A. Segment LOS during the weekday PM peak period gave a LOS level of D for both Segment 1 and 2. Based on the segment LOS criteria during Weekday AM Peak period, Segment 2 gave the highest value of 71.1% compared to all other non-peak analysis periods.

19
Table 4.1 Intersection LOS Summary – Operations Year 20, Scenario 3, Non-Peak Season Condition (Weekday)
AM Peak Hour PM Peak Hour Intersection
ICU (%) LOS ICU (%) LOS AZ-83 and I-10 Westbound on- and off-ramps 52.4 A 35.9 A AZ-83 and I-10 Eastbound on- and off-ramps 30.9 A 35.1 A
AZ-83 and East Sahuarita Rd. 43.2 A 49.1 A AZ-83 and Hilton Ranch Rd. 32.6 A 27.8 A AZ-83 and Hidden Valley Rd. 55.3 B 53.5 A
AZ-83 and Rosemont Junction 14.7 A 14.5 A AZ-83 and Greaterville Rd. 24.7 A 22.1 A
Table 4.2 Intersection LOS Summary – Operations Year 20, Scenario 3, Non-Peak Season Condition (Weekend)
AM Peak Hour PM Peak Hour Intersection
ICU (%) LOS ICU (%) LOS AZ-83 and I-10 Westbound on- and off-ramps 42.3 A 28.9 A AZ-83 and I-10 Eastbound on- and off-ramps 27.3 A 41.4 A
AZ-83 and East Sahuarita Rd. 34.7 A 51.4 A AZ-83 and Hilton Ranch Rd. 28.7 A 28.2 A AZ-83 and Hidden Valley Rd. 45.1 A 43.1 A
AZ-83 and Rosemont Junction 23.0 A 14.3 A AZ-83 and Greaterville Rd. 18.9 A 31.3 A
Table 4.3 Segment LOS – Operations Year 20, Scenario 3, Non-Peak Season Condition
Weekday Weekend
Segment AM Peak Hour
LOS (% Time Spent Following)
PM Peak Hour
LOS (% Time Spent Following)
AM Peak Hour
LOS (% Time Spent Following)
PM Peak Hour
LOS (% Time Spent Following)
Segment 1 C(66.5) D(70.3) C(68.1) D(70.2) Segment 2 D(71.1) D(70.5) C(65.3) C(64.5)

20
Peak Season For Operations Year 20 under Scenario 3, all the intersections were at acceptable operational levels for the peak season. An average of 45.68% increase in ICU values was observed compared to conditions without the Project. Even for the most active intersection of AZ-83 and East Sahuarita Road, where the ICU values were the highest (60.4% during PM peak hours), the approach leg for turning movements showed a LOS of B or higher. Similar to the non-peak period, the intersection of AZ-83 and Hidden Valley Road showed significantly higher values. Except for Segment 1 during the Weekday PM peak period, most of the segment LOS values showed an acceptable level of C. Although Segment 1 during the Weekend PM peak period was at a LOS level of C, the LOS criteria value was close to a level of D, indicating a condition close to the traffic failure point.
Table 4.4 Intersection LOS Summary – Operations Year 20, Scenario 3, Peak Season Condition (Weekday)
AM Peak Hour PM Peak Hour Intersection
ICU (%) LOS ICU (%) LOS AZ-83 and I-10 Westbound on- and off-ramps 39.6 A 31.5 A AZ-83 and I-10 Eastbound on- and off-ramps 24.8 A 25.2 A
AZ-83 and East Sahuarita Rd. 35.3 A 60.4 B AZ-83 and Hilton Ranch Rd. 26.4 A 42.1 A AZ-83 and Hidden Valley Rd. 48.2 A 56.3 B
AZ-83 and Rosemont Junction 25.2 A 19.6 A AZ-83 and Greaterville Rd. 20.6 A 24.6 A
Table 4.5 Intersection LOS Summary – Operations Year 20, Scenario 3, Peak Season Condition (Weekend)
AM Peak Hour PM Peak Hour Intersection
ICU (%) LOS ICU (%) LOS AZ-83 and I-10 Westbound on- and off-ramps 36.1 A 40.0 A AZ-83 and I-10 Eastbound on- and off-ramps 25.6 A 40.2 A
AZ-83 and East Sahuarita Rd. 46.3 A 56.2 B AZ-83 and Hilton Ranch Rd. 21.5 A 32.3 A AZ-83 and Hidden Valley Rd. 41.8 A 51.2 A
AZ-83 and Rosemont Junction 20.4 A 15.9 A AZ-83 and Greaterville Rd. 12.3 A 29.7 A

21
Table 4.6 Segment LOS – Operations Year 20, Scenario 3, Peak Season Condition
Weekday Weekend
Segment AM Peak Hour
LOS (% Time Spent Following)
PM Peak Hour
LOS (% Time Spent Following)
AM Peak Hour
LOS (% Time Spent Following)
PM Peak Hour
LOS (% Time Spent Following)
Segment 1 C(66.1) D(71.2) C(64.7) C(69.8) Segment 2 C(61.6) C(66.2) C(59.0) C(65.0)
Traffic Volume Comparison In order to distinguish between increases in traffic due to population growth versus the Project operation, a traffic volume comparison was completed. Table 4.7 summarizes the number of vehicles for the base volume [i.e., Existing Year (2008)] and the predicted number of vehicles related to population growth and the Project. As shown in Table 4.7, the percentage of traffic due to the Project at Operations Year 20, under Scenario 3, ranged from 38.57% to 59.03% with an average of 47.81%. Although the average value is lower than Operations Year 5 for this scenario, the results still indicate a higher percentage of traffic due to the Project operation.
Table 4.7 Traffic Volume Comparison for Operations Year 20, Scenario 3
Base Traffic Volume
Population Growth Traffic
Volume
Project Traffic Volume
Total Traffic Volume
Vehicle Type Vehicle Type Vehicle Type Vehicle Type Analysis Period
1 & 2 3,4 & 5 1 & 2 3,4 & 5 1 & 2 3,4 & 5 1 & 2 3,4 & 5
Traffic % from
Project Volume
Weekday AM 160 16 139 14 456 18 755 48 59.03
Weekday PM 212 12 184 10 456 18 852 40 53.14
Weekend AM 222 10 193 9 348 18 763 37 45.75
Operations Year 20,
Non-Peak Season
Weekend PM 250 16 218 14 348 18 816 48 42.36
Weekday AM 194 36 169 31 456 18 819 85 52.43
Weekday PM 290 20 252 17 456 18 998 55 45.01
Weekend AM 212 16 184 14 348 18 744 48 46.21
Operations Year 20,
Peak Season
Weekend PM 290 22 252 19 348 18 890 59 38.57

22
Scenario 4 – 50% Carpool
Non-Peak Season As shown in Tables 4.8 and 4.9, traffic forecasts during the non-peak season for all intersections are expected to operate at acceptable LOS values under Scenario 4 for Operations Year 20. Increases in ICU values were observed when compared to Operations Year 5. For the intersection of AZ-83 and Hidden Valley Road, the overall intersection LOS values showed a level of A with an approach LOS of B for turning movements onto AZ-83 during all analysis periods. For segment analysis results, although an increase in LOS criteria values were observed compared to Operations Year 5 under same Scenario 4, all the segment LOS values were at an acceptable level of C.
Table 4.8 Intersection LOS Summary – Operations Year 20, Scenario 4, Non-Peak Season Condition (Weekday)
AM Peak Hour PM Peak Hour Intersection
ICU (%) LOS ICU (%) LOS AZ-83 and I-10 Westbound on- and off-ramps 47.8 A 33.4 A AZ-83 and I-10 Eastbound on- and off-ramps 25.4 A 32.6 A
AZ-83 and East Sahuarita Rd. 39.3 A 44.6 A AZ-83 and Hilton Ranch Rd. 28.0 A 25.4 A AZ-83 and Hidden Valley Rd. 44.6 A 42.9 A
AZ-83 and Rosemont Junction 13.2 A 13.0 A AZ-83 and Greaterville Rd. 23.2 A 18.0 A
Table 4.9 Intersection LOS Summary – Operations Year 20, Scenario 4, Non-Peak Season Condition (Weekend)
AM Peak Hour PM Peak Hour Intersection
ICU (%) LOS ICU (%) LOS AZ-83 and I-10 Westbound on- and off-ramps 39.7 A 26.4 A AZ-83 and I-10 Eastbound on- and off-ramps 25.1 A 38.5 A
AZ-83 and East Sahuarita Rd. 32.2 A 45.9 A AZ-83 and Hilton Ranch Rd. 25.7 A 24.5 A AZ-83 and Hidden Valley Rd. 36.9 A 35.0 A
AZ-83 and Rosemont Junction 22.0 A 13.4 A AZ-83 and Greaterville Rd. 18.2 A 30.4 A

23
Table 4.10 Segment LOS – Operations Year 20, Scenario 4, Non-Peak Season Condition
Weekday Weekend
Segment AM Peak Hour
LOS (% Time Spent Following)
PM Peak Hour
LOS (% Time Spent Following)
AM Peak Hour
LOS (% Time Spent Following)
PM Peak Hour
LOS (% Time Spent Following)
Segment 1 C(63.0) C(66.0) C(65.2) C(67.1) Segment 2 C(65.6) C(65.0) C(61.7) C(60.5)
Peak Season Under Scenario 4, for Operations Year 20, all the intersections showed an acceptable LOS value of A. Average ICU values increased for all seven (7) intersections by 32.10% and 31.47% for the weekday and weekend periods, respectively, when compared to ICU values with the Project not in operation. The intersection of AZ-83 and Sahuarita Road showed high ICU values during PM peak periods. All approach LOS values for the corresponding intersection were at a LOS of C or higher. As shown in Table 4.13, except for Segment 1 during weekday and weekend PM peak periods, the remaining segment LOS values are expected to operate at an acceptable LOS of C. For Segment 1, mitigation measures are discussed in Section 5 to address an LOS level of D observed during PM peak periods.
Table 4.11 Intersection LOS Summary – Operations Year 20, Scenario 4, Peak Season Condition (Weekday)
AM Peak Hour PM Peak Hour Intersection
ICU (%) LOS ICU (%) LOS AZ-83 and I-10 Westbound on- and off-ramps 41.6 A 31.2 A AZ-83 and I-10 Eastbound on- and off-ramps 25.9 A 21.1 A
AZ-83 and East Sahuarita Rd. 32.8 A 53.2 A AZ-83 and Hilton Ranch Rd. 21.7 A 37.6 A AZ-83 and Hidden Valley Rd. 37.4 A 45.8 A
AZ-83 and Rosemont Junction 23.6 A 18.1 A AZ-83 and Greaterville Rd. 19.1 A 23.0 A

24
Table 4.12 Intersection LOS Summary – Operations Year 20, Scenario 4, Peak Season Condition (Weekend)
AM Peak Hour PM Peak Hour Intersection
ICU (%) LOS ICU (%) LOS AZ-83 and I-10 Westbound on- and off-ramps 33.4 A 37.5 A AZ-83 and I-10 Eastbound on- and off-ramps 23.3 A 37.2 A
AZ-83 and East Sahuarita Rd. 42.0 A 51.5 A AZ-83 and Hilton Ranch Rd. 18.5 A 29.9 A AZ-83 and Hidden Valley Rd. 33.6 A 43.0 A
AZ-83 and Rosemont Junction 19.4 A 14.9 A AZ-83 and Greaterville Rd. 11.3 A 28.9 A
Table 4.13 Segment LOS – Operations Year 20, Scenario 4, Peak Season Condition
Weekday Weekend
Segment AM Peak Hour
LOS (% Time Spent Following)
PM Peak Hour
LOS (% Time Spent Following)
AM Peak Hour
LOS (% Time Spent Following)
PM Peak Hour
LOS (% Time Spent Following)
Segment 1 C(66.4) D(71.5) C(65.0) D(70.1) Segment 2 C(61.8) C(66.5) C(59.2) C(65.2)
Traffic Volume Comparison Similar to the previous sections, a traffic volume comparison was prepared to distinguish the increase in traffic due to population growth versus the Project operation. Table 4.14 summarizes the number of vehicles for the base volume (i.e., Existing Year (2008)) and the predicted number of vehicles related to population growth and the Project. As shown in Table 4.14, the percentage of traffic due to the Project at Operations Year 20, under Scenario 4, ranged from 28.02% to 47.02% with an average of 36.32%.

25
Table 4.14 Traffic Volume Comparison for Operations Year 20, Scenario 4
Base Traffic Volume
Population Growth Traffic
Volume
Project Traffic Volume
Total Traffic Volume
Vehicle Type Vehicle Type Vehicle Type Vehicle Type Analysis Period
1 & 2 3,4 & 5 1 & 2 3,4 & 5 1 & 2 3,4 & 5 1 & 2 3,4 & 5
Traffic % from
Project Volume
Weekday AM 160 16 139 14 274 18 573 48 47.02
Weekday PM 212 12 184 10 274 18 670 40 41.13
Weekend AM 222 10 193 9 209 18 624 37 34.34
Operations Year 20,
Non-Peak Season
Weekend PM 250 16 218 14 209 18 677 48 31.31
Weekday AM 194 36 169 31 274 18 637 85 40.44
Weekday PM 290 20 252 17 274 18 816 55 33.52
Weekend AM 212 16 184 14 209 18 65 48 34.76
Operations Year 20,
Peak Season
Weekend PM 290 22 252 19 209 18 751 59 28.02
Scenario 5 – 50% Carpool with no Copper Concentrate Trucks
Non-Peak Season LOS results in Tables 4.15 and 4.16 show acceptable intersection LOS values for all intersections under Scenario 5 for Operations Year 20. As stated previously, the results of Operations Year 20 and Scenario 5 closely follow the patterns observed for Scenario 4. Increases in ICU values, an average of 28.65%, were observed when compared to Operations Year 5. Although an increase in LOS criteria values were observed, all segment LOS values were at an acceptable level of C.

26
Table 4.15 Intersection LOS Summary – Operations Year 20, Scenario 5, Non-Peak Season Condition (Weekday)
AM Peak Hour PM Peak Hour Intersection
ICU (%) LOS ICU (%) LOS
AZ-83 and I-10 Westbound on- and off-ramps 47.7 A 33.4 A
AZ-83 and I-10 Eastbound on- and off-ramps 25.3 A 32.6 A AZ-83 and East Sahuarita Rd. 39.2 A 44.5 A AZ-83 and Hilton Ranch Rd. 27.8 A 25.4 A AZ-83 and Hidden Valley Rd. 44.3 A 42.7 A
AZ-83 and Rosemont Junction 13.1 A 12.9 A AZ-83 and Greaterville Rd. 23.1 A 18.0 A
Table 4.16 Intersection LOS Summary – Operations Year 20, Scenario 5, Non-Peak Season Condition (Weekend)
AM Peak Hour PM Peak Hour Intersection
ICU (%) LOS ICU (%) LOS AZ-83 and I-10 Westbound on- and off-ramps 39.7 A 26.4 A AZ-83 and I-10 Eastbound on- and off-ramps 25.1 A 38.5 A
AZ-83 and East Sahuarita Rd. 32.2 A 45.8 A AZ-83 and Hilton Ranch Rd. 25.6 A 24.4 A AZ-83 and Hidden Valley Rd. 36.7 A 34.7 A
AZ-83 and Rosemont Junction 22.0 A 13.4 A AZ-83 and Greaterville Rd. 18.2 A 30.4 A
Table 4.17 Segment LOS – Operations Year 20, Scenario 5, Non-Peak Season Condition
Weekday Weekend
Segment AM Peak Hour
LOS (% Time Spent Following)
PM Peak Hour
LOS (% Time Spent Following)
AM Peak Hour
LOS (% Time Spent Following)
PM Peak Hour
LOS (% Time Spent Following)
Segment 1 C(62.8) C(65.7) C(65.0) C(66.8) Segment 2 C(65.4) C(65.0) C(61.6) C(60.2)

27
Peak Season Under Scenario 5, for the Operations Year 20, all the intersections showed an acceptable LOS value of A. Average ICU values increased for all seven (7) intersections by 31.77% and 31.05% for the weekday and weekend periods, respectively, when compared to ICU values with the Project not in operation. For the intersection of AZ-83 and Hidden Valley Road, the overall intersection LOS values were at a level of A with an approach LOS of B for turning movements onto AZ-83 during all analysis periods. As shown in Table 4.20, all segment LOS values are expected to operate at an acceptable LOS of C, except for Segment 1 during the Weekday PM peak hour.
Table 4.18 Intersection LOS Summary – Operations Year 20, Scenario 5, Peak Season Condition (Weekday)
AM Peak Hour PM Peak Hour Intersection
ICU (%) LOS ICU (%) LOS AZ-83 and I-10 Westbound on- and off-ramps 41.6 A 31.2 A AZ-83 and I-10 Eastbound on- and off-ramps 25.9 A 21.1 A
AZ-83 and East Sahuarita Rd. 32.8 A 53.0 A AZ-83 and Hilton Ranch Rd. 21.6 A 37.5 A AZ-83 and Hidden Valley Rd. 37.2 A 45.5 A
AZ-83 and Rosemont Junction 23.6 A 18.0 A AZ-83 and Greaterville Rd. 19.0 A 23.0 A
Table 4.19 Intersection LOS Summary – Operations Year 20, Scenario 5, Peak Season Condition (Weekend)
AM Peak Hour PM Peak Hour Intersection
ICU (%) LOS ICU (%) LOS AZ-83 and I-10 Westbound on- and off-ramps 33.4 A 37.5 A AZ-83 and I-10 Eastbound on- and off-ramps 23.3 A 37.2 A
AZ-83 and East Sahuarita Rd. 41.9 A 51.4 A AZ-83 and Hilton Ranch Rd. 18.3 A 29.9 A AZ-83 and Hidden Valley Rd. 33.3 A 42.8 A
AZ-83 and Rosemont Junction 19.3 A 14.8 A AZ-83 and Greaterville Rd. 11.3 A 28.9 A

28
Table 4.20 Segment LOS – Operations Year 20, Scenario 5, Peak Season Condition
Weekday Weekend
Segment AM Peak Hour
LOS (% Time Spent Following)
PM Peak Hour
LOS (% Time Spent Following)
AM Peak Hour
LOS (% Time Spent Following)
PM Peak Hour
LOS (% Time Spent Following)
Segment 1 C(66.1) D(71.2) C(64.7) C(69.8) Segment 2 C(61.6) C(66.2) C(59.0) C(65.0)
Traffic Volume Comparison Similar to the previous sections, a traffic volume comparison was prepared to distinguish the increase in traffic due to population growth versus the Project operation. Table 4.21 summarizes the number of vehicles for the base volume [i.e., Existing Year (2008)] and the predicted number of vehicles related to population growth and the Project. As shown in Table 4.21, the percentage of traffic due to the Project at Operations Year 20, under Scenario 5, ranged from 27.67% to 46.68% with an average value of 35.96%.
Table 4.21 Traffic Volume Comparison for Operations Year 20, Scenario 5
Base Traffic Volume
Population Growth Traffic
Volume
Project Traffic Volume
Total Traffic Volume
Vehicle Type Vehicle Type Vehicle Type Vehicle Type Analysis Period
1 & 2 3,4 & 5 1 & 2 3,4 & 5 1 & 2 3,4 & 5 1 & 2 3,4 & 5
Traffic % from
Project Volume
Weekday AM 160 16 139 14 274 14 573 44 46.68
Weekday PM 212 12 184 10 274 14 670 36 40.79
Weekend AM 222 10 193 9 209 14 624 33 33.94
Operations Year 20,
Non-Peak Season
Weekend PM 250 16 218 14 209 14 677 44 30.93
Weekday AM 194 36 169 31 274 14 637 81 40.11
Weekday PM 290 20 252 17 274 14 816 51 33.22
Weekend AM 212 16 184 14 209 14 605 44 34.36
Operations Year 20,
Peak Season
Weekend PM 290 22 252 19 209 14 751 55 27.67

29
5.0 Mitigation Most public agencies strive to achieve and maintain a LOS of C or greater in their jurisdiction. Therefore, when LOS results come close to or below a level of C, mitigation measures are recommended. In the previous Traffic Study Report (April 2009), total of two (2) potential mitigation methods were discussed when LOS values showed a level of D or worse. The most cost effective and easiest mitigation measure to implement is proper carpool management and staged truck deliveries such as those indicated in the Mine Plan of Operations and Feasibility Study. The Scenario 1 (100% Carpool), presented in the April 2009 Traffic Study Report, is a good example of this mitigation. The LOS analysis results under Scenario 1 showed all LOS values at an acceptable level for Operations Year 5 and 20, thus indicating an effective mitigation measure of LOS improvement under proper carpool management.
The other mitigation method identified includes roadway modifications to AZ-83 such as adding a passing lane(s). The mitigation analysis presented in the April 2009 Traffic Study Report of adding a passing lane(s) showed less improvement compared to carpool management. For example, mitigation analysis for Operations Year 20, for Scenario 3 during the peak season weekday PM peak period, showed approximately 80% of Segment 1 (AZ-83) needed to be converted into passing lanes in order to achieve an acceptable operation level of LOS C (see Attachment 5). This will require significantly high construction costs as well as numerous other considerations such as environmental issues and roadway design restrictions. Furthermore, with possible negative traffic impacts during construction of the passing lane(s), an in-depth assessment should be conducted when considering this type of mitigation measure. From a cost-benefit analysis perspective, this mitigation is not usually highly recommended as the benefit does not outweigh high invested costs.
6.0 Conclusion In this Technical Memorandum, three (3) additional scenarios were analyzed to assess traffic impacts of the proposed Rosemont Copper Project. Two (2) analysis years, Operations Year 5 and 20, were considered for comprehensive LOS evaluation. LOS analysis of intersections showed acceptable LOS for all scenarios under all analysis years. For segment LOS analysis of Operations Year 5, analysis results of all scenarios showed an acceptable level of C. Operations Year 20 segment LOS analysis results demonstrated that Segment 1 (along AZ-83) tends to be congested, yielding a LOS of level D during PM peak periods. Two (2) mitigation methods, as presented in the previous Traffic Study Report (April 2009), were reviewed. Analysis results revealed the importance of carpool implementation as a mitigation measure in order to achieve an acceptable LOS.
7.0 REFERENCES American Association of State Highway and Transportation Officials (AASHTO) (2004).
Geometric Design of Highways and Streets.
Arizona Department of Transportation (ADOT) (2000). Traffic Engineering Policies, Guidelines, and Procedures.
ADOT (1999). Traffic Impact Analysis for Proposed Development.

30
ADOT (2007). Roadway Design Guidelines.
H. Douglas Robertson, Joseph E. Hummer, Donna C. Nelson. (1994). Manual of Transportation Engineering Studies. Institute of Transportation Engineers.
M3 Engineering & Technology Corporation (M3) (2007). Rosemont Copper Project Feasibility Study. Prepared for Rosemont Copper Company. Report Dated August 2007.
M3 (2009). Rosemont Copper Project Updated Feasibility Study. Prepared for Rosemont Copper Company. Report Dated January 2009.
Tetra Tech (2009a). Traffic Analysis Report – Rosemont Copper Project. Prepared for Rosemont Copper Company. Report Dated April 2009.
Tetra Tech (2009b) Roadway Assessment Report – Rosemont Copper Project. Prepared for Rosemont Copper Company. Report Dated July, 2009.
Transportation Research Board (2000). Highway Capacity Manual.
WestLand Resources, Inc. (2007). Rosemont Project Mine Plan of Operations. Prepared for Rosemont Copper Company. Report Dated June 2007.

FIGURES

TET
RA
TE
CH
3031 West Ina R
oadTucson, A
rizona 85741(520) 297-7723 (520) 297-7724 fax

TETRA TECH3031 West Ina Road
Tucson, AZ 85741(520) 297-7723 (520) 297-7724 fax

TETRA TECH3031 West Ina Road
Tucson, AZ 85741(520) 297-7723 (520) 297-7724 fax
TETRA TECH3031 West Ina Road
Tucson, AZ 85741(520) 297-7723 (520) 297-7724 fax

TETRA TECH3031 West Ina Road
Tucson, AZ 85741(520) 297-7723 (520) 297-7724 fax

TETRA TECH3031 West Ina Road
Tucson, AZ 85741(520) 297-7723 (520) 297-7724 fax

TETRA TECH3031 West Ina Road
Tucson, AZ 85741(520) 297-7723 (520) 297-7724 fax

TETRA TECH3031 West Ina Road
Tucson, AZ 85741(520) 297-7723 (520) 297-7724 fax

TETRA TECH3031 West Ina Road
Tucson, AZ 85741(520) 297-7723 (520) 297-7724 fax
TETRA TECH3031 West Ina Road
Tucson, AZ 85741(520) 297-7723 (520) 297-7724 fax

TETRA TECH3031 West Ina Road
Tucson, AZ 85741(520) 297-7723 (520) 297-7724 fax

TETRA TECH3031 West Ina Road
Tucson, AZ 85741(520) 297-7723 (520) 297-7724 fax

TETRA TECH3031 West Ina Road
Tucson, AZ 85741(520) 297-7723 (520) 297-7724 fax

TETRA TECH3031 West Ina Road
Tucson, AZ 85741(520) 297-7723 (520) 297-7724 fax

TETRA TECH3031 West Ina Road
Tucson, AZ 85741(520) 297-7723 (520) 297-7724 fax

TETRA TECH3031 West Ina Road
Tucson, AZ 85741(520) 297-7723 (520) 297-7724 fax

TETRA TECH3031 West Ina Road
Tucson, AZ 85741(520) 297-7723 (520) 297-7724 fax

TETRA TECH3031 West Ina Road
Tucson, AZ 85741(520) 297-7723 (520) 297-7724 fax
TETRA TECH3031 West Ina Road
Tucson, AZ 85741(520) 297-7723 (520) 297-7724 fax

TETRA TECH3031 West Ina Road
Tucson, AZ 85741(520) 297-7723 (520) 297-7724 fax

TETRA TECH3031 West Ina Road
Tucson, AZ 85741(520) 297-7723 (520) 297-7724 fax

TETRA TECH3031 West Ina Road
Tucson, AZ 85741(520) 297-7723 (520) 297-7724 fax

TETRA TECH3031 West Ina Road
Tucson, AZ 85741(520) 297-7723 (520) 297-7724 fax

TETRA TECH3031 West Ina Road
Tucson, AZ 85741(520) 297-7723 (520) 297-7724 fax

TETRA TECH3031 West Ina Road
Tucson, AZ 85741(520) 297-7723 (520) 297-7724 fax

ATTACHMENT 1
OPERATIONS YEAR 5 LOS WORKSHEETS –
INTERSECTIONS

NON-PEAK SEASON
SCENARIO 3
NO CARPOOL

HCM Unsignalized Intersection Capacity Analysis
1: I-10 WB On-Off Ramp & AZ-83 Page 1
Operations Year 5, No Carpool, Non-Peak Season, Weekday, AM Synchro 7 Report
Tetra Tech ISG Page 1
Movement EBL EBT WBT WBR SBL SBR
Lane Configurations
Volume (veh/h) 6 45 590 2 8 31
Sign Control Free Free Yield
Grade 0% 0% 0%
Peak Hour Factor 0.92 0.92 0.92 0.92 0.92 0.92
Hourly flow rate (vph) 7 49 641 2 9 34
Pedestrians
Lane Width (ft)
Walking Speed (ft/s)
Percent Blockage
Right turn flare (veh)
Median type None None
Median storage veh)
Upstream signal (ft)
pX, platoon unblocked
vC, conflicting volume 643 704 642
vC1, stage 1 conf vol
vC2, stage 2 conf vol
vCu, unblocked vol 643 704 642
tC, single (s) 4.1 6.4 6.2
tC, 2 stage (s)
tF (s) 2.2 3.5 3.3
p0 queue free % 99 98 93
cM capacity (veh/h) 932 397 470
Direction, Lane # EB 1 WB 1 SB 1
Volume Total 55 643 42
Volume Left 7 0 9
Volume Right 0 2 34
cSH 932 1700 453
Volume to Capacity 0.01 0.38 0.09
Queue Length 95th (ft) 1 0 8
Control Delay (s) 1.1 0.0 13.8
Lane LOS A B
Approach Delay (s) 1.1 0.0 13.8
Approach LOS B
Intersection Summary
Average Delay 0.9
Intersection Capacity Utilization 41.2% ICU Level of Service A
Analysis Period (min) 15

HCM Unsignalized Intersection Capacity Analysis
2: AZ-83 & EB Off-Ramp Page 2
Operations Year 5, No Carpool, Non-Peak Season, Weekday, AM Synchro 7 Report
Tetra Tech ISG Page 2
Movement NBL NBT NBR SBL SBT SBR SEL SER SWL SWR
Lane Configurations
Volume (veh/h) 0 323 45 0 45 0 0 295 0 0
Sign Control Free Free Yield Yield
Grade 0% 0% 0% 0%
Peak Hour Factor 0.92 0.92 0.92 0.92 0.92 0.92 0.92 0.92 0.92 0.92
Hourly flow rate (vph) 0 351 49 0 49 0 0 321 0 0
Pedestrians
Lane Width (ft)
Walking Speed (ft/s)
Percent Blockage
Right turn flare (veh)
Median type None None
Median storage veh)
Upstream signal (ft)
pX, platoon unblocked
vC, conflicting volume 49 400 449 49 721 400
vC1, stage 1 conf vol
vC2, stage 2 conf vol
vCu, unblocked vol 49 400 449 49 721 400
tC, single (s) 4.1 4.1 6.5 6.2 7.1 6.5
tC, 2 stage (s)
tF (s) 2.2 2.2 4.0 3.3 3.5 4.0
p0 queue free % 100 100 100 68 100 100
cM capacity (veh/h) 1545 1148 502 1014 233 535
Direction, Lane # NB 1 NB 2 SB 1 SE 1
Volume Total 351 49 49 321
Volume Left 0 0 0 0
Volume Right 0 49 0 321
cSH 1700 1700 1700 1014
Volume to Capacity 0.21 0.03 0.03 0.32
Queue Length 95th (ft) 0 0 0 34
Control Delay (s) 0.0 0.0 0.0 10.2
Lane LOS B
Approach Delay (s) 0.0 0.0 10.2
Approach LOS B
Intersection Summary
Average Delay 4.2
Intersection Capacity Utilization 28.3% ICU Level of Service A
Analysis Period (min) 15

HCM Unsignalized Intersection Capacity Analysis
3: Sahuarita Rd. & AZ-83 Page 1
Operations Year 5, No Carpool, Non-Peak Season, Weekday, AM Synchro 7 Report
Tetra Tech ISG 2/5/2010
Movement EBL EBR NBL NBT SBT SBR
Lane Configurations
Volume (veh/h) 15 7 15 216 301 2
Sign Control Yield Free Free
Grade 0% 0% 0%
Peak Hour Factor 0.92 0.92 0.92 0.92 0.92 0.92
Hourly flow rate (vph) 16 8 16 235 327 2
Pedestrians
Lane Width (ft)
Walking Speed (ft/s)
Percent Blockage
Right turn flare (veh)
Median type None None
Median storage veh)
Upstream signal (ft)
pX, platoon unblocked
vC, conflicting volume 596 328 329
vC1, stage 1 conf vol
vC2, stage 2 conf vol
vCu, unblocked vol 596 328 329
tC, single (s) 6.4 6.2 4.1
tC, 2 stage (s)
tF (s) 3.5 3.3 2.2
p0 queue free % 96 99 99
cM capacity (veh/h) 457 709 1219
Direction, Lane # EB 1 NB 1 SB 1
Volume Total 24 251 329
Volume Left 16 16 0
Volume Right 8 0 2
cSH 515 1219 1700
Volume to Capacity 0.05 0.01 0.19
Queue Length 95th (ft) 4 1 0
Control Delay (s) 12.3 0.6 0.0
Lane LOS B A
Approach Delay (s) 12.3 0.6 0.0
Approach LOS B
Intersection Summary
Average Delay 0.8
Intersection Capacity Utilization 33.7% ICU Level of Service A
Analysis Period (min) 15

HCM Unsignalized Intersection Capacity Analysis
4: Hilton Ranch Rd. & AZ-83 Page 2
Operations Year 5, No Carpool, Non-Peak Season, Weekday, AM Synchro 7 Report
Tetra Tech ISG 2/5/2010
Movement WBL WBR NBT NBR SBL SBT
Lane Configurations
Volume (veh/h) 0 10 175 0 10 306
Sign Control Yield Free Free
Grade 0% 0% 0%
Peak Hour Factor 0.92 0.92 0.92 0.92 0.92 0.92
Hourly flow rate (vph) 0 11 190 0 11 333
Pedestrians
Lane Width (ft)
Walking Speed (ft/s)
Percent Blockage
Right turn flare (veh)
Median type None None
Median storage veh)
Upstream signal (ft)
pX, platoon unblocked
vC, conflicting volume 545 190 190
vC1, stage 1 conf vol
vC2, stage 2 conf vol
vCu, unblocked vol 545 190 190
tC, single (s) 6.4 6.2 4.1
tC, 2 stage (s)
tF (s) 3.5 3.3 2.2
p0 queue free % 100 99 99
cM capacity (veh/h) 492 846 1372
Direction, Lane # WB 1 NB 1 SB 1
Volume Total 11 190 343
Volume Left 0 0 11
Volume Right 11 0 0
cSH 846 1700 1372
Volume to Capacity 0.01 0.11 0.01
Queue Length 95th (ft) 1 0 1
Control Delay (s) 9.3 0.0 0.3
Lane LOS A A
Approach Delay (s) 9.3 0.0 0.3
Approach LOS A
Intersection Summary
Average Delay 0.4
Intersection Capacity Utilization 34.2% ICU Level of Service A
Analysis Period (min) 15

HCM Unsignalized Intersection Capacity Analysis
5: Hidden Valley Rd. & AZ-83 Page 3
Operations Year 5, No Carpool, Non-Peak Season, Weekday, AM Synchro 7 Report
Tetra Tech ISG 2/5/2010
Movement EBL EBR NBL NBT SBT SBR
Lane Configurations
Volume (veh/h) 107 36 85 116 90 255
Sign Control Yield Free Free
Grade 3% 6% -6%
Peak Hour Factor 0.92 0.92 0.92 0.92 0.92 0.92
Hourly flow rate (vph) 116 39 92 126 98 277
Pedestrians
Lane Width (ft)
Walking Speed (ft/s)
Percent Blockage
Right turn flare (veh)
Median type None None
Median storage veh)
Upstream signal (ft)
pX, platoon unblocked
vC, conflicting volume 547 236 375
vC1, stage 1 conf vol
vC2, stage 2 conf vol
vCu, unblocked vol 547 236 375
tC, single (s) 6.4 6.2 4.1
tC, 2 stage (s)
tF (s) 3.5 3.3 2.2
p0 queue free % 74 95 92
cM capacity (veh/h) 455 797 1173
Direction, Lane # EB 1 NB 1 SB 1
Volume Total 155 218 375
Volume Left 116 92 0
Volume Right 39 0 277
cSH 510 1173 1700
Volume to Capacity 0.30 0.08 0.22
Queue Length 95th (ft) 32 6 0
Control Delay (s) 15.1 3.9 0.0
Lane LOS C A
Approach Delay (s) 15.1 3.9 0.0
Approach LOS C
Intersection Summary
Average Delay 4.3
Intersection Capacity Utilization 49.4% ICU Level of Service A
Analysis Period (min) 15

HCM Unsignalized Intersection Capacity Analysis
6: Rosemont Junction & AZ-83 Page 4
Operations Year 5, No Carpool, Non-Peak Season, Weekday, AM Synchro 7 Report
Tetra Tech ISG 2/5/2010
Movement EBL EBR NBL NBT SBT SBR
Lane Configurations
Volume (veh/h) 0 0 0 172 96 0
Sign Control Yield Free Free
Grade 0% 0% 0%
Peak Hour Factor 0.92 0.92 0.92 0.92 0.92 0.92
Hourly flow rate (vph) 0 0 0 187 104 0
Pedestrians
Lane Width (ft)
Walking Speed (ft/s)
Percent Blockage
Right turn flare (veh)
Median type None None
Median storage veh)
Upstream signal (ft)
pX, platoon unblocked
vC, conflicting volume 291 104 104
vC1, stage 1 conf vol
vC2, stage 2 conf vol
vCu, unblocked vol 291 104 104
tC, single (s) 6.4 6.2 4.1
tC, 2 stage (s)
tF (s) 3.5 3.3 2.2
p0 queue free % 100 100 100
cM capacity (veh/h) 695 945 1475
Direction, Lane # EB 1 NB 1 SB 1
Volume Total 0 187 104
Volume Left 0 0 0
Volume Right 0 0 0
cSH 1700 1475 1700
Volume to Capacity 0.00 0.00 0.06
Queue Length 95th (ft) 0 0 0
Control Delay (s) 0.0 0.0 0.0
Lane LOS A
Approach Delay (s) 0.0 0.0 0.0
Approach LOS A
Intersection Summary
Average Delay 0.0
Intersection Capacity Utilization 12.4% ICU Level of Service A
Analysis Period (min) 15

HCM Unsignalized Intersection Capacity Analysis
7: AZ-83 & Greaterville Rd. Page 5
Operations Year 5, No Carpool, Non-Peak Season, Weekday, AM Synchro 7 Report
Tetra Tech ISG 2/5/2010
Movement SET SER NWL NWT NEL NER
Lane Configurations
Volume (veh/h) 87 5 5 143 2 2
Sign Control Free Free Yield
Grade 0% 0% 0%
Peak Hour Factor 0.92 0.92 0.92 0.92 0.92 0.92
Hourly flow rate (vph) 95 5 5 155 2 2
Pedestrians
Lane Width (ft)
Walking Speed (ft/s)
Percent Blockage
Right turn flare (veh)
Median type None None
Median storage veh)
Upstream signal (ft)
pX, platoon unblocked
vC, conflicting volume 100 264 97
vC1, stage 1 conf vol
vC2, stage 2 conf vol
vCu, unblocked vol 100 264 97
tC, single (s) 4.1 6.4 6.2
tC, 2 stage (s)
tF (s) 2.2 3.5 3.3
p0 queue free % 100 100 100
cM capacity (veh/h) 1480 718 953
Direction, Lane # SE 1 NW 1 NE 1
Volume Total 100 161 4
Volume Left 0 5 2
Volume Right 5 0 2
cSH 1700 1480 819
Volume to Capacity 0.06 0.00 0.01
Queue Length 95th (ft) 0 0 0
Control Delay (s) 0.0 0.3 9.4
Lane LOS A A
Approach Delay (s) 0.0 0.3 9.4
Approach LOS A
Intersection Summary
Average Delay 0.3
Intersection Capacity Utilization 21.6% ICU Level of Service A
Analysis Period (min) 15

HCM Unsignalized Intersection Capacity Analysis
1: I-10 WB On-Off Ramp & AZ-83 Page 1
Operations Year 5, No Carpool, Non-Peak Season, Weekday, PM Synchro 7 Report
Tetra Tech ISG 2/5/2010
Movement EBL EBT WBT WBR SBL SBR
Lane Configurations
Volume (veh/h) 25 53 224 5 10 7
Sign Control Free Free Yield
Grade 0% 0% 0%
Peak Hour Factor 0.92 0.92 0.92 0.92 0.92 0.92
Hourly flow rate (vph) 27 58 243 5 11 8
Pedestrians
Lane Width (ft)
Walking Speed (ft/s)
Percent Blockage
Right turn flare (veh)
Median type None None
Median storage veh)
Upstream signal (ft)
pX, platoon unblocked
vC, conflicting volume 249 358 246
vC1, stage 1 conf vol
vC2, stage 2 conf vol
vCu, unblocked vol 249 358 246
tC, single (s) 4.1 6.4 6.2
tC, 2 stage (s)
tF (s) 2.2 3.5 3.3
p0 queue free % 98 98 99
cM capacity (veh/h) 1305 623 788
Direction, Lane # EB 1 WB 1 SB 1
Volume Total 85 249 18
Volume Left 27 0 11
Volume Right 0 5 8
cSH 1305 1700 682
Volume to Capacity 0.02 0.15 0.03
Queue Length 95th (ft) 2 0 2
Control Delay (s) 2.6 0.0 10.4
Lane LOS A B
Approach Delay (s) 2.6 0.0 10.4
Approach LOS B
Intersection Summary
Average Delay 1.2
Intersection Capacity Utilization 29.6% ICU Level of Service A
Analysis Period (min) 15

HCM Unsignalized Intersection Capacity Analysis
2: AZ-83 & EB Off-Ramp Page 2
Operations Year 5, No Carpool, Non-Peak Season, Weekday, PM Synchro 7 Report
Tetra Tech ISG 2/5/2010
Movement NBL NBT NBR SBL SBT SBR SEL SER SWL SWR
Lane Configurations
Volume (veh/h) 0 334 49 0 38 0 0 289 0 0
Sign Control Free Free Yield Yield
Grade 0% 0% 0% 0%
Peak Hour Factor 0.92 0.92 0.92 0.92 0.92 0.92 0.92 0.92 0.92 0.92
Hourly flow rate (vph) 0 363 53 0 41 0 0 314 0 0
Pedestrians
Lane Width (ft)
Walking Speed (ft/s)
Percent Blockage
Right turn flare (veh)
Median type None None
Median storage veh)
Upstream signal (ft)
pX, platoon unblocked
vC, conflicting volume 41 416 458 41 718 404
vC1, stage 1 conf vol
vC2, stage 2 conf vol
vCu, unblocked vol 41 416 458 41 718 404
tC, single (s) 4.1 4.1 6.5 6.2 7.1 6.5
tC, 2 stage (s)
tF (s) 2.2 2.2 4.0 3.3 3.5 4.0
p0 queue free % 100 100 100 69 100 100
cM capacity (veh/h) 1555 1132 497 1024 237 532
Direction, Lane # NB 1 NB 2 SB 1 SE 1
Volume Total 363 53 41 314
Volume Left 0 0 0 0
Volume Right 0 53 0 314
cSH 1700 1700 1700 1024
Volume to Capacity 0.21 0.03 0.02 0.31
Queue Length 95th (ft) 0 0 0 33
Control Delay (s) 0.0 0.0 0.0 10.1
Lane LOS B
Approach Delay (s) 0.0 0.0 10.1
Approach LOS B
Intersection Summary
Average Delay 4.1
Intersection Capacity Utilization 27.9% ICU Level of Service A
Analysis Period (min) 15

HCM Unsignalized Intersection Capacity Analysis
3: Sahuarita Rd. & AZ-83 Page 1
Operations Year 5, No Carpool, Non-Peak Season, Weekday, PM Synchro 7 Report
Tetra Tech ISG 2/5/2010
Movement EBL EBR NBL NBT SBT SBR
Lane Configurations
Volume (veh/h) 19 7 17 313 221 51
Sign Control Yield Free Free
Grade 0% 0% 0%
Peak Hour Factor 0.92 0.92 0.92 0.92 0.92 0.92
Hourly flow rate (vph) 21 8 18 340 240 55
Pedestrians
Lane Width (ft)
Walking Speed (ft/s)
Percent Blockage
Right turn flare (veh)
Median type None None
Median storage veh)
Upstream signal (ft)
pX, platoon unblocked
vC, conflicting volume 645 268 296
vC1, stage 1 conf vol
vC2, stage 2 conf vol
vCu, unblocked vol 645 268 296
tC, single (s) 6.4 6.2 4.1
tC, 2 stage (s)
tF (s) 3.5 3.3 2.2
p0 queue free % 95 99 99
cM capacity (veh/h) 427 766 1254
Direction, Lane # EB 1 NB 1 SB 1
Volume Total 28 359 296
Volume Left 21 18 0
Volume Right 8 0 55
cSH 485 1254 1700
Volume to Capacity 0.06 0.01 0.17
Queue Length 95th (ft) 5 1 0
Control Delay (s) 12.9 0.5 0.0
Lane LOS B A
Approach Delay (s) 12.9 0.5 0.0
Approach LOS B
Intersection Summary
Average Delay 0.8
Intersection Capacity Utilization 40.3% ICU Level of Service A
Analysis Period (min) 15

HCM Unsignalized Intersection Capacity Analysis
4: Hilton Ranch Rd. & AZ-83 Page 2
Operations Year 5, No Carpool, Non-Peak Season, Weekday, PM Synchro 7 Report
Tetra Tech ISG 2/5/2010
Movement WBL WBR NBT NBR SBL SBT
Lane Configurations
Volume (veh/h) 0 0 298 0 10 180
Sign Control Yield Free Free
Grade 0% 0% 0%
Peak Hour Factor 0.92 0.92 0.92 0.92 0.92 0.92
Hourly flow rate (vph) 0 0 324 0 11 196
Pedestrians
Lane Width (ft)
Walking Speed (ft/s)
Percent Blockage
Right turn flare (veh)
Median type None None
Median storage veh)
Upstream signal (ft)
pX, platoon unblocked
vC, conflicting volume 541 324 324
vC1, stage 1 conf vol
vC2, stage 2 conf vol
vCu, unblocked vol 541 324 324
tC, single (s) 6.4 6.2 4.1
tC, 2 stage (s)
tF (s) 3.5 3.3 2.2
p0 queue free % 100 100 99
cM capacity (veh/h) 494 713 1225
Direction, Lane # WB 1 NB 1 SB 1
Volume Total 0 324 207
Volume Left 0 0 11
Volume Right 0 0 0
cSH 1700 1700 1225
Volume to Capacity 0.00 0.19 0.01
Queue Length 95th (ft) 0 0 1
Control Delay (s) 0.0 0.0 0.5
Lane LOS A A
Approach Delay (s) 0.0 0.0 0.5
Approach LOS A
Intersection Summary
Average Delay 0.2
Intersection Capacity Utilization 21.0% ICU Level of Service A
Analysis Period (min) 15

HCM Unsignalized Intersection Capacity Analysis
5: Hidden Valley Rd. & AZ-83 Page 3
Operations Year 5, No Carpool, Non-Peak Season, Weekday, PM Synchro 7 Report
Tetra Tech ISG 2/5/2010
Movement EBL EBR NBL NBT SBT SBR
Lane Configurations
Volume (veh/h) 250 82 36 80 119 107
Sign Control Yield Free Free
Grade 3% 6% -6%
Peak Hour Factor 0.92 0.92 0.92 0.92 0.92 0.92
Hourly flow rate (vph) 272 89 39 87 129 116
Pedestrians
Lane Width (ft)
Walking Speed (ft/s)
Percent Blockage
Right turn flare (veh)
Median type None None
Median storage veh)
Upstream signal (ft)
pX, platoon unblocked
vC, conflicting volume 353 188 246
vC1, stage 1 conf vol
vC2, stage 2 conf vol
vCu, unblocked vol 353 188 246
tC, single (s) 6.4 6.2 4.1
tC, 2 stage (s)
tF (s) 3.5 3.3 2.2
p0 queue free % 56 90 97
cM capacity (veh/h) 621 849 1309
Direction, Lane # EB 1 NB 1 SB 1
Volume Total 361 126 246
Volume Left 272 39 0
Volume Right 89 0 116
cSH 666 1309 1700
Volume to Capacity 0.54 0.03 0.14
Queue Length 95th (ft) 82 2 0
Control Delay (s) 16.6 2.6 0.0
Lane LOS C A
Approach Delay (s) 16.6 2.6 0.0
Approach LOS C
Intersection Summary
Average Delay 8.6
Intersection Capacity Utilization 47.9% ICU Level of Service A
Analysis Period (min) 15

HCM Unsignalized Intersection Capacity Analysis
6: Rosemont Junction & AZ-83 Page 4
Operations Year 5, No Carpool, Non-Peak Season, Weekday, PM Synchro 7 Report
Tetra Tech ISG 2/5/2010
Movement EBL EBR NBL NBT SBT SBR
Lane Configurations
Volume (veh/h) 0 0 0 101 169 0
Sign Control Yield Free Free
Grade 0% 0% 0%
Peak Hour Factor 0.92 0.92 0.92 0.92 0.92 0.92
Hourly flow rate (vph) 0 0 0 110 184 0
Pedestrians
Lane Width (ft)
Walking Speed (ft/s)
Percent Blockage
Right turn flare (veh)
Median type None None
Median storage veh)
Upstream signal (ft)
pX, platoon unblocked
vC, conflicting volume 293 184 184
vC1, stage 1 conf vol
vC2, stage 2 conf vol
vCu, unblocked vol 293 184 184
tC, single (s) 6.4 6.2 4.1
tC, 2 stage (s)
tF (s) 3.5 3.3 2.2
p0 queue free % 100 100 100
cM capacity (veh/h) 693 854 1379
Direction, Lane # EB 1 NB 1 SB 1
Volume Total 0 110 184
Volume Left 0 0 0
Volume Right 0 0 0
cSH 1700 1379 1700
Volume to Capacity 0.00 0.00 0.11
Queue Length 95th (ft) 0 0 0
Control Delay (s) 0.0 0.0 0.0
Lane LOS A
Approach Delay (s) 0.0 0.0 0.0
Approach LOS A
Intersection Summary
Average Delay 0.0
Intersection Capacity Utilization 12.2% ICU Level of Service A
Analysis Period (min) 15

HCM Unsignalized Intersection Capacity Analysis
7: AZ-83 & Greaterville Rd. Page 5
Operations Year 5, No Carpool, Non-Peak Season, Weekday, PM Synchro 7 Report
Tetra Tech ISG 2/5/2010
Movement SET SER NWL NWT NEL NER
Lane Configurations
Volume (veh/h) 193 5 5 130 0 0
Sign Control Free Free Yield
Grade 0% 0% 0%
Peak Hour Factor 0.92 0.92 0.92 0.92 0.92 0.92
Hourly flow rate (vph) 210 5 5 141 0 0
Pedestrians
Lane Width (ft)
Walking Speed (ft/s)
Percent Blockage
Right turn flare (veh)
Median type None None
Median storage veh)
Upstream signal (ft)
pX, platoon unblocked
vC, conflicting volume 215 365 212
vC1, stage 1 conf vol
vC2, stage 2 conf vol
vCu, unblocked vol 215 365 212
tC, single (s) 4.1 6.4 6.2
tC, 2 stage (s)
tF (s) 2.2 3.5 3.3
p0 queue free % 100 100 100
cM capacity (veh/h) 1343 628 823
Direction, Lane # SE 1 NW 1 NE 1
Volume Total 215 147 0
Volume Left 0 5 0
Volume Right 5 0 0
cSH 1700 1343 1700
Volume to Capacity 0.13 0.00 0.00
Queue Length 95th (ft) 0 0 0
Control Delay (s) 0.0 0.3 0.0
Lane LOS A A
Approach Delay (s) 0.0 0.3 0.0
Approach LOS A
Intersection Summary
Average Delay 0.1
Intersection Capacity Utilization 14.2% ICU Level of Service A
Analysis Period (min) 15

HCM Unsignalized Intersection Capacity Analysis
1: I-10 WB On-Off Ramp & AZ-83 Page 1
Operations Year 5, No Carpool, Non-Peak Season, Weekend, AM Synchro 7 Report
Tetra Tech ISG 2/5/2010
Movement EBL EBT WBT WBR SBL SBR
Lane Configurations
Volume (veh/h) 6 57 431 2 8 15
Sign Control Free Free Yield
Grade 0% 0% 0%
Peak Hour Factor 0.92 0.92 0.92 0.92 0.92 0.92
Hourly flow rate (vph) 7 62 468 2 9 16
Pedestrians
Lane Width (ft)
Walking Speed (ft/s)
Percent Blockage
Right turn flare (veh)
Median type None None
Median storage veh)
Upstream signal (ft)
pX, platoon unblocked
vC, conflicting volume 471 545 470
vC1, stage 1 conf vol
vC2, stage 2 conf vol
vCu, unblocked vol 471 545 470
tC, single (s) 4.1 6.4 6.2
tC, 2 stage (s)
tF (s) 2.2 3.5 3.3
p0 queue free % 99 98 97
cM capacity (veh/h) 1081 493 590
Direction, Lane # EB 1 WB 1 SB 1
Volume Total 68 471 25
Volume Left 7 0 9
Volume Right 0 2 16
cSH 1081 1700 552
Volume to Capacity 0.01 0.28 0.05
Queue Length 95th (ft) 0 0 4
Control Delay (s) 0.8 0.0 11.8
Lane LOS A B
Approach Delay (s) 0.8 0.0 11.8
Approach LOS B
Intersection Summary
Average Delay 0.6
Intersection Capacity Utilization 32.8% ICU Level of Service A
Analysis Period (min) 15
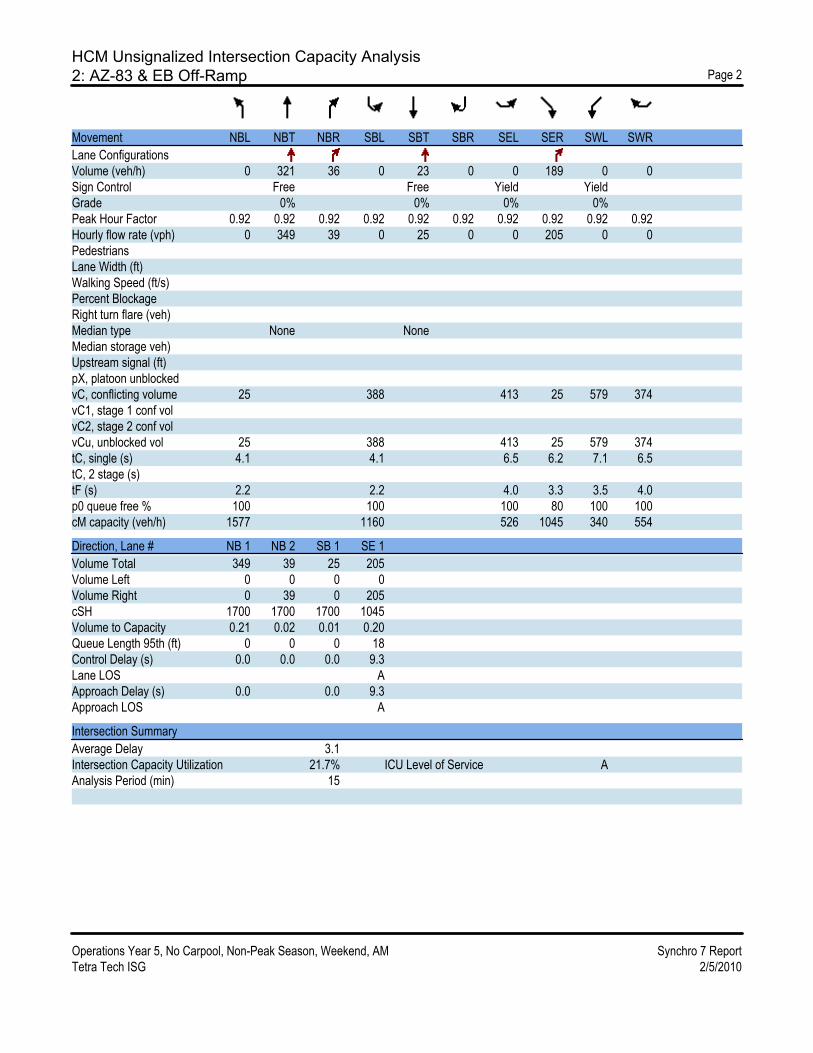
HCM Unsignalized Intersection Capacity Analysis
2: AZ-83 & EB Off-Ramp Page 2
Operations Year 5, No Carpool, Non-Peak Season, Weekend, AM Synchro 7 Report
Tetra Tech ISG 2/5/2010
Movement NBL NBT NBR SBL SBT SBR SEL SER SWL SWR
Lane Configurations
Volume (veh/h) 0 321 36 0 23 0 0 189 0 0
Sign Control Free Free Yield Yield
Grade 0% 0% 0% 0%
Peak Hour Factor 0.92 0.92 0.92 0.92 0.92 0.92 0.92 0.92 0.92 0.92
Hourly flow rate (vph) 0 349 39 0 25 0 0 205 0 0
Pedestrians
Lane Width (ft)
Walking Speed (ft/s)
Percent Blockage
Right turn flare (veh)
Median type None None
Median storage veh)
Upstream signal (ft)
pX, platoon unblocked
vC, conflicting volume 25 388 413 25 579 374
vC1, stage 1 conf vol
vC2, stage 2 conf vol
vCu, unblocked vol 25 388 413 25 579 374
tC, single (s) 4.1 4.1 6.5 6.2 7.1 6.5
tC, 2 stage (s)
tF (s) 2.2 2.2 4.0 3.3 3.5 4.0
p0 queue free % 100 100 100 80 100 100
cM capacity (veh/h) 1577 1160 526 1045 340 554
Direction, Lane # NB 1 NB 2 SB 1 SE 1
Volume Total 349 39 25 205
Volume Left 0 0 0 0
Volume Right 0 39 0 205
cSH 1700 1700 1700 1045
Volume to Capacity 0.21 0.02 0.01 0.20
Queue Length 95th (ft) 0 0 0 18
Control Delay (s) 0.0 0.0 0.0 9.3
Lane LOS A
Approach Delay (s) 0.0 0.0 9.3
Approach LOS A
Intersection Summary
Average Delay 3.1
Intersection Capacity Utilization 21.7% ICU Level of Service A
Analysis Period (min) 15

HCM Unsignalized Intersection Capacity Analysis
3: Sahuarita Rd. & AZ-83 Page 1
Operations Year 5, No Carpool, Non-Peak Season, Weekend, AM Synchro 7 Report
Tetra Tech ISG 2/5/2010
Movement EBL EBR NBL NBT SBT SBR
Lane Configurations
Volume (veh/h) 36 19 5 245 206 19
Sign Control Yield Free Free
Grade 0% 0% 0%
Peak Hour Factor 0.92 0.92 0.92 0.92 0.92 0.92
Hourly flow rate (vph) 39 21 5 266 224 21
Pedestrians
Lane Width (ft)
Walking Speed (ft/s)
Percent Blockage
Right turn flare (veh)
Median type None None
Median storage veh)
Upstream signal (ft)
pX, platoon unblocked
vC, conflicting volume 511 234 245
vC1, stage 1 conf vol
vC2, stage 2 conf vol
vCu, unblocked vol 511 234 245
tC, single (s) 6.4 6.2 4.1
tC, 2 stage (s)
tF (s) 3.5 3.3 2.2
p0 queue free % 92 97 100
cM capacity (veh/h) 517 800 1310
Direction, Lane # EB 1 NB 1 SB 1
Volume Total 60 272 245
Volume Left 39 5 0
Volume Right 21 0 21
cSH 589 1310 1700
Volume to Capacity 0.10 0.00 0.14
Queue Length 95th (ft) 8 0 0
Control Delay (s) 11.8 0.2 0.0
Lane LOS B A
Approach Delay (s) 11.8 0.2 0.0
Approach LOS B
Intersection Summary
Average Delay 1.3
Intersection Capacity Utilization 26.9% ICU Level of Service A
Analysis Period (min) 15

HCM Unsignalized Intersection Capacity Analysis
4: Hilton Ranch Rd. & AZ-83 Page 2
Operations Year 5, No Carpool, Non-Peak Season, Weekend, AM Synchro 7 Report
Tetra Tech ISG 2/5/2010
Movement WBL WBR NBT NBR SBL SBT
Lane Configurations
Volume (veh/h) 0 19 214 0 2 232
Sign Control Yield Free Free
Grade 0% 0% 0%
Peak Hour Factor 0.92 0.92 0.92 0.92 0.92 0.92
Hourly flow rate (vph) 0 21 233 0 2 252
Pedestrians
Lane Width (ft)
Walking Speed (ft/s)
Percent Blockage
Right turn flare (veh)
Median type None None
Median storage veh)
Upstream signal (ft)
pX, platoon unblocked
vC, conflicting volume 489 233 233
vC1, stage 1 conf vol
vC2, stage 2 conf vol
vCu, unblocked vol 489 233 233
tC, single (s) 6.4 6.2 4.1
tC, 2 stage (s)
tF (s) 3.5 3.3 2.2
p0 queue free % 100 97 100
cM capacity (veh/h) 534 802 1323
Direction, Lane # WB 1 NB 1 SB 1
Volume Total 21 233 254
Volume Left 0 0 2
Volume Right 21 0 0
cSH 802 1700 1323
Volume to Capacity 0.03 0.14 0.00
Queue Length 95th (ft) 2 0 0
Control Delay (s) 9.6 0.0 0.1
Lane LOS A A
Approach Delay (s) 9.6 0.0 0.1
Approach LOS A
Intersection Summary
Average Delay 0.4
Intersection Capacity Utilization 23.8% ICU Level of Service A
Analysis Period (min) 15

HCM Unsignalized Intersection Capacity Analysis
5: Hidden Valley Rd. & AZ-83 Page 3
Operations Year 5, No Carpool, Non-Peak Season, Weekend, AM Synchro 7 Report
Tetra Tech ISG 2/5/2010
Movement EBL EBR NBL NBT SBT SBR
Lane Configurations
Volume (veh/h) 107 38 46 99 61 147
Sign Control Yield Free Free
Grade 3% 6% -6%
Peak Hour Factor 0.92 0.92 0.92 0.92 0.92 0.92
Hourly flow rate (vph) 116 41 50 108 66 160
Pedestrians
Lane Width (ft)
Walking Speed (ft/s)
Percent Blockage
Right turn flare (veh)
Median type None None
Median storage veh)
Upstream signal (ft)
pX, platoon unblocked
vC, conflicting volume 354 146 226
vC1, stage 1 conf vol
vC2, stage 2 conf vol
vCu, unblocked vol 354 146 226
tC, single (s) 6.4 6.2 4.1
tC, 2 stage (s)
tF (s) 3.5 3.3 2.2
p0 queue free % 81 95 96
cM capacity (veh/h) 616 895 1331
Direction, Lane # EB 1 NB 1 SB 1
Volume Total 158 158 226
Volume Left 116 50 0
Volume Right 41 0 160
cSH 671 1331 1700
Volume to Capacity 0.24 0.04 0.13
Queue Length 95th (ft) 23 3 0
Control Delay (s) 12.0 2.7 0.0
Lane LOS B A
Approach Delay (s) 12.0 2.7 0.0
Approach LOS B
Intersection Summary
Average Delay 4.3
Intersection Capacity Utilization 38.2% ICU Level of Service A
Analysis Period (min) 15

HCM Unsignalized Intersection Capacity Analysis
6: Rosemont Junction & AZ-83 Page 4
Operations Year 5, No Carpool, Non-Peak Season, Weekend, AM Synchro 7 Report
Tetra Tech ISG 2/5/2010
Movement EBL EBR NBL NBT SBT SBR
Lane Configurations
Volume (veh/h) 2 0 2 133 77 0
Sign Control Yield Free Free
Grade 0% 0% 0%
Peak Hour Factor 0.92 0.92 0.92 0.92 0.92 0.92
Hourly flow rate (vph) 2 0 2 145 84 0
Pedestrians
Lane Width (ft)
Walking Speed (ft/s)
Percent Blockage
Right turn flare (veh)
Median type None None
Median storage veh)
Upstream signal (ft)
pX, platoon unblocked
vC, conflicting volume 233 84 84
vC1, stage 1 conf vol
vC2, stage 2 conf vol
vCu, unblocked vol 233 84 84
tC, single (s) 6.4 6.2 4.1
tC, 2 stage (s)
tF (s) 3.5 3.3 2.2
p0 queue free % 100 100 100
cM capacity (veh/h) 750 970 1501
Direction, Lane # EB 1 NB 1 SB 1
Volume Total 2 147 84
Volume Left 2 2 0
Volume Right 0 0 0
cSH 750 1501 1700
Volume to Capacity 0.00 0.00 0.05
Queue Length 95th (ft) 0 0 0
Control Delay (s) 9.8 0.1 0.0
Lane LOS A A
Approach Delay (s) 9.8 0.1 0.0
Approach LOS A
Intersection Summary
Average Delay 0.2
Intersection Capacity Utilization 18.6% ICU Level of Service A
Analysis Period (min) 15

HCM Unsignalized Intersection Capacity Analysis
7: AZ-83 & Greaterville Rd. Page 5
Operations Year 5, No Carpool, Non-Peak Season, Weekend, AM Synchro 7 Report
Tetra Tech ISG 2/5/2010
Movement SET SER NWL NWT NEL NER
Lane Configurations
Volume (veh/h) 120 0 0 114 2 5
Sign Control Free Free Yield
Grade 0% 0% 0%
Peak Hour Factor 0.92 0.92 0.92 0.92 0.92 0.92
Hourly flow rate (vph) 130 0 0 124 2 5
Pedestrians
Lane Width (ft)
Walking Speed (ft/s)
Percent Blockage
Right turn flare (veh)
Median type None None
Median storage veh)
Upstream signal (ft)
pX, platoon unblocked
vC, conflicting volume 130 254 130
vC1, stage 1 conf vol
vC2, stage 2 conf vol
vCu, unblocked vol 130 254 130
tC, single (s) 4.1 6.4 6.2
tC, 2 stage (s)
tF (s) 2.2 3.5 3.3
p0 queue free % 100 100 99
cM capacity (veh/h) 1443 730 914
Direction, Lane # SE 1 NW 1 NE 1
Volume Total 130 124 8
Volume Left 0 0 2
Volume Right 0 0 5
cSH 1700 1443 852
Volume to Capacity 0.08 0.00 0.01
Queue Length 95th (ft) 0 0 1
Control Delay (s) 0.0 0.0 9.3
Lane LOS A
Approach Delay (s) 0.0 0.0 9.3
Approach LOS A
Intersection Summary
Average Delay 0.3
Intersection Capacity Utilization 16.3% ICU Level of Service A
Analysis Period (min) 15

HCM Unsignalized Intersection Capacity Analysis
1: I-10 WB On-Off Ramp & AZ-83 Page 1
Operations Year 5, No Carpool, Non-Peak Season, Weekend, PM Synchro 7 Report
Tetra Tech ISG 2/5/2010
Movement EBL EBT WBT WBR SBL SBR
Lane Configurations
Volume (veh/h) 25 65 137 5 12 8
Sign Control Free Free Yield
Grade 0% 0% 0%
Peak Hour Factor 0.92 0.92 0.92 0.92 0.92 0.92
Hourly flow rate (vph) 27 71 149 5 13 9
Pedestrians
Lane Width (ft)
Walking Speed (ft/s)
Percent Blockage
Right turn flare (veh)
Median type None None
Median storage veh)
Upstream signal (ft)
pX, platoon unblocked
vC, conflicting volume 154 277 152
vC1, stage 1 conf vol
vC2, stage 2 conf vol
vCu, unblocked vol 154 277 152
tC, single (s) 4.1 6.4 6.2
tC, 2 stage (s)
tF (s) 2.2 3.5 3.3
p0 queue free % 98 98 99
cM capacity (veh/h) 1414 695 889
Direction, Lane # EB 1 WB 1 SB 1
Volume Total 98 154 22
Volume Left 27 0 13
Volume Right 0 5 9
cSH 1414 1700 762
Volume to Capacity 0.02 0.09 0.03
Queue Length 95th (ft) 1 0 2
Control Delay (s) 2.2 0.0 9.9
Lane LOS A A
Approach Delay (s) 2.2 0.0 9.9
Approach LOS A
Intersection Summary
Average Delay 1.6
Intersection Capacity Utilization 25.7% ICU Level of Service A
Analysis Period (min) 15

HCM Unsignalized Intersection Capacity Analysis
2: AZ-83 & EB Off-Ramp Page 2
Operations Year 5, No Carpool, Non-Peak Season, Weekend, PM Synchro 7 Report
Tetra Tech ISG 2/5/2010
Movement NBL NBT NBR SBL SBT SBR SEL SER SWL SWR
Lane Configurations
Volume (veh/h) 0 231 46 0 83 0 0 322 0 0
Sign Control Free Free Yield Yield
Grade 0% 0% 0% 0%
Peak Hour Factor 0.92 0.92 0.92 0.92 0.92 0.92 0.92 0.92 0.92 0.92
Hourly flow rate (vph) 0 251 50 0 90 0 0 350 0 0
Pedestrians
Lane Width (ft)
Walking Speed (ft/s)
Percent Blockage
Right turn flare (veh)
Median type None None
Median storage veh)
Upstream signal (ft)
pX, platoon unblocked
vC, conflicting volume 90 301 391 90 691 341
vC1, stage 1 conf vol
vC2, stage 2 conf vol
vCu, unblocked vol 90 301 391 90 691 341
tC, single (s) 4.1 4.1 6.5 6.2 7.1 6.5
tC, 2 stage (s)
tF (s) 2.2 2.2 4.0 3.3 3.5 4.0
p0 queue free % 100 100 100 64 100 100
cM capacity (veh/h) 1492 1249 541 962 226 577
Direction, Lane # NB 1 NB 2 SB 1 SE 1
Volume Total 251 50 90 350
Volume Left 0 0 0 0
Volume Right 0 50 0 350
cSH 1700 1700 1700 962
Volume to Capacity 0.15 0.03 0.05 0.36
Queue Length 95th (ft) 0 0 0 42
Control Delay (s) 0.0 0.0 0.0 10.9
Lane LOS B
Approach Delay (s) 0.0 0.0 10.9
Approach LOS B
Intersection Summary
Average Delay 5.1
Intersection Capacity Utilization 31.0% ICU Level of Service A
Analysis Period (min) 15

HCM Unsignalized Intersection Capacity Analysis
3: Sahuarita Rd. & AZ-83 Page 1
Operations Year 5, No Carpool, Non-Peak Season, Weekend, PM Synchro 7 Report
Tetra Tech ISG 2/5/2010
Movement EBL EBR NBL NBT SBT SBR
Lane Configurations
Volume (veh/h) 39 15 56 271 175 17
Sign Control Yield Free Free
Grade 0% 0% 0%
Peak Hour Factor 0.92 0.92 0.92 0.92 0.92 0.92
Hourly flow rate (vph) 42 16 61 295 190 18
Pedestrians
Lane Width (ft)
Walking Speed (ft/s)
Percent Blockage
Right turn flare (veh)
Median type None None
Median storage veh)
Upstream signal (ft)
pX, platoon unblocked
vC, conflicting volume 616 199 209
vC1, stage 1 conf vol
vC2, stage 2 conf vol
vCu, unblocked vol 616 199 209
tC, single (s) 6.4 6.2 4.1
tC, 2 stage (s)
tF (s) 3.5 3.3 2.2
p0 queue free % 90 98 95
cM capacity (veh/h) 431 836 1350
Direction, Lane # EB 1 NB 1 SB 1
Volume Total 59 355 209
Volume Left 42 61 0
Volume Right 16 0 18
cSH 498 1350 1700
Volume to Capacity 0.12 0.05 0.12
Queue Length 95th (ft) 10 4 0
Control Delay (s) 13.2 1.7 0.0
Lane LOS B A
Approach Delay (s) 13.2 1.7 0.0
Approach LOS B
Intersection Summary
Average Delay 2.2
Intersection Capacity Utilization 40.9% ICU Level of Service A
Analysis Period (min) 15

HCM Unsignalized Intersection Capacity Analysis
4: Hilton Ranch Rd. & AZ-83 Page 2
Operations Year 5, No Carpool, Non-Peak Season, Weekend, PM Synchro 7 Report
Tetra Tech ISG 2/5/2010
Movement WBL WBR NBT NBR SBL SBT
Lane Configurations
Volume (veh/h) 0 2 256 7 2 177
Sign Control Yield Free Free
Grade 0% 0% 0%
Peak Hour Factor 0.92 0.92 0.92 0.92 0.92 0.92
Hourly flow rate (vph) 0 2 278 8 2 192
Pedestrians
Lane Width (ft)
Walking Speed (ft/s)
Percent Blockage
Right turn flare (veh)
Median type None None
Median storage veh)
Upstream signal (ft)
pX, platoon unblocked
vC, conflicting volume 479 282 286
vC1, stage 1 conf vol
vC2, stage 2 conf vol
vCu, unblocked vol 479 282 286
tC, single (s) 6.4 6.2 4.1
tC, 2 stage (s)
tF (s) 3.5 3.3 2.2
p0 queue free % 100 100 100
cM capacity (veh/h) 541 752 1265
Direction, Lane # WB 1 NB 1 SB 1
Volume Total 2 286 195
Volume Left 0 0 2
Volume Right 2 8 0
cSH 752 1700 1265
Volume to Capacity 0.00 0.17 0.00
Queue Length 95th (ft) 0 0 0
Control Delay (s) 9.8 0.0 0.1
Lane LOS A A
Approach Delay (s) 9.8 0.0 0.1
Approach LOS A
Intersection Summary
Average Delay 0.1
Intersection Capacity Utilization 23.9% ICU Level of Service A
Analysis Period (min) 15

HCM Unsignalized Intersection Capacity Analysis
5: Hidden Valley Rd. & AZ-83 Page 3
Operations Year 5, No Carpool, Non-Peak Season, Weekend, PM Synchro 7 Report
Tetra Tech ISG 2/5/2010
Movement EBL EBR NBL NBT SBT SBR
Lane Configurations
Volume (veh/h) 145 46 36 99 44 107
Sign Control Yield Free Free
Grade 3% 6% -6%
Peak Hour Factor 0.92 0.92 0.92 0.92 0.92 0.92
Hourly flow rate (vph) 158 50 39 108 48 116
Pedestrians
Lane Width (ft)
Walking Speed (ft/s)
Percent Blockage
Right turn flare (veh)
Median type None None
Median storage veh)
Upstream signal (ft)
pX, platoon unblocked
vC, conflicting volume 292 106 164
vC1, stage 1 conf vol
vC2, stage 2 conf vol
vCu, unblocked vol 292 106 164
tC, single (s) 6.4 6.2 4.1
tC, 2 stage (s)
tF (s) 3.5 3.3 2.2
p0 queue free % 77 95 97
cM capacity (veh/h) 675 943 1402
Direction, Lane # EB 1 NB 1 SB 1
Volume Total 208 147 164
Volume Left 158 39 0
Volume Right 50 0 116
cSH 725 1402 1700
Volume to Capacity 0.29 0.03 0.10
Queue Length 95th (ft) 30 2 0
Control Delay (s) 12.0 2.2 0.0
Lane LOS B A
Approach Delay (s) 12.0 2.2 0.0
Approach LOS B
Intersection Summary
Average Delay 5.4
Intersection Capacity Utilization 36.9% ICU Level of Service A
Analysis Period (min) 15

HCM Unsignalized Intersection Capacity Analysis
6: Rosemont Junction & AZ-83 Page 4
Operations Year 5, No Carpool, Non-Peak Season, Weekend, PM Synchro 7 Report
Tetra Tech ISG 2/5/2010
Movement EBL EBR NBL NBT SBT SBR
Lane Configurations
Volume (veh/h) 0 0 0 145 107 0
Sign Control Yield Free Free
Grade 0% 0% 0%
Peak Hour Factor 0.92 0.92 0.92 0.92 0.92 0.92
Hourly flow rate (vph) 0 0 0 158 116 0
Pedestrians
Lane Width (ft)
Walking Speed (ft/s)
Percent Blockage
Right turn flare (veh)
Median type None None
Median storage veh)
Upstream signal (ft)
pX, platoon unblocked
vC, conflicting volume 274 116 116
vC1, stage 1 conf vol
vC2, stage 2 conf vol
vCu, unblocked vol 274 116 116
tC, single (s) 6.4 6.2 4.1
tC, 2 stage (s)
tF (s) 3.5 3.3 2.2
p0 queue free % 100 100 100
cM capacity (veh/h) 711 931 1460
Direction, Lane # EB 1 NB 1 SB 1
Volume Total 0 158 116
Volume Left 0 0 0
Volume Right 0 0 0
cSH 1700 1460 1700
Volume to Capacity 0.00 0.00 0.07
Queue Length 95th (ft) 0 0 0
Control Delay (s) 0.0 0.0 0.0
Lane LOS A
Approach Delay (s) 0.0 0.0 0.0
Approach LOS A
Intersection Summary
Average Delay 0.0
Intersection Capacity Utilization 11.0% ICU Level of Service A
Analysis Period (min) 15

HCM Unsignalized Intersection Capacity Analysis
7: AZ-83 & Greaterville Rd. Page 5
Operations Year 5, No Carpool, Non-Peak Season, Weekend, PM Synchro 7 Report
Tetra Tech ISG 2/5/2010
Movement SET SER NWL NWT NEL NER
Lane Configurations
Volume (veh/h) 153 5 7 162 2 5
Sign Control Free Free Yield
Grade 0% 0% 0%
Peak Hour Factor 0.92 0.92 0.92 0.92 0.92 0.92
Hourly flow rate (vph) 166 5 8 176 2 5
Pedestrians
Lane Width (ft)
Walking Speed (ft/s)
Percent Blockage
Right turn flare (veh)
Median type None None
Median storage veh)
Upstream signal (ft)
pX, platoon unblocked
vC, conflicting volume 172 360 169
vC1, stage 1 conf vol
vC2, stage 2 conf vol
vCu, unblocked vol 172 360 169
tC, single (s) 4.1 6.4 6.2
tC, 2 stage (s)
tF (s) 2.2 3.5 3.3
p0 queue free % 99 100 99
cM capacity (veh/h) 1393 631 870
Direction, Lane # SE 1 NW 1 NE 1
Volume Total 172 184 8
Volume Left 0 8 2
Volume Right 5 0 5
cSH 1700 1393 785
Volume to Capacity 0.10 0.01 0.01
Queue Length 95th (ft) 0 0 1
Control Delay (s) 0.0 0.4 9.6
Lane LOS A A
Approach Delay (s) 0.0 0.4 9.6
Approach LOS A
Intersection Summary
Average Delay 0.4
Intersection Capacity Utilization 24.2% ICU Level of Service A
Analysis Period (min) 15

PEAK SEASON
SCENARIO 3
NO CARPOOL

HCM Unsignalized Intersection Capacity Analysis
1: I-10 WB On-Off Ramp & AZ-83 Page 1
Operations Year 5, No Carpool, Peak Season, Weekday, AM Synchro 7 Report
Tetra Tech ISG 2/5/2010
Movement EBL EBT WBT WBR SBL SBR
Lane Configurations
Volume (veh/h) 8 43 395 4 11 29
Sign Control Free Free Yield
Grade 0% 0% 0%
Peak Hour Factor 0.92 0.92 0.92 0.92 0.92 0.92
Hourly flow rate (vph) 9 47 429 4 12 32
Pedestrians
Lane Width (ft)
Walking Speed (ft/s)
Percent Blockage
Right turn flare (veh)
Median type None None
Median storage veh)
Upstream signal (ft)
pX, platoon unblocked
vC, conflicting volume 434 496 432
vC1, stage 1 conf vol
vC2, stage 2 conf vol
vCu, unblocked vol 434 496 432
tC, single (s) 4.1 6.4 6.2
tC, 2 stage (s)
tF (s) 2.2 3.5 3.3
p0 queue free % 99 98 95
cM capacity (veh/h) 1115 526 620
Direction, Lane # EB 1 WB 1 SB 1
Volume Total 55 434 43
Volume Left 9 0 12
Volume Right 0 4 32
cSH 1115 1700 591
Volume to Capacity 0.01 0.26 0.07
Queue Length 95th (ft) 1 0 6
Control Delay (s) 1.4 0.0 11.6
Lane LOS A B
Approach Delay (s) 1.4 0.0 11.6
Approach LOS B
Intersection Summary
Average Delay 1.1
Intersection Capacity Utilization 31.0% ICU Level of Service A
Analysis Period (min) 15

HCM Unsignalized Intersection Capacity Analysis
2: AZ-83 & EB Off-Ramp Page 2
Operations Year 5, No Carpool, Peak Season, Weekday, AM Synchro 7 Report
Tetra Tech ISG 2/5/2010
Movement NBL NBT NBR SBL SBT SBR SEL SER SWL SWR
Lane Configurations
Volume (veh/h) 0 274 25 0 21 0 0 174 0 0
Sign Control Free Free Yield Yield
Grade 0% 0% 0% 0%
Peak Hour Factor 0.92 0.92 0.92 0.92 0.92 0.92 0.92 0.92 0.92 0.92
Hourly flow rate (vph) 0 298 27 0 23 0 0 189 0 0
Pedestrians
Lane Width (ft)
Walking Speed (ft/s)
Percent Blockage
Right turn flare (veh)
Median type None None
Median storage veh)
Upstream signal (ft)
pX, platoon unblocked
vC, conflicting volume 23 325 348 23 510 321
vC1, stage 1 conf vol
vC2, stage 2 conf vol
vCu, unblocked vol 23 325 348 23 510 321
tC, single (s) 4.1 4.1 6.5 6.2 7.1 6.5
tC, 2 stage (s)
tF (s) 2.2 2.2 4.0 3.3 3.5 4.0
p0 queue free % 100 100 100 82 100 100
cM capacity (veh/h) 1579 1224 573 1048 386 593
Direction, Lane # NB 1 NB 2 SB 1 SE 1
Volume Total 298 27 23 189
Volume Left 0 0 0 0
Volume Right 0 27 0 189
cSH 1700 1700 1700 1048
Volume to Capacity 0.18 0.02 0.01 0.18
Queue Length 95th (ft) 0 0 0 16
Control Delay (s) 0.0 0.0 0.0 9.2
Lane LOS A
Approach Delay (s) 0.0 0.0 9.2
Approach LOS A
Intersection Summary
Average Delay 3.2
Intersection Capacity Utilization 20.8% ICU Level of Service A
Analysis Period (min) 15

HCM Unsignalized Intersection Capacity Analysis
3: Sahuarita Rd. & AZ-83 Page 1
Operations Year 5, No Carpool, Peak Season, Weekday, AM Synchro 7 Report
Tetra Tech ISG 2/5/2010
Movement EBL EBR NBL NBT SBT SBR
Lane Configurations
Volume (veh/h) 41 19 5 248 296 27
Sign Control Yield Free Free
Grade 0% 0% 0%
Peak Hour Factor 0.92 0.92 0.92 0.92 0.92 0.92
Hourly flow rate (vph) 45 21 5 270 322 29
Pedestrians
Lane Width (ft)
Walking Speed (ft/s)
Percent Blockage
Right turn flare (veh)
Median type None None
Median storage veh)
Upstream signal (ft)
pX, platoon unblocked
vC, conflicting volume 617 336 351
vC1, stage 1 conf vol
vC2, stage 2 conf vol
vCu, unblocked vol 617 336 351
tC, single (s) 6.4 6.2 4.1
tC, 2 stage (s)
tF (s) 3.5 3.3 2.2
p0 queue free % 90 97 100
cM capacity (veh/h) 448 701 1197
Direction, Lane # EB 1 NB 1 SB 1
Volume Total 65 275 351
Volume Left 45 5 0
Volume Right 21 0 29
cSH 506 1197 1700
Volume to Capacity 0.13 0.00 0.21
Queue Length 95th (ft) 11 0 0
Control Delay (s) 13.2 0.2 0.0
Lane LOS B A
Approach Delay (s) 13.2 0.2 0.0
Approach LOS B
Intersection Summary
Average Delay 1.3
Intersection Capacity Utilization 27.3% ICU Level of Service A
Analysis Period (min) 15

HCM Unsignalized Intersection Capacity Analysis
4: Hilton Ranch Rd. & AZ-83 Page 2
Operations Year 5, No Carpool, Peak Season, Weekday, AM Synchro 7 Report
Tetra Tech ISG 2/5/2010
Movement WBL WBR NBT NBR SBL SBT
Lane Configurations
Volume (veh/h) 0 0 160 0 5 310
Sign Control Yield Free Free
Grade 0% 0% 0%
Peak Hour Factor 0.92 0.92 0.92 0.92 0.92 0.92
Hourly flow rate (vph) 0 0 174 0 5 337
Pedestrians
Lane Width (ft)
Walking Speed (ft/s)
Percent Blockage
Right turn flare (veh)
Median type None None
Median storage veh)
Upstream signal (ft)
pX, platoon unblocked
vC, conflicting volume 522 174 174
vC1, stage 1 conf vol
vC2, stage 2 conf vol
vCu, unblocked vol 522 174 174
tC, single (s) 6.4 6.2 4.1
tC, 2 stage (s)
tF (s) 3.5 3.3 2.2
p0 queue free % 100 100 100
cM capacity (veh/h) 510 864 1391
Direction, Lane # WB 1 NB 1 SB 1
Volume Total 0 174 342
Volume Left 0 0 5
Volume Right 0 0 0
cSH 1700 1700 1391
Volume to Capacity 0.00 0.10 0.00
Queue Length 95th (ft) 0 0 0
Control Delay (s) 0.0 0.0 0.2
Lane LOS A A
Approach Delay (s) 0.0 0.0 0.2
Approach LOS A
Intersection Summary
Average Delay 0.1
Intersection Capacity Utilization 23.6% ICU Level of Service A
Analysis Period (min) 15

HCM Unsignalized Intersection Capacity Analysis
5: Hidden Valley Rd. & AZ-83 Page 3
Operations Year 5, No Carpool, Peak Season, Weekday, AM Synchro 7 Report
Tetra Tech ISG 2/5/2010
Movement EBL EBR NBL NBT SBT SBR
Lane Configurations
Volume (veh/h) 107 38 82 75 48 250
Sign Control Yield Free Free
Grade 3% 6% -6%
Peak Hour Factor 0.92 0.92 0.92 0.92 0.92 0.92
Hourly flow rate (vph) 116 41 89 82 52 272
Pedestrians
Lane Width (ft)
Walking Speed (ft/s)
Percent Blockage
Right turn flare (veh)
Median type None None
Median storage veh)
Upstream signal (ft)
pX, platoon unblocked
vC, conflicting volume 448 188 324
vC1, stage 1 conf vol
vC2, stage 2 conf vol
vCu, unblocked vol 448 188 324
tC, single (s) 6.4 6.2 4.1
tC, 2 stage (s)
tF (s) 3.5 3.3 2.2
p0 queue free % 78 95 93
cM capacity (veh/h) 523 849 1225
Direction, Lane # EB 1 NB 1 SB 1
Volume Total 158 171 324
Volume Left 116 89 0
Volume Right 41 0 272
cSH 582 1225 1700
Volume to Capacity 0.27 0.07 0.19
Queue Length 95th (ft) 27 6 0
Control Delay (s) 13.5 4.6 0.0
Lane LOS B A
Approach Delay (s) 13.5 4.6 0.0
Approach LOS B
Intersection Summary
Average Delay 4.5
Intersection Capacity Utilization 44.7% ICU Level of Service A
Analysis Period (min) 15

HCM Unsignalized Intersection Capacity Analysis
6: Rosemont Junction & AZ-83 Page 4
Operations Year 5, No Carpool, Peak Season, Weekday, AM Synchro 7 Report
Tetra Tech ISG 2/5/2010
Movement EBL EBR NBL NBT SBT SBR
Lane Configurations
Volume (veh/h) 2 2 2 179 104 0
Sign Control Yield Free Free
Grade 0% 0% 0%
Peak Hour Factor 0.92 0.92 0.92 0.92 0.92 0.92
Hourly flow rate (vph) 2 2 2 195 113 0
Pedestrians
Lane Width (ft)
Walking Speed (ft/s)
Percent Blockage
Right turn flare (veh)
Median type None None
Median storage veh)
Upstream signal (ft)
pX, platoon unblocked
vC, conflicting volume 312 113 113
vC1, stage 1 conf vol
vC2, stage 2 conf vol
vCu, unblocked vol 312 113 113
tC, single (s) 6.4 6.2 4.1
tC, 2 stage (s)
tF (s) 3.5 3.3 2.2
p0 queue free % 100 100 100
cM capacity (veh/h) 675 934 1464
Direction, Lane # EB 1 NB 1 SB 1
Volume Total 4 197 113
Volume Left 2 2 0
Volume Right 2 0 0
cSH 784 1464 1700
Volume to Capacity 0.01 0.00 0.07
Queue Length 95th (ft) 0 0 0
Control Delay (s) 9.6 0.1 0.0
Lane LOS A A
Approach Delay (s) 9.6 0.1 0.0
Approach LOS A
Intersection Summary
Average Delay 0.2
Intersection Capacity Utilization 21.0% ICU Level of Service A
Analysis Period (min) 15

HCM Unsignalized Intersection Capacity Analysis
7: AZ-83 & Greaterville Rd. Page 5
Operations Year 5, No Carpool, Peak Season, Weekday, AM Synchro 7 Report
Tetra Tech ISG 2/5/2010
Movement SET SER NWL NWT NEL NER
Lane Configurations
Volume (veh/h) 89 2 0 162 2 0
Sign Control Free Free Yield
Grade 0% 0% 0%
Peak Hour Factor 0.92 0.92 0.92 0.92 0.92 0.92
Hourly flow rate (vph) 97 2 0 176 2 0
Pedestrians
Lane Width (ft)
Walking Speed (ft/s)
Percent Blockage
Right turn flare (veh)
Median type None None
Median storage veh)
Upstream signal (ft)
pX, platoon unblocked
vC, conflicting volume 99 274 98
vC1, stage 1 conf vol
vC2, stage 2 conf vol
vCu, unblocked vol 99 274 98
tC, single (s) 4.1 6.4 6.2
tC, 2 stage (s)
tF (s) 2.2 3.5 3.3
p0 queue free % 100 100 100
cM capacity (veh/h) 1482 711 953
Direction, Lane # SE 1 NW 1 NE 1
Volume Total 99 176 2
Volume Left 0 0 2
Volume Right 2 0 0
cSH 1700 1482 711
Volume to Capacity 0.06 0.00 0.00
Queue Length 95th (ft) 0 0 0
Control Delay (s) 0.0 0.0 10.1
Lane LOS B
Approach Delay (s) 0.0 0.0 10.1
Approach LOS B
Intersection Summary
Average Delay 0.1
Intersection Capacity Utilization 18.5% ICU Level of Service A
Analysis Period (min) 15

HCM Unsignalized Intersection Capacity Analysis
1: I-10 WB On-Off Ramp & AZ-83 Page 1
Operations Year 5, No Carpool, Peak Season, Weekday, PM Synchro 7 Report
Tetra Tech ISG 2/5/2010
Movement EBL EBT WBT WBR SBL SBR
Lane Configurations
Volume (veh/h) 23 70 227 6 7 8
Sign Control Free Free Yield
Grade 0% 0% 0%
Peak Hour Factor 0.92 0.92 0.92 0.92 0.92 0.92
Hourly flow rate (vph) 25 76 247 7 8 9
Pedestrians
Lane Width (ft)
Walking Speed (ft/s)
Percent Blockage
Right turn flare (veh)
Median type None None
Median storage veh)
Upstream signal (ft)
pX, platoon unblocked
vC, conflicting volume 253 376 250
vC1, stage 1 conf vol
vC2, stage 2 conf vol
vCu, unblocked vol 253 376 250
tC, single (s) 4.1 6.4 6.2
tC, 2 stage (s)
tF (s) 2.2 3.5 3.3
p0 queue free % 98 99 99
cM capacity (veh/h) 1300 609 784
Direction, Lane # EB 1 WB 1 SB 1
Volume Total 101 253 16
Volume Left 25 0 8
Volume Right 0 7 9
cSH 1300 1700 691
Volume to Capacity 0.02 0.15 0.02
Queue Length 95th (ft) 1 0 2
Control Delay (s) 2.1 0.0 10.3
Lane LOS A B
Approach Delay (s) 2.1 0.0 10.3
Approach LOS B
Intersection Summary
Average Delay 1.0
Intersection Capacity Utilization 30.6% ICU Level of Service A
Analysis Period (min) 15

HCM Unsignalized Intersection Capacity Analysis
2: AZ-83 & EB Off-Ramp Page 2
Operations Year 5, No Carpool, Peak Season, Weekday, PM Synchro 7 Report
Tetra Tech ISG 2/5/2010
Movement NBL NBT NBR SBL SBT SBR SEL SER SWL SWR
Lane Configurations
Volume (veh/h) 0 352 54 0 65 0 0 157 0 0
Sign Control Free Free Yield Yield
Grade 0% 0% 0% 0%
Peak Hour Factor 0.92 0.92 0.92 0.92 0.92 0.92 0.92 0.92 0.92 0.92
Hourly flow rate (vph) 0 383 59 0 71 0 0 171 0 0
Pedestrians
Lane Width (ft)
Walking Speed (ft/s)
Percent Blockage
Right turn flare (veh)
Median type None None
Median storage veh)
Upstream signal (ft)
pX, platoon unblocked
vC, conflicting volume 71 441 512 71 624 453
vC1, stage 1 conf vol
vC2, stage 2 conf vol
vCu, unblocked vol 71 441 512 71 624 453
tC, single (s) 4.1 4.1 6.5 6.2 7.1 6.5
tC, 2 stage (s)
tF (s) 2.2 2.2 4.0 3.3 3.5 4.0
p0 queue free % 100 100 100 83 100 100
cM capacity (veh/h) 1517 1108 463 986 327 499
Direction, Lane # NB 1 NB 2 SB 1 SE 1
Volume Total 383 59 71 171
Volume Left 0 0 0 0
Volume Right 0 59 0 171
cSH 1700 1700 1700 986
Volume to Capacity 0.23 0.03 0.04 0.17
Queue Length 95th (ft) 0 0 0 16
Control Delay (s) 0.0 0.0 0.0 9.4
Lane LOS A
Approach Delay (s) 0.0 0.0 9.4
Approach LOS A
Intersection Summary
Average Delay 2.4
Intersection Capacity Utilization 21.9% ICU Level of Service A
Analysis Period (min) 15

HCM Unsignalized Intersection Capacity Analysis
3: Sahuarita Rd. & AZ-83 Page 1
Operations Year 5, No Carpool, Peak Season, Weekday, PM Synchro 7 Report
Tetra Tech ISG 2/5/2010
Movement EBL EBR NBL NBT SBT SBR
Lane Configurations
Volume (veh/h) 22 15 34 349 265 48
Sign Control Yield Free Free
Grade 0% 0% 0%
Peak Hour Factor 0.92 0.92 0.92 0.92 0.92 0.92
Hourly flow rate (vph) 24 16 37 379 288 52
Pedestrians
Lane Width (ft)
Walking Speed (ft/s)
Percent Blockage
Right turn flare (veh)
Median type None None
Median storage veh)
Upstream signal (ft)
pX, platoon unblocked
vC, conflicting volume 767 314 340
vC1, stage 1 conf vol
vC2, stage 2 conf vol
vCu, unblocked vol 767 314 340
tC, single (s) 6.4 6.2 4.1
tC, 2 stage (s)
tF (s) 3.5 3.3 2.2
p0 queue free % 93 98 97
cM capacity (veh/h) 356 722 1208
Direction, Lane # EB 1 NB 1 SB 1
Volume Total 40 416 340
Volume Left 24 37 0
Volume Right 16 0 52
cSH 448 1208 1700
Volume to Capacity 0.09 0.03 0.20
Queue Length 95th (ft) 7 2 0
Control Delay (s) 13.8 1.0 0.0
Lane LOS B A
Approach Delay (s) 13.8 1.0 0.0
Approach LOS B
Intersection Summary
Average Delay 1.2
Intersection Capacity Utilization 50.4% ICU Level of Service A
Analysis Period (min) 15

HCM Unsignalized Intersection Capacity Analysis
4: Hilton Ranch Rd. & AZ-83 Page 2
Operations Year 5, No Carpool, Peak Season, Weekday, PM Synchro 7 Report
Tetra Tech ISG 2/5/2010
Movement WBL WBR NBT NBR SBL SBT
Lane Configurations
Volume (veh/h) 0 0 373 2 19 199
Sign Control Yield Free Free
Grade 0% 0% 0%
Peak Hour Factor 0.92 0.92 0.92 0.92 0.92 0.92
Hourly flow rate (vph) 0 0 405 2 21 216
Pedestrians
Lane Width (ft)
Walking Speed (ft/s)
Percent Blockage
Right turn flare (veh)
Median type None None
Median storage veh)
Upstream signal (ft)
pX, platoon unblocked
vC, conflicting volume 664 407 408
vC1, stage 1 conf vol
vC2, stage 2 conf vol
vCu, unblocked vol 664 407 408
tC, single (s) 6.4 6.2 4.1
tC, 2 stage (s)
tF (s) 3.5 3.3 2.2
p0 queue free % 100 100 98
cM capacity (veh/h) 415 640 1140
Direction, Lane # WB 1 NB 1 SB 1
Volume Total 0 408 237
Volume Left 0 0 21
Volume Right 0 2 0
cSH 1700 1700 1140
Volume to Capacity 0.00 0.24 0.02
Queue Length 95th (ft) 0 0 1
Control Delay (s) 0.0 0.0 0.9
Lane LOS A A
Approach Delay (s) 0.0 0.0 0.9
Approach LOS A
Intersection Summary
Average Delay 0.3
Intersection Capacity Utilization 29.6% ICU Level of Service A
Analysis Period (min) 15

HCM Unsignalized Intersection Capacity Analysis
5: Hidden Valley Rd. & AZ-83 Page 3
Operations Year 5, No Carpool, Peak Season, Weekday, PM Synchro 7 Report
Tetra Tech ISG 2/5/2010
Movement EBL EBR NBL NBT SBT SBR
Lane Configurations
Volume (veh/h) 250 85 36 111 119 107
Sign Control Yield Free Free
Grade 3% 6% -6%
Peak Hour Factor 0.92 0.92 0.92 0.92 0.92 0.92
Hourly flow rate (vph) 272 92 39 121 129 116
Pedestrians
Lane Width (ft)
Walking Speed (ft/s)
Percent Blockage
Right turn flare (veh)
Median type None None
Median storage veh)
Upstream signal (ft)
pX, platoon unblocked
vC, conflicting volume 386 188 246
vC1, stage 1 conf vol
vC2, stage 2 conf vol
vCu, unblocked vol 386 188 246
tC, single (s) 6.4 6.2 4.1
tC, 2 stage (s)
tF (s) 3.5 3.3 2.2
p0 queue free % 54 89 97
cM capacity (veh/h) 594 849 1309
Direction, Lane # EB 1 NB 1 SB 1
Volume Total 364 160 246
Volume Left 272 39 0
Volume Right 92 0 116
cSH 643 1309 1700
Volume to Capacity 0.57 0.03 0.14
Queue Length 95th (ft) 89 2 0
Control Delay (s) 17.6 2.1 0.0
Lane LOS C A
Approach Delay (s) 17.6 2.1 0.0
Approach LOS C
Intersection Summary
Average Delay 8.8
Intersection Capacity Utilization 49.7% ICU Level of Service A
Analysis Period (min) 15

HCM Unsignalized Intersection Capacity Analysis
6: Rosemont Junction & AZ-83 Page 4
Operations Year 5, No Carpool, Peak Season, Weekday, PM Synchro 7 Report
Tetra Tech ISG 2/5/2010
Movement EBL EBR NBL NBT SBT SBR
Lane Configurations
Volume (veh/h) 0 0 0 142 232 0
Sign Control Yield Free Free
Grade 0% 0% 0%
Peak Hour Factor 0.92 0.92 0.92 0.92 0.92 0.92
Hourly flow rate (vph) 0 0 0 154 252 0
Pedestrians
Lane Width (ft)
Walking Speed (ft/s)
Percent Blockage
Right turn flare (veh)
Median type None None
Median storage veh)
Upstream signal (ft)
pX, platoon unblocked
vC, conflicting volume 407 252 252
vC1, stage 1 conf vol
vC2, stage 2 conf vol
vCu, unblocked vol 407 252 252
tC, single (s) 6.4 6.2 4.1
tC, 2 stage (s)
tF (s) 3.5 3.3 2.2
p0 queue free % 100 100 100
cM capacity (veh/h) 597 782 1302
Direction, Lane # EB 1 NB 1 SB 1
Volume Total 0 154 252
Volume Left 0 0 0
Volume Right 0 0 0
cSH 1700 1302 1700
Volume to Capacity 0.00 0.00 0.15
Queue Length 95th (ft) 0 0 0
Control Delay (s) 0.0 0.0 0.0
Lane LOS A
Approach Delay (s) 0.0 0.0 0.0
Approach LOS A
Intersection Summary
Average Delay 0.0
Intersection Capacity Utilization 15.5% ICU Level of Service A
Analysis Period (min) 15

HCM Unsignalized Intersection Capacity Analysis
7: AZ-83 & Greaterville Rd. Page 5
Operations Year 5, No Carpool, Peak Season, Weekday, PM Synchro 7 Report
Tetra Tech ISG 2/5/2010
Movement SET SER NWL NWT NEL NER
Lane Configurations
Volume (veh/h) 208 2 5 104 2 0
Sign Control Free Free Yield
Grade 0% 0% 0%
Peak Hour Factor 0.92 0.92 0.92 0.92 0.92 0.92
Hourly flow rate (vph) 226 2 5 113 2 0
Pedestrians
Lane Width (ft)
Walking Speed (ft/s)
Percent Blockage
Right turn flare (veh)
Median type None None
Median storage veh)
Upstream signal (ft)
pX, platoon unblocked
vC, conflicting volume 228 351 227
vC1, stage 1 conf vol
vC2, stage 2 conf vol
vCu, unblocked vol 228 351 227
tC, single (s) 4.1 6.4 6.2
tC, 2 stage (s)
tF (s) 2.2 3.5 3.3
p0 queue free % 100 100 100
cM capacity (veh/h) 1328 640 807
Direction, Lane # SE 1 NW 1 NE 1
Volume Total 228 118 2
Volume Left 0 5 2
Volume Right 2 0 0
cSH 1700 1328 640
Volume to Capacity 0.13 0.00 0.00
Queue Length 95th (ft) 0 0 0
Control Delay (s) 0.0 0.4 10.6
Lane LOS A B
Approach Delay (s) 0.0 0.4 10.6
Approach LOS B
Intersection Summary
Average Delay 0.2
Intersection Capacity Utilization 21.1% ICU Level of Service A
Analysis Period (min) 15

HCM Unsignalized Intersection Capacity Analysis
1: I-10 WB On-Off Ramp & AZ-83 Page 1
Operations Year 5, No Carpool, Peak Season, Weekend, AM Synchro 7 Report
Tetra Tech ISG 2/5/2010
Movement EBL EBT WBT WBR SBL SBR
Lane Configurations
Volume (veh/h) 4 31 347 5 13 19
Sign Control Free Free Yield
Grade 0% 0% 0%
Peak Hour Factor 0.92 0.92 0.92 0.92 0.92 0.92
Hourly flow rate (vph) 4 34 377 5 14 21
Pedestrians
Lane Width (ft)
Walking Speed (ft/s)
Percent Blockage
Right turn flare (veh)
Median type None None
Median storage veh)
Upstream signal (ft)
pX, platoon unblocked
vC, conflicting volume 383 422 380
vC1, stage 1 conf vol
vC2, stage 2 conf vol
vCu, unblocked vol 383 422 380
tC, single (s) 4.1 6.4 6.2
tC, 2 stage (s)
tF (s) 2.2 3.5 3.3
p0 queue free % 100 98 97
cM capacity (veh/h) 1165 582 663
Direction, Lane # EB 1 WB 1 SB 1
Volume Total 38 383 35
Volume Left 4 0 14
Volume Right 0 5 21
cSH 1165 1700 627
Volume to Capacity 0.00 0.23 0.06
Queue Length 95th (ft) 0 0 4
Control Delay (s) 1.0 0.0 11.1
Lane LOS A B
Approach Delay (s) 1.0 0.0 11.1
Approach LOS B
Intersection Summary
Average Delay 0.9
Intersection Capacity Utilization 28.6% ICU Level of Service A
Analysis Period (min) 15

HCM Unsignalized Intersection Capacity Analysis
2: AZ-83 & EB Off-Ramp Page 2
Operations Year 5, No Carpool, Peak Season, Weekend, AM Synchro 7 Report
Tetra Tech ISG 2/5/2010
Movement NBL NBT NBR SBL SBT SBR SEL SER SWL SWR
Lane Configurations
Volume (veh/h) 0 299 41 0 28 0 0 199 0 0
Sign Control Free Free Yield Yield
Grade 0% 0% 0% 0%
Peak Hour Factor 0.92 0.92 0.92 0.92 0.92 0.92 0.92 0.92 0.92 0.92
Hourly flow rate (vph) 0 325 45 0 30 0 0 216 0 0
Pedestrians
Lane Width (ft)
Walking Speed (ft/s)
Percent Blockage
Right turn flare (veh)
Median type None None
Median storage veh)
Upstream signal (ft)
pX, platoon unblocked
vC, conflicting volume 30 370 400 30 572 355
vC1, stage 1 conf vol
vC2, stage 2 conf vol
vCu, unblocked vol 30 370 400 30 572 355
tC, single (s) 4.1 4.1 6.5 6.2 7.1 6.5
tC, 2 stage (s)
tF (s) 2.2 2.2 4.0 3.3 3.5 4.0
p0 queue free % 100 100 100 79 100 100
cM capacity (veh/h) 1569 1178 535 1038 339 567
Direction, Lane # NB 1 NB 2 SB 1 SE 1
Volume Total 325 45 30 216
Volume Left 0 0 0 0
Volume Right 0 45 0 216
cSH 1700 1700 1700 1038
Volume to Capacity 0.19 0.03 0.02 0.21
Queue Length 95th (ft) 0 0 0 20
Control Delay (s) 0.0 0.0 0.0 9.4
Lane LOS A
Approach Delay (s) 0.0 0.0 9.4
Approach LOS A
Intersection Summary
Average Delay 3.3
Intersection Capacity Utilization 22.3% ICU Level of Service A
Analysis Period (min) 15

HCM Unsignalized Intersection Capacity Analysis
3: Sahuarita Rd. & AZ-83 Page 1
Operations Year 5, No Carpool, Peak Season, Weekend, AM Synchro 7 Report
Tetra Tech ISG 2/5/2010
Movement EBL EBR NBL NBT SBT SBR
Lane Configurations
Volume (veh/h) 39 17 15 236 203 17
Sign Control Yield Free Free
Grade 0% 0% 0%
Peak Hour Factor 0.92 0.92 0.92 0.92 0.92 0.92
Hourly flow rate (vph) 42 18 16 257 221 18
Pedestrians
Lane Width (ft)
Walking Speed (ft/s)
Percent Blockage
Right turn flare (veh)
Median type None None
Median storage veh)
Upstream signal (ft)
pX, platoon unblocked
vC, conflicting volume 519 230 239
vC1, stage 1 conf vol
vC2, stage 2 conf vol
vCu, unblocked vol 519 230 239
tC, single (s) 6.4 6.2 4.1
tC, 2 stage (s)
tF (s) 3.5 3.3 2.2
p0 queue free % 92 98 99
cM capacity (veh/h) 507 804 1316
Direction, Lane # EB 1 NB 1 SB 1
Volume Total 61 273 239
Volume Left 42 16 0
Volume Right 18 0 18
cSH 571 1316 1700
Volume to Capacity 0.11 0.01 0.14
Queue Length 95th (ft) 9 1 0
Control Delay (s) 12.1 0.6 0.0
Lane LOS B A
Approach Delay (s) 12.1 0.6 0.0
Approach LOS B
Intersection Summary
Average Delay 1.6
Intersection Capacity Utilization 34.7% ICU Level of Service A
Analysis Period (min) 15

HCM Unsignalized Intersection Capacity Analysis
4: Hilton Ranch Rd. & AZ-83 Page 2
Operations Year 5, No Carpool, Peak Season, Weekend, AM Synchro 7 Report
Tetra Tech ISG 2/5/2010
Movement WBL WBR NBT NBR SBL SBT
Lane Configurations
Volume (veh/h) 0 0 175 0 2 225
Sign Control Yield Free Free
Grade 0% 0% 0%
Peak Hour Factor 0.92 0.92 0.92 0.92 0.92 0.92
Hourly flow rate (vph) 0 0 190 0 2 245
Pedestrians
Lane Width (ft)
Walking Speed (ft/s)
Percent Blockage
Right turn flare (veh)
Median type None None
Median storage veh)
Upstream signal (ft)
pX, platoon unblocked
vC, conflicting volume 439 190 190
vC1, stage 1 conf vol
vC2, stage 2 conf vol
vCu, unblocked vol 439 190 190
tC, single (s) 6.4 6.2 4.1
tC, 2 stage (s)
tF (s) 3.5 3.3 2.2
p0 queue free % 100 100 100
cM capacity (veh/h) 570 846 1372
Direction, Lane # WB 1 NB 1 SB 1
Volume Total 0 190 247
Volume Left 0 0 2
Volume Right 0 0 0
cSH 1700 1700 1372
Volume to Capacity 0.00 0.11 0.00
Queue Length 95th (ft) 0 0 0
Control Delay (s) 0.0 0.0 0.1
Lane LOS A A
Approach Delay (s) 0.0 0.0 0.1
Approach LOS A
Intersection Summary
Average Delay 0.0
Intersection Capacity Utilization 16.8% ICU Level of Service A
Analysis Period (min) 15

HCM Unsignalized Intersection Capacity Analysis
5: Hidden Valley Rd. & AZ-83 Page 3
Operations Year 5, No Carpool, Peak Season, Weekend, AM Synchro 7 Report
Tetra Tech ISG 2/5/2010
Movement EBL EBR NBL NBT SBT SBR
Lane Configurations
Volume (veh/h) 107 36 46 77 48 143
Sign Control Yield Free Free
Grade 3% 6% -6%
Peak Hour Factor 0.92 0.92 0.92 0.92 0.92 0.92
Hourly flow rate (vph) 116 39 50 84 52 155
Pedestrians
Lane Width (ft)
Walking Speed (ft/s)
Percent Blockage
Right turn flare (veh)
Median type None None
Median storage veh)
Upstream signal (ft)
pX, platoon unblocked
vC, conflicting volume 314 130 208
vC1, stage 1 conf vol
vC2, stage 2 conf vol
vCu, unblocked vol 314 130 208
tC, single (s) 6.4 6.2 4.1
tC, 2 stage (s)
tF (s) 3.5 3.3 2.2
p0 queue free % 82 96 96
cM capacity (veh/h) 650 914 1352
Direction, Lane # EB 1 NB 1 SB 1
Volume Total 155 134 208
Volume Left 116 50 0
Volume Right 39 0 155
cSH 701 1352 1700
Volume to Capacity 0.22 0.04 0.12
Queue Length 95th (ft) 21 3 0
Control Delay (s) 11.6 3.1 0.0
Lane LOS B A
Approach Delay (s) 11.6 3.1 0.0
Approach LOS B
Intersection Summary
Average Delay 4.5
Intersection Capacity Utilization 36.0% ICU Level of Service A
Analysis Period (min) 15

HCM Unsignalized Intersection Capacity Analysis
6: Rosemont Junction & AZ-83 Page 4
Operations Year 5, No Carpool, Peak Season, Weekend, AM Synchro 7 Report
Tetra Tech ISG 2/5/2010
Movement EBL EBR NBL NBT SBT SBR
Lane Configurations
Volume (veh/h) 2 0 0 141 118 2
Sign Control Yield Free Free
Grade 0% 0% 0%
Peak Hour Factor 0.92 0.92 0.92 0.92 0.92 0.92
Hourly flow rate (vph) 2 0 0 153 128 2
Pedestrians
Lane Width (ft)
Walking Speed (ft/s)
Percent Blockage
Right turn flare (veh)
Median type None None
Median storage veh)
Upstream signal (ft)
pX, platoon unblocked
vC, conflicting volume 283 129 130
vC1, stage 1 conf vol
vC2, stage 2 conf vol
vCu, unblocked vol 283 129 130
tC, single (s) 6.4 6.2 4.1
tC, 2 stage (s)
tF (s) 3.5 3.3 2.2
p0 queue free % 100 100 100
cM capacity (veh/h) 703 915 1443
Direction, Lane # EB 1 NB 1 SB 1
Volume Total 2 153 130
Volume Left 2 0 0
Volume Right 0 0 2
cSH 703 1443 1700
Volume to Capacity 0.00 0.00 0.08
Queue Length 95th (ft) 0 0 0
Control Delay (s) 10.1 0.0 0.0
Lane LOS B
Approach Delay (s) 10.1 0.0 0.0
Approach LOS B
Intersection Summary
Average Delay 0.1
Intersection Capacity Utilization 17.4% ICU Level of Service A
Analysis Period (min) 15

HCM Unsignalized Intersection Capacity Analysis
7: AZ-83 & Greaterville Rd. Page 5
Operations Year 5, No Carpool, Peak Season, Weekend, AM Synchro 7 Report
Tetra Tech ISG 2/5/2010
Movement SET SER NWL NWT NEL NER
Lane Configurations
Volume (veh/h) 91 0 0 124 0 0
Sign Control Free Free Yield
Grade 0% 0% 0%
Peak Hour Factor 0.92 0.92 0.92 0.92 0.92 0.92
Hourly flow rate (vph) 99 0 0 135 0 0
Pedestrians
Lane Width (ft)
Walking Speed (ft/s)
Percent Blockage
Right turn flare (veh)
Median type None None
Median storage veh)
Upstream signal (ft)
pX, platoon unblocked
vC, conflicting volume 99 234 99
vC1, stage 1 conf vol
vC2, stage 2 conf vol
vCu, unblocked vol 99 234 99
tC, single (s) 4.1 6.4 6.2
tC, 2 stage (s)
tF (s) 2.2 3.5 3.3
p0 queue free % 100 100 100
cM capacity (veh/h) 1482 750 951
Direction, Lane # SE 1 NW 1 NE 1
Volume Total 99 135 0
Volume Left 0 0 0
Volume Right 0 0 0
cSH 1700 1482 1700
Volume to Capacity 0.06 0.00 0.00
Queue Length 95th (ft) 0 0 0
Control Delay (s) 0.0 0.0 0.0
Lane LOS A
Approach Delay (s) 0.0 0.0 0.0
Approach LOS A
Intersection Summary
Average Delay 0.0
Intersection Capacity Utilization 9.9% ICU Level of Service A
Analysis Period (min) 15

HCM Unsignalized Intersection Capacity Analysis
1: I-10 WB On-Off Ramp & AZ-83 Page 1
Operations Year 5, No Carpool, Peak Season, Weekend, PM Synchro 7 Report
Tetra Tech ISG 2/5/2010
Movement EBL EBT WBT WBR SBL SBR
Lane Configurations
Volume (veh/h) 12 62 265 4 11 8
Sign Control Free Free Yield
Grade 0% 0% 0%
Peak Hour Factor 0.92 0.92 0.92 0.92 0.92 0.92
Hourly flow rate (vph) 13 67 288 4 12 9
Pedestrians
Lane Width (ft)
Walking Speed (ft/s)
Percent Blockage
Right turn flare (veh)
Median type None None
Median storage veh)
Upstream signal (ft)
pX, platoon unblocked
vC, conflicting volume 292 384 290
vC1, stage 1 conf vol
vC2, stage 2 conf vol
vCu, unblocked vol 292 384 290
tC, single (s) 4.1 6.4 6.2
tC, 2 stage (s)
tF (s) 2.2 3.5 3.3
p0 queue free % 99 98 99
cM capacity (veh/h) 1258 609 744
Direction, Lane # EB 1 WB 1 SB 1
Volume Total 80 292 21
Volume Left 13 0 12
Volume Right 0 4 9
cSH 1258 1700 659
Volume to Capacity 0.01 0.17 0.03
Queue Length 95th (ft) 1 0 2
Control Delay (s) 1.4 0.0 10.6
Lane LOS A B
Approach Delay (s) 1.4 0.0 10.6
Approach LOS B
Intersection Summary
Average Delay 0.8
Intersection Capacity Utilization 24.2% ICU Level of Service A
Analysis Period (min) 15

HCM Unsignalized Intersection Capacity Analysis
2: AZ-83 & EB Off-Ramp Page 2
Operations Year 5, No Carpool, Peak Season, Weekend, PM Synchro 7 Report
Tetra Tech ISG 2/5/2010
Movement NBL NBT NBR SBL SBT SBR SEL SER SWL SWR
Lane Configurations
Volume (veh/h) 0 281 48 0 70 0 0 321 0 0
Sign Control Free Free Yield Yield
Grade 0% 0% 0% 0%
Peak Hour Factor 0.92 0.92 0.92 0.92 0.92 0.92 0.92 0.92 0.92 0.92
Hourly flow rate (vph) 0 305 52 0 76 0 0 349 0 0
Pedestrians
Lane Width (ft)
Walking Speed (ft/s)
Percent Blockage
Right turn flare (veh)
Median type None None
Median storage veh)
Upstream signal (ft)
pX, platoon unblocked
vC, conflicting volume 76 358 434 76 730 382
vC1, stage 1 conf vol
vC2, stage 2 conf vol
vCu, unblocked vol 76 358 434 76 730 382
tC, single (s) 4.1 4.1 6.5 6.2 7.1 6.5
tC, 2 stage (s)
tF (s) 2.2 2.2 4.0 3.3 3.5 4.0
p0 queue free % 100 100 100 64 100 100
cM capacity (veh/h) 1510 1190 512 980 216 548
Direction, Lane # NB 1 NB 2 SB 1 SE 1
Volume Total 305 52 76 349
Volume Left 0 0 0 0
Volume Right 0 52 0 349
cSH 1700 1700 1700 980
Volume to Capacity 0.18 0.03 0.04 0.36
Queue Length 95th (ft) 0 0 0 41
Control Delay (s) 0.0 0.0 0.0 10.7
Lane LOS B
Approach Delay (s) 0.0 0.0 10.7
Approach LOS B
Intersection Summary
Average Delay 4.8
Intersection Capacity Utilization 30.2% ICU Level of Service A
Analysis Period (min) 15

HCM Unsignalized Intersection Capacity Analysis
3: Sahuarita Rd. & AZ-83 Page 1
Operations Year 5, No Carpool, Peak Season, Weekend, PM Synchro 7 Report
Tetra Tech ISG 2/5/2010
Movement EBL EBR NBL NBT SBT SBR
Lane Configurations
Volume (veh/h) 51 15 22 230 214 97
Sign Control Yield Free Free
Grade 0% 0% 0%
Peak Hour Factor 0.92 0.92 0.92 0.92 0.92 0.92
Hourly flow rate (vph) 55 16 24 250 233 105
Pedestrians
Lane Width (ft)
Walking Speed (ft/s)
Percent Blockage
Right turn flare (veh)
Median type None None
Median storage veh)
Upstream signal (ft)
pX, platoon unblocked
vC, conflicting volume 583 285 338
vC1, stage 1 conf vol
vC2, stage 2 conf vol
vCu, unblocked vol 583 285 338
tC, single (s) 6.4 6.2 4.1
tC, 2 stage (s)
tF (s) 3.5 3.3 2.2
p0 queue free % 88 98 98
cM capacity (veh/h) 462 749 1210
Direction, Lane # EB 1 NB 1 SB 1
Volume Total 72 274 338
Volume Left 55 24 0
Volume Right 16 0 105
cSH 506 1210 1700
Volume to Capacity 0.14 0.02 0.20
Queue Length 95th (ft) 12 2 0
Control Delay (s) 13.3 0.9 0.0
Lane LOS B A
Approach Delay (s) 13.3 0.9 0.0
Approach LOS B
Intersection Summary
Average Delay 1.7
Intersection Capacity Utilization 40.8% ICU Level of Service A
Analysis Period (min) 15

HCM Unsignalized Intersection Capacity Analysis
4: Hilton Ranch Rd. & AZ-83 Page 2
Operations Year 5, No Carpool, Peak Season, Weekend, PM Synchro 7 Report
Tetra Tech ISG 2/5/2010
Movement WBL WBR NBT NBR SBL SBT
Lane Configurations
Volume (veh/h) 0 0 232 0 12 194
Sign Control Yield Free Free
Grade 0% 0% 0%
Peak Hour Factor 0.92 0.92 0.92 0.92 0.92 0.92
Hourly flow rate (vph) 0 0 252 0 13 211
Pedestrians
Lane Width (ft)
Walking Speed (ft/s)
Percent Blockage
Right turn flare (veh)
Median type None None
Median storage veh)
Upstream signal (ft)
pX, platoon unblocked
vC, conflicting volume 489 252 252
vC1, stage 1 conf vol
vC2, stage 2 conf vol
vCu, unblocked vol 489 252 252
tC, single (s) 6.4 6.2 4.1
tC, 2 stage (s)
tF (s) 3.5 3.3 2.2
p0 queue free % 100 100 99
cM capacity (veh/h) 529 782 1302
Direction, Lane # WB 1 NB 1 SB 1
Volume Total 0 252 224
Volume Left 0 0 13
Volume Right 0 0 0
cSH 1700 1700 1302
Volume to Capacity 0.00 0.15 0.01
Queue Length 95th (ft) 0 0 1
Control Delay (s) 0.0 0.0 0.5
Lane LOS A A
Approach Delay (s) 0.0 0.0 0.5
Approach LOS A
Intersection Summary
Average Delay 0.3
Intersection Capacity Utilization 23.4% ICU Level of Service A
Analysis Period (min) 15

HCM Unsignalized Intersection Capacity Analysis
5: Hidden Valley Rd. & AZ-83 Page 3
Operations Year 5, No Carpool, Peak Season, Weekend, PM Synchro 7 Report
Tetra Tech ISG 2/5/2010
Movement EBL EBR NBL NBT SBT SBR
Lane Configurations
Volume (veh/h) 143 49 41 92 145 107
Sign Control Yield Free Free
Grade 3% 6% -6%
Peak Hour Factor 0.92 0.92 0.92 0.92 0.92 0.92
Hourly flow rate (vph) 155 53 45 100 158 116
Pedestrians
Lane Width (ft)
Walking Speed (ft/s)
Percent Blockage
Right turn flare (veh)
Median type None None
Median storage veh)
Upstream signal (ft)
pX, platoon unblocked
vC, conflicting volume 405 216 274
vC1, stage 1 conf vol
vC2, stage 2 conf vol
vCu, unblocked vol 405 216 274
tC, single (s) 6.4 6.2 4.1
tC, 2 stage (s)
tF (s) 3.5 3.3 2.2
p0 queue free % 73 93 97
cM capacity (veh/h) 577 819 1278
Direction, Lane # EB 1 NB 1 SB 1
Volume Total 209 145 274
Volume Left 155 45 0
Volume Right 53 0 116
cSH 624 1278 1700
Volume to Capacity 0.33 0.03 0.16
Queue Length 95th (ft) 37 3 0
Control Delay (s) 13.6 2.6 0.0
Lane LOS B A
Approach Delay (s) 13.6 2.6 0.0
Approach LOS B
Intersection Summary
Average Delay 5.1
Intersection Capacity Utilization 42.2% ICU Level of Service A
Analysis Period (min) 15

HCM Unsignalized Intersection Capacity Analysis
6: Rosemont Junction & AZ-83 Page 4
Operations Year 5, No Carpool, Peak Season, Weekend, PM Synchro 7 Report
Tetra Tech ISG 2/5/2010
Movement EBL EBR NBL NBT SBT SBR
Lane Configurations
Volume (veh/h) 0 0 0 137 167 0
Sign Control Yield Free Free
Grade 0% 0% 0%
Peak Hour Factor 0.92 0.92 0.92 0.92 0.92 0.92
Hourly flow rate (vph) 0 0 0 149 182 0
Pedestrians
Lane Width (ft)
Walking Speed (ft/s)
Percent Blockage
Right turn flare (veh)
Median type None None
Median storage veh)
Upstream signal (ft)
pX, platoon unblocked
vC, conflicting volume 330 182 182
vC1, stage 1 conf vol
vC2, stage 2 conf vol
vCu, unblocked vol 330 182 182
tC, single (s) 6.4 6.2 4.1
tC, 2 stage (s)
tF (s) 3.5 3.3 2.2
p0 queue free % 100 100 100
cM capacity (veh/h) 660 856 1382
Direction, Lane # EB 1 NB 1 SB 1
Volume Total 0 149 182
Volume Left 0 0 0
Volume Right 0 0 0
cSH 1700 1382 1700
Volume to Capacity 0.00 0.00 0.11
Queue Length 95th (ft) 0 0 0
Control Delay (s) 0.0 0.0 0.0
Lane LOS A
Approach Delay (s) 0.0 0.0 0.0
Approach LOS A
Intersection Summary
Average Delay 0.0
Intersection Capacity Utilization 12.1% ICU Level of Service A
Analysis Period (min) 15

HCM Unsignalized Intersection Capacity Analysis
7: AZ-83 & Greaterville Rd. Page 5
Operations Year 5, No Carpool, Peak Season, Weekend, PM Synchro 7 Report
Tetra Tech ISG 2/5/2010
Movement SET SER NWL NWT NEL NER
Lane Configurations
Volume (veh/h) 143 0 7 142 5 7
Sign Control Free Free Yield
Grade 0% 0% 0%
Peak Hour Factor 0.92 0.92 0.92 0.92 0.92 0.92
Hourly flow rate (vph) 155 0 8 154 5 8
Pedestrians
Lane Width (ft)
Walking Speed (ft/s)
Percent Blockage
Right turn flare (veh)
Median type None None
Median storage veh)
Upstream signal (ft)
pX, platoon unblocked
vC, conflicting volume 155 325 155
vC1, stage 1 conf vol
vC2, stage 2 conf vol
vCu, unblocked vol 155 325 155
tC, single (s) 4.1 6.4 6.2
tC, 2 stage (s)
tF (s) 2.2 3.5 3.3
p0 queue free % 99 99 99
cM capacity (veh/h) 1413 661 885
Direction, Lane # SE 1 NW 1 NE 1
Volume Total 155 162 13
Volume Left 0 8 5
Volume Right 0 0 8
cSH 1700 1413 776
Volume to Capacity 0.09 0.01 0.02
Queue Length 95th (ft) 0 0 1
Control Delay (s) 0.0 0.4 9.7
Lane LOS A A
Approach Delay (s) 0.0 0.4 9.7
Approach LOS A
Intersection Summary
Average Delay 0.6
Intersection Capacity Utilization 23.2% ICU Level of Service A
Analysis Period (min) 15

NON - PEAK SEASON
SCENARIO 4
50% CARPOOL

HCM Unsignalized Intersection Capacity Analysis
1: I-10 WB On-Off Ramp & AZ-83 Page 1
Operations Year 5, 50% Carpool,Non-Peak Season, Weekday, AM Synchro 7 Report
Tetra Tech ISG 2/5/2010
Movement EBL EBT WBT WBR SBL SBR
Lane Configurations
Volume (veh/h) 6 40 508 2 8 31
Sign Control Free Free Yield
Grade 0% 0% 0%
Peak Hour Factor 0.92 0.92 0.92 0.92 0.92 0.92
Hourly flow rate (vph) 7 43 552 2 9 34
Pedestrians
Lane Width (ft)
Walking Speed (ft/s)
Percent Blockage
Right turn flare (veh)
Median type None None
Median storage veh)
Upstream signal (ft)
pX, platoon unblocked
vC, conflicting volume 554 610 553
vC1, stage 1 conf vol
vC2, stage 2 conf vol
vCu, unblocked vol 554 610 553
tC, single (s) 4.2 6.5 6.3
tC, 2 stage (s)
tF (s) 2.3 3.6 3.4
p0 queue free % 99 98 94
cM capacity (veh/h) 987 445 521
Direction, Lane # EB 1 WB 1 SB 1
Volume Total 50 554 42
Volume Left 7 0 9
Volume Right 0 2 34
cSH 987 1700 504
Volume to Capacity 0.01 0.33 0.08
Queue Length 95th (ft) 0 0 7
Control Delay (s) 1.2 0.0 12.8
Lane LOS A B
Approach Delay (s) 1.2 0.0 12.8
Approach LOS B
Intersection Summary
Average Delay 0.9
Intersection Capacity Utilization 36.9% ICU Level of Service A
Analysis Period (min) 15

HCM Unsignalized Intersection Capacity Analysis
2: AZ-83 & EB Off-Ramp Page 2
Operations Year 5, 50% Carpool,Non-Peak Season, Weekday, AM Synchro 7 Report
Tetra Tech ISG 2/5/2010
Movement NBL NBT NBR SBL SBT SBR SEL SER SWL SWR
Lane Configurations
Volume (veh/h) 0 286 40 0 32 0 0 213 0 0
Sign Control Free Free Yield Yield
Grade 0% 0% 0% 0%
Peak Hour Factor 0.92 0.92 0.92 0.92 0.92 0.92 0.92 0.92 0.92 0.92
Hourly flow rate (vph) 0 311 43 0 35 0 0 232 0 0
Pedestrians
Lane Width (ft)
Walking Speed (ft/s)
Percent Blockage
Right turn flare (veh)
Median type None None
Median storage veh)
Upstream signal (ft)
pX, platoon unblocked
vC, conflicting volume 35 354 389 35 577 346
vC1, stage 1 conf vol
vC2, stage 2 conf vol
vCu, unblocked vol 35 354 389 35 577 346
tC, single (s) 4.2 4.2 6.6 6.3 7.2 6.6
tC, 2 stage (s)
tF (s) 2.3 2.3 4.1 3.4 3.6 4.1
p0 queue free % 100 100 100 77 100 100
cM capacity (veh/h) 1539 1172 537 1021 324 568
Direction, Lane # NB 1 NB 2 SB 1 SE 1
Volume Total 311 43 35 232
Volume Left 0 0 0 0
Volume Right 0 43 0 232
cSH 1700 1700 1700 1021
Volume to Capacity 0.18 0.03 0.02 0.23
Queue Length 95th (ft) 0 0 0 22
Control Delay (s) 0.0 0.0 0.0 9.6
Lane LOS A
Approach Delay (s) 0.0 0.0 9.6
Approach LOS A
Intersection Summary
Average Delay 3.6
Intersection Capacity Utilization 23.2% ICU Level of Service A
Analysis Period (min) 15

HCM Unsignalized Intersection Capacity Analysis
3: Sahuarita Rd. & AZ-83 Page 1
Operations Year 5, 50% Carpool, Non-Peak Season, Weekday, AM Synchro 7 Report
Tetra Tech ISG 2/5/2010
Movement EBL EBR NBL NBT SBT SBR
Lane Configurations
Volume (veh/h) 15 7 15 173 207 2
Sign Control Yield Free Free
Grade 0% 0% 0%
Peak Hour Factor 0.92 0.92 0.92 0.92 0.92 0.92
Hourly flow rate (vph) 16 8 16 188 225 2
Pedestrians
Lane Width (ft)
Walking Speed (ft/s)
Percent Blockage
Right turn flare (veh)
Median type None None
Median storage veh)
Upstream signal (ft)
pX, platoon unblocked
vC, conflicting volume 447 226 227
vC1, stage 1 conf vol
vC2, stage 2 conf vol
vCu, unblocked vol 447 226 227
tC, single (s) 6.5 6.3 4.2
tC, 2 stage (s)
tF (s) 3.6 3.4 2.3
p0 queue free % 97 99 99
cM capacity (veh/h) 551 799 1306
Direction, Lane # EB 1 NB 1 SB 1
Volume Total 24 204 227
Volume Left 16 16 0
Volume Right 8 0 2
cSH 612 1306 1700
Volume to Capacity 0.04 0.01 0.13
Queue Length 95th (ft) 3 1 0
Control Delay (s) 11.1 0.7 0.0
Lane LOS B A
Approach Delay (s) 11.1 0.7 0.0
Approach LOS B
Intersection Summary
Average Delay 0.9
Intersection Capacity Utilization 31.5% ICU Level of Service A
Analysis Period (min) 15
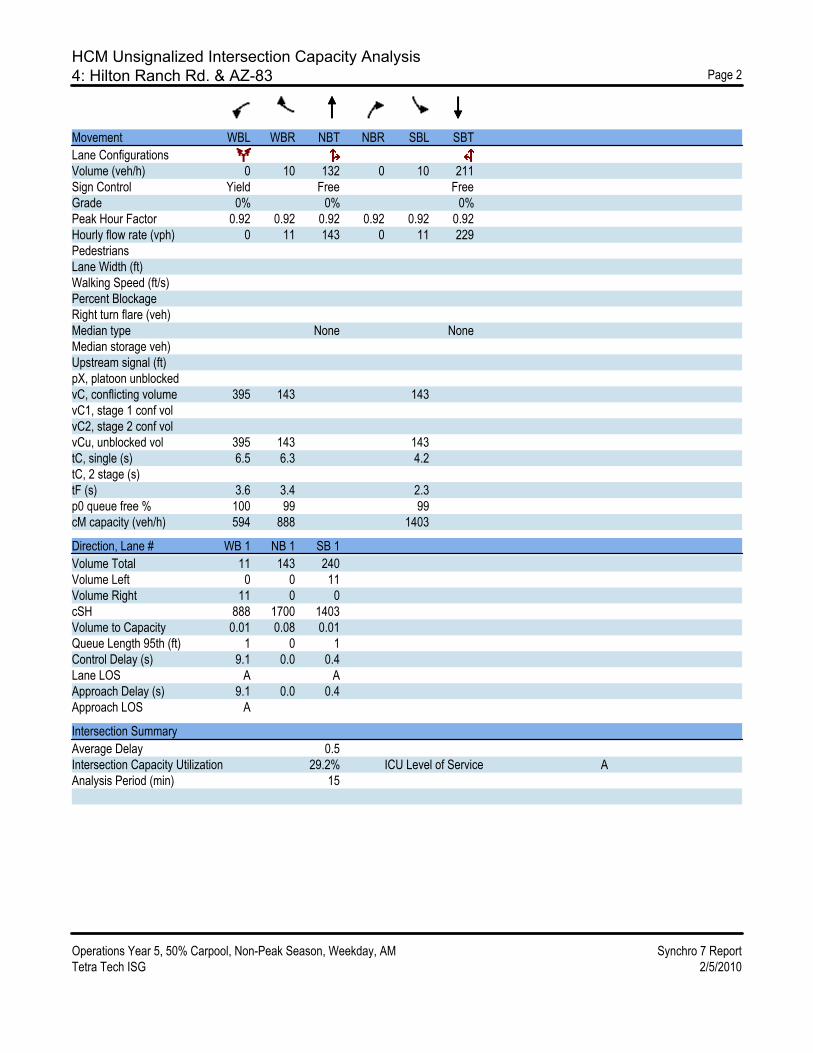
HCM Unsignalized Intersection Capacity Analysis
4: Hilton Ranch Rd. & AZ-83 Page 2
Operations Year 5, 50% Carpool, Non-Peak Season, Weekday, AM Synchro 7 Report
Tetra Tech ISG 2/5/2010
Movement WBL WBR NBT NBR SBL SBT
Lane Configurations
Volume (veh/h) 0 10 132 0 10 211
Sign Control Yield Free Free
Grade 0% 0% 0%
Peak Hour Factor 0.92 0.92 0.92 0.92 0.92 0.92
Hourly flow rate (vph) 0 11 143 0 11 229
Pedestrians
Lane Width (ft)
Walking Speed (ft/s)
Percent Blockage
Right turn flare (veh)
Median type None None
Median storage veh)
Upstream signal (ft)
pX, platoon unblocked
vC, conflicting volume 395 143 143
vC1, stage 1 conf vol
vC2, stage 2 conf vol
vCu, unblocked vol 395 143 143
tC, single (s) 6.5 6.3 4.2
tC, 2 stage (s)
tF (s) 3.6 3.4 2.3
p0 queue free % 100 99 99
cM capacity (veh/h) 594 888 1403
Direction, Lane # WB 1 NB 1 SB 1
Volume Total 11 143 240
Volume Left 0 0 11
Volume Right 11 0 0
cSH 888 1700 1403
Volume to Capacity 0.01 0.08 0.01
Queue Length 95th (ft) 1 0 1
Control Delay (s) 9.1 0.0 0.4
Lane LOS A A
Approach Delay (s) 9.1 0.0 0.4
Approach LOS A
Intersection Summary
Average Delay 0.5
Intersection Capacity Utilization 29.2% ICU Level of Service A
Analysis Period (min) 15

HCM Unsignalized Intersection Capacity Analysis
5: Hidden Valley Rd. & AZ-83 Page 3
Operations Year 5, 50% Carpool, Non-Peak Season, Weekday, AM Synchro 7 Report
Tetra Tech ISG 2/5/2010
Movement EBL EBR NBL NBT SBT SBR
Lane Configurations
Volume (veh/h) 64 21 53 116 90 161
Sign Control Yield Free Free
Grade 0% 0% 0%
Peak Hour Factor 0.92 0.92 0.92 0.92 0.92 0.92
Hourly flow rate (vph) 70 23 58 126 98 175
Pedestrians
Lane Width (ft)
Walking Speed (ft/s)
Percent Blockage
Right turn flare (veh)
Median type None None
Median storage veh)
Upstream signal (ft)
pX, platoon unblocked
vC, conflicting volume 427 185 273
vC1, stage 1 conf vol
vC2, stage 2 conf vol
vCu, unblocked vol 427 185 273
tC, single (s) 6.5 6.3 4.2
tC, 2 stage (s)
tF (s) 3.6 3.4 2.3
p0 queue free % 87 97 95
cM capacity (veh/h) 547 842 1257
Direction, Lane # EB 1 NB 1 SB 1
Volume Total 92 184 273
Volume Left 70 58 0
Volume Right 23 0 175
cSH 599 1257 1700
Volume to Capacity 0.15 0.05 0.16
Queue Length 95th (ft) 14 4 0
Control Delay (s) 12.1 2.8 0.0
Lane LOS B A
Approach Delay (s) 12.1 2.8 0.0
Approach LOS B
Intersection Summary
Average Delay 3.0
Intersection Capacity Utilization 38.5% ICU Level of Service A
Analysis Period (min) 15

HCM Unsignalized Intersection Capacity Analysis
6: Rosemont Junction & AZ-83 Page 4
Operations Year 5, 50% Carpool, Non-Peak Season, Weekday, AM Synchro 7 Report
Tetra Tech ISG 2/5/2010
Movement EBL EBR NBL NBT SBT SBR
Lane Configurations
Volume (veh/h) 0 0 0 140 82 0
Sign Control Yield Free Free
Grade 0% 0% 0%
Peak Hour Factor 0.92 0.92 0.92 0.92 0.92 0.92
Hourly flow rate (vph) 0 0 0 152 89 0
Pedestrians
Lane Width (ft)
Walking Speed (ft/s)
Percent Blockage
Right turn flare (veh)
Median type None None
Median storage veh)
Upstream signal (ft)
pX, platoon unblocked
vC, conflicting volume 241 89 89
vC1, stage 1 conf vol
vC2, stage 2 conf vol
vCu, unblocked vol 241 89 89
tC, single (s) 6.5 6.3 4.2
tC, 2 stage (s)
tF (s) 3.6 3.4 2.3
p0 queue free % 100 100 100
cM capacity (veh/h) 734 953 1469
Direction, Lane # EB 1 NB 1 SB 1
Volume Total 0 152 89
Volume Left 0 0 0
Volume Right 0 0 0
cSH 1700 1469 1700
Volume to Capacity 0.00 0.00 0.05
Queue Length 95th (ft) 0 0 0
Control Delay (s) 0.0 0.0 0.0
Lane LOS A
Approach Delay (s) 0.0 0.0 0.0
Approach LOS A
Intersection Summary
Average Delay 0.0
Intersection Capacity Utilization 10.7% ICU Level of Service A
Analysis Period (min) 15

HCM Unsignalized Intersection Capacity Analysis
7: AZ-83 & Greaterville Rd. Page 5
Operations Year 5, 50% Carpool, Non-Peak Season, Weekday, AM Synchro 7 Report
Tetra Tech ISG 2/5/2010
Movement SET SER NWL NWT NEL NER
Lane Configurations
Volume (veh/h) 72 5 5 111 2 2
Sign Control Free Free Yield
Grade 0% 0% 0%
Peak Hour Factor 0.92 0.92 0.92 0.92 0.92 0.92
Hourly flow rate (vph) 78 5 5 121 2 2
Pedestrians
Lane Width (ft)
Walking Speed (ft/s)
Percent Blockage
Right turn flare (veh)
Median type None None
Median storage veh)
Upstream signal (ft)
pX, platoon unblocked
vC, conflicting volume 84 212 81
vC1, stage 1 conf vol
vC2, stage 2 conf vol
vCu, unblocked vol 84 212 81
tC, single (s) 4.2 6.5 6.3
tC, 2 stage (s)
tF (s) 2.3 3.6 3.4
p0 queue free % 100 100 100
cM capacity (veh/h) 1476 760 963
Direction, Lane # SE 1 NW 1 NE 1
Volume Total 84 126 4
Volume Left 0 5 2
Volume Right 5 0 2
cSH 1700 1476 849
Volume to Capacity 0.05 0.00 0.01
Queue Length 95th (ft) 0 0 0
Control Delay (s) 0.0 0.3 9.3
Lane LOS A A
Approach Delay (s) 0.0 0.3 9.3
Approach LOS A
Intersection Summary
Average Delay 0.4
Intersection Capacity Utilization 19.9% ICU Level of Service A
Analysis Period (min) 15

HCM Unsignalized Intersection Capacity Analysis
1: I-10 WB On-Off Ramp & AZ-83 Page 1
Operations Year 5, 50% Carpool, Non-Peak Season, Weekday, PM Synchro 7 Report
Tetra Tech ISG 2/5/2010
Movement EBL EBT WBT WBR SBL SBR
Lane Configurations
Volume (veh/h) 25 47 187 5 10 7
Sign Control Free Free Yield
Grade 0% 0% 0%
Peak Hour Factor 0.92 0.92 0.92 0.92 0.92 0.92
Hourly flow rate (vph) 27 51 203 5 11 8
Pedestrians
Lane Width (ft)
Walking Speed (ft/s)
Percent Blockage
Right turn flare (veh)
Median type None None
Median storage veh)
Upstream signal (ft)
pX, platoon unblocked
vC, conflicting volume 209 311 206
vC1, stage 1 conf vol
vC2, stage 2 conf vol
vCu, unblocked vol 209 311 206
tC, single (s) 4.2 6.5 6.3
tC, 2 stage (s)
tF (s) 2.3 3.6 3.4
p0 queue free % 98 98 99
cM capacity (veh/h) 1327 655 820
Direction, Lane # EB 1 WB 1 SB 1
Volume Total 78 209 18
Volume Left 27 0 11
Volume Right 0 5 8
cSH 1327 1700 714
Volume to Capacity 0.02 0.12 0.03
Queue Length 95th (ft) 2 0 2
Control Delay (s) 2.8 0.0 10.2
Lane LOS A B
Approach Delay (s) 2.8 0.0 10.2
Approach LOS B
Intersection Summary
Average Delay 1.3
Intersection Capacity Utilization 27.3% ICU Level of Service A
Analysis Period (min) 15

HCM Unsignalized Intersection Capacity Analysis
2: AZ-83 & EB Off-Ramp Page 2
Operations Year 5, 50% Carpool, Non-Peak Season, Weekday, PM Synchro 7 Report
Tetra Tech ISG 2/5/2010
Movement NBL NBT NBR SBL SBT SBR SEL SER SWL SWR
Lane Configurations
Volume (veh/h) 0 252 37 0 33 0 0 252 0 0
Sign Control Free Free Yield Yield
Grade 0% 0% 0% 0%
Peak Hour Factor 0.92 0.92 0.92 0.92 0.92 0.92 0.92 0.92 0.92 0.92
Hourly flow rate (vph) 0 274 40 0 36 0 0 274 0 0
Pedestrians
Lane Width (ft)
Walking Speed (ft/s)
Percent Blockage
Right turn flare (veh)
Median type None None
Median storage veh)
Upstream signal (ft)
pX, platoon unblocked
vC, conflicting volume 36 314 350 36 584 310
vC1, stage 1 conf vol
vC2, stage 2 conf vol
vCu, unblocked vol 36 314 350 36 584 310
tC, single (s) 4.2 4.2 6.6 6.3 7.2 6.6
tC, 2 stage (s)
tF (s) 2.3 2.3 4.1 3.4 3.6 4.1
p0 queue free % 100 100 100 73 100 100
cM capacity (veh/h) 1537 1213 565 1020 303 595
Direction, Lane # NB 1 NB 2 SB 1 SE 1
Volume Total 274 40 36 274
Volume Left 0 0 0 0
Volume Right 0 40 0 274
cSH 1700 1700 1700 1020
Volume to Capacity 0.16 0.02 0.02 0.27
Queue Length 95th (ft) 0 0 0 27
Control Delay (s) 0.0 0.0 0.0 9.8
Lane LOS A
Approach Delay (s) 0.0 0.0 9.8
Approach LOS A
Intersection Summary
Average Delay 4.3
Intersection Capacity Utilization 25.6% ICU Level of Service A
Analysis Period (min) 15

HCM Unsignalized Intersection Capacity Analysis
3: Sahuarita Rd. & AZ-83 Page 1
Operations Year 5, 50% Carpool, Non-Peak Season, Weekday, PM Synchro 7 - Report
Tetra Tech ISG 2/5/2010
Movement EBL EBR NBL NBT SBT SBR
Lane Configurations
Volume (veh/h) 19 7 17 219 178 51
Sign Control Yield Free Free
Grade 0% 0% 0%
Peak Hour Factor 0.92 0.92 0.92 0.92 0.92 0.92
Hourly flow rate (vph) 21 8 18 238 193 55
Pedestrians
Lane Width (ft)
Walking Speed (ft/s)
Percent Blockage
Right turn flare (veh)
Median type None None
Median storage veh)
Upstream signal (ft)
pX, platoon unblocked
vC, conflicting volume 496 221 249
vC1, stage 1 conf vol
vC2, stage 2 conf vol
vCu, unblocked vol 496 221 249
tC, single (s) 6.5 6.3 4.2
tC, 2 stage (s)
tF (s) 3.6 3.4 2.3
p0 queue free % 96 99 99
cM capacity (veh/h) 515 804 1282
Direction, Lane # EB 1 NB 1 SB 1
Volume Total 28 257 249
Volume Left 21 18 0
Volume Right 8 0 55
cSH 570 1282 1700
Volume to Capacity 0.05 0.01 0.15
Queue Length 95th (ft) 4 1 0
Control Delay (s) 11.6 0.7 0.0
Lane LOS B A
Approach Delay (s) 11.6 0.7 0.0
Approach LOS B
Intersection Summary
Average Delay 0.9
Intersection Capacity Utilization 35.5% ICU Level of Service A
Analysis Period (min) 15

HCM Unsignalized Intersection Capacity Analysis
4: Hilton Ranch Rd. & AZ-83 Page 2
Operations Year 5, 50% Carpool, Non-Peak Season, Weekday, PM Synchro 7 - Report
Tetra Tech ISG 2/5/2010
Movement WBL WBR NBT NBR SBL SBT
Lane Configurations
Volume (veh/h) 0 0 204 0 10 137
Sign Control Yield Free Free
Grade 0% 0% 0%
Peak Hour Factor 0.92 0.92 0.92 0.92 0.92 0.92
Hourly flow rate (vph) 0 0 222 0 11 149
Pedestrians
Lane Width (ft)
Walking Speed (ft/s)
Percent Blockage
Right turn flare (veh)
Median type None None
Median storage veh)
Upstream signal (ft)
pX, platoon unblocked
vC, conflicting volume 392 222 222
vC1, stage 1 conf vol
vC2, stage 2 conf vol
vCu, unblocked vol 392 222 222
tC, single (s) 6.5 6.3 4.2
tC, 2 stage (s)
tF (s) 3.6 3.4 2.3
p0 queue free % 100 100 99
cM capacity (veh/h) 595 803 1313
Direction, Lane # WB 1 NB 1 SB 1
Volume Total 0 222 160
Volume Left 0 0 11
Volume Right 0 0 0
cSH 1700 1700 1313
Volume to Capacity 0.00 0.13 0.01
Queue Length 95th (ft) 0 0 1
Control Delay (s) 0.0 0.0 0.6
Lane LOS A A
Approach Delay (s) 0.0 0.0 0.6
Approach LOS A
Intersection Summary
Average Delay 0.2
Intersection Capacity Utilization 18.8% ICU Level of Service A
Analysis Period (min) 15

HCM Unsignalized Intersection Capacity Analysis
5: Hidden Valley Rd. & AZ-83 Page 3
Operations Year 5, 50% Carpool, Non-Peak Season, Weekday, PM Synchro 7 - Report
Tetra Tech ISG 2/5/2010
Movement EBL EBR NBL NBT SBT SBR
Lane Configurations
Volume (veh/h) 156 51 21 80 119 64
Sign Control Yield Free Free
Grade 0% 0% 0%
Peak Hour Factor 0.92 0.92 0.92 0.92 0.92 0.92
Hourly flow rate (vph) 170 55 23 87 129 70
Pedestrians
Lane Width (ft)
Walking Speed (ft/s)
Percent Blockage
Right turn flare (veh)
Median type None None
Median storage veh)
Upstream signal (ft)
pX, platoon unblocked
vC, conflicting volume 297 164 199
vC1, stage 1 conf vol
vC2, stage 2 conf vol
vCu, unblocked vol 297 164 199
tC, single (s) 6.5 6.3 4.2
tC, 2 stage (s)
tF (s) 3.6 3.4 2.3
p0 queue free % 75 94 98
cM capacity (veh/h) 670 865 1338
Direction, Lane # EB 1 NB 1 SB 1
Volume Total 225 110 199
Volume Left 170 23 0
Volume Right 55 0 70
cSH 710 1338 1700
Volume to Capacity 0.32 0.02 0.12
Queue Length 95th (ft) 34 1 0
Control Delay (s) 12.4 1.7 0.0
Lane LOS B A
Approach Delay (s) 12.4 1.7 0.0
Approach LOS B
Intersection Summary
Average Delay 5.6
Intersection Capacity Utilization 37.3% ICU Level of Service A
Analysis Period (min) 15

HCM Unsignalized Intersection Capacity Analysis
6: Rosemont Junction & AZ-83 Page 4
Operations Year 5, 50% Carpool, Non-Peak Season, Weekday, PM Synchro 7 - Report
Tetra Tech ISG 2/5/2010
Movement EBL EBR NBL NBT SBT SBR
Lane Configurations
Volume (veh/h) 0 0 0 87 138 0
Sign Control Yield Free Free
Grade 0% 0% 0%
Peak Hour Factor 0.92 0.92 0.92 0.92 0.92 0.92
Hourly flow rate (vph) 0 0 0 95 150 0
Pedestrians
Lane Width (ft)
Walking Speed (ft/s)
Percent Blockage
Right turn flare (veh)
Median type None None
Median storage veh)
Upstream signal (ft)
pX, platoon unblocked
vC, conflicting volume 245 150 150
vC1, stage 1 conf vol
vC2, stage 2 conf vol
vCu, unblocked vol 245 150 150
tC, single (s) 6.5 6.3 4.2
tC, 2 stage (s)
tF (s) 3.6 3.4 2.3
p0 queue free % 100 100 100
cM capacity (veh/h) 731 881 1395
Direction, Lane # EB 1 NB 1 SB 1
Volume Total 0 95 150
Volume Left 0 0 0
Volume Right 0 0 0
cSH 1700 1395 1700
Volume to Capacity 0.00 0.00 0.09
Queue Length 95th (ft) 0 0 0
Control Delay (s) 0.0 0.0 0.0
Lane LOS A
Approach Delay (s) 0.0 0.0 0.0
Approach LOS A
Intersection Summary
Average Delay 0.0
Intersection Capacity Utilization 10.6% ICU Level of Service A
Analysis Period (min) 15

HCM Unsignalized Intersection Capacity Analysis
7: AZ-83 & Greaterville Rd. Page 5
Operations Year 5, 50% Carpool, Non-Peak Season, Weekday, PM Synchro 7 - Report
Tetra Tech ISG 2/5/2010
Movement SET SER NWL NWT NEL NER
Lane Configurations
Volume (veh/h) 162 5 5 116 0 0
Sign Control Free Free Yield
Grade 0% 0% 0%
Peak Hour Factor 0.92 0.92 0.92 0.92 0.92 0.92
Hourly flow rate (vph) 176 5 5 126 0 0
Pedestrians
Lane Width (ft)
Walking Speed (ft/s)
Percent Blockage
Right turn flare (veh)
Median type None None
Median storage veh)
Upstream signal (ft)
pX, platoon unblocked
vC, conflicting volume 182 316 179
vC1, stage 1 conf vol
vC2, stage 2 conf vol
vCu, unblocked vol 182 316 179
tC, single (s) 4.2 6.5 6.3
tC, 2 stage (s)
tF (s) 2.3 3.6 3.4
p0 queue free % 100 100 100
cM capacity (veh/h) 1358 662 849
Direction, Lane # SE 1 NW 1 NE 1
Volume Total 182 132 0
Volume Left 0 5 0
Volume Right 5 0 0
cSH 1700 1358 1700
Volume to Capacity 0.11 0.00 0.00
Queue Length 95th (ft) 0 0 0
Control Delay (s) 0.0 0.3 0.0
Lane LOS A A
Approach Delay (s) 0.0 0.3 0.0
Approach LOS A
Intersection Summary
Average Delay 0.1
Intersection Capacity Utilization 13.5% ICU Level of Service A
Analysis Period (min) 15

HCM Unsignalized Intersection Capacity Analysis
1: I-10 WB On-Off Ramp & AZ-83 Page 1
Operations Year 5, 50% Carpool, Non-Peak Season, Weekend, AM Synchro 7 Report
Tetra Tech ISG 2/5/2010
Movement EBL EBT WBT WBR SBL SBR
Lane Configurations
Volume (veh/h) 6 51 387 2 8 15
Sign Control Free Free Yield
Grade 0% 0% 0%
Peak Hour Factor 0.92 0.92 0.92 0.92 0.92 0.92
Hourly flow rate (vph) 7 55 421 2 9 16
Pedestrians
Lane Width (ft)
Walking Speed (ft/s)
Percent Blockage
Right turn flare (veh)
Median type None None
Median storage veh)
Upstream signal (ft)
pX, platoon unblocked
vC, conflicting volume 423 490 422
vC1, stage 1 conf vol
vC2, stage 2 conf vol
vCu, unblocked vol 423 490 422
tC, single (s) 4.2 6.5 6.3
tC, 2 stage (s)
tF (s) 2.3 3.6 3.4
p0 queue free % 99 98 97
cM capacity (veh/h) 1105 524 619
Direction, Lane # EB 1 WB 1 SB 1
Volume Total 62 423 25
Volume Left 7 0 9
Volume Right 0 2 16
cSH 1105 1700 582
Volume to Capacity 0.01 0.25 0.04
Queue Length 95th (ft) 0 0 3
Control Delay (s) 0.9 0.0 11.5
Lane LOS A B
Approach Delay (s) 0.9 0.0 11.5
Approach LOS B
Intersection Summary
Average Delay 0.7
Intersection Capacity Utilization 30.5% ICU Level of Service A
Analysis Period (min) 15

HCM Unsignalized Intersection Capacity Analysis
2: AZ-83 & EB Off-Ramp Page 2
Operations Year 5, 50% Carpool, Non-Peak Season, Weekend, AM Synchro 7 Report
Tetra Tech ISG 2/5/2010
Movement NBL NBT NBR SBL SBT SBR SEL SER SWL SWR
Lane Configurations
Volume (veh/h) 0 283 30 0 17 0 0 145 0 0
Sign Control Free Free Yield Yield
Grade 0% 0% 0% 0%
Peak Hour Factor 0.92 0.92 0.92 0.92 0.92 0.92 0.92 0.92 0.92 0.92
Hourly flow rate (vph) 0 308 33 0 18 0 0 158 0 0
Pedestrians
Lane Width (ft)
Walking Speed (ft/s)
Percent Blockage
Right turn flare (veh)
Median type None None
Median storage veh)
Upstream signal (ft)
pX, platoon unblocked
vC, conflicting volume 18 340 359 18 484 326
vC1, stage 1 conf vol
vC2, stage 2 conf vol
vCu, unblocked vol 18 340 359 18 484 326
tC, single (s) 4.2 4.2 6.6 6.3 7.2 6.6
tC, 2 stage (s)
tF (s) 2.3 2.3 4.1 3.4 3.6 4.1
p0 queue free % 100 100 100 85 100 100
cM capacity (veh/h) 1560 1186 558 1043 410 582
Direction, Lane # NB 1 NB 2 SB 1 SE 1
Volume Total 308 33 18 158
Volume Left 0 0 0 0
Volume Right 0 33 0 158
cSH 1700 1700 1700 1043
Volume to Capacity 0.18 0.02 0.01 0.15
Queue Length 95th (ft) 0 0 0 13
Control Delay (s) 0.0 0.0 0.0 9.1
Lane LOS A
Approach Delay (s) 0.0 0.0 9.1
Approach LOS A
Intersection Summary
Average Delay 2.8
Intersection Capacity Utilization 19.0% ICU Level of Service A
Analysis Period (min) 15

HCM Unsignalized Intersection Capacity Analysis
3: Sahuarita Rd. & AZ-83 Page 1
Operations Year 5, 50% Carpool, Non-Peak Season, Weekend, AM Synchro 7 Report
Tetra Tech ISG 2/5/2010
Movement EBL EBR NBL NBT SBT SBR
Lane Configurations
Volume (veh/h) 36 19 5 202 154 19
Sign Control Yield Free Free
Grade 0% 0% 0%
Peak Hour Factor 0.92 0.92 0.92 0.92 0.92 0.92
Hourly flow rate (vph) 39 21 5 220 167 21
Pedestrians
Lane Width (ft)
Walking Speed (ft/s)
Percent Blockage
Right turn flare (veh)
Median type None None
Median storage veh)
Upstream signal (ft)
pX, platoon unblocked
vC, conflicting volume 408 178 188
vC1, stage 1 conf vol
vC2, stage 2 conf vol
vCu, unblocked vol 408 178 188
tC, single (s) 6.5 6.3 4.2
tC, 2 stage (s)
tF (s) 3.6 3.4 2.3
p0 queue free % 93 98 100
cM capacity (veh/h) 586 850 1351
Direction, Lane # EB 1 NB 1 SB 1
Volume Total 60 225 188
Volume Left 39 5 0
Volume Right 21 0 21
cSH 656 1351 1700
Volume to Capacity 0.09 0.00 0.11
Queue Length 95th (ft) 7 0 0
Control Delay (s) 11.0 0.2 0.0
Lane LOS B A
Approach Delay (s) 11.0 0.2 0.0
Approach LOS B
Intersection Summary
Average Delay 1.5
Intersection Capacity Utilization 24.7% ICU Level of Service A
Analysis Period (min) 15

HCM Unsignalized Intersection Capacity Analysis
4: Hilton Ranch Rd. & AZ-83 Page 2
Operations Year 5, 50% Carpool, Non-Peak Season, Weekend, AM Synchro 7 Report
Tetra Tech ISG 2/5/2010
Movement WBL WBR NBT NBR SBL SBT
Lane Configurations
Volume (veh/h) 0 19 171 0 2 181
Sign Control Yield Free Free
Grade 0% 0% 0%
Peak Hour Factor 0.92 0.92 0.92 0.92 0.92 0.92
Hourly flow rate (vph) 0 21 186 0 2 197
Pedestrians
Lane Width (ft)
Walking Speed (ft/s)
Percent Blockage
Right turn flare (veh)
Median type None None
Median storage veh)
Upstream signal (ft)
pX, platoon unblocked
vC, conflicting volume 387 186 186
vC1, stage 1 conf vol
vC2, stage 2 conf vol
vCu, unblocked vol 387 186 186
tC, single (s) 6.5 6.3 4.2
tC, 2 stage (s)
tF (s) 3.6 3.4 2.3
p0 queue free % 100 98 100
cM capacity (veh/h) 604 841 1353
Direction, Lane # WB 1 NB 1 SB 1
Volume Total 21 186 199
Volume Left 0 0 2
Volume Right 21 0 0
cSH 841 1700 1353
Volume to Capacity 0.02 0.11 0.00
Queue Length 95th (ft) 2 0 0
Control Delay (s) 9.4 0.0 0.1
Lane LOS A A
Approach Delay (s) 9.4 0.0 0.1
Approach LOS A
Intersection Summary
Average Delay 0.5
Intersection Capacity Utilization 21.1% ICU Level of Service A
Analysis Period (min) 15

HCM Unsignalized Intersection Capacity Analysis
5: Hidden Valley Rd. & AZ-83 Page 3
Operations Year 5, 50% Carpool, Non-Peak Season, Weekend, AM Synchro 7 Report
Tetra Tech ISG 2/5/2010
Movement EBL EBR NBL NBT SBT SBR
Lane Configurations
Volume (veh/h) 64 24 29 99 61 96
Sign Control Yield Free Free
Grade 0% 0% 0%
Peak Hour Factor 0.92 0.92 0.92 0.92 0.92 0.92
Hourly flow rate (vph) 70 26 32 108 66 104
Pedestrians
Lane Width (ft)
Walking Speed (ft/s)
Percent Blockage
Right turn flare (veh)
Median type None None
Median storage veh)
Upstream signal (ft)
pX, platoon unblocked
vC, conflicting volume 289 118 171
vC1, stage 1 conf vol
vC2, stage 2 conf vol
vCu, unblocked vol 289 118 171
tC, single (s) 6.5 6.3 4.2
tC, 2 stage (s)
tF (s) 3.6 3.4 2.3
p0 queue free % 90 97 98
cM capacity (veh/h) 673 917 1371
Direction, Lane # EB 1 NB 1 SB 1
Volume Total 96 139 171
Volume Left 70 32 0
Volume Right 26 0 104
cSH 726 1371 1700
Volume to Capacity 0.13 0.02 0.10
Queue Length 95th (ft) 11 2 0
Control Delay (s) 10.7 1.9 0.0
Lane LOS B A
Approach Delay (s) 10.7 1.9 0.0
Approach LOS B
Intersection Summary
Average Delay 3.2
Intersection Capacity Utilization 30.9% ICU Level of Service A
Analysis Period (min) 15

HCM Unsignalized Intersection Capacity Analysis
6: Rosemont Junction & AZ-83 Page 4
Operations Year 5, 50% Carpool, Non-Peak Season, Weekend, AM Synchro 7 Report
Tetra Tech ISG 2/5/2010
Movement EBL EBR NBL NBT SBT SBR
Lane Configurations
Volume (veh/h) 2 0 2 116 63 0
Sign Control Yield Free Free
Grade 0% 0% 0%
Peak Hour Factor 0.92 0.92 0.92 0.92 0.92 0.92
Hourly flow rate (vph) 2 0 2 126 68 0
Pedestrians
Lane Width (ft)
Walking Speed (ft/s)
Percent Blockage
Right turn flare (veh)
Median type None None
Median storage veh)
Upstream signal (ft)
pX, platoon unblocked
vC, conflicting volume 199 68 68
vC1, stage 1 conf vol
vC2, stage 2 conf vol
vCu, unblocked vol 199 68 68
tC, single (s) 6.5 6.3 4.2
tC, 2 stage (s)
tF (s) 3.6 3.4 2.3
p0 queue free % 100 100 100
cM capacity (veh/h) 775 978 1495
Direction, Lane # EB 1 NB 1 SB 1
Volume Total 2 128 68
Volume Left 2 2 0
Volume Right 0 0 0
cSH 775 1495 1700
Volume to Capacity 0.00 0.00 0.04
Queue Length 95th (ft) 0 0 0
Control Delay (s) 9.7 0.1 0.0
Lane LOS A A
Approach Delay (s) 9.7 0.1 0.0
Approach LOS A
Intersection Summary
Average Delay 0.2
Intersection Capacity Utilization 17.7% ICU Level of Service A
Analysis Period (min) 15

HCM Unsignalized Intersection Capacity Analysis
7: AZ-83 & Greaterville Rd. Page 5
Operations Year 5, 50% Carpool, Non-Peak Season, Weekend, AM Synchro 7 Report
Tetra Tech ISG 2/5/2010
Movement SET SER NWL NWT NEL NER
Lane Configurations
Volume (veh/h) 106 0 0 97 2 5
Sign Control Free Free Yield
Grade 0% 0% 0%
Peak Hour Factor 0.92 0.92 0.92 0.92 0.92 0.92
Hourly flow rate (vph) 115 0 0 105 2 5
Pedestrians
Lane Width (ft)
Walking Speed (ft/s)
Percent Blockage
Right turn flare (veh)
Median type None None
Median storage veh)
Upstream signal (ft)
pX, platoon unblocked
vC, conflicting volume 115 221 115
vC1, stage 1 conf vol
vC2, stage 2 conf vol
vCu, unblocked vol 115 221 115
tC, single (s) 4.2 6.5 6.3
tC, 2 stage (s)
tF (s) 2.3 3.6 3.4
p0 queue free % 100 100 99
cM capacity (veh/h) 1437 754 921
Direction, Lane # SE 1 NW 1 NE 1
Volume Total 115 105 8
Volume Left 0 0 2
Volume Right 0 0 5
cSH 1700 1437 866
Volume to Capacity 0.07 0.00 0.01
Queue Length 95th (ft) 0 0 1
Control Delay (s) 0.0 0.0 9.2
Lane LOS A
Approach Delay (s) 0.0 0.0 9.2
Approach LOS A
Intersection Summary
Average Delay 0.3
Intersection Capacity Utilization 15.6% ICU Level of Service A
Analysis Period (min) 15

HCM Unsignalized Intersection Capacity Analysis
1: I-10 WB On-Off Ramp & AZ-83 Page 1
Operations Year 5, 50% Carpool, Non-Peak Season, Weekend, PM Synchro 7 Report
Tetra Tech ISG 2/5/2010
Movement EBL EBT WBT WBR SBL SBR
Lane Configurations
Volume (veh/h) 25 59 100 5 12 8
Sign Control Free Free Yield
Grade 0% 0% 0%
Peak Hour Factor 0.92 0.92 0.92 0.92 0.92 0.92
Hourly flow rate (vph) 27 64 109 5 13 9
Pedestrians
Lane Width (ft)
Walking Speed (ft/s)
Percent Blockage
Right turn flare (veh)
Median type None None
Median storage veh)
Upstream signal (ft)
pX, platoon unblocked
vC, conflicting volume 114 230 111
vC1, stage 1 conf vol
vC2, stage 2 conf vol
vCu, unblocked vol 114 230 111
tC, single (s) 4.2 6.5 6.3
tC, 2 stage (s)
tF (s) 2.3 3.6 3.4
p0 queue free % 98 98 99
cM capacity (veh/h) 1438 731 926
Direction, Lane # EB 1 WB 1 SB 1
Volume Total 91 114 22
Volume Left 27 0 13
Volume Right 0 5 9
cSH 1438 1700 798
Volume to Capacity 0.02 0.07 0.03
Queue Length 95th (ft) 1 0 2
Control Delay (s) 2.4 0.0 9.6
Lane LOS A A
Approach Delay (s) 2.4 0.0 9.6
Approach LOS A
Intersection Summary
Average Delay 1.9
Intersection Capacity Utilization 21.2% ICU Level of Service A
Analysis Period (min) 15

HCM Unsignalized Intersection Capacity Analysis
2: AZ-83 & EB Off-Ramp Page 2
Operations Year 5, 50% Carpool, Non-Peak Season, Weekend, PM Synchro 7 Report
Tetra Tech ISG 2/5/2010
Movement NBL NBT NBR SBL SBT SBR SEL SER SWL SWR
Lane Configurations
Volume (veh/h) 0 187 39 0 78 0 0 285 0 0
Sign Control Free Free Yield Yield
Grade 0% 0% 0% 0%
Peak Hour Factor 0.92 0.92 0.92 0.92 0.92 0.92 0.92 0.92 0.92 0.92
Hourly flow rate (vph) 0 203 42 0 85 0 0 310 0 0
Pedestrians
Lane Width (ft)
Walking Speed (ft/s)
Percent Blockage
Right turn flare (veh)
Median type None None
Median storage veh)
Upstream signal (ft)
pX, platoon unblocked
vC, conflicting volume 85 246 330 85 598 288
vC1, stage 1 conf vol
vC2, stage 2 conf vol
vCu, unblocked vol 85 246 330 85 598 288
tC, single (s) 4.2 4.2 6.6 6.3 7.2 6.6
tC, 2 stage (s)
tF (s) 2.3 2.3 4.1 3.4 3.6 4.1
p0 queue free % 100 100 100 68 100 100
cM capacity (veh/h) 1475 1286 579 958 274 612
Direction, Lane # NB 1 NB 2 SB 1 SE 1
Volume Total 203 42 85 310
Volume Left 0 0 0 0
Volume Right 0 42 0 310
cSH 1700 1700 1700 958
Volume to Capacity 0.12 0.02 0.05 0.32
Queue Length 95th (ft) 0 0 0 35
Control Delay (s) 0.0 0.0 0.0 10.5
Lane LOS B
Approach Delay (s) 0.0 0.0 10.5
Approach LOS B
Intersection Summary
Average Delay 5.1
Intersection Capacity Utilization 28.4% ICU Level of Service A
Analysis Period (min) 15

HCM Unsignalized Intersection Capacity Analysis
3: Sahuarita Rd. & AZ-83 Page 1
Operations Year 5, 50% Carpool, Non-Peak Season, Weekend, PM Synchro 7 Report
Tetra Tech ISG 2/5/2010
Movement EBL EBR NBL NBT SBT SBR
Lane Configurations
Volume (veh/h) 39 15 56 220 132 17
Sign Control Yield Free Free
Grade 0% 0% 0%
Peak Hour Factor 0.92 0.92 0.92 0.92 0.92 0.92
Hourly flow rate (vph) 42 16 61 239 143 18
Pedestrians
Lane Width (ft)
Walking Speed (ft/s)
Percent Blockage
Right turn flare (veh)
Median type None None
Median storage veh)
Upstream signal (ft)
pX, platoon unblocked
vC, conflicting volume 514 153 162
vC1, stage 1 conf vol
vC2, stage 2 conf vol
vCu, unblocked vol 514 153 162
tC, single (s) 6.5 6.3 4.2
tC, 2 stage (s)
tF (s) 3.6 3.4 2.3
p0 queue free % 91 98 96
cM capacity (veh/h) 488 878 1381
Direction, Lane # EB 1 NB 1 SB 1
Volume Total 59 300 162
Volume Left 42 61 0
Volume Right 16 0 18
cSH 557 1381 1700
Volume to Capacity 0.11 0.04 0.10
Queue Length 95th (ft) 9 3 0
Control Delay (s) 12.2 1.9 0.0
Lane LOS B A
Approach Delay (s) 12.2 1.9 0.0
Approach LOS B
Intersection Summary
Average Delay 2.5
Intersection Capacity Utilization 36.0% ICU Level of Service A
Analysis Period (min) 15

HCM Unsignalized Intersection Capacity Analysis
4: Hilton Ranch Rd. & AZ-83 Page 2
Operations Year 5, 50% Carpool, Non-Peak Season, Weekend, PM Synchro 7 Report
Tetra Tech ISG 2/5/2010
Movement WBL WBR NBT NBR SBL SBT
Lane Configurations
Volume (veh/h) 0 2 205 7 2 135
Sign Control Yield Free Free
Grade 0% 0% 0%
Peak Hour Factor 0.92 0.92 0.92 0.92 0.92 0.92
Hourly flow rate (vph) 0 2 223 8 2 147
Pedestrians
Lane Width (ft)
Walking Speed (ft/s)
Percent Blockage
Right turn flare (veh)
Median type None None
Median storage veh)
Upstream signal (ft)
pX, platoon unblocked
vC, conflicting volume 378 227 230
vC1, stage 1 conf vol
vC2, stage 2 conf vol
vCu, unblocked vol 378 227 230
tC, single (s) 6.5 6.3 4.2
tC, 2 stage (s)
tF (s) 3.6 3.4 2.3
p0 queue free % 100 100 100
cM capacity (veh/h) 611 798 1303
Direction, Lane # WB 1 NB 1 SB 1
Volume Total 2 230 149
Volume Left 0 0 2
Volume Right 2 8 0
cSH 798 1700 1303
Volume to Capacity 0.00 0.14 0.00
Queue Length 95th (ft) 0 0 0
Control Delay (s) 9.5 0.0 0.1
Lane LOS A A
Approach Delay (s) 9.5 0.0 0.1
Approach LOS A
Intersection Summary
Average Delay 0.1
Intersection Capacity Utilization 21.2% ICU Level of Service A
Analysis Period (min) 15

HCM Unsignalized Intersection Capacity Analysis
5: Hidden Valley Rd. & AZ-83 Page 3
Operations Year 5, 50% Carpool, Non-Peak Season, Weekend, PM Synchro 7 Report
Tetra Tech ISG 2/5/2010
Movement EBL EBR NBL NBT SBT SBR
Lane Configurations
Volume (veh/h) 94 129 21 99 44 64
Sign Control Yield Free Free
Grade 0% 0% 0%
Peak Hour Factor 0.92 0.92 0.92 0.92 0.92 0.92
Hourly flow rate (vph) 102 140 23 108 48 70
Pedestrians
Lane Width (ft)
Walking Speed (ft/s)
Percent Blockage
Right turn flare (veh)
Median type None None
Median storage veh)
Upstream signal (ft)
pX, platoon unblocked
vC, conflicting volume 236 83 117
vC1, stage 1 conf vol
vC2, stage 2 conf vol
vCu, unblocked vol 236 83 117
tC, single (s) 6.5 6.3 4.2
tC, 2 stage (s)
tF (s) 3.6 3.4 2.3
p0 queue free % 86 85 98
cM capacity (veh/h) 728 961 1434
Direction, Lane # EB 1 NB 1 SB 1
Volume Total 242 130 117
Volume Left 102 23 0
Volume Right 140 0 70
cSH 846 1434 1700
Volume to Capacity 0.29 0.02 0.07
Queue Length 95th (ft) 30 1 0
Control Delay (s) 11.0 1.4 0.0
Lane LOS B A
Approach Delay (s) 11.0 1.4 0.0
Approach LOS B
Intersection Summary
Average Delay 5.8
Intersection Capacity Utilization 32.8% ICU Level of Service A
Analysis Period (min) 15

HCM Unsignalized Intersection Capacity Analysis
6: Rosemont Junction & AZ-83 Page 4
Operations Year 5, 50% Carpool, Non-Peak Season, Weekend, PM Synchro 7 Report
Tetra Tech ISG 2/5/2010
Movement EBL EBR NBL NBT SBT SBR
Lane Configurations
Volume (veh/h) 0 0 0 130 90 0
Sign Control Yield Free Free
Grade 0% 0% 0%
Peak Hour Factor 0.92 0.92 0.92 0.92 0.92 0.92
Hourly flow rate (vph) 0 0 0 141 98 0
Pedestrians
Lane Width (ft)
Walking Speed (ft/s)
Percent Blockage
Right turn flare (veh)
Median type None None
Median storage veh)
Upstream signal (ft)
pX, platoon unblocked
vC, conflicting volume 239 98 98
vC1, stage 1 conf vol
vC2, stage 2 conf vol
vCu, unblocked vol 239 98 98
tC, single (s) 6.5 6.3 4.2
tC, 2 stage (s)
tF (s) 3.6 3.4 2.3
p0 queue free % 100 100 100
cM capacity (veh/h) 736 942 1458
Direction, Lane # EB 1 NB 1 SB 1
Volume Total 0 141 98
Volume Left 0 0 0
Volume Right 0 0 0
cSH 1700 1458 1700
Volume to Capacity 0.00 0.00 0.06
Queue Length 95th (ft) 0 0 0
Control Delay (s) 0.0 0.0 0.0
Lane LOS A
Approach Delay (s) 0.0 0.0 0.0
Approach LOS A
Intersection Summary
Average Delay 0.0
Intersection Capacity Utilization 10.2% ICU Level of Service A
Analysis Period (min) 15

HCM Unsignalized Intersection Capacity Analysis
7: AZ-83 & Greaterville Rd. Page 5
Operations Year 5, 50% Carpool, Non-Peak Season, Weekend, PM Synchro 7 Report
Tetra Tech ISG 2/5/2010
Movement SET SER NWL NWT NEL NER
Lane Configurations
Volume (veh/h) 136 5 7 147 2 5
Sign Control Free Free Yield
Grade 0% 0% 0%
Peak Hour Factor 0.92 0.92 0.92 0.92 0.92 0.92
Hourly flow rate (vph) 148 5 8 160 2 5
Pedestrians
Lane Width (ft)
Walking Speed (ft/s)
Percent Blockage
Right turn flare (veh)
Median type None None
Median storage veh)
Upstream signal (ft)
pX, platoon unblocked
vC, conflicting volume 153 326 151
vC1, stage 1 conf vol
vC2, stage 2 conf vol
vCu, unblocked vol 153 326 151
tC, single (s) 4.2 6.5 6.3
tC, 2 stage (s)
tF (s) 2.3 3.6 3.4
p0 queue free % 99 100 99
cM capacity (veh/h) 1391 653 880
Direction, Lane # SE 1 NW 1 NE 1
Volume Total 153 167 8
Volume Left 0 8 2
Volume Right 5 0 5
cSH 1700 1391 801
Volume to Capacity 0.09 0.01 0.01
Queue Length 95th (ft) 0 0 1
Control Delay (s) 0.0 0.4 9.5
Lane LOS A A
Approach Delay (s) 0.0 0.4 9.5
Approach LOS A
Intersection Summary
Average Delay 0.4
Intersection Capacity Utilization 23.4% ICU Level of Service A
Analysis Period (min) 15

PEAK SEASON
SCENARIO 4
50% CARPOOL

HCM Unsignalized Intersection Capacity Analysis
1: I-10 WB On-Off Ramp & AZ-83 Page 1
Operations Year 5, 50% Carpool, Peak Season, Weekday, PM Synchro 7 Report
Tetra Tech ISG 2/5/2010
Movement EBL EBT WBT WBR SBL SBR
Lane Configurations
Volume (veh/h) 8 49 436 4 11 29
Sign Control Free Free Yield
Grade 0% 0% 0%
Peak Hour Factor 0.92 0.92 0.92 0.92 0.92 0.92
Hourly flow rate (vph) 9 53 474 4 12 32
Pedestrians
Lane Width (ft)
Walking Speed (ft/s)
Percent Blockage
Right turn flare (veh)
Median type None None
Median storage veh)
Upstream signal (ft)
pX, platoon unblocked
vC, conflicting volume 478 547 476
vC1, stage 1 conf vol
vC2, stage 2 conf vol
vCu, unblocked vol 478 547 476
tC, single (s) 4.2 6.5 6.3
tC, 2 stage (s)
tF (s) 2.3 3.6 3.4
p0 queue free % 99 98 95
cM capacity (veh/h) 1053 484 577
Direction, Lane # EB 1 WB 1 SB 1
Volume Total 62 478 43
Volume Left 9 0 12
Volume Right 0 4 32
cSH 1053 1700 548
Volume to Capacity 0.01 0.28 0.08
Queue Length 95th (ft) 1 0 6
Control Delay (s) 1.2 0.0 12.1
Lane LOS A B
Approach Delay (s) 1.2 0.0 12.1
Approach LOS B
Intersection Summary
Average Delay 1.0
Intersection Capacity Utilization 33.2% ICU Level of Service A
Analysis Period (min) 15

HCM Unsignalized Intersection Capacity Analysis
2: AZ-83 & EB Off-Ramp Page 2
Operations Year 5, 50% Carpool, Peak Season, Weekday, PM Synchro 7 Report
Tetra Tech ISG 2/5/2010
Movement NBL NBT NBR SBL SBT SBR SEL SER SWL SWR
Lane Configurations
Volume (veh/h) 0 293 28 0 28 0 0 215 0 0
Sign Control Free Free Yield Yield
Grade 0% 0% 0% 0%
Peak Hour Factor 0.92 0.92 0.92 0.92 0.92 0.92 0.92 0.92 0.92 0.92
Hourly flow rate (vph) 0 318 30 0 30 0 0 234 0 0
Pedestrians
Lane Width (ft)
Walking Speed (ft/s)
Percent Blockage
Right turn flare (veh)
Median type None None
Median storage veh)
Upstream signal (ft)
pX, platoon unblocked
vC, conflicting volume 30 349 379 30 583 349
vC1, stage 1 conf vol
vC2, stage 2 conf vol
vCu, unblocked vol 30 349 379 30 583 349
tC, single (s) 4.2 4.2 6.6 6.3 7.2 6.6
tC, 2 stage (s)
tF (s) 2.3 2.3 4.1 3.4 3.6 4.1
p0 queue free % 100 100 100 77 100 100
cM capacity (veh/h) 1544 1177 544 1027 321 565
Direction, Lane # NB 1 NB 2 SB 1 SE 1
Volume Total 318 30 30 234
Volume Left 0 0 0 0
Volume Right 0 30 0 234
cSH 1700 1700 1700 1027
Volume to Capacity 0.19 0.02 0.02 0.23
Queue Length 95th (ft) 0 0 0 22
Control Delay (s) 0.0 0.0 0.0 9.5
Lane LOS A
Approach Delay (s) 0.0 0.0 9.5
Approach LOS A
Intersection Summary
Average Delay 3.6
Intersection Capacity Utilization 23.3% ICU Level of Service A
Analysis Period (min) 15

HCM Unsignalized Intersection Capacity Analysis
3: Sahuarita Rd. & AZ-83 Page 1
Operations Year 5, 50% Carpool, Peak Season, Weekday, AM Synchro 7 Report
Tetra Tech ISG 2/5/2010
Movement EBL EBR NBL NBT SBT SBR
Lane Configurations
Volume (veh/h) 41 19 5 205 202 27
Sign Control Yield Free Free
Grade 0% 0% 0%
Peak Hour Factor 0.92 0.92 0.92 0.92 0.92 0.92
Hourly flow rate (vph) 45 21 5 223 220 29
Pedestrians
Lane Width (ft)
Walking Speed (ft/s)
Percent Blockage
Right turn flare (veh)
Median type None None
Median storage veh)
Upstream signal (ft)
pX, platoon unblocked
vC, conflicting volume 468 234 249
vC1, stage 1 conf vol
vC2, stage 2 conf vol
vCu, unblocked vol 468 234 249
tC, single (s) 6.5 6.3 4.2
tC, 2 stage (s)
tF (s) 3.6 3.4 2.3
p0 queue free % 92 97 100
cM capacity (veh/h) 540 790 1282
Direction, Lane # EB 1 NB 1 SB 1
Volume Total 65 228 249
Volume Left 45 5 0
Volume Right 21 0 29
cSH 600 1282 1700
Volume to Capacity 0.11 0.00 0.15
Queue Length 95th (ft) 9 0 0
Control Delay (s) 11.7 0.2 0.0
Lane LOS B A
Approach Delay (s) 11.7 0.2 0.0
Approach LOS B
Intersection Summary
Average Delay 1.5
Intersection Capacity Utilization 24.9% ICU Level of Service A
Analysis Period (min) 15

HCM Unsignalized Intersection Capacity Analysis
4: Hilton Ranch Rd. & AZ-83 Page 2
Operations Year 5, 50% Carpool, Peak Season, Weekday, AM Synchro 7 Report
Tetra Tech ISG 2/5/2010
Movement WBL WBR NBT NBR SBL SBT
Lane Configurations
Volume (veh/h) 0 12 118 0 5 216
Sign Control Yield Free Free
Grade 0% 0% 0%
Peak Hour Factor 0.92 0.92 0.92 0.92 0.92 0.92
Hourly flow rate (vph) 0 13 128 0 5 235
Pedestrians
Lane Width (ft)
Walking Speed (ft/s)
Percent Blockage
Right turn flare (veh)
Median type None None
Median storage veh)
Upstream signal (ft)
pX, platoon unblocked
vC, conflicting volume 374 128 128
vC1, stage 1 conf vol
vC2, stage 2 conf vol
vCu, unblocked vol 374 128 128
tC, single (s) 6.5 6.3 4.2
tC, 2 stage (s)
tF (s) 3.6 3.4 2.3
p0 queue free % 100 99 100
cM capacity (veh/h) 613 906 1421
Direction, Lane # WB 1 NB 1 SB 1
Volume Total 13 128 240
Volume Left 0 0 5
Volume Right 13 0 0
cSH 906 1700 1421
Volume to Capacity 0.01 0.08 0.00
Queue Length 95th (ft) 1 0 0
Control Delay (s) 9.0 0.0 0.2
Lane LOS A A
Approach Delay (s) 9.0 0.0 0.2
Approach LOS A
Intersection Summary
Average Delay 0.4
Intersection Capacity Utilization 25.4% ICU Level of Service A
Analysis Period (min) 15

HCM Unsignalized Intersection Capacity Analysis
5: Hidden Valley Rd. & AZ-83 Page 3
Operations Year 5, 50% Carpool, Peak Season, Weekday, AM Synchro 7 Report
Tetra Tech ISG 2/5/2010
Movement EBL EBR NBL NBT SBT SBR
Lane Configurations
Volume (veh/h) 64 24 51 75 48 156
Sign Control Yield Free Free
Grade 0% 0% 0%
Peak Hour Factor 0.92 0.92 0.92 0.92 0.92 0.92
Hourly flow rate (vph) 70 26 55 82 52 170
Pedestrians
Lane Width (ft)
Walking Speed (ft/s)
Percent Blockage
Right turn flare (veh)
Median type None None
Median storage veh)
Upstream signal (ft)
pX, platoon unblocked
vC, conflicting volume 329 137 222
vC1, stage 1 conf vol
vC2, stage 2 conf vol
vCu, unblocked vol 329 137 222
tC, single (s) 6.5 6.3 4.2
tC, 2 stage (s)
tF (s) 3.6 3.4 2.3
p0 queue free % 89 97 96
cM capacity (veh/h) 625 896 1313
Direction, Lane # EB 1 NB 1 SB 1
Volume Total 96 137 222
Volume Left 70 55 0
Volume Right 26 0 170
cSH 682 1313 1700
Volume to Capacity 0.14 0.04 0.13
Queue Length 95th (ft) 12 3 0
Control Delay (s) 11.1 3.4 0.0
Lane LOS B A
Approach Delay (s) 11.1 3.4 0.0
Approach LOS B
Intersection Summary
Average Delay 3.4
Intersection Capacity Utilization 33.9% ICU Level of Service A
Analysis Period (min) 15

HCM Unsignalized Intersection Capacity Analysis
6: Rosemont Junction & AZ-83 Page 4
Operations Year 5, 50% Carpool, Peak Season, Weekday, AM Synchro 7 Report
Tetra Tech ISG 2/5/2010
Movement EBL EBR NBL NBT SBT SBR
Lane Configurations
Volume (veh/h) 2 2 2 148 89 0
Sign Control Yield Free Free
Grade 0% 0% 0%
Peak Hour Factor 0.92 0.92 0.92 0.92 0.92 0.92
Hourly flow rate (vph) 2 2 2 161 97 0
Pedestrians
Lane Width (ft)
Walking Speed (ft/s)
Percent Blockage
Right turn flare (veh)
Median type None None
Median storage veh)
Upstream signal (ft)
pX, platoon unblocked
vC, conflicting volume 262 97 97
vC1, stage 1 conf vol
vC2, stage 2 conf vol
vCu, unblocked vol 262 97 97
tC, single (s) 6.5 6.3 4.2
tC, 2 stage (s)
tF (s) 3.6 3.4 2.3
p0 queue free % 100 100 100
cM capacity (veh/h) 713 943 1460
Direction, Lane # EB 1 NB 1 SB 1
Volume Total 4 163 97
Volume Left 2 2 0
Volume Right 2 0 0
cSH 812 1460 1700
Volume to Capacity 0.01 0.00 0.06
Queue Length 95th (ft) 0 0 0
Control Delay (s) 9.5 0.1 0.0
Lane LOS A A
Approach Delay (s) 9.5 0.1 0.0
Approach LOS A
Intersection Summary
Average Delay 0.2
Intersection Capacity Utilization 19.4% ICU Level of Service A
Analysis Period (min) 15

HCM Unsignalized Intersection Capacity Analysis
7: AZ-83 & Greaterville Rd. Page 5
Operations Year 5, 50% Carpool, Peak Season, Weekday, AM Synchro 7 Report
Tetra Tech ISG 2/5/2010
Movement SET SER NWL NWT NEL NER
Lane Configurations
Volume (veh/h) 75 2 0 131 2 0
Sign Control Free Free Yield
Grade 0% 0% 0%
Peak Hour Factor 0.92 0.92 0.92 0.92 0.92 0.92
Hourly flow rate (vph) 82 2 0 142 2 0
Pedestrians
Lane Width (ft)
Walking Speed (ft/s)
Percent Blockage
Right turn flare (veh)
Median type None None
Median storage veh)
Upstream signal (ft)
pX, platoon unblocked
vC, conflicting volume 84 225 83
vC1, stage 1 conf vol
vC2, stage 2 conf vol
vCu, unblocked vol 84 225 83
tC, single (s) 4.2 6.5 6.3
tC, 2 stage (s)
tF (s) 2.3 3.6 3.4
p0 queue free % 100 100 100
cM capacity (veh/h) 1476 750 961
Direction, Lane # SE 1 NW 1 NE 1
Volume Total 84 142 2
Volume Left 0 0 2
Volume Right 2 0 0
cSH 1700 1476 750
Volume to Capacity 0.05 0.00 0.00
Queue Length 95th (ft) 0 0 0
Control Delay (s) 0.0 0.0 9.8
Lane LOS A
Approach Delay (s) 0.0 0.0 9.8
Approach LOS A
Intersection Summary
Average Delay 0.1
Intersection Capacity Utilization 16.9% ICU Level of Service A
Analysis Period (min) 15

HCM Unsignalized Intersection Capacity Analysis
1: I-10 WB On-Off Ramp & AZ-83 Page 1
Operations Year 5, 50% Carpool, Peak Season, Weekday, PM Synchro 7 Report
Tetra Tech ISG 2/6/2010
Movement EBL EBT WBT WBR SBL SBR
Lane Configurations
Volume (veh/h) 23 64 189 6 8 7
Sign Control Free Free Yield
Grade 0% 0% 0%
Peak Hour Factor 0.92 0.92 0.92 0.92 0.92 0.92
Hourly flow rate (vph) 25 70 205 7 9 8
Pedestrians
Lane Width (ft)
Walking Speed (ft/s)
Percent Blockage
Right turn flare (veh)
Median type None None
Median storage veh)
Upstream signal (ft)
pX, platoon unblocked
vC, conflicting volume 212 328 209
vC1, stage 1 conf vol
vC2, stage 2 conf vol
vCu, unblocked vol 212 328 209
tC, single (s) 4.2 6.5 6.3
tC, 2 stage (s)
tF (s) 2.3 3.6 3.4
p0 queue free % 98 99 99
cM capacity (veh/h) 1335 646 822
Direction, Lane # EB 1 WB 1 SB 1
Volume Total 95 212 16
Volume Left 25 0 9
Volume Right 0 7 8
cSH 1335 1700 717
Volume to Capacity 0.02 0.12 0.02
Queue Length 95th (ft) 1 0 2
Control Delay (s) 2.2 0.0 10.1
Lane LOS A B
Approach Delay (s) 2.2 0.0 10.1
Approach LOS B
Intersection Summary
Average Delay 1.1
Intersection Capacity Utilization 28.3% ICU Level of Service A
Analysis Period (min) 15

HCM Unsignalized Intersection Capacity Analysis
2: AZ-83 & EB Off-Ramp Page 2
Operations Year 5, 50% Carpool, Peak Season, Weekday, PM Synchro 7 Report
Tetra Tech ISG 2/6/2010
Movement NBL NBT NBR SBL SBT SBR SEL SER SWL SWR
Lane Configurations
Volume (veh/h) 0 270 42 0 59 0 0 119 0 0
Sign Control Free Free Yield Yield
Grade 0% 0% 0% 0%
Peak Hour Factor 0.92 0.92 0.92 0.92 0.92 0.92 0.92 0.92 0.92 0.92
Hourly flow rate (vph) 0 293 46 0 64 0 0 129 0 0
Pedestrians
Lane Width (ft)
Walking Speed (ft/s)
Percent Blockage
Right turn flare (veh)
Median type None None
Median storage veh)
Upstream signal (ft)
pX, platoon unblocked
vC, conflicting volume 64 339 403 64 487 358
vC1, stage 1 conf vol
vC2, stage 2 conf vol
vCu, unblocked vol 64 339 403 64 487 358
tC, single (s) 4.2 4.2 6.6 6.3 7.2 6.6
tC, 2 stage (s)
tF (s) 2.3 2.3 4.1 3.4 3.6 4.1
p0 queue free % 100 100 100 87 100 100
cM capacity (veh/h) 1513 1198 530 989 421 562
Direction, Lane # NB 1 NB 2 SB 1 SE 1
Volume Total 293 46 64 129
Volume Left 0 0 0 0
Volume Right 0 46 0 129
cSH 1700 1700 1700 989
Volume to Capacity 0.17 0.03 0.04 0.13
Queue Length 95th (ft) 0 0 0 11
Control Delay (s) 0.0 0.0 0.0 9.2
Lane LOS A
Approach Delay (s) 0.0 0.0 9.2
Approach LOS A
Intersection Summary
Average Delay 2.2
Intersection Capacity Utilization 17.5% ICU Level of Service A
Analysis Period (min) 15

HCM Unsignalized Intersection Capacity Analysis
3: Sahuarita Rd. & AZ-83 Page 1
Operations Year 5, 50% Carpool, Peak Season, Weekday, PM Synchro 7 Report
Tetra Tech ISG 2/5/2010
Movement EBL EBR NBL NBT SBT SBR
Lane Configurations
Volume (veh/h) 22 15 34 255 222 48
Sign Control Yield Free Free
Grade 0% 0% 0%
Peak Hour Factor 0.92 0.92 0.92 0.92 0.92 0.92
Hourly flow rate (vph) 24 16 37 277 241 52
Pedestrians
Lane Width (ft)
Walking Speed (ft/s)
Percent Blockage
Right turn flare (veh)
Median type None None
Median storage veh)
Upstream signal (ft)
pX, platoon unblocked
vC, conflicting volume 618 267 293
vC1, stage 1 conf vol
vC2, stage 2 conf vol
vCu, unblocked vol 618 267 293
tC, single (s) 6.5 6.3 4.2
tC, 2 stage (s)
tF (s) 3.6 3.4 2.3
p0 queue free % 94 98 97
cM capacity (veh/h) 430 757 1235
Direction, Lane # EB 1 NB 1 SB 1
Volume Total 40 314 293
Volume Left 24 37 0
Volume Right 16 0 52
cSH 521 1235 1700
Volume to Capacity 0.08 0.03 0.17
Queue Length 95th (ft) 6 2 0
Control Delay (s) 12.5 1.2 0.0
Lane LOS B A
Approach Delay (s) 12.5 1.2 0.0
Approach LOS B
Intersection Summary
Average Delay 1.4
Intersection Capacity Utilization 43.2% ICU Level of Service A
Analysis Period (min) 15

HCM Unsignalized Intersection Capacity Analysis
4: Hilton Ranch Rd. & AZ-83 Page 2
Operations Year 5, 50% Carpool, Peak Season, Weekday, PM Synchro 7 Report
Tetra Tech ISG 2/5/2010
Movement WBL WBR NBT NBR SBL SBT
Lane Configurations
Volume (veh/h) 0 5 270 2 19 156
Sign Control Yield Free Free
Grade 0% 0% 0%
Peak Hour Factor 0.92 0.92 0.92 0.92 0.92 0.92
Hourly flow rate (vph) 0 5 293 2 21 170
Pedestrians
Lane Width (ft)
Walking Speed (ft/s)
Percent Blockage
Right turn flare (veh)
Median type None None
Median storage veh)
Upstream signal (ft)
pX, platoon unblocked
vC, conflicting volume 505 295 296
vC1, stage 1 conf vol
vC2, stage 2 conf vol
vCu, unblocked vol 505 295 296
tC, single (s) 6.5 6.3 4.2
tC, 2 stage (s)
tF (s) 3.6 3.4 2.3
p0 queue free % 100 99 98
cM capacity (veh/h) 507 731 1232
Direction, Lane # WB 1 NB 1 SB 1
Volume Total 5 296 190
Volume Left 0 0 21
Volume Right 5 2 0
cSH 731 1700 1232
Volume to Capacity 0.01 0.17 0.02
Queue Length 95th (ft) 1 0 1
Control Delay (s) 10.0 0.0 1.0
Lane LOS A A
Approach Delay (s) 10.0 0.0 1.0
Approach LOS A
Intersection Summary
Average Delay 0.5
Intersection Capacity Utilization 34.1% ICU Level of Service A
Analysis Period (min) 15

HCM Unsignalized Intersection Capacity Analysis
5: Hidden Valley Rd. & AZ-83 Page 3
Operations Year 5, 50% Carpool, Peak Season, Weekday, PM Synchro 7 Report
Tetra Tech ISG 2/5/2010
Movement EBL EBR NBL NBT SBT SBR
Lane Configurations
Volume (veh/h) 156 53 21 111 119 64
Sign Control Yield Free Free
Grade 0% 0% 0%
Peak Hour Factor 0.92 0.92 0.92 0.92 0.92 0.92
Hourly flow rate (vph) 170 58 23 121 129 70
Pedestrians
Lane Width (ft)
Walking Speed (ft/s)
Percent Blockage
Right turn flare (veh)
Median type None None
Median storage veh)
Upstream signal (ft)
pX, platoon unblocked
vC, conflicting volume 330 164 199
vC1, stage 1 conf vol
vC2, stage 2 conf vol
vCu, unblocked vol 330 164 199
tC, single (s) 6.5 6.3 4.2
tC, 2 stage (s)
tF (s) 3.6 3.4 2.3
p0 queue free % 74 93 98
cM capacity (veh/h) 641 865 1338
Direction, Lane # EB 1 NB 1 SB 1
Volume Total 227 143 199
Volume Left 170 23 0
Volume Right 58 0 70
cSH 686 1338 1700
Volume to Capacity 0.33 0.02 0.12
Queue Length 95th (ft) 36 1 0
Control Delay (s) 12.8 1.4 0.0
Lane LOS B A
Approach Delay (s) 12.8 1.4 0.0
Approach LOS B
Intersection Summary
Average Delay 5.5
Intersection Capacity Utilization 39.0% ICU Level of Service A
Analysis Period (min) 15

HCM Unsignalized Intersection Capacity Analysis
6: Rosemont Junction & AZ-83 Page 4
Operations Year 5, 50% Carpool, Peak Season, Weekday, PM Synchro 7 Report
Tetra Tech ISG 2/5/2010
Movement EBL EBR NBL NBT SBT SBR
Lane Configurations
Volume (veh/h) 0 0 0 128 201 0
Sign Control Yield Free Free
Grade 0% 0% 0%
Peak Hour Factor 0.92 0.92 0.92 0.92 0.92 0.92
Hourly flow rate (vph) 0 0 0 139 218 0
Pedestrians
Lane Width (ft)
Walking Speed (ft/s)
Percent Blockage
Right turn flare (veh)
Median type None None
Median storage veh)
Upstream signal (ft)
pX, platoon unblocked
vC, conflicting volume 358 218 218
vC1, stage 1 conf vol
vC2, stage 2 conf vol
vCu, unblocked vol 358 218 218
tC, single (s) 6.5 6.3 4.2
tC, 2 stage (s)
tF (s) 3.6 3.4 2.3
p0 queue free % 100 100 100
cM capacity (veh/h) 629 806 1316
Direction, Lane # EB 1 NB 1 SB 1
Volume Total 0 139 218
Volume Left 0 0 0
Volume Right 0 0 0
cSH 1700 1316 1700
Volume to Capacity 0.00 0.00 0.13
Queue Length 95th (ft) 0 0 0
Control Delay (s) 0.0 0.0 0.0
Lane LOS A
Approach Delay (s) 0.0 0.0 0.0
Approach LOS A
Intersection Summary
Average Delay 0.0
Intersection Capacity Utilization 13.9% ICU Level of Service A
Analysis Period (min) 15

HCM Unsignalized Intersection Capacity Analysis
7: AZ-83 & Greaterville Rd. Page 5
Operations Year 5, 50% Carpool, Peak Season, Weekday, PM Synchro 7 Report
Tetra Tech ISG 2/5/2010
Movement SET SER NWL NWT NEL NER
Lane Configurations
Volume (veh/h) 177 2 5 89 2 0
Sign Control Free Free Yield
Grade 0% 0% 0%
Peak Hour Factor 0.92 0.92 0.92 0.92 0.92 0.92
Hourly flow rate (vph) 192 2 5 97 2 0
Pedestrians
Lane Width (ft)
Walking Speed (ft/s)
Percent Blockage
Right turn flare (veh)
Median type None None
Median storage veh)
Upstream signal (ft)
pX, platoon unblocked
vC, conflicting volume 195 301 193
vC1, stage 1 conf vol
vC2, stage 2 conf vol
vCu, unblocked vol 195 301 193
tC, single (s) 4.2 6.5 6.3
tC, 2 stage (s)
tF (s) 2.3 3.6 3.4
p0 queue free % 100 100 100
cM capacity (veh/h) 1343 675 833
Direction, Lane # SE 1 NW 1 NE 1
Volume Total 195 102 2
Volume Left 0 5 2
Volume Right 2 0 0
cSH 1700 1343 675
Volume to Capacity 0.11 0.00 0.00
Queue Length 95th (ft) 0 0 0
Control Delay (s) 0.0 0.4 10.3
Lane LOS A B
Approach Delay (s) 0.0 0.4 10.3
Approach LOS B
Intersection Summary
Average Delay 0.2
Intersection Capacity Utilization 19.4% ICU Level of Service A
Analysis Period (min) 15

HCM Unsignalized Intersection Capacity Analysis
1: I-10 WB On-Off Ramp & AZ-83 Page 1
Operations Year 5, 50% Carpool, Peak Season, Weekend, AM Synchro 7 Report
Tetra Tech ISG 2/5/2010
Movement EBL EBT WBT WBR SBL SBR
Lane Configurations
Volume (veh/h) 24 4 302 5 13 19
Sign Control Free Free Yield
Grade 0% 0% 0%
Peak Hour Factor 0.92 0.92 0.92 0.92 0.92 0.92
Hourly flow rate (vph) 26 4 328 5 14 21
Pedestrians
Lane Width (ft)
Walking Speed (ft/s)
Percent Blockage
Right turn flare (veh)
Median type None None
Median storage veh)
Upstream signal (ft)
pX, platoon unblocked
vC, conflicting volume 334 388 331
vC1, stage 1 conf vol
vC2, stage 2 conf vol
vCu, unblocked vol 334 388 331
tC, single (s) 4.2 6.5 6.3
tC, 2 stage (s)
tF (s) 2.3 3.6 3.4
p0 queue free % 98 98 97
cM capacity (veh/h) 1193 591 697
Direction, Lane # EB 1 WB 1 SB 1
Volume Total 30 334 35
Volume Left 26 0 14
Volume Right 0 5 21
cSH 1193 1700 650
Volume to Capacity 0.02 0.20 0.05
Queue Length 95th (ft) 2 0 4
Control Delay (s) 7.0 0.0 10.9
Lane LOS A B
Approach Delay (s) 7.0 0.0 10.9
Approach LOS B
Intersection Summary
Average Delay 1.5
Intersection Capacity Utilization 30.8% ICU Level of Service A
Analysis Period (min) 15

HCM Unsignalized Intersection Capacity Analysis
2: AZ-83 & EB Off-Ramp Page 2
Operations Year 5, 50% Carpool, Peak Season, Weekend, AM Synchro 7 Report
Tetra Tech ISG 2/5/2010
Movement NBL NBT NBR SBL SBT SBR SEL SER SWL SWR
Lane Configurations
Volume (veh/h) 0 262 35 0 22 0 0 154 0 0
Sign Control Free Free Yield Yield
Grade 0% 0% 0% 0%
Peak Hour Factor 0.92 0.92 0.92 0.92 0.92 0.92 0.92 0.92 0.92 0.92
Hourly flow rate (vph) 0 285 38 0 24 0 0 167 0 0
Pedestrians
Lane Width (ft)
Walking Speed (ft/s)
Percent Blockage
Right turn flare (veh)
Median type None None
Median storage veh)
Upstream signal (ft)
pX, platoon unblocked
vC, conflicting volume 24 323 347 24 476 309
vC1, stage 1 conf vol
vC2, stage 2 conf vol
vCu, unblocked vol 24 323 347 24 476 309
tC, single (s) 4.2 4.2 6.6 6.3 7.2 6.6
tC, 2 stage (s)
tF (s) 2.3 2.3 4.1 3.4 3.6 4.1
p0 queue free % 100 100 100 84 100 100
cM capacity (veh/h) 1553 1204 567 1036 410 596
Direction, Lane # NB 1 NB 2 SB 1 SE 1
Volume Total 285 38 24 167
Volume Left 0 0 0 0
Volume Right 0 38 0 167
cSH 1700 1700 1700 1036
Volume to Capacity 0.17 0.02 0.01 0.16
Queue Length 95th (ft) 0 0 0 14
Control Delay (s) 0.0 0.0 0.0 9.1
Lane LOS A
Approach Delay (s) 0.0 0.0 9.1
Approach LOS A
Intersection Summary
Average Delay 3.0
Intersection Capacity Utilization 19.5% ICU Level of Service A
Analysis Period (min) 15

HCM Unsignalized Intersection Capacity Analysis
3: Sahuarita Rd. & AZ-83 Page 1
Operations Year 5, 50% Carpool, Peak Season, Weekend, AM Synchro 7 Report
Tetra Tech ISG 2/5/2010
Movement EBL EBR NBL NBT SBT SBR
Lane Configurations
Volume (veh/h) 39 17 15 193 152 17
Sign Control Yield Free Free
Grade 0% 0% 0%
Peak Hour Factor 0.92 0.92 0.92 0.92 0.92 0.92
Hourly flow rate (vph) 42 18 16 210 165 18
Pedestrians
Lane Width (ft)
Walking Speed (ft/s)
Percent Blockage
Right turn flare (veh)
Median type None None
Median storage veh)
Upstream signal (ft)
pX, platoon unblocked
vC, conflicting volume 417 174 184
vC1, stage 1 conf vol
vC2, stage 2 conf vol
vCu, unblocked vol 417 174 184
tC, single (s) 6.5 6.3 4.2
tC, 2 stage (s)
tF (s) 3.6 3.4 2.3
p0 queue free % 93 98 99
cM capacity (veh/h) 574 854 1356
Direction, Lane # EB 1 NB 1 SB 1
Volume Total 61 226 184
Volume Left 42 16 0
Volume Right 18 0 18
cSH 637 1356 1700
Volume to Capacity 0.10 0.01 0.11
Queue Length 95th (ft) 8 1 0
Control Delay (s) 11.2 0.7 0.0
Lane LOS B A
Approach Delay (s) 11.2 0.7 0.0
Approach LOS B
Intersection Summary
Average Delay 1.8
Intersection Capacity Utilization 32.5% ICU Level of Service A
Analysis Period (min) 15

HCM Unsignalized Intersection Capacity Analysis
4: Hilton Ranch Rd. & AZ-83 Page 2
Operations Year 5, 50% Carpool, Peak Season, Weekend, AM Synchro 7 Report
Tetra Tech ISG 2/5/2010
Movement WBL WBR NBT NBR SBL SBT
Lane Configurations
Volume (veh/h) 0 1 132 0 2 174
Sign Control Yield Free Free
Grade 0% 0% 0%
Peak Hour Factor 0.92 0.92 0.92 0.92 0.92 0.92
Hourly flow rate (vph) 0 1 143 0 2 189
Pedestrians
Lane Width (ft)
Walking Speed (ft/s)
Percent Blockage
Right turn flare (veh)
Median type None None
Median storage veh)
Upstream signal (ft)
pX, platoon unblocked
vC, conflicting volume 337 143 143
vC1, stage 1 conf vol
vC2, stage 2 conf vol
vCu, unblocked vol 337 143 143
tC, single (s) 6.5 6.3 4.2
tC, 2 stage (s)
tF (s) 3.6 3.4 2.3
p0 queue free % 100 100 100
cM capacity (veh/h) 645 888 1403
Direction, Lane # WB 1 NB 1 SB 1
Volume Total 1 143 191
Volume Left 0 0 2
Volume Right 1 0 0
cSH 888 1700 1403
Volume to Capacity 0.00 0.08 0.00
Queue Length 95th (ft) 0 0 0
Control Delay (s) 9.1 0.0 0.1
Lane LOS A A
Approach Delay (s) 9.1 0.0 0.1
Approach LOS A
Intersection Summary
Average Delay 0.1
Intersection Capacity Utilization 20.8% ICU Level of Service A
Analysis Period (min) 15

HCM Unsignalized Intersection Capacity Analysis
5: Hidden Valley Rd. & AZ-83 Page 3
Operations Year 5, 50% Carpool, Peak Season, Weekend, AM Synchro 7 Report
Tetra Tech ISG 2/5/2010
Movement EBL EBR NBL NBT SBT SBR
Lane Configurations
Volume (veh/h) 64 21 29 77 31 48
Sign Control Yield Free Free
Grade 0% 0% 0%
Peak Hour Factor 0.92 0.92 0.92 0.92 0.92 0.92
Hourly flow rate (vph) 70 23 32 84 34 52
Pedestrians
Lane Width (ft)
Walking Speed (ft/s)
Percent Blockage
Right turn flare (veh)
Median type None None
Median storage veh)
Upstream signal (ft)
pX, platoon unblocked
vC, conflicting volume 207 60 86
vC1, stage 1 conf vol
vC2, stage 2 conf vol
vCu, unblocked vol 207 60 86
tC, single (s) 6.5 6.3 4.2
tC, 2 stage (s)
tF (s) 3.6 3.4 2.3
p0 queue free % 91 98 98
cM capacity (veh/h) 752 989 1473
Direction, Lane # EB 1 NB 1 SB 1
Volume Total 92 115 86
Volume Left 70 32 0
Volume Right 23 0 52
cSH 799 1473 1700
Volume to Capacity 0.12 0.02 0.05
Queue Length 95th (ft) 10 2 0
Control Delay (s) 10.1 2.2 0.0
Lane LOS B A
Approach Delay (s) 10.1 2.2 0.0
Approach LOS B
Intersection Summary
Average Delay 4.0
Intersection Capacity Utilization 23.8% ICU Level of Service A
Analysis Period (min) 15

HCM Unsignalized Intersection Capacity Analysis
6: Rosemont Junction & AZ-83 Page 4
Operations Year 5, 50% Carpool, Peak Season, Weekend, AM Synchro 7 Report
Tetra Tech ISG 2/5/2010
Movement EBL EBR NBL NBT SBT SBR
Lane Configurations
Volume (veh/h) 2 0 0 124 104 2
Sign Control Yield Free Free
Grade 0% 0% 0%
Peak Hour Factor 0.92 0.92 0.92 0.92 0.92 0.92
Hourly flow rate (vph) 2 0 0 135 113 2
Pedestrians
Lane Width (ft)
Walking Speed (ft/s)
Percent Blockage
Right turn flare (veh)
Median type None None
Median storage veh)
Upstream signal (ft)
pX, platoon unblocked
vC, conflicting volume 249 114 115
vC1, stage 1 conf vol
vC2, stage 2 conf vol
vCu, unblocked vol 249 114 115
tC, single (s) 6.5 6.3 4.2
tC, 2 stage (s)
tF (s) 3.6 3.4 2.3
p0 queue free % 100 100 100
cM capacity (veh/h) 727 922 1437
Direction, Lane # EB 1 NB 1 SB 1
Volume Total 2 135 115
Volume Left 2 0 0
Volume Right 0 0 2
cSH 727 1437 1700
Volume to Capacity 0.00 0.00 0.07
Queue Length 95th (ft) 0 0 0
Control Delay (s) 10.0 0.0 0.0
Lane LOS A
Approach Delay (s) 10.0 0.0 0.0
Approach LOS A
Intersection Summary
Average Delay 0.1
Intersection Capacity Utilization 16.5% ICU Level of Service A
Analysis Period (min) 15

HCM Unsignalized Intersection Capacity Analysis
7: AZ-83 & Greaterville Rd. Page 5
Operations Year 5, 50% Carpool, Peak Season, Weekend, AM Synchro 7 Report
Tetra Tech ISG 2/5/2010
Movement SET SER NWL NWT NEL NER
Lane Configurations
Volume (veh/h) 77 0 0 107 0 0
Sign Control Free Free Yield
Grade 0% 0% 0%
Peak Hour Factor 0.92 0.92 0.92 0.92 0.92 0.92
Hourly flow rate (vph) 84 0 0 116 0 0
Pedestrians
Lane Width (ft)
Walking Speed (ft/s)
Percent Blockage
Right turn flare (veh)
Median type None None
Median storage veh)
Upstream signal (ft)
pX, platoon unblocked
vC, conflicting volume 84 200 84
vC1, stage 1 conf vol
vC2, stage 2 conf vol
vCu, unblocked vol 84 200 84
tC, single (s) 4.2 6.5 6.3
tC, 2 stage (s)
tF (s) 2.3 3.6 3.4
p0 queue free % 100 100 100
cM capacity (veh/h) 1476 775 959
Direction, Lane # SE 1 NW 1 NE 1
Volume Total 84 116 0
Volume Left 0 0 0
Volume Right 0 0 0
cSH 1700 1476 1700
Volume to Capacity 0.05 0.00 0.00
Queue Length 95th (ft) 0 0 0
Control Delay (s) 0.0 0.0 0.0
Lane LOS A
Approach Delay (s) 0.0 0.0 0.0
Approach LOS A
Intersection Summary
Average Delay 0.0
Intersection Capacity Utilization 9.0% ICU Level of Service A
Analysis Period (min) 15

HCM Unsignalized Intersection Capacity Analysis
1: I-10 WB On-Off Ramp & AZ-83 Page 1
Operations Year 5, 50% Carpool, Peak Season, Weekend, PM Synchro 7 Report
Tetra Tech ISG 2/5/2010
Movement EBL EBT WBT WBR SBL SBR
Lane Configurations
Volume (veh/h) 12 57 228 4 11 8
Sign Control Free Free Yield
Grade 0% 0% 0%
Peak Hour Factor 0.92 0.92 0.92 0.92 0.92 0.92
Hourly flow rate (vph) 13 62 248 4 12 9
Pedestrians
Lane Width (ft)
Walking Speed (ft/s)
Percent Blockage
Right turn flare (veh)
Median type None None
Median storage veh)
Upstream signal (ft)
pX, platoon unblocked
vC, conflicting volume 252 338 250
vC1, stage 1 conf vol
vC2, stage 2 conf vol
vCu, unblocked vol 252 338 250
tC, single (s) 4.2 6.5 6.3
tC, 2 stage (s)
tF (s) 2.3 3.6 3.4
p0 queue free % 99 98 99
cM capacity (veh/h) 1279 639 774
Direction, Lane # EB 1 WB 1 SB 1
Volume Total 75 252 21
Volume Left 13 0 12
Volume Right 0 4 9
cSH 1279 1700 690
Volume to Capacity 0.01 0.15 0.03
Queue Length 95th (ft) 1 0 2
Control Delay (s) 1.4 0.0 10.4
Lane LOS A B
Approach Delay (s) 1.4 0.0 10.4
Approach LOS B
Intersection Summary
Average Delay 0.9
Intersection Capacity Utilization 23.3% ICU Level of Service A
Analysis Period (min) 15

HCM Unsignalized Intersection Capacity Analysis
2: AZ-83 & EB Off-Ramp Page 2
Operations Year 5, 50% Carpool, Peak Season, Weekend, PM Synchro 7 Report
Tetra Tech ISG 2/5/2010
Movement NBL NBT NBR SBL SBT SBR SEL SER SWL SWR
Lane Configurations
Volume (veh/h) 0 237 41 0 64 0 0 283 0 0
Sign Control Free Free Yield Yield
Grade 0% 0% 0% 0%
Peak Hour Factor 0.92 0.92 0.92 0.92 0.92 0.92 0.92 0.92 0.92 0.92
Hourly flow rate (vph) 0 258 45 0 70 0 0 308 0 0
Pedestrians
Lane Width (ft)
Walking Speed (ft/s)
Percent Blockage
Right turn flare (veh)
Median type None None
Median storage veh)
Upstream signal (ft)
pX, platoon unblocked
vC, conflicting volume 70 302 372 70 635 327
vC1, stage 1 conf vol
vC2, stage 2 conf vol
vCu, unblocked vol 70 302 372 70 635 327
tC, single (s) 4.2 4.2 6.6 6.3 7.2 6.6
tC, 2 stage (s)
tF (s) 2.3 2.3 4.1 3.4 3.6 4.1
p0 queue free % 100 100 100 69 100 100
cM capacity (veh/h) 1494 1225 549 977 262 582
Direction, Lane # NB 1 NB 2 SB 1 SE 1
Volume Total 258 45 70 308
Volume Left 0 0 0 0
Volume Right 0 45 0 308
cSH 1700 1700 1700 977
Volume to Capacity 0.15 0.03 0.04 0.31
Queue Length 95th (ft) 0 0 0 34
Control Delay (s) 0.0 0.0 0.0 10.4
Lane LOS B
Approach Delay (s) 0.0 0.0 10.4
Approach LOS B
Intersection Summary
Average Delay 4.7
Intersection Capacity Utilization 27.6% ICU Level of Service A
Analysis Period (min) 15

HCM Unsignalized Intersection Capacity Analysis
3: Sahuarita Rd. & AZ-83 Page 1
Operations Year 5, 50% Carpool, Peak Season, Weekend, PM Synchro 7 Report
Tetra Tech ISG 2/5/2010
Movement EBL EBR NBL NBT SBT SBR
Lane Configurations
Volume (veh/h) 51 15 22 178 171 97
Sign Control Yield Free Free
Grade 0% 0% 0%
Peak Hour Factor 0.92 0.92 0.92 0.92 0.92 0.92
Hourly flow rate (vph) 55 16 24 193 186 105
Pedestrians
Lane Width (ft)
Walking Speed (ft/s)
Percent Blockage
Right turn flare (veh)
Median type None None
Median storage veh)
Upstream signal (ft)
pX, platoon unblocked
vC, conflicting volume 480 239 291
vC1, stage 1 conf vol
vC2, stage 2 conf vol
vCu, unblocked vol 480 239 291
tC, single (s) 6.5 6.3 4.2
tC, 2 stage (s)
tF (s) 3.6 3.4 2.3
p0 queue free % 89 98 98
cM capacity (veh/h) 524 786 1237
Direction, Lane # EB 1 NB 1 SB 1
Volume Total 72 217 291
Volume Left 55 24 0
Volume Right 16 0 105
cSH 567 1237 1700
Volume to Capacity 0.13 0.02 0.17
Queue Length 95th (ft) 11 1 0
Control Delay (s) 12.3 1.0 0.0
Lane LOS B A
Approach Delay (s) 12.3 1.0 0.0
Approach LOS B
Intersection Summary
Average Delay 1.9
Intersection Capacity Utilization 38.2% ICU Level of Service A
Analysis Period (min) 15

HCM Unsignalized Intersection Capacity Analysis
4: Hilton Ranch Rd. & AZ-83 Page 2
Operations Year 5, 50% Carpool, Peak Season, Weekend, PM Synchro 7 Report
Tetra Tech ISG 2/5/2010
Movement WBL WBR NBT NBR SBL SBT
Lane Configurations
Volume (veh/h) 0 0 181 0 12 151
Sign Control Yield Free Free
Grade 0% 0% 0%
Peak Hour Factor 0.92 0.92 0.92 0.92 0.92 0.92
Hourly flow rate (vph) 0 0 197 0 13 164
Pedestrians
Lane Width (ft)
Walking Speed (ft/s)
Percent Blockage
Right turn flare (veh)
Median type None None
Median storage veh)
Upstream signal (ft)
pX, platoon unblocked
vC, conflicting volume 387 197 197
vC1, stage 1 conf vol
vC2, stage 2 conf vol
vCu, unblocked vol 387 197 197
tC, single (s) 6.5 6.3 4.2
tC, 2 stage (s)
tF (s) 3.6 3.4 2.3
p0 queue free % 100 100 99
cM capacity (veh/h) 599 829 1341
Direction, Lane # WB 1 NB 1 SB 1
Volume Total 0 197 177
Volume Left 0 0 13
Volume Right 0 0 0
cSH 1700 1700 1341
Volume to Capacity 0.00 0.12 0.01
Queue Length 95th (ft) 0 0 1
Control Delay (s) 0.0 0.0 0.6
Lane LOS A A
Approach Delay (s) 0.0 0.0 0.6
Approach LOS A
Intersection Summary
Average Delay 0.3
Intersection Capacity Utilization 21.2% ICU Level of Service A
Analysis Period (min) 15

HCM Unsignalized Intersection Capacity Analysis
5: Hidden Valley Rd. & AZ-83 Page 3
Operations Year 5, 50% Carpool, Peak Season, Weekend, PM Synchro 7 Report
Tetra Tech ISG 2/5/2010
Movement EBL EBR NBL NBT SBT SBR
Lane Configurations
Volume (veh/h) 91 32 26 92 145 64
Sign Control Yield Free Free
Grade 0% 0% 0%
Peak Hour Factor 0.92 0.92 0.92 0.92 0.92 0.92
Hourly flow rate (vph) 99 35 28 100 158 70
Pedestrians
Lane Width (ft)
Walking Speed (ft/s)
Percent Blockage
Right turn flare (veh)
Median type None None
Median storage veh)
Upstream signal (ft)
pX, platoon unblocked
vC, conflicting volume 349 192 227
vC1, stage 1 conf vol
vC2, stage 2 conf vol
vCu, unblocked vol 349 192 227
tC, single (s) 6.5 6.3 4.2
tC, 2 stage (s)
tF (s) 3.6 3.4 2.3
p0 queue free % 84 96 98
cM capacity (veh/h) 623 834 1306
Direction, Lane # EB 1 NB 1 SB 1
Volume Total 134 128 227
Volume Left 99 28 0
Volume Right 35 0 70
cSH 666 1306 1700
Volume to Capacity 0.20 0.02 0.13
Queue Length 95th (ft) 19 2 0
Control Delay (s) 11.8 1.9 0.0
Lane LOS B A
Approach Delay (s) 11.8 1.9 0.0
Approach LOS B
Intersection Summary
Average Delay 3.7
Intersection Capacity Utilization 34.8% ICU Level of Service A
Analysis Period (min) 15

HCM Unsignalized Intersection Capacity Analysis
6: Rosemont Junction & AZ-83 Page 4
Operations Year 5, 50% Carpool, Peak Season, Weekend, PM Synchro 7 Report
Tetra Tech ISG 2/5/2010
Movement EBL EBR NBL NBT SBT SBR
Lane Configurations
Volume (veh/h) 0 0 0 123 150 0
Sign Control Yield Free Free
Grade 0% 0% 0%
Peak Hour Factor 0.92 0.92 0.92 0.92 0.92 0.92
Hourly flow rate (vph) 0 0 0 134 163 0
Pedestrians
Lane Width (ft)
Walking Speed (ft/s)
Percent Blockage
Right turn flare (veh)
Median type None None
Median storage veh)
Upstream signal (ft)
pX, platoon unblocked
vC, conflicting volume 297 163 163
vC1, stage 1 conf vol
vC2, stage 2 conf vol
vCu, unblocked vol 297 163 163
tC, single (s) 6.5 6.3 4.2
tC, 2 stage (s)
tF (s) 3.6 3.4 2.3
p0 queue free % 100 100 100
cM capacity (veh/h) 682 866 1380
Direction, Lane # EB 1 NB 1 SB 1
Volume Total 0 134 163
Volume Left 0 0 0
Volume Right 0 0 0
cSH 1700 1380 1700
Volume to Capacity 0.00 0.00 0.10
Queue Length 95th (ft) 0 0 0
Control Delay (s) 0.0 0.0 0.0
Lane LOS A
Approach Delay (s) 0.0 0.0 0.0
Approach LOS A
Intersection Summary
Average Delay 0.0
Intersection Capacity Utilization 11.2% ICU Level of Service A
Analysis Period (min) 15

HCM Unsignalized Intersection Capacity Analysis
7: AZ-83 & Greaterville Rd. Page 5
Operations Year 5, 50% Carpool, Peak Season, Weekend, PM Synchro 7 Report
Tetra Tech ISG 2/5/2010
Movement SET SER NWL NWT NEL NER
Lane Configurations
Volume (veh/h) 126 0 7 128 5 7
Sign Control Free Free Yield
Grade 0% 0% 0%
Peak Hour Factor 0.92 0.92 0.92 0.92 0.92 0.92
Hourly flow rate (vph) 137 0 8 139 5 8
Pedestrians
Lane Width (ft)
Walking Speed (ft/s)
Percent Blockage
Right turn flare (veh)
Median type None None
Median storage veh)
Upstream signal (ft)
pX, platoon unblocked
vC, conflicting volume 137 291 137
vC1, stage 1 conf vol
vC2, stage 2 conf vol
vCu, unblocked vol 137 291 137
tC, single (s) 4.2 6.5 6.3
tC, 2 stage (s)
tF (s) 2.3 3.6 3.4
p0 queue free % 99 99 99
cM capacity (veh/h) 1411 683 896
Direction, Lane # SE 1 NW 1 NE 1
Volume Total 137 147 13
Volume Left 0 8 5
Volume Right 0 0 8
cSH 1700 1411 793
Volume to Capacity 0.08 0.01 0.02
Queue Length 95th (ft) 0 0 1
Control Delay (s) 0.0 0.4 9.6
Lane LOS A A
Approach Delay (s) 0.0 0.4 9.6
Approach LOS A
Intersection Summary
Average Delay 0.6
Intersection Capacity Utilization 22.5% ICU Level of Service A
Analysis Period (min) 15

NON - PEAK SEASON
SCENARIO 5
50% CARPOOL WITH NO COPPER CONCENTRATE
TRUCKS

HCM Unsignalized Intersection Capacity Analysis
1: I-10 WB On-Off Ramp & AZ-83 Page 1
Operations Year 5, 50% Carpool with no Copper Concentrate Trucks, Non-Peak Season, Weekday, AM Synchro 7 Report
Tetra Tech ISG 2/5/2010
Movement EBL EBT WBT WBR SBL SBR
Lane Configurations
Volume (veh/h) 6 38 507 2 8 31
Sign Control Free Free Yield
Grade 0% 0% 0%
Peak Hour Factor 0.92 0.92 0.92 0.92 0.92 0.92
Hourly flow rate (vph) 7 41 551 2 9 34
Pedestrians
Lane Width (ft)
Walking Speed (ft/s)
Percent Blockage
Right turn flare (veh)
Median type None None
Median storage veh)
Upstream signal (ft)
pX, platoon unblocked
vC, conflicting volume 553 607 552
vC1, stage 1 conf vol
vC2, stage 2 conf vol
vCu, unblocked vol 553 607 552
tC, single (s) 4.2 6.5 6.3
tC, 2 stage (s)
tF (s) 2.3 3.6 3.4
p0 queue free % 99 98 94
cM capacity (veh/h) 997 450 526
Direction, Lane # EB 1 WB 1 SB 1
Volume Total 48 553 42
Volume Left 7 0 9
Volume Right 0 2 34
cSH 997 1700 508
Volume to Capacity 0.01 0.33 0.08
Queue Length 95th (ft) 0 0 7
Control Delay (s) 1.2 0.0 12.7
Lane LOS A B
Approach Delay (s) 1.2 0.0 12.7
Approach LOS B
Intersection Summary
Average Delay 0.9
Intersection Capacity Utilization 36.8% ICU Level of Service A
Analysis Period (min) 15

HCM Unsignalized Intersection Capacity Analysis
2: AZ-83 & EB Off-Ramp Page 2
Operations Year 5, 50% Carpool with no Copper Concentrate Trucks, Non-Peak Season, Weekday, AM Synchro 7 Report
Tetra Tech ISG 2/5/2010
Movement NBL NBT NBR SBL SBT SBR SEL SER SWL SWR
Lane Configurations
Volume (veh/h) 0 286 40 0 31 0 0 211 0 0
Sign Control Free Free Yield Yield
Grade 0% 0% 0% 0%
Peak Hour Factor 0.92 0.92 0.92 0.92 0.92 0.92 0.92 0.92 0.92 0.92
Hourly flow rate (vph) 0 311 43 0 34 0 0 229 0 0
Pedestrians
Lane Width (ft)
Walking Speed (ft/s)
Percent Blockage
Right turn flare (veh)
Median type None None
Median storage veh)
Upstream signal (ft)
pX, platoon unblocked
vC, conflicting volume 34 354 388 34 574 345
vC1, stage 1 conf vol
vC2, stage 2 conf vol
vCu, unblocked vol 34 354 388 34 574 345
tC, single (s) 4.2 4.2 6.6 6.3 7.2 6.6
tC, 2 stage (s)
tF (s) 2.3 2.3 4.1 3.4 3.6 4.1
p0 queue free % 100 100 100 78 100 100
cM capacity (veh/h) 1552 1183 540 1028 329 572
Direction, Lane # NB 1 NB 2 SB 1 SE 1
Volume Total 311 43 34 229
Volume Left 0 0 0 0
Volume Right 0 43 0 229
cSH 1700 1700 1700 1028
Volume to Capacity 0.18 0.03 0.02 0.22
Queue Length 95th (ft) 0 0 0 21
Control Delay (s) 0.0 0.0 0.0 9.5
Lane LOS A
Approach Delay (s) 0.0 0.0 9.5
Approach LOS A
Intersection Summary
Average Delay 3.5
Intersection Capacity Utilization 23.1% ICU Level of Service A
Analysis Period (min) 15

HCM Unsignalized Intersection Capacity Analysis
3: Sahuarita Rd. & AZ-83 Page 1
Operations Year 5, 50% Carpool with no Copper Concentrate Trucks, Non-Peak Season, Weekday, AM Synchro 7 Report
Tetra Tech ISG 2/5/2010
Movement EBL EBR NBL NBT SBT SBR
Lane Configurations
Volume (veh/h) 15 7 15 173 204 2
Sign Control Yield Free Free
Grade 0% 0% 0%
Peak Hour Factor 0.92 0.92 0.92 0.92 0.92 0.92
Hourly flow rate (vph) 16 8 16 188 222 2
Pedestrians
Lane Width (ft)
Walking Speed (ft/s)
Percent Blockage
Right turn flare (veh)
Median type None None
Median storage veh)
Upstream signal (ft)
pX, platoon unblocked
vC, conflicting volume 443 223 224
vC1, stage 1 conf vol
vC2, stage 2 conf vol
vCu, unblocked vol 443 223 224
tC, single (s) 6.5 6.3 4.2
tC, 2 stage (s)
tF (s) 3.6 3.4 2.3
p0 queue free % 97 99 99
cM capacity (veh/h) 557 807 1321
Direction, Lane # EB 1 NB 1 SB 1
Volume Total 24 204 224
Volume Left 16 16 0
Volume Right 8 0 2
cSH 618 1321 1700
Volume to Capacity 0.04 0.01 0.13
Queue Length 95th (ft) 3 1 0
Control Delay (s) 11.1 0.7 0.0
Lane LOS B A
Approach Delay (s) 11.1 0.7 0.0
Approach LOS B
Intersection Summary
Average Delay 0.9
Intersection Capacity Utilization 31.5% ICU Level of Service A
Analysis Period (min) 15

HCM Unsignalized Intersection Capacity Analysis
4: Hilton Ranch Rd. & AZ-83 Page 2
Operations Year 5, 50% Carpool with no Copper Concentrate Trucks, Non-Peak Season, Weekday, AM Synchro 7 Report
Tetra Tech ISG 2/5/2010
Movement WBL WBR NBT NBR SBL SBT
Lane Configurations
Volume (veh/h) 0 10 132 0 10 208
Sign Control Yield Free Free
Grade 0% 0% 0%
Peak Hour Factor 0.92 0.92 0.92 0.92 0.92 0.92
Hourly flow rate (vph) 0 11 143 0 11 226
Pedestrians
Lane Width (ft)
Walking Speed (ft/s)
Percent Blockage
Right turn flare (veh)
Median type None None
Median storage veh)
Upstream signal (ft)
pX, platoon unblocked
vC, conflicting volume 391 143 143
vC1, stage 1 conf vol
vC2, stage 2 conf vol
vCu, unblocked vol 391 143 143
tC, single (s) 6.5 6.3 4.2
tC, 2 stage (s)
tF (s) 3.6 3.4 2.3
p0 queue free % 100 99 99
cM capacity (veh/h) 600 893 1415
Direction, Lane # WB 1 NB 1 SB 1
Volume Total 11 143 237
Volume Left 0 0 11
Volume Right 11 0 0
cSH 893 1700 1415
Volume to Capacity 0.01 0.08 0.01
Queue Length 95th (ft) 1 0 1
Control Delay (s) 9.1 0.0 0.4
Lane LOS A A
Approach Delay (s) 9.1 0.0 0.4
Approach LOS A
Intersection Summary
Average Delay 0.5
Intersection Capacity Utilization 29.1% ICU Level of Service A
Analysis Period (min) 15

HCM Unsignalized Intersection Capacity Analysis
5: Hidden Valley Rd. & AZ-83 Page 3
Operations Year 5, 50% Carpool with no Copper Concentrate Trucks, Non-Peak Season, Weekday, AM Synchro 7 Report
Tetra Tech ISG 2/5/2010
Movement EBL EBR NBL NBT SBT SBR
Lane Configurations
Volume (veh/h) 64 21 52 116 90 158
Sign Control Yield Free Free
Grade 0% 0% 0%
Peak Hour Factor 0.92 0.92 0.92 0.92 0.92 0.92
Hourly flow rate (vph) 70 23 57 126 98 172
Pedestrians
Lane Width (ft)
Walking Speed (ft/s)
Percent Blockage
Right turn flare (veh)
Median type None None
Median storage veh)
Upstream signal (ft)
pX, platoon unblocked
vC, conflicting volume 423 184 270
vC1, stage 1 conf vol
vC2, stage 2 conf vol
vCu, unblocked vol 423 184 270
tC, single (s) 6.5 6.3 4.2
tC, 2 stage (s)
tF (s) 3.6 3.4 2.3
p0 queue free % 87 97 96
cM capacity (veh/h) 554 848 1271
Direction, Lane # EB 1 NB 1 SB 1
Volume Total 92 183 270
Volume Left 70 57 0
Volume Right 23 0 172
cSH 606 1271 1700
Volume to Capacity 0.15 0.04 0.16
Queue Length 95th (ft) 13 3 0
Control Delay (s) 12.0 2.7 0.0
Lane LOS B A
Approach Delay (s) 12.0 2.7 0.0
Approach LOS B
Intersection Summary
Average Delay 3.0
Intersection Capacity Utilization 38.2% ICU Level of Service A
Analysis Period (min) 15

HCM Unsignalized Intersection Capacity Analysis
6: Rosemont Junction & AZ-83 Page 4
Operations Year 5, 50% Carpool with no Copper Concentrate Trucks, Non-Peak Season, Weekday, AM Synchro 7 Report
Tetra Tech ISG 2/5/2010
Movement EBL EBR NBL NBT SBT SBR
Lane Configurations
Volume (veh/h) 0 0 0 139 82 0
Sign Control Yield Free Free
Grade 0% 0% 0%
Peak Hour Factor 0.92 0.92 0.92 0.92 0.92 0.92
Hourly flow rate (vph) 0 0 0 151 89 0
Pedestrians
Lane Width (ft)
Walking Speed (ft/s)
Percent Blockage
Right turn flare (veh)
Median type None None
Median storage veh)
Upstream signal (ft)
pX, platoon unblocked
vC, conflicting volume 240 89 89
vC1, stage 1 conf vol
vC2, stage 2 conf vol
vCu, unblocked vol 240 89 89
tC, single (s) 6.5 6.3 4.2
tC, 2 stage (s)
tF (s) 3.6 3.4 2.3
p0 queue free % 100 100 100
cM capacity (veh/h) 739 958 1481
Direction, Lane # EB 1 NB 1 SB 1
Volume Total 0 151 89
Volume Left 0 0 0
Volume Right 0 0 0
cSH 1700 1481 1700
Volume to Capacity 0.00 0.00 0.05
Queue Length 95th (ft) 0 0 0
Control Delay (s) 0.0 0.0 0.0
Lane LOS A
Approach Delay (s) 0.0 0.0 0.0
Approach LOS A
Intersection Summary
Average Delay 0.0
Intersection Capacity Utilization 10.6% ICU Level of Service A
Analysis Period (min) 15

HCM Unsignalized Intersection Capacity Analysis
7: AZ-83 & Greaterville Rd. Page 5
Operations Year 5, 50% Carpool with no Copper Concentrate Trucks, Non-Peak Season, Weekday, AM Synchro 7 Report
Tetra Tech ISG 2/5/2010
Movement SET SER NWL NWT NEL NER
Lane Configurations
Volume (veh/h) 72 5 5 110 2 2
Sign Control Free Free Yield
Grade 0% 0% 0%
Peak Hour Factor 0.92 0.92 0.92 0.92 0.92 0.92
Hourly flow rate (vph) 78 5 5 120 2 2
Pedestrians
Lane Width (ft)
Walking Speed (ft/s)
Percent Blockage
Right turn flare (veh)
Median type None None
Median storage veh)
Upstream signal (ft)
pX, platoon unblocked
vC, conflicting volume 84 211 81
vC1, stage 1 conf vol
vC2, stage 2 conf vol
vCu, unblocked vol 84 211 81
tC, single (s) 4.2 6.5 6.3
tC, 2 stage (s)
tF (s) 2.3 3.6 3.4
p0 queue free % 100 100 100
cM capacity (veh/h) 1488 765 968
Direction, Lane # SE 1 NW 1 NE 1
Volume Total 84 125 4
Volume Left 0 5 2
Volume Right 5 0 2
cSH 1700 1488 855
Volume to Capacity 0.05 0.00 0.01
Queue Length 95th (ft) 0 0 0
Control Delay (s) 0.0 0.4 9.2
Lane LOS A A
Approach Delay (s) 0.0 0.4 9.2
Approach LOS A
Intersection Summary
Average Delay 0.4
Intersection Capacity Utilization 19.9% ICU Level of Service A
Analysis Period (min) 15

HCM Unsignalized Intersection Capacity Analysis
1: I-10 WB On-Off Ramp & AZ-83 Page 1
Operations Year 5, 50% Carpool with no Copper Concentrate Trucks, Non-Peak Season, Weekday, PM Synchro 7 Report
Tetra Tech ISG 2/5/2010
Movement EBL EBT WBT WBR SBL SBR
Lane Configurations
Volume (veh/h) 25 47 187 5 10 7
Sign Control Free Free Yield
Grade 0% 0% 0%
Peak Hour Factor 0.92 0.92 0.92 0.92 0.92 0.92
Hourly flow rate (vph) 27 51 203 5 11 8
Pedestrians
Lane Width (ft)
Walking Speed (ft/s)
Percent Blockage
Right turn flare (veh)
Median type None None
Median storage veh)
Upstream signal (ft)
pX, platoon unblocked
vC, conflicting volume 209 311 206
vC1, stage 1 conf vol
vC2, stage 2 conf vol
vCu, unblocked vol 209 311 206
tC, single (s) 4.2 6.5 6.3
tC, 2 stage (s)
tF (s) 2.3 3.6 3.4
p0 queue free % 98 98 99
cM capacity (veh/h) 1339 659 825
Direction, Lane # EB 1 WB 1 SB 1
Volume Total 78 209 18
Volume Left 27 0 11
Volume Right 0 5 8
cSH 1339 1700 719
Volume to Capacity 0.02 0.12 0.03
Queue Length 95th (ft) 2 0 2
Control Delay (s) 2.8 0.0 10.1
Lane LOS A B
Approach Delay (s) 2.8 0.0 10.1
Approach LOS B
Intersection Summary
Average Delay 1.3
Intersection Capacity Utilization 27.3% ICU Level of Service A
Analysis Period (min) 15
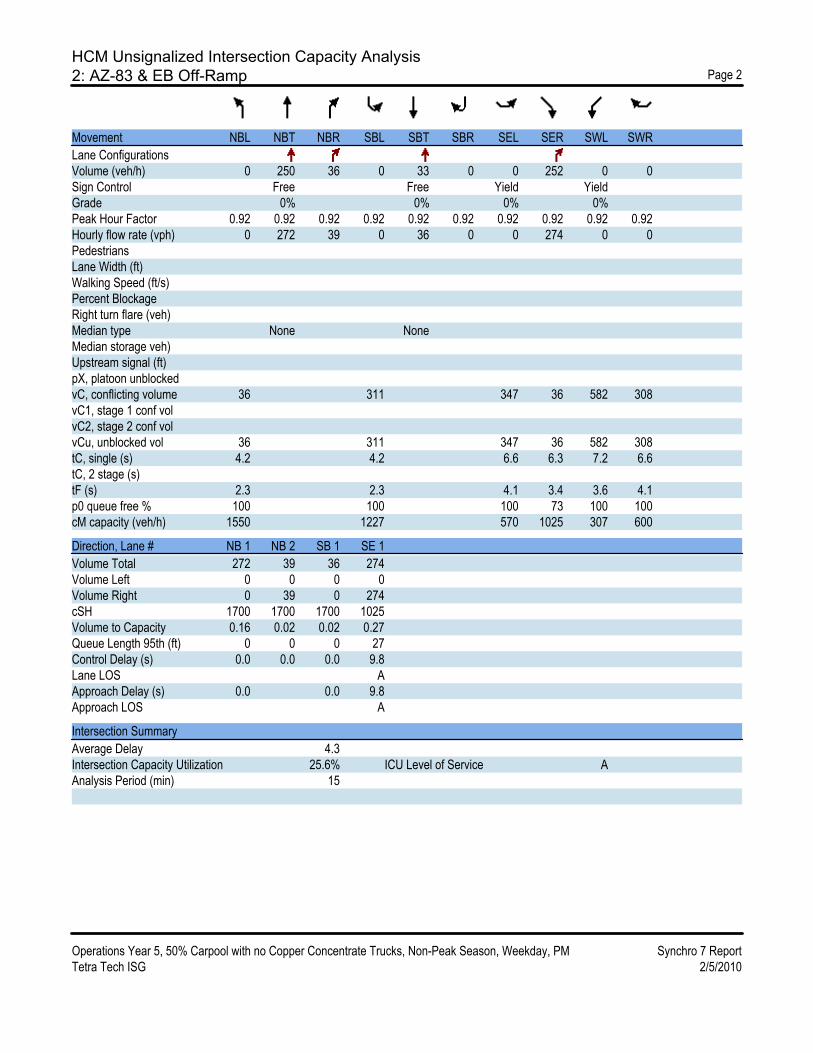
HCM Unsignalized Intersection Capacity Analysis
2: AZ-83 & EB Off-Ramp Page 2
Operations Year 5, 50% Carpool with no Copper Concentrate Trucks, Non-Peak Season, Weekday, PM Synchro 7 Report
Tetra Tech ISG 2/5/2010
Movement NBL NBT NBR SBL SBT SBR SEL SER SWL SWR
Lane Configurations
Volume (veh/h) 0 250 36 0 33 0 0 252 0 0
Sign Control Free Free Yield Yield
Grade 0% 0% 0% 0%
Peak Hour Factor 0.92 0.92 0.92 0.92 0.92 0.92 0.92 0.92 0.92 0.92
Hourly flow rate (vph) 0 272 39 0 36 0 0 274 0 0
Pedestrians
Lane Width (ft)
Walking Speed (ft/s)
Percent Blockage
Right turn flare (veh)
Median type None None
Median storage veh)
Upstream signal (ft)
pX, platoon unblocked
vC, conflicting volume 36 311 347 36 582 308
vC1, stage 1 conf vol
vC2, stage 2 conf vol
vCu, unblocked vol 36 311 347 36 582 308
tC, single (s) 4.2 4.2 6.6 6.3 7.2 6.6
tC, 2 stage (s)
tF (s) 2.3 2.3 4.1 3.4 3.6 4.1
p0 queue free % 100 100 100 73 100 100
cM capacity (veh/h) 1550 1227 570 1025 307 600
Direction, Lane # NB 1 NB 2 SB 1 SE 1
Volume Total 272 39 36 274
Volume Left 0 0 0 0
Volume Right 0 39 0 274
cSH 1700 1700 1700 1025
Volume to Capacity 0.16 0.02 0.02 0.27
Queue Length 95th (ft) 0 0 0 27
Control Delay (s) 0.0 0.0 0.0 9.8
Lane LOS A
Approach Delay (s) 0.0 0.0 9.8
Approach LOS A
Intersection Summary
Average Delay 4.3
Intersection Capacity Utilization 25.6% ICU Level of Service A
Analysis Period (min) 15

HCM Unsignalized Intersection Capacity Analysis
3: Sahuarita Rd. & AZ-83 Page 1
Operations Year 5, 50% Carpool with no Copper Concentrate Trucks, Non-Peak Season, Weekday, PM Synchro 7 Report
Tetra Tech ISG 2/5/2010
Movement EBL EBR NBL NBT SBT SBR
Lane Configurations
Volume (veh/h) 19 7 17 216 178 51
Sign Control Yield Free Free
Grade 0% 0% 0%
Peak Hour Factor 0.92 0.92 0.92 0.92 0.92 0.92
Hourly flow rate (vph) 21 8 18 235 193 55
Pedestrians
Lane Width (ft)
Walking Speed (ft/s)
Percent Blockage
Right turn flare (veh)
Median type None None
Median storage veh)
Upstream signal (ft)
pX, platoon unblocked
vC, conflicting volume 493 221 249
vC1, stage 1 conf vol
vC2, stage 2 conf vol
vCu, unblocked vol 493 221 249
tC, single (s) 6.5 6.3 4.2
tC, 2 stage (s)
tF (s) 3.6 3.4 2.3
p0 queue free % 96 99 99
cM capacity (veh/h) 521 808 1294
Direction, Lane # EB 1 NB 1 SB 1
Volume Total 28 253 249
Volume Left 21 18 0
Volume Right 8 0 55
cSH 576 1294 1700
Volume to Capacity 0.05 0.01 0.15
Queue Length 95th (ft) 4 1 0
Control Delay (s) 11.6 0.7 0.0
Lane LOS B A
Approach Delay (s) 11.6 0.7 0.0
Approach LOS B
Intersection Summary
Average Delay 0.9
Intersection Capacity Utilization 35.4% ICU Level of Service A
Analysis Period (min) 15

HCM Unsignalized Intersection Capacity Analysis
4: Hilton Ranch Rd. & AZ-83 Page 2
Operations Year 5, 50% Carpool with no Copper Concentrate Trucks, Non-Peak Season, Weekday, PM Synchro 7 Report
Tetra Tech ISG 2/5/2010
Movement WBL WBR NBT NBR SBL SBT
Lane Configurations
Volume (veh/h) 0 0 201 0 10 137
Sign Control Yield Free Free
Grade 0% 0% 0%
Peak Hour Factor 0.92 0.92 0.92 0.92 0.92 0.92
Hourly flow rate (vph) 0 0 218 0 11 149
Pedestrians
Lane Width (ft)
Walking Speed (ft/s)
Percent Blockage
Right turn flare (veh)
Median type None None
Median storage veh)
Upstream signal (ft)
pX, platoon unblocked
vC, conflicting volume 389 218 218
vC1, stage 1 conf vol
vC2, stage 2 conf vol
vCu, unblocked vol 389 218 218
tC, single (s) 6.5 6.3 4.2
tC, 2 stage (s)
tF (s) 3.6 3.4 2.3
p0 queue free % 100 100 99
cM capacity (veh/h) 602 811 1328
Direction, Lane # WB 1 NB 1 SB 1
Volume Total 0 218 160
Volume Left 0 0 11
Volume Right 0 0 0
cSH 1700 1700 1328
Volume to Capacity 0.00 0.13 0.01
Queue Length 95th (ft) 0 0 1
Control Delay (s) 0.0 0.0 0.6
Lane LOS A A
Approach Delay (s) 0.0 0.0 0.6
Approach LOS A
Intersection Summary
Average Delay 0.2
Intersection Capacity Utilization 18.8% ICU Level of Service A
Analysis Period (min) 15

HCM Unsignalized Intersection Capacity Analysis
5: Hidden Valley Rd. & AZ-83 Page 3
Operations Year 5, 50% Carpool with no Copper Concentrate Trucks, Non-Peak Season, Weekday, PM Synchro 7 Report
Tetra Tech ISG 2/5/2010
Movement EBL EBR NBL NBT SBT SBR
Lane Configurations
Volume (veh/h) 153 50 21 80 119 64
Sign Control Yield Free Free
Grade 0% 0% 0%
Peak Hour Factor 0.92 0.92 0.92 0.92 0.92 0.92
Hourly flow rate (vph) 166 54 23 87 129 70
Pedestrians
Lane Width (ft)
Walking Speed (ft/s)
Percent Blockage
Right turn flare (veh)
Median type None None
Median storage veh)
Upstream signal (ft)
pX, platoon unblocked
vC, conflicting volume 297 164 199
vC1, stage 1 conf vol
vC2, stage 2 conf vol
vCu, unblocked vol 297 164 199
tC, single (s) 6.5 6.3 4.2
tC, 2 stage (s)
tF (s) 3.6 3.4 2.3
p0 queue free % 75 94 98
cM capacity (veh/h) 675 870 1350
Direction, Lane # EB 1 NB 1 SB 1
Volume Total 221 110 199
Volume Left 166 23 0
Volume Right 54 0 70
cSH 714 1350 1700
Volume to Capacity 0.31 0.02 0.12
Queue Length 95th (ft) 33 1 0
Control Delay (s) 12.3 1.7 0.0
Lane LOS B A
Approach Delay (s) 12.3 1.7 0.0
Approach LOS B
Intersection Summary
Average Delay 5.5
Intersection Capacity Utilization 37.1% ICU Level of Service A
Analysis Period (min) 15

HCM Unsignalized Intersection Capacity Analysis
6: Rosemont Junction & AZ-83 Page 4
Operations Year 5, 50% Carpool with no Copper Concentrate Trucks, Non-Peak Season, Weekday, PM Synchro 7 Report
Tetra Tech ISG 2/5/2010
Movement EBL EBR NBL NBT SBT SBR
Lane Configurations
Volume (veh/h) 0 0 0 87 137 0
Sign Control Yield Free Free
Grade 0% 0% 0%
Peak Hour Factor 0.92 0.92 0.92 0.92 0.92 0.92
Hourly flow rate (vph) 0 0 0 95 149 0
Pedestrians
Lane Width (ft)
Walking Speed (ft/s)
Percent Blockage
Right turn flare (veh)
Median type None None
Median storage veh)
Upstream signal (ft)
pX, platoon unblocked
vC, conflicting volume 243 149 149
vC1, stage 1 conf vol
vC2, stage 2 conf vol
vCu, unblocked vol 243 149 149
tC, single (s) 6.5 6.3 4.2
tC, 2 stage (s)
tF (s) 3.6 3.4 2.3
p0 queue free % 100 100 100
cM capacity (veh/h) 736 887 1408
Direction, Lane # EB 1 NB 1 SB 1
Volume Total 0 95 149
Volume Left 0 0 0
Volume Right 0 0 0
cSH 1700 1408 1700
Volume to Capacity 0.00 0.00 0.09
Queue Length 95th (ft) 0 0 0
Control Delay (s) 0.0 0.0 0.0
Lane LOS A
Approach Delay (s) 0.0 0.0 0.0
Approach LOS A
Intersection Summary
Average Delay 0.0
Intersection Capacity Utilization 10.5% ICU Level of Service A
Analysis Period (min) 15

HCM Unsignalized Intersection Capacity Analysis
7: AZ-83 & Greaterville Rd. Page 5
Operations Year 5, 50% Carpool with no Copper Concentrate Trucks, Non-Peak Season, Weekday, PM Synchro 7 Report
Tetra Tech ISG 2/5/2010
Movement SET SER NWL NWT NEL NER
Lane Configurations
Volume (veh/h) 161 5 5 116 0 0
Sign Control Free Free Yield
Grade 0% 0% 0%
Peak Hour Factor 0.92 0.92 0.92 0.92 0.92 0.92
Hourly flow rate (vph) 175 5 5 126 0 0
Pedestrians
Lane Width (ft)
Walking Speed (ft/s)
Percent Blockage
Right turn flare (veh)
Median type None None
Median storage veh)
Upstream signal (ft)
pX, platoon unblocked
vC, conflicting volume 180 315 178
vC1, stage 1 conf vol
vC2, stage 2 conf vol
vCu, unblocked vol 180 315 178
tC, single (s) 4.2 6.5 6.3
tC, 2 stage (s)
tF (s) 2.3 3.6 3.4
p0 queue free % 100 100 100
cM capacity (veh/h) 1371 667 855
Direction, Lane # SE 1 NW 1 NE 1
Volume Total 180 132 0
Volume Left 0 5 0
Volume Right 5 0 0
cSH 1700 1371 1700
Volume to Capacity 0.11 0.00 0.00
Queue Length 95th (ft) 0 0 0
Control Delay (s) 0.0 0.3 0.0
Lane LOS A A
Approach Delay (s) 0.0 0.3 0.0
Approach LOS A
Intersection Summary
Average Delay 0.1
Intersection Capacity Utilization 13.5% ICU Level of Service A
Analysis Period (min) 15

HCM Unsignalized Intersection Capacity Analysis
1: I-10 WB On-Off Ramp & AZ-83 Page 1
Operations Year 5, 50% Carpool with no Copper Concentrate Trucks, Non-Peak Season, Weekend, AM Synchro 7 Report
Tetra Tech ISG 2/5/2010
Movement EBL EBT WBT WBR SBL SBR
Lane Configurations
Volume (veh/h) 6 49 386 2 8 15
Sign Control Free Free Yield
Grade 0% 0% 0%
Peak Hour Factor 0.92 0.92 0.92 0.92 0.92 0.92
Hourly flow rate (vph) 7 53 420 2 9 16
Pedestrians
Lane Width (ft)
Walking Speed (ft/s)
Percent Blockage
Right turn flare (veh)
Median type None None
Median storage veh)
Upstream signal (ft)
pX, platoon unblocked
vC, conflicting volume 422 487 421
vC1, stage 1 conf vol
vC2, stage 2 conf vol
vCu, unblocked vol 422 487 421
tC, single (s) 4.2 6.5 6.3
tC, 2 stage (s)
tF (s) 2.3 3.6 3.4
p0 queue free % 99 98 97
cM capacity (veh/h) 1116 529 624
Direction, Lane # EB 1 WB 1 SB 1
Volume Total 60 422 25
Volume Left 7 0 9
Volume Right 0 2 16
cSH 1116 1700 588
Volume to Capacity 0.01 0.25 0.04
Queue Length 95th (ft) 0 0 3
Control Delay (s) 0.9 0.0 11.4
Lane LOS A B
Approach Delay (s) 0.9 0.0 11.4
Approach LOS B
Intersection Summary
Average Delay 0.7
Intersection Capacity Utilization 30.4% ICU Level of Service A
Analysis Period (min) 15

HCM Unsignalized Intersection Capacity Analysis
2: AZ-83 & EB Off-Ramp Page 2
Operations Year 5, 50% Carpool with no Copper Concentrate Trucks, Non-Peak Season, Weekend, AM Synchro 7 Report
Tetra Tech ISG 2/5/2010
Movement NBL NBT NBR SBL SBT SBR SEL SER SWL SWR
Lane Configurations
Volume (veh/h) 0 283 30 0 16 0 0 143 0 0
Sign Control Free Free Yield Yield
Grade 0% 0% 0% 0%
Peak Hour Factor 0.92 0.92 0.92 0.92 0.92 0.92 0.92 0.92 0.92 0.92
Hourly flow rate (vph) 0 308 33 0 17 0 0 155 0 0
Pedestrians
Lane Width (ft)
Walking Speed (ft/s)
Percent Blockage
Right turn flare (veh)
Median type None None
Median storage veh)
Upstream signal (ft)
pX, platoon unblocked
vC, conflicting volume 17 340 358 17 480 325
vC1, stage 1 conf vol
vC2, stage 2 conf vol
vCu, unblocked vol 17 340 358 17 480 325
tC, single (s) 4.2 4.2 6.6 6.3 7.2 6.6
tC, 2 stage (s)
tF (s) 2.3 2.3 4.1 3.4 3.6 4.1
p0 queue free % 100 100 100 85 100 100
cM capacity (veh/h) 1574 1197 562 1050 417 587
Direction, Lane # NB 1 NB 2 SB 1 SE 1
Volume Total 308 33 17 155
Volume Left 0 0 0 0
Volume Right 0 33 0 155
cSH 1700 1700 1700 1050
Volume to Capacity 0.18 0.02 0.01 0.15
Queue Length 95th (ft) 0 0 0 13
Control Delay (s) 0.0 0.0 0.0 9.0
Lane LOS A
Approach Delay (s) 0.0 0.0 9.0
Approach LOS A
Intersection Summary
Average Delay 2.7
Intersection Capacity Utilization 18.9% ICU Level of Service A
Analysis Period (min) 15

HCM Unsignalized Intersection Capacity Analysis
3: Sahuarita Rd. & AZ-83 Page 1
Operations Year 5, 50% Carpool with no Copper Concentrate Trucks, Non-Peak Season, Weekend, AM Synchro 7 Report
Tetra Tech ISG 2/5/2010
Movement EBL EBR NBL NBT SBT SBR
Lane Configurations
Volume (veh/h) 36 19 5 202 151 19
Sign Control Yield Free Free
Grade 0% 0% 0%
Peak Hour Factor 0.92 0.92 0.92 0.92 0.92 0.92
Hourly flow rate (vph) 39 21 5 220 164 21
Pedestrians
Lane Width (ft)
Walking Speed (ft/s)
Percent Blockage
Right turn flare (veh)
Median type None None
Median storage veh)
Upstream signal (ft)
pX, platoon unblocked
vC, conflicting volume 405 174 185
vC1, stage 1 conf vol
vC2, stage 2 conf vol
vCu, unblocked vol 405 174 185
tC, single (s) 6.5 6.3 4.2
tC, 2 stage (s)
tF (s) 3.6 3.4 2.3
p0 queue free % 93 98 100
cM capacity (veh/h) 592 859 1366
Direction, Lane # EB 1 NB 1 SB 1
Volume Total 60 225 185
Volume Left 39 5 0
Volume Right 21 0 21
cSH 663 1366 1700
Volume to Capacity 0.09 0.00 0.11
Queue Length 95th (ft) 7 0 0
Control Delay (s) 11.0 0.2 0.0
Lane LOS B A
Approach Delay (s) 11.0 0.2 0.0
Approach LOS B
Intersection Summary
Average Delay 1.5
Intersection Capacity Utilization 24.7% ICU Level of Service A
Analysis Period (min) 15

HCM Unsignalized Intersection Capacity Analysis
4: Hilton Ranch Rd. & AZ-83 Page 2
Operations Year 5, 50% Carpool with no Copper Concentrate Trucks, Non-Peak Season, Weekend, AM Synchro 7 Report
Tetra Tech ISG 2/5/2010
Movement WBL WBR NBT NBR SBL SBT
Lane Configurations
Volume (veh/h) 0 19 171 0 2 178
Sign Control Yield Free Free
Grade 0% 0% 0%
Peak Hour Factor 0.92 0.92 0.92 0.92 0.92 0.92
Hourly flow rate (vph) 0 21 186 0 2 193
Pedestrians
Lane Width (ft)
Walking Speed (ft/s)
Percent Blockage
Right turn flare (veh)
Median type None None
Median storage veh)
Upstream signal (ft)
pX, platoon unblocked
vC, conflicting volume 384 186 186
vC1, stage 1 conf vol
vC2, stage 2 conf vol
vCu, unblocked vol 384 186 186
tC, single (s) 6.5 6.3 4.2
tC, 2 stage (s)
tF (s) 3.6 3.4 2.3
p0 queue free % 100 98 100
cM capacity (veh/h) 610 846 1365
Direction, Lane # WB 1 NB 1 SB 1
Volume Total 21 186 196
Volume Left 0 0 2
Volume Right 21 0 0
cSH 846 1700 1365
Volume to Capacity 0.02 0.11 0.00
Queue Length 95th (ft) 2 0 0
Control Delay (s) 9.4 0.0 0.1
Lane LOS A A
Approach Delay (s) 9.4 0.0 0.1
Approach LOS A
Intersection Summary
Average Delay 0.5
Intersection Capacity Utilization 21.0% ICU Level of Service A
Analysis Period (min) 15

HCM Unsignalized Intersection Capacity Analysis
5: Hidden Valley Rd. & AZ-83 Page 3
Operations Year 5, 50% Carpool with no Copper Concentrate Trucks, Non-Peak Season, Weekend, AM Synchro 7 Report
Tetra Tech ISG 2/5/2010
Movement EBL EBR NBL NBT SBT SBR
Lane Configurations
Volume (veh/h) 64 24 28 99 61 93
Sign Control Yield Free Free
Grade 0% 0% 0%
Peak Hour Factor 0.92 0.92 0.92 0.92 0.92 0.92
Hourly flow rate (vph) 70 26 30 108 66 101
Pedestrians
Lane Width (ft)
Walking Speed (ft/s)
Percent Blockage
Right turn flare (veh)
Median type None None
Median storage veh)
Upstream signal (ft)
pX, platoon unblocked
vC, conflicting volume 285 117 167
vC1, stage 1 conf vol
vC2, stage 2 conf vol
vCu, unblocked vol 285 117 167
tC, single (s) 6.5 6.3 4.2
tC, 2 stage (s)
tF (s) 3.6 3.4 2.3
p0 queue free % 90 97 98
cM capacity (veh/h) 681 925 1386
Direction, Lane # EB 1 NB 1 SB 1
Volume Total 96 138 167
Volume Left 70 30 0
Volume Right 26 0 101
cSH 734 1386 1700
Volume to Capacity 0.13 0.02 0.10
Queue Length 95th (ft) 11 2 0
Control Delay (s) 10.6 1.8 0.0
Lane LOS B A
Approach Delay (s) 10.6 1.8 0.0
Approach LOS B
Intersection Summary
Average Delay 3.2
Intersection Capacity Utilization 30.7% ICU Level of Service A
Analysis Period (min) 15

HCM Unsignalized Intersection Capacity Analysis
6: Rosemont Junction & AZ-83 Page 4
Operations Year 5, 50% Carpool with no Copper Concentrate Trucks, Non-Peak Season, Weekend, AM Synchro 7 Report
Tetra Tech ISG 2/5/2010
Movement EBL EBR NBL NBT SBT SBR
Lane Configurations
Volume (veh/h) 2 0 2 115 63 0
Sign Control Yield Free Free
Grade 0% 0% 0%
Peak Hour Factor 0.92 0.92 0.92 0.92 0.92 0.92
Hourly flow rate (vph) 2 0 2 125 68 0
Pedestrians
Lane Width (ft)
Walking Speed (ft/s)
Percent Blockage
Right turn flare (veh)
Median type None None
Median storage veh)
Upstream signal (ft)
pX, platoon unblocked
vC, conflicting volume 198 68 68
vC1, stage 1 conf vol
vC2, stage 2 conf vol
vCu, unblocked vol 198 68 68
tC, single (s) 6.5 6.3 4.2
tC, 2 stage (s)
tF (s) 3.6 3.4 2.3
p0 queue free % 100 100 100
cM capacity (veh/h) 781 984 1508
Direction, Lane # EB 1 NB 1 SB 1
Volume Total 2 127 68
Volume Left 2 2 0
Volume Right 0 0 0
cSH 781 1508 1700
Volume to Capacity 0.00 0.00 0.04
Queue Length 95th (ft) 0 0 0
Control Delay (s) 9.6 0.1 0.0
Lane LOS A A
Approach Delay (s) 9.6 0.1 0.0
Approach LOS A
Intersection Summary
Average Delay 0.2
Intersection Capacity Utilization 17.7% ICU Level of Service A
Analysis Period (min) 15

HCM Unsignalized Intersection Capacity Analysis
7: AZ-83 & Greaterville Rd. Page 5
Operations Year 5, 50% Carpool with no Copper Concentrate Trucks, Non-Peak Season, Weekend, AM Synchro 7 Report
Tetra Tech ISG 2/5/2010
Movement SET SER NWL NWT NEL NER
Lane Configurations
Volume (veh/h) 106 0 0 96 2 5
Sign Control Free Free Yield
Grade 0% 0% 0%
Peak Hour Factor 0.92 0.92 0.92 0.92 0.92 0.92
Hourly flow rate (vph) 115 0 0 104 2 5
Pedestrians
Lane Width (ft)
Walking Speed (ft/s)
Percent Blockage
Right turn flare (veh)
Median type None None
Median storage veh)
Upstream signal (ft)
pX, platoon unblocked
vC, conflicting volume 115 220 115
vC1, stage 1 conf vol
vC2, stage 2 conf vol
vCu, unblocked vol 115 220 115
tC, single (s) 4.2 6.5 6.3
tC, 2 stage (s)
tF (s) 2.3 3.6 3.4
p0 queue free % 100 100 99
cM capacity (veh/h) 1449 760 926
Direction, Lane # SE 1 NW 1 NE 1
Volume Total 115 104 8
Volume Left 0 0 2
Volume Right 0 0 5
cSH 1700 1449 872
Volume to Capacity 0.07 0.00 0.01
Queue Length 95th (ft) 0 0 1
Control Delay (s) 0.0 0.0 9.2
Lane LOS A
Approach Delay (s) 0.0 0.0 9.2
Approach LOS A
Intersection Summary
Average Delay 0.3
Intersection Capacity Utilization 15.6% ICU Level of Service A
Analysis Period (min) 15

HCM Unsignalized Intersection Capacity Analysis
1: I-10 WB On-Off Ramp & AZ-83 Page 1
Operations Year 5, 50% Carpool with no Copper Concentrate Trucks, Non-Peak Season, Weekend, PM Synchro 7 Report
Tetra Tech ISG 2/5/2010
Movement EBL EBT WBT WBR SBL SBR
Lane Configurations
Volume (veh/h) 25 59 100 5 12 8
Sign Control Free Free Yield
Grade 0% 0% 0%
Peak Hour Factor 0.92 0.92 0.92 0.92 0.92 0.92
Hourly flow rate (vph) 27 64 109 5 13 9
Pedestrians
Lane Width (ft)
Walking Speed (ft/s)
Percent Blockage
Right turn flare (veh)
Median type None None
Median storage veh)
Upstream signal (ft)
pX, platoon unblocked
vC, conflicting volume 114 230 111
vC1, stage 1 conf vol
vC2, stage 2 conf vol
vCu, unblocked vol 114 230 111
tC, single (s) 4.2 6.5 6.3
tC, 2 stage (s)
tF (s) 2.3 3.6 3.4
p0 queue free % 98 98 99
cM capacity (veh/h) 1450 735 931
Direction, Lane # EB 1 WB 1 SB 1
Volume Total 91 114 22
Volume Left 27 0 13
Volume Right 0 5 9
cSH 1450 1700 803
Volume to Capacity 0.02 0.07 0.03
Queue Length 95th (ft) 1 0 2
Control Delay (s) 2.3 0.0 9.6
Lane LOS A A
Approach Delay (s) 2.3 0.0 9.6
Approach LOS A
Intersection Summary
Average Delay 1.9
Intersection Capacity Utilization 21.2% ICU Level of Service A
Analysis Period (min) 15

HCM Unsignalized Intersection Capacity Analysis
2: AZ-83 & EB Off-Ramp Page 2
Operations Year 5, 50% Carpool with no Copper Concentrate Trucks, Non-Peak Season, Weekend, PM Synchro 7 Report
Tetra Tech ISG 2/5/2010
Movement NBL NBT NBR SBL SBT SBR SEL SER SWL SWR
Lane Configurations
Volume (veh/h) 0 185 38 0 78 0 0 285 0 0
Sign Control Free Free Yield Yield
Grade 0% 0% 0% 0%
Peak Hour Factor 0.92 0.92 0.92 0.92 0.92 0.92 0.92 0.92 0.92 0.92
Hourly flow rate (vph) 0 201 41 0 85 0 0 310 0 0
Pedestrians
Lane Width (ft)
Walking Speed (ft/s)
Percent Blockage
Right turn flare (veh)
Median type None None
Median storage veh)
Upstream signal (ft)
pX, platoon unblocked
vC, conflicting volume 85 242 327 85 596 286
vC1, stage 1 conf vol
vC2, stage 2 conf vol
vCu, unblocked vol 85 242 327 85 596 286
tC, single (s) 4.2 4.2 6.6 6.3 7.2 6.6
tC, 2 stage (s)
tF (s) 2.3 2.3 4.1 3.4 3.6 4.1
p0 queue free % 100 100 100 68 100 100
cM capacity (veh/h) 1487 1301 585 963 278 617
Direction, Lane # NB 1 NB 2 SB 1 SE 1
Volume Total 201 41 85 310
Volume Left 0 0 0 0
Volume Right 0 41 0 310
cSH 1700 1700 1700 963
Volume to Capacity 0.12 0.02 0.05 0.32
Queue Length 95th (ft) 0 0 0 35
Control Delay (s) 0.0 0.0 0.0 10.5
Lane LOS B
Approach Delay (s) 0.0 0.0 10.5
Approach LOS B
Intersection Summary
Average Delay 5.1
Intersection Capacity Utilization 28.4% ICU Level of Service A
Analysis Period (min) 15

HCM Unsignalized Intersection Capacity Analysis
3: Sahuarita Rd. & AZ-83 Page 1
Operations Year 5, 50% Carpool with no Copper Concentrate Trucks, Non-Peak Season, Weekend, PM Synchro 7 Report
Tetra Tech ISG 2/5/2010
Movement EBL EBR NBL NBT SBT SBR
Lane Configurations
Volume (veh/h) 39 15 56 217 132 17
Sign Control Yield Free Free
Grade 0% 0% 0%
Peak Hour Factor 0.92 0.92 0.92 0.92 0.92 0.92
Hourly flow rate (vph) 42 16 61 236 143 18
Pedestrians
Lane Width (ft)
Walking Speed (ft/s)
Percent Blockage
Right turn flare (veh)
Median type None None
Median storage veh)
Upstream signal (ft)
pX, platoon unblocked
vC, conflicting volume 510 153 162
vC1, stage 1 conf vol
vC2, stage 2 conf vol
vCu, unblocked vol 510 153 162
tC, single (s) 6.5 6.3 4.2
tC, 2 stage (s)
tF (s) 3.6 3.4 2.3
p0 queue free % 91 98 96
cM capacity (veh/h) 494 883 1393
Direction, Lane # EB 1 NB 1 SB 1
Volume Total 59 297 162
Volume Left 42 61 0
Volume Right 16 0 18
cSH 562 1393 1700
Volume to Capacity 0.10 0.04 0.10
Queue Length 95th (ft) 9 3 0
Control Delay (s) 12.1 1.9 0.0
Lane LOS B A
Approach Delay (s) 12.1 1.9 0.0
Approach LOS B
Intersection Summary
Average Delay 2.5
Intersection Capacity Utilization 35.8% ICU Level of Service A
Analysis Period (min) 15

HCM Unsignalized Intersection Capacity Analysis
4: Hilton Ranch Rd. & AZ-83 Page 2
Operations Year 5, 50% Carpool with no Copper Concentrate Trucks, Non-Peak Season, Weekend, PM Synchro 7 Report
Tetra Tech ISG 2/5/2010
Movement WBL WBR NBT NBR SBL SBT
Lane Configurations
Volume (veh/h) 0 2 202 7 2 135
Sign Control Yield Free Free
Grade 0% 0% 0%
Peak Hour Factor 0.92 0.92 0.92 0.92 0.92 0.92
Hourly flow rate (vph) 0 2 220 8 2 147
Pedestrians
Lane Width (ft)
Walking Speed (ft/s)
Percent Blockage
Right turn flare (veh)
Median type None None
Median storage veh)
Upstream signal (ft)
pX, platoon unblocked
vC, conflicting volume 374 223 227
vC1, stage 1 conf vol
vC2, stage 2 conf vol
vCu, unblocked vol 374 223 227
tC, single (s) 6.5 6.3 4.2
tC, 2 stage (s)
tF (s) 3.6 3.4 2.3
p0 queue free % 100 100 100
cM capacity (veh/h) 618 806 1318
Direction, Lane # WB 1 NB 1 SB 1
Volume Total 2 227 149
Volume Left 0 0 2
Volume Right 2 8 0
cSH 806 1700 1318
Volume to Capacity 0.00 0.13 0.00
Queue Length 95th (ft) 0 0 0
Control Delay (s) 9.5 0.0 0.1
Lane LOS A A
Approach Delay (s) 9.5 0.0 0.1
Approach LOS A
Intersection Summary
Average Delay 0.1
Intersection Capacity Utilization 21.1% ICU Level of Service A
Analysis Period (min) 15

HCM Unsignalized Intersection Capacity Analysis
5: Hidden Valley Rd. & AZ-83 Page 3
Operations Year 5, 50% Carpool with no Copper Concentrate Trucks, Non-Peak Season, Weekend, PM Synchro 7 Report
Tetra Tech ISG 2/5/2010
Movement EBL EBR NBL NBT SBT SBR
Lane Configurations
Volume (veh/h) 91 128 21 99 44 64
Sign Control Yield Free Free
Grade 0% 0% 0%
Peak Hour Factor 0.92 0.92 0.92 0.92 0.92 0.92
Hourly flow rate (vph) 99 139 23 108 48 70
Pedestrians
Lane Width (ft)
Walking Speed (ft/s)
Percent Blockage
Right turn flare (veh)
Median type None None
Median storage veh)
Upstream signal (ft)
pX, platoon unblocked
vC, conflicting volume 236 83 117
vC1, stage 1 conf vol
vC2, stage 2 conf vol
vCu, unblocked vol 236 83 117
tC, single (s) 6.5 6.3 4.2
tC, 2 stage (s)
tF (s) 3.6 3.4 2.3
p0 queue free % 86 86 98
cM capacity (veh/h) 732 966 1446
Direction, Lane # EB 1 NB 1 SB 1
Volume Total 238 130 117
Volume Left 99 23 0
Volume Right 139 0 70
cSH 853 1446 1700
Volume to Capacity 0.28 0.02 0.07
Queue Length 95th (ft) 29 1 0
Control Delay (s) 10.8 1.4 0.0
Lane LOS B A
Approach Delay (s) 10.8 1.4 0.0
Approach LOS B
Intersection Summary
Average Delay 5.7
Intersection Capacity Utilization 32.6% ICU Level of Service A
Analysis Period (min) 15
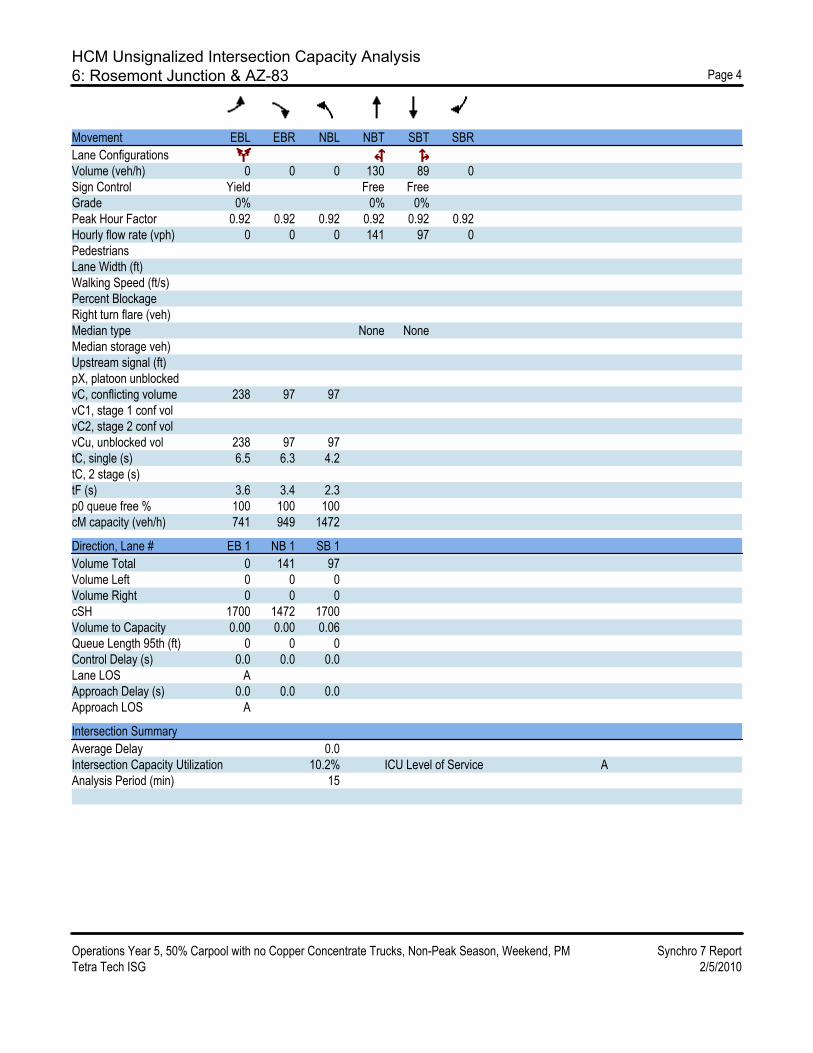
HCM Unsignalized Intersection Capacity Analysis
6: Rosemont Junction & AZ-83 Page 4
Operations Year 5, 50% Carpool with no Copper Concentrate Trucks, Non-Peak Season, Weekend, PM Synchro 7 Report
Tetra Tech ISG 2/5/2010
Movement EBL EBR NBL NBT SBT SBR
Lane Configurations
Volume (veh/h) 0 0 0 130 89 0
Sign Control Yield Free Free
Grade 0% 0% 0%
Peak Hour Factor 0.92 0.92 0.92 0.92 0.92 0.92
Hourly flow rate (vph) 0 0 0 141 97 0
Pedestrians
Lane Width (ft)
Walking Speed (ft/s)
Percent Blockage
Right turn flare (veh)
Median type None None
Median storage veh)
Upstream signal (ft)
pX, platoon unblocked
vC, conflicting volume 238 97 97
vC1, stage 1 conf vol
vC2, stage 2 conf vol
vCu, unblocked vol 238 97 97
tC, single (s) 6.5 6.3 4.2
tC, 2 stage (s)
tF (s) 3.6 3.4 2.3
p0 queue free % 100 100 100
cM capacity (veh/h) 741 949 1472
Direction, Lane # EB 1 NB 1 SB 1
Volume Total 0 141 97
Volume Left 0 0 0
Volume Right 0 0 0
cSH 1700 1472 1700
Volume to Capacity 0.00 0.00 0.06
Queue Length 95th (ft) 0 0 0
Control Delay (s) 0.0 0.0 0.0
Lane LOS A
Approach Delay (s) 0.0 0.0 0.0
Approach LOS A
Intersection Summary
Average Delay 0.0
Intersection Capacity Utilization 10.2% ICU Level of Service A
Analysis Period (min) 15

HCM Unsignalized Intersection Capacity Analysis
7: AZ-83 & Greaterville Rd. Page 5
Operations Year 5, 50% Carpool with no Copper Concentrate Trucks, Non-Peak Season, Weekend, PM Synchro 7 Report
Tetra Tech ISG 2/5/2010
Movement SET SER NWL NWT NEL NER
Lane Configurations
Volume (veh/h) 135 5 7 147 2 5
Sign Control Free Free Yield
Grade 0% 0% 0%
Peak Hour Factor 0.92 0.92 0.92 0.92 0.92 0.92
Hourly flow rate (vph) 147 5 8 160 2 5
Pedestrians
Lane Width (ft)
Walking Speed (ft/s)
Percent Blockage
Right turn flare (veh)
Median type None None
Median storage veh)
Upstream signal (ft)
pX, platoon unblocked
vC, conflicting volume 152 324 149
vC1, stage 1 conf vol
vC2, stage 2 conf vol
vCu, unblocked vol 152 324 149
tC, single (s) 4.2 6.5 6.3
tC, 2 stage (s)
tF (s) 2.3 3.6 3.4
p0 queue free % 99 100 99
cM capacity (veh/h) 1404 658 887
Direction, Lane # SE 1 NW 1 NE 1
Volume Total 152 167 8
Volume Left 0 8 2
Volume Right 5 0 5
cSH 1700 1404 806
Volume to Capacity 0.09 0.01 0.01
Queue Length 95th (ft) 0 0 1
Control Delay (s) 0.0 0.4 9.5
Lane LOS A A
Approach Delay (s) 0.0 0.4 9.5
Approach LOS A
Intersection Summary
Average Delay 0.4
Intersection Capacity Utilization 23.4% ICU Level of Service A
Analysis Period (min) 15

PEAK SEASON
SCENARIO 5
50% CARPOOL WITH NO COPPER CONCENTRATE
TRUCKS

HCM Unsignalized Intersection Capacity Analysis
1: I-10 WB On-Off Ramp & AZ-83 Page 1
Operations Year 5, 50% Carpool with no Copper Concentrate Trucks, Peak Season, Weekday, AM Synchro 7 Report
Tetra Tech ISG 2/5/2010
Movement EBL EBT WBT WBR SBL SBR
Lane Configurations
Volume (veh/h) 8 47 435 4 11 29
Sign Control Free Free Yield
Grade 0% 0% 0%
Peak Hour Factor 0.92 0.92 0.92 0.92 0.92 0.92
Hourly flow rate (vph) 9 51 473 4 12 32
Pedestrians
Lane Width (ft)
Walking Speed (ft/s)
Percent Blockage
Right turn flare (veh)
Median type None None
Median storage veh)
Upstream signal (ft)
pX, platoon unblocked
vC, conflicting volume 477 543 475
vC1, stage 1 conf vol
vC2, stage 2 conf vol
vCu, unblocked vol 477 543 475
tC, single (s) 4.2 6.5 6.3
tC, 2 stage (s)
tF (s) 2.3 3.6 3.4
p0 queue free % 99 98 95
cM capacity (veh/h) 1064 490 582
Direction, Lane # EB 1 WB 1 SB 1
Volume Total 60 477 43
Volume Left 9 0 12
Volume Right 0 4 32
cSH 1064 1700 553
Volume to Capacity 0.01 0.28 0.08
Queue Length 95th (ft) 1 0 6
Control Delay (s) 1.3 0.0 12.1
Lane LOS A B
Approach Delay (s) 1.3 0.0 12.1
Approach LOS B
Intersection Summary
Average Delay 1.0
Intersection Capacity Utilization 33.1% ICU Level of Service A
Analysis Period (min) 15

HCM Unsignalized Intersection Capacity Analysis
2: AZ-83 & EB Off-Ramp Page 2
Operations Year 5, 50% Carpool with no Copper Concentrate Trucks, Peak Season, Weekday, AM Synchro 7 Report
Tetra Tech ISG 2/5/2010
Movement NBL NBT NBR SBL SBT SBR SEL SER SWL SWR
Lane Configurations
Volume (veh/h) 0 293 28 0 27 0 0 213 0 0
Sign Control Free Free Yield Yield
Grade 0% 0% 0% 0%
Peak Hour Factor 0.92 0.92 0.92 0.92 0.92 0.92 0.92 0.92 0.92 0.92
Hourly flow rate (vph) 0 318 30 0 29 0 0 232 0 0
Pedestrians
Lane Width (ft)
Walking Speed (ft/s)
Percent Blockage
Right turn flare (veh)
Median type None None
Median storage veh)
Upstream signal (ft)
pX, platoon unblocked
vC, conflicting volume 29 349 378 29 579 348
vC1, stage 1 conf vol
vC2, stage 2 conf vol
vCu, unblocked vol 29 349 378 29 579 348
tC, single (s) 4.2 4.2 6.6 6.3 7.2 6.6
tC, 2 stage (s)
tF (s) 2.3 2.3 4.1 3.4 3.6 4.1
p0 queue free % 100 100 100 78 100 100
cM capacity (veh/h) 1558 1188 547 1034 326 569
Direction, Lane # NB 1 NB 2 SB 1 SE 1
Volume Total 318 30 29 232
Volume Left 0 0 0 0
Volume Right 0 30 0 232
cSH 1700 1700 1700 1034
Volume to Capacity 0.19 0.02 0.02 0.22
Queue Length 95th (ft) 0 0 0 21
Control Delay (s) 0.0 0.0 0.0 9.5
Lane LOS A
Approach Delay (s) 0.0 0.0 9.5
Approach LOS A
Intersection Summary
Average Delay 3.6
Intersection Capacity Utilization 23.2% ICU Level of Service A
Analysis Period (min) 15

HCM Unsignalized Intersection Capacity Analysis
3: Sahuarita Rd. & AZ-83 Page 1
Operations Year 5, 50% Carpool with no Copper Concentrate Trucks, Peak Season, Weekday, AM Synchro 7 Report
Tetra Tech ISG 2/5/2010
Movement EBL EBR NBL NBT SBT SBR
Lane Configurations
Volume (veh/h) 41 19 5 205 199 27
Sign Control Yield Free Free
Grade 0% 0% 0%
Peak Hour Factor 0.92 0.92 0.92 0.92 0.92 0.92
Hourly flow rate (vph) 45 21 5 223 216 29
Pedestrians
Lane Width (ft)
Walking Speed (ft/s)
Percent Blockage
Right turn flare (veh)
Median type None None
Median storage veh)
Upstream signal (ft)
pX, platoon unblocked
vC, conflicting volume 465 231 246
vC1, stage 1 conf vol
vC2, stage 2 conf vol
vCu, unblocked vol 465 231 246
tC, single (s) 6.5 6.3 4.2
tC, 2 stage (s)
tF (s) 3.6 3.4 2.3
p0 queue free % 92 97 100
cM capacity (veh/h) 546 798 1297
Direction, Lane # EB 1 NB 1 SB 1
Volume Total 65 228 246
Volume Left 45 5 0
Volume Right 21 0 29
cSH 607 1297 1700
Volume to Capacity 0.11 0.00 0.14
Queue Length 95th (ft) 9 0 0
Control Delay (s) 11.6 0.2 0.0
Lane LOS B A
Approach Delay (s) 11.6 0.2 0.0
Approach LOS B
Intersection Summary
Average Delay 1.5
Intersection Capacity Utilization 24.9% ICU Level of Service A
Analysis Period (min) 15

HCM Unsignalized Intersection Capacity Analysis
4: Hilton Ranch Rd. & AZ-83 Page 2
Operations Year 5, 50% Carpool with no Copper Concentrate Trucks, Peak Season, Weekday, AM Synchro 7 Report
Tetra Tech ISG 2/5/2010
Movement WBL WBR NBT NBR SBL SBT
Lane Configurations
Volume (veh/h) 0 12 118 0 5 213
Sign Control Yield Free Free
Grade 0% 0% 0%
Peak Hour Factor 0.92 0.92 0.92 0.92 0.92 0.92
Hourly flow rate (vph) 0 13 128 0 5 232
Pedestrians
Lane Width (ft)
Walking Speed (ft/s)
Percent Blockage
Right turn flare (veh)
Median type None None
Median storage veh)
Upstream signal (ft)
pX, platoon unblocked
vC, conflicting volume 371 128 128
vC1, stage 1 conf vol
vC2, stage 2 conf vol
vCu, unblocked vol 371 128 128
tC, single (s) 6.5 6.3 4.2
tC, 2 stage (s)
tF (s) 3.6 3.4 2.3
p0 queue free % 100 99 100
cM capacity (veh/h) 620 911 1433
Direction, Lane # WB 1 NB 1 SB 1
Volume Total 13 128 237
Volume Left 0 0 5
Volume Right 13 0 0
cSH 911 1700 1433
Volume to Capacity 0.01 0.08 0.00
Queue Length 95th (ft) 1 0 0
Control Delay (s) 9.0 0.0 0.2
Lane LOS A A
Approach Delay (s) 9.0 0.0 0.2
Approach LOS A
Intersection Summary
Average Delay 0.4
Intersection Capacity Utilization 25.2% ICU Level of Service A
Analysis Period (min) 15

HCM Unsignalized Intersection Capacity Analysis
5: Hidden Valley Rd. & AZ-83 Page 3
Operations Year 5, 50% Carpool with no Copper Concentrate Trucks, Peak Season, Weekday, AM Synchro 7 Report
Tetra Tech ISG 2/5/2010
Movement EBL EBR NBL NBT SBT SBR
Lane Configurations
Volume (veh/h) 64 24 50 75 48 153
Sign Control Yield Free Free
Grade 0% 0% 0%
Peak Hour Factor 0.92 0.92 0.92 0.92 0.92 0.92
Hourly flow rate (vph) 70 26 54 82 52 166
Pedestrians
Lane Width (ft)
Walking Speed (ft/s)
Percent Blockage
Right turn flare (veh)
Median type None None
Median storage veh)
Upstream signal (ft)
pX, platoon unblocked
vC, conflicting volume 326 135 218
vC1, stage 1 conf vol
vC2, stage 2 conf vol
vCu, unblocked vol 326 135 218
tC, single (s) 6.5 6.3 4.2
tC, 2 stage (s)
tF (s) 3.6 3.4 2.3
p0 queue free % 89 97 96
cM capacity (veh/h) 633 903 1328
Direction, Lane # EB 1 NB 1 SB 1
Volume Total 96 136 218
Volume Left 70 54 0
Volume Right 26 0 166
cSH 689 1328 1700
Volume to Capacity 0.14 0.04 0.13
Queue Length 95th (ft) 12 3 0
Control Delay (s) 11.1 3.3 0.0
Lane LOS B A
Approach Delay (s) 11.1 3.3 0.0
Approach LOS B
Intersection Summary
Average Delay 3.4
Intersection Capacity Utilization 33.7% ICU Level of Service A
Analysis Period (min) 15

HCM Unsignalized Intersection Capacity Analysis
6: Rosemont Junction & AZ-83 Page 4
Operations Year 5, 50% Carpool with no Copper Concentrate Trucks, Peak Season, Weekday, AM Synchro 7 Report
Tetra Tech ISG 2/5/2010
Movement EBL EBR NBL NBT SBT SBR
Lane Configurations
Volume (veh/h) 2 2 2 147 89 0
Sign Control Yield Free Free
Grade 0% 0% 0%
Peak Hour Factor 0.92 0.92 0.92 0.92 0.92 0.92
Hourly flow rate (vph) 2 2 2 160 97 0
Pedestrians
Lane Width (ft)
Walking Speed (ft/s)
Percent Blockage
Right turn flare (veh)
Median type None None
Median storage veh)
Upstream signal (ft)
pX, platoon unblocked
vC, conflicting volume 261 97 97
vC1, stage 1 conf vol
vC2, stage 2 conf vol
vCu, unblocked vol 261 97 97
tC, single (s) 6.5 6.3 4.2
tC, 2 stage (s)
tF (s) 3.6 3.4 2.3
p0 queue free % 100 100 100
cM capacity (veh/h) 718 949 1472
Direction, Lane # EB 1 NB 1 SB 1
Volume Total 4 162 97
Volume Left 2 2 0
Volume Right 2 0 0
cSH 818 1472 1700
Volume to Capacity 0.01 0.00 0.06
Queue Length 95th (ft) 0 0 0
Control Delay (s) 9.4 0.1 0.0
Lane LOS A A
Approach Delay (s) 9.4 0.1 0.0
Approach LOS A
Intersection Summary
Average Delay 0.2
Intersection Capacity Utilization 19.3% ICU Level of Service A
Analysis Period (min) 15

HCM Unsignalized Intersection Capacity Analysis
7: AZ-83 & Greaterville Rd. Page 5
Operations Year 5, 50% Carpool with no Copper Concentrate Trucks, Peak Season, Weekday, AM Synchro 7 Report
Tetra Tech ISG 2/5/2010
Movement SET SER NWL NWT NEL NER
Lane Configurations
Volume (veh/h) 75 2 0 130 2 0
Sign Control Free Free Yield
Grade 0% 0% 0%
Peak Hour Factor 0.92 0.92 0.92 0.92 0.92 0.92
Hourly flow rate (vph) 82 2 0 141 2 0
Pedestrians
Lane Width (ft)
Walking Speed (ft/s)
Percent Blockage
Right turn flare (veh)
Median type None None
Median storage veh)
Upstream signal (ft)
pX, platoon unblocked
vC, conflicting volume 84 224 83
vC1, stage 1 conf vol
vC2, stage 2 conf vol
vCu, unblocked vol 84 224 83
tC, single (s) 4.2 6.5 6.3
tC, 2 stage (s)
tF (s) 2.3 3.6 3.4
p0 queue free % 100 100 100
cM capacity (veh/h) 1488 755 966
Direction, Lane # SE 1 NW 1 NE 1
Volume Total 84 141 2
Volume Left 0 0 2
Volume Right 2 0 0
cSH 1700 1488 755
Volume to Capacity 0.05 0.00 0.00
Queue Length 95th (ft) 0 0 0
Control Delay (s) 0.0 0.0 9.8
Lane LOS A
Approach Delay (s) 0.0 0.0 9.8
Approach LOS A
Intersection Summary
Average Delay 0.1
Intersection Capacity Utilization 16.8% ICU Level of Service A
Analysis Period (min) 15

HCM Unsignalized Intersection Capacity Analysis
1: I-10 WB On-Off Ramp & AZ-83 Page 1
Operations Year 5, 50% Carpool with no Copper Concentrate Trucks, Peak Season, Weekday, PM Synchro 7 Report
Tetra Tech ISG 2/5/2010
Movement EBL EBT WBT WBR SBL SBR
Lane Configurations
Volume (veh/h) 23 64 189 6 8 7
Sign Control Free Free Yield
Grade 0% 0% 0%
Peak Hour Factor 0.92 0.92 0.92 0.92 0.92 0.92
Hourly flow rate (vph) 25 70 205 7 9 8
Pedestrians
Lane Width (ft)
Walking Speed (ft/s)
Percent Blockage
Right turn flare (veh)
Median type None None
Median storage veh)
Upstream signal (ft)
pX, platoon unblocked
vC, conflicting volume 212 328 209
vC1, stage 1 conf vol
vC2, stage 2 conf vol
vCu, unblocked vol 212 328 209
tC, single (s) 4.2 6.5 6.3
tC, 2 stage (s)
tF (s) 2.3 3.6 3.4
p0 queue free % 98 99 99
cM capacity (veh/h) 1335 646 822
Direction, Lane # EB 1 WB 1 SB 1
Volume Total 95 212 16
Volume Left 25 0 9
Volume Right 0 7 8
cSH 1335 1700 717
Volume to Capacity 0.02 0.12 0.02
Queue Length 95th (ft) 1 0 2
Control Delay (s) 2.2 0.0 10.1
Lane LOS A B
Approach Delay (s) 2.2 0.0 10.1
Approach LOS B
Intersection Summary
Average Delay 1.1
Intersection Capacity Utilization 28.3% ICU Level of Service A
Analysis Period (min) 15

HCM Unsignalized Intersection Capacity Analysis
2: AZ-83 & EB Off-Ramp Page 2
Operations Year 5, 50% Carpool with no Copper Concentrate Trucks, Peak Season, Weekday, PM Synchro 7 Report
Tetra Tech ISG 2/5/2010
Movement NBL NBT NBR SBL SBT SBR SEL SER SWL SWR
Lane Configurations
Volume (veh/h) 0 268 41 0 59 0 0 119 0 0
Sign Control Free Free Yield Yield
Grade 0% 0% 0% 0%
Peak Hour Factor 0.92 0.92 0.92 0.92 0.92 0.92 0.92 0.92 0.92 0.92
Hourly flow rate (vph) 0 291 45 0 64 0 0 129 0 0
Pedestrians
Lane Width (ft)
Walking Speed (ft/s)
Percent Blockage
Right turn flare (veh)
Median type None None
Median storage veh)
Upstream signal (ft)
pX, platoon unblocked
vC, conflicting volume 64 336 400 64 485 355
vC1, stage 1 conf vol
vC2, stage 2 conf vol
vCu, unblocked vol 64 336 400 64 485 355
tC, single (s) 4.2 4.2 6.6 6.3 7.2 6.6
tC, 2 stage (s)
tF (s) 2.3 2.3 4.1 3.4 3.6 4.1
p0 queue free % 100 100 100 87 100 100
cM capacity (veh/h) 1513 1201 532 989 422 564
Direction, Lane # NB 1 NB 2 SB 1 SE 1
Volume Total 291 45 64 129
Volume Left 0 0 0 0
Volume Right 0 45 0 129
cSH 1700 1700 1700 989
Volume to Capacity 0.17 0.03 0.04 0.13
Queue Length 95th (ft) 0 0 0 11
Control Delay (s) 0.0 0.0 0.0 9.2
Lane LOS A
Approach Delay (s) 0.0 0.0 9.2
Approach LOS A
Intersection Summary
Average Delay 2.2
Intersection Capacity Utilization 17.4% ICU Level of Service A
Analysis Period (min) 15

HCM Unsignalized Intersection Capacity Analysis
3: Sahuarita Rd. & AZ-83 Page 1
Operations Year 5, 50% Carpool with no Copper Concentrate Trucks, Peak Season, Weekday, PM Synchro 7 Report
Tetra Tech ISG 2/5/2010
Movement EBL EBR NBL NBT SBT SBR
Lane Configurations
Volume (veh/h) 22 15 34 252 222 48
Sign Control Yield Free Free
Grade 0% 0% 0%
Peak Hour Factor 0.92 0.92 0.92 0.92 0.92 0.92
Hourly flow rate (vph) 24 16 37 274 241 52
Pedestrians
Lane Width (ft)
Walking Speed (ft/s)
Percent Blockage
Right turn flare (veh)
Median type None None
Median storage veh)
Upstream signal (ft)
pX, platoon unblocked
vC, conflicting volume 615 267 293
vC1, stage 1 conf vol
vC2, stage 2 conf vol
vCu, unblocked vol 615 267 293
tC, single (s) 6.5 6.3 4.2
tC, 2 stage (s)
tF (s) 3.6 3.4 2.3
p0 queue free % 95 98 97
cM capacity (veh/h) 435 762 1246
Direction, Lane # EB 1 NB 1 SB 1
Volume Total 40 311 293
Volume Left 24 37 0
Volume Right 16 0 52
cSH 526 1246 1700
Volume to Capacity 0.08 0.03 0.17
Queue Length 95th (ft) 6 2 0
Control Delay (s) 12.4 1.2 0.0
Lane LOS B A
Approach Delay (s) 12.4 1.2 0.0
Approach LOS B
Intersection Summary
Average Delay 1.4
Intersection Capacity Utilization 43.1% ICU Level of Service A
Analysis Period (min) 15

HCM Unsignalized Intersection Capacity Analysis
4: Hilton Ranch Rd. & AZ-83 Page 2
Operations Year 5, 50% Carpool with no Copper Concentrate Trucks, Peak Season, Weekday, PM Synchro 7 Report
Tetra Tech ISG 2/5/2010
Movement WBL WBR NBT NBR SBL SBT
Lane Configurations
Volume (veh/h) 0 5 276 2 19 155
Sign Control Yield Free Free
Grade 0% 0% 0%
Peak Hour Factor 0.92 0.92 0.92 0.92 0.92 0.92
Hourly flow rate (vph) 0 5 300 2 21 168
Pedestrians
Lane Width (ft)
Walking Speed (ft/s)
Percent Blockage
Right turn flare (veh)
Median type None None
Median storage veh)
Upstream signal (ft)
pX, platoon unblocked
vC, conflicting volume 511 301 302
vC1, stage 1 conf vol
vC2, stage 2 conf vol
vCu, unblocked vol 511 301 302
tC, single (s) 6.5 6.3 4.2
tC, 2 stage (s)
tF (s) 3.6 3.4 2.3
p0 queue free % 100 99 98
cM capacity (veh/h) 507 729 1236
Direction, Lane # WB 1 NB 1 SB 1
Volume Total 5 302 189
Volume Left 0 0 21
Volume Right 5 2 0
cSH 729 1700 1236
Volume to Capacity 0.01 0.18 0.02
Queue Length 95th (ft) 1 0 1
Control Delay (s) 10.0 0.0 1.0
Lane LOS A A
Approach Delay (s) 10.0 0.0 1.0
Approach LOS A
Intersection Summary
Average Delay 0.5
Intersection Capacity Utilization 34.1% ICU Level of Service A
Analysis Period (min) 15

HCM Unsignalized Intersection Capacity Analysis
5: Hidden Valley Rd. & AZ-83 Page 3
Operations Year 5, 50% Carpool with no Copper Concentrate Trucks, Peak Season, Weekday, PM Synchro 7 Report
Tetra Tech ISG 2/5/2010
Movement EBL EBR NBL NBT SBT SBR
Lane Configurations
Volume (veh/h) 153 52 21 111 119 64
Sign Control Yield Free Free
Grade 0% 0% 0%
Peak Hour Factor 0.92 0.92 0.92 0.92 0.92 0.92
Hourly flow rate (vph) 166 57 23 121 129 70
Pedestrians
Lane Width (ft)
Walking Speed (ft/s)
Percent Blockage
Right turn flare (veh)
Median type None None
Median storage veh)
Upstream signal (ft)
pX, platoon unblocked
vC, conflicting volume 330 164 199
vC1, stage 1 conf vol
vC2, stage 2 conf vol
vCu, unblocked vol 330 164 199
tC, single (s) 6.5 6.3 4.2
tC, 2 stage (s)
tF (s) 3.6 3.4 2.3
p0 queue free % 74 94 98
cM capacity (veh/h) 645 870 1350
Direction, Lane # EB 1 NB 1 SB 1
Volume Total 223 143 199
Volume Left 166 23 0
Volume Right 57 0 70
cSH 690 1350 1700
Volume to Capacity 0.32 0.02 0.12
Queue Length 95th (ft) 35 1 0
Control Delay (s) 12.7 1.3 0.0
Lane LOS B A
Approach Delay (s) 12.7 1.3 0.0
Approach LOS B
Intersection Summary
Average Delay 5.3
Intersection Capacity Utilization 38.8% ICU Level of Service A
Analysis Period (min) 15

HCM Unsignalized Intersection Capacity Analysis
6: Rosemont Junction & AZ-83 Page 4
Operations Year 5, 50% Carpool with no Copper Concentrate Trucks, Peak Season, Weekday, PM Synchro 7 Report
Tetra Tech ISG 2/5/2010
Movement EBL EBR NBL NBT SBT SBR
Lane Configurations
Volume (veh/h) 0 0 0 128 200 0
Sign Control Yield Free Free
Grade 0% 0% 0%
Peak Hour Factor 0.92 0.92 0.92 0.92 0.92 0.92
Hourly flow rate (vph) 0 0 0 139 217 0
Pedestrians
Lane Width (ft)
Walking Speed (ft/s)
Percent Blockage
Right turn flare (veh)
Median type None None
Median storage veh)
Upstream signal (ft)
pX, platoon unblocked
vC, conflicting volume 357 217 217
vC1, stage 1 conf vol
vC2, stage 2 conf vol
vCu, unblocked vol 357 217 217
tC, single (s) 6.5 6.3 4.2
tC, 2 stage (s)
tF (s) 3.6 3.4 2.3
p0 queue free % 100 100 100
cM capacity (veh/h) 634 812 1329
Direction, Lane # EB 1 NB 1 SB 1
Volume Total 0 139 217
Volume Left 0 0 0
Volume Right 0 0 0
cSH 1700 1329 1700
Volume to Capacity 0.00 0.00 0.13
Queue Length 95th (ft) 0 0 0
Control Delay (s) 0.0 0.0 0.0
Lane LOS A
Approach Delay (s) 0.0 0.0 0.0
Approach LOS A
Intersection Summary
Average Delay 0.0
Intersection Capacity Utilization 13.9% ICU Level of Service A
Analysis Period (min) 15

HCM Unsignalized Intersection Capacity Analysis
7: AZ-83 & Greaterville Rd. Page 5
Operations Year 5, 50% Carpool with no Copper Concentrate Trucks, Peak Season, Weekday, PM Synchro 7 Report
Tetra Tech ISG 2/5/2010
Movement SET SER NWL NWT NEL NER
Lane Configurations
Volume (veh/h) 176 2 5 89 2 0
Sign Control Free Free Yield
Grade 0% 0% 0%
Peak Hour Factor 0.92 0.92 0.92 0.92 0.92 0.92
Hourly flow rate (vph) 191 2 5 97 2 0
Pedestrians
Lane Width (ft)
Walking Speed (ft/s)
Percent Blockage
Right turn flare (veh)
Median type None None
Median storage veh)
Upstream signal (ft)
pX, platoon unblocked
vC, conflicting volume 193 300 192
vC1, stage 1 conf vol
vC2, stage 2 conf vol
vCu, unblocked vol 193 300 192
tC, single (s) 4.2 6.5 6.3
tC, 2 stage (s)
tF (s) 2.3 3.6 3.4
p0 queue free % 100 100 100
cM capacity (veh/h) 1356 680 839
Direction, Lane # SE 1 NW 1 NE 1
Volume Total 193 102 2
Volume Left 0 5 2
Volume Right 2 0 0
cSH 1700 1356 680
Volume to Capacity 0.11 0.00 0.00
Queue Length 95th (ft) 0 0 0
Control Delay (s) 0.0 0.4 10.3
Lane LOS A B
Approach Delay (s) 0.0 0.4 10.3
Approach LOS B
Intersection Summary
Average Delay 0.2
Intersection Capacity Utilization 19.4% ICU Level of Service A
Analysis Period (min) 15

HCM Unsignalized Intersection Capacity Analysis
1: I-10 WB On-Off Ramp & AZ-83 Page 1
Operations Year 5, 50% Carpool with no Copper Concentrate Trucks, Peak Season, Weekend, AM Synchro 7 Report
Tetra Tech ISG 2/5/2010
Movement EBL EBT WBT WBR SBL SBR
Lane Configurations
Volume (veh/h) 4 22 301 5 13 19
Sign Control Free Free Yield
Grade 0% 0% 0%
Peak Hour Factor 0.92 0.92 0.92 0.92 0.92 0.92
Hourly flow rate (vph) 4 24 327 5 14 21
Pedestrians
Lane Width (ft)
Walking Speed (ft/s)
Percent Blockage
Right turn flare (veh)
Median type None None
Median storage veh)
Upstream signal (ft)
pX, platoon unblocked
vC, conflicting volume 333 362 330
vC1, stage 1 conf vol
vC2, stage 2 conf vol
vCu, unblocked vol 333 362 330
tC, single (s) 4.2 6.5 6.3
tC, 2 stage (s)
tF (s) 2.3 3.6 3.4
p0 queue free % 100 98 97
cM capacity (veh/h) 1205 626 702
Direction, Lane # EB 1 WB 1 SB 1
Volume Total 28 333 35
Volume Left 4 0 14
Volume Right 0 5 21
cSH 1205 1700 669
Volume to Capacity 0.00 0.20 0.05
Queue Length 95th (ft) 0 0 4
Control Delay (s) 1.3 0.0 10.7
Lane LOS A B
Approach Delay (s) 1.3 0.0 10.7
Approach LOS B
Intersection Summary
Average Delay 1.0
Intersection Capacity Utilization 26.1% ICU Level of Service A
Analysis Period (min) 15

HCM Unsignalized Intersection Capacity Analysis
2: AZ-83 & EB Off-Ramp Page 2
Operations Year 5, 50% Carpool with no Copper Concentrate Trucks, Peak Season, Weekend, AM Synchro 7 Report
Tetra Tech ISG 2/5/2010
Movement NBL NBT NBR SBL SBT SBR SEL SER SWL SWR
Lane Configurations
Volume (veh/h) 0 262 35 0 21 0 0 152 0 0
Sign Control Free Free Yield Yield
Grade 0% 0% 0% 0%
Peak Hour Factor 0.92 0.92 0.92 0.92 0.92 0.92 0.92 0.92 0.92 0.92
Hourly flow rate (vph) 0 285 38 0 23 0 0 165 0 0
Pedestrians
Lane Width (ft)
Walking Speed (ft/s)
Percent Blockage
Right turn flare (veh)
Median type None None
Median storage veh)
Upstream signal (ft)
pX, platoon unblocked
vC, conflicting volume 23 323 346 23 473 308
vC1, stage 1 conf vol
vC2, stage 2 conf vol
vCu, unblocked vol 23 323 346 23 473 308
tC, single (s) 4.2 4.2 6.6 6.3 7.2 6.6
tC, 2 stage (s)
tF (s) 2.3 2.3 4.1 3.4 3.6 4.1
p0 queue free % 100 100 100 84 100 100
cM capacity (veh/h) 1567 1215 571 1043 417 600
Direction, Lane # NB 1 NB 2 SB 1 SE 1
Volume Total 285 38 23 165
Volume Left 0 0 0 0
Volume Right 0 38 0 165
cSH 1700 1700 1700 1043
Volume to Capacity 0.17 0.02 0.01 0.16
Queue Length 95th (ft) 0 0 0 14
Control Delay (s) 0.0 0.0 0.0 9.1
Lane LOS A
Approach Delay (s) 0.0 0.0 9.1
Approach LOS A
Intersection Summary
Average Delay 2.9
Intersection Capacity Utilization 19.4% ICU Level of Service A
Analysis Period (min) 15

HCM Unsignalized Intersection Capacity Analysis
3: Sahuarita Rd. & AZ-83 Page 1
Operations Year 5, 50% Carpool with no Copper Concentrate Trucks, Peak Season, Weekend, AM Synchro 7 - Report
Tetra Tech ISG 2/5/2010
Movement EBL EBR NBL NBT SBT SBR
Lane Configurations
Volume (veh/h) 39 17 15 193 149 17
Sign Control Yield Free Free
Grade 0% 0% 0%
Peak Hour Factor 0.92 0.92 0.92 0.92 0.92 0.92
Hourly flow rate (vph) 42 18 16 210 162 18
Pedestrians
Lane Width (ft)
Walking Speed (ft/s)
Percent Blockage
Right turn flare (veh)
Median type None None
Median storage veh)
Upstream signal (ft)
pX, platoon unblocked
vC, conflicting volume 414 171 180
vC1, stage 1 conf vol
vC2, stage 2 conf vol
vCu, unblocked vol 414 171 180
tC, single (s) 6.5 6.3 4.2
tC, 2 stage (s)
tF (s) 3.6 3.4 2.3
p0 queue free % 93 98 99
cM capacity (veh/h) 580 862 1371
Direction, Lane # EB 1 NB 1 SB 1
Volume Total 61 226 180
Volume Left 42 16 0
Volume Right 18 0 18
cSH 644 1371 1700
Volume to Capacity 0.09 0.01 0.11
Queue Length 95th (ft) 8 1 0
Control Delay (s) 11.2 0.6 0.0
Lane LOS B A
Approach Delay (s) 11.2 0.6 0.0
Approach LOS B
Intersection Summary
Average Delay 1.8
Intersection Capacity Utilization 32.5% ICU Level of Service A
Analysis Period (min) 15

HCM Unsignalized Intersection Capacity Analysis
4: Hilton Ranch Rd. & AZ-83 Page 2
Operations Year 5, 50% Carpool with no Copper Concentrate Trucks, Peak Season, Weekend, AM Synchro 7 - Report
Tetra Tech ISG 2/5/2010
Movement WBL WBR NBT NBR SBL SBT
Lane Configurations
Volume (veh/h) 0 1 132 0 2 171
Sign Control Yield Free Free
Grade 0% 0% 0%
Peak Hour Factor 0.92 0.92 0.92 0.92 0.92 0.92
Hourly flow rate (vph) 0 1 143 0 2 186
Pedestrians
Lane Width (ft)
Walking Speed (ft/s)
Percent Blockage
Right turn flare (veh)
Median type None None
Median storage veh)
Upstream signal (ft)
pX, platoon unblocked
vC, conflicting volume 334 143 143
vC1, stage 1 conf vol
vC2, stage 2 conf vol
vCu, unblocked vol 334 143 143
tC, single (s) 6.5 6.3 4.2
tC, 2 stage (s)
tF (s) 3.6 3.4 2.3
p0 queue free % 100 100 100
cM capacity (veh/h) 652 893 1415
Direction, Lane # WB 1 NB 1 SB 1
Volume Total 1 143 188
Volume Left 0 0 2
Volume Right 1 0 0
cSH 893 1700 1415
Volume to Capacity 0.00 0.08 0.00
Queue Length 95th (ft) 0 0 0
Control Delay (s) 9.0 0.0 0.1
Lane LOS A A
Approach Delay (s) 9.0 0.0 0.1
Approach LOS A
Intersection Summary
Average Delay 0.1
Intersection Capacity Utilization 20.6% ICU Level of Service A
Analysis Period (min) 15

HCM Unsignalized Intersection Capacity Analysis
5: Hidden Valley Rd. & AZ-83 Page 3
Operations Year 5, 50% Carpool with no Copper Concentrate Trucks, Peak Season, Weekend, AM Synchro 7 - Report
Tetra Tech ISG 2/5/2010
Movement EBL EBR NBL NBT SBT SBR
Lane Configurations
Volume (veh/h) 64 21 28 77 31 45
Sign Control Yield Free Free
Grade 0% 0% 0%
Peak Hour Factor 0.92 0.92 0.92 0.92 0.92 0.92
Hourly flow rate (vph) 70 23 30 84 34 49
Pedestrians
Lane Width (ft)
Walking Speed (ft/s)
Percent Blockage
Right turn flare (veh)
Median type None None
Median storage veh)
Upstream signal (ft)
pX, platoon unblocked
vC, conflicting volume 203 58 83
vC1, stage 1 conf vol
vC2, stage 2 conf vol
vCu, unblocked vol 203 58 83
tC, single (s) 6.5 6.3 4.2
tC, 2 stage (s)
tF (s) 3.6 3.4 2.3
p0 queue free % 91 98 98
cM capacity (veh/h) 761 997 1490
Direction, Lane # EB 1 NB 1 SB 1
Volume Total 92 114 83
Volume Left 70 30 0
Volume Right 23 0 49
cSH 808 1490 1700
Volume to Capacity 0.11 0.02 0.05
Queue Length 95th (ft) 10 2 0
Control Delay (s) 10.0 2.1 0.0
Lane LOS B A
Approach Delay (s) 10.0 2.1 0.0
Approach LOS B
Intersection Summary
Average Delay 4.0
Intersection Capacity Utilization 23.8% ICU Level of Service A
Analysis Period (min) 15

HCM Unsignalized Intersection Capacity Analysis
6: Rosemont Junction & AZ-83 Page 4
Operations Year 5, 50% Carpool with no Copper Concentrate Trucks, Peak Season, Weekend, AM Synchro 7 - Report
Tetra Tech ISG 2/5/2010
Movement EBL EBR NBL NBT SBT SBR
Lane Configurations
Volume (veh/h) 2 0 0 123 104 2
Sign Control Yield Free Free
Grade 0% 0% 0%
Peak Hour Factor 0.92 0.92 0.92 0.92 0.92 0.92
Hourly flow rate (vph) 2 0 0 134 113 2
Pedestrians
Lane Width (ft)
Walking Speed (ft/s)
Percent Blockage
Right turn flare (veh)
Median type None None
Median storage veh)
Upstream signal (ft)
pX, platoon unblocked
vC, conflicting volume 248 114 115
vC1, stage 1 conf vol
vC2, stage 2 conf vol
vCu, unblocked vol 248 114 115
tC, single (s) 6.5 6.3 4.2
tC, 2 stage (s)
tF (s) 3.6 3.4 2.3
p0 queue free % 100 100 100
cM capacity (veh/h) 732 928 1449
Direction, Lane # EB 1 NB 1 SB 1
Volume Total 2 134 115
Volume Left 2 0 0
Volume Right 0 0 2
cSH 732 1449 1700
Volume to Capacity 0.00 0.00 0.07
Queue Length 95th (ft) 0 0 0
Control Delay (s) 9.9 0.0 0.0
Lane LOS A
Approach Delay (s) 9.9 0.0 0.0
Approach LOS A
Intersection Summary
Average Delay 0.1
Intersection Capacity Utilization 16.5% ICU Level of Service A
Analysis Period (min) 15

HCM Unsignalized Intersection Capacity Analysis
7: AZ-83 & Greaterville Rd. Page 5
Operations Year 5, 50% Carpool with no Copper Concentrate Trucks, Peak Season, Weekend, AM Synchro 7 - Report
Tetra Tech ISG 2/5/2010
Movement SET SER NWL NWT NEL NER
Lane Configurations
Volume (veh/h) 77 0 0 106 0 0
Sign Control Free Free Yield
Grade 0% 0% 0%
Peak Hour Factor 0.92 0.92 0.92 0.92 0.92 0.92
Hourly flow rate (vph) 84 0 0 115 0 0
Pedestrians
Lane Width (ft)
Walking Speed (ft/s)
Percent Blockage
Right turn flare (veh)
Median type None None
Median storage veh)
Upstream signal (ft)
pX, platoon unblocked
vC, conflicting volume 84 199 84
vC1, stage 1 conf vol
vC2, stage 2 conf vol
vCu, unblocked vol 84 199 84
tC, single (s) 4.2 6.5 6.3
tC, 2 stage (s)
tF (s) 2.3 3.6 3.4
p0 queue free % 100 100 100
cM capacity (veh/h) 1488 781 965
Direction, Lane # SE 1 NW 1 NE 1
Volume Total 84 115 0
Volume Left 0 0 0
Volume Right 0 0 0
cSH 1700 1488 1700
Volume to Capacity 0.05 0.00 0.00
Queue Length 95th (ft) 0 0 0
Control Delay (s) 0.0 0.0 0.0
Lane LOS A
Approach Delay (s) 0.0 0.0 0.0
Approach LOS A
Intersection Summary
Average Delay 0.0
Intersection Capacity Utilization 8.9% ICU Level of Service A
Analysis Period (min) 15

HCM Unsignalized Intersection Capacity Analysis
1: I-10 WB On-Off Ramp & AZ-83 Page 1
Operations Year 5, 50% Carpool with no Copper Concentrate Trucks, Peak Season, Weekend, PM Synchro 7 Report
Tetra Tech ISG 2/5/2010
Movement EBL EBT WBT WBR SBL SBR
Lane Configurations
Volume (veh/h) 12 57 228 4 11 8
Sign Control Free Free Yield
Grade 0% 0% 0%
Peak Hour Factor 0.92 0.92 0.92 0.92 0.92 0.92
Hourly flow rate (vph) 13 62 248 4 12 9
Pedestrians
Lane Width (ft)
Walking Speed (ft/s)
Percent Blockage
Right turn flare (veh)
Median type None None
Median storage veh)
Upstream signal (ft)
pX, platoon unblocked
vC, conflicting volume 252 338 250
vC1, stage 1 conf vol
vC2, stage 2 conf vol
vCu, unblocked vol 252 338 250
tC, single (s) 4.2 6.5 6.3
tC, 2 stage (s)
tF (s) 2.3 3.6 3.4
p0 queue free % 99 98 99
cM capacity (veh/h) 1290 643 779
Direction, Lane # EB 1 WB 1 SB 1
Volume Total 75 252 21
Volume Left 13 0 12
Volume Right 0 4 9
cSH 1290 1700 694
Volume to Capacity 0.01 0.15 0.03
Queue Length 95th (ft) 1 0 2
Control Delay (s) 1.4 0.0 10.3
Lane LOS A B
Approach Delay (s) 1.4 0.0 10.3
Approach LOS B
Intersection Summary
Average Delay 0.9
Intersection Capacity Utilization 23.3% ICU Level of Service A
Analysis Period (min) 15

HCM Unsignalized Intersection Capacity Analysis
2: AZ-83 & EB Off-Ramp Page 2
Operations Year 5, 50% Carpool with no Copper Concentrate Trucks, Peak Season, Weekend, PM Synchro 7 Report
Tetra Tech ISG 2/5/2010
Movement NBL NBT NBR SBL SBT SBR SEL SER SWL SWR
Lane Configurations
Volume (veh/h) 0 235 40 0 64 0 0 283 0 0
Sign Control Free Free Yield Yield
Grade 0% 0% 0% 0%
Peak Hour Factor 0.92 0.92 0.92 0.92 0.92 0.92 0.92 0.92 0.92 0.92
Hourly flow rate (vph) 0 255 43 0 70 0 0 308 0 0
Pedestrians
Lane Width (ft)
Walking Speed (ft/s)
Percent Blockage
Right turn flare (veh)
Median type None None
Median storage veh)
Upstream signal (ft)
pX, platoon unblocked
vC, conflicting volume 70 299 368 70 633 325
vC1, stage 1 conf vol
vC2, stage 2 conf vol
vCu, unblocked vol 70 299 368 70 633 325
tC, single (s) 4.2 4.2 6.6 6.3 7.2 6.6
tC, 2 stage (s)
tF (s) 2.3 2.3 4.1 3.4 3.6 4.1
p0 queue free % 100 100 100 69 100 100
cM capacity (veh/h) 1506 1240 554 982 266 587
Direction, Lane # NB 1 NB 2 SB 1 SE 1
Volume Total 255 43 70 308
Volume Left 0 0 0 0
Volume Right 0 43 0 308
cSH 1700 1700 1700 982
Volume to Capacity 0.15 0.03 0.04 0.31
Queue Length 95th (ft) 0 0 0 34
Control Delay (s) 0.0 0.0 0.0 10.3
Lane LOS B
Approach Delay (s) 0.0 0.0 10.3
Approach LOS B
Intersection Summary
Average Delay 4.7
Intersection Capacity Utilization 27.6% ICU Level of Service A
Analysis Period (min) 15

HCM Unsignalized Intersection Capacity Analysis
3: Sahuarita Rd. & AZ-83 Page 1
Operations Year 5, 50% Carpool with no Copper Concentrate Trucks, Peak Season, Weekend, PM Synchro 7 Report
Tetra Tech ISG 2/5/2010
Movement EBL EBR NBL NBT SBT SBR
Lane Configurations
Volume (veh/h) 51 15 22 175 171 97
Sign Control Yield Free Free
Grade 0% 0% 0%
Peak Hour Factor 0.92 0.92 0.92 0.92 0.92 0.92
Hourly flow rate (vph) 55 16 24 190 186 105
Pedestrians
Lane Width (ft)
Walking Speed (ft/s)
Percent Blockage
Right turn flare (veh)
Median type None None
Median storage veh)
Upstream signal (ft)
pX, platoon unblocked
vC, conflicting volume 477 239 291
vC1, stage 1 conf vol
vC2, stage 2 conf vol
vCu, unblocked vol 477 239 291
tC, single (s) 6.5 6.3 4.2
tC, 2 stage (s)
tF (s) 3.6 3.4 2.3
p0 queue free % 89 98 98
cM capacity (veh/h) 526 786 1237
Direction, Lane # EB 1 NB 1 SB 1
Volume Total 72 214 291
Volume Left 55 24 0
Volume Right 16 0 105
cSH 569 1237 1700
Volume to Capacity 0.13 0.02 0.17
Queue Length 95th (ft) 11 1 0
Control Delay (s) 12.2 1.0 0.0
Lane LOS B A
Approach Delay (s) 12.2 1.0 0.0
Approach LOS B
Intersection Summary
Average Delay 1.9
Intersection Capacity Utilization 38.1% ICU Level of Service A
Analysis Period (min) 15

HCM Unsignalized Intersection Capacity Analysis
4: Hilton Ranch Rd. & AZ-83 Page 2
Operations Year 5, 50% Carpool with no Copper Concentrate Trucks, Peak Season, Weekend, PM Synchro 7 Report
Tetra Tech ISG 2/5/2010
Movement WBL WBR NBT NBR SBL SBT
Lane Configurations
Volume (veh/h) 0 0 178 0 12 151
Sign Control Yield Free Free
Grade 0% 0% 0%
Peak Hour Factor 0.92 0.92 0.92 0.92 0.92 0.92
Hourly flow rate (vph) 0 0 193 0 13 164
Pedestrians
Lane Width (ft)
Walking Speed (ft/s)
Percent Blockage
Right turn flare (veh)
Median type None None
Median storage veh)
Upstream signal (ft)
pX, platoon unblocked
vC, conflicting volume 384 193 193
vC1, stage 1 conf vol
vC2, stage 2 conf vol
vCu, unblocked vol 384 193 193
tC, single (s) 6.5 6.3 4.2
tC, 2 stage (s)
tF (s) 3.6 3.4 2.3
p0 queue free % 100 100 99
cM capacity (veh/h) 602 833 1345
Direction, Lane # WB 1 NB 1 SB 1
Volume Total 0 193 177
Volume Left 0 0 13
Volume Right 0 0 0
cSH 1700 1700 1345
Volume to Capacity 0.00 0.11 0.01
Queue Length 95th (ft) 0 0 1
Control Delay (s) 0.0 0.0 0.6
Lane LOS A A
Approach Delay (s) 0.0 0.0 0.6
Approach LOS A
Intersection Summary
Average Delay 0.3
Intersection Capacity Utilization 21.2% ICU Level of Service A
Analysis Period (min) 15

HCM Unsignalized Intersection Capacity Analysis
5: Hidden Valley Rd. & AZ-83 Page 3
Operations Year 5, 50% Carpool with no Copper Concentrate Trucks, Peak Season, Weekend, PM Synchro 7 Report
Tetra Tech ISG 2/5/2010
Movement EBL EBR NBL NBT SBT SBR
Lane Configurations
Volume (veh/h) 88 31 26 92 145 64
Sign Control Yield Free Free
Grade 0% 0% 0%
Peak Hour Factor 0.92 0.92 0.92 0.92 0.92 0.92
Hourly flow rate (vph) 96 34 28 100 158 70
Pedestrians
Lane Width (ft)
Walking Speed (ft/s)
Percent Blockage
Right turn flare (veh)
Median type None None
Median storage veh)
Upstream signal (ft)
pX, platoon unblocked
vC, conflicting volume 349 192 227
vC1, stage 1 conf vol
vC2, stage 2 conf vol
vCu, unblocked vol 349 192 227
tC, single (s) 6.5 6.3 4.2
tC, 2 stage (s)
tF (s) 3.6 3.4 2.3
p0 queue free % 85 96 98
cM capacity (veh/h) 623 834 1306
Direction, Lane # EB 1 NB 1 SB 1
Volume Total 129 128 227
Volume Left 96 28 0
Volume Right 34 0 70
cSH 667 1306 1700
Volume to Capacity 0.19 0.02 0.13
Queue Length 95th (ft) 18 2 0
Control Delay (s) 11.7 1.9 0.0
Lane LOS B A
Approach Delay (s) 11.7 1.9 0.0
Approach LOS B
Intersection Summary
Average Delay 3.6
Intersection Capacity Utilization 34.6% ICU Level of Service A
Analysis Period (min) 15

HCM Unsignalized Intersection Capacity Analysis
6: Rosemont Junction & AZ-83 Page 4
Operations Year 5, 50% Carpool with no Copper Concentrate Trucks, Peak Season, Weekend, PM Synchro 7 Report
Tetra Tech ISG 2/5/2010
Movement EBL EBR NBL NBT SBT SBR
Lane Configurations
Volume (veh/h) 0 0 0 123 149 0
Sign Control Yield Free Free
Grade 0% 0% 0%
Peak Hour Factor 0.92 0.92 0.92 0.92 0.92 0.92
Hourly flow rate (vph) 0 0 0 134 162 0
Pedestrians
Lane Width (ft)
Walking Speed (ft/s)
Percent Blockage
Right turn flare (veh)
Median type None None
Median storage veh)
Upstream signal (ft)
pX, platoon unblocked
vC, conflicting volume 296 162 162
vC1, stage 1 conf vol
vC2, stage 2 conf vol
vCu, unblocked vol 296 162 162
tC, single (s) 6.5 6.3 4.2
tC, 2 stage (s)
tF (s) 3.6 3.4 2.3
p0 queue free % 100 100 100
cM capacity (veh/h) 683 867 1381
Direction, Lane # EB 1 NB 1 SB 1
Volume Total 0 134 162
Volume Left 0 0 0
Volume Right 0 0 0
cSH 1700 1381 1700
Volume to Capacity 0.00 0.00 0.10
Queue Length 95th (ft) 0 0 0
Control Delay (s) 0.0 0.0 0.0
Lane LOS A
Approach Delay (s) 0.0 0.0 0.0
Approach LOS A
Intersection Summary
Average Delay 0.0
Intersection Capacity Utilization 11.2% ICU Level of Service A
Analysis Period (min) 15

HCM Unsignalized Intersection Capacity Analysis
7: AZ-83 & Greaterville Rd. Page 5
Operations Year 5, 50% Carpool with no Copper Concentrate Trucks, Peak Season, Weekend, PM Synchro 7 Report
Tetra Tech ISG 2/5/2010
Movement SET SER NWL NWT NEL NER
Lane Configurations
Volume (veh/h) 125 0 7 128 5 7
Sign Control Free Free Yield
Grade 0% 0% 0%
Peak Hour Factor 0.92 0.92 0.92 0.92 0.92 0.92
Hourly flow rate (vph) 136 0 8 139 5 8
Pedestrians
Lane Width (ft)
Walking Speed (ft/s)
Percent Blockage
Right turn flare (veh)
Median type None None
Median storage veh)
Upstream signal (ft)
pX, platoon unblocked
vC, conflicting volume 136 290 136
vC1, stage 1 conf vol
vC2, stage 2 conf vol
vCu, unblocked vol 136 290 136
tC, single (s) 4.2 6.5 6.3
tC, 2 stage (s)
tF (s) 2.3 3.6 3.4
p0 queue free % 99 99 99
cM capacity (veh/h) 1412 684 897
Direction, Lane # SE 1 NW 1 NE 1
Volume Total 136 147 13
Volume Left 0 8 5
Volume Right 0 0 8
cSH 1700 1412 794
Volume to Capacity 0.08 0.01 0.02
Queue Length 95th (ft) 0 0 1
Control Delay (s) 0.0 0.4 9.6
Lane LOS A A
Approach Delay (s) 0.0 0.4 9.6
Approach LOS A
Intersection Summary
Average Delay 0.6
Intersection Capacity Utilization 22.5% ICU Level of Service A
Analysis Period (min) 15

ATTACHMENT 2
OPERATIONS YEAR 5 LOS WORKSHEETS –
SEGMENTS

NON-PEAK SEASON
SCENARIO 3
NO CARPOOL

TWO-WAY TWO-LANE HIGHWAY SEGMENT WORKSHEETGeneral Information Site InformationAnalyst Tetra Tech ISGAgency or Company Rosemont Copper CompanyDate Performed 1/16/2010Analysis Time Period Non-Peak Season, Weekday, AM
Highway AZ-83From/To I-10 Ramps/Hidden Valley RdJurisdiction Pima CountyAnalysis Year Operations Year 5, No Carpool
Input Data
Class I highway Class II highway
Terrain Level RollingTwo-way hourly volume 556 veh/hDirectional split 50 / 50Peak-hour factor, PHF 0.88No-passing zone 100 % Trucks and Buses , PT 4 %
% Recreational vehicles, PR 4%
Access points/ mi 1
Average Travel Speed
Grade adjustment factor, fG (Exhibit 20-7) 0.93
Passenger-car equivalents for trucks, ET (Exhibit 20-9) 1.9
Passenger-car equivalents for RVs, ER (Exhibit 20-9) 1.1
Heavy-vehicle adjustment factor, fHV fHV=1/ (1+ PT(ET-1)+PR(ER-1) ) 0.962
Two-way flow rate1, vp (pc/h) vp=V/ (PHF * fG * fHV) 707
vp * highest directional split proportion2 (pc/h) 354
Free-Flow Speed from Field Measurement Estimated Free-Flow Speed
Field Measured speed, SFM mi/h
Observed volume, Vf veh/h
Free-flow speed, FFS FFS=SFM+0.00776(Vf/ fHV ) 57.2 mi/h
Base free-flow speed, BFFSFM 60.0mi/h
Adj. for lane width and shoulder width3, fLS (Exhibit 20-5) 2.6mi/h
Adj. for access points, fA (Exhibit 20-6) 0.3
mi/h
Free-flow speed, FFS (FSS=BFFS-fLS-fA) 57.2mi/h
Adj. for no-passing zones, fnp ( mi/h) (Exhibit 20-11) 3.4
Average travel speed, ATS ( mi/h) ATS=FFS-0.00776vp-fnp 48.2
Percent Time-Spent-Following
Grade Adjustment factor, fG (Exhibit 20-8) 0.94
Passenger-car equivalents for trucks, ET (Exhibit 20-10) 1.5
Passenger-car equivalents for RVs, ER (Exhibit 20-10) 1.0
Heavy-vehicle adjustment factor, fHV fHV=1/ (1+ PT(ET-1)+PR(ER-1) ) 0.980
Two-way flow rate1, vp (pc/h) vp=V/ (PHF * fG * fHV) 686
vp * highest directional split proportion2 (pc/h) 343
Base percent time-spent-following, BPTSF(%) BPTSF=100(1-e-0.000879vp) 45.3
Adj. for directional distribution and no-passing zone, fd/hp(%)(Exh. 20-12) 18.3
Percent time-spent-following, PTSF(%) PTSF=BPTSF+f d/np 63.6
Level of Service and Other Performance MeasuresLevel of service, LOS (Exhibit 20-3 for Class I or 20-4 for Class II) C
Volume to capacity ratio v/c v/c=Vp/ 3,200 0.22
Peak 15-min veh-miles of travel,VMT15 (veh- mi) VMT15= 0.25Lt(V/PHF) 1580
Peak-hour vehicle-miles of travel, VMT60 (veh- mi) VMT60=V*Lt 5560
Peak 15-min total travel time, TT15(veh-h) TT15= VMT15/ATS 32.7
Notes
1. If vp >= 3,200 pc/h, terminate analysis-the LOS is F. 2. If highest directional split vp>= 1,700 pc/h, terminated anlysis-the LOS is F.
HCS2000TM Copyright © 2000 University of Florida, All Rights Reserved Version 4.1f
Page 1 of 1Two-Way
1/20/2010file://C:\Documents and Settings\max.scheideman\Local Settings\Temp\s2k19CA.tmp

TWO-WAY TWO-LANE HIGHWAY SEGMENT WORKSHEETGeneral Information Site InformationAnalyst Tetra Tech ISGAgency or Company Rosemont Copper CompanyDate Performed 1/16/2010Analysis Time Period Non-Peak Season, Weekday, AM
Highway AZ-83From/To Hidden Valley Rd/GreatervilleJurisdiction Pima CountyAnalysis Year Operations Year 5, No Carpool
Input Data
Class I highway Class II highway
Terrain Level RollingTwo-way hourly volume 688 veh/hDirectional split 50 / 50Peak-hour factor, PHF 0.88No-passing zone 100 % Trucks and Buses , PT 4 %
% Recreational vehicles, PR 4%
Access points/ mi 0
Average Travel Speed
Grade adjustment factor, fG (Exhibit 20-7) 0.93
Passenger-car equivalents for trucks, ET (Exhibit 20-9) 1.9
Passenger-car equivalents for RVs, ER (Exhibit 20-9) 1.1
Heavy-vehicle adjustment factor, fHV fHV=1/ (1+ PT(ET-1)+PR(ER-1) ) 0.962
Two-way flow rate1, vp (pc/h) vp=V/ (PHF * fG * fHV) 874
vp * highest directional split proportion2 (pc/h) 437
Free-Flow Speed from Field Measurement Estimated Free-Flow Speed
Field Measured speed, SFM mi/h
Observed volume, Vf veh/h
Free-flow speed, FFS FFS=SFM+0.00776(Vf/ fHV ) 57.4 mi/h
Base free-flow speed, BFFSFM 60.0mi/h
Adj. for lane width and shoulder width3, fLS (Exhibit 20-5) 2.6mi/h
Adj. for access points, fA (Exhibit 20-6) 0.0
mi/h
Free-flow speed, FFS (FSS=BFFS-fLS-fA) 57.4mi/h
Adj. for no-passing zones, fnp ( mi/h) (Exhibit 20-11) 2.9
Average travel speed, ATS ( mi/h) ATS=FFS-0.00776vp-fnp 47.8
Percent Time-Spent-Following
Grade Adjustment factor, fG (Exhibit 20-8) 0.94
Passenger-car equivalents for trucks, ET (Exhibit 20-10) 1.5
Passenger-car equivalents for RVs, ER (Exhibit 20-10) 1.0
Heavy-vehicle adjustment factor, fHV fHV=1/ (1+ PT(ET-1)+PR(ER-1) ) 0.980
Two-way flow rate1, vp (pc/h) vp=V/ (PHF * fG * fHV) 848
vp * highest directional split proportion2 (pc/h) 424
Base percent time-spent-following, BPTSF(%) BPTSF=100(1-e-0.000879vp) 52.5
Adj. for directional distribution and no-passing zone, fd/hp(%)(Exh. 20-12) 14.8
Percent time-spent-following, PTSF(%) PTSF=BPTSF+f d/np 67.3
Level of Service and Other Performance MeasuresLevel of service, LOS (Exhibit 20-3 for Class I or 20-4 for Class II) C
Volume to capacity ratio v/c v/c=Vp/ 3,200 0.27
Peak 15-min veh-miles of travel,VMT15 (veh- mi) VMT15= 0.25Lt(V/PHF) 1173
Peak-hour vehicle-miles of travel, VMT60 (veh- mi) VMT60=V*Lt 4128
Peak 15-min total travel time, TT15(veh-h) TT15= VMT15/ATS 24.6
Notes
1. If vp >= 3,200 pc/h, terminate analysis-the LOS is F. 2. If highest directional split vp>= 1,700 pc/h, terminated anlysis-the LOS is F.
HCS2000TM Copyright © 2000 University of Florida, All Rights Reserved Version 4.1f
Page 1 of 1Two-Way
1/20/2010file://C:\Documents and Settings\max.scheideman\Local Settings\Temp\s2k19DC.tmp
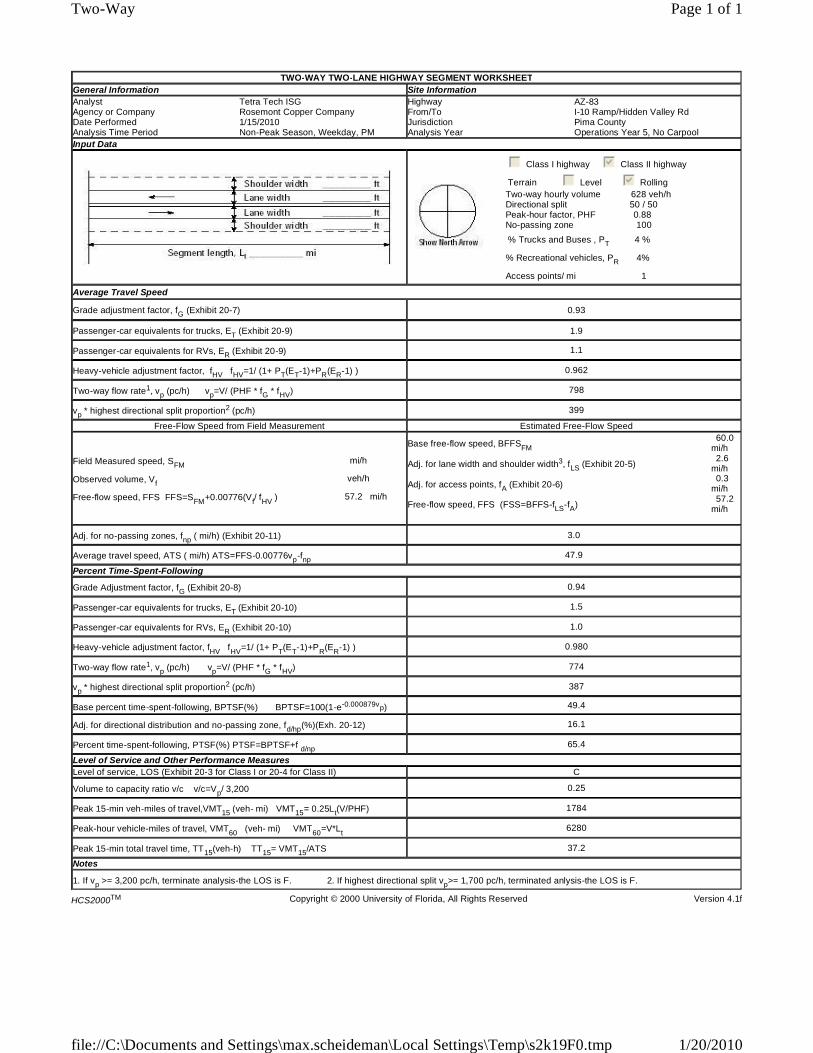
TWO-WAY TWO-LANE HIGHWAY SEGMENT WORKSHEETGeneral Information Site InformationAnalyst Tetra Tech ISGAgency or Company Rosemont Copper CompanyDate Performed 1/15/2010Analysis Time Period Non-Peak Season, Weekday, PM
Highway AZ-83From/To I-10 Ramp/Hidden Valley RdJurisdiction Pima CountyAnalysis Year Operations Year 5, No Carpool
Input Data
Class I highway Class II highway
Terrain Level RollingTwo-way hourly volume 628 veh/hDirectional split 50 / 50Peak-hour factor, PHF 0.88No-passing zone 100 % Trucks and Buses , PT 4 %
% Recreational vehicles, PR 4%
Access points/ mi 1
Average Travel Speed
Grade adjustment factor, fG (Exhibit 20-7) 0.93
Passenger-car equivalents for trucks, ET (Exhibit 20-9) 1.9
Passenger-car equivalents for RVs, ER (Exhibit 20-9) 1.1
Heavy-vehicle adjustment factor, fHV fHV=1/ (1+ PT(ET-1)+PR(ER-1) ) 0.962
Two-way flow rate1, vp (pc/h) vp=V/ (PHF * fG * fHV) 798
vp * highest directional split proportion2 (pc/h) 399
Free-Flow Speed from Field Measurement Estimated Free-Flow Speed
Field Measured speed, SFM mi/h
Observed volume, Vf veh/h
Free-flow speed, FFS FFS=SFM+0.00776(Vf/ fHV ) 57.2 mi/h
Base free-flow speed, BFFSFM 60.0mi/h
Adj. for lane width and shoulder width3, fLS (Exhibit 20-5) 2.6mi/h
Adj. for access points, fA (Exhibit 20-6) 0.3
mi/h
Free-flow speed, FFS (FSS=BFFS-fLS-fA) 57.2mi/h
Adj. for no-passing zones, fnp ( mi/h) (Exhibit 20-11) 3.0
Average travel speed, ATS ( mi/h) ATS=FFS-0.00776vp-fnp 47.9
Percent Time-Spent-Following
Grade Adjustment factor, fG (Exhibit 20-8) 0.94
Passenger-car equivalents for trucks, ET (Exhibit 20-10) 1.5
Passenger-car equivalents for RVs, ER (Exhibit 20-10) 1.0
Heavy-vehicle adjustment factor, fHV fHV=1/ (1+ PT(ET-1)+PR(ER-1) ) 0.980
Two-way flow rate1, vp (pc/h) vp=V/ (PHF * fG * fHV) 774
vp * highest directional split proportion2 (pc/h) 387
Base percent time-spent-following, BPTSF(%) BPTSF=100(1-e-0.000879vp) 49.4
Adj. for directional distribution and no-passing zone, fd/hp(%)(Exh. 20-12) 16.1
Percent time-spent-following, PTSF(%) PTSF=BPTSF+f d/np 65.4
Level of Service and Other Performance MeasuresLevel of service, LOS (Exhibit 20-3 for Class I or 20-4 for Class II) C
Volume to capacity ratio v/c v/c=Vp/ 3,200 0.25
Peak 15-min veh-miles of travel,VMT15 (veh- mi) VMT15= 0.25Lt(V/PHF) 1784
Peak-hour vehicle-miles of travel, VMT60 (veh- mi) VMT60=V*Lt 6280
Peak 15-min total travel time, TT15(veh-h) TT15= VMT15/ATS 37.2
Notes
1. If vp >= 3,200 pc/h, terminate analysis-the LOS is F. 2. If highest directional split vp>= 1,700 pc/h, terminated anlysis-the LOS is F.
HCS2000TM Copyright © 2000 University of Florida, All Rights Reserved Version 4.1f
Page 1 of 1Two-Way
1/20/2010file://C:\Documents and Settings\max.scheideman\Local Settings\Temp\s2k19F0.tmp

TWO-WAY TWO-LANE HIGHWAY SEGMENT WORKSHEETGeneral Information Site InformationAnalyst Tetra Tech ISGAgency or Company Rosemont Copper CompanyDate Performed 1/15/2010Analysis Time Period Non-Peak Season, Weekday, PM
Highway AZ-83From/To Hidden Valley Rd/GreatervilleJurisdiction Pima CountyAnalysis Year Operations Year 5, No Carpool
Input Data
Class I highway Class II highway
Terrain Level RollingTwo-way hourly volume 673 veh/hDirectional split 50 / 50Peak-hour factor, PHF 0.88No-passing zone 100 % Trucks and Buses , PT 4 %
% Recreational vehicles, PR 4%
Access points/ mi 0
Average Travel Speed
Grade adjustment factor, fG (Exhibit 20-7) 0.93
Passenger-car equivalents for trucks, ET (Exhibit 20-9) 1.9
Passenger-car equivalents for RVs, ER (Exhibit 20-9) 1.1
Heavy-vehicle adjustment factor, fHV fHV=1/ (1+ PT(ET-1)+PR(ER-1) ) 0.962
Two-way flow rate1, vp (pc/h) vp=V/ (PHF * fG * fHV) 855
vp * highest directional split proportion2 (pc/h) 428
Free-Flow Speed from Field Measurement Estimated Free-Flow Speed
Field Measured speed, SFM mi/h
Observed volume, Vf veh/h
Free-flow speed, FFS FFS=SFM+0.00776(Vf/ fHV ) 57.4 mi/h
Base free-flow speed, BFFSFM 60.0mi/h
Adj. for lane width and shoulder width3, fLS (Exhibit 20-5) 2.6mi/h
Adj. for access points, fA (Exhibit 20-6) 0.0
mi/h
Free-flow speed, FFS (FSS=BFFS-fLS-fA) 57.4mi/h
Adj. for no-passing zones, fnp ( mi/h) (Exhibit 20-11) 2.9
Average travel speed, ATS ( mi/h) ATS=FFS-0.00776vp-fnp 47.9
Percent Time-Spent-Following
Grade Adjustment factor, fG (Exhibit 20-8) 0.94
Passenger-car equivalents for trucks, ET (Exhibit 20-10) 1.5
Passenger-car equivalents for RVs, ER (Exhibit 20-10) 1.0
Heavy-vehicle adjustment factor, fHV fHV=1/ (1+ PT(ET-1)+PR(ER-1) ) 0.980
Two-way flow rate1, vp (pc/h) vp=V/ (PHF * fG * fHV) 830
vp * highest directional split proportion2 (pc/h) 415
Base percent time-spent-following, BPTSF(%) BPTSF=100(1-e-0.000879vp) 51.8
Adj. for directional distribution and no-passing zone, fd/hp(%)(Exh. 20-12) 15.0
Percent time-spent-following, PTSF(%) PTSF=BPTSF+f d/np 66.8
Level of Service and Other Performance MeasuresLevel of service, LOS (Exhibit 20-3 for Class I or 20-4 for Class II) C
Volume to capacity ratio v/c v/c=Vp/ 3,200 0.27
Peak 15-min veh-miles of travel,VMT15 (veh- mi) VMT15= 0.25Lt(V/PHF) 1147
Peak-hour vehicle-miles of travel, VMT60 (veh- mi) VMT60=V*Lt 4038
Peak 15-min total travel time, TT15(veh-h) TT15= VMT15/ATS 24.0
Notes
1. If vp >= 3,200 pc/h, terminate analysis-the LOS is F. 2. If highest directional split vp>= 1,700 pc/h, terminated anlysis-the LOS is F.
HCS2000TM Copyright © 2000 University of Florida, All Rights Reserved Version 4.1f
Page 1 of 1Two-Way
1/20/2010file://C:\Documents and Settings\max.scheideman\Local Settings\Temp\s2k19F8.tmp

TWO-WAY TWO-LANE HIGHWAY SEGMENT WORKSHEETGeneral Information Site InformationAnalyst Tetra Tech ISGAgency or Company Rosemont Copper CompanyDate Performed 1/1/5/2010Analysis Time Period Non-Peak Season, Weekend, AM
Highway AZ-83From/To I-10 Ramp/Hidden Valley RdJurisdiction Pima CountyAnalysis Year Operations Year 5, No Carpool
Input Data
Class I highway Class II highway
Terrain Level RollingTwo-way hourly volume 531 veh/hDirectional split 50 / 50Peak-hour factor, PHF 0.88No-passing zone 100 % Trucks and Buses , PT 4 %
% Recreational vehicles, PR 4%
Access points/ mi 1
Average Travel Speed
Grade adjustment factor, fG (Exhibit 20-7) 0.93
Passenger-car equivalents for trucks, ET (Exhibit 20-9) 1.9
Passenger-car equivalents for RVs, ER (Exhibit 20-9) 1.1
Heavy-vehicle adjustment factor, fHV fHV=1/ (1+ PT(ET-1)+PR(ER-1) ) 0.962
Two-way flow rate1, vp (pc/h) vp=V/ (PHF * fG * fHV) 675
vp * highest directional split proportion2 (pc/h) 338
Free-Flow Speed from Field Measurement Estimated Free-Flow Speed
Field Measured speed, SFM mi/h
Observed volume, Vf veh/h
Free-flow speed, FFS FFS=SFM+0.00776(Vf/ fHV ) 57.2 mi/h
Base free-flow speed, BFFSFM 60.0mi/h
Adj. for lane width and shoulder width3, fLS (Exhibit 20-5) 2.6mi/h
Adj. for access points, fA (Exhibit 20-6) 0.3
mi/h
Free-flow speed, FFS (FSS=BFFS-fLS-fA) 57.2mi/h
Adj. for no-passing zones, fnp ( mi/h) (Exhibit 20-11) 3.6
Average travel speed, ATS ( mi/h) ATS=FFS-0.00776vp-fnp 48.3
Percent Time-Spent-Following
Grade Adjustment factor, fG (Exhibit 20-8) 0.94
Passenger-car equivalents for trucks, ET (Exhibit 20-10) 1.5
Passenger-car equivalents for RVs, ER (Exhibit 20-10) 1.0
Heavy-vehicle adjustment factor, fHV fHV=1/ (1+ PT(ET-1)+PR(ER-1) ) 0.980
Two-way flow rate1, vp (pc/h) vp=V/ (PHF * fG * fHV) 655
vp * highest directional split proportion2 (pc/h) 328
Base percent time-spent-following, BPTSF(%) BPTSF=100(1-e-0.000879vp) 43.8
Adj. for directional distribution and no-passing zone, fd/hp(%)(Exh. 20-12) 19.1
Percent time-spent-following, PTSF(%) PTSF=BPTSF+f d/np 62.9
Level of Service and Other Performance MeasuresLevel of service, LOS (Exhibit 20-3 for Class I or 20-4 for Class II) C
Volume to capacity ratio v/c v/c=Vp/ 3,200 0.21
Peak 15-min veh-miles of travel,VMT15 (veh- mi) VMT15= 0.25Lt(V/PHF) 1509
Peak-hour vehicle-miles of travel, VMT60 (veh- mi) VMT60=V*Lt 5310
Peak 15-min total travel time, TT15(veh-h) TT15= VMT15/ATS 31.2
Notes
1. If vp >= 3,200 pc/h, terminate analysis-the LOS is F. 2. If highest directional split vp>= 1,700 pc/h, terminated anlysis-the LOS is F.
HCS2000TM Copyright © 2000 University of Florida, All Rights Reserved Version 4.1f
Page 1 of 1Two-Way
1/20/2010file://C:\Documents and Settings\max.scheideman\Local Settings\Temp\s2k19FF.tmp

TWO-WAY TWO-LANE HIGHWAY SEGMENT WORKSHEETGeneral Information Site InformationAnalyst Tetra Tech ISGAgency or Company Rosemont Copper CompanyDate Performed 1/15/2010Analysis Time Period Non-Peak Season, Weekend, AM
Highway AZ-83From/To Hidden Valley Rd/GreatervilleJurisdiction Pima CountyAnalysis Year Operations Year 5, No Carpool
Input Data
Class I highway Class II highway
Terrain Level RollingTwo-way hourly volume 499 veh/hDirectional split 50 / 50Peak-hour factor, PHF 0.88No-passing zone 100 % Trucks and Buses , PT 4 %
% Recreational vehicles, PR 4%
Access points/ mi 0
Average Travel Speed
Grade adjustment factor, fG (Exhibit 20-7) 0.93
Passenger-car equivalents for trucks, ET (Exhibit 20-9) 1.9
Passenger-car equivalents for RVs, ER (Exhibit 20-9) 1.1
Heavy-vehicle adjustment factor, fHV fHV=1/ (1+ PT(ET-1)+PR(ER-1) ) 0.962
Two-way flow rate1, vp (pc/h) vp=V/ (PHF * fG * fHV) 634
vp * highest directional split proportion2 (pc/h) 317
Free-Flow Speed from Field Measurement Estimated Free-Flow Speed
Field Measured speed, SFM mi/h
Observed volume, Vf veh/h
Free-flow speed, FFS FFS=SFM+0.00776(Vf/ fHV ) 57.4 mi/h
Base free-flow speed, BFFSFM 60.0mi/h
Adj. for lane width and shoulder width3, fLS (Exhibit 20-5) 2.6mi/h
Adj. for access points, fA (Exhibit 20-6) 0.0
mi/h
Free-flow speed, FFS (FSS=BFFS-fLS-fA) 57.4mi/h
Adj. for no-passing zones, fnp ( mi/h) (Exhibit 20-11) 3.7
Average travel speed, ATS ( mi/h) ATS=FFS-0.00776vp-fnp 48.7
Percent Time-Spent-Following
Grade Adjustment factor, fG (Exhibit 20-8) 0.94
Passenger-car equivalents for trucks, ET (Exhibit 20-10) 1.5
Passenger-car equivalents for RVs, ER (Exhibit 20-10) 1.0
Heavy-vehicle adjustment factor, fHV fHV=1/ (1+ PT(ET-1)+PR(ER-1) ) 0.980
Two-way flow rate1, vp (pc/h) vp=V/ (PHF * fG * fHV) 615
vp * highest directional split proportion2 (pc/h) 308
Base percent time-spent-following, BPTSF(%) BPTSF=100(1-e-0.000879vp) 41.8
Adj. for directional distribution and no-passing zone, fd/hp(%)(Exh. 20-12) 20.1
Percent time-spent-following, PTSF(%) PTSF=BPTSF+f d/np 61.9
Level of Service and Other Performance MeasuresLevel of service, LOS (Exhibit 20-3 for Class I or 20-4 for Class II) C
Volume to capacity ratio v/c v/c=Vp/ 3,200 0.20
Peak 15-min veh-miles of travel,VMT15 (veh- mi) VMT15= 0.25Lt(V/PHF) 851
Peak-hour vehicle-miles of travel, VMT60 (veh- mi) VMT60=V*Lt 2994
Peak 15-min total travel time, TT15(veh-h) TT15= VMT15/ATS 17.5
Notes
1. If vp >= 3,200 pc/h, terminate analysis-the LOS is F. 2. If highest directional split vp>= 1,700 pc/h, terminated anlysis-the LOS is F.
HCS2000TM Copyright © 2000 University of Florida, All Rights Reserved Version 4.1f
Page 1 of 1Two-Way
1/20/2010file://C:\Documents and Settings\max.scheideman\Local Settings\Temp\s2k1A0A.tmp

TWO-WAY TWO-LANE HIGHWAY SEGMENT WORKSHEETGeneral Information Site InformationAnalyst Tetra Tech ISGAgency or Company Rosemont Copper CompanyDate Performed 1/15/2010Analysis Time Period Non-Peak Season, Weekend, PM
Highway AZ-83From/To I-10 Ramps/Hidden Valley RdJurisdiction Pima CountyAnalysis Year Operations Year 5, No Carpool
Input Data
Class I highway Class II highway
Terrain Level RollingTwo-way hourly volume 572 veh/hDirectional split 50 / 50Peak-hour factor, PHF 0.88No-passing zone 100 % Trucks and Buses , PT 4 %
% Recreational vehicles, PR 4%
Access points/ mi 1
Average Travel Speed
Grade adjustment factor, fG (Exhibit 20-7) 0.93
Passenger-car equivalents for trucks, ET (Exhibit 20-9) 1.9
Passenger-car equivalents for RVs, ER (Exhibit 20-9) 1.1
Heavy-vehicle adjustment factor, fHV fHV=1/ (1+ PT(ET-1)+PR(ER-1) ) 0.962
Two-way flow rate1, vp (pc/h) vp=V/ (PHF * fG * fHV) 727
vp * highest directional split proportion2 (pc/h) 364
Free-Flow Speed from Field Measurement Estimated Free-Flow Speed
Field Measured speed, SFM mi/h
Observed volume, Vf veh/h
Free-flow speed, FFS FFS=SFM+0.00776(Vf/ fHV ) 57.2 mi/h
Base free-flow speed, BFFSFM 60.0mi/h
Adj. for lane width and shoulder width3, fLS (Exhibit 20-5) 2.6mi/h
Adj. for access points, fA (Exhibit 20-6) 0.3
mi/h
Free-flow speed, FFS (FSS=BFFS-fLS-fA) 57.2mi/h
Adj. for no-passing zones, fnp ( mi/h) (Exhibit 20-11) 3.3
Average travel speed, ATS ( mi/h) ATS=FFS-0.00776vp-fnp 48.2
Percent Time-Spent-Following
Grade Adjustment factor, fG (Exhibit 20-8) 0.94
Passenger-car equivalents for trucks, ET (Exhibit 20-10) 1.5
Passenger-car equivalents for RVs, ER (Exhibit 20-10) 1.0
Heavy-vehicle adjustment factor, fHV fHV=1/ (1+ PT(ET-1)+PR(ER-1) ) 0.980
Two-way flow rate1, vp (pc/h) vp=V/ (PHF * fG * fHV) 705
vp * highest directional split proportion2 (pc/h) 353
Base percent time-spent-following, BPTSF(%) BPTSF=100(1-e-0.000879vp) 46.2
Adj. for directional distribution and no-passing zone, fd/hp(%)(Exh. 20-12) 17.8
Percent time-spent-following, PTSF(%) PTSF=BPTSF+f d/np 64.0
Level of Service and Other Performance MeasuresLevel of service, LOS (Exhibit 20-3 for Class I or 20-4 for Class II) C
Volume to capacity ratio v/c v/c=Vp/ 3,200 0.23
Peak 15-min veh-miles of travel,VMT15 (veh- mi) VMT15= 0.25Lt(V/PHF) 1625
Peak-hour vehicle-miles of travel, VMT60 (veh- mi) VMT60=V*Lt 5720
Peak 15-min total travel time, TT15(veh-h) TT15= VMT15/ATS 33.7
Notes
1. If vp >= 3,200 pc/h, terminate analysis-the LOS is F. 2. If highest directional split vp>= 1,700 pc/h, terminated anlysis-the LOS is F.
HCS2000TM Copyright © 2000 University of Florida, All Rights Reserved Version 4.1f
Page 1 of 1Two-Way
1/20/2010file://C:\Documents and Settings\max.scheideman\Local Settings\Temp\s2k1A11.tmp

TWO-WAY TWO-LANE HIGHWAY SEGMENT WORKSHEETGeneral Information Site InformationAnalyst Tetra Tech ISGAgency or Company Rosemont Copper CompanyDate Performed 1/1/5/2010Analysis Time Period Non-Peak Season, Weekend, PM
Highway AZ-83From/To Hidden Valley Rd/GreatervilleJurisdiction Pima CountyAnalysis Year Operations Year 5, No Carpool
Input Data
Class I highway Class II highway
Terrain Level RollingTwo-way hourly volume 477 veh/hDirectional split 50 / 50Peak-hour factor, PHF 0.88No-passing zone 100 % Trucks and Buses , PT 4 %
% Recreational vehicles, PR 4%
Access points/ mi 0
Average Travel Speed
Grade adjustment factor, fG (Exhibit 20-7) 0.93
Passenger-car equivalents for trucks, ET (Exhibit 20-9) 1.9
Passenger-car equivalents for RVs, ER (Exhibit 20-9) 1.1
Heavy-vehicle adjustment factor, fHV fHV=1/ (1+ PT(ET-1)+PR(ER-1) ) 0.962
Two-way flow rate1, vp (pc/h) vp=V/ (PHF * fG * fHV) 606
vp * highest directional split proportion2 (pc/h) 303
Free-Flow Speed from Field Measurement Estimated Free-Flow Speed
Field Measured speed, SFM mi/h
Observed volume, Vf veh/h
Free-flow speed, FFS FFS=SFM+0.00776(Vf/ fHV ) 57.4 mi/h
Base free-flow speed, BFFSFM 60.0mi/h
Adj. for lane width and shoulder width3, fLS (Exhibit 20-5) 2.6mi/h
Adj. for access points, fA (Exhibit 20-6) 0.0
mi/h
Free-flow speed, FFS (FSS=BFFS-fLS-fA) 57.4mi/h
Adj. for no-passing zones, fnp ( mi/h) (Exhibit 20-11) 3.9
Average travel speed, ATS ( mi/h) ATS=FFS-0.00776vp-fnp 48.8
Percent Time-Spent-Following
Grade Adjustment factor, fG (Exhibit 20-8) 0.94
Passenger-car equivalents for trucks, ET (Exhibit 20-10) 1.5
Passenger-car equivalents for RVs, ER (Exhibit 20-10) 1.0
Heavy-vehicle adjustment factor, fHV fHV=1/ (1+ PT(ET-1)+PR(ER-1) ) 0.980
Two-way flow rate1, vp (pc/h) vp=V/ (PHF * fG * fHV) 588
vp * highest directional split proportion2 (pc/h) 294
Base percent time-spent-following, BPTSF(%) BPTSF=100(1-e-0.000879vp) 40.4
Adj. for directional distribution and no-passing zone, fd/hp(%)(Exh. 20-12) 20.8
Percent time-spent-following, PTSF(%) PTSF=BPTSF+f d/np 61.1
Level of Service and Other Performance MeasuresLevel of service, LOS (Exhibit 20-3 for Class I or 20-4 for Class II) C
Volume to capacity ratio v/c v/c=Vp/ 3,200 0.19
Peak 15-min veh-miles of travel,VMT15 (veh- mi) VMT15= 0.25Lt(V/PHF) 813
Peak-hour vehicle-miles of travel, VMT60 (veh- mi) VMT60=V*Lt 2862
Peak 15-min total travel time, TT15(veh-h) TT15= VMT15/ATS 16.7
Notes
1. If vp >= 3,200 pc/h, terminate analysis-the LOS is F. 2. If highest directional split vp>= 1,700 pc/h, terminated anlysis-the LOS is F.
HCS2000TM Copyright © 2000 University of Florida, All Rights Reserved Version 4.1f
Page 1 of 1Two-Way
1/20/2010file://C:\Documents and Settings\max.scheideman\Local Settings\Temp\s2k1A1A.tmp

PEAK SEASON
SCENARIO 3
NO CARPOOL

TWO-WAY TWO-LANE HIGHWAY SEGMENT WORKSHEETGeneral Information Site InformationAnalyst Tetra Tech ISGAgency or Company Rosemont Copper CompanyDate Performed 1/17/2010Analysis Time Period Peak Season, Weekday, AM
Highway AZ-83From/To I-10 Ramp/Hidden Valley RdJurisdiction Pima CountyAnalysis Year Operations Year 5, No Carpool
Input Data
Class I highway Class II highway
Terrain Level RollingTwo-way hourly volume 635 veh/hDirectional split 50 / 50Peak-hour factor, PHF 0.88No-passing zone 100 % Trucks and Buses , PT 4 %
% Recreational vehicles, PR 4%
Access points/ mi 1
Average Travel Speed
Grade adjustment factor, fG (Exhibit 20-7) 0.93
Passenger-car equivalents for trucks, ET (Exhibit 20-9) 1.9
Passenger-car equivalents for RVs, ER (Exhibit 20-9) 1.1
Heavy-vehicle adjustment factor, fHV fHV=1/ (1+ PT(ET-1)+PR(ER-1) ) 0.962
Two-way flow rate1, vp (pc/h) vp=V/ (PHF * fG * fHV) 807
vp * highest directional split proportion2 (pc/h) 404
Free-Flow Speed from Field Measurement Estimated Free-Flow Speed
Field Measured speed, SFM mi/h
Observed volume, Vf veh/h
Free-flow speed, FFS FFS=SFM+0.00776(Vf/ fHV ) 57.2 mi/h
Base free-flow speed, BFFSFM 60.0mi/h
Adj. for lane width and shoulder width3, fLS (Exhibit 20-5) 2.6mi/h
Adj. for access points, fA (Exhibit 20-6) 0.3
mi/h
Free-flow speed, FFS (FSS=BFFS-fLS-fA) 57.2mi/h
Adj. for no-passing zones, fnp ( mi/h) (Exhibit 20-11) 3.0
Average travel speed, ATS ( mi/h) ATS=FFS-0.00776vp-fnp 47.9
Percent Time-Spent-Following
Grade Adjustment factor, fG (Exhibit 20-8) 0.94
Passenger-car equivalents for trucks, ET (Exhibit 20-10) 1.5
Passenger-car equivalents for RVs, ER (Exhibit 20-10) 1.0
Heavy-vehicle adjustment factor, fHV fHV=1/ (1+ PT(ET-1)+PR(ER-1) ) 0.980
Two-way flow rate1, vp (pc/h) vp=V/ (PHF * fG * fHV) 783
vp * highest directional split proportion2 (pc/h) 392
Base percent time-spent-following, BPTSF(%) BPTSF=100(1-e-0.000879vp) 49.8
Adj. for directional distribution and no-passing zone, fd/hp(%)(Exh. 20-12) 15.8
Percent time-spent-following, PTSF(%) PTSF=BPTSF+f d/np 65.6
Level of Service and Other Performance MeasuresLevel of service, LOS (Exhibit 20-3 for Class I or 20-4 for Class II) C
Volume to capacity ratio v/c v/c=Vp/ 3,200 0.25
Peak 15-min veh-miles of travel,VMT15 (veh- mi) VMT15= 0.25Lt(V/PHF) 1804
Peak-hour vehicle-miles of travel, VMT60 (veh- mi) VMT60=V*Lt 6350
Peak 15-min total travel time, TT15(veh-h) TT15= VMT15/ATS 37.7
Notes
1. If vp >= 3,200 pc/h, terminate analysis-the LOS is F. 2. If highest directional split vp>= 1,700 pc/h, terminated anlysis-the LOS is F.
HCS2000TM Copyright © 2000 University of Florida, All Rights Reserved Version 4.1f
Page 1 of 1Two-Way
1/20/2010file://C:\Documents and Settings\max.scheideman\Local Settings\Temp\s2k1A22.tmp

TWO-WAY TWO-LANE HIGHWAY SEGMENT WORKSHEETGeneral Information Site InformationAnalyst Tetra Tech ISGAgency or Company Rosemont Copper CompanyDate Performed 1/17/2010Analysis Time Period Peak Season, Weekday, AM
Highway AZ-83From/To Hidden Valley Rd/GreatervilleJurisdiction Pima CountyAnalysis Year Operations Year 5, No Carpool
Input Data
Class I highway Class II highway
Terrain Level RollingTwo-way hourly volume 601 veh/hDirectional split 50 / 50Peak-hour factor, PHF 0.88No-passing zone 100 % Trucks and Buses , PT 4 %
% Recreational vehicles, PR 4%
Access points/ mi 0
Average Travel Speed
Grade adjustment factor, fG (Exhibit 20-7) 0.93
Passenger-car equivalents for trucks, ET (Exhibit 20-9) 1.9
Passenger-car equivalents for RVs, ER (Exhibit 20-9) 1.1
Heavy-vehicle adjustment factor, fHV fHV=1/ (1+ PT(ET-1)+PR(ER-1) ) 0.962
Two-way flow rate1, vp (pc/h) vp=V/ (PHF * fG * fHV) 764
vp * highest directional split proportion2 (pc/h) 382
Free-Flow Speed from Field Measurement Estimated Free-Flow Speed
Field Measured speed, SFM mi/h
Observed volume, Vf veh/h
Free-flow speed, FFS FFS=SFM+0.00776(Vf/ fHV ) 57.4 mi/h
Base free-flow speed, BFFSFM 60.0mi/h
Adj. for lane width and shoulder width3, fLS (Exhibit 20-5) 2.6mi/h
Adj. for access points, fA (Exhibit 20-6) 0.0
mi/h
Free-flow speed, FFS (FSS=BFFS-fLS-fA) 57.4mi/h
Adj. for no-passing zones, fnp ( mi/h) (Exhibit 20-11) 3.2
Average travel speed, ATS ( mi/h) ATS=FFS-0.00776vp-fnp 48.3
Percent Time-Spent-Following
Grade Adjustment factor, fG (Exhibit 20-8) 0.94
Passenger-car equivalents for trucks, ET (Exhibit 20-10) 1.5
Passenger-car equivalents for RVs, ER (Exhibit 20-10) 1.0
Heavy-vehicle adjustment factor, fHV fHV=1/ (1+ PT(ET-1)+PR(ER-1) ) 0.980
Two-way flow rate1, vp (pc/h) vp=V/ (PHF * fG * fHV) 741
vp * highest directional split proportion2 (pc/h) 371
Base percent time-spent-following, BPTSF(%) BPTSF=100(1-e-0.000879vp) 47.9
Adj. for directional distribution and no-passing zone, fd/hp(%)(Exh. 20-12) 16.9
Percent time-spent-following, PTSF(%) PTSF=BPTSF+f d/np 64.8
Level of Service and Other Performance MeasuresLevel of service, LOS (Exhibit 20-3 for Class I or 20-4 for Class II) C
Volume to capacity ratio v/c v/c=Vp/ 3,200 0.24
Peak 15-min veh-miles of travel,VMT15 (veh- mi) VMT15= 0.25Lt(V/PHF) 1024
Peak-hour vehicle-miles of travel, VMT60 (veh- mi) VMT60=V*Lt 3606
Peak 15-min total travel time, TT15(veh-h) TT15= VMT15/ATS 21.2
Notes
1. If vp >= 3,200 pc/h, terminate analysis-the LOS is F. 2. If highest directional split vp>= 1,700 pc/h, terminated anlysis-the LOS is F.
HCS2000TM Copyright © 2000 University of Florida, All Rights Reserved Version 4.1f
Page 1 of 1Two-Way
1/20/2010file://C:\Documents and Settings\max.scheideman\Local Settings\Temp\s2k1A34.tmp

TWO-WAY TWO-LANE HIGHWAY SEGMENT WORKSHEETGeneral Information Site InformationAnalyst Tetra Tech ISGAgency or Company Rosemont Copper CompanyDate Performed 1/17/2010Analysis Time Period Peak Season, Weekday, PM
Highway AZ-83From/To I-10 ramp/Hidden Valley RdJurisdiction Pima CountyAnalysis Year Operations Year 5, No Carpool
Input Data
Class I highway Class II highway
Terrain Level RollingTwo-way hourly volume 732 veh/hDirectional split 50 / 50Peak-hour factor, PHF 0.88No-passing zone 100 % Trucks and Buses , PT 4 %
% Recreational vehicles, PR 4%
Access points/ mi 1
Average Travel Speed
Grade adjustment factor, fG (Exhibit 20-7) 0.93
Passenger-car equivalents for trucks, ET (Exhibit 20-9) 1.9
Passenger-car equivalents for RVs, ER (Exhibit 20-9) 1.1
Heavy-vehicle adjustment factor, fHV fHV=1/ (1+ PT(ET-1)+PR(ER-1) ) 0.962
Two-way flow rate1, vp (pc/h) vp=V/ (PHF * fG * fHV) 930
vp * highest directional split proportion2 (pc/h) 465
Free-Flow Speed from Field Measurement Estimated Free-Flow Speed
Field Measured speed, SFM mi/h
Observed volume, Vf veh/h
Free-flow speed, FFS FFS=SFM+0.00776(Vf/ fHV ) 57.2 mi/h
Base free-flow speed, BFFSFM 60.0mi/h
Adj. for lane width and shoulder width3, fLS (Exhibit 20-5) 2.6mi/h
Adj. for access points, fA (Exhibit 20-6) 0.3
mi/h
Free-flow speed, FFS (FSS=BFFS-fLS-fA) 57.2mi/h
Adj. for no-passing zones, fnp ( mi/h) (Exhibit 20-11) 2.7
Average travel speed, ATS ( mi/h) ATS=FFS-0.00776vp-fnp 47.2
Percent Time-Spent-Following
Grade Adjustment factor, fG (Exhibit 20-8) 0.94
Passenger-car equivalents for trucks, ET (Exhibit 20-10) 1.5
Passenger-car equivalents for RVs, ER (Exhibit 20-10) 1.0
Heavy-vehicle adjustment factor, fHV fHV=1/ (1+ PT(ET-1)+PR(ER-1) ) 0.980
Two-way flow rate1, vp (pc/h) vp=V/ (PHF * fG * fHV) 903
vp * highest directional split proportion2 (pc/h) 452
Base percent time-spent-following, BPTSF(%) BPTSF=100(1-e-0.000879vp) 54.8
Adj. for directional distribution and no-passing zone, fd/hp(%)(Exh. 20-12) 14.1
Percent time-spent-following, PTSF(%) PTSF=BPTSF+f d/np 68.9
Level of Service and Other Performance MeasuresLevel of service, LOS (Exhibit 20-3 for Class I or 20-4 for Class II) C
Volume to capacity ratio v/c v/c=Vp/ 3,200 0.29
Peak 15-min veh-miles of travel,VMT15 (veh- mi) VMT15= 0.25Lt(V/PHF) 2080
Peak-hour vehicle-miles of travel, VMT60 (veh- mi) VMT60=V*Lt 7320
Peak 15-min total travel time, TT15(veh-h) TT15= VMT15/ATS 44.1
Notes
1. If vp >= 3,200 pc/h, terminate analysis-the LOS is F. 2. If highest directional split vp>= 1,700 pc/h, terminated anlysis-the LOS is F.
HCS2000TM Copyright © 2000 University of Florida, All Rights Reserved Version 4.1f
Page 1 of 1Two-Way
1/20/2010file://C:\Documents and Settings\max.scheideman\Local Settings\Temp\s2k1A3E.tmp

TWO-WAY TWO-LANE HIGHWAY SEGMENT WORKSHEETGeneral Information Site InformationAnalyst Tetra Tech ISGAgency or Company Rosemont Copper CompanyDate Performed 1/17/2010Analysis Time Period Peak Season, Weekday, PM
Highway AZ-83From/To Hidden Valley Rd./GreatervilleJurisdiction Pima CountyAnalysis Year Operations Year 5, No Carpool
Input Data
Class I highway Class II highway
Terrain Level RollingTwo-way hourly volume 707 veh/hDirectional split 50 / 50Peak-hour factor, PHF 0.88No-passing zone 100 % Trucks and Buses , PT 4 %
% Recreational vehicles, PR 4%
Access points/ mi 0
Average Travel Speed
Grade adjustment factor, fG (Exhibit 20-7) 0.93
Passenger-car equivalents for trucks, ET (Exhibit 20-9) 1.9
Passenger-car equivalents for RVs, ER (Exhibit 20-9) 1.1
Heavy-vehicle adjustment factor, fHV fHV=1/ (1+ PT(ET-1)+PR(ER-1) ) 0.962
Two-way flow rate1, vp (pc/h) vp=V/ (PHF * fG * fHV) 898
vp * highest directional split proportion2 (pc/h) 449
Free-Flow Speed from Field Measurement Estimated Free-Flow Speed
Field Measured speed, SFM mi/h
Observed volume, Vf veh/h
Free-flow speed, FFS FFS=SFM+0.00776(Vf/ fHV ) 57.4 mi/h
Base free-flow speed, BFFSFM 60.0mi/h
Adj. for lane width and shoulder width3, fLS (Exhibit 20-5) 2.6mi/h
Adj. for access points, fA (Exhibit 20-6) 0.0
mi/h
Free-flow speed, FFS (FSS=BFFS-fLS-fA) 57.4mi/h
Adj. for no-passing zones, fnp ( mi/h) (Exhibit 20-11) 2.8
Average travel speed, ATS ( mi/h) ATS=FFS-0.00776vp-fnp 47.6
Percent Time-Spent-Following
Grade Adjustment factor, fG (Exhibit 20-8) 0.94
Passenger-car equivalents for trucks, ET (Exhibit 20-10) 1.5
Passenger-car equivalents for RVs, ER (Exhibit 20-10) 1.0
Heavy-vehicle adjustment factor, fHV fHV=1/ (1+ PT(ET-1)+PR(ER-1) ) 0.980
Two-way flow rate1, vp (pc/h) vp=V/ (PHF * fG * fHV) 872
vp * highest directional split proportion2 (pc/h) 436
Base percent time-spent-following, BPTSF(%) BPTSF=100(1-e-0.000879vp) 53.5
Adj. for directional distribution and no-passing zone, fd/hp(%)(Exh. 20-12) 14.5
Percent time-spent-following, PTSF(%) PTSF=BPTSF+f d/np 68.0
Level of Service and Other Performance MeasuresLevel of service, LOS (Exhibit 20-3 for Class I or 20-4 for Class II) C
Volume to capacity ratio v/c v/c=Vp/ 3,200 0.28
Peak 15-min veh-miles of travel,VMT15 (veh- mi) VMT15= 0.25Lt(V/PHF) 1205
Peak-hour vehicle-miles of travel, VMT60 (veh- mi) VMT60=V*Lt 4242
Peak 15-min total travel time, TT15(veh-h) TT15= VMT15/ATS 25.3
Notes
1. If vp >= 3,200 pc/h, terminate analysis-the LOS is F. 2. If highest directional split vp>= 1,700 pc/h, terminated anlysis-the LOS is F.
HCS2000TM Copyright © 2000 University of Florida, All Rights Reserved Version 4.1f
Page 1 of 1Two-Way
1/20/2010file://C:\Documents and Settings\max.scheideman\Local Settings\Temp\s2k1A46.tmp

TWO-WAY TWO-LANE HIGHWAY SEGMENT WORKSHEETGeneral Information Site InformationAnalyst Tetra Tech ISGAgency or Company Rosemont Copper CompanyDate Performed 1/17/2010Analysis Time Period Peak Season, Weekend, AM
Highway AZ-83From/To I-10 ramp/Hidden Valley Rd.Jurisdiction Pima CountyAnalysis Year Operations Year 5, No Carpool
Input Data
Class I highway Class II highway
Terrain Level RollingTwo-way hourly volume 526 veh/hDirectional split 50 / 50Peak-hour factor, PHF 0.88No-passing zone 100 % Trucks and Buses , PT 4 %
% Recreational vehicles, PR 4%
Access points/ mi 1
Average Travel Speed
Grade adjustment factor, fG (Exhibit 20-7) 0.93
Passenger-car equivalents for trucks, ET (Exhibit 20-9) 1.9
Passenger-car equivalents for RVs, ER (Exhibit 20-9) 1.1
Heavy-vehicle adjustment factor, fHV fHV=1/ (1+ PT(ET-1)+PR(ER-1) ) 0.962
Two-way flow rate1, vp (pc/h) vp=V/ (PHF * fG * fHV) 668
vp * highest directional split proportion2 (pc/h) 334
Free-Flow Speed from Field Measurement Estimated Free-Flow Speed
Field Measured speed, SFM mi/h
Observed volume, Vf veh/h
Free-flow speed, FFS FFS=SFM+0.00776(Vf/ fHV ) 57.2 mi/h
Base free-flow speed, BFFSFM 60.0mi/h
Adj. for lane width and shoulder width3, fLS (Exhibit 20-5) 2.6mi/h
Adj. for access points, fA (Exhibit 20-6) 0.3
mi/h
Free-flow speed, FFS (FSS=BFFS-fLS-fA) 57.2mi/h
Adj. for no-passing zones, fnp ( mi/h) (Exhibit 20-11) 3.6
Average travel speed, ATS ( mi/h) ATS=FFS-0.00776vp-fnp 48.4
Percent Time-Spent-Following
Grade Adjustment factor, fG (Exhibit 20-8) 0.94
Passenger-car equivalents for trucks, ET (Exhibit 20-10) 1.5
Passenger-car equivalents for RVs, ER (Exhibit 20-10) 1.0
Heavy-vehicle adjustment factor, fHV fHV=1/ (1+ PT(ET-1)+PR(ER-1) ) 0.980
Two-way flow rate1, vp (pc/h) vp=V/ (PHF * fG * fHV) 649
vp * highest directional split proportion2 (pc/h) 325
Base percent time-spent-following, BPTSF(%) BPTSF=100(1-e-0.000879vp) 43.5
Adj. for directional distribution and no-passing zone, fd/hp(%)(Exh. 20-12) 19.3
Percent time-spent-following, PTSF(%) PTSF=BPTSF+f d/np 62.7
Level of Service and Other Performance MeasuresLevel of service, LOS (Exhibit 20-3 for Class I or 20-4 for Class II) C
Volume to capacity ratio v/c v/c=Vp/ 3,200 0.21
Peak 15-min veh-miles of travel,VMT15 (veh- mi) VMT15= 0.25Lt(V/PHF) 1494
Peak-hour vehicle-miles of travel, VMT60 (veh- mi) VMT60=V*Lt 5260
Peak 15-min total travel time, TT15(veh-h) TT15= VMT15/ATS 30.9
Notes
1. If vp >= 3,200 pc/h, terminate analysis-the LOS is F. 2. If highest directional split vp>= 1,700 pc/h, terminated anlysis-the LOS is F.
HCS2000TM Copyright © 2000 University of Florida, All Rights Reserved Version 4.1f
Page 1 of 1Two-Way
1/20/2010file://C:\Documents and Settings\max.scheideman\Local Settings\Temp\s2k1A4D.tmp

TWO-WAY TWO-LANE HIGHWAY SEGMENT WORKSHEETGeneral Information Site InformationAnalyst Tetra Tech ISGAgency or Company Rosemont Copper CompanyDate Performed 1/17/2010Analysis Time Period Peak Season, Weekend, AM
Highway AZ-83From/To Hidden Valley Rd./GreatervilleJurisdiction Pima CountyAnalysis Year Operations Year 5, No Carpool
Input Data
Class I highway Class II highway
Terrain Level RollingTwo-way hourly volume 458 veh/hDirectional split 50 / 50Peak-hour factor, PHF 0.88No-passing zone 100 % Trucks and Buses , PT 4 %
% Recreational vehicles, PR 4%
Access points/ mi 0
Average Travel Speed
Grade adjustment factor, fG (Exhibit 20-7) 0.93
Passenger-car equivalents for trucks, ET (Exhibit 20-9) 1.9
Passenger-car equivalents for RVs, ER (Exhibit 20-9) 1.1
Heavy-vehicle adjustment factor, fHV fHV=1/ (1+ PT(ET-1)+PR(ER-1) ) 0.962
Two-way flow rate1, vp (pc/h) vp=V/ (PHF * fG * fHV) 582
vp * highest directional split proportion2 (pc/h) 291
Free-Flow Speed from Field Measurement Estimated Free-Flow Speed
Field Measured speed, SFM mi/h
Observed volume, Vf veh/h
Free-flow speed, FFS FFS=SFM+0.00776(Vf/ fHV ) 57.4 mi/h
Base free-flow speed, BFFSFM 60.0mi/h
Adj. for lane width and shoulder width3, fLS (Exhibit 20-5) 2.6mi/h
Adj. for access points, fA (Exhibit 20-6) 0.0
mi/h
Free-flow speed, FFS (FSS=BFFS-fLS-fA) 57.4mi/h
Adj. for no-passing zones, fnp ( mi/h) (Exhibit 20-11) 4.0
Average travel speed, ATS ( mi/h) ATS=FFS-0.00776vp-fnp 48.9
Percent Time-Spent-Following
Grade Adjustment factor, fG (Exhibit 20-8) 0.94
Passenger-car equivalents for trucks, ET (Exhibit 20-10) 1.5
Passenger-car equivalents for RVs, ER (Exhibit 20-10) 1.0
Heavy-vehicle adjustment factor, fHV fHV=1/ (1+ PT(ET-1)+PR(ER-1) ) 0.980
Two-way flow rate1, vp (pc/h) vp=V/ (PHF * fG * fHV) 565
vp * highest directional split proportion2 (pc/h) 283
Base percent time-spent-following, BPTSF(%) BPTSF=100(1-e-0.000879vp) 39.1
Adj. for directional distribution and no-passing zone, fd/hp(%)(Exh. 20-12) 21.3
Percent time-spent-following, PTSF(%) PTSF=BPTSF+f d/np 60.4
Level of Service and Other Performance MeasuresLevel of service, LOS (Exhibit 20-3 for Class I or 20-4 for Class II) C
Volume to capacity ratio v/c v/c=Vp/ 3,200 0.18
Peak 15-min veh-miles of travel,VMT15 (veh- mi) VMT15= 0.25Lt(V/PHF) 781
Peak-hour vehicle-miles of travel, VMT60 (veh- mi) VMT60=V*Lt 2748
Peak 15-min total travel time, TT15(veh-h) TT15= VMT15/ATS 16.0
Notes
1. If vp >= 3,200 pc/h, terminate analysis-the LOS is F. 2. If highest directional split vp>= 1,700 pc/h, terminated anlysis-the LOS is F.
HCS2000TM Copyright © 2000 University of Florida, All Rights Reserved Version 4.1f
Page 1 of 1Two-Way
1/20/2010file://C:\Documents and Settings\max.scheideman\Local Settings\Temp\s2k1A54.tmp

TWO-WAY TWO-LANE HIGHWAY SEGMENT WORKSHEETGeneral Information Site InformationAnalyst Tetra Tech ISGAgency or Company Rosemont Copper CompanyDate Performed 1/17/2010Analysis Time Period Peak Season, Weekend, PM
Highway AZ-83From/To I-10 ramp/Hidden Valley Rd.Jurisdiction Pima CountyAnalysis Year Operations Year 5, No Carpool
Input Data
Class I highway Class II highway
Terrain Level RollingTwo-way hourly volume 627 veh/hDirectional split 50 / 50Peak-hour factor, PHF 0.88No-passing zone 100 % Trucks and Buses , PT 4 %
% Recreational vehicles, PR 4%
Access points/ mi 1
Average Travel Speed
Grade adjustment factor, fG (Exhibit 20-7) 0.93
Passenger-car equivalents for trucks, ET (Exhibit 20-9) 1.9
Passenger-car equivalents for RVs, ER (Exhibit 20-9) 1.1
Heavy-vehicle adjustment factor, fHV fHV=1/ (1+ PT(ET-1)+PR(ER-1) ) 0.962
Two-way flow rate1, vp (pc/h) vp=V/ (PHF * fG * fHV) 797
vp * highest directional split proportion2 (pc/h) 399
Free-Flow Speed from Field Measurement Estimated Free-Flow Speed
Field Measured speed, SFM mi/h
Observed volume, Vf veh/h
Free-flow speed, FFS FFS=SFM+0.00776(Vf/ fHV ) 57.2 mi/h
Base free-flow speed, BFFSFM 60.0mi/h
Adj. for lane width and shoulder width3, fLS (Exhibit 20-5) 2.6mi/h
Adj. for access points, fA (Exhibit 20-6) 0.3
mi/h
Free-flow speed, FFS (FSS=BFFS-fLS-fA) 57.2mi/h
Adj. for no-passing zones, fnp ( mi/h) (Exhibit 20-11) 3.0
Average travel speed, ATS ( mi/h) ATS=FFS-0.00776vp-fnp 48.0
Percent Time-Spent-Following
Grade Adjustment factor, fG (Exhibit 20-8) 0.94
Passenger-car equivalents for trucks, ET (Exhibit 20-10) 1.5
Passenger-car equivalents for RVs, ER (Exhibit 20-10) 1.0
Heavy-vehicle adjustment factor, fHV fHV=1/ (1+ PT(ET-1)+PR(ER-1) ) 0.980
Two-way flow rate1, vp (pc/h) vp=V/ (PHF * fG * fHV) 773
vp * highest directional split proportion2 (pc/h) 387
Base percent time-spent-following, BPTSF(%) BPTSF=100(1-e-0.000879vp) 49.3
Adj. for directional distribution and no-passing zone, fd/hp(%)(Exh. 20-12) 16.1
Percent time-spent-following, PTSF(%) PTSF=BPTSF+f d/np 65.4
Level of Service and Other Performance MeasuresLevel of service, LOS (Exhibit 20-3 for Class I or 20-4 for Class II) C
Volume to capacity ratio v/c v/c=Vp/ 3,200 0.25
Peak 15-min veh-miles of travel,VMT15 (veh- mi) VMT15= 0.25Lt(V/PHF) 1781
Peak-hour vehicle-miles of travel, VMT60 (veh- mi) VMT60=V*Lt 6270
Peak 15-min total travel time, TT15(veh-h) TT15= VMT15/ATS 37.1
Notes
1. If vp >= 3,200 pc/h, terminate analysis-the LOS is F. 2. If highest directional split vp>= 1,700 pc/h, terminated anlysis-the LOS is F.
HCS2000TM Copyright © 2000 University of Florida, All Rights Reserved Version 4.1f
Page 1 of 1Two-Way
1/20/2010file://C:\Documents and Settings\max.scheideman\Local Settings\Temp\s2k1A5B.tmp

TWO-WAY TWO-LANE HIGHWAY SEGMENT WORKSHEETGeneral Information Site InformationAnalyst Tetra Tech ISGAgency or Company Rosemont Copper CompanyDate Performed 1/17/2010Analysis Time Period Peak Season, Weekend, PM
Highway AZ-83From/To Hidden Valley Rd./GreatervilleJurisdiction Pima CountyAnalysis Year Operations Year 5, No Carpool
Input Data
Class I highway Class II highway
Terrain Level RollingTwo-way hourly volume 576 veh/hDirectional split 50 / 50Peak-hour factor, PHF 0.88No-passing zone 100 % Trucks and Buses , PT 4 %
% Recreational vehicles, PR 4%
Access points/ mi 0
Average Travel Speed
Grade adjustment factor, fG (Exhibit 20-7) 0.93
Passenger-car equivalents for trucks, ET (Exhibit 20-9) 1.9
Passenger-car equivalents for RVs, ER (Exhibit 20-9) 1.1
Heavy-vehicle adjustment factor, fHV fHV=1/ (1+ PT(ET-1)+PR(ER-1) ) 0.962
Two-way flow rate1, vp (pc/h) vp=V/ (PHF * fG * fHV) 732
vp * highest directional split proportion2 (pc/h) 366
Free-Flow Speed from Field Measurement Estimated Free-Flow Speed
Field Measured speed, SFM mi/h
Observed volume, Vf veh/h
Free-flow speed, FFS FFS=SFM+0.00776(Vf/ fHV ) 57.4 mi/h
Base free-flow speed, BFFSFM 60.0mi/h
Adj. for lane width and shoulder width3, fLS (Exhibit 20-5) 2.6mi/h
Adj. for access points, fA (Exhibit 20-6) 0.0
mi/h
Free-flow speed, FFS (FSS=BFFS-fLS-fA) 57.4mi/h
Adj. for no-passing zones, fnp ( mi/h) (Exhibit 20-11) 3.3
Average travel speed, ATS ( mi/h) ATS=FFS-0.00776vp-fnp 48.4
Percent Time-Spent-Following
Grade Adjustment factor, fG (Exhibit 20-8) 0.94
Passenger-car equivalents for trucks, ET (Exhibit 20-10) 1.5
Passenger-car equivalents for RVs, ER (Exhibit 20-10) 1.0
Heavy-vehicle adjustment factor, fHV fHV=1/ (1+ PT(ET-1)+PR(ER-1) ) 0.980
Two-way flow rate1, vp (pc/h) vp=V/ (PHF * fG * fHV) 710
vp * highest directional split proportion2 (pc/h) 355
Base percent time-spent-following, BPTSF(%) BPTSF=100(1-e-0.000879vp) 46.4
Adj. for directional distribution and no-passing zone, fd/hp(%)(Exh. 20-12) 17.7
Percent time-spent-following, PTSF(%) PTSF=BPTSF+f d/np 64.1
Level of Service and Other Performance MeasuresLevel of service, LOS (Exhibit 20-3 for Class I or 20-4 for Class II) C
Volume to capacity ratio v/c v/c=Vp/ 3,200 0.23
Peak 15-min veh-miles of travel,VMT15 (veh- mi) VMT15= 0.25Lt(V/PHF) 982
Peak-hour vehicle-miles of travel, VMT60 (veh- mi) VMT60=V*Lt 3456
Peak 15-min total travel time, TT15(veh-h) TT15= VMT15/ATS 20.3
Notes
1. If vp >= 3,200 pc/h, terminate analysis-the LOS is F. 2. If highest directional split vp>= 1,700 pc/h, terminated anlysis-the LOS is F.
HCS2000TM Copyright © 2000 University of Florida, All Rights Reserved Version 4.1f
Page 1 of 1Two-Way
1/20/2010file://C:\Documents and Settings\max.scheideman\Local Settings\Temp\s2k1A62.tmp

NON - PEAK SEASON
SCENARIO 4
50% CARPOOL

TWO-WAY TWO-LANE HIGHWAY SEGMENT WORKSHEETGeneral Information Site InformationAnalyst Tetra Tech ISGAgency or Company Rosemont Copper CompanyDate Performed 1/16/2010Analysis Time Period Non-Peak Season, Weekday, AM
Highway AZ-83From/To I-10 Ramps/Hidden Valley RdJurisdiction Pima CountyAnalysis Year Operations Year 5, 50% Carpool
Input Data
Class I highway Class II highway
Terrain Level RollingTwo-way hourly volume 418 veh/hDirectional split 50 / 50Peak-hour factor, PHF 0.88No-passing zone 100 % Trucks and Buses , PT 8 %
% Recreational vehicles, PR 4%
Access points/ mi 1
Average Travel Speed
Grade adjustment factor, fG (Exhibit 20-7) 0.93
Passenger-car equivalents for trucks, ET (Exhibit 20-9) 1.9
Passenger-car equivalents for RVs, ER (Exhibit 20-9) 1.1
Heavy-vehicle adjustment factor, fHV fHV=1/ (1+ PT(ET-1)+PR(ER-1) ) 0.929
Two-way flow rate1, vp (pc/h) vp=V/ (PHF * fG * fHV) 550
vp * highest directional split proportion2 (pc/h) 275
Free-Flow Speed from Field Measurement Estimated Free-Flow Speed
Field Measured speed, SFM mi/h
Observed volume, Vf veh/h
Free-flow speed, FFS FFS=SFM+0.00776(Vf/ fHV ) 57.2 mi/h
Base free-flow speed, BFFSFM 60.0mi/h
Adj. for lane width and shoulder width3, fLS (Exhibit 20-5) 2.6mi/h
Adj. for access points, fA (Exhibit 20-6) 0.3
mi/h
Free-flow speed, FFS (FSS=BFFS-fLS-fA) 57.2mi/h
Adj. for no-passing zones, fnp ( mi/h) (Exhibit 20-11) 4.1
Average travel speed, ATS ( mi/h) ATS=FFS-0.00776vp-fnp 48.8
Percent Time-Spent-Following
Grade Adjustment factor, fG (Exhibit 20-8) 0.94
Passenger-car equivalents for trucks, ET (Exhibit 20-10) 1.5
Passenger-car equivalents for RVs, ER (Exhibit 20-10) 1.0
Heavy-vehicle adjustment factor, fHV fHV=1/ (1+ PT(ET-1)+PR(ER-1) ) 0.962
Two-way flow rate1, vp (pc/h) vp=V/ (PHF * fG * fHV) 526
vp * highest directional split proportion2 (pc/h) 263
Base percent time-spent-following, BPTSF(%) BPTSF=100(1-e-0.000879vp) 37.0
Adj. for directional distribution and no-passing zone, fd/hp(%)(Exh. 20-12) 22.1
Percent time-spent-following, PTSF(%) PTSF=BPTSF+f d/np 59.1
Level of Service and Other Performance MeasuresLevel of service, LOS (Exhibit 20-3 for Class I or 20-4 for Class II) C
Volume to capacity ratio v/c v/c=Vp/ 3,200 0.17
Peak 15-min veh-miles of travel,VMT15 (veh- mi) VMT15= 0.25Lt(V/PHF) 1188
Peak-hour vehicle-miles of travel, VMT60 (veh- mi) VMT60=V*Lt 4180
Peak 15-min total travel time, TT15(veh-h) TT15= VMT15/ATS 24.3
Notes
1. If vp >= 3,200 pc/h, terminate analysis-the LOS is F. 2. If highest directional split vp>= 1,700 pc/h, terminated anlysis-the LOS is F.
HCS2000TM Copyright © 2000 University of Florida, All Rights Reserved Version 4.1f
Page 1 of 1Two-Way
1/20/2010file://C:\Documents and Settings\max.scheideman\Local Settings\Temp\s2k1AEC.tmp

TWO-WAY TWO-LANE HIGHWAY SEGMENT WORKSHEETGeneral Information Site InformationAnalyst Tetra Tech ISGAgency or Company Rosemont Copper CompanyDate Performed 1/16/2010Analysis Time Period Non-Peak Season, Weekday, AM
Highway AZ-83From/To Hidden Valley Rd/GreatervilleJurisdiction Pima CountyAnalysis Year Operations Year 5, 50% Carpool
Input Data
Class I highway Class II highway
Terrain Level RollingTwo-way hourly volume 505 veh/hDirectional split 50 / 50Peak-hour factor, PHF 0.88No-passing zone 100 % Trucks and Buses , PT 8 %
% Recreational vehicles, PR 4%
Access points/ mi 0
Average Travel Speed
Grade adjustment factor, fG (Exhibit 20-7) 0.93
Passenger-car equivalents for trucks, ET (Exhibit 20-9) 1.9
Passenger-car equivalents for RVs, ER (Exhibit 20-9) 1.1
Heavy-vehicle adjustment factor, fHV fHV=1/ (1+ PT(ET-1)+PR(ER-1) ) 0.929
Two-way flow rate1, vp (pc/h) vp=V/ (PHF * fG * fHV) 664
vp * highest directional split proportion2 (pc/h) 332
Free-Flow Speed from Field Measurement Estimated Free-Flow Speed
Field Measured speed, SFM mi/h
Observed volume, Vf veh/h
Free-flow speed, FFS FFS=SFM+0.00776(Vf/ fHV ) 57.4 mi/h
Base free-flow speed, BFFSFM 60.0mi/h
Adj. for lane width and shoulder width3, fLS (Exhibit 20-5) 2.6mi/h
Adj. for access points, fA (Exhibit 20-6) 0.0
mi/h
Free-flow speed, FFS (FSS=BFFS-fLS-fA) 57.4mi/h
Adj. for no-passing zones, fnp ( mi/h) (Exhibit 20-11) 3.6
Average travel speed, ATS ( mi/h) ATS=FFS-0.00776vp-fnp 48.6
Percent Time-Spent-Following
Grade Adjustment factor, fG (Exhibit 20-8) 0.94
Passenger-car equivalents for trucks, ET (Exhibit 20-10) 1.5
Passenger-car equivalents for RVs, ER (Exhibit 20-10) 1.0
Heavy-vehicle adjustment factor, fHV fHV=1/ (1+ PT(ET-1)+PR(ER-1) ) 0.962
Two-way flow rate1, vp (pc/h) vp=V/ (PHF * fG * fHV) 635
vp * highest directional split proportion2 (pc/h) 318
Base percent time-spent-following, BPTSF(%) BPTSF=100(1-e-0.000879vp) 42.8
Adj. for directional distribution and no-passing zone, fd/hp(%)(Exh. 20-12) 19.6
Percent time-spent-following, PTSF(%) PTSF=BPTSF+f d/np 62.4
Level of Service and Other Performance MeasuresLevel of service, LOS (Exhibit 20-3 for Class I or 20-4 for Class II) C
Volume to capacity ratio v/c v/c=Vp/ 3,200 0.21
Peak 15-min veh-miles of travel,VMT15 (veh- mi) VMT15= 0.25Lt(V/PHF) 861
Peak-hour vehicle-miles of travel, VMT60 (veh- mi) VMT60=V*Lt 3030
Peak 15-min total travel time, TT15(veh-h) TT15= VMT15/ATS 17.7
Notes
1. If vp >= 3,200 pc/h, terminate analysis-the LOS is F. 2. If highest directional split vp>= 1,700 pc/h, terminated anlysis-the LOS is F.
HCS2000TM Copyright © 2000 University of Florida, All Rights Reserved Version 4.1f
Page 1 of 1Two-Way
1/20/2010file://C:\Documents and Settings\max.scheideman\Local Settings\Temp\s2k1AF3.tmp

TWO-WAY TWO-LANE HIGHWAY SEGMENT WORKSHEETGeneral Information Site InformationAnalyst Tetra Tech ISGAgency or Company Rosemont Copper CompanyDate Performed 1/15/2010Analysis Time Period Non-Peak Season, Weekday, PM
Highway AZ-83From/To I-10 Ramp/Hidden Valley RdJurisdiction Pima CountyAnalysis Year Operations Year 5, 50% Carpool
Input Data
Class I highway Class II highway
Terrain Level RollingTwo-way hourly volume 491 veh/hDirectional split 50 / 50Peak-hour factor, PHF 0.88No-passing zone 100 % Trucks and Buses , PT 8 %
% Recreational vehicles, PR 4%
Access points/ mi 1
Average Travel Speed
Grade adjustment factor, fG (Exhibit 20-7) 0.93
Passenger-car equivalents for trucks, ET (Exhibit 20-9) 1.9
Passenger-car equivalents for RVs, ER (Exhibit 20-9) 1.1
Heavy-vehicle adjustment factor, fHV fHV=1/ (1+ PT(ET-1)+PR(ER-1) ) 0.929
Two-way flow rate1, vp (pc/h) vp=V/ (PHF * fG * fHV) 646
vp * highest directional split proportion2 (pc/h) 323
Free-Flow Speed from Field Measurement Estimated Free-Flow Speed
Field Measured speed, SFM mi/h
Observed volume, Vf veh/h
Free-flow speed, FFS FFS=SFM+0.00776(Vf/ fHV ) 57.2 mi/h
Base free-flow speed, BFFSFM 60.0mi/h
Adj. for lane width and shoulder width3, fLS (Exhibit 20-5) 2.6mi/h
Adj. for access points, fA (Exhibit 20-6) 0.3
mi/h
Free-flow speed, FFS (FSS=BFFS-fLS-fA) 57.2mi/h
Adj. for no-passing zones, fnp ( mi/h) (Exhibit 20-11) 3.7
Average travel speed, ATS ( mi/h) ATS=FFS-0.00776vp-fnp 48.4
Percent Time-Spent-Following
Grade Adjustment factor, fG (Exhibit 20-8) 0.94
Passenger-car equivalents for trucks, ET (Exhibit 20-10) 1.5
Passenger-car equivalents for RVs, ER (Exhibit 20-10) 1.0
Heavy-vehicle adjustment factor, fHV fHV=1/ (1+ PT(ET-1)+PR(ER-1) ) 0.962
Two-way flow rate1, vp (pc/h) vp=V/ (PHF * fG * fHV) 617
vp * highest directional split proportion2 (pc/h) 309
Base percent time-spent-following, BPTSF(%) BPTSF=100(1-e-0.000879vp) 41.9
Adj. for directional distribution and no-passing zone, fd/hp(%)(Exh. 20-12) 20.1
Percent time-spent-following, PTSF(%) PTSF=BPTSF+f d/np 61.9
Level of Service and Other Performance MeasuresLevel of service, LOS (Exhibit 20-3 for Class I or 20-4 for Class II) C
Volume to capacity ratio v/c v/c=Vp/ 3,200 0.20
Peak 15-min veh-miles of travel,VMT15 (veh- mi) VMT15= 0.25Lt(V/PHF) 1395
Peak-hour vehicle-miles of travel, VMT60 (veh- mi) VMT60=V*Lt 4910
Peak 15-min total travel time, TT15(veh-h) TT15= VMT15/ATS 28.8
Notes
1. If vp >= 3,200 pc/h, terminate analysis-the LOS is F. 2. If highest directional split vp>= 1,700 pc/h, terminated anlysis-the LOS is F.
HCS2000TM Copyright © 2000 University of Florida, All Rights Reserved Version 4.1f
Page 1 of 1Two-Way
1/20/2010file://C:\Documents and Settings\max.scheideman\Local Settings\Temp\s2k1AFA.tmp

TWO-WAY TWO-LANE HIGHWAY SEGMENT WORKSHEETGeneral Information Site InformationAnalyst Tetra Tech ISGAgency or Company Rosemont Copper CompanyDate Performed 1/15/2010Analysis Time Period Non-Peak Season, Weekday, PM
Highway AZ-83From/To Hidden Valley Rd/GreatervilleJurisdiction Pima CountyAnalysis Year Operations Year 5, 50% Carpool
Input Data
Class I highway Class II highway
Terrain Level RollingTwo-way hourly volume 491 veh/hDirectional split 50 / 50Peak-hour factor, PHF 0.88No-passing zone 100 % Trucks and Buses , PT 8 %
% Recreational vehicles, PR 4%
Access points/ mi 0
Average Travel Speed
Grade adjustment factor, fG (Exhibit 20-7) 0.93
Passenger-car equivalents for trucks, ET (Exhibit 20-9) 1.9
Passenger-car equivalents for RVs, ER (Exhibit 20-9) 1.1
Heavy-vehicle adjustment factor, fHV fHV=1/ (1+ PT(ET-1)+PR(ER-1) ) 0.929
Two-way flow rate1, vp (pc/h) vp=V/ (PHF * fG * fHV) 646
vp * highest directional split proportion2 (pc/h) 323
Free-Flow Speed from Field Measurement Estimated Free-Flow Speed
Field Measured speed, SFM mi/h
Observed volume, Vf veh/h
Free-flow speed, FFS FFS=SFM+0.00776(Vf/ fHV ) 57.4 mi/h
Base free-flow speed, BFFSFM 60.0mi/h
Adj. for lane width and shoulder width3, fLS (Exhibit 20-5) 2.6mi/h
Adj. for access points, fA (Exhibit 20-6) 0.0
mi/h
Free-flow speed, FFS (FSS=BFFS-fLS-fA) 57.4mi/h
Adj. for no-passing zones, fnp ( mi/h) (Exhibit 20-11) 3.7
Average travel speed, ATS ( mi/h) ATS=FFS-0.00776vp-fnp 48.7
Percent Time-Spent-Following
Grade Adjustment factor, fG (Exhibit 20-8) 0.94
Passenger-car equivalents for trucks, ET (Exhibit 20-10) 1.5
Passenger-car equivalents for RVs, ER (Exhibit 20-10) 1.0
Heavy-vehicle adjustment factor, fHV fHV=1/ (1+ PT(ET-1)+PR(ER-1) ) 0.962
Two-way flow rate1, vp (pc/h) vp=V/ (PHF * fG * fHV) 617
vp * highest directional split proportion2 (pc/h) 309
Base percent time-spent-following, BPTSF(%) BPTSF=100(1-e-0.000879vp) 41.9
Adj. for directional distribution and no-passing zone, fd/hp(%)(Exh. 20-12) 20.1
Percent time-spent-following, PTSF(%) PTSF=BPTSF+f d/np 61.9
Level of Service and Other Performance MeasuresLevel of service, LOS (Exhibit 20-3 for Class I or 20-4 for Class II) C
Volume to capacity ratio v/c v/c=Vp/ 3,200 0.20
Peak 15-min veh-miles of travel,VMT15 (veh- mi) VMT15= 0.25Lt(V/PHF) 837
Peak-hour vehicle-miles of travel, VMT60 (veh- mi) VMT60=V*Lt 2946
Peak 15-min total travel time, TT15(veh-h) TT15= VMT15/ATS 17.2
Notes
1. If vp >= 3,200 pc/h, terminate analysis-the LOS is F. 2. If highest directional split vp>= 1,700 pc/h, terminated anlysis-the LOS is F.
HCS2000TM Copyright © 2000 University of Florida, All Rights Reserved Version 4.1f
Page 1 of 1Two-Way
1/20/2010file://C:\Documents and Settings\max.scheideman\Local Settings\Temp\s2k1B01.tmp

TWO-WAY TWO-LANE HIGHWAY SEGMENT WORKSHEETGeneral Information Site InformationAnalyst Tetra Tech ISGAgency or Company Rosemont Copper CompanyDate Performed 1/1/5/2010Analysis Time Period Non-Peak Season, Weekend, AM
Highway AZ-83From/To I-10 Ramp/Hidden Valley RdJurisdiction Pima CountyAnalysis Year Operations Year 5, 50% Carpool
Input Data
Class I highway Class II highway
Terrain Level RollingTwo-way hourly volume 436 veh/hDirectional split 50 / 50Peak-hour factor, PHF 0.88No-passing zone 100 % Trucks and Buses , PT 8 %
% Recreational vehicles, PR 4%
Access points/ mi 1
Average Travel Speed
Grade adjustment factor, fG (Exhibit 20-7) 0.93
Passenger-car equivalents for trucks, ET (Exhibit 20-9) 1.9
Passenger-car equivalents for RVs, ER (Exhibit 20-9) 1.1
Heavy-vehicle adjustment factor, fHV fHV=1/ (1+ PT(ET-1)+PR(ER-1) ) 0.929
Two-way flow rate1, vp (pc/h) vp=V/ (PHF * fG * fHV) 573
vp * highest directional split proportion2 (pc/h) 287
Free-Flow Speed from Field Measurement Estimated Free-Flow Speed
Field Measured speed, SFM mi/h
Observed volume, Vf veh/h
Free-flow speed, FFS FFS=SFM+0.00776(Vf/ fHV ) 57.2 mi/h
Base free-flow speed, BFFSFM 60.0mi/h
Adj. for lane width and shoulder width3, fLS (Exhibit 20-5) 2.6mi/h
Adj. for access points, fA (Exhibit 20-6) 0.3
mi/h
Free-flow speed, FFS (FSS=BFFS-fLS-fA) 57.2mi/h
Adj. for no-passing zones, fnp ( mi/h) (Exhibit 20-11) 4.0
Average travel speed, ATS ( mi/h) ATS=FFS-0.00776vp-fnp 48.7
Percent Time-Spent-Following
Grade Adjustment factor, fG (Exhibit 20-8) 0.94
Passenger-car equivalents for trucks, ET (Exhibit 20-10) 1.5
Passenger-car equivalents for RVs, ER (Exhibit 20-10) 1.0
Heavy-vehicle adjustment factor, fHV fHV=1/ (1+ PT(ET-1)+PR(ER-1) ) 0.962
Two-way flow rate1, vp (pc/h) vp=V/ (PHF * fG * fHV) 548
vp * highest directional split proportion2 (pc/h) 274
Base percent time-spent-following, BPTSF(%) BPTSF=100(1-e-0.000879vp) 38.2
Adj. for directional distribution and no-passing zone, fd/hp(%)(Exh. 20-12) 21.6
Percent time-spent-following, PTSF(%) PTSF=BPTSF+f d/np 59.8
Level of Service and Other Performance MeasuresLevel of service, LOS (Exhibit 20-3 for Class I or 20-4 for Class II) C
Volume to capacity ratio v/c v/c=Vp/ 3,200 0.18
Peak 15-min veh-miles of travel,VMT15 (veh- mi) VMT15= 0.25Lt(V/PHF) 1239
Peak-hour vehicle-miles of travel, VMT60 (veh- mi) VMT60=V*Lt 4360
Peak 15-min total travel time, TT15(veh-h) TT15= VMT15/ATS 25.4
Notes
1. If vp >= 3,200 pc/h, terminate analysis-the LOS is F. 2. If highest directional split vp>= 1,700 pc/h, terminated anlysis-the LOS is F.
HCS2000TM Copyright © 2000 University of Florida, All Rights Reserved Version 4.1f
Page 1 of 1Two-Way
1/20/2010file://C:\Documents and Settings\max.scheideman\Local Settings\Temp\s2k1B08.tmp

TWO-WAY TWO-LANE HIGHWAY SEGMENT WORKSHEETGeneral Information Site InformationAnalyst Tetra Tech ISGAgency or Company Rosemont Copper CompanyDate Performed 1/15/2010Analysis Time Period Non-Peak Season, Weekend, AM
Highway AZ-83From/To Hidden Valley Rd/GreatervilleJurisdiction Pima CountyAnalysis Year Operations Year 5, 50% Carpool
Input Data
Class I highway Class II highway
Terrain Level RollingTwo-way hourly volume 373 veh/hDirectional split 50 / 50Peak-hour factor, PHF 0.88No-passing zone 100 % Trucks and Buses , PT 8 %
% Recreational vehicles, PR 4%
Access points/ mi 0
Average Travel Speed
Grade adjustment factor, fG (Exhibit 20-7) 0.93
Passenger-car equivalents for trucks, ET (Exhibit 20-9) 1.9
Passenger-car equivalents for RVs, ER (Exhibit 20-9) 1.1
Heavy-vehicle adjustment factor, fHV fHV=1/ (1+ PT(ET-1)+PR(ER-1) ) 0.929
Two-way flow rate1, vp (pc/h) vp=V/ (PHF * fG * fHV) 490
vp * highest directional split proportion2 (pc/h) 245
Free-Flow Speed from Field Measurement Estimated Free-Flow Speed
Field Measured speed, SFM mi/h
Observed volume, Vf veh/h
Free-flow speed, FFS FFS=SFM+0.00776(Vf/ fHV ) 57.4 mi/h
Base free-flow speed, BFFSFM 60.0mi/h
Adj. for lane width and shoulder width3, fLS (Exhibit 20-5) 2.6mi/h
Adj. for access points, fA (Exhibit 20-6) 0.0
mi/h
Free-flow speed, FFS (FSS=BFFS-fLS-fA) 57.4mi/h
Adj. for no-passing zones, fnp ( mi/h) (Exhibit 20-11) 4.2
Average travel speed, ATS ( mi/h) ATS=FFS-0.00776vp-fnp 49.4
Percent Time-Spent-Following
Grade Adjustment factor, fG (Exhibit 20-8) 0.77
Passenger-car equivalents for trucks, ET (Exhibit 20-10) 1.8
Passenger-car equivalents for RVs, ER (Exhibit 20-10) 1.0
Heavy-vehicle adjustment factor, fHV fHV=1/ (1+ PT(ET-1)+PR(ER-1) ) 0.940
Two-way flow rate1, vp (pc/h) vp=V/ (PHF * fG * fHV) 586
vp * highest directional split proportion2 (pc/h) 293
Base percent time-spent-following, BPTSF(%) BPTSF=100(1-e-0.000879vp) 40.3
Adj. for directional distribution and no-passing zone, fd/hp(%)(Exh. 20-12) 20.8
Percent time-spent-following, PTSF(%) PTSF=BPTSF+f d/np 61.1
Level of Service and Other Performance MeasuresLevel of service, LOS (Exhibit 20-3 for Class I or 20-4 for Class II) C
Volume to capacity ratio v/c v/c=Vp/ 3,200 0.15
Peak 15-min veh-miles of travel,VMT15 (veh- mi) VMT15= 0.25Lt(V/PHF) 636
Peak-hour vehicle-miles of travel, VMT60 (veh- mi) VMT60=V*Lt 2238
Peak 15-min total travel time, TT15(veh-h) TT15= VMT15/ATS 12.9
Notes
1. If vp >= 3,200 pc/h, terminate analysis-the LOS is F. 2. If highest directional split vp>= 1,700 pc/h, terminated anlysis-the LOS is F.
HCS2000TM Copyright © 2000 University of Florida, All Rights Reserved Version 4.1f
Page 1 of 1Two-Way
1/20/2010file://C:\Documents and Settings\max.scheideman\Local Settings\Temp\s2k1B0F.tmp

TWO-WAY TWO-LANE HIGHWAY SEGMENT WORKSHEETGeneral Information Site InformationAnalyst Tetra Tech ISGAgency or Company Rosemont Copper CompanyDate Performed 1/15/2010Analysis Time Period Non-Peak Season, Weekend, PM
Highway AZ-83From/To I-10 Ramps/Hidden Valley RdJurisdiction Pima CountyAnalysis Year Operations Year 5, 50% Carpool
Input Data
Class I highway Class II highway
Terrain Level RollingTwo-way hourly volume 478 veh/hDirectional split 50 / 50Peak-hour factor, PHF 0.88No-passing zone 100 % Trucks and Buses , PT 8 %
% Recreational vehicles, PR 4%
Access points/ mi 1
Average Travel Speed
Grade adjustment factor, fG (Exhibit 20-7) 0.93
Passenger-car equivalents for trucks, ET (Exhibit 20-9) 1.9
Passenger-car equivalents for RVs, ER (Exhibit 20-9) 1.1
Heavy-vehicle adjustment factor, fHV fHV=1/ (1+ PT(ET-1)+PR(ER-1) ) 0.929
Two-way flow rate1, vp (pc/h) vp=V/ (PHF * fG * fHV) 628
vp * highest directional split proportion2 (pc/h) 314
Free-Flow Speed from Field Measurement Estimated Free-Flow Speed
Field Measured speed, SFM mi/h
Observed volume, Vf veh/h
Free-flow speed, FFS FFS=SFM+0.00776(Vf/ fHV ) 57.2 mi/h
Base free-flow speed, BFFSFM 60.0mi/h
Adj. for lane width and shoulder width3, fLS (Exhibit 20-5) 2.6mi/h
Adj. for access points, fA (Exhibit 20-6) 0.3
mi/h
Free-flow speed, FFS (FSS=BFFS-fLS-fA) 57.2mi/h
Adj. for no-passing zones, fnp ( mi/h) (Exhibit 20-11) 3.8
Average travel speed, ATS ( mi/h) ATS=FFS-0.00776vp-fnp 48.5
Percent Time-Spent-Following
Grade Adjustment factor, fG (Exhibit 20-8) 0.94
Passenger-car equivalents for trucks, ET (Exhibit 20-10) 1.5
Passenger-car equivalents for RVs, ER (Exhibit 20-10) 1.0
Heavy-vehicle adjustment factor, fHV fHV=1/ (1+ PT(ET-1)+PR(ER-1) ) 0.962
Two-way flow rate1, vp (pc/h) vp=V/ (PHF * fG * fHV) 601
vp * highest directional split proportion2 (pc/h) 301
Base percent time-spent-following, BPTSF(%) BPTSF=100(1-e-0.000879vp) 41.0
Adj. for directional distribution and no-passing zone, fd/hp(%)(Exh. 20-12) 20.5
Percent time-spent-following, PTSF(%) PTSF=BPTSF+f d/np 61.5
Level of Service and Other Performance MeasuresLevel of service, LOS (Exhibit 20-3 for Class I or 20-4 for Class II) C
Volume to capacity ratio v/c v/c=Vp/ 3,200 0.20
Peak 15-min veh-miles of travel,VMT15 (veh- mi) VMT15= 0.25Lt(V/PHF) 1358
Peak-hour vehicle-miles of travel, VMT60 (veh- mi) VMT60=V*Lt 4780
Peak 15-min total travel time, TT15(veh-h) TT15= VMT15/ATS 28.0
Notes
1. If vp >= 3,200 pc/h, terminate analysis-the LOS is F. 2. If highest directional split vp>= 1,700 pc/h, terminated anlysis-the LOS is F.
HCS2000TM Copyright © 2000 University of Florida, All Rights Reserved Version 4.1f
Page 1 of 1Two-Way
1/20/2010file://C:\Documents and Settings\max.scheideman\Local Settings\Temp\s2k1B17.tmp

TWO-WAY TWO-LANE HIGHWAY SEGMENT WORKSHEETGeneral Information Site InformationAnalyst Tetra Tech ISGAgency or Company Rosemont Copper CompanyDate Performed 1/1/5/2010Analysis Time Period Non-Peak Season, Weekend, PM
Highway AZ-83From/To Hidden Valley Rd/GreatervilleJurisdiction Pima CountyAnalysis Year Operations Year 5, 50% Carpool
Input Data
Class I highway Class II highway
Terrain Level RollingTwo-way hourly volume 352 veh/hDirectional split 50 / 50Peak-hour factor, PHF 0.88No-passing zone 100 % Trucks and Buses , PT 8 %
% Recreational vehicles, PR 4%
Access points/ mi 0
Average Travel Speed
Grade adjustment factor, fG (Exhibit 20-7) 0.93
Passenger-car equivalents for trucks, ET (Exhibit 20-9) 1.9
Passenger-car equivalents for RVs, ER (Exhibit 20-9) 1.1
Heavy-vehicle adjustment factor, fHV fHV=1/ (1+ PT(ET-1)+PR(ER-1) ) 0.929
Two-way flow rate1, vp (pc/h) vp=V/ (PHF * fG * fHV) 463
vp * highest directional split proportion2 (pc/h) 232
Free-Flow Speed from Field Measurement Estimated Free-Flow Speed
Field Measured speed, SFM mi/h
Observed volume, Vf veh/h
Free-flow speed, FFS FFS=SFM+0.00776(Vf/ fHV ) 57.4 mi/h
Base free-flow speed, BFFSFM 60.0mi/h
Adj. for lane width and shoulder width3, fLS (Exhibit 20-5) 2.6mi/h
Adj. for access points, fA (Exhibit 20-6) 0.0
mi/h
Free-flow speed, FFS (FSS=BFFS-fLS-fA) 57.4mi/h
Adj. for no-passing zones, fnp ( mi/h) (Exhibit 20-11) 4.3
Average travel speed, ATS ( mi/h) ATS=FFS-0.00776vp-fnp 49.5
Percent Time-Spent-Following
Grade Adjustment factor, fG (Exhibit 20-8) 0.77
Passenger-car equivalents for trucks, ET (Exhibit 20-10) 1.8
Passenger-car equivalents for RVs, ER (Exhibit 20-10) 1.0
Heavy-vehicle adjustment factor, fHV fHV=1/ (1+ PT(ET-1)+PR(ER-1) ) 0.940
Two-way flow rate1, vp (pc/h) vp=V/ (PHF * fG * fHV) 553
vp * highest directional split proportion2 (pc/h) 277
Base percent time-spent-following, BPTSF(%) BPTSF=100(1-e-0.000879vp) 38.5
Adj. for directional distribution and no-passing zone, fd/hp(%)(Exh. 20-12) 21.5
Percent time-spent-following, PTSF(%) PTSF=BPTSF+f d/np 60.0
Level of Service and Other Performance MeasuresLevel of service, LOS (Exhibit 20-3 for Class I or 20-4 for Class II) C
Volume to capacity ratio v/c v/c=Vp/ 3,200 0.14
Peak 15-min veh-miles of travel,VMT15 (veh- mi) VMT15= 0.25Lt(V/PHF) 600
Peak-hour vehicle-miles of travel, VMT60 (veh- mi) VMT60=V*Lt 2112
Peak 15-min total travel time, TT15(veh-h) TT15= VMT15/ATS 12.1
Notes
1. If vp >= 3,200 pc/h, terminate analysis-the LOS is F. 2. If highest directional split vp>= 1,700 pc/h, terminated anlysis-the LOS is F.
HCS2000TM Copyright © 2000 University of Florida, All Rights Reserved Version 4.1f
Page 1 of 1Two-Way
1/20/2010file://C:\Documents and Settings\max.scheideman\Local Settings\Temp\s2k1B1E.tmp

PEAK SEASON
SCENARIO 4
50% CARPOOL

TWO-WAY TWO-LANE HIGHWAY SEGMENT WORKSHEETGeneral Information Site InformationAnalyst Tetra Tech ISGAgency or Company Rosemont Copper CompanyDate Performed 1/17/2010Analysis Time Period Peak Season, Weekday, AM
Highway AZ-83From/To I-10 Ramp/Hidden Valley RdJurisdiction Pima CountyAnalysis Year Operations Year 5, 50% Carpool
Input Data
Class I highway Class II highway
Terrain Level RollingTwo-way hourly volume 498 veh/hDirectional split 50 / 50Peak-hour factor, PHF 0.88No-passing zone 100 % Trucks and Buses , PT 8 %
% Recreational vehicles, PR 4%
Access points/ mi 1
Average Travel Speed
Grade adjustment factor, fG (Exhibit 20-7) 0.93
Passenger-car equivalents for trucks, ET (Exhibit 20-9) 1.9
Passenger-car equivalents for RVs, ER (Exhibit 20-9) 1.1
Heavy-vehicle adjustment factor, fHV fHV=1/ (1+ PT(ET-1)+PR(ER-1) ) 0.929
Two-way flow rate1, vp (pc/h) vp=V/ (PHF * fG * fHV) 655
vp * highest directional split proportion2 (pc/h) 328
Free-Flow Speed from Field Measurement Estimated Free-Flow Speed
Field Measured speed, SFM mi/h
Observed volume, Vf veh/h
Free-flow speed, FFS FFS=SFM+0.00776(Vf/ fHV ) 57.2 mi/h
Base free-flow speed, BFFSFM 60.0mi/h
Adj. for lane width and shoulder width3, fLS (Exhibit 20-5) 2.6mi/h
Adj. for access points, fA (Exhibit 20-6) 0.3
mi/h
Free-flow speed, FFS (FSS=BFFS-fLS-fA) 57.2mi/h
Adj. for no-passing zones, fnp ( mi/h) (Exhibit 20-11) 3.7
Average travel speed, ATS ( mi/h) ATS=FFS-0.00776vp-fnp 48.4
Percent Time-Spent-Following
Grade Adjustment factor, fG (Exhibit 20-8) 0.94
Passenger-car equivalents for trucks, ET (Exhibit 20-10) 1.5
Passenger-car equivalents for RVs, ER (Exhibit 20-10) 1.0
Heavy-vehicle adjustment factor, fHV fHV=1/ (1+ PT(ET-1)+PR(ER-1) ) 0.962
Two-way flow rate1, vp (pc/h) vp=V/ (PHF * fG * fHV) 626
vp * highest directional split proportion2 (pc/h) 313
Base percent time-spent-following, BPTSF(%) BPTSF=100(1-e-0.000879vp) 42.3
Adj. for directional distribution and no-passing zone, fd/hp(%)(Exh. 20-12) 19.8
Percent time-spent-following, PTSF(%) PTSF=BPTSF+f d/np 62.2
Level of Service and Other Performance MeasuresLevel of service, LOS (Exhibit 20-3 for Class I or 20-4 for Class II) C
Volume to capacity ratio v/c v/c=Vp/ 3,200 0.20
Peak 15-min veh-miles of travel,VMT15 (veh- mi) VMT15= 0.25Lt(V/PHF) 1415
Peak-hour vehicle-miles of travel, VMT60 (veh- mi) VMT60=V*Lt 4980
Peak 15-min total travel time, TT15(veh-h) TT15= VMT15/ATS 29.2
Notes
1. If vp >= 3,200 pc/h, terminate analysis-the LOS is F. 2. If highest directional split vp>= 1,700 pc/h, terminated anlysis-the LOS is F.
HCS2000TM Copyright © 2000 University of Florida, All Rights Reserved Version 4.1f
Page 1 of 1Two-Way
1/20/2010file://C:\Documents and Settings\max.scheideman\Local Settings\Temp\s2k1B25.tmp

TWO-WAY TWO-LANE HIGHWAY SEGMENT WORKSHEETGeneral Information Site InformationAnalyst Tetra Tech ISGAgency or Company Rosemont Copper CompanyDate Performed 1/17/2010Analysis Time Period Peak Season, Weekday, AM
Highway AZ-83From/To Hidden Valley Rd/GreatervilleJurisdiction Pima CountyAnalysis Year Operations Year 5, 50% Carpool
Input Data
Class I highway Class II highway
Terrain Level RollingTwo-way hourly volume 418 veh/hDirectional split 50 / 50Peak-hour factor, PHF 0.88No-passing zone 100 % Trucks and Buses , PT 8 %
% Recreational vehicles, PR 4%
Access points/ mi 0
Average Travel Speed
Grade adjustment factor, fG (Exhibit 20-7) 0.93
Passenger-car equivalents for trucks, ET (Exhibit 20-9) 1.9
Passenger-car equivalents for RVs, ER (Exhibit 20-9) 1.1
Heavy-vehicle adjustment factor, fHV fHV=1/ (1+ PT(ET-1)+PR(ER-1) ) 0.929
Two-way flow rate1, vp (pc/h) vp=V/ (PHF * fG * fHV) 550
vp * highest directional split proportion2 (pc/h) 275
Free-Flow Speed from Field Measurement Estimated Free-Flow Speed
Field Measured speed, SFM mi/h
Observed volume, Vf veh/h
Free-flow speed, FFS FFS=SFM+0.00776(Vf/ fHV ) 57.4 mi/h
Base free-flow speed, BFFSFM 60.0mi/h
Adj. for lane width and shoulder width3, fLS (Exhibit 20-5) 2.6mi/h
Adj. for access points, fA (Exhibit 20-6) 0.0
mi/h
Free-flow speed, FFS (FSS=BFFS-fLS-fA) 57.4mi/h
Adj. for no-passing zones, fnp ( mi/h) (Exhibit 20-11) 4.1
Average travel speed, ATS ( mi/h) ATS=FFS-0.00776vp-fnp 49.1
Percent Time-Spent-Following
Grade Adjustment factor, fG (Exhibit 20-8) 0.94
Passenger-car equivalents for trucks, ET (Exhibit 20-10) 1.5
Passenger-car equivalents for RVs, ER (Exhibit 20-10) 1.0
Heavy-vehicle adjustment factor, fHV fHV=1/ (1+ PT(ET-1)+PR(ER-1) ) 0.962
Two-way flow rate1, vp (pc/h) vp=V/ (PHF * fG * fHV) 526
vp * highest directional split proportion2 (pc/h) 263
Base percent time-spent-following, BPTSF(%) BPTSF=100(1-e-0.000879vp) 37.0
Adj. for directional distribution and no-passing zone, fd/hp(%)(Exh. 20-12) 22.1
Percent time-spent-following, PTSF(%) PTSF=BPTSF+f d/np 59.1
Level of Service and Other Performance MeasuresLevel of service, LOS (Exhibit 20-3 for Class I or 20-4 for Class II) C
Volume to capacity ratio v/c v/c=Vp/ 3,200 0.17
Peak 15-min veh-miles of travel,VMT15 (veh- mi) VMT15= 0.25Lt(V/PHF) 713
Peak-hour vehicle-miles of travel, VMT60 (veh- mi) VMT60=V*Lt 2508
Peak 15-min total travel time, TT15(veh-h) TT15= VMT15/ATS 14.5
Notes
1. If vp >= 3,200 pc/h, terminate analysis-the LOS is F. 2. If highest directional split vp>= 1,700 pc/h, terminated anlysis-the LOS is F.
HCS2000TM Copyright © 2000 University of Florida, All Rights Reserved Version 4.1f
Page 1 of 1Two-Way
1/20/2010file://C:\Documents and Settings\max.scheideman\Local Settings\Temp\s2k1B2C.tmp

TWO-WAY TWO-LANE HIGHWAY SEGMENT WORKSHEETGeneral Information Site InformationAnalyst Tetra Tech ISGAgency or Company Rosemont Copper CompanyDate Performed 1/17/2010Analysis Time Period Peak Season, Weekday, PM
Highway AZ-83From/To I-10 ramp/Hidden Valley RdJurisdiction Pima CountyAnalysis Year Operations Year 5, 50% Carpool
Input Data
Class I highway Class II highway
Terrain Level RollingTwo-way hourly volume 595 veh/hDirectional split 50 / 50Peak-hour factor, PHF 0.88No-passing zone 100 % Trucks and Buses , PT 8 %
% Recreational vehicles, PR 4%
Access points/ mi 1
Average Travel Speed
Grade adjustment factor, fG (Exhibit 20-7) 0.93
Passenger-car equivalents for trucks, ET (Exhibit 20-9) 1.9
Passenger-car equivalents for RVs, ER (Exhibit 20-9) 1.1
Heavy-vehicle adjustment factor, fHV fHV=1/ (1+ PT(ET-1)+PR(ER-1) ) 0.929
Two-way flow rate1, vp (pc/h) vp=V/ (PHF * fG * fHV) 782
vp * highest directional split proportion2 (pc/h) 391
Free-Flow Speed from Field Measurement Estimated Free-Flow Speed
Field Measured speed, SFM mi/h
Observed volume, Vf veh/h
Free-flow speed, FFS FFS=SFM+0.00776(Vf/ fHV ) 57.2 mi/h
Base free-flow speed, BFFSFM 60.0mi/h
Adj. for lane width and shoulder width3, fLS (Exhibit 20-5) 2.6mi/h
Adj. for access points, fA (Exhibit 20-6) 0.3
mi/h
Free-flow speed, FFS (FSS=BFFS-fLS-fA) 57.2mi/h
Adj. for no-passing zones, fnp ( mi/h) (Exhibit 20-11) 3.1
Average travel speed, ATS ( mi/h) ATS=FFS-0.00776vp-fnp 48.0
Percent Time-Spent-Following
Grade Adjustment factor, fG (Exhibit 20-8) 0.94
Passenger-car equivalents for trucks, ET (Exhibit 20-10) 1.5
Passenger-car equivalents for RVs, ER (Exhibit 20-10) 1.0
Heavy-vehicle adjustment factor, fHV fHV=1/ (1+ PT(ET-1)+PR(ER-1) ) 0.962
Two-way flow rate1, vp (pc/h) vp=V/ (PHF * fG * fHV) 748
vp * highest directional split proportion2 (pc/h) 374
Base percent time-spent-following, BPTSF(%) BPTSF=100(1-e-0.000879vp) 48.2
Adj. for directional distribution and no-passing zone, fd/hp(%)(Exh. 20-12) 16.7
Percent time-spent-following, PTSF(%) PTSF=BPTSF+f d/np 64.9
Level of Service and Other Performance MeasuresLevel of service, LOS (Exhibit 20-3 for Class I or 20-4 for Class II) C
Volume to capacity ratio v/c v/c=Vp/ 3,200 0.24
Peak 15-min veh-miles of travel,VMT15 (veh- mi) VMT15= 0.25Lt(V/PHF) 1690
Peak-hour vehicle-miles of travel, VMT60 (veh- mi) VMT60=V*Lt 5950
Peak 15-min total travel time, TT15(veh-h) TT15= VMT15/ATS 35.2
Notes
1. If vp >= 3,200 pc/h, terminate analysis-the LOS is F. 2. If highest directional split vp>= 1,700 pc/h, terminated anlysis-the LOS is F.
HCS2000TM Copyright © 2000 University of Florida, All Rights Reserved Version 4.1f
Page 1 of 1Two-Way
1/20/2010file://C:\Documents and Settings\max.scheideman\Local Settings\Temp\s2k1B34.tmp

TWO-WAY TWO-LANE HIGHWAY SEGMENT WORKSHEETGeneral Information Site InformationAnalyst Tetra Tech ISGAgency or Company Rosemont Copper CompanyDate Performed 1/17/2010Analysis Time Period Peak Season, Weekday, PM
Highway AZ-83From/To Hidden Valley Rd./GreatervilleJurisdiction Pima CountyAnalysis Year Operations Year 5, 50% Carpool
Input Data
Class I highway Class II highway
Terrain Level RollingTwo-way hourly volume 525 veh/hDirectional split 50 / 50Peak-hour factor, PHF 0.88No-passing zone 100 % Trucks and Buses , PT 8 %
% Recreational vehicles, PR 4%
Access points/ mi 0
Average Travel Speed
Grade adjustment factor, fG (Exhibit 20-7) 0.93
Passenger-car equivalents for trucks, ET (Exhibit 20-9) 1.9
Passenger-car equivalents for RVs, ER (Exhibit 20-9) 1.1
Heavy-vehicle adjustment factor, fHV fHV=1/ (1+ PT(ET-1)+PR(ER-1) ) 0.929
Two-way flow rate1, vp (pc/h) vp=V/ (PHF * fG * fHV) 690
vp * highest directional split proportion2 (pc/h) 345
Free-Flow Speed from Field Measurement Estimated Free-Flow Speed
Field Measured speed, SFM mi/h
Observed volume, Vf veh/h
Free-flow speed, FFS FFS=SFM+0.00776(Vf/ fHV ) 57.4 mi/h
Base free-flow speed, BFFSFM 60.0mi/h
Adj. for lane width and shoulder width3, fLS (Exhibit 20-5) 2.6mi/h
Adj. for access points, fA (Exhibit 20-6) 0.0
mi/h
Free-flow speed, FFS (FSS=BFFS-fLS-fA) 57.4mi/h
Adj. for no-passing zones, fnp ( mi/h) (Exhibit 20-11) 3.5
Average travel speed, ATS ( mi/h) ATS=FFS-0.00776vp-fnp 48.6
Percent Time-Spent-Following
Grade Adjustment factor, fG (Exhibit 20-8) 0.94
Passenger-car equivalents for trucks, ET (Exhibit 20-10) 1.5
Passenger-car equivalents for RVs, ER (Exhibit 20-10) 1.0
Heavy-vehicle adjustment factor, fHV fHV=1/ (1+ PT(ET-1)+PR(ER-1) ) 0.962
Two-way flow rate1, vp (pc/h) vp=V/ (PHF * fG * fHV) 660
vp * highest directional split proportion2 (pc/h) 330
Base percent time-spent-following, BPTSF(%) BPTSF=100(1-e-0.000879vp) 44.0
Adj. for directional distribution and no-passing zone, fd/hp(%)(Exh. 20-12) 19.0
Percent time-spent-following, PTSF(%) PTSF=BPTSF+f d/np 63.0
Level of Service and Other Performance MeasuresLevel of service, LOS (Exhibit 20-3 for Class I or 20-4 for Class II) C
Volume to capacity ratio v/c v/c=Vp/ 3,200 0.22
Peak 15-min veh-miles of travel,VMT15 (veh- mi) VMT15= 0.25Lt(V/PHF) 895
Peak-hour vehicle-miles of travel, VMT60 (veh- mi) VMT60=V*Lt 3150
Peak 15-min total travel time, TT15(veh-h) TT15= VMT15/ATS 18.4
Notes
1. If vp >= 3,200 pc/h, terminate analysis-the LOS is F. 2. If highest directional split vp>= 1,700 pc/h, terminated anlysis-the LOS is F.
HCS2000TM Copyright © 2000 University of Florida, All Rights Reserved Version 4.1f
Page 1 of 1Two-Way
1/20/2010file://C:\Documents and Settings\max.scheideman\Local Settings\Temp\s2k1B3B.tmp

TWO-WAY TWO-LANE HIGHWAY SEGMENT WORKSHEETGeneral Information Site InformationAnalyst Tetra Tech ISGAgency or Company Rosemont Copper CompanyDate Performed 1/17/2010Analysis Time Period Peak Season, Weekend, AM
Highway AZ-83From/To I-10 ramp/Hidden Valley Rd.Jurisdiction Pima CountyAnalysis Year Operations Year 5, 50% Carpool
Input Data
Class I highway Class II highway
Terrain Level RollingTwo-way hourly volume 432 veh/hDirectional split 50 / 50Peak-hour factor, PHF 0.88No-passing zone 100 % Trucks and Buses , PT 8 %
% Recreational vehicles, PR 4%
Access points/ mi 1
Average Travel Speed
Grade adjustment factor, fG (Exhibit 20-7) 0.93
Passenger-car equivalents for trucks, ET (Exhibit 20-9) 1.9
Passenger-car equivalents for RVs, ER (Exhibit 20-9) 1.1
Heavy-vehicle adjustment factor, fHV fHV=1/ (1+ PT(ET-1)+PR(ER-1) ) 0.929
Two-way flow rate1, vp (pc/h) vp=V/ (PHF * fG * fHV) 568
vp * highest directional split proportion2 (pc/h) 284
Free-Flow Speed from Field Measurement Estimated Free-Flow Speed
Field Measured speed, SFM mi/h
Observed volume, Vf veh/h
Free-flow speed, FFS FFS=SFM+0.00776(Vf/ fHV ) 57.2 mi/h
Base free-flow speed, BFFSFM 60.0mi/h
Adj. for lane width and shoulder width3, fLS (Exhibit 20-5) 2.6mi/h
Adj. for access points, fA (Exhibit 20-6) 0.3
mi/h
Free-flow speed, FFS (FSS=BFFS-fLS-fA) 57.2mi/h
Adj. for no-passing zones, fnp ( mi/h) (Exhibit 20-11) 4.0
Average travel speed, ATS ( mi/h) ATS=FFS-0.00776vp-fnp 48.7
Percent Time-Spent-Following
Grade Adjustment factor, fG (Exhibit 20-8) 0.94
Passenger-car equivalents for trucks, ET (Exhibit 20-10) 1.5
Passenger-car equivalents for RVs, ER (Exhibit 20-10) 1.0
Heavy-vehicle adjustment factor, fHV fHV=1/ (1+ PT(ET-1)+PR(ER-1) ) 0.962
Two-way flow rate1, vp (pc/h) vp=V/ (PHF * fG * fHV) 543
vp * highest directional split proportion2 (pc/h) 272
Base percent time-spent-following, BPTSF(%) BPTSF=100(1-e-0.000879vp) 38.0
Adj. for directional distribution and no-passing zone, fd/hp(%)(Exh. 20-12) 21.7
Percent time-spent-following, PTSF(%) PTSF=BPTSF+f d/np 59.7
Level of Service and Other Performance MeasuresLevel of service, LOS (Exhibit 20-3 for Class I or 20-4 for Class II) C
Volume to capacity ratio v/c v/c=Vp/ 3,200 0.18
Peak 15-min veh-miles of travel,VMT15 (veh- mi) VMT15= 0.25Lt(V/PHF) 1227
Peak-hour vehicle-miles of travel, VMT60 (veh- mi) VMT60=V*Lt 4320
Peak 15-min total travel time, TT15(veh-h) TT15= VMT15/ATS 25.2
Notes
1. If vp >= 3,200 pc/h, terminate analysis-the LOS is F. 2. If highest directional split vp>= 1,700 pc/h, terminated anlysis-the LOS is F.
HCS2000TM Copyright © 2000 University of Florida, All Rights Reserved Version 4.1f
Page 1 of 1Two-Way
1/20/2010file://C:\Documents and Settings\max.scheideman\Local Settings\Temp\s2k1B42.tmp

TWO-WAY TWO-LANE HIGHWAY SEGMENT WORKSHEETGeneral Information Site InformationAnalyst Tetra Tech ISGAgency or Company Rosemont Copper CompanyDate Performed 1/17/2010Analysis Time Period Peak Season, Weekend, AM
Highway AZ-83From/To Hidden Valley Rd./GreatervilleJurisdiction Pima CountyAnalysis Year Operations Year 5, 50% Carpool
Input Data
Class I highway Class II highway
Terrain Level RollingTwo-way hourly volume 332 veh/hDirectional split 50 / 50Peak-hour factor, PHF 0.88No-passing zone 100 % Trucks and Buses , PT 8 %
% Recreational vehicles, PR 4%
Access points/ mi 0
Average Travel Speed
Grade adjustment factor, fG (Exhibit 20-7) 0.71
Passenger-car equivalents for trucks, ET (Exhibit 20-9) 2.5
Passenger-car equivalents for RVs, ER (Exhibit 20-9) 1.1
Heavy-vehicle adjustment factor, fHV fHV=1/ (1+ PT(ET-1)+PR(ER-1) ) 0.890
Two-way flow rate1, vp (pc/h) vp=V/ (PHF * fG * fHV) 597
vp * highest directional split proportion2 (pc/h) 299
Free-Flow Speed from Field Measurement Estimated Free-Flow Speed
Field Measured speed, SFM mi/h
Observed volume, Vf veh/h
Free-flow speed, FFS FFS=SFM+0.00776(Vf/ fHV ) 57.4 mi/h
Base free-flow speed, BFFSFM 60.0mi/h
Adj. for lane width and shoulder width3, fLS (Exhibit 20-5) 2.6mi/h
Adj. for access points, fA (Exhibit 20-6) 0.0
mi/h
Free-flow speed, FFS (FSS=BFFS-fLS-fA) 57.4mi/h
Adj. for no-passing zones, fnp ( mi/h) (Exhibit 20-11) 3.9
Average travel speed, ATS ( mi/h) ATS=FFS-0.00776vp-fnp 48.9
Percent Time-Spent-Following
Grade Adjustment factor, fG (Exhibit 20-8) 0.77
Passenger-car equivalents for trucks, ET (Exhibit 20-10) 1.8
Passenger-car equivalents for RVs, ER (Exhibit 20-10) 1.0
Heavy-vehicle adjustment factor, fHV fHV=1/ (1+ PT(ET-1)+PR(ER-1) ) 0.940
Two-way flow rate1, vp (pc/h) vp=V/ (PHF * fG * fHV) 521
vp * highest directional split proportion2 (pc/h) 261
Base percent time-spent-following, BPTSF(%) BPTSF=100(1-e-0.000879vp) 36.7
Adj. for directional distribution and no-passing zone, fd/hp(%)(Exh. 20-12) 22.2
Percent time-spent-following, PTSF(%) PTSF=BPTSF+f d/np 58.9
Level of Service and Other Performance MeasuresLevel of service, LOS (Exhibit 20-3 for Class I or 20-4 for Class II) C
Volume to capacity ratio v/c v/c=Vp/ 3,200 0.19
Peak 15-min veh-miles of travel,VMT15 (veh- mi) VMT15= 0.25Lt(V/PHF) 566
Peak-hour vehicle-miles of travel, VMT60 (veh- mi) VMT60=V*Lt 1992
Peak 15-min total travel time, TT15(veh-h) TT15= VMT15/ATS 11.6
Notes
1. If vp >= 3,200 pc/h, terminate analysis-the LOS is F. 2. If highest directional split vp>= 1,700 pc/h, terminated anlysis-the LOS is F.
HCS2000TM Copyright © 2000 University of Florida, All Rights Reserved Version 4.1f
Page 1 of 1Two-Way
1/20/2010file://C:\Documents and Settings\max.scheideman\Local Settings\Temp\s2k1B56.tmp

TWO-WAY TWO-LANE HIGHWAY SEGMENT WORKSHEETGeneral Information Site InformationAnalyst Tetra Tech ISGAgency or Company Rosemont Copper CompanyDate Performed 1/17/2010Analysis Time Period Peak Season, Weekend, PM
Highway AZ-83From/To I-10 ramp/Hidden Valley Rd.Jurisdiction Pima CountyAnalysis Year Operations Year 5, 50% Carpool
Input Data
Class I highway Class II highway
Terrain Level RollingTwo-way hourly volume 533 veh/hDirectional split 50 / 50Peak-hour factor, PHF 0.88No-passing zone 100 % Trucks and Buses , PT 8 %
% Recreational vehicles, PR 4%
Access points/ mi 1
Average Travel Speed
Grade adjustment factor, fG (Exhibit 20-7) 0.93
Passenger-car equivalents for trucks, ET (Exhibit 20-9) 1.9
Passenger-car equivalents for RVs, ER (Exhibit 20-9) 1.1
Heavy-vehicle adjustment factor, fHV fHV=1/ (1+ PT(ET-1)+PR(ER-1) ) 0.929
Two-way flow rate1, vp (pc/h) vp=V/ (PHF * fG * fHV) 701
vp * highest directional split proportion2 (pc/h) 351
Free-Flow Speed from Field Measurement Estimated Free-Flow Speed
Field Measured speed, SFM mi/h
Observed volume, Vf veh/h
Free-flow speed, FFS FFS=SFM+0.00776(Vf/ fHV ) 57.2 mi/h
Base free-flow speed, BFFSFM 60.0mi/h
Adj. for lane width and shoulder width3, fLS (Exhibit 20-5) 2.6mi/h
Adj. for access points, fA (Exhibit 20-6) 0.3
mi/h
Free-flow speed, FFS (FSS=BFFS-fLS-fA) 57.2mi/h
Adj. for no-passing zones, fnp ( mi/h) (Exhibit 20-11) 3.4
Average travel speed, ATS ( mi/h) ATS=FFS-0.00776vp-fnp 48.3
Percent Time-Spent-Following
Grade Adjustment factor, fG (Exhibit 20-8) 0.94
Passenger-car equivalents for trucks, ET (Exhibit 20-10) 1.5
Passenger-car equivalents for RVs, ER (Exhibit 20-10) 1.0
Heavy-vehicle adjustment factor, fHV fHV=1/ (1+ PT(ET-1)+PR(ER-1) ) 0.962
Two-way flow rate1, vp (pc/h) vp=V/ (PHF * fG * fHV) 670
vp * highest directional split proportion2 (pc/h) 335
Base percent time-spent-following, BPTSF(%) BPTSF=100(1-e-0.000879vp) 44.5
Adj. for directional distribution and no-passing zone, fd/hp(%)(Exh. 20-12) 18.7
Percent time-spent-following, PTSF(%) PTSF=BPTSF+f d/np 63.2
Level of Service and Other Performance MeasuresLevel of service, LOS (Exhibit 20-3 for Class I or 20-4 for Class II) C
Volume to capacity ratio v/c v/c=Vp/ 3,200 0.22
Peak 15-min veh-miles of travel,VMT15 (veh- mi) VMT15= 0.25Lt(V/PHF) 1514
Peak-hour vehicle-miles of travel, VMT60 (veh- mi) VMT60=V*Lt 5330
Peak 15-min total travel time, TT15(veh-h) TT15= VMT15/ATS 31.4
Notes
1. If vp >= 3,200 pc/h, terminate analysis-the LOS is F. 2. If highest directional split vp>= 1,700 pc/h, terminated anlysis-the LOS is F.
HCS2000TM Copyright © 2000 University of Florida, All Rights Reserved Version 4.1f
Page 1 of 1Two-Way
1/20/2010file://C:\Documents and Settings\max.scheideman\Local Settings\Temp\s2k1B5E.tmp

TWO-WAY TWO-LANE HIGHWAY SEGMENT WORKSHEETGeneral Information Site InformationAnalyst Tetra Tech ISGAgency or Company Rosemont Copper CompanyDate Performed 1/17/2010Analysis Time Period Peak Season, Weekend, PM
Highway AZ-83From/To Hidden Valley Rd./GreatervilleJurisdiction Pima CountyAnalysis Year Operations Year 5, 50% Carpool
Input Data
Class I highway Class II highway
Terrain Level RollingTwo-way hourly volume 451 veh/hDirectional split 50 / 50Peak-hour factor, PHF 0.88No-passing zone 100 % Trucks and Buses , PT 8 %
% Recreational vehicles, PR 4%
Access points/ mi 0
Average Travel Speed
Grade adjustment factor, fG (Exhibit 20-7) 0.93
Passenger-car equivalents for trucks, ET (Exhibit 20-9) 1.9
Passenger-car equivalents for RVs, ER (Exhibit 20-9) 1.1
Heavy-vehicle adjustment factor, fHV fHV=1/ (1+ PT(ET-1)+PR(ER-1) ) 0.929
Two-way flow rate1, vp (pc/h) vp=V/ (PHF * fG * fHV) 593
vp * highest directional split proportion2 (pc/h) 297
Free-Flow Speed from Field Measurement Estimated Free-Flow Speed
Field Measured speed, SFM mi/h
Observed volume, Vf veh/h
Free-flow speed, FFS FFS=SFM+0.00776(Vf/ fHV ) 57.4 mi/h
Base free-flow speed, BFFSFM 60.0mi/h
Adj. for lane width and shoulder width3, fLS (Exhibit 20-5) 2.6mi/h
Adj. for access points, fA (Exhibit 20-6) 0.0
mi/h
Free-flow speed, FFS (FSS=BFFS-fLS-fA) 57.4mi/h
Adj. for no-passing zones, fnp ( mi/h) (Exhibit 20-11) 3.9
Average travel speed, ATS ( mi/h) ATS=FFS-0.00776vp-fnp 48.9
Percent Time-Spent-Following
Grade Adjustment factor, fG (Exhibit 20-8) 0.94
Passenger-car equivalents for trucks, ET (Exhibit 20-10) 1.5
Passenger-car equivalents for RVs, ER (Exhibit 20-10) 1.0
Heavy-vehicle adjustment factor, fHV fHV=1/ (1+ PT(ET-1)+PR(ER-1) ) 0.962
Two-way flow rate1, vp (pc/h) vp=V/ (PHF * fG * fHV) 567
vp * highest directional split proportion2 (pc/h) 284
Base percent time-spent-following, BPTSF(%) BPTSF=100(1-e-0.000879vp) 39.2
Adj. for directional distribution and no-passing zone, fd/hp(%)(Exh. 20-12) 21.2
Percent time-spent-following, PTSF(%) PTSF=BPTSF+f d/np 60.5
Level of Service and Other Performance MeasuresLevel of service, LOS (Exhibit 20-3 for Class I or 20-4 for Class II) C
Volume to capacity ratio v/c v/c=Vp/ 3,200 0.19
Peak 15-min veh-miles of travel,VMT15 (veh- mi) VMT15= 0.25Lt(V/PHF) 769
Peak-hour vehicle-miles of travel, VMT60 (veh- mi) VMT60=V*Lt 2706
Peak 15-min total travel time, TT15(veh-h) TT15= VMT15/ATS 15.7
Notes
1. If vp >= 3,200 pc/h, terminate analysis-the LOS is F. 2. If highest directional split vp>= 1,700 pc/h, terminated anlysis-the LOS is F.
HCS2000TM Copyright © 2000 University of Florida, All Rights Reserved Version 4.1f
Page 1 of 1Two-Way
1/20/2010file://C:\Documents and Settings\max.scheideman\Local Settings\Temp\s2k1B65.tmp

NON - PEAK SEASON
SCENARIO 5
50% CARPOOL WITH NO COPPER CONCENTRATE
TRUCKS

TWO-WAY TWO-LANE HIGHWAY SEGMENT WORKSHEETGeneral Information Site InformationAnalyst Tetra Tech ISGAgency or Company Rosemont Copper CompanyDate Performed 1/16/2010Analysis Time Period Non-Peak Season, Weekday, AM
Highway AZ-83From/To I-10 Ramps/Hidden Valley RdJurisdiction Pima CountyAnalysis Year Operations Year 5, 50% NoTruck
Input Data
Class I highway Class II highway
Terrain Level RollingTwo-way hourly volume 415 veh/hDirectional split 50 / 50Peak-hour factor, PHF 0.88No-passing zone 100 % Trucks and Buses , PT 6 %
% Recreational vehicles, PR 4%
Access points/ mi 1
Average Travel Speed
Grade adjustment factor, fG (Exhibit 20-7) 0.93
Passenger-car equivalents for trucks, ET (Exhibit 20-9) 1.9
Passenger-car equivalents for RVs, ER (Exhibit 20-9) 1.1
Heavy-vehicle adjustment factor, fHV fHV=1/ (1+ PT(ET-1)+PR(ER-1) ) 0.945
Two-way flow rate1, vp (pc/h) vp=V/ (PHF * fG * fHV) 536
vp * highest directional split proportion2 (pc/h) 268
Free-Flow Speed from Field Measurement Estimated Free-Flow Speed
Field Measured speed, SFM mi/h
Observed volume, Vf veh/h
Free-flow speed, FFS FFS=SFM+0.00776(Vf/ fHV ) 57.2 mi/h
Base free-flow speed, BFFSFM 60.0mi/h
Adj. for lane width and shoulder width3, fLS (Exhibit 20-5) 2.6mi/h
Adj. for access points, fA (Exhibit 20-6) 0.3
mi/h
Free-flow speed, FFS (FSS=BFFS-fLS-fA) 57.2mi/h
Adj. for no-passing zones, fnp ( mi/h) (Exhibit 20-11) 4.1
Average travel speed, ATS ( mi/h) ATS=FFS-0.00776vp-fnp 48.9
Percent Time-Spent-Following
Grade Adjustment factor, fG (Exhibit 20-8) 0.94
Passenger-car equivalents for trucks, ET (Exhibit 20-10) 1.5
Passenger-car equivalents for RVs, ER (Exhibit 20-10) 1.0
Heavy-vehicle adjustment factor, fHV fHV=1/ (1+ PT(ET-1)+PR(ER-1) ) 0.971
Two-way flow rate1, vp (pc/h) vp=V/ (PHF * fG * fHV) 517
vp * highest directional split proportion2 (pc/h) 259
Base percent time-spent-following, BPTSF(%) BPTSF=100(1-e-0.000879vp) 36.5
Adj. for directional distribution and no-passing zone, fd/hp(%)(Exh. 20-12) 22.3
Percent time-spent-following, PTSF(%) PTSF=BPTSF+f d/np 58.8
Level of Service and Other Performance MeasuresLevel of service, LOS (Exhibit 20-3 for Class I or 20-4 for Class II) C
Volume to capacity ratio v/c v/c=Vp/ 3,200 0.17
Peak 15-min veh-miles of travel,VMT15 (veh- mi) VMT15= 0.25Lt(V/PHF) 1179
Peak-hour vehicle-miles of travel, VMT60 (veh- mi) VMT60=V*Lt 4150
Peak 15-min total travel time, TT15(veh-h) TT15= VMT15/ATS 24.1
Notes
1. If vp >= 3,200 pc/h, terminate analysis-the LOS is F. 2. If highest directional split vp>= 1,700 pc/h, terminated anlysis-the LOS is F.
HCS2000TM Copyright © 2000 University of Florida, All Rights Reserved Version 4.1f
Page 1 of 1Two-Way
1/20/2010file://C:\Documents and Settings\max.scheideman\Local Settings\Temp\s2k1C03.tmp

TWO-WAY TWO-LANE HIGHWAY SEGMENT WORKSHEETGeneral Information Site InformationAnalyst Tetra Tech ISGAgency or Company Rosemont Copper CompanyDate Performed 1/16/2010Analysis Time Period Non-Peak Season, Weekday, AM
Highway AZ-83From/To Hidden Valley Rd/GreatervilleJurisdiction Pima CountyAnalysis Year Operations Year 5, 50% NoTruck
Input Data
Class I highway Class II highway
Terrain Level RollingTwo-way hourly volume 504 veh/hDirectional split 50 / 50Peak-hour factor, PHF 0.88No-passing zone 100 % Trucks and Buses , PT 6 %
% Recreational vehicles, PR 4%
Access points/ mi 0
Average Travel Speed
Grade adjustment factor, fG (Exhibit 20-7) 0.93
Passenger-car equivalents for trucks, ET (Exhibit 20-9) 1.9
Passenger-car equivalents for RVs, ER (Exhibit 20-9) 1.1
Heavy-vehicle adjustment factor, fHV fHV=1/ (1+ PT(ET-1)+PR(ER-1) ) 0.945
Two-way flow rate1, vp (pc/h) vp=V/ (PHF * fG * fHV) 652
vp * highest directional split proportion2 (pc/h) 326
Free-Flow Speed from Field Measurement Estimated Free-Flow Speed
Field Measured speed, SFM mi/h
Observed volume, Vf veh/h
Free-flow speed, FFS FFS=SFM+0.00776(Vf/ fHV ) 57.4 mi/h
Base free-flow speed, BFFSFM 60.0mi/h
Adj. for lane width and shoulder width3, fLS (Exhibit 20-5) 2.6mi/h
Adj. for access points, fA (Exhibit 20-6) 0.0
mi/h
Free-flow speed, FFS (FSS=BFFS-fLS-fA) 57.4mi/h
Adj. for no-passing zones, fnp ( mi/h) (Exhibit 20-11) 3.7
Average travel speed, ATS ( mi/h) ATS=FFS-0.00776vp-fnp 48.7
Percent Time-Spent-Following
Grade Adjustment factor, fG (Exhibit 20-8) 0.94
Passenger-car equivalents for trucks, ET (Exhibit 20-10) 1.5
Passenger-car equivalents for RVs, ER (Exhibit 20-10) 1.0
Heavy-vehicle adjustment factor, fHV fHV=1/ (1+ PT(ET-1)+PR(ER-1) ) 0.971
Two-way flow rate1, vp (pc/h) vp=V/ (PHF * fG * fHV) 628
vp * highest directional split proportion2 (pc/h) 314
Base percent time-spent-following, BPTSF(%) BPTSF=100(1-e-0.000879vp) 42.4
Adj. for directional distribution and no-passing zone, fd/hp(%)(Exh. 20-12) 19.8
Percent time-spent-following, PTSF(%) PTSF=BPTSF+f d/np 62.2
Level of Service and Other Performance MeasuresLevel of service, LOS (Exhibit 20-3 for Class I or 20-4 for Class II) C
Volume to capacity ratio v/c v/c=Vp/ 3,200 0.20
Peak 15-min veh-miles of travel,VMT15 (veh- mi) VMT15= 0.25Lt(V/PHF) 859
Peak-hour vehicle-miles of travel, VMT60 (veh- mi) VMT60=V*Lt 3024
Peak 15-min total travel time, TT15(veh-h) TT15= VMT15/ATS 17.6
Notes
1. If vp >= 3,200 pc/h, terminate analysis-the LOS is F. 2. If highest directional split vp>= 1,700 pc/h, terminated anlysis-the LOS is F.
HCS2000TM Copyright © 2000 University of Florida, All Rights Reserved Version 4.1f
Page 1 of 1Two-Way
1/21/2010file://C:\Documents and Settings\max.scheideman\Local Settings\Temp\s2k1D63.tmp

TWO-WAY TWO-LANE HIGHWAY SEGMENT WORKSHEETGeneral Information Site InformationAnalyst Tetra Tech ISGAgency or Company Rosemont Copper CompanyDate Performed 1/15/2010Analysis Time Period Non-Peak Season, Weekday, PM
Highway AZ-83From/To I-10 Ramp/Hidden Valley RdJurisdiction Pima CountyAnalysis Year Operations Year 5, 50% NoTruck
Input Data
Class I highway Class II highway
Terrain Level RollingTwo-way hourly volume 488 veh/hDirectional split 50 / 50Peak-hour factor, PHF 0.88No-passing zone 100 % Trucks and Buses , PT 6 %
% Recreational vehicles, PR 4%
Access points/ mi 1
Average Travel Speed
Grade adjustment factor, fG (Exhibit 20-7) 0.93
Passenger-car equivalents for trucks, ET (Exhibit 20-9) 1.9
Passenger-car equivalents for RVs, ER (Exhibit 20-9) 1.1
Heavy-vehicle adjustment factor, fHV fHV=1/ (1+ PT(ET-1)+PR(ER-1) ) 0.945
Two-way flow rate1, vp (pc/h) vp=V/ (PHF * fG * fHV) 631
vp * highest directional split proportion2 (pc/h) 316
Free-Flow Speed from Field Measurement Estimated Free-Flow Speed
Field Measured speed, SFM mi/h
Observed volume, Vf veh/h
Free-flow speed, FFS FFS=SFM+0.00776(Vf/ fHV ) 57.2 mi/h
Base free-flow speed, BFFSFM 60.0mi/h
Adj. for lane width and shoulder width3, fLS (Exhibit 20-5) 2.6mi/h
Adj. for access points, fA (Exhibit 20-6) 0.3
mi/h
Free-flow speed, FFS (FSS=BFFS-fLS-fA) 57.2mi/h
Adj. for no-passing zones, fnp ( mi/h) (Exhibit 20-11) 3.8
Average travel speed, ATS ( mi/h) ATS=FFS-0.00776vp-fnp 48.5
Percent Time-Spent-Following
Grade Adjustment factor, fG (Exhibit 20-8) 0.94
Passenger-car equivalents for trucks, ET (Exhibit 20-10) 1.5
Passenger-car equivalents for RVs, ER (Exhibit 20-10) 1.0
Heavy-vehicle adjustment factor, fHV fHV=1/ (1+ PT(ET-1)+PR(ER-1) ) 0.971
Two-way flow rate1, vp (pc/h) vp=V/ (PHF * fG * fHV) 608
vp * highest directional split proportion2 (pc/h) 304
Base percent time-spent-following, BPTSF(%) BPTSF=100(1-e-0.000879vp) 41.4
Adj. for directional distribution and no-passing zone, fd/hp(%)(Exh. 20-12) 20.3
Percent time-spent-following, PTSF(%) PTSF=BPTSF+f d/np 61.7
Level of Service and Other Performance MeasuresLevel of service, LOS (Exhibit 20-3 for Class I or 20-4 for Class II) C
Volume to capacity ratio v/c v/c=Vp/ 3,200 0.20
Peak 15-min veh-miles of travel,VMT15 (veh- mi) VMT15= 0.25Lt(V/PHF) 1386
Peak-hour vehicle-miles of travel, VMT60 (veh- mi) VMT60=V*Lt 4880
Peak 15-min total travel time, TT15(veh-h) TT15= VMT15/ATS 28.6
Notes
1. If vp >= 3,200 pc/h, terminate analysis-the LOS is F. 2. If highest directional split vp>= 1,700 pc/h, terminated anlysis-the LOS is F.
HCS2000TM Copyright © 2000 University of Florida, All Rights Reserved Version 4.1f
Page 1 of 1Two-Way
1/21/2010file://C:\Documents and Settings\max.scheideman\Local Settings\Temp\s2k1D6B.tmp

TWO-WAY TWO-LANE HIGHWAY SEGMENT WORKSHEETGeneral Information Site InformationAnalyst Tetra Tech ISGAgency or Company Rosemont Copper CompanyDate Performed 1/15/2010Analysis Time Period Non-Peak Season, Weekday, PM
Highway AZ-83From/To Hidden Valley Rd/GreatervilleJurisdiction Pima CountyAnalysis Year Operations Year 5, 50% NoTruck
Input Data
Class I highway Class II highway
Terrain Level RollingTwo-way hourly volume 490 veh/hDirectional split 50 / 50Peak-hour factor, PHF 0.88No-passing zone 100 % Trucks and Buses , PT 6 %
% Recreational vehicles, PR 4%
Access points/ mi 0
Average Travel Speed
Grade adjustment factor, fG (Exhibit 20-7) 0.93
Passenger-car equivalents for trucks, ET (Exhibit 20-9) 1.9
Passenger-car equivalents for RVs, ER (Exhibit 20-9) 1.1
Heavy-vehicle adjustment factor, fHV fHV=1/ (1+ PT(ET-1)+PR(ER-1) ) 0.945
Two-way flow rate1, vp (pc/h) vp=V/ (PHF * fG * fHV) 633
vp * highest directional split proportion2 (pc/h) 317
Free-Flow Speed from Field Measurement Estimated Free-Flow Speed
Field Measured speed, SFM mi/h
Observed volume, Vf veh/h
Free-flow speed, FFS FFS=SFM+0.00776(Vf/ fHV ) 57.4 mi/h
Base free-flow speed, BFFSFM 60.0mi/h
Adj. for lane width and shoulder width3, fLS (Exhibit 20-5) 2.6mi/h
Adj. for access points, fA (Exhibit 20-6) 0.0
mi/h
Free-flow speed, FFS (FSS=BFFS-fLS-fA) 57.4mi/h
Adj. for no-passing zones, fnp ( mi/h) (Exhibit 20-11) 3.8
Average travel speed, ATS ( mi/h) ATS=FFS-0.00776vp-fnp 48.7
Percent Time-Spent-Following
Grade Adjustment factor, fG (Exhibit 20-8) 0.94
Passenger-car equivalents for trucks, ET (Exhibit 20-10) 1.5
Passenger-car equivalents for RVs, ER (Exhibit 20-10) 1.0
Heavy-vehicle adjustment factor, fHV fHV=1/ (1+ PT(ET-1)+PR(ER-1) ) 0.971
Two-way flow rate1, vp (pc/h) vp=V/ (PHF * fG * fHV) 610
vp * highest directional split proportion2 (pc/h) 305
Base percent time-spent-following, BPTSF(%) BPTSF=100(1-e-0.000879vp) 41.5
Adj. for directional distribution and no-passing zone, fd/hp(%)(Exh. 20-12) 20.2
Percent time-spent-following, PTSF(%) PTSF=BPTSF+f d/np 61.7
Level of Service and Other Performance MeasuresLevel of service, LOS (Exhibit 20-3 for Class I or 20-4 for Class II) C
Volume to capacity ratio v/c v/c=Vp/ 3,200 0.20
Peak 15-min veh-miles of travel,VMT15 (veh- mi) VMT15= 0.25Lt(V/PHF) 835
Peak-hour vehicle-miles of travel, VMT60 (veh- mi) VMT60=V*Lt 2940
Peak 15-min total travel time, TT15(veh-h) TT15= VMT15/ATS 17.1
Notes
1. If vp >= 3,200 pc/h, terminate analysis-the LOS is F. 2. If highest directional split vp>= 1,700 pc/h, terminated anlysis-the LOS is F.
HCS2000TM Copyright © 2000 University of Florida, All Rights Reserved Version 4.1f
Page 1 of 1Two-Way
1/21/2010file://C:\Documents and Settings\max.scheideman\Local Settings\Temp\s2k1D73.tmp

TWO-WAY TWO-LANE HIGHWAY SEGMENT WORKSHEETGeneral Information Site InformationAnalyst Tetra Tech ISGAgency or Company Rosemont Copper CompanyDate Performed 1/1/5/2010Analysis Time Period Non-Peak Season, Weekend, AM
Highway AZ-83From/To I-10 Ramp/Hidden Valley RdJurisdiction Pima CountyAnalysis Year Operations Year 5, 50% NoTruck
Input Data
Class I highway Class II highway
Terrain Level RollingTwo-way hourly volume 433 veh/hDirectional split 50 / 50Peak-hour factor, PHF 0.88No-passing zone 100 % Trucks and Buses , PT 6 %
% Recreational vehicles, PR 4%
Access points/ mi 1
Average Travel Speed
Grade adjustment factor, fG (Exhibit 20-7) 0.93
Passenger-car equivalents for trucks, ET (Exhibit 20-9) 1.9
Passenger-car equivalents for RVs, ER (Exhibit 20-9) 1.1
Heavy-vehicle adjustment factor, fHV fHV=1/ (1+ PT(ET-1)+PR(ER-1) ) 0.945
Two-way flow rate1, vp (pc/h) vp=V/ (PHF * fG * fHV) 560
vp * highest directional split proportion2 (pc/h) 280
Free-Flow Speed from Field Measurement Estimated Free-Flow Speed
Field Measured speed, SFM mi/h
Observed volume, Vf veh/h
Free-flow speed, FFS FFS=SFM+0.00776(Vf/ fHV ) 57.2 mi/h
Base free-flow speed, BFFSFM 60.0mi/h
Adj. for lane width and shoulder width3, fLS (Exhibit 20-5) 2.6mi/h
Adj. for access points, fA (Exhibit 20-6) 0.3
mi/h
Free-flow speed, FFS (FSS=BFFS-fLS-fA) 57.2mi/h
Adj. for no-passing zones, fnp ( mi/h) (Exhibit 20-11) 4.0
Average travel speed, ATS ( mi/h) ATS=FFS-0.00776vp-fnp 48.8
Percent Time-Spent-Following
Grade Adjustment factor, fG (Exhibit 20-8) 0.94
Passenger-car equivalents for trucks, ET (Exhibit 20-10) 1.5
Passenger-car equivalents for RVs, ER (Exhibit 20-10) 1.0
Heavy-vehicle adjustment factor, fHV fHV=1/ (1+ PT(ET-1)+PR(ER-1) ) 0.971
Two-way flow rate1, vp (pc/h) vp=V/ (PHF * fG * fHV) 539
vp * highest directional split proportion2 (pc/h) 270
Base percent time-spent-following, BPTSF(%) BPTSF=100(1-e-0.000879vp) 37.7
Adj. for directional distribution and no-passing zone, fd/hp(%)(Exh. 20-12) 21.8
Percent time-spent-following, PTSF(%) PTSF=BPTSF+f d/np 59.5
Level of Service and Other Performance MeasuresLevel of service, LOS (Exhibit 20-3 for Class I or 20-4 for Class II) C
Volume to capacity ratio v/c v/c=Vp/ 3,200 0.17
Peak 15-min veh-miles of travel,VMT15 (veh- mi) VMT15= 0.25Lt(V/PHF) 1230
Peak-hour vehicle-miles of travel, VMT60 (veh- mi) VMT60=V*Lt 4330
Peak 15-min total travel time, TT15(veh-h) TT15= VMT15/ATS 25.2
Notes
1. If vp >= 3,200 pc/h, terminate analysis-the LOS is F. 2. If highest directional split vp>= 1,700 pc/h, terminated anlysis-the LOS is F.
HCS2000TM Copyright © 2000 University of Florida, All Rights Reserved Version 4.1f
Page 1 of 1Two-Way
1/20/2010file://C:\Documents and Settings\max.scheideman\Local Settings\Temp\s2k1C21.tmp

TWO-WAY TWO-LANE HIGHWAY SEGMENT WORKSHEETGeneral Information Site InformationAnalyst Tetra Tech ISGAgency or Company Rosemont Copper CompanyDate Performed 1/15/2010Analysis Time Period Non-Peak Season, Weekend, AM
Highway AZ-83From/To Hidden Valley Rd/GreatervilleJurisdiction Pima CountyAnalysis Year Operations Year 5, 50% NoTruck
Input Data
Class I highway Class II highway
Terrain Level RollingTwo-way hourly volume 372 veh/hDirectional split 50 / 50Peak-hour factor, PHF 0.88No-passing zone 100 % Trucks and Buses , PT 6 %
% Recreational vehicles, PR 4%
Access points/ mi 0
Average Travel Speed
Grade adjustment factor, fG (Exhibit 20-7) 0.93
Passenger-car equivalents for trucks, ET (Exhibit 20-9) 1.9
Passenger-car equivalents for RVs, ER (Exhibit 20-9) 1.1
Heavy-vehicle adjustment factor, fHV fHV=1/ (1+ PT(ET-1)+PR(ER-1) ) 0.945
Two-way flow rate1, vp (pc/h) vp=V/ (PHF * fG * fHV) 481
vp * highest directional split proportion2 (pc/h) 241
Free-Flow Speed from Field Measurement Estimated Free-Flow Speed
Field Measured speed, SFM mi/h
Observed volume, Vf veh/h
Free-flow speed, FFS FFS=SFM+0.00776(Vf/ fHV ) 57.4 mi/h
Base free-flow speed, BFFSFM 60.0mi/h
Adj. for lane width and shoulder width3, fLS (Exhibit 20-5) 2.6mi/h
Adj. for access points, fA (Exhibit 20-6) 0.0
mi/h
Free-flow speed, FFS (FSS=BFFS-fLS-fA) 57.4mi/h
Adj. for no-passing zones, fnp ( mi/h) (Exhibit 20-11) 4.3
Average travel speed, ATS ( mi/h) ATS=FFS-0.00776vp-fnp 49.4
Percent Time-Spent-Following
Grade Adjustment factor, fG (Exhibit 20-8) 0.77
Passenger-car equivalents for trucks, ET (Exhibit 20-10) 1.8
Passenger-car equivalents for RVs, ER (Exhibit 20-10) 1.0
Heavy-vehicle adjustment factor, fHV fHV=1/ (1+ PT(ET-1)+PR(ER-1) ) 0.954
Two-way flow rate1, vp (pc/h) vp=V/ (PHF * fG * fHV) 575
vp * highest directional split proportion2 (pc/h) 288
Base percent time-spent-following, BPTSF(%) BPTSF=100(1-e-0.000879vp) 39.7
Adj. for directional distribution and no-passing zone, fd/hp(%)(Exh. 20-12) 21.0
Percent time-spent-following, PTSF(%) PTSF=BPTSF+f d/np 60.7
Level of Service and Other Performance MeasuresLevel of service, LOS (Exhibit 20-3 for Class I or 20-4 for Class II) C
Volume to capacity ratio v/c v/c=Vp/ 3,200 0.15
Peak 15-min veh-miles of travel,VMT15 (veh- mi) VMT15= 0.25Lt(V/PHF) 634
Peak-hour vehicle-miles of travel, VMT60 (veh- mi) VMT60=V*Lt 2232
Peak 15-min total travel time, TT15(veh-h) TT15= VMT15/ATS 12.8
Notes
1. If vp >= 3,200 pc/h, terminate analysis-the LOS is F. 2. If highest directional split vp>= 1,700 pc/h, terminated anlysis-the LOS is F.
HCS2000TM Copyright © 2000 University of Florida, All Rights Reserved Version 4.1f
Page 1 of 1Two-Way
1/20/2010file://C:\Documents and Settings\max.scheideman\Local Settings\Temp\s2k1C28.tmp

TWO-WAY TWO-LANE HIGHWAY SEGMENT WORKSHEETGeneral Information Site InformationAnalyst Tetra Tech ISGAgency or Company Rosemont Copper CompanyDate Performed 1/15/2010Analysis Time Period Non-Peak Season, Weekend, PM
Highway AZ-83From/To I-10 Ramps/Hidden Valley RdJurisdiction Pima CountyAnalysis Year Operations Year 5, 50% NoTruck
Input Data
Class I highway Class II highway
Terrain Level RollingTwo-way hourly volume 475 veh/hDirectional split 50 / 50Peak-hour factor, PHF 0.88No-passing zone 100 % Trucks and Buses , PT 6 %
% Recreational vehicles, PR 4%
Access points/ mi 1
Average Travel Speed
Grade adjustment factor, fG (Exhibit 20-7) 0.93
Passenger-car equivalents for trucks, ET (Exhibit 20-9) 1.9
Passenger-car equivalents for RVs, ER (Exhibit 20-9) 1.1
Heavy-vehicle adjustment factor, fHV fHV=1/ (1+ PT(ET-1)+PR(ER-1) ) 0.945
Two-way flow rate1, vp (pc/h) vp=V/ (PHF * fG * fHV) 614
vp * highest directional split proportion2 (pc/h) 307
Free-Flow Speed from Field Measurement Estimated Free-Flow Speed
Field Measured speed, SFM mi/h
Observed volume, Vf veh/h
Free-flow speed, FFS FFS=SFM+0.00776(Vf/ fHV ) 57.2 mi/h
Base free-flow speed, BFFSFM 60.0mi/h
Adj. for lane width and shoulder width3, fLS (Exhibit 20-5) 2.6mi/h
Adj. for access points, fA (Exhibit 20-6) 0.3
mi/h
Free-flow speed, FFS (FSS=BFFS-fLS-fA) 57.2mi/h
Adj. for no-passing zones, fnp ( mi/h) (Exhibit 20-11) 3.8
Average travel speed, ATS ( mi/h) ATS=FFS-0.00776vp-fnp 48.5
Percent Time-Spent-Following
Grade Adjustment factor, fG (Exhibit 20-8) 0.94
Passenger-car equivalents for trucks, ET (Exhibit 20-10) 1.5
Passenger-car equivalents for RVs, ER (Exhibit 20-10) 1.0
Heavy-vehicle adjustment factor, fHV fHV=1/ (1+ PT(ET-1)+PR(ER-1) ) 0.971
Two-way flow rate1, vp (pc/h) vp=V/ (PHF * fG * fHV) 591
vp * highest directional split proportion2 (pc/h) 296
Base percent time-spent-following, BPTSF(%) BPTSF=100(1-e-0.000879vp) 40.5
Adj. for directional distribution and no-passing zone, fd/hp(%)(Exh. 20-12) 20.7
Percent time-spent-following, PTSF(%) PTSF=BPTSF+f d/np 61.2
Level of Service and Other Performance MeasuresLevel of service, LOS (Exhibit 20-3 for Class I or 20-4 for Class II) C
Volume to capacity ratio v/c v/c=Vp/ 3,200 0.19
Peak 15-min veh-miles of travel,VMT15 (veh- mi) VMT15= 0.25Lt(V/PHF) 1349
Peak-hour vehicle-miles of travel, VMT60 (veh- mi) VMT60=V*Lt 4750
Peak 15-min total travel time, TT15(veh-h) TT15= VMT15/ATS 27.8
Notes
1. If vp >= 3,200 pc/h, terminate analysis-the LOS is F. 2. If highest directional split vp>= 1,700 pc/h, terminated anlysis-the LOS is F.
HCS2000TM Copyright © 2000 University of Florida, All Rights Reserved Version 4.1f
Page 1 of 1Two-Way
1/20/2010file://C:\Documents and Settings\max.scheideman\Local Settings\Temp\s2k1C30.tmp

TWO-WAY TWO-LANE HIGHWAY SEGMENT WORKSHEETGeneral Information Site InformationAnalyst Tetra Tech ISGAgency or Company Rosemont Copper CompanyDate Performed 1/1/5/2010Analysis Time Period Non-Peak Season, Weekend, PM
Highway AZ-83From/To Hidden Valley Rd/GreatervilleJurisdiction Pima CountyAnalysis Year Operations Year 5, 50% NoTruck
Input Data
Class I highway Class II highway
Terrain Level RollingTwo-way hourly volume 351 veh/hDirectional split 50 / 50Peak-hour factor, PHF 0.88No-passing zone 100 % Trucks and Buses , PT 6 %
% Recreational vehicles, PR 4%
Access points/ mi 0
Average Travel Speed
Grade adjustment factor, fG (Exhibit 20-7) 0.93
Passenger-car equivalents for trucks, ET (Exhibit 20-9) 1.9
Passenger-car equivalents for RVs, ER (Exhibit 20-9) 1.1
Heavy-vehicle adjustment factor, fHV fHV=1/ (1+ PT(ET-1)+PR(ER-1) ) 0.945
Two-way flow rate1, vp (pc/h) vp=V/ (PHF * fG * fHV) 454
vp * highest directional split proportion2 (pc/h) 227
Free-Flow Speed from Field Measurement Estimated Free-Flow Speed
Field Measured speed, SFM mi/h
Observed volume, Vf veh/h
Free-flow speed, FFS FFS=SFM+0.00776(Vf/ fHV ) 57.4 mi/h
Base free-flow speed, BFFSFM 60.0mi/h
Adj. for lane width and shoulder width3, fLS (Exhibit 20-5) 2.6mi/h
Adj. for access points, fA (Exhibit 20-6) 0.0
mi/h
Free-flow speed, FFS (FSS=BFFS-fLS-fA) 57.4mi/h
Adj. for no-passing zones, fnp ( mi/h) (Exhibit 20-11) 4.3
Average travel speed, ATS ( mi/h) ATS=FFS-0.00776vp-fnp 49.5
Percent Time-Spent-Following
Grade Adjustment factor, fG (Exhibit 20-8) 0.77
Passenger-car equivalents for trucks, ET (Exhibit 20-10) 1.8
Passenger-car equivalents for RVs, ER (Exhibit 20-10) 1.0
Heavy-vehicle adjustment factor, fHV fHV=1/ (1+ PT(ET-1)+PR(ER-1) ) 0.954
Two-way flow rate1, vp (pc/h) vp=V/ (PHF * fG * fHV) 543
vp * highest directional split proportion2 (pc/h) 272
Base percent time-spent-following, BPTSF(%) BPTSF=100(1-e-0.000879vp) 38.0
Adj. for directional distribution and no-passing zone, fd/hp(%)(Exh. 20-12) 21.7
Percent time-spent-following, PTSF(%) PTSF=BPTSF+f d/np 59.7
Level of Service and Other Performance MeasuresLevel of service, LOS (Exhibit 20-3 for Class I or 20-4 for Class II) C
Volume to capacity ratio v/c v/c=Vp/ 3,200 0.14
Peak 15-min veh-miles of travel,VMT15 (veh- mi) VMT15= 0.25Lt(V/PHF) 598
Peak-hour vehicle-miles of travel, VMT60 (veh- mi) VMT60=V*Lt 2106
Peak 15-min total travel time, TT15(veh-h) TT15= VMT15/ATS 12.1
Notes
1. If vp >= 3,200 pc/h, terminate analysis-the LOS is F. 2. If highest directional split vp>= 1,700 pc/h, terminated anlysis-the LOS is F.
HCS2000TM Copyright © 2000 University of Florida, All Rights Reserved Version 4.1f
Page 1 of 1Two-Way
1/20/2010file://C:\Documents and Settings\max.scheideman\Local Settings\Temp\s2k1C38.tmp

PEAK SEASON
SCENARIO 5
50% CARPOOL WITH NO COPPER CONCENTRATE
TRUCKS
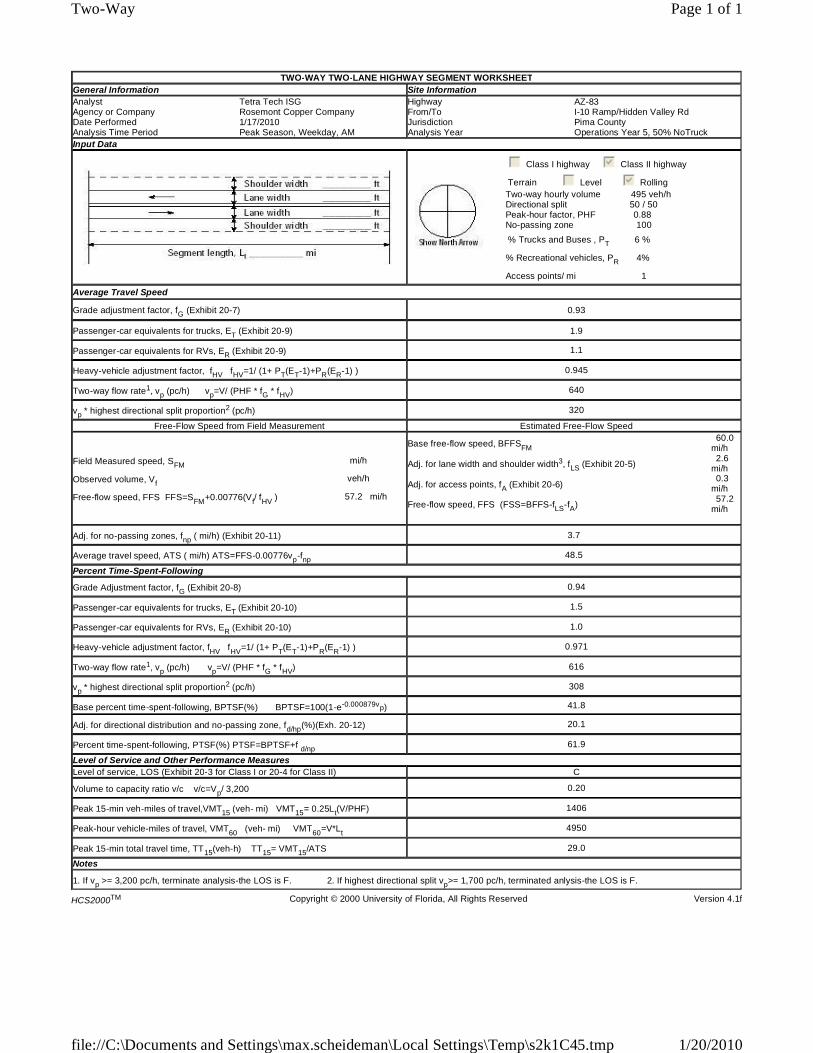
TWO-WAY TWO-LANE HIGHWAY SEGMENT WORKSHEETGeneral Information Site InformationAnalyst Tetra Tech ISGAgency or Company Rosemont Copper CompanyDate Performed 1/17/2010Analysis Time Period Peak Season, Weekday, AM
Highway AZ-83From/To I-10 Ramp/Hidden Valley RdJurisdiction Pima CountyAnalysis Year Operations Year 5, 50% NoTruck
Input Data
Class I highway Class II highway
Terrain Level RollingTwo-way hourly volume 495 veh/hDirectional split 50 / 50Peak-hour factor, PHF 0.88No-passing zone 100 % Trucks and Buses , PT 6 %
% Recreational vehicles, PR 4%
Access points/ mi 1
Average Travel Speed
Grade adjustment factor, fG (Exhibit 20-7) 0.93
Passenger-car equivalents for trucks, ET (Exhibit 20-9) 1.9
Passenger-car equivalents for RVs, ER (Exhibit 20-9) 1.1
Heavy-vehicle adjustment factor, fHV fHV=1/ (1+ PT(ET-1)+PR(ER-1) ) 0.945
Two-way flow rate1, vp (pc/h) vp=V/ (PHF * fG * fHV) 640
vp * highest directional split proportion2 (pc/h) 320
Free-Flow Speed from Field Measurement Estimated Free-Flow Speed
Field Measured speed, SFM mi/h
Observed volume, Vf veh/h
Free-flow speed, FFS FFS=SFM+0.00776(Vf/ fHV ) 57.2 mi/h
Base free-flow speed, BFFSFM 60.0mi/h
Adj. for lane width and shoulder width3, fLS (Exhibit 20-5) 2.6mi/h
Adj. for access points, fA (Exhibit 20-6) 0.3
mi/h
Free-flow speed, FFS (FSS=BFFS-fLS-fA) 57.2mi/h
Adj. for no-passing zones, fnp ( mi/h) (Exhibit 20-11) 3.7
Average travel speed, ATS ( mi/h) ATS=FFS-0.00776vp-fnp 48.5
Percent Time-Spent-Following
Grade Adjustment factor, fG (Exhibit 20-8) 0.94
Passenger-car equivalents for trucks, ET (Exhibit 20-10) 1.5
Passenger-car equivalents for RVs, ER (Exhibit 20-10) 1.0
Heavy-vehicle adjustment factor, fHV fHV=1/ (1+ PT(ET-1)+PR(ER-1) ) 0.971
Two-way flow rate1, vp (pc/h) vp=V/ (PHF * fG * fHV) 616
vp * highest directional split proportion2 (pc/h) 308
Base percent time-spent-following, BPTSF(%) BPTSF=100(1-e-0.000879vp) 41.8
Adj. for directional distribution and no-passing zone, fd/hp(%)(Exh. 20-12) 20.1
Percent time-spent-following, PTSF(%) PTSF=BPTSF+f d/np 61.9
Level of Service and Other Performance MeasuresLevel of service, LOS (Exhibit 20-3 for Class I or 20-4 for Class II) C
Volume to capacity ratio v/c v/c=Vp/ 3,200 0.20
Peak 15-min veh-miles of travel,VMT15 (veh- mi) VMT15= 0.25Lt(V/PHF) 1406
Peak-hour vehicle-miles of travel, VMT60 (veh- mi) VMT60=V*Lt 4950
Peak 15-min total travel time, TT15(veh-h) TT15= VMT15/ATS 29.0
Notes
1. If vp >= 3,200 pc/h, terminate analysis-the LOS is F. 2. If highest directional split vp>= 1,700 pc/h, terminated anlysis-the LOS is F.
HCS2000TM Copyright © 2000 University of Florida, All Rights Reserved Version 4.1f
Page 1 of 1Two-Way
1/20/2010file://C:\Documents and Settings\max.scheideman\Local Settings\Temp\s2k1C45.tmp

TWO-WAY TWO-LANE HIGHWAY SEGMENT WORKSHEETGeneral Information Site InformationAnalyst Tetra Tech ISGAgency or Company Rosemont Copper CompanyDate Performed 1/17/2010Analysis Time Period Peak Season, Weekday, AM
Highway AZ-83From/To Hidden Valley Rd/GreatervilleJurisdiction Pima CountyAnalysis Year Operations Year 5, 50% NoTruck
Input Data
Class I highway Class II highway
Terrain Level RollingTwo-way hourly volume 417 veh/hDirectional split 50 / 50Peak-hour factor, PHF 0.88No-passing zone 100 % Trucks and Buses , PT 6 %
% Recreational vehicles, PR 4%
Access points/ mi 0
Average Travel Speed
Grade adjustment factor, fG (Exhibit 20-7) 0.93
Passenger-car equivalents for trucks, ET (Exhibit 20-9) 1.9
Passenger-car equivalents for RVs, ER (Exhibit 20-9) 1.1
Heavy-vehicle adjustment factor, fHV fHV=1/ (1+ PT(ET-1)+PR(ER-1) ) 0.945
Two-way flow rate1, vp (pc/h) vp=V/ (PHF * fG * fHV) 539
vp * highest directional split proportion2 (pc/h) 270
Free-Flow Speed from Field Measurement Estimated Free-Flow Speed
Field Measured speed, SFM mi/h
Observed volume, Vf veh/h
Free-flow speed, FFS FFS=SFM+0.00776(Vf/ fHV ) 57.4 mi/h
Base free-flow speed, BFFSFM 60.0mi/h
Adj. for lane width and shoulder width3, fLS (Exhibit 20-5) 2.6mi/h
Adj. for access points, fA (Exhibit 20-6) 0.0
mi/h
Free-flow speed, FFS (FSS=BFFS-fLS-fA) 57.4mi/h
Adj. for no-passing zones, fnp ( mi/h) (Exhibit 20-11) 4.1
Average travel speed, ATS ( mi/h) ATS=FFS-0.00776vp-fnp 49.1
Percent Time-Spent-Following
Grade Adjustment factor, fG (Exhibit 20-8) 0.94
Passenger-car equivalents for trucks, ET (Exhibit 20-10) 1.5
Passenger-car equivalents for RVs, ER (Exhibit 20-10) 1.0
Heavy-vehicle adjustment factor, fHV fHV=1/ (1+ PT(ET-1)+PR(ER-1) ) 0.971
Two-way flow rate1, vp (pc/h) vp=V/ (PHF * fG * fHV) 519
vp * highest directional split proportion2 (pc/h) 260
Base percent time-spent-following, BPTSF(%) BPTSF=100(1-e-0.000879vp) 36.6
Adj. for directional distribution and no-passing zone, fd/hp(%)(Exh. 20-12) 22.2
Percent time-spent-following, PTSF(%) PTSF=BPTSF+f d/np 58.9
Level of Service and Other Performance MeasuresLevel of service, LOS (Exhibit 20-3 for Class I or 20-4 for Class II) C
Volume to capacity ratio v/c v/c=Vp/ 3,200 0.17
Peak 15-min veh-miles of travel,VMT15 (veh- mi) VMT15= 0.25Lt(V/PHF) 711
Peak-hour vehicle-miles of travel, VMT60 (veh- mi) VMT60=V*Lt 2502
Peak 15-min total travel time, TT15(veh-h) TT15= VMT15/ATS 14.5
Notes
1. If vp >= 3,200 pc/h, terminate analysis-the LOS is F. 2. If highest directional split vp>= 1,700 pc/h, terminated anlysis-the LOS is F.
HCS2000TM Copyright © 2000 University of Florida, All Rights Reserved Version 4.1f
Page 1 of 1Two-Way
1/20/2010file://C:\Documents and Settings\max.scheideman\Local Settings\Temp\s2k1C4E.tmp

TWO-WAY TWO-LANE HIGHWAY SEGMENT WORKSHEETGeneral Information Site InformationAnalyst Tetra Tech ISGAgency or Company Rosemont Copper CompanyDate Performed 1/17/2010Analysis Time Period Peak Season, Weekday, PM
Highway AZ-83From/To I-10 ramp/Hidden Valley RdJurisdiction Pima CountyAnalysis Year Operations Year 5, 50% NoTruck
Input Data
Class I highway Class II highway
Terrain Level RollingTwo-way hourly volume 592 veh/hDirectional split 50 / 50Peak-hour factor, PHF 0.88No-passing zone 100 % Trucks and Buses , PT 6 %
% Recreational vehicles, PR 4%
Access points/ mi 1
Average Travel Speed
Grade adjustment factor, fG (Exhibit 20-7) 0.93
Passenger-car equivalents for trucks, ET (Exhibit 20-9) 1.9
Passenger-car equivalents for RVs, ER (Exhibit 20-9) 1.1
Heavy-vehicle adjustment factor, fHV fHV=1/ (1+ PT(ET-1)+PR(ER-1) ) 0.945
Two-way flow rate1, vp (pc/h) vp=V/ (PHF * fG * fHV) 765
vp * highest directional split proportion2 (pc/h) 383
Free-Flow Speed from Field Measurement Estimated Free-Flow Speed
Field Measured speed, SFM mi/h
Observed volume, Vf veh/h
Free-flow speed, FFS FFS=SFM+0.00776(Vf/ fHV ) 57.2 mi/h
Base free-flow speed, BFFSFM 60.0mi/h
Adj. for lane width and shoulder width3, fLS (Exhibit 20-5) 2.6mi/h
Adj. for access points, fA (Exhibit 20-6) 0.3
mi/h
Free-flow speed, FFS (FSS=BFFS-fLS-fA) 57.2mi/h
Adj. for no-passing zones, fnp ( mi/h) (Exhibit 20-11) 3.2
Average travel speed, ATS ( mi/h) ATS=FFS-0.00776vp-fnp 48.1
Percent Time-Spent-Following
Grade Adjustment factor, fG (Exhibit 20-8) 0.94
Passenger-car equivalents for trucks, ET (Exhibit 20-10) 1.5
Passenger-car equivalents for RVs, ER (Exhibit 20-10) 1.0
Heavy-vehicle adjustment factor, fHV fHV=1/ (1+ PT(ET-1)+PR(ER-1) ) 0.971
Two-way flow rate1, vp (pc/h) vp=V/ (PHF * fG * fHV) 737
vp * highest directional split proportion2 (pc/h) 369
Base percent time-spent-following, BPTSF(%) BPTSF=100(1-e-0.000879vp) 47.7
Adj. for directional distribution and no-passing zone, fd/hp(%)(Exh. 20-12) 17.0
Percent time-spent-following, PTSF(%) PTSF=BPTSF+f d/np 64.7
Level of Service and Other Performance MeasuresLevel of service, LOS (Exhibit 20-3 for Class I or 20-4 for Class II) C
Volume to capacity ratio v/c v/c=Vp/ 3,200 0.24
Peak 15-min veh-miles of travel,VMT15 (veh- mi) VMT15= 0.25Lt(V/PHF) 1682
Peak-hour vehicle-miles of travel, VMT60 (veh- mi) VMT60=V*Lt 5920
Peak 15-min total travel time, TT15(veh-h) TT15= VMT15/ATS 35.0
Notes
1. If vp >= 3,200 pc/h, terminate analysis-the LOS is F. 2. If highest directional split vp>= 1,700 pc/h, terminated anlysis-the LOS is F.
HCS2000TM Copyright © 2000 University of Florida, All Rights Reserved Version 4.1f
Page 1 of 1Two-Way
1/20/2010file://C:\Documents and Settings\max.scheideman\Local Settings\Temp\s2k1C55.tmp

TWO-WAY TWO-LANE HIGHWAY SEGMENT WORKSHEETGeneral Information Site InformationAnalyst Tetra Tech ISGAgency or Company Rosemont Copper CompanyDate Performed 1/17/2010Analysis Time Period Peak Season, Weekday, PM
Highway AZ-83From/To Hidden Valley Rd./GreatervilleJurisdiction Pima CountyAnalysis Year Operations Year 5, 50% NoTruck
Input Data
Class I highway Class II highway
Terrain Level RollingTwo-way hourly volume 524 veh/hDirectional split 50 / 50Peak-hour factor, PHF 0.88No-passing zone 100 % Trucks and Buses , PT 6 %
% Recreational vehicles, PR 4%
Access points/ mi 0
Average Travel Speed
Grade adjustment factor, fG (Exhibit 20-7) 0.93
Passenger-car equivalents for trucks, ET (Exhibit 20-9) 1.9
Passenger-car equivalents for RVs, ER (Exhibit 20-9) 1.1
Heavy-vehicle adjustment factor, fHV fHV=1/ (1+ PT(ET-1)+PR(ER-1) ) 0.945
Two-way flow rate1, vp (pc/h) vp=V/ (PHF * fG * fHV) 677
vp * highest directional split proportion2 (pc/h) 339
Free-Flow Speed from Field Measurement Estimated Free-Flow Speed
Field Measured speed, SFM mi/h
Observed volume, Vf veh/h
Free-flow speed, FFS FFS=SFM+0.00776(Vf/ fHV ) 57.4 mi/h
Base free-flow speed, BFFSFM 60.0mi/h
Adj. for lane width and shoulder width3, fLS (Exhibit 20-5) 2.6mi/h
Adj. for access points, fA (Exhibit 20-6) 0.0
mi/h
Free-flow speed, FFS (FSS=BFFS-fLS-fA) 57.4mi/h
Adj. for no-passing zones, fnp ( mi/h) (Exhibit 20-11) 3.6
Average travel speed, ATS ( mi/h) ATS=FFS-0.00776vp-fnp 48.6
Percent Time-Spent-Following
Grade Adjustment factor, fG (Exhibit 20-8) 0.94
Passenger-car equivalents for trucks, ET (Exhibit 20-10) 1.5
Passenger-car equivalents for RVs, ER (Exhibit 20-10) 1.0
Heavy-vehicle adjustment factor, fHV fHV=1/ (1+ PT(ET-1)+PR(ER-1) ) 0.971
Two-way flow rate1, vp (pc/h) vp=V/ (PHF * fG * fHV) 652
vp * highest directional split proportion2 (pc/h) 326
Base percent time-spent-following, BPTSF(%) BPTSF=100(1-e-0.000879vp) 43.6
Adj. for directional distribution and no-passing zone, fd/hp(%)(Exh. 20-12) 19.2
Percent time-spent-following, PTSF(%) PTSF=BPTSF+f d/np 62.8
Level of Service and Other Performance MeasuresLevel of service, LOS (Exhibit 20-3 for Class I or 20-4 for Class II) C
Volume to capacity ratio v/c v/c=Vp/ 3,200 0.21
Peak 15-min veh-miles of travel,VMT15 (veh- mi) VMT15= 0.25Lt(V/PHF) 893
Peak-hour vehicle-miles of travel, VMT60 (veh- mi) VMT60=V*Lt 3144
Peak 15-min total travel time, TT15(veh-h) TT15= VMT15/ATS 18.4
Notes
1. If vp >= 3,200 pc/h, terminate analysis-the LOS is F. 2. If highest directional split vp>= 1,700 pc/h, terminated anlysis-the LOS is F.
HCS2000TM Copyright © 2000 University of Florida, All Rights Reserved Version 4.1f
Page 1 of 1Two-Way
1/20/2010file://C:\Documents and Settings\max.scheideman\Local Settings\Temp\s2k1C5C.tmp

TWO-WAY TWO-LANE HIGHWAY SEGMENT WORKSHEETGeneral Information Site InformationAnalyst Tetra Tech ISGAgency or Company Rosemont Copper CompanyDate Performed 1/17/2010Analysis Time Period Peak Season, Weekend, AM
Highway AZ-83From/To I-10 ramp/Hidden Valley Rd.Jurisdiction Pima CountyAnalysis Year Operations Year 5, 50% NoTruck
Input Data
Class I highway Class II highway
Terrain Level RollingTwo-way hourly volume 429 veh/hDirectional split 50 / 50Peak-hour factor, PHF 0.88No-passing zone 100 % Trucks and Buses , PT 6 %
% Recreational vehicles, PR 4%
Access points/ mi 1
Average Travel Speed
Grade adjustment factor, fG (Exhibit 20-7) 0.93
Passenger-car equivalents for trucks, ET (Exhibit 20-9) 1.9
Passenger-car equivalents for RVs, ER (Exhibit 20-9) 1.1
Heavy-vehicle adjustment factor, fHV fHV=1/ (1+ PT(ET-1)+PR(ER-1) ) 0.945
Two-way flow rate1, vp (pc/h) vp=V/ (PHF * fG * fHV) 555
vp * highest directional split proportion2 (pc/h) 278
Free-Flow Speed from Field Measurement Estimated Free-Flow Speed
Field Measured speed, SFM mi/h
Observed volume, Vf veh/h
Free-flow speed, FFS FFS=SFM+0.00776(Vf/ fHV ) 57.2 mi/h
Base free-flow speed, BFFSFM 60.0mi/h
Adj. for lane width and shoulder width3, fLS (Exhibit 20-5) 2.6mi/h
Adj. for access points, fA (Exhibit 20-6) 0.3
mi/h
Free-flow speed, FFS (FSS=BFFS-fLS-fA) 57.2mi/h
Adj. for no-passing zones, fnp ( mi/h) (Exhibit 20-11) 4.0
Average travel speed, ATS ( mi/h) ATS=FFS-0.00776vp-fnp 48.8
Percent Time-Spent-Following
Grade Adjustment factor, fG (Exhibit 20-8) 0.94
Passenger-car equivalents for trucks, ET (Exhibit 20-10) 1.5
Passenger-car equivalents for RVs, ER (Exhibit 20-10) 1.0
Heavy-vehicle adjustment factor, fHV fHV=1/ (1+ PT(ET-1)+PR(ER-1) ) 0.971
Two-way flow rate1, vp (pc/h) vp=V/ (PHF * fG * fHV) 534
vp * highest directional split proportion2 (pc/h) 267
Base percent time-spent-following, BPTSF(%) BPTSF=100(1-e-0.000879vp) 37.5
Adj. for directional distribution and no-passing zone, fd/hp(%)(Exh. 20-12) 21.9
Percent time-spent-following, PTSF(%) PTSF=BPTSF+f d/np 59.4
Level of Service and Other Performance MeasuresLevel of service, LOS (Exhibit 20-3 for Class I or 20-4 for Class II) C
Volume to capacity ratio v/c v/c=Vp/ 3,200 0.17
Peak 15-min veh-miles of travel,VMT15 (veh- mi) VMT15= 0.25Lt(V/PHF) 1219
Peak-hour vehicle-miles of travel, VMT60 (veh- mi) VMT60=V*Lt 4290
Peak 15-min total travel time, TT15(veh-h) TT15= VMT15/ATS 25.0
Notes
1. If vp >= 3,200 pc/h, terminate analysis-the LOS is F. 2. If highest directional split vp>= 1,700 pc/h, terminated anlysis-the LOS is F.
HCS2000TM Copyright © 2000 University of Florida, All Rights Reserved Version 4.1f
Page 1 of 1Two-Way
1/20/2010file://C:\Documents and Settings\max.scheideman\Local Settings\Temp\s2k1C63.tmp

TWO-WAY TWO-LANE HIGHWAY SEGMENT WORKSHEETGeneral Information Site InformationAnalyst Tetra Tech ISGAgency or Company Rosemont Copper CompanyDate Performed 1/17/2010Analysis Time Period Peak Season, Weekend, AM
Highway AZ-83From/To Hidden Valley Rd./GreatervilleJurisdiction Pima CountyAnalysis Year Operations Year 5, 50% NoTruck
Input Data
Class I highway Class II highway
Terrain Level RollingTwo-way hourly volume 331 veh/hDirectional split 50 / 50Peak-hour factor, PHF 0.88No-passing zone 100 % Trucks and Buses , PT 6 %
% Recreational vehicles, PR 4%
Access points/ mi 0
Average Travel Speed
Grade adjustment factor, fG (Exhibit 20-7) 0.71
Passenger-car equivalents for trucks, ET (Exhibit 20-9) 2.5
Passenger-car equivalents for RVs, ER (Exhibit 20-9) 1.1
Heavy-vehicle adjustment factor, fHV fHV=1/ (1+ PT(ET-1)+PR(ER-1) ) 0.914
Two-way flow rate1, vp (pc/h) vp=V/ (PHF * fG * fHV) 580
vp * highest directional split proportion2 (pc/h) 290
Free-Flow Speed from Field Measurement Estimated Free-Flow Speed
Field Measured speed, SFM mi/h
Observed volume, Vf veh/h
Free-flow speed, FFS FFS=SFM+0.00776(Vf/ fHV ) 57.4 mi/h
Base free-flow speed, BFFSFM 60.0mi/h
Adj. for lane width and shoulder width3, fLS (Exhibit 20-5) 2.6mi/h
Adj. for access points, fA (Exhibit 20-6) 0.0
mi/h
Free-flow speed, FFS (FSS=BFFS-fLS-fA) 57.4mi/h
Adj. for no-passing zones, fnp ( mi/h) (Exhibit 20-11) 4.0
Average travel speed, ATS ( mi/h) ATS=FFS-0.00776vp-fnp 48.9
Percent Time-Spent-Following
Grade Adjustment factor, fG (Exhibit 20-8) 0.77
Passenger-car equivalents for trucks, ET (Exhibit 20-10) 1.8
Passenger-car equivalents for RVs, ER (Exhibit 20-10) 1.0
Heavy-vehicle adjustment factor, fHV fHV=1/ (1+ PT(ET-1)+PR(ER-1) ) 0.954
Two-way flow rate1, vp (pc/h) vp=V/ (PHF * fG * fHV) 512
vp * highest directional split proportion2 (pc/h) 256
Base percent time-spent-following, BPTSF(%) BPTSF=100(1-e-0.000879vp) 36.2
Adj. for directional distribution and no-passing zone, fd/hp(%)(Exh. 20-12) 22.4
Percent time-spent-following, PTSF(%) PTSF=BPTSF+f d/np 58.6
Level of Service and Other Performance MeasuresLevel of service, LOS (Exhibit 20-3 for Class I or 20-4 for Class II) C
Volume to capacity ratio v/c v/c=Vp/ 3,200 0.18
Peak 15-min veh-miles of travel,VMT15 (veh- mi) VMT15= 0.25Lt(V/PHF) 564
Peak-hour vehicle-miles of travel, VMT60 (veh- mi) VMT60=V*Lt 1986
Peak 15-min total travel time, TT15(veh-h) TT15= VMT15/ATS 11.5
Notes
1. If vp >= 3,200 pc/h, terminate analysis-the LOS is F. 2. If highest directional split vp>= 1,700 pc/h, terminated anlysis-the LOS is F.
HCS2000TM Copyright © 2000 University of Florida, All Rights Reserved Version 4.1f
Page 1 of 1Two-Way
1/20/2010file://C:\Documents and Settings\max.scheideman\Local Settings\Temp\s2k1C6A.tmp

TWO-WAY TWO-LANE HIGHWAY SEGMENT WORKSHEETGeneral Information Site InformationAnalyst Tetra Tech ISGAgency or Company Rosemont Copper CompanyDate Performed 1/17/2010Analysis Time Period Peak Season, Weekend, PM
Highway AZ-83From/To I-10 ramp/Hidden Valley Rd.Jurisdiction Pima CountyAnalysis Year Operations Year 5, 50% NoTruck
Input Data
Class I highway Class II highway
Terrain Level RollingTwo-way hourly volume 530 veh/hDirectional split 50 / 50Peak-hour factor, PHF 0.88No-passing zone 100 % Trucks and Buses , PT 6 %
% Recreational vehicles, PR 4%
Access points/ mi 1
Average Travel Speed
Grade adjustment factor, fG (Exhibit 20-7) 0.93
Passenger-car equivalents for trucks, ET (Exhibit 20-9) 1.9
Passenger-car equivalents for RVs, ER (Exhibit 20-9) 1.1
Heavy-vehicle adjustment factor, fHV fHV=1/ (1+ PT(ET-1)+PR(ER-1) ) 0.945
Two-way flow rate1, vp (pc/h) vp=V/ (PHF * fG * fHV) 685
vp * highest directional split proportion2 (pc/h) 343
Free-Flow Speed from Field Measurement Estimated Free-Flow Speed
Field Measured speed, SFM mi/h
Observed volume, Vf veh/h
Free-flow speed, FFS FFS=SFM+0.00776(Vf/ fHV ) 57.2 mi/h
Base free-flow speed, BFFSFM 60.0mi/h
Adj. for lane width and shoulder width3, fLS (Exhibit 20-5) 2.6mi/h
Adj. for access points, fA (Exhibit 20-6) 0.3
mi/h
Free-flow speed, FFS (FSS=BFFS-fLS-fA) 57.2mi/h
Adj. for no-passing zones, fnp ( mi/h) (Exhibit 20-11) 3.5
Average travel speed, ATS ( mi/h) ATS=FFS-0.00776vp-fnp 48.3
Percent Time-Spent-Following
Grade Adjustment factor, fG (Exhibit 20-8) 0.94
Passenger-car equivalents for trucks, ET (Exhibit 20-10) 1.5
Passenger-car equivalents for RVs, ER (Exhibit 20-10) 1.0
Heavy-vehicle adjustment factor, fHV fHV=1/ (1+ PT(ET-1)+PR(ER-1) ) 0.971
Two-way flow rate1, vp (pc/h) vp=V/ (PHF * fG * fHV) 660
vp * highest directional split proportion2 (pc/h) 330
Base percent time-spent-following, BPTSF(%) BPTSF=100(1-e-0.000879vp) 44.0
Adj. for directional distribution and no-passing zone, fd/hp(%)(Exh. 20-12) 19.0
Percent time-spent-following, PTSF(%) PTSF=BPTSF+f d/np 63.0
Level of Service and Other Performance MeasuresLevel of service, LOS (Exhibit 20-3 for Class I or 20-4 for Class II) C
Volume to capacity ratio v/c v/c=Vp/ 3,200 0.21
Peak 15-min veh-miles of travel,VMT15 (veh- mi) VMT15= 0.25Lt(V/PHF) 1506
Peak-hour vehicle-miles of travel, VMT60 (veh- mi) VMT60=V*Lt 5300
Peak 15-min total travel time, TT15(veh-h) TT15= VMT15/ATS 31.2
Notes
1. If vp >= 3,200 pc/h, terminate analysis-the LOS is F. 2. If highest directional split vp>= 1,700 pc/h, terminated anlysis-the LOS is F.
HCS2000TM Copyright © 2000 University of Florida, All Rights Reserved Version 4.1f
Page 1 of 1Two-Way
1/20/2010file://C:\Documents and Settings\max.scheideman\Local Settings\Temp\s2k1C71.tmp

TWO-WAY TWO-LANE HIGHWAY SEGMENT WORKSHEETGeneral Information Site InformationAnalyst Tetra Tech ISGAgency or Company Rosemont Copper CompanyDate Performed 1/17/2010Analysis Time Period Peak Season, Weekend, PM
Highway AZ-83From/To Hidden Valley Rd./GreatervilleJurisdiction Pima CountyAnalysis Year Operations Year 5, 50% NoTruck
Input Data
Class I highway Class II highway
Terrain Level RollingTwo-way hourly volume 450 veh/hDirectional split 50 / 50Peak-hour factor, PHF 0.88No-passing zone 100 % Trucks and Buses , PT 6 %
% Recreational vehicles, PR 4%
Access points/ mi 0
Average Travel Speed
Grade adjustment factor, fG (Exhibit 20-7) 0.93
Passenger-car equivalents for trucks, ET (Exhibit 20-9) 1.9
Passenger-car equivalents for RVs, ER (Exhibit 20-9) 1.1
Heavy-vehicle adjustment factor, fHV fHV=1/ (1+ PT(ET-1)+PR(ER-1) ) 0.945
Two-way flow rate1, vp (pc/h) vp=V/ (PHF * fG * fHV) 582
vp * highest directional split proportion2 (pc/h) 291
Free-Flow Speed from Field Measurement Estimated Free-Flow Speed
Field Measured speed, SFM mi/h
Observed volume, Vf veh/h
Free-flow speed, FFS FFS=SFM+0.00776(Vf/ fHV ) 57.4 mi/h
Base free-flow speed, BFFSFM 60.0mi/h
Adj. for lane width and shoulder width3, fLS (Exhibit 20-5) 2.6mi/h
Adj. for access points, fA (Exhibit 20-6) 0.0
mi/h
Free-flow speed, FFS (FSS=BFFS-fLS-fA) 57.4mi/h
Adj. for no-passing zones, fnp ( mi/h) (Exhibit 20-11) 4.0
Average travel speed, ATS ( mi/h) ATS=FFS-0.00776vp-fnp 48.9
Percent Time-Spent-Following
Grade Adjustment factor, fG (Exhibit 20-8) 0.94
Passenger-car equivalents for trucks, ET (Exhibit 20-10) 1.5
Passenger-car equivalents for RVs, ER (Exhibit 20-10) 1.0
Heavy-vehicle adjustment factor, fHV fHV=1/ (1+ PT(ET-1)+PR(ER-1) ) 0.971
Two-way flow rate1, vp (pc/h) vp=V/ (PHF * fG * fHV) 560
vp * highest directional split proportion2 (pc/h) 280
Base percent time-spent-following, BPTSF(%) BPTSF=100(1-e-0.000879vp) 38.9
Adj. for directional distribution and no-passing zone, fd/hp(%)(Exh. 20-12) 21.4
Percent time-spent-following, PTSF(%) PTSF=BPTSF+f d/np 60.2
Level of Service and Other Performance MeasuresLevel of service, LOS (Exhibit 20-3 for Class I or 20-4 for Class II) C
Volume to capacity ratio v/c v/c=Vp/ 3,200 0.18
Peak 15-min veh-miles of travel,VMT15 (veh- mi) VMT15= 0.25Lt(V/PHF) 767
Peak-hour vehicle-miles of travel, VMT60 (veh- mi) VMT60=V*Lt 2700
Peak 15-min total travel time, TT15(veh-h) TT15= VMT15/ATS 15.7
Notes
1. If vp >= 3,200 pc/h, terminate analysis-the LOS is F. 2. If highest directional split vp>= 1,700 pc/h, terminated anlysis-the LOS is F.
HCS2000TM Copyright © 2000 University of Florida, All Rights Reserved Version 4.1f
Page 1 of 1Two-Way
1/21/2010file://C:\Documents and Settings\max.scheideman\Local Settings\Temp\s2k1DC0.tmp

ATTACHMENT 3
OPERATIONS YEAR 20 LOS WORKSHEETS –
INTERSECTIONS

NON-PEAK SEASON
SCENARIO 3
NO CARPOOL

HCM Unsignalized Intersection Capacity Analysis
1: I-10 WB On-Off Ramp & AZ-83 Page 1
Operations Year 20, No Carpool, Non-Peak Season, Weekday, AM Synchro 7 Report
Tetra Tech ISG 2/5/2010
Movement EBL EBT WBT WBR SBL SBR
Lane Configurations
Volume (veh/h) 9 62 793 4 13 49
Sign Control Free Free Yield
Grade 0% 0% 0%
Peak Hour Factor 0.92 0.92 0.92 0.92 0.92 0.92
Hourly flow rate (vph) 10 67 862 4 14 53
Pedestrians
Lane Width (ft)
Walking Speed (ft/s)
Percent Blockage
Right turn flare (veh)
Median type None None
Median storage veh)
Upstream signal (ft)
pX, platoon unblocked
vC, conflicting volume 866 951 864
vC1, stage 1 conf vol
vC2, stage 2 conf vol
vCu, unblocked vol 866 951 864
tC, single (s) 4.1 6.4 6.2
tC, 2 stage (s)
tF (s) 2.2 3.5 3.3
p0 queue free % 99 95 85
cM capacity (veh/h) 769 282 351
Direction, Lane # EB 1 WB 1 SB 1
Volume Total 77 866 67
Volume Left 10 0 14
Volume Right 0 4 53
cSH 769 1700 334
Volume to Capacity 0.01 0.51 0.20
Queue Length 95th (ft) 1 0 19
Control Delay (s) 1.3 0.0 18.5
Lane LOS A C
Approach Delay (s) 1.3 0.0 18.5
Approach LOS C
Intersection Summary
Average Delay 1.3
Intersection Capacity Utilization 52.4% ICU Level of Service A
Analysis Period (min) 15
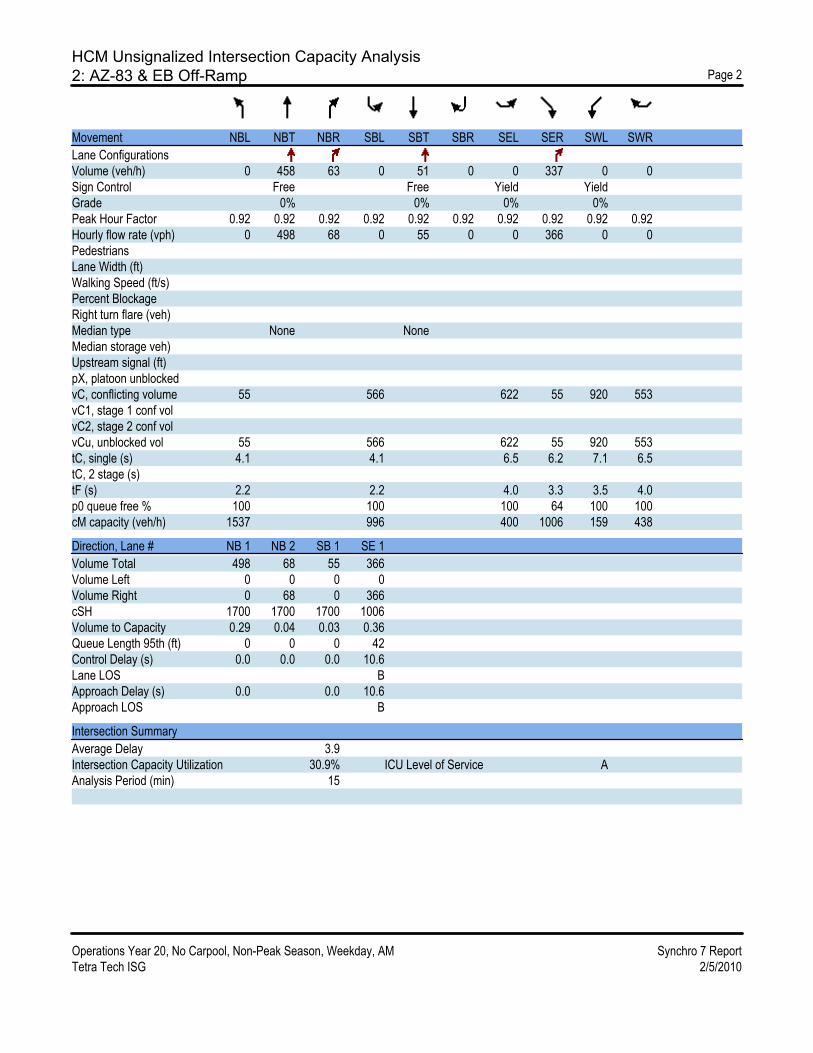
HCM Unsignalized Intersection Capacity Analysis
2: AZ-83 & EB Off-Ramp Page 2
Operations Year 20, No Carpool, Non-Peak Season, Weekday, AM Synchro 7 Report
Tetra Tech ISG 2/5/2010
Movement NBL NBT NBR SBL SBT SBR SEL SER SWL SWR
Lane Configurations
Volume (veh/h) 0 458 63 0 51 0 0 337 0 0
Sign Control Free Free Yield Yield
Grade 0% 0% 0% 0%
Peak Hour Factor 0.92 0.92 0.92 0.92 0.92 0.92 0.92 0.92 0.92 0.92
Hourly flow rate (vph) 0 498 68 0 55 0 0 366 0 0
Pedestrians
Lane Width (ft)
Walking Speed (ft/s)
Percent Blockage
Right turn flare (veh)
Median type None None
Median storage veh)
Upstream signal (ft)
pX, platoon unblocked
vC, conflicting volume 55 566 622 55 920 553
vC1, stage 1 conf vol
vC2, stage 2 conf vol
vCu, unblocked vol 55 566 622 55 920 553
tC, single (s) 4.1 4.1 6.5 6.2 7.1 6.5
tC, 2 stage (s)
tF (s) 2.2 2.2 4.0 3.3 3.5 4.0
p0 queue free % 100 100 100 64 100 100
cM capacity (veh/h) 1537 996 400 1006 159 438
Direction, Lane # NB 1 NB 2 SB 1 SE 1
Volume Total 498 68 55 366
Volume Left 0 0 0 0
Volume Right 0 68 0 366
cSH 1700 1700 1700 1006
Volume to Capacity 0.29 0.04 0.03 0.36
Queue Length 95th (ft) 0 0 0 42
Control Delay (s) 0.0 0.0 0.0 10.6
Lane LOS B
Approach Delay (s) 0.0 0.0 10.6
Approach LOS B
Intersection Summary
Average Delay 3.9
Intersection Capacity Utilization 30.9% ICU Level of Service A
Analysis Period (min) 15

HCM Unsignalized Intersection Capacity Analysis
3: Sahuarita Rd. & AZ-83 Page 1
Operations Year 20, No Carpool, Non-Peak Season, Weekday, AM Synchro 7 Report
Tetra Tech ISG Page 1
Movement EBL EBR NBL NBT SBT SBR
Lane Configurations
Volume (veh/h) 22 11 22 287 316 4
Sign Control Yield Free Free
Grade 0% 0% 0%
Peak Hour Factor 0.92 0.92 0.92 0.92 0.92 0.92
Hourly flow rate (vph) 24 12 24 312 343 4
Pedestrians
Lane Width (ft)
Walking Speed (ft/s)
Percent Blockage
Right turn flare (veh)
Median type None None
Median storage veh)
Upstream signal (ft)
pX, platoon unblocked
vC, conflicting volume 705 346 348
vC1, stage 1 conf vol
vC2, stage 2 conf vol
vCu, unblocked vol 705 346 348
tC, single (s) 6.4 6.2 4.1
tC, 2 stage (s)
tF (s) 3.5 3.3 2.2
p0 queue free % 94 98 98
cM capacity (veh/h) 392 693 1200
Direction, Lane # EB 1 NB 1 SB 1
Volume Total 36 336 348
Volume Left 24 24 0
Volume Right 12 0 4
cSH 458 1200 1700
Volume to Capacity 0.08 0.02 0.20
Queue Length 95th (ft) 6 2 0
Control Delay (s) 13.5 0.8 0.0
Lane LOS B A
Approach Delay (s) 13.5 0.8 0.0
Approach LOS B
Intersection Summary
Average Delay 1.0
Intersection Capacity Utilization 43.2% ICU Level of Service A
Analysis Period (min) 15

HCM Unsignalized Intersection Capacity Analysis
4: Hilton Ranch Rd. & AZ-83 Page 2
Operations Year 20, No Carpool, Non-Peak Season, Weekday, AM Synchro 7 Report
Tetra Tech ISG Page 2
Movement WBL WBR NBT NBR SBL SBT
Lane Configurations
Volume (veh/h) 0 0 223 0 15 324
Sign Control Yield Free Free
Grade 0% 0% 0%
Peak Hour Factor 0.92 0.92 0.92 0.92 0.92 0.92
Hourly flow rate (vph) 0 0 242 0 16 352
Pedestrians
Lane Width (ft)
Walking Speed (ft/s)
Percent Blockage
Right turn flare (veh)
Median type None None
Median storage veh)
Upstream signal (ft)
pX, platoon unblocked
vC, conflicting volume 627 242 242
vC1, stage 1 conf vol
vC2, stage 2 conf vol
vCu, unblocked vol 627 242 242
tC, single (s) 6.4 6.2 4.1
tC, 2 stage (s)
tF (s) 3.5 3.3 2.2
p0 queue free % 100 100 99
cM capacity (veh/h) 439 792 1312
Direction, Lane # WB 1 NB 1 SB 1
Volume Total 0 242 368
Volume Left 0 0 16
Volume Right 0 0 0
cSH 1700 1700 1312
Volume to Capacity 0.00 0.14 0.01
Queue Length 95th (ft) 0 0 1
Control Delay (s) 0.0 0.0 0.5
Lane LOS A A
Approach Delay (s) 0.0 0.0 0.5
Approach LOS A
Intersection Summary
Average Delay 0.3
Intersection Capacity Utilization 32.6% ICU Level of Service A
Analysis Period (min) 15

HCM Unsignalized Intersection Capacity Analysis
5: Hidden Valley Rd. & AZ-83 Page 3
Operations Year 20, No Carpool, Non-Peak Season, Weekday, AM Synchro 7 Report
Tetra Tech ISG Page 3
Movement EBL EBR NBL NBT SBT SBR
Lane Configurations
Volume (veh/h) 119 40 82 180 138 245
Sign Control Yield Free Free
Grade 3% 6% -6%
Peak Hour Factor 0.92 0.92 0.92 0.92 0.92 0.92
Hourly flow rate (vph) 129 43 89 196 150 266
Pedestrians
Lane Width (ft)
Walking Speed (ft/s)
Percent Blockage
Right turn flare (veh)
Median type None None
Median storage veh)
Upstream signal (ft)
pX, platoon unblocked
vC, conflicting volume 657 283 416
vC1, stage 1 conf vol
vC2, stage 2 conf vol
vCu, unblocked vol 657 283 416
tC, single (s) 6.4 6.2 4.1
tC, 2 stage (s)
tF (s) 3.5 3.3 2.2
p0 queue free % 67 94 92
cM capacity (veh/h) 393 751 1132
Direction, Lane # EB 1 NB 1 SB 1
Volume Total 173 285 416
Volume Left 129 89 0
Volume Right 43 0 266
cSH 446 1132 1700
Volume to Capacity 0.39 0.08 0.24
Queue Length 95th (ft) 45 6 0
Control Delay (s) 18.1 3.2 0.0
Lane LOS C A
Approach Delay (s) 18.1 3.2 0.0
Approach LOS C
Intersection Summary
Average Delay 4.6
Intersection Capacity Utilization 55.3% ICU Level of Service B
Analysis Period (min) 15

HCM Unsignalized Intersection Capacity Analysis
6: Rosemont Junction & AZ-83 Page 4
Operations Year 20, No Carpool, Non-Peak Season, Weekday, AM Synchro 7 Report
Tetra Tech ISG Page 4
Movement EBL EBR NBL NBT SBT SBR
Lane Configurations
Volume (veh/h) 0 0 0 216 133 0
Sign Control Yield Free Free
Grade 0% 0% 0%
Peak Hour Factor 0.92 0.92 0.92 0.92 0.92 0.92
Hourly flow rate (vph) 0 0 0 235 145 0
Pedestrians
Lane Width (ft)
Walking Speed (ft/s)
Percent Blockage
Right turn flare (veh)
Median type None None
Median storage veh)
Upstream signal (ft)
pX, platoon unblocked
vC, conflicting volume 379 145 145
vC1, stage 1 conf vol
vC2, stage 2 conf vol
vCu, unblocked vol 379 145 145
tC, single (s) 6.4 6.2 4.1
tC, 2 stage (s)
tF (s) 3.5 3.3 2.2
p0 queue free % 100 100 100
cM capacity (veh/h) 619 897 1426
Direction, Lane # EB 1 NB 1 SB 1
Volume Total 0 235 145
Volume Left 0 0 0
Volume Right 0 0 0
cSH 1700 1426 1700
Volume to Capacity 0.00 0.00 0.09
Queue Length 95th (ft) 0 0 0
Control Delay (s) 0.0 0.0 0.0
Lane LOS A
Approach Delay (s) 0.0 0.0 0.0
Approach LOS A
Intersection Summary
Average Delay 0.0
Intersection Capacity Utilization 14.7% ICU Level of Service A
Analysis Period (min) 15

HCM Unsignalized Intersection Capacity Analysis
7: AZ-83 & Greaterville Rd. Page 5
Operations Year 20, No Carpool, Non-Peak Season, Weekday, AM Synchro 7 Report
Tetra Tech ISG Page 5
Movement SET SER NWL NWT NEL NER
Lane Configurations
Volume (veh/h) 118 7 7 172 4 4
Sign Control Free Free Yield
Grade 0% 0% 0%
Peak Hour Factor 0.92 0.92 0.92 0.92 0.92 0.92
Hourly flow rate (vph) 128 8 8 187 4 4
Pedestrians
Lane Width (ft)
Walking Speed (ft/s)
Percent Blockage
Right turn flare (veh)
Median type None None
Median storage veh)
Upstream signal (ft)
pX, platoon unblocked
vC, conflicting volume 136 334 132
vC1, stage 1 conf vol
vC2, stage 2 conf vol
vCu, unblocked vol 136 334 132
tC, single (s) 4.1 6.4 6.2
tC, 2 stage (s)
tF (s) 2.2 3.5 3.3
p0 queue free % 99 99 100
cM capacity (veh/h) 1436 653 912
Direction, Lane # SE 1 NW 1 NE 1
Volume Total 136 195 9
Volume Left 0 8 4
Volume Right 8 0 4
cSH 1700 1436 761
Volume to Capacity 0.08 0.01 0.01
Queue Length 95th (ft) 0 0 1
Control Delay (s) 0.0 0.3 9.8
Lane LOS A A
Approach Delay (s) 0.0 0.3 9.8
Approach LOS A
Intersection Summary
Average Delay 0.4
Intersection Capacity Utilization 24.7% ICU Level of Service A
Analysis Period (min) 15

HCM Unsignalized Intersection Capacity Analysis
1: I-10 WB On-Off Ramp & AZ-83 Page 1
Operations Year 20, No Carpool Non-Peak Season, Weekday, PM Synchro 7 Report
Tetra Tech ISG 2/5/2010
Movement EBL EBT WBT WBR SBL SBR
Lane Configurations
Volume (veh/h) 39 75 305 7 15 11
Sign Control Free Free Yield
Grade 0% 0% 0%
Peak Hour Factor 0.92 0.92 0.92 0.92 0.92 0.92
Hourly flow rate (vph) 42 82 332 8 16 12
Pedestrians
Lane Width (ft)
Walking Speed (ft/s)
Percent Blockage
Right turn flare (veh)
Median type None None
Median storage veh)
Upstream signal (ft)
pX, platoon unblocked
vC, conflicting volume 339 502 335
vC1, stage 1 conf vol
vC2, stage 2 conf vol
vCu, unblocked vol 339 502 335
tC, single (s) 4.1 6.4 6.2
tC, 2 stage (s)
tF (s) 2.2 3.5 3.3
p0 queue free % 97 97 98
cM capacity (veh/h) 1220 511 707
Direction, Lane # EB 1 WB 1 SB 1
Volume Total 124 339 28
Volume Left 42 0 16
Volume Right 0 8 12
cSH 1220 1700 579
Volume to Capacity 0.03 0.20 0.05
Queue Length 95th (ft) 3 0 4
Control Delay (s) 2.9 0.0 11.5
Lane LOS A B
Approach Delay (s) 2.9 0.0 11.5
Approach LOS B
Intersection Summary
Average Delay 1.4
Intersection Capacity Utilization 35.9% ICU Level of Service A
Analysis Period (min) 15

HCM Unsignalized Intersection Capacity Analysis
2: AZ-83 & EB Off-Ramp Page 2
Operations Year 20, No Carpool Non-Peak Season, Weekday, PM Synchro 7 Report
Tetra Tech ISG 2/5/2010
Movement NBL NBT NBR SBL SBT SBR SEL SER SWL SWR
Lane Configurations
Volume (veh/h) 0 386 57 0 53 0 0 406 0 0
Sign Control Free Free Yield Yield
Grade 0% 0% 0% 0%
Peak Hour Factor 0.92 0.92 0.92 0.92 0.92 0.92 0.92 0.92 0.92 0.92
Hourly flow rate (vph) 0 420 62 0 58 0 0 441 0 0
Pedestrians
Lane Width (ft)
Walking Speed (ft/s)
Percent Blockage
Right turn flare (veh)
Median type None None
Median storage veh)
Upstream signal (ft)
pX, platoon unblocked
vC, conflicting volume 58 482 539 58 918 477
vC1, stage 1 conf vol
vC2, stage 2 conf vol
vCu, unblocked vol 58 482 539 58 918 477
tC, single (s) 4.2 4.2 6.6 6.3 7.2 6.6
tC, 2 stage (s)
tF (s) 2.3 2.3 4.1 3.4 3.6 4.1
p0 queue free % 100 100 100 55 100 100
cM capacity (veh/h) 1503 1046 439 989 136 477
Direction, Lane # NB 1 NB 2 SB 1 SE 1
Volume Total 420 62 58 441
Volume Left 0 0 0 0
Volume Right 0 62 0 441
cSH 1700 1700 1700 989
Volume to Capacity 0.25 0.04 0.03 0.45
Queue Length 95th (ft) 0 0 0 58
Control Delay (s) 0.0 0.0 0.0 11.5
Lane LOS B
Approach Delay (s) 0.0 0.0 11.5
Approach LOS B
Intersection Summary
Average Delay 5.2
Intersection Capacity Utilization 35.1% ICU Level of Service A
Analysis Period (min) 15

HCM Unsignalized Intersection Capacity Analysis
3: Sahuarita Rd. & AZ-83 Page 1
Operations Year 20, No Carpool, Non-Peak Season, Weekday, PM Synchro 7 Report
Tetra Tech ISG 2/5/2010
Movement EBL EBR NBL NBT SBT SBR
Lane Configurations
Volume (veh/h) 30 11 26 335 294 79
Sign Control Yield Free Free
Grade 0% 0% 0%
Peak Hour Factor 0.92 0.92 0.92 0.92 0.92 0.92
Hourly flow rate (vph) 33 12 28 364 320 86
Pedestrians
Lane Width (ft)
Walking Speed (ft/s)
Percent Blockage
Right turn flare (veh)
Median type None None
Median storage veh)
Upstream signal (ft)
pX, platoon unblocked
vC, conflicting volume 783 362 405
vC1, stage 1 conf vol
vC2, stage 2 conf vol
vCu, unblocked vol 783 362 405
tC, single (s) 6.4 6.2 4.1
tC, 2 stage (s)
tF (s) 3.5 3.3 2.2
p0 queue free % 91 98 98
cM capacity (veh/h) 351 678 1143
Direction, Lane # EB 1 NB 1 SB 1
Volume Total 45 392 405
Volume Left 33 28 0
Volume Right 12 0 86
cSH 403 1143 1700
Volume to Capacity 0.11 0.02 0.24
Queue Length 95th (ft) 9 2 0
Control Delay (s) 15.0 0.8 0.0
Lane LOS C A
Approach Delay (s) 15.0 0.8 0.0
Approach LOS C
Intersection Summary
Average Delay 1.2
Intersection Capacity Utilization 49.1% ICU Level of Service A
Analysis Period (min) 15

HCM Unsignalized Intersection Capacity Analysis
4: Hilton Ranch Rd. & AZ-83 Page 2
Operations Year 20, No Carpool, Non-Peak Season, Weekday, PM Synchro 7 Report
Tetra Tech ISG 2/5/2010
Movement WBL WBR NBT NBR SBL SBT
Lane Configurations
Volume (veh/h) 0 0 313 0 15 231
Sign Control Yield Free Free
Grade 0% 0% 0%
Peak Hour Factor 0.92 0.92 0.92 0.92 0.92 0.92
Hourly flow rate (vph) 0 0 340 0 16 251
Pedestrians
Lane Width (ft)
Walking Speed (ft/s)
Percent Blockage
Right turn flare (veh)
Median type None None
Median storage veh)
Upstream signal (ft)
pX, platoon unblocked
vC, conflicting volume 624 340 340
vC1, stage 1 conf vol
vC2, stage 2 conf vol
vCu, unblocked vol 624 340 340
tC, single (s) 6.4 6.2 4.1
tC, 2 stage (s)
tF (s) 3.5 3.3 2.2
p0 queue free % 100 100 99
cM capacity (veh/h) 440 698 1208
Direction, Lane # WB 1 NB 1 SB 1
Volume Total 0 340 267
Volume Left 0 0 16
Volume Right 0 0 0
cSH 1700 1700 1208
Volume to Capacity 0.00 0.20 0.01
Queue Length 95th (ft) 0 0 1
Control Delay (s) 0.0 0.0 0.6
Lane LOS A A
Approach Delay (s) 0.0 0.0 0.6
Approach LOS A
Intersection Summary
Average Delay 0.3
Intersection Capacity Utilization 27.8% ICU Level of Service A
Analysis Period (min) 15

HCM Unsignalized Intersection Capacity Analysis
5: Hidden Valley Rd. & AZ-83 Page 3
Operations Year 20, No Carpool, Non-Peak Season, Weekday, PM Synchro 7 Report
Tetra Tech ISG 2/5/2010
Movement EBL EBR NBL NBT SBT SBR
Lane Configurations
Volume (veh/h) 238 78 40 123 183 119
Sign Control Yield Free Free
Grade 3% 6% -6%
Peak Hour Factor 0.92 0.92 0.92 0.92 0.92 0.92
Hourly flow rate (vph) 259 85 43 134 199 129
Pedestrians
Lane Width (ft)
Walking Speed (ft/s)
Percent Blockage
Right turn flare (veh)
Median type None None
Median storage veh)
Upstream signal (ft)
pX, platoon unblocked
vC, conflicting volume 484 264 328
vC1, stage 1 conf vol
vC2, stage 2 conf vol
vCu, unblocked vol 484 264 328
tC, single (s) 6.4 6.2 4.1
tC, 2 stage (s)
tF (s) 3.5 3.3 2.2
p0 queue free % 50 89 96
cM capacity (veh/h) 518 770 1220
Direction, Lane # EB 1 NB 1 SB 1
Volume Total 343 177 328
Volume Left 259 43 0
Volume Right 85 0 129
cSH 564 1220 1700
Volume to Capacity 0.61 0.04 0.19
Queue Length 95th (ft) 102 3 0
Control Delay (s) 20.8 2.2 0.0
Lane LOS C A
Approach Delay (s) 20.8 2.2 0.0
Approach LOS C
Intersection Summary
Average Delay 8.9
Intersection Capacity Utilization 53.5% ICU Level of Service A
Analysis Period (min) 15

HCM Unsignalized Intersection Capacity Analysis
6: Rosemont Junction & AZ-83 Page 4
Operations Year 20, No Carpool, Non-Peak Season, Weekday, PM Synchro 7 Report
Tetra Tech ISG 2/5/2010
Movement EBL EBR NBL NBT SBT SBR
Lane Configurations
Volume (veh/h) 0 0 0 140 213 0
Sign Control Yield Free Free
Grade 0% 0% 0%
Peak Hour Factor 0.92 0.92 0.92 0.92 0.92 0.92
Hourly flow rate (vph) 0 0 0 152 232 0
Pedestrians
Lane Width (ft)
Walking Speed (ft/s)
Percent Blockage
Right turn flare (veh)
Median type None None
Median storage veh)
Upstream signal (ft)
pX, platoon unblocked
vC, conflicting volume 384 232 232
vC1, stage 1 conf vol
vC2, stage 2 conf vol
vCu, unblocked vol 384 232 232
tC, single (s) 6.4 6.2 4.1
tC, 2 stage (s)
tF (s) 3.5 3.3 2.2
p0 queue free % 100 100 100
cM capacity (veh/h) 615 803 1324
Direction, Lane # EB 1 NB 1 SB 1
Volume Total 0 152 232
Volume Left 0 0 0
Volume Right 0 0 0
cSH 1700 1324 1700
Volume to Capacity 0.00 0.00 0.14
Queue Length 95th (ft) 0 0 0
Control Delay (s) 0.0 0.0 0.0
Lane LOS A
Approach Delay (s) 0.0 0.0 0.0
Approach LOS A
Intersection Summary
Average Delay 0.0
Intersection Capacity Utilization 14.5% ICU Level of Service A
Analysis Period (min) 15

HCM Unsignalized Intersection Capacity Analysis
7: AZ-83 & Greaterville Rd. Page 5
Operations Year 20, No Carpool, Non-Peak Season, Weekday, PM Synchro 7 Report
Tetra Tech ISG 2/5/2010
Movement SET SER NWL NWT NEL NER
Lane Configurations
Volume (veh/h) 185 7 7 250 0 0
Sign Control Free Free Yield
Grade 0% 0% 0%
Peak Hour Factor 0.92 0.92 0.92 0.92 0.92 0.92
Hourly flow rate (vph) 201 8 8 272 0 0
Pedestrians
Lane Width (ft)
Walking Speed (ft/s)
Percent Blockage
Right turn flare (veh)
Median type None None
Median storage veh)
Upstream signal (ft)
pX, platoon unblocked
vC, conflicting volume 209 492 205
vC1, stage 1 conf vol
vC2, stage 2 conf vol
vCu, unblocked vol 209 492 205
tC, single (s) 4.1 6.4 6.2
tC, 2 stage (s)
tF (s) 2.2 3.5 3.3
p0 queue free % 99 100 100
cM capacity (veh/h) 1350 530 831
Direction, Lane # SE 1 NW 1 NE 1
Volume Total 209 279 0
Volume Left 0 8 0
Volume Right 8 0 0
cSH 1700 1350 1700
Volume to Capacity 0.12 0.01 0.00
Queue Length 95th (ft) 0 0 0
Control Delay (s) 0.0 0.3 0.0
Lane LOS A A
Approach Delay (s) 0.0 0.3 0.0
Approach LOS A
Intersection Summary
Average Delay 0.1
Intersection Capacity Utilization 22.1% ICU Level of Service A
Analysis Period (min) 15

HCM Unsignalized Intersection Capacity Analysis
1: I-10 WB On-Off Ramp & AZ-83 Page 1
Operations Year 20, No Carpool, Non-Peak Season, Weekend, AM Synchro 7 Report
Tetra Tech ISG 2/5/2010
Movement EBL EBT WBT WBR SBL SBR
Lane Configurations
Volume (veh/h) 7 80 611 2 13 22
Sign Control Free Free Yield
Grade 0% 0% 0%
Peak Hour Factor 0.92 0.92 0.92 0.92 0.92 0.92
Hourly flow rate (vph) 8 87 664 2 14 24
Pedestrians
Lane Width (ft)
Walking Speed (ft/s)
Percent Blockage
Right turn flare (veh)
Median type None None
Median storage veh)
Upstream signal (ft)
pX, platoon unblocked
vC, conflicting volume 666 767 665
vC1, stage 1 conf vol
vC2, stage 2 conf vol
vCu, unblocked vol 666 767 665
tC, single (s) 4.1 6.4 6.2
tC, 2 stage (s)
tF (s) 2.2 3.5 3.3
p0 queue free % 99 96 95
cM capacity (veh/h) 914 364 456
Direction, Lane # EB 1 WB 1 SB 1
Volume Total 95 666 38
Volume Left 8 0 14
Volume Right 0 2 24
cSH 914 1700 417
Volume to Capacity 0.01 0.39 0.09
Queue Length 95th (ft) 1 0 7
Control Delay (s) 0.8 0.0 14.5
Lane LOS A B
Approach Delay (s) 0.8 0.0 14.5
Approach LOS B
Intersection Summary
Average Delay 0.8
Intersection Capacity Utilization 42.3% ICU Level of Service A
Analysis Period (min) 15

HCM Unsignalized Intersection Capacity Analysis
2: AZ-83 & EB Off-Ramp Page 2
Operations Year 20, No Carpool, Non-Peak Season, Weekend, AM Synchro 7 Report
Tetra Tech ISG 2/5/2010
Movement NBL NBT NBR SBL SBT SBR SEL SER SWL SWR
Lane Configurations
Volume (veh/h) 0 455 49 0 28 0 0 237 0 0
Sign Control Free Free Yield Yield
Grade 0% 0% 0% 0%
Peak Hour Factor 0.92 0.92 0.92 0.92 0.92 0.92 0.92 0.92 0.92 0.92
Hourly flow rate (vph) 0 495 53 0 30 0 0 258 0 0
Pedestrians
Lane Width (ft)
Walking Speed (ft/s)
Percent Blockage
Right turn flare (veh)
Median type None None
Median storage veh)
Upstream signal (ft)
pX, platoon unblocked
vC, conflicting volume 30 548 578 30 783 525
vC1, stage 1 conf vol
vC2, stage 2 conf vol
vCu, unblocked vol 30 548 578 30 783 525
tC, single (s) 4.1 4.1 6.5 6.2 7.1 6.5
tC, 2 stage (s)
tF (s) 2.2 2.2 4.0 3.3 3.5 4.0
p0 queue free % 100 100 100 75 100 100
cM capacity (veh/h) 1569 1012 424 1038 232 455
Direction, Lane # NB 1 NB 2 SB 1 SE 1
Volume Total 495 53 30 258
Volume Left 0 0 0 0
Volume Right 0 53 0 258
cSH 1700 1700 1700 1038
Volume to Capacity 0.29 0.03 0.02 0.25
Queue Length 95th (ft) 0 0 0 25
Control Delay (s) 0.0 0.0 0.0 9.6
Lane LOS A
Approach Delay (s) 0.0 0.0 9.6
Approach LOS A
Intersection Summary
Average Delay 3.0
Intersection Capacity Utilization 27.3% ICU Level of Service A
Analysis Period (min) 15

HCM Unsignalized Intersection Capacity Analysis
3: Sahuarita Rd. & AZ-83 Page 1
Operations Year 20, No Carpool, Non-Peak Season, Weekend, AM Synchro 7 Report
Tetra Tech ISG 2/5/2010
Movement EBL EBR NBL NBT SBT SBR
Lane Configurations
Volume (veh/h) 56 30 7 332 254 30
Sign Control Yield Free Free
Grade 0% 0% 0%
Peak Hour Factor 0.92 0.92 0.92 0.92 0.92 0.92
Hourly flow rate (vph) 61 33 8 361 276 33
Pedestrians
Lane Width (ft)
Walking Speed (ft/s)
Percent Blockage
Right turn flare (veh)
Median type None None
Median storage veh)
Upstream signal (ft)
pX, platoon unblocked
vC, conflicting volume 668 292 309
vC1, stage 1 conf vol
vC2, stage 2 conf vol
vCu, unblocked vol 668 292 309
tC, single (s) 6.4 6.2 4.1
tC, 2 stage (s)
tF (s) 3.5 3.3 2.2
p0 queue free % 85 96 99
cM capacity (veh/h) 417 742 1241
Direction, Lane # EB 1 NB 1 SB 1
Volume Total 93 368 309
Volume Left 61 8 0
Volume Right 33 0 33
cSH 493 1241 1700
Volume to Capacity 0.19 0.01 0.18
Queue Length 95th (ft) 17 0 0
Control Delay (s) 14.0 0.2 0.0
Lane LOS B A
Approach Delay (s) 14.0 0.2 0.0
Approach LOS B
Intersection Summary
Average Delay 1.8
Intersection Capacity Utilization 34.7% ICU Level of Service A
Analysis Period (min) 15

HCM Unsignalized Intersection Capacity Analysis
4: Hilton Ranch Rd. & AZ-83 Page 2
Operations Year 20, No Carpool, Non-Peak Season, Weekend, AM Synchro 7 Report
Tetra Tech ISG 2/5/2010
Movement WBL WBR NBT NBR SBL SBT
Lane Configurations
Volume (veh/h) 0 30 283 0 4 295
Sign Control Yield Free Free
Grade 0% 0% 0%
Peak Hour Factor 0.92 0.92 0.92 0.92 0.92 0.92
Hourly flow rate (vph) 0 33 308 0 4 321
Pedestrians
Lane Width (ft)
Walking Speed (ft/s)
Percent Blockage
Right turn flare (veh)
Median type None None
Median storage veh)
Upstream signal (ft)
pX, platoon unblocked
vC, conflicting volume 637 308 308
vC1, stage 1 conf vol
vC2, stage 2 conf vol
vCu, unblocked vol 637 308 308
tC, single (s) 6.4 6.2 4.1
tC, 2 stage (s)
tF (s) 3.5 3.3 2.2
p0 queue free % 100 96 100
cM capacity (veh/h) 437 728 1242
Direction, Lane # WB 1 NB 1 SB 1
Volume Total 33 308 325
Volume Left 0 0 4
Volume Right 33 0 0
cSH 728 1700 1242
Volume to Capacity 0.04 0.18 0.00
Queue Length 95th (ft) 4 0 0
Control Delay (s) 10.2 0.0 0.1
Lane LOS B A
Approach Delay (s) 10.2 0.0 0.1
Approach LOS B
Intersection Summary
Average Delay 0.6
Intersection Capacity Utilization 28.7% ICU Level of Service A
Analysis Period (min) 15

HCM Unsignalized Intersection Capacity Analysis
5: Hidden Valley Rd. & AZ-83 Page 3
Operations Year 20, No Carpool, Non-Peak Season, Weekend, AM Synchro 7 Report
Tetra Tech ISG 2/5/2010
Movement EBL EBR NBL NBT SBT SBR
Lane Configurations
Volume (veh/h) 119 43 51 153 94 164
Sign Control Yield Free Free
Grade 3% 6% -6%
Peak Hour Factor 0.92 0.92 0.92 0.92 0.92 0.92
Hourly flow rate (vph) 129 47 55 166 102 178
Pedestrians
Lane Width (ft)
Walking Speed (ft/s)
Percent Blockage
Right turn flare (veh)
Median type None None
Median storage veh)
Upstream signal (ft)
pX, platoon unblocked
vC, conflicting volume 468 191 280
vC1, stage 1 conf vol
vC2, stage 2 conf vol
vCu, unblocked vol 468 191 280
tC, single (s) 6.4 6.2 4.1
tC, 2 stage (s)
tF (s) 3.5 3.3 2.2
p0 queue free % 75 94 96
cM capacity (veh/h) 525 845 1271
Direction, Lane # EB 1 NB 1 SB 1
Volume Total 176 222 280
Volume Left 129 55 0
Volume Right 47 0 178
cSH 584 1271 1700
Volume to Capacity 0.30 0.04 0.16
Queue Length 95th (ft) 32 3 0
Control Delay (s) 13.8 2.3 0.0
Lane LOS B A
Approach Delay (s) 13.8 2.3 0.0
Approach LOS B
Intersection Summary
Average Delay 4.3
Intersection Capacity Utilization 45.1% ICU Level of Service A
Analysis Period (min) 15

HCM Unsignalized Intersection Capacity Analysis
6: Rosemont Junction & AZ-83 Page 4
Operations Year 20, No Carpool, Non-Peak Season, Weekend, AM Synchro 7 Report
Tetra Tech ISG 2/5/2010
Movement EBL EBR NBL NBT SBT SBR
Lane Configurations
Volume (veh/h) 4 0 4 186 103 0
Sign Control Yield Free Free
Grade 0% 0% 0%
Peak Hour Factor 0.92 0.92 0.92 0.92 0.92 0.92
Hourly flow rate (vph) 4 0 4 202 112 0
Pedestrians
Lane Width (ft)
Walking Speed (ft/s)
Percent Blockage
Right turn flare (veh)
Median type None None
Median storage veh)
Upstream signal (ft)
pX, platoon unblocked
vC, conflicting volume 323 112 112
vC1, stage 1 conf vol
vC2, stage 2 conf vol
vCu, unblocked vol 323 112 112
tC, single (s) 6.4 6.2 4.1
tC, 2 stage (s)
tF (s) 3.5 3.3 2.2
p0 queue free % 99 100 100
cM capacity (veh/h) 665 936 1465
Direction, Lane # EB 1 NB 1 SB 1
Volume Total 4 207 112
Volume Left 4 4 0
Volume Right 0 0 0
cSH 665 1465 1700
Volume to Capacity 0.01 0.00 0.07
Queue Length 95th (ft) 0 0 0
Control Delay (s) 10.5 0.2 0.0
Lane LOS B A
Approach Delay (s) 10.5 0.2 0.0
Approach LOS B
Intersection Summary
Average Delay 0.3
Intersection Capacity Utilization 23.0% ICU Level of Service A
Analysis Period (min) 15

HCM Unsignalized Intersection Capacity Analysis
7: AZ-83 & Greaterville Rd. Page 5
Operations Year 20, No Carpool, Non-Peak Season, Weekend, AM Synchro 7 Report
Tetra Tech ISG 2/5/2010
Movement SET SER NWL NWT NEL NER
Lane Configurations
Volume (veh/h) 170 0 0 156 4 7
Sign Control Free Free Yield
Grade 0% 0% 0%
Peak Hour Factor 0.92 0.92 0.92 0.92 0.92 0.92
Hourly flow rate (vph) 185 0 0 170 4 8
Pedestrians
Lane Width (ft)
Walking Speed (ft/s)
Percent Blockage
Right turn flare (veh)
Median type None None
Median storage veh)
Upstream signal (ft)
pX, platoon unblocked
vC, conflicting volume 185 354 185
vC1, stage 1 conf vol
vC2, stage 2 conf vol
vCu, unblocked vol 185 354 185
tC, single (s) 4.1 6.4 6.2
tC, 2 stage (s)
tF (s) 2.2 3.5 3.3
p0 queue free % 100 99 99
cM capacity (veh/h) 1378 640 852
Direction, Lane # SE 1 NW 1 NE 1
Volume Total 185 170 12
Volume Left 0 0 4
Volume Right 0 0 8
cSH 1700 1378 760
Volume to Capacity 0.11 0.00 0.02
Queue Length 95th (ft) 0 0 1
Control Delay (s) 0.0 0.0 9.8
Lane LOS A
Approach Delay (s) 0.0 0.0 9.8
Approach LOS A
Intersection Summary
Average Delay 0.3
Intersection Capacity Utilization 18.9% ICU Level of Service A
Analysis Period (min) 15

HCM Unsignalized Intersection Capacity Analysis
1: I-10 WB On-Off Ramp & AZ-83 Page 1
Operations Year 20, No Carpool, Non-Peak Season, Weekend, PM Synchro 7 Report
Tetra Tech ISG 2/5/2010
Movement EBL EBT WBT WBR SBL SBR
Lane Configurations
Volume (veh/h) 28 94 170 2 19 13
Sign Control Free Free Yield
Grade 0% 0% 0%
Peak Hour Factor 0.92 0.92 0.92 0.92 0.92 0.92
Hourly flow rate (vph) 30 102 185 2 21 14
Pedestrians
Lane Width (ft)
Walking Speed (ft/s)
Percent Blockage
Right turn flare (veh)
Median type None None
Median storage veh)
Upstream signal (ft)
pX, platoon unblocked
vC, conflicting volume 187 349 186
vC1, stage 1 conf vol
vC2, stage 2 conf vol
vCu, unblocked vol 187 349 186
tC, single (s) 4.1 6.4 6.2
tC, 2 stage (s)
tF (s) 2.2 3.5 3.3
p0 queue free % 98 97 98
cM capacity (veh/h) 1387 634 856
Direction, Lane # EB 1 WB 1 SB 1
Volume Total 133 187 35
Volume Left 30 0 21
Volume Right 0 2 14
cSH 1387 1700 709
Volume to Capacity 0.02 0.11 0.05
Queue Length 95th (ft) 2 0 4
Control Delay (s) 1.9 0.0 10.3
Lane LOS A B
Approach Delay (s) 1.9 0.0 10.3
Approach LOS B
Intersection Summary
Average Delay 1.7
Intersection Capacity Utilization 28.9% ICU Level of Service A
Analysis Period (min) 15

HCM Unsignalized Intersection Capacity Analysis
2: AZ-83 & EB Off-Ramp Page 2
Operations Year 20, No Carpool, Non-Peak Season, Weekend, PM Synchro 7 Report
Tetra Tech ISG 2/5/2010
Movement NBL NBT NBR SBL SBT SBR SEL SER SWL SWR
Lane Configurations
Volume (veh/h) 0 302 62 0 123 0 0 457 0 0
Sign Control Free Free Yield Yield
Grade 0% 0% 0% 0%
Peak Hour Factor 0.92 0.92 0.92 0.92 0.92 0.92 0.92 0.92 0.92 0.92
Hourly flow rate (vph) 0 328 67 0 134 0 0 497 0 0
Pedestrians
Lane Width (ft)
Walking Speed (ft/s)
Percent Blockage
Right turn flare (veh)
Median type None None
Median storage veh)
Upstream signal (ft)
pX, platoon unblocked
vC, conflicting volume 134 396 529 134 959 462
vC1, stage 1 conf vol
vC2, stage 2 conf vol
vCu, unblocked vol 134 396 529 134 959 462
tC, single (s) 4.2 4.2 6.6 6.3 7.2 6.6
tC, 2 stage (s)
tF (s) 2.3 2.3 4.1 3.4 3.6 4.1
p0 queue free % 100 100 100 45 100 100
cM capacity (veh/h) 1409 1126 445 897 103 486
Direction, Lane # NB 1 NB 2 SB 1 SE 1
Volume Total 328 67 134 497
Volume Left 0 0 0 0
Volume Right 0 67 0 497
cSH 1700 1700 1700 897
Volume to Capacity 0.19 0.04 0.08 0.55
Queue Length 95th (ft) 0 0 0 87
Control Delay (s) 0.0 0.0 0.0 13.9
Lane LOS B
Approach Delay (s) 0.0 0.0 13.9
Approach LOS B
Intersection Summary
Average Delay 6.7
Intersection Capacity Utilization 41.4% ICU Level of Service A
Analysis Period (min) 15

HCM Unsignalized Intersection Capacity Analysis
3: Sahuarita Rd. & AZ-83 Page 1
Operations Year 20, No Carpool, Non-Peak Season, Weekend, PM Synchro 7 Report
Tetra Tech ISG 2/5/2010
Movement EBL EBR NBL NBT SBT SBR
Lane Configurations
Volume (veh/h) 60 22 86 355 223 26
Sign Control Yield Free Free
Grade 0% 0% 0%
Peak Hour Factor 0.92 0.92 0.92 0.92 0.92 0.92
Hourly flow rate (vph) 65 24 93 386 242 28
Pedestrians
Lane Width (ft)
Walking Speed (ft/s)
Percent Blockage
Right turn flare (veh)
Median type None None
Median storage veh)
Upstream signal (ft)
pX, platoon unblocked
vC, conflicting volume 829 257 271
vC1, stage 1 conf vol
vC2, stage 2 conf vol
vCu, unblocked vol 829 257 271
tC, single (s) 6.4 6.2 4.1
tC, 2 stage (s)
tF (s) 3.5 3.3 2.2
p0 queue free % 79 97 93
cM capacity (veh/h) 313 777 1281
Direction, Lane # EB 1 NB 1 SB 1
Volume Total 89 479 271
Volume Left 65 93 0
Volume Right 24 0 28
cSH 373 1281 1700
Volume to Capacity 0.24 0.07 0.16
Queue Length 95th (ft) 23 6 0
Control Delay (s) 17.7 2.2 0.0
Lane LOS C A
Approach Delay (s) 17.7 2.2 0.0
Approach LOS C
Intersection Summary
Average Delay 3.1
Intersection Capacity Utilization 51.4% ICU Level of Service A
Analysis Period (min) 15

HCM Unsignalized Intersection Capacity Analysis
4: Hilton Ranch Rd. & AZ-83 Page 2
Operations Year 20, No Carpool, Non-Peak Season, Weekend, PM Synchro 7 Report
Tetra Tech ISG 2/5/2010
Movement WBL WBR NBT NBR SBL SBT
Lane Configurations
Volume (veh/h) 0 4 333 11 4 227
Sign Control Yield Free Free
Grade 0% 0% 0%
Peak Hour Factor 0.92 0.92 0.92 0.92 0.92 0.92
Hourly flow rate (vph) 0 4 362 12 4 247
Pedestrians
Lane Width (ft)
Walking Speed (ft/s)
Percent Blockage
Right turn flare (veh)
Median type None None
Median storage veh)
Upstream signal (ft)
pX, platoon unblocked
vC, conflicting volume 623 368 374
vC1, stage 1 conf vol
vC2, stage 2 conf vol
vCu, unblocked vol 623 368 374
tC, single (s) 6.4 6.2 4.1
tC, 2 stage (s)
tF (s) 3.5 3.3 2.2
p0 queue free % 100 99 100
cM capacity (veh/h) 445 673 1174
Direction, Lane # WB 1 NB 1 SB 1
Volume Total 4 374 251
Volume Left 0 0 4
Volume Right 4 12 0
cSH 673 1700 1174
Volume to Capacity 0.01 0.22 0.00
Queue Length 95th (ft) 0 0 0
Control Delay (s) 10.4 0.0 0.2
Lane LOS B A
Approach Delay (s) 10.4 0.0 0.2
Approach LOS B
Intersection Summary
Average Delay 0.1
Intersection Capacity Utilization 28.2% ICU Level of Service A
Analysis Period (min) 15

HCM Unsignalized Intersection Capacity Analysis
5: Hidden Valley Rd. & AZ-83 Page 3
Operations Year 20, No Carpool, Non-Peak Season, Weekend, PM Synchro 7 Report
Tetra Tech ISG 2/5/2010
Movement EBL EBR NBL NBT SBT SBR
Lane Configurations
Volume (veh/h) 161 51 40 153 67 119
Sign Control Yield Free Free
Grade 3% 6% -6%
Peak Hour Factor 0.92 0.92 0.92 0.92 0.92 0.92
Hourly flow rate (vph) 175 55 43 166 73 129
Pedestrians
Lane Width (ft)
Walking Speed (ft/s)
Percent Blockage
Right turn flare (veh)
Median type None None
Median storage veh)
Upstream signal (ft)
pX, platoon unblocked
vC, conflicting volume 391 138 202
vC1, stage 1 conf vol
vC2, stage 2 conf vol
vCu, unblocked vol 391 138 202
tC, single (s) 6.4 6.2 4.1
tC, 2 stage (s)
tF (s) 3.5 3.3 2.2
p0 queue free % 70 94 97
cM capacity (veh/h) 589 906 1358
Direction, Lane # EB 1 NB 1 SB 1
Volume Total 230 210 202
Volume Left 175 43 0
Volume Right 55 0 129
cSH 644 1358 1700
Volume to Capacity 0.36 0.03 0.12
Queue Length 95th (ft) 41 2 0
Control Delay (s) 13.7 1.8 0.0
Lane LOS B A
Approach Delay (s) 13.7 1.8 0.0
Approach LOS B
Intersection Summary
Average Delay 5.5
Intersection Capacity Utilization 43.1% ICU Level of Service A
Analysis Period (min) 15

HCM Unsignalized Intersection Capacity Analysis
6: Rosemont Junction & AZ-83 Page 4
Operations Year 20, No Carpool, Non-Peak Season, Weekend, PM Synchro 7 Report
Tetra Tech ISG 2/5/2010
Movement EBL EBR NBL NBT SBT SBR
Lane Configurations
Volume (veh/h) 0 0 0 208 145 0
Sign Control Yield Free Free
Grade 0% 0% 0%
Peak Hour Factor 0.92 0.92 0.92 0.92 0.92 0.92
Hourly flow rate (vph) 0 0 0 226 158 0
Pedestrians
Lane Width (ft)
Walking Speed (ft/s)
Percent Blockage
Right turn flare (veh)
Median type None None
Median storage veh)
Upstream signal (ft)
pX, platoon unblocked
vC, conflicting volume 384 158 158
vC1, stage 1 conf vol
vC2, stage 2 conf vol
vCu, unblocked vol 384 158 158
tC, single (s) 6.4 6.2 4.1
tC, 2 stage (s)
tF (s) 3.5 3.3 2.2
p0 queue free % 100 100 100
cM capacity (veh/h) 615 883 1410
Direction, Lane # EB 1 NB 1 SB 1
Volume Total 0 226 158
Volume Left 0 0 0
Volume Right 0 0 0
cSH 1700 1410 1700
Volume to Capacity 0.00 0.00 0.09
Queue Length 95th (ft) 0 0 0
Control Delay (s) 0.0 0.0 0.0
Lane LOS A
Approach Delay (s) 0.0 0.0 0.0
Approach LOS A
Intersection Summary
Average Delay 0.0
Intersection Capacity Utilization 14.3% ICU Level of Service A
Analysis Period (min) 15

HCM Unsignalized Intersection Capacity Analysis
7: AZ-83 & Greaterville Rd. Page 5
Operations Year 20, No Carpool, Non-Peak Season, Weekend, PM Synchro 7 Report
Tetra Tech ISG 2/5/2010
Movement SET SER NWL NWT NEL NER
Lane Configurations
Volume (veh/h) 216 7 11 234 4 7
Sign Control Free Free Yield
Grade 0% 0% 0%
Peak Hour Factor 0.92 0.92 0.92 0.92 0.92 0.92
Hourly flow rate (vph) 235 8 12 254 4 8
Pedestrians
Lane Width (ft)
Walking Speed (ft/s)
Percent Blockage
Right turn flare (veh)
Median type None None
Median storage veh)
Upstream signal (ft)
pX, platoon unblocked
vC, conflicting volume 242 517 239
vC1, stage 1 conf vol
vC2, stage 2 conf vol
vCu, unblocked vol 242 517 239
tC, single (s) 4.1 6.4 6.2
tC, 2 stage (s)
tF (s) 2.2 3.5 3.3
p0 queue free % 99 99 99
cM capacity (veh/h) 1312 510 795
Direction, Lane # SE 1 NW 1 NE 1
Volume Total 242 266 12
Volume Left 0 12 4
Volume Right 8 0 8
cSH 1700 1312 661
Volume to Capacity 0.14 0.01 0.02
Queue Length 95th (ft) 0 1 1
Control Delay (s) 0.0 0.4 10.5
Lane LOS A B
Approach Delay (s) 0.0 0.4 10.5
Approach LOS B
Intersection Summary
Average Delay 0.5
Intersection Capacity Utilization 31.3% ICU Level of Service A
Analysis Period (min) 15

PEAK SEASON
SCENARIO 3
NO CARPOOL

HCM Unsignalized Intersection Capacity Analysis
1: I-10 WB On-Off Ramp & AZ-83 Page 1
Operations Year 20, No Carpool, Peak Season, Weekday, AM Synchro 7 Report
Tetra Tech ISG 2/5/2010
Movement EBL EBT WBT WBR SBL SBR
Lane Configurations
Volume (veh/h) 6 58 554 7 21 30
Sign Control Free Free Yield
Grade 0% 0% 0%
Peak Hour Factor 0.92 0.92 0.92 0.92 0.92 0.92
Hourly flow rate (vph) 7 63 602 8 23 33
Pedestrians
Lane Width (ft)
Walking Speed (ft/s)
Percent Blockage
Right turn flare (veh)
Median type None None
Median storage veh)
Upstream signal (ft)
pX, platoon unblocked
vC, conflicting volume 610 682 606
vC1, stage 1 conf vol
vC2, stage 2 conf vol
vCu, unblocked vol 610 682 606
tC, single (s) 4.1 6.4 6.2
tC, 2 stage (s)
tF (s) 2.2 3.5 3.3
p0 queue free % 99 94 93
cM capacity (veh/h) 959 410 493
Direction, Lane # EB 1 WB 1 SB 1
Volume Total 70 610 55
Volume Left 7 0 23
Volume Right 0 8 33
cSH 959 1700 455
Volume to Capacity 0.01 0.36 0.12
Queue Length 95th (ft) 1 0 10
Control Delay (s) 0.9 0.0 14.0
Lane LOS A B
Approach Delay (s) 0.9 0.0 14.0
Approach LOS B
Intersection Summary
Average Delay 1.1
Intersection Capacity Utilization 39.6% ICU Level of Service A
Analysis Period (min) 15

HCM Unsignalized Intersection Capacity Analysis
2: AZ-83 & EB Off-Ramp Page 2
Operations Year 20, No Carpool, Peak Season, Weekday, AM Synchro 7 Report
Tetra Tech ISG 2/5/2010
Movement NBL NBT NBR SBL SBT SBR SEL SER SWL SWR
Lane Configurations
Volume (veh/h) 0 408 36 0 25 0 0 214 0 0
Sign Control Free Free Yield Yield
Grade 0% 0% 0% 0%
Peak Hour Factor 0.92 0.92 0.92 0.92 0.92 0.92 0.92 0.92 0.92 0.92
Hourly flow rate (vph) 0 443 39 0 27 0 0 233 0 0
Pedestrians
Lane Width (ft)
Walking Speed (ft/s)
Percent Blockage
Right turn flare (veh)
Median type None None
Median storage veh)
Upstream signal (ft)
pX, platoon unblocked
vC, conflicting volume 27 483 510 27 703 471
vC1, stage 1 conf vol
vC2, stage 2 conf vol
vCu, unblocked vol 27 483 510 27 703 471
tC, single (s) 4.1 4.1 6.5 6.2 7.1 6.5
tC, 2 stage (s)
tF (s) 2.2 2.2 4.0 3.3 3.5 4.0
p0 queue free % 100 100 100 78 100 100
cM capacity (veh/h) 1574 1070 464 1043 272 488
Direction, Lane # NB 1 NB 2 SB 1 SE 1
Volume Total 443 39 27 233
Volume Left 0 0 0 0
Volume Right 0 39 0 233
cSH 1700 1700 1700 1043
Volume to Capacity 0.26 0.02 0.02 0.22
Queue Length 95th (ft) 0 0 0 21
Control Delay (s) 0.0 0.0 0.0 9.4
Lane LOS A
Approach Delay (s) 0.0 0.0 9.4
Approach LOS A
Intersection Summary
Average Delay 3.0
Intersection Capacity Utilization 24.8% ICU Level of Service A
Analysis Period (min) 15

HCM Unsignalized Intersection Capacity Analysis
3: Sahuarita Rd. & AZ-83 Page 1
Operations Year 20, No Carpool, Peak Season, Weekday, AM Synchro 7 Report
Tetra Tech ISG 2/5/2010
Movement EBL EBR NBL NBT SBT SBR
Lane Configurations
Volume (veh/h) 64 30 7 335 309 41
Sign Control Yield Free Free
Grade 0% 0% 0%
Peak Hour Factor 0.92 0.92 0.92 0.92 0.92 0.92
Hourly flow rate (vph) 70 33 8 364 336 45
Pedestrians
Lane Width (ft)
Walking Speed (ft/s)
Percent Blockage
Right turn flare (veh)
Median type None None
Median storage veh)
Upstream signal (ft)
pX, platoon unblocked
vC, conflicting volume 738 358 380
vC1, stage 1 conf vol
vC2, stage 2 conf vol
vCu, unblocked vol 738 358 380
tC, single (s) 6.4 6.2 4.1
tC, 2 stage (s)
tF (s) 3.5 3.3 2.2
p0 queue free % 82 95 99
cM capacity (veh/h) 383 686 1178
Direction, Lane # EB 1 NB 1 SB 1
Volume Total 102 372 380
Volume Left 70 8 0
Volume Right 33 0 45
cSH 446 1178 1700
Volume to Capacity 0.23 0.01 0.22
Queue Length 95th (ft) 22 0 0
Control Delay (s) 15.5 0.2 0.0
Lane LOS C A
Approach Delay (s) 15.5 0.2 0.0
Approach LOS C
Intersection Summary
Average Delay 1.9
Intersection Capacity Utilization 35.3% ICU Level of Service A
Analysis Period (min) 15

HCM Unsignalized Intersection Capacity Analysis
4: Hilton Ranch Rd. & AZ-83 Page 2
Operations Year 20, No Carpool, Peak Season, Weekday, AM Synchro 7 Report
Tetra Tech ISG 2/5/2010
Movement WBL WBR NBT NBR SBL SBT
Lane Configurations
Volume (veh/h) 0 0 201 0 7 331
Sign Control Yield Free Free
Grade 0% 0% 0%
Peak Hour Factor 0.92 0.92 0.92 0.92 0.92 0.92
Hourly flow rate (vph) 0 0 218 0 8 360
Pedestrians
Lane Width (ft)
Walking Speed (ft/s)
Percent Blockage
Right turn flare (veh)
Median type None None
Median storage veh)
Upstream signal (ft)
pX, platoon unblocked
vC, conflicting volume 593 218 218
vC1, stage 1 conf vol
vC2, stage 2 conf vol
vCu, unblocked vol 593 218 218
tC, single (s) 6.4 6.2 4.1
tC, 2 stage (s)
tF (s) 3.5 3.3 2.2
p0 queue free % 100 100 99
cM capacity (veh/h) 465 821 1351
Direction, Lane # WB 1 NB 1 SB 1
Volume Total 0 218 367
Volume Left 0 0 8
Volume Right 0 0 0
cSH 1700 1700 1351
Volume to Capacity 0.00 0.13 0.01
Queue Length 95th (ft) 0 0 0
Control Delay (s) 0.0 0.0 0.2
Lane LOS A A
Approach Delay (s) 0.0 0.0 0.2
Approach LOS A
Intersection Summary
Average Delay 0.1
Intersection Capacity Utilization 26.4% ICU Level of Service A
Analysis Period (min) 15

HCM Unsignalized Intersection Capacity Analysis
5: Hidden Valley Rd. & AZ-83 Page 3
Operations Year 20, No Carpool, Peak Season, Weekday, AM Synchro 7 Report
Tetra Tech ISG 2/5/2010
Movement EBL EBR NBL NBT SBT SBR
Lane Configurations
Volume (veh/h) 119 43 78 116 75 238
Sign Control Yield Free Free
Grade 3% 6% -6%
Peak Hour Factor 0.92 0.92 0.92 0.92 0.92 0.92
Hourly flow rate (vph) 129 47 85 126 82 259
Pedestrians
Lane Width (ft)
Walking Speed (ft/s)
Percent Blockage
Right turn flare (veh)
Median type None None
Median storage veh)
Upstream signal (ft)
pX, platoon unblocked
vC, conflicting volume 507 211 340
vC1, stage 1 conf vol
vC2, stage 2 conf vol
vCu, unblocked vol 507 211 340
tC, single (s) 6.5 6.3 4.2
tC, 2 stage (s)
tF (s) 3.6 3.4 2.3
p0 queue free % 73 94 93
cM capacity (veh/h) 480 817 1191
Direction, Lane # EB 1 NB 1 SB 1
Volume Total 176 211 340
Volume Left 129 85 0
Volume Right 47 0 259
cSH 539 1191 1700
Volume to Capacity 0.33 0.07 0.20
Queue Length 95th (ft) 35 6 0
Control Delay (s) 14.9 3.7 0.0
Lane LOS B A
Approach Delay (s) 14.9 3.7 0.0
Approach LOS B
Intersection Summary
Average Delay 4.7
Intersection Capacity Utilization 48.2% ICU Level of Service A
Analysis Period (min) 15

HCM Unsignalized Intersection Capacity Analysis
6: Rosemont Junction & AZ-83 Page 4
Operations Year 20, No Carpool, Peak Season, Weekday, AM Synchro 7 Report
Tetra Tech ISG 2/5/2010
Movement EBL EBR NBL NBT SBT SBR
Lane Configurations
Volume (veh/h) 4 4 4 228 144 0
Sign Control Yield Free Free
Grade 0% 0% 0%
Peak Hour Factor 0.92 0.92 0.92 0.92 0.92 0.92
Hourly flow rate (vph) 4 4 4 248 157 0
Pedestrians
Lane Width (ft)
Walking Speed (ft/s)
Percent Blockage
Right turn flare (veh)
Median type None None
Median storage veh)
Upstream signal (ft)
pX, platoon unblocked
vC, conflicting volume 413 157 157
vC1, stage 1 conf vol
vC2, stage 2 conf vol
vCu, unblocked vol 413 157 157
tC, single (s) 6.4 6.2 4.1
tC, 2 stage (s)
tF (s) 3.5 3.3 2.2
p0 queue free % 99 100 100
cM capacity (veh/h) 594 889 1423
Direction, Lane # EB 1 NB 1 SB 1
Volume Total 9 252 157
Volume Left 4 4 0
Volume Right 4 0 0
cSH 712 1423 1700
Volume to Capacity 0.01 0.00 0.09
Queue Length 95th (ft) 1 0 0
Control Delay (s) 10.1 0.2 0.0
Lane LOS B A
Approach Delay (s) 10.1 0.2 0.0
Approach LOS B
Intersection Summary
Average Delay 0.3
Intersection Capacity Utilization 25.2% ICU Level of Service A
Analysis Period (min) 15

HCM Unsignalized Intersection Capacity Analysis
7: AZ-83 & Greaterville Rd. Page 5
Operations Year 20, No Carpool, Peak Season, Weekday, AM Synchro 7 Report
Tetra Tech ISG 2/5/2010
Movement SET SER NWL NWT NEL NER
Lane Configurations
Volume (veh/h) 122 4 0 202 4 0
Sign Control Free Free Yield
Grade 0% 0% 0%
Peak Hour Factor 0.92 0.92 0.92 0.92 0.92 0.92
Hourly flow rate (vph) 133 4 0 220 4 0
Pedestrians
Lane Width (ft)
Walking Speed (ft/s)
Percent Blockage
Right turn flare (veh)
Median type None None
Median storage veh)
Upstream signal (ft)
pX, platoon unblocked
vC, conflicting volume 137 354 135
vC1, stage 1 conf vol
vC2, stage 2 conf vol
vCu, unblocked vol 137 354 135
tC, single (s) 4.1 6.4 6.2
tC, 2 stage (s)
tF (s) 2.2 3.5 3.3
p0 queue free % 100 99 100
cM capacity (veh/h) 1447 644 914
Direction, Lane # SE 1 NW 1 NE 1
Volume Total 137 220 4
Volume Left 0 0 4
Volume Right 4 0 0
cSH 1700 1447 644
Volume to Capacity 0.08 0.00 0.01
Queue Length 95th (ft) 0 0 1
Control Delay (s) 0.0 0.0 10.6
Lane LOS B
Approach Delay (s) 0.0 0.0 10.6
Approach LOS B
Intersection Summary
Average Delay 0.1
Intersection Capacity Utilization 20.6% ICU Level of Service A
Analysis Period (min) 15

HCM Unsignalized Intersection Capacity Analysis
1: I-10 WB On-Off Ramp & AZ-83 Page 1
Operations Year 20, No Carpool, Peak Season, Weekday, PM Synchro 7 Report
Tetra Tech ISG 2/5/2010
Movement EBL EBT WBT WBR SBL SBR
Lane Configurations
Volume (veh/h) 19 101 309 6 17 13
Sign Control Free Free Yield
Grade 0% 0% 0%
Peak Hour Factor 0.92 0.92 0.92 0.92 0.92 0.92
Hourly flow rate (vph) 21 110 336 7 18 14
Pedestrians
Lane Width (ft)
Walking Speed (ft/s)
Percent Blockage
Right turn flare (veh)
Median type None None
Median storage veh)
Upstream signal (ft)
pX, platoon unblocked
vC, conflicting volume 342 490 339
vC1, stage 1 conf vol
vC2, stage 2 conf vol
vCu, unblocked vol 342 490 339
tC, single (s) 4.1 6.4 6.2
tC, 2 stage (s)
tF (s) 2.2 3.5 3.3
p0 queue free % 98 96 98
cM capacity (veh/h) 1206 525 699
Direction, Lane # EB 1 WB 1 SB 1
Volume Total 130 342 33
Volume Left 21 0 18
Volume Right 0 7 14
cSH 1206 1700 588
Volume to Capacity 0.02 0.20 0.06
Queue Length 95th (ft) 1 0 4
Control Delay (s) 1.4 0.0 11.5
Lane LOS A B
Approach Delay (s) 1.4 0.0 11.5
Approach LOS B
Intersection Summary
Average Delay 1.1
Intersection Capacity Utilization 31.5% ICU Level of Service A
Analysis Period (min) 15

HCM Unsignalized Intersection Capacity Analysis
2: AZ-83 & EB Off-Ramp Page 2
Operations Year 20, No Carpool, Peak Season, Weekday, PM Synchro 7 Report
Tetra Tech ISG 2/5/2010
Movement NBL NBT NBR SBL SBT SBR SEL SER SWL SWR
Lane Configurations
Volume (veh/h) 0 415 65 0 94 0 0 200 0 0
Sign Control Free Free Yield Yield
Grade 0% 0% 0% 0%
Peak Hour Factor 0.92 0.92 0.92 0.92 0.92 0.92 0.92 0.92 0.92 0.92
Hourly flow rate (vph) 0 451 71 0 102 0 0 217 0 0
Pedestrians
Lane Width (ft)
Walking Speed (ft/s)
Percent Blockage
Right turn flare (veh)
Median type None None
Median storage veh)
Upstream signal (ft)
pX, platoon unblocked
vC, conflicting volume 102 522 624 102 771 553
vC1, stage 1 conf vol
vC2, stage 2 conf vol
vCu, unblocked vol 102 522 624 102 771 553
tC, single (s) 4.1 4.1 6.5 6.2 7.1 6.5
tC, 2 stage (s)
tF (s) 2.2 2.2 4.0 3.3 3.5 4.0
p0 queue free % 100 100 100 77 100 100
cM capacity (veh/h) 1477 1034 399 947 243 438
Direction, Lane # NB 1 NB 2 SB 1 SE 1
Volume Total 451 71 102 217
Volume Left 0 0 0 0
Volume Right 0 71 0 217
cSH 1700 1700 1700 947
Volume to Capacity 0.27 0.04 0.06 0.23
Queue Length 95th (ft) 0 0 0 22
Control Delay (s) 0.0 0.0 0.0 9.9
Lane LOS A
Approach Delay (s) 0.0 0.0 9.9
Approach LOS A
Intersection Summary
Average Delay 2.6
Intersection Capacity Utilization 25.2% ICU Level of Service A
Analysis Period (min) 15

HCM Unsignalized Intersection Capacity Analysis
3: Sahuarita Rd. & AZ-83 Page 1
Operations Year 20, No Carpool, Peak Season, Weekday, PM Synchro 7 Report
Tetra Tech ISG 2/5/2010
Movement EBL EBR NBL NBT SBT SBR
Lane Configurations
Volume (veh/h) 34 22 52 391 362 75
Sign Control Yield Free Free
Grade 0% 0% 0%
Peak Hour Factor 0.92 0.92 0.92 0.92 0.92 0.92
Hourly flow rate (vph) 37 24 57 425 393 82
Pedestrians
Lane Width (ft)
Walking Speed (ft/s)
Percent Blockage
Right turn flare (veh)
Median type None None
Median storage veh)
Upstream signal (ft)
pX, platoon unblocked
vC, conflicting volume 972 434 475
vC1, stage 1 conf vol
vC2, stage 2 conf vol
vCu, unblocked vol 972 434 475
tC, single (s) 6.4 6.2 4.1
tC, 2 stage (s)
tF (s) 3.5 3.3 2.2
p0 queue free % 86 96 95
cM capacity (veh/h) 263 618 1077
Direction, Lane # EB 1 NB 1 SB 1
Volume Total 61 482 475
Volume Left 37 57 0
Volume Right 24 0 82
cSH 340 1077 1700
Volume to Capacity 0.18 0.05 0.28
Queue Length 95th (ft) 16 4 0
Control Delay (s) 17.9 1.5 0.0
Lane LOS C A
Approach Delay (s) 17.9 1.5 0.0
Approach LOS C
Intersection Summary
Average Delay 1.8
Intersection Capacity Utilization 60.4% ICU Level of Service B
Analysis Period (min) 15

HCM Unsignalized Intersection Capacity Analysis
4: Hilton Ranch Rd. & AZ-83 Page 2
Operations Year 20, No Carpool, Peak Season, Weekday, PM Synchro 7 Report
Tetra Tech ISG 2/5/2010
Movement WBL WBR NBT NBR SBL SBT
Lane Configurations
Volume (veh/h) 0 0 429 4 30 261
Sign Control Yield Free Free
Grade 0% 0% 0%
Peak Hour Factor 0.92 0.92 0.92 0.92 0.92 0.92
Hourly flow rate (vph) 0 0 466 4 33 284
Pedestrians
Lane Width (ft)
Walking Speed (ft/s)
Percent Blockage
Right turn flare (veh)
Median type None None
Median storage veh)
Upstream signal (ft)
pX, platoon unblocked
vC, conflicting volume 817 468 471
vC1, stage 1 conf vol
vC2, stage 2 conf vol
vCu, unblocked vol 817 468 471
tC, single (s) 6.4 6.2 4.1
tC, 2 stage (s)
tF (s) 3.5 3.3 2.2
p0 queue free % 100 100 97
cM capacity (veh/h) 333 591 1081
Direction, Lane # WB 1 NB 1 SB 1
Volume Total 0 471 316
Volume Left 0 0 33
Volume Right 0 4 0
cSH 1700 1700 1081
Volume to Capacity 0.00 0.28 0.03
Queue Length 95th (ft) 0 0 2
Control Delay (s) 0.0 0.0 1.1
Lane LOS A A
Approach Delay (s) 0.0 0.0 1.1
Approach LOS A
Intersection Summary
Average Delay 0.5
Intersection Capacity Utilization 42.1% ICU Level of Service A
Analysis Period (min) 15

HCM Unsignalized Intersection Capacity Analysis
5: Hidden Valley Rd. & AZ-83 Page 3
Operations Year 20, No Carpool, Peak Season, Weekday, PM Synchro 7 Report
Tetra Tech ISG 2/5/2010
Movement EBL EBR NBL NBT SBT SBR
Lane Configurations
Volume (veh/h) 238 82 40 172 183 119
Sign Control Yield Free Free
Grade 3% 6% -6%
Peak Hour Factor 0.92 0.92 0.92 0.92 0.92 0.92
Hourly flow rate (vph) 259 89 43 187 199 129
Pedestrians
Lane Width (ft)
Walking Speed (ft/s)
Percent Blockage
Right turn flare (veh)
Median type None None
Median storage veh)
Upstream signal (ft)
pX, platoon unblocked
vC, conflicting volume 538 264 328
vC1, stage 1 conf vol
vC2, stage 2 conf vol
vCu, unblocked vol 538 264 328
tC, single (s) 6.4 6.2 4.1
tC, 2 stage (s)
tF (s) 3.5 3.3 2.2
p0 queue free % 46 88 96
cM capacity (veh/h) 483 770 1220
Direction, Lane # EB 1 NB 1 SB 1
Volume Total 348 230 328
Volume Left 259 43 0
Volume Right 89 0 129
cSH 534 1220 1700
Volume to Capacity 0.65 0.04 0.19
Queue Length 95th (ft) 117 3 0
Control Delay (s) 23.5 1.8 0.0
Lane LOS C A
Approach Delay (s) 23.5 1.8 0.0
Approach LOS C
Intersection Summary
Average Delay 9.5
Intersection Capacity Utilization 56.3% ICU Level of Service B
Analysis Period (min) 15

HCM Unsignalized Intersection Capacity Analysis
6: Rosemont Junction & AZ-83 Page 4
Operations Year 20, No Carpool, Peak Season, Weekday, PM Synchro 7 Report
Tetra Tech ISG 2/5/2010
Movement EBL EBR NBL NBT SBT SBR
Lane Configurations
Volume (veh/h) 0 0 0 204 310 0
Sign Control Yield Free Free
Grade 0% 0% 0%
Peak Hour Factor 0.92 0.92 0.92 0.92 0.92 0.92
Hourly flow rate (vph) 0 0 0 222 337 0
Pedestrians
Lane Width (ft)
Walking Speed (ft/s)
Percent Blockage
Right turn flare (veh)
Median type None None
Median storage veh)
Upstream signal (ft)
pX, platoon unblocked
vC, conflicting volume 559 337 337
vC1, stage 1 conf vol
vC2, stage 2 conf vol
vCu, unblocked vol 559 337 337
tC, single (s) 6.4 6.2 4.1
tC, 2 stage (s)
tF (s) 3.5 3.3 2.2
p0 queue free % 100 100 100
cM capacity (veh/h) 487 701 1211
Direction, Lane # EB 1 NB 1 SB 1
Volume Total 0 222 337
Volume Left 0 0 0
Volume Right 0 0 0
cSH 1700 1211 1700
Volume to Capacity 0.00 0.00 0.20
Queue Length 95th (ft) 0 0 0
Control Delay (s) 0.0 0.0 0.0
Lane LOS A
Approach Delay (s) 0.0 0.0 0.0
Approach LOS A
Intersection Summary
Average Delay 0.0
Intersection Capacity Utilization 19.6% ICU Level of Service A
Analysis Period (min) 15

HCM Unsignalized Intersection Capacity Analysis
7: AZ-83 & Greaterville Rd. Page 5
Operations Year 20, No Carpool, Peak Season, Weekday, PM Synchro 7 Report
Tetra Tech ISG 2/5/2010
Movement SET SER NWL NWT NEL NER
Lane Configurations
Volume (veh/h) 273 4 7 144 4 0
Sign Control Free Free Yield
Grade 0% 0% 0%
Peak Hour Factor 0.92 0.92 0.92 0.92 0.92 0.92
Hourly flow rate (vph) 297 4 8 157 4 0
Pedestrians
Lane Width (ft)
Walking Speed (ft/s)
Percent Blockage
Right turn flare (veh)
Median type None None
Median storage veh)
Upstream signal (ft)
pX, platoon unblocked
vC, conflicting volume 301 471 299
vC1, stage 1 conf vol
vC2, stage 2 conf vol
vCu, unblocked vol 301 471 299
tC, single (s) 4.1 6.4 6.2
tC, 2 stage (s)
tF (s) 2.2 3.5 3.3
p0 queue free % 99 99 100
cM capacity (veh/h) 1249 545 736
Direction, Lane # SE 1 NW 1 NE 1
Volume Total 301 164 4
Volume Left 0 8 4
Volume Right 4 0 0
cSH 1700 1249 545
Volume to Capacity 0.18 0.01 0.01
Queue Length 95th (ft) 0 0 1
Control Delay (s) 0.0 0.4 11.7
Lane LOS A B
Approach Delay (s) 0.0 0.4 11.7
Approach LOS B
Intersection Summary
Average Delay 0.3
Intersection Capacity Utilization 24.6% ICU Level of Service A
Analysis Period (min) 15

HCM Unsignalized Intersection Capacity Analysis
1: I-10 WB On-Off Ramp & AZ-83 Page 1
Operations Year 20, No Carpool, Peak Season, Weekend, AM Synchro 7 Report
Tetra Tech ISG 2/5/2010
Movement EBL EBT WBT WBR SBL SBR
Lane Configurations
Volume (veh/h) 13 39 481 6 17 45
Sign Control Free Free Yield
Grade 0% 0% 0%
Peak Hour Factor 0.92 0.92 0.92 0.92 0.92 0.92
Hourly flow rate (vph) 14 42 523 7 18 49
Pedestrians
Lane Width (ft)
Walking Speed (ft/s)
Percent Blockage
Right turn flare (veh)
Median type None None
Median storage veh)
Upstream signal (ft)
pX, platoon unblocked
vC, conflicting volume 529 597 526
vC1, stage 1 conf vol
vC2, stage 2 conf vol
vCu, unblocked vol 529 597 526
tC, single (s) 4.1 6.4 6.2
tC, 2 stage (s)
tF (s) 2.2 3.5 3.3
p0 queue free % 99 96 91
cM capacity (veh/h) 1028 456 548
Direction, Lane # EB 1 WB 1 SB 1
Volume Total 57 529 67
Volume Left 14 0 18
Volume Right 0 7 49
cSH 1028 1700 519
Volume to Capacity 0.01 0.31 0.13
Queue Length 95th (ft) 1 0 11
Control Delay (s) 2.2 0.0 13.0
Lane LOS A B
Approach Delay (s) 2.2 0.0 13.0
Approach LOS B
Intersection Summary
Average Delay 1.5
Intersection Capacity Utilization 36.1% ICU Level of Service A
Analysis Period (min) 15

HCM Unsignalized Intersection Capacity Analysis
2: AZ-83 & EB Off-Ramp Page 2
Operations Year 20, No Carpool, Peak Season, Weekend, AM Synchro 7 Report
Tetra Tech ISG 2/5/2010
Movement NBL NBT NBR SBL SBT SBR SEL SER SWL SWR
Lane Configurations
Volume (veh/h) 0 421 57 0 35 0 0 252 0 0
Sign Control Free Free Yield Yield
Grade 0% 0% 0% 0%
Peak Hour Factor 0.92 0.92 0.92 0.92 0.92 0.92 0.92 0.92 0.92 0.92
Hourly flow rate (vph) 0 458 62 0 38 0 0 274 0 0
Pedestrians
Lane Width (ft)
Walking Speed (ft/s)
Percent Blockage
Right turn flare (veh)
Median type None None
Median storage veh)
Upstream signal (ft)
pX, platoon unblocked
vC, conflicting volume 38 520 558 38 770 496
vC1, stage 1 conf vol
vC2, stage 2 conf vol
vCu, unblocked vol 38 520 558 38 770 496
tC, single (s) 4.1 4.1 6.5 6.2 7.1 6.5
tC, 2 stage (s)
tF (s) 2.2 2.2 4.0 3.3 3.5 4.0
p0 queue free % 100 100 100 73 100 100
cM capacity (veh/h) 1559 1036 436 1028 231 472
Direction, Lane # NB 1 NB 2 SB 1 SE 1
Volume Total 458 62 38 274
Volume Left 0 0 0 0
Volume Right 0 62 0 274
cSH 1700 1700 1700 1028
Volume to Capacity 0.27 0.04 0.02 0.27
Queue Length 95th (ft) 0 0 0 27
Control Delay (s) 0.0 0.0 0.0 9.8
Lane LOS A
Approach Delay (s) 0.0 0.0 9.8
Approach LOS A
Intersection Summary
Average Delay 3.2
Intersection Capacity Utilization 25.6% ICU Level of Service A
Analysis Period (min) 15

HCM Unsignalized Intersection Capacity Analysis
3: Sahuarita Rd. & AZ-83 Page 1
Operations Year 20, No Carpool, Peak Season, Weekend, AM Synchro 7 Report
Tetra Tech ISG 2/5/2010
Movement EBL EBR NBL NBT SBT SBR
Lane Configurations
Volume (veh/h) 60 26 22 317 250 26
Sign Control Yield Free Free
Grade 0% 0% 0%
Peak Hour Factor 0.92 0.92 0.92 0.92 0.92 0.92
Hourly flow rate (vph) 65 28 24 345 272 28
Pedestrians
Lane Width (ft)
Walking Speed (ft/s)
Percent Blockage
Right turn flare (veh)
Median type None None
Median storage veh)
Upstream signal (ft)
pX, platoon unblocked
vC, conflicting volume 678 286 300
vC1, stage 1 conf vol
vC2, stage 2 conf vol
vCu, unblocked vol 678 286 300
tC, single (s) 6.4 6.2 4.1
tC, 2 stage (s)
tF (s) 3.5 3.3 2.2
p0 queue free % 84 96 98
cM capacity (veh/h) 407 748 1250
Direction, Lane # EB 1 NB 1 SB 1
Volume Total 93 368 300
Volume Left 65 24 0
Volume Right 28 0 28
cSH 472 1250 1700
Volume to Capacity 0.20 0.02 0.18
Queue Length 95th (ft) 18 1 0
Control Delay (s) 14.5 0.7 0.0
Lane LOS B A
Approach Delay (s) 14.5 0.7 0.0
Approach LOS B
Intersection Summary
Average Delay 2.1
Intersection Capacity Utilization 46.3% ICU Level of Service A
Analysis Period (min) 15

HCM Unsignalized Intersection Capacity Analysis
4: Hilton Ranch Rd. & AZ-83 Page 2
Operations Year 20, No Carpool, Peak Season, Weekend, AM Synchro 7 Report
Tetra Tech ISG 2/5/2010
Movement WBL WBR NBT NBR SBL SBT
Lane Configurations
Volume (veh/h) 0 0 223 0 4 284
Sign Control Yield Free Free
Grade 0% 0% 0%
Peak Hour Factor 0.92 0.92 0.92 0.92 0.92 0.92
Hourly flow rate (vph) 0 0 242 0 4 309
Pedestrians
Lane Width (ft)
Walking Speed (ft/s)
Percent Blockage
Right turn flare (veh)
Median type None None
Median storage veh)
Upstream signal (ft)
pX, platoon unblocked
vC, conflicting volume 560 242 242
vC1, stage 1 conf vol
vC2, stage 2 conf vol
vCu, unblocked vol 560 242 242
tC, single (s) 6.4 6.2 4.1
tC, 2 stage (s)
tF (s) 3.5 3.3 2.2
p0 queue free % 100 100 100
cM capacity (veh/h) 485 792 1312
Direction, Lane # WB 1 NB 1 SB 1
Volume Total 0 242 313
Volume Left 0 0 4
Volume Right 0 0 0
cSH 1700 1700 1312
Volume to Capacity 0.00 0.14 0.00
Queue Length 95th (ft) 0 0 0
Control Delay (s) 0.0 0.0 0.1
Lane LOS A A
Approach Delay (s) 0.0 0.0 0.1
Approach LOS A
Intersection Summary
Average Delay 0.1
Intersection Capacity Utilization 21.5% ICU Level of Service A
Analysis Period (min) 15

HCM Unsignalized Intersection Capacity Analysis
5: Hidden Valley Rd. & AZ-83 Page 3
Operations Year 20, No Carpool, Peak Season, Weekend, AM Synchro 7 Report
Tetra Tech ISG 2/5/2010
Movement EBL EBR NBL NBT SBT SBR
Lane Configurations
Volume (veh/h) 119 40 51 120 75 157
Sign Control Yield Free Free
Grade 3% 6% -6%
Peak Hour Factor 0.92 0.92 0.92 0.92 0.92 0.92
Hourly flow rate (vph) 129 43 55 130 82 171
Pedestrians
Lane Width (ft)
Walking Speed (ft/s)
Percent Blockage
Right turn flare (veh)
Median type None None
Median storage veh)
Upstream signal (ft)
pX, platoon unblocked
vC, conflicting volume 408 167 252
vC1, stage 1 conf vol
vC2, stage 2 conf vol
vCu, unblocked vol 408 167 252
tC, single (s) 6.4 6.2 4.1
tC, 2 stage (s)
tF (s) 3.5 3.3 2.2
p0 queue free % 77 95 96
cM capacity (veh/h) 570 872 1302
Direction, Lane # EB 1 NB 1 SB 1
Volume Total 173 186 252
Volume Left 129 55 0
Volume Right 43 0 171
cSH 624 1302 1700
Volume to Capacity 0.28 0.04 0.15
Queue Length 95th (ft) 28 3 0
Control Delay (s) 13.0 2.6 0.0
Lane LOS B A
Approach Delay (s) 13.0 2.6 0.0
Approach LOS B
Intersection Summary
Average Delay 4.5
Intersection Capacity Utilization 41.8% ICU Level of Service A
Analysis Period (min) 15

HCM Unsignalized Intersection Capacity Analysis
6: Rosemont Junction & AZ-83 Page 4
Operations Year 20, No Carpool, Peak Season, Weekend, AM Synchro 7 Report
Tetra Tech ISG 2/5/2010
Movement EBL EBR NBL NBT SBT SBR
Lane Configurations
Volume (veh/h) 4 0 0 197 167 4
Sign Control Yield Free Free
Grade 0% 0% 0%
Peak Hour Factor 0.92 0.92 0.92 0.92 0.92 0.92
Hourly flow rate (vph) 4 0 0 214 182 4
Pedestrians
Lane Width (ft)
Walking Speed (ft/s)
Percent Blockage
Right turn flare (veh)
Median type None None
Median storage veh)
Upstream signal (ft)
pX, platoon unblocked
vC, conflicting volume 398 184 186
vC1, stage 1 conf vol
vC2, stage 2 conf vol
vCu, unblocked vol 398 184 186
tC, single (s) 6.4 6.2 4.1
tC, 2 stage (s)
tF (s) 3.5 3.3 2.2
p0 queue free % 99 100 100
cM capacity (veh/h) 604 854 1377
Direction, Lane # EB 1 NB 1 SB 1
Volume Total 4 214 186
Volume Left 4 0 0
Volume Right 0 0 4
cSH 604 1377 1700
Volume to Capacity 0.01 0.00 0.11
Queue Length 95th (ft) 1 0 0
Control Delay (s) 11.0 0.0 0.0
Lane LOS B
Approach Delay (s) 11.0 0.0 0.0
Approach LOS B
Intersection Summary
Average Delay 0.1
Intersection Capacity Utilization 20.4% ICU Level of Service A
Analysis Period (min) 15

HCM Unsignalized Intersection Capacity Analysis
7: AZ-83 & Greaterville Rd. Page 5
Operations Year 20, No Carpool, Peak Season, Weekend, AM Synchro 7 Report
Tetra Tech ISG 2/5/2010
Movement SET SER NWL NWT NEL NER
Lane Configurations
Volume (veh/h) 126 0 0 171 0 0
Sign Control Free Free Yield
Grade 0% 0% 0%
Peak Hour Factor 0.92 0.92 0.92 0.92 0.92 0.92
Hourly flow rate (vph) 137 0 0 186 0 0
Pedestrians
Lane Width (ft)
Walking Speed (ft/s)
Percent Blockage
Right turn flare (veh)
Median type None None
Median storage veh)
Upstream signal (ft)
pX, platoon unblocked
vC, conflicting volume 137 323 137
vC1, stage 1 conf vol
vC2, stage 2 conf vol
vCu, unblocked vol 137 323 137
tC, single (s) 4.1 6.4 6.2
tC, 2 stage (s)
tF (s) 2.2 3.5 3.3
p0 queue free % 100 100 100
cM capacity (veh/h) 1435 667 906
Direction, Lane # SE 1 NW 1 NE 1
Volume Total 137 186 0
Volume Left 0 0 0
Volume Right 0 0 0
cSH 1700 1435 1700
Volume to Capacity 0.08 0.00 0.00
Queue Length 95th (ft) 0 0 0
Control Delay (s) 0.0 0.0 0.0
Lane LOS A
Approach Delay (s) 0.0 0.0 0.0
Approach LOS A
Intersection Summary
Average Delay 0.0
Intersection Capacity Utilization 12.3% ICU Level of Service A
Analysis Period (min) 15

HCM Unsignalized Intersection Capacity Analysis
1: I-10 WB On-Off Ramp & AZ-83 Page 1
Operations Year 20, No Carpool Peak Season, Weekend, PM Synchro 7 Report
2/5/2010
Movement EBL EBT WBT WBR SBL SBR
Lane Configurations
Volume (veh/h) 36 90 369 9 11 13
Sign Control Free Free Yield
Grade 0% 0% 0%
Peak Hour Factor 0.92 0.92 0.92 0.92 0.92 0.92
Hourly flow rate (vph) 39 98 401 10 12 14
Pedestrians
Lane Width (ft)
Walking Speed (ft/s)
Percent Blockage
Right turn flare (veh)
Median type None None
Median storage veh)
Upstream signal (ft)
pX, platoon unblocked
vC, conflicting volume 411 582 406
vC1, stage 1 conf vol
vC2, stage 2 conf vol
vCu, unblocked vol 411 582 406
tC, single (s) 4.1 6.4 6.2
tC, 2 stage (s)
tF (s) 2.2 3.5 3.3
p0 queue free % 97 97 98
cM capacity (veh/h) 1137 456 641
Direction, Lane # EB 1 WB 1 SB 1
Volume Total 137 411 26
Volume Left 39 0 12
Volume Right 0 10 14
cSH 1137 1700 540
Volume to Capacity 0.03 0.24 0.05
Queue Length 95th (ft) 3 0 4
Control Delay (s) 2.6 0.0 12.0
Lane LOS A B
Approach Delay (s) 2.6 0.0 12.0
Approach LOS B
Intersection Summary
Average Delay 1.2
Intersection Capacity Utilization 40.0% ICU Level of Service A
Analysis Period (min) 15

HCM Unsignalized Intersection Capacity Analysis
2: AZ-83 & EB Off-Ramp Page 2
Operations Year 20, No Carpool Peak Season, Weekend, PM Synchro 7 Report
2/5/2010
Movement NBL NBT NBR SBL SBT SBR SEL SER SWL SWR
Lane Configurations
Volume (veh/h) 0 380 65 0 101 0 0 455 0 0
Sign Control Free Free Yield Yield
Grade 0% 0% 0% 0%
Peak Hour Factor 0.92 0.92 0.92 0.92 0.92 0.92 0.92 0.92 0.92 0.92
Hourly flow rate (vph) 0 413 71 0 110 0 0 495 0 0
Pedestrians
Lane Width (ft)
Walking Speed (ft/s)
Percent Blockage
Right turn flare (veh)
Median type None None
Median storage veh)
Upstream signal (ft)
pX, platoon unblocked
vC, conflicting volume 110 484 593 110 1017 523
vC1, stage 1 conf vol
vC2, stage 2 conf vol
vCu, unblocked vol 110 484 593 110 1017 523
tC, single (s) 4.1 4.1 6.5 6.2 7.1 6.5
tC, 2 stage (s)
tF (s) 2.2 2.2 4.0 3.3 3.5 4.0
p0 queue free % 100 100 100 47 100 100
cM capacity (veh/h) 1468 1069 416 938 101 456
Direction, Lane # NB 1 NB 2 SB 1 SE 1
Volume Total 413 71 110 495
Volume Left 0 0 0 0
Volume Right 0 71 0 495
cSH 1700 1700 1700 938
Volume to Capacity 0.24 0.04 0.06 0.53
Queue Length 95th (ft) 0 0 0 79
Control Delay (s) 0.0 0.0 0.0 13.0
Lane LOS B
Approach Delay (s) 0.0 0.0 13.0
Approach LOS B
Intersection Summary
Average Delay 5.9
Intersection Capacity Utilization 40.2% ICU Level of Service A
Analysis Period (min) 15

HCM Unsignalized Intersection Capacity Analysis
3: Sahuarita Rd. & AZ-83 Page 1
Operations Year 20, No Carpool, Peak Season, Weekend, PM Synchro 7 Report
Tetra Tech ISG 2/5/2010
Movement EBL EBR NBL NBT SBT SBR
Lane Configurations
Volume (veh/h) 79 22 34 292 283 150
Sign Control Yield Free Free
Grade 0% 0% 0%
Peak Hour Factor 0.92 0.92 0.92 0.92 0.92 0.92
Hourly flow rate (vph) 86 24 37 317 308 163
Pedestrians
Lane Width (ft)
Walking Speed (ft/s)
Percent Blockage
Right turn flare (veh)
Median type None None
Median storage veh)
Upstream signal (ft)
pX, platoon unblocked
vC, conflicting volume 780 389 471
vC1, stage 1 conf vol
vC2, stage 2 conf vol
vCu, unblocked vol 780 389 471
tC, single (s) 6.4 6.2 4.1
tC, 2 stage (s)
tF (s) 3.5 3.3 2.2
p0 queue free % 76 96 97
cM capacity (veh/h) 351 659 1091
Direction, Lane # EB 1 NB 1 SB 1
Volume Total 110 354 471
Volume Left 86 37 0
Volume Right 24 0 163
cSH 391 1091 1700
Volume to Capacity 0.28 0.03 0.28
Queue Length 95th (ft) 28 3 0
Control Delay (s) 17.8 1.2 0.0
Lane LOS C A
Approach Delay (s) 17.8 1.2 0.0
Approach LOS C
Intersection Summary
Average Delay 2.5
Intersection Capacity Utilization 56.2% ICU Level of Service B
Analysis Period (min) 15

HCM Unsignalized Intersection Capacity Analysis
4: Hilton Ranch Rd. & AZ-83 Page 2
Operations Year 20, No Carpool, Peak Season, Weekend, PM Synchro 7 Report
Tetra Tech ISG 2/5/2010
Movement WBL WBR NBT NBR SBL SBT
Lane Configurations
Volume (veh/h) 0 0 295 0 19 253
Sign Control Yield Free Free
Grade 0% 0% 0%
Peak Hour Factor 0.92 0.92 0.92 0.92 0.92 0.92
Hourly flow rate (vph) 0 0 321 0 21 275
Pedestrians
Lane Width (ft)
Walking Speed (ft/s)
Percent Blockage
Right turn flare (veh)
Median type None None
Median storage veh)
Upstream signal (ft)
pX, platoon unblocked
vC, conflicting volume 637 321 321
vC1, stage 1 conf vol
vC2, stage 2 conf vol
vCu, unblocked vol 637 321 321
tC, single (s) 6.4 6.2 4.1
tC, 2 stage (s)
tF (s) 3.5 3.3 2.2
p0 queue free % 100 100 98
cM capacity (veh/h) 434 720 1239
Direction, Lane # WB 1 NB 1 SB 1
Volume Total 0 321 296
Volume Left 0 0 21
Volume Right 0 0 0
cSH 1700 1700 1239
Volume to Capacity 0.00 0.19 0.02
Queue Length 95th (ft) 0 0 1
Control Delay (s) 0.0 0.0 0.7
Lane LOS A A
Approach Delay (s) 0.0 0.0 0.7
Approach LOS A
Intersection Summary
Average Delay 0.3
Intersection Capacity Utilization 32.3% ICU Level of Service A
Analysis Period (min) 15

HCM Unsignalized Intersection Capacity Analysis
5: Hidden Valley Rd. & AZ-83 Page 3
Operations Year 20, No Carpool, Peak Season, Weekend, PM Synchro 7 Report
Tetra Tech ISG 2/5/2010
Movement EBL EBR NBL NBT SBT SBR
Lane Configurations
Volume (veh/h) 157 55 47 142 224 119
Sign Control Yield Free Free
Grade 0% 0% 0%
Peak Hour Factor 0.92 0.92 0.92 0.92 0.92 0.92
Hourly flow rate (vph) 171 60 51 154 243 129
Pedestrians
Lane Width (ft)
Walking Speed (ft/s)
Percent Blockage
Right turn flare (veh)
Median type None None
Median storage veh)
Upstream signal (ft)
pX, platoon unblocked
vC, conflicting volume 565 308 373
vC1, stage 1 conf vol
vC2, stage 2 conf vol
vCu, unblocked vol 565 308 373
tC, single (s) 6.5 6.3 4.2
tC, 2 stage (s)
tF (s) 3.6 3.4 2.3
p0 queue free % 63 92 96
cM capacity (veh/h) 457 720 1159
Direction, Lane # EB 1 NB 1 SB 1
Volume Total 230 205 373
Volume Left 171 51 0
Volume Right 60 0 129
cSH 505 1159 1700
Volume to Capacity 0.46 0.04 0.22
Queue Length 95th (ft) 59 3 0
Control Delay (s) 18.0 2.4 0.0
Lane LOS C A
Approach Delay (s) 18.0 2.4 0.0
Approach LOS C
Intersection Summary
Average Delay 5.7
Intersection Capacity Utilization 51.2% ICU Level of Service A
Analysis Period (min) 15

HCM Unsignalized Intersection Capacity Analysis
6: Rosemont Junction & AZ-83 Page 4
Operations Year 20, No Carpool, Peak Season, Weekend, PM Synchro 7 Report
Tetra Tech ISG 2/5/2010
Movement EBL EBR NBL NBT SBT SBR
Lane Configurations
Volume (veh/h) 0 0 0 197 238 0
Sign Control Yield Free Free
Grade 0% 0% 0%
Peak Hour Factor 0.92 0.92 0.92 0.92 0.92 0.92
Hourly flow rate (vph) 0 0 0 214 259 0
Pedestrians
Lane Width (ft)
Walking Speed (ft/s)
Percent Blockage
Right turn flare (veh)
Median type None None
Median storage veh)
Upstream signal (ft)
pX, platoon unblocked
vC, conflicting volume 473 259 259
vC1, stage 1 conf vol
vC2, stage 2 conf vol
vCu, unblocked vol 473 259 259
tC, single (s) 6.4 6.2 4.1
tC, 2 stage (s)
tF (s) 3.5 3.3 2.2
p0 queue free % 100 100 100
cM capacity (veh/h) 550 780 1306
Direction, Lane # EB 1 NB 1 SB 1
Volume Total 0 214 259
Volume Left 0 0 0
Volume Right 0 0 0
cSH 1700 1306 1700
Volume to Capacity 0.00 0.00 0.15
Queue Length 95th (ft) 0 0 0
Control Delay (s) 0.0 0.0 0.0
Lane LOS A
Approach Delay (s) 0.0 0.0 0.0
Approach LOS A
Intersection Summary
Average Delay 0.0
Intersection Capacity Utilization 15.9% ICU Level of Service A
Analysis Period (min) 15

HCM Unsignalized Intersection Capacity Analysis
7: AZ-83 & Greaterville Rd. Page 5
Operations Year 20, No Carpool, Peak Season, Weekend, PM Synchro 7 Report
Tetra Tech ISG 2/5/2010
Movement SET SER NWL NWT NEL NER
Lane Configurations
Volume (veh/h) 201 0 11 204 7 11
Sign Control Free Free Yield
Grade 0% 0% 0%
Peak Hour Factor 0.92 0.92 0.92 0.92 0.92 0.92
Hourly flow rate (vph) 218 0 12 222 8 12
Pedestrians
Lane Width (ft)
Walking Speed (ft/s)
Percent Blockage
Right turn flare (veh)
Median type None None
Median storage veh)
Upstream signal (ft)
pX, platoon unblocked
vC, conflicting volume 218 464 218
vC1, stage 1 conf vol
vC2, stage 2 conf vol
vCu, unblocked vol 218 464 218
tC, single (s) 4.1 6.4 6.2
tC, 2 stage (s)
tF (s) 2.2 3.5 3.3
p0 queue free % 99 99 99
cM capacity (veh/h) 1351 551 821
Direction, Lane # SE 1 NW 1 NE 1
Volume Total 218 234 20
Volume Left 0 12 8
Volume Right 0 0 12
cSH 1700 1351 690
Volume to Capacity 0.13 0.01 0.03
Queue Length 95th (ft) 0 1 2
Control Delay (s) 0.0 0.5 10.4
Lane LOS A B
Approach Delay (s) 0.0 0.5 10.4
Approach LOS B
Intersection Summary
Average Delay 0.7
Intersection Capacity Utilization 29.7% ICU Level of Service A
Analysis Period (min) 15

NON - PEAK SEASON
SCENARIO 4
50% CARPOOL

HCM Unsignalized Intersection Capacity Analysis
1: I-10 WB On-Off Ramp & AZ-83 Page 1
Operations Year 20, 50% Carpool, Non-Peak Season, Weekday, AM Synchro 7 Report
Tetra Tech ISG 2/5/2010
Movement EBL EBT WBT WBR SBL SBR
Lane Configurations
Volume (veh/h) 9 49 705 4 13 49
Sign Control Free Free Yield
Grade 0% 0% 0%
Peak Hour Factor 0.92 0.92 0.92 0.92 0.92 0.92
Hourly flow rate (vph) 10 53 766 4 14 53
Pedestrians
Lane Width (ft)
Walking Speed (ft/s)
Percent Blockage
Right turn flare (veh)
Median type None None
Median storage veh)
Upstream signal (ft)
pX, platoon unblocked
vC, conflicting volume 771 841 768
vC1, stage 1 conf vol
vC2, stage 2 conf vol
vCu, unblocked vol 771 841 768
tC, single (s) 4.2 6.5 6.3
tC, 2 stage (s)
tF (s) 2.3 3.6 3.4
p0 queue free % 99 96 86
cM capacity (veh/h) 818 323 392
Direction, Lane # EB 1 WB 1 SB 1
Volume Total 63 771 67
Volume Left 10 0 14
Volume Right 0 4 53
cSH 818 1700 375
Volume to Capacity 0.01 0.45 0.18
Queue Length 95th (ft) 1 0 16
Control Delay (s) 1.6 0.0 16.7
Lane LOS A C
Approach Delay (s) 1.6 0.0 16.7
Approach LOS C
Intersection Summary
Average Delay 1.4
Intersection Capacity Utilization 47.8% ICU Level of Service A
Analysis Period (min) 15

HCM Unsignalized Intersection Capacity Analysis
2: AZ-83 & EB Off-Ramp Page 2
Operations Year 20, 50% Carpool, Non-Peak Season, Weekday, AM Synchro 7 Report
Tetra Tech ISG 2/5/2010
Movement NBL NBT NBR SBL SBT SBR SEL SER SWL SWR
Lane Configurations
Volume (veh/h) 0 417 58 0 38 0 0 249 0 0
Sign Control Free Free Yield Yield
Grade 0% 0% 0% 0%
Peak Hour Factor 0.92 0.92 0.92 0.92 0.92 0.92 0.92 0.92 0.92 0.92
Hourly flow rate (vph) 0 453 63 0 41 0 0 271 0 0
Pedestrians
Lane Width (ft)
Walking Speed (ft/s)
Percent Blockage
Right turn flare (veh)
Median type None None
Median storage veh)
Upstream signal (ft)
pX, platoon unblocked
vC, conflicting volume 41 516 558 41 765 495
vC1, stage 1 conf vol
vC2, stage 2 conf vol
vCu, unblocked vol 41 516 558 41 765 495
tC, single (s) 4.2 4.2 6.6 6.3 7.2 6.6
tC, 2 stage (s)
tF (s) 2.3 2.3 4.1 3.4 3.6 4.1
p0 queue free % 100 100 100 73 100 100
cM capacity (veh/h) 1530 1019 430 1013 229 467
Direction, Lane # NB 1 NB 2 SB 1 SE 1
Volume Total 453 63 41 271
Volume Left 0 0 0 0
Volume Right 0 63 0 271
cSH 1700 1700 1700 1013
Volume to Capacity 0.27 0.04 0.02 0.27
Queue Length 95th (ft) 0 0 0 27
Control Delay (s) 0.0 0.0 0.0 9.8
Lane LOS A
Approach Delay (s) 0.0 0.0 9.8
Approach LOS A
Intersection Summary
Average Delay 3.2
Intersection Capacity Utilization 25.4% ICU Level of Service A
Analysis Period (min) 15

HCM Unsignalized Intersection Capacity Analysis
3: Sahuarita Rd. & AZ-83 Page 1
Operations Year 20, 50% Carpool, Non-Peak Season, Weekday, AM Synchro 7 Report
Tetra Tech ISG 2/5/2010
Movement EBL EBR NBL NBT SBT SBR
Lane Configurations
Volume (veh/h) 22 11 22 239 227 4
Sign Control Yield Free Free
Grade 0% 0% 0%
Peak Hour Factor 0.92 0.92 0.92 0.92 0.92 0.92
Hourly flow rate (vph) 24 12 24 260 247 4
Pedestrians
Lane Width (ft)
Walking Speed (ft/s)
Percent Blockage
Right turn flare (veh)
Median type None None
Median storage veh)
Upstream signal (ft)
pX, platoon unblocked
vC, conflicting volume 557 249 251
vC1, stage 1 conf vol
vC2, stage 2 conf vol
vCu, unblocked vol 557 249 251
tC, single (s) 6.5 6.3 4.2
tC, 2 stage (s)
tF (s) 3.6 3.4 2.3
p0 queue free % 95 98 98
cM capacity (veh/h) 473 775 1280
Direction, Lane # EB 1 NB 1 SB 1
Volume Total 36 284 251
Volume Left 24 24 0
Volume Right 12 0 4
cSH 543 1280 1700
Volume to Capacity 0.07 0.02 0.15
Queue Length 95th (ft) 5 1 0
Control Delay (s) 12.1 0.8 0.0
Lane LOS B A
Approach Delay (s) 12.1 0.8 0.0
Approach LOS B
Intersection Summary
Average Delay 1.2
Intersection Capacity Utilization 39.3% ICU Level of Service A
Analysis Period (min) 15

HCM Unsignalized Intersection Capacity Analysis
4: Hilton Ranch Rd. & AZ-83 Page 2
Operations Year 20, 50% Carpool, Non-Peak Season, Weekday, AM Synchro 7 Report
Tetra Tech ISG 2/5/2010
Movement WBL WBR NBT NBR SBL SBT
Lane Configurations
Volume (veh/h) 0 0 176 0 15 235
Sign Control Yield Free Free
Grade 0% 0% 0%
Peak Hour Factor 0.92 0.92 0.92 0.92 0.92 0.92
Hourly flow rate (vph) 0 0 191 0 16 255
Pedestrians
Lane Width (ft)
Walking Speed (ft/s)
Percent Blockage
Right turn flare (veh)
Median type None None
Median storage veh)
Upstream signal (ft)
pX, platoon unblocked
vC, conflicting volume 479 191 191
vC1, stage 1 conf vol
vC2, stage 2 conf vol
vCu, unblocked vol 479 191 191
tC, single (s) 6.5 6.3 4.2
tC, 2 stage (s)
tF (s) 3.6 3.4 2.3
p0 queue free % 100 100 99
cM capacity (veh/h) 528 835 1347
Direction, Lane # WB 1 NB 1 SB 1
Volume Total 0 191 272
Volume Left 0 0 16
Volume Right 0 0 0
cSH 1700 1700 1347
Volume to Capacity 0.00 0.11 0.01
Queue Length 95th (ft) 0 0 1
Control Delay (s) 0.0 0.0 0.6
Lane LOS A A
Approach Delay (s) 0.0 0.0 0.6
Approach LOS A
Intersection Summary
Average Delay 0.3
Intersection Capacity Utilization 28.0% ICU Level of Service A
Analysis Period (min) 15

HCM Unsignalized Intersection Capacity Analysis
5: Hidden Valley Rd. & AZ-83 Page 3
Operations Year 20, 50% Carpool, Non-Peak Season, Weekday, AM Synchro 7 Report
Tetra Tech ISG 2/5/2010
Movement EBL EBR NBL NBT SBT SBR
Lane Configurations
Volume (veh/h) 71 24 52 180 138 156
Sign Control Yield Free Free
Grade 0% 0% 0%
Peak Hour Factor 0.92 0.92 0.92 0.92 0.92 0.92
Hourly flow rate (vph) 77 26 57 196 150 170
Pedestrians
Lane Width (ft)
Walking Speed (ft/s)
Percent Blockage
Right turn flare (veh)
Median type None None
Median storage veh)
Upstream signal (ft)
pX, platoon unblocked
vC, conflicting volume 543 235 320
vC1, stage 1 conf vol
vC2, stage 2 conf vol
vCu, unblocked vol 543 235 320
tC, single (s) 6.5 6.3 4.2
tC, 2 stage (s)
tF (s) 3.6 3.4 2.3
p0 queue free % 83 97 95
cM capacity (veh/h) 467 790 1207
Direction, Lane # EB 1 NB 1 SB 1
Volume Total 103 252 320
Volume Left 77 57 0
Volume Right 26 0 170
cSH 521 1207 1700
Volume to Capacity 0.20 0.05 0.19
Queue Length 95th (ft) 18 4 0
Control Delay (s) 13.6 2.2 0.0
Lane LOS B A
Approach Delay (s) 13.6 2.2 0.0
Approach LOS B
Intersection Summary
Average Delay 2.9
Intersection Capacity Utilization 44.6% ICU Level of Service A
Analysis Period (min) 15

HCM Unsignalized Intersection Capacity Analysis
6: Rosemont Junction & AZ-83 Page 4
Operations Year 20, 50% Carpool, Non-Peak Season, Weekday, AM Synchro 7 Report
Tetra Tech ISG 2/5/2010
Movement EBL EBR NBL NBT SBT SBR
Lane Configurations
Volume (veh/h) 0 0 0 187 117 0
Sign Control Yield Free Free
Grade 0% 0% 0%
Peak Hour Factor 0.92 0.92 0.92 0.92 0.92 0.92
Hourly flow rate (vph) 0 0 0 203 127 0
Pedestrians
Lane Width (ft)
Walking Speed (ft/s)
Percent Blockage
Right turn flare (veh)
Median type None None
Median storage veh)
Upstream signal (ft)
pX, platoon unblocked
vC, conflicting volume 330 127 127
vC1, stage 1 conf vol
vC2, stage 2 conf vol
vCu, unblocked vol 330 127 127
tC, single (s) 6.5 6.3 4.2
tC, 2 stage (s)
tF (s) 3.6 3.4 2.3
p0 queue free % 100 100 100
cM capacity (veh/h) 652 907 1423
Direction, Lane # EB 1 NB 1 SB 1
Volume Total 0 203 127
Volume Left 0 0 0
Volume Right 0 0 0
cSH 1700 1423 1700
Volume to Capacity 0.00 0.00 0.07
Queue Length 95th (ft) 0 0 0
Control Delay (s) 0.0 0.0 0.0
Lane LOS A
Approach Delay (s) 0.0 0.0 0.0
Approach LOS A
Intersection Summary
Average Delay 0.0
Intersection Capacity Utilization 13.2% ICU Level of Service A
Analysis Period (min) 15

HCM Unsignalized Intersection Capacity Analysis
7: AZ-83 & Greaterville Rd. Page 5
Operations Year 20, 50% Carpool, Non-Peak Season, Weekday, AM Synchro 7 Report
Tetra Tech ISG 2/5/2010
Movement SET SER NWL NWT NEL NER
Lane Configurations
Volume (veh/h) 102 7 7 142 4 4
Sign Control Free Free Yield
Grade 0% 0% 0%
Peak Hour Factor 0.92 0.92 0.92 0.92 0.92 0.92
Hourly flow rate (vph) 111 8 8 154 4 4
Pedestrians
Lane Width (ft)
Walking Speed (ft/s)
Percent Blockage
Right turn flare (veh)
Median type None None
Median storage veh)
Upstream signal (ft)
pX, platoon unblocked
vC, conflicting volume 118 284 115
vC1, stage 1 conf vol
vC2, stage 2 conf vol
vCu, unblocked vol 118 284 115
tC, single (s) 4.2 6.5 6.3
tC, 2 stage (s)
tF (s) 2.3 3.6 3.4
p0 queue free % 99 99 100
cM capacity (veh/h) 1433 690 922
Direction, Lane # SE 1 NW 1 NE 1
Volume Total 118 162 9
Volume Left 0 8 4
Volume Right 8 0 4
cSH 1700 1433 789
Volume to Capacity 0.07 0.01 0.01
Queue Length 95th (ft) 0 0 1
Control Delay (s) 0.0 0.4 9.6
Lane LOS A A
Approach Delay (s) 0.0 0.4 9.6
Approach LOS A
Intersection Summary
Average Delay 0.5
Intersection Capacity Utilization 23.2% ICU Level of Service A
Analysis Period (min) 15

HCM Unsignalized Intersection Capacity Analysis
1: I-10 WB On-Off Ramp & AZ-83 Page 1
Operations Year 20, 50% Carpool, Non-Peak Season, Weekday, PM Synchro 7 Report
Tetra Tech ISG 2/5/2010
Movement EBL EBT WBT WBR SBL SBR
Lane Configurations
Volume (veh/h) 39 69 264 7 15 11
Sign Control Free Free Yield
Grade 0% 0% 0%
Peak Hour Factor 0.92 0.92 0.92 0.92 0.92 0.92
Hourly flow rate (vph) 42 75 287 8 16 12
Pedestrians
Lane Width (ft)
Walking Speed (ft/s)
Percent Blockage
Right turn flare (veh)
Median type None None
Median storage veh)
Upstream signal (ft)
pX, platoon unblocked
vC, conflicting volume 295 451 291
vC1, stage 1 conf vol
vC2, stage 2 conf vol
vCu, unblocked vol 295 451 291
tC, single (s) 4.2 6.5 6.3
tC, 2 stage (s)
tF (s) 2.3 3.6 3.4
p0 queue free % 97 97 98
cM capacity (veh/h) 1233 536 734
Direction, Lane # EB 1 WB 1 SB 1
Volume Total 117 295 28
Volume Left 42 0 16
Volume Right 0 8 12
cSH 1233 1700 605
Volume to Capacity 0.03 0.17 0.05
Queue Length 95th (ft) 3 0 4
Control Delay (s) 3.1 0.0 11.2
Lane LOS A B
Approach Delay (s) 3.1 0.0 11.2
Approach LOS B
Intersection Summary
Average Delay 1.5
Intersection Capacity Utilization 33.4% ICU Level of Service A
Analysis Period (min) 15

HCM Unsignalized Intersection Capacity Analysis
2: AZ-83 & EB Off-Ramp Page 2
Operations Year 20, 50% Carpool, Non-Peak Season, Weekday, PM Synchro 7 Report
Tetra Tech ISG 2/5/2010
Movement NBL NBT NBR SBL SBT SBR SEL SER SWL SWR
Lane Configurations
Volume (veh/h) 0 309 45 0 47 0 0 365 0 0
Sign Control Free Free Yield Yield
Grade 0% 0% 0% 0%
Peak Hour Factor 0.92 0.92 0.92 0.92 0.92 0.92 0.92 0.92 0.92 0.92
Hourly flow rate (vph) 0 336 49 0 51 0 0 397 0 0
Pedestrians
Lane Width (ft)
Walking Speed (ft/s)
Percent Blockage
Right turn flare (veh)
Median type None None
Median storage veh)
Upstream signal (ft)
pX, platoon unblocked
vC, conflicting volume 51 385 436 51 784 387
vC1, stage 1 conf vol
vC2, stage 2 conf vol
vCu, unblocked vol 51 385 436 51 784 387
tC, single (s) 4.2 4.2 6.6 6.3 7.2 6.6
tC, 2 stage (s)
tF (s) 2.3 2.3 4.1 3.4 3.6 4.1
p0 queue free % 100 100 100 60 100 100
cM capacity (veh/h) 1517 1142 505 1000 183 538
Direction, Lane # NB 1 NB 2 SB 1 SE 1
Volume Total 336 49 51 397
Volume Left 0 0 0 0
Volume Right 0 49 0 397
cSH 1700 1700 1700 1000
Volume to Capacity 0.20 0.03 0.03 0.40
Queue Length 95th (ft) 0 0 0 48
Control Delay (s) 0.0 0.0 0.0 10.9
Lane LOS B
Approach Delay (s) 0.0 0.0 10.9
Approach LOS B
Intersection Summary
Average Delay 5.2
Intersection Capacity Utilization 32.6% ICU Level of Service A
Analysis Period (min) 15

HCM Unsignalized Intersection Capacity Analysis
3: Sahuarita Rd. & AZ-83 Page 1
Operations Year 20, 50% Carpool, Non-Peak Season, Weekday, PM Synchro 7 Report
Tetra Tech ISG 2/6/2010
Movement EBL EBR NBL NBT SBT SBR
Lane Configurations
Volume (veh/h) 30 11 26 246 247 79
Sign Control Yield Free Free
Grade 0% 0% 0%
Peak Hour Factor 0.92 0.92 0.92 0.92 0.92 0.92
Hourly flow rate (vph) 33 12 28 267 268 86
Pedestrians
Lane Width (ft)
Walking Speed (ft/s)
Percent Blockage
Right turn flare (veh)
Median type None None
Median storage veh)
Upstream signal (ft)
pX, platoon unblocked
vC, conflicting volume 635 311 354
vC1, stage 1 conf vol
vC2, stage 2 conf vol
vCu, unblocked vol 635 311 354
tC, single (s) 6.5 6.3 4.2
tC, 2 stage (s)
tF (s) 3.6 3.4 2.3
p0 queue free % 92 98 98
cM capacity (veh/h) 423 715 1172
Direction, Lane # EB 1 NB 1 SB 1
Volume Total 45 296 354
Volume Left 33 28 0
Volume Right 12 0 86
cSH 475 1172 1700
Volume to Capacity 0.09 0.02 0.21
Queue Length 95th (ft) 8 2 0
Control Delay (s) 13.4 1.0 0.0
Lane LOS B A
Approach Delay (s) 13.4 1.0 0.0
Approach LOS B
Intersection Summary
Average Delay 1.3
Intersection Capacity Utilization 44.6% ICU Level of Service A
Analysis Period (min) 15

HCM Unsignalized Intersection Capacity Analysis
4: Hilton Ranch Rd. & AZ-83 Page 2
Operations Year 20, 50% Carpool, Non-Peak Season, Weekday, PM Synchro 7 Report
Tetra Tech ISG 2/6/2010
Movement WBL WBR NBT NBR SBL SBT
Lane Configurations
Volume (veh/h) 0 0 223 0 15 183
Sign Control Yield Free Free
Grade 0% 0% 0%
Peak Hour Factor 0.92 0.92 0.92 0.92 0.92 0.92
Hourly flow rate (vph) 0 0 242 0 16 199
Pedestrians
Lane Width (ft)
Walking Speed (ft/s)
Percent Blockage
Right turn flare (veh)
Median type None None
Median storage veh)
Upstream signal (ft)
pX, platoon unblocked
vC, conflicting volume 474 242 242
vC1, stage 1 conf vol
vC2, stage 2 conf vol
vCu, unblocked vol 474 242 242
tC, single (s) 6.5 6.3 4.2
tC, 2 stage (s)
tF (s) 3.6 3.4 2.3
p0 queue free % 100 100 99
cM capacity (veh/h) 532 782 1290
Direction, Lane # WB 1 NB 1 SB 1
Volume Total 0 242 215
Volume Left 0 0 16
Volume Right 0 0 0
cSH 1700 1700 1290
Volume to Capacity 0.00 0.14 0.01
Queue Length 95th (ft) 0 0 1
Control Delay (s) 0.0 0.0 0.7
Lane LOS A A
Approach Delay (s) 0.0 0.0 0.7
Approach LOS A
Intersection Summary
Average Delay 0.3
Intersection Capacity Utilization 25.4% ICU Level of Service A
Analysis Period (min) 15

HCM Unsignalized Intersection Capacity Analysis
5: Hidden Valley Rd. & AZ-83 Page 3
Operations Year 20, 50% Carpool, Non-Peak Season, Weekday, PM Synchro 7 Report
Tetra Tech ISG 2/6/2010
Movement EBL EBR NBL NBT SBT SBR
Lane Configurations
Volume (veh/h) 149 48 24 123 183 71
Sign Control Yield Free Free
Grade 0% 0% 0%
Peak Hour Factor 0.92 0.92 0.92 0.92 0.92 0.92
Hourly flow rate (vph) 162 52 26 134 199 77
Pedestrians
Lane Width (ft)
Walking Speed (ft/s)
Percent Blockage
Right turn flare (veh)
Median type None None
Median storage veh)
Upstream signal (ft)
pX, platoon unblocked
vC, conflicting volume 423 238 276
vC1, stage 1 conf vol
vC2, stage 2 conf vol
vCu, unblocked vol 423 238 276
tC, single (s) 6.5 6.3 4.2
tC, 2 stage (s)
tF (s) 3.6 3.4 2.3
p0 queue free % 71 93 98
cM capacity (veh/h) 564 787 1253
Direction, Lane # EB 1 NB 1 SB 1
Volume Total 214 160 276
Volume Left 162 26 0
Volume Right 52 0 77
cSH 606 1253 1700
Volume to Capacity 0.35 0.02 0.16
Queue Length 95th (ft) 40 2 0
Control Delay (s) 14.2 1.4 0.0
Lane LOS B A
Approach Delay (s) 14.2 1.4 0.0
Approach LOS B
Intersection Summary
Average Delay 5.0
Intersection Capacity Utilization 42.9% ICU Level of Service A
Analysis Period (min) 15

HCM Unsignalized Intersection Capacity Analysis
6: Rosemont Junction & AZ-83 Page 4
Operations Year 20, 50% Carpool, Non-Peak Season, Weekday, PM Synchro 7 Report
Tetra Tech ISG 2/6/2010
Movement EBL EBR NBL NBT SBT SBR
Lane Configurations
Volume (veh/h) 0 0 0 125 183 0
Sign Control Yield Free Free
Grade 0% 0% 0%
Peak Hour Factor 0.92 0.92 0.92 0.92 0.92 0.92
Hourly flow rate (vph) 0 0 0 136 199 0
Pedestrians
Lane Width (ft)
Walking Speed (ft/s)
Percent Blockage
Right turn flare (veh)
Median type None None
Median storage veh)
Upstream signal (ft)
pX, platoon unblocked
vC, conflicting volume 335 199 199
vC1, stage 1 conf vol
vC2, stage 2 conf vol
vCu, unblocked vol 335 199 199
tC, single (s) 6.5 6.3 4.2
tC, 2 stage (s)
tF (s) 3.6 3.4 2.3
p0 queue free % 100 100 100
cM capacity (veh/h) 648 827 1338
Direction, Lane # EB 1 NB 1 SB 1
Volume Total 0 136 199
Volume Left 0 0 0
Volume Right 0 0 0
cSH 1700 1338 1700
Volume to Capacity 0.00 0.00 0.12
Queue Length 95th (ft) 0 0 0
Control Delay (s) 0.0 0.0 0.0
Lane LOS A
Approach Delay (s) 0.0 0.0 0.0
Approach LOS A
Intersection Summary
Average Delay 0.0
Intersection Capacity Utilization 13.0% ICU Level of Service A
Analysis Period (min) 15

HCM Unsignalized Intersection Capacity Analysis
7: AZ-83 & Greaterville Rd. Page 5
Operations Year 20, 50% Carpool, Non-Peak Season, Weekday, PM Synchro 7 Report
Tetra Tech ISG 2/6/2010
Movement SET SER NWL NWT NEL NER
Lane Configurations
Volume (veh/h) 220 7 7 170 0 0
Sign Control Free Free Yield
Grade 0% 0% 0%
Peak Hour Factor 0.92 0.92 0.92 0.92 0.92 0.92
Hourly flow rate (vph) 239 8 8 185 0 0
Pedestrians
Lane Width (ft)
Walking Speed (ft/s)
Percent Blockage
Right turn flare (veh)
Median type None None
Median storage veh)
Upstream signal (ft)
pX, platoon unblocked
vC, conflicting volume 247 443 243
vC1, stage 1 conf vol
vC2, stage 2 conf vol
vCu, unblocked vol 247 443 243
tC, single (s) 4.2 6.5 6.3
tC, 2 stage (s)
tF (s) 2.3 3.6 3.4
p0 queue free % 99 100 100
cM capacity (veh/h) 1285 558 781
Direction, Lane # SE 1 NW 1 NE 1
Volume Total 247 192 0
Volume Left 0 8 0
Volume Right 8 0 0
cSH 1700 1285 1700
Volume to Capacity 0.15 0.01 0.00
Queue Length 95th (ft) 0 0 0
Control Delay (s) 0.0 0.4 0.0
Lane LOS A A
Approach Delay (s) 0.0 0.4 0.0
Approach LOS A
Intersection Summary
Average Delay 0.2
Intersection Capacity Utilization 18.0% ICU Level of Service A
Analysis Period (min) 15

HCM Unsignalized Intersection Capacity Analysis
1: I-10 WB On-Off Ramp & AZ-83 Page 1
Operations Year 20, 50% Carpool, Non-Peak Season, Weekend, AM Synchro 7 Report
Tetra Tech ISG 2/5/2010
Movement EBL EBT WBT WBR SBL SBR
Lane Configurations
Volume (veh/h) 7 73 562 2 13 22
Sign Control Free Free Yield
Grade 0% 0% 0%
Peak Hour Factor 0.92 0.92 0.92 0.92 0.92 0.92
Hourly flow rate (vph) 8 79 611 2 14 24
Pedestrians
Lane Width (ft)
Walking Speed (ft/s)
Percent Blockage
Right turn flare (veh)
Median type None None
Median storage veh)
Upstream signal (ft)
pX, platoon unblocked
vC, conflicting volume 613 707 612
vC1, stage 1 conf vol
vC2, stage 2 conf vol
vCu, unblocked vol 613 707 612
tC, single (s) 4.2 6.5 6.3
tC, 2 stage (s)
tF (s) 2.3 3.6 3.4
p0 queue free % 99 96 95
cM capacity (veh/h) 938 390 482
Direction, Lane # EB 1 WB 1 SB 1
Volume Total 87 613 38
Volume Left 8 0 14
Volume Right 0 2 24
cSH 938 1700 443
Volume to Capacity 0.01 0.36 0.09
Queue Length 95th (ft) 1 0 7
Control Delay (s) 0.8 0.0 13.9
Lane LOS A B
Approach Delay (s) 0.8 0.0 13.9
Approach LOS B
Intersection Summary
Average Delay 0.8
Intersection Capacity Utilization 39.7% ICU Level of Service A
Analysis Period (min) 15

HCM Unsignalized Intersection Capacity Analysis
2: AZ-83 & EB Off-Ramp Page 2
Operations Year 20, 50% Carpool, Non-Peak Season, Weekend, AM Synchro 7 Report
Tetra Tech ISG 2/5/2010
Movement NBL NBT NBR SBL SBT SBR SEL SER SWL SWR
Lane Configurations
Volume (veh/h) 0 413 43 0 20 0 0 188 0 0
Sign Control Free Free Yield Yield
Grade 0% 0% 0% 0%
Peak Hour Factor 0.92 0.92 0.92 0.92 0.92 0.92 0.92 0.92 0.92 0.92
Hourly flow rate (vph) 0 449 47 0 22 0 0 204 0 0
Pedestrians
Lane Width (ft)
Walking Speed (ft/s)
Percent Blockage
Right turn flare (veh)
Median type None None
Median storage veh)
Upstream signal (ft)
pX, platoon unblocked
vC, conflicting volume 22 496 517 22 675 471
vC1, stage 1 conf vol
vC2, stage 2 conf vol
vCu, unblocked vol 22 496 517 22 675 471
tC, single (s) 4.2 4.2 6.6 6.3 7.2 6.6
tC, 2 stage (s)
tF (s) 2.3 2.3 4.1 3.4 3.6 4.1
p0 queue free % 100 100 100 80 100 100
cM capacity (veh/h) 1556 1038 454 1038 289 482
Direction, Lane # NB 1 NB 2 SB 1 SE 1
Volume Total 449 47 22 204
Volume Left 0 0 0 0
Volume Right 0 47 0 204
cSH 1700 1700 1700 1038
Volume to Capacity 0.26 0.03 0.01 0.20
Queue Length 95th (ft) 0 0 0 18
Control Delay (s) 0.0 0.0 0.0 9.3
Lane LOS A
Approach Delay (s) 0.0 0.0 9.3
Approach LOS A
Intersection Summary
Average Delay 2.6
Intersection Capacity Utilization 25.1% ICU Level of Service A
Analysis Period (min) 15

HCM Unsignalized Intersection Capacity Analysis
3: Sahuarita Rd. & AZ-83 Page 1
Operations Year 20, 50% Carpool, Non-Peak Season, Weekend, AM Synchro 7 Report
Tetra Tech ISG 2/5/2010
Movement EBL EBR NBL NBT SBT SBR
Lane Configurations
Volume (veh/h) 56 30 7 284 197 30
Sign Control Yield Free Free
Grade 0% 0% 0%
Peak Hour Factor 0.92 0.92 0.92 0.92 0.92 0.92
Hourly flow rate (vph) 61 33 8 309 214 33
Pedestrians
Lane Width (ft)
Walking Speed (ft/s)
Percent Blockage
Right turn flare (veh)
Median type None None
Median storage veh)
Upstream signal (ft)
pX, platoon unblocked
vC, conflicting volume 554 230 247
vC1, stage 1 conf vol
vC2, stage 2 conf vol
vCu, unblocked vol 554 230 247
tC, single (s) 6.5 6.3 4.2
tC, 2 stage (s)
tF (s) 3.6 3.4 2.3
p0 queue free % 87 96 99
cM capacity (veh/h) 480 794 1285
Direction, Lane # EB 1 NB 1 SB 1
Volume Total 93 316 247
Volume Left 61 8 0
Volume Right 33 0 33
cSH 557 1285 1700
Volume to Capacity 0.17 0.01 0.15
Queue Length 95th (ft) 15 0 0
Control Delay (s) 12.8 0.2 0.0
Lane LOS B A
Approach Delay (s) 12.8 0.2 0.0
Approach LOS B
Intersection Summary
Average Delay 1.9
Intersection Capacity Utilization 32.2% ICU Level of Service A
Analysis Period (min) 15

HCM Unsignalized Intersection Capacity Analysis
4: Hilton Ranch Rd. & AZ-83 Page 2
Operations Year 20, 50% Carpool, Non-Peak Season, Weekend, AM Synchro 7 Report
Tetra Tech ISG 2/5/2010
Movement WBL WBR NBT NBR SBL SBT
Lane Configurations
Volume (veh/h) 0 30 236 0 4 238
Sign Control Yield Free Free
Grade 0% 0% 0%
Peak Hour Factor 0.92 0.92 0.92 0.92 0.92 0.92
Hourly flow rate (vph) 0 33 257 0 4 259
Pedestrians
Lane Width (ft)
Walking Speed (ft/s)
Percent Blockage
Right turn flare (veh)
Median type None None
Median storage veh)
Upstream signal (ft)
pX, platoon unblocked
vC, conflicting volume 524 257 257
vC1, stage 1 conf vol
vC2, stage 2 conf vol
vCu, unblocked vol 524 257 257
tC, single (s) 6.5 6.3 4.2
tC, 2 stage (s)
tF (s) 3.6 3.4 2.3
p0 queue free % 100 96 100
cM capacity (veh/h) 502 768 1274
Direction, Lane # WB 1 NB 1 SB 1
Volume Total 33 257 263
Volume Left 0 0 4
Volume Right 33 0 0
cSH 768 1700 1274
Volume to Capacity 0.04 0.15 0.00
Queue Length 95th (ft) 3 0 0
Control Delay (s) 9.9 0.0 0.2
Lane LOS A A
Approach Delay (s) 9.9 0.0 0.2
Approach LOS A
Intersection Summary
Average Delay 0.7
Intersection Capacity Utilization 25.7% ICU Level of Service A
Analysis Period (min) 15

HCM Unsignalized Intersection Capacity Analysis
5: Hidden Valley Rd. & AZ-83 Page 3
Operations Year 20, 50% Carpool, Non-Peak Season, Weekend, AM Synchro 7 Report
Tetra Tech ISG 2/5/2010
Movement EBL EBR NBL NBT SBT SBR
Lane Configurations
Volume (veh/h) 71 27 32 153 94 107
Sign Control Yield Free Free
Grade 0% 0% 0%
Peak Hour Factor 0.92 0.92 0.92 0.92 0.92 0.92
Hourly flow rate (vph) 77 29 35 166 102 116
Pedestrians
Lane Width (ft)
Walking Speed (ft/s)
Percent Blockage
Right turn flare (veh)
Median type None None
Median storage veh)
Upstream signal (ft)
pX, platoon unblocked
vC, conflicting volume 396 160 218
vC1, stage 1 conf vol
vC2, stage 2 conf vol
vCu, unblocked vol 396 160 218
tC, single (s) 6.5 6.3 4.2
tC, 2 stage (s)
tF (s) 3.6 3.4 2.3
p0 queue free % 87 97 97
cM capacity (veh/h) 582 869 1316
Direction, Lane # EB 1 NB 1 SB 1
Volume Total 107 201 218
Volume Left 77 35 0
Volume Right 29 0 116
cSH 640 1316 1700
Volume to Capacity 0.17 0.03 0.13
Queue Length 95th (ft) 15 2 0
Control Delay (s) 11.7 1.5 0.0
Lane LOS B A
Approach Delay (s) 11.7 1.5 0.0
Approach LOS B
Intersection Summary
Average Delay 3.0
Intersection Capacity Utilization 36.9% ICU Level of Service A
Analysis Period (min) 15

HCM Unsignalized Intersection Capacity Analysis
6: Rosemont Junction & AZ-83 Page 4
Operations Year 20, 50% Carpool, Non-Peak Season, Weekend, AM Synchro 7 Report
Tetra Tech ISG 2/5/2010
Movement EBL EBR NBL NBT SBT SBR
Lane Configurations
Volume (veh/h) 4 0 4 167 87 0
Sign Control Yield Free Free
Grade 0% 0% 0%
Peak Hour Factor 0.92 0.92 0.92 0.92 0.92 0.92
Hourly flow rate (vph) 4 0 4 182 95 0
Pedestrians
Lane Width (ft)
Walking Speed (ft/s)
Percent Blockage
Right turn flare (veh)
Median type None None
Median storage veh)
Upstream signal (ft)
pX, platoon unblocked
vC, conflicting volume 285 95 95
vC1, stage 1 conf vol
vC2, stage 2 conf vol
vCu, unblocked vol 285 95 95
tC, single (s) 6.5 6.3 4.2
tC, 2 stage (s)
tF (s) 3.6 3.4 2.3
p0 queue free % 99 100 100
cM capacity (veh/h) 691 946 1463
Direction, Lane # EB 1 NB 1 SB 1
Volume Total 4 186 95
Volume Left 4 4 0
Volume Right 0 0 0
cSH 691 1463 1700
Volume to Capacity 0.01 0.00 0.06
Queue Length 95th (ft) 0 0 0
Control Delay (s) 10.2 0.2 0.0
Lane LOS B A
Approach Delay (s) 10.2 0.2 0.0
Approach LOS B
Intersection Summary
Average Delay 0.3
Intersection Capacity Utilization 22.0% ICU Level of Service A
Analysis Period (min) 15

HCM Unsignalized Intersection Capacity Analysis
7: AZ-83 & Greaterville Rd. Page 5
Operations Year 20, 50% Carpool, Non-Peak Season, Weekend, AM Synchro 7 Report
Tetra Tech ISG 2/5/2010
Movement SET SER NWL NWT NEL NER
Lane Configurations
Volume (veh/h) 155 0 0 137 4 7
Sign Control Free Free Yield
Grade 0% 0% 0%
Peak Hour Factor 0.92 0.92 0.92 0.92 0.92 0.92
Hourly flow rate (vph) 168 0 0 149 4 8
Pedestrians
Lane Width (ft)
Walking Speed (ft/s)
Percent Blockage
Right turn flare (veh)
Median type None None
Median storage veh)
Upstream signal (ft)
pX, platoon unblocked
vC, conflicting volume 168 317 168
vC1, stage 1 conf vol
vC2, stage 2 conf vol
vCu, unblocked vol 168 317 168
tC, single (s) 4.2 6.5 6.3
tC, 2 stage (s)
tF (s) 2.3 3.6 3.4
p0 queue free % 100 99 99
cM capacity (veh/h) 1373 664 860
Direction, Lane # SE 1 NW 1 NE 1
Volume Total 168 149 12
Volume Left 0 0 4
Volume Right 0 0 8
cSH 1700 1373 777
Volume to Capacity 0.10 0.00 0.02
Queue Length 95th (ft) 0 0 1
Control Delay (s) 0.0 0.0 9.7
Lane LOS A
Approach Delay (s) 0.0 0.0 9.7
Approach LOS A
Intersection Summary
Average Delay 0.4
Intersection Capacity Utilization 18.2% ICU Level of Service A
Analysis Period (min) 15
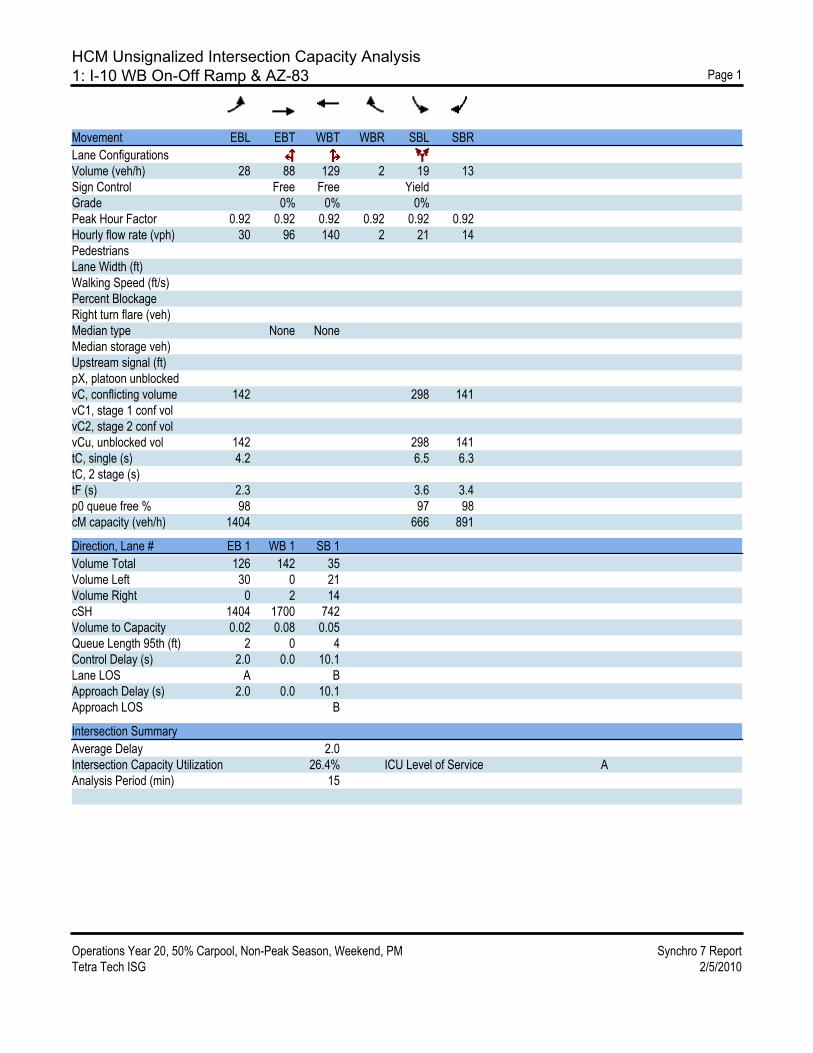
HCM Unsignalized Intersection Capacity Analysis
1: I-10 WB On-Off Ramp & AZ-83 Page 1
Operations Year 20, 50% Carpool, Non-Peak Season, Weekend, PM Synchro 7 Report
Tetra Tech ISG 2/5/2010
Movement EBL EBT WBT WBR SBL SBR
Lane Configurations
Volume (veh/h) 28 88 129 2 19 13
Sign Control Free Free Yield
Grade 0% 0% 0%
Peak Hour Factor 0.92 0.92 0.92 0.92 0.92 0.92
Hourly flow rate (vph) 30 96 140 2 21 14
Pedestrians
Lane Width (ft)
Walking Speed (ft/s)
Percent Blockage
Right turn flare (veh)
Median type None None
Median storage veh)
Upstream signal (ft)
pX, platoon unblocked
vC, conflicting volume 142 298 141
vC1, stage 1 conf vol
vC2, stage 2 conf vol
vCu, unblocked vol 142 298 141
tC, single (s) 4.2 6.5 6.3
tC, 2 stage (s)
tF (s) 2.3 3.6 3.4
p0 queue free % 98 97 98
cM capacity (veh/h) 1404 666 891
Direction, Lane # EB 1 WB 1 SB 1
Volume Total 126 142 35
Volume Left 30 0 21
Volume Right 0 2 14
cSH 1404 1700 742
Volume to Capacity 0.02 0.08 0.05
Queue Length 95th (ft) 2 0 4
Control Delay (s) 2.0 0.0 10.1
Lane LOS A B
Approach Delay (s) 2.0 0.0 10.1
Approach LOS B
Intersection Summary
Average Delay 2.0
Intersection Capacity Utilization 26.4% ICU Level of Service A
Analysis Period (min) 15

HCM Unsignalized Intersection Capacity Analysis
2: AZ-83 & EB Off-Ramp Page 2
Operations Year 20, 50% Carpool, Non-Peak Season, Weekend, PM Synchro 7 Report
Tetra Tech ISG 2/5/2010
Movement NBL NBT NBR SBL SBT SBR SEL SER SWL SWR
Lane Configurations
Volume (veh/h) 0 252 55 0 116 0 0 415 0 0
Sign Control Free Free Yield Yield
Grade 0% 0% 0% 0%
Peak Hour Factor 0.92 0.92 0.92 0.92 0.92 0.92 0.92 0.92 0.92 0.92
Hourly flow rate (vph) 0 274 60 0 126 0 0 451 0 0
Pedestrians
Lane Width (ft)
Walking Speed (ft/s)
Percent Blockage
Right turn flare (veh)
Median type None None
Median storage veh)
Upstream signal (ft)
pX, platoon unblocked
vC, conflicting volume 126 334 460 126 851 400
vC1, stage 1 conf vol
vC2, stage 2 conf vol
vCu, unblocked vol 126 334 460 126 851 400
tC, single (s) 4.2 4.2 6.6 6.3 7.2 6.6
tC, 2 stage (s)
tF (s) 2.3 2.3 4.1 3.4 3.6 4.1
p0 queue free % 100 100 100 50 100 100
cM capacity (veh/h) 1424 1193 489 908 138 529
Direction, Lane # NB 1 NB 2 SB 1 SE 1
Volume Total 274 60 126 451
Volume Left 0 0 0 0
Volume Right 0 60 0 451
cSH 1700 1700 1700 908
Volume to Capacity 0.16 0.04 0.07 0.50
Queue Length 95th (ft) 0 0 0 70
Control Delay (s) 0.0 0.0 0.0 12.8
Lane LOS B
Approach Delay (s) 0.0 0.0 12.8
Approach LOS B
Intersection Summary
Average Delay 6.3
Intersection Capacity Utilization 38.5% ICU Level of Service A
Analysis Period (min) 15

HCM Unsignalized Intersection Capacity Analysis
3: Sahuarita Rd. & AZ-83 Page 1
Operations Year 20, 50% Carpool, Non-Peak Season, Weekend, PM Synchro 7 Report
Tetra Tech ISG 2/5/2010
Movement EBL EBR NBL NBT SBT SBR
Lane Configurations
Volume (veh/h) 60 22 86 298 176 26
Sign Control Yield Free Free
Grade 0% 0% 0%
Peak Hour Factor 0.92 0.92 0.92 0.92 0.92 0.92
Hourly flow rate (vph) 65 24 93 324 191 28
Pedestrians
Lane Width (ft)
Walking Speed (ft/s)
Percent Blockage
Right turn flare (veh)
Median type None None
Median storage veh)
Upstream signal (ft)
pX, platoon unblocked
vC, conflicting volume 716 205 220
vC1, stage 1 conf vol
vC2, stage 2 conf vol
vCu, unblocked vol 716 205 220
tC, single (s) 6.5 6.3 4.2
tC, 2 stage (s)
tF (s) 3.6 3.4 2.3
p0 queue free % 82 97 93
cM capacity (veh/h) 360 820 1315
Direction, Lane # EB 1 NB 1 SB 1
Volume Total 89 417 220
Volume Left 65 93 0
Volume Right 24 0 28
cSH 424 1315 1700
Volume to Capacity 0.21 0.07 0.13
Queue Length 95th (ft) 20 6 0
Control Delay (s) 15.7 2.3 0.0
Lane LOS C A
Approach Delay (s) 15.7 2.3 0.0
Approach LOS C
Intersection Summary
Average Delay 3.3
Intersection Capacity Utilization 45.9% ICU Level of Service A
Analysis Period (min) 15

HCM Unsignalized Intersection Capacity Analysis
4: Hilton Ranch Rd. & AZ-83 Page 2
Operations Year 20, 50% Carpool, Non-Peak Season, Weekend, PM Synchro 7 Report
Tetra Tech ISG 2/5/2010
Movement WBL WBR NBT NBR SBL SBT
Lane Configurations
Volume (veh/h) 0 4 276 0 4 180
Sign Control Yield Free Free
Grade 0% 0% 0%
Peak Hour Factor 0.92 0.92 0.92 0.92 0.92 0.92
Hourly flow rate (vph) 0 4 300 0 4 196
Pedestrians
Lane Width (ft)
Walking Speed (ft/s)
Percent Blockage
Right turn flare (veh)
Median type None None
Median storage veh)
Upstream signal (ft)
pX, platoon unblocked
vC, conflicting volume 504 300 300
vC1, stage 1 conf vol
vC2, stage 2 conf vol
vCu, unblocked vol 504 300 300
tC, single (s) 6.5 6.3 4.2
tC, 2 stage (s)
tF (s) 3.6 3.4 2.3
p0 queue free % 100 99 100
cM capacity (veh/h) 515 726 1228
Direction, Lane # WB 1 NB 1 SB 1
Volume Total 4 300 200
Volume Left 0 0 4
Volume Right 4 0 0
cSH 726 1700 1228
Volume to Capacity 0.01 0.18 0.00
Queue Length 95th (ft) 0 0 0
Control Delay (s) 10.0 0.0 0.2
Lane LOS A A
Approach Delay (s) 10.0 0.0 0.2
Approach LOS A
Intersection Summary
Average Delay 0.2
Intersection Capacity Utilization 24.5% ICU Level of Service A
Analysis Period (min) 15

HCM Unsignalized Intersection Capacity Analysis
5: Hidden Valley Rd. & AZ-83 Page 3
Operations Year 20, 50% Carpool, Non-Peak Season, Weekend, PM Synchro 7 Report
Tetra Tech ISG 2/5/2010
Movement EBL EBR NBL NBT SBT SBR
Lane Configurations
Volume (veh/h) 104 32 24 153 67 71
Sign Control Yield Free Free
Grade 0% 0% 0%
Peak Hour Factor 0.92 0.92 0.92 0.92 0.92 0.92
Hourly flow rate (vph) 113 35 26 166 73 77
Pedestrians
Lane Width (ft)
Walking Speed (ft/s)
Percent Blockage
Right turn flare (veh)
Median type None None
Median storage veh)
Upstream signal (ft)
pX, platoon unblocked
vC, conflicting volume 330 111 150
vC1, stage 1 conf vol
vC2, stage 2 conf vol
vCu, unblocked vol 330 111 150
tC, single (s) 6.5 6.3 4.2
tC, 2 stage (s)
tF (s) 3.6 3.4 2.3
p0 queue free % 82 96 98
cM capacity (veh/h) 640 926 1395
Direction, Lane # EB 1 NB 1 SB 1
Volume Total 148 192 150
Volume Left 113 26 0
Volume Right 35 0 77
cSH 690 1395 1700
Volume to Capacity 0.21 0.02 0.09
Queue Length 95th (ft) 20 1 0
Control Delay (s) 11.6 1.2 0.0
Lane LOS B A
Approach Delay (s) 11.6 1.2 0.0
Approach LOS B
Intersection Summary
Average Delay 4.0
Intersection Capacity Utilization 35.0% ICU Level of Service A
Analysis Period (min) 15

HCM Unsignalized Intersection Capacity Analysis
6: Rosemont Junction & AZ-83 Page 4
Operations Year 20, 50% Carpool, Non-Peak Season, Weekend, PM Synchro 7 Report
Tetra Tech ISG 2/5/2010
Movement EBL EBR NBL NBT SBT SBR
Lane Configurations
Volume (veh/h) 0 0 0 192 126 0
Sign Control Yield Free Free
Grade 0% 0% 0%
Peak Hour Factor 0.92 0.92 0.92 0.92 0.92 0.92
Hourly flow rate (vph) 0 0 0 209 137 0
Pedestrians
Lane Width (ft)
Walking Speed (ft/s)
Percent Blockage
Right turn flare (veh)
Median type None None
Median storage veh)
Upstream signal (ft)
pX, platoon unblocked
vC, conflicting volume 346 137 137
vC1, stage 1 conf vol
vC2, stage 2 conf vol
vCu, unblocked vol 346 137 137
tC, single (s) 6.5 6.3 4.2
tC, 2 stage (s)
tF (s) 3.6 3.4 2.3
p0 queue free % 100 100 100
cM capacity (veh/h) 639 896 1411
Direction, Lane # EB 1 NB 1 SB 1
Volume Total 0 209 137
Volume Left 0 0 0
Volume Right 0 0 0
cSH 1700 1411 1700
Volume to Capacity 0.00 0.00 0.08
Queue Length 95th (ft) 0 0 0
Control Delay (s) 0.0 0.0 0.0
Lane LOS A
Approach Delay (s) 0.0 0.0 0.0
Approach LOS A
Intersection Summary
Average Delay 0.0
Intersection Capacity Utilization 13.4% ICU Level of Service A
Analysis Period (min) 15

HCM Unsignalized Intersection Capacity Analysis
7: AZ-83 & Greaterville Rd. Page 5
Operations Year 20, 50% Carpool, Non-Peak Season, Weekend, PM Synchro 7 Report
Tetra Tech ISG 2/5/2010
Movement SET SER NWL NWT NEL NER
Lane Configurations
Volume (veh/h) 197 7 11 218 4 7
Sign Control Free Free Yield
Grade 0% 0% 0%
Peak Hour Factor 0.92 0.92 0.92 0.92 0.92 0.92
Hourly flow rate (vph) 214 8 12 237 4 8
Pedestrians
Lane Width (ft)
Walking Speed (ft/s)
Percent Blockage
Right turn flare (veh)
Median type None None
Median storage veh)
Upstream signal (ft)
pX, platoon unblocked
vC, conflicting volume 222 479 218
vC1, stage 1 conf vol
vC2, stage 2 conf vol
vCu, unblocked vol 222 479 218
tC, single (s) 4.2 6.5 6.3
tC, 2 stage (s)
tF (s) 2.3 3.6 3.4
p0 queue free % 99 99 99
cM capacity (veh/h) 1313 530 807
Direction, Lane # SE 1 NW 1 NE 1
Volume Total 222 249 12
Volume Left 0 12 4
Volume Right 8 0 8
cSH 1700 1313 678
Volume to Capacity 0.13 0.01 0.02
Queue Length 95th (ft) 0 1 1
Control Delay (s) 0.0 0.5 10.4
Lane LOS A B
Approach Delay (s) 0.0 0.5 10.4
Approach LOS B
Intersection Summary
Average Delay 0.5
Intersection Capacity Utilization 30.4% ICU Level of Service A
Analysis Period (min) 15

PEAK SEASON
SCENARIO 4
50% CARPOOL

HCM Unsignalized Intersection Capacity Analysis
1: I-10 WB On-Off Ramp & AZ-83 Page 1
Operations Year 20, 50% Carpool, Peak Season, Weekday, AM Synchro 7 Report
Tetra Tech ISG 2/5/2010
Movement EBL EBT WBT WBR SBL SBR
Lane Configurations
Volume (veh/h) 6 64 593 7 21 30
Sign Control Free Free Yield
Grade 0% 0% 0%
Peak Hour Factor 0.92 0.92 0.92 0.92 0.92 0.92
Hourly flow rate (vph) 7 70 645 8 23 33
Pedestrians
Lane Width (ft)
Walking Speed (ft/s)
Percent Blockage
Right turn flare (veh)
Median type None None
Median storage veh)
Upstream signal (ft)
pX, platoon unblocked
vC, conflicting volume 652 731 648
vC1, stage 1 conf vol
vC2, stage 2 conf vol
vCu, unblocked vol 652 731 648
tC, single (s) 4.2 6.5 6.3
tC, 2 stage (s)
tF (s) 2.3 3.6 3.4
p0 queue free % 99 94 93
cM capacity (veh/h) 906 377 460
Direction, Lane # EB 1 WB 1 SB 1
Volume Total 76 652 55
Volume Left 7 0 23
Volume Right 0 8 33
cSH 906 1700 422
Volume to Capacity 0.01 0.38 0.13
Queue Length 95th (ft) 1 0 11
Control Delay (s) 0.8 0.0 14.8
Lane LOS A B
Approach Delay (s) 0.8 0.0 14.8
Approach LOS B
Intersection Summary
Average Delay 1.1
Intersection Capacity Utilization 41.6% ICU Level of Service A
Analysis Period (min) 15

HCM Unsignalized Intersection Capacity Analysis
2: AZ-83 & EB Off-Ramp Page 2
Operations Year 20, 50% Carpool, Peak Season, Weekday, AM Synchro 7 Report
Tetra Tech ISG 2/5/2010
Movement NBL NBT NBR SBL SBT SBR SEL SER SWL SWR
Lane Configurations
Volume (veh/h) 0 428 29 0 31 0 0 253 0 0
Sign Control Free Free Yield Yield
Grade 0% 0% 0% 0%
Peak Hour Factor 0.92 0.92 0.92 0.92 0.92 0.92 0.92 0.92 0.92 0.92
Hourly flow rate (vph) 0 465 32 0 34 0 0 275 0 0
Pedestrians
Lane Width (ft)
Walking Speed (ft/s)
Percent Blockage
Right turn flare (veh)
Median type None None
Median storage veh)
Upstream signal (ft)
pX, platoon unblocked
vC, conflicting volume 34 497 530 34 774 499
vC1, stage 1 conf vol
vC2, stage 2 conf vol
vCu, unblocked vol 34 497 530 34 774 499
tC, single (s) 4.2 4.2 6.6 6.3 7.2 6.6
tC, 2 stage (s)
tF (s) 2.3 2.3 4.1 3.4 3.6 4.1
p0 queue free % 100 100 100 73 100 100
cM capacity (veh/h) 1540 1037 446 1023 225 465
Direction, Lane # NB 1 NB 2 SB 1 SE 1
Volume Total 465 32 34 275
Volume Left 0 0 0 0
Volume Right 0 32 0 275
cSH 1700 1700 1700 1023
Volume to Capacity 0.27 0.02 0.02 0.27
Queue Length 95th (ft) 0 0 0 27
Control Delay (s) 0.0 0.0 0.0 9.8
Lane LOS A
Approach Delay (s) 0.0 0.0 9.8
Approach LOS A
Intersection Summary
Average Delay 3.3
Intersection Capacity Utilization 25.9% ICU Level of Service A
Analysis Period (min) 15

HCM Unsignalized Intersection Capacity Analysis
3: Sahuarita Rd. & AZ-83 Page 1
Operations Year 20, 50% Carpool, Peak Season, Weekday, AM Synchro 7 Report
Tetra Tech ISG 2/5/2010
Movement EBL EBR NBL NBT SBT SBR
Lane Configurations
Volume (veh/h) 64 30 7 288 220 41
Sign Control Yield Free Free
Grade 0% 0% 0%
Peak Hour Factor 0.92 0.92 0.92 0.92 0.92 0.92
Hourly flow rate (vph) 70 33 8 313 239 45
Pedestrians
Lane Width (ft)
Walking Speed (ft/s)
Percent Blockage
Right turn flare (veh)
Median type None None
Median storage veh)
Upstream signal (ft)
pX, platoon unblocked
vC, conflicting volume 590 261 284
vC1, stage 1 conf vol
vC2, stage 2 conf vol
vCu, unblocked vol 590 261 284
tC, single (s) 6.5 6.3 4.2
tC, 2 stage (s)
tF (s) 3.6 3.4 2.3
p0 queue free % 85 96 99
cM capacity (veh/h) 458 763 1245
Direction, Lane # EB 1 NB 1 SB 1
Volume Total 102 321 284
Volume Left 70 8 0
Volume Right 33 0 45
cSH 525 1245 1700
Volume to Capacity 0.19 0.01 0.17
Queue Length 95th (ft) 18 0 0
Control Delay (s) 13.5 0.2 0.0
Lane LOS B A
Approach Delay (s) 13.5 0.2 0.0
Approach LOS B
Intersection Summary
Average Delay 2.1
Intersection Capacity Utilization 32.8% ICU Level of Service A
Analysis Period (min) 15

HCM Unsignalized Intersection Capacity Analysis
4: Hilton Ranch Rd. & AZ-83 Page 2
Operations Year 20, 50% Carpool, Peak Season, Weekday, AM Synchro 7 Report
Tetra Tech ISG 2/5/2010
Movement WBL WBR NBT NBR SBL SBT
Lane Configurations
Volume (veh/h) 0 0 153 0 7 242
Sign Control Yield Free Free
Grade 0% 0% 0%
Peak Hour Factor 0.92 0.92 0.92 0.92 0.92 0.92
Hourly flow rate (vph) 0 0 166 0 8 263
Pedestrians
Lane Width (ft)
Walking Speed (ft/s)
Percent Blockage
Right turn flare (veh)
Median type None None
Median storage veh)
Upstream signal (ft)
pX, platoon unblocked
vC, conflicting volume 445 166 166
vC1, stage 1 conf vol
vC2, stage 2 conf vol
vCu, unblocked vol 445 166 166
tC, single (s) 6.5 6.3 4.2
tC, 2 stage (s)
tF (s) 3.6 3.4 2.3
p0 queue free % 100 100 99
cM capacity (veh/h) 557 863 1376
Direction, Lane # WB 1 NB 1 SB 1
Volume Total 0 166 271
Volume Left 0 0 8
Volume Right 0 0 0
cSH 1700 1700 1376
Volume to Capacity 0.00 0.10 0.01
Queue Length 95th (ft) 0 0 0
Control Delay (s) 0.0 0.0 0.3
Lane LOS A A
Approach Delay (s) 0.0 0.0 0.3
Approach LOS A
Intersection Summary
Average Delay 0.2
Intersection Capacity Utilization 21.7% ICU Level of Service A
Analysis Period (min) 15

HCM Unsignalized Intersection Capacity Analysis
5: Hidden Valley Rd. & AZ-83 Page 3
Operations Year 20, 50% Carpool, Peak Season, Weekday, AM Synchro 7 Report
Tetra Tech ISG 2/5/2010
Movement EBL EBR NBL NBT SBT SBR
Lane Configurations
Volume (veh/h) 71 27 48 116 75 149
Sign Control Yield Free Free
Grade 0% 0% 0%
Peak Hour Factor 0.92 0.92 0.92 0.92 0.92 0.92
Hourly flow rate (vph) 77 29 52 126 82 162
Pedestrians
Lane Width (ft)
Walking Speed (ft/s)
Percent Blockage
Right turn flare (veh)
Median type None None
Median storage veh)
Upstream signal (ft)
pX, platoon unblocked
vC, conflicting volume 393 162 243
vC1, stage 1 conf vol
vC2, stage 2 conf vol
vCu, unblocked vol 393 162 243
tC, single (s) 6.5 6.3 4.2
tC, 2 stage (s)
tF (s) 3.6 3.4 2.3
p0 queue free % 87 97 96
cM capacity (veh/h) 576 867 1288
Direction, Lane # EB 1 NB 1 SB 1
Volume Total 107 178 243
Volume Left 77 52 0
Volume Right 29 0 162
cSH 634 1288 1700
Volume to Capacity 0.17 0.04 0.14
Queue Length 95th (ft) 15 3 0
Control Delay (s) 11.8 2.6 0.0
Lane LOS B A
Approach Delay (s) 11.8 2.6 0.0
Approach LOS B
Intersection Summary
Average Delay 3.2
Intersection Capacity Utilization 37.4% ICU Level of Service A
Analysis Period (min) 15

HCM Unsignalized Intersection Capacity Analysis
6: Rosemont Junction & AZ-83 Page 4
Operations Year 20, 50% Carpool, Peak Season, Weekday, AM Synchro 7 Report
Tetra Tech ISG 2/5/2010
Movement EBL EBR NBL NBT SBT SBR
Lane Configurations
Volume (veh/h) 4 4 4 198 128 0
Sign Control Yield Free Free
Grade 0% 0% 0%
Peak Hour Factor 0.92 0.92 0.92 0.92 0.92 0.92
Hourly flow rate (vph) 4 4 4 215 139 0
Pedestrians
Lane Width (ft)
Walking Speed (ft/s)
Percent Blockage
Right turn flare (veh)
Median type None None
Median storage veh)
Upstream signal (ft)
pX, platoon unblocked
vC, conflicting volume 363 139 139
vC1, stage 1 conf vol
vC2, stage 2 conf vol
vCu, unblocked vol 363 139 139
tC, single (s) 6.5 6.3 4.2
tC, 2 stage (s)
tF (s) 3.6 3.4 2.3
p0 queue free % 99 100 100
cM capacity (veh/h) 622 893 1408
Direction, Lane # EB 1 NB 1 SB 1
Volume Total 9 220 139
Volume Left 4 4 0
Volume Right 4 0 0
cSH 734 1408 1700
Volume to Capacity 0.01 0.00 0.08
Queue Length 95th (ft) 1 0 0
Control Delay (s) 10.0 0.2 0.0
Lane LOS A A
Approach Delay (s) 10.0 0.2 0.0
Approach LOS A
Intersection Summary
Average Delay 0.3
Intersection Capacity Utilization 23.6% ICU Level of Service A
Analysis Period (min) 15
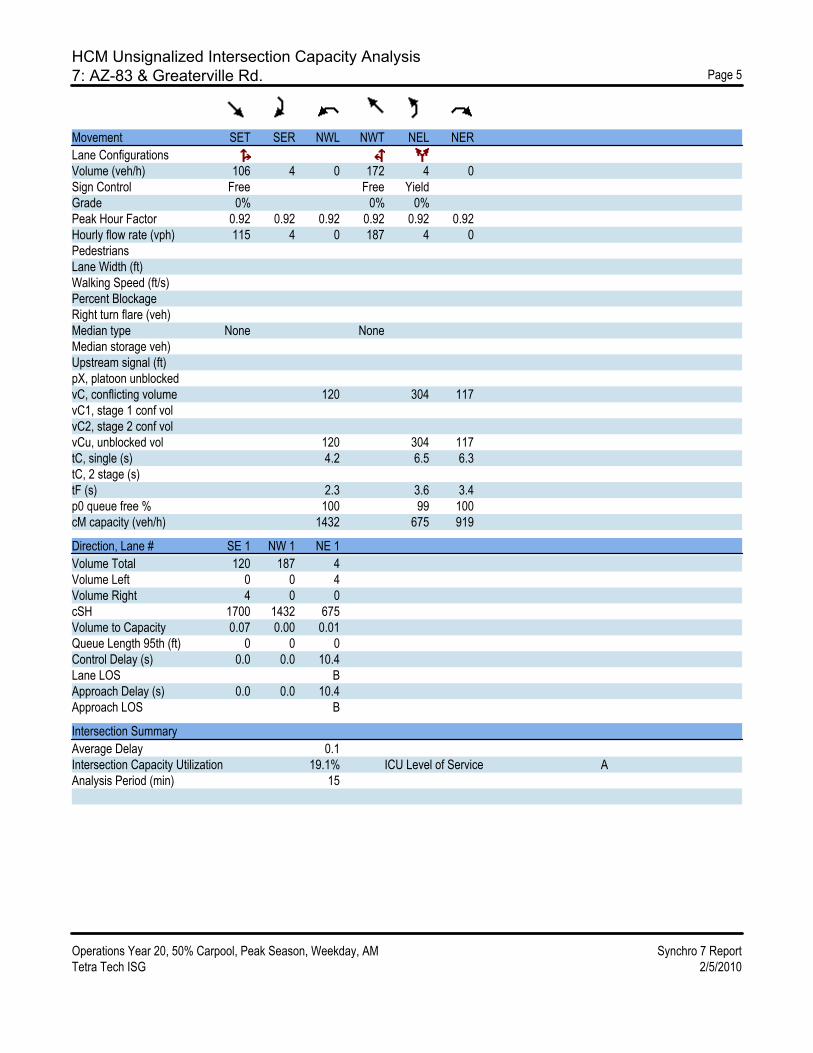
HCM Unsignalized Intersection Capacity Analysis
7: AZ-83 & Greaterville Rd. Page 5
Operations Year 20, 50% Carpool, Peak Season, Weekday, AM Synchro 7 Report
Tetra Tech ISG 2/5/2010
Movement SET SER NWL NWT NEL NER
Lane Configurations
Volume (veh/h) 106 4 0 172 4 0
Sign Control Free Free Yield
Grade 0% 0% 0%
Peak Hour Factor 0.92 0.92 0.92 0.92 0.92 0.92
Hourly flow rate (vph) 115 4 0 187 4 0
Pedestrians
Lane Width (ft)
Walking Speed (ft/s)
Percent Blockage
Right turn flare (veh)
Median type None None
Median storage veh)
Upstream signal (ft)
pX, platoon unblocked
vC, conflicting volume 120 304 117
vC1, stage 1 conf vol
vC2, stage 2 conf vol
vCu, unblocked vol 120 304 117
tC, single (s) 4.2 6.5 6.3
tC, 2 stage (s)
tF (s) 2.3 3.6 3.4
p0 queue free % 100 99 100
cM capacity (veh/h) 1432 675 919
Direction, Lane # SE 1 NW 1 NE 1
Volume Total 120 187 4
Volume Left 0 0 4
Volume Right 4 0 0
cSH 1700 1432 675
Volume to Capacity 0.07 0.00 0.01
Queue Length 95th (ft) 0 0 0
Control Delay (s) 0.0 0.0 10.4
Lane LOS B
Approach Delay (s) 0.0 0.0 10.4
Approach LOS B
Intersection Summary
Average Delay 0.1
Intersection Capacity Utilization 19.1% ICU Level of Service A
Analysis Period (min) 15

HCM Unsignalized Intersection Capacity Analysis
1: I-10 WB On-Off Ramp & AZ-83 Page 1
Operations Year 20, 50% Carpool, Peak Season, Weekday, PM Synchro 7 Report
Tetra Tech ISG 2/5/2010
Movement EBL EBT WBT WBR SBL SBR
Lane Configurations
Volume (veh/h) 19 95 268 6 17 13
Sign Control Free Free Yield
Grade 0% 0% 0%
Peak Hour Factor 0.92 0.92 0.92 0.92 0.92 0.92
Hourly flow rate (vph) 21 103 291 7 18 14
Pedestrians
Lane Width (ft)
Walking Speed (ft/s)
Percent Blockage
Right turn flare (veh)
Median type None None
Median storage veh)
Upstream signal (ft)
pX, platoon unblocked
vC, conflicting volume 298 439 295
vC1, stage 1 conf vol
vC2, stage 2 conf vol
vCu, unblocked vol 298 439 295
tC, single (s) 4.2 6.5 6.3
tC, 2 stage (s)
tF (s) 2.3 3.6 3.4
p0 queue free % 98 97 98
cM capacity (veh/h) 1230 555 731
Direction, Lane # EB 1 WB 1 SB 1
Volume Total 124 298 33
Volume Left 21 0 18
Volume Right 0 7 14
cSH 1230 1700 619
Volume to Capacity 0.02 0.18 0.05
Queue Length 95th (ft) 1 0 4
Control Delay (s) 1.4 0.0 11.1
Lane LOS A B
Approach Delay (s) 1.4 0.0 11.1
Approach LOS B
Intersection Summary
Average Delay 1.2
Intersection Capacity Utilization 31.2% ICU Level of Service A
Analysis Period (min) 15

HCM Unsignalized Intersection Capacity Analysis
2: AZ-83 & EB Off-Ramp Page 2
Operations Year 20, 50% Carpool, Peak Season, Weekday, PM Synchro 7 Report
Tetra Tech ISG 2/5/2010
Movement NBL NBT NBR SBL SBT SBR SEL SER SWL SWR
Lane Configurations
Volume (veh/h) 0 338 53 0 88 0 0 159 0 0
Sign Control Free Free Yield Yield
Grade 0% 0% 0% 0%
Peak Hour Factor 0.92 0.92 0.92 0.92 0.92 0.92 0.92 0.92 0.92 0.92
Hourly flow rate (vph) 0 367 58 0 96 0 0 173 0 0
Pedestrians
Lane Width (ft)
Walking Speed (ft/s)
Percent Blockage
Right turn flare (veh)
Median type None None
Median storage veh)
Upstream signal (ft)
pX, platoon unblocked
vC, conflicting volume 96 425 521 96 636 463
vC1, stage 1 conf vol
vC2, stage 2 conf vol
vCu, unblocked vol 96 425 521 96 636 463
tC, single (s) 4.2 4.2 6.6 6.3 7.2 6.6
tC, 2 stage (s)
tF (s) 2.3 2.3 4.1 3.4 3.6 4.1
p0 queue free % 100 100 100 82 100 100
cM capacity (veh/h) 1461 1103 452 945 312 487
Direction, Lane # NB 1 NB 2 SB 1 SE 1
Volume Total 367 58 96 173
Volume Left 0 0 0 0
Volume Right 0 58 0 173
cSH 1700 1700 1700 945
Volume to Capacity 0.22 0.03 0.06 0.18
Queue Length 95th (ft) 0 0 0 17
Control Delay (s) 0.0 0.0 0.0 9.7
Lane LOS A
Approach Delay (s) 0.0 0.0 9.7
Approach LOS A
Intersection Summary
Average Delay 2.4
Intersection Capacity Utilization 21.1% ICU Level of Service A
Analysis Period (min) 15

HCM Unsignalized Intersection Capacity Analysis
3: Sahuarita Rd. & AZ-83 Page 1
Operations Year 20, 50% Carpool, Peak Season, Weekday, PM Synchro 7 Report
Tetra Tech ISG 2/5/2010
Movement EBL EBR NBL NBT SBT SBR
Lane Configurations
Volume (veh/h) 34 22 52 302 314 75
Sign Control Yield Free Free
Grade 0% 0% 0%
Peak Hour Factor 0.92 0.92 0.92 0.92 0.92 0.92
Hourly flow rate (vph) 37 24 57 328 341 82
Pedestrians
Lane Width (ft)
Walking Speed (ft/s)
Percent Blockage
Right turn flare (veh)
Median type None None
Median storage veh)
Upstream signal (ft)
pX, platoon unblocked
vC, conflicting volume 823 382 423
vC1, stage 1 conf vol
vC2, stage 2 conf vol
vCu, unblocked vol 823 382 423
tC, single (s) 6.5 6.3 4.2
tC, 2 stage (s)
tF (s) 3.6 3.4 2.3
p0 queue free % 88 96 95
cM capacity (veh/h) 318 652 1105
Direction, Lane # EB 1 NB 1 SB 1
Volume Total 61 385 423
Volume Left 37 57 0
Volume Right 24 0 82
cSH 398 1105 1700
Volume to Capacity 0.15 0.05 0.25
Queue Length 95th (ft) 13 4 0
Control Delay (s) 15.7 1.7 0.0
Lane LOS C A
Approach Delay (s) 15.7 1.7 0.0
Approach LOS C
Intersection Summary
Average Delay 1.8
Intersection Capacity Utilization 53.2% ICU Level of Service A
Analysis Period (min) 15

HCM Unsignalized Intersection Capacity Analysis
4: Hilton Ranch Rd. & AZ-83 Page 2
Operations Year 20, 50% Carpool, Peak Season, Weekday, PM Synchro 7 Report
Tetra Tech ISG 2/5/2010
Movement WBL WBR NBT NBR SBL SBT
Lane Configurations
Volume (veh/h) 0 0 339 4 30 213
Sign Control Yield Free Free
Grade 0% 0% 0%
Peak Hour Factor 0.92 0.92 0.92 0.92 0.92 0.92
Hourly flow rate (vph) 0 0 368 4 33 232
Pedestrians
Lane Width (ft)
Walking Speed (ft/s)
Percent Blockage
Right turn flare (veh)
Median type None None
Median storage veh)
Upstream signal (ft)
pX, platoon unblocked
vC, conflicting volume 667 371 373
vC1, stage 1 conf vol
vC2, stage 2 conf vol
vCu, unblocked vol 667 371 373
tC, single (s) 6.5 6.3 4.2
tC, 2 stage (s)
tF (s) 3.6 3.4 2.3
p0 queue free % 100 100 97
cM capacity (veh/h) 403 662 1153
Direction, Lane # WB 1 NB 1 SB 1
Volume Total 0 373 264
Volume Left 0 0 33
Volume Right 0 4 0
cSH 1700 1700 1153
Volume to Capacity 0.00 0.22 0.03
Queue Length 95th (ft) 0 0 2
Control Delay (s) 0.0 0.0 1.2
Lane LOS A A
Approach Delay (s) 0.0 0.0 1.2
Approach LOS A
Intersection Summary
Average Delay 0.5
Intersection Capacity Utilization 37.6% ICU Level of Service A
Analysis Period (min) 15

HCM Unsignalized Intersection Capacity Analysis
5: Hidden Valley Rd. & AZ-83 Page 3
Operations Year 20, 50% Carpool, Peak Season, Weekday, PM Synchro 7 Report
Tetra Tech ISG 2/5/2010
Movement EBL EBR NBL NBT SBT SBR
Lane Configurations
Volume (veh/h) 149 52 24 172 183 71
Sign Control Yield Free Free
Grade 0% 0% 0%
Peak Hour Factor 0.92 0.92 0.92 0.92 0.92 0.92
Hourly flow rate (vph) 162 57 26 187 199 77
Pedestrians
Lane Width (ft)
Walking Speed (ft/s)
Percent Blockage
Right turn flare (veh)
Median type None None
Median storage veh)
Upstream signal (ft)
pX, platoon unblocked
vC, conflicting volume 477 238 276
vC1, stage 1 conf vol
vC2, stage 2 conf vol
vCu, unblocked vol 477 238 276
tC, single (s) 6.5 6.3 4.2
tC, 2 stage (s)
tF (s) 3.6 3.4 2.3
p0 queue free % 69 93 98
cM capacity (veh/h) 525 787 1253
Direction, Lane # EB 1 NB 1 SB 1
Volume Total 218 213 276
Volume Left 162 26 0
Volume Right 57 0 77
cSH 575 1253 1700
Volume to Capacity 0.38 0.02 0.16
Queue Length 95th (ft) 44 2 0
Control Delay (s) 15.1 1.1 0.0
Lane LOS C A
Approach Delay (s) 15.1 1.1 0.0
Approach LOS C
Intersection Summary
Average Delay 5.0
Intersection Capacity Utilization 45.8% ICU Level of Service A
Analysis Period (min) 15

HCM Unsignalized Intersection Capacity Analysis
6: Rosemont Junction & AZ-83 Page 4
Operations Year 20, 50% Carpool, Peak Season, Weekday, PM Synchro 7 Report
Tetra Tech ISG 2/5/2010
Movement EBL EBR NBL NBT SBT SBR
Lane Configurations
Volume (veh/h) 0 0 0 188 280 0
Sign Control Yield Free Free
Grade 0% 0% 0%
Peak Hour Factor 0.92 0.92 0.92 0.92 0.92 0.92
Hourly flow rate (vph) 0 0 0 204 304 0
Pedestrians
Lane Width (ft)
Walking Speed (ft/s)
Percent Blockage
Right turn flare (veh)
Median type None None
Median storage veh)
Upstream signal (ft)
pX, platoon unblocked
vC, conflicting volume 509 304 304
vC1, stage 1 conf vol
vC2, stage 2 conf vol
vCu, unblocked vol 509 304 304
tC, single (s) 6.5 6.3 4.2
tC, 2 stage (s)
tF (s) 3.6 3.4 2.3
p0 queue free % 100 100 100
cM capacity (veh/h) 514 722 1223
Direction, Lane # EB 1 NB 1 SB 1
Volume Total 0 204 304
Volume Left 0 0 0
Volume Right 0 0 0
cSH 1700 1223 1700
Volume to Capacity 0.00 0.00 0.18
Queue Length 95th (ft) 0 0 0
Control Delay (s) 0.0 0.0 0.0
Lane LOS A
Approach Delay (s) 0.0 0.0 0.0
Approach LOS A
Intersection Summary
Average Delay 0.0
Intersection Capacity Utilization 18.1% ICU Level of Service A
Analysis Period (min) 15

HCM Unsignalized Intersection Capacity Analysis
7: AZ-83 & Greaterville Rd. Page 5
Operations Year 20, 50% Carpool, Peak Season, Weekday, PM Synchro 7 Report
Tetra Tech ISG 2/5/2010
Movement SET SER NWL NWT NEL NER
Lane Configurations
Volume (veh/h) 243 4 7 128 4 0
Sign Control Free Free Yield
Grade 0% 0% 0%
Peak Hour Factor 0.92 0.92 0.92 0.92 0.92 0.92
Hourly flow rate (vph) 264 4 8 139 4 0
Pedestrians
Lane Width (ft)
Walking Speed (ft/s)
Percent Blockage
Right turn flare (veh)
Median type None None
Median storage veh)
Upstream signal (ft)
pX, platoon unblocked
vC, conflicting volume 268 421 266
vC1, stage 1 conf vol
vC2, stage 2 conf vol
vCu, unblocked vol 268 421 266
tC, single (s) 4.2 6.5 6.3
tC, 2 stage (s)
tF (s) 2.3 3.6 3.4
p0 queue free % 99 99 100
cM capacity (veh/h) 1261 575 758
Direction, Lane # SE 1 NW 1 NE 1
Volume Total 268 147 4
Volume Left 0 8 4
Volume Right 4 0 0
cSH 1700 1261 575
Volume to Capacity 0.16 0.01 0.01
Queue Length 95th (ft) 0 0 1
Control Delay (s) 0.0 0.5 11.3
Lane LOS A B
Approach Delay (s) 0.0 0.5 11.3
Approach LOS B
Intersection Summary
Average Delay 0.3
Intersection Capacity Utilization 23.0% ICU Level of Service A
Analysis Period (min) 15

HCM Unsignalized Intersection Capacity Analysis
1: I-10 WB On-Off Ramp & AZ-83 Page 1
Operations Year 20, 50% Carpool, Peak Season, Weekend, AM Synchro 7 Report
Tetra Tech ISG 2/5/2010
Movement EBL EBT WBT WBR SBL SBR
Lane Configurations
Volume (veh/h) 13 32 431 6 17 45
Sign Control Free Free Yield
Grade 0% 0% 0%
Peak Hour Factor 0.92 0.92 0.92 0.92 0.92 0.92
Hourly flow rate (vph) 14 35 468 7 18 49
Pedestrians
Lane Width (ft)
Walking Speed (ft/s)
Percent Blockage
Right turn flare (veh)
Median type None None
Median storage veh)
Upstream signal (ft)
pX, platoon unblocked
vC, conflicting volume 475 535 472
vC1, stage 1 conf vol
vC2, stage 2 conf vol
vCu, unblocked vol 475 535 472
tC, single (s) 4.2 6.5 6.3
tC, 2 stage (s)
tF (s) 2.3 3.6 3.4
p0 queue free % 99 96 92
cM capacity (veh/h) 1056 489 580
Direction, Lane # EB 1 WB 1 SB 1
Volume Total 49 475 67
Volume Left 14 0 18
Volume Right 0 7 49
cSH 1056 1700 552
Volume to Capacity 0.01 0.28 0.12
Queue Length 95th (ft) 1 0 10
Control Delay (s) 2.5 0.0 12.4
Lane LOS A B
Approach Delay (s) 2.5 0.0 12.4
Approach LOS B
Intersection Summary
Average Delay 1.6
Intersection Capacity Utilization 33.4% ICU Level of Service A
Analysis Period (min) 15

HCM Unsignalized Intersection Capacity Analysis
2: AZ-83 & EB Off-Ramp Page 2
Operations Year 20, 50% Carpool, Peak Season, Weekend, AM Synchro 7 Report
Tetra Tech ISG 2/5/2010
Movement NBL NBT NBR SBL SBT SBR SEL SER SWL SWR
Lane Configurations
Volume (veh/h) 0 380 50 0 28 0 0 203 0 0
Sign Control Free Free Yield Yield
Grade 0% 0% 0% 0%
Peak Hour Factor 0.92 0.92 0.92 0.92 0.92 0.92 0.92 0.92 0.92 0.92
Hourly flow rate (vph) 0 413 54 0 30 0 0 221 0 0
Pedestrians
Lane Width (ft)
Walking Speed (ft/s)
Percent Blockage
Right turn flare (veh)
Median type None None
Median storage veh)
Upstream signal (ft)
pX, platoon unblocked
vC, conflicting volume 30 467 498 30 664 443
vC1, stage 1 conf vol
vC2, stage 2 conf vol
vCu, unblocked vol 30 467 498 30 664 443
tC, single (s) 4.2 4.2 6.6 6.3 7.2 6.6
tC, 2 stage (s)
tF (s) 2.3 2.3 4.1 3.4 3.6 4.1
p0 queue free % 100 100 100 79 100 100
cM capacity (veh/h) 1544 1063 465 1027 287 500
Direction, Lane # NB 1 NB 2 SB 1 SE 1
Volume Total 413 54 30 221
Volume Left 0 0 0 0
Volume Right 0 54 0 221
cSH 1700 1700 1700 1027
Volume to Capacity 0.24 0.03 0.02 0.21
Queue Length 95th (ft) 0 0 0 20
Control Delay (s) 0.0 0.0 0.0 9.5
Lane LOS A
Approach Delay (s) 0.0 0.0 9.5
Approach LOS A
Intersection Summary
Average Delay 2.9
Intersection Capacity Utilization 23.3% ICU Level of Service A
Analysis Period (min) 15

HCM Unsignalized Intersection Capacity Analysis
3: Sahuarita Rd. & AZ-83 Page 1
Operations Year 20, 50% Carpool, Peak Season, Weekend, AM Synchro 7 Report
Tetra Tech ISG 2/5/2010
Movement EBL EBR NBL NBT SBT SBR
Lane Configurations
Volume (veh/h) 60 26 22 269 193 26
Sign Control Yield Free Free
Grade 0% 0% 0%
Peak Hour Factor 0.92 0.92 0.92 0.92 0.92 0.92
Hourly flow rate (vph) 65 28 24 292 210 28
Pedestrians
Lane Width (ft)
Walking Speed (ft/s)
Percent Blockage
Right turn flare (veh)
Median type None None
Median storage veh)
Upstream signal (ft)
pX, platoon unblocked
vC, conflicting volume 564 224 238
vC1, stage 1 conf vol
vC2, stage 2 conf vol
vCu, unblocked vol 564 224 238
tC, single (s) 6.5 6.3 4.2
tC, 2 stage (s)
tF (s) 3.6 3.4 2.3
p0 queue free % 86 96 98
cM capacity (veh/h) 468 801 1294
Direction, Lane # EB 1 NB 1 SB 1
Volume Total 93 316 238
Volume Left 65 24 0
Volume Right 28 0 28
cSH 535 1294 1700
Volume to Capacity 0.17 0.02 0.14
Queue Length 95th (ft) 16 1 0
Control Delay (s) 13.1 0.8 0.0
Lane LOS B A
Approach Delay (s) 13.1 0.8 0.0
Approach LOS B
Intersection Summary
Average Delay 2.3
Intersection Capacity Utilization 42.0% ICU Level of Service A
Analysis Period (min) 15

HCM Unsignalized Intersection Capacity Analysis
4: Hilton Ranch Rd. & AZ-83 Page 2
Operations Year 20, 50% Carpool, Peak Season, Weekend, AM Synchro 7 Report
Tetra Tech ISG 2/5/2010
Movement WBL WBR NBT NBR SBL SBT
Lane Configurations
Volume (veh/h) 0 0 176 0 4 227
Sign Control Yield Free Free
Grade 0% 0% 0%
Peak Hour Factor 0.92 0.92 0.92 0.92 0.92 0.92
Hourly flow rate (vph) 0 0 191 0 4 247
Pedestrians
Lane Width (ft)
Walking Speed (ft/s)
Percent Blockage
Right turn flare (veh)
Median type None None
Median storage veh)
Upstream signal (ft)
pX, platoon unblocked
vC, conflicting volume 447 191 191
vC1, stage 1 conf vol
vC2, stage 2 conf vol
vCu, unblocked vol 447 191 191
tC, single (s) 6.5 6.3 4.2
tC, 2 stage (s)
tF (s) 3.6 3.4 2.3
p0 queue free % 100 100 100
cM capacity (veh/h) 556 835 1347
Direction, Lane # WB 1 NB 1 SB 1
Volume Total 0 191 251
Volume Left 0 0 4
Volume Right 0 0 0
cSH 1700 1700 1347
Volume to Capacity 0.00 0.11 0.00
Queue Length 95th (ft) 0 0 0
Control Delay (s) 0.0 0.0 0.2
Lane LOS A A
Approach Delay (s) 0.0 0.0 0.2
Approach LOS A
Intersection Summary
Average Delay 0.1
Intersection Capacity Utilization 18.5% ICU Level of Service A
Analysis Period (min) 15

HCM Unsignalized Intersection Capacity Analysis
5: Hidden Valley Rd. & AZ-83 Page 3
Operations Year 20, 50% Carpool, Peak Season, Weekend, AM Synchro 7 Report
Tetra Tech ISG 2/5/2010
Movement EBL EBR NBL NBT SBT SBR
Lane Configurations
Volume (veh/h) 71 24 32 120 75 100
Sign Control Yield Free Free
Grade 0% 0% 0%
Peak Hour Factor 0.92 0.92 0.92 0.92 0.92 0.92
Hourly flow rate (vph) 77 26 35 130 82 109
Pedestrians
Lane Width (ft)
Walking Speed (ft/s)
Percent Blockage
Right turn flare (veh)
Median type None None
Median storage veh)
Upstream signal (ft)
pX, platoon unblocked
vC, conflicting volume 336 136 190
vC1, stage 1 conf vol
vC2, stage 2 conf vol
vCu, unblocked vol 336 136 190
tC, single (s) 6.5 6.3 4.2
tC, 2 stage (s)
tF (s) 3.6 3.4 2.3
p0 queue free % 88 97 97
cM capacity (veh/h) 631 897 1348
Direction, Lane # EB 1 NB 1 SB 1
Volume Total 103 165 190
Volume Left 77 35 0
Volume Right 26 0 109
cSH 682 1348 1700
Volume to Capacity 0.15 0.03 0.11
Queue Length 95th (ft) 13 2 0
Control Delay (s) 11.2 1.8 0.0
Lane LOS B A
Approach Delay (s) 11.2 1.8 0.0
Approach LOS B
Intersection Summary
Average Delay 3.2
Intersection Capacity Utilization 33.6% ICU Level of Service A
Analysis Period (min) 15

HCM Unsignalized Intersection Capacity Analysis
6: Rosemont Junction & AZ-83 Page 4
Operations Year 20, 50% Carpool, Peak Season, Weekend, AM Synchro 7 Report
Tetra Tech ISG 2/5/2010
Movement EBL EBR NBL NBT SBT SBR
Lane Configurations
Volume (veh/h) 4 0 0 178 151 4
Sign Control Yield Free Free
Grade 0% 0% 0%
Peak Hour Factor 0.92 0.92 0.92 0.92 0.92 0.92
Hourly flow rate (vph) 4 0 0 193 164 4
Pedestrians
Lane Width (ft)
Walking Speed (ft/s)
Percent Blockage
Right turn flare (veh)
Median type None None
Median storage veh)
Upstream signal (ft)
pX, platoon unblocked
vC, conflicting volume 360 166 168
vC1, stage 1 conf vol
vC2, stage 2 conf vol
vCu, unblocked vol 360 166 168
tC, single (s) 6.5 6.3 4.2
tC, 2 stage (s)
tF (s) 3.6 3.4 2.3
p0 queue free % 99 100 100
cM capacity (veh/h) 627 863 1373
Direction, Lane # EB 1 NB 1 SB 1
Volume Total 4 193 168
Volume Left 4 0 0
Volume Right 0 0 4
cSH 627 1373 1700
Volume to Capacity 0.01 0.00 0.10
Queue Length 95th (ft) 1 0 0
Control Delay (s) 10.8 0.0 0.0
Lane LOS B
Approach Delay (s) 10.8 0.0 0.0
Approach LOS B
Intersection Summary
Average Delay 0.1
Intersection Capacity Utilization 19.4% ICU Level of Service A
Analysis Period (min) 15

HCM Unsignalized Intersection Capacity Analysis
7: AZ-83 & Greaterville Rd. Page 5
Operations Year 20, 50% Carpool, Peak Season, Weekend, AM Synchro 7 Report
Tetra Tech ISG 2/5/2010
Movement SET SER NWL NWT NEL NER
Lane Configurations
Volume (veh/h) 110 0 0 152 0 0
Sign Control Free Free Yield
Grade 0% 0% 0%
Peak Hour Factor 0.92 0.92 0.92 0.92 0.92 0.92
Hourly flow rate (vph) 120 0 0 165 0 0
Pedestrians
Lane Width (ft)
Walking Speed (ft/s)
Percent Blockage
Right turn flare (veh)
Median type None None
Median storage veh)
Upstream signal (ft)
pX, platoon unblocked
vC, conflicting volume 120 285 120
vC1, stage 1 conf vol
vC2, stage 2 conf vol
vCu, unblocked vol 120 285 120
tC, single (s) 4.2 6.5 6.3
tC, 2 stage (s)
tF (s) 2.3 3.6 3.4
p0 queue free % 100 100 100
cM capacity (veh/h) 1432 693 916
Direction, Lane # SE 1 NW 1 NE 1
Volume Total 120 165 0
Volume Left 0 0 0
Volume Right 0 0 0
cSH 1700 1432 1700
Volume to Capacity 0.07 0.00 0.00
Queue Length 95th (ft) 0 0 0
Control Delay (s) 0.0 0.0 0.0
Lane LOS A
Approach Delay (s) 0.0 0.0 0.0
Approach LOS A
Intersection Summary
Average Delay 0.0
Intersection Capacity Utilization 11.3% ICU Level of Service A
Analysis Period (min) 15

HCM Unsignalized Intersection Capacity Analysis
1: I-10 WB On-Off Ramp & AZ-83 Page 1
Operations Year 20, 50% Carpool, Peak Season, Weekend, PM Synchro 7 Report
Tetra Tech ISG 2/5/2010
Movement EBL EBT WBT WBR SBL SBR
Lane Configurations
Volume (veh/h) 36 84 327 9 11 13
Sign Control Free Free Yield
Grade 0% 0% 0%
Peak Hour Factor 0.92 0.92 0.92 0.92 0.92 0.92
Hourly flow rate (vph) 39 91 355 10 12 14
Pedestrians
Lane Width (ft)
Walking Speed (ft/s)
Percent Blockage
Right turn flare (veh)
Median type None None
Median storage veh)
Upstream signal (ft)
pX, platoon unblocked
vC, conflicting volume 365 530 360
vC1, stage 1 conf vol
vC2, stage 2 conf vol
vCu, unblocked vol 365 530 360
tC, single (s) 4.2 6.5 6.3
tC, 2 stage (s)
tF (s) 2.3 3.6 3.4
p0 queue free % 97 98 98
cM capacity (veh/h) 1161 482 671
Direction, Lane # EB 1 WB 1 SB 1
Volume Total 130 365 26
Volume Left 39 0 12
Volume Right 0 10 14
cSH 1161 1700 569
Volume to Capacity 0.03 0.21 0.05
Queue Length 95th (ft) 3 0 4
Control Delay (s) 2.7 0.0 11.6
Lane LOS A B
Approach Delay (s) 2.7 0.0 11.6
Approach LOS B
Intersection Summary
Average Delay 1.2
Intersection Capacity Utilization 37.5% ICU Level of Service A
Analysis Period (min) 15

HCM Unsignalized Intersection Capacity Analysis
2: AZ-83 & EB Off-Ramp Page 2
Operations Year 20, 50% Carpool, Peak Season, Weekend, PM Synchro 7 Report
Tetra Tech ISG 2/5/2010
Movement NBL NBT NBR SBL SBT SBR SEL SER SWL SWR
Lane Configurations
Volume (veh/h) 0 330 58 0 95 0 0 413 0 0
Sign Control Free Free Yield Yield
Grade 0% 0% 0% 0%
Peak Hour Factor 0.92 0.92 0.92 0.92 0.92 0.92 0.92 0.92 0.92 0.92
Hourly flow rate (vph) 0 359 63 0 103 0 0 449 0 0
Pedestrians
Lane Width (ft)
Walking Speed (ft/s)
Percent Blockage
Right turn flare (veh)
Median type None None
Median storage veh)
Upstream signal (ft)
pX, platoon unblocked
vC, conflicting volume 103 422 525 103 911 462
vC1, stage 1 conf vol
vC2, stage 2 conf vol
vCu, unblocked vol 103 422 525 103 911 462
tC, single (s) 4.2 4.2 6.6 6.3 7.2 6.6
tC, 2 stage (s)
tF (s) 2.3 2.3 4.1 3.4 3.6 4.1
p0 queue free % 100 100 100 52 100 100
cM capacity (veh/h) 1452 1106 449 935 129 488
Direction, Lane # NB 1 NB 2 SB 1 SE 1
Volume Total 359 63 103 449
Volume Left 0 0 0 0
Volume Right 0 63 0 449
cSH 1700 1700 1700 935
Volume to Capacity 0.21 0.04 0.06 0.48
Queue Length 95th (ft) 0 0 0 66
Control Delay (s) 0.0 0.0 0.0 12.3
Lane LOS B
Approach Delay (s) 0.0 0.0 12.3
Approach LOS B
Intersection Summary
Average Delay 5.7
Intersection Capacity Utilization 37.2% ICU Level of Service A
Analysis Period (min) 15

HCM Unsignalized Intersection Capacity Analysis
3: Sahuarita Rd. & AZ-83 Page 1
Operations Year 20, 50% Carpool, Peak Season, Weekend, PM Synchro 7 Report
Tetra Tech ISG 2/6/2010
Movement EBL EBR NBL NBT SBT SBR
Lane Configurations
Volume (veh/h) 79 22 34 235 236 150
Sign Control Yield Free Free
Grade 0% 0% 0%
Peak Hour Factor 0.92 0.92 0.92 0.92 0.92 0.92
Hourly flow rate (vph) 86 24 37 255 257 163
Pedestrians
Lane Width (ft)
Walking Speed (ft/s)
Percent Blockage
Right turn flare (veh)
Median type None None
Median storage veh)
Upstream signal (ft)
pX, platoon unblocked
vC, conflicting volume 667 338 420
vC1, stage 1 conf vol
vC2, stage 2 conf vol
vCu, unblocked vol 667 338 420
tC, single (s) 6.5 6.3 4.2
tC, 2 stage (s)
tF (s) 3.6 3.4 2.3
p0 queue free % 79 97 97
cM capacity (veh/h) 401 691 1108
Direction, Lane # EB 1 NB 1 SB 1
Volume Total 110 292 420
Volume Left 86 37 0
Volume Right 24 0 163
cSH 441 1108 1700
Volume to Capacity 0.25 0.03 0.25
Queue Length 95th (ft) 24 3 0
Control Delay (s) 15.8 1.3 0.0
Lane LOS C A
Approach Delay (s) 15.8 1.3 0.0
Approach LOS C
Intersection Summary
Average Delay 2.6
Intersection Capacity Utilization 51.5% ICU Level of Service A
Analysis Period (min) 15

HCM Unsignalized Intersection Capacity Analysis
4: Hilton Ranch Rd. & AZ-83 Page 2
Operations Year 20, 50% Carpool, Peak Season, Weekend, PM Synchro 7 Report
Tetra Tech ISG 2/6/2010
Movement WBL WBR NBT NBR SBL SBT
Lane Configurations
Volume (veh/h) 0 0 238 0 19 206
Sign Control Yield Free Free
Grade 0% 0% 0%
Peak Hour Factor 0.92 0.92 0.92 0.92 0.92 0.92
Hourly flow rate (vph) 0 0 259 0 21 224
Pedestrians
Lane Width (ft)
Walking Speed (ft/s)
Percent Blockage
Right turn flare (veh)
Median type None None
Median storage veh)
Upstream signal (ft)
pX, platoon unblocked
vC, conflicting volume 524 259 259
vC1, stage 1 conf vol
vC2, stage 2 conf vol
vCu, unblocked vol 524 259 259
tC, single (s) 6.5 6.3 4.2
tC, 2 stage (s)
tF (s) 3.6 3.4 2.3
p0 queue free % 100 100 98
cM capacity (veh/h) 495 766 1272
Direction, Lane # WB 1 NB 1 SB 1
Volume Total 0 259 245
Volume Left 0 0 21
Volume Right 0 0 0
cSH 1700 1700 1272
Volume to Capacity 0.00 0.15 0.02
Queue Length 95th (ft) 0 0 1
Control Delay (s) 0.0 0.0 0.8
Lane LOS A A
Approach Delay (s) 0.0 0.0 0.8
Approach LOS A
Intersection Summary
Average Delay 0.4
Intersection Capacity Utilization 29.9% ICU Level of Service A
Analysis Period (min) 15

HCM Unsignalized Intersection Capacity Analysis
5: Hidden Valley Rd. & AZ-83 Page 3
Operations Year 20, 50% Carpool, Peak Season, Weekend, PM Synchro 7 Report
Tetra Tech ISG 2/6/2010
Movement EBL EBR NBL NBT SBT SBR
Lane Configurations
Volume (veh/h) 100 36 31 142 224 71
Sign Control Yield Free Free
Grade 0% 0% 0%
Peak Hour Factor 0.92 0.92 0.92 0.92 0.92 0.92
Hourly flow rate (vph) 109 39 34 154 243 77
Pedestrians
Lane Width (ft)
Walking Speed (ft/s)
Percent Blockage
Right turn flare (veh)
Median type None None
Median storage veh)
Upstream signal (ft)
pX, platoon unblocked
vC, conflicting volume 504 282 321
vC1, stage 1 conf vol
vC2, stage 2 conf vol
vCu, unblocked vol 504 282 321
tC, single (s) 6.5 6.3 4.2
tC, 2 stage (s)
tF (s) 3.6 3.4 2.3
p0 queue free % 78 95 97
cM capacity (veh/h) 503 743 1206
Direction, Lane # EB 1 NB 1 SB 1
Volume Total 148 188 321
Volume Left 109 34 0
Volume Right 39 0 77
cSH 550 1206 1700
Volume to Capacity 0.27 0.03 0.19
Queue Length 95th (ft) 27 2 0
Control Delay (s) 13.9 1.6 0.0
Lane LOS B A
Approach Delay (s) 13.9 1.6 0.0
Approach LOS B
Intersection Summary
Average Delay 3.6
Intersection Capacity Utilization 43.0% ICU Level of Service A
Analysis Period (min) 15

HCM Unsignalized Intersection Capacity Analysis
6: Rosemont Junction & AZ-83 Page 4
Operations Year 20, 50% Carpool, Peak Season, Weekend, PM Synchro 7 Report
Tetra Tech ISG 2/6/2010
Movement EBL EBR NBL NBT SBT SBR
Lane Configurations
Volume (veh/h) 0 0 0 181 219 0
Sign Control Yield Free Free
Grade 0% 0% 0%
Peak Hour Factor 0.92 0.92 0.92 0.92 0.92 0.92
Hourly flow rate (vph) 0 0 0 197 238 0
Pedestrians
Lane Width (ft)
Walking Speed (ft/s)
Percent Blockage
Right turn flare (veh)
Median type None None
Median storage veh)
Upstream signal (ft)
pX, platoon unblocked
vC, conflicting volume 435 238 238
vC1, stage 1 conf vol
vC2, stage 2 conf vol
vCu, unblocked vol 435 238 238
tC, single (s) 6.5 6.3 4.2
tC, 2 stage (s)
tF (s) 3.6 3.4 2.3
p0 queue free % 100 100 100
cM capacity (veh/h) 567 786 1294
Direction, Lane # EB 1 NB 1 SB 1
Volume Total 0 197 238
Volume Left 0 0 0
Volume Right 0 0 0
cSH 1700 1294 1700
Volume to Capacity 0.00 0.00 0.14
Queue Length 95th (ft) 0 0 0
Control Delay (s) 0.0 0.0 0.0
Lane LOS A
Approach Delay (s) 0.0 0.0 0.0
Approach LOS A
Intersection Summary
Average Delay 0.0
Intersection Capacity Utilization 14.9% ICU Level of Service A
Analysis Period (min) 15

HCM Unsignalized Intersection Capacity Analysis
7: AZ-83 & Greaterville Rd. Page 5
Operations Year 20, 50% Carpool, Peak Season, Weekend, PM Synchro 7 Report
Tetra Tech ISG 2/6/2010
Movement SET SER NWL NWT NEL NER
Lane Configurations
Volume (veh/h) 182 0 11 188 7 11
Sign Control Free Free Yield
Grade 0% 0% 0%
Peak Hour Factor 0.92 0.92 0.92 0.92 0.92 0.92
Hourly flow rate (vph) 198 0 12 204 8 12
Pedestrians
Lane Width (ft)
Walking Speed (ft/s)
Percent Blockage
Right turn flare (veh)
Median type None None
Median storage veh)
Upstream signal (ft)
pX, platoon unblocked
vC, conflicting volume 198 426 198
vC1, stage 1 conf vol
vC2, stage 2 conf vol
vCu, unblocked vol 198 426 198
tC, single (s) 4.2 6.5 6.3
tC, 2 stage (s)
tF (s) 2.3 3.6 3.4
p0 queue free % 99 99 99
cM capacity (veh/h) 1340 569 828
Direction, Lane # SE 1 NW 1 NE 1
Volume Total 198 216 20
Volume Left 0 12 8
Volume Right 0 0 12
cSH 1700 1340 703
Volume to Capacity 0.12 0.01 0.03
Queue Length 95th (ft) 0 1 2
Control Delay (s) 0.0 0.5 10.3
Lane LOS A B
Approach Delay (s) 0.0 0.5 10.3
Approach LOS B
Intersection Summary
Average Delay 0.7
Intersection Capacity Utilization 28.9% ICU Level of Service A
Analysis Period (min) 15

NON - PEAK SEASON
SCENARIO 5
50% CARPOOL WITH NO COPPER CONCENTRATE
TRUCKS

HCM Unsignalized Intersection Capacity Analysis
1: I-10 WB On-Off Ramp & AZ-83 Page 1
Operations Year 20, 50% Carpool with no Copper Concentrate Trucks, Non-Peak Season, Weekday, AM Synchro 7 Report
Tetra Tech ISG 2/5/2010
Movement EBL EBT WBT WBR SBL SBR
Lane Configurations
Volume (veh/h) 9 47 704 4 13 49
Sign Control Free Free Yield
Grade 0% 0% 0%
Peak Hour Factor 0.92 0.92 0.92 0.92 0.92 0.92
Hourly flow rate (vph) 10 51 765 4 14 53
Pedestrians
Lane Width (ft)
Walking Speed (ft/s)
Percent Blockage
Right turn flare (veh)
Median type None None
Median storage veh)
Upstream signal (ft)
pX, platoon unblocked
vC, conflicting volume 770 838 767
vC1, stage 1 conf vol
vC2, stage 2 conf vol
vCu, unblocked vol 770 838 767
tC, single (s) 4.2 6.5 6.3
tC, 2 stage (s)
tF (s) 2.3 3.6 3.4
p0 queue free % 99 96 87
cM capacity (veh/h) 827 327 396
Direction, Lane # EB 1 WB 1 SB 1
Volume Total 61 770 67
Volume Left 10 0 14
Volume Right 0 4 53
cSH 827 1700 379
Volume to Capacity 0.01 0.45 0.18
Queue Length 95th (ft) 1 0 16
Control Delay (s) 1.6 0.0 16.5
Lane LOS A C
Approach Delay (s) 1.6 0.0 16.5
Approach LOS C
Intersection Summary
Average Delay 1.4
Intersection Capacity Utilization 47.7% ICU Level of Service A
Analysis Period (min) 15

HCM Unsignalized Intersection Capacity Analysis
2: AZ-83 & EB Off-Ramp Page 2
Operations Year 20, 50% Carpool with no Copper Concentrate Trucks, Non-Peak Season, Weekday, AM Synchro 7 Report
Tetra Tech ISG 2/5/2010
Movement NBL NBT NBR SBL SBT SBR SEL SER SWL SWR
Lane Configurations
Volume (veh/h) 0 417 58 0 37 0 0 247 0 0
Sign Control Free Free Yield Yield
Grade 0% 0% 0% 0%
Peak Hour Factor 0.92 0.92 0.92 0.92 0.92 0.92 0.92 0.92 0.92 0.92
Hourly flow rate (vph) 0 453 63 0 40 0 0 268 0 0
Pedestrians
Lane Width (ft)
Walking Speed (ft/s)
Percent Blockage
Right turn flare (veh)
Median type None None
Median storage veh)
Upstream signal (ft)
pX, platoon unblocked
vC, conflicting volume 40 516 557 40 762 493
vC1, stage 1 conf vol
vC2, stage 2 conf vol
vCu, unblocked vol 40 516 557 40 762 493
tC, single (s) 4.2 4.2 6.6 6.3 7.2 6.6
tC, 2 stage (s)
tF (s) 2.3 2.3 4.1 3.4 3.6 4.1
p0 queue free % 100 100 100 74 100 100
cM capacity (veh/h) 1544 1029 434 1020 233 471
Direction, Lane # NB 1 NB 2 SB 1 SE 1
Volume Total 453 63 40 268
Volume Left 0 0 0 0
Volume Right 0 63 0 268
cSH 1700 1700 1700 1020
Volume to Capacity 0.27 0.04 0.02 0.26
Queue Length 95th (ft) 0 0 0 27
Control Delay (s) 0.0 0.0 0.0 9.8
Lane LOS A
Approach Delay (s) 0.0 0.0 9.8
Approach LOS A
Intersection Summary
Average Delay 3.2
Intersection Capacity Utilization 25.3% ICU Level of Service A
Analysis Period (min) 15

HCM Unsignalized Intersection Capacity Analysis
3: Sahuarita Rd. & AZ-83 Page 1
Operations Year 20, 50% Carpool with no Copper Concentrate Trucks, Non-Peak Season, Weekday, AM Synchro 7 Report
Tetra Tech ISG 2/5/2010
Movement EBL EBR NBL NBT SBT SBR
Lane Configurations
Volume (veh/h) 22 11 22 239 224 4
Sign Control Yield Free Free
Grade 0% 0% 0%
Peak Hour Factor 0.92 0.92 0.92 0.92 0.92 0.92
Hourly flow rate (vph) 24 12 24 260 243 4
Pedestrians
Lane Width (ft)
Walking Speed (ft/s)
Percent Blockage
Right turn flare (veh)
Median type None None
Median storage veh)
Upstream signal (ft)
pX, platoon unblocked
vC, conflicting volume 553 246 248
vC1, stage 1 conf vol
vC2, stage 2 conf vol
vCu, unblocked vol 553 246 248
tC, single (s) 6.5 6.3 4.2
tC, 2 stage (s)
tF (s) 3.6 3.4 2.3
p0 queue free % 95 98 98
cM capacity (veh/h) 478 783 1295
Direction, Lane # EB 1 NB 1 SB 1
Volume Total 36 284 248
Volume Left 24 24 0
Volume Right 12 0 4
cSH 550 1295 1700
Volume to Capacity 0.07 0.02 0.15
Queue Length 95th (ft) 5 1 0
Control Delay (s) 12.0 0.8 0.0
Lane LOS B A
Approach Delay (s) 12.0 0.8 0.0
Approach LOS B
Intersection Summary
Average Delay 1.2
Intersection Capacity Utilization 39.2% ICU Level of Service A
Analysis Period (min) 15

HCM Unsignalized Intersection Capacity Analysis
4: Hilton Ranch Rd. & AZ-83 Page 2
Operations Year 20, 50% Carpool with no Copper Concentrate Trucks, Non-Peak Season, Weekday, AM Synchro 7 Report
Tetra Tech ISG 2/5/2010
Movement WBL WBR NBT NBR SBL SBT
Lane Configurations
Volume (veh/h) 0 0 176 0 15 232
Sign Control Yield Free Free
Grade 0% 0% 0%
Peak Hour Factor 0.92 0.92 0.92 0.92 0.92 0.92
Hourly flow rate (vph) 0 0 191 0 16 252
Pedestrians
Lane Width (ft)
Walking Speed (ft/s)
Percent Blockage
Right turn flare (veh)
Median type None None
Median storage veh)
Upstream signal (ft)
pX, platoon unblocked
vC, conflicting volume 476 191 191
vC1, stage 1 conf vol
vC2, stage 2 conf vol
vCu, unblocked vol 476 191 191
tC, single (s) 6.5 6.3 4.2
tC, 2 stage (s)
tF (s) 3.6 3.4 2.3
p0 queue free % 100 100 99
cM capacity (veh/h) 534 840 1359
Direction, Lane # WB 1 NB 1 SB 1
Volume Total 0 191 268
Volume Left 0 0 16
Volume Right 0 0 0
cSH 1700 1700 1359
Volume to Capacity 0.00 0.11 0.01
Queue Length 95th (ft) 0 0 1
Control Delay (s) 0.0 0.0 0.6
Lane LOS A A
Approach Delay (s) 0.0 0.0 0.6
Approach LOS A
Intersection Summary
Average Delay 0.3
Intersection Capacity Utilization 27.8% ICU Level of Service A
Analysis Period (min) 15

HCM Unsignalized Intersection Capacity Analysis
5: Hidden Valley Rd. & AZ-83 Page 3
Operations Year 20, 50% Carpool with no Copper Concentrate Trucks, Non-Peak Season, Weekday, AM Synchro 7 Report
Tetra Tech ISG 2/5/2010
Movement EBL EBR NBL NBT SBT SBR
Lane Configurations
Volume (veh/h) 71 24 51 180 138 153
Sign Control Yield Free Free
Grade 0% 0% 0%
Peak Hour Factor 0.92 0.92 0.92 0.92 0.92 0.92
Hourly flow rate (vph) 77 26 55 196 150 166
Pedestrians
Lane Width (ft)
Walking Speed (ft/s)
Percent Blockage
Right turn flare (veh)
Median type None None
Median storage veh)
Upstream signal (ft)
pX, platoon unblocked
vC, conflicting volume 540 233 316
vC1, stage 1 conf vol
vC2, stage 2 conf vol
vCu, unblocked vol 540 233 316
tC, single (s) 6.5 6.3 4.2
tC, 2 stage (s)
tF (s) 3.6 3.4 2.3
p0 queue free % 84 97 95
cM capacity (veh/h) 474 796 1222
Direction, Lane # EB 1 NB 1 SB 1
Volume Total 103 251 316
Volume Left 77 55 0
Volume Right 26 0 166
cSH 528 1222 1700
Volume to Capacity 0.20 0.05 0.19
Queue Length 95th (ft) 18 4 0
Control Delay (s) 13.5 2.1 0.0
Lane LOS B A
Approach Delay (s) 13.5 2.1 0.0
Approach LOS B
Intersection Summary
Average Delay 2.9
Intersection Capacity Utilization 44.3% ICU Level of Service A
Analysis Period (min) 15

HCM Unsignalized Intersection Capacity Analysis
6: Rosemont Junction & AZ-83 Page 4
Operations Year 20, 50% Carpool with no Copper Concentrate Trucks, Non-Peak Season, Weekday, AM Synchro 7 Report
Tetra Tech ISG 2/5/2010
Movement EBL EBR NBL NBT SBT SBR
Lane Configurations
Volume (veh/h) 0 0 0 186 117 0
Sign Control Yield Free Free
Grade 0% 0% 0%
Peak Hour Factor 0.92 0.92 0.92 0.92 0.92 0.92
Hourly flow rate (vph) 0 0 0 202 127 0
Pedestrians
Lane Width (ft)
Walking Speed (ft/s)
Percent Blockage
Right turn flare (veh)
Median type None None
Median storage veh)
Upstream signal (ft)
pX, platoon unblocked
vC, conflicting volume 329 127 127
vC1, stage 1 conf vol
vC2, stage 2 conf vol
vCu, unblocked vol 329 127 127
tC, single (s) 6.5 6.3 4.2
tC, 2 stage (s)
tF (s) 3.6 3.4 2.3
p0 queue free % 100 100 100
cM capacity (veh/h) 657 912 1435
Direction, Lane # EB 1 NB 1 SB 1
Volume Total 0 202 127
Volume Left 0 0 0
Volume Right 0 0 0
cSH 1700 1435 1700
Volume to Capacity 0.00 0.00 0.07
Queue Length 95th (ft) 0 0 0
Control Delay (s) 0.0 0.0 0.0
Lane LOS A
Approach Delay (s) 0.0 0.0 0.0
Approach LOS A
Intersection Summary
Average Delay 0.0
Intersection Capacity Utilization 13.1% ICU Level of Service A
Analysis Period (min) 15

HCM Unsignalized Intersection Capacity Analysis
7: AZ-83 & Greaterville Rd. Page 5
Operations Year 20, 50% Carpool with no Copper Concentrate Trucks, Non-Peak Season, Weekday, AM Synchro 7 Report
Tetra Tech ISG 2/5/2010
Movement SET SER NWL NWT NEL NER
Lane Configurations
Volume (veh/h) 102 7 7 141 4 4
Sign Control Free Free Yield
Grade 0% 0% 0%
Peak Hour Factor 0.92 0.92 0.92 0.92 0.92 0.92
Hourly flow rate (vph) 111 8 8 153 4 4
Pedestrians
Lane Width (ft)
Walking Speed (ft/s)
Percent Blockage
Right turn flare (veh)
Median type None None
Median storage veh)
Upstream signal (ft)
pX, platoon unblocked
vC, conflicting volume 118 283 115
vC1, stage 1 conf vol
vC2, stage 2 conf vol
vCu, unblocked vol 118 283 115
tC, single (s) 4.2 6.5 6.3
tC, 2 stage (s)
tF (s) 2.3 3.6 3.4
p0 queue free % 99 99 100
cM capacity (veh/h) 1445 695 927
Direction, Lane # SE 1 NW 1 NE 1
Volume Total 118 161 9
Volume Left 0 8 4
Volume Right 8 0 4
cSH 1700 1445 794
Volume to Capacity 0.07 0.01 0.01
Queue Length 95th (ft) 0 0 1
Control Delay (s) 0.0 0.4 9.6
Lane LOS A A
Approach Delay (s) 0.0 0.4 9.6
Approach LOS A
Intersection Summary
Average Delay 0.5
Intersection Capacity Utilization 23.1% ICU Level of Service A
Analysis Period (min) 15

HCM Unsignalized Intersection Capacity Analysis
1: I-10 WB On-Off Ramp & AZ-83 Page 1
Operations Year 20, 50% Carpool with no Copper Concentrate Trucks, Non-Peak Season, Weekday, PM Synchro 7 Report
Tetra Tech ISG 2/5/2010
Movement EBL EBT WBT WBR SBL SBR
Lane Configurations
Volume (veh/h) 39 69 264 7 15 11
Sign Control Free Free Yield
Grade 0% 0% 0%
Peak Hour Factor 0.92 0.92 0.92 0.92 0.92 0.92
Hourly flow rate (vph) 42 75 287 8 16 12
Pedestrians
Lane Width (ft)
Walking Speed (ft/s)
Percent Blockage
Right turn flare (veh)
Median type None None
Median storage veh)
Upstream signal (ft)
pX, platoon unblocked
vC, conflicting volume 295 451 291
vC1, stage 1 conf vol
vC2, stage 2 conf vol
vCu, unblocked vol 295 451 291
tC, single (s) 4.2 6.5 6.3
tC, 2 stage (s)
tF (s) 2.3 3.6 3.4
p0 queue free % 97 97 98
cM capacity (veh/h) 1244 540 739
Direction, Lane # EB 1 WB 1 SB 1
Volume Total 117 295 28
Volume Left 42 0 16
Volume Right 0 8 12
cSH 1244 1700 609
Volume to Capacity 0.03 0.17 0.05
Queue Length 95th (ft) 3 0 4
Control Delay (s) 3.1 0.0 11.2
Lane LOS A B
Approach Delay (s) 3.1 0.0 11.2
Approach LOS B
Intersection Summary
Average Delay 1.5
Intersection Capacity Utilization 33.4% ICU Level of Service A
Analysis Period (min) 15

HCM Unsignalized Intersection Capacity Analysis
2: AZ-83 & EB Off-Ramp Page 2
Operations Year 20, 50% Carpool with no Copper Concentrate Trucks, Non-Peak Season, Weekday, PM Synchro 7 Report
Tetra Tech ISG 2/5/2010
Movement NBL NBT NBR SBL SBT SBR SEL SER SWL SWR
Lane Configurations
Volume (veh/h) 0 307 44 0 47 0 0 365 0 0
Sign Control Free Free Yield Yield
Grade 0% 0% 0% 0%
Peak Hour Factor 0.92 0.92 0.92 0.92 0.92 0.92 0.92 0.92 0.92 0.92
Hourly flow rate (vph) 0 334 48 0 51 0 0 397 0 0
Pedestrians
Lane Width (ft)
Walking Speed (ft/s)
Percent Blockage
Right turn flare (veh)
Median type None None
Median storage veh)
Upstream signal (ft)
pX, platoon unblocked
vC, conflicting volume 51 382 433 51 782 385
vC1, stage 1 conf vol
vC2, stage 2 conf vol
vCu, unblocked vol 51 382 433 51 782 385
tC, single (s) 4.2 4.2 6.6 6.3 7.2 6.6
tC, 2 stage (s)
tF (s) 2.3 2.3 4.1 3.4 3.6 4.1
p0 queue free % 100 100 100 61 100 100
cM capacity (veh/h) 1530 1155 510 1006 186 543
Direction, Lane # NB 1 NB 2 SB 1 SE 1
Volume Total 334 48 51 397
Volume Left 0 0 0 0
Volume Right 0 48 0 397
cSH 1700 1700 1700 1006
Volume to Capacity 0.20 0.03 0.03 0.39
Queue Length 95th (ft) 0 0 0 48
Control Delay (s) 0.0 0.0 0.0 10.9
Lane LOS B
Approach Delay (s) 0.0 0.0 10.9
Approach LOS B
Intersection Summary
Average Delay 5.2
Intersection Capacity Utilization 32.6% ICU Level of Service A
Analysis Period (min) 15

HCM Unsignalized Intersection Capacity Analysis
3: Sahuarita Rd. & AZ-83 Page 1
Operations Year 20, 50% Carpool with no Copper Concentrate Trucks, Non-Peak Season, Weekday, PM Synchro 7 Report
Tetra Tech ISG 2/5/2010
Movement EBL EBR NBL NBT SBT SBR
Lane Configurations
Volume (veh/h) 30 11 26 243 247 79
Sign Control Yield Free Free
Grade 0% 0% 0%
Peak Hour Factor 0.92 0.92 0.92 0.92 0.92 0.92
Hourly flow rate (vph) 33 12 28 264 268 86
Pedestrians
Lane Width (ft)
Walking Speed (ft/s)
Percent Blockage
Right turn flare (veh)
Median type None None
Median storage veh)
Upstream signal (ft)
pX, platoon unblocked
vC, conflicting volume 632 311 354
vC1, stage 1 conf vol
vC2, stage 2 conf vol
vCu, unblocked vol 632 311 354
tC, single (s) 6.5 6.3 4.2
tC, 2 stage (s)
tF (s) 3.6 3.4 2.3
p0 queue free % 92 98 98
cM capacity (veh/h) 428 720 1183
Direction, Lane # EB 1 NB 1 SB 1
Volume Total 45 292 354
Volume Left 33 28 0
Volume Right 12 0 86
cSH 480 1183 1700
Volume to Capacity 0.09 0.02 0.21
Queue Length 95th (ft) 8 2 0
Control Delay (s) 13.3 1.0 0.0
Lane LOS B A
Approach Delay (s) 13.3 1.0 0.0
Approach LOS B
Intersection Summary
Average Delay 1.3
Intersection Capacity Utilization 44.5% ICU Level of Service A
Analysis Period (min) 15

HCM Unsignalized Intersection Capacity Analysis
4: Hilton Ranch Rd. & AZ-83 Page 2
Operations Year 20, 50% Carpool with no Copper Concentrate Trucks, Non-Peak Season, Weekday, PM Synchro 7 Report
Tetra Tech ISG 2/5/2010
Movement WBL WBR NBT NBR SBL SBT
Lane Configurations
Volume (veh/h) 0 0 220 0 15 183
Sign Control Yield Free Free
Grade 0% 0% 0%
Peak Hour Factor 0.92 0.92 0.92 0.92 0.92 0.92
Hourly flow rate (vph) 0 0 239 0 16 199
Pedestrians
Lane Width (ft)
Walking Speed (ft/s)
Percent Blockage
Right turn flare (veh)
Median type None None
Median storage veh)
Upstream signal (ft)
pX, platoon unblocked
vC, conflicting volume 471 239 239
vC1, stage 1 conf vol
vC2, stage 2 conf vol
vCu, unblocked vol 471 239 239
tC, single (s) 6.5 6.3 4.2
tC, 2 stage (s)
tF (s) 3.6 3.4 2.3
p0 queue free % 100 100 99
cM capacity (veh/h) 537 790 1305
Direction, Lane # WB 1 NB 1 SB 1
Volume Total 0 239 215
Volume Left 0 0 16
Volume Right 0 0 0
cSH 1700 1700 1305
Volume to Capacity 0.00 0.14 0.01
Queue Length 95th (ft) 0 0 1
Control Delay (s) 0.0 0.0 0.7
Lane LOS A A
Approach Delay (s) 0.0 0.0 0.7
Approach LOS A
Intersection Summary
Average Delay 0.3
Intersection Capacity Utilization 25.4% ICU Level of Service A
Analysis Period (min) 15

HCM Unsignalized Intersection Capacity Analysis
5: Hidden Valley Rd. & AZ-83 Page 3
Operations Year 20, 50% Carpool with no Copper Concentrate Trucks, Non-Peak Season, Weekday, PM Synchro 7 Report
Tetra Tech ISG 2/5/2010
Movement EBL EBR NBL NBT SBT SBR
Lane Configurations
Volume (veh/h) 146 47 24 123 183 71
Sign Control Yield Free Free
Grade 0% 0% 0%
Peak Hour Factor 0.92 0.92 0.92 0.92 0.92 0.92
Hourly flow rate (vph) 159 51 26 134 199 77
Pedestrians
Lane Width (ft)
Walking Speed (ft/s)
Percent Blockage
Right turn flare (veh)
Median type None None
Median storage veh)
Upstream signal (ft)
pX, platoon unblocked
vC, conflicting volume 423 238 276
vC1, stage 1 conf vol
vC2, stage 2 conf vol
vCu, unblocked vol 423 238 276
tC, single (s) 6.5 6.3 4.2
tC, 2 stage (s)
tF (s) 3.6 3.4 2.3
p0 queue free % 72 94 98
cM capacity (veh/h) 568 792 1264
Direction, Lane # EB 1 NB 1 SB 1
Volume Total 210 160 276
Volume Left 159 26 0
Volume Right 51 0 77
cSH 610 1264 1700
Volume to Capacity 0.34 0.02 0.16
Queue Length 95th (ft) 38 2 0
Control Delay (s) 14.0 1.4 0.0
Lane LOS B A
Approach Delay (s) 14.0 1.4 0.0
Approach LOS B
Intersection Summary
Average Delay 4.9
Intersection Capacity Utilization 42.7% ICU Level of Service A
Analysis Period (min) 15

HCM Unsignalized Intersection Capacity Analysis
6: Rosemont Junction & AZ-83 Page 4
Operations Year 20, 50% Carpool with no Copper Concentrate Trucks, Non-Peak Season, Weekday, PM Synchro 7 Report
Tetra Tech ISG 2/5/2010
Movement EBL EBR NBL NBT SBT SBR
Lane Configurations
Volume (veh/h) 0 0 0 125 182 0
Sign Control Yield Free Free
Grade 0% 0% 0%
Peak Hour Factor 0.92 0.92 0.92 0.92 0.92 0.92
Hourly flow rate (vph) 0 0 0 136 198 0
Pedestrians
Lane Width (ft)
Walking Speed (ft/s)
Percent Blockage
Right turn flare (veh)
Median type None None
Median storage veh)
Upstream signal (ft)
pX, platoon unblocked
vC, conflicting volume 334 198 198
vC1, stage 1 conf vol
vC2, stage 2 conf vol
vCu, unblocked vol 334 198 198
tC, single (s) 6.5 6.3 4.2
tC, 2 stage (s)
tF (s) 3.6 3.4 2.3
p0 queue free % 100 100 100
cM capacity (veh/h) 653 833 1351
Direction, Lane # EB 1 NB 1 SB 1
Volume Total 0 136 198
Volume Left 0 0 0
Volume Right 0 0 0
cSH 1700 1351 1700
Volume to Capacity 0.00 0.00 0.12
Queue Length 95th (ft) 0 0 0
Control Delay (s) 0.0 0.0 0.0
Lane LOS A
Approach Delay (s) 0.0 0.0 0.0
Approach LOS A
Intersection Summary
Average Delay 0.0
Intersection Capacity Utilization 12.9% ICU Level of Service A
Analysis Period (min) 15

HCM Unsignalized Intersection Capacity Analysis
7: AZ-83 & Greaterville Rd. Page 5
Operations Year 20, 50% Carpool with no Copper Concentrate Trucks, Non-Peak Season, Weekday, PM Synchro 7 Report
Tetra Tech ISG 2/5/2010
Movement SET SER NWL NWT NEL NER
Lane Configurations
Volume (veh/h) 219 7 7 170 0 0
Sign Control Free Free Yield
Grade 0% 0% 0%
Peak Hour Factor 0.92 0.92 0.92 0.92 0.92 0.92
Hourly flow rate (vph) 238 8 8 185 0 0
Pedestrians
Lane Width (ft)
Walking Speed (ft/s)
Percent Blockage
Right turn flare (veh)
Median type None None
Median storage veh)
Upstream signal (ft)
pX, platoon unblocked
vC, conflicting volume 246 442 242
vC1, stage 1 conf vol
vC2, stage 2 conf vol
vCu, unblocked vol 246 442 242
tC, single (s) 4.2 6.5 6.3
tC, 2 stage (s)
tF (s) 2.3 3.6 3.4
p0 queue free % 99 100 100
cM capacity (veh/h) 1297 562 787
Direction, Lane # SE 1 NW 1 NE 1
Volume Total 246 192 0
Volume Left 0 8 0
Volume Right 8 0 0
cSH 1700 1297 1700
Volume to Capacity 0.14 0.01 0.00
Queue Length 95th (ft) 0 0 0
Control Delay (s) 0.0 0.4 0.0
Lane LOS A A
Approach Delay (s) 0.0 0.4 0.0
Approach LOS A
Intersection Summary
Average Delay 0.2
Intersection Capacity Utilization 18.0% ICU Level of Service A
Analysis Period (min) 15

HCM Unsignalized Intersection Capacity Analysis
1: I-10 WB On-Off Ramp & AZ-83 Page 1
Operations Year 20, 50% Carpool with no Copper Concentrate Trucks, Non-Peak Season, Weekend, AM Synchro 7 Report
Tetra Tech ISG 2/5/2010
Movement EBL EBT WBT WBR SBL SBR
Lane Configurations
Volume (veh/h) 7 71 562 2 13 22
Sign Control Free Free Yield
Grade 0% 0% 0%
Peak Hour Factor 0.92 0.92 0.92 0.92 0.92 0.92
Hourly flow rate (vph) 8 77 611 2 14 24
Pedestrians
Lane Width (ft)
Walking Speed (ft/s)
Percent Blockage
Right turn flare (veh)
Median type None None
Median storage veh)
Upstream signal (ft)
pX, platoon unblocked
vC, conflicting volume 613 704 612
vC1, stage 1 conf vol
vC2, stage 2 conf vol
vCu, unblocked vol 613 704 612
tC, single (s) 4.2 6.5 6.3
tC, 2 stage (s)
tF (s) 2.3 3.6 3.4
p0 queue free % 99 96 95
cM capacity (veh/h) 947 394 486
Direction, Lane # EB 1 WB 1 SB 1
Volume Total 85 613 38
Volume Left 8 0 14
Volume Right 0 2 24
cSH 947 1700 447
Volume to Capacity 0.01 0.36 0.09
Queue Length 95th (ft) 1 0 7
Control Delay (s) 0.9 0.0 13.8
Lane LOS A B
Approach Delay (s) 0.9 0.0 13.8
Approach LOS B
Intersection Summary
Average Delay 0.8
Intersection Capacity Utilization 39.7% ICU Level of Service A
Analysis Period (min) 15

HCM Unsignalized Intersection Capacity Analysis
2: AZ-83 & EB Off-Ramp Page 2
Operations Year 20, 50% Carpool with no Copper Concentrate Trucks, Non-Peak Season, Weekend, AM Synchro 7 Report
Tetra Tech ISG 2/5/2010
Movement NBL NBT NBR SBL SBT SBR SEL SER SWL SWR
Lane Configurations
Volume (veh/h) 0 413 43 0 19 0 0 186 0 0
Sign Control Free Free Yield Yield
Grade 0% 0% 0% 0%
Peak Hour Factor 0.92 0.92 0.92 0.92 0.92 0.92 0.92 0.92 0.92 0.92
Hourly flow rate (vph) 0 449 47 0 21 0 0 202 0 0
Pedestrians
Lane Width (ft)
Walking Speed (ft/s)
Percent Blockage
Right turn flare (veh)
Median type None None
Median storage veh)
Upstream signal (ft)
pX, platoon unblocked
vC, conflicting volume 21 496 516 21 672 470
vC1, stage 1 conf vol
vC2, stage 2 conf vol
vCu, unblocked vol 21 496 516 21 672 470
tC, single (s) 4.2 4.2 6.6 6.3 7.2 6.6
tC, 2 stage (s)
tF (s) 2.3 2.3 4.1 3.4 3.6 4.1
p0 queue free % 100 100 100 81 100 100
cM capacity (veh/h) 1570 1048 457 1045 294 486
Direction, Lane # NB 1 NB 2 SB 1 SE 1
Volume Total 449 47 21 202
Volume Left 0 0 0 0
Volume Right 0 47 0 202
cSH 1700 1700 1700 1045
Volume to Capacity 0.26 0.03 0.01 0.19
Queue Length 95th (ft) 0 0 0 18
Control Delay (s) 0.0 0.0 0.0 9.3
Lane LOS A
Approach Delay (s) 0.0 0.0 9.3
Approach LOS A
Intersection Summary
Average Delay 2.6
Intersection Capacity Utilization 25.1% ICU Level of Service A
Analysis Period (min) 15
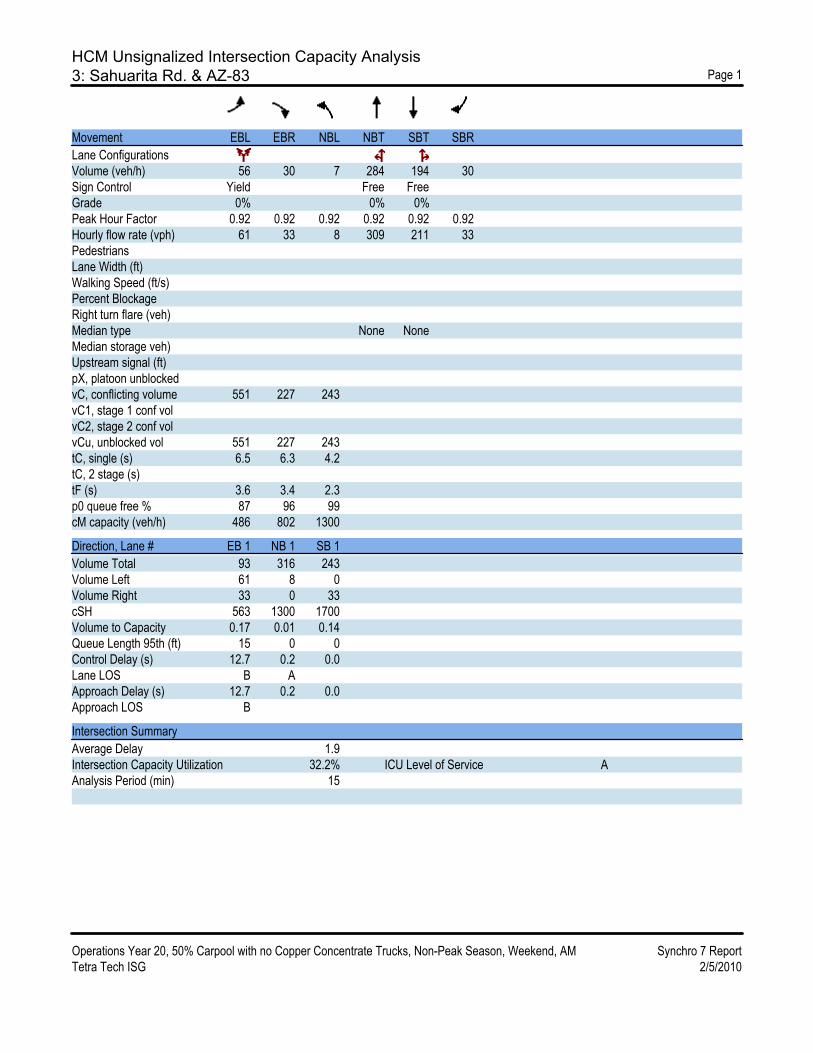
HCM Unsignalized Intersection Capacity Analysis
3: Sahuarita Rd. & AZ-83 Page 1
Operations Year 20, 50% Carpool with no Copper Concentrate Trucks, Non-Peak Season, Weekend, AM Synchro 7 Report
Tetra Tech ISG 2/5/2010
Movement EBL EBR NBL NBT SBT SBR
Lane Configurations
Volume (veh/h) 56 30 7 284 194 30
Sign Control Yield Free Free
Grade 0% 0% 0%
Peak Hour Factor 0.92 0.92 0.92 0.92 0.92 0.92
Hourly flow rate (vph) 61 33 8 309 211 33
Pedestrians
Lane Width (ft)
Walking Speed (ft/s)
Percent Blockage
Right turn flare (veh)
Median type None None
Median storage veh)
Upstream signal (ft)
pX, platoon unblocked
vC, conflicting volume 551 227 243
vC1, stage 1 conf vol
vC2, stage 2 conf vol
vCu, unblocked vol 551 227 243
tC, single (s) 6.5 6.3 4.2
tC, 2 stage (s)
tF (s) 3.6 3.4 2.3
p0 queue free % 87 96 99
cM capacity (veh/h) 486 802 1300
Direction, Lane # EB 1 NB 1 SB 1
Volume Total 93 316 243
Volume Left 61 8 0
Volume Right 33 0 33
cSH 563 1300 1700
Volume to Capacity 0.17 0.01 0.14
Queue Length 95th (ft) 15 0 0
Control Delay (s) 12.7 0.2 0.0
Lane LOS B A
Approach Delay (s) 12.7 0.2 0.0
Approach LOS B
Intersection Summary
Average Delay 1.9
Intersection Capacity Utilization 32.2% ICU Level of Service A
Analysis Period (min) 15

HCM Unsignalized Intersection Capacity Analysis
4: Hilton Ranch Rd. & AZ-83 Page 2
Operations Year 20, 50% Carpool with no Copper Concentrate Trucks, Non-Peak Season, Weekend, AM Synchro 7 Report
Tetra Tech ISG 2/5/2010
Movement WBL WBR NBT NBR SBL SBT
Lane Configurations
Volume (veh/h) 0 30 236 0 4 235
Sign Control Yield Free Free
Grade 0% 0% 0%
Peak Hour Factor 0.92 0.92 0.92 0.92 0.92 0.92
Hourly flow rate (vph) 0 33 257 0 4 255
Pedestrians
Lane Width (ft)
Walking Speed (ft/s)
Percent Blockage
Right turn flare (veh)
Median type None None
Median storage veh)
Upstream signal (ft)
pX, platoon unblocked
vC, conflicting volume 521 257 257
vC1, stage 1 conf vol
vC2, stage 2 conf vol
vCu, unblocked vol 521 257 257
tC, single (s) 6.5 6.3 4.2
tC, 2 stage (s)
tF (s) 3.6 3.4 2.3
p0 queue free % 100 96 100
cM capacity (veh/h) 507 772 1285
Direction, Lane # WB 1 NB 1 SB 1
Volume Total 33 257 260
Volume Left 0 0 4
Volume Right 33 0 0
cSH 772 1700 1285
Volume to Capacity 0.04 0.15 0.00
Queue Length 95th (ft) 3 0 0
Control Delay (s) 9.9 0.0 0.2
Lane LOS A A
Approach Delay (s) 9.9 0.0 0.2
Approach LOS A
Intersection Summary
Average Delay 0.7
Intersection Capacity Utilization 25.6% ICU Level of Service A
Analysis Period (min) 15

HCM Unsignalized Intersection Capacity Analysis
5: Hidden Valley Rd. & AZ-83 Page 3
Operations Year 20, 50% Carpool with no Copper Concentrate Trucks, Non-Peak Season, Weekend, AM Synchro 7 Report
Tetra Tech ISG 2/5/2010
Movement EBL EBR NBL NBT SBT SBR
Lane Configurations
Volume (veh/h) 71 27 32 152 94 104
Sign Control Yield Free Free
Grade 0% 0% 0%
Peak Hour Factor 0.92 0.92 0.92 0.92 0.92 0.92
Hourly flow rate (vph) 77 29 35 165 102 113
Pedestrians
Lane Width (ft)
Walking Speed (ft/s)
Percent Blockage
Right turn flare (veh)
Median type None None
Median storage veh)
Upstream signal (ft)
pX, platoon unblocked
vC, conflicting volume 393 159 215
vC1, stage 1 conf vol
vC2, stage 2 conf vol
vCu, unblocked vol 393 159 215
tC, single (s) 6.5 6.3 4.2
tC, 2 stage (s)
tF (s) 3.6 3.4 2.3
p0 queue free % 87 97 97
cM capacity (veh/h) 588 876 1331
Direction, Lane # EB 1 NB 1 SB 1
Volume Total 107 200 215
Volume Left 77 35 0
Volume Right 29 0 113
cSH 646 1331 1700
Volume to Capacity 0.16 0.03 0.13
Queue Length 95th (ft) 15 2 0
Control Delay (s) 11.7 1.5 0.0
Lane LOS B A
Approach Delay (s) 11.7 1.5 0.0
Approach LOS B
Intersection Summary
Average Delay 3.0
Intersection Capacity Utilization 36.7% ICU Level of Service A
Analysis Period (min) 15

HCM Unsignalized Intersection Capacity Analysis
6: Rosemont Junction & AZ-83 Page 4
Operations Year 20, 50% Carpool with no Copper Concentrate Trucks, Non-Peak Season, Weekend, AM Synchro 7 Report
Tetra Tech ISG 2/5/2010
Movement EBL EBR NBL NBT SBT SBR
Lane Configurations
Volume (veh/h) 4 0 4 166 87 0
Sign Control Yield Free Free
Grade 0% 0% 0%
Peak Hour Factor 0.92 0.92 0.92 0.92 0.92 0.92
Hourly flow rate (vph) 4 0 4 180 95 0
Pedestrians
Lane Width (ft)
Walking Speed (ft/s)
Percent Blockage
Right turn flare (veh)
Median type None None
Median storage veh)
Upstream signal (ft)
pX, platoon unblocked
vC, conflicting volume 284 95 95
vC1, stage 1 conf vol
vC2, stage 2 conf vol
vCu, unblocked vol 284 95 95
tC, single (s) 6.5 6.3 4.2
tC, 2 stage (s)
tF (s) 3.6 3.4 2.3
p0 queue free % 99 100 100
cM capacity (veh/h) 696 951 1475
Direction, Lane # EB 1 NB 1 SB 1
Volume Total 4 185 95
Volume Left 4 4 0
Volume Right 0 0 0
cSH 696 1475 1700
Volume to Capacity 0.01 0.00 0.06
Queue Length 95th (ft) 0 0 0
Control Delay (s) 10.2 0.2 0.0
Lane LOS B A
Approach Delay (s) 10.2 0.2 0.0
Approach LOS B
Intersection Summary
Average Delay 0.3
Intersection Capacity Utilization 22.0% ICU Level of Service A
Analysis Period (min) 15

HCM Unsignalized Intersection Capacity Analysis
7: AZ-83 & Greaterville Rd. Page 5
Operations Year 20, 50% Carpool with no Copper Concentrate Trucks, Non-Peak Season, Weekend, AM Synchro 7 Report
Tetra Tech ISG 2/5/2010
Movement SET SER NWL NWT NEL NER
Lane Configurations
Volume (veh/h) 155 0 0 136 4 7
Sign Control Free Free Yield
Grade 0% 0% 0%
Peak Hour Factor 0.92 0.92 0.92 0.92 0.92 0.92
Hourly flow rate (vph) 168 0 0 148 4 8
Pedestrians
Lane Width (ft)
Walking Speed (ft/s)
Percent Blockage
Right turn flare (veh)
Median type None None
Median storage veh)
Upstream signal (ft)
pX, platoon unblocked
vC, conflicting volume 168 316 168
vC1, stage 1 conf vol
vC2, stage 2 conf vol
vCu, unblocked vol 168 316 168
tC, single (s) 4.2 6.5 6.3
tC, 2 stage (s)
tF (s) 2.3 3.6 3.4
p0 queue free % 100 99 99
cM capacity (veh/h) 1385 669 865
Direction, Lane # SE 1 NW 1 NE 1
Volume Total 168 148 12
Volume Left 0 0 4
Volume Right 0 0 8
cSH 1700 1385 782
Volume to Capacity 0.10 0.00 0.02
Queue Length 95th (ft) 0 0 1
Control Delay (s) 0.0 0.0 9.7
Lane LOS A
Approach Delay (s) 0.0 0.0 9.7
Approach LOS A
Intersection Summary
Average Delay 0.4
Intersection Capacity Utilization 18.2% ICU Level of Service A
Analysis Period (min) 15

HCM Unsignalized Intersection Capacity Analysis
1: I-10 WB On-Off Ramp & AZ-83 Page 1
Operations Year 20, 50% Carpool with no Copper Concentrate Trucks, Non-Peak Season, Weekend, PM Synchro 7 Report
Tetra Tech ISG 2/5/2010
Movement EBL EBT WBT WBR SBL SBR
Lane Configurations
Volume (veh/h) 28 88 129 2 19 13
Sign Control Free Free Yield
Grade 0% 0% 0%
Peak Hour Factor 0.92 0.92 0.92 0.92 0.92 0.92
Hourly flow rate (vph) 30 96 140 2 21 14
Pedestrians
Lane Width (ft)
Walking Speed (ft/s)
Percent Blockage
Right turn flare (veh)
Median type None None
Median storage veh)
Upstream signal (ft)
pX, platoon unblocked
vC, conflicting volume 142 298 141
vC1, stage 1 conf vol
vC2, stage 2 conf vol
vCu, unblocked vol 142 298 141
tC, single (s) 4.2 6.5 6.3
tC, 2 stage (s)
tF (s) 2.3 3.6 3.4
p0 queue free % 98 97 98
cM capacity (veh/h) 1416 670 896
Direction, Lane # EB 1 WB 1 SB 1
Volume Total 126 142 35
Volume Left 30 0 21
Volume Right 0 2 14
cSH 1416 1700 747
Volume to Capacity 0.02 0.08 0.05
Queue Length 95th (ft) 2 0 4
Control Delay (s) 2.0 0.0 10.1
Lane LOS A B
Approach Delay (s) 2.0 0.0 10.1
Approach LOS B
Intersection Summary
Average Delay 2.0
Intersection Capacity Utilization 26.4% ICU Level of Service A
Analysis Period (min) 15

HCM Unsignalized Intersection Capacity Analysis
2: AZ-83 & EB Off-Ramp Page 2
Operations Year 20, 50% Carpool with no Copper Concentrate Trucks, Non-Peak Season, Weekend, PM Synchro 7 Report
Tetra Tech ISG 2/5/2010
Movement NBL NBT NBR SBL SBT SBR SEL SER SWL SWR
Lane Configurations
Volume (veh/h) 0 250 54 0 116 0 0 415 0 0
Sign Control Free Free Yield Yield
Grade 0% 0% 0% 0%
Peak Hour Factor 0.92 0.92 0.92 0.92 0.92 0.92 0.92 0.92 0.92 0.92
Hourly flow rate (vph) 0 272 59 0 126 0 0 451 0 0
Pedestrians
Lane Width (ft)
Walking Speed (ft/s)
Percent Blockage
Right turn flare (veh)
Median type None None
Median storage veh)
Upstream signal (ft)
pX, platoon unblocked
vC, conflicting volume 126 330 457 126 849 398
vC1, stage 1 conf vol
vC2, stage 2 conf vol
vCu, unblocked vol 126 330 457 126 849 398
tC, single (s) 4.2 4.2 6.6 6.3 7.2 6.6
tC, 2 stage (s)
tF (s) 2.3 2.3 4.1 3.4 3.6 4.1
p0 queue free % 100 100 100 51 100 100
cM capacity (veh/h) 1436 1207 494 914 140 534
Direction, Lane # NB 1 NB 2 SB 1 SE 1
Volume Total 272 59 126 451
Volume Left 0 0 0 0
Volume Right 0 59 0 451
cSH 1700 1700 1700 914
Volume to Capacity 0.16 0.03 0.07 0.49
Queue Length 95th (ft) 0 0 0 70
Control Delay (s) 0.0 0.0 0.0 12.7
Lane LOS B
Approach Delay (s) 0.0 0.0 12.7
Approach LOS B
Intersection Summary
Average Delay 6.3
Intersection Capacity Utilization 38.5% ICU Level of Service A
Analysis Period (min) 15

HCM Unsignalized Intersection Capacity Analysis
3: Sahuarita Rd. & AZ-83 Page 1
Operations Year 20, 50% Carpool with no Copper Concentrate Trucks, Non-Peak Season, Weekend, PM Synchro 7 Report
Tetra Tech ISG 2/5/2010
Movement EBL EBR NBL NBT SBT SBR
Lane Configurations
Volume (veh/h) 60 22 86 295 176 26
Sign Control Yield Free Free
Grade 0% 0% 0%
Peak Hour Factor 0.92 0.92 0.92 0.92 0.92 0.92
Hourly flow rate (vph) 65 24 93 321 191 28
Pedestrians
Lane Width (ft)
Walking Speed (ft/s)
Percent Blockage
Right turn flare (veh)
Median type None None
Median storage veh)
Upstream signal (ft)
pX, platoon unblocked
vC, conflicting volume 713 205 220
vC1, stage 1 conf vol
vC2, stage 2 conf vol
vCu, unblocked vol 713 205 220
tC, single (s) 6.5 6.3 4.2
tC, 2 stage (s)
tF (s) 3.6 3.4 2.3
p0 queue free % 82 97 93
cM capacity (veh/h) 365 825 1326
Direction, Lane # EB 1 NB 1 SB 1
Volume Total 89 414 220
Volume Left 65 93 0
Volume Right 24 0 28
cSH 429 1326 1700
Volume to Capacity 0.21 0.07 0.13
Queue Length 95th (ft) 19 6 0
Control Delay (s) 15.6 2.3 0.0
Lane LOS C A
Approach Delay (s) 15.6 2.3 0.0
Approach LOS C
Intersection Summary
Average Delay 3.3
Intersection Capacity Utilization 45.8% ICU Level of Service A
Analysis Period (min) 15

HCM Unsignalized Intersection Capacity Analysis
4: Hilton Ranch Rd. & AZ-83 Page 2
Operations Year 20, 50% Carpool with no Copper Concentrate Trucks, Non-Peak Season, Weekend, PM Synchro 7 Report
Tetra Tech ISG 2/5/2010
Movement WBL WBR NBT NBR SBL SBT
Lane Configurations
Volume (veh/h) 0 4 273 0 4 180
Sign Control Yield Free Free
Grade 0% 0% 0%
Peak Hour Factor 0.92 0.92 0.92 0.92 0.92 0.92
Hourly flow rate (vph) 0 4 297 0 4 196
Pedestrians
Lane Width (ft)
Walking Speed (ft/s)
Percent Blockage
Right turn flare (veh)
Median type None None
Median storage veh)
Upstream signal (ft)
pX, platoon unblocked
vC, conflicting volume 501 297 297
vC1, stage 1 conf vol
vC2, stage 2 conf vol
vCu, unblocked vol 501 297 297
tC, single (s) 6.5 6.3 4.2
tC, 2 stage (s)
tF (s) 3.6 3.4 2.3
p0 queue free % 100 99 100
cM capacity (veh/h) 521 733 1242
Direction, Lane # WB 1 NB 1 SB 1
Volume Total 4 297 200
Volume Left 0 0 4
Volume Right 4 0 0
cSH 733 1700 1242
Volume to Capacity 0.01 0.17 0.00
Queue Length 95th (ft) 0 0 0
Control Delay (s) 9.9 0.0 0.2
Lane LOS A A
Approach Delay (s) 9.9 0.0 0.2
Approach LOS A
Intersection Summary
Average Delay 0.2
Intersection Capacity Utilization 24.4% ICU Level of Service A
Analysis Period (min) 15

HCM Unsignalized Intersection Capacity Analysis
5: Hidden Valley Rd. & AZ-83 Page 3
Operations Year 20, 50% Carpool with no Copper Concentrate Trucks, Non-Peak Season, Weekend, PM Synchro 7 Report
Tetra Tech ISG 2/5/2010
Movement EBL EBR NBL NBT SBT SBR
Lane Configurations
Volume (veh/h) 101 31 24 153 67 71
Sign Control Yield Free Free
Grade 0% 0% 0%
Peak Hour Factor 0.92 0.92 0.92 0.92 0.92 0.92
Hourly flow rate (vph) 110 34 26 166 73 77
Pedestrians
Lane Width (ft)
Walking Speed (ft/s)
Percent Blockage
Right turn flare (veh)
Median type None None
Median storage veh)
Upstream signal (ft)
pX, platoon unblocked
vC, conflicting volume 330 111 150
vC1, stage 1 conf vol
vC2, stage 2 conf vol
vCu, unblocked vol 330 111 150
tC, single (s) 6.5 6.3 4.2
tC, 2 stage (s)
tF (s) 3.6 3.4 2.3
p0 queue free % 83 96 98
cM capacity (veh/h) 644 931 1407
Direction, Lane # EB 1 NB 1 SB 1
Volume Total 143 192 150
Volume Left 110 26 0
Volume Right 34 0 77
cSH 695 1407 1700
Volume to Capacity 0.21 0.02 0.09
Queue Length 95th (ft) 19 1 0
Control Delay (s) 11.5 1.2 0.0
Lane LOS B A
Approach Delay (s) 11.5 1.2 0.0
Approach LOS B
Intersection Summary
Average Delay 3.9
Intersection Capacity Utilization 34.7% ICU Level of Service A
Analysis Period (min) 15

HCM Unsignalized Intersection Capacity Analysis
6: Rosemont Junction & AZ-83 Page 4
Operations Year 20, 50% Carpool with no Copper Concentrate Trucks, Non-Peak Season, Weekend, PM Synchro 7 Report
Tetra Tech ISG 2/5/2010
Movement EBL EBR NBL NBT SBT SBR
Lane Configurations
Volume (veh/h) 0 0 0 192 125 0
Sign Control Yield Free Free
Grade 0% 0% 0%
Peak Hour Factor 0.92 0.92 0.92 0.92 0.92 0.92
Hourly flow rate (vph) 0 0 0 209 136 0
Pedestrians
Lane Width (ft)
Walking Speed (ft/s)
Percent Blockage
Right turn flare (veh)
Median type None None
Median storage veh)
Upstream signal (ft)
pX, platoon unblocked
vC, conflicting volume 345 136 136
vC1, stage 1 conf vol
vC2, stage 2 conf vol
vCu, unblocked vol 345 136 136
tC, single (s) 6.5 6.3 4.2
tC, 2 stage (s)
tF (s) 3.6 3.4 2.3
p0 queue free % 100 100 100
cM capacity (veh/h) 644 902 1424
Direction, Lane # EB 1 NB 1 SB 1
Volume Total 0 209 136
Volume Left 0 0 0
Volume Right 0 0 0
cSH 1700 1424 1700
Volume to Capacity 0.00 0.00 0.08
Queue Length 95th (ft) 0 0 0
Control Delay (s) 0.0 0.0 0.0
Lane LOS A
Approach Delay (s) 0.0 0.0 0.0
Approach LOS A
Intersection Summary
Average Delay 0.0
Intersection Capacity Utilization 13.4% ICU Level of Service A
Analysis Period (min) 15

HCM Unsignalized Intersection Capacity Analysis
7: AZ-83 & Greaterville Rd. Page 5
Operations Year 20, 50% Carpool with no Copper Concentrate Trucks, Non-Peak Season, Weekend, PM Synchro 7 Report
Tetra Tech ISG 2/5/2010
Movement SET SER NWL NWT NEL NER
Lane Configurations
Volume (veh/h) 196 7 11 218 4 7
Sign Control Free Free Yield
Grade 0% 0% 0%
Peak Hour Factor 0.92 0.92 0.92 0.92 0.92 0.92
Hourly flow rate (vph) 213 8 12 237 4 8
Pedestrians
Lane Width (ft)
Walking Speed (ft/s)
Percent Blockage
Right turn flare (veh)
Median type None None
Median storage veh)
Upstream signal (ft)
pX, platoon unblocked
vC, conflicting volume 221 478 217
vC1, stage 1 conf vol
vC2, stage 2 conf vol
vCu, unblocked vol 221 478 217
tC, single (s) 4.2 6.5 6.3
tC, 2 stage (s)
tF (s) 2.3 3.6 3.4
p0 queue free % 99 99 99
cM capacity (veh/h) 1325 534 813
Direction, Lane # SE 1 NW 1 NE 1
Volume Total 221 249 12
Volume Left 0 12 4
Volume Right 8 0 8
cSH 1700 1325 683
Volume to Capacity 0.13 0.01 0.02
Queue Length 95th (ft) 0 1 1
Control Delay (s) 0.0 0.4 10.4
Lane LOS A B
Approach Delay (s) 0.0 0.4 10.4
Approach LOS B
Intersection Summary
Average Delay 0.5
Intersection Capacity Utilization 30.4% ICU Level of Service A
Analysis Period (min) 15

PEAK SEASON
SCENARIO 5
50% CARPOOL WITH NO COPPER CONCENTRATE
TRUCKS

HCM Unsignalized Intersection Capacity Analysis
1: I-10 WB On-Off Ramp & AZ-83 Page 1
Operations Year 20, 50% Carpool with no Copper Concentrate Trucks, Peak Season, Weekday, AM Synchro 7 Report
Tetra Tech ISG 2/5/2010
Movement EBL EBT WBT WBR SBL SBR
Lane Configurations
Volume (veh/h) 6 62 592 7 21 30
Sign Control Free Free Yield
Grade 0% 0% 0%
Peak Hour Factor 0.92 0.92 0.92 0.92 0.92 0.92
Hourly flow rate (vph) 7 67 643 8 23 33
Pedestrians
Lane Width (ft)
Walking Speed (ft/s)
Percent Blockage
Right turn flare (veh)
Median type None None
Median storage veh)
Upstream signal (ft)
pX, platoon unblocked
vC, conflicting volume 651 728 647
vC1, stage 1 conf vol
vC2, stage 2 conf vol
vCu, unblocked vol 651 728 647
tC, single (s) 4.2 6.5 6.3
tC, 2 stage (s)
tF (s) 2.3 3.6 3.4
p0 queue free % 99 94 93
cM capacity (veh/h) 916 382 464
Direction, Lane # EB 1 WB 1 SB 1
Volume Total 74 651 55
Volume Left 7 0 23
Volume Right 0 8 33
cSH 916 1700 426
Volume to Capacity 0.01 0.38 0.13
Queue Length 95th (ft) 1 0 11
Control Delay (s) 0.9 0.0 14.7
Lane LOS A B
Approach Delay (s) 0.9 0.0 14.7
Approach LOS B
Intersection Summary
Average Delay 1.1
Intersection Capacity Utilization 41.6% ICU Level of Service A
Analysis Period (min) 15

HCM Unsignalized Intersection Capacity Analysis
2: AZ-83 & EB Off-Ramp Page 2
Operations Year 20, 50% Carpool with no Copper Concentrate Trucks, Peak Season, Weekday, AM Synchro 7 Report
Tetra Tech ISG 2/5/2010
Movement NBL NBT NBR SBL SBT SBR SEL SER SWL SWR
Lane Configurations
Volume (veh/h) 0 428 29 0 30 0 0 252 0 0
Sign Control Free Free Yield Yield
Grade 0% 0% 0% 0%
Peak Hour Factor 0.92 0.92 0.92 0.92 0.92 0.92 0.92 0.92 0.92 0.92
Hourly flow rate (vph) 0 465 32 0 33 0 0 274 0 0
Pedestrians
Lane Width (ft)
Walking Speed (ft/s)
Percent Blockage
Right turn flare (veh)
Median type None None
Median storage veh)
Upstream signal (ft)
pX, platoon unblocked
vC, conflicting volume 33 497 529 33 772 498
vC1, stage 1 conf vol
vC2, stage 2 conf vol
vCu, unblocked vol 33 497 529 33 772 498
tC, single (s) 4.2 4.2 6.6 6.3 7.2 6.6
tC, 2 stage (s)
tF (s) 2.3 2.3 4.1 3.4 3.6 4.1
p0 queue free % 100 100 100 73 100 100
cM capacity (veh/h) 1554 1047 449 1030 229 468
Direction, Lane # NB 1 NB 2 SB 1 SE 1
Volume Total 465 32 33 274
Volume Left 0 0 0 0
Volume Right 0 32 0 274
cSH 1700 1700 1700 1030
Volume to Capacity 0.27 0.02 0.02 0.27
Queue Length 95th (ft) 0 0 0 27
Control Delay (s) 0.0 0.0 0.0 9.8
Lane LOS A
Approach Delay (s) 0.0 0.0 9.8
Approach LOS A
Intersection Summary
Average Delay 3.3
Intersection Capacity Utilization 25.9% ICU Level of Service A
Analysis Period (min) 15

HCM Unsignalized Intersection Capacity Analysis
3: Sahuarita Rd. & AZ-83 Page 1
Operations Year 20, 50% Carpool with no Copper Concentrate Trucks, Peak Season, Weekday, AM Synchro 7 Report
Tetra Tech ISG 2/5/2010
Movement EBL EBR NBL NBT SBT SBR
Lane Configurations
Volume (veh/h) 64 30 7 288 217 41
Sign Control Yield Free Free
Grade 0% 0% 0%
Peak Hour Factor 0.92 0.92 0.92 0.92 0.92 0.92
Hourly flow rate (vph) 70 33 8 313 236 45
Pedestrians
Lane Width (ft)
Walking Speed (ft/s)
Percent Blockage
Right turn flare (veh)
Median type None None
Median storage veh)
Upstream signal (ft)
pX, platoon unblocked
vC, conflicting volume 586 258 280
vC1, stage 1 conf vol
vC2, stage 2 conf vol
vCu, unblocked vol 586 258 280
tC, single (s) 6.5 6.3 4.2
tC, 2 stage (s)
tF (s) 3.6 3.4 2.3
p0 queue free % 85 96 99
cM capacity (veh/h) 463 771 1259
Direction, Lane # EB 1 NB 1 SB 1
Volume Total 102 321 280
Volume Left 70 8 0
Volume Right 33 0 45
cSH 531 1259 1700
Volume to Capacity 0.19 0.01 0.16
Queue Length 95th (ft) 18 0 0
Control Delay (s) 13.4 0.2 0.0
Lane LOS B A
Approach Delay (s) 13.4 0.2 0.0
Approach LOS B
Intersection Summary
Average Delay 2.1
Intersection Capacity Utilization 32.8% ICU Level of Service A
Analysis Period (min) 15

HCM Unsignalized Intersection Capacity Analysis
4: Hilton Ranch Rd. & AZ-83 Page 2
Operations Year 20, 50% Carpool with no Copper Concentrate Trucks, Peak Season, Weekday, AM Synchro 7 Report
Tetra Tech ISG 2/5/2010
Movement WBL WBR NBT NBR SBL SBT
Lane Configurations
Volume (veh/h) 0 0 153 0 7 239
Sign Control Yield Free Free
Grade 0% 0% 0%
Peak Hour Factor 0.92 0.92 0.92 0.92 0.92 0.92
Hourly flow rate (vph) 0 0 166 0 8 260
Pedestrians
Lane Width (ft)
Walking Speed (ft/s)
Percent Blockage
Right turn flare (veh)
Median type None None
Median storage veh)
Upstream signal (ft)
pX, platoon unblocked
vC, conflicting volume 441 166 166
vC1, stage 1 conf vol
vC2, stage 2 conf vol
vCu, unblocked vol 441 166 166
tC, single (s) 6.5 6.3 4.2
tC, 2 stage (s)
tF (s) 3.6 3.4 2.3
p0 queue free % 100 100 99
cM capacity (veh/h) 563 868 1388
Direction, Lane # WB 1 NB 1 SB 1
Volume Total 0 166 267
Volume Left 0 0 8
Volume Right 0 0 0
cSH 1700 1700 1388
Volume to Capacity 0.00 0.10 0.01
Queue Length 95th (ft) 0 0 0
Control Delay (s) 0.0 0.0 0.3
Lane LOS A A
Approach Delay (s) 0.0 0.0 0.3
Approach LOS A
Intersection Summary
Average Delay 0.2
Intersection Capacity Utilization 21.6% ICU Level of Service A
Analysis Period (min) 15

HCM Unsignalized Intersection Capacity Analysis
5: Hidden Valley Rd. & AZ-83 Page 3
Operations Year 20, 50% Carpool with no Copper Concentrate Trucks, Peak Season, Weekday, AM Synchro 7 Report
Tetra Tech ISG 2/5/2010
Movement EBL EBR NBL NBT SBT SBR
Lane Configurations
Volume (veh/h) 71 27 47 116 75 146
Sign Control Yield Free Free
Grade 0% 0% 0%
Peak Hour Factor 0.92 0.92 0.92 0.92 0.92 0.92
Hourly flow rate (vph) 77 29 51 126 82 159
Pedestrians
Lane Width (ft)
Walking Speed (ft/s)
Percent Blockage
Right turn flare (veh)
Median type None None
Median storage veh)
Upstream signal (ft)
pX, platoon unblocked
vC, conflicting volume 389 161 240
vC1, stage 1 conf vol
vC2, stage 2 conf vol
vCu, unblocked vol 389 161 240
tC, single (s) 6.5 6.3 4.2
tC, 2 stage (s)
tF (s) 3.6 3.4 2.3
p0 queue free % 87 97 96
cM capacity (veh/h) 583 874 1303
Direction, Lane # EB 1 NB 1 SB 1
Volume Total 107 177 240
Volume Left 77 51 0
Volume Right 29 0 159
cSH 642 1303 1700
Volume to Capacity 0.17 0.04 0.14
Queue Length 95th (ft) 15 3 0
Control Delay (s) 11.7 2.5 0.0
Lane LOS B A
Approach Delay (s) 11.7 2.5 0.0
Approach LOS B
Intersection Summary
Average Delay 3.2
Intersection Capacity Utilization 37.2% ICU Level of Service A
Analysis Period (min) 15

HCM Unsignalized Intersection Capacity Analysis
6: Rosemont Junction & AZ-83 Page 4
Operations Year 20, 50% Carpool with no Copper Concentrate Trucks, Peak Season, Weekday, AM Synchro 7 Report
Tetra Tech ISG 2/5/2010
Movement EBL EBR NBL NBT SBT SBR
Lane Configurations
Volume (veh/h) 4 4 4 197 128 0
Sign Control Yield Free Free
Grade 0% 0% 0%
Peak Hour Factor 0.92 0.92 0.92 0.92 0.92 0.92
Hourly flow rate (vph) 4 4 4 214 139 0
Pedestrians
Lane Width (ft)
Walking Speed (ft/s)
Percent Blockage
Right turn flare (veh)
Median type None None
Median storage veh)
Upstream signal (ft)
pX, platoon unblocked
vC, conflicting volume 362 139 139
vC1, stage 1 conf vol
vC2, stage 2 conf vol
vCu, unblocked vol 362 139 139
tC, single (s) 6.5 6.3 4.2
tC, 2 stage (s)
tF (s) 3.6 3.4 2.3
p0 queue free % 99 100 100
cM capacity (veh/h) 627 898 1420
Direction, Lane # EB 1 NB 1 SB 1
Volume Total 9 218 139
Volume Left 4 4 0
Volume Right 4 0 0
cSH 739 1420 1700
Volume to Capacity 0.01 0.00 0.08
Queue Length 95th (ft) 1 0 0
Control Delay (s) 9.9 0.2 0.0
Lane LOS A A
Approach Delay (s) 9.9 0.2 0.0
Approach LOS A
Intersection Summary
Average Delay 0.3
Intersection Capacity Utilization 23.6% ICU Level of Service A
Analysis Period (min) 15

HCM Unsignalized Intersection Capacity Analysis
7: AZ-83 & Greaterville Rd. Page 5
Operations Year 20, 50% Carpool with no Copper Concentrate Trucks, Peak Season, Weekday, AM Synchro 7 Report
Tetra Tech ISG 2/5/2010
Movement SET SER NWL NWT NEL NER
Lane Configurations
Volume (veh/h) 106 4 0 171 4 0
Sign Control Free Free Yield
Grade 0% 0% 0%
Peak Hour Factor 0.92 0.92 0.92 0.92 0.92 0.92
Hourly flow rate (vph) 115 4 0 186 4 0
Pedestrians
Lane Width (ft)
Walking Speed (ft/s)
Percent Blockage
Right turn flare (veh)
Median type None None
Median storage veh)
Upstream signal (ft)
pX, platoon unblocked
vC, conflicting volume 120 303 117
vC1, stage 1 conf vol
vC2, stage 2 conf vol
vCu, unblocked vol 120 303 117
tC, single (s) 4.2 6.5 6.3
tC, 2 stage (s)
tF (s) 2.3 3.6 3.4
p0 queue free % 100 99 100
cM capacity (veh/h) 1444 680 924
Direction, Lane # SE 1 NW 1 NE 1
Volume Total 120 186 4
Volume Left 0 0 4
Volume Right 4 0 0
cSH 1700 1444 680
Volume to Capacity 0.07 0.00 0.01
Queue Length 95th (ft) 0 0 0
Control Delay (s) 0.0 0.0 10.3
Lane LOS B
Approach Delay (s) 0.0 0.0 10.3
Approach LOS B
Intersection Summary
Average Delay 0.1
Intersection Capacity Utilization 19.0% ICU Level of Service A
Analysis Period (min) 15

HCM Unsignalized Intersection Capacity Analysis
1: I-10 WB On-Off Ramp & AZ-83 Page 1
Operations Year 20, 50% Carpool with no Copper Concentrate Trucks, Peak Season, Weekday, PM Synchro 7 Report
Tetra Tech ISG 2/5/2010
Movement EBL EBT WBT WBR SBL SBR
Lane Configurations
Volume (veh/h) 19 95 268 6 17 13
Sign Control Free Free Yield
Grade 0% 0% 0%
Peak Hour Factor 0.92 0.92 0.92 0.92 0.92 0.92
Hourly flow rate (vph) 21 103 291 7 18 14
Pedestrians
Lane Width (ft)
Walking Speed (ft/s)
Percent Blockage
Right turn flare (veh)
Median type None None
Median storage veh)
Upstream signal (ft)
pX, platoon unblocked
vC, conflicting volume 298 439 295
vC1, stage 1 conf vol
vC2, stage 2 conf vol
vCu, unblocked vol 298 439 295
tC, single (s) 4.2 6.5 6.3
tC, 2 stage (s)
tF (s) 2.3 3.6 3.4
p0 queue free % 98 97 98
cM capacity (veh/h) 1241 558 735
Direction, Lane # EB 1 WB 1 SB 1
Volume Total 124 298 33
Volume Left 21 0 18
Volume Right 0 7 14
cSH 1241 1700 623
Volume to Capacity 0.02 0.18 0.05
Queue Length 95th (ft) 1 0 4
Control Delay (s) 1.4 0.0 11.1
Lane LOS A B
Approach Delay (s) 1.4 0.0 11.1
Approach LOS B
Intersection Summary
Average Delay 1.2
Intersection Capacity Utilization 31.2% ICU Level of Service A
Analysis Period (min) 15

HCM Unsignalized Intersection Capacity Analysis
2: AZ-83 & EB Off-Ramp Page 2
Operations Year 20, 50% Carpool with no Copper Concentrate Trucks, Peak Season, Weekday, PM Synchro 7 Report
Tetra Tech ISG 2/5/2010
Movement NBL NBT NBR SBL SBT SBR SEL SER SWL SWR
Lane Configurations
Volume (veh/h) 0 336 52 0 88 0 0 159 0 0
Sign Control Free Free Yield Yield
Grade 0% 0% 0% 0%
Peak Hour Factor 0.92 0.92 0.92 0.92 0.92 0.92 0.92 0.92 0.92 0.92
Hourly flow rate (vph) 0 365 57 0 96 0 0 173 0 0
Pedestrians
Lane Width (ft)
Walking Speed (ft/s)
Percent Blockage
Right turn flare (veh)
Median type None None
Median storage veh)
Upstream signal (ft)
pX, platoon unblocked
vC, conflicting volume 96 422 517 96 634 461
vC1, stage 1 conf vol
vC2, stage 2 conf vol
vCu, unblocked vol 96 422 517 96 634 461
tC, single (s) 4.2 4.2 6.6 6.3 7.2 6.6
tC, 2 stage (s)
tF (s) 2.3 2.3 4.1 3.4 3.6 4.1
p0 queue free % 100 100 100 82 100 100
cM capacity (veh/h) 1473 1116 456 950 316 492
Direction, Lane # NB 1 NB 2 SB 1 SE 1
Volume Total 365 57 96 173
Volume Left 0 0 0 0
Volume Right 0 57 0 173
cSH 1700 1700 1700 950
Volume to Capacity 0.21 0.03 0.06 0.18
Queue Length 95th (ft) 0 0 0 17
Control Delay (s) 0.0 0.0 0.0 9.6
Lane LOS A
Approach Delay (s) 0.0 0.0 9.6
Approach LOS A
Intersection Summary
Average Delay 2.4
Intersection Capacity Utilization 21.1% ICU Level of Service A
Analysis Period (min) 15

HCM Unsignalized Intersection Capacity Analysis
3: Sahuarita Rd. & AZ-83 Page 1
Operations Year 20, 50% Carpool with no Copper Concentrate Trucks, Peak Season, Weekday, PM Synchro 7 Report
Tetra Tech ISG 2/5/2010
Movement EBL EBR NBL NBT SBT SBR
Lane Configurations
Volume (veh/h) 34 22 52 299 314 75
Sign Control Yield Free Free
Grade 0% 0% 0%
Peak Hour Factor 0.92 0.92 0.92 0.92 0.92 0.92
Hourly flow rate (vph) 37 24 57 325 341 82
Pedestrians
Lane Width (ft)
Walking Speed (ft/s)
Percent Blockage
Right turn flare (veh)
Median type None None
Median storage veh)
Upstream signal (ft)
pX, platoon unblocked
vC, conflicting volume 820 382 423
vC1, stage 1 conf vol
vC2, stage 2 conf vol
vCu, unblocked vol 820 382 423
tC, single (s) 6.5 6.3 4.2
tC, 2 stage (s)
tF (s) 3.6 3.4 2.3
p0 queue free % 89 96 95
cM capacity (veh/h) 322 656 1115
Direction, Lane # EB 1 NB 1 SB 1
Volume Total 61 382 423
Volume Left 37 57 0
Volume Right 24 0 82
cSH 403 1115 1700
Volume to Capacity 0.15 0.05 0.25
Queue Length 95th (ft) 13 4 0
Control Delay (s) 15.5 1.7 0.0
Lane LOS C A
Approach Delay (s) 15.5 1.7 0.0
Approach LOS C
Intersection Summary
Average Delay 1.8
Intersection Capacity Utilization 53.0% ICU Level of Service A
Analysis Period (min) 15

HCM Unsignalized Intersection Capacity Analysis
4: Hilton Ranch Rd. & AZ-83 Page 2
Operations Year 20, 50% Carpool with no Copper Concentrate Trucks, Peak Season, Weekday, PM Synchro 7 Report
Tetra Tech ISG 2/5/2010
Movement WBL WBR NBT NBR SBL SBT
Lane Configurations
Volume (veh/h) 0 0 336 4 30 213
Sign Control Yield Free Free
Grade 0% 0% 0%
Peak Hour Factor 0.92 0.92 0.92 0.92 0.92 0.92
Hourly flow rate (vph) 0 0 365 4 33 232
Pedestrians
Lane Width (ft)
Walking Speed (ft/s)
Percent Blockage
Right turn flare (veh)
Median type None None
Median storage veh)
Upstream signal (ft)
pX, platoon unblocked
vC, conflicting volume 664 367 370
vC1, stage 1 conf vol
vC2, stage 2 conf vol
vCu, unblocked vol 664 367 370
tC, single (s) 6.5 6.3 4.2
tC, 2 stage (s)
tF (s) 3.6 3.4 2.3
p0 queue free % 100 100 97
cM capacity (veh/h) 408 669 1167
Direction, Lane # WB 1 NB 1 SB 1
Volume Total 0 370 264
Volume Left 0 0 33
Volume Right 0 4 0
cSH 1700 1700 1167
Volume to Capacity 0.00 0.22 0.03
Queue Length 95th (ft) 0 0 2
Control Delay (s) 0.0 0.0 1.2
Lane LOS A A
Approach Delay (s) 0.0 0.0 1.2
Approach LOS A
Intersection Summary
Average Delay 0.5
Intersection Capacity Utilization 37.5% ICU Level of Service A
Analysis Period (min) 15

HCM Unsignalized Intersection Capacity Analysis
5: Hidden Valley Rd. & AZ-83 Page 3
Operations Year 20, 50% Carpool with no Copper Concentrate Trucks, Peak Season, Weekday, PM Synchro 7 Report
Tetra Tech ISG 2/5/2010
Movement EBL EBR NBL NBT SBT SBR
Lane Configurations
Volume (veh/h) 146 51 24 172 183 71
Sign Control Yield Free Free
Grade 0% 0% 0%
Peak Hour Factor 0.92 0.92 0.92 0.92 0.92 0.92
Hourly flow rate (vph) 159 55 26 187 199 77
Pedestrians
Lane Width (ft)
Walking Speed (ft/s)
Percent Blockage
Right turn flare (veh)
Median type None None
Median storage veh)
Upstream signal (ft)
pX, platoon unblocked
vC, conflicting volume 477 238 276
vC1, stage 1 conf vol
vC2, stage 2 conf vol
vCu, unblocked vol 477 238 276
tC, single (s) 6.5 6.3 4.2
tC, 2 stage (s)
tF (s) 3.6 3.4 2.3
p0 queue free % 70 93 98
cM capacity (veh/h) 529 792 1264
Direction, Lane # EB 1 NB 1 SB 1
Volume Total 214 213 276
Volume Left 159 26 0
Volume Right 55 0 77
cSH 578 1264 1700
Volume to Capacity 0.37 0.02 0.16
Queue Length 95th (ft) 42 2 0
Control Delay (s) 14.8 1.1 0.0
Lane LOS B A
Approach Delay (s) 14.8 1.1 0.0
Approach LOS B
Intersection Summary
Average Delay 4.9
Intersection Capacity Utilization 45.5% ICU Level of Service A
Analysis Period (min) 15

HCM Unsignalized Intersection Capacity Analysis
6: Rosemont Junction & AZ-83 Page 4
Operations Year 20, 50% Carpool with no Copper Concentrate Trucks, Peak Season, Weekday, PM Synchro 7 Report
Tetra Tech ISG 2/5/2010
Movement EBL EBR NBL NBT SBT SBR
Lane Configurations
Volume (veh/h) 0 0 0 187 279 0
Sign Control Yield Free Free
Grade 0% 0% 0%
Peak Hour Factor 0.92 0.92 0.92 0.92 0.92 0.92
Hourly flow rate (vph) 0 0 0 203 303 0
Pedestrians
Lane Width (ft)
Walking Speed (ft/s)
Percent Blockage
Right turn flare (veh)
Median type None None
Median storage veh)
Upstream signal (ft)
pX, platoon unblocked
vC, conflicting volume 507 303 303
vC1, stage 1 conf vol
vC2, stage 2 conf vol
vCu, unblocked vol 507 303 303
tC, single (s) 6.5 6.3 4.2
tC, 2 stage (s)
tF (s) 3.6 3.4 2.3
p0 queue free % 100 100 100
cM capacity (veh/h) 519 727 1235
Direction, Lane # EB 1 NB 1 SB 1
Volume Total 0 203 303
Volume Left 0 0 0
Volume Right 0 0 0
cSH 1700 1235 1700
Volume to Capacity 0.00 0.00 0.18
Queue Length 95th (ft) 0 0 0
Control Delay (s) 0.0 0.0 0.0
Lane LOS A
Approach Delay (s) 0.0 0.0 0.0
Approach LOS A
Intersection Summary
Average Delay 0.0
Intersection Capacity Utilization 18.0% ICU Level of Service A
Analysis Period (min) 15

HCM Unsignalized Intersection Capacity Analysis
7: AZ-83 & Greaterville Rd. Page 5
Operations Year 20, 50% Carpool with no Copper Concentrate Trucks, Peak Season, Weekday, PM Synchro 7 Report
Tetra Tech ISG 2/5/2010
Movement SET SER NWL NWT NEL NER
Lane Configurations
Volume (veh/h) 242 4 7 128 4 0
Sign Control Free Free Yield
Grade 0% 0% 0%
Peak Hour Factor 0.92 0.92 0.92 0.92 0.92 0.92
Hourly flow rate (vph) 263 4 8 139 4 0
Pedestrians
Lane Width (ft)
Walking Speed (ft/s)
Percent Blockage
Right turn flare (veh)
Median type None None
Median storage veh)
Upstream signal (ft)
pX, platoon unblocked
vC, conflicting volume 267 420 265
vC1, stage 1 conf vol
vC2, stage 2 conf vol
vCu, unblocked vol 267 420 265
tC, single (s) 4.2 6.5 6.3
tC, 2 stage (s)
tF (s) 2.3 3.6 3.4
p0 queue free % 99 99 100
cM capacity (veh/h) 1274 579 764
Direction, Lane # SE 1 NW 1 NE 1
Volume Total 267 147 4
Volume Left 0 8 4
Volume Right 4 0 0
cSH 1700 1274 579
Volume to Capacity 0.16 0.01 0.01
Queue Length 95th (ft) 0 0 1
Control Delay (s) 0.0 0.5 11.3
Lane LOS A B
Approach Delay (s) 0.0 0.5 11.3
Approach LOS B
Intersection Summary
Average Delay 0.3
Intersection Capacity Utilization 23.0% ICU Level of Service A
Analysis Period (min) 15

HCM Unsignalized Intersection Capacity Analysis
1: I-10 WB On-Off Ramp & AZ-83 Page 1
Operations Year 20, 50% Carpool with no Copper Concentrate Trucks, Peak Season, Weekend, AM Synchro 7 Report
Tetra Tech ISG 2/5/2010
Movement EBL EBT WBT WBR SBL SBR
Lane Configurations
Volume (veh/h) 13 30 430 6 17 45
Sign Control Free Free Yield
Grade 0% 0% 0%
Peak Hour Factor 0.92 0.92 0.92 0.92 0.92 0.92
Hourly flow rate (vph) 14 33 467 7 18 49
Pedestrians
Lane Width (ft)
Walking Speed (ft/s)
Percent Blockage
Right turn flare (veh)
Median type None None
Median storage veh)
Upstream signal (ft)
pX, platoon unblocked
vC, conflicting volume 474 532 471
vC1, stage 1 conf vol
vC2, stage 2 conf vol
vCu, unblocked vol 474 532 471
tC, single (s) 4.2 6.5 6.3
tC, 2 stage (s)
tF (s) 2.3 3.6 3.4
p0 queue free % 99 96 92
cM capacity (veh/h) 1067 495 585
Direction, Lane # EB 1 WB 1 SB 1
Volume Total 47 474 67
Volume Left 14 0 18
Volume Right 0 7 49
cSH 1067 1700 557
Volume to Capacity 0.01 0.28 0.12
Queue Length 95th (ft) 1 0 10
Control Delay (s) 2.6 0.0 12.3
Lane LOS A B
Approach Delay (s) 2.6 0.0 12.3
Approach LOS B
Intersection Summary
Average Delay 1.6
Intersection Capacity Utilization 33.4% ICU Level of Service A
Analysis Period (min) 15

HCM Unsignalized Intersection Capacity Analysis
2: AZ-83 & EB Off-Ramp Page 2
Operations Year 20, 50% Carpool with no Copper Concentrate Trucks, Peak Season, Weekend, AM Synchro 7 Report
Tetra Tech ISG 2/5/2010
Movement NBL NBT NBR SBL SBT SBR SEL SER SWL SWR
Lane Configurations
Volume (veh/h) 0 380 50 0 27 0 0 201 0 0
Sign Control Free Free Yield Yield
Grade 0% 0% 0% 0%
Peak Hour Factor 0.92 0.92 0.92 0.92 0.92 0.92 0.92 0.92 0.92 0.92
Hourly flow rate (vph) 0 413 54 0 29 0 0 218 0 0
Pedestrians
Lane Width (ft)
Walking Speed (ft/s)
Percent Blockage
Right turn flare (veh)
Median type None None
Median storage veh)
Upstream signal (ft)
pX, platoon unblocked
vC, conflicting volume 29 467 497 29 661 442
vC1, stage 1 conf vol
vC2, stage 2 conf vol
vCu, unblocked vol 29 467 497 29 661 442
tC, single (s) 4.2 4.2 6.6 6.3 7.2 6.6
tC, 2 stage (s)
tF (s) 2.3 2.3 4.1 3.4 3.6 4.1
p0 queue free % 100 100 100 79 100 100
cM capacity (veh/h) 1558 1073 469 1034 292 504
Direction, Lane # NB 1 NB 2 SB 1 SE 1
Volume Total 413 54 29 218
Volume Left 0 0 0 0
Volume Right 0 54 0 218
cSH 1700 1700 1700 1034
Volume to Capacity 0.24 0.03 0.02 0.21
Queue Length 95th (ft) 0 0 0 20
Control Delay (s) 0.0 0.0 0.0 9.4
Lane LOS A
Approach Delay (s) 0.0 0.0 9.4
Approach LOS A
Intersection Summary
Average Delay 2.9
Intersection Capacity Utilization 23.3% ICU Level of Service A
Analysis Period (min) 15

HCM Unsignalized Intersection Capacity Analysis
3: Sahuarita Rd. & AZ-83 Page 1
Operations Year 20, 50% Carpool with no Copper Concentrate Trucks, Peak Season, Weekend, AM Synchro 7 Report
Tetra Tech ISG 2/5/2010
Movement EBL EBR NBL NBT SBT SBR
Lane Configurations
Volume (veh/h) 60 26 22 269 190 26
Sign Control Yield Free Free
Grade 0% 0% 0%
Peak Hour Factor 0.92 0.92 0.92 0.92 0.92 0.92
Hourly flow rate (vph) 65 28 24 292 207 28
Pedestrians
Lane Width (ft)
Walking Speed (ft/s)
Percent Blockage
Right turn flare (veh)
Median type None None
Median storage veh)
Upstream signal (ft)
pX, platoon unblocked
vC, conflicting volume 561 221 235
vC1, stage 1 conf vol
vC2, stage 2 conf vol
vCu, unblocked vol 561 221 235
tC, single (s) 6.5 6.3 4.2
tC, 2 stage (s)
tF (s) 3.6 3.4 2.3
p0 queue free % 86 96 98
cM capacity (veh/h) 470 804 1298
Direction, Lane # EB 1 NB 1 SB 1
Volume Total 93 316 235
Volume Left 65 24 0
Volume Right 28 0 28
cSH 538 1298 1700
Volume to Capacity 0.17 0.02 0.14
Queue Length 95th (ft) 16 1 0
Control Delay (s) 13.1 0.8 0.0
Lane LOS B A
Approach Delay (s) 13.1 0.8 0.0
Approach LOS B
Intersection Summary
Average Delay 2.3
Intersection Capacity Utilization 41.9% ICU Level of Service A
Analysis Period (min) 15

HCM Unsignalized Intersection Capacity Analysis
4: Hilton Ranch Rd. & AZ-83 Page 2
Operations Year 20, 50% Carpool with no Copper Concentrate Trucks, Peak Season, Weekend, AM Synchro 7 Report
Tetra Tech ISG 2/5/2010
Movement WBL WBR NBT NBR SBL SBT
Lane Configurations
Volume (veh/h) 0 0 176 0 4 224
Sign Control Yield Free Free
Grade 0% 0% 0%
Peak Hour Factor 0.92 0.92 0.92 0.92 0.92 0.92
Hourly flow rate (vph) 0 0 191 0 4 243
Pedestrians
Lane Width (ft)
Walking Speed (ft/s)
Percent Blockage
Right turn flare (veh)
Median type None None
Median storage veh)
Upstream signal (ft)
pX, platoon unblocked
vC, conflicting volume 443 191 191
vC1, stage 1 conf vol
vC2, stage 2 conf vol
vCu, unblocked vol 443 191 191
tC, single (s) 6.5 6.3 4.2
tC, 2 stage (s)
tF (s) 3.6 3.4 2.3
p0 queue free % 100 100 100
cM capacity (veh/h) 559 835 1347
Direction, Lane # WB 1 NB 1 SB 1
Volume Total 0 191 248
Volume Left 0 0 4
Volume Right 0 0 0
cSH 1700 1700 1347
Volume to Capacity 0.00 0.11 0.00
Queue Length 95th (ft) 0 0 0
Control Delay (s) 0.0 0.0 0.2
Lane LOS A A
Approach Delay (s) 0.0 0.0 0.2
Approach LOS A
Intersection Summary
Average Delay 0.1
Intersection Capacity Utilization 18.3% ICU Level of Service A
Analysis Period (min) 15

HCM Unsignalized Intersection Capacity Analysis
5: Hidden Valley Rd. & AZ-83 Page 3
Operations Year 20, 50% Carpool with no Copper Concentrate Trucks, Peak Season, Weekend, AM Synchro 7 Report
Tetra Tech ISG 2/5/2010
Movement EBL EBR NBL NBT SBT SBR
Lane Configurations
Volume (veh/h) 71 24 31 120 75 97
Sign Control Yield Free Free
Grade 0% 0% 0%
Peak Hour Factor 0.92 0.92 0.92 0.92 0.92 0.92
Hourly flow rate (vph) 77 26 34 130 82 105
Pedestrians
Lane Width (ft)
Walking Speed (ft/s)
Percent Blockage
Right turn flare (veh)
Median type None None
Median storage veh)
Upstream signal (ft)
pX, platoon unblocked
vC, conflicting volume 332 134 187
vC1, stage 1 conf vol
vC2, stage 2 conf vol
vCu, unblocked vol 332 134 187
tC, single (s) 6.5 6.3 4.2
tC, 2 stage (s)
tF (s) 3.6 3.4 2.3
p0 queue free % 88 97 98
cM capacity (veh/h) 634 899 1352
Direction, Lane # EB 1 NB 1 SB 1
Volume Total 103 164 187
Volume Left 77 34 0
Volume Right 26 0 105
cSH 685 1352 1700
Volume to Capacity 0.15 0.02 0.11
Queue Length 95th (ft) 13 2 0
Control Delay (s) 11.2 1.8 0.0
Lane LOS B A
Approach Delay (s) 11.2 1.8 0.0
Approach LOS B
Intersection Summary
Average Delay 3.2
Intersection Capacity Utilization 33.3% ICU Level of Service A
Analysis Period (min) 15

HCM Unsignalized Intersection Capacity Analysis
6: Rosemont Junction & AZ-83 Page 4
Operations Year 20, 50% Carpool with no Copper Concentrate Trucks, Peak Season, Weekend, AM Synchro 7 Report
Tetra Tech ISG 2/5/2010
Movement EBL EBR NBL NBT SBT SBR
Lane Configurations
Volume (veh/h) 4 0 0 177 151 4
Sign Control Yield Free Free
Grade 0% 0% 0%
Peak Hour Factor 0.92 0.92 0.92 0.92 0.92 0.92
Hourly flow rate (vph) 4 0 0 192 164 4
Pedestrians
Lane Width (ft)
Walking Speed (ft/s)
Percent Blockage
Right turn flare (veh)
Median type None None
Median storage veh)
Upstream signal (ft)
pX, platoon unblocked
vC, conflicting volume 359 166 168
vC1, stage 1 conf vol
vC2, stage 2 conf vol
vCu, unblocked vol 359 166 168
tC, single (s) 6.5 6.3 4.2
tC, 2 stage (s)
tF (s) 3.6 3.4 2.3
p0 queue free % 99 100 100
cM capacity (veh/h) 628 863 1373
Direction, Lane # EB 1 NB 1 SB 1
Volume Total 4 192 168
Volume Left 4 0 0
Volume Right 0 0 4
cSH 628 1373 1700
Volume to Capacity 0.01 0.00 0.10
Queue Length 95th (ft) 1 0 0
Control Delay (s) 10.8 0.0 0.0
Lane LOS B
Approach Delay (s) 10.8 0.0 0.0
Approach LOS B
Intersection Summary
Average Delay 0.1
Intersection Capacity Utilization 19.3% ICU Level of Service A
Analysis Period (min) 15

HCM Unsignalized Intersection Capacity Analysis
7: AZ-83 & Greaterville Rd. Page 5
Operations Year 20, 50% Carpool with no Copper Concentrate Trucks, Peak Season, Weekend, AM Synchro 7 Report
Tetra Tech ISG 2/5/2010
Movement SET SER NWL NWT NEL NER
Lane Configurations
Volume (veh/h) 110 0 0 151 0 0
Sign Control Free Free Yield
Grade 0% 0% 0%
Peak Hour Factor 0.92 0.92 0.92 0.92 0.92 0.92
Hourly flow rate (vph) 120 0 0 164 0 0
Pedestrians
Lane Width (ft)
Walking Speed (ft/s)
Percent Blockage
Right turn flare (veh)
Median type None None
Median storage veh)
Upstream signal (ft)
pX, platoon unblocked
vC, conflicting volume 120 284 120
vC1, stage 1 conf vol
vC2, stage 2 conf vol
vCu, unblocked vol 120 284 120
tC, single (s) 4.2 6.5 6.3
tC, 2 stage (s)
tF (s) 2.3 3.6 3.4
p0 queue free % 100 100 100
cM capacity (veh/h) 1432 694 916
Direction, Lane # SE 1 NW 1 NE 1
Volume Total 120 164 0
Volume Left 0 0 0
Volume Right 0 0 0
cSH 1700 1432 1700
Volume to Capacity 0.07 0.00 0.00
Queue Length 95th (ft) 0 0 0
Control Delay (s) 0.0 0.0 0.0
Lane LOS A
Approach Delay (s) 0.0 0.0 0.0
Approach LOS A
Intersection Summary
Average Delay 0.0
Intersection Capacity Utilization 11.3% ICU Level of Service A
Analysis Period (min) 15
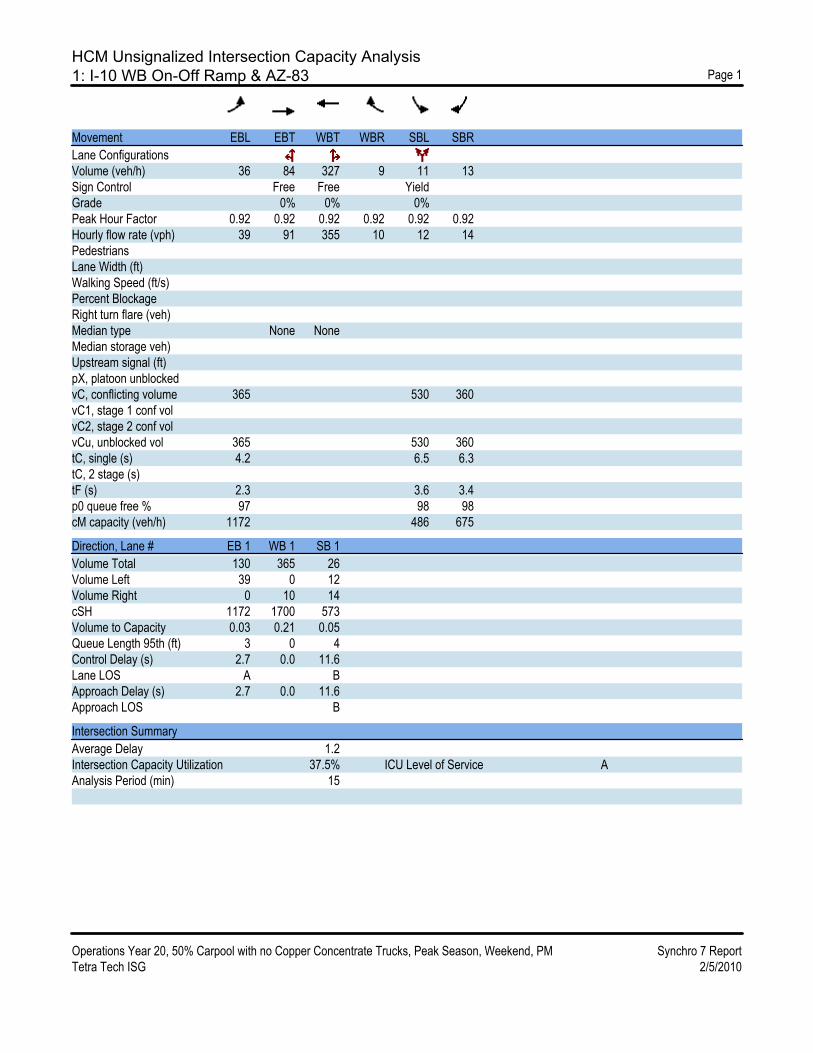
HCM Unsignalized Intersection Capacity Analysis
1: I-10 WB On-Off Ramp & AZ-83 Page 1
Operations Year 20, 50% Carpool with no Copper Concentrate Trucks, Peak Season, Weekend, PM Synchro 7 Report
Tetra Tech ISG 2/5/2010
Movement EBL EBT WBT WBR SBL SBR
Lane Configurations
Volume (veh/h) 36 84 327 9 11 13
Sign Control Free Free Yield
Grade 0% 0% 0%
Peak Hour Factor 0.92 0.92 0.92 0.92 0.92 0.92
Hourly flow rate (vph) 39 91 355 10 12 14
Pedestrians
Lane Width (ft)
Walking Speed (ft/s)
Percent Blockage
Right turn flare (veh)
Median type None None
Median storage veh)
Upstream signal (ft)
pX, platoon unblocked
vC, conflicting volume 365 530 360
vC1, stage 1 conf vol
vC2, stage 2 conf vol
vCu, unblocked vol 365 530 360
tC, single (s) 4.2 6.5 6.3
tC, 2 stage (s)
tF (s) 2.3 3.6 3.4
p0 queue free % 97 98 98
cM capacity (veh/h) 1172 486 675
Direction, Lane # EB 1 WB 1 SB 1
Volume Total 130 365 26
Volume Left 39 0 12
Volume Right 0 10 14
cSH 1172 1700 573
Volume to Capacity 0.03 0.21 0.05
Queue Length 95th (ft) 3 0 4
Control Delay (s) 2.7 0.0 11.6
Lane LOS A B
Approach Delay (s) 2.7 0.0 11.6
Approach LOS B
Intersection Summary
Average Delay 1.2
Intersection Capacity Utilization 37.5% ICU Level of Service A
Analysis Period (min) 15

HCM Unsignalized Intersection Capacity Analysis
2: AZ-83 & EB Off-Ramp Page 2
Operations Year 20, 50% Carpool with no Copper Concentrate Trucks, Peak Season, Weekend, PM Synchro 7 Report
Tetra Tech ISG 2/5/2010
Movement NBL NBT NBR SBL SBT SBR SEL SER SWL SWR
Lane Configurations
Volume (veh/h) 0 328 57 0 95 0 0 413 0 0
Sign Control Free Free Yield Yield
Grade 0% 0% 0% 0%
Peak Hour Factor 0.92 0.92 0.92 0.92 0.92 0.92 0.92 0.92 0.92 0.92
Hourly flow rate (vph) 0 357 62 0 103 0 0 449 0 0
Pedestrians
Lane Width (ft)
Walking Speed (ft/s)
Percent Blockage
Right turn flare (veh)
Median type None None
Median storage veh)
Upstream signal (ft)
pX, platoon unblocked
vC, conflicting volume 103 418 522 103 909 460
vC1, stage 1 conf vol
vC2, stage 2 conf vol
vCu, unblocked vol 103 418 522 103 909 460
tC, single (s) 4.2 4.2 6.6 6.3 7.2 6.6
tC, 2 stage (s)
tF (s) 2.3 2.3 4.1 3.4 3.6 4.1
p0 queue free % 100 100 100 52 100 100
cM capacity (veh/h) 1464 1119 454 941 132 492
Direction, Lane # NB 1 NB 2 SB 1 SE 1
Volume Total 357 62 103 449
Volume Left 0 0 0 0
Volume Right 0 62 0 449
cSH 1700 1700 1700 941
Volume to Capacity 0.21 0.04 0.06 0.48
Queue Length 95th (ft) 0 0 0 66
Control Delay (s) 0.0 0.0 0.0 12.3
Lane LOS B
Approach Delay (s) 0.0 0.0 12.3
Approach LOS B
Intersection Summary
Average Delay 5.7
Intersection Capacity Utilization 37.2% ICU Level of Service A
Analysis Period (min) 15

HCM Unsignalized Intersection Capacity Analysis
3: Sahuarita Rd. & AZ-83 Page 1
Operations Year 20, 50% Carpool with no Copper Concentrate Trucks, Peak Season, Weekend, PM Synchro 7 Report
Tetra Tech ISG 2/5/2010
Movement EBL EBR NBL NBT SBT SBR
Lane Configurations
Volume (veh/h) 79 22 34 232 236 150
Sign Control Yield Free Free
Grade 0% 0% 0%
Peak Hour Factor 0.92 0.92 0.92 0.92 0.92 0.92
Hourly flow rate (vph) 86 24 37 252 257 163
Pedestrians
Lane Width (ft)
Walking Speed (ft/s)
Percent Blockage
Right turn flare (veh)
Median type None None
Median storage veh)
Upstream signal (ft)
pX, platoon unblocked
vC, conflicting volume 664 338 420
vC1, stage 1 conf vol
vC2, stage 2 conf vol
vCu, unblocked vol 664 338 420
tC, single (s) 6.5 6.3 4.2
tC, 2 stage (s)
tF (s) 3.6 3.4 2.3
p0 queue free % 79 97 97
cM capacity (veh/h) 406 695 1118
Direction, Lane # EB 1 NB 1 SB 1
Volume Total 110 289 420
Volume Left 86 37 0
Volume Right 24 0 163
cSH 446 1118 1700
Volume to Capacity 0.25 0.03 0.25
Queue Length 95th (ft) 24 3 0
Control Delay (s) 15.7 1.3 0.0
Lane LOS C A
Approach Delay (s) 15.7 1.3 0.0
Approach LOS C
Intersection Summary
Average Delay 2.6
Intersection Capacity Utilization 51.4% ICU Level of Service A
Analysis Period (min) 15

HCM Unsignalized Intersection Capacity Analysis
4: Hilton Ranch Rd. & AZ-83 Page 2
Operations Year 20, 50% Carpool with no Copper Concentrate Trucks, Peak Season, Weekend, PM Synchro 7 Report
Tetra Tech ISG 2/5/2010
Movement WBL WBR NBT NBR SBL SBT
Lane Configurations
Volume (veh/h) 0 0 235 0 19 206
Sign Control Yield Free Free
Grade 0% 0% 0%
Peak Hour Factor 0.92 0.92 0.92 0.92 0.92 0.92
Hourly flow rate (vph) 0 0 255 0 21 224
Pedestrians
Lane Width (ft)
Walking Speed (ft/s)
Percent Blockage
Right turn flare (veh)
Median type None None
Median storage veh)
Upstream signal (ft)
pX, platoon unblocked
vC, conflicting volume 521 255 255
vC1, stage 1 conf vol
vC2, stage 2 conf vol
vCu, unblocked vol 521 255 255
tC, single (s) 6.5 6.3 4.2
tC, 2 stage (s)
tF (s) 3.6 3.4 2.3
p0 queue free % 100 100 98
cM capacity (veh/h) 501 774 1287
Direction, Lane # WB 1 NB 1 SB 1
Volume Total 0 255 245
Volume Left 0 0 21
Volume Right 0 0 0
cSH 1700 1700 1287
Volume to Capacity 0.00 0.15 0.02
Queue Length 95th (ft) 0 0 1
Control Delay (s) 0.0 0.0 0.8
Lane LOS A A
Approach Delay (s) 0.0 0.0 0.8
Approach LOS A
Intersection Summary
Average Delay 0.4
Intersection Capacity Utilization 29.9% ICU Level of Service A
Analysis Period (min) 15

HCM Unsignalized Intersection Capacity Analysis
5: Hidden Valley Rd. & AZ-83 Page 3
Operations Year 20, 50% Carpool with no Copper Concentrate Trucks, Peak Season, Weekend, PM Synchro 7 Report
Tetra Tech ISG 2/5/2010
Movement EBL EBR NBL NBT SBT SBR
Lane Configurations
Volume (veh/h) 97 35 31 142 224 71
Sign Control Yield Free Free
Grade 0% 0% 0%
Peak Hour Factor 0.92 0.92 0.92 0.92 0.92 0.92
Hourly flow rate (vph) 105 38 34 154 243 77
Pedestrians
Lane Width (ft)
Walking Speed (ft/s)
Percent Blockage
Right turn flare (veh)
Median type None None
Median storage veh)
Upstream signal (ft)
pX, platoon unblocked
vC, conflicting volume 504 282 321
vC1, stage 1 conf vol
vC2, stage 2 conf vol
vCu, unblocked vol 504 282 321
tC, single (s) 6.5 6.3 4.2
tC, 2 stage (s)
tF (s) 3.6 3.4 2.3
p0 queue free % 79 95 97
cM capacity (veh/h) 506 747 1217
Direction, Lane # EB 1 NB 1 SB 1
Volume Total 143 188 321
Volume Left 105 34 0
Volume Right 38 0 77
cSH 554 1217 1700
Volume to Capacity 0.26 0.03 0.19
Queue Length 95th (ft) 26 2 0
Control Delay (s) 13.8 1.6 0.0
Lane LOS B A
Approach Delay (s) 13.8 1.6 0.0
Approach LOS B
Intersection Summary
Average Delay 3.5
Intersection Capacity Utilization 42.8% ICU Level of Service A
Analysis Period (min) 15

HCM Unsignalized Intersection Capacity Analysis
6: Rosemont Junction & AZ-83 Page 4
Operations Year 20, 50% Carpool with no Copper Concentrate Trucks, Peak Season, Weekend, PM Synchro 7 Report
Tetra Tech ISG 2/5/2010
Movement EBL EBR NBL NBT SBT SBR
Lane Configurations
Volume (veh/h) 0 0 0 181 218 0
Sign Control Yield Free Free
Grade 0% 0% 0%
Peak Hour Factor 0.92 0.92 0.92 0.92 0.92 0.92
Hourly flow rate (vph) 0 0 0 197 237 0
Pedestrians
Lane Width (ft)
Walking Speed (ft/s)
Percent Blockage
Right turn flare (veh)
Median type None None
Median storage veh)
Upstream signal (ft)
pX, platoon unblocked
vC, conflicting volume 434 237 237
vC1, stage 1 conf vol
vC2, stage 2 conf vol
vCu, unblocked vol 434 237 237
tC, single (s) 6.5 6.3 4.2
tC, 2 stage (s)
tF (s) 3.6 3.4 2.3
p0 queue free % 100 100 100
cM capacity (veh/h) 572 792 1307
Direction, Lane # EB 1 NB 1 SB 1
Volume Total 0 197 237
Volume Left 0 0 0
Volume Right 0 0 0
cSH 1700 1307 1700
Volume to Capacity 0.00 0.00 0.14
Queue Length 95th (ft) 0 0 0
Control Delay (s) 0.0 0.0 0.0
Lane LOS A
Approach Delay (s) 0.0 0.0 0.0
Approach LOS A
Intersection Summary
Average Delay 0.0
Intersection Capacity Utilization 14.8% ICU Level of Service A
Analysis Period (min) 15

HCM Unsignalized Intersection Capacity Analysis
7: AZ-83 & Greaterville Rd. Page 5
Operations Year 20, 50% Carpool with no Copper Concentrate Trucks, Peak Season, Weekend, PM Synchro 7 Report
Tetra Tech ISG 2/5/2010
Movement SET SER NWL NWT NEL NER
Lane Configurations
Volume (veh/h) 181 0 11 188 7 11
Sign Control Free Free Yield
Grade 0% 0% 0%
Peak Hour Factor 0.92 0.92 0.92 0.92 0.92 0.92
Hourly flow rate (vph) 197 0 12 204 8 12
Pedestrians
Lane Width (ft)
Walking Speed (ft/s)
Percent Blockage
Right turn flare (veh)
Median type None None
Median storage veh)
Upstream signal (ft)
pX, platoon unblocked
vC, conflicting volume 197 425 197
vC1, stage 1 conf vol
vC2, stage 2 conf vol
vCu, unblocked vol 197 425 197
tC, single (s) 4.2 6.5 6.3
tC, 2 stage (s)
tF (s) 2.3 3.6 3.4
p0 queue free % 99 99 99
cM capacity (veh/h) 1352 573 834
Direction, Lane # SE 1 NW 1 NE 1
Volume Total 197 216 20
Volume Left 0 12 8
Volume Right 0 0 12
cSH 1700 1352 709
Volume to Capacity 0.12 0.01 0.03
Queue Length 95th (ft) 0 1 2
Control Delay (s) 0.0 0.5 10.2
Lane LOS A B
Approach Delay (s) 0.0 0.5 10.2
Approach LOS B
Intersection Summary
Average Delay 0.7
Intersection Capacity Utilization 28.9% ICU Level of Service A
Analysis Period (min) 15

ATTACHMENT 4
OPERATIONS YEAR 20 LOS WORKSHEETS –
SEGMENTS

NON-PEAK SEASON
SCENARIO 3
NO CARPOOL

TWO-WAY TWO-LANE HIGHWAY SEGMENT WORKSHEETGeneral Information Site InformationAnalyst Tetra Tech ISGAgency or Company Rosemont Copper CompanyDate Performed 1/15/2010Analysis Time Period Non-Peak Season, Weekday, AM
Highway AZ-83From/To I-10 Ramps/Hidden Valley RdJurisdiction Pima CountyAnalysis Year Operations Year 20, No Carpool
Input Data
Class I highway Class II highway
Terrain Level RollingTwo-way hourly volume 663 veh/hDirectional split 50 / 50Peak-hour factor, PHF 0.88No-passing zone 100 % Trucks and Buses , PT 4 %
% Recreational vehicles, PR 4%
Access points/ mi 1
Average Travel Speed
Grade adjustment factor, fG (Exhibit 20-7) 0.93
Passenger-car equivalents for trucks, ET (Exhibit 20-9) 1.9
Passenger-car equivalents for RVs, ER (Exhibit 20-9) 1.1
Heavy-vehicle adjustment factor, fHV fHV=1/ (1+ PT(ET-1)+PR(ER-1) ) 0.962
Two-way flow rate1, vp (pc/h) vp=V/ (PHF * fG * fHV) 843
vp * highest directional split proportion2 (pc/h) 422
Free-Flow Speed from Field Measurement Estimated Free-Flow Speed
Field Measured speed, SFM mi/h
Observed volume, Vf veh/h
Free-flow speed, FFS FFS=SFM+0.00776(Vf/ fHV ) 57.2 mi/h
Base free-flow speed, BFFSFM 60.0mi/h
Adj. for lane width and shoulder width3, fLS (Exhibit 20-5) 2.6mi/h
Adj. for access points, fA (Exhibit 20-6) 0.3
mi/h
Free-flow speed, FFS (FSS=BFFS-fLS-fA) 57.2mi/h
Adj. for no-passing zones, fnp ( mi/h) (Exhibit 20-11) 2.9
Average travel speed, ATS ( mi/h) ATS=FFS-0.00776vp-fnp 47.7
Percent Time-Spent-Following
Grade Adjustment factor, fG (Exhibit 20-8) 0.94
Passenger-car equivalents for trucks, ET (Exhibit 20-10) 1.5
Passenger-car equivalents for RVs, ER (Exhibit 20-10) 1.0
Heavy-vehicle adjustment factor, fHV fHV=1/ (1+ PT(ET-1)+PR(ER-1) ) 0.980
Two-way flow rate1, vp (pc/h) vp=V/ (PHF * fG * fHV) 818
vp * highest directional split proportion2 (pc/h) 409
Base percent time-spent-following, BPTSF(%) BPTSF=100(1-e-0.000879vp) 51.3
Adj. for directional distribution and no-passing zone, fd/hp(%)(Exh. 20-12) 15.2
Percent time-spent-following, PTSF(%) PTSF=BPTSF+f d/np 66.5
Level of Service and Other Performance MeasuresLevel of service, LOS (Exhibit 20-3 for Class I or 20-4 for Class II) C
Volume to capacity ratio v/c v/c=Vp/ 3,200 0.26
Peak 15-min veh-miles of travel,VMT15 (veh- mi) VMT15= 0.25Lt(V/PHF) 1884
Peak-hour vehicle-miles of travel, VMT60 (veh- mi) VMT60=V*Lt 6630
Peak 15-min total travel time, TT15(veh-h) TT15= VMT15/ATS 39.5
Notes
1. If vp >= 3,200 pc/h, terminate analysis-the LOS is F. 2. If highest directional split vp>= 1,700 pc/h, terminated anlysis-the LOS is F.
HCS2000TM Copyright © 2000 University of Florida, All Rights Reserved Version 4.1f
Page 1 of 1Two-Way
1/20/2010file://C:\Documents and Settings\max.scheideman\Local Settings\Temp\s2k1A6A.tmp

TWO-WAY TWO-LANE HIGHWAY SEGMENT WORKSHEETGeneral Information Site InformationAnalyst Tetra Tech ISGAgency or Company Rosemont Copper CompanyDate Performed 1/15/2010Analysis Time Period Non-Peak Season, Weekday, AM
Highway AZ-83From/To Hidden Valley Rd/GreatervilleJurisdiction Pima CountyAnalysis Year Operations Year 20, No Carpool
Input Data
Class I highway Class II highway
Terrain Level RollingTwo-way hourly volume 803 veh/hDirectional split 50 / 50Peak-hour factor, PHF 0.88No-passing zone 100 % Trucks and Buses , PT 4 %
% Recreational vehicles, PR 4%
Access points/ mi 0
Average Travel Speed
Grade adjustment factor, fG (Exhibit 20-7) 0.93
Passenger-car equivalents for trucks, ET (Exhibit 20-9) 1.9
Passenger-car equivalents for RVs, ER (Exhibit 20-9) 1.1
Heavy-vehicle adjustment factor, fHV fHV=1/ (1+ PT(ET-1)+PR(ER-1) ) 0.962
Two-way flow rate1, vp (pc/h) vp=V/ (PHF * fG * fHV) 1020
vp * highest directional split proportion2 (pc/h) 510
Free-Flow Speed from Field Measurement Estimated Free-Flow Speed
Field Measured speed, SFM mi/h
Observed volume, Vf veh/h
Free-flow speed, FFS FFS=SFM+0.00776(Vf/ fHV ) 57.4 mi/h
Base free-flow speed, BFFSFM 60.0mi/h
Adj. for lane width and shoulder width3, fLS (Exhibit 20-5) 2.6mi/h
Adj. for access points, fA (Exhibit 20-6) 0.0
mi/h
Free-flow speed, FFS (FSS=BFFS-fLS-fA) 57.4mi/h
Adj. for no-passing zones, fnp ( mi/h) (Exhibit 20-11) 2.5
Average travel speed, ATS ( mi/h) ATS=FFS-0.00776vp-fnp 46.9
Percent Time-Spent-Following
Grade Adjustment factor, fG (Exhibit 20-8) 0.94
Passenger-car equivalents for trucks, ET (Exhibit 20-10) 1.5
Passenger-car equivalents for RVs, ER (Exhibit 20-10) 1.0
Heavy-vehicle adjustment factor, fHV fHV=1/ (1+ PT(ET-1)+PR(ER-1) ) 0.980
Two-way flow rate1, vp (pc/h) vp=V/ (PHF * fG * fHV) 990
vp * highest directional split proportion2 (pc/h) 495
Base percent time-spent-following, BPTSF(%) BPTSF=100(1-e-0.000879vp) 58.1
Adj. for directional distribution and no-passing zone, fd/hp(%)(Exh. 20-12) 13.0
Percent time-spent-following, PTSF(%) PTSF=BPTSF+f d/np 71.1
Level of Service and Other Performance MeasuresLevel of service, LOS (Exhibit 20-3 for Class I or 20-4 for Class II) D
Volume to capacity ratio v/c v/c=Vp/ 3,200 0.32
Peak 15-min veh-miles of travel,VMT15 (veh- mi) VMT15= 0.25Lt(V/PHF) 1369
Peak-hour vehicle-miles of travel, VMT60 (veh- mi) VMT60=V*Lt 4818
Peak 15-min total travel time, TT15(veh-h) TT15= VMT15/ATS 29.2
Notes
1. If vp >= 3,200 pc/h, terminate analysis-the LOS is F. 2. If highest directional split vp>= 1,700 pc/h, terminated anlysis-the LOS is F.
HCS2000TM Copyright © 2000 University of Florida, All Rights Reserved Version 4.1f
Page 1 of 1Two-Way
1/20/2010file://C:\Documents and Settings\max.scheideman\Local Settings\Temp\s2k1A77.tmp

TWO-WAY TWO-LANE HIGHWAY SEGMENT WORKSHEETGeneral Information Site InformationAnalyst Tetra Tech ISGAgency or Company Rosemont Copper CompanyDate Performed 1/1/5/2010Analysis Time Period Non-Peak Season, Weekday, PM
Highway AZ-83From/To I-10 Ramp/Hidden Valley RdJurisdiction Pima CountyAnalysis Year Operations Year 20, No Carpool
Input Data
Class I highway Class II highway
Terrain Level RollingTwo-way hourly volume 775 veh/hDirectional split 50 / 50Peak-hour factor, PHF 0.88No-passing zone 100 % Trucks and Buses , PT 4 %
% Recreational vehicles, PR 4%
Access points/ mi 1
Average Travel Speed
Grade adjustment factor, fG (Exhibit 20-7) 0.93
Passenger-car equivalents for trucks, ET (Exhibit 20-9) 1.9
Passenger-car equivalents for RVs, ER (Exhibit 20-9) 1.1
Heavy-vehicle adjustment factor, fHV fHV=1/ (1+ PT(ET-1)+PR(ER-1) ) 0.962
Two-way flow rate1, vp (pc/h) vp=V/ (PHF * fG * fHV) 985
vp * highest directional split proportion2 (pc/h) 493
Free-Flow Speed from Field Measurement Estimated Free-Flow Speed
Field Measured speed, SFM mi/h
Observed volume, Vf veh/h
Free-flow speed, FFS FFS=SFM+0.00776(Vf/ fHV ) 57.2 mi/h
Base free-flow speed, BFFSFM 60.0mi/h
Adj. for lane width and shoulder width3, fLS (Exhibit 20-5) 2.6mi/h
Adj. for access points, fA (Exhibit 20-6) 0.3
mi/h
Free-flow speed, FFS (FSS=BFFS-fLS-fA) 57.2mi/h
Adj. for no-passing zones, fnp ( mi/h) (Exhibit 20-11) 2.6
Average travel speed, ATS ( mi/h) ATS=FFS-0.00776vp-fnp 46.9
Percent Time-Spent-Following
Grade Adjustment factor, fG (Exhibit 20-8) 0.94
Passenger-car equivalents for trucks, ET (Exhibit 20-10) 1.5
Passenger-car equivalents for RVs, ER (Exhibit 20-10) 1.0
Heavy-vehicle adjustment factor, fHV fHV=1/ (1+ PT(ET-1)+PR(ER-1) ) 0.980
Two-way flow rate1, vp (pc/h) vp=V/ (PHF * fG * fHV) 956
vp * highest directional split proportion2 (pc/h) 478
Base percent time-spent-following, BPTSF(%) BPTSF=100(1-e-0.000879vp) 56.8
Adj. for directional distribution and no-passing zone, fd/hp(%)(Exh. 20-12) 13.4
Percent time-spent-following, PTSF(%) PTSF=BPTSF+f d/np 70.3
Level of Service and Other Performance MeasuresLevel of service, LOS (Exhibit 20-3 for Class I or 20-4 for Class II) D
Volume to capacity ratio v/c v/c=Vp/ 3,200 0.31
Peak 15-min veh-miles of travel,VMT15 (veh- mi) VMT15= 0.25Lt(V/PHF) 2202
Peak-hour vehicle-miles of travel, VMT60 (veh- mi) VMT60=V*Lt 7750
Peak 15-min total travel time, TT15(veh-h) TT15= VMT15/ATS 47.0
Notes
1. If vp >= 3,200 pc/h, terminate analysis-the LOS is F. 2. If highest directional split vp>= 1,700 pc/h, terminated anlysis-the LOS is F.
HCS2000TM Copyright © 2000 University of Florida, All Rights Reserved Version 4.1f
Page 1 of 1Two-Way
1/20/2010file://C:\Documents and Settings\max.scheideman\Local Settings\Temp\s2k1A7E.tmp

TWO-WAY TWO-LANE HIGHWAY SEGMENT WORKSHEETGeneral Information Site InformationAnalyst Tetra Tech ISGAgency or Company Rosemont Copper CompanyDate Performed 1/15/2010Analysis Time Period Non-Peak Season, Weekday, PM
Highway AZ-83From/To Hidden Valley Rd/GreatervilleJurisdiction Pima CountyAnalysis Year Operations Year 20, No Carpool
Input Data
Class I highway Class II highway
Terrain Level RollingTwo-way hourly volume 781 veh/hDirectional split 50 / 50Peak-hour factor, PHF 0.88No-passing zone 100 % Trucks and Buses , PT 4 %
% Recreational vehicles, PR 4%
Access points/ mi 0
Average Travel Speed
Grade adjustment factor, fG (Exhibit 20-7) 0.93
Passenger-car equivalents for trucks, ET (Exhibit 20-9) 1.9
Passenger-car equivalents for RVs, ER (Exhibit 20-9) 1.1
Heavy-vehicle adjustment factor, fHV fHV=1/ (1+ PT(ET-1)+PR(ER-1) ) 0.962
Two-way flow rate1, vp (pc/h) vp=V/ (PHF * fG * fHV) 992
vp * highest directional split proportion2 (pc/h) 496
Free-Flow Speed from Field Measurement Estimated Free-Flow Speed
Field Measured speed, SFM mi/h
Observed volume, Vf veh/h
Free-flow speed, FFS FFS=SFM+0.00776(Vf/ fHV ) 57.4 mi/h
Base free-flow speed, BFFSFM 60.0mi/h
Adj. for lane width and shoulder width3, fLS (Exhibit 20-5) 2.6mi/h
Adj. for access points, fA (Exhibit 20-6) 0.0
mi/h
Free-flow speed, FFS (FSS=BFFS-fLS-fA) 57.4mi/h
Adj. for no-passing zones, fnp ( mi/h) (Exhibit 20-11) 2.6
Average travel speed, ATS ( mi/h) ATS=FFS-0.00776vp-fnp 47.1
Percent Time-Spent-Following
Grade Adjustment factor, fG (Exhibit 20-8) 0.94
Passenger-car equivalents for trucks, ET (Exhibit 20-10) 1.5
Passenger-car equivalents for RVs, ER (Exhibit 20-10) 1.0
Heavy-vehicle adjustment factor, fHV fHV=1/ (1+ PT(ET-1)+PR(ER-1) ) 0.980
Two-way flow rate1, vp (pc/h) vp=V/ (PHF * fG * fHV) 963
vp * highest directional split proportion2 (pc/h) 482
Base percent time-spent-following, BPTSF(%) BPTSF=100(1-e-0.000879vp) 57.1
Adj. for directional distribution and no-passing zone, fd/hp(%)(Exh. 20-12) 13.4
Percent time-spent-following, PTSF(%) PTSF=BPTSF+f d/np 70.5
Level of Service and Other Performance MeasuresLevel of service, LOS (Exhibit 20-3 for Class I or 20-4 for Class II) D
Volume to capacity ratio v/c v/c=Vp/ 3,200 0.31
Peak 15-min veh-miles of travel,VMT15 (veh- mi) VMT15= 0.25Lt(V/PHF) 1331
Peak-hour vehicle-miles of travel, VMT60 (veh- mi) VMT60=V*Lt 4686
Peak 15-min total travel time, TT15(veh-h) TT15= VMT15/ATS 28.3
Notes
1. If vp >= 3,200 pc/h, terminate analysis-the LOS is F. 2. If highest directional split vp>= 1,700 pc/h, terminated anlysis-the LOS is F.
HCS2000TM Copyright © 2000 University of Florida, All Rights Reserved Version 4.1f
Page 1 of 1Two-Way
1/20/2010file://C:\Documents and Settings\max.scheideman\Local Settings\Temp\s2k1A86.tmp

TWO-WAY TWO-LANE HIGHWAY SEGMENT WORKSHEETGeneral Information Site InformationAnalyst Tetra Tech ISGAgency or Company Rosemont Copper CompanyDate Performed 1/15/2010Analysis Time Period Non-Peak Season, Weekend, AM
Highway AZ-83From/To I-10 Ramp/Hidden Valley RdJurisdiction Pima CountyAnalysis Year Operations Year 20, No Carpool
Input Data
Class I highway Class II highway
Terrain Level RollingTwo-way hourly volume 709 veh/hDirectional split 50 / 50Peak-hour factor, PHF 0.88No-passing zone 100 % Trucks and Buses , PT 4 %
% Recreational vehicles, PR 4%
Access points/ mi 1
Average Travel Speed
Grade adjustment factor, fG (Exhibit 20-7) 0.93
Passenger-car equivalents for trucks, ET (Exhibit 20-9) 1.9
Passenger-car equivalents for RVs, ER (Exhibit 20-9) 1.1
Heavy-vehicle adjustment factor, fHV fHV=1/ (1+ PT(ET-1)+PR(ER-1) ) 0.962
Two-way flow rate1, vp (pc/h) vp=V/ (PHF * fG * fHV) 901
vp * highest directional split proportion2 (pc/h) 451
Free-Flow Speed from Field Measurement Estimated Free-Flow Speed
Field Measured speed, SFM mi/h
Observed volume, Vf veh/h
Free-flow speed, FFS FFS=SFM+0.00776(Vf/ fHV ) 57.2 mi/h
Base free-flow speed, BFFSFM 60.0mi/h
Adj. for lane width and shoulder width3, fLS (Exhibit 20-5) 2.6mi/h
Adj. for access points, fA (Exhibit 20-6) 0.3
mi/h
Free-flow speed, FFS (FSS=BFFS-fLS-fA) 57.2mi/h
Adj. for no-passing zones, fnp ( mi/h) (Exhibit 20-11) 2.8
Average travel speed, ATS ( mi/h) ATS=FFS-0.00776vp-fnp 47.4
Percent Time-Spent-Following
Grade Adjustment factor, fG (Exhibit 20-8) 0.94
Passenger-car equivalents for trucks, ET (Exhibit 20-10) 1.5
Passenger-car equivalents for RVs, ER (Exhibit 20-10) 1.0
Heavy-vehicle adjustment factor, fHV fHV=1/ (1+ PT(ET-1)+PR(ER-1) ) 0.980
Two-way flow rate1, vp (pc/h) vp=V/ (PHF * fG * fHV) 874
vp * highest directional split proportion2 (pc/h) 437
Base percent time-spent-following, BPTSF(%) BPTSF=100(1-e-0.000879vp) 53.6
Adj. for directional distribution and no-passing zone, fd/hp(%)(Exh. 20-12) 14.5
Percent time-spent-following, PTSF(%) PTSF=BPTSF+f d/np 68.1
Level of Service and Other Performance MeasuresLevel of service, LOS (Exhibit 20-3 for Class I or 20-4 for Class II) C
Volume to capacity ratio v/c v/c=Vp/ 3,200 0.28
Peak 15-min veh-miles of travel,VMT15 (veh- mi) VMT15= 0.25Lt(V/PHF) 2014
Peak-hour vehicle-miles of travel, VMT60 (veh- mi) VMT60=V*Lt 7090
Peak 15-min total travel time, TT15(veh-h) TT15= VMT15/ATS 42.5
Notes
1. If vp >= 3,200 pc/h, terminate analysis-the LOS is F. 2. If highest directional split vp>= 1,700 pc/h, terminated anlysis-the LOS is F.
HCS2000TM Copyright © 2000 University of Florida, All Rights Reserved Version 4.1f
Page 1 of 1Two-Way
1/20/2010file://C:\Documents and Settings\max.scheideman\Local Settings\Temp\s2k1A8E.tmp

TWO-WAY TWO-LANE HIGHWAY SEGMENT WORKSHEETGeneral Information Site InformationAnalyst Tetra Tech ISGAgency or Company Rosemont Copper CompanyDate Performed 1/15/2010Analysis Time Period Non Peak Season, Weekend, AM
Highway AZ-83From/To Hidden Valley Rd/GreatervilleJurisdiction Pima CountyAnalysis Year Operations Year 20, No Carpool
Input Data
Class I highway Class II highway
Terrain Level RollingTwo-way hourly volume 624 veh/hDirectional split 50 / 50Peak-hour factor, PHF 0.88No-passing zone 100 % Trucks and Buses , PT 4 %
% Recreational vehicles, PR 4%
Access points/ mi 0
Average Travel Speed
Grade adjustment factor, fG (Exhibit 20-7) 0.93
Passenger-car equivalents for trucks, ET (Exhibit 20-9) 1.9
Passenger-car equivalents for RVs, ER (Exhibit 20-9) 1.1
Heavy-vehicle adjustment factor, fHV fHV=1/ (1+ PT(ET-1)+PR(ER-1) ) 0.962
Two-way flow rate1, vp (pc/h) vp=V/ (PHF * fG * fHV) 793
vp * highest directional split proportion2 (pc/h) 397
Free-Flow Speed from Field Measurement Estimated Free-Flow Speed
Field Measured speed, SFM mi/h
Observed volume, Vf veh/h
Free-flow speed, FFS FFS=SFM+0.00776(Vf/ fHV ) 57.4 mi/h
Base free-flow speed, BFFSFM 60.0mi/h
Adj. for lane width and shoulder width3, fLS (Exhibit 20-5) 2.6mi/h
Adj. for access points, fA (Exhibit 20-6) 0.0
mi/h
Free-flow speed, FFS (FSS=BFFS-fLS-fA) 57.4mi/h
Adj. for no-passing zones, fnp ( mi/h) (Exhibit 20-11) 3.0
Average travel speed, ATS ( mi/h) ATS=FFS-0.00776vp-fnp 48.2
Percent Time-Spent-Following
Grade Adjustment factor, fG (Exhibit 20-8) 0.94
Passenger-car equivalents for trucks, ET (Exhibit 20-10) 1.5
Passenger-car equivalents for RVs, ER (Exhibit 20-10) 1.0
Heavy-vehicle adjustment factor, fHV fHV=1/ (1+ PT(ET-1)+PR(ER-1) ) 0.980
Two-way flow rate1, vp (pc/h) vp=V/ (PHF * fG * fHV) 769
vp * highest directional split proportion2 (pc/h) 385
Base percent time-spent-following, BPTSF(%) BPTSF=100(1-e-0.000879vp) 49.1
Adj. for directional distribution and no-passing zone, fd/hp(%)(Exh. 20-12) 16.2
Percent time-spent-following, PTSF(%) PTSF=BPTSF+f d/np 65.3
Level of Service and Other Performance MeasuresLevel of service, LOS (Exhibit 20-3 for Class I or 20-4 for Class II) C
Volume to capacity ratio v/c v/c=Vp/ 3,200 0.25
Peak 15-min veh-miles of travel,VMT15 (veh- mi) VMT15= 0.25Lt(V/PHF) 1064
Peak-hour vehicle-miles of travel, VMT60 (veh- mi) VMT60=V*Lt 3744
Peak 15-min total travel time, TT15(veh-h) TT15= VMT15/ATS 22.1
Notes
1. If vp >= 3,200 pc/h, terminate analysis-the LOS is F. 2. If highest directional split vp>= 1,700 pc/h, terminated anlysis-the LOS is F.
HCS2000TM Copyright © 2000 University of Florida, All Rights Reserved Version 4.1f
Page 1 of 1Two-Way
1/20/2010file://C:\Documents and Settings\max.scheideman\Local Settings\Temp\s2k1A97.tmp

TWO-WAY TWO-LANE HIGHWAY SEGMENT WORKSHEETGeneral Information Site InformationAnalyst Tetra Tech ISGAgency or Company Rosemont Copper CompanyDate Performed 1/15/2010Analysis Time Period Non-Peak Season, Weekend, PM
Highway AZ-83From/To I-10 Ramps/Hidden Valley RdJurisdiction Pima CountyAnalysis Year Operations Year 20, No Carpool
Input Data
Class I highway Class II highway
Terrain Level RollingTwo-way hourly volume 773 veh/hDirectional split 50 / 50Peak-hour factor, PHF 0.88No-passing zone 100 % Trucks and Buses , PT 4 %
% Recreational vehicles, PR 4%
Access points/ mi 1
Average Travel Speed
Grade adjustment factor, fG (Exhibit 20-7) 0.93
Passenger-car equivalents for trucks, ET (Exhibit 20-9) 1.9
Passenger-car equivalents for RVs, ER (Exhibit 20-9) 1.1
Heavy-vehicle adjustment factor, fHV fHV=1/ (1+ PT(ET-1)+PR(ER-1) ) 0.962
Two-way flow rate1, vp (pc/h) vp=V/ (PHF * fG * fHV) 982
vp * highest directional split proportion2 (pc/h) 491
Free-Flow Speed from Field Measurement Estimated Free-Flow Speed
Field Measured speed, SFM mi/h
Observed volume, Vf veh/h
Free-flow speed, FFS FFS=SFM+0.00776(Vf/ fHV ) 57.2 mi/h
Base free-flow speed, BFFSFM 60.0mi/h
Adj. for lane width and shoulder width3, fLS (Exhibit 20-5) 2.6mi/h
Adj. for access points, fA (Exhibit 20-6) 0.3
mi/h
Free-flow speed, FFS (FSS=BFFS-fLS-fA) 57.2mi/h
Adj. for no-passing zones, fnp ( mi/h) (Exhibit 20-11) 2.6
Average travel speed, ATS ( mi/h) ATS=FFS-0.00776vp-fnp 46.9
Percent Time-Spent-Following
Grade Adjustment factor, fG (Exhibit 20-8) 0.94
Passenger-car equivalents for trucks, ET (Exhibit 20-10) 1.5
Passenger-car equivalents for RVs, ER (Exhibit 20-10) 1.0
Heavy-vehicle adjustment factor, fHV fHV=1/ (1+ PT(ET-1)+PR(ER-1) ) 0.980
Two-way flow rate1, vp (pc/h) vp=V/ (PHF * fG * fHV) 953
vp * highest directional split proportion2 (pc/h) 477
Base percent time-spent-following, BPTSF(%) BPTSF=100(1-e-0.000879vp) 56.7
Adj. for directional distribution and no-passing zone, fd/hp(%)(Exh. 20-12) 13.5
Percent time-spent-following, PTSF(%) PTSF=BPTSF+f d/np 70.2
Level of Service and Other Performance MeasuresLevel of service, LOS (Exhibit 20-3 for Class I or 20-4 for Class II) D
Volume to capacity ratio v/c v/c=Vp/ 3,200 0.31
Peak 15-min veh-miles of travel,VMT15 (veh- mi) VMT15= 0.25Lt(V/PHF) 2196
Peak-hour vehicle-miles of travel, VMT60 (veh- mi) VMT60=V*Lt 7730
Peak 15-min total travel time, TT15(veh-h) TT15= VMT15/ATS 46.8
Notes
1. If vp >= 3,200 pc/h, terminate analysis-the LOS is F. 2. If highest directional split vp>= 1,700 pc/h, terminated anlysis-the LOS is F.
HCS2000TM Copyright © 2000 University of Florida, All Rights Reserved Version 4.1f
Page 1 of 1Two-Way
1/20/2010file://C:\Documents and Settings\max.scheideman\Local Settings\Temp\s2k1A9E.tmp

TWO-WAY TWO-LANE HIGHWAY SEGMENT WORKSHEETGeneral Information Site InformationAnalyst Tetra Tech ISGAgency or Company Rosemont Copper CompanyDate Performed 1/15/2010Analysis Time Period Non-Peak Season, Weekend, PM
Highway AZ-83From/To Hidden Valley Rd/GreatervilleJurisdiction Pima CountyAnalysis Year Operations Year 20, No Carpool
Input Data
Class I highway Class II highway
Terrain Level RollingTwo-way hourly volume 590 veh/hDirectional split 50 / 50Peak-hour factor, PHF 0.88No-passing zone 100 % Trucks and Buses , PT 4 %
% Recreational vehicles, PR 4%
Access points/ mi 0
Average Travel Speed
Grade adjustment factor, fG (Exhibit 20-7) 0.93
Passenger-car equivalents for trucks, ET (Exhibit 20-9) 1.9
Passenger-car equivalents for RVs, ER (Exhibit 20-9) 1.1
Heavy-vehicle adjustment factor, fHV fHV=1/ (1+ PT(ET-1)+PR(ER-1) ) 0.962
Two-way flow rate1, vp (pc/h) vp=V/ (PHF * fG * fHV) 750
vp * highest directional split proportion2 (pc/h) 375
Free-Flow Speed from Field Measurement Estimated Free-Flow Speed
Field Measured speed, SFM mi/h
Observed volume, Vf veh/h
Free-flow speed, FFS FFS=SFM+0.00776(Vf/ fHV ) 57.4 mi/h
Base free-flow speed, BFFSFM 60.0mi/h
Adj. for lane width and shoulder width3, fLS (Exhibit 20-5) 2.6mi/h
Adj. for access points, fA (Exhibit 20-6) 0.0
mi/h
Free-flow speed, FFS (FSS=BFFS-fLS-fA) 57.4mi/h
Adj. for no-passing zones, fnp ( mi/h) (Exhibit 20-11) 3.2
Average travel speed, ATS ( mi/h) ATS=FFS-0.00776vp-fnp 48.4
Percent Time-Spent-Following
Grade Adjustment factor, fG (Exhibit 20-8) 0.94
Passenger-car equivalents for trucks, ET (Exhibit 20-10) 1.5
Passenger-car equivalents for RVs, ER (Exhibit 20-10) 1.0
Heavy-vehicle adjustment factor, fHV fHV=1/ (1+ PT(ET-1)+PR(ER-1) ) 0.980
Two-way flow rate1, vp (pc/h) vp=V/ (PHF * fG * fHV) 728
vp * highest directional split proportion2 (pc/h) 364
Base percent time-spent-following, BPTSF(%) BPTSF=100(1-e-0.000879vp) 47.3
Adj. for directional distribution and no-passing zone, fd/hp(%)(Exh. 20-12) 17.2
Percent time-spent-following, PTSF(%) PTSF=BPTSF+f d/np 64.5
Level of Service and Other Performance MeasuresLevel of service, LOS (Exhibit 20-3 for Class I or 20-4 for Class II) C
Volume to capacity ratio v/c v/c=Vp/ 3,200 0.23
Peak 15-min veh-miles of travel,VMT15 (veh- mi) VMT15= 0.25Lt(V/PHF) 1006
Peak-hour vehicle-miles of travel, VMT60 (veh- mi) VMT60=V*Lt 3540
Peak 15-min total travel time, TT15(veh-h) TT15= VMT15/ATS 20.8
Notes
1. If vp >= 3,200 pc/h, terminate analysis-the LOS is F. 2. If highest directional split vp>= 1,700 pc/h, terminated anlysis-the LOS is F.
HCS2000TM Copyright © 2000 University of Florida, All Rights Reserved Version 4.1f
Page 1 of 1Two-Way
1/20/2010file://C:\Documents and Settings\max.scheideman\Local Settings\Temp\s2k1AA5.tmp
PEAK SEASON
SCENARIO 3
NO CARPOOL

TWO-WAY TWO-LANE HIGHWAY SEGMENT WORKSHEETGeneral Information Site InformationAnalyst Tetra Tech ISGAgency or Company Rosemont Copper CompanyDate Performed 1/15/2010Analysis Time Period Non-Peak Season, Weekday, AM
Highway AZ-83From/To I-10 Ramps/Hidden Valley RdJurisdiction Pima CountyAnalysis Year Operations Year 20, No Carpool
Input Data
Class I highway Class II highway
Terrain Level RollingTwo-way hourly volume 663 veh/hDirectional split 50 / 50Peak-hour factor, PHF 0.88No-passing zone 100 % Trucks and Buses , PT 4 %
% Recreational vehicles, PR 4%
Access points/ mi 1
Average Travel Speed
Grade adjustment factor, fG (Exhibit 20-7) 0.93
Passenger-car equivalents for trucks, ET (Exhibit 20-9) 1.9
Passenger-car equivalents for RVs, ER (Exhibit 20-9) 1.1
Heavy-vehicle adjustment factor, fHV fHV=1/ (1+ PT(ET-1)+PR(ER-1) ) 0.962
Two-way flow rate1, vp (pc/h) vp=V/ (PHF * fG * fHV) 843
vp * highest directional split proportion2 (pc/h) 422
Free-Flow Speed from Field Measurement Estimated Free-Flow Speed
Field Measured speed, SFM mi/h
Observed volume, Vf veh/h
Free-flow speed, FFS FFS=SFM+0.00776(Vf/ fHV ) 57.2 mi/h
Base free-flow speed, BFFSFM 60.0mi/h
Adj. for lane width and shoulder width3, fLS (Exhibit 20-5) 2.6mi/h
Adj. for access points, fA (Exhibit 20-6) 0.3
mi/h
Free-flow speed, FFS (FSS=BFFS-fLS-fA) 57.2mi/h
Adj. for no-passing zones, fnp ( mi/h) (Exhibit 20-11) 2.9
Average travel speed, ATS ( mi/h) ATS=FFS-0.00776vp-fnp 47.7
Percent Time-Spent-Following
Grade Adjustment factor, fG (Exhibit 20-8) 0.94
Passenger-car equivalents for trucks, ET (Exhibit 20-10) 1.5
Passenger-car equivalents for RVs, ER (Exhibit 20-10) 1.0
Heavy-vehicle adjustment factor, fHV fHV=1/ (1+ PT(ET-1)+PR(ER-1) ) 0.980
Two-way flow rate1, vp (pc/h) vp=V/ (PHF * fG * fHV) 818
vp * highest directional split proportion2 (pc/h) 409
Base percent time-spent-following, BPTSF(%) BPTSF=100(1-e-0.000879vp) 51.3
Adj. for directional distribution and no-passing zone, fd/hp(%)(Exh. 20-12) 15.2
Percent time-spent-following, PTSF(%) PTSF=BPTSF+f d/np 66.5
Level of Service and Other Performance MeasuresLevel of service, LOS (Exhibit 20-3 for Class I or 20-4 for Class II) C
Volume to capacity ratio v/c v/c=Vp/ 3,200 0.26
Peak 15-min veh-miles of travel,VMT15 (veh- mi) VMT15= 0.25Lt(V/PHF) 1884
Peak-hour vehicle-miles of travel, VMT60 (veh- mi) VMT60=V*Lt 6630
Peak 15-min total travel time, TT15(veh-h) TT15= VMT15/ATS 39.5
Notes
1. If vp >= 3,200 pc/h, terminate analysis-the LOS is F. 2. If highest directional split vp>= 1,700 pc/h, terminated anlysis-the LOS is F.
HCS2000TM Copyright © 2000 University of Florida, All Rights Reserved Version 4.1f
Page 1 of 1Two-Way
1/20/2010file://C:\Documents and Settings\max.scheideman\Local Settings\Temp\s2k1A6A.tmp

TWO-WAY TWO-LANE HIGHWAY SEGMENT WORKSHEETGeneral Information Site InformationAnalyst Tetra Tech ISGAgency or Company Rosemont Copper CompanyDate Performed 1/15/2010Analysis Time Period Non-Peak Season, Weekday, AM
Highway AZ-83From/To Hidden Valley Rd/GreatervilleJurisdiction Pima CountyAnalysis Year Operations Year 20, No Carpool
Input Data
Class I highway Class II highway
Terrain Level RollingTwo-way hourly volume 803 veh/hDirectional split 50 / 50Peak-hour factor, PHF 0.88No-passing zone 100 % Trucks and Buses , PT 4 %
% Recreational vehicles, PR 4%
Access points/ mi 0
Average Travel Speed
Grade adjustment factor, fG (Exhibit 20-7) 0.93
Passenger-car equivalents for trucks, ET (Exhibit 20-9) 1.9
Passenger-car equivalents for RVs, ER (Exhibit 20-9) 1.1
Heavy-vehicle adjustment factor, fHV fHV=1/ (1+ PT(ET-1)+PR(ER-1) ) 0.962
Two-way flow rate1, vp (pc/h) vp=V/ (PHF * fG * fHV) 1020
vp * highest directional split proportion2 (pc/h) 510
Free-Flow Speed from Field Measurement Estimated Free-Flow Speed
Field Measured speed, SFM mi/h
Observed volume, Vf veh/h
Free-flow speed, FFS FFS=SFM+0.00776(Vf/ fHV ) 57.4 mi/h
Base free-flow speed, BFFSFM 60.0mi/h
Adj. for lane width and shoulder width3, fLS (Exhibit 20-5) 2.6mi/h
Adj. for access points, fA (Exhibit 20-6) 0.0
mi/h
Free-flow speed, FFS (FSS=BFFS-fLS-fA) 57.4mi/h
Adj. for no-passing zones, fnp ( mi/h) (Exhibit 20-11) 2.5
Average travel speed, ATS ( mi/h) ATS=FFS-0.00776vp-fnp 46.9
Percent Time-Spent-Following
Grade Adjustment factor, fG (Exhibit 20-8) 0.94
Passenger-car equivalents for trucks, ET (Exhibit 20-10) 1.5
Passenger-car equivalents for RVs, ER (Exhibit 20-10) 1.0
Heavy-vehicle adjustment factor, fHV fHV=1/ (1+ PT(ET-1)+PR(ER-1) ) 0.980
Two-way flow rate1, vp (pc/h) vp=V/ (PHF * fG * fHV) 990
vp * highest directional split proportion2 (pc/h) 495
Base percent time-spent-following, BPTSF(%) BPTSF=100(1-e-0.000879vp) 58.1
Adj. for directional distribution and no-passing zone, fd/hp(%)(Exh. 20-12) 13.0
Percent time-spent-following, PTSF(%) PTSF=BPTSF+f d/np 71.1
Level of Service and Other Performance MeasuresLevel of service, LOS (Exhibit 20-3 for Class I or 20-4 for Class II) D
Volume to capacity ratio v/c v/c=Vp/ 3,200 0.32
Peak 15-min veh-miles of travel,VMT15 (veh- mi) VMT15= 0.25Lt(V/PHF) 1369
Peak-hour vehicle-miles of travel, VMT60 (veh- mi) VMT60=V*Lt 4818
Peak 15-min total travel time, TT15(veh-h) TT15= VMT15/ATS 29.2
Notes
1. If vp >= 3,200 pc/h, terminate analysis-the LOS is F. 2. If highest directional split vp>= 1,700 pc/h, terminated anlysis-the LOS is F.
HCS2000TM Copyright © 2000 University of Florida, All Rights Reserved Version 4.1f
Page 1 of 1Two-Way
1/20/2010file://C:\Documents and Settings\max.scheideman\Local Settings\Temp\s2k1A77.tmp

TWO-WAY TWO-LANE HIGHWAY SEGMENT WORKSHEETGeneral Information Site InformationAnalyst Tetra Tech ISGAgency or Company Rosemont Copper CompanyDate Performed 1/1/5/2010Analysis Time Period Non-Peak Season, Weekday, PM
Highway AZ-83From/To I-10 Ramp/Hidden Valley RdJurisdiction Pima CountyAnalysis Year Operations Year 20, No Carpool
Input Data
Class I highway Class II highway
Terrain Level RollingTwo-way hourly volume 775 veh/hDirectional split 50 / 50Peak-hour factor, PHF 0.88No-passing zone 100 % Trucks and Buses , PT 4 %
% Recreational vehicles, PR 4%
Access points/ mi 1
Average Travel Speed
Grade adjustment factor, fG (Exhibit 20-7) 0.93
Passenger-car equivalents for trucks, ET (Exhibit 20-9) 1.9
Passenger-car equivalents for RVs, ER (Exhibit 20-9) 1.1
Heavy-vehicle adjustment factor, fHV fHV=1/ (1+ PT(ET-1)+PR(ER-1) ) 0.962
Two-way flow rate1, vp (pc/h) vp=V/ (PHF * fG * fHV) 985
vp * highest directional split proportion2 (pc/h) 493
Free-Flow Speed from Field Measurement Estimated Free-Flow Speed
Field Measured speed, SFM mi/h
Observed volume, Vf veh/h
Free-flow speed, FFS FFS=SFM+0.00776(Vf/ fHV ) 57.2 mi/h
Base free-flow speed, BFFSFM 60.0mi/h
Adj. for lane width and shoulder width3, fLS (Exhibit 20-5) 2.6mi/h
Adj. for access points, fA (Exhibit 20-6) 0.3
mi/h
Free-flow speed, FFS (FSS=BFFS-fLS-fA) 57.2mi/h
Adj. for no-passing zones, fnp ( mi/h) (Exhibit 20-11) 2.6
Average travel speed, ATS ( mi/h) ATS=FFS-0.00776vp-fnp 46.9
Percent Time-Spent-Following
Grade Adjustment factor, fG (Exhibit 20-8) 0.94
Passenger-car equivalents for trucks, ET (Exhibit 20-10) 1.5
Passenger-car equivalents for RVs, ER (Exhibit 20-10) 1.0
Heavy-vehicle adjustment factor, fHV fHV=1/ (1+ PT(ET-1)+PR(ER-1) ) 0.980
Two-way flow rate1, vp (pc/h) vp=V/ (PHF * fG * fHV) 956
vp * highest directional split proportion2 (pc/h) 478
Base percent time-spent-following, BPTSF(%) BPTSF=100(1-e-0.000879vp) 56.8
Adj. for directional distribution and no-passing zone, fd/hp(%)(Exh. 20-12) 13.4
Percent time-spent-following, PTSF(%) PTSF=BPTSF+f d/np 70.3
Level of Service and Other Performance MeasuresLevel of service, LOS (Exhibit 20-3 for Class I or 20-4 for Class II) D
Volume to capacity ratio v/c v/c=Vp/ 3,200 0.31
Peak 15-min veh-miles of travel,VMT15 (veh- mi) VMT15= 0.25Lt(V/PHF) 2202
Peak-hour vehicle-miles of travel, VMT60 (veh- mi) VMT60=V*Lt 7750
Peak 15-min total travel time, TT15(veh-h) TT15= VMT15/ATS 47.0
Notes
1. If vp >= 3,200 pc/h, terminate analysis-the LOS is F. 2. If highest directional split vp>= 1,700 pc/h, terminated anlysis-the LOS is F.
HCS2000TM Copyright © 2000 University of Florida, All Rights Reserved Version 4.1f
Page 1 of 1Two-Way
1/20/2010file://C:\Documents and Settings\max.scheideman\Local Settings\Temp\s2k1A7E.tmp

TWO-WAY TWO-LANE HIGHWAY SEGMENT WORKSHEETGeneral Information Site InformationAnalyst Tetra Tech ISGAgency or Company Rosemont Copper CompanyDate Performed 1/15/2010Analysis Time Period Non-Peak Season, Weekday, PM
Highway AZ-83From/To Hidden Valley Rd/GreatervilleJurisdiction Pima CountyAnalysis Year Operations Year 20, No Carpool
Input Data
Class I highway Class II highway
Terrain Level RollingTwo-way hourly volume 781 veh/hDirectional split 50 / 50Peak-hour factor, PHF 0.88No-passing zone 100 % Trucks and Buses , PT 4 %
% Recreational vehicles, PR 4%
Access points/ mi 0
Average Travel Speed
Grade adjustment factor, fG (Exhibit 20-7) 0.93
Passenger-car equivalents for trucks, ET (Exhibit 20-9) 1.9
Passenger-car equivalents for RVs, ER (Exhibit 20-9) 1.1
Heavy-vehicle adjustment factor, fHV fHV=1/ (1+ PT(ET-1)+PR(ER-1) ) 0.962
Two-way flow rate1, vp (pc/h) vp=V/ (PHF * fG * fHV) 992
vp * highest directional split proportion2 (pc/h) 496
Free-Flow Speed from Field Measurement Estimated Free-Flow Speed
Field Measured speed, SFM mi/h
Observed volume, Vf veh/h
Free-flow speed, FFS FFS=SFM+0.00776(Vf/ fHV ) 57.4 mi/h
Base free-flow speed, BFFSFM 60.0mi/h
Adj. for lane width and shoulder width3, fLS (Exhibit 20-5) 2.6mi/h
Adj. for access points, fA (Exhibit 20-6) 0.0
mi/h
Free-flow speed, FFS (FSS=BFFS-fLS-fA) 57.4mi/h
Adj. for no-passing zones, fnp ( mi/h) (Exhibit 20-11) 2.6
Average travel speed, ATS ( mi/h) ATS=FFS-0.00776vp-fnp 47.1
Percent Time-Spent-Following
Grade Adjustment factor, fG (Exhibit 20-8) 0.94
Passenger-car equivalents for trucks, ET (Exhibit 20-10) 1.5
Passenger-car equivalents for RVs, ER (Exhibit 20-10) 1.0
Heavy-vehicle adjustment factor, fHV fHV=1/ (1+ PT(ET-1)+PR(ER-1) ) 0.980
Two-way flow rate1, vp (pc/h) vp=V/ (PHF * fG * fHV) 963
vp * highest directional split proportion2 (pc/h) 482
Base percent time-spent-following, BPTSF(%) BPTSF=100(1-e-0.000879vp) 57.1
Adj. for directional distribution and no-passing zone, fd/hp(%)(Exh. 20-12) 13.4
Percent time-spent-following, PTSF(%) PTSF=BPTSF+f d/np 70.5
Level of Service and Other Performance MeasuresLevel of service, LOS (Exhibit 20-3 for Class I or 20-4 for Class II) D
Volume to capacity ratio v/c v/c=Vp/ 3,200 0.31
Peak 15-min veh-miles of travel,VMT15 (veh- mi) VMT15= 0.25Lt(V/PHF) 1331
Peak-hour vehicle-miles of travel, VMT60 (veh- mi) VMT60=V*Lt 4686
Peak 15-min total travel time, TT15(veh-h) TT15= VMT15/ATS 28.3
Notes
1. If vp >= 3,200 pc/h, terminate analysis-the LOS is F. 2. If highest directional split vp>= 1,700 pc/h, terminated anlysis-the LOS is F.
HCS2000TM Copyright © 2000 University of Florida, All Rights Reserved Version 4.1f
Page 1 of 1Two-Way
1/20/2010file://C:\Documents and Settings\max.scheideman\Local Settings\Temp\s2k1A86.tmp

TWO-WAY TWO-LANE HIGHWAY SEGMENT WORKSHEETGeneral Information Site InformationAnalyst Tetra Tech ISGAgency or Company Rosemont Copper CompanyDate Performed 1/15/2010Analysis Time Period Non-Peak Season, Weekend, AM
Highway AZ-83From/To I-10 Ramp/Hidden Valley RdJurisdiction Pima CountyAnalysis Year Operations Year 20, No Carpool
Input Data
Class I highway Class II highway
Terrain Level RollingTwo-way hourly volume 709 veh/hDirectional split 50 / 50Peak-hour factor, PHF 0.88No-passing zone 100 % Trucks and Buses , PT 4 %
% Recreational vehicles, PR 4%
Access points/ mi 1
Average Travel Speed
Grade adjustment factor, fG (Exhibit 20-7) 0.93
Passenger-car equivalents for trucks, ET (Exhibit 20-9) 1.9
Passenger-car equivalents for RVs, ER (Exhibit 20-9) 1.1
Heavy-vehicle adjustment factor, fHV fHV=1/ (1+ PT(ET-1)+PR(ER-1) ) 0.962
Two-way flow rate1, vp (pc/h) vp=V/ (PHF * fG * fHV) 901
vp * highest directional split proportion2 (pc/h) 451
Free-Flow Speed from Field Measurement Estimated Free-Flow Speed
Field Measured speed, SFM mi/h
Observed volume, Vf veh/h
Free-flow speed, FFS FFS=SFM+0.00776(Vf/ fHV ) 57.2 mi/h
Base free-flow speed, BFFSFM 60.0mi/h
Adj. for lane width and shoulder width3, fLS (Exhibit 20-5) 2.6mi/h
Adj. for access points, fA (Exhibit 20-6) 0.3
mi/h
Free-flow speed, FFS (FSS=BFFS-fLS-fA) 57.2mi/h
Adj. for no-passing zones, fnp ( mi/h) (Exhibit 20-11) 2.8
Average travel speed, ATS ( mi/h) ATS=FFS-0.00776vp-fnp 47.4
Percent Time-Spent-Following
Grade Adjustment factor, fG (Exhibit 20-8) 0.94
Passenger-car equivalents for trucks, ET (Exhibit 20-10) 1.5
Passenger-car equivalents for RVs, ER (Exhibit 20-10) 1.0
Heavy-vehicle adjustment factor, fHV fHV=1/ (1+ PT(ET-1)+PR(ER-1) ) 0.980
Two-way flow rate1, vp (pc/h) vp=V/ (PHF * fG * fHV) 874
vp * highest directional split proportion2 (pc/h) 437
Base percent time-spent-following, BPTSF(%) BPTSF=100(1-e-0.000879vp) 53.6
Adj. for directional distribution and no-passing zone, fd/hp(%)(Exh. 20-12) 14.5
Percent time-spent-following, PTSF(%) PTSF=BPTSF+f d/np 68.1
Level of Service and Other Performance MeasuresLevel of service, LOS (Exhibit 20-3 for Class I or 20-4 for Class II) C
Volume to capacity ratio v/c v/c=Vp/ 3,200 0.28
Peak 15-min veh-miles of travel,VMT15 (veh- mi) VMT15= 0.25Lt(V/PHF) 2014
Peak-hour vehicle-miles of travel, VMT60 (veh- mi) VMT60=V*Lt 7090
Peak 15-min total travel time, TT15(veh-h) TT15= VMT15/ATS 42.5
Notes
1. If vp >= 3,200 pc/h, terminate analysis-the LOS is F. 2. If highest directional split vp>= 1,700 pc/h, terminated anlysis-the LOS is F.
HCS2000TM Copyright © 2000 University of Florida, All Rights Reserved Version 4.1f
Page 1 of 1Two-Way
1/20/2010file://C:\Documents and Settings\max.scheideman\Local Settings\Temp\s2k1A8E.tmp

TWO-WAY TWO-LANE HIGHWAY SEGMENT WORKSHEETGeneral Information Site InformationAnalyst Tetra Tech ISGAgency or Company Rosemont Copper CompanyDate Performed 1/15/2010Analysis Time Period Non Peak Season, Weekend, AM
Highway AZ-83From/To Hidden Valley Rd/GreatervilleJurisdiction Pima CountyAnalysis Year Operations Year 20, No Carpool
Input Data
Class I highway Class II highway
Terrain Level RollingTwo-way hourly volume 624 veh/hDirectional split 50 / 50Peak-hour factor, PHF 0.88No-passing zone 100 % Trucks and Buses , PT 4 %
% Recreational vehicles, PR 4%
Access points/ mi 0
Average Travel Speed
Grade adjustment factor, fG (Exhibit 20-7) 0.93
Passenger-car equivalents for trucks, ET (Exhibit 20-9) 1.9
Passenger-car equivalents for RVs, ER (Exhibit 20-9) 1.1
Heavy-vehicle adjustment factor, fHV fHV=1/ (1+ PT(ET-1)+PR(ER-1) ) 0.962
Two-way flow rate1, vp (pc/h) vp=V/ (PHF * fG * fHV) 793
vp * highest directional split proportion2 (pc/h) 397
Free-Flow Speed from Field Measurement Estimated Free-Flow Speed
Field Measured speed, SFM mi/h
Observed volume, Vf veh/h
Free-flow speed, FFS FFS=SFM+0.00776(Vf/ fHV ) 57.4 mi/h
Base free-flow speed, BFFSFM 60.0mi/h
Adj. for lane width and shoulder width3, fLS (Exhibit 20-5) 2.6mi/h
Adj. for access points, fA (Exhibit 20-6) 0.0
mi/h
Free-flow speed, FFS (FSS=BFFS-fLS-fA) 57.4mi/h
Adj. for no-passing zones, fnp ( mi/h) (Exhibit 20-11) 3.0
Average travel speed, ATS ( mi/h) ATS=FFS-0.00776vp-fnp 48.2
Percent Time-Spent-Following
Grade Adjustment factor, fG (Exhibit 20-8) 0.94
Passenger-car equivalents for trucks, ET (Exhibit 20-10) 1.5
Passenger-car equivalents for RVs, ER (Exhibit 20-10) 1.0
Heavy-vehicle adjustment factor, fHV fHV=1/ (1+ PT(ET-1)+PR(ER-1) ) 0.980
Two-way flow rate1, vp (pc/h) vp=V/ (PHF * fG * fHV) 769
vp * highest directional split proportion2 (pc/h) 385
Base percent time-spent-following, BPTSF(%) BPTSF=100(1-e-0.000879vp) 49.1
Adj. for directional distribution and no-passing zone, fd/hp(%)(Exh. 20-12) 16.2
Percent time-spent-following, PTSF(%) PTSF=BPTSF+f d/np 65.3
Level of Service and Other Performance MeasuresLevel of service, LOS (Exhibit 20-3 for Class I or 20-4 for Class II) C
Volume to capacity ratio v/c v/c=Vp/ 3,200 0.25
Peak 15-min veh-miles of travel,VMT15 (veh- mi) VMT15= 0.25Lt(V/PHF) 1064
Peak-hour vehicle-miles of travel, VMT60 (veh- mi) VMT60=V*Lt 3744
Peak 15-min total travel time, TT15(veh-h) TT15= VMT15/ATS 22.1
Notes
1. If vp >= 3,200 pc/h, terminate analysis-the LOS is F. 2. If highest directional split vp>= 1,700 pc/h, terminated anlysis-the LOS is F.
HCS2000TM Copyright © 2000 University of Florida, All Rights Reserved Version 4.1f
Page 1 of 1Two-Way
1/20/2010file://C:\Documents and Settings\max.scheideman\Local Settings\Temp\s2k1A97.tmp

TWO-WAY TWO-LANE HIGHWAY SEGMENT WORKSHEETGeneral Information Site InformationAnalyst Tetra Tech ISGAgency or Company Rosemont Copper CompanyDate Performed 1/15/2010Analysis Time Period Non-Peak Season, Weekend, PM
Highway AZ-83From/To I-10 Ramps/Hidden Valley RdJurisdiction Pima CountyAnalysis Year Operations Year 20, No Carpool
Input Data
Class I highway Class II highway
Terrain Level RollingTwo-way hourly volume 773 veh/hDirectional split 50 / 50Peak-hour factor, PHF 0.88No-passing zone 100 % Trucks and Buses , PT 4 %
% Recreational vehicles, PR 4%
Access points/ mi 1
Average Travel Speed
Grade adjustment factor, fG (Exhibit 20-7) 0.93
Passenger-car equivalents for trucks, ET (Exhibit 20-9) 1.9
Passenger-car equivalents for RVs, ER (Exhibit 20-9) 1.1
Heavy-vehicle adjustment factor, fHV fHV=1/ (1+ PT(ET-1)+PR(ER-1) ) 0.962
Two-way flow rate1, vp (pc/h) vp=V/ (PHF * fG * fHV) 982
vp * highest directional split proportion2 (pc/h) 491
Free-Flow Speed from Field Measurement Estimated Free-Flow Speed
Field Measured speed, SFM mi/h
Observed volume, Vf veh/h
Free-flow speed, FFS FFS=SFM+0.00776(Vf/ fHV ) 57.2 mi/h
Base free-flow speed, BFFSFM 60.0mi/h
Adj. for lane width and shoulder width3, fLS (Exhibit 20-5) 2.6mi/h
Adj. for access points, fA (Exhibit 20-6) 0.3
mi/h
Free-flow speed, FFS (FSS=BFFS-fLS-fA) 57.2mi/h
Adj. for no-passing zones, fnp ( mi/h) (Exhibit 20-11) 2.6
Average travel speed, ATS ( mi/h) ATS=FFS-0.00776vp-fnp 46.9
Percent Time-Spent-Following
Grade Adjustment factor, fG (Exhibit 20-8) 0.94
Passenger-car equivalents for trucks, ET (Exhibit 20-10) 1.5
Passenger-car equivalents for RVs, ER (Exhibit 20-10) 1.0
Heavy-vehicle adjustment factor, fHV fHV=1/ (1+ PT(ET-1)+PR(ER-1) ) 0.980
Two-way flow rate1, vp (pc/h) vp=V/ (PHF * fG * fHV) 953
vp * highest directional split proportion2 (pc/h) 477
Base percent time-spent-following, BPTSF(%) BPTSF=100(1-e-0.000879vp) 56.7
Adj. for directional distribution and no-passing zone, fd/hp(%)(Exh. 20-12) 13.5
Percent time-spent-following, PTSF(%) PTSF=BPTSF+f d/np 70.2
Level of Service and Other Performance MeasuresLevel of service, LOS (Exhibit 20-3 for Class I or 20-4 for Class II) D
Volume to capacity ratio v/c v/c=Vp/ 3,200 0.31
Peak 15-min veh-miles of travel,VMT15 (veh- mi) VMT15= 0.25Lt(V/PHF) 2196
Peak-hour vehicle-miles of travel, VMT60 (veh- mi) VMT60=V*Lt 7730
Peak 15-min total travel time, TT15(veh-h) TT15= VMT15/ATS 46.8
Notes
1. If vp >= 3,200 pc/h, terminate analysis-the LOS is F. 2. If highest directional split vp>= 1,700 pc/h, terminated anlysis-the LOS is F.
HCS2000TM Copyright © 2000 University of Florida, All Rights Reserved Version 4.1f
Page 1 of 1Two-Way
1/20/2010file://C:\Documents and Settings\max.scheideman\Local Settings\Temp\s2k1A9E.tmp

TWO-WAY TWO-LANE HIGHWAY SEGMENT WORKSHEETGeneral Information Site InformationAnalyst Tetra Tech ISGAgency or Company Rosemont Copper CompanyDate Performed 1/15/2010Analysis Time Period Non-Peak Season, Weekend, PM
Highway AZ-83From/To Hidden Valley Rd/GreatervilleJurisdiction Pima CountyAnalysis Year Operations Year 20, No Carpool
Input Data
Class I highway Class II highway
Terrain Level RollingTwo-way hourly volume 590 veh/hDirectional split 50 / 50Peak-hour factor, PHF 0.88No-passing zone 100 % Trucks and Buses , PT 4 %
% Recreational vehicles, PR 4%
Access points/ mi 0
Average Travel Speed
Grade adjustment factor, fG (Exhibit 20-7) 0.93
Passenger-car equivalents for trucks, ET (Exhibit 20-9) 1.9
Passenger-car equivalents for RVs, ER (Exhibit 20-9) 1.1
Heavy-vehicle adjustment factor, fHV fHV=1/ (1+ PT(ET-1)+PR(ER-1) ) 0.962
Two-way flow rate1, vp (pc/h) vp=V/ (PHF * fG * fHV) 750
vp * highest directional split proportion2 (pc/h) 375
Free-Flow Speed from Field Measurement Estimated Free-Flow Speed
Field Measured speed, SFM mi/h
Observed volume, Vf veh/h
Free-flow speed, FFS FFS=SFM+0.00776(Vf/ fHV ) 57.4 mi/h
Base free-flow speed, BFFSFM 60.0mi/h
Adj. for lane width and shoulder width3, fLS (Exhibit 20-5) 2.6mi/h
Adj. for access points, fA (Exhibit 20-6) 0.0
mi/h
Free-flow speed, FFS (FSS=BFFS-fLS-fA) 57.4mi/h
Adj. for no-passing zones, fnp ( mi/h) (Exhibit 20-11) 3.2
Average travel speed, ATS ( mi/h) ATS=FFS-0.00776vp-fnp 48.4
Percent Time-Spent-Following
Grade Adjustment factor, fG (Exhibit 20-8) 0.94
Passenger-car equivalents for trucks, ET (Exhibit 20-10) 1.5
Passenger-car equivalents for RVs, ER (Exhibit 20-10) 1.0
Heavy-vehicle adjustment factor, fHV fHV=1/ (1+ PT(ET-1)+PR(ER-1) ) 0.980
Two-way flow rate1, vp (pc/h) vp=V/ (PHF * fG * fHV) 728
vp * highest directional split proportion2 (pc/h) 364
Base percent time-spent-following, BPTSF(%) BPTSF=100(1-e-0.000879vp) 47.3
Adj. for directional distribution and no-passing zone, fd/hp(%)(Exh. 20-12) 17.2
Percent time-spent-following, PTSF(%) PTSF=BPTSF+f d/np 64.5
Level of Service and Other Performance MeasuresLevel of service, LOS (Exhibit 20-3 for Class I or 20-4 for Class II) C
Volume to capacity ratio v/c v/c=Vp/ 3,200 0.23
Peak 15-min veh-miles of travel,VMT15 (veh- mi) VMT15= 0.25Lt(V/PHF) 1006
Peak-hour vehicle-miles of travel, VMT60 (veh- mi) VMT60=V*Lt 3540
Peak 15-min total travel time, TT15(veh-h) TT15= VMT15/ATS 20.8
Notes
1. If vp >= 3,200 pc/h, terminate analysis-the LOS is F. 2. If highest directional split vp>= 1,700 pc/h, terminated anlysis-the LOS is F.
HCS2000TM Copyright © 2000 University of Florida, All Rights Reserved Version 4.1f
Page 1 of 1Two-Way
1/20/2010file://C:\Documents and Settings\max.scheideman\Local Settings\Temp\s2k1AA5.tmp

NON - PEAK SEASON
SCENARIO 4
50% CARPOOL

TWO-WAY TWO-LANE HIGHWAY SEGMENT WORKSHEETGeneral Information Site InformationAnalyst Tetra Tech ISGAgency or Company Rosemont Copper CompanyDate Performed 1/15/2010Analysis Time Period Non-Peak Season, Weekday, AM
Highway AZ-83From/To I-10 Ramps/Hidden Valley RdJurisdiction Pima CountyAnalysis Year Operations Year 20,50% Carpool
Input Data
Class I highway Class II highway
Terrain Level RollingTwo-way hourly volume 526 veh/hDirectional split 50 / 50Peak-hour factor, PHF 0.88No-passing zone 100 % Trucks and Buses , PT 8 %
% Recreational vehicles, PR 4%
Access points/ mi 1
Average Travel Speed
Grade adjustment factor, fG (Exhibit 20-7) 0.93
Passenger-car equivalents for trucks, ET (Exhibit 20-9) 1.9
Passenger-car equivalents for RVs, ER (Exhibit 20-9) 1.1
Heavy-vehicle adjustment factor, fHV fHV=1/ (1+ PT(ET-1)+PR(ER-1) ) 0.929
Two-way flow rate1, vp (pc/h) vp=V/ (PHF * fG * fHV) 692
vp * highest directional split proportion2 (pc/h) 346
Free-Flow Speed from Field Measurement Estimated Free-Flow Speed
Field Measured speed, SFM mi/h
Observed volume, Vf veh/h
Free-flow speed, FFS FFS=SFM+0.00776(Vf/ fHV ) 57.2 mi/h
Base free-flow speed, BFFSFM 60.0mi/h
Adj. for lane width and shoulder width3, fLS (Exhibit 20-5) 2.6mi/h
Adj. for access points, fA (Exhibit 20-6) 0.3
mi/h
Free-flow speed, FFS (FSS=BFFS-fLS-fA) 57.2mi/h
Adj. for no-passing zones, fnp ( mi/h) (Exhibit 20-11) 3.5
Average travel speed, ATS ( mi/h) ATS=FFS-0.00776vp-fnp 48.3
Percent Time-Spent-Following
Grade Adjustment factor, fG (Exhibit 20-8) 0.94
Passenger-car equivalents for trucks, ET (Exhibit 20-10) 1.5
Passenger-car equivalents for RVs, ER (Exhibit 20-10) 1.0
Heavy-vehicle adjustment factor, fHV fHV=1/ (1+ PT(ET-1)+PR(ER-1) ) 0.962
Two-way flow rate1, vp (pc/h) vp=V/ (PHF * fG * fHV) 661
vp * highest directional split proportion2 (pc/h) 331
Base percent time-spent-following, BPTSF(%) BPTSF=100(1-e-0.000879vp) 44.1
Adj. for directional distribution and no-passing zone, fd/hp(%)(Exh. 20-12) 18.9
Percent time-spent-following, PTSF(%) PTSF=BPTSF+f d/np 63.0
Level of Service and Other Performance MeasuresLevel of service, LOS (Exhibit 20-3 for Class I or 20-4 for Class II) C
Volume to capacity ratio v/c v/c=Vp/ 3,200 0.22
Peak 15-min veh-miles of travel,VMT15 (veh- mi) VMT15= 0.25Lt(V/PHF) 1494
Peak-hour vehicle-miles of travel, VMT60 (veh- mi) VMT60=V*Lt 5260
Peak 15-min total travel time, TT15(veh-h) TT15= VMT15/ATS 30.9
Notes
1. If vp >= 3,200 pc/h, terminate analysis-the LOS is F. 2. If highest directional split vp>= 1,700 pc/h, terminated anlysis-the LOS is F.
HCS2000TM Copyright © 2000 University of Florida, All Rights Reserved Version 4.1f
Page 1 of 1Two-Way
1/20/2010file://C:\Documents and Settings\max.scheideman\Local Settings\Temp\s2k1B70.tmp

TWO-WAY TWO-LANE HIGHWAY SEGMENT WORKSHEETGeneral Information Site InformationAnalyst Tetra Tech ISGAgency or Company Rosemont Copper CompanyDate Performed 1/15/2010Analysis Time Period Non-Peak Season, Weekday, AM
Highway AZ-83From/To Hidden Valley Rd/GreatervilleJurisdiction Pima CountyAnalysis Year Operations Year 20,50% Carpool
Input Data
Class I highway Class II highway
Terrain Level RollingTwo-way hourly volume 621 veh/hDirectional split 50 / 50Peak-hour factor, PHF 0.88No-passing zone 100 % Trucks and Buses , PT 8 %
% Recreational vehicles, PR 4%
Access points/ mi 0
Average Travel Speed
Grade adjustment factor, fG (Exhibit 20-7) 0.93
Passenger-car equivalents for trucks, ET (Exhibit 20-9) 1.9
Passenger-car equivalents for RVs, ER (Exhibit 20-9) 1.1
Heavy-vehicle adjustment factor, fHV fHV=1/ (1+ PT(ET-1)+PR(ER-1) ) 0.929
Two-way flow rate1, vp (pc/h) vp=V/ (PHF * fG * fHV) 816
vp * highest directional split proportion2 (pc/h) 408
Free-Flow Speed from Field Measurement Estimated Free-Flow Speed
Field Measured speed, SFM mi/h
Observed volume, Vf veh/h
Free-flow speed, FFS FFS=SFM+0.00776(Vf/ fHV ) 57.4 mi/h
Base free-flow speed, BFFSFM 60.0mi/h
Adj. for lane width and shoulder width3, fLS (Exhibit 20-5) 2.6mi/h
Adj. for access points, fA (Exhibit 20-6) 0.0
mi/h
Free-flow speed, FFS (FSS=BFFS-fLS-fA) 57.4mi/h
Adj. for no-passing zones, fnp ( mi/h) (Exhibit 20-11) 3.0
Average travel speed, ATS ( mi/h) ATS=FFS-0.00776vp-fnp 48.1
Percent Time-Spent-Following
Grade Adjustment factor, fG (Exhibit 20-8) 0.94
Passenger-car equivalents for trucks, ET (Exhibit 20-10) 1.5
Passenger-car equivalents for RVs, ER (Exhibit 20-10) 1.0
Heavy-vehicle adjustment factor, fHV fHV=1/ (1+ PT(ET-1)+PR(ER-1) ) 0.962
Two-way flow rate1, vp (pc/h) vp=V/ (PHF * fG * fHV) 781
vp * highest directional split proportion2 (pc/h) 391
Base percent time-spent-following, BPTSF(%) BPTSF=100(1-e-0.000879vp) 49.7
Adj. for directional distribution and no-passing zone, fd/hp(%)(Exh. 20-12) 15.9
Percent time-spent-following, PTSF(%) PTSF=BPTSF+f d/np 65.6
Level of Service and Other Performance MeasuresLevel of service, LOS (Exhibit 20-3 for Class I or 20-4 for Class II) C
Volume to capacity ratio v/c v/c=Vp/ 3,200 0.25
Peak 15-min veh-miles of travel,VMT15 (veh- mi) VMT15= 0.25Lt(V/PHF) 1059
Peak-hour vehicle-miles of travel, VMT60 (veh- mi) VMT60=V*Lt 3726
Peak 15-min total travel time, TT15(veh-h) TT15= VMT15/ATS 22.0
Notes
1. If vp >= 3,200 pc/h, terminate analysis-the LOS is F. 2. If highest directional split vp>= 1,700 pc/h, terminated anlysis-the LOS is F.
HCS2000TM Copyright © 2000 University of Florida, All Rights Reserved Version 4.1f
Page 1 of 1Two-Way
1/20/2010file://C:\Documents and Settings\max.scheideman\Local Settings\Temp\s2k1B7B.tmp

TWO-WAY TWO-LANE HIGHWAY SEGMENT WORKSHEETGeneral Information Site InformationAnalyst Tetra Tech ISGAgency or Company Rosemont Copper CompanyDate Performed 1/1/5/2010Analysis Time Period Non-Peak Season, Weekday, PM
Highway AZ-83From/To I-10 Ramp/Hidden Valley RdJurisdiction Pima CountyAnalysis Year Operations Year 20,50% Carpool
Input Data
Class I highway Class II highway
Terrain Level RollingTwo-way hourly volume 638 veh/hDirectional split 50 / 50Peak-hour factor, PHF 0.88No-passing zone 100 % Trucks and Buses , PT 8 %
% Recreational vehicles, PR 4%
Access points/ mi 1
Average Travel Speed
Grade adjustment factor, fG (Exhibit 20-7) 0.93
Passenger-car equivalents for trucks, ET (Exhibit 20-9) 1.9
Passenger-car equivalents for RVs, ER (Exhibit 20-9) 1.1
Heavy-vehicle adjustment factor, fHV fHV=1/ (1+ PT(ET-1)+PR(ER-1) ) 0.929
Two-way flow rate1, vp (pc/h) vp=V/ (PHF * fG * fHV) 839
vp * highest directional split proportion2 (pc/h) 420
Free-Flow Speed from Field Measurement Estimated Free-Flow Speed
Field Measured speed, SFM mi/h
Observed volume, Vf veh/h
Free-flow speed, FFS FFS=SFM+0.00776(Vf/ fHV ) 57.2 mi/h
Base free-flow speed, BFFSFM 60.0mi/h
Adj. for lane width and shoulder width3, fLS (Exhibit 20-5) 2.6mi/h
Adj. for access points, fA (Exhibit 20-6) 0.3
mi/h
Free-flow speed, FFS (FSS=BFFS-fLS-fA) 57.2mi/h
Adj. for no-passing zones, fnp ( mi/h) (Exhibit 20-11) 2.9
Average travel speed, ATS ( mi/h) ATS=FFS-0.00776vp-fnp 47.7
Percent Time-Spent-Following
Grade Adjustment factor, fG (Exhibit 20-8) 0.94
Passenger-car equivalents for trucks, ET (Exhibit 20-10) 1.5
Passenger-car equivalents for RVs, ER (Exhibit 20-10) 1.0
Heavy-vehicle adjustment factor, fHV fHV=1/ (1+ PT(ET-1)+PR(ER-1) ) 0.962
Two-way flow rate1, vp (pc/h) vp=V/ (PHF * fG * fHV) 802
vp * highest directional split proportion2 (pc/h) 401
Base percent time-spent-following, BPTSF(%) BPTSF=100(1-e-0.000879vp) 50.6
Adj. for directional distribution and no-passing zone, fd/hp(%)(Exh. 20-12) 15.4
Percent time-spent-following, PTSF(%) PTSF=BPTSF+f d/np 66.0
Level of Service and Other Performance MeasuresLevel of service, LOS (Exhibit 20-3 for Class I or 20-4 for Class II) C
Volume to capacity ratio v/c v/c=Vp/ 3,200 0.26
Peak 15-min veh-miles of travel,VMT15 (veh- mi) VMT15= 0.25Lt(V/PHF) 1813
Peak-hour vehicle-miles of travel, VMT60 (veh- mi) VMT60=V*Lt 6380
Peak 15-min total travel time, TT15(veh-h) TT15= VMT15/ATS 38.0
Notes
1. If vp >= 3,200 pc/h, terminate analysis-the LOS is F. 2. If highest directional split vp>= 1,700 pc/h, terminated anlysis-the LOS is F.
HCS2000TM Copyright © 2000 University of Florida, All Rights Reserved Version 4.1f
Page 1 of 1Two-Way
1/20/2010file://C:\Documents and Settings\max.scheideman\Local Settings\Temp\s2k1B82.tmp

TWO-WAY TWO-LANE HIGHWAY SEGMENT WORKSHEETGeneral Information Site InformationAnalyst Tetra Tech ISGAgency or Company Rosemont Copper CompanyDate Performed 1/15/2010Analysis Time Period Non-Peak Season, Weekday, PM
Highway AZ-83From/To Hidden Valley Rd/GreatervilleJurisdiction Pima CountyAnalysis Year Operations Year 20,50% Carpool
Input Data
Class I highway Class II highway
Terrain Level RollingTwo-way hourly volume 598 veh/hDirectional split 50 / 50Peak-hour factor, PHF 0.88No-passing zone 100 % Trucks and Buses , PT 8 %
% Recreational vehicles, PR 4%
Access points/ mi 0
Average Travel Speed
Grade adjustment factor, fG (Exhibit 20-7) 0.93
Passenger-car equivalents for trucks, ET (Exhibit 20-9) 1.9
Passenger-car equivalents for RVs, ER (Exhibit 20-9) 1.1
Heavy-vehicle adjustment factor, fHV fHV=1/ (1+ PT(ET-1)+PR(ER-1) ) 0.929
Two-way flow rate1, vp (pc/h) vp=V/ (PHF * fG * fHV) 786
vp * highest directional split proportion2 (pc/h) 393
Free-Flow Speed from Field Measurement Estimated Free-Flow Speed
Field Measured speed, SFM mi/h
Observed volume, Vf veh/h
Free-flow speed, FFS FFS=SFM+0.00776(Vf/ fHV ) 57.4 mi/h
Base free-flow speed, BFFSFM 60.0mi/h
Adj. for lane width and shoulder width3, fLS (Exhibit 20-5) 2.6mi/h
Adj. for access points, fA (Exhibit 20-6) 0.0
mi/h
Free-flow speed, FFS (FSS=BFFS-fLS-fA) 57.4mi/h
Adj. for no-passing zones, fnp ( mi/h) (Exhibit 20-11) 3.1
Average travel speed, ATS ( mi/h) ATS=FFS-0.00776vp-fnp 48.2
Percent Time-Spent-Following
Grade Adjustment factor, fG (Exhibit 20-8) 0.94
Passenger-car equivalents for trucks, ET (Exhibit 20-10) 1.5
Passenger-car equivalents for RVs, ER (Exhibit 20-10) 1.0
Heavy-vehicle adjustment factor, fHV fHV=1/ (1+ PT(ET-1)+PR(ER-1) ) 0.962
Two-way flow rate1, vp (pc/h) vp=V/ (PHF * fG * fHV) 752
vp * highest directional split proportion2 (pc/h) 376
Base percent time-spent-following, BPTSF(%) BPTSF=100(1-e-0.000879vp) 48.4
Adj. for directional distribution and no-passing zone, fd/hp(%)(Exh. 20-12) 16.6
Percent time-spent-following, PTSF(%) PTSF=BPTSF+f d/np 65.0
Level of Service and Other Performance MeasuresLevel of service, LOS (Exhibit 20-3 for Class I or 20-4 for Class II) C
Volume to capacity ratio v/c v/c=Vp/ 3,200 0.25
Peak 15-min veh-miles of travel,VMT15 (veh- mi) VMT15= 0.25Lt(V/PHF) 1019
Peak-hour vehicle-miles of travel, VMT60 (veh- mi) VMT60=V*Lt 3588
Peak 15-min total travel time, TT15(veh-h) TT15= VMT15/ATS 21.1
Notes
1. If vp >= 3,200 pc/h, terminate analysis-the LOS is F. 2. If highest directional split vp>= 1,700 pc/h, terminated anlysis-the LOS is F.
HCS2000TM Copyright © 2000 University of Florida, All Rights Reserved Version 4.1f
Page 1 of 1Two-Way
1/20/2010file://C:\Documents and Settings\max.scheideman\Local Settings\Temp\s2k1B89.tmp

TWO-WAY TWO-LANE HIGHWAY SEGMENT WORKSHEETGeneral Information Site InformationAnalyst Tetra Tech ISGAgency or Company Rosemont Copper CompanyDate Performed 1/15/2010Analysis Time Period Non-Peak Season, Weekend, AM
Highway AZ-83From/To I-10 Ramp/Hidden Valley RdJurisdiction Pima CountyAnalysis Year Operations Year 20,50% Carpool
Input Data
Class I highway Class II highway
Terrain Level RollingTwo-way hourly volume 605 veh/hDirectional split 50 / 50Peak-hour factor, PHF 0.88No-passing zone 100 % Trucks and Buses , PT 8 %
% Recreational vehicles, PR 4%
Access points/ mi 1
Average Travel Speed
Grade adjustment factor, fG (Exhibit 20-7) 0.93
Passenger-car equivalents for trucks, ET (Exhibit 20-9) 1.9
Passenger-car equivalents for RVs, ER (Exhibit 20-9) 1.1
Heavy-vehicle adjustment factor, fHV fHV=1/ (1+ PT(ET-1)+PR(ER-1) ) 0.929
Two-way flow rate1, vp (pc/h) vp=V/ (PHF * fG * fHV) 795
vp * highest directional split proportion2 (pc/h) 398
Free-Flow Speed from Field Measurement Estimated Free-Flow Speed
Field Measured speed, SFM mi/h
Observed volume, Vf veh/h
Free-flow speed, FFS FFS=SFM+0.00776(Vf/ fHV ) 57.2 mi/h
Base free-flow speed, BFFSFM 60.0mi/h
Adj. for lane width and shoulder width3, fLS (Exhibit 20-5) 2.6mi/h
Adj. for access points, fA (Exhibit 20-6) 0.3
mi/h
Free-flow speed, FFS (FSS=BFFS-fLS-fA) 57.2mi/h
Adj. for no-passing zones, fnp ( mi/h) (Exhibit 20-11) 3.0
Average travel speed, ATS ( mi/h) ATS=FFS-0.00776vp-fnp 48.0
Percent Time-Spent-Following
Grade Adjustment factor, fG (Exhibit 20-8) 0.94
Passenger-car equivalents for trucks, ET (Exhibit 20-10) 1.5
Passenger-car equivalents for RVs, ER (Exhibit 20-10) 1.0
Heavy-vehicle adjustment factor, fHV fHV=1/ (1+ PT(ET-1)+PR(ER-1) ) 0.962
Two-way flow rate1, vp (pc/h) vp=V/ (PHF * fG * fHV) 761
vp * highest directional split proportion2 (pc/h) 381
Base percent time-spent-following, BPTSF(%) BPTSF=100(1-e-0.000879vp) 48.8
Adj. for directional distribution and no-passing zone, fd/hp(%)(Exh. 20-12) 16.4
Percent time-spent-following, PTSF(%) PTSF=BPTSF+f d/np 65.2
Level of Service and Other Performance MeasuresLevel of service, LOS (Exhibit 20-3 for Class I or 20-4 for Class II) C
Volume to capacity ratio v/c v/c=Vp/ 3,200 0.25
Peak 15-min veh-miles of travel,VMT15 (veh- mi) VMT15= 0.25Lt(V/PHF) 1719
Peak-hour vehicle-miles of travel, VMT60 (veh- mi) VMT60=V*Lt 6050
Peak 15-min total travel time, TT15(veh-h) TT15= VMT15/ATS 35.8
Notes
1. If vp >= 3,200 pc/h, terminate analysis-the LOS is F. 2. If highest directional split vp>= 1,700 pc/h, terminated anlysis-the LOS is F.
HCS2000TM Copyright © 2000 University of Florida, All Rights Reserved Version 4.1f
Page 1 of 1Two-Way
1/20/2010file://C:\Documents and Settings\max.scheideman\Local Settings\Temp\s2k1B90.tmp

TWO-WAY TWO-LANE HIGHWAY SEGMENT WORKSHEETGeneral Information Site InformationAnalyst Tetra Tech ISGAgency or Company Rosemont Copper CompanyDate Performed 1/15/2010Analysis Time Period Non Peak Season, Weekend, AM
Highway AZ-83From/To Hidden Valley Rd/GreatervilleJurisdiction Pima CountyAnalysis Year Operations Year 20,50% Carpool
Input Data
Class I highway Class II highway
Terrain Level RollingTwo-way hourly volume 485 veh/hDirectional split 50 / 50Peak-hour factor, PHF 0.88No-passing zone 100 % Trucks and Buses , PT 8 %
% Recreational vehicles, PR 4%
Access points/ mi 0
Average Travel Speed
Grade adjustment factor, fG (Exhibit 20-7) 0.93
Passenger-car equivalents for trucks, ET (Exhibit 20-9) 1.9
Passenger-car equivalents for RVs, ER (Exhibit 20-9) 1.1
Heavy-vehicle adjustment factor, fHV fHV=1/ (1+ PT(ET-1)+PR(ER-1) ) 0.929
Two-way flow rate1, vp (pc/h) vp=V/ (PHF * fG * fHV) 638
vp * highest directional split proportion2 (pc/h) 319
Free-Flow Speed from Field Measurement Estimated Free-Flow Speed
Field Measured speed, SFM mi/h
Observed volume, Vf veh/h
Free-flow speed, FFS FFS=SFM+0.00776(Vf/ fHV ) 57.4 mi/h
Base free-flow speed, BFFSFM 60.0mi/h
Adj. for lane width and shoulder width3, fLS (Exhibit 20-5) 2.6mi/h
Adj. for access points, fA (Exhibit 20-6) 0.0
mi/h
Free-flow speed, FFS (FSS=BFFS-fLS-fA) 57.4mi/h
Adj. for no-passing zones, fnp ( mi/h) (Exhibit 20-11) 3.7
Average travel speed, ATS ( mi/h) ATS=FFS-0.00776vp-fnp 48.7
Percent Time-Spent-Following
Grade Adjustment factor, fG (Exhibit 20-8) 0.94
Passenger-car equivalents for trucks, ET (Exhibit 20-10) 1.5
Passenger-car equivalents for RVs, ER (Exhibit 20-10) 1.0
Heavy-vehicle adjustment factor, fHV fHV=1/ (1+ PT(ET-1)+PR(ER-1) ) 0.962
Two-way flow rate1, vp (pc/h) vp=V/ (PHF * fG * fHV) 610
vp * highest directional split proportion2 (pc/h) 305
Base percent time-spent-following, BPTSF(%) BPTSF=100(1-e-0.000879vp) 41.5
Adj. for directional distribution and no-passing zone, fd/hp(%)(Exh. 20-12) 20.2
Percent time-spent-following, PTSF(%) PTSF=BPTSF+f d/np 61.7
Level of Service and Other Performance MeasuresLevel of service, LOS (Exhibit 20-3 for Class I or 20-4 for Class II) C
Volume to capacity ratio v/c v/c=Vp/ 3,200 0.20
Peak 15-min veh-miles of travel,VMT15 (veh- mi) VMT15= 0.25Lt(V/PHF) 827
Peak-hour vehicle-miles of travel, VMT60 (veh- mi) VMT60=V*Lt 2910
Peak 15-min total travel time, TT15(veh-h) TT15= VMT15/ATS 17.0
Notes
1. If vp >= 3,200 pc/h, terminate analysis-the LOS is F. 2. If highest directional split vp>= 1,700 pc/h, terminated anlysis-the LOS is F.
HCS2000TM Copyright © 2000 University of Florida, All Rights Reserved Version 4.1f
Page 1 of 1Two-Way
1/20/2010file://C:\Documents and Settings\max.scheideman\Local Settings\Temp\s2k1B97.tmp

TWO-WAY TWO-LANE HIGHWAY SEGMENT WORKSHEETGeneral Information Site InformationAnalyst Tetra Tech ISGAgency or Company Rosemont Copper CompanyDate Performed 1/15/2010Analysis Time Period Non-Peak Season, Weekend, PM
Highway AZ-83From/To I-10 Ramps/Hidden Valley RdJurisdiction Pima CountyAnalysis Year Operations Year 20,50% Carpool
Input Data
Class I highway Class II highway
Terrain Level RollingTwo-way hourly volume 668 veh/hDirectional split 50 / 50Peak-hour factor, PHF 0.88No-passing zone 100 % Trucks and Buses , PT 8 %
% Recreational vehicles, PR 4%
Access points/ mi 1
Average Travel Speed
Grade adjustment factor, fG (Exhibit 20-7) 0.93
Passenger-car equivalents for trucks, ET (Exhibit 20-9) 1.9
Passenger-car equivalents for RVs, ER (Exhibit 20-9) 1.1
Heavy-vehicle adjustment factor, fHV fHV=1/ (1+ PT(ET-1)+PR(ER-1) ) 0.929
Two-way flow rate1, vp (pc/h) vp=V/ (PHF * fG * fHV) 878
vp * highest directional split proportion2 (pc/h) 439
Free-Flow Speed from Field Measurement Estimated Free-Flow Speed
Field Measured speed, SFM mi/h
Observed volume, Vf veh/h
Free-flow speed, FFS FFS=SFM+0.00776(Vf/ fHV ) 57.2 mi/h
Base free-flow speed, BFFSFM 60.0mi/h
Adj. for lane width and shoulder width3, fLS (Exhibit 20-5) 2.6mi/h
Adj. for access points, fA (Exhibit 20-6) 0.3
mi/h
Free-flow speed, FFS (FSS=BFFS-fLS-fA) 57.2mi/h
Adj. for no-passing zones, fnp ( mi/h) (Exhibit 20-11) 2.8
Average travel speed, ATS ( mi/h) ATS=FFS-0.00776vp-fnp 47.5
Percent Time-Spent-Following
Grade Adjustment factor, fG (Exhibit 20-8) 0.94
Passenger-car equivalents for trucks, ET (Exhibit 20-10) 1.5
Passenger-car equivalents for RVs, ER (Exhibit 20-10) 1.0
Heavy-vehicle adjustment factor, fHV fHV=1/ (1+ PT(ET-1)+PR(ER-1) ) 0.962
Two-way flow rate1, vp (pc/h) vp=V/ (PHF * fG * fHV) 840
vp * highest directional split proportion2 (pc/h) 420
Base percent time-spent-following, BPTSF(%) BPTSF=100(1-e-0.000879vp) 52.2
Adj. for directional distribution and no-passing zone, fd/hp(%)(Exh. 20-12) 14.9
Percent time-spent-following, PTSF(%) PTSF=BPTSF+f d/np 67.1
Level of Service and Other Performance MeasuresLevel of service, LOS (Exhibit 20-3 for Class I or 20-4 for Class II) C
Volume to capacity ratio v/c v/c=Vp/ 3,200 0.27
Peak 15-min veh-miles of travel,VMT15 (veh- mi) VMT15= 0.25Lt(V/PHF) 1898
Peak-hour vehicle-miles of travel, VMT60 (veh- mi) VMT60=V*Lt 6680
Peak 15-min total travel time, TT15(veh-h) TT15= VMT15/ATS 40.0
Notes
1. If vp >= 3,200 pc/h, terminate analysis-the LOS is F. 2. If highest directional split vp>= 1,700 pc/h, terminated anlysis-the LOS is F.
HCS2000TM Copyright © 2000 University of Florida, All Rights Reserved Version 4.1f
Page 1 of 1Two-Way
1/20/2010file://C:\Documents and Settings\max.scheideman\Local Settings\Temp\s2k1B9E.tmp

TWO-WAY TWO-LANE HIGHWAY SEGMENT WORKSHEETGeneral Information Site InformationAnalyst Tetra Tech ISGAgency or Company Rosemont Copper CompanyDate Performed 1/15/2010Analysis Time Period Non-Peak Season, Weekend, PM
Highway AZ-83From/To Hidden Valley Rd/GreatervilleJurisdiction Pima CountyAnalysis Year Operations Year 20,50% Carpool
Input Data
Class I highway Class II highway
Terrain Level RollingTwo-way hourly volume 451 veh/hDirectional split 50 / 50Peak-hour factor, PHF 0.88No-passing zone 100 % Trucks and Buses , PT 8 %
% Recreational vehicles, PR 4%
Access points/ mi 0
Average Travel Speed
Grade adjustment factor, fG (Exhibit 20-7) 0.93
Passenger-car equivalents for trucks, ET (Exhibit 20-9) 1.9
Passenger-car equivalents for RVs, ER (Exhibit 20-9) 1.1
Heavy-vehicle adjustment factor, fHV fHV=1/ (1+ PT(ET-1)+PR(ER-1) ) 0.929
Two-way flow rate1, vp (pc/h) vp=V/ (PHF * fG * fHV) 593
vp * highest directional split proportion2 (pc/h) 297
Free-Flow Speed from Field Measurement Estimated Free-Flow Speed
Field Measured speed, SFM mi/h
Observed volume, Vf veh/h
Free-flow speed, FFS FFS=SFM+0.00776(Vf/ fHV ) 57.4 mi/h
Base free-flow speed, BFFSFM 60.0mi/h
Adj. for lane width and shoulder width3, fLS (Exhibit 20-5) 2.6mi/h
Adj. for access points, fA (Exhibit 20-6) 0.0
mi/h
Free-flow speed, FFS (FSS=BFFS-fLS-fA) 57.4mi/h
Adj. for no-passing zones, fnp ( mi/h) (Exhibit 20-11) 3.9
Average travel speed, ATS ( mi/h) ATS=FFS-0.00776vp-fnp 48.9
Percent Time-Spent-Following
Grade Adjustment factor, fG (Exhibit 20-8) 0.94
Passenger-car equivalents for trucks, ET (Exhibit 20-10) 1.5
Passenger-car equivalents for RVs, ER (Exhibit 20-10) 1.0
Heavy-vehicle adjustment factor, fHV fHV=1/ (1+ PT(ET-1)+PR(ER-1) ) 0.962
Two-way flow rate1, vp (pc/h) vp=V/ (PHF * fG * fHV) 567
vp * highest directional split proportion2 (pc/h) 284
Base percent time-spent-following, BPTSF(%) BPTSF=100(1-e-0.000879vp) 39.2
Adj. for directional distribution and no-passing zone, fd/hp(%)(Exh. 20-12) 21.2
Percent time-spent-following, PTSF(%) PTSF=BPTSF+f d/np 60.5
Level of Service and Other Performance MeasuresLevel of service, LOS (Exhibit 20-3 for Class I or 20-4 for Class II) C
Volume to capacity ratio v/c v/c=Vp/ 3,200 0.19
Peak 15-min veh-miles of travel,VMT15 (veh- mi) VMT15= 0.25Lt(V/PHF) 769
Peak-hour vehicle-miles of travel, VMT60 (veh- mi) VMT60=V*Lt 2706
Peak 15-min total travel time, TT15(veh-h) TT15= VMT15/ATS 15.7
Notes
1. If vp >= 3,200 pc/h, terminate analysis-the LOS is F. 2. If highest directional split vp>= 1,700 pc/h, terminated anlysis-the LOS is F.
HCS2000TM Copyright © 2000 University of Florida, All Rights Reserved Version 4.1f
Page 1 of 1Two-Way
1/20/2010file://C:\Documents and Settings\max.scheideman\Local Settings\Temp\s2k1BA5.tmp

PEAK SEASON
SCENARIO 4
50% CARPOOL

TWO-WAY TWO-LANE HIGHWAY SEGMENT WORKSHEETGeneral Information Site InformationAnalyst Tetra Tech ISGAgency or Company Rosemont Copper CompanyDate Performed 1/17/2010Analysis Time Period Peak Season, Weekday, AM
Highway AZ-83From/To I-10 Ramp/Hidden Valley RdJurisdiction Pima CountyAnalysis Year Operations Year 20,50% Carpool
Input Data
Class I highway Class II highway
Terrain Level RollingTwo-way hourly volume 650 veh/hDirectional split 50 / 50Peak-hour factor, PHF 0.88No-passing zone 100 % Trucks and Buses , PT 8 %
% Recreational vehicles, PR 4%
Access points/ mi 1
Average Travel Speed
Grade adjustment factor, fG (Exhibit 20-7) 0.93
Passenger-car equivalents for trucks, ET (Exhibit 20-9) 1.9
Passenger-car equivalents for RVs, ER (Exhibit 20-9) 1.1
Heavy-vehicle adjustment factor, fHV fHV=1/ (1+ PT(ET-1)+PR(ER-1) ) 0.929
Two-way flow rate1, vp (pc/h) vp=V/ (PHF * fG * fHV) 855
vp * highest directional split proportion2 (pc/h) 428
Free-Flow Speed from Field Measurement Estimated Free-Flow Speed
Field Measured speed, SFM mi/h
Observed volume, Vf veh/h
Free-flow speed, FFS FFS=SFM+0.00776(Vf/ fHV ) 57.2 mi/h
Base free-flow speed, BFFSFM 60.0mi/h
Adj. for lane width and shoulder width3, fLS (Exhibit 20-5) 2.6mi/h
Adj. for access points, fA (Exhibit 20-6) 0.3
mi/h
Free-flow speed, FFS (FSS=BFFS-fLS-fA) 57.2mi/h
Adj. for no-passing zones, fnp ( mi/h) (Exhibit 20-11) 2.9
Average travel speed, ATS ( mi/h) ATS=FFS-0.00776vp-fnp 47.6
Percent Time-Spent-Following
Grade Adjustment factor, fG (Exhibit 20-8) 0.94
Passenger-car equivalents for trucks, ET (Exhibit 20-10) 1.5
Passenger-car equivalents for RVs, ER (Exhibit 20-10) 1.0
Heavy-vehicle adjustment factor, fHV fHV=1/ (1+ PT(ET-1)+PR(ER-1) ) 0.962
Two-way flow rate1, vp (pc/h) vp=V/ (PHF * fG * fHV) 817
vp * highest directional split proportion2 (pc/h) 409
Base percent time-spent-following, BPTSF(%) BPTSF=100(1-e-0.000879vp) 51.2
Adj. for directional distribution and no-passing zone, fd/hp(%)(Exh. 20-12) 15.2
Percent time-spent-following, PTSF(%) PTSF=BPTSF+f d/np 66.4
Level of Service and Other Performance MeasuresLevel of service, LOS (Exhibit 20-3 for Class I or 20-4 for Class II) C
Volume to capacity ratio v/c v/c=Vp/ 3,200 0.27
Peak 15-min veh-miles of travel,VMT15 (veh- mi) VMT15= 0.25Lt(V/PHF) 1847
Peak-hour vehicle-miles of travel, VMT60 (veh- mi) VMT60=V*Lt 6500
Peak 15-min total travel time, TT15(veh-h) TT15= VMT15/ATS 38.8
Notes
1. If vp >= 3,200 pc/h, terminate analysis-the LOS is F. 2. If highest directional split vp>= 1,700 pc/h, terminated anlysis-the LOS is F.
HCS2000TM Copyright © 2000 University of Florida, All Rights Reserved Version 4.1f
Page 1 of 1Two-Way
1/20/2010file://C:\Documents and Settings\max.scheideman\Local Settings\Temp\s2k1BAC.tmp

TWO-WAY TWO-LANE HIGHWAY SEGMENT WORKSHEETGeneral Information Site InformationAnalyst Tetra Tech ISGAgency or Company Rosemont Copper CompanyDate Performed 1/17/2010Analysis Time Period Peak Season, Weekday, AM
Highway AZ-83From/To Hidden Valley Rd/GreatervilleJurisdiction Pima CountyAnalysis Year Operations Year 20,50% Carpool
Input Data
Class I highway Class II highway
Terrain Level RollingTwo-way hourly volume 486 veh/hDirectional split 50 / 50Peak-hour factor, PHF 0.88No-passing zone 100 % Trucks and Buses , PT 8 %
% Recreational vehicles, PR 4%
Access points/ mi 0
Average Travel Speed
Grade adjustment factor, fG (Exhibit 20-7) 0.93
Passenger-car equivalents for trucks, ET (Exhibit 20-9) 1.9
Passenger-car equivalents for RVs, ER (Exhibit 20-9) 1.1
Heavy-vehicle adjustment factor, fHV fHV=1/ (1+ PT(ET-1)+PR(ER-1) ) 0.929
Two-way flow rate1, vp (pc/h) vp=V/ (PHF * fG * fHV) 639
vp * highest directional split proportion2 (pc/h) 320
Free-Flow Speed from Field Measurement Estimated Free-Flow Speed
Field Measured speed, SFM mi/h
Observed volume, Vf veh/h
Free-flow speed, FFS FFS=SFM+0.00776(Vf/ fHV ) 57.4 mi/h
Base free-flow speed, BFFSFM 60.0mi/h
Adj. for lane width and shoulder width3, fLS (Exhibit 20-5) 2.6mi/h
Adj. for access points, fA (Exhibit 20-6) 0.0
mi/h
Free-flow speed, FFS (FSS=BFFS-fLS-fA) 57.4mi/h
Adj. for no-passing zones, fnp ( mi/h) (Exhibit 20-11) 3.7
Average travel speed, ATS ( mi/h) ATS=FFS-0.00776vp-fnp 48.7
Percent Time-Spent-Following
Grade Adjustment factor, fG (Exhibit 20-8) 0.94
Passenger-car equivalents for trucks, ET (Exhibit 20-10) 1.5
Passenger-car equivalents for RVs, ER (Exhibit 20-10) 1.0
Heavy-vehicle adjustment factor, fHV fHV=1/ (1+ PT(ET-1)+PR(ER-1) ) 0.962
Two-way flow rate1, vp (pc/h) vp=V/ (PHF * fG * fHV) 611
vp * highest directional split proportion2 (pc/h) 306
Base percent time-spent-following, BPTSF(%) BPTSF=100(1-e-0.000879vp) 41.6
Adj. for directional distribution and no-passing zone, fd/hp(%)(Exh. 20-12) 20.2
Percent time-spent-following, PTSF(%) PTSF=BPTSF+f d/np 61.8
Level of Service and Other Performance MeasuresLevel of service, LOS (Exhibit 20-3 for Class I or 20-4 for Class II) C
Volume to capacity ratio v/c v/c=Vp/ 3,200 0.20
Peak 15-min veh-miles of travel,VMT15 (veh- mi) VMT15= 0.25Lt(V/PHF) 828
Peak-hour vehicle-miles of travel, VMT60 (veh- mi) VMT60=V*Lt 2916
Peak 15-min total travel time, TT15(veh-h) TT15= VMT15/ATS 17.0
Notes
1. If vp >= 3,200 pc/h, terminate analysis-the LOS is F. 2. If highest directional split vp>= 1,700 pc/h, terminated anlysis-the LOS is F.
HCS2000TM Copyright © 2000 University of Florida, All Rights Reserved Version 4.1f
Page 1 of 1Two-Way
1/20/2010file://C:\Documents and Settings\max.scheideman\Local Settings\Temp\s2k1BB3.tmp

TWO-WAY TWO-LANE HIGHWAY SEGMENT WORKSHEETGeneral Information Site InformationAnalyst Tetra Tech ISGAgency or Company Rosemont Copper CompanyDate Performed 1/17/2010Analysis Time Period Peak Season, Weekday, PM
Highway AZ-83From/To I-10 ramp/Hidden Valley RdJurisdiction Pima CountyAnalysis Year Operations Year 20,50% Carpool
Input Data
Class I highway Class II highway
Terrain Level RollingTwo-way hourly volume 799 veh/hDirectional split 50 / 50Peak-hour factor, PHF 0.88No-passing zone 100 % Trucks and Buses , PT 8 %
% Recreational vehicles, PR 4%
Access points/ mi 1
Average Travel Speed
Grade adjustment factor, fG (Exhibit 20-7) 0.93
Passenger-car equivalents for trucks, ET (Exhibit 20-9) 1.9
Passenger-car equivalents for RVs, ER (Exhibit 20-9) 1.1
Heavy-vehicle adjustment factor, fHV fHV=1/ (1+ PT(ET-1)+PR(ER-1) ) 0.929
Two-way flow rate1, vp (pc/h) vp=V/ (PHF * fG * fHV) 1050
vp * highest directional split proportion2 (pc/h) 525
Free-Flow Speed from Field Measurement Estimated Free-Flow Speed
Field Measured speed, SFM mi/h
Observed volume, Vf veh/h
Free-flow speed, FFS FFS=SFM+0.00776(Vf/ fHV ) 57.2 mi/h
Base free-flow speed, BFFSFM 60.0mi/h
Adj. for lane width and shoulder width3, fLS (Exhibit 20-5) 2.6mi/h
Adj. for access points, fA (Exhibit 20-6) 0.3
mi/h
Free-flow speed, FFS (FSS=BFFS-fLS-fA) 57.2mi/h
Adj. for no-passing zones, fnp ( mi/h) (Exhibit 20-11) 2.5
Average travel speed, ATS ( mi/h) ATS=FFS-0.00776vp-fnp 46.5
Percent Time-Spent-Following
Grade Adjustment factor, fG (Exhibit 20-8) 0.94
Passenger-car equivalents for trucks, ET (Exhibit 20-10) 1.5
Passenger-car equivalents for RVs, ER (Exhibit 20-10) 1.0
Heavy-vehicle adjustment factor, fHV fHV=1/ (1+ PT(ET-1)+PR(ER-1) ) 0.962
Two-way flow rate1, vp (pc/h) vp=V/ (PHF * fG * fHV) 1005
vp * highest directional split proportion2 (pc/h) 503
Base percent time-spent-following, BPTSF(%) BPTSF=100(1-e-0.000879vp) 58.7
Adj. for directional distribution and no-passing zone, fd/hp(%)(Exh. 20-12) 12.8
Percent time-spent-following, PTSF(%) PTSF=BPTSF+f d/np 71.5
Level of Service and Other Performance MeasuresLevel of service, LOS (Exhibit 20-3 for Class I or 20-4 for Class II) D
Volume to capacity ratio v/c v/c=Vp/ 3,200 0.33
Peak 15-min veh-miles of travel,VMT15 (veh- mi) VMT15= 0.25Lt(V/PHF) 2270
Peak-hour vehicle-miles of travel, VMT60 (veh- mi) VMT60=V*Lt 7990
Peak 15-min total travel time, TT15(veh-h) TT15= VMT15/ATS 48.8
Notes
1. If vp >= 3,200 pc/h, terminate analysis-the LOS is F. 2. If highest directional split vp>= 1,700 pc/h, terminated anlysis-the LOS is F.
HCS2000TM Copyright © 2000 University of Florida, All Rights Reserved Version 4.1f
Page 1 of 1Two-Way
1/20/2010file://C:\Documents and Settings\max.scheideman\Local Settings\Temp\s2k1BB5.tmp

TWO-WAY TWO-LANE HIGHWAY SEGMENT WORKSHEETGeneral Information Site InformationAnalyst Tetra Tech ISGAgency or Company Rosemont Copper CompanyDate Performed 1/17/2010Analysis Time Period Peak Season, Weekday, PM
Highway AZ-83From/To Hidden Valley Rd./GreatervilleJurisdiction Pima CountyAnalysis Year Operations Year 20,50% Carpool
Input Data
Class I highway Class II highway
Terrain Level RollingTwo-way hourly volume 651 veh/hDirectional split 50 / 50Peak-hour factor, PHF 0.88No-passing zone 100 % Trucks and Buses , PT 8 %
% Recreational vehicles, PR 4%
Access points/ mi 0
Average Travel Speed
Grade adjustment factor, fG (Exhibit 20-7) 0.93
Passenger-car equivalents for trucks, ET (Exhibit 20-9) 1.9
Passenger-car equivalents for RVs, ER (Exhibit 20-9) 1.1
Heavy-vehicle adjustment factor, fHV fHV=1/ (1+ PT(ET-1)+PR(ER-1) ) 0.929
Two-way flow rate1, vp (pc/h) vp=V/ (PHF * fG * fHV) 856
vp * highest directional split proportion2 (pc/h) 428
Free-Flow Speed from Field Measurement Estimated Free-Flow Speed
Field Measured speed, SFM mi/h
Observed volume, Vf veh/h
Free-flow speed, FFS FFS=SFM+0.00776(Vf/ fHV ) 57.4 mi/h
Base free-flow speed, BFFSFM 60.0mi/h
Adj. for lane width and shoulder width3, fLS (Exhibit 20-5) 2.6mi/h
Adj. for access points, fA (Exhibit 20-6) 0.0
mi/h
Free-flow speed, FFS (FSS=BFFS-fLS-fA) 57.4mi/h
Adj. for no-passing zones, fnp ( mi/h) (Exhibit 20-11) 2.9
Average travel speed, ATS ( mi/h) ATS=FFS-0.00776vp-fnp 47.9
Percent Time-Spent-Following
Grade Adjustment factor, fG (Exhibit 20-8) 0.94
Passenger-car equivalents for trucks, ET (Exhibit 20-10) 1.5
Passenger-car equivalents for RVs, ER (Exhibit 20-10) 1.0
Heavy-vehicle adjustment factor, fHV fHV=1/ (1+ PT(ET-1)+PR(ER-1) ) 0.962
Two-way flow rate1, vp (pc/h) vp=V/ (PHF * fG * fHV) 818
vp * highest directional split proportion2 (pc/h) 409
Base percent time-spent-following, BPTSF(%) BPTSF=100(1-e-0.000879vp) 51.3
Adj. for directional distribution and no-passing zone, fd/hp(%)(Exh. 20-12) 15.2
Percent time-spent-following, PTSF(%) PTSF=BPTSF+f d/np 66.5
Level of Service and Other Performance MeasuresLevel of service, LOS (Exhibit 20-3 for Class I or 20-4 for Class II) C
Volume to capacity ratio v/c v/c=Vp/ 3,200 0.27
Peak 15-min veh-miles of travel,VMT15 (veh- mi) VMT15= 0.25Lt(V/PHF) 1110
Peak-hour vehicle-miles of travel, VMT60 (veh- mi) VMT60=V*Lt 3906
Peak 15-min total travel time, TT15(veh-h) TT15= VMT15/ATS 23.2
Notes
1. If vp >= 3,200 pc/h, terminate analysis-the LOS is F. 2. If highest directional split vp>= 1,700 pc/h, terminated anlysis-the LOS is F.
HCS2000TM Copyright © 2000 University of Florida, All Rights Reserved Version 4.1f
Page 1 of 1Two-Way
1/21/2010file://C:\Documents and Settings\max.scheideman\Local Settings\Temp\s2k1D4B.tmp

TWO-WAY TWO-LANE HIGHWAY SEGMENT WORKSHEETGeneral Information Site InformationAnalyst Tetra Tech ISGAgency or Company Rosemont Copper CompanyDate Performed 1/17/2010Analysis Time Period Peak Season, Weekend, AM
Highway AZ-83From/To I-10 Ramp/Hidden Valley Rd.Jurisdiction Pima CountyAnalysis Year Operations Year 20,50% Carpool
Input Data
Class I highway Class II highway
Terrain Level RollingTwo-way hourly volume 597 veh/hDirectional split 50 / 50Peak-hour factor, PHF 0.88No-passing zone 100 % Trucks and Buses , PT 8 %
% Recreational vehicles, PR 4%
Access points/ mi 1
Average Travel Speed
Grade adjustment factor, fG (Exhibit 20-7) 0.93
Passenger-car equivalents for trucks, ET (Exhibit 20-9) 1.9
Passenger-car equivalents for RVs, ER (Exhibit 20-9) 1.1
Heavy-vehicle adjustment factor, fHV fHV=1/ (1+ PT(ET-1)+PR(ER-1) ) 0.929
Two-way flow rate1, vp (pc/h) vp=V/ (PHF * fG * fHV) 785
vp * highest directional split proportion2 (pc/h) 393
Free-Flow Speed from Field Measurement Estimated Free-Flow Speed
Field Measured speed, SFM mi/h
Observed volume, Vf veh/h
Free-flow speed, FFS FFS=SFM+0.00776(Vf/ fHV ) 57.2 mi/h
Base free-flow speed, BFFSFM 60.0mi/h
Adj. for lane width and shoulder width3, fLS (Exhibit 20-5) 2.6mi/h
Adj. for access points, fA (Exhibit 20-6) 0.3
mi/h
Free-flow speed, FFS (FSS=BFFS-fLS-fA) 57.2mi/h
Adj. for no-passing zones, fnp ( mi/h) (Exhibit 20-11) 3.1
Average travel speed, ATS ( mi/h) ATS=FFS-0.00776vp-fnp 48.0
Percent Time-Spent-Following
Grade Adjustment factor, fG (Exhibit 20-8) 0.94
Passenger-car equivalents for trucks, ET (Exhibit 20-10) 1.5
Passenger-car equivalents for RVs, ER (Exhibit 20-10) 1.0
Heavy-vehicle adjustment factor, fHV fHV=1/ (1+ PT(ET-1)+PR(ER-1) ) 0.962
Two-way flow rate1, vp (pc/h) vp=V/ (PHF * fG * fHV) 751
vp * highest directional split proportion2 (pc/h) 376
Base percent time-spent-following, BPTSF(%) BPTSF=100(1-e-0.000879vp) 48.3
Adj. for directional distribution and no-passing zone, fd/hp(%)(Exh. 20-12) 16.6
Percent time-spent-following, PTSF(%) PTSF=BPTSF+f d/np 65.0
Level of Service and Other Performance MeasuresLevel of service, LOS (Exhibit 20-3 for Class I or 20-4 for Class II) C
Volume to capacity ratio v/c v/c=Vp/ 3,200 0.25
Peak 15-min veh-miles of travel,VMT15 (veh- mi) VMT15= 0.25Lt(V/PHF) 1696
Peak-hour vehicle-miles of travel, VMT60 (veh- mi) VMT60=V*Lt 5970
Peak 15-min total travel time, TT15(veh-h) TT15= VMT15/ATS 35.3
Notes
1. If vp >= 3,200 pc/h, terminate analysis-the LOS is F. 2. If highest directional split vp>= 1,700 pc/h, terminated anlysis-the LOS is F.
HCS2000TM Copyright © 2000 University of Florida, All Rights Reserved Version 4.1f
Page 1 of 1Two-Way
1/20/2010file://C:\Documents and Settings\max.scheideman\Local Settings\Temp\s2k1BC9.tmp

TWO-WAY TWO-LANE HIGHWAY SEGMENT WORKSHEETGeneral Information Site InformationAnalyst Tetra Tech ISGAgency or Company Rosemont Copper CompanyDate Performed 1/17/2010Analysis Time Period Peak Season, Weekend, AM
Highway AZ-83From/To Hidden Valley Rd./GreatervilleJurisdiction Pima CountyAnalysis Year Operations Year 20,50% Carpool
Input Data
Class I highway Class II highway
Terrain Level RollingTwo-way hourly volume 421 veh/hDirectional split 50 / 50Peak-hour factor, PHF 0.88No-passing zone 100 % Trucks and Buses , PT 8 %
% Recreational vehicles, PR 4%
Access points/ mi 0
Average Travel Speed
Grade adjustment factor, fG (Exhibit 20-7) 0.93
Passenger-car equivalents for trucks, ET (Exhibit 20-9) 1.9
Passenger-car equivalents for RVs, ER (Exhibit 20-9) 1.1
Heavy-vehicle adjustment factor, fHV fHV=1/ (1+ PT(ET-1)+PR(ER-1) ) 0.929
Two-way flow rate1, vp (pc/h) vp=V/ (PHF * fG * fHV) 554
vp * highest directional split proportion2 (pc/h) 277
Free-Flow Speed from Field Measurement Estimated Free-Flow Speed
Field Measured speed, SFM mi/h
Observed volume, Vf veh/h
Free-flow speed, FFS FFS=SFM+0.00776(Vf/ fHV ) 57.4 mi/h
Base free-flow speed, BFFSFM 60.0mi/h
Adj. for lane width and shoulder width3, fLS (Exhibit 20-5) 2.6mi/h
Adj. for access points, fA (Exhibit 20-6) 0.0
mi/h
Free-flow speed, FFS (FSS=BFFS-fLS-fA) 57.4mi/h
Adj. for no-passing zones, fnp ( mi/h) (Exhibit 20-11) 4.0
Average travel speed, ATS ( mi/h) ATS=FFS-0.00776vp-fnp 49.1
Percent Time-Spent-Following
Grade Adjustment factor, fG (Exhibit 20-8) 0.94
Passenger-car equivalents for trucks, ET (Exhibit 20-10) 1.5
Passenger-car equivalents for RVs, ER (Exhibit 20-10) 1.0
Heavy-vehicle adjustment factor, fHV fHV=1/ (1+ PT(ET-1)+PR(ER-1) ) 0.962
Two-way flow rate1, vp (pc/h) vp=V/ (PHF * fG * fHV) 529
vp * highest directional split proportion2 (pc/h) 265
Base percent time-spent-following, BPTSF(%) BPTSF=100(1-e-0.000879vp) 37.2
Adj. for directional distribution and no-passing zone, fd/hp(%)(Exh. 20-12) 22.0
Percent time-spent-following, PTSF(%) PTSF=BPTSF+f d/np 59.2
Level of Service and Other Performance MeasuresLevel of service, LOS (Exhibit 20-3 for Class I or 20-4 for Class II) C
Volume to capacity ratio v/c v/c=Vp/ 3,200 0.17
Peak 15-min veh-miles of travel,VMT15 (veh- mi) VMT15= 0.25Lt(V/PHF) 718
Peak-hour vehicle-miles of travel, VMT60 (veh- mi) VMT60=V*Lt 2526
Peak 15-min total travel time, TT15(veh-h) TT15= VMT15/ATS 14.6
Notes
1. If vp >= 3,200 pc/h, terminate analysis-the LOS is F. 2. If highest directional split vp>= 1,700 pc/h, terminated anlysis-the LOS is F.
HCS2000TM Copyright © 2000 University of Florida, All Rights Reserved Version 4.1f
Page 1 of 1Two-Way
1/20/2010file://C:\Documents and Settings\max.scheideman\Local Settings\Temp\s2k1BD4.tmp

TWO-WAY TWO-LANE HIGHWAY SEGMENT WORKSHEETGeneral Information Site InformationAnalyst Tetra Tech ISGAgency or Company Rosemont Copper CompanyDate Performed 1/17/2010Analysis Time Period Peak Season, Weekend, PM
Highway AZ-83From/To I-10 ramp/Hidden Valley Rd.Jurisdiction Pima CountyAnalysis Year Operations Year 20,50% Carpool
Input Data
Class I highway Class II highway
Terrain Level RollingTwo-way hourly volume 754 veh/hDirectional split 50 / 50Peak-hour factor, PHF 0.88No-passing zone 100 % Trucks and Buses , PT 8 %
% Recreational vehicles, PR 4%
Access points/ mi 1
Average Travel Speed
Grade adjustment factor, fG (Exhibit 20-7) 0.93
Passenger-car equivalents for trucks, ET (Exhibit 20-9) 1.9
Passenger-car equivalents for RVs, ER (Exhibit 20-9) 1.1
Heavy-vehicle adjustment factor, fHV fHV=1/ (1+ PT(ET-1)+PR(ER-1) ) 0.929
Two-way flow rate1, vp (pc/h) vp=V/ (PHF * fG * fHV) 991
vp * highest directional split proportion2 (pc/h) 496
Free-Flow Speed from Field Measurement Estimated Free-Flow Speed
Field Measured speed, SFM mi/h
Observed volume, Vf veh/h
Free-flow speed, FFS FFS=SFM+0.00776(Vf/ fHV ) 57.2 mi/h
Base free-flow speed, BFFSFM 60.0mi/h
Adj. for lane width and shoulder width3, fLS (Exhibit 20-5) 2.6mi/h
Adj. for access points, fA (Exhibit 20-6) 0.3
mi/h
Free-flow speed, FFS (FSS=BFFS-fLS-fA) 57.2mi/h
Adj. for no-passing zones, fnp ( mi/h) (Exhibit 20-11) 2.6
Average travel speed, ATS ( mi/h) ATS=FFS-0.00776vp-fnp 46.8
Percent Time-Spent-Following
Grade Adjustment factor, fG (Exhibit 20-8) 0.94
Passenger-car equivalents for trucks, ET (Exhibit 20-10) 1.5
Passenger-car equivalents for RVs, ER (Exhibit 20-10) 1.0
Heavy-vehicle adjustment factor, fHV fHV=1/ (1+ PT(ET-1)+PR(ER-1) ) 0.962
Two-way flow rate1, vp (pc/h) vp=V/ (PHF * fG * fHV) 948
vp * highest directional split proportion2 (pc/h) 474
Base percent time-spent-following, BPTSF(%) BPTSF=100(1-e-0.000879vp) 56.5
Adj. for directional distribution and no-passing zone, fd/hp(%)(Exh. 20-12) 13.6
Percent time-spent-following, PTSF(%) PTSF=BPTSF+f d/np 70.1
Level of Service and Other Performance MeasuresLevel of service, LOS (Exhibit 20-3 for Class I or 20-4 for Class II) D
Volume to capacity ratio v/c v/c=Vp/ 3,200 0.31
Peak 15-min veh-miles of travel,VMT15 (veh- mi) VMT15= 0.25Lt(V/PHF) 2142
Peak-hour vehicle-miles of travel, VMT60 (veh- mi) VMT60=V*Lt 7540
Peak 15-min total travel time, TT15(veh-h) TT15= VMT15/ATS 45.7
Notes
1. If vp >= 3,200 pc/h, terminate analysis-the LOS is F. 2. If highest directional split vp>= 1,700 pc/h, terminated anlysis-the LOS is F.
HCS2000TM Copyright © 2000 University of Florida, All Rights Reserved Version 4.1f
Page 1 of 1Two-Way
1/20/2010file://C:\Documents and Settings\max.scheideman\Local Settings\Temp\s2k1BDB.tmp
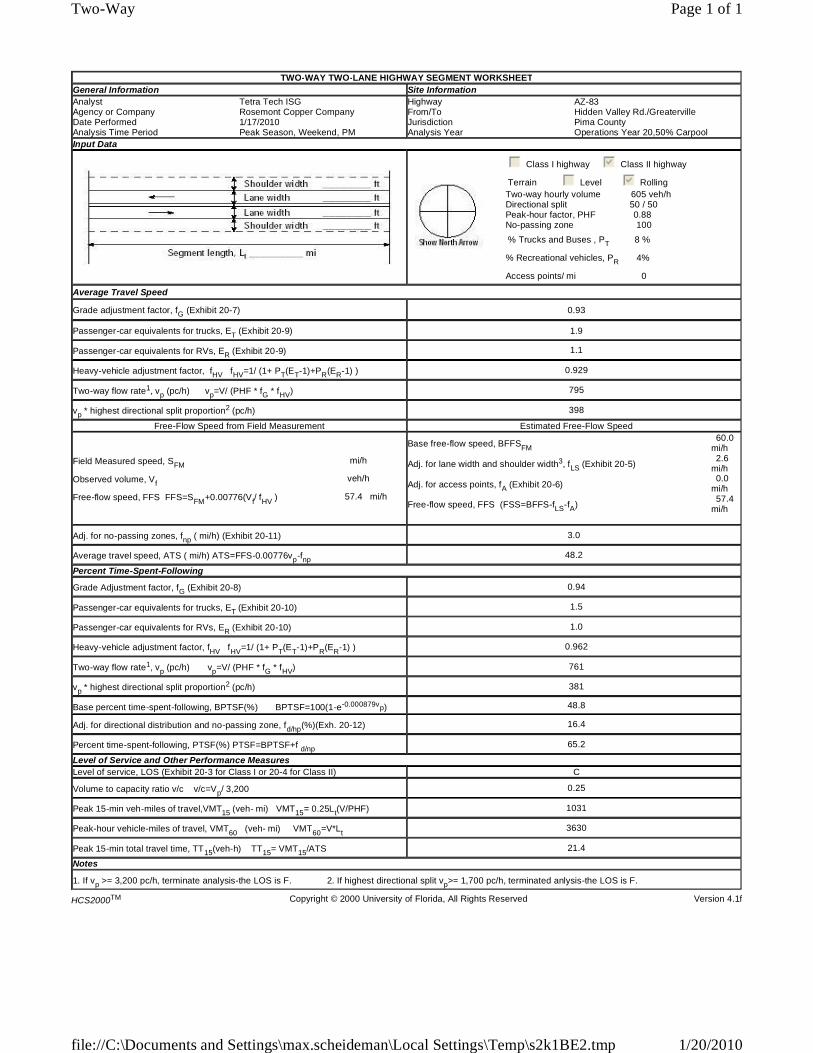
TWO-WAY TWO-LANE HIGHWAY SEGMENT WORKSHEETGeneral Information Site InformationAnalyst Tetra Tech ISGAgency or Company Rosemont Copper CompanyDate Performed 1/17/2010Analysis Time Period Peak Season, Weekend, PM
Highway AZ-83From/To Hidden Valley Rd./GreatervilleJurisdiction Pima CountyAnalysis Year Operations Year 20,50% Carpool
Input Data
Class I highway Class II highway
Terrain Level RollingTwo-way hourly volume 605 veh/hDirectional split 50 / 50Peak-hour factor, PHF 0.88No-passing zone 100 % Trucks and Buses , PT 8 %
% Recreational vehicles, PR 4%
Access points/ mi 0
Average Travel Speed
Grade adjustment factor, fG (Exhibit 20-7) 0.93
Passenger-car equivalents for trucks, ET (Exhibit 20-9) 1.9
Passenger-car equivalents for RVs, ER (Exhibit 20-9) 1.1
Heavy-vehicle adjustment factor, fHV fHV=1/ (1+ PT(ET-1)+PR(ER-1) ) 0.929
Two-way flow rate1, vp (pc/h) vp=V/ (PHF * fG * fHV) 795
vp * highest directional split proportion2 (pc/h) 398
Free-Flow Speed from Field Measurement Estimated Free-Flow Speed
Field Measured speed, SFM mi/h
Observed volume, Vf veh/h
Free-flow speed, FFS FFS=SFM+0.00776(Vf/ fHV ) 57.4 mi/h
Base free-flow speed, BFFSFM 60.0mi/h
Adj. for lane width and shoulder width3, fLS (Exhibit 20-5) 2.6mi/h
Adj. for access points, fA (Exhibit 20-6) 0.0
mi/h
Free-flow speed, FFS (FSS=BFFS-fLS-fA) 57.4mi/h
Adj. for no-passing zones, fnp ( mi/h) (Exhibit 20-11) 3.0
Average travel speed, ATS ( mi/h) ATS=FFS-0.00776vp-fnp 48.2
Percent Time-Spent-Following
Grade Adjustment factor, fG (Exhibit 20-8) 0.94
Passenger-car equivalents for trucks, ET (Exhibit 20-10) 1.5
Passenger-car equivalents for RVs, ER (Exhibit 20-10) 1.0
Heavy-vehicle adjustment factor, fHV fHV=1/ (1+ PT(ET-1)+PR(ER-1) ) 0.962
Two-way flow rate1, vp (pc/h) vp=V/ (PHF * fG * fHV) 761
vp * highest directional split proportion2 (pc/h) 381
Base percent time-spent-following, BPTSF(%) BPTSF=100(1-e-0.000879vp) 48.8
Adj. for directional distribution and no-passing zone, fd/hp(%)(Exh. 20-12) 16.4
Percent time-spent-following, PTSF(%) PTSF=BPTSF+f d/np 65.2
Level of Service and Other Performance MeasuresLevel of service, LOS (Exhibit 20-3 for Class I or 20-4 for Class II) C
Volume to capacity ratio v/c v/c=Vp/ 3,200 0.25
Peak 15-min veh-miles of travel,VMT15 (veh- mi) VMT15= 0.25Lt(V/PHF) 1031
Peak-hour vehicle-miles of travel, VMT60 (veh- mi) VMT60=V*Lt 3630
Peak 15-min total travel time, TT15(veh-h) TT15= VMT15/ATS 21.4
Notes
1. If vp >= 3,200 pc/h, terminate analysis-the LOS is F. 2. If highest directional split vp>= 1,700 pc/h, terminated anlysis-the LOS is F.
HCS2000TM Copyright © 2000 University of Florida, All Rights Reserved Version 4.1f
Page 1 of 1Two-Way
1/20/2010file://C:\Documents and Settings\max.scheideman\Local Settings\Temp\s2k1BE2.tmp

NON - PEAK SEASON
SCENARIO 5
50% CARPOOL WITH NO COPPER CONCENTRATE
TRUCKS

TWO-WAY TWO-LANE HIGHWAY SEGMENT WORKSHEETGeneral Information Site InformationAnalyst Tetra Tech ISGAgency or Company Rosemont Copper CompanyDate Performed 1/15/2010Analysis Time Period Non-Peak Season, Weekday, AM
Highway AZ-83From/To I-10 Ramps/Hidden Valley RdJurisdiction Pima CountyAnalysis Year Operations Year 20,50% NoTruck
Input Data
Class I highway Class II highway
Terrain Level RollingTwo-way hourly volume 523 veh/hDirectional split 50 / 50Peak-hour factor, PHF 0.88No-passing zone 100 % Trucks and Buses , PT 6 %
% Recreational vehicles, PR 4%
Access points/ mi 1
Average Travel Speed
Grade adjustment factor, fG (Exhibit 20-7) 0.93
Passenger-car equivalents for trucks, ET (Exhibit 20-9) 1.9
Passenger-car equivalents for RVs, ER (Exhibit 20-9) 1.1
Heavy-vehicle adjustment factor, fHV fHV=1/ (1+ PT(ET-1)+PR(ER-1) ) 0.945
Two-way flow rate1, vp (pc/h) vp=V/ (PHF * fG * fHV) 676
vp * highest directional split proportion2 (pc/h) 338
Free-Flow Speed from Field Measurement Estimated Free-Flow Speed
Field Measured speed, SFM mi/h
Observed volume, Vf veh/h
Free-flow speed, FFS FFS=SFM+0.00776(Vf/ fHV ) 57.2 mi/h
Base free-flow speed, BFFSFM 60.0mi/h
Adj. for lane width and shoulder width3, fLS (Exhibit 20-5) 2.6mi/h
Adj. for access points, fA (Exhibit 20-6) 0.3
mi/h
Free-flow speed, FFS (FSS=BFFS-fLS-fA) 57.2mi/h
Adj. for no-passing zones, fnp ( mi/h) (Exhibit 20-11) 3.6
Average travel speed, ATS ( mi/h) ATS=FFS-0.00776vp-fnp 48.3
Percent Time-Spent-Following
Grade Adjustment factor, fG (Exhibit 20-8) 0.94
Passenger-car equivalents for trucks, ET (Exhibit 20-10) 1.5
Passenger-car equivalents for RVs, ER (Exhibit 20-10) 1.0
Heavy-vehicle adjustment factor, fHV fHV=1/ (1+ PT(ET-1)+PR(ER-1) ) 0.971
Two-way flow rate1, vp (pc/h) vp=V/ (PHF * fG * fHV) 651
vp * highest directional split proportion2 (pc/h) 326
Base percent time-spent-following, BPTSF(%) BPTSF=100(1-e-0.000879vp) 43.6
Adj. for directional distribution and no-passing zone, fd/hp(%)(Exh. 20-12) 19.2
Percent time-spent-following, PTSF(%) PTSF=BPTSF+f d/np 62.8
Level of Service and Other Performance MeasuresLevel of service, LOS (Exhibit 20-3 for Class I or 20-4 for Class II) C
Volume to capacity ratio v/c v/c=Vp/ 3,200 0.21
Peak 15-min veh-miles of travel,VMT15 (veh- mi) VMT15= 0.25Lt(V/PHF) 1486
Peak-hour vehicle-miles of travel, VMT60 (veh- mi) VMT60=V*Lt 5230
Peak 15-min total travel time, TT15(veh-h) TT15= VMT15/ATS 30.7
Notes
1. If vp >= 3,200 pc/h, terminate analysis-the LOS is F. 2. If highest directional split vp>= 1,700 pc/h, terminated anlysis-the LOS is F.
HCS2000TM Copyright © 2000 University of Florida, All Rights Reserved Version 4.1f
Page 1 of 1Two-Way
1/20/2010file://C:\Documents and Settings\max.scheideman\Local Settings\Temp\s2k1C81.tmp

TWO-WAY TWO-LANE HIGHWAY SEGMENT WORKSHEETGeneral Information Site InformationAnalyst Tetra Tech ISGAgency or Company Rosemont Copper CompanyDate Performed 1/15/2010Analysis Time Period Non-Peak Season, Weekday, AM
Highway AZ-83From/To Hidden Valley Rd/GreatervilleJurisdiction Pima CountyAnalysis Year Operations Year 20,50% NoTruck
Input Data
Class I highway Class II highway
Terrain Level RollingTwo-way hourly volume 620 veh/hDirectional split 50 / 50Peak-hour factor, PHF 0.88No-passing zone 100 % Trucks and Buses , PT 6 %
% Recreational vehicles, PR 4%
Access points/ mi 0
Average Travel Speed
Grade adjustment factor, fG (Exhibit 20-7) 0.93
Passenger-car equivalents for trucks, ET (Exhibit 20-9) 1.9
Passenger-car equivalents for RVs, ER (Exhibit 20-9) 1.1
Heavy-vehicle adjustment factor, fHV fHV=1/ (1+ PT(ET-1)+PR(ER-1) ) 0.945
Two-way flow rate1, vp (pc/h) vp=V/ (PHF * fG * fHV) 802
vp * highest directional split proportion2 (pc/h) 401
Free-Flow Speed from Field Measurement Estimated Free-Flow Speed
Field Measured speed, SFM mi/h
Observed volume, Vf veh/h
Free-flow speed, FFS FFS=SFM+0.00776(Vf/ fHV ) 57.4 mi/h
Base free-flow speed, BFFSFM 60.0mi/h
Adj. for lane width and shoulder width3, fLS (Exhibit 20-5) 2.6mi/h
Adj. for access points, fA (Exhibit 20-6) 0.0
mi/h
Free-flow speed, FFS (FSS=BFFS-fLS-fA) 57.4mi/h
Adj. for no-passing zones, fnp ( mi/h) (Exhibit 20-11) 3.0
Average travel speed, ATS ( mi/h) ATS=FFS-0.00776vp-fnp 48.2
Percent Time-Spent-Following
Grade Adjustment factor, fG (Exhibit 20-8) 0.94
Passenger-car equivalents for trucks, ET (Exhibit 20-10) 1.5
Passenger-car equivalents for RVs, ER (Exhibit 20-10) 1.0
Heavy-vehicle adjustment factor, fHV fHV=1/ (1+ PT(ET-1)+PR(ER-1) ) 0.971
Two-way flow rate1, vp (pc/h) vp=V/ (PHF * fG * fHV) 772
vp * highest directional split proportion2 (pc/h) 386
Base percent time-spent-following, BPTSF(%) BPTSF=100(1-e-0.000879vp) 49.3
Adj. for directional distribution and no-passing zone, fd/hp(%)(Exh. 20-12) 16.1
Percent time-spent-following, PTSF(%) PTSF=BPTSF+f d/np 65.4
Level of Service and Other Performance MeasuresLevel of service, LOS (Exhibit 20-3 for Class I or 20-4 for Class II) C
Volume to capacity ratio v/c v/c=Vp/ 3,200 0.25
Peak 15-min veh-miles of travel,VMT15 (veh- mi) VMT15= 0.25Lt(V/PHF) 1057
Peak-hour vehicle-miles of travel, VMT60 (veh- mi) VMT60=V*Lt 3720
Peak 15-min total travel time, TT15(veh-h) TT15= VMT15/ATS 21.9
Notes
1. If vp >= 3,200 pc/h, terminate analysis-the LOS is F. 2. If highest directional split vp>= 1,700 pc/h, terminated anlysis-the LOS is F.
HCS2000TM Copyright © 2000 University of Florida, All Rights Reserved Version 4.1f
Page 1 of 1Two-Way
1/20/2010file://C:\Documents and Settings\max.scheideman\Local Settings\Temp\s2k1C93.tmp

TWO-WAY TWO-LANE HIGHWAY SEGMENT WORKSHEETGeneral Information Site InformationAnalyst Tetra Tech ISGAgency or Company Rosemont Copper CompanyDate Performed 1/1/5/2010Analysis Time Period Non-Peak Season, Weekday, PM
Highway AZ-83From/To I-10 Ramp/Hidden Valley RdJurisdiction Pima CountyAnalysis Year Operations Year 20,50% NoTruck
Input Data
Class I highway Class II highway
Terrain Level RollingTwo-way hourly volume 635 veh/hDirectional split 50 / 50Peak-hour factor, PHF 0.88No-passing zone 100 % Trucks and Buses , PT 6 %
% Recreational vehicles, PR 4%
Access points/ mi 1
Average Travel Speed
Grade adjustment factor, fG (Exhibit 20-7) 0.93
Passenger-car equivalents for trucks, ET (Exhibit 20-9) 1.9
Passenger-car equivalents for RVs, ER (Exhibit 20-9) 1.1
Heavy-vehicle adjustment factor, fHV fHV=1/ (1+ PT(ET-1)+PR(ER-1) ) 0.945
Two-way flow rate1, vp (pc/h) vp=V/ (PHF * fG * fHV) 821
vp * highest directional split proportion2 (pc/h) 411
Free-Flow Speed from Field Measurement Estimated Free-Flow Speed
Field Measured speed, SFM mi/h
Observed volume, Vf veh/h
Free-flow speed, FFS FFS=SFM+0.00776(Vf/ fHV ) 57.2 mi/h
Base free-flow speed, BFFSFM 60.0mi/h
Adj. for lane width and shoulder width3, fLS (Exhibit 20-5) 2.6mi/h
Adj. for access points, fA (Exhibit 20-6) 0.3
mi/h
Free-flow speed, FFS (FSS=BFFS-fLS-fA) 57.2mi/h
Adj. for no-passing zones, fnp ( mi/h) (Exhibit 20-11) 3.0
Average travel speed, ATS ( mi/h) ATS=FFS-0.00776vp-fnp 47.8
Percent Time-Spent-Following
Grade Adjustment factor, fG (Exhibit 20-8) 0.94
Passenger-car equivalents for trucks, ET (Exhibit 20-10) 1.5
Passenger-car equivalents for RVs, ER (Exhibit 20-10) 1.0
Heavy-vehicle adjustment factor, fHV fHV=1/ (1+ PT(ET-1)+PR(ER-1) ) 0.971
Two-way flow rate1, vp (pc/h) vp=V/ (PHF * fG * fHV) 791
vp * highest directional split proportion2 (pc/h) 396
Base percent time-spent-following, BPTSF(%) BPTSF=100(1-e-0.000879vp) 50.1
Adj. for directional distribution and no-passing zone, fd/hp(%)(Exh. 20-12) 15.6
Percent time-spent-following, PTSF(%) PTSF=BPTSF+f d/np 65.7
Level of Service and Other Performance MeasuresLevel of service, LOS (Exhibit 20-3 for Class I or 20-4 for Class II) C
Volume to capacity ratio v/c v/c=Vp/ 3,200 0.26
Peak 15-min veh-miles of travel,VMT15 (veh- mi) VMT15= 0.25Lt(V/PHF) 1804
Peak-hour vehicle-miles of travel, VMT60 (veh- mi) VMT60=V*Lt 6350
Peak 15-min total travel time, TT15(veh-h) TT15= VMT15/ATS 37.7
Notes
1. If vp >= 3,200 pc/h, terminate analysis-the LOS is F. 2. If highest directional split vp>= 1,700 pc/h, terminated anlysis-the LOS is F.
HCS2000TM Copyright © 2000 University of Florida, All Rights Reserved Version 4.1f
Page 1 of 1Two-Way
1/20/2010file://C:\Documents and Settings\max.scheideman\Local Settings\Temp\s2k1C9A.tmp

TWO-WAY TWO-LANE HIGHWAY SEGMENT WORKSHEETGeneral Information Site InformationAnalyst Tetra Tech ISGAgency or Company Rosemont Copper CompanyDate Performed 1/15/2010Analysis Time Period Non-Peak Season, Weekday, PM
Highway AZ-83From/To Hidden Valley Rd/GreatervilleJurisdiction Pima CountyAnalysis Year Operations Year 20,50% NoTruck
Input Data
Class I highway Class II highway
Terrain Level RollingTwo-way hourly volume 597 veh/hDirectional split 50 / 50Peak-hour factor, PHF 0.88No-passing zone 100 % Trucks and Buses , PT 8 %
% Recreational vehicles, PR 4%
Access points/ mi 0
Average Travel Speed
Grade adjustment factor, fG (Exhibit 20-7) 0.93
Passenger-car equivalents for trucks, ET (Exhibit 20-9) 1.9
Passenger-car equivalents for RVs, ER (Exhibit 20-9) 1.1
Heavy-vehicle adjustment factor, fHV fHV=1/ (1+ PT(ET-1)+PR(ER-1) ) 0.929
Two-way flow rate1, vp (pc/h) vp=V/ (PHF * fG * fHV) 785
vp * highest directional split proportion2 (pc/h) 393
Free-Flow Speed from Field Measurement Estimated Free-Flow Speed
Field Measured speed, SFM mi/h
Observed volume, Vf veh/h
Free-flow speed, FFS FFS=SFM+0.00776(Vf/ fHV ) 57.4 mi/h
Base free-flow speed, BFFSFM 60.0mi/h
Adj. for lane width and shoulder width3, fLS (Exhibit 20-5) 2.6mi/h
Adj. for access points, fA (Exhibit 20-6) 0.0
mi/h
Free-flow speed, FFS (FSS=BFFS-fLS-fA) 57.4mi/h
Adj. for no-passing zones, fnp ( mi/h) (Exhibit 20-11) 3.1
Average travel speed, ATS ( mi/h) ATS=FFS-0.00776vp-fnp 48.2
Percent Time-Spent-Following
Grade Adjustment factor, fG (Exhibit 20-8) 0.94
Passenger-car equivalents for trucks, ET (Exhibit 20-10) 1.5
Passenger-car equivalents for RVs, ER (Exhibit 20-10) 1.0
Heavy-vehicle adjustment factor, fHV fHV=1/ (1+ PT(ET-1)+PR(ER-1) ) 0.962
Two-way flow rate1, vp (pc/h) vp=V/ (PHF * fG * fHV) 751
vp * highest directional split proportion2 (pc/h) 376
Base percent time-spent-following, BPTSF(%) BPTSF=100(1-e-0.000879vp) 48.3
Adj. for directional distribution and no-passing zone, fd/hp(%)(Exh. 20-12) 16.6
Percent time-spent-following, PTSF(%) PTSF=BPTSF+f d/np 65.0
Level of Service and Other Performance MeasuresLevel of service, LOS (Exhibit 20-3 for Class I or 20-4 for Class II) C
Volume to capacity ratio v/c v/c=Vp/ 3,200 0.25
Peak 15-min veh-miles of travel,VMT15 (veh- mi) VMT15= 0.25Lt(V/PHF) 1018
Peak-hour vehicle-miles of travel, VMT60 (veh- mi) VMT60=V*Lt 3582
Peak 15-min total travel time, TT15(veh-h) TT15= VMT15/ATS 21.1
Notes
1. If vp >= 3,200 pc/h, terminate analysis-the LOS is F. 2. If highest directional split vp>= 1,700 pc/h, terminated anlysis-the LOS is F.
HCS2000TM Copyright © 2000 University of Florida, All Rights Reserved Version 4.1f
Page 1 of 1Two-Way
1/21/2010file://C:\Documents and Settings\max.scheideman\Local Settings\Temp\s2k1CC3.tmp

TWO-WAY TWO-LANE HIGHWAY SEGMENT WORKSHEETGeneral Information Site InformationAnalyst Tetra Tech ISGAgency or Company Rosemont Copper CompanyDate Performed 1/15/2010Analysis Time Period Non-Peak Season, Weekend, AM
Highway AZ-83From/To I-10 Ramp/Hidden Valley RdJurisdiction Pima CountyAnalysis Year Operations Year 20,50% NoTruck
Input Data
Class I highway Class II highway
Terrain Level RollingTwo-way hourly volume 602 veh/hDirectional split 50 / 50Peak-hour factor, PHF 0.88No-passing zone 100 % Trucks and Buses , PT 6 %
% Recreational vehicles, PR 4%
Access points/ mi 1
Average Travel Speed
Grade adjustment factor, fG (Exhibit 20-7) 0.93
Passenger-car equivalents for trucks, ET (Exhibit 20-9) 1.9
Passenger-car equivalents for RVs, ER (Exhibit 20-9) 1.1
Heavy-vehicle adjustment factor, fHV fHV=1/ (1+ PT(ET-1)+PR(ER-1) ) 0.945
Two-way flow rate1, vp (pc/h) vp=V/ (PHF * fG * fHV) 778
vp * highest directional split proportion2 (pc/h) 389
Free-Flow Speed from Field Measurement Estimated Free-Flow Speed
Field Measured speed, SFM mi/h
Observed volume, Vf veh/h
Free-flow speed, FFS FFS=SFM+0.00776(Vf/ fHV ) 57.2 mi/h
Base free-flow speed, BFFSFM 60.0mi/h
Adj. for lane width and shoulder width3, fLS (Exhibit 20-5) 2.6mi/h
Adj. for access points, fA (Exhibit 20-6) 0.3
mi/h
Free-flow speed, FFS (FSS=BFFS-fLS-fA) 57.2mi/h
Adj. for no-passing zones, fnp ( mi/h) (Exhibit 20-11) 3.1
Average travel speed, ATS ( mi/h) ATS=FFS-0.00776vp-fnp 48.0
Percent Time-Spent-Following
Grade Adjustment factor, fG (Exhibit 20-8) 0.94
Passenger-car equivalents for trucks, ET (Exhibit 20-10) 1.5
Passenger-car equivalents for RVs, ER (Exhibit 20-10) 1.0
Heavy-vehicle adjustment factor, fHV fHV=1/ (1+ PT(ET-1)+PR(ER-1) ) 0.971
Two-way flow rate1, vp (pc/h) vp=V/ (PHF * fG * fHV) 750
vp * highest directional split proportion2 (pc/h) 375
Base percent time-spent-following, BPTSF(%) BPTSF=100(1-e-0.000879vp) 48.3
Adj. for directional distribution and no-passing zone, fd/hp(%)(Exh. 20-12) 16.7
Percent time-spent-following, PTSF(%) PTSF=BPTSF+f d/np 65.0
Level of Service and Other Performance MeasuresLevel of service, LOS (Exhibit 20-3 for Class I or 20-4 for Class II) C
Volume to capacity ratio v/c v/c=Vp/ 3,200 0.24
Peak 15-min veh-miles of travel,VMT15 (veh- mi) VMT15= 0.25Lt(V/PHF) 1710
Peak-hour vehicle-miles of travel, VMT60 (veh- mi) VMT60=V*Lt 6020
Peak 15-min total travel time, TT15(veh-h) TT15= VMT15/ATS 35.6
Notes
1. If vp >= 3,200 pc/h, terminate analysis-the LOS is F. 2. If highest directional split vp>= 1,700 pc/h, terminated anlysis-the LOS is F.
HCS2000TM Copyright © 2000 University of Florida, All Rights Reserved Version 4.1f
Page 1 of 1Two-Way
1/21/2010file://C:\Documents and Settings\max.scheideman\Local Settings\Temp\s2k1CB5.tmp

TWO-WAY TWO-LANE HIGHWAY SEGMENT WORKSHEETGeneral Information Site InformationAnalyst Tetra Tech ISGAgency or Company Rosemont Copper CompanyDate Performed 1/15/2010Analysis Time Period Non Peak Season, Weekend, AM
Highway AZ-83From/To Hidden Valley Rd/GreatervilleJurisdiction Pima CountyAnalysis Year Operations Year 20,50% NoTruck
Input Data
Class I highway Class II highway
Terrain Level RollingTwo-way hourly volume 484 veh/hDirectional split 50 / 50Peak-hour factor, PHF 0.88No-passing zone 100 % Trucks and Buses , PT 6 %
% Recreational vehicles, PR 4%
Access points/ mi 0
Average Travel Speed
Grade adjustment factor, fG (Exhibit 20-7) 0.93
Passenger-car equivalents for trucks, ET (Exhibit 20-9) 1.9
Passenger-car equivalents for RVs, ER (Exhibit 20-9) 1.1
Heavy-vehicle adjustment factor, fHV fHV=1/ (1+ PT(ET-1)+PR(ER-1) ) 0.945
Two-way flow rate1, vp (pc/h) vp=V/ (PHF * fG * fHV) 626
vp * highest directional split proportion2 (pc/h) 313
Free-Flow Speed from Field Measurement Estimated Free-Flow Speed
Field Measured speed, SFM mi/h
Observed volume, Vf veh/h
Free-flow speed, FFS FFS=SFM+0.00776(Vf/ fHV ) 57.4 mi/h
Base free-flow speed, BFFSFM 60.0mi/h
Adj. for lane width and shoulder width3, fLS (Exhibit 20-5) 2.6mi/h
Adj. for access points, fA (Exhibit 20-6) 0.0
mi/h
Free-flow speed, FFS (FSS=BFFS-fLS-fA) 57.4mi/h
Adj. for no-passing zones, fnp ( mi/h) (Exhibit 20-11) 3.8
Average travel speed, ATS ( mi/h) ATS=FFS-0.00776vp-fnp 48.8
Percent Time-Spent-Following
Grade Adjustment factor, fG (Exhibit 20-8) 0.94
Passenger-car equivalents for trucks, ET (Exhibit 20-10) 1.5
Passenger-car equivalents for RVs, ER (Exhibit 20-10) 1.0
Heavy-vehicle adjustment factor, fHV fHV=1/ (1+ PT(ET-1)+PR(ER-1) ) 0.971
Two-way flow rate1, vp (pc/h) vp=V/ (PHF * fG * fHV) 603
vp * highest directional split proportion2 (pc/h) 302
Base percent time-spent-following, BPTSF(%) BPTSF=100(1-e-0.000879vp) 41.1
Adj. for directional distribution and no-passing zone, fd/hp(%)(Exh. 20-12) 20.4
Percent time-spent-following, PTSF(%) PTSF=BPTSF+f d/np 61.6
Level of Service and Other Performance MeasuresLevel of service, LOS (Exhibit 20-3 for Class I or 20-4 for Class II) C
Volume to capacity ratio v/c v/c=Vp/ 3,200 0.20
Peak 15-min veh-miles of travel,VMT15 (veh- mi) VMT15= 0.25Lt(V/PHF) 825
Peak-hour vehicle-miles of travel, VMT60 (veh- mi) VMT60=V*Lt 2904
Peak 15-min total travel time, TT15(veh-h) TT15= VMT15/ATS 16.9
Notes
1. If vp >= 3,200 pc/h, terminate analysis-the LOS is F. 2. If highest directional split vp>= 1,700 pc/h, terminated anlysis-the LOS is F.
HCS2000TM Copyright © 2000 University of Florida, All Rights Reserved Version 4.1f
Page 1 of 1Two-Way
1/21/2010file://C:\Documents and Settings\max.scheideman\Local Settings\Temp\s2k1CCB.tmp

TWO-WAY TWO-LANE HIGHWAY SEGMENT WORKSHEETGeneral Information Site InformationAnalyst Tetra Tech ISGAgency or Company Rosemont Copper CompanyDate Performed 1/15/2010Analysis Time Period Non-Peak Season, Weekend, PM
Highway AZ-83From/To I-10 Ramps/Hidden Valley RdJurisdiction Pima CountyAnalysis Year Operations Year 20,50% NoTruck
Input Data
Class I highway Class II highway
Terrain Level RollingTwo-way hourly volume 665 veh/hDirectional split 50 / 50Peak-hour factor, PHF 0.88No-passing zone 100 % Trucks and Buses , PT 6 %
% Recreational vehicles, PR 4%
Access points/ mi 1
Average Travel Speed
Grade adjustment factor, fG (Exhibit 20-7) 0.93
Passenger-car equivalents for trucks, ET (Exhibit 20-9) 1.9
Passenger-car equivalents for RVs, ER (Exhibit 20-9) 1.1
Heavy-vehicle adjustment factor, fHV fHV=1/ (1+ PT(ET-1)+PR(ER-1) ) 0.945
Two-way flow rate1, vp (pc/h) vp=V/ (PHF * fG * fHV) 860
vp * highest directional split proportion2 (pc/h) 430
Free-Flow Speed from Field Measurement Estimated Free-Flow Speed
Field Measured speed, SFM mi/h
Observed volume, Vf veh/h
Free-flow speed, FFS FFS=SFM+0.00776(Vf/ fHV ) 57.2 mi/h
Base free-flow speed, BFFSFM 60.0mi/h
Adj. for lane width and shoulder width3, fLS (Exhibit 20-5) 2.6mi/h
Adj. for access points, fA (Exhibit 20-6) 0.3
mi/h
Free-flow speed, FFS (FSS=BFFS-fLS-fA) 57.2mi/h
Adj. for no-passing zones, fnp ( mi/h) (Exhibit 20-11) 2.9
Average travel speed, ATS ( mi/h) ATS=FFS-0.00776vp-fnp 47.6
Percent Time-Spent-Following
Grade Adjustment factor, fG (Exhibit 20-8) 0.94
Passenger-car equivalents for trucks, ET (Exhibit 20-10) 1.5
Passenger-car equivalents for RVs, ER (Exhibit 20-10) 1.0
Heavy-vehicle adjustment factor, fHV fHV=1/ (1+ PT(ET-1)+PR(ER-1) ) 0.971
Two-way flow rate1, vp (pc/h) vp=V/ (PHF * fG * fHV) 828
vp * highest directional split proportion2 (pc/h) 414
Base percent time-spent-following, BPTSF(%) BPTSF=100(1-e-0.000879vp) 51.7
Adj. for directional distribution and no-passing zone, fd/hp(%)(Exh. 20-12) 15.0
Percent time-spent-following, PTSF(%) PTSF=BPTSF+f d/np 66.8
Level of Service and Other Performance MeasuresLevel of service, LOS (Exhibit 20-3 for Class I or 20-4 for Class II) C
Volume to capacity ratio v/c v/c=Vp/ 3,200 0.27
Peak 15-min veh-miles of travel,VMT15 (veh- mi) VMT15= 0.25Lt(V/PHF) 1889
Peak-hour vehicle-miles of travel, VMT60 (veh- mi) VMT60=V*Lt 6650
Peak 15-min total travel time, TT15(veh-h) TT15= VMT15/ATS 39.7
Notes
1. If vp >= 3,200 pc/h, terminate analysis-the LOS is F. 2. If highest directional split vp>= 1,700 pc/h, terminated anlysis-the LOS is F.
HCS2000TM Copyright © 2000 University of Florida, All Rights Reserved Version 4.1f
Page 1 of 1Two-Way
1/21/2010file://C:\Documents and Settings\max.scheideman\Local Settings\Temp\s2k1CD3.tmp

TWO-WAY TWO-LANE HIGHWAY SEGMENT WORKSHEETGeneral Information Site InformationAnalyst Tetra Tech ISGAgency or Company Rosemont Copper CompanyDate Performed 1/15/2010Analysis Time Period Non-Peak Season, Weekend, PM
Highway AZ-83From/To Hidden Valley Rd/GreatervilleJurisdiction Pima CountyAnalysis Year Operations Year 20,50% NoTruck
Input Data
Class I highway Class II highway
Terrain Level RollingTwo-way hourly volume 450 veh/hDirectional split 50 / 50Peak-hour factor, PHF 0.88No-passing zone 100 % Trucks and Buses , PT 6 %
% Recreational vehicles, PR 4%
Access points/ mi 0
Average Travel Speed
Grade adjustment factor, fG (Exhibit 20-7) 0.93
Passenger-car equivalents for trucks, ET (Exhibit 20-9) 1.9
Passenger-car equivalents for RVs, ER (Exhibit 20-9) 1.1
Heavy-vehicle adjustment factor, fHV fHV=1/ (1+ PT(ET-1)+PR(ER-1) ) 0.945
Two-way flow rate1, vp (pc/h) vp=V/ (PHF * fG * fHV) 582
vp * highest directional split proportion2 (pc/h) 291
Free-Flow Speed from Field Measurement Estimated Free-Flow Speed
Field Measured speed, SFM mi/h
Observed volume, Vf veh/h
Free-flow speed, FFS FFS=SFM+0.00776(Vf/ fHV ) 57.4 mi/h
Base free-flow speed, BFFSFM 60.0mi/h
Adj. for lane width and shoulder width3, fLS (Exhibit 20-5) 2.6mi/h
Adj. for access points, fA (Exhibit 20-6) 0.0
mi/h
Free-flow speed, FFS (FSS=BFFS-fLS-fA) 57.4mi/h
Adj. for no-passing zones, fnp ( mi/h) (Exhibit 20-11) 4.0
Average travel speed, ATS ( mi/h) ATS=FFS-0.00776vp-fnp 48.9
Percent Time-Spent-Following
Grade Adjustment factor, fG (Exhibit 20-8) 0.94
Passenger-car equivalents for trucks, ET (Exhibit 20-10) 1.5
Passenger-car equivalents for RVs, ER (Exhibit 20-10) 1.0
Heavy-vehicle adjustment factor, fHV fHV=1/ (1+ PT(ET-1)+PR(ER-1) ) 0.971
Two-way flow rate1, vp (pc/h) vp=V/ (PHF * fG * fHV) 560
vp * highest directional split proportion2 (pc/h) 280
Base percent time-spent-following, BPTSF(%) BPTSF=100(1-e-0.000879vp) 38.9
Adj. for directional distribution and no-passing zone, fd/hp(%)(Exh. 20-12) 21.4
Percent time-spent-following, PTSF(%) PTSF=BPTSF+f d/np 60.2
Level of Service and Other Performance MeasuresLevel of service, LOS (Exhibit 20-3 for Class I or 20-4 for Class II) C
Volume to capacity ratio v/c v/c=Vp/ 3,200 0.18
Peak 15-min veh-miles of travel,VMT15 (veh- mi) VMT15= 0.25Lt(V/PHF) 767
Peak-hour vehicle-miles of travel, VMT60 (veh- mi) VMT60=V*Lt 2700
Peak 15-min total travel time, TT15(veh-h) TT15= VMT15/ATS 15.7
Notes
1. If vp >= 3,200 pc/h, terminate analysis-the LOS is F. 2. If highest directional split vp>= 1,700 pc/h, terminated anlysis-the LOS is F.
HCS2000TM Copyright © 2000 University of Florida, All Rights Reserved Version 4.1f
Page 1 of 1Two-Way
1/21/2010file://C:\Documents and Settings\max.scheideman\Local Settings\Temp\s2k1CDA.tmp

PEAK SEASON
SCENARIO 5
50% CARPOOL WITH NO COPPER CONCENTRATE
TRUCKS

TWO-WAY TWO-LANE HIGHWAY SEGMENT WORKSHEETGeneral Information Site InformationAnalyst Tetra Tech ISGAgency or Company Rosemont Copper CompanyDate Performed 1/17/2010Analysis Time Period Peak Season, Weekday, AM
Highway AZ-83From/To I-10 Ramp/Hidden Valley RdJurisdiction Pima CountyAnalysis Year Operations Year 20,50% NoTruck
Input Data
Class I highway Class II highway
Terrain Level RollingTwo-way hourly volume 647 veh/hDirectional split 50 / 50Peak-hour factor, PHF 0.88No-passing zone 100 % Trucks and Buses , PT 6 %
% Recreational vehicles, PR 4%
Access points/ mi 1
Average Travel Speed
Grade adjustment factor, fG (Exhibit 20-7) 0.93
Passenger-car equivalents for trucks, ET (Exhibit 20-9) 1.9
Passenger-car equivalents for RVs, ER (Exhibit 20-9) 1.1
Heavy-vehicle adjustment factor, fHV fHV=1/ (1+ PT(ET-1)+PR(ER-1) ) 0.945
Two-way flow rate1, vp (pc/h) vp=V/ (PHF * fG * fHV) 836
vp * highest directional split proportion2 (pc/h) 418
Free-Flow Speed from Field Measurement Estimated Free-Flow Speed
Field Measured speed, SFM mi/h
Observed volume, Vf veh/h
Free-flow speed, FFS FFS=SFM+0.00776(Vf/ fHV ) 57.2 mi/h
Base free-flow speed, BFFSFM 60.0mi/h
Adj. for lane width and shoulder width3, fLS (Exhibit 20-5) 2.6mi/h
Adj. for access points, fA (Exhibit 20-6) 0.3
mi/h
Free-flow speed, FFS (FSS=BFFS-fLS-fA) 57.2mi/h
Adj. for no-passing zones, fnp ( mi/h) (Exhibit 20-11) 2.9
Average travel speed, ATS ( mi/h) ATS=FFS-0.00776vp-fnp 47.7
Percent Time-Spent-Following
Grade Adjustment factor, fG (Exhibit 20-8) 0.94
Passenger-car equivalents for trucks, ET (Exhibit 20-10) 1.5
Passenger-car equivalents for RVs, ER (Exhibit 20-10) 1.0
Heavy-vehicle adjustment factor, fHV fHV=1/ (1+ PT(ET-1)+PR(ER-1) ) 0.971
Two-way flow rate1, vp (pc/h) vp=V/ (PHF * fG * fHV) 806
vp * highest directional split proportion2 (pc/h) 403
Base percent time-spent-following, BPTSF(%) BPTSF=100(1-e-0.000879vp) 50.8
Adj. for directional distribution and no-passing zone, fd/hp(%)(Exh. 20-12) 15.3
Percent time-spent-following, PTSF(%) PTSF=BPTSF+f d/np 66.1
Level of Service and Other Performance MeasuresLevel of service, LOS (Exhibit 20-3 for Class I or 20-4 for Class II) C
Volume to capacity ratio v/c v/c=Vp/ 3,200 0.26
Peak 15-min veh-miles of travel,VMT15 (veh- mi) VMT15= 0.25Lt(V/PHF) 1838
Peak-hour vehicle-miles of travel, VMT60 (veh- mi) VMT60=V*Lt 6470
Peak 15-min total travel time, TT15(veh-h) TT15= VMT15/ATS 38.5
Notes
1. If vp >= 3,200 pc/h, terminate analysis-the LOS is F. 2. If highest directional split vp>= 1,700 pc/h, terminated anlysis-the LOS is F.
HCS2000TM Copyright © 2000 University of Florida, All Rights Reserved Version 4.1f
Page 1 of 1Two-Way
1/21/2010file://C:\Documents and Settings\max.scheideman\Local Settings\Temp\s2k1CE1.tmp

TWO-WAY TWO-LANE HIGHWAY SEGMENT WORKSHEETGeneral Information Site InformationAnalyst Tetra Tech ISGAgency or Company Rosemont Copper CompanyDate Performed 1/17/2010Analysis Time Period Peak Season, Weekday, AM
Highway AZ-83From/To Hidden Valley Rd/GreatervilleJurisdiction Pima CountyAnalysis Year Operations Year 20,50% NoTruck
Input Data
Class I highway Class II highway
Terrain Level RollingTwo-way hourly volume 485 veh/hDirectional split 50 / 50Peak-hour factor, PHF 0.88No-passing zone 100 % Trucks and Buses , PT 6 %
% Recreational vehicles, PR 4%
Access points/ mi 0
Average Travel Speed
Grade adjustment factor, fG (Exhibit 20-7) 0.93
Passenger-car equivalents for trucks, ET (Exhibit 20-9) 1.9
Passenger-car equivalents for RVs, ER (Exhibit 20-9) 1.1
Heavy-vehicle adjustment factor, fHV fHV=1/ (1+ PT(ET-1)+PR(ER-1) ) 0.945
Two-way flow rate1, vp (pc/h) vp=V/ (PHF * fG * fHV) 627
vp * highest directional split proportion2 (pc/h) 314
Free-Flow Speed from Field Measurement Estimated Free-Flow Speed
Field Measured speed, SFM mi/h
Observed volume, Vf veh/h
Free-flow speed, FFS FFS=SFM+0.00776(Vf/ fHV ) 57.4 mi/h
Base free-flow speed, BFFSFM 60.0mi/h
Adj. for lane width and shoulder width3, fLS (Exhibit 20-5) 2.6mi/h
Adj. for access points, fA (Exhibit 20-6) 0.0
mi/h
Free-flow speed, FFS (FSS=BFFS-fLS-fA) 57.4mi/h
Adj. for no-passing zones, fnp ( mi/h) (Exhibit 20-11) 3.8
Average travel speed, ATS ( mi/h) ATS=FFS-0.00776vp-fnp 48.8
Percent Time-Spent-Following
Grade Adjustment factor, fG (Exhibit 20-8) 0.94
Passenger-car equivalents for trucks, ET (Exhibit 20-10) 1.5
Passenger-car equivalents for RVs, ER (Exhibit 20-10) 1.0
Heavy-vehicle adjustment factor, fHV fHV=1/ (1+ PT(ET-1)+PR(ER-1) ) 0.971
Two-way flow rate1, vp (pc/h) vp=V/ (PHF * fG * fHV) 604
vp * highest directional split proportion2 (pc/h) 302
Base percent time-spent-following, BPTSF(%) BPTSF=100(1-e-0.000879vp) 41.2
Adj. for directional distribution and no-passing zone, fd/hp(%)(Exh. 20-12) 20.4
Percent time-spent-following, PTSF(%) PTSF=BPTSF+f d/np 61.6
Level of Service and Other Performance MeasuresLevel of service, LOS (Exhibit 20-3 for Class I or 20-4 for Class II) C
Volume to capacity ratio v/c v/c=Vp/ 3,200 0.20
Peak 15-min veh-miles of travel,VMT15 (veh- mi) VMT15= 0.25Lt(V/PHF) 827
Peak-hour vehicle-miles of travel, VMT60 (veh- mi) VMT60=V*Lt 2910
Peak 15-min total travel time, TT15(veh-h) TT15= VMT15/ATS 17.0
Notes
1. If vp >= 3,200 pc/h, terminate analysis-the LOS is F. 2. If highest directional split vp>= 1,700 pc/h, terminated anlysis-the LOS is F.
HCS2000TM Copyright © 2000 University of Florida, All Rights Reserved Version 4.1f
Page 1 of 1Two-Way
1/21/2010file://C:\Documents and Settings\max.scheideman\Local Settings\Temp\s2k1CE9.tmp

TWO-WAY TWO-LANE HIGHWAY SEGMENT WORKSHEETGeneral Information Site InformationAnalyst Tetra Tech ISGAgency or Company Rosemont Copper CompanyDate Performed 1/17/2010Analysis Time Period Peak Season, Weekday, PM
Highway AZ-83From/To I-10 ramp/Hidden Valley RdJurisdiction Pima CountyAnalysis Year Operations Year 20,50% NoTruck
Input Data
Class I highway Class II highway
Terrain Level RollingTwo-way hourly volume 796 veh/hDirectional split 50 / 50Peak-hour factor, PHF 0.88No-passing zone 100 % Trucks and Buses , PT 6 %
% Recreational vehicles, PR 4%
Access points/ mi 1
Average Travel Speed
Grade adjustment factor, fG (Exhibit 20-7) 0.93
Passenger-car equivalents for trucks, ET (Exhibit 20-9) 1.9
Passenger-car equivalents for RVs, ER (Exhibit 20-9) 1.1
Heavy-vehicle adjustment factor, fHV fHV=1/ (1+ PT(ET-1)+PR(ER-1) ) 0.945
Two-way flow rate1, vp (pc/h) vp=V/ (PHF * fG * fHV) 1029
vp * highest directional split proportion2 (pc/h) 515
Free-Flow Speed from Field Measurement Estimated Free-Flow Speed
Field Measured speed, SFM mi/h
Observed volume, Vf veh/h
Free-flow speed, FFS FFS=SFM+0.00776(Vf/ fHV ) 57.2 mi/h
Base free-flow speed, BFFSFM 60.0mi/h
Adj. for lane width and shoulder width3, fLS (Exhibit 20-5) 2.6mi/h
Adj. for access points, fA (Exhibit 20-6) 0.3
mi/h
Free-flow speed, FFS (FSS=BFFS-fLS-fA) 57.2mi/h
Adj. for no-passing zones, fnp ( mi/h) (Exhibit 20-11) 2.5
Average travel speed, ATS ( mi/h) ATS=FFS-0.00776vp-fnp 46.6
Percent Time-Spent-Following
Grade Adjustment factor, fG (Exhibit 20-8) 0.94
Passenger-car equivalents for trucks, ET (Exhibit 20-10) 1.5
Passenger-car equivalents for RVs, ER (Exhibit 20-10) 1.0
Heavy-vehicle adjustment factor, fHV fHV=1/ (1+ PT(ET-1)+PR(ER-1) ) 0.971
Two-way flow rate1, vp (pc/h) vp=V/ (PHF * fG * fHV) 991
vp * highest directional split proportion2 (pc/h) 496
Base percent time-spent-following, BPTSF(%) BPTSF=100(1-e-0.000879vp) 58.2
Adj. for directional distribution and no-passing zone, fd/hp(%)(Exh. 20-12) 13.0
Percent time-spent-following, PTSF(%) PTSF=BPTSF+f d/np 71.2
Level of Service and Other Performance MeasuresLevel of service, LOS (Exhibit 20-3 for Class I or 20-4 for Class II) D
Volume to capacity ratio v/c v/c=Vp/ 3,200 0.32
Peak 15-min veh-miles of travel,VMT15 (veh- mi) VMT15= 0.25Lt(V/PHF) 2261
Peak-hour vehicle-miles of travel, VMT60 (veh- mi) VMT60=V*Lt 7960
Peak 15-min total travel time, TT15(veh-h) TT15= VMT15/ATS 48.5
Notes
1. If vp >= 3,200 pc/h, terminate analysis-the LOS is F. 2. If highest directional split vp>= 1,700 pc/h, terminated anlysis-the LOS is F.
HCS2000TM Copyright © 2000 University of Florida, All Rights Reserved Version 4.1f
Page 1 of 1Two-Way
1/21/2010file://C:\Documents and Settings\max.scheideman\Local Settings\Temp\s2k1CF0.tmp

TWO-WAY TWO-LANE HIGHWAY SEGMENT WORKSHEETGeneral Information Site InformationAnalyst Tetra Tech ISGAgency or Company Rosemont Copper CompanyDate Performed 1/17/2010Analysis Time Period Peak Season, Weekday, PM
Highway AZ-83From/To Hidden Valley Rd./GreatervilleJurisdiction Pima CountyAnalysis Year Operations Year 20,50% NoTruck
Input Data
Class I highway Class II highway
Terrain Level RollingTwo-way hourly volume 650 veh/hDirectional split 50 / 50Peak-hour factor, PHF 0.88No-passing zone 100 % Trucks and Buses , PT 6 %
% Recreational vehicles, PR 4%
Access points/ mi 0
Average Travel Speed
Grade adjustment factor, fG (Exhibit 20-7) 0.93
Passenger-car equivalents for trucks, ET (Exhibit 20-9) 1.9
Passenger-car equivalents for RVs, ER (Exhibit 20-9) 1.1
Heavy-vehicle adjustment factor, fHV fHV=1/ (1+ PT(ET-1)+PR(ER-1) ) 0.945
Two-way flow rate1, vp (pc/h) vp=V/ (PHF * fG * fHV) 840
vp * highest directional split proportion2 (pc/h) 420
Free-Flow Speed from Field Measurement Estimated Free-Flow Speed
Field Measured speed, SFM mi/h
Observed volume, Vf veh/h
Free-flow speed, FFS FFS=SFM+0.00776(Vf/ fHV ) 57.4 mi/h
Base free-flow speed, BFFSFM 60.0mi/h
Adj. for lane width and shoulder width3, fLS (Exhibit 20-5) 2.6mi/h
Adj. for access points, fA (Exhibit 20-6) 0.0
mi/h
Free-flow speed, FFS (FSS=BFFS-fLS-fA) 57.4mi/h
Adj. for no-passing zones, fnp ( mi/h) (Exhibit 20-11) 2.9
Average travel speed, ATS ( mi/h) ATS=FFS-0.00776vp-fnp 48.0
Percent Time-Spent-Following
Grade Adjustment factor, fG (Exhibit 20-8) 0.94
Passenger-car equivalents for trucks, ET (Exhibit 20-10) 1.5
Passenger-car equivalents for RVs, ER (Exhibit 20-10) 1.0
Heavy-vehicle adjustment factor, fHV fHV=1/ (1+ PT(ET-1)+PR(ER-1) ) 0.971
Two-way flow rate1, vp (pc/h) vp=V/ (PHF * fG * fHV) 809
vp * highest directional split proportion2 (pc/h) 405
Base percent time-spent-following, BPTSF(%) BPTSF=100(1-e-0.000879vp) 50.9
Adj. for directional distribution and no-passing zone, fd/hp(%)(Exh. 20-12) 15.3
Percent time-spent-following, PTSF(%) PTSF=BPTSF+f d/np 66.2
Level of Service and Other Performance MeasuresLevel of service, LOS (Exhibit 20-3 for Class I or 20-4 for Class II) C
Volume to capacity ratio v/c v/c=Vp/ 3,200 0.26
Peak 15-min veh-miles of travel,VMT15 (veh- mi) VMT15= 0.25Lt(V/PHF) 1108
Peak-hour vehicle-miles of travel, VMT60 (veh- mi) VMT60=V*Lt 3900
Peak 15-min total travel time, TT15(veh-h) TT15= VMT15/ATS 23.1
Notes
1. If vp >= 3,200 pc/h, terminate analysis-the LOS is F. 2. If highest directional split vp>= 1,700 pc/h, terminated anlysis-the LOS is F.
HCS2000TM Copyright © 2000 University of Florida, All Rights Reserved Version 4.1f
Page 1 of 1Two-Way
1/21/2010file://C:\Documents and Settings\max.scheideman\Local Settings\Temp\s2k1CFB.tmp

TWO-WAY TWO-LANE HIGHWAY SEGMENT WORKSHEETGeneral Information Site InformationAnalyst Tetra Tech ISGAgency or Company Rosemont Copper CompanyDate Performed 1/17/2010Analysis Time Period Peak Season, Weekend, AM
Highway AZ-83From/To I-10 Ramp/Hidden Valley Rd.Jurisdiction Pima CountyAnalysis Year Operations Year 20,50% NoTruck
Input Data
Class I highway Class II highway
Terrain Level RollingTwo-way hourly volume 594 veh/hDirectional split 50 / 50Peak-hour factor, PHF 0.88No-passing zone 100 % Trucks and Buses , PT 6 %
% Recreational vehicles, PR 4%
Access points/ mi 1
Average Travel Speed
Grade adjustment factor, fG (Exhibit 20-7) 0.93
Passenger-car equivalents for trucks, ET (Exhibit 20-9) 1.9
Passenger-car equivalents for RVs, ER (Exhibit 20-9) 1.1
Heavy-vehicle adjustment factor, fHV fHV=1/ (1+ PT(ET-1)+PR(ER-1) ) 0.945
Two-way flow rate1, vp (pc/h) vp=V/ (PHF * fG * fHV) 768
vp * highest directional split proportion2 (pc/h) 384
Free-Flow Speed from Field Measurement Estimated Free-Flow Speed
Field Measured speed, SFM mi/h
Observed volume, Vf veh/h
Free-flow speed, FFS FFS=SFM+0.00776(Vf/ fHV ) 57.2 mi/h
Base free-flow speed, BFFSFM 60.0mi/h
Adj. for lane width and shoulder width3, fLS (Exhibit 20-5) 2.6mi/h
Adj. for access points, fA (Exhibit 20-6) 0.3
mi/h
Free-flow speed, FFS (FSS=BFFS-fLS-fA) 57.2mi/h
Adj. for no-passing zones, fnp ( mi/h) (Exhibit 20-11) 3.1
Average travel speed, ATS ( mi/h) ATS=FFS-0.00776vp-fnp 48.0
Percent Time-Spent-Following
Grade Adjustment factor, fG (Exhibit 20-8) 0.94
Passenger-car equivalents for trucks, ET (Exhibit 20-10) 1.5
Passenger-car equivalents for RVs, ER (Exhibit 20-10) 1.0
Heavy-vehicle adjustment factor, fHV fHV=1/ (1+ PT(ET-1)+PR(ER-1) ) 0.971
Two-way flow rate1, vp (pc/h) vp=V/ (PHF * fG * fHV) 740
vp * highest directional split proportion2 (pc/h) 370
Base percent time-spent-following, BPTSF(%) BPTSF=100(1-e-0.000879vp) 47.8
Adj. for directional distribution and no-passing zone, fd/hp(%)(Exh. 20-12) 16.9
Percent time-spent-following, PTSF(%) PTSF=BPTSF+f d/np 64.7
Level of Service and Other Performance MeasuresLevel of service, LOS (Exhibit 20-3 for Class I or 20-4 for Class II) C
Volume to capacity ratio v/c v/c=Vp/ 3,200 0.24
Peak 15-min veh-miles of travel,VMT15 (veh- mi) VMT15= 0.25Lt(V/PHF) 1688
Peak-hour vehicle-miles of travel, VMT60 (veh- mi) VMT60=V*Lt 5940
Peak 15-min total travel time, TT15(veh-h) TT15= VMT15/ATS 35.1
Notes
1. If vp >= 3,200 pc/h, terminate analysis-the LOS is F. 2. If highest directional split vp>= 1,700 pc/h, terminated anlysis-the LOS is F.
HCS2000TM Copyright © 2000 University of Florida, All Rights Reserved Version 4.1f
Page 1 of 1Two-Way
1/21/2010file://C:\Documents and Settings\max.scheideman\Local Settings\Temp\s2k1D02.tmp

TWO-WAY TWO-LANE HIGHWAY SEGMENT WORKSHEETGeneral Information Site InformationAnalyst Tetra Tech ISGAgency or Company Rosemont Copper CompanyDate Performed 1/17/2010Analysis Time Period Peak Season, Weekend, AM
Highway AZ-83From/To Hidden Valley Rd./GreatervilleJurisdiction Pima CountyAnalysis Year Operations Year 20,50% NoTruck
Input Data
Class I highway Class II highway
Terrain Level RollingTwo-way hourly volume 420 veh/hDirectional split 50 / 50Peak-hour factor, PHF 0.88No-passing zone 100 % Trucks and Buses , PT 6 %
% Recreational vehicles, PR 4%
Access points/ mi 0
Average Travel Speed
Grade adjustment factor, fG (Exhibit 20-7) 0.93
Passenger-car equivalents for trucks, ET (Exhibit 20-9) 1.9
Passenger-car equivalents for RVs, ER (Exhibit 20-9) 1.1
Heavy-vehicle adjustment factor, fHV fHV=1/ (1+ PT(ET-1)+PR(ER-1) ) 0.945
Two-way flow rate1, vp (pc/h) vp=V/ (PHF * fG * fHV) 543
vp * highest directional split proportion2 (pc/h) 272
Free-Flow Speed from Field Measurement Estimated Free-Flow Speed
Field Measured speed, SFM mi/h
Observed volume, Vf veh/h
Free-flow speed, FFS FFS=SFM+0.00776(Vf/ fHV ) 57.4 mi/h
Base free-flow speed, BFFSFM 60.0mi/h
Adj. for lane width and shoulder width3, fLS (Exhibit 20-5) 2.6mi/h
Adj. for access points, fA (Exhibit 20-6) 0.0
mi/h
Free-flow speed, FFS (FSS=BFFS-fLS-fA) 57.4mi/h
Adj. for no-passing zones, fnp ( mi/h) (Exhibit 20-11) 4.1
Average travel speed, ATS ( mi/h) ATS=FFS-0.00776vp-fnp 49.1
Percent Time-Spent-Following
Grade Adjustment factor, fG (Exhibit 20-8) 0.94
Passenger-car equivalents for trucks, ET (Exhibit 20-10) 1.5
Passenger-car equivalents for RVs, ER (Exhibit 20-10) 1.0
Heavy-vehicle adjustment factor, fHV fHV=1/ (1+ PT(ET-1)+PR(ER-1) ) 0.971
Two-way flow rate1, vp (pc/h) vp=V/ (PHF * fG * fHV) 523
vp * highest directional split proportion2 (pc/h) 262
Base percent time-spent-following, BPTSF(%) BPTSF=100(1-e-0.000879vp) 36.9
Adj. for directional distribution and no-passing zone, fd/hp(%)(Exh. 20-12) 22.2
Percent time-spent-following, PTSF(%) PTSF=BPTSF+f d/np 59.0
Level of Service and Other Performance MeasuresLevel of service, LOS (Exhibit 20-3 for Class I or 20-4 for Class II) C
Volume to capacity ratio v/c v/c=Vp/ 3,200 0.17
Peak 15-min veh-miles of travel,VMT15 (veh- mi) VMT15= 0.25Lt(V/PHF) 716
Peak-hour vehicle-miles of travel, VMT60 (veh- mi) VMT60=V*Lt 2520
Peak 15-min total travel time, TT15(veh-h) TT15= VMT15/ATS 14.6
Notes
1. If vp >= 3,200 pc/h, terminate analysis-the LOS is F. 2. If highest directional split vp>= 1,700 pc/h, terminated anlysis-the LOS is F.
HCS2000TM Copyright © 2000 University of Florida, All Rights Reserved Version 4.1f
Page 1 of 1Two-Way
1/21/2010file://C:\Documents and Settings\max.scheideman\Local Settings\Temp\s2k1D09.tmp

TWO-WAY TWO-LANE HIGHWAY SEGMENT WORKSHEETGeneral Information Site InformationAnalyst Tetra Tech ISGAgency or Company Rosemont Copper CompanyDate Performed 1/17/2010Analysis Time Period Peak Season, Weekend, PM
Highway AZ-83From/To I-10 ramp/Hidden Valley Rd.Jurisdiction Pima CountyAnalysis Year Operations Year 20,50% NoTruck
Input Data
Class I highway Class II highway
Terrain Level RollingTwo-way hourly volume 751 veh/hDirectional split 50 / 50Peak-hour factor, PHF 0.88No-passing zone 100 % Trucks and Buses , PT 6 %
% Recreational vehicles, PR 4%
Access points/ mi 1
Average Travel Speed
Grade adjustment factor, fG (Exhibit 20-7) 0.93
Passenger-car equivalents for trucks, ET (Exhibit 20-9) 1.9
Passenger-car equivalents for RVs, ER (Exhibit 20-9) 1.1
Heavy-vehicle adjustment factor, fHV fHV=1/ (1+ PT(ET-1)+PR(ER-1) ) 0.945
Two-way flow rate1, vp (pc/h) vp=V/ (PHF * fG * fHV) 971
vp * highest directional split proportion2 (pc/h) 486
Free-Flow Speed from Field Measurement Estimated Free-Flow Speed
Field Measured speed, SFM mi/h
Observed volume, Vf veh/h
Free-flow speed, FFS FFS=SFM+0.00776(Vf/ fHV ) 57.2 mi/h
Base free-flow speed, BFFSFM 60.0mi/h
Adj. for lane width and shoulder width3, fLS (Exhibit 20-5) 2.6mi/h
Adj. for access points, fA (Exhibit 20-6) 0.3
mi/h
Free-flow speed, FFS (FSS=BFFS-fLS-fA) 57.2mi/h
Adj. for no-passing zones, fnp ( mi/h) (Exhibit 20-11) 2.7
Average travel speed, ATS ( mi/h) ATS=FFS-0.00776vp-fnp 47.0
Percent Time-Spent-Following
Grade Adjustment factor, fG (Exhibit 20-8) 0.94
Passenger-car equivalents for trucks, ET (Exhibit 20-10) 1.5
Passenger-car equivalents for RVs, ER (Exhibit 20-10) 1.0
Heavy-vehicle adjustment factor, fHV fHV=1/ (1+ PT(ET-1)+PR(ER-1) ) 0.971
Two-way flow rate1, vp (pc/h) vp=V/ (PHF * fG * fHV) 935
vp * highest directional split proportion2 (pc/h) 468
Base percent time-spent-following, BPTSF(%) BPTSF=100(1-e-0.000879vp) 56.0
Adj. for directional distribution and no-passing zone, fd/hp(%)(Exh. 20-12) 13.7
Percent time-spent-following, PTSF(%) PTSF=BPTSF+f d/np 69.8
Level of Service and Other Performance MeasuresLevel of service, LOS (Exhibit 20-3 for Class I or 20-4 for Class II) C
Volume to capacity ratio v/c v/c=Vp/ 3,200 0.30
Peak 15-min veh-miles of travel,VMT15 (veh- mi) VMT15= 0.25Lt(V/PHF) 2134
Peak-hour vehicle-miles of travel, VMT60 (veh- mi) VMT60=V*Lt 7510
Peak 15-min total travel time, TT15(veh-h) TT15= VMT15/ATS 45.4
Notes
1. If vp >= 3,200 pc/h, terminate analysis-the LOS is F. 2. If highest directional split vp>= 1,700 pc/h, terminated anlysis-the LOS is F.
HCS2000TM Copyright © 2000 University of Florida, All Rights Reserved Version 4.1f
Page 1 of 1Two-Way
1/21/2010file://C:\Documents and Settings\max.scheideman\Local Settings\Temp\s2k1D10.tmp

TWO-WAY TWO-LANE HIGHWAY SEGMENT WORKSHEETGeneral Information Site InformationAnalyst Tetra Tech ISGAgency or Company Rosemont Copper CompanyDate Performed 1/17/2010Analysis Time Period Peak Season, Weekend, PM
Highway AZ-83From/To Hidden Valley Rd./GreatervilleJurisdiction Pima CountyAnalysis Year Operations Year 20,50% NoTruck
Input Data
Class I highway Class II highway
Terrain Level RollingTwo-way hourly volume 604 veh/hDirectional split 50 / 50Peak-hour factor, PHF 0.88No-passing zone 100 % Trucks and Buses , PT 6 %
% Recreational vehicles, PR 4%
Access points/ mi 0
Average Travel Speed
Grade adjustment factor, fG (Exhibit 20-7) 0.93
Passenger-car equivalents for trucks, ET (Exhibit 20-9) 1.9
Passenger-car equivalents for RVs, ER (Exhibit 20-9) 1.1
Heavy-vehicle adjustment factor, fHV fHV=1/ (1+ PT(ET-1)+PR(ER-1) ) 0.945
Two-way flow rate1, vp (pc/h) vp=V/ (PHF * fG * fHV) 781
vp * highest directional split proportion2 (pc/h) 391
Free-Flow Speed from Field Measurement Estimated Free-Flow Speed
Field Measured speed, SFM mi/h
Observed volume, Vf veh/h
Free-flow speed, FFS FFS=SFM+0.00776(Vf/ fHV ) 57.4 mi/h
Base free-flow speed, BFFSFM 60.0mi/h
Adj. for lane width and shoulder width3, fLS (Exhibit 20-5) 2.6mi/h
Adj. for access points, fA (Exhibit 20-6) 0.0
mi/h
Free-flow speed, FFS (FSS=BFFS-fLS-fA) 57.4mi/h
Adj. for no-passing zones, fnp ( mi/h) (Exhibit 20-11) 3.1
Average travel speed, ATS ( mi/h) ATS=FFS-0.00776vp-fnp 48.3
Percent Time-Spent-Following
Grade Adjustment factor, fG (Exhibit 20-8) 0.94
Passenger-car equivalents for trucks, ET (Exhibit 20-10) 1.5
Passenger-car equivalents for RVs, ER (Exhibit 20-10) 1.0
Heavy-vehicle adjustment factor, fHV fHV=1/ (1+ PT(ET-1)+PR(ER-1) ) 0.971
Two-way flow rate1, vp (pc/h) vp=V/ (PHF * fG * fHV) 752
vp * highest directional split proportion2 (pc/h) 376
Base percent time-spent-following, BPTSF(%) BPTSF=100(1-e-0.000879vp) 48.4
Adj. for directional distribution and no-passing zone, fd/hp(%)(Exh. 20-12) 16.6
Percent time-spent-following, PTSF(%) PTSF=BPTSF+f d/np 65.0
Level of Service and Other Performance MeasuresLevel of service, LOS (Exhibit 20-3 for Class I or 20-4 for Class II) C
Volume to capacity ratio v/c v/c=Vp/ 3,200 0.24
Peak 15-min veh-miles of travel,VMT15 (veh- mi) VMT15= 0.25Lt(V/PHF) 1030
Peak-hour vehicle-miles of travel, VMT60 (veh- mi) VMT60=V*Lt 3624
Peak 15-min total travel time, TT15(veh-h) TT15= VMT15/ATS 21.3
Notes
1. If vp >= 3,200 pc/h, terminate analysis-the LOS is F. 2. If highest directional split vp>= 1,700 pc/h, terminated anlysis-the LOS is F.
HCS2000TM Copyright © 2000 University of Florida, All Rights Reserved Version 4.1f
Page 1 of 1Two-Way
1/21/2010file://C:\Documents and Settings\max.scheideman\Local Settings\Temp\s2k1D17.tmp

ATTACHMENT 5
MITIGATED CONDITION LOS WORKSHEET

SEGMENT
SCENARIO 3 NO CARPOOL
AZ-83 ROADWAY MODIFICATION

TWO-WAY TWO-LANE HIGHWAY SEGMENT WORKSHEETGeneral Information Site InformationAnalyst Tetra Tech ISGAgency or Company Rosemont Copper CompanyDate Performed 1/17/2010Analysis Time Period Peak Season, Weekday, PM
Highway AZ-83From/To I-10 Ramp/Hidden Valley RdJurisdiction Pima CountyAnalysis Year Operations Year 20, No Carpool
Input Data
Class I highway Class II highway
Terrain Level RollingTwo-way hourly volume 936 veh/hDirectional split 50 / 50Peak-hour factor, PHF 0.88No-passing zone 20
% Trucks and Buses , PT 4 %
% Recreational vehicles, PR 4%
Access points/ mi 1
Average Travel Speed
Grade adjustment factor, fG (Exhibit 20-7) 0.93
Passenger-car equivalents for trucks, ET (Exhibit 20-9) 1.9
Passenger-car equivalents for RVs, ER (Exhibit 20-9) 1.1
Heavy-vehicle adjustment factor, fHV fHV=1/ (1+ PT(ET-1)+PR(ER-1) ) 0.962
Two-way flow rate1, vp (pc/h) vp=V/ (PHF * fG * fHV) 1189
vp * highest directional split proportion2 (pc/h) 595
Free-Flow Speed from Field Measurement Estimated Free-Flow Speed
Field Measured speed, SFM mi/h
Observed volume, Vf veh/h
Free-flow speed, FFS FFS=SFM+0.00776(Vf/ fHV ) 57.2 mi/h
Base free-flow speed, BFFSFM 60.0
mi/h
Adj. for lane width and shoulder width3, fLS (Exhibit 20-5) 2.6mi/h
Adj. for access points, fA (Exhibit 20-6) 0.3mi/h
Free-flow speed, FFS (FSS=BFFS-fLS-fA) 57.2mi/h
Adj. for no-passing zones, fnp ( mi/h) (Exhibit 20-11) 0.8
Average travel speed, ATS ( mi/h) ATS=FFS-0.00776vp-fnp 47.1
Percent Time-Spent-Following
Grade Adjustment factor, fG (Exhibit 20-8) 0.94
Passenger-car equivalents for trucks, ET (Exhibit 20-10) 1.5
Passenger-car equivalents for RVs, ER (Exhibit 20-10) 1.0
Heavy-vehicle adjustment factor, fHV fHV=1/ (1+ PT(ET-1)+PR(ER-1) ) 0.980
Two-way flow rate1, vp (pc/h) vp=V/ (PHF * fG * fHV) 1154
vp * highest directional split proportion2 (pc/h) 577
Base percent time-spent-following, BPTSF(%) BPTSF=100(1-e-0.000879vp) 63.7
Adj. for directional distribution and no-passing zone, fd/hp(%)(Exh. 20-12) 5.8
Percent time-spent-following, PTSF(%) PTSF=BPTSF+f d/np 69.6
Level of Service and Other Performance MeasuresLevel of service, LOS (Exhibit 20-3 for Class I or 20-4 for Class II) C
Volume to capacity ratio v/c v/c=Vp/ 3,200 0.37
Peak 15-min veh-miles of travel,VMT15 (veh- mi) VMT15= 0.25Lt(V/PHF) 2659
Peak-hour vehicle-miles of travel, VMT60 (veh- mi) VMT60=V*Lt 9360
Peak 15-min total travel time, TT15(veh-h) TT15= VMT15/ATS 56.4
Notes
1. If vp >= 3,200 pc/h, terminate analysis-the LOS is F. 2. If highest directional split vp>= 1,700 pc/h, terminated anlysis-the LOS is F.
HCS2000TM Copyright © 2000 University of Florida, All Rights Reserved Version 4.1f
Page 1 of 1Two-Way
2/10/2010file://C:\Documents and Settings\max.scheideman\Local Settings\Temp\s2k36.tmp

COPPER
Resourceful.
Memorandum
To: Beverly Everson
Cc: Tom Furgason
From: Kathy Arnold
Doc #: 006/10 — 15.3.2
Subject: Transmittal of Inflitration , Seepage, Fate and Transport Modeling Report and Rosemont Traffic Study —Additional Scenarios
Date: March 1, 2010
Rosemont Copper is pleased to transmit the following two documents. The first dociment is the
Infiltration, Seepage, Fate, and Transport Modeling Report, Tetra Tech dated February 2010. The second
is a Technical Memorandum that addresses Rosemont Traffic Study — Additional Scenarios, Tetra Tech dated February 23, 2010. We are transmitting three hard copies and two CDs of the report directly to
the Forest Service. We are also transmitting two hard copies of the report and one a CD to SWCA.
Related Documents