prepared for Michigan DOT prepared by Cambridge Systematics, Inc. with Kimley-Horn and Associates, Inc. September 30, 2014 MEASURING MICHIGAN LOCAL AND STATEWIDE TRANSIT LEVELS OF SERVICE Final Report

Welcome message from author
This document is posted to help you gain knowledge. Please leave a comment to let me know what you think about it! Share it to your friends and learn new things together.
Transcript
prepared for
Michigan DOT
prepared by
Cambridge Systematics, Inc.
with
Kimley-Horn and Associates, Inc.
September 30, 2014
MEASURING MICHIGAN LOCAL AND STATEWIDE TRANSIT
LEVELS OF SERVICE
Final Report

.
This publication is disseminated in the interest of information exchange. The Michigan Department of Transportation (hereinafter referred to as MDOT) expressly disclaims any liability, of any kind, or for any reason,
that might otherwise arise out of any use of this publication or the information or data provided in the publication. MDOT further disclaims
any responsibility for typographical errors or accuracy of the information provided or contained within this information. MDOT
makes no warranties or representations whatsoever regarding the quality, content, completeness, suitability, adequacy, sequence,
accuracy or timeliness of the information and data provided, or that the contents represent standards, specifications, or regulations.

1. Report No. RC-1613
2. Government Accession No.
3. MDOT Project Manager Jill Adams
4. Title and Subtitle Measuring Michigan Local and Statewide Transit Levels of Service
5. Report Date 9/30/2014 6. Performing Organization Code
7. Author(s) Sam Van Hecke, Cambridge Systematics, Inc. David Baumgartner, Cambridge Systematics, Inc.
8. Performing Org. Report No.
9. Performing Organization Name and Address Cambridge Systematics, Inc. 100 Cambridge Park Drive, Suite 400 Cambridge, MA 02140
10. Work Unit No. (TRAIS) 11. Contract No. 2011-0477 11(a). Authorization No. Z2
12. Sponsoring Agency Name and Address Michigan Department of Transportation Office of Research and Best Practices 425 West Ottawa Street Lansing MI 48933
13. Type of Report & Period Covered Final Report 10/1/2013 – 9/30/2014 14. Sponsoring Agency Code
15. Supplementary Notes
16. Abstract The Michigan Department of Transportation’s (MDOT) Office of Passenger Transportation, in conjunction with MDOT’s Research Administration, worked with Cambridge Systematics and Kimley-Horn and Associates to research performance measures for transit levels of service (LOS). MDOT sought to improve the transit LOS measures that are collected, analyzed, and aggregated from the local to statewide level to help gauge the effectiveness of transit in meeting the mobility needs of Michigan. Researchers reviewed the existing state of the practice in LOS measures, existing LOS practices in Michigan at the state and agency level, and available transit data. Several transit LOS measures were identified as building blocks for statewide and regional transit LOS performance measurement, including Passenger Trips Per Capita, Vehicle Revenue Hours Per Capita, Passenger Trips Per Transit Dependent Population, and Safety Incidents Per 100k Vehicle Miles. Researchers provided a snapshot of current transit LOS performance, a vision and feasibility assessment for the development of a transit LOS tool for data analysis, and a series of recommendations for MDOT to continue to improve transit LOS measurement. 17. Key Words Transit, level of service, performance measure
18. Distribution Statement No restrictions. This document is available to the public through the Michigan Department of Transportation.
19. Security Classif. (of this report) Unclassified
20. Security Classif. (of this page) Unclassified
21. No. of Pages 88
22. Price
Research Report Disclaimer

Measuring Michigan Local and Statewide Transit Levels of Service
Table of Contents
Executive Summary ............................................................................................... ES-1
1.0 Introduction .................................................................................................... 1-1
2.0 Best Practices in Transit LOS Measures ........................................................... 2-1 2.1 Sources Reviewed ...................................................................................... 2-1
2.1.1 Federal Research ........................................................................... 2-2 2.1.2 Academic Research ....................................................................... 2-4 2.1.3 Statewide Transit Plans .................................................................. 2-4 2.1.4 Other Sources ............................................................................... 2-5
2.2 Fixed-Route Service Measures ..................................................................... 2-5 2.2.1 Availability Measures ..................................................................... 2-5 2.2.2 Comfort and Convenience Measures ................................................ 2-7 2.2.3 Utilization ..................................................................................... 2-9 2.2.4 Supply ....................................................................................... 2-11
2.3 Demand-Responsive Service Measures ....................................................... 2-11 2.3.1 Availability Measures ................................................................... 2-11 2.3.2 Comfort and Convenience Measures .............................................. 2-12 2.3.3 Utilization ................................................................................... 2-15 2.3.4 Supply ....................................................................................... 2-15
2.4 Summary of Findings ............................................................................... 2-16
3.0 Current Michigan Transit LOS Measures ........................................................... 3-1 3.1 Statewide Transit LOS Measures and Goals ................................................... 3-1 3.2 Local Transit Agency LOS Measures ............................................................. 3-8 3.3 Summary of Findings ............................................................................... 3-12
4.0 Michigan Transit Data Assessment .................................................................. 4-1 4.1 National and Statewide Transit Data ............................................................ 4-1
4.1.1 MDOT’s Public Transit Management System ...................................... 4-1
4.1.2 National Transit Database .............................................................. 4-2 4.1.3 Rural National Transit Database ...................................................... 4-2 4.1.4 National Socioeconomic Data Sources .............................................. 4-3
4.2 Local Agency Transit Data ........................................................................... 4-4 4.2.1 Local Agency Data Collection Overview ............................................ 4-4 4.2.2 Available Local Agency Data Summary ............................................. 4-7
4.3 Summary of Findings ................................................................................. 4-8
Cambridge Systematics, Inc. i
Measuring Michigan Local and Statewide Transit Levels of Service
5.0 Recommended Michigan Transit LOS Measures ............................................... 5-1 5.1 The Context for Michigan Transit LOS Measures ............................................. 5-1 5.2 Recommended Transit LOS Measures ........................................................... 5-1 5.3 Transit LOS Gaps ....................................................................................... 5-3
6.0 Findings ........................................................................................................... 6-1 6.1 Snapshot of Transit Level of Service in Michigan ............................................ 6-1
6.1.1 Passenger Trips per Capita ............................................................. 6-1 6.1.2 Passenger Trips per Transit Dependent Population ............................. 6-2 6.1.3 Service Hours per Capita ................................................................ 6-4 6.1.4 Safety Incidents per 100,000 VMT ................................................... 6-5 6.1.5 Comparing Passenger Trips per Capita to Service Hours per Capita ..... 6-6 6.1.6 Regional Snapshot ......................................................................... 6-8 6.1.7 Demand-Responsive versus Fixed Route ........................................ 6-11
6.2 Transit LOS Measurement Tool .................................................................. 6-12 6.2.1 Prototype Concept ....................................................................... 6-12 6.2.2 Development .............................................................................. 6-14 6.2.3 Applications and Value ................................................................. 6-16
7.0 Conclusions and Recommendations ................................................................. 7-1 7.1 Conclusions ............................................................................................... 7-1 7.2 Recommendations ..................................................................................... 7-5
8.0 Bibliography .................................................................................................... 8-1
9.0 List of Acronyms .............................................................................................. 9-1
Measuring Michigan Local and Statewide Transit Levels of Service
List of Tables
Table 2.1 National and Peer Agency Sources ............................................................. 2-1
Table 2.2 DRT Service Span LOS ........................................................................... 2-12
Table 2.3 DRT On-Time Performance LOS ............................................................... 2-13
Table 2.4 DRT Trips Not Served LOS ...................................................................... 2-14
Table 2.5 DRT-Auto Travel-Time LOS ..................................................................... 2-15
Table 4.1 Interviewed Agencies ............................................................................... 4-5
Table 5.1 Recommended Transit LOS Measures......................................................... 5-2
Table 5.2 Recommended Supporting Transit LOS Measure .......................................... 5-2
Cambridge Systematics, Inc. iii


Measuring Michigan Local and Statewide Transit Levels of Service
List of Figures
Figure ES.1 2012 Snapshot of Transit LOS by MDOT Region ........................................ ES-3
Figure 3.1 Transportation System Condition Report .................................................... 3-3
Figure 3.2 Intercity Bus Service Map ......................................................................... 3-4
Figure 3.3 Governor’s Dashboard ............................................................................. 3-6
Figure 3.4 MTA Performance Indicators ................................................................... 3-10
Figure 6.1 Passenger Trips per Capita versus Population ............................................. 6-2
Figure 6.2 Passenger Trips per Transit-Dependent Population versus Population ............. 6-3
Figure 6.3 Service Hours per Capita versus Population ................................................ 6-5
Figure 6.4 Safety Incidents per 100,000 VMT versus Population ................................... 6-6
Figure 6.5 Passenger Trips per Capita versus Service Hours per Capita ......................... 6-7
Figure 6.6 MDOT Regions Map ................................................................................. 6-8
Figure 6.7 2012 Snapshot of Transit LOS by MDOT Region ........................................ 6-10
Figure 6.8 Comparison of Demand-Responsive and Fixed-Route Services .................... 6-11
Figure 6.9 Wireframes Main Page ........................................................................... 6-13
Figure 6.10 Filter Dialog .......................................................................................... 6-14
Cambridge Systematics, Inc. v

Measuring Michigan Local and Statewide Transit Levels of Service
Executive Summary
The Michigan Department of Transportation’s (MDOT) Office of Passenger Transportation, in conjunction with MDOT’s Research Administration, tasked Cambridge Systematics and Kimley-Horn and Associates to research performance measures for transit levels of service (LOS). MDOT sought to enhance the transit LOS measures that are collected, analyzed, and aggregated from the local to statewide level to better assess the effectiveness of current transit services in meeting the mobility needs of the people of Michigan.
Transit LOS can be challenging to measure, particularly on regional and statewide levels. The national dialogue on transit LOS tends to focus on complex, data-intensive measures appropriate to larger urban areas by agencies which have the budget and expertise for advanced data collection but difficult to apply in smaller communities and rural areas. MDOT sought a simple, reliable set of transit LOS measures that accurately capture and communicate the performance of Michigan transit systems and support long-range planning decisions with a minimal burden of data collection and complex analysis on transit agencies.
Researchers reviewed the existing state of the practice in LOS measures, existing LOS practices in Michigan at the state and agency level, and available transit data.
Common fixed-route transit LOS measures for availability include service coverage, frequency, and hours of service. Passenger comfort and convenience can be measured using passenger load factor, on-time performance, and headway adherence, in addition to measures of safety, security, travel time, appearance, and comfort. Utilization and supply can measure the transit provider’s perspective of LOS.
Demand-responsive services have measures that differ due to the nature of the service: advance reservations, varying routes, and specialized populations. While some measures overlap with the fixed-route measures, they are often defined or calculated differently given different expectations. For availability, measures of demand-responsive transit LOS include response time and service span. Comfort and convenience measure include on-time performance, trip denials, missed trips, and travel time. Utilization and supply measures also are used by transit agencies to track the level of service provided.
The review of existing Michigan sources and local transit agencies revealed few existing LOS measures. Transit data on individual Michigan transit agency operations is very rich in areas such as operating expenses, operating characteristics, vehicle fleets, and other transit assets. Some Michigan local transit agencies collect and report performance measures, but the measures reported vary widely among agencies and the majority publishes none.
Linking service data to socioeconomic statistics (service area population, transit dependent population, jobs) allows agencies of different sizes and serving different settings to be compared with each other on a more equal footing, while allowing for transit LOS measures to be aggregated to county, regional, or statewide levels.
Cambridge Systematics, Inc. ES-1

Measuring Michigan Local and Statewide Transit Levels of Service
The following measures have the potential to serve as a foundation for statewide and regional transit LOS measurement:
• Passenger Trips Per Capita: This measure shows how well transit is utilized relative to the population served.
• Vehicle Revenue Hours Per Capita: This measure is indicative of service frequency and transit availability within a service area.
• Passenger Trips Per Transit Dependent Population: This measure is indicative of service demand for mobility-challenged individuals.
• Safety Incidents Per 100k Vehicle Miles: This measure is indicative of safe service.
Based on an assessment of statewide transit LOS using 2012 data, Michigan produced the following values:
• Passenger Transit Trips Per Capita: 9.8.
• Transit Vehicle Revenue Hours Per Capita: 0.6.
• Passenger Transit Trips Per Transit Dependent Population: 127.
• Safety Incidents Per 100k Vehicle Miles: 1.3.
Analysis of the statewide transit LOS snapshot at an agency level shows some patterns:
• Agencies across the State see a wide range of passenger trips per capita – from less than one at many agencies to over 40 annual trips per capita. In particular, a handful of larger agencies are doing well by this measure, including DDOT, CATA, RAPID, Ann Arbor, DTC, and Flint. Driven by those well-performing agencies, the trendline shows that as service area population increases, so does passenger trips per capita.
• Passenger trips per transit dependent population shows a similar pattern to passenger trips per capita.
• Smaller agencies tended to have higher service hours per capita. This suggests that there may be economies of scale that denser, larger cities benefit from when providing service.
• Larger agencies generally experienced more safety incidents per vehicle mile traveled than smaller agencies, which may relate to the roadway conditions of the larger cities in which they operate.
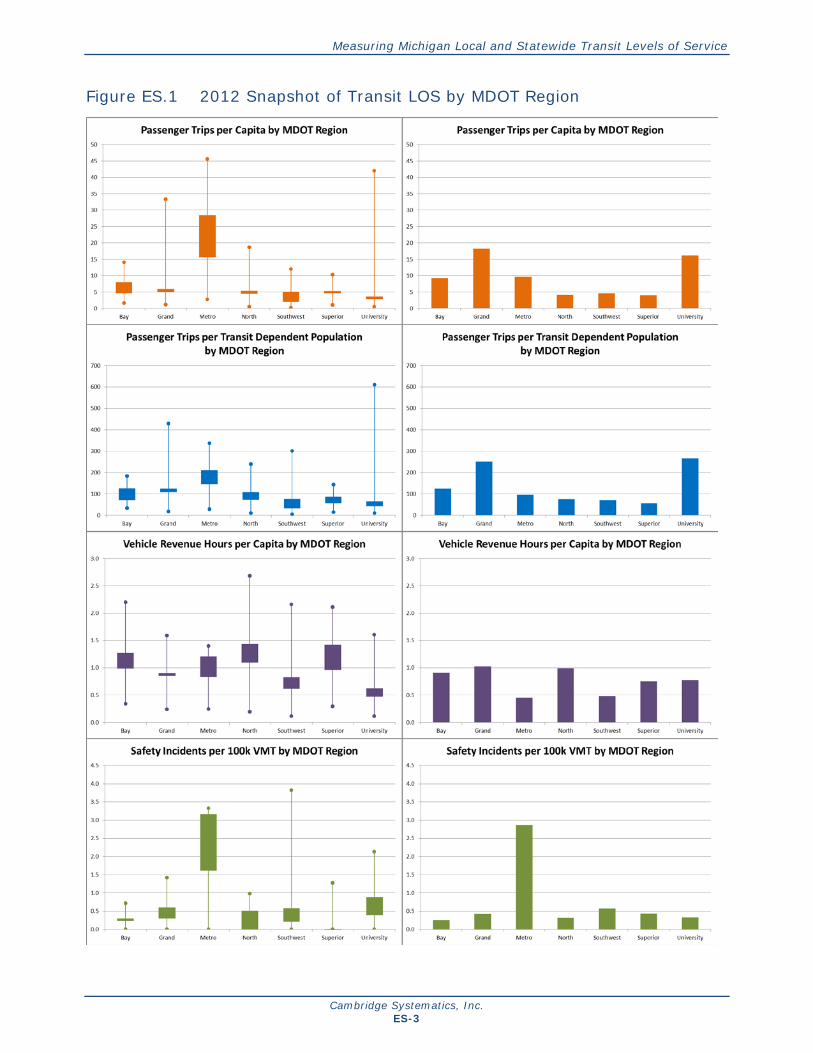
When aggregated to the regional level, the patterns and distribution of the Transit LOS measures across the State become more apparent. Figure ES.1 provides a 2012 snapshot of Transit LOS measures by MDOT region.
Cambridge Systematics, Inc. ES-2
Measuring Michigan Local and Statewide Transit Levels of Service
Figure ES.1 2012 Snapshot of Transit LOS by MDOT Region
Cambridge Systematics, Inc. ES-3

Measuring Michigan Local and Statewide Transit Levels of Service
In the box-and-whisker charts on the left of Figure ES.1, the range of each measure (minimum and maximum) within a region is represented by the dot on the bottom and top. The thicker boxes in the middle represent the 25th to 75th percentile range of agencies within each region. These charts show the range and distribution of the measures within each region. The column charts on the right portray the weighted calculation of the measure for the overall region, with all agencies aggregated within the region.
Some comparisons by region are possible using the transit LOS measures snapshot:
• The Metro and University regions measure the highest on the passenger trips per capita and passenger trips per transit-dependent population measures;
• For the service hours per capita measure, most of the regions are comparable, although the Metro and Southwest regions stand out as being lower on this measure;
• Safety incidents per 100,000 Vehicle Miles Traveled (VMT) shows that the reported safety incidents in 2012 were heavily concentrated in the Metro region, where two large agencies (SMART and DDOT) both had high-incident rates.
The call-out box to the right contains statewide measures for fixed-route service compared to demand responsive. Fixed-route services perform better than demand-responsive services for two measures: passenger trips per capita and passenger trips per transit-dependent population. Fixed Route (FR) and Demand Responsive (DR) services are the same, on average, for the service hours per capita measure. Demand-responsive services have fewer safety incidents per 100,000 VMT on average than fixed-route services do.
Researchers developed a vision and conducted a feasibility assessment for a transit LOS measurement tool. Development of a transit LOS measurement tool is feasible. It would give MDOT the ability to access the transit LOS data via a web-based application, view the data by region/county or transit agency, filter the data based on spatial location and attributes, and analyze the data in a variety of intuitive manners using maps, charts, and tables.
It is recommended that MDOT continue tracking the identified LOS measures. They can add new measures, such as an intercity transit availability measure. By making an annual process of simple transit service data updates (limiting major recalculations of socioeconomic data),
Michigan Statewide Aggregate:
Passenger trips per capita:
FR: 12.5 DR: 2.5 Passenger trips per transit-dependent population:
FR: 137 DR: 46 Service Hours per capita:
FR: 0.6 DR: 0.6 Safety Incidents per 100k VMT:
FR: 1.6 DR: .25
Cambridge Systematics, Inc. ES-4

Measuring Michigan Local and Statewide Transit Levels of Service
MDOT can revisit transit LOS and see how transit performance is changing over time, and help understand what it can do to improve trends.
As MDOT’s transit LOS monitoring matures, the Office of Passenger Transportation has the opportunity to monitor peer state activities in statewide transit LOS measurement; share transit LOS results in transportation community and among public agencies; use transit LOS reporting as an opportunity to strengthen data; and identify transit agency peer grouping opportunities based on transit LOS similarities.
Cambridge Systematics, Inc. ES-5


Measuring Michigan Local and Statewide Transit Levels of Service
1.0 Introduction The Michigan Department of Transportation’s (MDOT) Office of Passenger Transportation, in partnership with the MDOT Research Administration, is seeking a mechanism to determine the performance of the transit services provided through the 78 transit agencies operating in the State. The various agencies offer a variety of services, ranging from heavily urban fixed-route bus and rail transit (with proposed commuter rail and light rail) to demand responsive transit service in rural areas. There also are intercity and interstate services provided by Amtrak and private bus companies. These services all support greater mobility for the residents of Michigan.
Transit performance measures are quantitative or qualitative factors used to evaluate aspects of transit service. For a given performance measure, a designated range of values called Levels of Service (LOS) can be defined based on a transit passenger’s perception of the quality of service. MDOT is interested in improving the transit LOS measures that are collected, analyzed, and aggregated from the local to statewide level to help gauge the effectiveness of transit in meeting the mobility needs of the people of Michigan.
Transit LOS can be challenging to measure, particularly on regional and statewide levels. The national dialogue on transit LOS tends to focus on complex, data-intensive measures that are difficult to obtain outside of larger urban areas by agencies which have the budget and expertise for advanced data collection. MDOT seeks a simple, reliable set of transit LOS measures that accurately capture and communicate the performance of each transit system and support long-range planning decisions with a minimal burden of data collection and complex analysis on transit agencies.
The overall goal of the research is to identify a strategy to accurately and effectively measure transit LOS in Michigan for local and statewide transit services. This report includes recommended LOS measures, mechanisms for data collection, and simple methodologies for data aggregation and analysis. The ideal transit LOS measures would be readily available data, would relate to the common goals of transportation agencies, and would be easy to understand and use. This study recommends a potential framework for a transit LOS measurement tool and assesses the feasibility of tool development and maintenance.
This report summarizes the research for this project. It includes:
• A review of current practices in measuring transit level of service at the national level and among peer agencies (Section 2.0);
• A review of MDOT’s current practices in measuring transit LOS (Section 3.0);
• An assessment of available transit data resources at the national, statewide, and individual agency levels (Section 4.0);
• A set of recommendations for transit LOS measures (Section 5.0);
• A snapshot of transit LOS based on recommended measures and feasibility assessment for a transit LOS tool (Section 6.0); and
• A set of conclusions drawn from the research (Section 7.0).
Cambridge Systematics, Inc. 1-1

Measuring Michigan Local and Statewide Transit Levels of Service
2.0 Best Practices in Transit LOS Measures This section reviews current practices in measuring transit level of service at the national level, among other state agencies, and among Michigan’s transit agencies. The objective is to review the current practices in measuring transit LOS to provide a broad spectrum of potential transit LOS measurement options that MDOT can consider for potential application in the future.
The section includes a list of sources reviewed for this work, fixed-route service measures (organized by availability, comfort and convenience, utilization, and supply), and service measures for demand-responsive transit (also organized by availability, comfort and convenience, utilization, and supply).
This section divides performance measures along two dimensions. First is a distinction between fixed-route and demand-responsive services. These modes are delivered in different ways and with different service expectations, so they are best described with different performance measures. Second, a distinction is made between measures of availability and measures of comfort and convenience. Availability describes the ability of transit to serve a given trip, both spatially and temporally. Comfort and convenience measures describe the quality of a transit service. Measures of utilization and supply also are identified for both fixed-route and demand-responsive transit systems.
2.1 Sources Reviewed
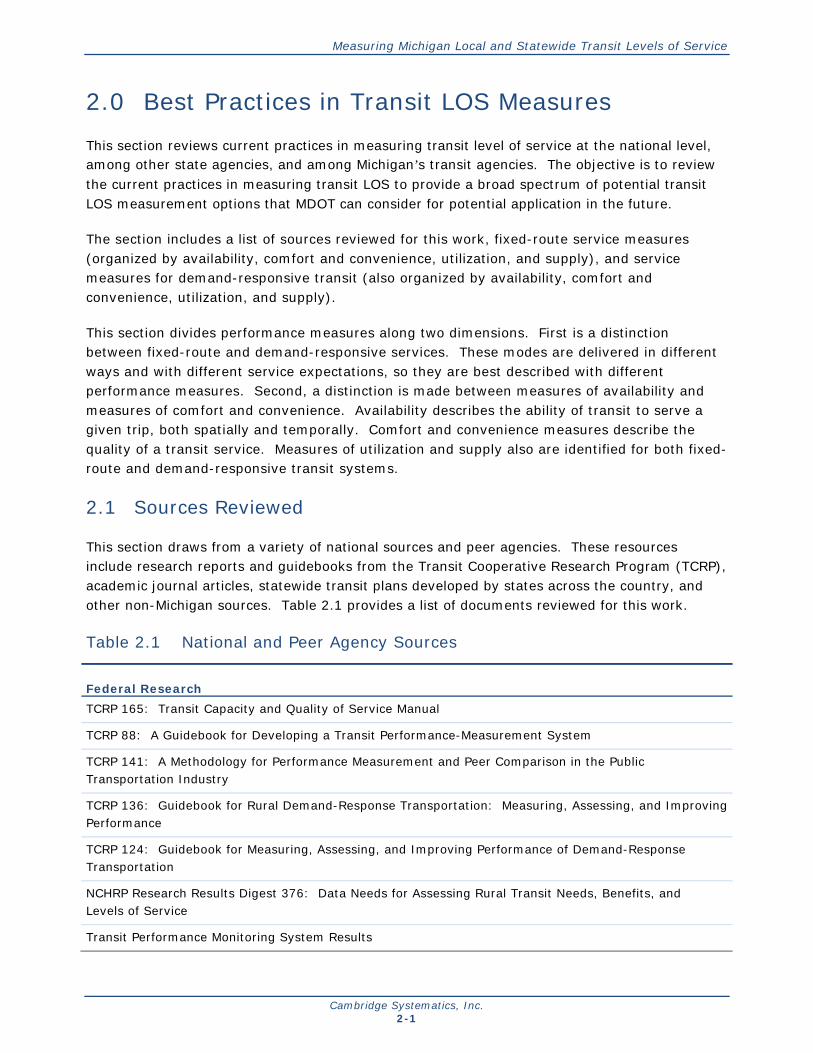
This section draws from a variety of national sources and peer agencies. These resources include research reports and guidebooks from the Transit Cooperative Research Program (TCRP), academic journal articles, statewide transit plans developed by states across the country, and other non-Michigan sources. Table 2.1 provides a list of documents reviewed for this work.
Table 2.1 National and Peer Agency Sources
Federal Research TCRP 165: Transit Capacity and Quality of Service Manual
TCRP 88: A Guidebook for Developing a Transit Performance-Measurement System
TCRP 141: A Methodology for Performance Measurement and Peer Comparison in the Public Transportation Industry
TCRP 136: Guidebook for Rural Demand-Response Transportation: Measuring, Assessing, and Improving Performance
TCRP 124: Guidebook for Measuring, Assessing, and Improving Performance of Demand-Response Transportation
NCHRP Research Results Digest 376: Data Needs for Assessing Rural Transit Needs, Benefits, and Levels of Service
Transit Performance Monitoring System Results
Cambridge Systematics, Inc. 2-1
Measuring Michigan Local and Statewide Transit Levels of Service
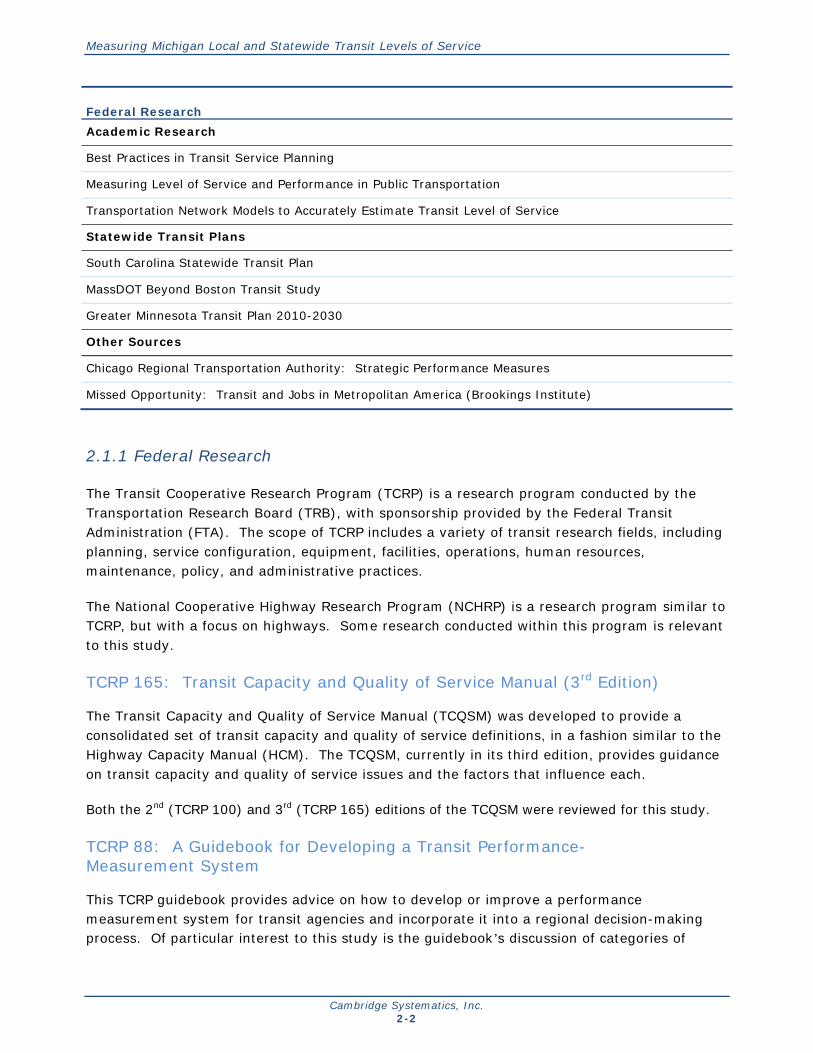
Federal Research Academic Research
Best Practices in Transit Service Planning
Measuring Level of Service and Performance in Public Transportation
Transportation Network Models to Accurately Estimate Transit Level of Service
Statewide Transit Plans
South Carolina Statewide Transit Plan
MassDOT Beyond Boston Transit Study
Greater Minnesota Transit Plan 2010-2030
Other Sources
Chicago Regional Transportation Authority: Strategic Performance Measures
Missed Opportunity: Transit and Jobs in Metropolitan America (Brookings Institute)
2.1.1 Federal Research
The Transit Cooperative Research Program (TCRP) is a research program conducted by the Transportation Research Board (TRB), with sponsorship provided by the Federal Transit Administration (FTA). The scope of TCRP includes a variety of transit research fields, including planning, service configuration, equipment, facilities, operations, human resources, maintenance, policy, and administrative practices.
The National Cooperative Highway Research Program (NCHRP) is a research program similar to TCRP, but with a focus on highways. Some research conducted within this program is relevant to this study.
TCRP 165: Transit Capacity and Quality of Service Manual (3rd Edition)
The Transit Capacity and Quality of Service Manual (TCQSM) was developed to provide a consolidated set of transit capacity and quality of service definitions, in a fashion similar to the Highway Capacity Manual (HCM). The TCQSM, currently in its third edition, provides guidance on transit capacity and quality of service issues and the factors that influence each.
Both the 2nd (TCRP 100) and 3rd (TCRP 165) editions of the TCQSM were reviewed for this study.
TCRP 88: A Guidebook for Developing a Transit Performance-Measurement System
This TCRP guidebook provides advice on how to develop or improve a performance measurement system for transit agencies and incorporate it into a regional decision-making process. Of particular interest to this study is the guidebook’s discussion of categories of
Cambridge Systematics, Inc. 2-2

Measuring Michigan Local and Statewide Transit Levels of Service
performance measures, including specific measures, data sources, and reporting methods. The guidebook includes reference to over 400 performance measures.
TCRP 141: A Methodology for Performance Measurement and Peer Comparison in the Public Transportation Industry
This TCRP report provides a methodology for performance measurement for fixed-route transit systems. The process includes benchmarking against a peer group using a set of performance measures, some of which may be service quality measures. Some of the service quality measures listed include average system speed, on-time performance, excess wait time, passenger loading, overall satisfaction, complaint and compliment rates, call-center response time, and missed trips.
TCRP 136: Guidebook for Rural Demand-Response Transportation: Measuring, Assessing, and Improving Performance
Focused on rural demand responsive transit (DRT), this guidebook considers available performance data for rural DRT and describes a set of performance measures appropriate for these systems. The focus is on performance measures from the transit provider’s perspective, rather than the level of service experienced by passengers.
TCRP 124: Guidebook for Measuring, Assessing, and Improving Performance of Demand-Response Transportation
This guidebook, the urban counterpart to TCRP 136, also provides guidance on measuring DRT systems. It includes performance measures for DRT that describe performance from the agency perspective and levels of service from the passenger perspective, although the primary focus is on the agency perspective.
NCHRP Research Results Digest 376: Data Needs for Assessing Rural Transit Needs, Benefits, and Levels of Service
This report is a review of data elements in the Rural National Transit Database (NTD), and recommends changes to data collected in that program. It also identifies potential LOS options for evaluation of rural transit services. It identifies performance measures to be used to assess rural transit performance and LOS.
Transit Performance Monitoring System (TPMS) Results
This report, prepared for the American Public Transit Association (APTA) and funded by the FTA, presents the results of a project to implement a performance monitoring system for transit. It includes survey mechanisms and results that describe, from a user’s perspective, how transit is used.
Cambridge Systematics, Inc. 2-3
Measuring Michigan Local and Statewide Transit Levels of Service
2.1.2 Academic Research
Best Practices in Transit Service Planning
This paper was prepared for the Florida Department of Transportation Research Center by the University of South Florida’s (USF) Center for Urban Transportation Research (CUTR). It discusses three components to transit service planning: service design standards, performance measurement, and service evaluation. Within the performance measurement section, a variety of performance measures for routes are discussed, along with a review of target values for these measures.
Measuring Level of Service and Performance in Public Transportation
Prepared by the Washington State Transportation Center for the Washington State Department of Transportation and Transportation Northwest (TransNow), in cooperation with the U.S. DOT, this report looks at evaluation criteria and performance measures for transit. It provides many examples of LOS indicators and definitions from Washington State and the broader literature.
Transportation Network Models to Accurately Estimate Transit Level of Service
This paper, by David P. Racca of the University of Delaware, describes a process for estimating transit level of service between origins and destinations using network models. The focus is on the ratio of transit trip time to car drive time.
2.1.3 Statewide Transit Plans
Several states have developed statewide transit plans. This section describes a sample of these statewide transit plans.
South Carolina Statewide Transit Plan
The statewide transit plan for South Carolina includes an overview of transit in the State, a report on perceptions of transit, a vision for transit, definition of needs, funding projections, and an action plan. Measures used in the plan to describe current transit in the State include vehicle miles, vehicle hours, and ridership.
MassDOT Beyond Boston Transit Study
This statewide transit study for Massachusetts includes a thorough review of the transit network from a statewide perspective, an analysis of the operation of each transit provider, identification of improvement projects, and an evaluation of equity. One part of the study is an initiative to develop and use service guidelines. This includes the definition of local service standards and the use of state-level performance measures. Through the review of other states, five key state performance measures were identified: passengers per revenue hour, cost per passenger, cost per revenue mile, farebox recovery ratio, and revenue/subsidy per passenger.
Cambridge Systematics, Inc. 2-4

Measuring Michigan Local and Statewide Transit Levels of Service
Greater Minnesota Transit Plan 2010-2030
This transit plan, prepared by the Minnesota DOT, outlines the challenges facing transit in Minnesota, describes existing public transit systems, documents future transit needs and demand, provides financial analysis, and offers strategic directions for transit in the State. In describing existing systems, the plan uses cost-efficiency (cost per mile and cost per hour), service effectiveness (passengers per service mile and passengers per service hour), and cost-effectiveness (cost per passenger, revenue per passenger, revenue per hour, farebox recovery ratio) measures.
2.1.4 Other Sources
Chicago Regional Transportation Authority: Strategic Performance Measures
This report describes the status of 29 performance measures centered on four goals for the region: provide transportation options, ensure financial viability, enhance livability and economic vitality, and demonstrate value. Performance measures within these goal areas are focused on transit’s impact. Updated every five years, the report allows the region to track progress in a strategic way to avoid focusing on short-term “disturbances.”
Missed Opportunity: Transit and Jobs in Metropolitan America
Prepared by the Brookings Institute’s Metropolitan Policy Program, this report describes a robust methodology for estimating transit’s potential effectiveness in serving workers and employers. It focuses on the value of transit in making connections between workers’ homes and jobs. Measures of coverage, service frequency, and job access are all employed. Transit supply data are combined with socioeconomic data and a modeling process connects possible origins with possible destinations. This report showcases a good model of a robust transit LOS measure that is applicable in data-rich urban areas and requires some robust analysis.
2.2 Fixed-Route Service Measures
Fixed-route services include bus and rail operations that travel along a defined route according to a published schedule. They are generally available to the general public, and their performance is regularly tracked through the National Transit Database (NTD) and other sources.
2.2.1 Availability Measures
Availability measures show whether a transit service is present for use for a trip at a given time. The presence of transit near a traveler’s origin and destination, at or near the time one wants to travel, while sufficient capacity is available, is necessary for using a transit service.
Availability measures are a prerequisite to comfort and convenience measures; if service is not available for a trip, the quality of service does not matter.
Cambridge Systematics, Inc. 2-5
Measuring Michigan Local and Statewide Transit Levels of Service
Service Coverage
Service coverage measures a transit service’s spatial proximity to the population. This information can be useful for identifying gaps in service. Several measures are available to describe service coverage.
Route Miles per Square Mile
This measure is relatively easy to calculate, and is an indication of the density of transit routes within a service area. A system with a high number of route miles per square mile typically has transit routes are close together and serving more destinations.
A limitation of this measure is that it does not indicate how well transit is distributed across a given area, or if the transit routes are serving the population and jobs in the service area. Additionally, individual transit agencies may define service areas differently, for example an urbanized area versus a county or set of counties, which may include rural areas not intended to be served by routed service.
Percentage of Transit-Supportive Area Served
This measure works to address the limitations of area-based service coverage measures. Transit-supportive areas are defined in the TCQSM as areas with a density of at least three residential units or four jobs per acre – a figure cited as the minimum density needed to support hourly transit service.
The service coverage area is calculated as the area within an easy walking distance from a transit stop. The most common distance used in this calculation is 0.25 miles from a bus stop or 0.5 miles from a rail station.
The percentage of transit-supportive area served is typically calculated using GIS methods. Data needs include bus stop and rail station locations in GIS-usable format, and transportation analysis zones (TAZ) or census blocks with associated households and jobs data.
Percentage of People or Jobs Served
Similar to the previous measure, the percentage of people served or percentage of jobs served is calculated by identifying the population and/or jobs within a given distance from the transit network. It is the number of people (or jobs) in the service coverage area, divided by the population (or number of jobs) in the service area.
This measure also is calculated using GIS methods. Data needs include bus stop and rail station locations and TAZs or census blocks with population and jobs. It should be noted that measures such as these typically are less accurate outside of urban areas, where socioeconomic data is compiled in larger geographic areas.
Cambridge Systematics, Inc. 2-6

Measuring Michigan Local and Statewide Transit Levels of Service
Frequency
Frequency is the number of times per hour that a user has access to the transit mode, given a service is available at that time.
Average Headway
The inverse of frequency is headway, or the amount of time between consecutive transit vehicles. The average headway provides information on the convenience of the service, and is a determinant of the wait time at a given stop.
Using average headway can mask variability in the schedule of a service, especially in systems with timed transfers. If several buses arrive at a stop within a short interval, followed by a long headway before the next bus, the experience of a passenger is not the same as if the buses arrive at regular intervals. The TCQSM recommends treating multiple routes serving the same destination within three minutes of each other as a single bus when calculating this measure.
System-level average headway can be calculated from NTD data, as described in Section 5.0 of the TCQSM (3rd Edition).
Hours of Service
Hours of service also is referred to as service span when there is no midday interruption of service. Hours of service represents the number of hours during a day a transit service is operating at hourly headways or better. This measure is important for describing availability, especially when considering round trips: if the service is not operating when the return trip is needed, the user will not be able to use the transit service.
To calculate hours of service, subtract the departure time of the last run from the departure time of the first run, and add one hour to account for the final hour of service.
2.2.2 Comfort and Convenience Measures
Comfort and convenience measures can be used to evaluate a user’s perception of quality of a transit service. These measures help describe the attractiveness or competitiveness of transit relative to other modes.
Capacity
Capacity describes whether there is space available on the transit vehicle for a passenger on a trip. It also can be a measure of availability, as a transit vehicle at capacity is not available for use by additional passengers.
Cambridge Systematics, Inc. 2-7

Measuring Michigan Local and Statewide Transit Levels of Service
Passenger Load Factor
Passenger load factor is the number of passengers on the transit vehicle divided by the number of seats. Low numbers (i.e., smaller than 0.75) mean that passengers can choose to sit where they like. A load factor higher than 1.0 means there are standees. The point at which crush loading or capacity is reached depends on the design of the vehicle. Passenger comfort-level rises as load factor falls.
A more detailed calculation estimates the square feet available per standing passenger. This takes into account the design of the vehicle, and definition of level of service thresholds can incorporate typical objects worn or carried on, such as backpacks or suitcases.
Reliability
There are several possible measures of reliability that can describe the convenience of a transit service to a passenger.
On-Time Performance
This widely used measure describes how frequently a vehicle arrives at a stop within a given window around the scheduled time. For example, a common acceptable window may be zero minutes early to five minutes late, but the definition of “on-time” varies among providers.
On-time performance is a measure that becomes more important as the headway increases. For very frequent routes, the evenness of headways is more important, but routes with long headways require close adherence to the published schedule to serve customers effectively.
An alternative to on-time performance is excess wait time, which is the number of extra minutes passengers had to wait past the scheduled departure time. This measure helps avoid the differences in definition between agencies of “on-time.”
Headway Adherence
For routes with shorter headways, headway adherence is more important than on-time performance from a passenger’s perspective, since most passengers will simply show up to the station expecting a short wait. Bus bunching has a negative impact on the headway experienced by most passengers.
The measure of headway adherence suggested in the TCQSM is the coefficient of variation of headways at a particular stop along a route. It is calculated as the standard deviation of headway deviations, divided by the mean scheduled headway on the route at that location. Headway deviations are the actual headway minus the scheduled headway. Low coefficients indicate very regular service with little bunching, while high coefficients indicate poor headway adherence.
Cambridge Systematics, Inc. 2-8

Measuring Michigan Local and Statewide Transit Levels of Service
Travel Time
Transit-Auto Travel Time
This measure is the difference in trip travel time from door to door between transit and automobile. It includes access and egress times, wait time, and transfer time for both modes. It measures how much longer or shorter a trip will take on transit compared to auto.
This measure is computed at the system level, and can be calculated using the outputs from a regional travel demand model, or more manually using a trip planner for a sampling of origin-destination pairs.
Safety and Security
Safety measures refer to the probability of being injured, while security refers to the probability of being a victim of a crime while using transit.
Safety Incidents per 100k VMT
This measure indicates the frequency of crashes resulting in property damage, injury, or death. This is an area where data are well-reported. Minimizing the number of safety incidents is a common goal across transportation providers. While it is not necessarily an attribute that passengers consider each day, it is one dimension of customer service quality.
Security
A measure of security is the rate of crime that occurs while using a transit system. In some cases, it can be hard to measure given the difficulty in distinguishing, for example, between crime at a bus stop and crime in areas surrounding the station. In many cases, measuring security is more qualitative, since passenger perception of security can matter just as much as actual conditions in the process of deciding whether to take transit.
Appearance and Comfort
There are many less-tangible aspects to comfort and convenience of transit, and perceptions can vary from one passenger to the next. Cleanliness, temperature, smoothness of ride, and operator friendliness are among the many things that affect the perception and attractiveness of transit.
Customer satisfaction on these types of factors is often measured using passenger surveys. This process can help track service quality over time, and identify the areas that most influence customer satisfaction.
2.2.3 Utilization
Utilization of transit refers to the number of passengers riding transit.
Cambridge Systematics, Inc. 2-9
Measuring Michigan Local and Statewide Transit Levels of Service
Ridership
Ridership can be measured in the aggregate or using rate-based measures.
Total Passenger Trips
This measure is the total number of passengers using the system each year. These data are universally reported by transit agencies, and is a common measure of the utilization of transit for an agency.
Transit Trips per Capita
Dividing total ridership by the population of the service area helps to illustrate the impact of transit in a community. The Regional Transportation Authority (RTA) in Chicago tracks this measure to demonstrate transit’s role as a transportation option in the region.
Transit Mode Share
Transit mode share is the percentage of trips taken on transit compared to trips taken on all modes. It is most commonly measured for work trips, which is typically when transit is most competitive with other modes.
Passengers per Vehicle Revenue Hour
The productivity of a transit service is measured using passengers per vehicle revenue hour. This compares the ridership to the service provided. Data for this measure is commonly available for all agencies through the National Transit Database (NTD) and the Rural NTD.
Distance
A second aspect of transit utilization is the distance traveled by passengers on the transit network.
Passenger Miles Traveled
The aggregate passenger miles traveled is the total distance traveled on transit by each passenger. It reflects a combination of average trip distance and total ridership.
Passenger Miles Traveled per Capita
Passenger miles traveled per capita is the ratio of total passenger miles traveled to the number of residents in the service area. The RTA in Chicago also tracks this measure to show progress in reducing automobile use and increasing transit use in the region.
Cambridge Systematics, Inc. 2-10
Measuring Michigan Local and Statewide Transit Levels of Service
2.2.4 Supply
Quantity of Service Provided
Annual Service Hours
Revenue vehicle hours is a measure of how much transit supply is provided in a region. It is reported in the NTD and Rural NTD.
Annual Service Miles
The total number of revenue vehicle miles also measures the transit supply provided by an agency. This data is available in the NTD and Rural NTD.
2.3 Demand-Responsive Service Measures
Demand-responsive transit services transport passengers from origin to destination based on advanced scheduling by the customer. The vehicles do not travel along a fixed or published route or schedule, and serve many different pickup and dropoff points. Demand-responsive services may be open to the general public, but are frequently limited by local polices to certain population groups (e.g., seniors and persons with mobility limitations).
The measures below frequently use per capita. These measures can be refined by only including the eligible population for DRT (which may be limited to the elderly or mobility impaired in some instances) for each particular transit service or service area.
Since demand-responsive services have no designated stops, some measures of availability and comfort and convenience that are used for fixed-route services do not apply. Other measures may have differing definitions to account for the different structure of the services. This section presents availability and comfort and convenience service measures that can be used to evaluate demand-responsive transit.
2.3.1 Availability Measures
As before, availability measures describe whether a transit service can be used for a trip at a given time. Because of the nature of the differences between demand-responsive and fixed-route transit services, the measures used to describe availability vary.
Response Time
Response Time
Response time is the amount of time a user needs to schedule a trip in advance of the reservation time. Fixed-route services have a zero response time, since no reservation is needed. Most demand-responsive services require an advance reservation so a vehicle can be dispatched and routed to serve the needed trip. In some cases, a trip can be scheduled more or less on the fly, and an advance call requirement is an hour. Many demand-responsive
Cambridge Systematics, Inc. 2-11

Measuring Michigan Local and Statewide Transit Levels of Service
services require 24 hours or more notice to provide service, so the passenger needs to call for a trip the previous day. A few systems have advance call requirements of even longer, which requires significant advance planning for a potential passenger.
Hours of Service
Hours of service is the number of hours during the day that transit is provided within the service area. It also is referred to as service span when there is no midday interruption of service.
Service Span
Service span for demand-responsive transit should incorporate both the number of hours per day the service is available, but also the number of days per week. Many rural services are limited to weekday-only or even fewer days of service each week.
Table 2.2 provides a matrix of transit level of service (LOS) for each combination of hours per day and days per week. Rather than the A through F scale typically used for fixed-route services, demand-responsive service LOS is rated on a scale of 1 to 8, where 1 is the highest level of service.
Table 2.2 DRT Service Span LOS
Days per week
Hours Per Day 6-7 5 3-4 2 1 0.5a <0.5
≥16 LOS 1 LOS 2 LOS 4 LOS 5 LOS 6 LOS 7 LOS 8
12-16 LOS 2 LOS 3 LOS 4 LOS 5 LOS 6 LOS 7 LOS 8
9-12 LOS 3 LOS 4 LOS 4 LOS 6 LOS 6 LOS 7 LOS 8
4-9 LOS 4 LOS 5 LOS 5 LOS 6 LOS 7 LOS 7 LOS 8
<4 LOS 6 LOS 6 LOS 6 LOS 7 LOS 8 LOS 8 LOS 8
Source: TCQSM, 2nd Edition.
a Service at least twice per month.
2.3.2 Comfort and Convenience Measures
These measures demonstrate the quality of service provided by a demand-responsive transit service.
Reliability
On-Time Performance
When a passenger schedules a trip on a demand-responsive service, the dispatcher will typically provide a window around the pickup time during which the vehicle may arrive. For
Cambridge Systematics, Inc. 2-12
Measuring Michigan Local and Statewide Transit Levels of Service
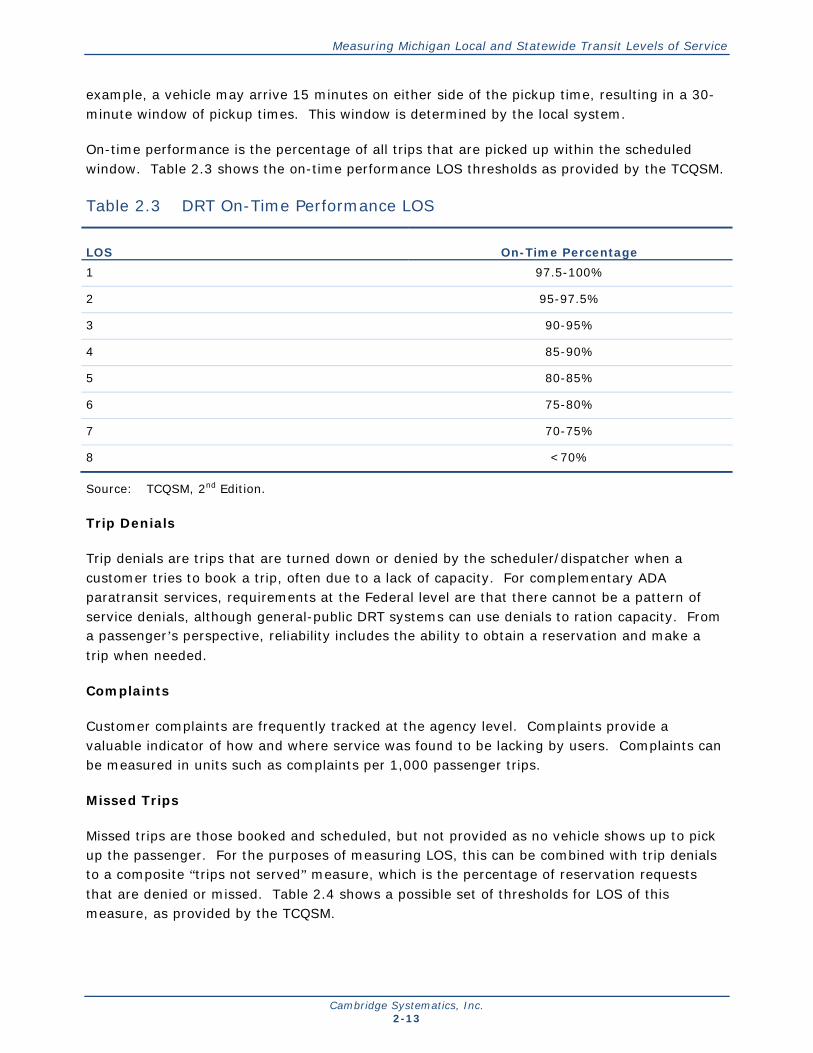
example, a vehicle may arrive 15 minutes on either side of the pickup time, resulting in a 30-minute window of pickup times. This window is determined by the local system.
On-time performance is the percentage of all trips that are picked up within the scheduled window. Table 2.3 shows the on-time performance LOS thresholds as provided by the TCQSM.
Table 2.3 DRT On-Time Performance LOS
LOS On-Time Percentage 1 97.5-100%
2 95-97.5%
3 90-95%
4 85-90%
5 80-85%
6 75-80%
7 70-75%
8 <70%
Source: TCQSM, 2nd Edition.
Trip Denials
Trip denials are trips that are turned down or denied by the scheduler/dispatcher when a customer tries to book a trip, often due to a lack of capacity. For complementary ADA paratransit services, requirements at the Federal level are that there cannot be a pattern of service denials, although general-public DRT systems can use denials to ration capacity. From a passenger’s perspective, reliability includes the ability to obtain a reservation and make a trip when needed.
Complaints
Customer complaints are frequently tracked at the agency level. Complaints provide a valuable indicator of how and where service was found to be lacking by users. Complaints can be measured in units such as complaints per 1,000 passenger trips.
Missed Trips
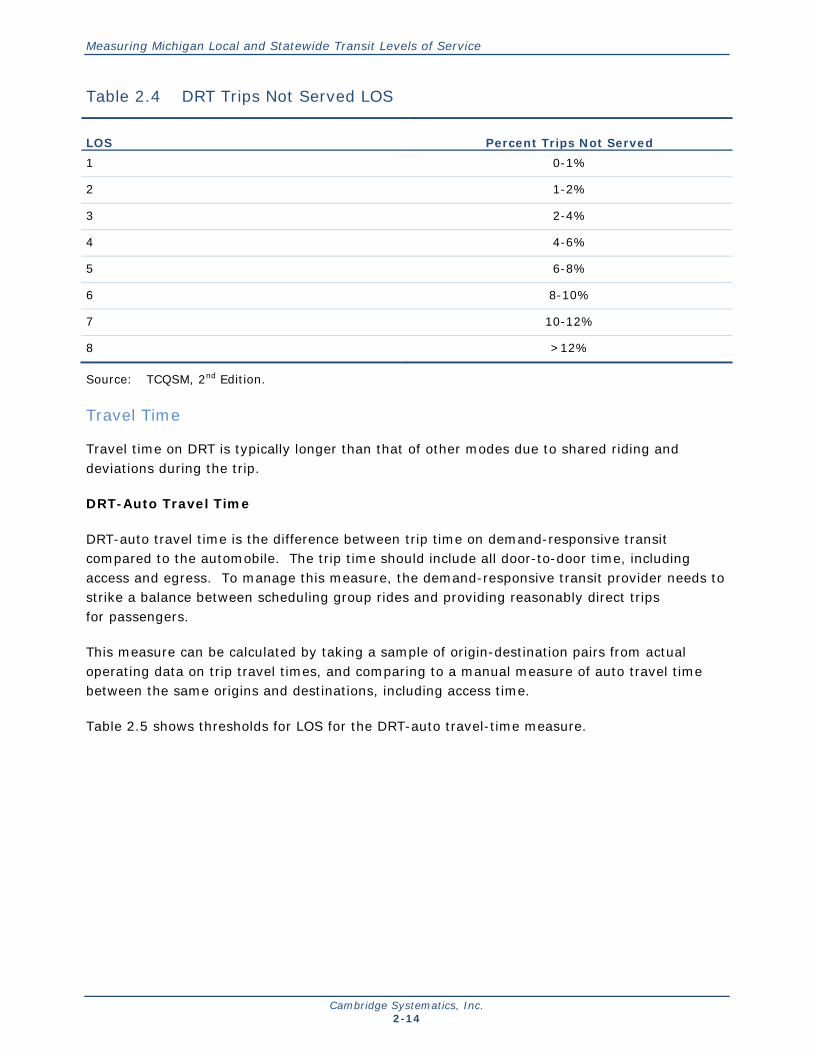
Missed trips are those booked and scheduled, but not provided as no vehicle shows up to pick up the passenger. For the purposes of measuring LOS, this can be combined with trip denials to a composite “trips not served” measure, which is the percentage of reservation requests that are denied or missed. Table 2.4 shows a possible set of thresholds for LOS of this measure, as provided by the TCQSM.
Cambridge Systematics, Inc. 2-13
Measuring Michigan Local and Statewide Transit Levels of Service
Table 2.4 DRT Trips Not Served LOS
LOS Percent Trips Not Served 1 0-1%
2 1-2%
3 2-4%
4 4-6%
5 6-8%
6 8-10%
7 10-12%
8 >12%
Source: TCQSM, 2nd Edition.
Travel Time
Travel time on DRT is typically longer than that of other modes due to shared riding and deviations during the trip.
DRT-Auto Travel Time
DRT-auto travel time is the difference between trip time on demand-responsive transit compared to the automobile. The trip time should include all door-to-door time, including access and egress. To manage this measure, the demand-responsive transit provider needs to strike a balance between scheduling group rides and providing reasonably direct trips for passengers.
This measure can be calculated by taking a sample of origin-destination pairs from actual operating data on trip travel times, and comparing to a manual measure of auto travel time between the same origins and destinations, including access time.
Table 2.5 shows thresholds for LOS for the DRT-auto travel-time measure.
Cambridge Systematics, Inc. 2-14

Measuring Michigan Local and Statewide Transit Levels of Service
Table 2.5 DRT-Auto Travel-Time LOS
LOS Travel-Time Difference (minutes) 1 ≤0
2 1-10
3 11-20
4 21-30
5 31-40
6 41-50
7 51-60
8 >60
Source: TCQSM, 2nd Edition.
2.3.3 Utilization
Ridership
Passenger Trips per Capita
Passenger trips per capita points to the benefits provided by rural transit. It can be indirectly indicative of LOS if demand is affected by service levels. This measure provides a macrolevel view of transit’s success in rural areas. Passenger trips per capita is one of three high-priority recommended measures to indicate LOS in rural transit systems in the NCHRP RRD 376 report.
Passenger Trips per Vehicle Hour
This is a measure of the productivity of a DRT system, which is considered by many to be the most important single measure of DRT performance and effectiveness. It is affected by population density, rider trip patterns, ability of trips to be grouped, and dispersion of destinations. It is calculated by dividing the total number of passenger trips by total vehicle-hours.
2.3.4 Supply
Quantity of Service Provided
Vehicle Revenue Miles per Capita
This measure, recommended as a high-priority measure in the NCHRP RRD 376 report, assesses the quantity of rural transit provided in a geographic area. This measure can be indicative of service frequency and availability.
Simply calculated as the total vehicle revenue miles provided, divided by the total population in the service area, data needs are small while providing a macrolevel assessment of transit availability.
Cambridge Systematics, Inc. 2-15
Measuring Michigan Local and Statewide Transit Levels of Service
Vehicle Revenue Hours per Capita
Similar to miles per capita, this measure also is a high-priority recommendation in the NCHRP RRD 376 report. It is a macrolevel assessment of the availability of transit in the service area. This measure is calculated by dividing the total revenue miles of service provided by the service area’s total population.
2.4 Summary of Findings
Significant research has been conducted at the Federal level in measuring transit level of service. These TCRP studies and other research were reviewed, in conjunction with academic research and examples of statewide transit plans, to help understand the best practices and measures available for use within this study. There are limited examples of other states measuring transit LOS on a statewide level with a focus on mobility, as MDOT is pursuing.
There is no single “silver bullet” measure that portrays a complete picture of transit LOS. Therefore, multiple measures are needed to describe the performance of transit in Michigan. Transit LOS measures should be separated into those appropriate for fixed-route services and measures for demand-responsive services, due to the inherent differences between these modes. Within these groupings, measures can be further categorized by whether they represent availability, comfort and convenience, utilization, or supply.
Data availability is a limiting factor when selecting among potential transit LOS measures. With comprehensive, reliable data, more detailed measures can be used. When more limited data are available, transit LOS measures are still possible, but are less illuminating.
Among fixed-route transit LOS measures, service coverage, frequency, and hours of service describe whether a service is available, and a variety of measures within these categories are possible depending on data availability. Passenger comfort and convenience can be measured using passenger load factor, on-time performance, and headway adherence, in addition to measures of safety, security, travel time, appearance, and comfort. Utilization and supply can measure the transit provider’s perspective of LOS.
Demand-responsive services have measures that differ due to the nature of the service: advance reservations, varying routes, and specialized populations. While some measures overlap with the fixed-route measures, they are often defined or calculated differently given different expectations. For availability, measures of demand-responsive transit LOS include response time and service span. Comfort and convenience measure include on-time performance, trip denials, missed trips, and travel time. Utilization and supply measures also are used by transit agencies to track the level of service provided.
Cambridge Systematics, Inc. 2-16

Measuring Michigan Local and Statewide Transit Levels of Service
3.0 Current Michigan Transit LOS Measures This section identifies current practices in measuring transit LOS in Michigan, including local transit LOS measures, regional mobility measures, and aggregated statewide mobility and transit LOS measures. This research includes MDOT partners, such as the larger transit providers that employ their own internal performance measurements like the DDOT.
The section begins by summarizing various transit measures aggregated by MDOT from transit agencies across the State. A review of Michigan’s goals in transit LOS measurement also is documented. The memorandum concludes with an assessment of LOS captured by local transit agencies. The review of local agencies includes a representative cross section of transit operators, including larger transit providers such as the Detroit Department of Transportation (DDOT) and smaller demand responsive systems.
3.1 Statewide Transit LOS Measures and Goals
Numerous studies and reports have been initiated over the last several years related to the evaluation of transit system performance in Michigan. The outcomes of these initiatives have provided a foundation for the exploration of transit level of service for this study. The following section summarizes various Michigan statewide sources. The intent is to determine the purpose of the study and identify which (if any) performance metrics are measured. Sources evaluated and summarized as part of this task included:
• MDOT Transportation System Performance Measures Report;
• Driven By Excellence: A Report on Transportation Performance at MDOT;
• MDOT System Condition Measurement for Local Transit;
• Michigan Governor’s Dashboard;
• Transit Economic Benefits Model;
• MI Transportation Plan (2035 State Long-Range Transportation Plan); and
• MI Travel Counts.
Cambridge Systematics, Inc. 3-1

Measuring Michigan Local and Statewide Transit Levels of Service
MDOT Transportation System Performance Measures Report
The Transportation System Performance Measures Report1 is compiled annually by MDOT to provide data on the condition and performance of publicly owned transportation system components in Michigan. The on-line report categorizes the various measures into four major goal areas: Stewardship, Safety and Security, System Improvement, and Efficient and Effective Operations. These areas align with the State Long-Range Transportation Plan. The intent of the Transportation System Performance Measures Report is to develop performance measures that reflect aspects of the transportation system ranging from pavement conditions and roadway level of service to airport and transit fleet condition to services levels for transit and passenger rail. Transit measures provided in the report include bus fleet condition, passenger rail service, rural intercity bus access, and local bus transit service, defined as follows.
• Bus Fleet Condition – percent of rural and specialized transit vehicles past their useful life;
• Passenger Rail Service – daily train miles and total annual ridership;
• Rural Intercity Bus Access – percent of rural population within 25 miles of an intercity bus stop (shown in Figure 3.2); and
• Local Bus Transit Service – level of service based on five indicators (presence of transit in every county, total annual passenger trips, total annual passenger trips for seniors and persons with disabilities, total hours of service, total miles of service).
Figure 3.1 shows a snapshot of web-interface of the Transportation System Performance Measures Report.
The Transportation Research Board (TRB) Committee on Performance Measurement (ABC30) featured the report in its December 2009 newsletter.
1 http://www.michigan.gov/mdot/0,4616,7-151-58877_60168-220589-,00.html.
Cambridge Systematics, Inc. 3-2

Measuring Michigan Local and Statewide Transit Levels of Service
Figure 3.1 Transportation System Condition Report
Source: http://www.michigan.gov/documents/mdot/MDOT-Performance_Measures_Report_289930_7.pdf.
The intercity bus service map, shown in Figure 3.2, is a good example of a transit LOS measure that relies on service supply. MDOT looks at existing intercity bus service, and the populations that have access to it. This does not add other dimensions (How good is the service? Do people use it regularly?) but distinguishes between areas that have this mobility options that other areas lack.
Cambridge Systematics, Inc. 3-3

Measuring Michigan Local and Statewide Transit Levels of Service
Figure 3.2 Intercity Bus Service Map
Source: http://www.mi.gov/documents/mdot/RuralPopulationIntercityBusMap_8-2-11_362046_7.pdf.
Cambridge Systematics, Inc. 3-4

Measuring Michigan Local and Statewide Transit Levels of Service
Driven By Excellence: A Report on Transportation Performance at MDOT
Driven By Excellence: A Report on Transportation Performance at MDOT2 is a high-level, easy to read summary that is a companion to the web-based MDOT Transportation System Performance Measures Report described in the previous section. This report provides a subset of the measures MDOT uses to indicate the condition of the publicly owned and/or maintained transportation system.
MDOT System Condition Measurement for Local Transit
The System Condition Measurement for Local Transit initiative Report3 provides performance measures for all the elements of the State’s transportation system. The report identifies gaps in the 2009 Transportation System Performance Measures Report relative to local public transit systems. In doing so, it establishes systemwide condition measures that can be used by MDOT, the industry, and policy-makers to evaluate the results of state and Federal investments in transit. The report describes findings relative to best practices associated with transit system condition measures and identifies performances measures based on the State’s four major goal areas: Stewardship, Safety and Security, System Improvement, and Efficient and Effective Operations. A Data Evaluation Matrix offers a helpful summary of the relevance of data, how often data is reported, and the method by which MDOT will collect data.
Michigan Governor’s Dashboard
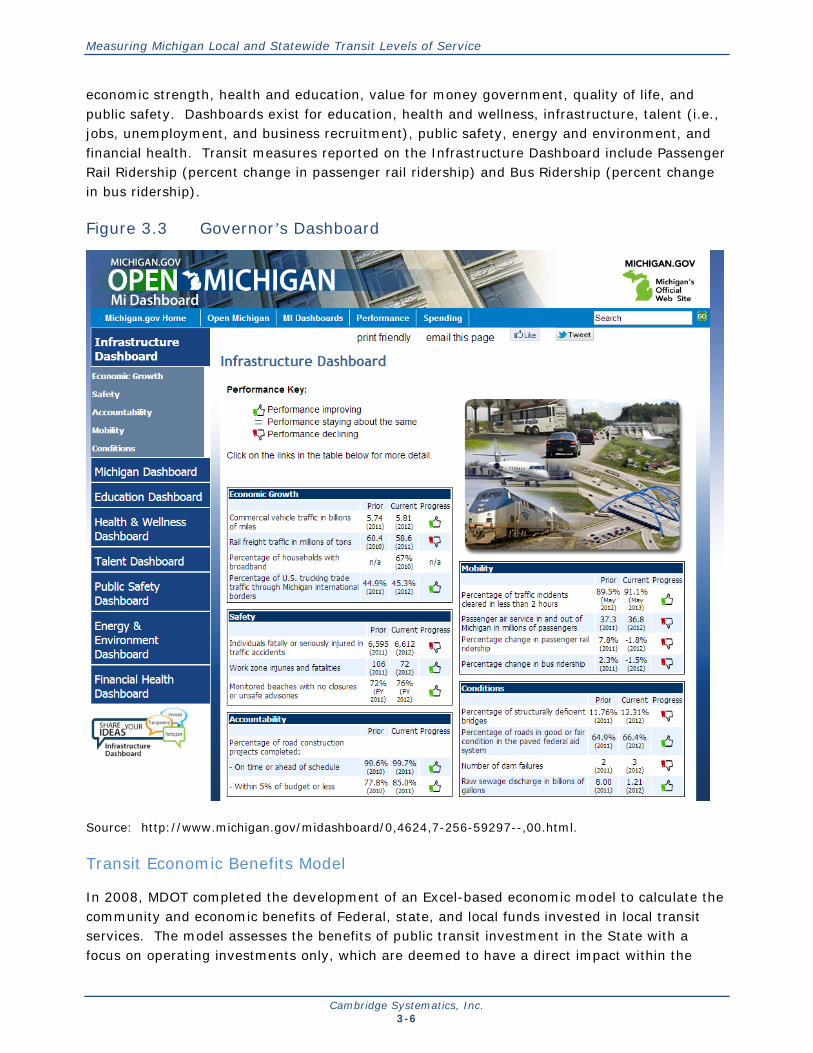
Michigan has developed a series of dashboards providing measures of the State’s performance in a broad range of areas. These measures are updated annually and made available on-line. On the main page, progress is illustrated as improving, staying the same, or declining. Additional detail is provided by clicking on each measure. The Michigan Dashboard4 tracks
2 https://www.michigan.gov/documents/mdot/MDOT_DrivenExcellenceReport_323894_7.pdf. 3 http://www.michigan.gov/documents/mdot/SystemsConditionMeasurementsFinalReport_321891_7.pdf. 4 http://www.michigan.gov/midashboard.
Cambridge Systematics, Inc. 3-5
Measuring Michigan Local and Statewide Transit Levels of Service
economic strength, health and education, value for money government, quality of life, and public safety. Dashboards exist for education, health and wellness, infrastructure, talent (i.e., jobs, unemployment, and business recruitment), public safety, energy and environment, and financial health. Transit measures reported on the Infrastructure Dashboard include Passenger Rail Ridership (percent change in passenger rail ridership) and Bus Ridership (percent change in bus ridership).
Figure 3.3 Governor’s Dashboard
Source: http://www.michigan.gov/midashboard/0,4624,7-256-59297--,00.html.
Transit Economic Benefits Model
In 2008, MDOT completed the development of an Excel-based economic model to calculate the community and economic benefits of Federal, state, and local funds invested in local transit services. The model assesses the benefits of public transit investment in the State with a focus on operating investments only, which are deemed to have a direct impact within the
Cambridge Systematics, Inc. 3-6

Measuring Michigan Local and Statewide Transit Levels of Service
State and/or a specific community. The Transit Economic Benefits Model5 is a helpful tool for generating values for the economic benefits of transit investment, though it has a focus on cost effectiveness that may not match with MDOT’s goals in LOS measurement.
MI Transportation Plan (2035 State Long-Range Transportation Plan)
The MI Transportation Plan (MITP)6, the state long-range transportation plan, was most recently updated in September 2012. The 2035 MITP reaffirms the policy framework of the previous plan and readopts the vision, goals, objectives, strategies, focus on Corridors of Highest Significance, and decision principles guiding program development. This revision serves as an interim step to keep the State’s plan current. The 2035 MITP also includes 18 newly published White Papers, including documents specific to transit, intercity bus service, and intercity passenger rail service. The transit white paper recounts ridership and passenger information found in the Transportation System Condition Report. The white paper also reports on vanpooling and transit under development. No additional performances measures are recorded or reported in the MITP. The intercity bus service white paper includes a section on performance measurement, though the focus of the section is on the demographic profile of riders and passenger satisfaction. The intercity passenger rail service white paper documents numerous funding considerations but lacks specific performance measures.
MI Travel Counts
The MI Travel Counts7 study aims to improve the State’s transportation system by providing accurate data inputs used to estimate future travel in Michigan. The estimates inform the planning, alternative analysis, and prioritization of transportation projects. The first round of travel counts occurred in 2005 with follow-up counts conducted in 2009. The second round collected travel data from a subset of households which responded to the 2005 counts, allowing transportation officials to gauge how household travel has changed in Michigan during that time period. The subsequent report provides unweighted and weighted analysis of data. Objectives of this process include:
5 http://michigan.gov/mdot/0,4616,7-151-9625_21607-271057-,00.html. 6 http://www.michigan.gov/documents/mdot/MDOT_2035MIPlan4approval_398932_7.pdf. 7 http://www.michigan.gov/mdot/0,1607,7-151-9615_51690--,00.html.
Cambridge Systematics, Inc. 3-7
Measuring Michigan Local and Statewide Transit Levels of Service
• Understanding changes in household travel behavior characteristics
• Determining whether the surveys support the observed reduction in travel as reflected in changes in traffic volumes in the recent years
• Examining changes in household socioeconomic characteristics and their impacts on observed travel behavior
The Comparison Report discloses the modal distribution of trips by sample area. However, the small sampling of this data at the household level and the infrequent updates makes it less relevant for transit LOS considerations as part of this study.
3.2 Local Transit Agency LOS Measures
There are 78 transit agencies operating in Michigan. These agencies provide a variety of services, ranging from heavily urban fixed-route bus and rail transit (with proposed commuter rail and light rail) to demand responsive transit service in rural areas. Additional intercity and interstate services are provided by Amtrak and private bus companies.
While each agency is motivated to monitor its performance, the measures used vary from agency to agency. Many agencies lack the resources and staff to develop custom measures or implement detailed LOS measures. Several monitor performance solely using the data submitted to the NTD and Rural NTD and to MDOT as part of the Public Transportation Management System (PTMS). PTMS includes information from all transit operators in the State.
The focus of this analysis is to identify some of the local agency measures being used to evaluate their suitability as potential building blocks for statewide transit LOS measurements.
Required Data Sharing
Each local transit agency is required to collect and submit asset and operational data by the State of Michigan. MDOT’s PTMS data is largely oriented towards asset management (capital and operating budget requests, vehicle inventory, and budgeted, quarterly, annual and audited financial data as reported by the transit agencies). The NTD and Rural NTD are the FTA’s primary databases for statistics on the nation’s transit network. Recipients of Urbanized and Nonurbanized Area Formula Program Funds are required to submit NTD data. These data include operating characteristics, service characteristics, capital revenue and assets, and financial operating statistics.
It is important to note that a prerequisite in MDOT’s vision for statewide transit LOS measures is that there should be no increase in the burden of data collection and compilation that transit agencies currently face. Therefore, any new or adapted measures are intended to rely on existing data, data that can be combined with other easily collected sources, or new data with little or no collection burden.
Cambridge Systematics, Inc. 3-8
Measuring Michigan Local and Statewide Transit Levels of Service
Local Agency Measures
The review of current practices measuring transit level of service focused on outward-facing measures used to report LOS to stakeholders, decision-makers, and the general public. The study team also conducted outreach to selected MDOT partners who represent a cross section of urban and rural providers to identify measures used internally.
Some of the most relevant findings and examples are summarized below.
Urbanized Public Transit Agencies
Michigan’s urban public transit agencies frequently use performance measures as part of their annual and long-range planning. Most of these measures, however, deal with the supply (output) of transit services (ridership, vehicle miles, and vehicle hours) and cost efficiency. A few agencies provide more detailed measures which get nearer to providing LOS measures. Some examples include:
• Ann Arbor Transportation Authority posts annual operating statistics on their web site, including ridership, service hours, passenger per service hour, average number of weekday passengers, average operating expense per passenger, subsidy per passenger, and percent cost paid by passenger.
• Capital Area Transportation Authority (CATA) in the greater Lansing region publishes an annual report tracking the services and programs it provides. The report includes ridership by mode and overall finances of the agency.
• The DDOT Service Quality and Systems Management Report is an annual update to DDOT’s standards that govern service planning and delivery. The publication is a tangible expression of the system’s desire to instill efficient methods that “benefit the common good of the public and the transit communities.” The system captures a series of performance measures that track on-time performance, maintenance, and customer satisfaction. In particular, the system reports bus on-time performance, mean distance between failures (bus miles by chargeable service calls), bus in-service delays, on-time pullouts, total service calls, and bus customer complaints. Bus service delivery standards also seek to manage headway times and load factors. In addition, route productivity is captured through a series of standard metrics, including passengers per revenue hour, passengers per revenue mile, cost per passenger, passengers per trip, and farebox recovery. As stated in the annual report, “Adherence to these standards ensures ongoing quality and system integrity.”
• Detroit Metro SMART publishes annual financial reports and posts them on their web site. They also have annual reports, though the most recent is from 2009, which include some measures intended to make the case for transit, such as the results of a survey showcasing interest from ITT Technical Institute students in taking transit.
Cambridge Systematics, Inc. 3-9

Measuring Michigan Local and Statewide Transit Levels of Service
Figure 3.4 MTA Performance Indicators
Source: http://mtaflint.org/docs/2015-2020%20Narrative.pdf.
Cambridge Systematics, Inc. 3-10

Measuring Michigan Local and Statewide Transit Levels of Service
• The Mass Transportation Authority (MTA) serves Flint. In the MTA Five-Year Plan, the agency summarizes its performance indicators, which are established each year as part of the Planning, Programming, and Budgeting Process. The indicators are calculated quarterly to measure the results of efforts to increase service utilization, accessibility and quality; to promote cost efficiency, operating and maintenance efficiency; to improve vehicle utilization and labor productivity. In FY 2014, MTA reports on 14 performance measures, shown in Figure 3.4. They differentiate between fixed route and demand responsive service for each measure.
• The Rapid in Grand Rapids uses several performance measures to advocate for the system’s effectiveness and value in its 2010 Transit Master Plan (http://www.ridetherapid.org/assets/files/6u/tmp%20phase%20one%20improvements.pdf).
• The Macatawa Area Express provides statistics on its web site to advocate for transit in a “Benefits to the Community” section (http://www.catchamax.org/about-us.html). These include the impacts of transit on the local economy and property values.
• Midland Dial-a-Ride provides a few performance measures through its budget report, including ridership by demographic, vehicle miles driven, cost per passenger, and revenue per passenger.
Nonurbanized Public Transit Agencies
The majority of the nonurbanized public transit agencies do not publish performance measures. Those that do publish measures generally rely on the same statistics reported to the Rural NTD (ridership, vehicle hours, vehicle miles). Some examples of nonurbanized public transit agency measures include:
• Allegan County Transportation produces an annual report that includes vehicle miles, ridership by demographic, and financials.
• Clare County Transit Corporation, through its on-line annual report, provides ridership by demographic, vehicle miles driven, vehicle hours, gallons of fuel consumed, fleet size, and finances.
• Delta Area Transit Authority (DATA) actively collects and tracks performance based on passengers per hour, passengers per mile, total passengers, vehicle miles traveled per gallon of fuel, and fare revenue per passenger. To account for seasonal variations, the system tracks total passengers each month for comparison to previous years. Vehicle miles traveled per gallon of fuel and fare revenue per passenger are calculated annually. Fare revenue specific to contracts also is calculated annually on a per passenger basis. DATA identified trips per capita and the local share of operating revenue as valid measures for comparing systems with diverse sized population and service areas. Because DATA shares executive leadership with neighboring Schoolcraft County Public Transportation, the systems use the same performance measures.
Cambridge Systematics, Inc. 3-11
Measuring Michigan Local and Statewide Transit Levels of Service
3.3 Summary of Findings
This review of Michigan sources and local transit agencies reveals few existing LOS measures. The measures in MDOT’s Transportation System Performance Measures Report are established measures that provide a baseline for LOS. Other measures may be able to be calculated using data found in the NTD and Rural NTD, Michigan’s PTMS system, and the other sources reviewed in this section.
Some local transit agencies collect and report performance measures, but these measures vary widely between agencies and a majority of the agencies do not publish any such measures. No local transit agencies have advanced much further than MDOT’s efforts in determining LOS based on more advanced measures.
An understanding of the reporting mechanisms used for performance reporting in Michigan, including the Governor’s Dashboard, local agency annual reports, the Transportation System Condition Report, and others, provides helpful context for the potential development of transit LOS measures.
Cambridge Systematics, Inc. 3-12

Measuring Michigan Local and Statewide Transit Levels of Service
4.0 Michigan Transit Data Assessment This section summarizes an assessment and compilation of applicable Michigan transit data. These data support the development, application, and review of recommended transit LOS measures. The Michigan transit data assessment helps identify where there is data to support potential measures, and, just as importantly, where there is not.
4.1 National and Statewide Transit Data
There are several national and statewide transit data resources that were reviewed and have the benefit of being universal. They generally cover all 78 transit agencies (or in the case of the NTD and Rural NTD, cover them all when combined). The data requirements, submission standards, and workflows are well established and mature. Use of national and statewide data would not create any new data collection and sharing burdens among the transit agencies. MDOT can compile these data easily. These are generally strong resources, with the obvious limitation being that they are limited to only certain data items and those items are frequently at a service area level.
4.1.1 MDOT’s Public Transit Management System
Michigan DOT’s Public Transit Management System (PTMS) is a database of information on transit agencies in Michigan. It is collected and updated annually by staff at MDOT. PTMS covers Michigan’s 78 agencies. For collection purposes, the data are broken down in 94 separate units, as some agencies provide multiple types of service. The collected data includes:
• Agency information, including agency type, service area population, number of days operated, and number of routes;
• Vehicle statistics, including number of vehicles and hours and miles of service, and fuel consumption;
• Ridership data, including passengers and passengers by type;
• Financial data, including revenue sources and farebox recovery; and
• Safety data, including injuries and number of accidents by type.
The PTMS data has several strengths, including consistent data across all transit agency types and in-house control of the data.
There are some weaknesses with PTMS data. Certain data items which would be helpful are not present, such as a detailed description of each service area. The data is only publically available for download in.pdf format on-line, although this is not an issue for MIDOT internally created measures.
Cambridge Systematics, Inc. 4-1

Measuring Michigan Local and Statewide Transit Levels of Service
While there are limitations to PTMS data, it can provide a strong foundation to certain transit LOS measures. It is easy to use and does not create an increased data burden on transit agencies if used in its present form.
4.1.2 National Transit Database
The National Transit Database (NTD) is a compilation of data from transit agencies in large cities in the United States. The NTD was established by Congress to be the Nation’s primary source for information and statistics on the transit systems of the United States. Recipients or beneficiaries of grants from the Federal Transit Administration (FTA) under the Urbanized Area Formula Program (§5307) or Other than Urbanized Area (Rural) Formula Program (§5311) are required by statute to submit data to the NTD.8
The NTD consists of a series of spreadsheets with information about each agency, including:
• Agency location and contact information;
• Quantity of service provided by mode;
• Capital and operating expenses;
• Revenue by source;
• Vehicle inventory;
• Facility information; and
• Employee counts.
This information is collected on an annual basis. The NTD is freely available for download on-line and relatively easy to use in analysis.
4.1.3 Rural National Transit Database
The Rural National Transit Database (Rural NTD) is similar to the National Transit Database, but for small agencies. This data also is collected on an annual basis, with reporting mandatory for recipients of Federal funds. A more limited set of information is collected in the Rural NTD, which includes:
• Agency location and contact information;
• Revenue vehicle inventory;
• Service data;
8 http://www.ntdprogram.gov/ntdprogram/ntd.htm. Accessed 5/22/2014.
Cambridge Systematics, Inc. 4-2

Measuring Michigan Local and Statewide Transit Levels of Service
• Financial data;
• Safety data; and
• Facilities and resources.
Since the data fields in the NTD and Rural NTD are not always consistent, there are challenges in creating a combined database that can be analyzed consistently for both small and large transit agencies in the State.
4.1.4 National Socioeconomic Data Sources
Several of the potential transit LOS measures identified in Section 2.0 involve use of service area socioeconomic data. Luckily, socioeconomic data are readily available from several national data resources.
The American Community Survey (ACS) is a national survey of population and socioeconomic data in the United States. Data is available at many geographic levels, ranging from the State to counties to Census blocks. For the purposes of this study, the five-year estimates from 2008-2012 were compiled and reviewed to provide the highest level of geographic detail and statistical significance.
The following socioeconomic data were compiled and reviewed from the ACS at the county level:
• Population;
• Gender;
• Age distribution;
• Race;
• Housing units;
• Employment status;
• Commute mode;
• Occupation; and
• Income.
The ACS data represents the most complete and reliable publically available information on population and household socioeconomic conditions.
Cambridge Systematics, Inc. 4-3

Measuring Michigan Local and Statewide Transit Levels of Service
4.2 Local Agency Transit Data
Local agencies in Michigan were surveyed to better understand how LOS is measured and reported across the State and among agencies of varying sizes and complexities. The survey included basic questions about what LOS measures are in use and what additional data (if any) is collected by agencies about their transit services.
4.2.1 Local Agency Data Collection Overview
The review of local agency data occurred in two phases: 1) phone interviews were conducted with a selection of MPOs and local transit agencies to identify data issues and opportunities; and 2) a web-based data collection survey was administered to every local transit agency in Michigan.
Phone Interviews
Two MPOs, the Michigan Association of Transportation Systems (MASSTrans), and seven local agencies representing fixed route and demand responsive services were identified for phone interviews. Interviews began with MPOs and MASSTrans contacts who are part of the steering committee for this research project or have been identified as transit data leaders.
• Tri-County Regional Planning Commission – Paul Hamilton.
• Michigan Association of Transportation Systems (MASSTrans) – John Drury.
• Southeast Michigan Council of Governments (SEMCOG) – Alex Bourgeau.
These interviews focused on available data, data format and collection issues, and future directions in data collection and use. MPTA was not interviewed because several large urban transit agencies that are MPTA members were interviewed. Following the discussions with the MPOs and MASSTrans, the seven agencies listed in the Table 4.1 were contacted. The agencies selected were based on their geographic distribution across the State as well as service type and agency size.
Cambridge Systematics, Inc. 4-4
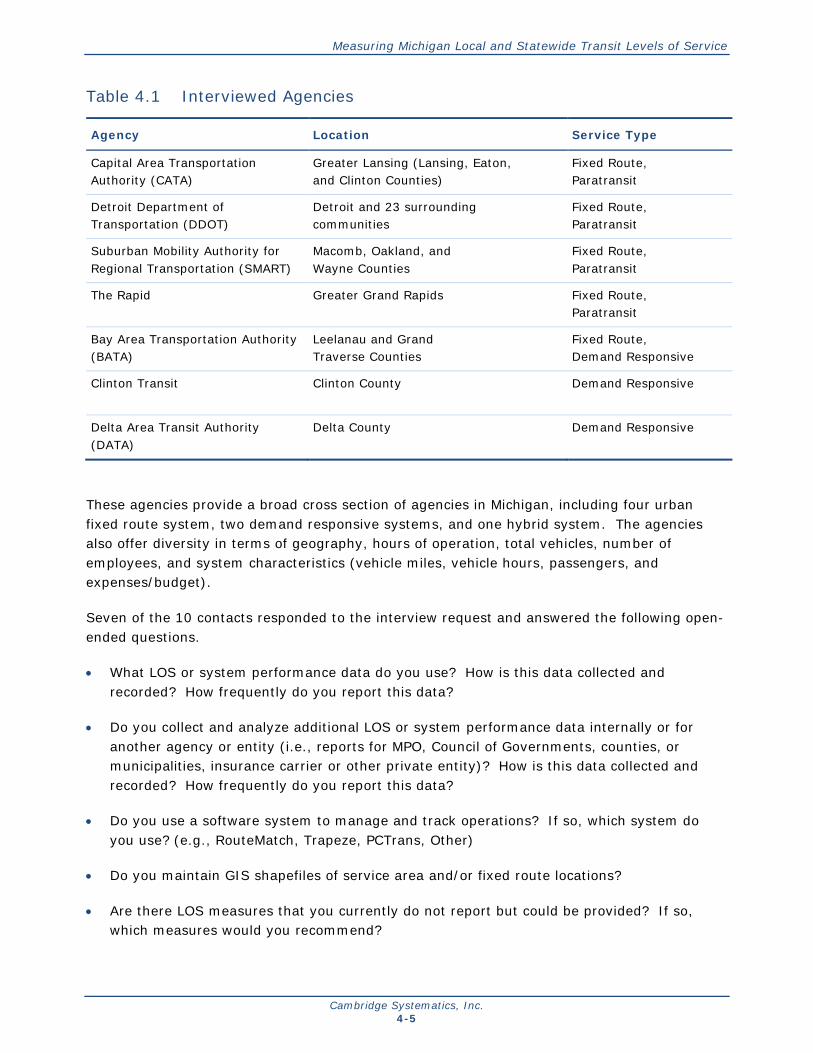
Measuring Michigan Local and Statewide Transit Levels of Service
Table 4.1 Interviewed Agencies
Agency Location Service Type
Capital Area Transportation Authority (CATA)
Greater Lansing (Lansing, Eaton, and Clinton Counties)
Fixed Route, Paratransit
Detroit Department of Transportation (DDOT)
Detroit and 23 surrounding communities
Fixed Route, Paratransit
Suburban Mobility Authority for Regional Transportation (SMART)
Macomb, Oakland, and Wayne Counties
Fixed Route, Paratransit
The Rapid Greater Grand Rapids Fixed Route, Paratransit
Bay Area Transportation Authority (BATA)
Leelanau and Grand Traverse Counties
Fixed Route, Demand Responsive
Clinton Transit Clinton County Demand Responsive
Delta Area Transit Authority (DATA)
Delta County Demand Responsive
These agencies provide a broad cross section of agencies in Michigan, including four urban fixed route system, two demand responsive systems, and one hybrid system. The agencies also offer diversity in terms of geography, hours of operation, total vehicles, number of employees, and system characteristics (vehicle miles, vehicle hours, passengers, and expenses/budget).
Seven of the 10 contacts responded to the interview request and answered the following open-ended questions.
• What LOS or system performance data do you use? How is this data collected and recorded? How frequently do you report this data?
• Do you collect and analyze additional LOS or system performance data internally or for another agency or entity (i.e., reports for MPO, Council of Governments, counties, or municipalities, insurance carrier or other private entity)? How is this data collected and recorded? How frequently do you report this data?
• Do you use a software system to manage and track operations? If so, which system do you use? (e.g., RouteMatch, Trapeze, PCTrans, Other)
• Do you maintain GIS shapefiles of service area and/or fixed route locations?
• Are there LOS measures that you currently do not report but could be provided? If so, which measures would you recommend?
Cambridge Systematics, Inc. 4-5

Measuring Michigan Local and Statewide Transit Levels of Service
• How frequently do you believe is most appropriate to assess performance – weekly, monthly, or annually?
The interview responses have been combined with the results of the web-based survey and are summarized in Section 4.2.2.
Web-Based Survey
Following summation of the phone interviews, a customized web-based survey instrument was developed and deployed to 78 transit agencies across the State. Participants were asked to select their agency from a dropdown list at the beginning of the survey to track which agencies completed the survey. The following questions were asked:
• What is the name of your agency/organization?
• What is your name and title within this agency/organization?
• What LOS data do you use? Examples of LOS data include ridership, service hours, service miles, passengers per service hour, on-time performance, etc. Briefly describe the data, how it is collected and reported, and how frequented the date is reported.
• Do you collect and analyze additional LOS or system performance data internally or for an agency or entity aside from Michigan DOT (i.e., reports for Regional Planning Organizations, counties, or municipalities, insurance carrier or other private entity)? If yes, please provide more information.
• Do you use a software system to manage and track operations? If so, which system do you use?
• Are there LOS measures that you currently do not report but could provide? If yes, which measures would you recommend?
• How frequently do you believe is most appropriate to assess LOS?
• Do you maintain GIS shapefiles of your service area and/or fixed routes? If yes, please upload the data.
Responses were received from 23 agencies, representing fixed route and demand response systems. These agencies were:
Cambridge Systematics, Inc. 4-6

Measuring Michigan Local and Statewide Transit Levels of Service
• Ann Arbor • Battle Creek
• Kalamazoo • Livingston
• Midland • Port Huron
• Alma Dial-A-Ride • Benzie Transportation Authority
• Berrien County • Big Rapids Dial-A-Ride
• Cadillac/Wexford Transit Authority • Caro Transit Authority
• Cass County Transportation Authority • Clinton Area Transit System
• Greater Lapeer Transportation Authority • Isabella County Transportation Commission
• Ludington Mass Transportation Authority • Manistee County Transportation
• Ontonagon County Public Transit • Roscommon County Transportation Authority
• Shiawassee Area Transportation Agency • Van Buren Public Transit
• Yates Township Transportation System
4.2.2 Available Local Agency Data Summary
The following bullets summarize pertinent points gathered through the survey processes.
• In most cases, two factors determine what data is collected and reported. Data required to be submitted to the National Transit Database is the main reason data sets are chosen. Secondarily, the operations software (e.g., RouteMatch, Trapeze, PCTrans) often determines what additional data is provided.
• Most agencies cautioned against direct comparisons. One agency suggested performance be measured against goals specific to individual agencies or FTA and MDOT requirements rather than direct comparisons against other systems. Comparisons against goals established on an agency-by-agency basis would be daunting and suffer during changes in leadership at the agency level.
• Numerous agencies that responded to the web-based survey reported collecting data by hand and manually inputting the data into reporting software. Other agencies noted the installation of web-based software was underway. These answers highlight the wide spectrum of sophistication in terms of how transit operations are managed across the various software platforms.
• Definition of performance measures by U.S. DOT that are consistent with MAP-21 requirements is a consideration. MPOs, in particular, are poised to have to adapt their practices to reflect these measures. While LOS measures should be based on these requirements, ongoing changes to Federal legislation could challenge long-term comparisons.
Cambridge Systematics, Inc. 4-7

Measuring Michigan Local and Statewide Transit Levels of Service
• Complexities for assessing transit level of service was recognized even within the same metropolitan regions due to the availability and comparability of data across systems. While it was preferred to establish a comparative framework, MPOs noted having to scale back performance measures to where reportable comparable information was available regionwide.
• Peer comparison – either in-state or nationally – has limitations due to data accounting and reporting issues. Simple comparison to city size or fleet size may lack sufficient detail to effectively identify differences.
• The ideal LOS reporting frequencies (e.g., weekly, monthly, quarterly, or annually) differs by data type.
• In expansive metropolitan areas, the diversity of the service areas, absorption of services by key drivers (e.g., universities, health systems, etc.), and discrepancies in trip distances among urban and rural system make comparative metrics hard to identify.
• Commuting patterns (e.g., in-commute versus out-commute) complicates comparison between agencies.
• One agency suggested comparing passengers per mile rather than passengers per hour given the recording of vehicle miles is more standardized than vehicle hours.
• Tracking no shows and cancellations and addressing deficiencies in these areas could yield large cost savings statewide. However, variations in how data is collected and what policies are in place locally make this process cumbersome.
• On-time performance – and other measures beyond the scope of the NTD – would provide useful comparison points if complexities in data collection and assemblage can be overcome.
• Relative performance can be affected by the amount (absolute or percentage) of mobility-impaired riders.
• At a minimum, comparisons should be limited to those agencies that operate the same service types (e.g., fixed-route, demand response, etc.).
• Additional measures that should be considered include miles per gallon and ratio of riders to the population of the service area.
4.3 Summary of Findings
Transit data on individual transit agency operations is very rich in certain areas. There is plentiful and reliable data on operating expenses, operating characteristics, vehicle fleets, and other transit assets.
Cambridge Systematics, Inc. 4-8

Measuring Michigan Local and Statewide Transit Levels of Service
Transit LOS measurement, however, generally relies on customer experience and perception. Most LOS measures require heavily localized data resources. Unfortunately, these data resources are rarely uniform across two or three transit agencies, let alone an entire state.
The Michigan transit data assessment did not uncover any surprising new data opportunities. It makes the case for MDOT focusing on simple, uniform measures and using the data that are available to craft a useful and compelling story about transit LOS.
Cambridge Systematics, Inc. 4-9


Measuring Michigan Local and Statewide Transit Levels of Service
5.0 Recommended Michigan Transit LOS Measures This section includes recommendations for potential Michigan statewide transit LOS measures that MDOT can realistically and reliably employ in the future to strengthen decision-making. The transit LOS measures must have readily available data, be related to the common goals of transportation agencies, and be easy to understand and use.
5.1 The Context for Michigan Transit LOS Measures
There are several factors to be aware of when identifying transit LOS opportunities. These factors help to limit the field of potential transit LOS measures and focus the outcome of this study on measures that will satisfy MDOT’s needs.
MDOT’s Objectives
MDOT is seeking a simple, reliable set of transit LOS measures that accurately capture and communicate the performance of the transit system and support long-range planning decisions. MDOT is not interested in using transit LOS measures to prioritize funding or compare cost-effectiveness. MDOT is interested in minimizing the burden of data collection and complex analysis for local transit agencies, understanding many have limited resources.
Local Transit Agency Concerns
Local transit agencies expressed concern over increased data collection and sharing burdens. They also are concerned over transit LOS measures being used to compare agency performance without acknowledging the many factors that determine the success of transit services, the vast majority of which are outside of agency control.
Data Limitations
As noted in the Michigan transit data assessment, there are reliable transit data items in the PTMS and NTD/Rural NTD. However, there are no uniform measures of customer experience and perception.
Communication of Transit Needs
Though not discussed explicitly in the prior sections of the report, MDOT has had difficulty communicating transit needs and the benefits of transit. An important outcome of implementing new transit LOS measures would be the ability to clearly communicate and tell the story of transit to key decision-makers.
5.2 Recommended Transit LOS Measures
The research team recommends MDOT use the following transit LOS measures. Reporting of some or all of these measures may support MDOT’s needs in transit LOS measurement. Many of these measures are designed to compare agencies of different sizes with each other, as well
Cambridge Systematics, Inc. 5-1

Measuring Michigan Local and Statewide Transit Levels of Service
as provide the ability to aggregate agencies to the county, region, or statewide level. Linking service data to socioeconomic statistics (service area population, transit dependent population, jobs) enables better comparisons and aggregation. Several of the measures factor include per capita elements.
Table 5.1 Recommended Transit LOS Measures
Performance Measure How It Would Be Used Strengths Weaknesses
Passenger Trips Per Capita
Divide annual passenger trips by service area population
Indicative of service demand, easily understandable
Relies on rough estimation of service area, requires analysis of ACS to update per capita
Vehicle Revenue Hours Per Capita
Divide vehicle revenue hours by service area population
Indicative of service frequency and availability
More effective for DR than FR, does not reward efficiency
Passenger Trips Per Transit Dependent Population
Divide annual passenger trips by service area population determined to be transit dependent
Indicative of service demand for mobility challenged individuals
Relies on rough estimation of service area, requires analysis of ACS to update transit dependent population, requires assumptions for transit dependency
Safety Incidents Per 100k Vehicle Miles
Divide safety incidents (from NTD or PTMS) by vehicle miles
Indicative of safe service
Does not capture security issues, only crashes
Intercity Seat Miles Per Week (statewide)a
Collect intercity schedules from all intercity service providers and multiply by vehicle capacity
Indicative of regional mobility options
Requires data collection, does not account for trip lengths and connectivity, only works at statewide level (not useful for comparing agencies/regions)
a This item is not included in Section 6.0 due to lack of data, but is recommended for future consideration.
Table 5.2 shows one supporting transit LOS measure. This differs from the measures in Table 5.1. It is not as helpful in the tracking of transit LOS at the agency and state levels and tracking progress over time. However, it does support the communication of the story of transit and does provide context for the audience to understand the value of transit.
Table 5.2 Recommended Supporting Transit LOS Measure
Performance Measure How It Would Be Used Strengths Weaknesses
Size of transit dependent population
Determine transit dependent population based on ACS analysis of individuals/ households in poverty, the elderly, and the disabled
Demonstrates latent demand for transit
Does not differentiate between those provided with valid transit options versus others
Cambridge Systematics, Inc. 5-2

Measuring Michigan Local and Statewide Transit Levels of Service
Many measures also were considered but, ultimately, rejected. Not every measure is listed below, but the measures which generated the most discussion include:
• Passenger miles per vehicle revenue hour: This measure would be indicative of service utilization, but it targets agency efficiency more than customer-centric LOS. Several agencies noted that passenger miles are not always a good indicator as even short trips can be valuable to customers.
• Mode share: While it is valuable to understand transit in terms of mode share, this measure is difficult to reliably link to a transit service area. It also reflects the influence of many factors outside of the control of transit agencies.
• Measures including employment: Data on jobs are less readily available than population. Employment data are usually at a less detailed geographic level or are only tied geographically to the residence of the employee.
• Measures utilizing square miles: This includes measures such as “fixed-route density;” these measures may be valuable, but better data are needed and agency comparisons would be difficult without accounting for population density over the area. Per capita measures are more valuable given the wide variety of agency types and communities served.
• Fuel efficiency: It would be possible to measure fuel consumption by passenger. This would be helpful in communicating the value of transit versus single-occupancy vehicle. However, it is more indicative of agency efficiency than customer-centric LOS and requires significant analysis and assumptions.
• Number of employees in transit: This measure has the potential to showcase the role of transit agencies in providing employment for MI residents. However, the relationship between number of employees and LOS is tenuous.
5.3 Transit LOS Gaps
There are some gaps that the measures in Tables 5.1 and 5.2 do not address. These include:
• Proximity to good service: The proposed measures do not tie population to transit service proximity. They also do not differentiate amongst areas of good transit service versus areas of poor transit service. The transit service spatial data are lacking to make this detailed of an analysis on a statewide level.
• Intercity demand: Without reliable ridership data for intercity transit operators, it is difficult to quantify demand for intercity travel. The proposed intercity measure focuses solely on supply of services and only at regional or aggregate statewide levels.
• Security: The security of transit services is an important LOS measure. It requires significant data resources, however, and currently is not reported in a uniform manner. It is a larger issue in urban FR service areas than in rural DR areas.
Cambridge Systematics, Inc. 5-3

Measuring Michigan Local and Statewide Transit Levels of Service
While MDOT has indicated it has no intention of increasing data requirements for Michigan’s transit agencies, it is worth noting where data could be improved in the future to facilitate LOS measurement. Several of the gaps could be resolved with greater data resources. Notably, if data were tied more closely to geography, that would strengthen transit LOS measurement. If agencies provided detailed service boundaries and locations of fixed-route services, this would facilitate more sophisticated spatial analysis and closer links to transit dependent populations.
Cambridge Systematics, Inc. 5-4

Measuring Michigan Local and Statewide Transit Levels of Service
6.0 Findings
6.1 Snapshot of Transit Level of Service in Michigan
This section presents a snapshot of Michigan’s Transit LOS for 2012. Included in the snapshot are 78 transit agencies in total, ranging from large urban agencies to small county or township services providing basic demand-responsive transit. As described in Section 5.0, the LOS measures are designed to compare these agencies with each other and aggregate them to the county, region, or statewide level.
The measures included in the snapshot are:
• Passenger Trips Per Capita;
• Vehicle Revenue Hours Per Capita;
• Passenger Trips Per Transit Dependent Population; and
• Safety Incidents Per 100k Vehicle Miles.
6.1.1 Passenger Trips per Capita
The first LOS measure is annual Passenger Trips per Capita. This measure shows how well transit is utilized relative to the population served. Figure 6.1 shows passenger trips per capita for each transit agency in Michigan. This is plotted against service area population, shown on a log scale for readability, with each agency represented by a circle. This figure shows that agencies across the State see a wide range of passenger trips per capita – from less than one at many agencies to over 40 annual trips per capita. In particular, a handful of larger agencies are doing well by this measure, including DDOT, CATA, RAPID, Ann Arbor, DTC, and Flint. Driven by those well-performing agencies, the trendline shows that as service area population increases, so does passenger trips per capita.
Michigan Statewide Aggregate: Passenger Trips per Capita
9.8
Cambridge Systematics, Inc. 6-1

Measuring Michigan Local and Statewide Transit Levels of Service
Figure 6.1 Passenger Trips per Capita versus Population
6.1.2 Passenger Trips per Transit Dependent Population
A second measure is annual Passenger Trips per Transit Dependent Population. This measure is indicative of service demand for mobility challenged individuals.
Figure 6.2 shows each agency’s passenger trips per transit-dependent population. This results in a similar distribution to the previous measure, with agencies, including CATA, RAPID, DDOT, and Ann Arbor ranking among the highest for this measure.
Michigan Statewide Aggregate: Passenger Trips per Transit
Dependent Population
127
Cambridge Systematics, Inc. 6-2
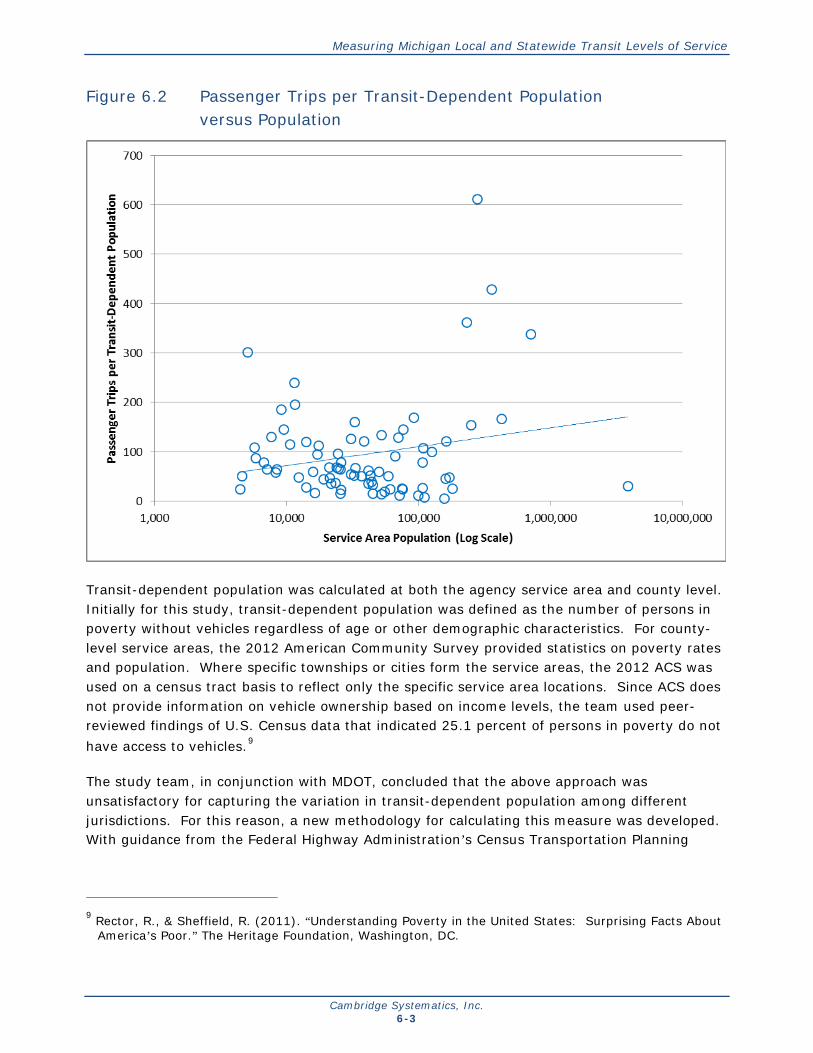
Measuring Michigan Local and Statewide Transit Levels of Service
Figure 6.2 Passenger Trips per Transit-Dependent Population versus Population
Transit-dependent population was calculated at both the agency service area and county level. Initially for this study, transit-dependent population was defined as the number of persons in poverty without vehicles regardless of age or other demographic characteristics. For county-level service areas, the 2012 American Community Survey provided statistics on poverty rates and population. Where specific townships or cities form the service areas, the 2012 ACS was used on a census tract basis to reflect only the specific service area locations. Since ACS does not provide information on vehicle ownership based on income levels, the team used peer-reviewed findings of U.S. Census data that indicated 25.1 percent of persons in poverty do not have access to vehicles.9
The study team, in conjunction with MDOT, concluded that the above approach was unsatisfactory for capturing the variation in transit-dependent population among different jurisdictions. For this reason, a new methodology for calculating this measure was developed. With guidance from the Federal Highway Administration’s Census Transportation Planning
9 Rector, R., & Sheffield, R. (2011). “Understanding Poverty in the United States: Surprising Facts About America’s Poor.” The Heritage Foundation, Washington, DC.
Cambridge Systematics, Inc. 6-3

Measuring Michigan Local and Statewide Transit Levels of Service
Products site,10 the study team chose to focus on household availability of vehicles rather than demographic data to estimate the transit-dependent population. Using ACS five-year averages for 2008-2012, the percentage of households with zero vehicles was obtained at the county level. This percentage was multiplied by the total county populations to yield the transit-dependent population for each county. At the transit agency level, the transit-dependent population was calculated using a weighted average approach. For agencies whose service areas span multiple counties, the zero-vehicle household percentages were weighted based on the constituent county populations, and then multiplied by the service area populations.
6.1.3 Service Hours per Capita
Another measure to highlight is annual Vehicle Revenue Hours (Service Hours) per Capita. This measure is indicative of service frequency and transit availability within a service area. Figure 6.3 presents Service Hours per Capita for each agency in Michigan. In this case, the trendline is downward-sloping: smaller agencies tend to have higher service hours per capita. The two best-performing agencies by this measure include Ludington Mass Transportation Authority and Yates Township. This suggests that there may be economies of scale that denser, larger cities benefit from when providing service.
10 FHWA Office of Planning, Environment, and Realty, “Calculating/Analyzing Transit Dependent Populations Using 2000 Census Data and GIS,” April 2006. http://www.fhwa.dot.gov/planning/census_issues/ctpp/status_report/sr0406.cfm.
Michigan Statewide Aggregate: Service Hours per Capita
0.60
Cambridge Systematics, Inc. 6-4
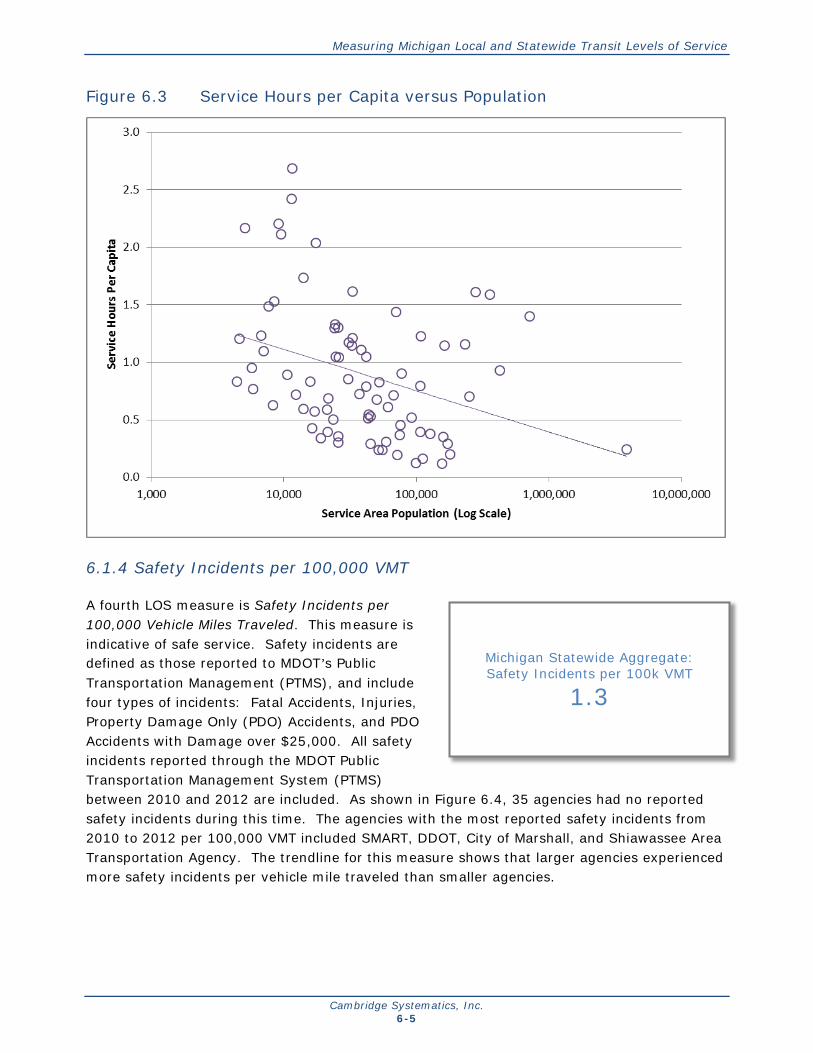
Measuring Michigan Local and Statewide Transit Levels of Service
Figure 6.3 Service Hours per Capita versus Population
6.1.4 Safety Incidents per 100,000 VMT
A fourth LOS measure is Safety Incidents per 100,000 Vehicle Miles Traveled. This measure is indicative of safe service. Safety incidents are defined as those reported to MDOT’s Public Transportation Management (PTMS), and include four types of incidents: Fatal Accidents, Injuries, Property Damage Only (PDO) Accidents, and PDO Accidents with Damage over $25,000. All safety incidents reported through the MDOT Public Transportation Management System (PTMS) between 2010 and 2012 are included. As shown in Figure 6.4, 35 agencies had no reported safety incidents during this time. The agencies with the most reported safety incidents from 2010 to 2012 per 100,000 VMT included SMART, DDOT, City of Marshall, and Shiawassee Area Transportation Agency. The trendline for this measure shows that larger agencies experienced more safety incidents per vehicle mile traveled than smaller agencies.
Michigan Statewide Aggregate: Safety Incidents per 100k VMT
1.3
Cambridge Systematics, Inc. 6-5

Measuring Michigan Local and Statewide Transit Levels of Service
Notably, several agencies serving large populations reported no safety incidents through PTMS between 2010 and 2012. These include CATA, Blue Water Transportation Commission, City of Jackson Transportation Authority, Berrien County, and Saginaw Transit Authority Regional Services.
Figure 6.4 Safety Incidents per 100,000 VMT versus Population
6.1.5 Comparing Passenger Trips per Capita to Service Hours per Capita
In some cases, transit LOS can be analyzed by plotting two of the LOS measures against each other. For example, one can look at the Passenger Trips per Capita measure is to compare it to Service Hours per Capita. In this case, we would expect passenger trips to increase as service hours increased. In Figure 6.5, this is the case, although there are some interesting patterns to be found. In this figure, bubble sizes are proportional to the service area population of each agency. The larger agencies tend to be found above the trendline, showing that their services are being utilized more efficiently than average. Many smaller agencies fall below the trendline, indicating they are providing a basic level of service that while not being heavily utilized, is filling a need for their constituents.
Cambridge Systematics, Inc. 6-6

Measuring Michigan Local and Statewide Transit Levels of Service
Figure 6.5 Passenger Trips per Capita versus Service Hours per Capita
Bubble size Proportional to
population
Cambridge Systematics, Inc. 6-7
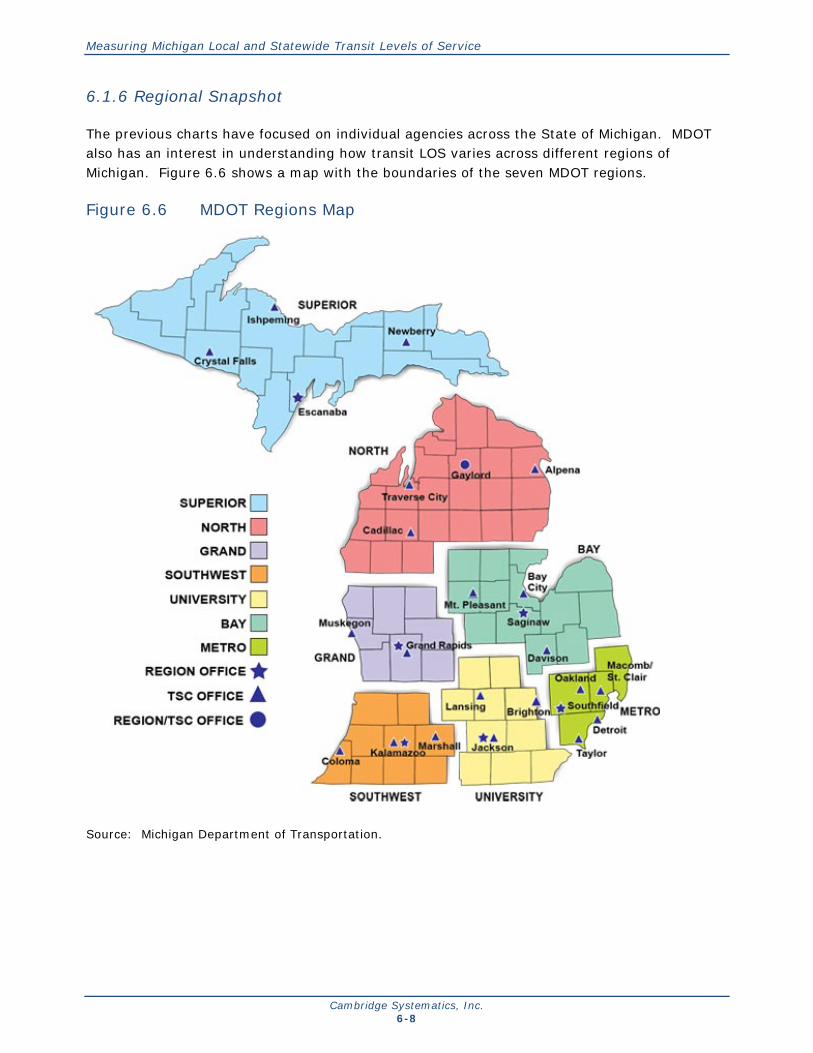
Measuring Michigan Local and Statewide Transit Levels of Service
6.1.6 Regional Snapshot
The previous charts have focused on individual agencies across the State of Michigan. MDOT also has an interest in understanding how transit LOS varies across different regions of Michigan. Figure 6.6 shows a map with the boundaries of the seven MDOT regions.
Figure 6.6 MDOT Regions Map
Source: Michigan Department of Transportation.
Cambridge Systematics, Inc. 6-8

Measuring Michigan Local and Statewide Transit Levels of Service
When aggregated to the regional level, the patterns and distribution of the Transit LOS measures across the State become more apparent. Figure 6.7 provides a 2012 snapshot of Transit LOS measures by MDOT region.11
In the box-and-whisker charts on the left of Figure 6.7, the range of each measure (minimum and maximum) within a region is represented by the dot on the bottom and top. The thicker boxes in the middle represent the 25th to 75th percentile range of agencies within each region. These charts help to show the range and distribution of the measures within each region. The column charts on the right represent the weighted calculation of the measure for the overall region, with all agencies aggregated within the region.
The Metro and University regions measure the highest on the Passenger Trips per Capita and Passenger Trips per Transit-Dependent Population measures. They also show large ranges on these measures for the agencies within these regions.
For the Vehicle Revenue Hours per Capita measure, most of the regions are close to each other, although the Metro and Southwest regions stand out as being lower on this measure.
Finally, the graph of Safety Incidents per 100,000 VMT shows that the reported safety incidents from 2010 to 2012 were heavily concentrated in the Metro region, where two large agencies (SMART and DDOT) both had high-incident rates. Also notable is the Superior region, where only one agency reported any safety incidents from 2010 to 2012.
11 This information has also been compiled for Michigan Economic Development Collaborative Regions and Regional Planning Regions in the accompanying spreadsheet.
Cambridge Systematics, Inc. 6-9

Measuring Michigan Local and Statewide Transit Levels of Service
Figure 6.7 2012 Snapshot of Transit LOS by MDOT Region
Cambridge Systematics, Inc. 6-10
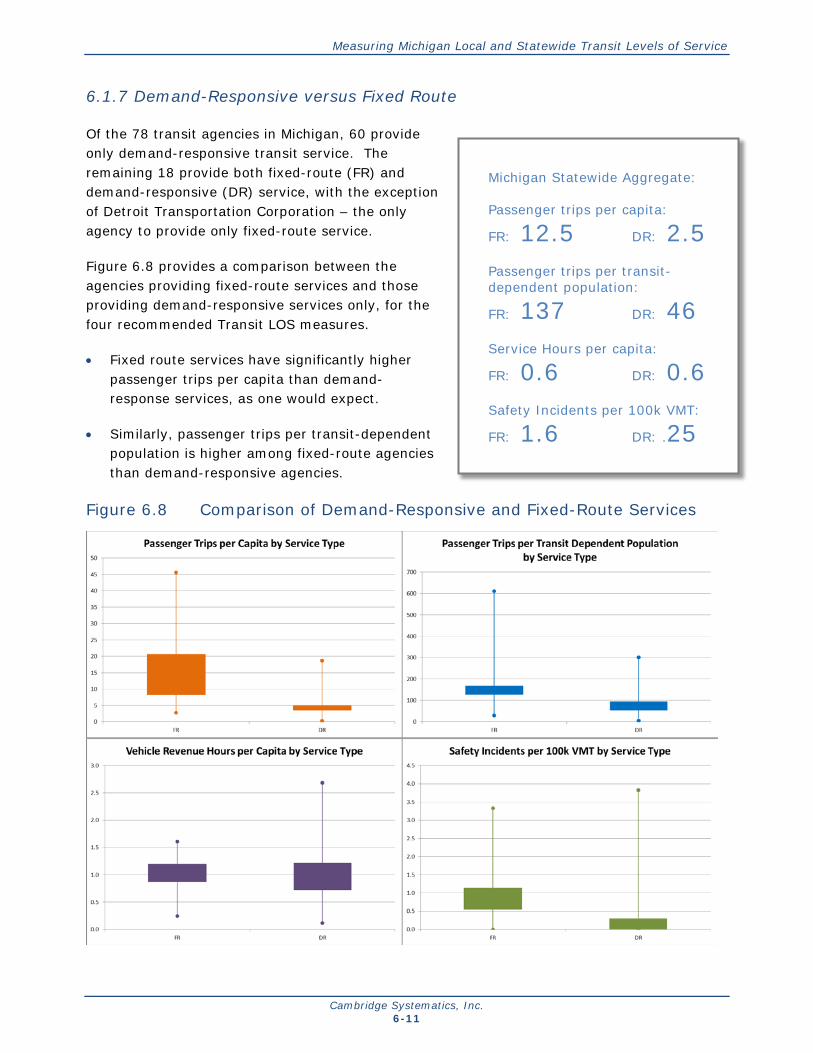
Measuring Michigan Local and Statewide Transit Levels of Service
6.1.7 Demand-Responsive versus Fixed Route
Of the 78 transit agencies in Michigan, 60 provide only demand-responsive transit service. The remaining 18 provide both fixed-route (FR) and demand-responsive (DR) service, with the exception of Detroit Transportation Corporation – the only agency to provide only fixed-route service.
Figure 6.8 provides a comparison between the agencies providing fixed-route services and those providing demand-responsive services only, for the four recommended Transit LOS measures.
• Fixed route services have significantly higher passenger trips per capita than demand-response services, as one would expect.
• Similarly, passenger trips per transit-dependent population is higher among fixed-route agencies than demand-responsive agencies.
Figure 6.8 Comparison of Demand-Responsive and Fixed-Route Services
Michigan Statewide Aggregate:
Passenger trips per capita:
FR: 12.5 DR: 2.5 Passenger trips per transit-dependent population:
FR: 137 DR: 46 Service Hours per capita:
FR: 0.6 DR: 0.6 Safety Incidents per 100k VMT:
FR: 1.6 DR: .25
Cambridge Systematics, Inc. 6-11
Measuring Michigan Local and Statewide Transit Levels of Service
• Vehicle revenue hours per capita are very similar between FR and DR agencies, although DR shows a wider spread among agencies for this measure.
• Safety incidents per 100,000 vehicle miles traveled is an area where demand-responsive services are performing better than fixed-route agencies in Michigan.
Many of the differences in Transit LOS measures between agencies providing fixed route service and demand-responsive service are likely attributable to differences in size and density of service area population.
6.2 Transit LOS Measurement Tool
In addition to providing an initial assessment of transit LOS in Michigan, the team explored the feasibility of developing a transit LOS measurement tool. To this end, the team developed a vision for a web application and implemented a prototype, known as wireframes, to illustrate the concept of the Transit LOS tool.
6.2.1 Prototype Concept
The transit LOS database developed as part of this project contains a wealth of information. Authorized transit professionals should be able to:
• Access the transit data via a web-based application;
• View the data by region/county or transit agency;
• Filter the data based on spatial location and attributes; and,
• Analyze the data in a variety of intuitive manners using maps, charts, and tables.
The wireframes were developed using the HotGloo12 wireframing tool and published at: http://ags.camsys.com/wireframes/MDOTTransitLOS
These wireframes illustrate the workflow of the proposed application. While they are designed to appear as if they are a fully functional application, they are, in fact, a sequenced set of animated pages. To ‘execute’ wireframes, the user clicks on any widget (e.g., button, label, etc.) highlighted in yellow, while the icons provide additional information when clicked upon.
Access
For illustration purposes and to provide context, the prototype application was integrated into the main MDOT web site. The application could as easily be integrated into other web sites or even be deployed as a standalone web application.
12 http://www.hotgloo.com/.
Cambridge Systematics, Inc. 6-12

Measuring Michigan Local and Statewide Transit Levels of Service
Framework
The main page allows the user to select whether to analyze the data via Agencies or Counties by selecting the appropriate tab as illustrated in Figure 6.9.
Figure 6.9 Wireframes Main Page
Regardless of the selected analysis grouping, for consistency of design the page is divided into the same panel layout:
• Chart. The chart panel displays user-selected attributes as either a bar chart or scatter plot. For bar charts, the average or median value could be illustrated, while a regression line could be displayed on the scatter plots to indicate trends. Users will be able to export the charts to an image file for inclusion in third-party applications.
• Map. To determine spatial patterns, the user-selected attribute are overlaid on the map as a color-classified layer. The map also will allow users to:
− Identify displayed data;
− Export the map to an image file for inclusion in third-party applications; and
− Spatially select agencies and counties to be used as part of the data filter.
• Table. The table displays the attributes for each selected agency/county together with a summary line giving field averages (mean/median/mode as appropriate) for the selected agencies/counties. Users can sort the table by any of the fields and export the table to allow opening in third-party application (e.g., Microsoft Excel).
To allow users to focus the analysis on a subset of the agencies or counties, they can filter the data based on:
• One or more agencies or counties.
• Attribute (e.g., area type, county population range, number of agency riders/vehicles, etc.).
Cambridge Systematics, Inc. 6-13

Measuring Michigan Local and Statewide Transit Levels of Service
• Region (e.g., Economic Development Collaborative Region, MDOT region, Regional Planning Region, etc.).
• Performance measure range.
The Filter Dialog is illustrated in 6.10.
Figure 6.10 Filter Dialog
6.2.2 Development
Approach
The development of the Transit LOS tool provides MDOT with the opportunity to implement a modern, flexible analysis tool. We recommend that the tool be developed:
• Following an iterative, user-centered approach to software development, which ensures that functional requirements are met, exposes risk early, makes progress more transparent and predictable, and encourages continuous testing;
• Using modern technologies that will provide the ability to easily extend the application in the future;
Cambridge Systematics, Inc. 6-14
Measuring Michigan Local and Statewide Transit Levels of Service
• With a system architecture that will easily adapt to different IT infrastructures and deployment environments; and
• Based on a flexible application framework that leverages a proven user interface.
For example, some developers use a standardized process for all software projects, based on principles of user-centric design and incremental, iterative development. This approach to software development ensures that functional requirements are met, exposes risk early, makes progress more transparent and predictable, and encourages continuous testing. Iterative development means that software is constructed through a series of iterations, with each one, including additional functionality until the product is complete. Quality assurance and testing activities are integrated fully into each iteration, so that the product of each iteration is a stable, integrated and tested software product.
Development Tasks
It is recommend that the effort to implement the Transit LOS tool be organized into a series of tasks similar to those described below.
Development Task 1 – Requirements
Refine and validate the Transit LOS tool, including the development of prototype applications, as illustrated above. The finalized requirements should be documented in a concise Requirements Report which should define all user roles and summarize all planned functionality in bullet-point form.
Development Task 2 – System Design
Develop a System Design Report that provides technical documentation of the application tools architecture, database, integration approach, analytic components, user interface, support and system administration procedures, and other items, as appropriate.
Development Task 3 – Acceptance Tests
Define a set of test cases for each requirement. These test cases should be documented in an Acceptance Test Report that could be used by Michigan DOT to confirm the final application meets the requirements.
Development Task 4 – Development and Testing
Using the iterative approach described above, the required functionality should be implemented over a series of iterations. Prior to the start of development, a Software Iteration Plan should be developed to identify, at a high level, which features are planned for each iteration.
At the end of each iteration the developers should:
• Demonstrate the software to Michigan DOT for comment;
Cambridge Systematics, Inc. 6-15

Measuring Michigan Local and Statewide Transit Levels of Service
• Make the iteration available for field testing by project stakeholders; and
• Provide an updated plan for the subsequent iteration.
As part of each iteration, any defects identified in the previous iteration should be addressed and resolved.
Development Task 5 – Deployment
Once the Transit LOS tool has successfully passed the Acceptance Tests defined in task 3, the application needs to be hosted at a permanent location designated by Michigan DOT.
Development Task 6 – Documentation
A User Guide, System Administrator Guide and a finalized System Design Report should be developed describing all aspects of the tool.
Development Task 7 – Training
Michigan DOT staff should be trained in the use of the tool.
Development Task 8 – Maintenance and Support
Upon deployment of the Transit LOS tool, maintenance and support should be provided to ensure the correct functioning of the tool. This should include a Maintenance Plan that specifies how issues are reported, logged and resolved.
6.2.3 Applications and Value
As envisioned, MDOT would see significant benefits from development of a transit LOS measurement tool. Based on the currently understood requirements for the Transit LOS tool, it is estimated that the cost of developing the Transit LOS tool would be comparable to a midsized research project, with additional costs for hosting and long-term maintenance.
There are several potential valuable applications of the Transit LOS Tool envisioned above. These could include:
• Reviewing transit LOS on an annual basis. Regular annual reviews with a tool that enables comparison to prior years and identification of transit LOS trends would help MDOT identify which regions are improving and which are not. Certain measures may be lagging in areas. The identification of progress over time could ultimately be linked with other decision factors to identify the causes behind improvement or stagnation.
• Answering queries about transit LOS with greater precision. With a user-friendly tool, MDOT would be able to both ask and answer questions of transit LOS, looking at agency level, regional level, and statewide level with greater ease.
Cambridge Systematics, Inc. 6-16

Measuring Michigan Local and Statewide Transit Levels of Service
• Better communicating the story of transit LOS in Michigan. A tool could support the development of narratives that show the statewide progress in transit LOS.
• Identifying peer agencies in terms of transit LOS performance. Transit agencies are frequently grouped by metrics like service type, fleet size, or service area population. MDOT would have the potential to identify peer agencies in terms of transit LOS and facilitate communication among peer groups.
• Conducting more analysis by geography. The tool as envisioned includes the ability to draw lines on a map and better understand the transit LOS among different regions.
Cambridge Systematics, Inc. 6-17

Measuring Michigan Local and Statewide Transit Levels of Service
7.0 Conclusions and Recommendations Transit LOS can be challenging to measure, particularly on regional and statewide levels. MDOT seeks a simple, reliable set of transit LOS measures that accurately capture and communicate the performance of the transit system and support long-range planning decisions with a minimal burden of data collection and complex analysis.
7.1 Conclusions
Based on the research conducted, the following conclusions are offered:
• Significant research has been conducted in measuring transit LOS. However, national dialogue on transit LOS tends to focus on complex, data-intensive measures that are difficult to apply outside of larger urban areas by agencies which have the budget and expertise for advanced data collection.
• There is no “silver bullet” measure that portrays a complete picture of transit LOS. Therefore, multiple measures are needed to describe the performance of transit in Michigan.
• Data availability is a limiting factor when selecting transit LOS measures to use. With comprehensive, reliable data, more detailed measures can be used. When more limited data are available, transit LOS measures are still possible, but are less illuminating.
• Common fixed-route transit LOS measures for availability include service coverage, frequency, and hours of service. Passenger comfort and convenience can be measured using passenger load factor, on-time performance, and headway adherence, in addition to measures of safety, security, travel time, appearance, and comfort. Utilization and supply can measure the transit provider’s perspective of LOS.
• Demand-responsive services have measures that differ due to the nature of the service: advance reservations, varying routes, and specialized populations. While some measures overlap with the fixed-route measures, they are often defined or calculated differently given different expectations. For availability, measures of demand-responsive transit LOS include response time and service span. Comfort and convenience measure include on-time performance, trip denials, missed trips, and travel time. Utilization and supply measures also are used by transit agencies to track the level of service provided.
• An understanding of the reporting mechanisms used for performance reporting in Michigan, including the Governor’s Dashboard, local agency annual reports, the Transportation System Condition Report, and others, provides helpful context for the potential development of transit LOS measures.
• The review of existing Michigan sources and local transit agencies reveals very limited existing presence of LOS measures. The measures in MDOT’s Transportation System Performance Measures Report represent the low-hanging fruit. These established measures provide a baseline for LOS. Other measures may be able to be calculated using
Cambridge Systematics, Inc. 7-1

Measuring Michigan Local and Statewide Transit Levels of Service
data found in the NTD and Rural NTD, Michigan’s PTMS system, and the other sources reviewed in this report.
• Transit data on individual Michigan transit agency operations is very rich in certain areas. There is plentiful and reliable data on operating expenses, operating characteristics, vehicle fleets, and other transit assets.
• Transit LOS measurement generally relies on customer experience and perception. Most LOS measures require heavily localized data resources. Unfortunately, these data resources are rarely uniform across two or three transit agencies, let alone an entire state. Some of Michigan’s local transit agencies collect and report performance measures, but these measures vary widely between agencies and a majority do not publish any. No local transit agencies have advanced much further than MDOT’s existing efforts in determining LOS based on more advanced measures.
• A review of existing Michigan transit data supports the desirability of MDOT focusing on simple, uniform measures and using the data that are available to craft a useful and compelling story about transit LOS.
• Linking service data to socioeconomic statistics (service area population, transit dependent population, jobs) allows agencies of different sizes and providing service in different settings to be compared with each other on a more equal footing, while allowing for transit LOS measures to be aggregated to county, regional, or statewide levels.
• The following measures have the potential to serve as a foundation for statewide and regional transit LOS measurement:
− Passenger Trips Per Capita. This measure shows how well transit is utilized relative to the population served.
− Vehicle Revenue Hours Per Capita. This measure is indicative of service frequency and transit availability within a service area.
− Passenger Trips Per Transit Dependent Population. This measure is indicative of service demand for mobility challenged individuals.
− Safety Incidents Per 100k Vehicle Miles. This measure is indicative of safe service.
• Intercity Seat Miles Per Week has the potential to support the measures listed above in assessing statewide transit LOS but additional work is needed to develop the data to support it.
• The identified measures do leave some gaps in transit LOS measurement, however, such as:
− Proximity to good service: The proposed measures do not tie population to transit service proximity. They also do not differentiate amongst areas of good transit service versus areas of poor transit service. The transit service spatial data are lacking to make this detailed of an analysis on a statewide level.
Cambridge Systematics, Inc. 7-2

Measuring Michigan Local and Statewide Transit Levels of Service
− Intercity demand: Without reliable ridership data for intercity transit operators, it is difficult to quantify demand for intercity travel. The proposed intercity measure focuses solely on supply of services.
− Security: The security of transit services is an important LOS measure. It requires significant data resources, however, and currently is not reported in a uniform manner. It is a larger issue in urban FR service areas than in rural DR areas.
• Based on an assessment of statewide transit LOS using 2012 data, Michigan produced the following values:
− Passenger trips per capita: 9.8;
− Vehicle revenue hours per capita: 0.6;
− Passenger trips per transit dependent population: 127; and
− Safety incidents per 100k vehicle miles: 1.3.
• There are limited examples of other states measuring transit LOS on a statewide level with a focus on mobility, as MDOT is pursuing. This makes it difficult for Michigan to compare its transit LOS performance to other states.
• Analysis of the statewide transit LOS snapshot at an agency level shows some trends:
− Agencies across the State see a wide range of passenger trips per capita – from less than one at many agencies to over 40 annual trips per capita. In particular, a handful of larger agencies are doing well by this measure, including DDOT, CATA, RAPID, Ann Arbor, DTC, and Flint. Driven by those well-performing agencies, the trendline shows that as service area population increases, so do passenger trips per capita.
− Passenger trips per transit dependent population shows a similar pattern to passenger trips per capita.
− Smaller agencies tended to have higher service hours per capita. This suggests that there may be economies of scale that denser, larger cities benefit from when providing service.
− Larger agencies generally experienced more safety incidents per vehicle mile traveled than smaller agencies.
• Some comparisons by region are possible using the transit LOS measures snapshot:
− The Metro and University regions measure the highest on the passenger trips per capita and passenger trips per transit-dependent population measures.
− For the service hours per capita measure, most of the regions are close to each other, although the Metro and Southwest regions stand out as being lower on this measure.
Cambridge Systematics, Inc. 7-3
Measuring Michigan Local and Statewide Transit Levels of Service
− Safety incidents per 100,000 VMT shows that the reported safety incidents in 2012 were heavily concentrated in the Metro region, where two large agencies (SMART and DDOT) both had higher incident rates.
• Fixed-route services perform better than demand-responsive services for two measures: passenger trips per capita and passenger trips per transit-dependent population. FR and DR services are the same, on average, for the service hours per capita measure. Demand-responsive services have fewer safety incidents per 100,000 VMT on average than fixed-route services do.
• While MDOT has indicated it has no intention of increasing data requirements for Michigan’s transit agencies, it is worth noting where data could be improved in the future to facilitate LOS measurement. Several of the gaps could be resolved with greater data resources. Notably, if data were tied more closely to geography, that would strengthen transit LOS measurement. If agencies provided detailed service boundaries and locations of fixed-route services, this would facilitate more sophisticated spatial analysis and closer links to transit dependent populations.
• This report and its accompanying data snapshot give MDOT the ability to look regionally at transit LOS. Agency level analysis also is possible.
• Development of a transit LOS measurement tool is feasible. It give MDOT the ability to access the transit LOS data via a web-based application, view the data by region/county or transit agency, filter the data based on spatial location and attributes, and analyze the data in a variety of intuitive manners using maps, charts and tables.
• The benefits of having a transit LOS measurement tool may include enabling MDOT to:
− Review transit LOS on an annual basis;
− Answer queries about transit LOS with greater precision;
− Better communicate the story of transit LOS in Michigan;
− Identify peer agencies in terms of transit LOS performance; and
− Conduct more analysis by geography.
Cambridge Systematics, Inc. 7-4

Measuring Michigan Local and Statewide Transit Levels of Service
7.2 Recommendations
The following recommendations are offered for consideration by MDOT:
• Continue tracking the identified measures. The statewide transit LOS snapshot (provided to MDOT in spreadsheet format) offers an easy opportunity to update data and continue monitoring the recommended transit LOS measures to identify trends and track progress.
• Add a measure on intercity transit to the current transit LOS measures. MDOT should be able to provide data for intercity seat miles per week (statewide) or a similar measure that is indicative of regional mobility options for Michigan citizens.
• Monitor transit LOS performance over time. By making an annual process of simple transit service data updates (limiting major recalculations of socioeconomic data), MDOT can revisit transit LOS and see how transit performance is changing over time, and help understand what it can do to improve trends.
• Consider if transit LOS measurement tool development is worthwhile. MDOT can review available resources and explore interest in developing the Transit LOS Tool as envisioned in this report.
• Monitor peer state activities in statewide transit LOS measurement. Michigan is an early adopter in this area, unfortunately, giving them limited current opportunities for benchmarking. MDOT could watch for peer states undertaking similar efforts, encourage them to adopt similar measures or explore comparable methodologies, and then benefit from benchmarking.
• Seek opportunities to share transit LOS results in transportation community and among public agencies. Michigan is a state that is very interested in performance management. Reporting on transit LOS may benefit the state of transit by highlighting the value of continued investment in transit to improve performance. Agencies may benefit from learning about their performance and how it compares to peers.
• Use transit LOS reporting as an opportunity to strengthen data. MDOT has benefited from a detailed assessment of transit data resources, including weaknesses in existing data. MDOT could emphasize to transit agencies the value of accurate reporting in certain areas, such as safety incidents.
• Strengthen geographic data collection. While several agencies maintain geographic data on service area and fixed routes, there is no statewide collection mechanism. Agencies are not encouraged to submit these data and there are no statewide data standards. Advancement of geographic transit data would allow for much greater opportunities for transit LOS analysis and enable more accurate linkage to socioeconomic data.
• Look for peer grouping opportunities based on transit LOS similarities. Transit agencies may be interested to learn more about how they are contributing to statewide transit LOS measures. There may be opportunities for agencies to communicate with peers based on transit LOS similarities rather than more simplistic service characteristics.
Cambridge Systematics, Inc. 7-5

Measuring Michigan Local and Statewide Transit Levels of Service
8.0 Bibliography American Public Transit Association and Federal Transit Authority. Transit Performance Monitoring System (TPMS) Results – Summary Report Phase III. Washington, D.C.: Federal Transit Authority, 2004.
Chicago Regional Transportation Authority. Strategic Performance Measures: 2012 Report, 2012.
Florida Department of Transportation Research Center. Best Practices in Transit Service Planning. National Center for Transit Research Publications, 2009.
Massachusetts Department of Transportation. Beyond Boston: A Transit Study for the Commonwealth, 2012.
Metropolitan Policy Program at Brookings. Missed Opportunity: Transit and Jobs in Metropolitan America, 2011.
Michigan Department of Transportation. Driven By Excellence: A Report on Transportation Performance at MDOT, 2010.
Michigan Department of Transportation. MI Transportation Plan: Moving Michigan Forward (2035 State Long-Range Transportation Plan), 2012.
Michigan Department of Transportation. MI Travel Counts. Accessed September 2014, http://www.michigan.gov/mdot/0,1607,7-151-9615_51690--,00.html.
Michigan Department of Transportation. System Condition Measurement for Local Transit, 2010.
Michigan Department of Transportation. Transit Economic Benefits Model. Accessed September 2014, http://michigan.gov/mdot/0,4616,7-151-9625_21607-271057-,00.html.
Michigan Department of Transportation. Transportation System Performance Measures Report, 2013.
Michigan.gov Open Michigan web site. Measuring Michigan’s Performance. Accessed September 2014, http://www.michigan.gov/midashboard.
Minnesota Department of Transportation. Greater Minnesota Transit Plan 2010-2030, 2009.
National Cooperative Highway Research Program. Research Results Digest 376: Data Needs for Assessing Rural Transit Needs, Benefits, and Levels of Service. Washington, D.C.: Transportation Research Board, 2012.
Racca, David P. Transportation Network Models to Accurately Estimate Transit Level of Service. Paper 1921. University of Delaware, 2004.
Cambridge Systematics, Inc. 8-1

Measuring Michigan Local and Statewide Transit Levels of Service
South Carolina Department of Transportation. South Carolina Statewide Transit Plan, 2008.
Transit Cooperative Research Program. A Guidebook for Developing a Transit Performance-Measurement System. Report 88. Washington, D.C.: Transportation Research Board, 2003.
Transit Cooperative Research Program. Guidebook for Measuring, Assessing, and Improving Performance of Demand-Response Transportation. Report 124. Washington, D.C.: Transportation Research Board, 2008.
Transit Cooperative Research Program. Guidebook for Rural Demand-Response Transportation: Measuring, Assessing, and Improving Performance. Report 136. Washington, D.C.: Transportation Research Board, 2009.
Transit Cooperative Research Program. A Methodology for Performance Measurement and Peer Comparison in the Public Transportation Industry. Report 141. Washington, D.C.: Transportation Research Board, 2010.
Transit Cooperative Research Program. Transit Capacity and Quality of Service Manual. Report 100. 2nd Edition. Washington, D.C.: Transportation Research Board, 2003.
Transit Cooperative Research Program. Transit Capacity and Quality of Service Manual. Report 100. 3rd Edition. Washington, D.C.: Transportation Research Board, 2013.
Washington State Transportation Center (TRAC). Measuring Level of Service and Performance in Public Transportation. Publication Number WA-RD 390.1, 1995.
Cambridge Systematics, Inc. 8-2

Measuring Michigan Local and Statewide Transit Levels of Service
9.0 List of Acronyms
Acronym Spelled Out
§5307 Urbanized Area Formula Program
§5311 Other than Urbanized Area (Rural) Formula Program
ACS American Community Survey
ADA Americans with Disabilities Act
APTA American Public Transit Association
BATA Bay Area Transportation Authority
CATA Capital Area Transportation Authority
CUTR Center for Urban Transportation Research
DATA Delta Area Transit Authority
DDOT Detroit Department of Transportation
DR Demand-Responsive
DRT Demand Responsive Transit
DTC Detroit Transportation Corporation
FR Fixed-Route
FTA Federal Transit Administration
GIS Geographic Information Systems
HCM Highway Capacity Manual
LOS Level of Service
MassDOT Massachusetts Department of Transportation
MASSTrans Michigan Association of Transportation Systems
MDOT Michigan Department of Transportation
MITP Michigan Transportation Plan
MPO Metropolitan Planning Organization
MPTA Michigan Public Transit Association
MTA Mass Transportation Authority
NCHRP National Cooperative Highway Research Program
NTD National Transit Database
PDO Property Damage Only
PTMS Public Transportation Management System
RRD Research Results Digest
Cambridge Systematics, Inc. 9-1
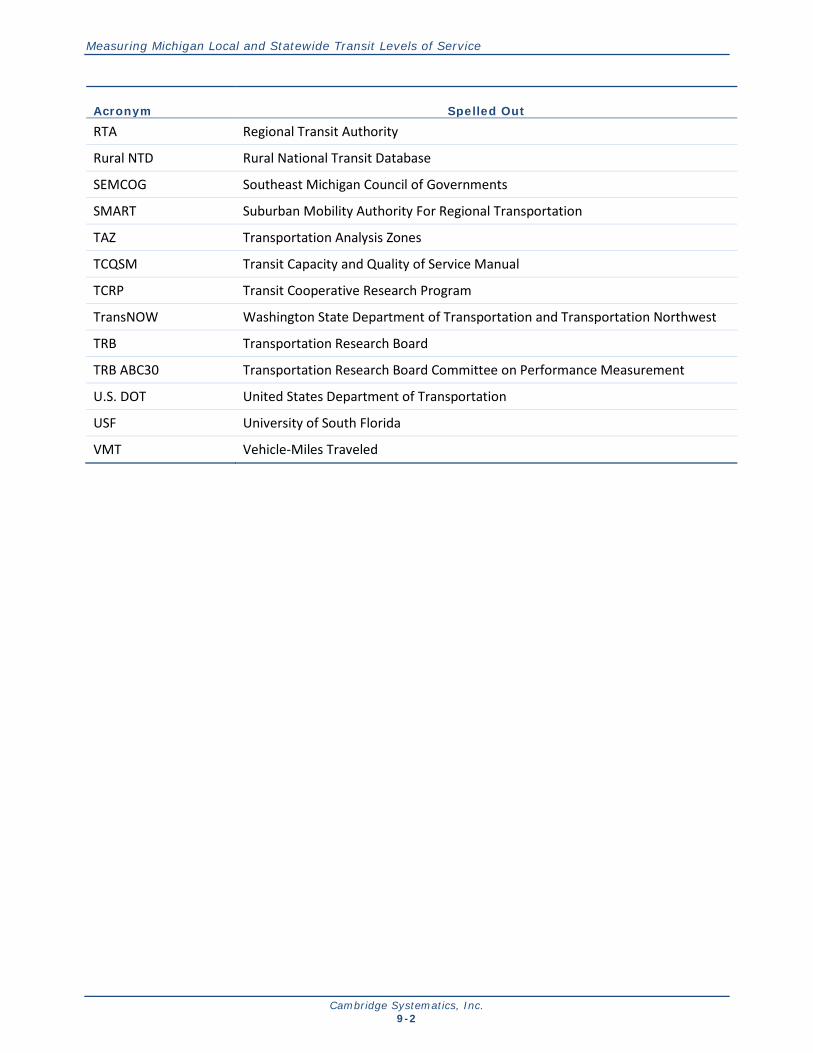
Measuring Michigan Local and Statewide Transit Levels of Service
Acronym Spelled Out
RTA Regional Transit Authority
Rural NTD Rural National Transit Database
SEMCOG Southeast Michigan Council of Governments
SMART Suburban Mobility Authority For Regional Transportation
TAZ Transportation Analysis Zones
TCQSM Transit Capacity and Quality of Service Manual
TCRP Transit Cooperative Research Program
TransNOW Washington State Department of Transportation and Transportation Northwest
TRB Transportation Research Board
TRB ABC30 Transportation Research Board Committee on Performance Measurement
U.S. DOT United States Department of Transportation
USF University of South Florida
VMT Vehicle-Miles Traveled
Cambridge Systematics, Inc. 9-2
Related Documents