RBS Citizens Barclays Presentation Bruce Van Saun, Chief Executive Officer March 7, 2014 Note: Results reported on a US GAAP CFG legal entity basis to allow comparability with peers. RBS Group reported results were for US Retail and Commercial on an IFRS basis. A reconciliation from RBS Group US R&C on IFRS basis to CFG on US GAAP basis is provided on slide 23 in the Appendix.

Welcome message from author
This document is posted to help you gain knowledge. Please leave a comment to let me know what you think about it! Share it to your friends and learn new things together.
Transcript
RBS Citizens Barclays PresentationBruce Van Saun, Chief Executive Officer
March 7, 2014
Note: Results reported on a US GAAP CFG legal entity basis to allow comparability with peers. RBS Group reported results were for US Retail and Commercial on an IFRS basis.A reconciliation from RBS Group US R&C on IFRS basis to CFG on US GAAP basis is provided on slide 23 in the Appendix.

Key Messages
1
RBS Citizens is an attractive franchise with a good foundation:Good geographical footprint and a balanced business mix
Strong culture with emphasis on customers, colleagues, and communityRobust product offerings that focus on our customers needsCapable and energized leadership teamStrong, clean balance sheet
To drive improved performance over the medium term, we will:Maximize the full potential of our core business by putting the customer at the center of everything we doGrow our balance sheet and improve our asset mix and yieldLeverage our investment spend by becoming more effective and efficientExecute on several tactical initiatives including “Project Top”, “Project Cedar”, Chicago branch transaction, and capital optimization
The result will be a top performing regional bank with a clear path to 10%+ return on tangible common equity for our shareholders
RoTCE is currently too low, with a variety of causes:NIM below peers given asset mix, low LDR, conservative risk appetite, pricing / hedgingNeed to catch up on investment spending, regulatory and compliance capabilitiesNot fully capitalizing on cross-sell potential

Good foundation to deliver improving returns…
2
Citizens operates in a 12 state footprint within 3 geographic regions...
Real GDP: 5%Population: 5%Branches: 476
Real GDP: 15% Population: 13%Branches: 559
Real GDP: 10% Population: 11%Branches: 331
...with an established presence within our footprint and nationally
Dimension Rank
Assets ($122bn) #13
Loans ($87bn) #12
Deposits ($92bn) #14
Branches (1,366) #10
ATM Network (3,554) #7
Deposits (top 5 rank) 8 / 10 markets
HELOC (top 5 rank) 10 / 10 markets
Auto (top 5 rank) 7 / 10 markets
Mortgage (top 5 rank) 1 / 10 markets
Middle Markets #5
Bookrunner Table #5
Nat
iona
lIn
-Fo
otpr
int
Mid West Mid-Atlantic New England
Strong market positions, building out commercial capabilitiesNeed to move from franchise with potential to one that consistently deliversIntense focus on improving returns
Note: Data includes Illinois branches currently being disposed of (targeting Q2’14). HELOC = Home equity line of creditReal GDP and Population data as a percent of total US

…with a balanced business mix
3Source: Internal Reporting
Consumer Banking:
Retail Banking
Business Banking (<$25mm)
Wealth Management
Home Lending Solutions
Auto & Student Lending
Commercial Banking:
Middle Market ($25-$500mm)
Mid-Corporate ($500-$2bn)
Specialty (healthcare, technology, franchise finance, leasing, etc.)
Capital Markets, FX, derivatives, Oppenheimer referral agreement
Treasury Solutions
December 2009
December 2013
Commercial36%
Consumer64%
Commercial45%
Consumer55%
Loan Composition
Continued focus on balancing business mix – targeting 50 / 50

However, financial results need to improve…
4
Operating RoTCE% Efficiency Ratio
Sizable gap to peer RoTCE remainsLower NIM drives RoTCE gap, reflects asset portfolio mix, risk appetite, loan pricing and hedgingIncome level has been impacted by regulation, rate environment and subdued economyHigh efficiency ratio needs both revenue and expense focus
Medium Term
2013
5.1%*
2012
4.8%
2011
4.7%
2013
69%
2012
71%
2011
65%
Medium Term
Low60’s
NIM%
2013
2.85%
2012
2.90%
2011
2.97%
10%12%+
LongTerm
LongTerm
< 60%
* c7% adjusted for excess equity capital and Non Core SBO portfolio in run-offNote: US GAAP basis
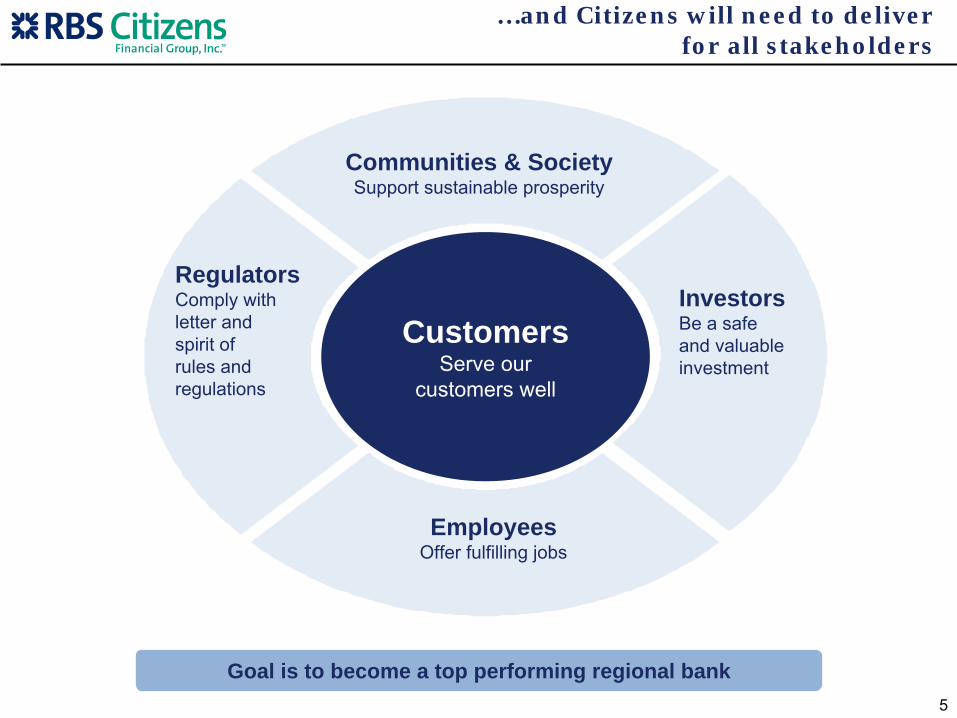
…and Citizens will need to deliver for all stakeholders
5
Employees
Offer fulfilling jobs
RegulatorsComply with letter
and spirit of
rules and regulations
Communities & Society
Support sustainable prosperity
CustomersServe our
customers well
Goal is to become a top performing regional bank
EmployeesOffer fulfilling jobs
RegulatorsComply with letter and spirit of rules and regulations
InvestorsBe a safe and valuable investment
Communities & SocietySupport sustainable prosperity

A program of initiatives is in place that will improve performance
6
Initiatives to Enhance Current Strategy:
Balance Sheet Optimization: Adjusting asset mix, pricing, and hedging to drive NII
Business Expansion: Selective expansion of various lending segments and geographies such as national mid-corporate, specialty verticals, lender / dealer finance, and auto finance
Credit Risk Appetite: Playing more in-line with peers as we move to standalone
Project Top: “Tapping Our Potential”
–
designed to make Citizens a more effective and efficient bank, with improvements to both revenue and expenses
Project Cedar: Multiple initiatives to add originators and grow assets and revenues
Chicago Branch Transaction: Sale of the Chicago-area retail branches, small business operations and select middle market relationships. Gain facilitates reinvestment
Capital Optimization: Continue to optimize the capital base and more closely align with peer banks
Tactical Initiatives:Strategic Initiatives:Realizing the Full Potential of Our Core Business:
Customers remain at the center of what we do and we continue to focus on delivering a differentiated experience:
Citizens prepares employees to deliver a consistent, high-quality experience with every customer interaction
Substantial investments have been made in colleague training, product capabilities and technology / infrastructureto strengthen the overall value proposition
Citizens was named one of the “Best Banks in America” in 2013 by Money magazine

47.0%
50.8%52.9%
Q4'11 Q4'12 Q4'13
70.6%
74.0%
78.9%
Q4'11 Q4'12 Q4'13
7
Consumer Banking is building a strong value proposition around simplicity and transparency...
Initiatives are creating more satisfied customers and deeper relationships:Launched new checking product that will improve consideration and greatly reduce customer complaintsVery strong mobile and online capabilities, with remote deposit capture deploying in mid yearInstalled over 1600 intelligent deposit machines to provide customers with the same funds availability experienced in the branchEnhanced sales & service process focused on transparency and improved cross sellUniversal banker model in the branches
Checking Customers withDirect Deposit Transactions
Checking Customers with Online Banking
Deposit Customerswith a Consumer LoanCustomer Satisfaction
Source: Burke, score based on footprint
states and is a rolling average of the prior
two quarters
62.4%
67.7%69.4%
Q4'11 Q4'12 Q4'13
28.8%
31.3%
32.8%
Q4'11 Q4'12 Q4'13
We are Citizens helping citizens bank betterSimple Clear Personal

8
… and investing in new technology
Branch Image Capture(BIC) teller system rolled out to all
branches in 2013
June ’13: Simplified Logon Screen
Nov ‘13: New iPad App
Jan ’14: Mobile Pop Money
New origination systems for Mortgage and Auto
Auto “Origenate”Allowing more granular credit policy, loss model, & pricing
Mortgage “Empower”Automates the workflow & meet the dynamic demands of the industry and regulatory environment. Will be deployed in 2014
Completed the IDM rollout to all deposit
ATMs in 2013

Improvements in client services & capabilitiesRecent Greenwich Assoc. survey results show an improvement in several key client satisfaction metrics –a trend attributable to our Thought Leadership initiatives
Citizens moved up in the rankings to #6 in Traditional Middle Market Bookrunner by volume ($mm) and #5 in Traditional Middle Market Bookrunner by # of transactions, according to Thomson Reuters’ 4Q League Table Publication
Commercial Banking is positioned for success by continuing to enhance our capabilities and client-centric culture
Revenue growth initiativesBuild out /expand Specialty Verticals, MidCorporate, Strategic Client Acquisition and Institutional CRE contiguous initiative
Enhanced Franchise Finance and Business Capital coverage
Build out existing Capital Markets capabilities in order to win more lead transactions and gain flexibility to support future opportunities
Increase Leveraged Loan capacity to prudently allocate capital to risk/ return profile opportunities and target sponsor relationships with adequate cross-sell and event-driven fee potential
1 Source: Greenwich Assoc. Market Tracking Program (RBS Citizens‐Footprint $25‐500MM‐FY 2013 – Core; Top 4 competitors include: B of A, JPM, Wells & PNC
FY2012 Rank vs. Top 4
Competitors
Overall Capability of RM 76% 96% #1
Proactively Provides Advice & Solutions 59% 89% #1
Understanding of Your Industry 61% 81% #2
Knowledge of Treasury Mgmt. Services 84% 95% #1
Overall Client Satisfaction 62% 85% #1
Overall Lead Client Satisfaction 72% 94% #1
Client Loyalty ‐
Net Promoter 40 47 #1
Values Long‐Term Relationship 71% 98% #1
Client Penetration 10% 10% #5
Lead Relationships as a % of Clients 53% 54% #3
FY2013 Traditional Middle 4Q13 Market Bookrunner 2
$1,942
$1,512
$852
$780
$769
$588
$542
$392
$386
$353
51
48
16
22
23
16
14
16
12
9
JP Morgan
Wells Fargo
B of A ML
PNC
US Bank
Citizens
GE Capital
BMO
Madison
Fifth Third
Ranked 6th by volumeRanked 5th by # of deals
Volume ($MM)
# of deals
2 Source: Thomson Reuters’
4Q13 League Tables (December 2013) 9

RBS Citizens Barclays PresentationJohn Fawcett, Chief Financial Officer
March 7, 2014
Note: Results reported on a US GAAP CFG legal entity basis to allow comparability with peers. RBS Group reported results were for US Retail and Commercial on an IFRS basis.A reconciliation from RBS Group US R&C on IFRS basis to CFG on US GAAP basis is provided on slide 23 in the Appendix.
FY 13 FY 12Actual Actual $ %
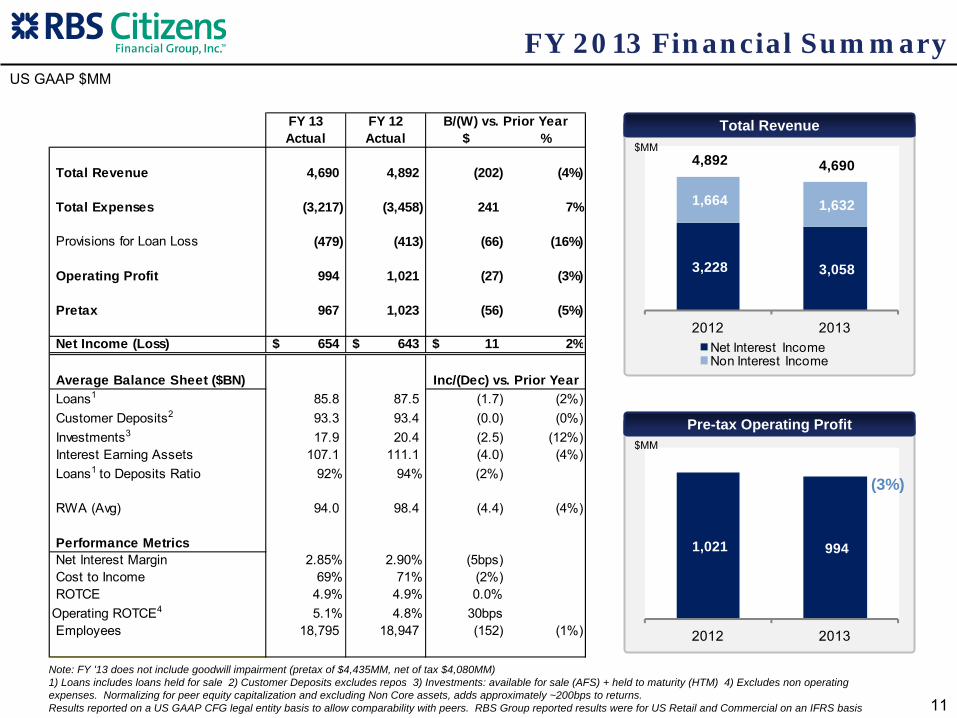
Total Revenue 4,690 4,892 (202) (4%)
Total Expenses (3,217) (3,458) 241 7%
Provisions for Loan Loss (479) (413) (66) (16%)
Operating Profit 994 1,021 (27) (3%)
Pretax 967 1,023 (56) (5%)
Net Income (Loss) 654$ 643$ 11$ 2%
Average Balance Sheet ($BN) Loans1 85.8 87.5 (1.7) (2%) Customer Deposits2 93.3 93.4 (0.0) (0%) Investments3 17.9 20.4 (2.5) (12%) Interest Earning Assets 107.1 111.1 (4.0) (4%) Loans1 to Deposits Ratio 92% 94% (2%)
RWA (Avg) 94.0 98.4 (4.4) (4%)
Performance MetricsNet Interest Margin 2.85% 2.90% (5bps)Cost to Income 69% 71% (2%)ROTCE 4.9% 4.9% 0.0%
Operating ROTCE4 5.1% 4.8% 30bpsEmployees 18,795 18,947 (152) (1%)
B/(W) vs. Prior Year
Inc/(Dec) vs. Prior Year
Pre-tax Operating Profit
Total Revenue
3,228 3,058
1,664 1,632
4,892 4,690
2012 2013Net Interest IncomeNon Interest Income
1,021 994
2012 2013
(3%)
11
Note: FY '13 does not include goodwill impairment (pretax of $4,435MM, net of tax $4,080MM)1) Loans includes loans held for sale 2) Customer Deposits excludes repos 3) Investments: available for sale (AFS) + held to maturity (HTM) 4) Excludes non operating expenses. Normalizing for peer equity capitalization and excluding Non Core assets, adds approximately ~200bps to returns.Results reported on a US GAAP CFG legal entity basis to allow comparability with peers. RBS Group reported results were for US Retail and Commercial on an IFRS basis
FY 2013 Financial SummaryUS GAAP $MM
$MM
$MM

Benefit of deposit mix / pricing and commercial loan growth
Higher account and transaction fees have partially mitigated the impact of legislative change
12
Revenue CompositionUS GAAP
558 505
2012 2013
169 160
2012 2013
177 165 170 171 159
54 46 67 21 20
34 35 36
39 40
35 40 37 35 35
105 94 88 94 102
405 379 398 359 356
Q4'12 Q1'13 Q2'13 Q3'13 Q4'13Deposit / ATM / Debit Mortgage FeesInvestment Services / Trust International / DerivativesMerchant / Card / All Other
Fee Income – $MM Deposit Fees – $MM ATM / Debit Fees – $MM
881 834 855 850 859 845 833 811 815 845 838 823 824 821 810 773 761 748 769 779
435 513 467 484 461 486 479 460 371 405 396 386 398 376 376 405 379 398 359 356
200 400 600 800
1,000 1,200 1,400
49% 48% 48% 47% 47% 47% 48% 48% 47% 47% 46% 45% 45% 45% 45% 45% 45% 45% 44% 43%
27% 27% 27% 27% 27% 27% 29% 30% 30% 31% 32% 32% 33% 34% 34% 35% 36% 36% 36% 36%
24% 25% 24% 26% 25% 26% 23% 22% 22% 22% 22% 22% 22% 21% 22% 20% 19% 19% 20% 21%
25
50
75
100
125
150 Balance sheet reduced to enhance focus, NIM
Rev
enue
(ex
Gai
ns) $
MM
Avg
Ear
ning
A
sset
s %
mix
Net Interest Income
Fee Income
Consumer
Commercial
Investments
Q1 Q2 Q3 Q4 Q1 Q2 Q3 Q4 Q1 Q2 Q3 Q4 Q1 Q2 Q3 Q4 Q1 Q2 Q3 Q42009 2010 2011 2012 2013
Peer NIM Ranking1
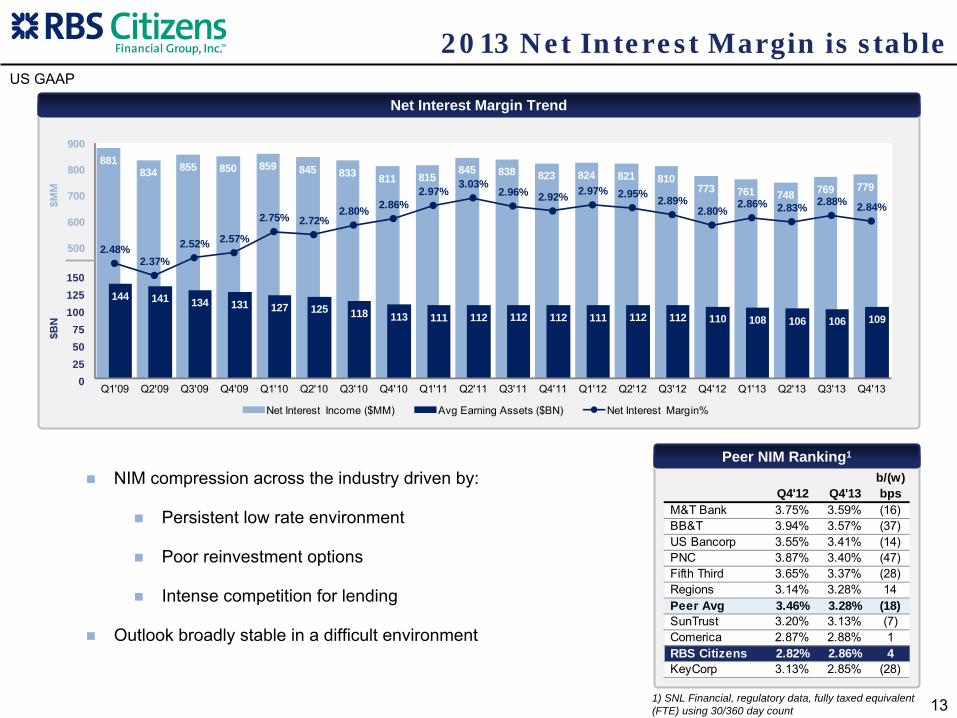
Net Interest Margin Trend
881834 855 850 859 845 833 811 815
845 838 823 824 821 810773 761 748 769 779
144 141 134 131 127 125 118 113 111 112 112 112 111 112 112 110 108 106 106 109
2.48%2.37%
2.52% 2.57%
2.75% 2.72%2.80% 2.86%
2.97%3.03%
2.96% 2.92% 2.97% 2.95% 2.89%2.80% 2.86% 2.83% 2.88% 2.84%
0
100
200
300
400
500
600
700
800
900
Q1'09 Q2'09 Q3'09 Q4'09 Q1'10 Q2'10 Q3'10 Q4'10 Q1'11 Q2'11 Q3'11 Q4'11 Q1'12 Q2'12 Q3'12 Q4'12 Q1'13 Q2'13 Q3'13 Q4'13
Net Interest Income ($MM) Avg Earning Assets ($BN) Net Interest Margin%
NIM compression across the industry driven by:
Persistent low rate environment
Poor reinvestment options
Intense competition for lending
Outlook broadly stable in a difficult environment
2013 Net Interest Margin is stable
13
150125100
755025
0
$MM
$BN
US GAAP
1) SNL Financial, regulatory data, fully taxed equivalent (FTE) using 30/360 day count
b/(w)Q4'12 Q4'13 bps
M&T Bank 3.75% 3.59% (16)BB&T 3.94% 3.57% (37)US Bancorp 3.55% 3.41% (14)PNC 3.87% 3.40% (47)Fifth Third 3.65% 3.37% (28)Regions 3.14% 3.28% 14 Peer Avg 3.46% 3.28% (18)SunTrust 3.20% 3.13% (7)Comerica 2.87% 2.88% 1 RBS Citizens 2.82% 2.86% 4 KeyCorp 3.13% 2.85% (28)

FY 2013 Expense / Avg Earning Assets
2.91%
3.00%
3.19%
3.32%
3.46%
3.48%
3.60%
3.63%
3.65%
3.69%
3.70%
Comerica
RBS Citizens
US Bancorp
Regions
Peer Avg
M&T Bank
SunTrust
BB&T
KeyCorp
Fif th Third
PNC
FY 2013 Expense Walk
Headcount
22,478
18,795
2008 2013
Central Items
Non Core
WorldPay
Staff Areas
Business Services
Commercial
Consumer Ex Branch
Branch
FY'13 Expense Distribution
Staff Expense 51%
Occupancy & Equipment
22%
Outside Services(3)
11%
Advertising & PR 2%
Insurance & Tax 4%
Net OREO(1) & NPA(2) 1%
Shipping & Supplies 2% All Other
7%
14
Staff, Occupancy & Equipment
73%
(1) OREO – Other Real Estate Owned(2) NPA – Non Performing Assets(3) Outside Services includes services or other business processes that are outsourced to 3rd party vendors rather than employing staffPeer data SNL Financial SEC reporting
US GAAP $MM
Expenses remain well controlled
3,458
3,243 3,217
138
77 18 18 10 14 6
December 2012 YTD
Litigation Settlement
Pension Loss
FY 2012 Underlying
Staff Expense
Insurance & Tax Exp
Advertising Occupancy & Equipment
Other December 2013 YTD
2012 Δ bps
2.99% (8)
3.11% (11)
3.30% (11)
3.13% 19
3.62% (16)
3.47% 1
4.07% (47)
3.68% (5)
3.82% (17)
4.08% (39)
4.04% (34)
FY 2012 FY 2013FY 2012 Underlying
Summary
Loan Provision
15
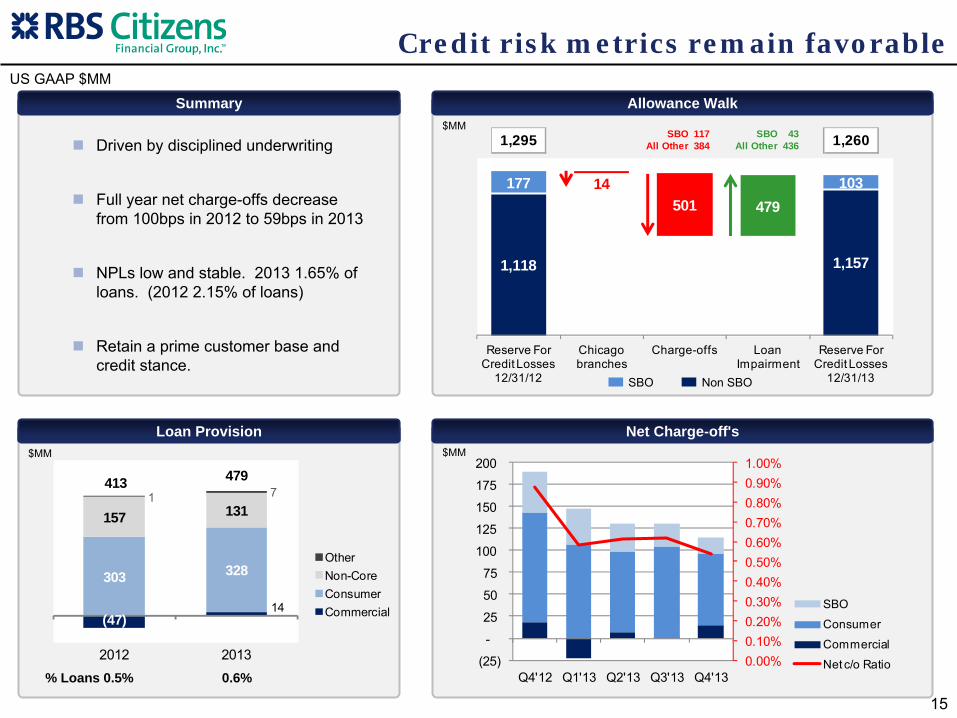
Driven by disciplined underwriting
Full year net charge-offs decrease from 100bps in 2012 to 59bps in 2013
NPLs low and stable. 2013 1.65% of loans. (2012 2.15% of loans)
Retain a prime customer base and credit stance.
US GAAP $MM
Credit risk metrics remain favorable
Net Charge-off's
0.00%0.10%0.20%0.30%0.40%0.50%0.60%0.70%0.80%0.90%1.00%
(25)
-
25
50
75
100
125
150
175
200
Q4'12 Q1'13 Q2'13 Q3'13 Q4'13
SBO
Consumer
Commercial
Net c/o Ratio
(47)14
303 328
157 131 1 7
413 479
2012 2013
OtherNon-CoreConsumerCommercial
Allowance Walk
1,118 1,157
177 10314501 479
Reserve For Credit Losses
12/31/12
Chicago branches
Charge-offs Loan Impairment
Reserve For Credit Losses
12/31/13
SBO 117 SBO 43All Other 384 All Other 4361,295 1,260
SBO Non SBO
$MM
$MM$MM
% Loans 0.5% 0.6%

Reserves / NPLs %NPLs / Loans %
47%
50%
55%
77%
84%
85%
86%
86%
94%
134%
139%
Regions
Fif th Third
SunTrust
BB&T
PNC
Peer Avg
M&T Bank
RBS Citizens
US Bancorp
KeyCorp
Comerica
3.75%
3.56%
2.88%
2.22%
2.18%
1.92%
1.91%
1.67%
1.63%
1.15%
0.95%
Regions
Fif th Third
SunTrust
Peer Avg
PNC
US Bancorp
BB&T
M&T Bank
RBS Citizens
KeyCorp
Comerica
16Source: SNL Financial. SEC data
US GAAP FY 2013
We have strong asset quality…

Common Equity Tier 1 RatioTier 1 Capital Ratio
12.4%
12.0%
12.0%
11.8%
11.7%
11.2%
10.8%
10.6%
10.4%
13.5%
11.4%
RBS Citizens
PNC
M&T Bank
KeyCorp
BB&T
Regions
Peer Average
US Bancorp
SunTrust
Comerica
Fif th Third
17Subject to regulatory approval and the CCAR process. Data from SNL Financial Y9C regulatory data
US GAAP Q4 2013
…and are well capitalized versus peers
11.2%
11.2%
10.6%
10.5%
9.9%
9.8%
9.4%
9.4%
9.2%
13.5%
10.1%
RBS Citizens
KeyCorp
Regions
Comerica
PNC
Peer Average
BB&T
SunTrust
Fif th Third
US Bancorp
M&T Bank
RBSCFG’s 2014 Capital Plan submitted to the Federal Reserve Board (FRB)
in early January under the Comprehensive Capital Analysis and Review process, CCAR 2014, requests FRB approval of capital actions executable in Q2 2014 –
Q1 2015. The FRB will provide an “object / non-
object”
decision by the end of March.
Common dividends paid to RBS in 2013 totaled $185MM
Debt for equity swap of $1BN to RBS in 2013
Estimated FY2013 Basel III common equity tier 1 ratio of 13.1%
Expect to continue to move towards a more efficient capital structure
ConclusionBruce Van Saun, Chief Executive Officer
March 7, 2014
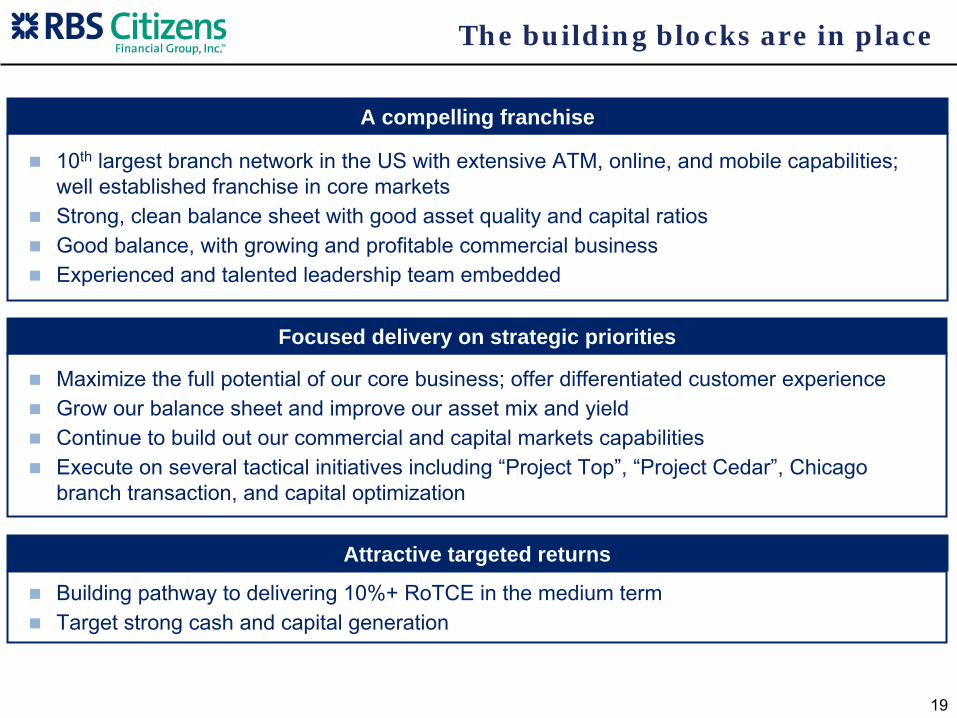
The building blocks are in place
19
10th largest branch network in the US with extensive ATM, online, and mobile capabilities; well established franchise in core marketsStrong, clean balance sheet with good asset quality and capital ratios Good balance, with growing and profitable commercial businessExperienced and talented leadership team embedded
A compelling franchise
Building pathway to delivering 10%+ RoTCE in the medium termTarget strong cash and capital generation
Attractive targeted returns
Maximize the full potential of our core business; offer differentiated customer experienceGrow our balance sheet and improve our asset mix and yieldContinue to build out our commercial and capital markets capabilitiesExecute on several tactical initiatives including “Project Top”, “Project Cedar”, Chicago branch transaction, and capital optimization
Focused delivery on strategic priorities

20

Appendix
21

Announced Chicago Divestiture of Charter One Branches
22
Definitive agreement entered into with U.S. Bancorp in January to sell the Chicago-area branches, small business operations and select middle market relationships
Anticipated to close mid-2014
CFG will maintain a presence in Chicago through its commercial business lines and several consumer business lines not included in the sale (i.e. mortgage, student, auto)Transaction Specifications:
94 branches6% deposit premium$5.3bn of deposits$1.1bn of loans
Chicago Branches
2.7%2.8% 2.9%
2.1% 2.0% 2.0% 1.8% 1.7% 1.8%
0.0%
1.0%
2.0%
3.0%
4.0%
2005 2006 2007 2008 2009 2010 2011 2012 2013
CFG Chicago MSA Deposit Market Share
Source: SNL Financial.
#6 Rank #13 Rank

23
US R&C Core Results to Total CFG ReconciliationFY 2013
GAAPExternal Replace Internal BusinessUS R&C "Group Alloc" US R&C US R&C US R&C International Services Central Total GAAP vs. Total
Core with Internal Core Non Core Total Banking (Offshore) Items CFG IFRS CFG
Net Interest Income 2,960 2,960 114 3,074 - - (0) 3,074 (16) 3,058 Treasury Allocation 38 (38) Non Interest Income 1,679 1,679 9 1,688 - - 1 1,689 (57) 1,632
Total Income 4,677 (38) 4,639 123 4,762 - - 1 4,763 (73) 4,690
Total Direct Expense (3,188) (3,188) (34) (3,222) (0) (8) (60) (3,290) 74 (3,217) Business Services Allocations (81) 81 Center Allocations (152) 152 Internal CFG Allocations (33) (33) (22) (56) - 10 46 0 0 0
Total Costs (3,422) 200 (3,221) (57) (3,278) (0) 2 (14) (3,290) 74 (3,217)
Operating Profit Before Impairment 1,256 162 1,418 66 1,484 (0) 2 (13) 1,473 1 1,473
Impairment Losses (244) (244) (243) (488) - - - (488) 8 (479)
Operating Profit 1,012 162 1,174 (177) 997 (0) 2 (13) 985 8 994
Amortization / Intangibles / One Time Costs 3 - 3 - - (1) 2 (4,464) (4,462)
Pretax 1,177 (177) 1,000 (0) 2 (14) 987 (4,456) (3,468)
Income tax (387) 62 (325) 0 (1) 5 (320) 363 42
Net Income 790 (115) 675 (0) 1 (9) 667 (4,093) (3,426)
ROE (10% RWAs - based on operating profit tax effected) 7.2% 8.3% (28.5%) 6.8% NM NM NM 6.7%ROTCE (excludes goodwill impairment) 4.9%
IFRS
Related Documents