Raymond James Energy Group Raymond James Energy Group “Is The Stock Market or “Is The Stock Market or the Futures Market Correct?” the Futures Market Correct?” [email protected] [email protected] [email protected] [email protected] [email protected] [email protected] Raymond James Oilservice Group Raymond James Oilservice Group (800) 945-6275 (800) 945-6275 June 2006

Raymond James Energy Group “Is The Stock Market or the Futures Market Correct?” [email protected]@[email protected].
Dec 18, 2015
Welcome message from author
This document is posted to help you gain knowledge. Please leave a comment to let me know what you think about it! Share it to your friends and learn new things together.
Transcript

Raymond James Energy GroupRaymond James Energy Group
“Is The Stock Market or “Is The Stock Market or the Futures Market Correct?”the Futures Market Correct?”
[email protected]@[email protected]@RaymondJames.com
[email protected]@RaymondJames.comRaymond James Oilservice GroupRaymond James Oilservice Group(800) 945-6275 (800) 945-6275 June 2006

Short-term Outlook (next 6 months)Short-term Outlook (next 6 months)Increasingly Bullish!Increasingly Bullish!
Investor sentiment: never been more bearish Investor sentiment: never been more bearish – U.S. gas fearsU.S. gas fears
Technical support levels have held firmTechnical support levels have held firm– Stocks bounced off their 200 day moving avg.Stocks bounced off their 200 day moving avg.
Fundamentals are strong & improvingFundamentals are strong & improving– Strong upward earningsStrong upward earnings– Gas storage situation is improvingGas storage situation is improving– No indication of a slow downNo indication of a slow down
2

Long-term Energy Outlook (6-18 months)Long-term Energy Outlook (6-18 months)Still Very Bullish! Still Very Bullish!
Gas resets in NovemberGas resets in November
Oil supply/demand remains tight Oil supply/demand remains tight – even with an economic slowdown & more drillingeven with an economic slowdown & more drilling
Supply response is anemicSupply response is anemic– Both U.S. gas & global oilBoth U.S. gas & global oil
Geopolitical issues are Geopolitical issues are NOTNOT going away going away
3
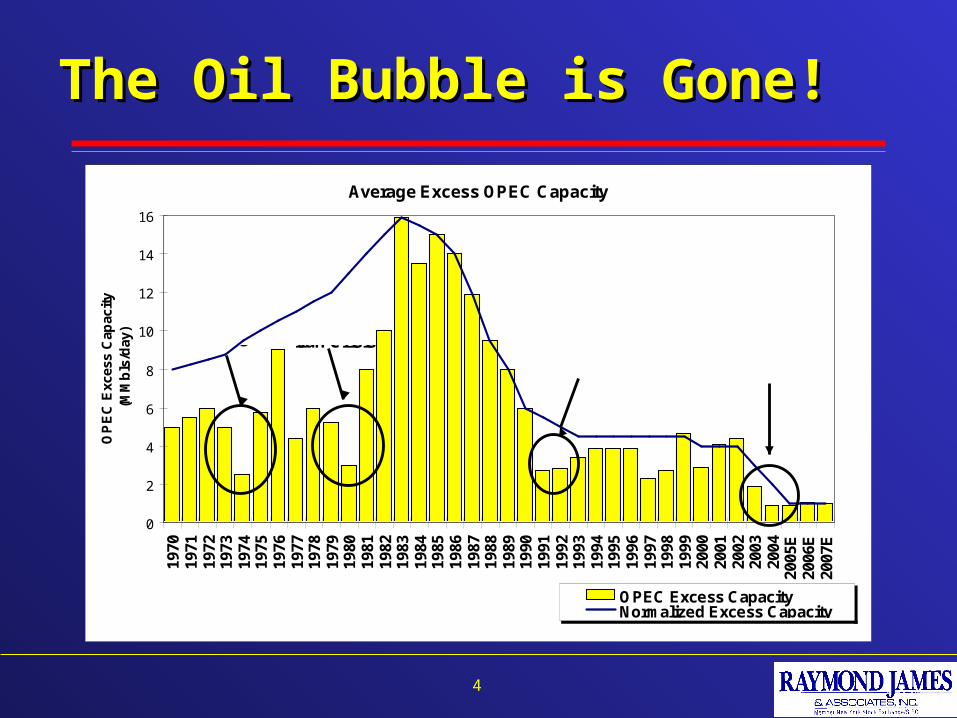
The Oil Bubble is Gone!The Oil Bubble is Gone!
4
Average Excess OPEC Capacity
0
2
4
6
8
10
12
14
16
1970
1971
1972
1973
1974
1975
1976
1977
1978
1979
1980
1981
1982
1983
1984
1985
1986
1987
1988
1989
1990
1991
1992
1993
1994
1995
1996
1997
1998
1999
2000
2001
2002
2003
2004
2005
E20
06E
2007
E
OP
EC
Exc
ess
Cap
acit
y(M
Mb
ls/d
ay)
OPEC Excess CapacityNormalized Excess Capacity
Sources: IEA, RJ&A, Bloomberg
Arab Embargo Iran Crisis
Kuwait WarDemand Growth
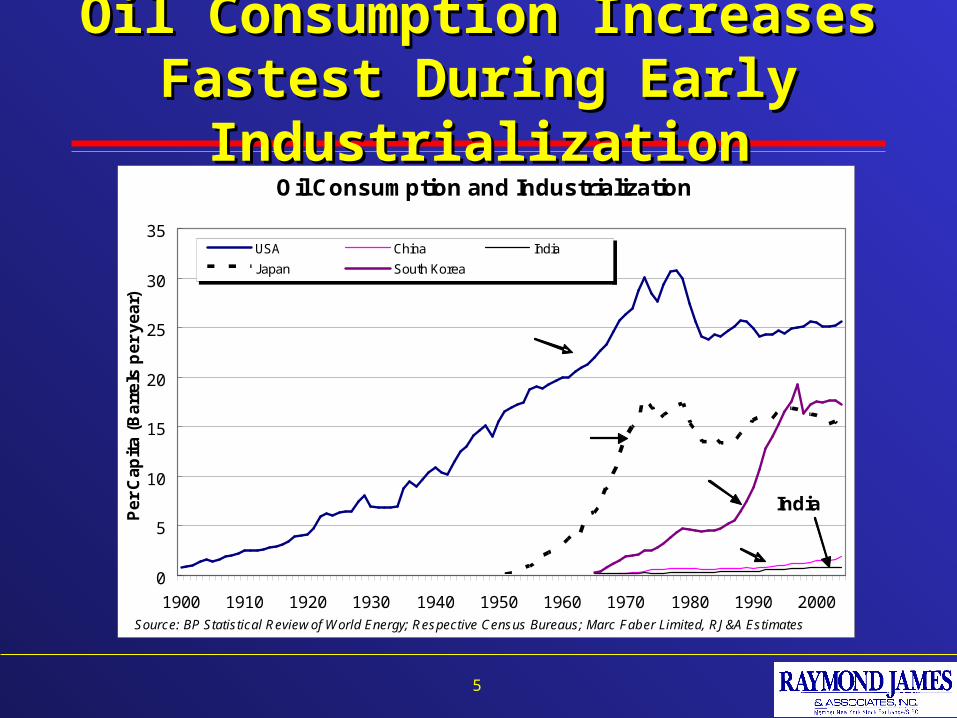
Oil Consumption Increases Fastest Oil Consumption Increases Fastest During Early IndustrializationDuring Early Industrialization
5
Oil Consumption and Industrialization
0
5
10
15
20
25
30
35
1900 1910 1920 1930 1940 1950 1960 1970 1980 1990 2000
Pe
r C
ap
ita
(B
arr
els
pe
r y
ea
r)
USA China India
Japan South Korea
USA
Japan
South Korea
China
India
Source: BP Statistical Review of World Energy; Respective Census Bureaus; Marc Faber Limited, RJ&A Estimates

Russian Oil Production Russian Oil Production GrowthGrowth Slowing Slowing
6
Russian Oil Production Growth (Year-Over-Year)
0.0
0.1
0.2
0.3
0.4
0.5
0.6
0.7
0.8
0.9
1998 1999 2000 2001 2002 2003 2004 2005 2006E 2007E
Mil
lio
n b
arre
ls p
er d
ay
Source: IEA, RJ&A Estimates
??
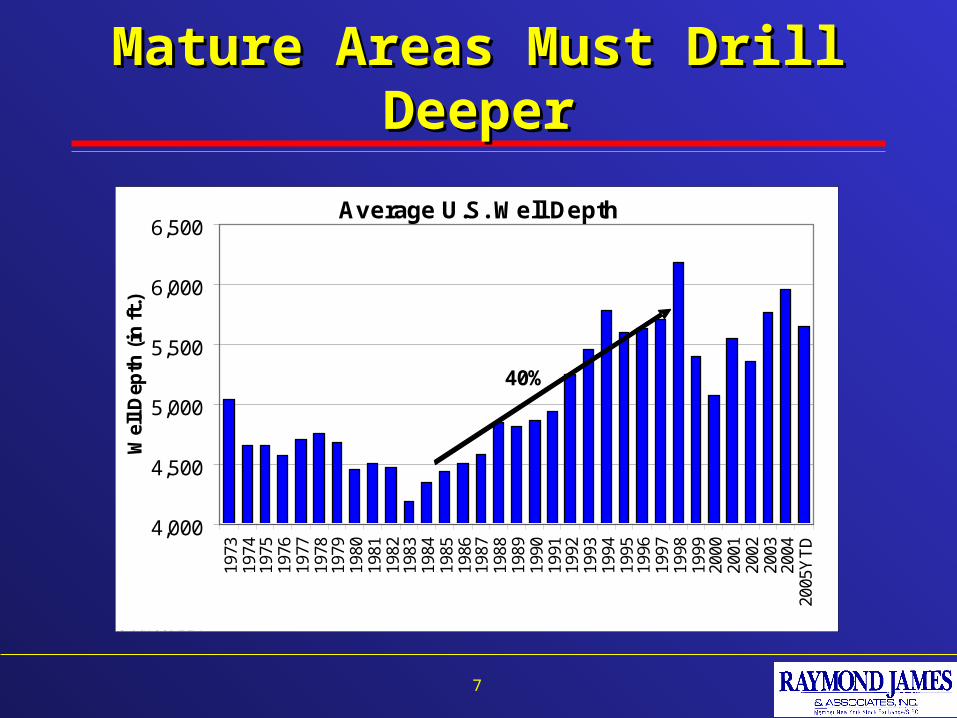
Mature Areas Must Drill DeeperMature Areas Must Drill Deeper
7
Average U.S. Well Depth
4,000
4,500
5,000
5,500
6,000
6,50019
7319
7419
7519
7619
7719
7819
7919
8019
8119
8219
8319
8419
8519
8619
8719
8819
8919
9019
9119
9219
9319
9419
9519
9619
9719
9819
9920
0020
0120
0220
0320
0420
05Y
TD
Wel
l Dep
th (
in f
t.)
Source: EIA
40%
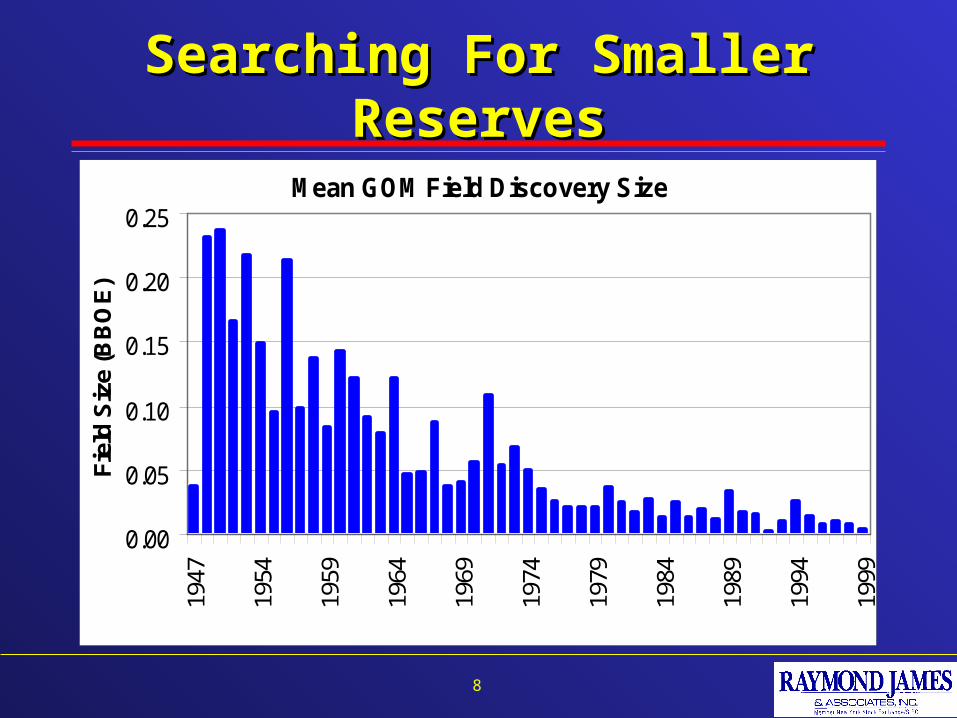
Searching For Smaller ReservesSearching For Smaller Reserves
8
Mean GOM Field Discovery Size
0.00
0.05
0.10
0.15
0.20
0.2519
47
1954
1959
1964
1969
1974
1979
1984
1989
1994
1999
Fiel
d S
ize
(BB
OE
)
Source: Minerals Management Service.
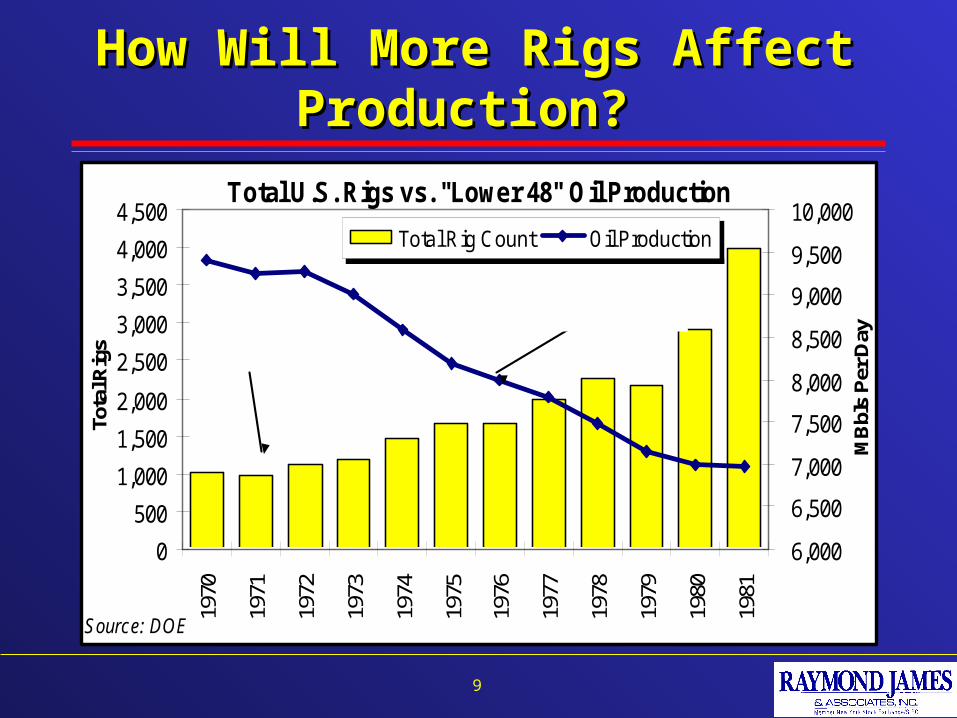
How Will More Rigs Affect Production?How Will More Rigs Affect Production?
9
Total U.S. Rigs vs. "Lower 48" Oil Production
0
500
1,000
1,500
2,000
2,500
3,000
3,500
4,000
4,50019
70
1971
1972
1973
1974
1975
1976
1977
1978
1979
1980
1981
Source: DOE
Tota
l Rig
s
6,000
6,500
7,000
7,500
8,000
8,500
9,000
9,500
10,000
MB
bls
Per
Day
Total Rig Count Oil Production
Total Rigs
"Lower 48" Oil Production
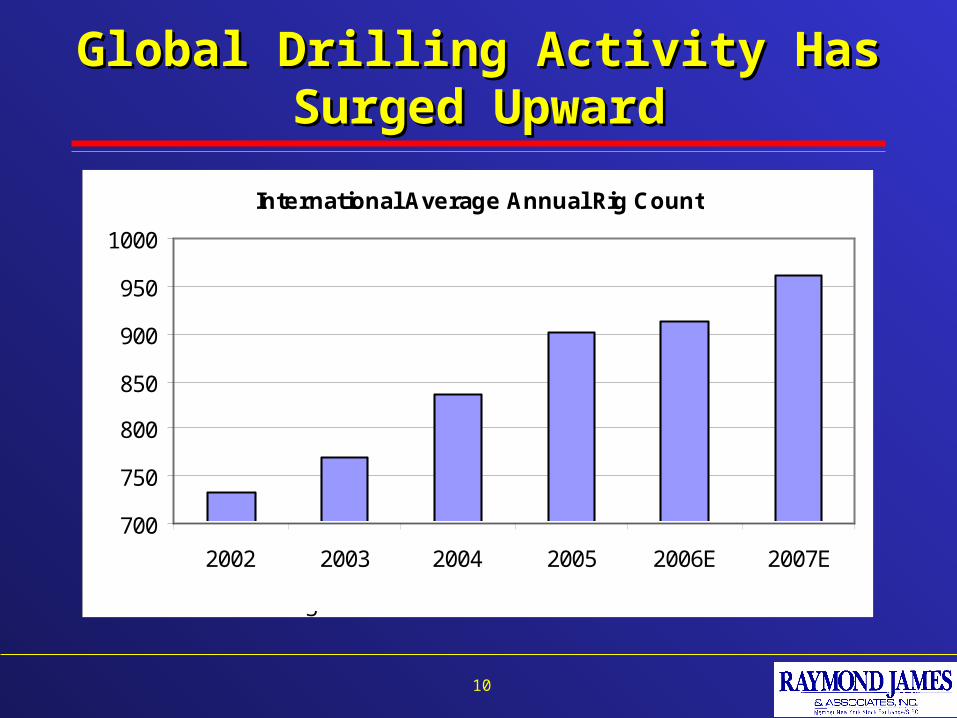
Global Drilling Activity Has Surged UpwardGlobal Drilling Activity Has Surged Upward
10
International Average Annual Rig Count
700
750
800
850
900
950
1000
2002 2003 2004 2005 2006E 2007E
Source: Baker Hughes
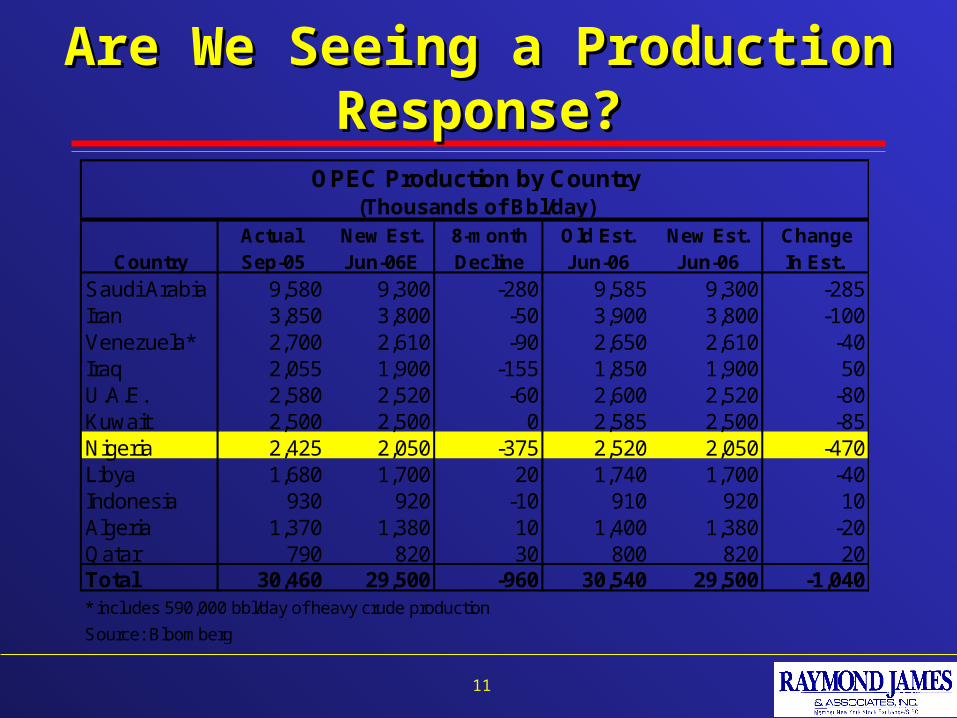
Are We Seeing a Production Response?Are We Seeing a Production Response?
11
Actual New Est. 8-month Old Est. New Est. ChangeCountry Sep-05 Jun-06E Decline Jun-06 Jun-06 In Est.
Saudi Arabia 9,580 9,300 -280 9,585 9,300 -285Iran 3,850 3,800 -50 3,900 3,800 -100Venezuela* 2,700 2,610 -90 2,650 2,610 -40Iraq 2,055 1,900 -155 1,850 1,900 50U.A.E. 2,580 2,520 -60 2,600 2,520 -80Kuwait 2,500 2,500 0 2,585 2,500 -85Nigeria 2,425 2,050 -375 2,520 2,050 -470Libya 1,680 1,700 20 1,740 1,700 -40Indonesia 930 920 -10 910 920 10Algeria 1,370 1,380 10 1,400 1,380 -20Qatar 790 820 30 800 820 20Total 30,460 29,500 -960 30,540 29,500 -1,040* includes 590,000 bbl/day of heavy crude production
Source: Bloomberg
OPEC Production by Country(Thousands of Bbl/day)

Today’s Oil OutlookToday’s Oil Outlook
12
Days of Supply (U.S.) New Estimate
29.0
31.0
33.0
35.0
37.0
39.0
Jan
Fe
b
Ma
r
Ap
r
Ma
y
Jun
Jul
Au
g
Se
p
Oct
No
v
De
c
Da
ys
of
Su
pp
ly (
U.S
.)
5 Yr Range 5 Yr AVG 2005 2006 E 2006 Actual
Source: API.
Source: EIA, RJ&A Estimates
2006 E
2005 A
2006 A

Geo Area 03/'05 Avg. 2006E 2007ENorth America 1.8% 0.5% 1.0%
Europe 0.6% 0.8% 0.5%
Pacific 0.0% 0.5% 1.0%
FSU 3.0% 2.8% 0.0%China 10.1% 6.0% 5.0%
Other Asia 3.6% 1.8% 2.5%
Latin America 1.4% 1.9% 1.5%
Middle East 3.3% 6.2% 3.5%
Africa 2.5% 2.9% 1.0%
Source: IEA
Y/Y Demand Percentage Change
What if We Have a Global Slowdown?What if We Have a Global Slowdown?
13

Where is the Price Floor?Where is the Price Floor?(OPEC Will Defend $55 or Higher)(OPEC Will Defend $55 or Higher)
14
Rising Saudi infrastructure costsRising Saudi infrastructure costs
Higher shipping costsHigher shipping costs
Widening differential for poor quality crudesWidening differential for poor quality crudes
Devaluation of the U.S. $ Devaluation of the U.S. $
– Less OPEC purchasing powerLess OPEC purchasing power
• Cheaper international oil pricesCheaper international oil prices
OPEC wants highest price w/o demand destructionOPEC wants highest price w/o demand destruction

Discounts on Heavy Oil Have WidenedDiscounts on Heavy Oil Have Widened
15
Discount From WTI Price for Maya (Heavy) Crude
$0
$2
$4
$6
$8
$10
$12
$14
$16
$18
$20
Jan-
96
Jan-
97
Jan-
98
Jan-
99
Jan-
00
Jan-
01
Jan-
02
Jan-
03
Jan-
04
Jan-
05
Jan-
06
Pri
ce p
er B
arre
l
Source: Bloomberg
Light/Heavy Spread
Historic Average Spread = ~$5
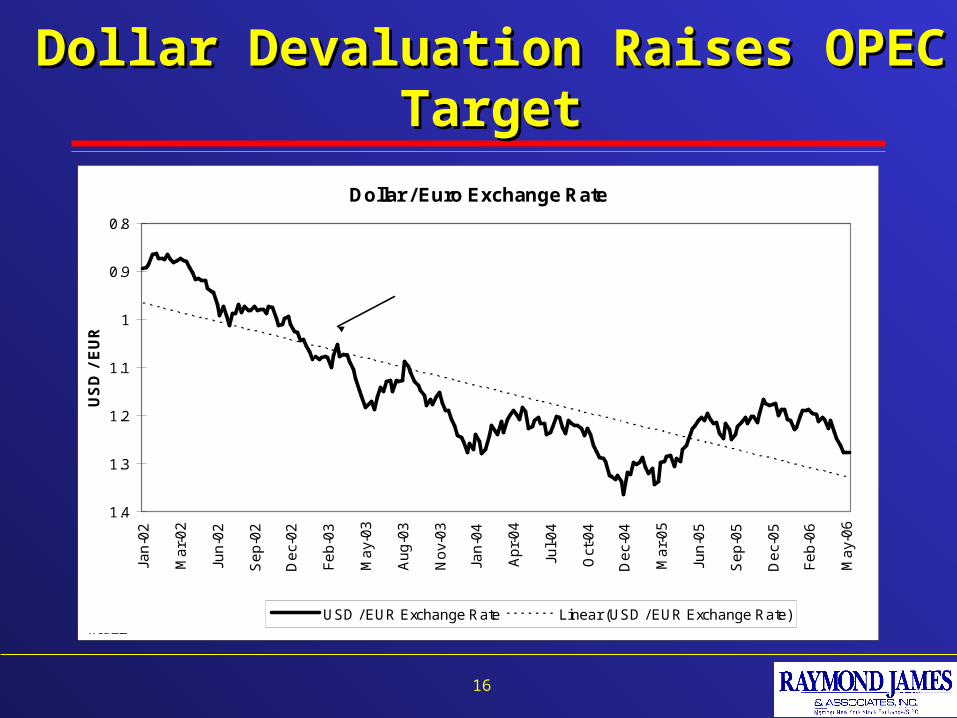
Dollar Devaluation Raises OPEC TargetDollar Devaluation Raises OPEC Target
16
Dollar / Euro Exchange Rate
0.8
0.9
1
1.1
1.2
1.3
1.4
Jan
-02
Ma
r-0
2
Jun
-02
Se
p-0
2
De
c-0
2
Fe
b-0
3
Ma
y-0
3
Au
g-0
3
No
v-0
3
Jan
-04
Ap
r-0
4
Jul-
04
Oct
-04
De
c-0
4
Ma
r-0
5
Jun
-05
Se
p-0
5
De
c-0
5
Fe
b-0
6
Ma
y-0
6
US
D /
EU
R
USD / EUR Exchange Rate Linear (USD / EUR Exchange Rate)Source: OANDA.com, Reuters
Dollar is down 42% since Dec 2001
USD/EUR
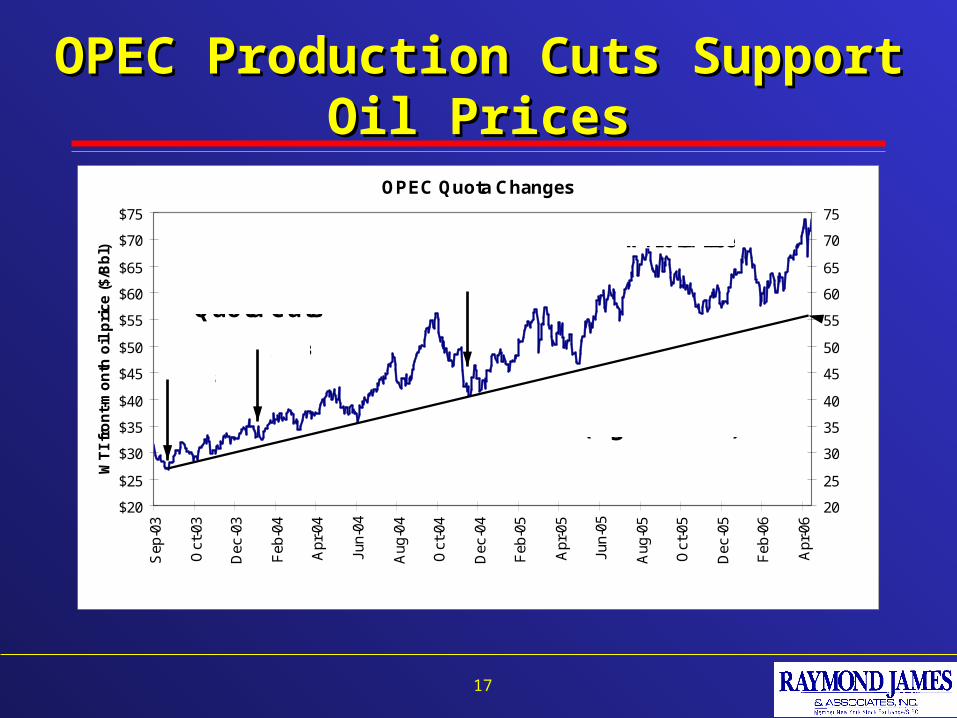
OPEC Production Cuts Support Oil PricesOPEC Production Cuts Support Oil Prices
17
OPEC Quota Changes
$20
$25
$30
$35
$40
$45
$50
$55
$60
$65
$70
$75
Sep
-03
Oct
-03
Dec
-03
Feb
-04
Apr
-04
Jun-
04
Aug
-04
Oct
-04
Dec
-04
Feb
-05
Apr
-05
Jun-
05
Aug
-05
Oct
-05
Dec
-05
Feb
-06
Apr
-06
WT
I fr
on
t-m
on
th o
il p
rice
($/
Bb
l)
20
25
30
35
40
45
50
55
60
65
70
75
Quota Cuts
Source: Bloomberg
WTI Oil Price
(Higher Lows)
$26.93
$32.83
$42.53

Our Oil Price GuessOur Oil Price Guess
18
Q1 05A Q2 05A Q3 05A Q4 05A 2005AWTI $48.00 $52.00 $60.50 $61.15 $55.41
Estimate Q1 06A Q2 06E Q3 06E Q4 06E 2006EWTI First Call $62.50 $58.37 $58.68 $58.19 $59.44NYMEX Futures $62.50 $64.88 $68.83 $69.61 $66.46WTI Old RJ Oil $62.50 $54.00 $59.00 $62.00 $59.38WTI New RJ Oil $62.50 $65.00 $67.00 $68.00 $65.50
Estimate Q1 07E Q2 07E Q3 07E Q4 07E 2007EWTI First Call $58.00 $56.80 $57.20 $57.20 $57.30NYMEX Futures $69.75 $69.65 $69.62 $69.38 $69.60WTI Old RJ Oil $61.00 $59.00 $63.00 $65.00 $62.00WTI New RJ Oil $70.00 $70.00 $70.00 $70.00 $70.00
RJ&A Oil Price Estimates (as of April 2006)
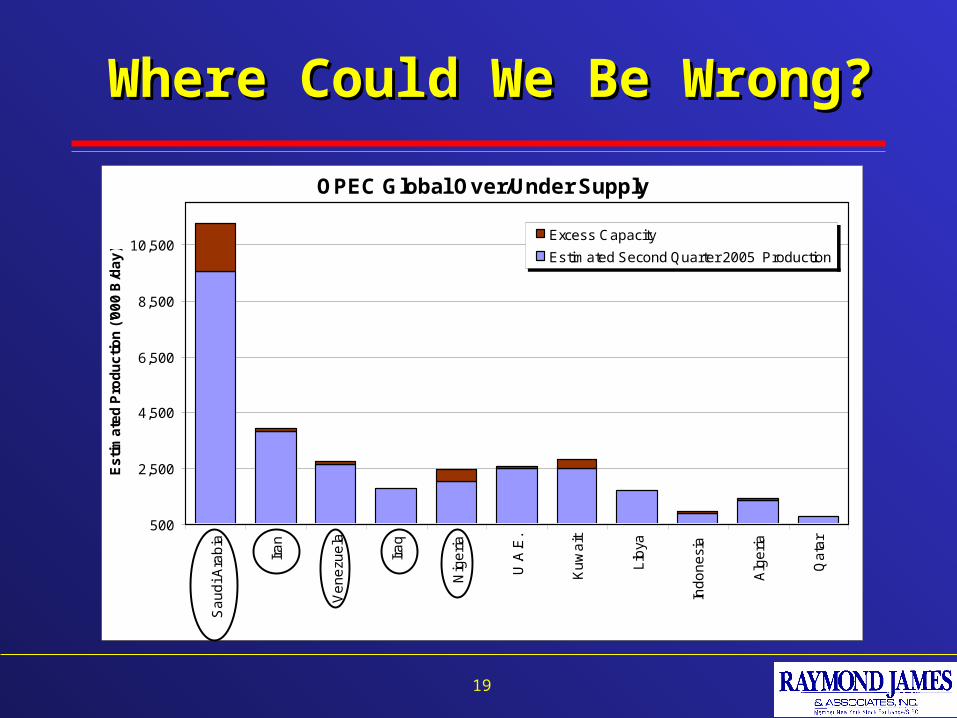
Where Could We Be Wrong?Where Could We Be Wrong?
19
OPEC Global Over/Under Supply
500
2,500
4,500
6,500
8,500
10,500
Sa
ud
i Ara
bia
Ira
n
Ve
ne
zue
la
Ira
q
Nig
eri
a
U.A
.E.
Ku
wa
it
Lib
ya
Ind
on
esi
a
Alg
eri
a
Qa
tar
Es
tim
ate
d P
rod
uc
tio
n (
'00
0 B
/da
y)
Excess Capacity
Estimated Second Quarter 2005 Production
Iran Has Changed the Game! Iran Has Changed the Game!
20
Iran has re-opened nuclear effortsIran has re-opened nuclear efforts
– New leader not backing downNew leader not backing down
U.S. & Israel will U.S. & Israel will NOTNOT let Iran get nuclear weapons let Iran get nuclear weapons
Iran’s 3.9 million Bpd is at riskIran’s 3.9 million Bpd is at risk
Situation should come to a head in 6 - 18 monthsSituation should come to a head in 6 - 18 months
80% probability Iran drives oil higher 80% probability Iran drives oil higher
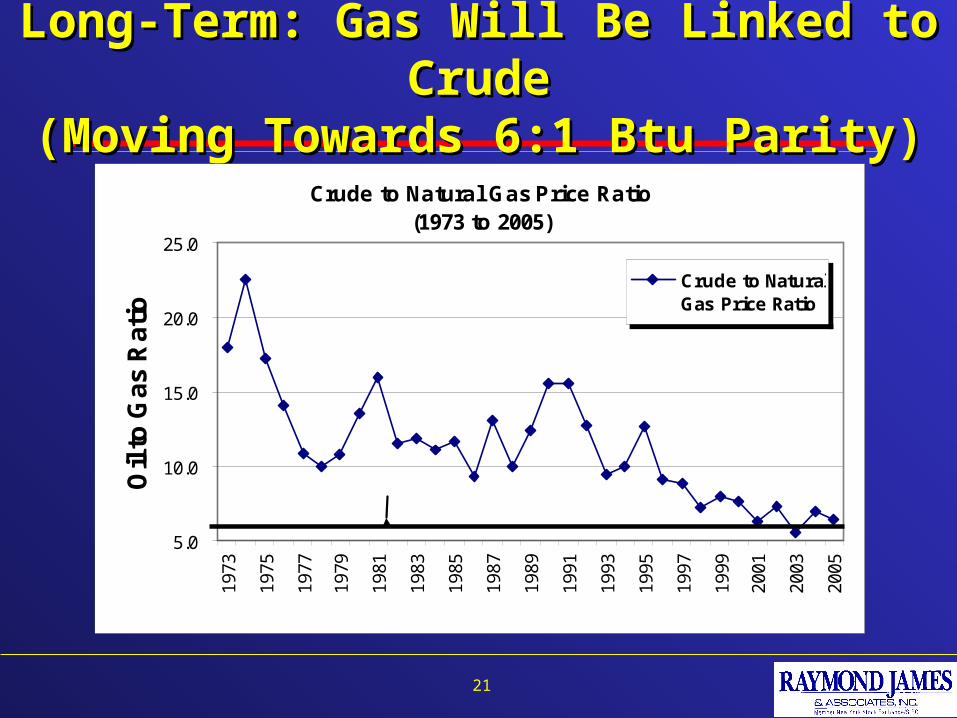
Long-Term: Gas Will Be Linked to CrudeLong-Term: Gas Will Be Linked to Crude(Moving Towards 6:1 Btu Parity)(Moving Towards 6:1 Btu Parity)
21
Crude to Natural Gas Price Ratio(1973 to 2005)
5.0
10.0
15.0
20.0
25.019
73
1975
1977
1979
1981
1983
1985
1987
1989
1991
1993
1995
1997
1999
2001
2003
2005
Oil
to G
as
Ra
tio
Crude to NaturalGas Price Ratio
Source: Bloomberg, API, EIA
6:1 BTU Parity
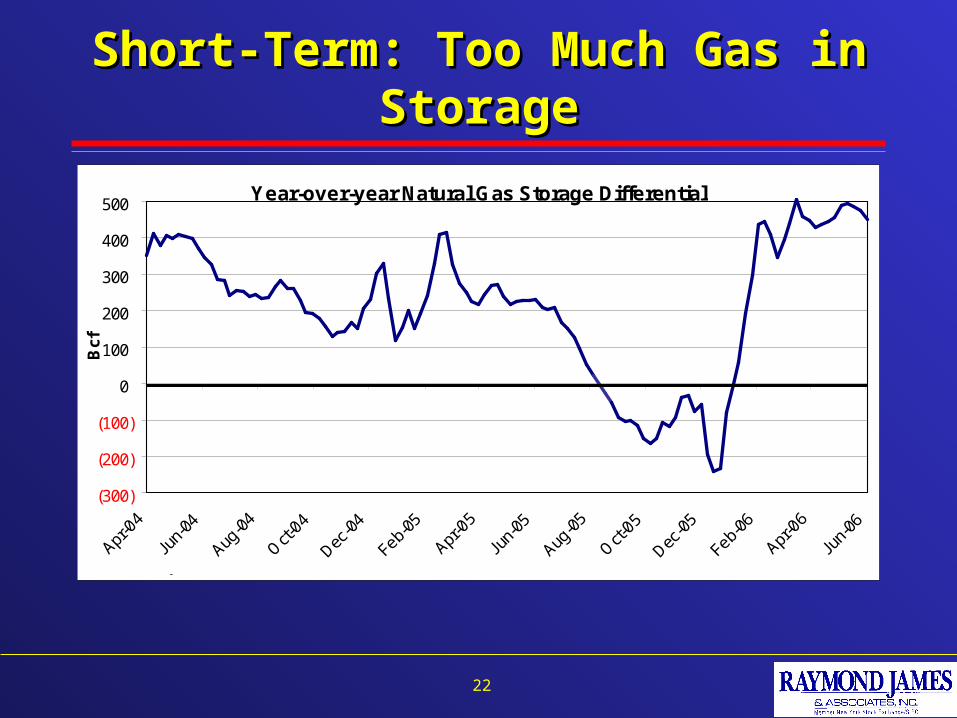
Short-Term: Too Much Gas in StorageShort-Term: Too Much Gas in Storage
22
Year-over-year Natural Gas Storage Differential
(300)
(200)
(100)
0
100
200
300
400
500
Apr-0
4
Jun-
04
Aug-0
4
Oct-
04
Dec-0
4
Feb-05
Apr-0
5
Jun-
05
Aug-0
5
Oct-
05
Dec-0
5
Feb-06
Apr-0
6
Jun-
06
Bcf
Source: EIA, RJ&A estimates
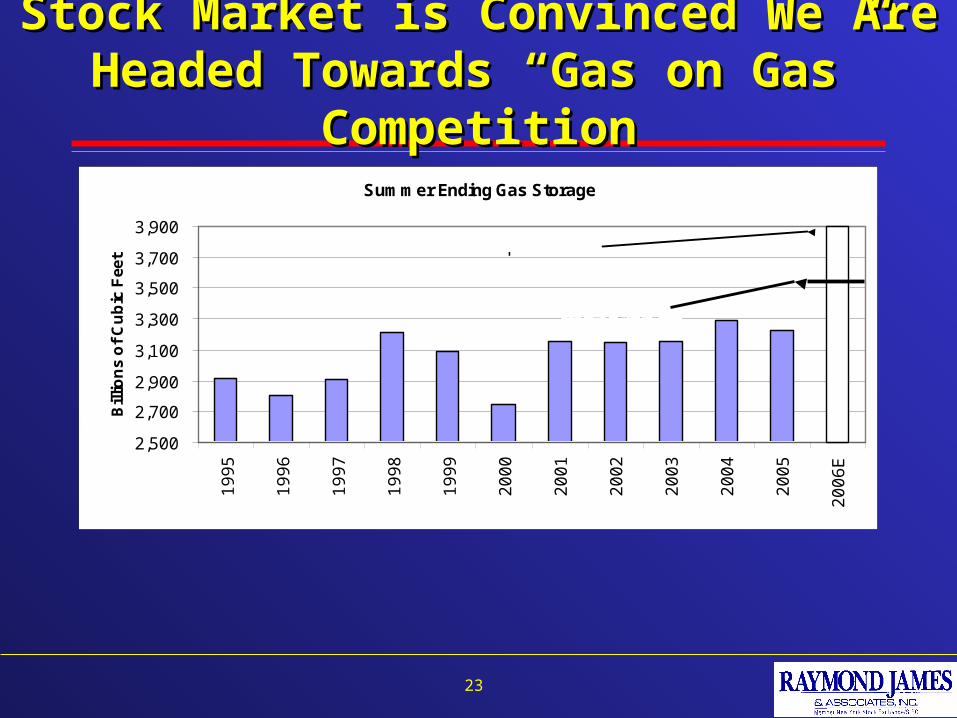
Stock Market is Convinced We Are Headed Stock Market is Convinced We Are Headed Towards “Gas on Gas” CompetitionTowards “Gas on Gas” Competition
23
Summer Ending Gas Storage
2,500
2,700
2,900
3,100
3,300
3,500
3,700
3,9001
99
5
19
96
19
97
19
98
19
99
20
00
20
01
20
02
20
03
20
04
20
05
20
06
E
Bill
ion
s o
f C
ub
ic F
eet
Source: EIA
RJ Estimate
Market Expectations
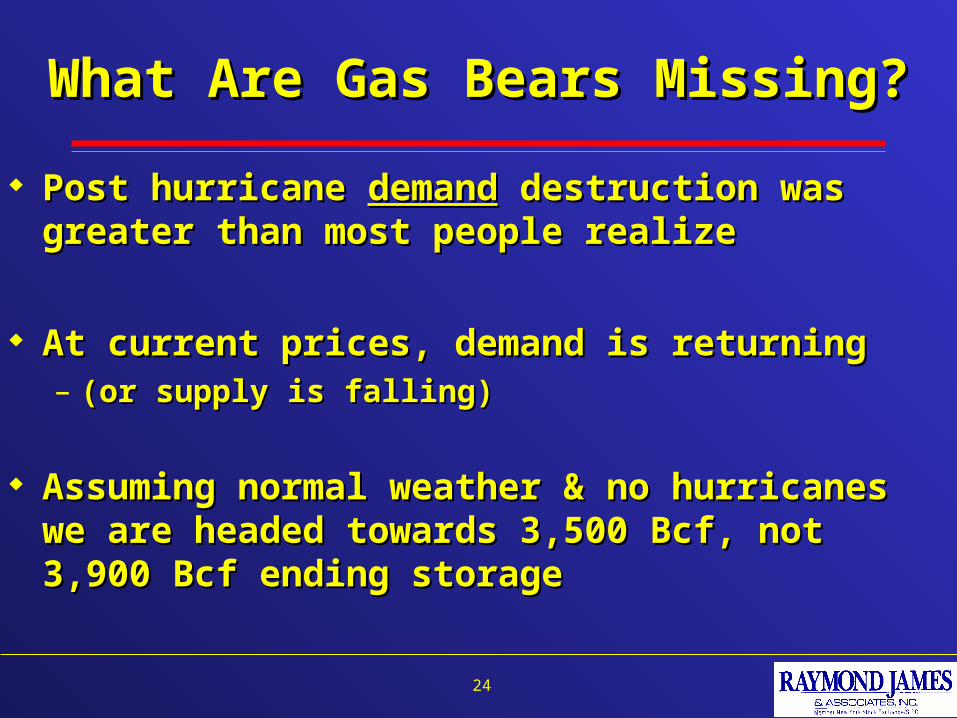
What Are Gas Bears Missing?What Are Gas Bears Missing?
24
Post hurricane Post hurricane demanddemand destruction was greater than destruction was greater than most people realizemost people realize
At current prices, demand is returningAt current prices, demand is returning– (or supply is falling)(or supply is falling)
Assuming normal weather & no hurricanes we are Assuming normal weather & no hurricanes we are headed towards 3,500 Bcf, not 3,900 Bcf ending storageheaded towards 3,500 Bcf, not 3,900 Bcf ending storage
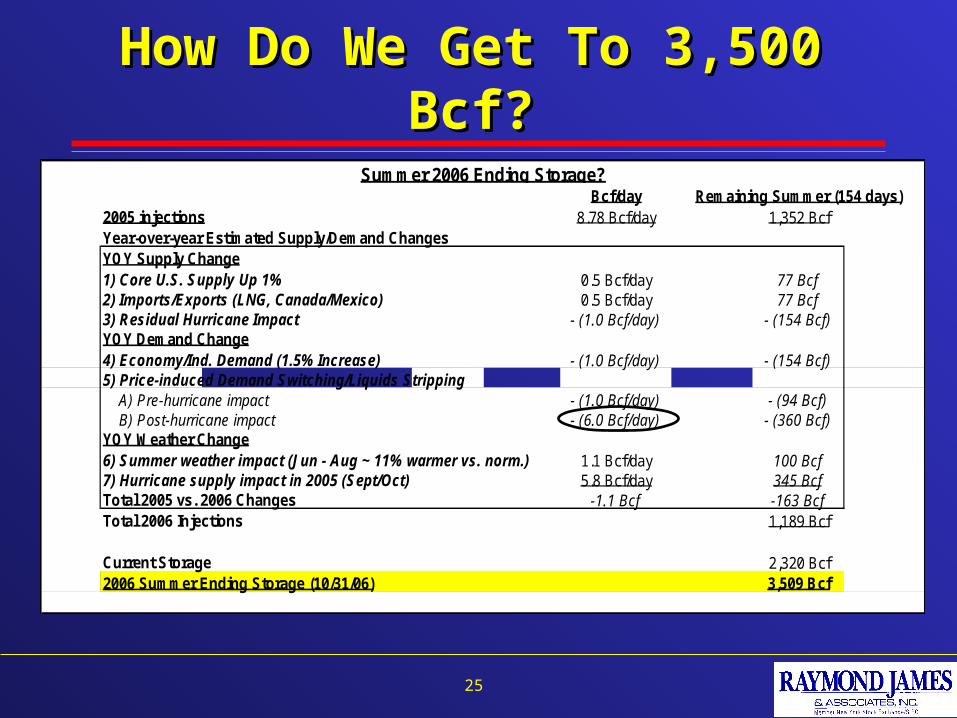
How Do We Get To 3,500 Bcf?How Do We Get To 3,500 Bcf?
25
Bcf/day Remaining Summer (154 days)2005 injections 8.78 Bcf/day 1,352 BcfYear-over-year Estimated Supply/Demand ChangesYOY Supply Change1) Core U.S. Supply Up 1% 0.5 Bcf/day 77 Bcf2) Imports/Exports (LNG, Canada/Mexico) 0.5 Bcf/day 77 Bcf3) Residual Hurricane Impact - (1.0 Bcf/day) - (154 Bcf)YOY Demand Change4) Economy/Ind. Demand (1.5% Increase) - (1.0 Bcf/day) - (154 Bcf)5) Price-induced Demand Switching/Liquids Stripping A) Pre-hurricane impact - (1.0 Bcf/day) - (94 Bcf) B) Post-hurricane impact - (6.0 Bcf/day) - (360 Bcf)YOY Weather Change6) Summer weather impact (Jun - Aug ~ 11% warmer vs. norm.) 1.1 Bcf/day 100 Bcf7) Hurricane supply impact in 2005 (Sept/Oct) 5.8 Bcf/day 345 BcfTotal 2005 vs. 2006 Changes -1.1 Bcf -163 BcfTotal 2006 Injections 1,189 Bcf
Current Storage 2,320 Bcf2006 Summer Ending Storage (10/31/06) 3,509 Bcf
Summer 2006 Ending Storage?
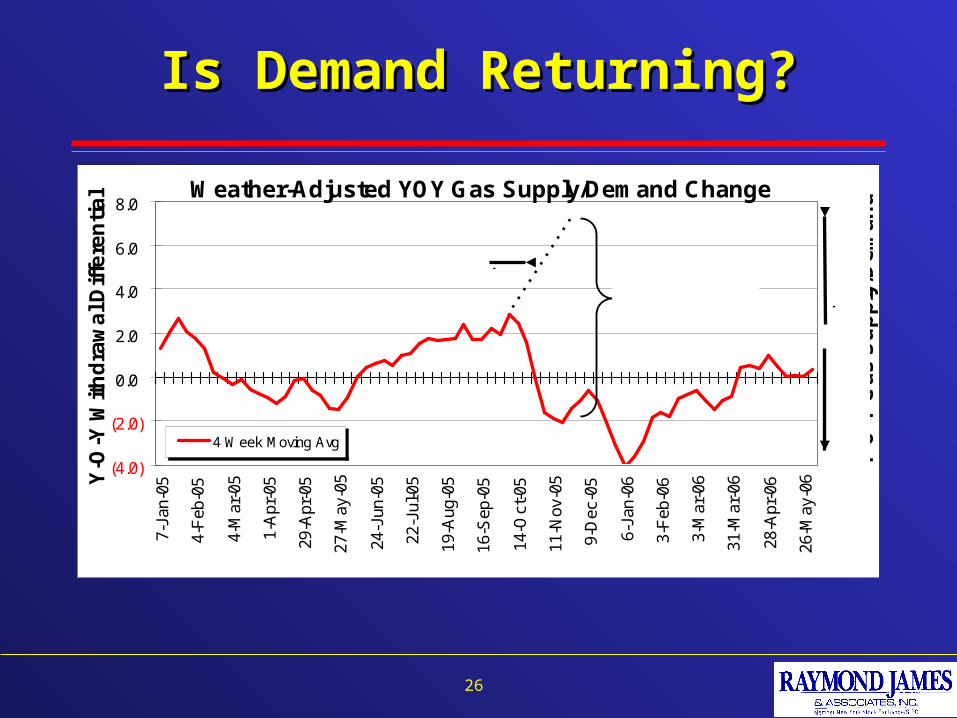
Is Demand Returning?Is Demand Returning?
26
Weather-Adjusted YOY Gas Supply/Demand Change
(4.0)
(2.0)
0.0
2.0
4.0
6.0
8.0
7-Ja
n-05
4-F
eb-0
5
4-M
ar-0
5
1-A
pr-0
5
29-A
pr-0
5
27-M
ay-0
5
24-J
un-0
5
22-J
ul-0
5
19-A
ug-0
5
16-S
ep-0
5
14-O
ct-0
5
11-N
ov-0
5
9-D
ec-0
5
6-Ja
n-06
3-F
eb-0
6
3-M
ar-0
6
31-M
ar-0
6
28-A
pr-0
6
26-M
ay-0
6Y-O
-Y W
ith
dra
wa
l Dif
fere
nti
al
4 Week Moving Avg
Source: EIA, RJ&A.
LO
OS
ER
TIG
HT
ER
Y-O
-Y G
as
Su
pp
ly/D
em
an
d
9 Bcf/day Demand Destruction?
5.5 Bcf/day supply lost

Even DOE’s Numbers Suggest Even DOE’s Numbers Suggest Big Demand DestructionBig Demand Destruction
27
Monthly Total Gas Demand, Excluding WeatherChange From Previous Year
(3.3)
0.61.5 1.2
(3.3)(4.0) (3.8)
(2.3)
(8.3)
(8.50)
(7.00)
(5.50)
(4.00)
(2.50)
(1.00)
0.50
2.00
May
-05
Jun-
05
Jul-0
5
Aug
-05
Sep
-05
Oct
-05
Nov
-05
Dec
-05
Jan-
06
Bcf
/Day
Source: EIA, DOE, RJ&A Estimates
~5 Bcf/day change in demand
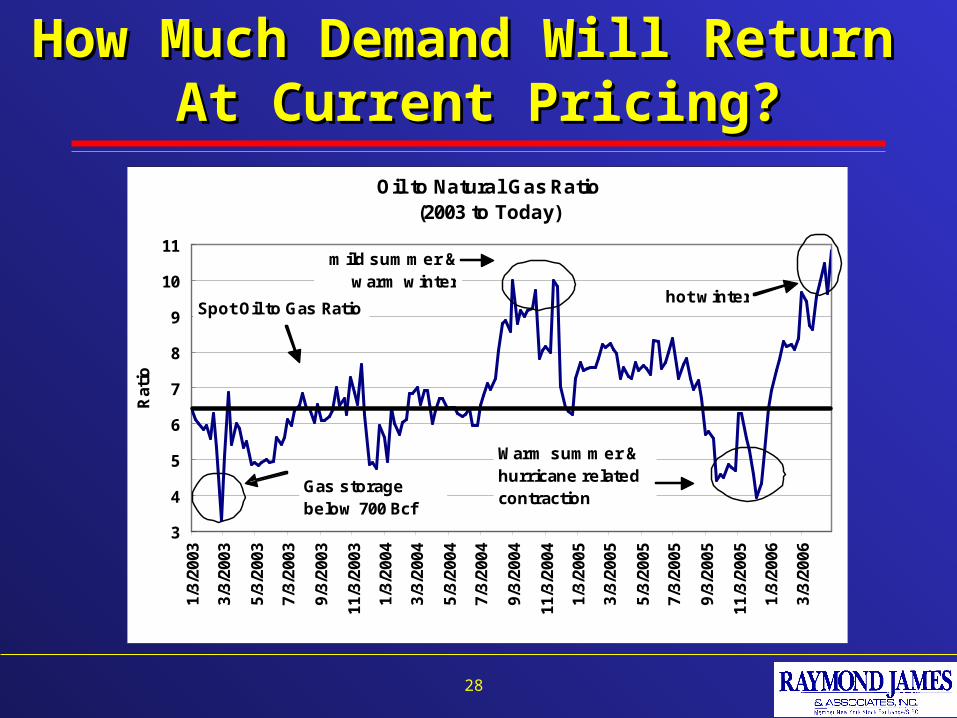
How Much Demand Will Return How Much Demand Will Return At Current Pricing?At Current Pricing?
28
Oil to Natural Gas Ratio(2003 to Today)
3
4
5
6
7
8
9
10
11
1/3/
2003
3/3/
2003
5/3/
2003
7/3/
2003
9/3/
2003
11/3
/200
3
1/3/
2004
3/3/
2004
5/3/
2004
7/3/
2004
9/3/
2004
11/3
/200
4
1/3/
2005
3/3/
2005
5/3/
2005
7/3/
2005
9/3/
2005
11/3
/200
5
1/3/
2006
3/3/
2006
Rat
io
Source: Bloomberg
Warm summer & hurricane related contraction
Gas storage below 700 Bcf
mild summer & warm winter
hot winterSpot Oil to Gas Ratio
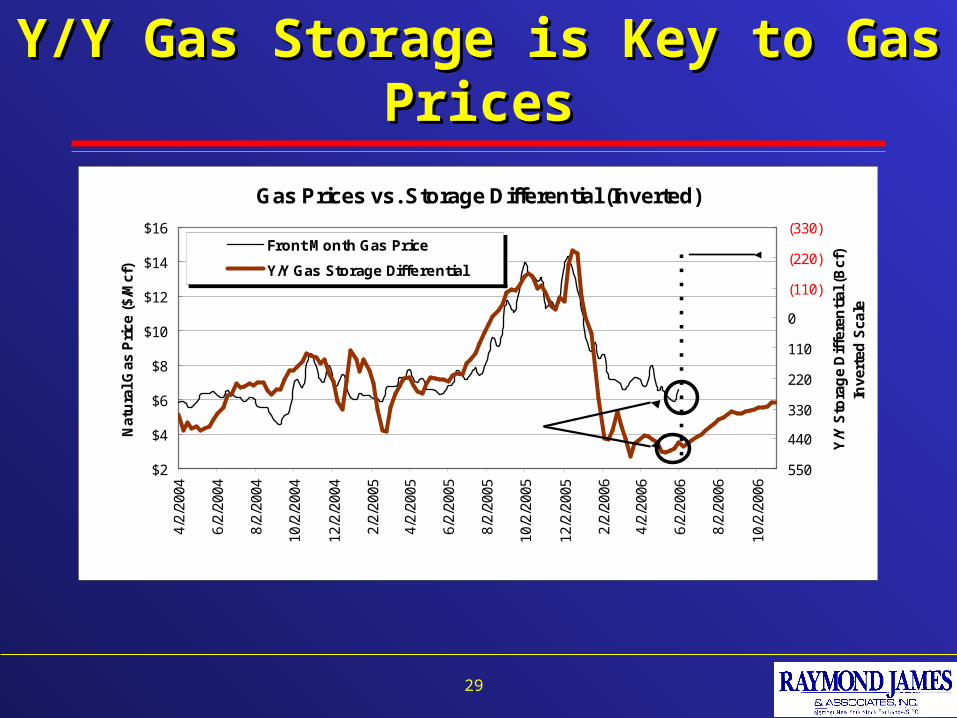
Y/Y Gas Storage is Key to Gas PricesY/Y Gas Storage is Key to Gas Prices
29
Gas Prices vs. Storage Differential (Inverted)
$2
$4
$6
$8
$10
$12
$14
$16
4/2/
2004
6/2/
2004
8/2/
2004
10/2
/200
4
12/2
/200
4
2/2/
2005
4/2/
2005
6/2/
2005
8/2/
2005
10/2
/200
5
12/2
/200
5
2/2/
2006
4/2/
2006
6/2/
2006
8/2/
2006
10/2
/200
6
Nat
ura
l Gas
Pri
ce (
$/M
cf)
(330)
(220)
(110)
0
110
220
330
440
550
Y/Y
Sto
rag
e D
iffe
ren
tial
(B
cf)
Inve
rted
Sca
le
Front Month Gas Price
Y/Y Gas Storage Differential
Source: Bloomberg, EIA
Inflection Point?
Estimate

Where Will Winter Storage End?Where Will Winter Storage End?
30
Bcf/day Full Winter (151 days)2005/2006 Withdrawals 9.56 Bcf/day 1,444 BcfYear-over-year Estimated Supply/Demand ChangesYOY Supply Change1) Core U.S. Supply Up 1% 0.50 Bcf/day 76 Bcf2) Imports/Exports (LNG, Canada/Mexico) 0 Bcf/day 0 Bcf3) Residual Hurricane Impact - (0.75 Bcf/day) - (113 Bcf)YOY Demand Change4) Economy/Ind. Demand (1.75% Increase) - (1.0 Bcf/day) - (151 Bcf)5) Price-induced Demand Switching/Liquids Stripping - (2.5 Bcf/day) - (378 Bcf)6) Hurricane Demand Recovery - (1.0 Bcf/day) - (151 Bcf)YOY Weather Change7) Winter weather impact (2005/2006 ~ 9% warmer vs. normal) - (2.4 Bcf/day) - (362 Bcf)8) Hurricane supply impact 2.1 Bcf/day 323 BcfTotal 2006/07 vs. 2005/06 Changes - (5.0 Bcf) - (757 Bcf)Total 2006/2007 Withdrawals 2,201 Bcf
2006 Summer Ending Storage 3,509 Bcf2006/2007 Winter Ending Storage (3/31/07) 1,308 Bcf
Winter 2006/2007 Ending Storage?
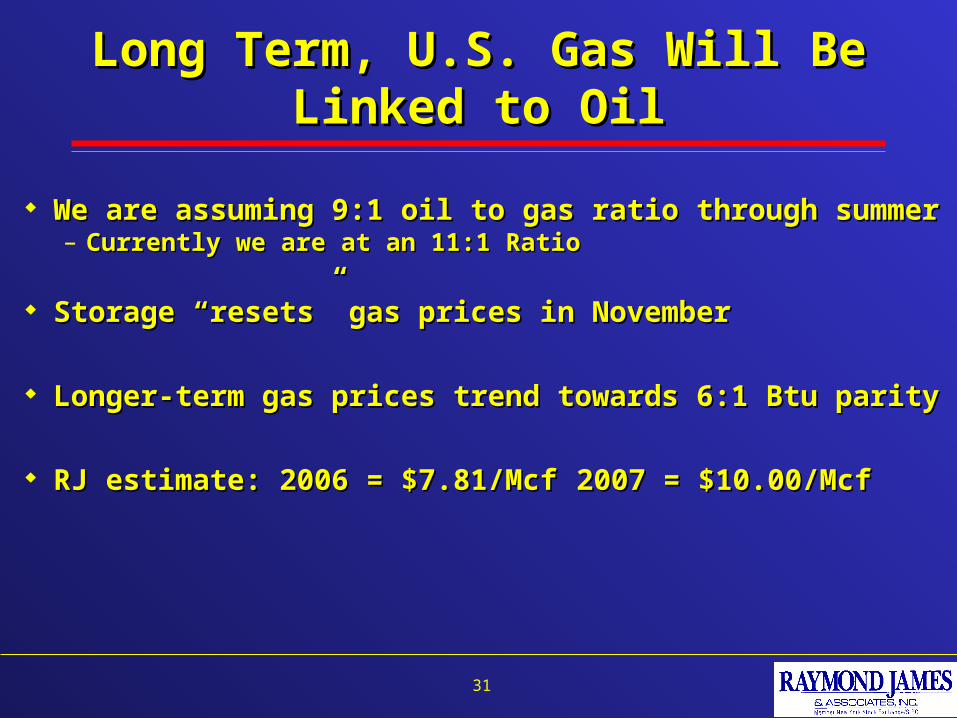
Long Term, U.S. Gas Will Be Linked to OilLong Term, U.S. Gas Will Be Linked to Oil
31
We are assuming 9:1 oil to gas ratio through summerWe are assuming 9:1 oil to gas ratio through summer– Currently we are at an 11:1 RatioCurrently we are at an 11:1 Ratio
Storage “resets” gas prices in NovemberStorage “resets” gas prices in November
Longer-term gas prices trend towards 6:1 Btu parityLonger-term gas prices trend towards 6:1 Btu parity
RJ estimate: 2006 = $7.81/McfRJ estimate: 2006 = $7.81/Mcf 2007 = $10.00/Mcf2007 = $10.00/Mcf
How Do Prospect Inventories Look & Are Higher How Do Prospect Inventories Look & Are Higher Service Costs Impacting Prospect Hurdle Rates?Service Costs Impacting Prospect Hurdle Rates?
32
Our Take:Our Take:
– 5 years ago 5 years ago “There aren’t enough prospects” “There aren’t enough prospects”
– Today Today “There aren’t enough rigs” “There aren’t enough rigs”
– Reality Reality LT gas prices above $6/Mcf generates LT gas prices above $6/Mcf generates
great revenues & more prospects despite higher costsgreat revenues & more prospects despite higher costs

Reinvestment Returns Reinvestment Returns Are Still OutstandingAre Still Outstanding
33
Major Assumptions:Year 1 2 3+Oil Price ($/Bbl) $60.00 $60.00 $60.00Gas Price ($/Mcf) $9.00 $9.00 VariesLOE and G&A Costs ($/Mcfe) $1.80Production Tax Rate 6.0%Net Revenue Interest 78%Percentage Gas 70%
IRR at Various Finding & Development (F&D) Costs
20%
30%
40%
50%
60%
70%
80%
90%
100%
$6.00 $7.00 $8.00 $9.00 $10.00
Long-term Gas Price ($ / Mcf)
Inte
rnal
Rat
e o
f R
etu
rn (
%) $1.75 $2.00 $2.25
Source: RJ&A Estimates
How Far Do Oil & Gas Prices Need to How Far Do Oil & Gas Prices Need to Fall Before Activity Slows?Fall Before Activity Slows?
34
Our Take:Our Take: Long-term price expectations (or 2 yr. strip) must fall Long-term price expectations (or 2 yr. strip) must fall
below $6 gas and $50 crudebelow $6 gas and $50 crude Short-term spike to $5 range will Short-term spike to $5 range will NOTNOT slow activity slow activity Most think gas pull-back will be short-livedMost think gas pull-back will be short-lived Many E&P companies have hedged @ higher pricesMany E&P companies have hedged @ higher prices E&P companies are flush with cash & prospectsE&P companies are flush with cash & prospects If E&P companies “lay down” a rig, they move to the If E&P companies “lay down” a rig, they move to the
“back of the line.”“back of the line.”
Will the Service Industry Over-Build Will the Service Industry Over-Build Rigs & Oilfield Equipment?Rigs & Oilfield Equipment?
35
Our Take:Our Take:
Global rig fleet will grow 10-15% per year over the Global rig fleet will grow 10-15% per year over the next 5 years.next 5 years.
Rig new build costs will rise & Rig new build costs will rise & demand will exceed demand will exceed supplysupply for the entire period for the entire period

History LessonHistory Lesson
36
Historic Average U.S. Rig Count
500
1000
1500
2000
2500
3000
3500
4000
4500
5000
5500
6000
1973
1974
1975
1976
1977
1978
1979
1980
1981
1982
Rig
Co
un
t
0.0%
3.0%
6.0%
9.0%
12.0%
15.0%
18.0%
21.0%
24.0%
27.0%
30.0%
33.0%Total U.S. Rigs AvailableRig Build Rate
Source: ReedHycalog, RJ&A
12.6% average growth rate
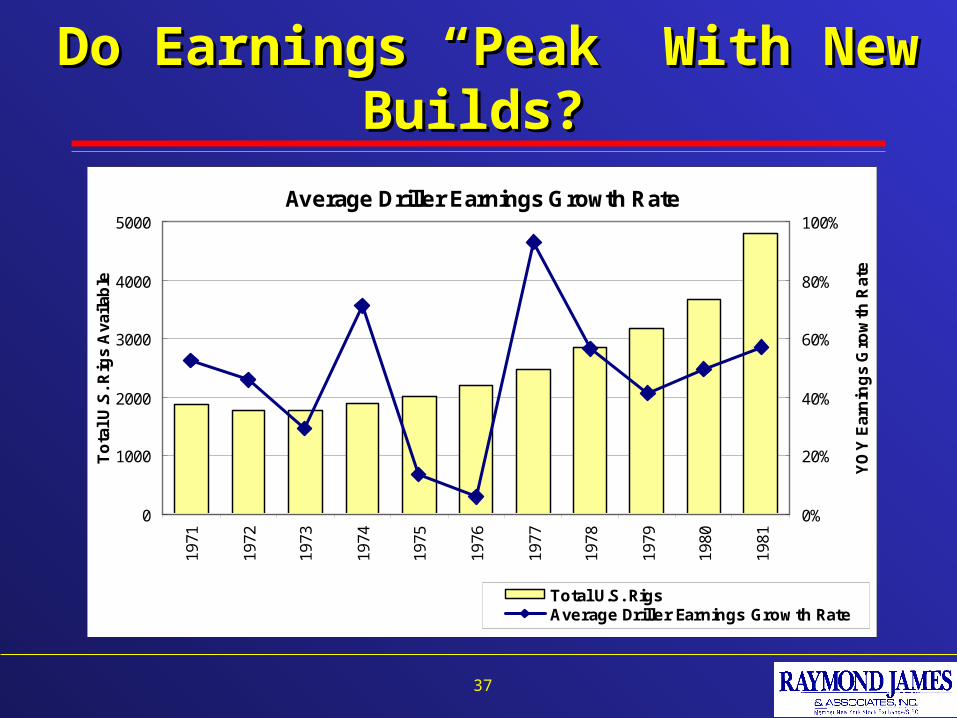
Do Earnings “Peak” With New Builds?Do Earnings “Peak” With New Builds?
37
Average Driller Earnings Growth Rate
0
1000
2000
3000
4000
5000
1971
1972
1973
1974
1975
1976
1977
1978
1979
1980
1981
To
tal U
.S. R
igs
Ava
ilab
le
0%
20%
40%
60%
80%
100%
YO
Y E
arn
ing
s G
row
th R
ate
Total U.S. RigsAverage Driller Earnings Growth RateSource: Factset, Reedhycalog
Companies Included: GSF, RDC, HP, NBR, PKD
(10 yr. growth rate = 46%)
ConclusionConclusion
38
Longer-term bullish secular move is still intactLonger-term bullish secular move is still intact
Oil & gas supply is not responding to rigsOil & gas supply is not responding to rigs
Oil prices are signaling that demand Oil prices are signaling that demand must must slowslow
Oil wildcards are not going awayOil wildcards are not going away
Gas could be near a bottomGas could be near a bottom

DisclaimerDisclaimer
Important Investor Disclosures. Stock Ratings: Within our four-tiered rating system, Strong Buy means that the stock is expected to appreciate and produce
a total return of at least 15% and outperform the S&P 500 over the next six months; Outperform means the stock is expected to appreciate and outperform the S&P 500 over the next 12 months; Market Perform means the stock is expected to perform generally in line with the S&P 500 over the next 12 months and is potentially a source of funds for more highly rated securities; and Underperform means the stock is expected to underperform the S&P 500 or its sector over the next six to 12 months and should be sold.
Out of approximately 519 stocks in the Raymond James coverage universe, 52% have Strong Buy or Outperform ratings, 35% are rated Market Perform and 12% are rated Underperform. Within those rating categories, 25% of the Strong Buy- or Outperform-rated companies either currently are or have been Raymond James Investment Banking clients within the past three years; 17% of the Market Perform-rated companies are or have been clients and 9% of the Underperform-rated companies are or have been clients.
Analyst Holdings and Compensation: Equity analysts and their staffs at Raymond James are compensated based on a salary and bonus system. Several factors enter into the bonus determination including the analyst’s success in rating stocks versus an industry index, support effectiveness to the retail and institutional sales forces, traders, and investment bankers, institutional research votes, as well as overall productivity and revenue generated in covered stocks.
Raymond James Relationships: Raymond James & Associates may make a market in stocks mentioned in this report and may have managed/co-managed a public/follow-on offering of these shares or otherwise provided investment banking services to companies mentioned in this report in the past three years.
RJA or its officers, employees, or affiliates may (1) currently own shares, options, rights or warrants and/or (2) execute transactions in the securities mentioned in this report that may or may not be consistent with this report's conclusions.
Disclosure information, as well as more information on the Raymond James rating system and suitability categories, is available at www.rjcapitalmarkets.com/SearchForDisclosures_main.asp. Copies of research can be obtained by contacting any Raymond James & Associates or Raymond James Financial Services office (please see www.rjf.com for office locations) or by sending a written request to the Equity Research Library, Raymond James & Associates, Inc., Tower 3, 6th Floor, 880 Carillon Parkway, St. Petersburg, FL 33716.
Additional information is available on request. This document may not be reprinted without permission.
39
Related Documents