RATIO ANALYSIS Very Useful Material

Welcome message from author
This document is posted to help you gain knowledge. Please leave a comment to let me know what you think about it! Share it to your friends and learn new things together.
Transcript

8/22/2019 Ratios - Study ppt.
http://slidepdf.com/reader/full/ratios-study-ppt 1/35
RATIO ANALYSIS
Very Useful Material

8/22/2019 Ratios - Study ppt.
http://slidepdf.com/reader/full/ratios-study-ppt 2/35
Ratio-analysis means the process of computing, determining and presenting the
relationship of related items and groups of
items of the financial statements. Theyprovide in a summarized and concise form
of fairly good idea about the financial
position of a unit. They are important toolsfor financial analysis.
RATIO ANALYSIS

8/22/2019 Ratios - Study ppt.
http://slidepdf.com/reader/full/ratios-study-ppt 3/35
RATIO ANALYSIS
It’s a tool which enables the banker or lender toarrive at the following factors :
Liquidity position
Profitability Solvency
Financial Stability
Quality of the Management Safety & Security of the loans & advances to be
or already been provided

8/22/2019 Ratios - Study ppt.
http://slidepdf.com/reader/full/ratios-study-ppt 4/35
HOW A RATIO IS EXPRESSED?
As Percentage - such as 25% or 50% . For example if net profit is Rs.25,000/- and the sales isRs.1,00,000/- then the net profit can be said to be25% of the sales.
As Proportion - The above figures may beexpressed in terms of the relationship between netprofit to sales as 1 : 4.
As Pure Number /Times - The same can also beexpressed in an alternatively way such as the saleis 4 times of the net profit or profit is 1/4th of thesales.
8/22/2019 Ratios - Study ppt.
http://slidepdf.com/reader/full/ratios-study-ppt 5/35
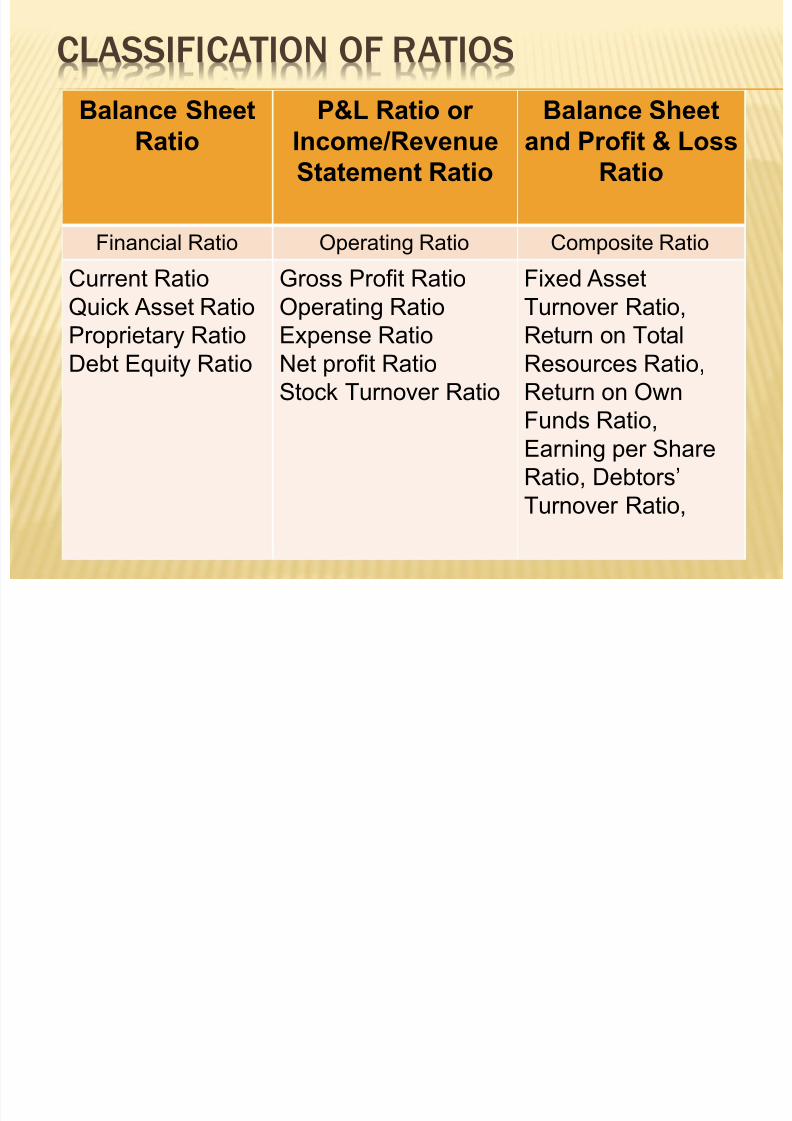
CLASSIFICATION OF RATIOS
Balance Sheet
Ratio
P&L Ratio or
Income/RevenueStatement Ratio
Balance Sheet
and Profit & LossRatio
Financial Ratio Operating Ratio Composite Ratio
Current RatioQuick Asset Ratio
Proprietary Ratio
Debt Equity Ratio
Gross Profit RatioOperating Ratio
Expense Ratio
Net profit Ratio
Stock Turnover Ratio
Fixed AssetTurnover Ratio,
Return on Total
Resources Ratio,
Return on Own
Funds Ratio,
Earning per Share
Ratio, Debtors’
Turnover Ratio,

8/22/2019 Ratios - Study ppt.
http://slidepdf.com/reader/full/ratios-study-ppt 6/35
FORMAT OF BALANCE SHEET FOR RATIO ANALYSISLIABILITIES ASSETS
NET WORTH/EQUITY/OWNED FUNDS
Share Capital/Partner’s Capital/Paid up
Capital/ Owners FundsReserves ( General, Capital, Revaluation &
Other Reserves)
Credit Balance in P&L A/c
FIXED ASSETS : LAND & BUILDING, PLANT
& MACHINERIES
Original Value Less DepreciationNet Value or Book Value or Written down value
LONG TERM LIABILITIES/BORROWED
FUNDS : Term Loans (Banks & Institutions)
Debentures/Bonds, Unsecured Loans, FixedDeposits, Other Long Term Liabilities
NON CURRENT ASSETS
Investments in quoted shares & securities
Old stocks or old/disputed book debtsLong Term Security Deposits
Other Misc. assets which are not current or
fixed in nature
CURRENT LIABILTIES
Bank Working Capital Limits such as
CC/OD/Bills/Export Credit
Sundry /Trade Creditors/Creditors/Bills
Payable, Short duration loans or deposits
Expenses payable & provisions against various
items
CURRENT ASSETS : Cash & Bank Balance,
Marketable/quoted Govt. or other securities,
Book Debts/Sundry Debtors, Bills Receivables,
Stocks & inventory (RM,SIP,FG) Stores &
Spares, Advance Payment of Taxes, Prepaid
expenses, Loans and Advances recoverable
within 12 months
INTANGIBLE ASSETS
Patent, Goodwill, Debit balance in P&L A/c,
Preliminary or Preoperative expenses

8/22/2019 Ratios - Study ppt.
http://slidepdf.com/reader/full/ratios-study-ppt 7/35
SOME IMPORTANT NOTES
Liabilities have Credit balance and Assets have Debit
balance
Current Liabilities are those which have either become due
for payment or shall fall due for payment within 12 months
from the date of Balance Sheet
Current Assets are those which undergo change in their
shape/form within 12 months. These are also called
Working Capital or Gross Working Capital
Net Worth & Long Term Liabilities are also called Long
Term Sources of Funds
Current Liabilities are known as Short Term Sou rces of
Funds
Long Term Liabilities & Short Term Liabilities are also called
8/22/2019 Ratios - Study ppt.
http://slidepdf.com/reader/full/ratios-study-ppt 8/35
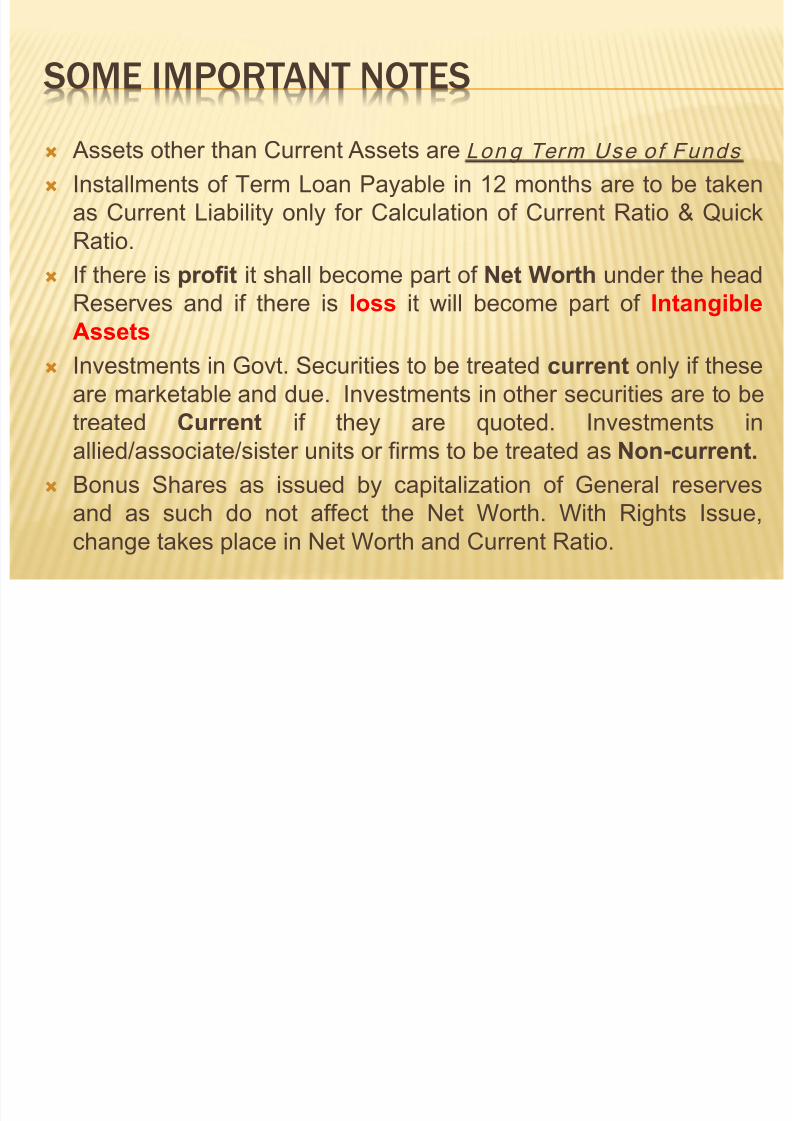
SOME IMPORTANT NOTES
Assets other than Current Assets are Long Term Use of Funds
Installments of Term Loan Payable in 12 months are to be taken
as Current Liability only for Calculation of Current Ratio & Quick
Ratio.
If there is profit it shall become part of Net Worth under the headReserves and if there is loss it will become part of Intangible
Assets
Investments in Govt. Securities to be treated current only if these
are marketable and due. Investments in other securities are to be
treated Current if they are quoted. Investments in
allied/associate/sister units or firms to be treated as Non-current.
Bonus Shares as issued by capitalization of General reserves
and as such do not affect the Net Worth. With Rights Issue,
change takes place in Net Worth and Current Ratio.
8/22/2019 Ratios - Study ppt.
http://slidepdf.com/reader/full/ratios-study-ppt 9/35
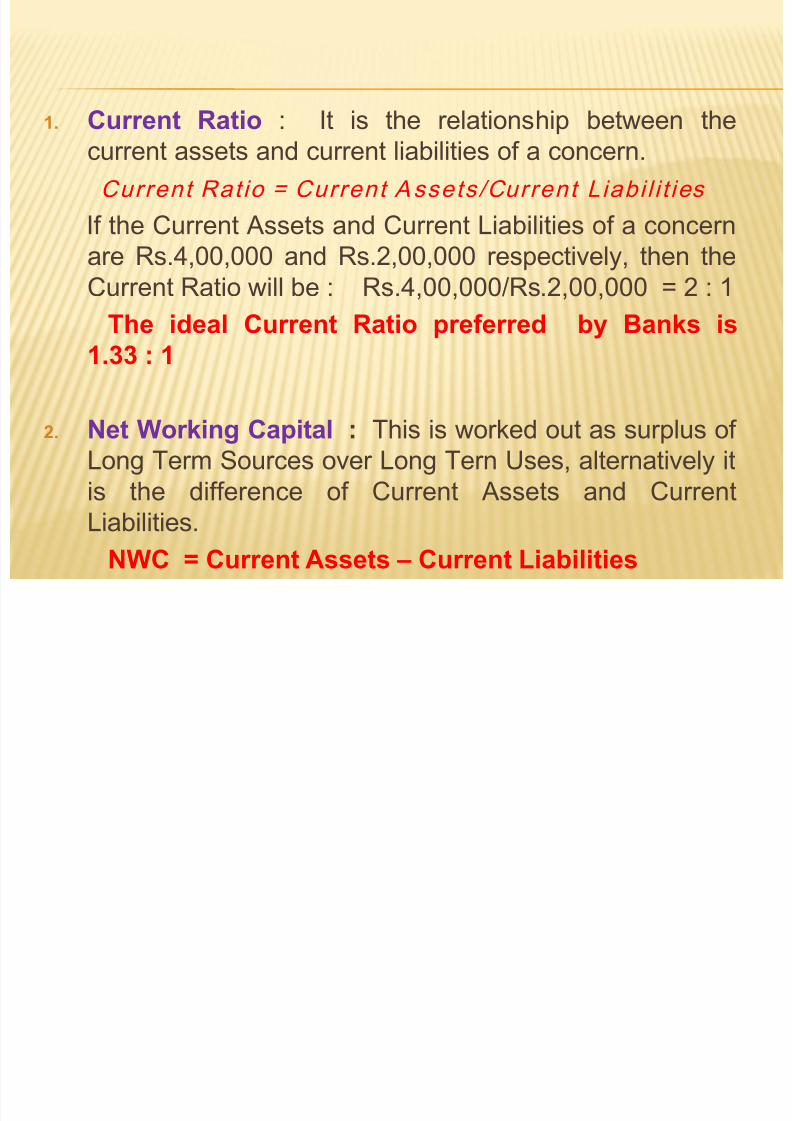
1. Current Ratio : It is the relationship between the
current assets and current liabilities of a concern.
Current Ratio = Current Assets/Current Liabi l i t ies
If the Current Assets and Current Liabilities of a concern
are Rs.4,00,000 and Rs.2,00,000 respectively, then the
Current Ratio will be : Rs.4,00,000/Rs.2,00,000 = 2 : 1
The ideal Current Ratio preferred by Banks is
1.33 : 1
2. Net Working Capital : This is worked out as surplus of
Long Term Sources over Long Tern Uses, alternatively it
is the difference of Current Assets and Current
Liabilities.
NWC = Current Assets – Current Liabilities

8/22/2019 Ratios - Study ppt.
http://slidepdf.com/reader/full/ratios-study-ppt 10/35
Current Assets : Raw Material, Stores, Spares, Work-in Progress. Finished
Goods, Debtors, Bills Receivables, Cash.
Current Liabilities : Sundry Creditors, Installments of Term Loan, DPG etc.
payable within one year and other liabilities payable within one year.
This ratio must be at least 1.33 : 1 to ensure minimum margin of 25% of current
assets as margin from long term sources.
Current Ratio measures short term liquidity of the concern and its ability to
meet its short term obligations within a time span of a year.
It shows the liquidity position of the enterprise and its ability to meet current
obligations in time.
Higher ratio may be good from the point of view of creditors. In the long run
very high current ratio may affect profitability ( e.g. high inventory carrying cost) Shows the liquidity at a particular point of time. The position can change
immediately after that date. So trend of the current ratio over the years to be
analyzed.
Current Ratio is to be studied with the changes of NWC. It is also necessary to
look at this ratio along with the Debt-Equity ratio.

8/22/2019 Ratios - Study ppt.
http://slidepdf.com/reader/full/ratios-study-ppt 11/35
3. ACID TEST or QUICK RATIO : It is the ratio between Quick Current Assets and Current Liabilities. The should be at least equal to 1.
Quick Current Assets : Cash/Bank Balances + Receivables upto 6 months +Quickly realizable securities such as Govt. Securities or quickly marketable/quotedshares and Bank Fixed Deposits
Acid Test or Quick Ratio = Quick Current Assets/Current Liabilities
Example :Cash 50,000Debtors 1,00,000Inventories 1,50,000 Current Liabilities 1,00,000
Total Current Assets 3,00,000
Current Ratio = > 3,00,000/1,00,000 = 3 : 1Quick Ratio = > 1,50,000/1,00,000 = 1.5 : 1
8/22/2019 Ratios - Study ppt.
http://slidepdf.com/reader/full/ratios-study-ppt 12/35
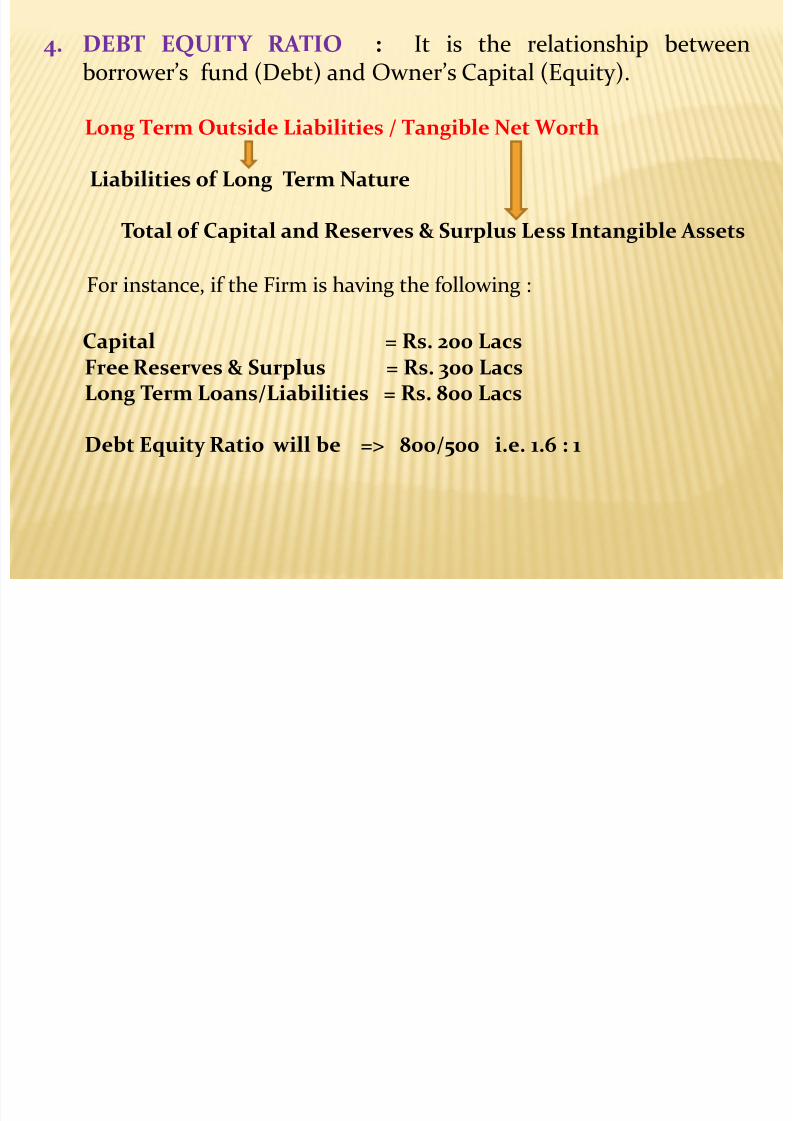
4. DEBT EQUITY RATIO : It is the relationship betweenborrower’s fund (Debt) and Owner’s Capital (Equity).
Long Term Outside Liabilities / Tangible Net Worth
Liabilities of Long Term Nature
Total of Capital and Reserves & Surplus Less Intangible Assets
For instance, if the Firm is having the following :
Capital = Rs. 200 LacsFree Reserves & Surplus = Rs. 300 LacsLong Term Loans/Liabilities = Rs. 800 Lacs
Debt Equity Ratio will be => 800/500 i.e. 1.6 : 1

8/22/2019 Ratios - Study ppt.
http://slidepdf.com/reader/full/ratios-study-ppt 13/35
5. PROPRIETARY RATIO : This ratio indicates the extent to whichTangible Assets are financed by Owner’s Fund.Proprietary Ratio = (Tangible Net Worth/Total Tangible
Assets) x 100The ratio will be 100% when there is no Borrowing for purchasingof Assets.
6. GROSS PROFIT RATIO : By comparing Gross Profit percentage to
Net Sales we can arrive at the Gross Profit Ratio which indicates themanufacturing efficiency as well as the pricing policy of the concern.
Gross Profit Ratio = (Gross Profit / Net Sales ) x 100
Alternatively , since Gross Profit is equal to Sales minus Cost of Goods Sold, it can also be interpreted as below :
Gross Profit Ratio = [ (Sales – Cost of goods sold)/ Net Sales]x 100
A higher Gross Profit Ratio indicates efficiency in production of the unit.
8/22/2019 Ratios - Study ppt.
http://slidepdf.com/reader/full/ratios-study-ppt 14/35
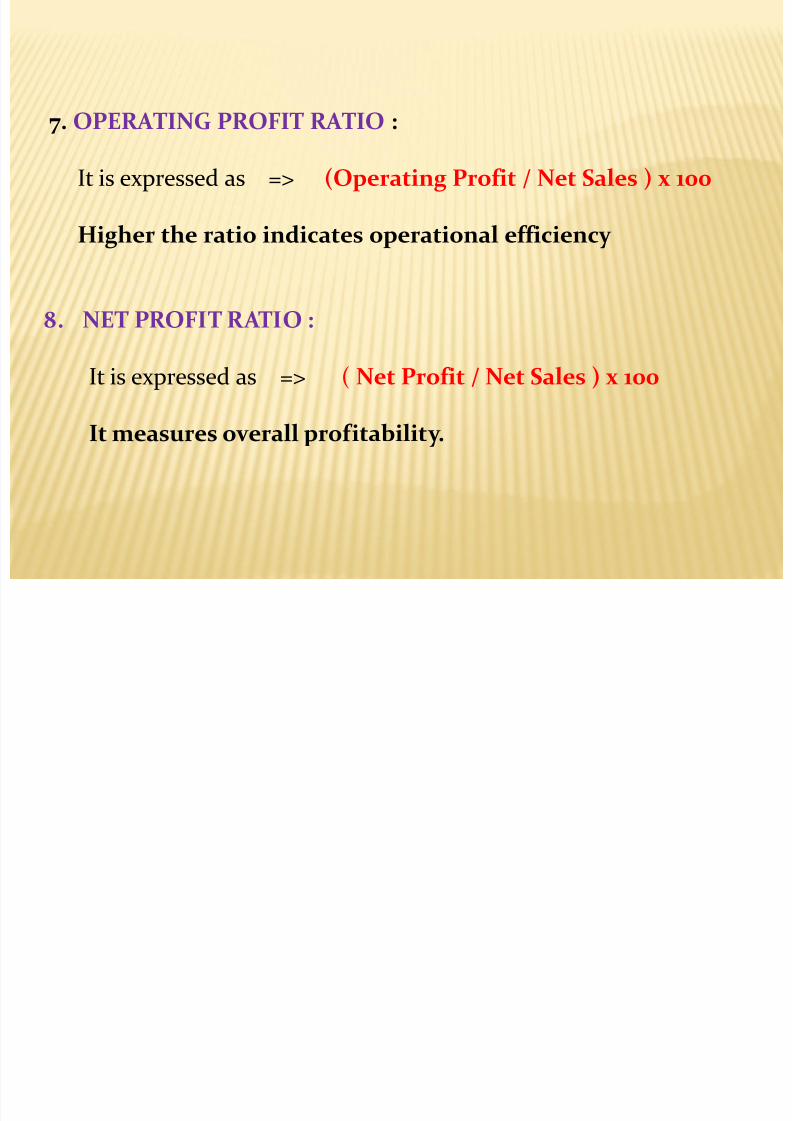
7. OPERATING PROFIT RATIO :
It is expressed as => (Operating Profit / Net Sales ) x 100
Higher the ratio indicates operational efficiency
8. NET PROFIT RATIO :
It is expressed as => ( Net Profit / Net Sales ) x 100
It measures overall profitability.
8/22/2019 Ratios - Study ppt.
http://slidepdf.com/reader/full/ratios-study-ppt 15/35
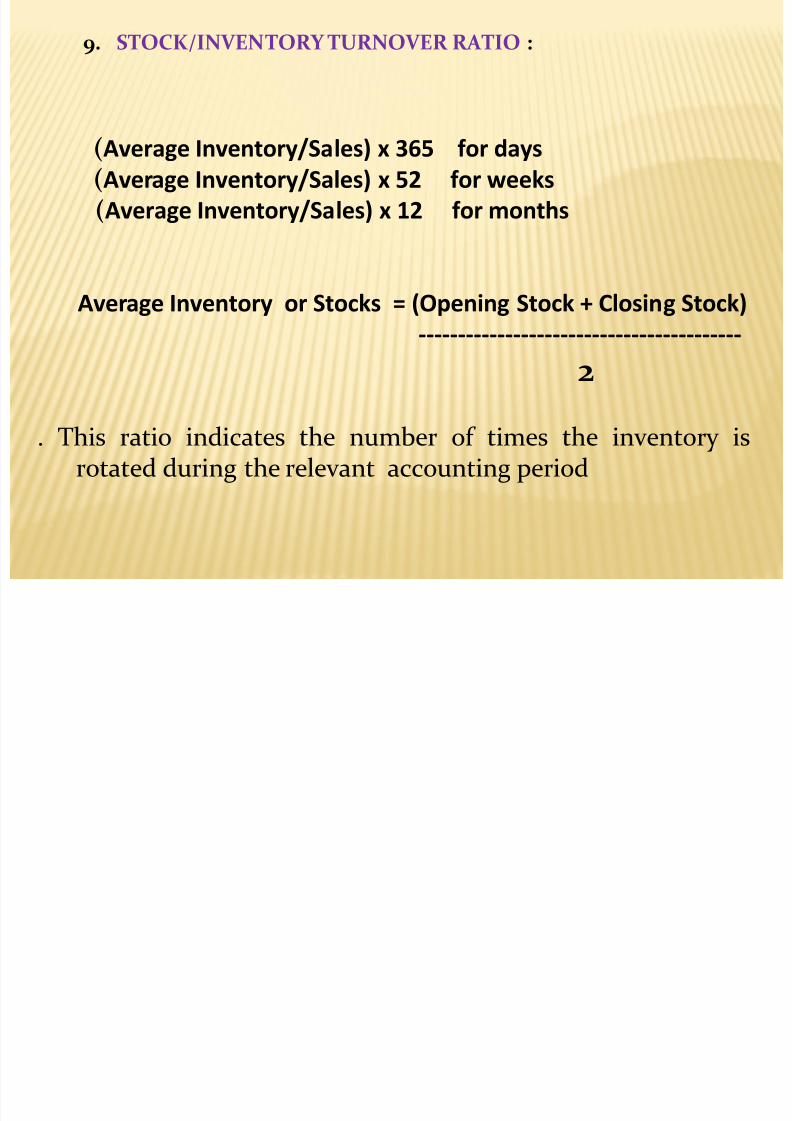
9. STOCK/INVENTORY TURNOVER RATIO :
(Average Inventory/Sales) x 365 for days
(Average Inventory/Sales) x 52 for weeks
(Average Inventory/Sales) x 12 for months
Average Inventory or Stocks = (Opening Stock + Closing Stock)
-----------------------------------------
2
. This ratio indicates the number of times the inventory isrotated during the relevant accounting period
8/22/2019 Ratios - Study ppt.
http://slidepdf.com/reader/full/ratios-study-ppt 16/35
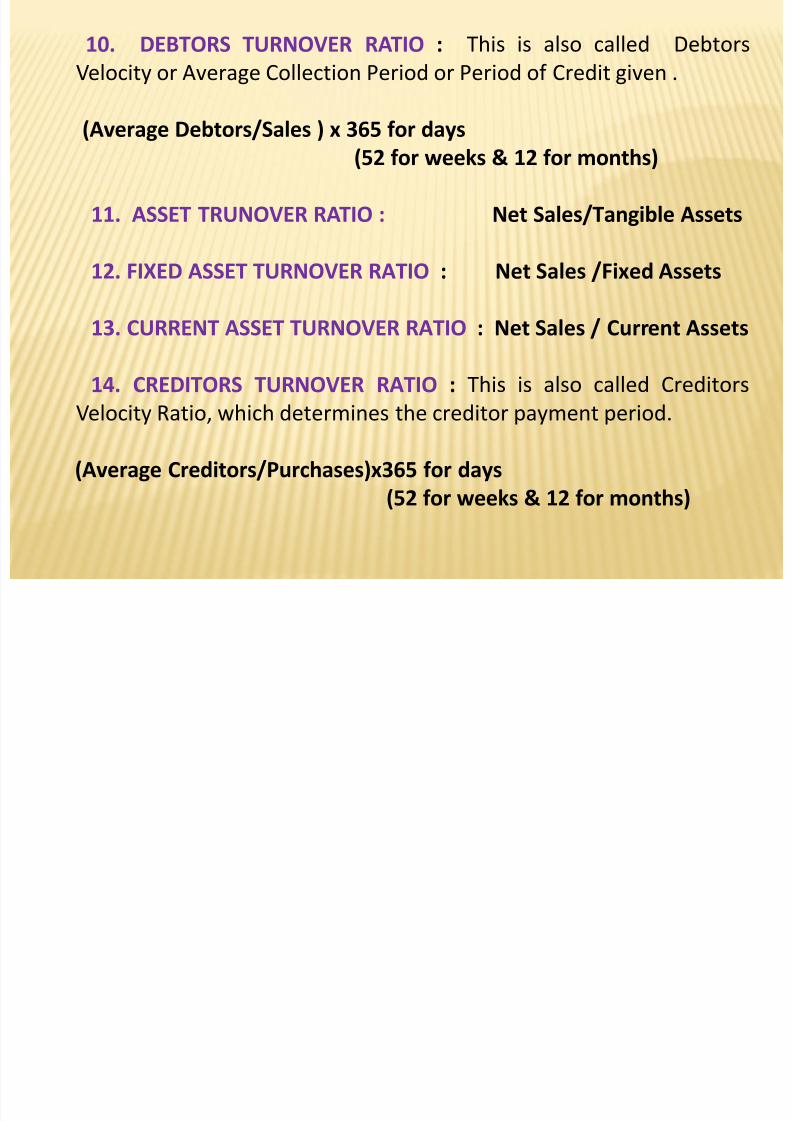
10. DEBTORS TURNOVER RATIO : This is also called Debtors
Velocity or Average Collection Period or Period of Credit given .
(Average Debtors/Sales ) x 365 for days(52 for weeks & 12 for months)
11. ASSET TRUNOVER RATIO : Net Sales/Tangible Assets
12. FIXED ASSET TURNOVER RATIO : Net Sales /Fixed Assets
13. CURRENT ASSET TURNOVER RATIO : Net Sales / Current Assets
14. CREDITORS TURNOVER RATIO : This is also called Creditors
Velocity Ratio, which determines the creditor payment period.
(Average Creditors/Purchases)x365 for days
(52 for weeks & 12 for months)

8/22/2019 Ratios - Study ppt.
http://slidepdf.com/reader/full/ratios-study-ppt 17/35
15. RETRUN ON ASSETS : Net Profit after Taxes/Total Assets
16. RETRUN ON CAPITAL EMPLOYED :
( Net Profit before Interest & Tax / Average Capital Employed) x 100
Average Capital Employed is the average of the equity share
capital and long term funds provided by the owners and the
creditors of the firm at the beginning and end of the accounting
period.

8/22/2019 Ratios - Study ppt.
http://slidepdf.com/reader/full/ratios-study-ppt 18/35
Composite Ratio
17. RETRUN ON EQUITY CAPITAL (ROE) :
Net Profit after Taxes / Tangible Net Worth
18. EARNING PER SHARE : EPS indicates the quantum of net profit
of the year that would be ranking for dividend for each share of
the company being held by the equity share holders.
Net profit after Taxes and Preference Dividend/ No. of Equity
Shares
19. PRICE EARNING RATIO : PE Ratio indicates the number of times
the Earning Per Share is covered by its market price.
Market Price Per Equity Share/Earning Per Share
8/22/2019 Ratios - Study ppt.
http://slidepdf.com/reader/full/ratios-study-ppt 19/35
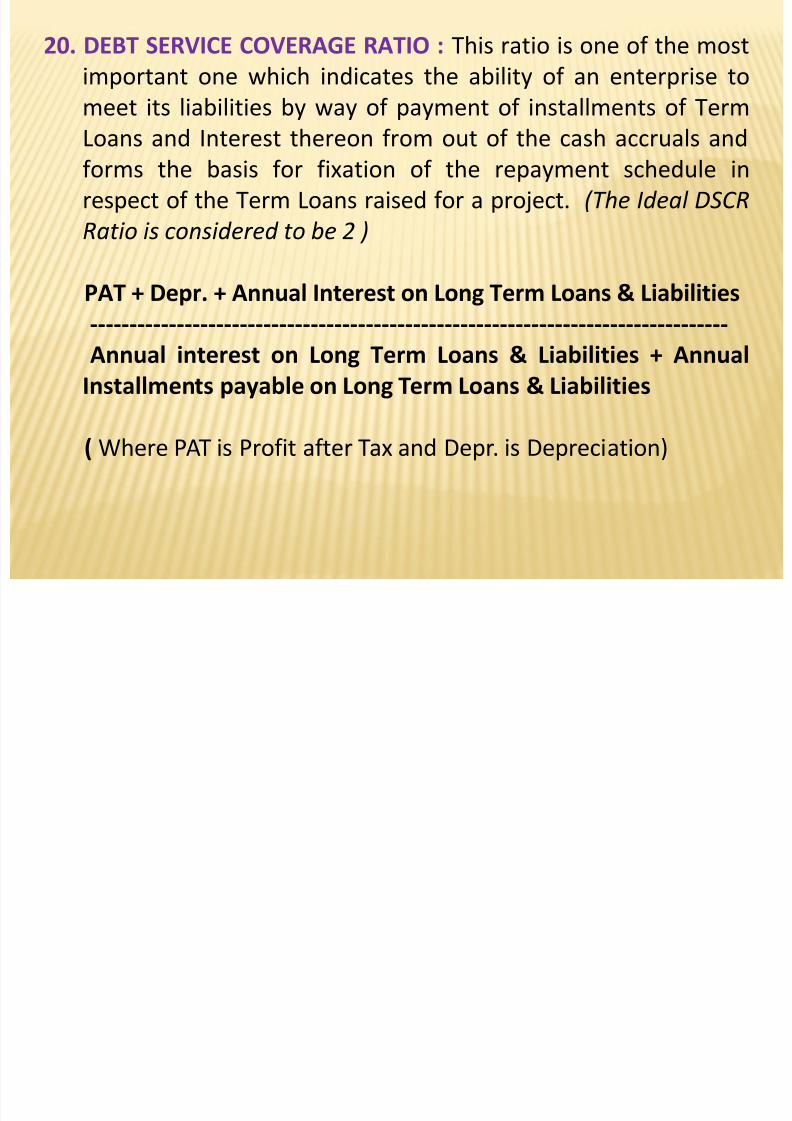
20. DEBT SERVICE COVERAGE RATIO : This ratio is one of the most
important one which indicates the ability of an enterprise to
meet its liabilities by way of payment of installments of Term
Loans and Interest thereon from out of the cash accruals andforms the basis for fixation of the repayment schedule in
respect of the Term Loans raised for a project. (The Ideal DSCR
Ratio is considered to be 2 )
PAT + Depr. + Annual Interest on Long Term Loans & Liabilities
---------------------------------------------------------------------------------
Annual interest on Long Term Loans & Liabilities + Annual
Installments payable on Long Term Loans & Liabilities
( Where PAT is Profit after Tax and Depr. is Depreciation)
EXERCISE 1

8/22/2019 Ratios - Study ppt.
http://slidepdf.com/reader/full/ratios-study-ppt 20/35
LIABILITES ASSETS
Capital 180 Net Fixed Assets 400
Reserves 20 Inventories 150
Term Loan 300 Cash 50
Bank C/C 200 Receivables 150
Trade Creditors 50 Goodwill 50
Provisions 50
800 800
EXERCISE 1
a. What is the Net Worth : Capital + Reserve = 200
b. Tangible Net Worth is : Net Worth - Goodwill = 150
c. Outside Liabilities : TL + CC + Creditors + Provisions = 600
d. Net Working Capital : C A - C L = 350 - 250 = 50e. Current Ratio : C A / C L = 350 / 300 = 1.17 : 1
f. Quick Ratio : Quick Assets / C L = 200/300 = 0.66 : 1
EXERCISE 2
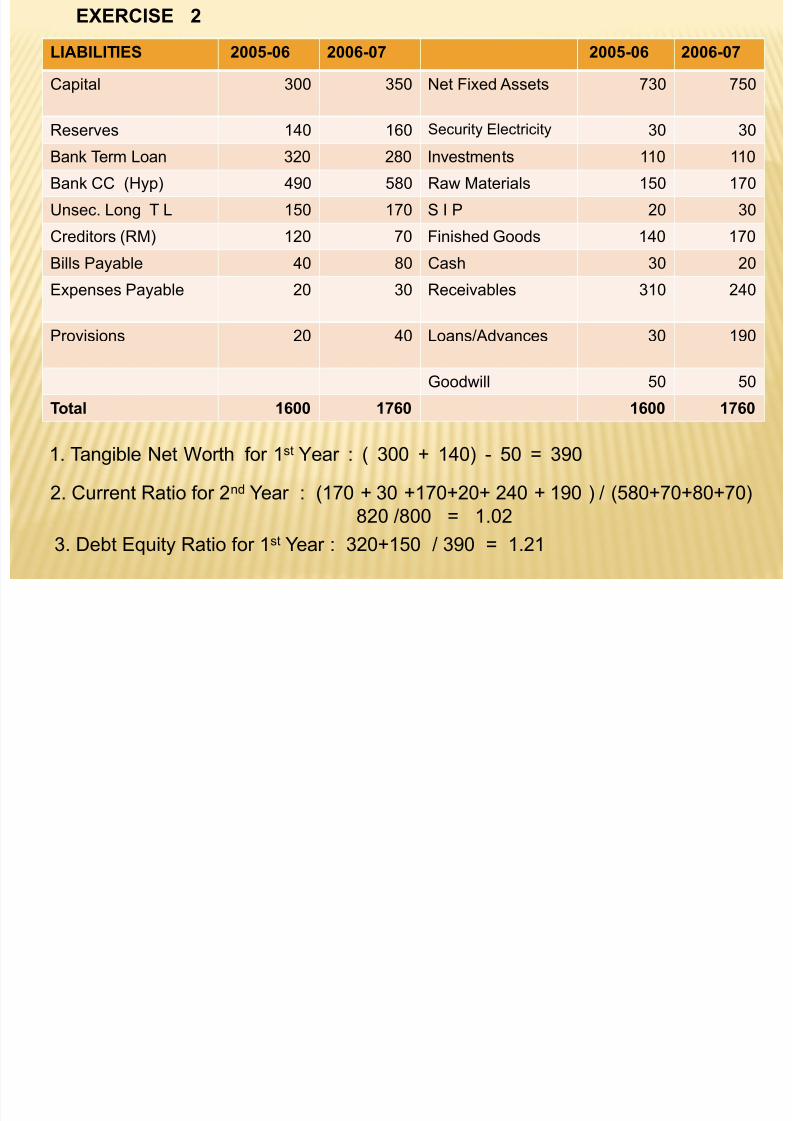
8/22/2019 Ratios - Study ppt.
http://slidepdf.com/reader/full/ratios-study-ppt 21/35
EXERCISE 2
LIABILITIES 2005-06 2006-07 2005-06 2006-07
Capital 300 350 Net Fixed Assets 730 750
Reserves 140 160Security Electricity
30 30Bank Term Loan 320 280 Investments 110 110
Bank CC (Hyp) 490 580 Raw Materials 150 170
Unsec. Long T L 150 170 S I P 20 30
Creditors (RM) 120 70 Finished Goods 140 170
Bills Payable 40 80 Cash 30 20
Expenses Payable 20 30 Receivables 310 240
Provisions 20 40 Loans/Advances 30 190
Goodwill 50 50
Total 1600 1760 1600 1760
1. Tangible Net Worth for 1st Year : ( 300 + 140) - 50 = 390
2. Current Ratio for 2nd Year : (170 + 30 +170+20+ 240 + 190 ) / (580+70+80+70)
820 /800 = 1.02
3. Debt Equity Ratio for 1st Year : 320+150 / 390 = 1.21
8/22/2019 Ratios - Study ppt.
http://slidepdf.com/reader/full/ratios-study-ppt 22/35
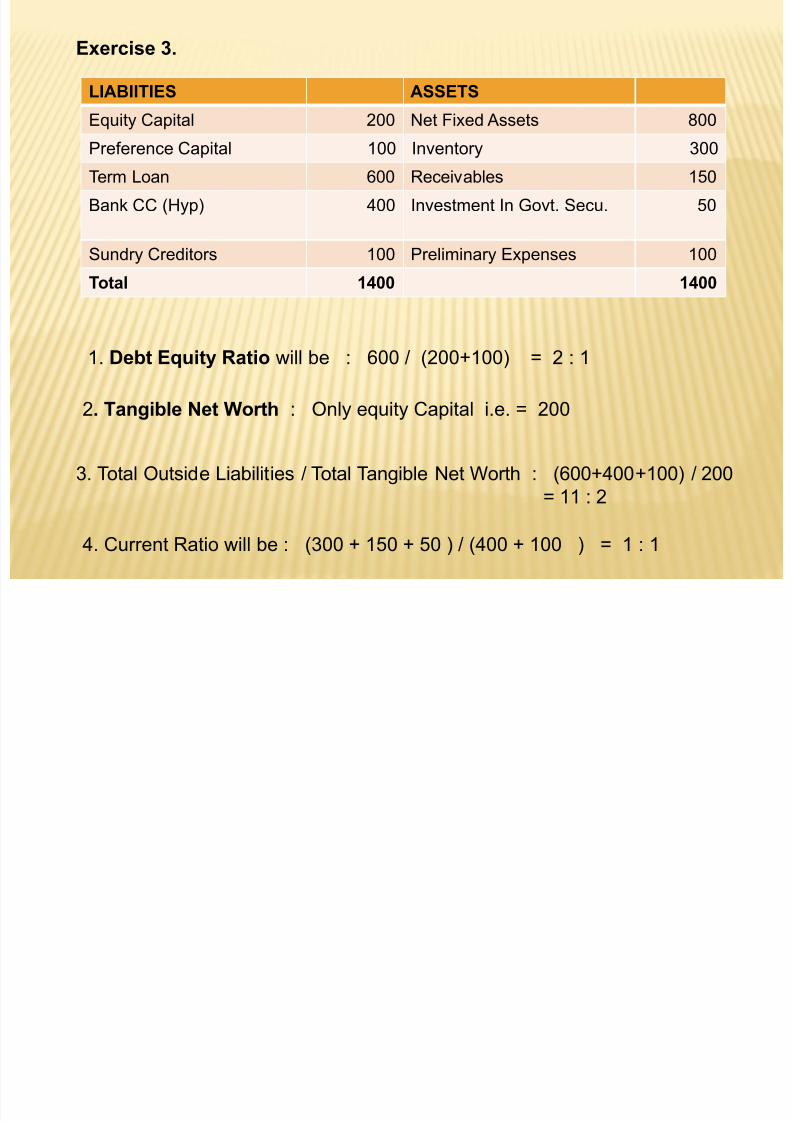
Exercise 3.
LIABIITIES ASSETS
Equity Capital 200 Net Fixed Assets 800
Preference Capital 100 Inventory 300
Term Loan 600 Receivables 150
Bank CC (Hyp) 400 Investment In Govt. Secu. 50
Sundry Creditors 100 Preliminary Expenses 100
Total 1400 1400
1. Debt Equity Ratio will be : 600 / (200+100) = 2 : 1
2. Tangible Net Worth : Only equity Capital i.e. = 200
3. Total Outside Liabilities / Total Tangible Net Worth : (600+400+100) / 200
= 11 : 2
4. Current Ratio will be : (300 + 150 + 50 ) / (400 + 100 ) = 1 : 1
8/22/2019 Ratios - Study ppt.
http://slidepdf.com/reader/full/ratios-study-ppt 23/35
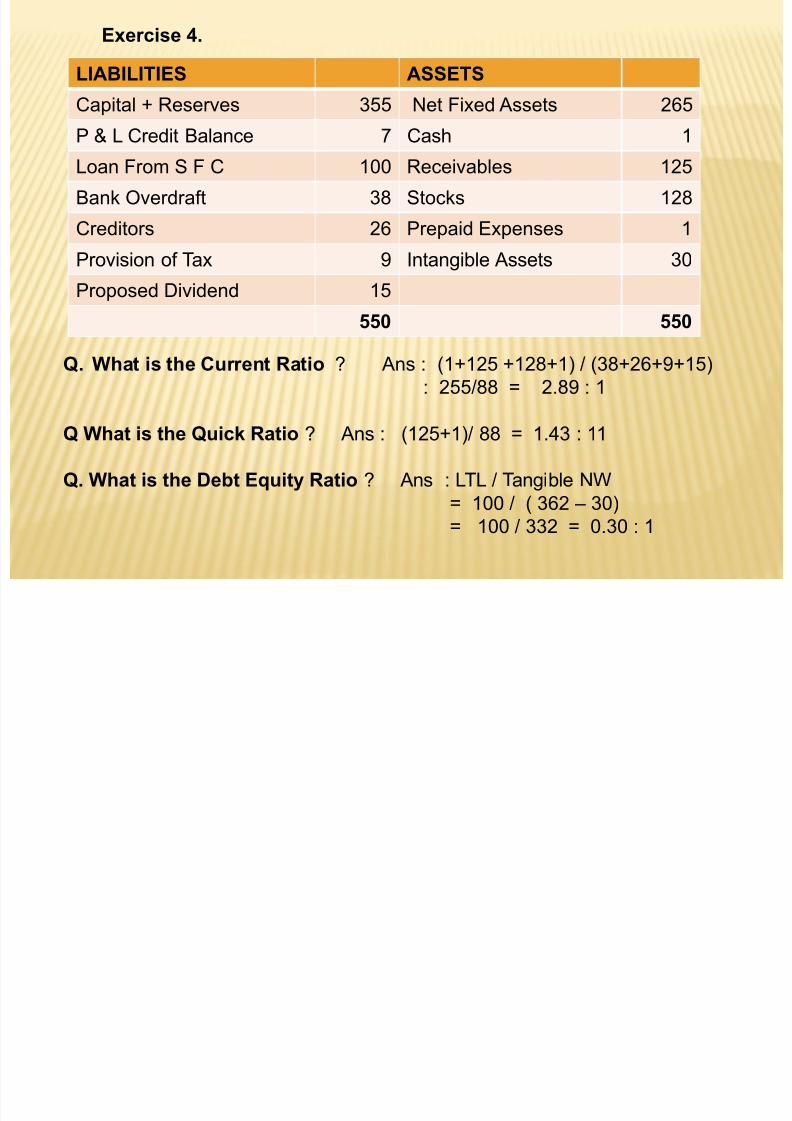
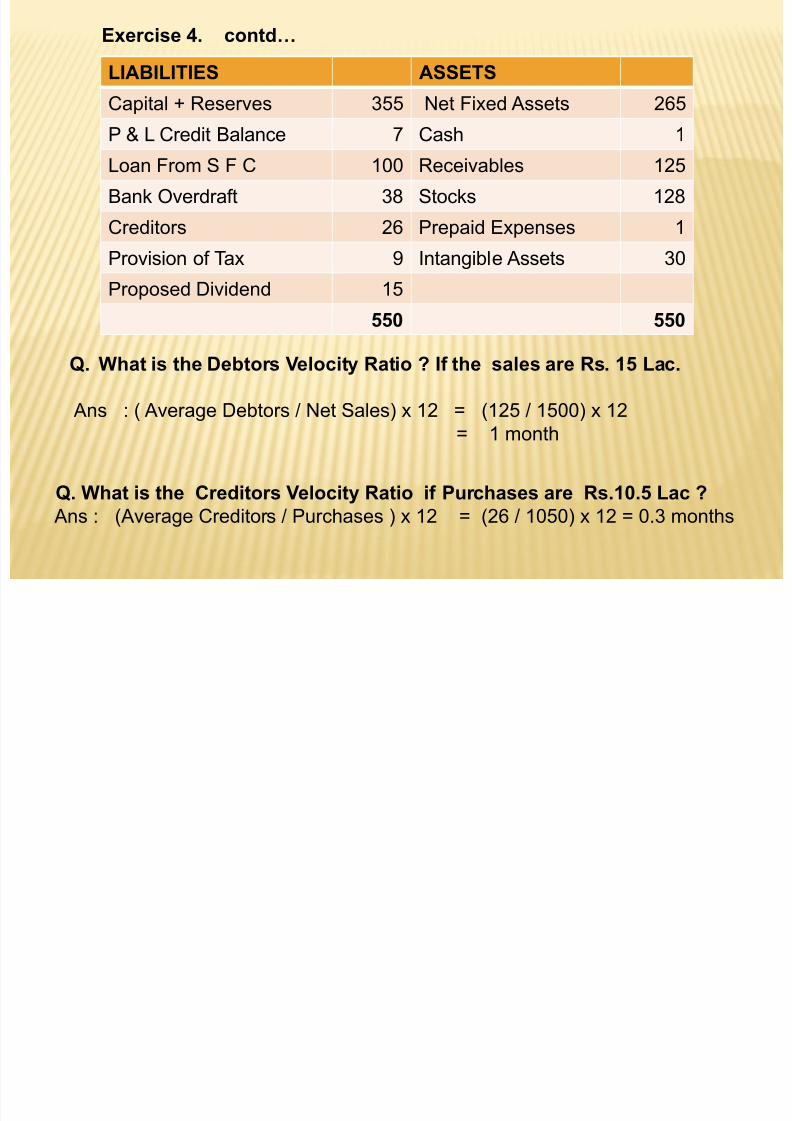
LIABILITIES ASSETS
Capital + Reserves 355 Net Fixed Assets 265
P & L Credit Balance 7 Cash 1Loan From S F C 100 Receivables 125
Bank Overdraft 38 Stocks 128
Creditors 26 Prepaid Expenses 1
Provision of Tax 9 Intangible Assets 30
Proposed Dividend 15
550 550
Q. What is the Current Ratio ? Ans : (1+125 +128+1) / (38+26+9+15)
: 255/88 = 2.89 : 1
Q What is the Quick Ratio ? Ans : (125+1)/ 88 = 1.43 : 11
Q. What is the Debt Equity Ratio ? Ans : LTL / Tangible NW
= 100 / ( 362 – 30)
= 100 / 332 = 0.30 : 1
Exercise 4.
8/22/2019 Ratios - Study ppt.
http://slidepdf.com/reader/full/ratios-study-ppt 24/35
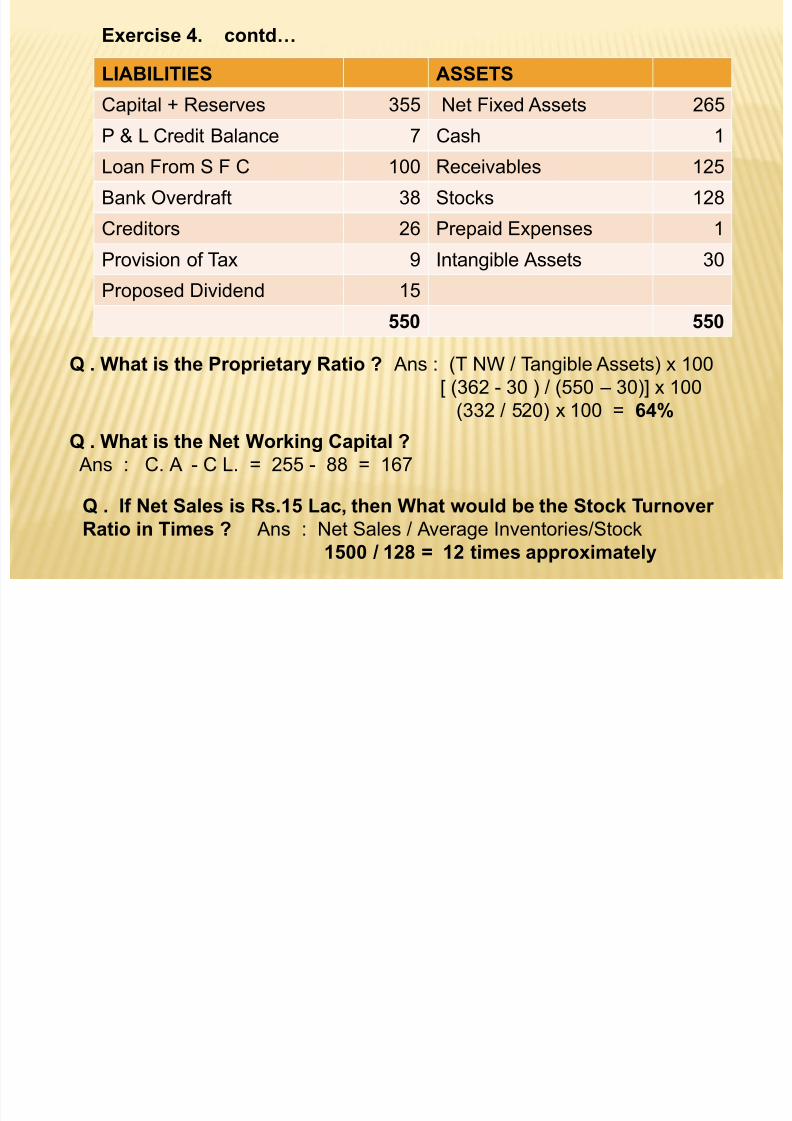
LIABILITIES ASSETS
Capital + Reserves 355 Net Fixed Assets 265
P & L Credit Balance 7 Cash 1Loan From S F C 100 Receivables 125
Bank Overdraft 38 Stocks 128
Creditors 26 Prepaid Expenses 1
Provision of Tax 9 Intangible Assets 30
Proposed Dividend 15
550 550
Q . What is the Proprietary Ratio ? Ans : (T NW / Tangible Assets) x 100
[ (362 - 30 ) / (550 – 30)] x 100
(332 / 520) x 100 = 64%
Q . What is the Net Working Capital ?
Ans : C. A - C L. = 255 - 88 = 167
Q . If Net Sales is Rs.15 Lac, then What would be the Stock Turnover
Ratio in Times ? Ans : Net Sales / Average Inventories/Stock
1500 / 128 = 12 times approximately
Exercise 4. contd…
8/22/2019 Ratios - Study ppt.
http://slidepdf.com/reader/full/ratios-study-ppt 25/35
LIABILITIES ASSETS
Capital + Reserves 355 Net Fixed Assets 265
P & L Credit Balance 7 Cash 1Loan From S F C 100 Receivables 125
Bank Overdraft 38 Stocks 128
Creditors 26 Prepaid Expenses 1
Provision of Tax 9 Intangible Assets 30
Proposed Dividend 15
550 550
Q. What is the Debtors Velocity Ratio ? If the sales are Rs. 15 Lac.
Ans : ( Average Debtors / Net Sales) x 12 = (125 / 1500) x 12= 1 month
Q. What is the Creditors Velocity Ratio if Purchases are Rs.10.5 Lac ?
Ans : (Average Creditors / Purchases ) x 12 = (26 / 1050) x 12 = 0.3 months
Exercise 4. contd…
8/22/2019 Ratios - Study ppt.
http://slidepdf.com/reader/full/ratios-study-ppt 26/35
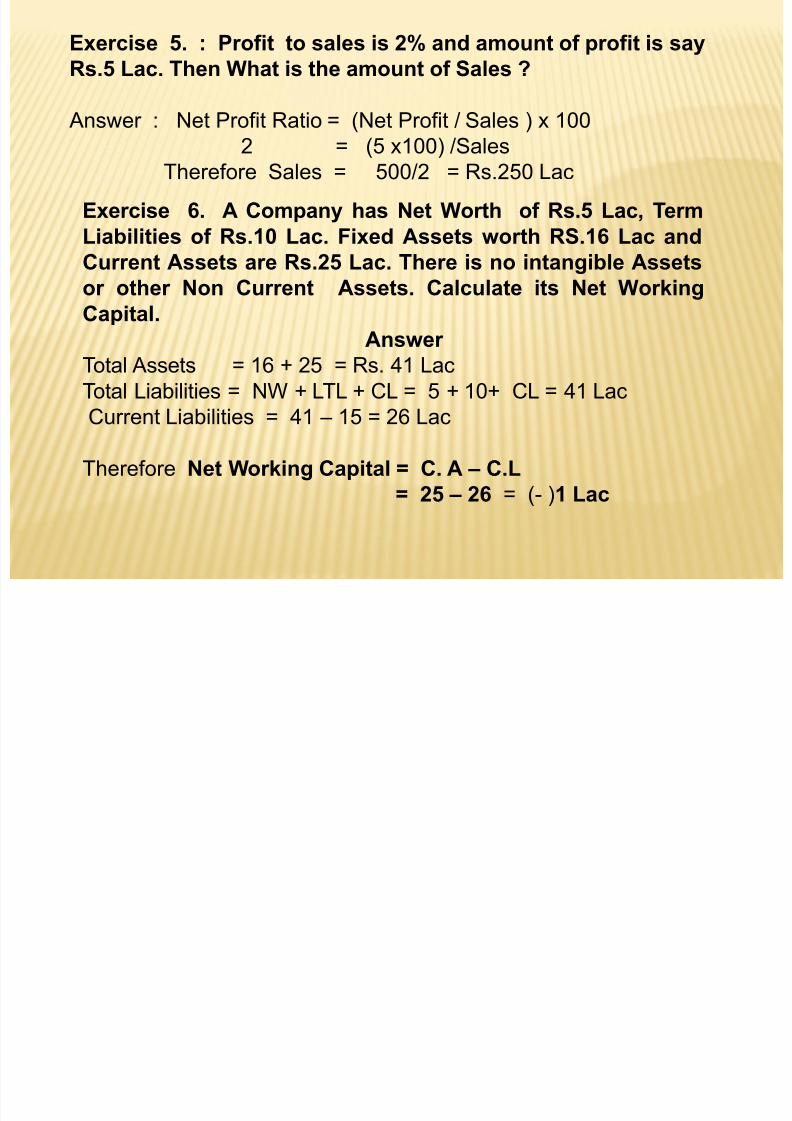
Exercise 5. : Profit to sales is 2% and amount of profit is say
Rs.5 Lac. Then What is the amount of Sales ?
Answer : Net Profit Ratio = (Net Profit / Sales ) x 100
2 = (5 x100) /SalesTherefore Sales = 500/2 = Rs.250 Lac
Exercise 6. A Company has Net Worth of Rs.5 Lac, Term
Liabilities of Rs.10 Lac. Fixed Assets worth RS.16 Lac and
Current Assets are Rs.25 Lac. There is no intangible Assets
or other Non Current Assets. Calculate its Net Working
Capital.
Answer
Total Assets = 16 + 25 = Rs. 41 Lac
Total Liabilities = NW + LTL + CL = 5 + 10+ CL = 41 Lac
Current Liabilities = 41 – 15 = 26 Lac
Therefore Net Working Capital = C. A – C.L
= 25 – 26 = (- )1 Lac

8/22/2019 Ratios - Study ppt.
http://slidepdf.com/reader/full/ratios-study-ppt 27/35
Exercise 7 : Current Ratio of a concern is 1 : 1. What will be the Net
Working Capital ?
Answer : It suggest that the Current Assets is equal to Current Liabilities
hence the NWC would be NIL ( since NWC = C.A - C.L )
Exercise 8 : Suppose Current Ratio is 4 : 1. NWC is Rs.30,000/-. What
is the amount of Current Assets ?
Answer : 4a - 1a = 30,000Therefore a = 10,000 i.e. Current Liabilities is Rs.10,000
Hence Current Assets would be 4a = 4 x 10,000 = Rs.40,000/-
Exercise 9. The amount of Term Loan installment is Rs.10000/ per
month, monthly average interest on TL is Rs.5000/-. If the amountof Depreciation is Rs.30,000/- p.a. and PAT is Rs.2,70,000/-. What
would be the DSCR ?
DSCR = (PAT + Depr + Annual Intt.) / Annual Intt + Annual Installment
= (270000 + 30000 + 60000 ) / 60000 + 120000
= 360000 / 180000 = 2
8/22/2019 Ratios - Study ppt.
http://slidepdf.com/reader/full/ratios-study-ppt 28/35
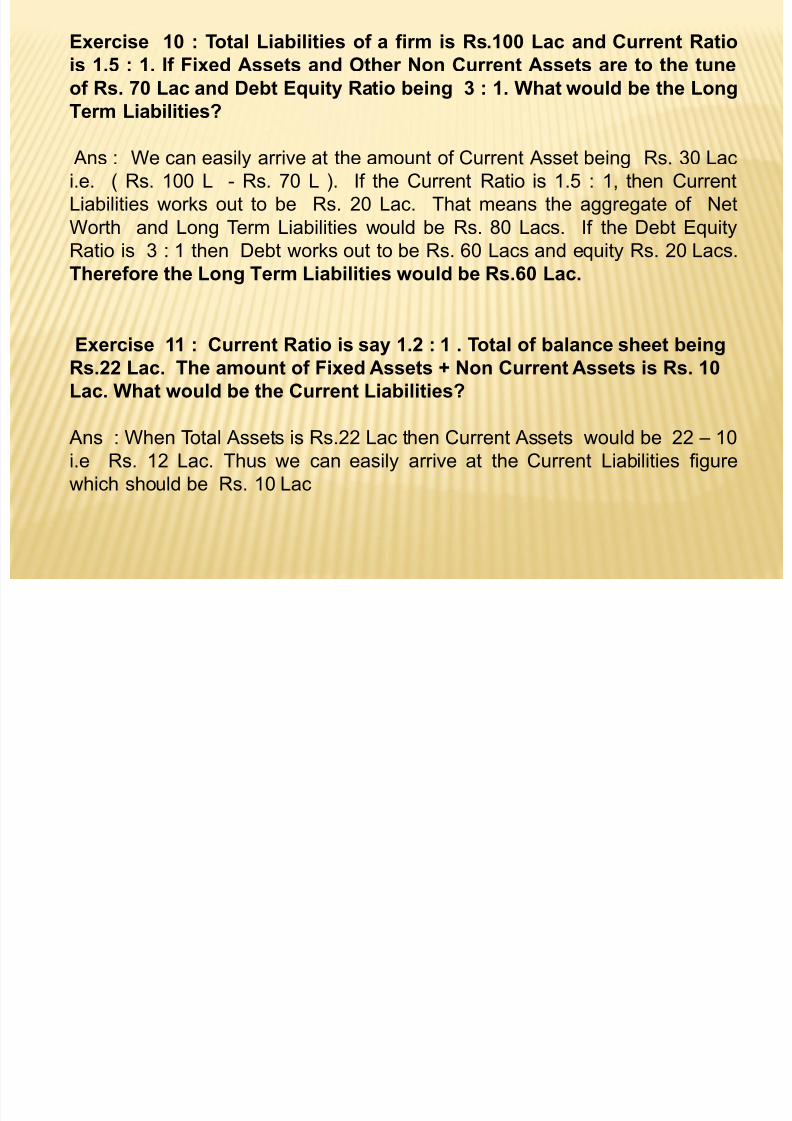
Exercise 10 : Total Liabilities of a firm is Rs.100 Lac and Current Ratio
is 1.5 : 1. If Fixed Assets and Other Non Current Assets are to the tune
of Rs. 70 Lac and Debt Equity Ratio being 3 : 1. What would be the Long
Term Liabilities?
Ans : We can easily arrive at the amount of Current Asset being Rs. 30 Lac
i.e. ( Rs. 100 L - Rs. 70 L ). If the Current Ratio is 1.5 : 1, then Current
Liabilities works out to be Rs. 20 Lac. That means the aggregate of Net
Worth and Long Term Liabilities would be Rs. 80 Lacs. If the Debt Equity
Ratio is 3 : 1 then Debt works out to be Rs. 60 Lacs and equity Rs. 20 Lacs.
Therefore the Long Term Liabilities would be Rs.60 Lac.
Exercise 11 : Current Ratio is say 1.2 : 1 . Total of balance sheet being
Rs.22 Lac. The amount of Fixed Assets + Non Current Assets is Rs. 10
Lac. What would be the Current Liabilities?
Ans : When Total Assets is Rs.22 Lac then Current Assets would be 22 – 10
i.e Rs. 12 Lac. Thus we can easily arrive at the Current Liabilities figure
which should be Rs. 10 Lac
8/22/2019 Ratios - Study ppt.
http://slidepdf.com/reader/full/ratios-study-ppt 29/35
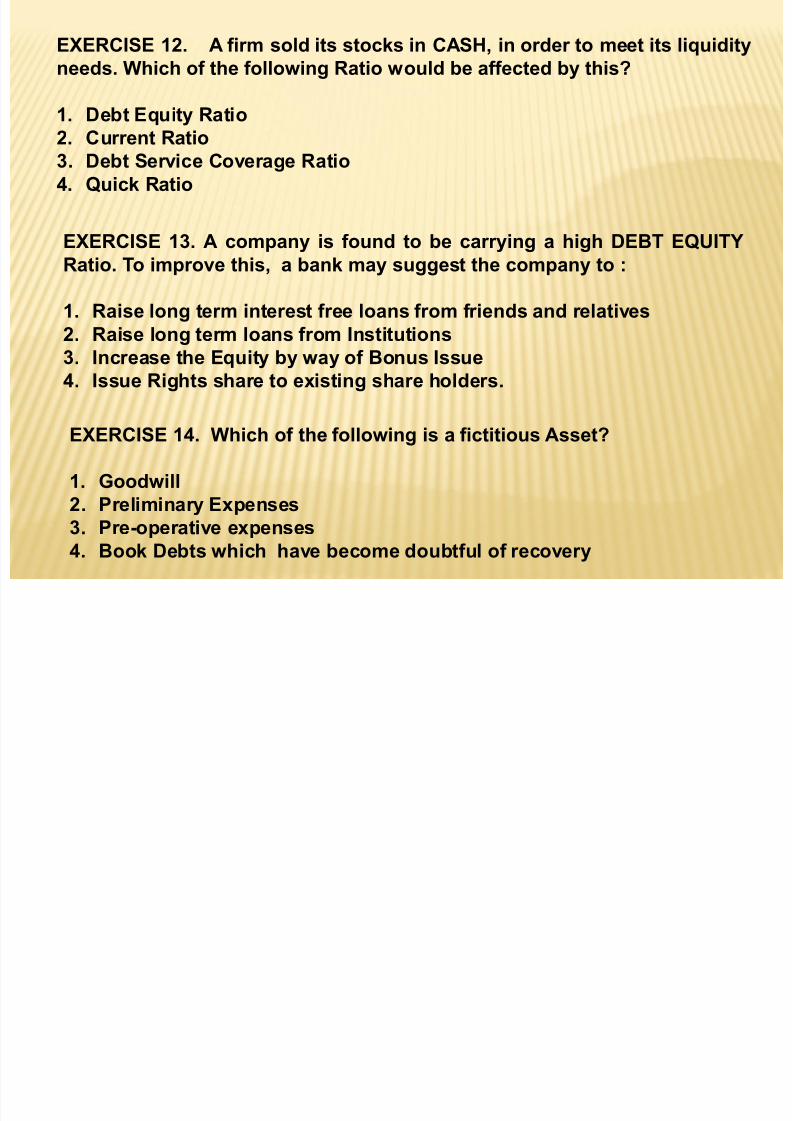
EXERCISE 12. A firm sold its stocks in CASH, in order to meet its liquidity
needs. Which of the following Ratio would be affected by this?
1. Debt Equity Ratio
2. Current Ratio3. Debt Service Coverage Ratio
4. Quick Ratio
EXERCISE 13. A company is found to be carrying a high DEBT EQUITY
Ratio. To improve this, a bank may suggest the company to :
1. Raise long term interest free loans from friends and relatives
2. Raise long term loans from Institutions
3. Increase the Equity by way of Bonus Issue
4. Issue Rights share to existing share holders.
EXERCISE 14. Which of the following is a fictitious Asset?
1. Goodwill
2. Preliminary Expenses
3. Pre-operative expenses
4. Book Debts which have become doubtful of recovery

8/22/2019 Ratios - Study ppt.
http://slidepdf.com/reader/full/ratios-study-ppt 30/35
EXERCISE 15. Under which of the following methods of depreciation on
Fixed Assets, the annual amount of depreciation decreases?
1. Written Down Value method
2. Straight Line method3. Annuity method
4. Insurance policy method
EXERCISE 16 Debt Service Coverage Ratio (DSCR) shows :
1. Excess of current assets over current liabilities
2. Number of times the value of fixed assets covers the amount of loan
3. Number of times the company’s earnings cover the payment of
interest and repayment of principal of long term debt
4. Effective utilisation of assets
EXERCISE 17. Which of the following is not considered a Quick Asset?
1. Cash and Bank balances
2. Bank Fixed Deposits
3. Current Book Debts
4. Loans and Advances

8/22/2019 Ratios - Study ppt.
http://slidepdf.com/reader/full/ratios-study-ppt 31/35
Exercise 18. From the following financial statement calculate (i) Current Ratio (ii)
Acid test Ratio (iii) Inventory Turnover (iv) Average Debt Collection Period (v)
Average Creditors’ payment period.
C.Assets
Sales 1500 Inventories 125Cost of sales 1000 Debtors 250
Gross profit 500 Cash 225
C. Liabilities
Trade Creditors 200
(i) Current Ratio : 600/200 = 3 : 1
(ii) Acid Test Ratio : Debtors+Cash /Trade creditors = 475/200 = 2.4 : 1
(iii) Inventory Turnover Ratio : Cost of sales / Inventories = 1000/125 = 8 times
(iv) Average Debt collection period : (Debtors/sales) x 365 = (250/1500)x365 =
61 days
(v) Average Creditors’ payment period : (Trade Creditors/Cost of sales) x 365(200/100) x 365 = 73 days

8/22/2019 Ratios - Study ppt.
http://slidepdf.com/reader/full/ratios-study-ppt 32/35
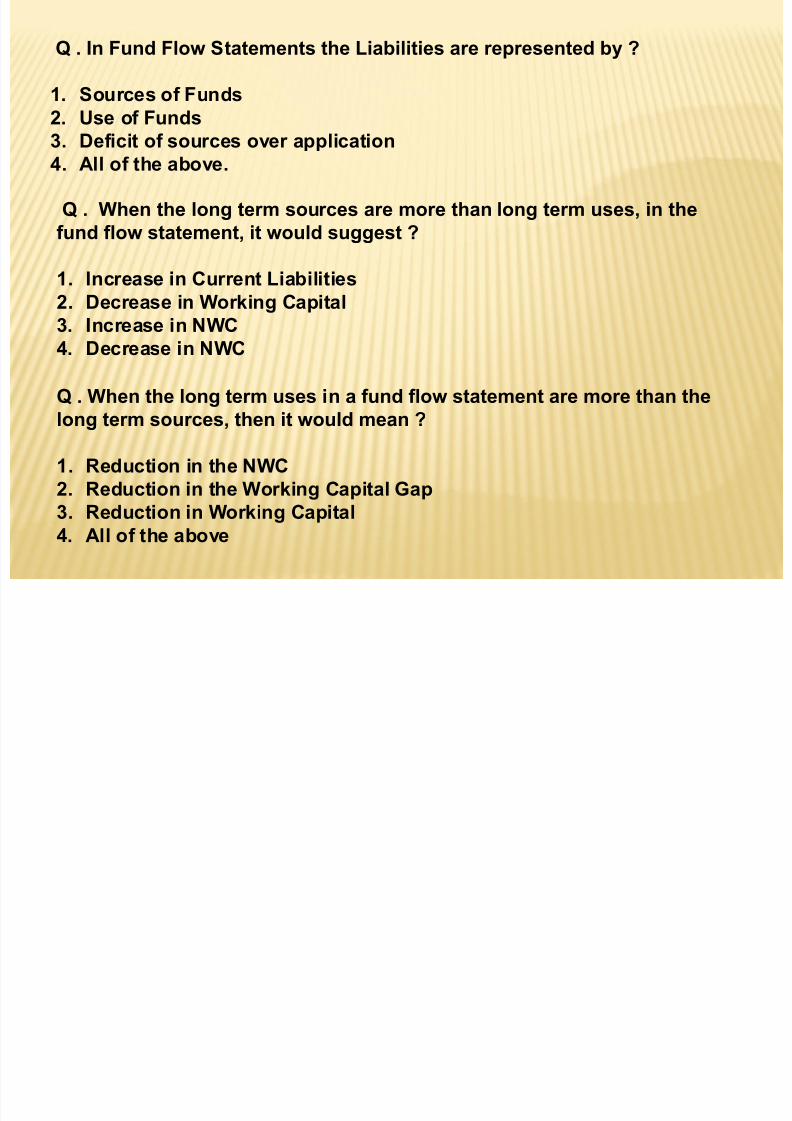
Questions on Fund Flow Statement
Q . Fund Flow Statement is prepared from the Balance sheet :
1. Of three balance sheets
2. Of a single year
3. Of two consecutive years
4. None of the above.
Q. Why this Fund Flow Statement is studied for ?
1. It indicates the quantum of finance required
2. It is the indicator of utilisation of Bank funds by the concern
3. It shows the money available for repayment of loan
4. It will indicate the provisions against various expenses
Q . In a Fund Flow Statement , the assets are represented by ?
1. Application of Funds
2. Sources of Funds
3. Surplus of sources over application
4. Deficit of sources over application
8/22/2019 Ratios - Study ppt.
http://slidepdf.com/reader/full/ratios-study-ppt 33/35
Q . In Fund Flow Statements the Liabilities are represented by ?
1. Sources of Funds
2. Use of Funds
3. Deficit of sources over application4. All of the above.
Q . When the long term sources are more than long term uses, in the
fund flow statement, it would suggest ?
1. Increase in Current Liabilities2. Decrease in Working Capital
3. Increase in NWC
4. Decrease in NWC
Q . When the long term uses in a fund flow statement are more than the
long term sources, then it would mean ?
1. Reduction in the NWC
2. Reduction in the Working Capital Gap
3. Reduction in Working Capital
4. All of the above
8/22/2019 Ratios - Study ppt.
http://slidepdf.com/reader/full/ratios-study-ppt 34/35
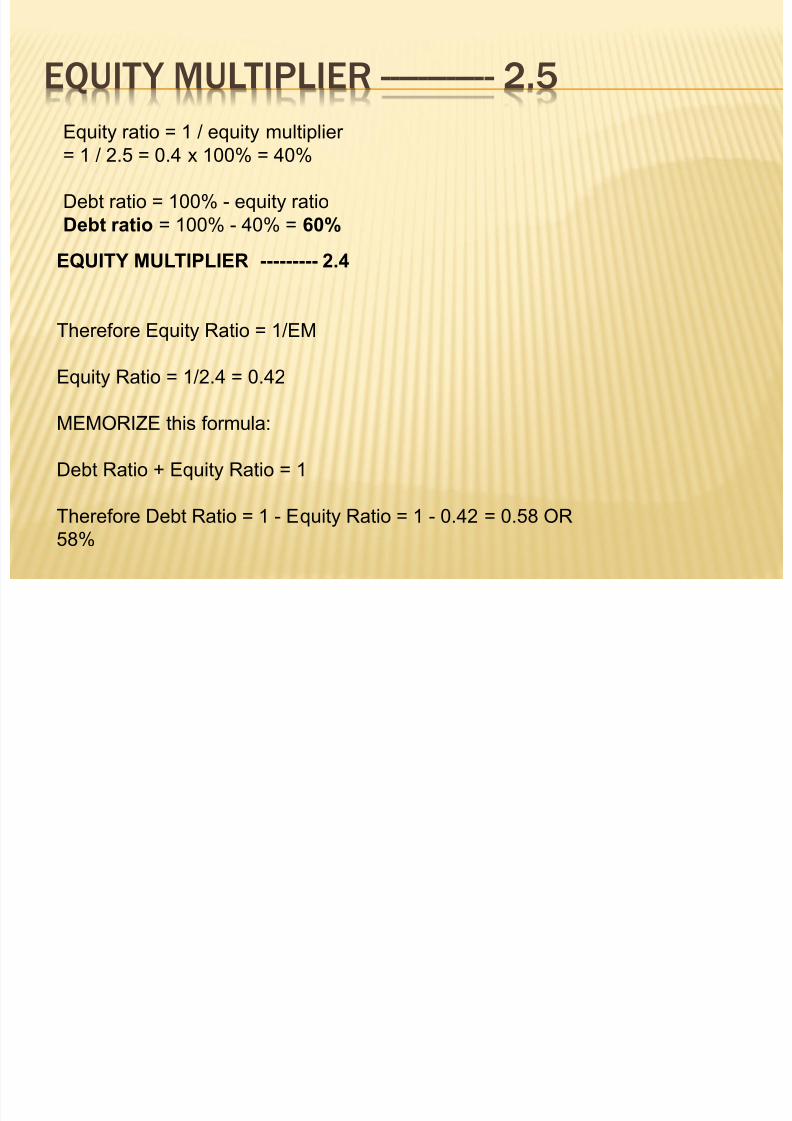
EQUITY MULTIPLIER ------------ 2.5
Equity ratio = 1 / equity multiplier = 1 / 2.5 = 0.4 x 100% = 40%
Debt ratio = 100% - equity ratio
Debt ratio = 100% - 40% = 60%
EQUITY MULTIPLIER --------- 2.4
Therefore Equity Ratio = 1/EM
Equity Ratio = 1/2.4 = 0.42
MEMORIZE this formula:
Debt Ratio + Equity Ratio = 1
Therefore Debt Ratio = 1 - Equity Ratio = 1 - 0.42 = 0.58 OR
58%
8/22/2019 Ratios - Study ppt.
http://slidepdf.com/reader/full/ratios-study-ppt 35/35
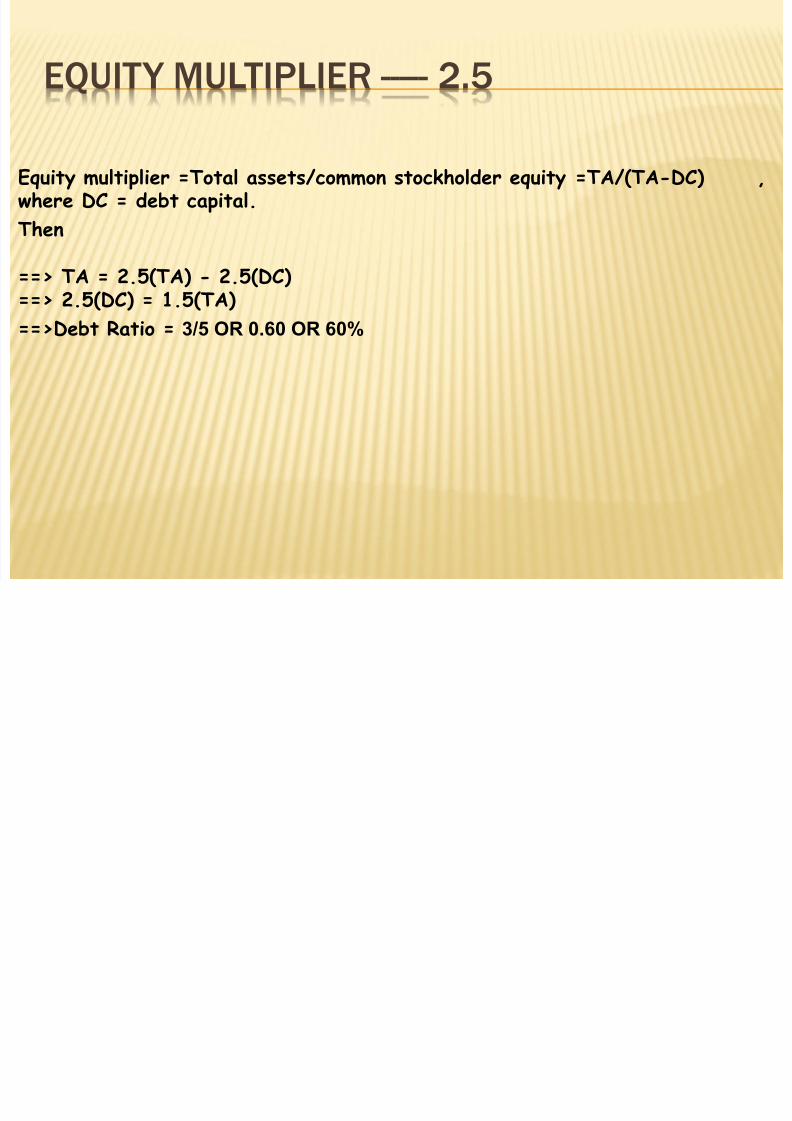
EQUITY MULTIPLIER ----- 2.5
Equity multiplier =Total assets/common stockholder equity =TA/(TA-DC) ,where DC = debt capital.
Then
==> TA = 2.5(TA) - 2.5(DC)==> 2.5(DC) = 1.5(TA)
==>Debt Ratio = 3/5 OR 0.60 OR 60%
Related Documents


