DISCUSSION PAPER SERIES ABCD www.cepr.org Available online at: www.cepr.org/pubs/dps/DP7328.asp www.ssrn.com/xxx/xxx/xxx No. 7328 RATINGS PERFORMANCE, REGULATION AND THE GREAT DEPRESSION: LESSONS FROM FOREIGN GOVERNMENT SECURITIES Marc Flandreau, Norbert Gaillard and Frank Packer INTERNATIONAL MACROECONOMICS

Welcome message from author
This document is posted to help you gain knowledge. Please leave a comment to let me know what you think about it! Share it to your friends and learn new things together.
Transcript

DISCUSSION PAPER SERIES
ABCD
www.cepr.org
Available online at: www.cepr.org/pubs/dps/DP7328.asp
www.ssrn.com/xxx/xxx/xxx
No. 7328
RATINGS PERFORMANCE, REGULATION AND THE GREAT DEPRESSION: LESSONS FROM
FOREIGN GOVERNMENT SECURITIES
Marc Flandreau, Norbert Gaillard and Frank Packer
INTERNATIONAL MACROECONOMICS
ISSN 0265-8003
RATINGS PERFORMANCE, REGULATION AND THE GREAT DEPRESSION: LESSONS FROM
FOREIGN GOVERNMENT SECURITIES
Marc Flandreau, The Graduate Institute, Geneva and CEPR Norbert Gaillard, Sciences Po, Paris
Frank Packer, Bank for International Settlements (BIS), Basel
Discussion Paper No. 7328 June 2009
Centre for Economic Policy Research 53–56 Gt Sutton St, London EC1V 0DG, UK
Tel: (44 20) 7183 8801, Fax: (44 20) 7183 8820 Email: [email protected], Website: www.cepr.org
This Discussion Paper is issued under the auspices of the Centre’s research programme in INTERNATIONAL MACROECONOMICS. Any opinions expressed here are those of the author(s) and not those of the Centre for Economic Policy Research. Research disseminated by CEPR may include views on policy, but the Centre itself takes no institutional policy positions.
The Centre for Economic Policy Research was established in 1983 as an educational charity, to promote independent analysis and public discussion of open economies and the relations among them. It is pluralist and non-partisan, bringing economic research to bear on the analysis of medium- and long-run policy questions.
These Discussion Papers often represent preliminary or incomplete work, circulated to encourage discussion and comment. Citation and use of such a paper should take account of its provisional character.
Copyright: Marc Flandreau, Norbert Gaillard and Frank Packer

CEPR Discussion Paper No. 7328
June 2009
ABSTRACT
Ratings Performance, Regulation and the Great Depression: Lessons from Foreign Government Securities
During the 1930s, rating agencies took up a central role in regulatory supervision that they still have today. We study the process through which they received this regulatory license. The proximate cause for this changeover was the economic shock of the Great Depression. Exploring the performance of rating agencies in assessing the risks of sovereign debt, an important segment of the bond market, we show that superior forecasting capacities cannot explain the agencies’ growing importance. We argue that the agencies’ perceived lack of conflicts of interest (in contrast to other financial intermediaries) was a major factor in bringing them to the forefront of a new regulatory regime.
JEL Classification: F34, G28, N2 and N40 Keywords: great depression, rating agencies regulatory licence and sovereign debt
Marc Flandreau The Graduate Institute P.O.Box 136 1211 Geneva 21 SWITZERLAND Email: [email protected] For further Discussion Papers by this author see: www.cepr.org/pubs/new-dps/dplist.asp?authorid=113661
Norbert Gaillard Sciences Po 27 rue Saint Guillaume 75007 Paris FRANCE Email: [email protected] For further Discussion Papers by this author see: www.cepr.org/pubs/new-dps/dplist.asp?authorid=170539
Frank Packer Monetary and Economic Department Bank for International Settlements Centralbanhnplatz 2 CH-4002 Basel SWITZERLAND Email: [email protected] For further Discussion Papers by this author see: www.cepr.org/pubs/new-dps/dplist.asp?authorid=161237
Submitted 07 June 2009
Part of this paper was written while Marc Flandreau was visiting scholar with the BIS, whose hospitality is warmly acknowledged. Norbert Gaillard acknowledges financial support from the Caisse des Dépôts et Consignations. We are grateful to Magdalena Erdem for her invaluable assistance in preparing the paper. We also thank Laura Rosner for assistance with additional sources located in New York. We thank Richard Cantor, Marcello de Cecco, Jean Helwege, Claudio Borio, Jacob Gyntelberg, Michael King, Patrick McGuire, Robert McCauley, Larry Neal, Patrick O’Brien, Albrecht Ritschl, Augustin Villar, Eugene White, Mira Wilkins and seminar participants at the Bank for International Settlements, Bundesbank, London School of Economics, and the Banca d’Italia conference on regulatory response to crises, for their comments on previous drafts. Caveat: The views expressed here are those of the authors and do not reflect those of the Bank for International Settlements.
2
“Standard Statistics […] did not grow to be the world largest statistical and investment advisory organization by giving inaccurate information and unsound advice. Rather, its growth may be attributed to the fact that it has conscientiously – and successfully – endeavoured to furnish reliable information and advice which, while by no means devoid of error, is right far more often than it is wrong”
Advertisement by Standard Statistics, A rating corporation, Wall Street Journal, June 17, 1931
The role of rating agencies in setting the stage for the financial market turmoil that erupted in mid-2007 has been hotly debated as of late. While arguments had for some time been made that the ratings process for structured financial instruments exacerbated conflicts of interest (Partnoy 2001, 2006), the origins of the recent crisis in securitisations of sub-prime mortgages has provided further impetus to these concerns and a multitude of proposals for revised regulatory oversight of rating agencies have surfaced across the globe.1 Credit rating agencies have long been a lightning rod for criticism when financial markets were perceived to have failed. Following the East Asian crisis of 1997, many observers suggested that ratings agencies had amplified business fluctuations through hasty downgrades (Reisen & Von Maltzan 1999, Ferri, Liu & Stiglitz 1999). Rating agencies came again under scrutiny following the Enron debacle: some argued that the agencies had waited too long to voice doubt about the ailing conglomerate.2 This was followed by the adoption of the Credit Rating Agency Reform Act of 2006, which was intended to increase competition in the rating industry.3 By contrast, many of today’s critics view competition among agencies as a mechanism that contributed to a lowering of rating agency standards.4
The debates of the past decade raise the question of how and why rating agencies came to be used as a basis of regulatory frameworks in the first place. Given the recurring criticisms of agencies whenever financial markets fall into turmoil, such a decision may appear to have been ill advised.5 The irony, however, is that rating agencies were discovered by regulators precisely in a period of deep distrust towards the market mechanism. The collapse of stock and bond markets that followed the Great Crash of 1929 had led to accusations of “banksterism”. Banks, it was said, had failed to address the conflicts of interest between their role as gatekeepers and the fees they earned from selling securities to the public.6 It may have been of importance that some people within the rating industry had publicly expressed concerns about the conflicted role of banking intermediaries.
1 . The agreement reached between rating agencies and New York’s Attorney General’s Andrew Cuomo last June lends credence to this view as it was meant to prevent “ratings shopping”, in which new issuers play off rating agencies against each other in order to elicit the most generous credit rating. See “Status Cuomo; Credit-rating agencies”, The Economist, June 5, 2008. 2 . “Market watch; Post-Enron, All Eyes On Rating Agencies” Gretchen Morgenson, The New York Times, December 16, 2001. 3 . See Hill (2004) for a sceptical appraisal. 4 . See Financial Times, October 23rd 2008, on Waxman and Congressional hearings of rating agencies. Quote on competition bearing the blame. For an early discussion of the potential impact of ratings competition in structured finance ratings, see Cantor and Packer (1994). 5 . As of December 3rd, 2008, the SEC (Securities and Exchange Commission) had not dropped explicit references to credit ratings from its own rules (Financial Times, “SEC set to crack down on credit rating agencies”, December, 4th, 2008). 6 . This point was initially made in the context of sovereign debts but it was then extended to all sectors of originations; see U.S. Congress, Senate (1932), Mintz (1951).

3
It was against this backdrop that the Office of the Comptroller of the Currency (OCC) - a department of United States Treasury that was in charge of supervising nationally chartered banks - took an emergency decision in 1931 that depended heavily on rating agency judgements. In the midst of a wave of defaults and plummeting bond prices in 1931, the OCC instituted formulae based on credit ratings to book the value of US national banks’ bond portfolios. The role of rating agencies was extended in 1936 when the OCC restricted the purchase by banks of securities with lower credit ratings. So while the current financial crisis has raised questions about the widespread reliance of regulations on rating agency judgements, it was the financial crisis of the 1930s that led regulators to start depending on rating agencies in the first place. In this article, our goal is to understand why rating agencies emerged from the Great Depression with a considerably enhanced status within the US financial system, securing regulatory license from banking supervisors. One hypothesis is that the agencies had outperformed markets and thus emerged as a natural tool for regulatory purposes. To address this question, we have gathered and analysed data on ratings and financial markets during the debt cycle of the 1920s and 1930s. We focus on foreign government securities in the New York Stock Exchange, or the sovereign debt market. While this market was smaller than the corporate debt market, it nonetheless provides a useful test case of the performance of rating agencies. According to the conventional wisdom of the day, the sovereign market was where the abuse of investors by underwriting banks was the most rampant, and thus where the agencies’ role as a “conscience of lenders” might have been most valuable.
We find little evidence to support this view. Rating agencies do not appear to have performed particularly well relative to financial markets in seeing the incoming mess approaching or judging the relative risks of borrowers. When we compare the predictive power of agency ratings with that of synthetic ratings based on market yields, we find little that suggests superior performance could have been a critical motive for the initial delegation of a regulatory license to ratings.
The alternative view we articulate is the following: during the 1920s, rating agencies operated in an environment that was radically different from that of today. While today’s incentives have, at least in the minds of some critics, tarnished the credibility of rating agencies as much as that of banks, the conflicts of interest they faced during the interwar era–when the rating industry was in its infancy–were perceived as very different from those of banks. When problems hit in the 1930s, banks came under ferocious public criticism. But rating firms earned revenues from selling their Manuals instead of charging the concerns they rated. They were not at all involved in the origination of securities. Barriers to entry in the rating business did not appear particularly large. All of this protected the agencies against accusation of wrongdoing and they were not a target of public criticism and litigation. Therefore, the agencies were in the early 1930s a ready-made alternative to certification of asset quality by banks. And since the key problem of the time was one of complete distrust in the ability of markets and private financial institutions to set prices correctly, ratings became a valuable and politically acceptable tool in the hands of regulators.
This paper stands at the confines of neighbouring literatures. The pioneering paper by West (1973) suggests an empirical importance for investment grade status in cross sections post WWII but not those before – assuming that the OCC regulations of the 1930s took some time to develop their full effects. Another set of relevant work comprises studies of the performance of ratings over various time periods. Hickman (1958) and (1960) examined performance of American corporate bonds in 1900-1943, looking at default rates across rating categories. Related works include Atkinson (1967) and Altman (1989). Today, rating agencies regularly report similar evidence in their bond default studies, some of which look back as

4
early as 1920 (e.g. see Moody’s (1997)). Moody’s (2003), S&P (2007), and Fitch (2007) provide extensions of default studies to sovereign ratings. In general, research has documented a consistently negative association between default rates and credit rating categories. Another relevant branch of research is the macroeconomic history literature that has studied the interwar sovereign debt boom and bust cycle although it has ignored ratings and explored various aspects of the international debt crisis of the 1920s (Winkler (1933), Lewis (1938), Rippy (1950), Mintz (1951), Wigmore (1985), Eichengreen and Portes (1988)). Yet another variety of papers questioned the wisdom of the Glass-Steagall Act’s separation of commercial and investment banking, using Moody’s ratings as judges (Cleveland and Huertas 1986, Kroszner and Rajan 1994). Findings in this article may bring interesting light to these research concerns. The remainder of the paper is organized as follows. Section I documents the rating agencies’ emergence as an instrument for regulatory intervention in the 1930s. Section II discusses the dataset, the differences in rating policies among agencies, and the surge in sovereign defaults across many rating classes during the 1930s. Section III reviews some conventional criteria for judging credit agencies performance, applies these to our new dataset and provides some insights on the performance of sovereign ratings in the interwar period. Section IV revisits rationales for the increased regulatory use of ratings in the 1930s. In conclusion, we provide some lessons that may be useful for the current debate.
Section I. The Rise of Rating’s Regulatory License in the Interwar Partnoy (2001, p. 5) portrays the business of rating as a fairly minor one until the 1920s. He notes that “early rating agencies were small and only marginally profitable”, and suggests that rating agencies were only propelled to the forefront of financial markets with the emergence and receipt of a “regulatory license” in the 1930s. This was when regulators began to rely on ratings, effectively providing the agencies with property rights over certain forms of quality certification. At that time, the agencies were probably less fundamental a part of the financial system. Certainly they did not enjoy the kind of prestige or power that recently led a well-known columnist to compare them (favourably) with a “superpower”.7 On the other hand, the relevance of ratings in that early period should not be discounted. An early paper by Babson (1910) surveys sources of information available to investors and gives emphasis to the rating agencies among the seven main sources available. He does mention three leading manuals and argues that “every stock exchange firm, bond dealer and bank should have all three publications each year” although he had a preference for Moody’s. He carried on that “all those publications are ably managed and worthy of the support of all.” During the 1920s, growth in ratings demand and supply was obviously fuelled by the 1920s’ boom in the New York securities markets. It coincided with a diversification of the products agencies offered to the market. By the time the stock market crash of 1929 occurred the agencies had already secured attention in standard descriptions of the operation of the NYSE (Dice 1926). This and other anecdotal evidence suggest that there was a rising demand for informed opinion about sovereign and other credit risks.
7 . Thomas L. Friedman, interview, Newshour with Jim Lehrer, PBS, February 1996.

5
Harold (1938) provides extensive evidence of a growing use of ratings by investors and government agencies.8 He suggests that the relatively high price of the Manuals and their availability on bank facilities limited individual demand for subscription to the manuals but states that institutional investors were important customers.9 He refers to Fowler (1928) and Robinson (1929) who describe how some investment trusts created during the 1920s used ratings to provide investors with reassurance on the solidity of their portfolio.10 That trusts gave ratings producers a kind of de facto trustee status suggests that they must have been perceived as somewhat reliable. Against this backdrop, the gradual emergence of regulatory uses of ratings and its acceleration after the surge in defaults and bond market collapse in 1931 is less of a discontinuity than Partnoy argues. The increased regulatory reliance on ratings occurred in the midst of a fragmented banking system in the US, where different authorities were in charge of supervising different institutions. National banks had a federal charter and were supervised by the Office of the Comptroller of the Currency, an independent agency under the formal authority the Federal Treasury. State banks had a State charter and were supervised by State authorities. All banks that decided to become members of the Federal Reserve System got also to be supervised by the Federal Reserve Banks.11 But all bodies came to rely on ratings in the 1930s.
The initial use of ratings in financial supervision addressed the question of how credit risky securities should be valued. The post-1929 asset price deflation created balance sheet problems for US financial institutions. According to Osterhus (1931), the Federal Reserve Bank of New York began in 1930 weighing reporting banks’ bond portfolio quality using established ratings.12 A frequently discussed move was the OCC’s ruling, announced in the press as taking place on September 11, 1931. At the time bond prices were plummeting in the wake of the German financial crisis and a run on Sterling. The OCC ruling was reported to state that all Federal, State, and Municipal US securities, as well as other domestic and foreign securities belonging to any of the top four categories of ratings could be booked by banks at face value (Harold 1938), while other securities and defaulted bonds should continue to be marked to market. According to the Wall Street Journal, the regulation really formalized the administrative guidance already introduced in 1930, and was supported and endorsed by market participants.13 Harold’s classic account (1938) heavily emphasizes the September
8 . Harold (1938) is the principal source on this. This is where we draw most of the evidence in this section. 9 . Harold (1938), p. 25. 10 . Robinson (1929), pp. 557-8. For instance, the United States Shares Corporation, created in 1927, advertised the following prudential rules for its investment policy: no securities rated below Moody’s B; at most 10% securities below Moody’s Ba; at most 50% below Moody’s Baa; at least 20% of securities above A. 11 . See White (2009) fore a recent survey. 12 . Similar to many haircuts for reserving applied today, as well as the risk-weighted asset approach to assessing bank capital requirements (e.g. the standardized approach of the Basel II framework), weights varied with credit quality. In the procedure documented by Osterhus, the weights applied were 100% for securities rated in the top two categories, 90%, 80%, 50% and 10% respectively for the next four rating categories, and 0% after that. 13 . Harold (1938) quotes a “mimeographed ruling” by J. W. Pole, which he may have seen. We corresponded with the archivist of the OCC and it looks like the document would have to be recovered from primary sources, if it survived at all. The sources that are still accessible to us are the New York Sun of September 11, 1931, the Wall Street Journal of September 12, 1931. Harold (1938) gives the Commercial and Financial Chronicle (CFC) of September 12. However, the CFC essentially reprinted parts of the New York Sun article. A later article supporting the move was “New York Banks agree on Values”, Wall Street Journal, December 31, 1931.

6
1931 ruling as of critical importance to the credit rating industry, as have subsequent authors.14 Several points regarding the decision, however, are worth mentioning. First, secondary sources are agnostic as to whether the ruling referred to the ratings of any specific agency. The language used in the press is a reference to “statistical corporations”. Second, it seems, again from these sources, that ratings could come from any of the agencies, implying that the highest rating was used, in contrast with modern practice.15 Third, as far as we can tell, the unpublished decision did not initially use the modern terms of “investment grade” and “speculative grade”, but instead associated “high grade” with ratings in the top four categories, and by this channel “low grade” to the categories below.16 Finally, the “cut-off” implied by the ruling was less conservative than what we can infer from the language of the agencies themselves, since agency descriptions of their ratings associated very safe securities with the top three categories only. The language used to describe securities in the fourth category emphasizes the risks involved and imply that they ought to be dealt with by informed agents only.17
In subsequent years, similar trends could be observed in the supervision of members of the Federal Reserve System. State superintendents started relying more and more on ratings. Similarly, authorities supervising insurance companies began using ratings.18 Regulatory reliance on ratings soon intensified to include the proscription of the purchase of securities with low ratings. The Banking Act of 1935 vested the Comptroller of the Currency with the power to identify “investment securities” that institutions under its supervision would be enabled to buy. A similar arrangement was made for State banks that were members of the Federal Reserve System under Federal Reserve rules.19 In February 1936, the OCC ruled that national banks were now prevented from buying securities viewed as “distinctly and predominantly speculative”. No rating was provided for what would be a “speculative” security, but the now wide-spread term “speculative” was thus embedded in regulation.20 A footnote stated that “the terms employed herein may be found in recognized rating manuals,
14 . Cantor and Packer (1994), Partnoy (2001), Sylla (2002). It is of interest that after having made an article on the front page of the Wall Street Journal and another one inside the New York Sun, which was then picked up by the Commercial and Financial Chronicle, coverage of the OCC 1931 ruling soon dissipated. To be sure, the month of September 1931 was a busy one for financial news. 15 . Harold (1938), p. 27. A complication also arises from the fact that one agency – Poor’s -- reported a number of what Harold (1938, p. 74) called “super-ratings” that only applied to top US securities and other “impregnable securities”. If the criterion of focusing on the top four categories was applied literally, very few securities would be eligible for booking at face value using Poor’s ratings. On the other hand, we have not seen the unpublished mimeographed document and we cannot rule out that the ruling did adjust for this. With regard to modern practice, see, for example, the standardised approach of the Basel 2 framework, whereby in the case of multiple ratings, the second highest rating is recommended for the calculation of risk weights (BIS 2006). 16 . See Wall Street Journal, September 12, 1931. However, Harold (1938, p. 28) describes the OCC’s decision as identifying an “investment grade” category. 17 . For instance, bonds have “moderate investment merit”, “require close discrimination”, are “business-men bonds”, etc. See Fitch Bond Book 1930, Moody’s Manual of Investment 1929, Poor’s Ratings 1925, Standard Bond Description 1924. 18 . Harold (1938), p. 29. 19 . Harold (1938), p. 29. 20 . “Comptroller unlikely to define ‘Speculative’ securities”, Wall Street Journal, April 29, 1936.
7
and where there is doubt as to the eligibility of a security for purchase, such eligibility must be supported by not less than two rating manuals”.21 While there was initially some doubt regarding the exact cut-off associated with the 1936 ruling (some observers suggested the cut-off was at a higher rating level than the previous one), it gradually emerged that the target was again between the top four and lower grades. Greater conservativeness was rather reflected in the implicit move from the top rating to the second best rating as the one which “counted” (when there were multiple ratings), and in the formal prevention of any purchase of a security not over the cut-off. The new regulation represented a significant new constraint, for the percentage of securities falling below the agencies’ fourth category had increased enormously between 1931 and 1936.22 An estimation performed by the Securities Tabulating Corporation of New York at the time showed that around half of the bonds traded in the NYSE could no longer be purchased.23 By 1936, speculative securities, as they are now known, outnumbered higher grade ones.
Unlike the provision of 1931, the 1936 ruling triggered strong protests from the banking and finance industry.24 Bond prices were rallying, and bankers did not want to be excluded. In addition, they argued that the new ruling penalized smaller companies who were not covered by rating agencies. Bankers also didn’t hesitate to criticize ratings as metrics of credit risk: they noted that relying on ratings could create a deceptive sense of security, and that ratings tended to be backward looking. There was also criticism that the agencies’ past record did not suggest they had outsmarted markets.25 One resolution from a bankers’ association quoted by Harold (1938, p. 32) stated that “delegation of the judgement as to what constitutes a sound investment is unprecedented in our history and wholly unwarranted by [the agencies] records in the past”. The OCC had eventually to back off somewhat, and provided banks with slightly greater freedom over the identification of speculative securities.26 To conclude, not only did the 1930s usher in the emergence of a central role for rating agencies in financial supervision, but the decade also provided a preview of future criticism opposing this role.
Section II. Regulatory environment and performance Recent commentators have suggested or implied that the regulatory license rating agencies received in the 1930s drastically modified the set of incentives facing rating agencies. For instance, Goodhart (2008) writes that “in the early 1930s, incentives for [Statistical Ratings Organizations] to produce reliable information for investors were complicated by introducing ratings into the regulatory process.” Partnoy (2001, p.5) also suggests that the advent of a
21 . Harold (1938), p. 30. 22 . In September 1931, the percentage of foreign securities falling in the top four rating categories, according to “current ratings” (i.e. latest pending annual rating as we collected them) was 95.0% (Fitch), 90.1% (Moody’s), 81.2% (Poor’s) and 75.2% (Standard Statistics). At the date of the second ruling, the percentages were 45.4%, 50.5% 49.5% and 43.3% respectively. Source: authors’ calculations based on Fitch, Moody’s, Poor’s and Standard Statistics manuals (various years). 23 . Harold (1938), p. 31. 24 . “Banks oppose eligibility rules for investments”, Wall Street Journal, March 13, 1936; “Security regulations opposed by bankers”, Wall Street Journal, June 25, 1936. 25 . “Security regulations opposed by bankers”, Wall Street Journal, June 25, 1936. 26 . “Banks given more discretion over investment”, Wall Street Journal, May 23, 1936. One is reminded of the poem published in 1903 by the Anglo-Colorado Mining Guide: “In modern speculation/Your language you must choose./It’s an “investment” if you win/ But “gambling” if you lose”.
8
regulatory license dramatically changed the rules of the game: “Throughout the 1920s, credit ratings were financed entirely from subscription fees, and rating agencies competed to acquire their respective reputations for independence, integrity, and reliability. In a market with low-cost barriers to entry, a rating agency issued inaccurate ratings at its peril. Every time an agency assigned a rating, that agency’s name, integrity, and credibility were subject to inspection and critique by the entire investment community. Reputational considerations would have been especially acute in such an environment.” While agencies’ reputations are also at stake today, the existence of competing concerns, namely, the provision of fees by issuers being rated as a result of the issuer-pay business model, present countervailing pressures. Thus, implicit in the modern notion that regulatory usage hampers ratings performance is the view that the rating agencies must have done better previous to the change in the regulatory environment.27 For a long time, economists have largely ignored the relevance of ratings and scholarly research on the matter has remained sparse. Lawyers were first to recognize their relevance (see Hunt 2009 for a recent survey). One argument is that the value of debt rating agencies lies in their ability to convince financial purchasers of the validity and accuracy of their ratings (Choi 1998, Schwarcz 2002). This argument is related to earlier insights in economic theory suggesting that the formation of reputations can help support quality provision in markets where information problems would otherwise preclude it (Shapiro 1983, Klein and Leffler 1984, and more recently Bar-Isaac and Tadelis forthcoming). This arises as a dominant strategy in a repeated game, because sellers with a reputation for quality can extract future rents from current investment in reputations. These arguments are articulated in a somewhat different context than that of rating agencies, which operate in two sided markets where intermediaries can charge either borrowers or lenders or both. The incidence of competition on the reputation story is subtle. On the one hand, competition may decrease the expected revenues from reputational capital and reduce reliability. On the other hand stand arguments that emphasize the increased disciplinary role of competition as it creates an endogenous outside option that promote reliability. In this context a de facto (as opposed to de jure) oligopoly with a credible entry threat may turn out to be optimal. Bolton, Freixas and Shapiro (2008) provide a recent theoretical perspective focusing on important aspects of current regulatory proposals. They suggest that rating agencies have an incentive to inflate ratings when there are more naïve investors or when reputation costs are lower. They argue that Cuomo’s plan does not prevent shopping around and thus does not fully eliminate conflicts of interests. Empirical research on the matter is still underdeveloped. One exception is Becker and Milbourn (2008) who provide an empirical study on the effects of increased market share by Fitch since 1970 in what they describe as the previous Moody’s-Standard and Poor’s duopoly. They suggest that the rise of Fitch had a negative impact on the disciplining effects of reputation. They find that in this instance, competition leads to more issuer-friendly and less informative ratings and conclude that competition can impede the reputational mechanism. On the other hand, Flandreau and Flores (2009) provide evidence of the relevance of reputational forces and repeat play in the historical context of signalling sovereign debt by reputation conscious underwriters. It is not clear, however, whether this argument can apply to rating agencies.
27 . By contrast, Boot et al (2006) argue that institutional rigidities, such as restrictions to hold only investment-grade securities, can stabilize an equilibrium where credit ratings serve as a welfare-enhancing coordinating mechanism for firms and their investors.

9
The interwar experience does provide a setting that is different from the modern rules of the game. The payment model that prevailed interwar was based on selling the manuals or investment letters rather than charging issuers.28 The gradual emergence of a ratings based regulatory framework, although it created an incentive for issuers to secure high ratings, did not provide immediate means to shop around since the decision to rate a company was still consumer driven (i.e. it met the demand of investors for information on available financial products). Moreover, the threat of entry was probably more credible during these years, as already suggested by Partnoy (2001). Thus the interwar period offers an interesting environment where the relevance of some of the important contentions can be examined. On top of this, history provides us with a particularly interesting crisis experience with many parallels with today’s crisis. Between 1920 and 1929, the New York bond market experienced a classic boom-bust debt cycle. Total bond issuance grew rapidly, both for foreign government and other bonds (Figure 1). Foreign issues peaked in 1924 when they were more than 25% of domestic corporate issuance. By contrast domestic corporate issuance reached a maximum in 1927. Bond issuance then contracted dramatically after 1930, following the stock market crash and credit crunch. This was followed by a wave of defaults.
In this paper, we seek to take a closer look at this question by comparing ratings reliability among different agencies and between these agencies and yield premia. Yield premia are a natural benchmark, because the standard charge of the time against bankers was that they had manipulated bond prices bringing bad bonds to market at too low a yield before leaving investors to deal with the mess. It is natural in this context to ask whether the rating industry as a whole might have been seen as an islet of serious opinions in a sea of “banksters”.
We are going to focus on sovereign bonds. While Figure 1 shows them to be a fraction of the overall market for new fixed income securities,29 they nonetheless are an interesting population to study owing to the particularly nasty experience that they went through. As we shall see, default rates on sovereigns during the interwar period were extremely high. The extent of the sovereign debt disaster is something of a statistical bounty -- robustness of statistical work on the performance of rating agencies is increased when the number of default events is increased. We also mention the specific role sovereign debt played in mobilizing public opinion against alleged bankers’ abuses. The US Senate Committee on Finance hearings on the Sale of Foreign Bonds was convened in 1931 to discuss sovereign bond market only a few weeks after the Office of the Comptroller of the Currency’s ruling on the role of ratings for booking bonds. Its focus (as suggested by its name) was on sovereign debt as a particularly obvious failure of the market mechanism. Obviously, we recognize that it would be most interesting to replicate our computations for corporate securities as well. 28 . Although the fact that many issuers were also subscribers of the volumes was occasionally pointed out as a source of conflict of interest, with non-subscribers being under threat of receiving poorer grades. This may have played a bigger role for mercantile agencies, who sold ratings on firms for firms, rather than for rating agencies who sold ratings to investors and intermediaries. Note that one firm (Poor’s) includes publicities in its manuals and this may have provided a channel for rewarding issuers or intermediaries who included substantial amounts of publicities. Poor’s volumes included mostly underwriters’ publicity (American Bank Note Co, NY; Bankers Trust Co., NY; Bonbright & Co., NY; Dillon, Read & Co., NY; JP Morgan, NY; Payne, Webber & Co., Boston; Pynchon & Co, NY; Tobey & Kirk, NY; White, J.G. & Co., NY; etc.). It would be interesting in itself to try and correlate the amount of publicity in Poor’s volumes with differences between Poor’s ratings and those of other firms. 29 . Foreign government bonds issued over the entire decade amounted to $4.3 US billion, slightly more than 15% of the total issuance of domestic corporate bonds. The largest sovereign issuers were Canada ($575 US million), Argentina ($462 US m), Chile ($304 US m), France ($300 US m) and Belgium ($289 US m).

10
We are not aware of earlier empirical research on ratings agencies in the interwar. A notable exception is West (1973) who argues that after the 1930s yield spreads for bonds with lower credit ratings were larger than could be explained by fundamental factors. He suggests that this owes to the emergence of the frameworks arrangements of the 1930s which against these bonds. In his study, however, it is not until well after WWII that the “effect” of ratings was being felt. We also mention the work of Gaillard (2008) who studies the determinants of Moody’s sovereign ratings during the 1920s. A surprising feature of his study is that the determinants of interwar ratings resembled closely (by types, elasticity and significance) post-WWII, post-OCC rulings era ratings studied by Cantor and Packer (1996).30
Section III. The Provision of Ratings in the Interwar Era Rating in the interwar: snapshots at the industry As we indicated, when our story begins, rating was a well-established branch of business. Corporate rating had already a long history dating back to 1857 when Bradstreet’s Book of Commercial Reports was first released.31 At about the same time and later on, systematic descriptions of securities were provided by a number of publishing agencies although no ratings as such were given. These publications included Henry Varnum Poor’s Manual of the Railroads of the United States (first published 1868),32 the Manual of Statistics – whose subtitle was A Stock exchange handbook (first published 1879),33 or Moody’s Manual of Industrial and Miscellaneous Securities first published 1900. Innovation in securities reporting came when Moody’s Analyses of Railroad Investments began rating railroad securities in 1909. Poor’s followed suit in 1916. New entrants in the rating industry during the 1920s included Fitch and Standard Statistics in 1922. Standard Statistics had been established in the 1900s as a provider of “card index”, which gave information on securities through card systems, which purchasers received and could file in matching drawers so that the latest information would always be available (the other important firm in this line of business was Babson System). In the 1920s, Standard Statistics began providing ratings as part of new high frequency publications. This suggests that investors valued summary assessments of outlooks.34
These moves reflected the increased scope of businesses involved in information provision. Between 1900 and 1925, they sought to become “advisory agencies” and tied data to advice.35 Other outputs that emerged at the same time were business forecasts, which were the subject 30 . Among the 25 key criteria listed by Moody’s (1924) as relevant indicators, Gaillard (2008) shows that wealth, monetary stability, external debt, past default and institutional quality show up as particularly large and statistically significant determinants of ratings during the 1920s. One possible interpretation is that regulatory environments do not radically influence the rating outlook 31 . Bradstreet’s Books did contain a list of companies; there was a complementary system of key to reports so that the listings of the reports could be converted to ratings. 32 . This annual provided details on the performance of railway lines and companies, Chandler (1956). 33 . In July 1904, a New York Times ad described the Manual as one of the books most often consulted in a busy office”. The manual was “10140 pages but handy in both bulk and arrangements”. Information is given in regard to the organization, history, capital, bonds, and other details of the great transportation systems of the United States, Canada, Mexico”, New York Times, July 2, 1904. 34 . We ignore whether Standard Statistics card system provided ratings through its cards at an earlier date. 35 . For instance in 1907, the Stock Department of Babson System published Investments: What and When to Buy, The use of statistics in accumulating a fortune (published as Lamar 1907).
11
of commentary in the press.36 In this segment, other shops not devoted to rating, such as Irving Fischer’s consultancy created in 1930, or Babson System competed.37 Of course, it is hard to disentangle the value for subscribers, of having a well-documented source book from that encapsulated in the provision of summary grades, explicit buying or selling recommendations, or business conditions indicators or forecasts. In effect, the little information we could collect on pricing suggests changing schedules, with joint products and cross subsidy being the rule and changing very rapidly over time. Another challenge is that the higher frequency publications have survived in scattered locations, when they have survived at all. Finally, we have no data to relate the revenues from these various sources to the agencies overall profitability. As a result, there is a cap to what can be learned about the agencies output, competition and pricing policies. However, we find plenty of indirect evidence of efforts and competition. All in all this suggests a concern over brand and performance as we proceed to show.
Output and signals We now take a look at rating of securities. To provide a summary outlook of what the agencies did, when, and for what price, Table 1 describes the interwar situation with a more acute focus on 1930.38 It is important to emphasize that several of these firms have little or nothing to do with their successors bearing the same or similar names, so that everything that we are about to say has historical significance only.
Statistical agencies covered securities through a variety of tools. On the one hand there was the reference instrument, which in the case of Fitch, Moody’s and Poor’s was the manual. We understand that for Standard Statistics, the reference was a card system (although some book-like tools were later produced) so that direct comparison with the others is not feasible. Comparison of the number of pages in the volumes for the three agencies with volumes reveals a clear lead for Moody’s, whose thicker books were also more expensive. Moody’s manuals also fully distinguished between Municipal & Government, Banks and Finance Companies, Industrials, Public Utilities and Railroads while competitors had more aggregated products. This distinction would appear to underscore Babson’s early remark (Babson 1910, p. 622) that Moody’s was the leading manual because of the scope of its coverage.
Another advantage of Moody’s, according to Babson, was its higher frequency cumulative supplement “which was intended to keep the main book or manual up to date throughout the year”. It grew into Moody’s Investment letter, a formula that was later copied by Fitch and Poor’s. We remark that prices for this service were similar across agencies. Card systems were by construction designed to keep readers up to date so Standard Statistics can be seen as having been a leader too in this area. When it came to designing an additional product, it opted for still higher frequency (daily). This service was slightly more expensive. It too came to be copied by other agencies during the 1930s. Fitch for instance, launched in 1933 a product that cost 180 USD per year, similar therefore to the cost of the daily coverage by Standard Statistics. In general, from our perusal of sources and advertisements, we observe a gradual increase in the frequency of updates over time (ie weekly, semi-weekly, or daily
36 . For instance, Moody’s Investors Service stated on January 4, 1929 that the “prosperity which has characterized this country with only moderate setbacks since 1923 is likely to continue without great variation well into the future”, New York Times, Jan 4, 1929 37 . On business forecasting in the US during the interwar, see Favero (2007). On the performance of academic forecasting shops see Dominguez et al. (1988). 38 . Constructing this Table has involved an amount of guesswork and we have tried to make it as explicit as possible through notes and references.

12
products are launched). This can be taken as an indicator of the increased demand for the agencies’ products. We note that the process did not begin with the 1931 OCC regulation. There is also evidence of efforts and competition to cover new products as they were launched or as they began attracting interest. For instance, regarding the specific segment of the market that will interest us later on, we find that Moody’s started reviewing sovereign and sub-sovereign entities in its annual Governments and Municipals handbook in 1918. This was when the market for such securities was in its infancy. The move was followed by other rating services that already existed or were being created. Poor’s began sovereign ratings in 1922, Fitch and Standard Statistics in 1924.
In an age of largely free capital mobility, New York was not the only market available for US investment. Other markets of greater or lesser importance to US investors could also be covered. One prominent example is the London market where a lot of non-dollar international sovereign bonds were traded. We found that while Moody’s covered instruments traded in that market, Fitch, Poor’s, and Standard Statistics focused on New York. We also found that Moody’s rated a higher number of domestic currency local bonds not listed in either New York or London than the other agencies. Another interesting feature that we identified in the case of one firm (Standard Statistics) is the posting of several names from prestigious universities as part of the “contributing editors” of the firm.39 Moody’s did employ Max Winkler, a PhD economist, but did not boast connections with academic economists as did Standard Statistics. Fitch and Poor’s did not bother. While Standard Statistics was an established competitor in the business of selling statistical information, it was new to the game of selling ratings. It is hard to tell whether the signal of hiring academic economists was meant to compensate for its lack of reputation in this additional line of business, or whether it simply kept with a policy that sought to associate Standard Statistics with cutting edge research.40 Standard Statistics also advertised a large network of branches signalling a strong global presence, while Moody’s established its international reach very early on with a branch in London. Fitch was later.
All in all, it seems that a fair characterization of the general landscape could be as follows. Moody’s was the incumbent, Fitch and Poor’s were followers. Standard Statistics came from a different background, taking advantage of its large investment in reputation for rigorous tracking of securities data. Although limitations on the available information limit what may be derived from the data, we will keep this alignment in mind when comparing performance. Symbology Unlike today’s readily comparable scales, rating symbols were a challenge to match across agencies. The A, B, C, and [D] ranking was common to all four agencies, but different firms used different keys for granularity, although always sorted out through three sub-rankings. For instance, to decompose the top A category, Fitch used AAA, AA, A, Moody’s Aaa, Aa, A, Poor’s A**, A*, A, and Standard A1+, A1, A. Complications included Moody’s lack of a letter D letter and Poor’s initial use of a “super-rating” category above A** that was “practically inapplicable” (Harold 1938, p. 74) to most securities and discontinued in 1939. Granularity was coarser than it is now. This may be consistent with models that predict that agencies with a reputation yet to establish may not favour overly precise ratings. More precise 39 . In February 1922, the Standard Daily Trade Service publication indicated “Contributing editors: Eugene E. Agger, Associate Professor of Economics, Columbia University; Lewis H. Haney, Director, Bureau of Business Research, NYU; DR Scott, Professor of Economics in the University of Missouri; Consulting economist: H.J. Davenport, Professor of Economics, Cornell University”. 40 . Standard Statistics (1931).

13
information increases current payoffs from providing investors with more information, but also increases the probability that errors destroy reputation. Harold (1938) gives product differentiation as one likely reason why agencies did not initially seek consistency. Differentiation would have also enabled agencies to interpret own forecast errors simply as owing to the different “meaning” of their symbols. The role of signal precision in reputation acquisition is studied in Bolton et al. (2008). That said, the use of ratings in regulation implied at some level that the ratings could be compared. The OCC’s reference to the top four ratings was an explicit recognition of an implicit correspondence across rating agencies’ keys. This usage may have provided incentives to agencies to make their ratings categories more consistent with each other over time.41 Based on the language used by agencies42 to describe the meaning of the ratings and by his own extensive survey of market participants, Harold (1938) establishes a “majority interpretation” of the correspondence across the individual agency ratings (Table 3). This equivalence system is consistent with later evolution, which produced a convergence across rating keys. Unless we state otherwise Harold’s majority interpretation is the key that we use in this article. It is important to emphasize, however, that in most of the analysis that follows, a strict correspondence across ratings is not needed.
Section IV. Sovereign Rating Outlook in the Interwar Era Data In order to put together our annual dataset for sovereign ratings by the four agencies during the interwar era, we have proceeded as follows: for Fitch, Moody’s, and Poor’s, for which a consistent series of annual volumes was located, we have collected each of the ratings for sovereign bonds in those volumes. Regarding Standard Statistics, for which we could only locate higher frequency (monthly) publications containing only updates, we recorded as rating outstanding for a given year the lastest rating mentioned in the series of monthly publications and assigned it the date of December of that year (as it was the rating that was current in December of that year). Table 2 summarizes relevant information on how the ratings dataset was constructed. Figure 2 shows the number of sovereign securities listed on the NYSE in 1929 and the number of these securities that were covered by the agencies’ publications during that year (1929). Listing in the NYSE resulted either from offerings on that market or cross listing of securities initially traded abroad. Coverage of instruments listed in the NYSE by Moody’s, Poor’s and Standard Statistics was close to exhaustive (missing securities would usually be covered in the next volume). Fitch was slightly less complete (about 90%), and had thinner and less detailed volumes than the others, omitting some bonds with low ratings from other agencies. . Bonds omitted by Fitch generally had very low grades from the other agencies.
41 . We do not know whether the OCC’s decision of 1931 adjusted for Poor’s super ratings. If it did not, it may have persuaded investors not to refer to Poor’s manuals because that would have forced them to do more write offs. This may explain that Poor’s deleted its super-ratings (A*****, A****, and A***) in the late 1930s. The reduction of Poor’s rating range downgraded top bonds (U.S. Government, British, and Canadian bonds in 1938 and 1939) and amalgamated them into the new current highest rating. 42 . At the top, Fitch described AAA securities as “highest”, while Moody’s Aaa were “highest”, Poor’s A** “very high” and Standard’s A1+ “highest class”, suggesting a fairly good match. At the bottom, the D letter meant “slight or nil” to Fitch, “practically valueless” to Poor’s and “doubtful value” to Standard. Intermediary cases may have involved some overlap, however. For instance, Fitch’s B was “speculative” while Standard’s B was “semi-speculative” (“speculative” was C1+).
14
The relative lack of coverage by Fitch is consistent with its junior status in the field of sovereign ratings, already noted. When comparisons are made across agencies, we use the intersection between the four rating populations, meaning that it generally coincides with Fitch rated issues. In other cases, each agency’s own entire population of ratings is taken into account.
Ratings Composition Previous writers have emphasized the deteriorating quality of the portfolio of sovereign bonds issued in the NYSE before 1929 (Mintz 1951) but an examination of ratings composition reveals a sharp deterioration in quality after 1930. The evolution of the distribution of outstanding ratings per category is tracked for two rating agencies in Figure 3.43 For Moody’s, while only about one-fifth of the issues were rated Ba and below in 1930, that fraction had risen to 40% by 1933. The case of Fitch shows an even more dramatic change: while on average less than 15% of their 1930 ratings were BB and below, by 1933 more than 60% were in that category. Since new issues of foreign government securities were essentially discontinued after 1930, and rating agencies did thus not increase their coverage, the sharp deterioration in rating composition reflected the greater number of downgrades than upgrades. Figure 4 tracks upgrades and downgrades for the four agencies and shows there were very few upgrades and a large number of downgrades between 1931 and 1934. In 1932, Fitch downgraded 90 percent of their foreign government securities, Moody’s 80 percent, and Standard Statistics and Poor’s close to 50%.
To the extent that the agencies remained upbeat during the 1920s, with upgrades outnumbering downgrades (see Figure 4) and revised drastically their perception after 1930, questions about the stability of ratings through the cycle may be raised by the early experience of sovereign rating. On the other hand, it may simply reveal that the bond market collapse of 1931 was just as unpredictable for rating agencies as it was for markets. In any case, this suggests that the modern tendency for ratings to be reactive to financial crises rather than anticipate them, noted by Reinhart (2002), was also a feature of its early, regulation free stages. The next section takes a closer look at the record and assesses in greater detail the performance of the rating agencies ahead and during the sovereign debt crisis of the 1930s. Section IV. Ratings and Defaults Ratings at and before default An obvious indicator of the level of ratings reliability assumed in the use of letter-grade cut-offs is the extent that agency ratings are able to anticipate actual defaults. To what extent did the levels of ratings as well as their movement ahead of default events reflect the risks? To what extent were investors alerted by the rating agencies? Looking at Sovereign securities to address this question is particularly informative because of the extent of the shock. Average default rates for “investment grade” and “speculative grade” corporate securities for 1930-34
43 . As the lists of securities rated by the two agencies were not identical, differences may represent differences in composition of issues rating as well as differences in the ratings assigned to common borrowers. However, the charts do not differ greatly if only jointly rated issues are used.
15
are 0.56% and 8.42% respectively. Comparable numbers for sovereign securities are 5.6% and 31.1%.44 We thus set to collect records of sovereign default from two standard sources, namely Moody’s and the Annual Reports of the Foreign Bondholders Protective Council (FBPC). As is well known, the 1930s wave of sovereign defaults was unprecedented. Our new data supports this (Figure 5). By December 1939, more than half of countries that had borrowed on the NYSE in the 1920s had defaulted, accounting for nearly 40% of the number of sovereign and quasi-sovereign securities issued there. And more than four-fifths of the number of sovereign issued bonds in the 1920s that defaulted in the 1930s did so between 1931 and 1933. The coincidence between the wave of defaults and the deterioration of the rating outlook documented above suggests that defaults were a powerful driver of the observed dynamics.45 Figures 6 and 7 provide further insights. Defaults surged across many rating classes. Figure 6 shows the composition of the (last observed) ratings for the four rating agencies at the time of default for the 41 defaults of the sample. So-called “high-grade” ratings appear to have provided little guarantee against default during the financial crisis. After 1930, defaults surged across all rating classes. More than one-half of all defaulted bonds are observed to have a high-grade rating (the equivalent of BBB or higher) from at least one agency. In the case of individual agencies, for Fitch and Poor’s, the last observed ratings for 39% of the defaulting issues are high-grade. In the case of Moody’s, fully 45% were rated high-grade. Standard Statistics has “only” 25% of the defaulting issues rated high-grade.46This contrasts notably with the general default experience of the last two decades of the 20th century.47 The incidence of high-grade defaults at the time was not merely due to bonds at the fourth highest letter grade level. A good chunk of the high-grade defaults occurred with observed ratings even higher than the fourth highest letter grade level: defaults of A grade (or equivalent) or higher accounted for up to 23% (Poor’s) of the high-grade defaults. 48
44 . Source: Corporate: Moody’s (2008); Sovereign: authors’ computations. There are some limitations to strict comparability and the numbers are mostly for heuristic purpose. Details available from the authors. 45 . For agencies other than Moody’s, defaulted securities were recorded as C or D-rated securities and maintained as part of the rated security population. 46 .The fact that the ratings were based on snapshots were taken at different months of the year implies that the ratings used for this study of some agencies might have had an informational advantage relative to others by being more recent. We checked whether the timing of defaults relative to observed ratings might have biased the comparison of the agencies with regard to ratings at default, eg accounting for Standard having a lower percentage of highly rated issues at default. However, the average numbers of months elapsed between the latest available rating and the dates of defaulted issues are quite similar: 4.9 for Fitch, 5.4 for Poor’s, 6.2 for Standard Statistics, and 6.8 for Moody’s respectively. If anything, Standard’s ratings were at a slight disadvantage. 47 . For instance, Cantor and Mann (2003) state that the average Moody’s rating for defaulting issues during 1983-2001 is CCC. Of course, these ratings from the modern era were continuously updated, and thus had an informational advantage by being fresher than our observed interwar ratings, but the ratings of issues that default at longer horizons are also significantly lower in the modern than pre-war era as well. 48 . No bond was observed to have the top rating (AAA/Aaa/A**/A1+) at the time of default. The one bond which was observed to have top ratings at some time prior to default was the 1924 German bond, rated AAA by Fitch four years before its default in 1934. Two securities had observed ratings in the second highest category at the time of default: the Dominican bonds rated AA by Fitch. Several bonds were rated in this category at some point before their default (the Dominican bonds (Fitch and Standard Statistics), the 1924 German bond (Moody’s), the 1930 Cuban bond (Poor’s), the 1928 Panama bond (Fitch, Poor’s, Standard Statistics)). Many bonds were rated A by the agencies at the time of default or a few years before.

16
Even starker results obtain when we move a bit further back in time, and check the last observed ratings of defaulted issues one year ahead of default (Figure 7). Between 39% (Standard Statistics) and 66% (Moody’s) of the defaulting bonds are observed to have a high-grade rating one-year ahead of default. This compares to an average Moody’s rating one-year prior to default of B in the 1983-2001 sample mentioned above. Again, there are many future defaulters in our sample rated A grade (or equivalent) or above one-year ahead of time (more than half the high-grade defaulters).
Correspondence of ratings to default rates49 Default rates, which control for the quantity of issues outstanding in different ratings classes, provide another take on the issue of ratings reliability. The use of ratings in regulations assumes, at some level, that ratings provide a good measure of the absolute risks of default, or the degree of probability of default or expected loss associated with a particular rating category. However, evidence for recent periods does suggest agency ratings have not been a particularly reliable guide to absolute credit risks over time – the likelihood of default associated with any particular rating tends to drift over time (Cantor and Packer, 1994).
As might be expected, variability is present in default rates on various horizons in the interwar era (Tables 4-6). For example, the 1-year high grade default rate for Fitch which averages 3% in the years 1928 to 1937 ranges between 0 and 16% for individual years; at the longer horizon of 5-years, the high-grade default rate ranges for Moody’s ranges between 2 and 32%. This variability is much greater than that documented in the post-era – likely indicative of the degree to which the financial crisis and great depression were completely unanticipated and beyond cyclical norms. In addition to variability, the default rates at all horizons show high default rates for high-grade credits, nearly an order of magnitude difference at all horizons relative to recent experience. For instance, the average high-grade one-year default rate (for the years 1928-1937) of between 2-4% for the four rating agencies (Table 4) dwarfs Moody’s worst single-year default rate for investment-grade credit during 1983-2001 of 0.5%. Similarly high-grade default rates at the three year horizon (for the years 1928-1937) that average between 8-13% for the four rating agencies (Table 5) correspond to a worst year of 2% in the recent Moody’s rated sample cited above. 50 Neither do the default tables provide ringing support for the notion implied by the use of multiple agency ratings in regulation that the absolute scales of the ratings agencies – i.e. the correspondence of their ratings to default – were strictly comparable in the interwar era. Moody’s 1 and 3-year Baa default rates of 15% and 35% corresponded to ranges for the other three agencies of between 5-8% and 16-20%, respectively. The degree and consistency of the differential may be indicative of the fact that in the interwar era, before the correspondence of ratings implied by regulation was well-established, Moody’s could well have thought of their Baa rating as corresponding to a higher default rate than the other ratings agencies thought of
49 . The default rates and the accuracy ratios reported in the following two sections and in Tables 3-7 were also calculated for a smaller issuer-basis sample, whereby only one bond (either the most junior or the one for which the most data were available) was taken into the sample per country. None of the results reported in the following two sections differed significantly for the smaller sample. 50 . To be sure, some of the level difference in default rates compared with more recent experience is accounted for by the lower frequency at which observed ratings were available. However, even the addition of one-year to the time horizon leaves average default-rates calculated for the more recent period lower than those calculated for the interwar era.

17
their BBB-equivalent.51 Another example is provided by Standard’s higher-grade rating default rates, which were consistently lower than those of the other three agencies at all time horizons, suggestive of either a different cut-off for Standard Statistics than the other three agencies for high grade credits (in conflict with what external observers perceived) or of a more pessimistic outlook than other agencies.52
Section V. Performance and Accuracy Ratios Measuring relative performance The above discussion focused on the variability and levels of absolute risk at different rating levels. In fact, Moody’s and other rating agencies have for some time indicated that relative rating accuracy is the primary objective of their rating systems (e.g. Cantor and Mann, 2003). To be useful, ratings at a minimum should be able to provide a good ordering of relative default risk among different credits. Since for the most part relative creditworthiness does not change dramatically over time, producing consistent relative rankings allows rating agencies to maintain greater ratings stability through the business cycle, with relatively infrequent and small changes that are unlikely to be reversed in a short period of time.53
One indicator of the ability of rating agencies to order relative risks is the degree to which default rates tend to increase as ratings decline. Almost all academic studies on the topic show a strong negative relationship between the two at relevant time-horizons. Tables 4-6–despite the documented variability in default rates over time and across agencies--are all consistent with default rates rising as ratings decline at the 1, 3 and 5 year time horizons for all years before and during the financial crisis.
However, documenting the simple existence of a negative relation between ratings and default rates or recovery rates is probably unsurprising and a fairly weak test of ratings reliability. Further, it does little to distinguish between the discriminatory power of one rating system versus another. A more precise assessment of a rating system is provided by the so-called cumulative accuracy profile (CAP) and associated accuracy ratio, which is described in Cantor and Mann (2003).
Like default rates, CAPs and accuracy ratios can be calculated for any cohort of securities at a single point in time for any given time horizon. As shown in Figure 8 below, the CAP curve indicates the share of total defaults among the borrowers as a function of the share of the lowest-rated borrowers in the sample. Namely, for any given share of the lowest-rated borrowers in the sample (e.g. the lowest 10% of the sample), the CAP curve charts what percent of defaults in the sample they account for (e.g. 50%). The more the CAP curve veers towards the upper-left hand corner close to the vertical and horizontal axes, the greater the proportion of defaults that occurs in the lowest rating categories.
This representation of ratings performance is independent of the particular scales used by agencies as well as the absolute level of default rates. Comparison then only requires using identical cohorts of securities across identical time periods. It is made by graphing different 51 . In the post-war era; if anything, evidence suggests that Moody’s ratings likely corresponded to a stricter scale than those of some other agencies (Cantor and Packer, 1997). 52 While the differential lags at which we observe ratings during the pre-war era can account for some of the higher Moody’s Baa default rates and lower Standard (overall) default rates, examination of default rates at marginally shorter horizons for Moody’s and marginally longer horizons for Standard indicate that the lags cannot account for the entire difference. 53 . Noting that many clients prefer ratings that are stable as well as accurate, Cantor and Mann (2007) explicitly analyze the trade-off between ratings accuracy and stability. We do not assess ratings stability in this study.

18
ratings system on the same chart and looking for the one that always provides a higher proportion of defaults for ratings in ascending order. This is the case for ratings system 1 in Figure 8, which dominates both ratings system 2 and 3. Of course, it can be the case that different curves provide ambiguous signals about their relative accuracy. This is when different parts of the curve lie closer to the upper left-hand corner, depending upon the portion of the rating scale that is examined. This is the situation for ratings system 2 and 3, which cannot be compared to one another.
However, it is possible to distil the information of any cumulative accuracy profile into a single statistic, called the accuracy ratio. This is the ratio of the area between the CAP curve and the 45 degree line, and the maximum possible area between the 45 degree line and a perfectly accurate rating system. (The means of calculation are discussed in the appendix.)
The accuracy ratio has a number of attractive properties: a) it is always larger for any curve that lies unambiguously above another; b) it effectively varies between -1 and 1, much like a correlation measure, where 1 represents maximum accuracy when all defaulters are assigned the lowest ratings, and c) it is invariant to changes to the aggregate default rate that do not also change the ratings distribution of the share of defaults.54 Results In what follows, we compare the performance of the four agencies’ separate ratings, an average of their ratings, and a measure of “market” ratings. For the last measures, we use a method detailed in Breger et al. (2003) to transform yield spreads (collected using prices in the Wall Street Journal) into ratings. The need to match the population of ratings across the four agencies produces a set of 120 bonds, though only a subset of these are used for any single cohort since bonds enter in and exit the sample due to new issuance, redemption, default and so forth. The need to match agency ratings against synthetic ratings derived from yields produces a more limited set of around 70 bonds (for which prices are available), though again only a subset of the 70 applies to any single cohort. We consider three horizons (one year, three years and five years). Moreover, to capture the performance over the wave of interwar defaults and downgrades we examine the one year ahead predictive performance of the various ratings between 1931 and 1936 (since there were no defaults in 1935, one year accuracy ratios cannot be calculated for that year). We look at the three years ahead performance for the (non-overlapping) cohorts of 1929, 1932, and 1935. And finally the five years ahead performance is examined for the non-overlapping cohorts of 1929 and 1934.
The results in Table 7 show that, quite apart from the issues of absolute scale differences discussed above, there were striking differences in accuracy in the ranking of relative credits among the observed ratings of the agencies. Moody’s and Standard Statistics had the highest accuracy ratios (AR) among the 4 agencies in 50% and 40% of the cohorts examined, respectively, and one of these two agencies accounted for the second highest ratio in 50% of the cases. The performance comparison of ratings was for the most part invariant to time horizon. Differences in the accuracy ratios could be substantial: for example, the mean
54 . There are other schemes reducing the CAP to a single number with the above properties, but the key identifying assumption of the accuracy ratio of equation (1) is that the ratio, as calculated, weighs errors on the high end of the rating scheme equivalently to errors on the low end of rating scheme. Equivalently, the cost of having a defaulting borrower highly rated (type 1 error) is weighed equally to the cost having a non-defaulter rated too low (type 2 error).

19
accuracy ratio over all cohorts at the five-year horizon ranged from 60% for the highest performing rating agency to 52% for the lowest.55 In an indication that the individual rating agencies might be getting separate, valuable, signals about the creditworthiness of sovereign borrowers, the accuracy ratios of the consolidated ratings (average rating) were often superior to those of each of the single agencies. The average rating scored higher on average than all of the individual agency ratings at the three and five-year horizons, with a mean accuracy ratio higher than each of the single agencies.
Finally, with regard to market versus rating agency rankings of relative risk, we report the difference between the accuracy ratios of the agency ratings, and synthetic ratings derived from market prices for the same cohorts in Table 8. (A negative number in any cell indicates that the agency ratings had lower accuracy ratios than the yield-based metrics.) The results suggest that market-based ratings modestly outperform observed agency ratings at the one- and three-year horizons, having a higher AR in about 16 of the 25 cases (4 agency ratings plus average rating over five separate years) at the one-year horizon, and a higher AR in two-thirds of the cases at the three-year horizon. At the longer 5-year horizon, actual agency ratings appear to outperform the yield implied ratings (YIRs), though only modestly.56 That said, the difference in the accuracy ratios between observed ratings and yield-implied ratings at all maturities, while large for specific years and specific agencies, is relatively small when the mean is taken across all the cohort years. In sum, there does not seem to be anything specific or exceptional about the performance of rating agencies in assessing relative credit risk over the interwar period compared to what could have been inferred from market prices. At the same time, they were still pretty new to the game and this is only half surprising.
Section VI. Ratings vs. Bankers In the previous discussion, we have recurrently alluded to the bad reputation that bankers acquired in the midst of the interwar financial collapse. Theory suggests that in a poor information environment, intermediaries can provide valuable signals on the quality of the assets they market. Historically, before ratings existed, bankers assumed an important role as providers of certifying services for the benefit of investors.
This mechanism has been identified for European markets. Flandreau and Flores (2009) report evidence of a mapping of underwriters’ prestige onto the grade of sovereign borrowers, with leading merchant houses such as Rothschild signalling lower default risks by sovereign borrowers. They show that during the early 19th century, sovereign securities underwritten by Rothschild proved more resilient than the others. This secured a leading market share for the
55 . The performance of Standard likely reflects at least in part the lag that is shorter (than other agencies) between the previous year’s observed rating for which rating cohorts are determined and the periods over which defaults are observed. The factor will be most important for the 1-year accuracy ratios, where Standard’s rating indeed outperforms the most markedly. By contrast, the performance of Moody’s ratings is particularly striking given its observed ratings have the longest lag. Mean and median accuracy ratios were calculated over all available yearly cohorts, and thus contain overlapping observations at horizons greater than one-year. 56 . Again, the greater lag at which our agency ratings are observed relative to market yields (greatest for Moody’s, least for Standard) might account for some of the (marginally) superior market yield performance, particularly at short horizons. As reported in Table 7, though the accuracy ratio tends to be higher for actual agency ratings than yield-based ratings for the two selected cohorts at the five-year horizon, the mean difference calculated across all annual cohorts find agency ratings to (slightly) outperform market yields only in the case of Moody’s ratings. The improvement in the ratings performance relative to the YIRs at longer maturities parallels the results for more recent samples using Moody’s ratings (Cantor and Mann, 2003).
20
prestigious underwriters and helped them consolidate their position.57 During the interwar period, Lord Kindersley, of the house of Lazard (a “merchant bank” i.e. investment bank) in London, stated before the Macmillan Committee that “if we put our name to [an issue] we really say to the public: ‘We have looked thoroughly into this, we thoroughly believe in it, and we can thoroughly recommend it”.58 He also questions whether such policies could be trustfully adopted in New York, owing to commercial banks’ conflict of interest. US bankers interviewed during the Senate Committee on Finance Hearings on the Sale of Foreign Bonds insisted that they had strong incentives to signal properly the quality of investments to the subscribing public. The following exchange, taken from the interview of Otto Kahn from Kuhn & Loeb is a typical illustration: “[Kahn] I think that the banker is called upon to exercise a greater degree of care than pretty nearly anyone else who is dealing with the public, because he is dealing with a commodity as to which he is considered to be an expert adviser and as to which many people rely on his integrity. [Sen. Johnson]: And judgement? [Kahn] His integrity and judgement […] He must resolutely decline, whatever be the monetary inducement, to attach that trademark and that responsibility to any securities as to the soundness of which there is, or ought to be, any doubt in his own mind. If he does not do all that, he is not the kind of banker that deserves to live.”59
So did US banks “deserve to live”? To address this question, we deepen our foray and compare the performance of rating agencies with that of bankers as providers of quality signals. The argument we examine is the following. We consider the null hypothesis that in the pre-rating era, underwriters performed certification roles. As a result, we ought to be able to treat underwriters’ names as equivalent to ratings, with more prestigious houses being able to signal sounder investments. The alternative assumption, that bankers did not care, would have rating agencies outperforming the signals associated with bankers’ brands. To identify prestige, we have relied on the suggestion from Megginson and Weiss (1991) to use relative market shares of the underwriter. The argument is that in a context of serious information asymmetries, prestigious houses can secure a greater market share.60 This is both owing to their greater screening abilities and to the fact that the resolution of asymmetries of information is more complete for safer securities (which prestigious houses tend to specialise in), so that the market for quality bonds dominates in size the market for much more speculative securities.61
On this account we have already noted that, ex ante, the vast majority of the foreign government securities marketed in New York during the 1920s has one of the top four rating grades (later known as “investment grade”) and this vindicates Otto Kahn at a broad level. Yet a more precise and interesting question is whether we can discern finer shades in the selection of securities for underwriting by bankers. In other words, we need a formal test of this “certification-by-name” accuracy. Empirically, we use market shares to rank underwriters
57 . In the late 19th century, some commercial banks, such as the Credit Lyonnais in France, developed powerful research and certification units as well as Chinese Wall policies in order to establish their credibility as certifiers of safe securities (Flandreau 2003). 58 . Macmillan Committee, Minutes of Evidence, p. 77. 59 . U.S. Congress, Senate (1932), 60 . For related measures and their discussion, see Carter and Manaster (1990); Carter and Dark (1989); Carter, Dark and Singh (1998). 61 . The argument is also consistent with the evidence in Flandreau and Flores (2009) for the London market for sovereign debt in the early 19th century.

21
from the least prestigious (Chandler, Brown & Harriman, and Lisman) to the most (JP Morgan).62 We then compare the performance of this “rating” system with that of the agencies’ by graphically comparing cumulative accuracy profiles as done in the previous section.63 Figure 9 shows the cumulative accuracy profiles (CAP) for our 120-bond interwar sample of a underwriter reputation (market share) ranking system alongside that of one rating agency. The selected agency is Moody’s, because it is the one with the longest record in sovereign ratings. We are confident however (and the previous section suggests) that results would not be affected by considering another agency. All measures are roughly concave, which is consistent with all “rating systems” adding value, but the cumulative accuracy for bankers does display a somewhat less smooth profile with default rates again accelerating for prestigious houses (in other words it is not strictly concave).64 As can be seen, no security initially rated with the highest credit rating defaulted. However, the most prestigious house (JP Morgan) while very safe was not default free.65 In sum, the accuracy profile for the agency ratings clearly dominates that based on a market-share based reputation measure for underwriting banks. The above may be taken as prima facie evidence that agency credit ratings had outperformed the reputation of underwriting banks as a means of sorting credit risk. This finding may go some way towards explaining why the former were then used as an instrument to assess the quality of the portfolios held by national banks. The driving force behind the emergence of rating agencies at the forefront of the new regulatory regime may not have been, strictly speaking, he high performance of rating agencies, but rather a crisis of confidence in the credibility of bank based signals of credit quality.
Section VII. Conflicts of interest, legal franchise and regulatory license Undoubtedly, the difficulties for predicting must have been enormous and the agencies were not strongly superior to the market. On the other hand we reckon that some of the earliest (albeit quite late) pessimistic assessments of the financial and economic outlook on the eve of the 1929 Crash came from the rating and economic information provision industry. In September 5, 1929 Roger Babson (whose professional career and personal investments were tied to ratings) made gloomy predictions that are less remembered than Irving Fisher’s
62 . Authors’ computations. Brown Bros Harriman was born in January 1931, from the merger of W.A. Harriman et de Brown Bros. 63 The sample for which the CAPs in this exercise are calculated are collected as follows. We take every outstanding sovereign issue for which a Moody’s rating was available at 1918 (and for which the underwriter at issue was known) plus all Moody’s rated bonds (ratings at issue) between 1919-1938. The market shares of the underwriters are calculated based on the fraction of this number of bonds (120) underwritten by each underwriter. There are 17 different investment houses which underwrote the bonds, thus 17 different underwriter reputation ratings to attach to the bonds at issue. The difference between this and the earlier exercises is that this time, the time horizon over which defaults are tracked is not fixed but varies according to when each security is issued and redeemed. However, the comparison is valid since the same sample is used to calculate the CAP of both the agency ratings, and underwriter market share (reputation) based rankings. 64 . A particularly interesting case is the bank with the second highest market share rating, which contributed proportionately more to defaults than it underwrote. That this bank was a commercial bank (National City Bank) may have played an important role in the subsequent debates about the dangers of universal banks. This may also shed light on the rationale for the Glass Steagall Act. 65 . That the Dawes and Young loans to Germany account for the largest share of JP Morgan’s defaulted securities may be taken as indicative of the liability that US diplomacy created for the signalling capacity of its banking system. We are grateful to Robert McCauley for having brought our attention to this point.
22
unwelcome remark on the ‘permanent plateau’, although they attracted much discussion at the time. In his words: “Wise investors will pay up their loans and avoid margin speculation at this time because a ‘crash’ of the stock market is inevitable.66 Still, there were subsequent accusations that the forecasting record of the rating agencies was dismal and in June 1931, it led Standard Statistics to circulate throughout the world a booklet meant to refute such allegations.67 This conclusion leaves us with a puzzle. We still need to understand the rationale for the increased regulatory use of ratings in the 1930s. In what follows, we argue that ratings – and only ratings – met both a necessary and a sufficient condition to emerge as an instrument for supervision. As said, owing to different performance of the different agencies, it is hard to conclude that the agencies “at large” outperformed. Moreover, in the midst of the 1931 crisis, there was still way too much smoke for any regulator or observer to be in a position similar to ours to make any such inference – and we found that the evidence was not unambiguous. And thus, why did they start relying on ratings? Regulation and Forbearance in the 1930s Our starting point is the following remark. Serious financial turmoil such as that of the 1930s or the current sub-prime crisis is characterized by failure of the price discovery mechanism. Distress sales and the withdrawal of many investors from financial markets not only result in severe price declines but often the inability to transact at any price. Not only are bad securities shunned, but so are fair ones and even good ones. The effects of such shocks to market liquidity are enormous and threaten economic stability.68
A solution is to provide support to good securities, since the deep discounts during crises or on occasion even the disappearance of liquidity altogether for these securities does not reflect a problem with their intrinsic value. This rationale goes back to early contributions to the theory of lending of last resort. Bagehot (1873/1919, p. 194-5) emphasized the benefits from lending freely on “good” securities.69 Extensive support to holders of such securities would check unjustified price depreciation. Following Goodhart (1985), lending of last resort has been rationalized as a way to prevent fire sale liquidations transforming an illiquidity problem into one of insolvency. Identification of eligible bonds thus becomes the crux of crisis management. It is a peculiarly difficult issue, because it is in the nature of crises to cast doubt on the significance of previously well-established values. If all values go down, and if illiquidity quickly converts itself into insolvency, how are we to tell good from bad? We argue that two conditions must be met. The necessary condition is that the sorting of securities to handle the crisis is socially and politically acceptable. This means that a critical degree of consensus should exist on what a good security ought to be. Any sorting system that is robust to political criticism can become an eligible instrument of crisis management. The sufficient condition is that this system does exhibit a fair degree of separation, in normal times but more importantly in periods of crises, with the standard price discovery system, since it is this very system, which is said to malfunction. To summarize, what is needed to handle a crisis, is a kind of price system that is not the price system. If a solution to this “catch-22” problem does
66 . The New York Times, September 6, 1929. 67 . Standard Statistics (1931). 68 . One implication of this may be that suggestion by authors such as Partnoy (2001) that regulation could rely on market prices are not practical, because failure of the market mechanism is where the story begins. 69 . He found that British government debt and also prime corporate bonds ought to be eligible.

23
exist, then public authorities can lay to rest the malfunctioning parts of markets and restore order by relying on a parallel pricing system. We argue that ratings provided a response. To see this, we need to show that relying on ratings as was done in the early 1930s provided a corrective to what was perceived as defective market pricing. For this, we use a randomly drawn sample of US corporate and foreign government securities rated in the third and fourth top categories on the day after the publication of the Comptroller of the Currency’s rule, and compute the nominal benefit from booking at face value as a percentage of mark-to-market valuations. Our computations are made using Moody’s third and fourth rating levels (A and Baa).70 For corporate securities the wedge between is 16.7% (A) and 32.8% (Baa). For foreign government and sub-national securities, for which the collapse in prices had been reported to have been much worse, the boost is huge: 75.6% (A) and 82.1% (Baa).71. In other words, in the midst of the crisis, ratings initially emerged as a powerful corrective to a financial panic that sent bond prices plummeting across the board. According to the New York Sun, quoting the Comptroller of Currency: “the banks have been permitted to enter in their assets the full value of [high grade] bonds […] Mr Pole stated that depreciation in these high grade securities has been due purely to market fluctuations, and that to permit banks to report them at face value is now and has always proved sound and reasonable.”72 Similarly the Wall Street Journal reported that “depreciation in high grade securities has been due purely to market conditions, and that to permit banks to report them at face value is […] sound and reasonable. […] Issues given the four highest ratings by statistical corporations did not have their intrinsic value impaired by market fluctuations.”73 We conclude that ratings met the sufficient condition described above, namely, they were a sorting instrument to correct a perceived failure of the price discovery mechanism, and as a result could help provide much needed forbearance in a system under acute stress.74
Regulation and conflicts of interests The second part of our argument has to do with the social acceptability of ratings. Students of history are familiar with the blaming game that follows disasters. Crises, when they reveal wrongdoing, create pressures for political action. To the extent that the crisis is viewed to have been created by improper behaviour, then the offenders must be punished. And if it has been created by improper structures, these ought to be changed as well, but the key point is to identify some individuals that ought to be punished. The interwar stock market collapse and bond debacle provided plenty of opportunity for complaints. The soil for such accusation had been fertilized for a long time by concerns expressed publicly by senior voices such as Brandeis (later Justice Brandeis of the Supreme Court) an open critic of the agency problem associated with delegation of portfolio management to bankers (Brandeis 1914). Already
70 . Similar results would obtain for other agencies. 71 . Computations based on prices as of September 12, 1931 (Wall Street Journal, September 14, 1931). For details on how the sample was constructed, see Appendix. For a related interpretation, see Morton 1939. He argues that the use of ratings enabled banks to insulate themselves from the bond price debacle while ensuring the quality of their portfolio. 72 . The New York Sun, September 11, 1931. 73 . “75% of bonds valuations safe”, Wall Street Journal, September 12, 1931. 74 . The SEC took a similar measure in September 2008, allowing money market mutual funds to value A1-P1 securities on the basis of amortised cost in their calculation of their shadow prices for the purpose of assessing whether they had broken the buck. We are grateful to Robert McCauley for pointing this out to us.

24
before WWI, the Pujo Commission and investigation of the Money Trust had emphasized the conflicts of interest posed by investment banks’ underwriting and intermediation role. During the 1920s some critics included some coming from the industry itself, noted that the originate and distribute model, whereby underwriting firms were receiving fees from the concerns whose bonds they floated, was flawed by inevitable conflicts of interest. Among the most vocal proponents of this view was Max Winkler. Winkler supervised foreign government bond ratings at Moody’s. He left Moody’s and launched his own series of manuals in 1928.75 Later, he wrote what became a reference book on the 1920s sovereign bond market cycle in which he drew on his experience at Moody’s (Winkler 1933). The debate over bankers’ conflicts of interest during the 1930s is a critical aspect of the evolution of the rating industry during those years. During the 1930s concerns were expressed in newspapers and also in a succession of Senatorial commissions, starting with the Senate Committee on Finance hearings on the Sale of Foreign Bonds on the sale of foreign securities in the US and continuing with increasingly acrimonious overtones during the Pecora investigations into the causes of the Wall Street Crash of 1929. The recurrent, almost obsessive, theme of these hearings was concern with bankers’ conflicts of interest (Benston 1990, p. 64). These included and were not limited to accusations such as the following: a) bankers had misled the public about the quality of securities to cash in short-term fees; b) bankers were connected to Republican administrations and committed to their foreign policies; c) bankers supported foreign defaults on long term debts (held by ordinary investors) to protect their own short term loans to foreign governments (still in their books).
The rampant distrust of normal financial intermediaries – sometimes called “banksters” – was so prevalent that it became a major theme of Franklin Delano Roosevelt’s 1932 Presidential campaign. This distrust stands in contrast with the prevalent view of the rating agencies. As a result, bankers taken to task on specific bond issues they had underwritten gave contemporary ratings as proof of their sincerity. Benston (1990, p. 64) gives the example of the National City Company’s CEO Charles Mitchell justification of Anaconda Investments before the Pecora investigations by pointing to the positive outlook Anaconda had received from Standard Statistics. Such a defence may have been suggested by the bank’s lawyers. As early as 1897, court decisions quoted ratings as external evidence of the quality of investment recommendations.76 Thus it would appear that judges saw ratings as opinions that were free of conflicts of interest, and this we argue was a powerful factor in causing their emergence as an instrument for regulatory control.
This legal perspective was precisely the one that Brandeis adopted when he referred to the problem of agency faced by financial advisers in his criticism of the Money Trust: “No man can serve two masters. The surprising fact is that a principle of equity so firmly rooted should have been departed from at all when dealing with corporations. For no rule of law has, in other connections, been more rigorously applied, then that which prohibits a trustee from occupying inconsistent positions, from dealing with himself, or from running his fiduciary position for personal profit. And a director of a corporation, is as obviously a trustee as person holding similar positions in an unincorporated association, or in a private trust estate, who are called specifically by that name. The courts have recognized this fully”. (Brandeis 1914, p. 38). Obviously, the trustee problem was better addressed by a rating agency than by a banker.
Against this backdrop, pointing to the initial high ratings provided a more credible case than citing the initially high prices bond had once commanded, for bankers faced the charge that 75 . Winkler’s Manual of Foreign Corporations, published by Overseas Statistics. 76 . Partnoy (2001, p. 19).

25
they had manipulated prices. We thus argue that ratings not being tainted by perceived conflicts of interest (and here the emphasis is on the political perception of the existence of a conflict of interest, not on its reality) gave them a legal franchise that was a powerful factor for their subsequent regulatory license.77 The key element is legal and political, and has thus little to do with economic performance or track record as such.
Conclusions The interwar period offers a rich environment where we can examine a number of contentions pertaining to the performance of rating agencies and the relation between this performance and the regulatory and competitive environment. This is because until the 1930s, ratings were not part of the supervisory frameworks and thus in principle without regulatory license. The two natural questions that emerge in this context are why ratings emerged as an instrument for regulatory control and whether rating agencies performed significantly better or worse in this environment.
Our main empirical finding is that the performance of rating agencies during the interwar era was not particularly exceptional. Ratings above subsequent regulatory cut-offs provided little guarantee against default during the financial crisis. Rating agencies generally did not exhibit forecasting capacities superior to those embedded in available market prices. While this probably means that the agencies like many other players in the financial industry did not see the interwar debacle coming, it is also consistent with the view that their forecasting capacities at the time were not particularly outstanding. On the other hand, we also reported some evidence of market discipline and brand concerns within the industry in the form of an apparently tougher rating scale on the part of Standard Statistics and higher accuracy ratios (particularly at longer horizons) on the part of Moody’s, although the small sample size limits strong statistical inference. Another important finding is that observed credit ratings outperformed a metric reflecting the reputation of the underwriting bank, which had been a powerful signal in other historical environments (see Flandreau and Flores 2009).
These results will have to be challenged and extended, in particular with the help of data for corporate securities, but we think that they fit well with some earlier characterizations that have emphasized that the main reasons for the defaults of the 1930s were the (unpredicted) decline in commodity prices that undermined the fiscal base of many sovereign borrowers. It also presents a new angle on the issue of the importance of conflicts of interest in the interwar era. 78
Another lesson from this paper has to do with regulatory dynamics. While some recent authors have emphasized the different set of incentives faced by rating agencies in the interwar period, they have not emphasized the implications that this may have had on the public’s perception of the agencies. We argue that this played a crucial role in the interwar era. Crises, when they reveal wrongdoing, or suggest that wrongdoing may have occurred, do sap important political and social institutions. The discredit in which the market economy found itself in the interwar years may well be related to the subsequent embracing of extreme ideologies, which sold themselves precisely as an alternative to the “defunct” 19th century liberal-bourgeois social compact. The irony is that distrust in bankers during the interwar years is both a cause of the emergence of ratings as a regulatory instrument, and a foreshadowing of some of the challenges now faced by the agencies. 77 . Compare with Partnoy (2001). 78 . Compare with Kroszner and Rajan (1994), Eichengreen and Portes (1989).

26
In conclusion, the agencies’ new role in the 1930s did not primarily result from evidence of the superior forecasting qualities of ratings per se. More importantly, the agencies were pushed to the centre of the stage because they were perceived as being free from conflicts of interest. While bankers were said to have manipulated prices, the agencies provided a certification of quality that was not tainted by the rampant mistrust in financial intermediaries, and their opinions were used as benchmarks in legal cases. Second, in an environment where volatility hampered the ability of the market to perform effective price discovery, the top four ratings gave regulators some basis for identifying “good collateral”. The emergence of ratings as a regulatory instrument was a specific response to the specific financial problems faced during the Great Depression, conditional upon its being politically acceptable. The previous thoughts cast doubt on what we ought to expect from a revision of incentive frameworks. It may or may not be that some particularly ill-advised ratings were produced ahead of the latest crisis in part on account of defective incentive schemes plagued by conflicts of interest, but there is a long way to go between proving this claim and reaching the further conclusion that regulatory changes addressing such conflicts of interest ought to cure most of our modern problems and somehow make credit ratings more “perfect”. Our results suggest, if anything, that a world where agency conflicts of interest are less pronounced is neither a world where crises are absent nor one where they are more predictable.

27
References Altman, Edward (1989), “Measuring Corporate Bond Mortality and Performance”, Journal of Finance, Vol.44. Atkinson, Thomas R. (1967), Trends in Corporate Bond Quality, NBER.
Babson, Robert W. (1910) “Sources of Market News”; The ANNALS of the American Academy of Political and Social Science, Vol.35; 135, pp. 617-628.
Bagehot, Walter (1873), Lombard Street: a description of the money market, John Murray, London.
Bar-Isaac, Heski, and Steven Tadelis (2008), “Who wants a reputation”, in Foundation and Trends in Microeconomics, forthcoming.
Bank for International Settlements (2006), Basel II: International Convergence of Capital Measurement and Capital Standards: A Revised Framework - Comprehensive Version. Becker, Bo and Todd Milbourne (2008), “Reputation and competition: evidence from the rating industry”, mimeo, Feburary.
Benston, George J. (1990), The separation of commercial and investment banking. The Glass Steagall Act Revisited and Reconsidered, Macmillan, London.
Board of Governors of the Federal Reserve System (1943), Banking and Monetary Statistics 1914-1941, Washington, D.C.
Bolton, Patrick, Xavier Freixas, and Joel Shapiro (2008), “The Credit Ratings Game”, Mimeo, UPF, Barcelona.
Boot, Arnoud, Todd J. Milbourn, and Anjolein Schmeits (2006) “Credit Ratings as Coordination Mechanisms”, Review of Financial Studies, Vol.19, No.1.
Brandeis, Louis D. (1914), Other People's Money and How the Bankers Use It, Frederick A. Stokes Company, New York.
Breger, Ludovic, Lisa Goldberg, and Oren Cheyette (2003), “Market Implied Ratings”, Barra Credit Series, Research Insights. Cantor, Richard and Christopher Mann (2003), “Measuring The Performance of Corporate Bond Ratings”, Moody’s Special Comment. Cantor, Richard and Christopher Mann (2007), “Analyzing the Tradeoff between Ratings Accuracy and Stability”, Journal of Fixed Income, Spring.
Cantor, Richard and Frank Packer (1994), “The Credit Rating Industry”, Federal Reserve Bank of New York Quarterly Review, Summer-Fall.
Cantor, Richard and Frank Packer (1996), “Determinants and Impact of Sovereign Credit Ratings”, Economic Policy Review, October.
Cantor, Richard and Frank Packer (1997), “Differences of Opinion and Selection Bias in the Credit Rating Industry”, Journal of Banking and Finance, Vol.21.
Carter, R. and F. Dark (1989), “Alternative measures of underwriter reputation: an empirical analysis”, Manuscript, Iowa State University.
Carter R. B., F. H. Dark, and A. K. Singh (1988), “Underwriter Reputation, Initial Returns, and the Long-Run Performance of IPO”, Journal of Finance, Vol. 53, issue 1, pages 285-311.
28
Carter R. B. and S. Manaster (1990), “Initial Public Offerings and Underwriter’s Reputation”, Journal of Finance, Vol.45, 4, pp.1045-67. Chandler, Alfred (1956), Henry Varnum Poor: Business editor, analyst, and reformer, Cambridge, Mass.: Harvard University Press. Choi, Stephen (1998), “Market Lessons for Gatekeepers”, 92, NW. U. L. REV. 916, 961.
Cleveland, Harold Van B., and Thomas F. Huertas (1986), Citibank, 1812-1970, Harvard University Press, Cambridge.
Dice, Charles A. (1926), The Stock Market, McGraw-Hill Book Cy, New York. Dittrich, Fabian (2007), “The Credit Rating Industry: Competition and Regulation”, Working Paper, University of Cologne - Department of Economics. Dominguez, K.M., R.C. Fair, M.D. Shapiro (1988), “Forecasting the Depression: Harvard versus Yale”, American Economic Review, Vol.78, 4, pp. 595-612. Eichengreen, Barry (1989), The International Debt Crisis in Historical Perspective, MIT Press, Cambridge. Eichengreen, Barry and Richard Portes (1986) “Debt and default in the 1930s. Causes and consequences”, European Economic Review, Vol.30, pp. 599-640. Ferri, Giovanni, L.-G. Liu, and Joseph Stiglitz (1999), “The Procyclical Role of Rating Agencies: Evidence from the East Asian Crisis”, Economic Notes, Banca Monte dei Paschi di Siena SpA, No.3.
Favero, Giovanni (2007), “Weather forecast or rain-dance? On inter-war business barometers”, Working Paper, University of Venice.
Fitch (2007), Sovereign Rating Transition and Default Study 1995-2006, February 7. Fitch (various years), Fitch Bond Books. Flandreau, Marc (2003), “Caveat Emptor – Coping with Sovereign Risk Under the International Gold Standard, 1871-1913”, in Flandreau, Marc, C-L. Holtfrerich, and Harold James (eds.), International Financial History in the Twentieth century. System and anarchy, Cambridge University Press.
Flandreau, Marc and Juan H. Flores (2009), “Bonds and Brands: Foundations of sovereign debt markets 1820-1830”, Forthcoming in the Journal of Economic History, Fall.
Fowler, J. F. (1928), American Investment Trusts, Harper & Brothers, New York and London. Frost, Carol Ann (2006), “Credit Rating Agencies in Capital Markets: A Review of Research Evidence on Selected Criticisms of the Agencies”, Working paper, University of North Texas. Gaillard, Norbert (2008), Les méthodologies de notation souveraine, Unpub. Diss., Institut d’Etudes Politiques de Paris. Goodhart, Charles (1985), The evolution of central banks, MIT Press.
Goodhart, Charles (2008), “The Financial Economists Roundtable’s statement on reforming the role of SROs in the securitisation process”, in Vox, December 5 2008, http://www.voxeu.org/index.php?q=node/2667 Harold, Gilbert (1934), “Do bond ratings forecast the market?” Barron’s, Vol.14, No.53.
Harold, Gilbert (1938), Bond Ratings as an Investment Guide, Ronald Press Company, New York.
29
Hickman, W. Braddock (1953), The Volume of Corporate Bond Financing Since 1900, Princeton University Press. Hickman, W. Braddock (1958), Corporate Bond Quality and Investor Experience, Princeton University Press. Hickman, W. Braddock (1960), Statistical Measures of Corporate Bond Financing since 1900, Princeton University Press. Hill, Claire A. (2004), “Regulating the Rating Agencies”, Washington University Law Quarterly, Vol.82. Hill, Paula, Robert Brooks and Robert Faff (2009), “Variations in Sovereign Credit Quality Assessments across Rating Agencies”. Kisgen, Darren (2006), “Credit Ratings and Capital Structure”, Journal of Finance, Vol.41, No.3. Klein, Benjamin and Keith B. Leffler (1984), “The Role of Market Forces in Assuring Contractual Performance”, Journal of Political Economy, Vol. 89, No. 4. (August), pp. 615-641.
KMV Corporation (1998), “Uses and Abuses of Bond Default Rates”, March 3. Kroszner, Randall S., and Raghuram G. Rajan (1994), “Is the Glass-Steagall Act Justified ? A Study of the U.S. Experience with Universal Banking before 1933”, American Economic Review, Vol.84, No.4.
Lamar, W. R., 1907, Investments: What and When to Buy. The Use of Statistics in Accumulating Wealth, Mass.: The Babson System, Wellesley Hills.
Lewis, Cleona (1938), America’s Stake in International Investments, Brookings Institution, Washington.
Megginson W. and K. Weiss (1994), “Venture capitalists certification in initial public offerings”, Journal of Finance, Vol.46, pp. 879-904.
Mintz, Ilse (1951), Deterioration in the Quality of Foreign Bonds Issued in the United States 1920-30, NBER, Cambridge.
Moody's Investors Service (1924), Foreign and American Government Securities. Moody’s Investors Service (1995), Corporate Bond Defaults and Default Rates 1970-1994.
Moody's Investors Service (1997), Historical Default Rates of Corporate Bond Issuers, 1920-1996.
Moody’s Investors Service (2003), Sovereign Bond Defaults, Rating Transitions and Recoveries (1985-2002), February.
Moody’s Investors Service (2007), Sovereign Defaults and Recovery Rates, 1983-2006, June. Moody’s Investors Service (various years), Moody’s Manuals. Morton, Walter A. (1939), “Liquidity and Solvency”, American Economic Review, Vol. 29, No.2.
Osterhus, Gustav (1931), “Flaw-Tester for Bond Lists”, American Bankers Association Journal, August.
Palyi, Melchior (1938), “Bank Portfolios and the Control of the Capital Market”, Journal of Business of the University of Chicago, Vol. 11, No.1.

30
Partnoy, Frank (2001), “The Paradox of Credit Ratings”, UCSD Law and Economics Working Paper. Partnoy, Frank (2006), “How and Why Credit Rating Agencies Are Not Like Other Gatekeepers”, in Yasuyuki Fuchita, and Robert E. Litan (eds.), Financial Gatekeepers: Can they Protect Investors?, Brookings Institution Press and the Nomura Institute of Capital Markets Research. Poor’s (various years), Poor’s Volumes. Reinhart, Carmen M. (2002), “Sovereign Credit Ratings Before and After Financial Crises,” in Ratings, Rating Agencies and the Global Financial System, edited by Levich R., Majnoni G. and Reinhart C., Kluwer Academic Publishers, Boston. Reisen, Helmut and Julia Von Maltzan (1999), “Boom and Bust and Sovereign Ratings”, OECD Development Centre, Working Papers No.148. Rippy, J. Fred (1950), “A Bond-Selling Extravaganza of the 1920’s”, Journal of Business of the University of Chicago, Vol.23, No.4. Robinson, Leland Rex (1929), Investment trust organization and management, Ronald Press Company, New York. Schwarcz, Steven L. (2002), “Private Ordering of Public Markets: The Rating Agency Paradox, University of Illinois Law Review, 1, 26. Shapiro, Carl (1983), “Premiums for High Quality Products as Returns to Reputations.” Quarterly Journal of Economics, November, 98(4), pp. 659–79. Standard Statistics Company (various years), Standard Bond Descriptions. Standard & Poor’s (2007), Sovereign Defaults And Rating Transition Data: 2006 Update, February.
Standard Statistics (1931), A Forecaster’s view of forecasting, New York: Standard Statistics. Sylla, Richard (2002), “An Historical Primer on the Business of Credit Rating”, in Ratings, Rating Agencies and the Global Financial System, edited by Levich R., Majnoni G. and Reinhart C., Kluwer Academic Publishers, Boston.
U.S. Senate (1932), “Sale of Foreign Bonds or Securities in the United States”, Hearings Before the Committee on Finance, Washington, D.C.
West, Richard (1973), “Bond Ratings, Bond Yields and Financial Regulation: Some Findings”, Journal of Law and Economics, April.
White, Eugene N. (2009), “Lessons from the history of bank examination and supervision in the United States 1863-2008”, paper prepared for the “Conference on Financial Market Regulation after Financial Crises: The Historical Experience”. Wigmore, Barry (1985), The Crash and its Aftermath: A History of Securities Markets in the United States, New York: Greenwood Press. Winkler, Max (1933), Foreign Bonds – An Autopsy, New York: Roland Swain Company.
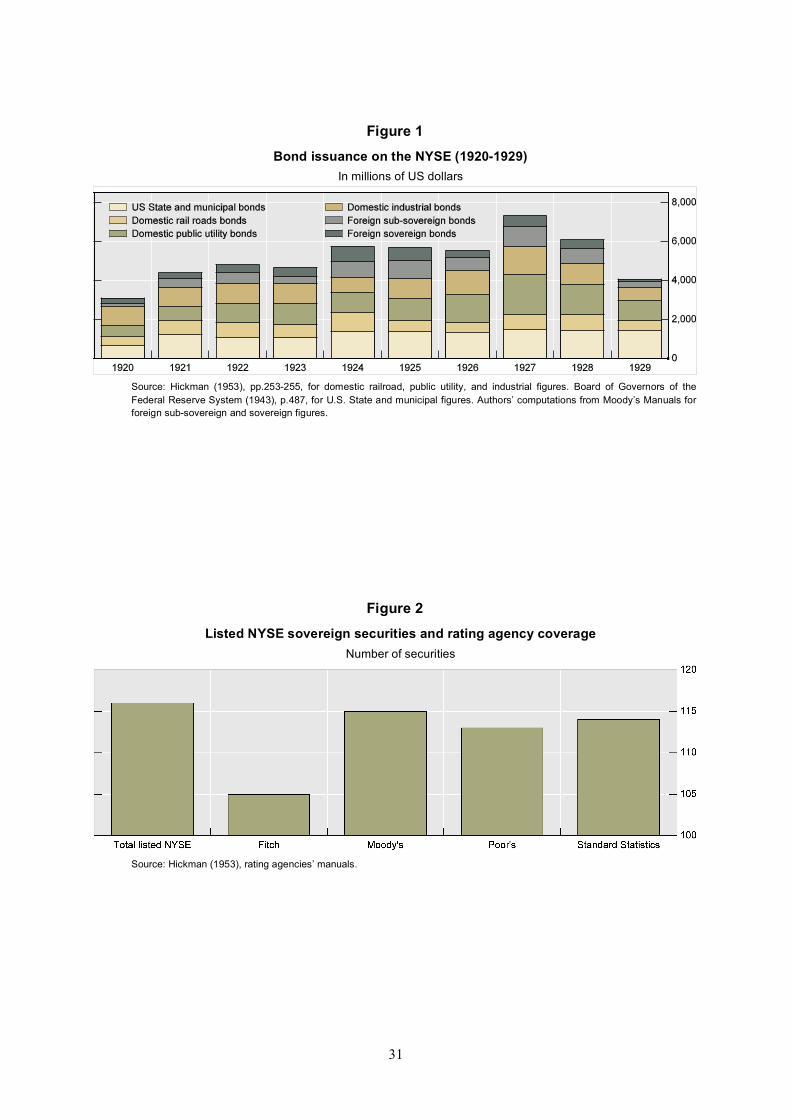
31
Figure 1 Bond issuance on the NYSE (1920-1929)
In millions of US dollars
Source: Hickman (1953), pp.253-255, for domestic railroad, public utility, and industrial figures. Board of Governors of the Federal Reserve System (1943), p.487, for U.S. State and municipal figures. Authors’ computations from Moody’s Manuals for foreign sub-sovereign and sovereign figures.
Figure 2 Listed NYSE sovereign securities and rating agency coverage
Number of securities
Source: Hickman (1953), rating agencies’ manuals.

32
Figure 3 Ratings composition of sovereign bonds outstanding (1918-1937)
In per cent
Moody’s Fitch
Source: Gaillard (2008).
Figure 4 Upgrades and downgrades as fraction of outstanding ratings1
In per cent
1 Positive bars indicate upgrades, negative indicate downgrades.
Source: Author’s computations.
Note: an upgrade (resp. downgrade) measures any upward (resp. downward) revision occurring during year.
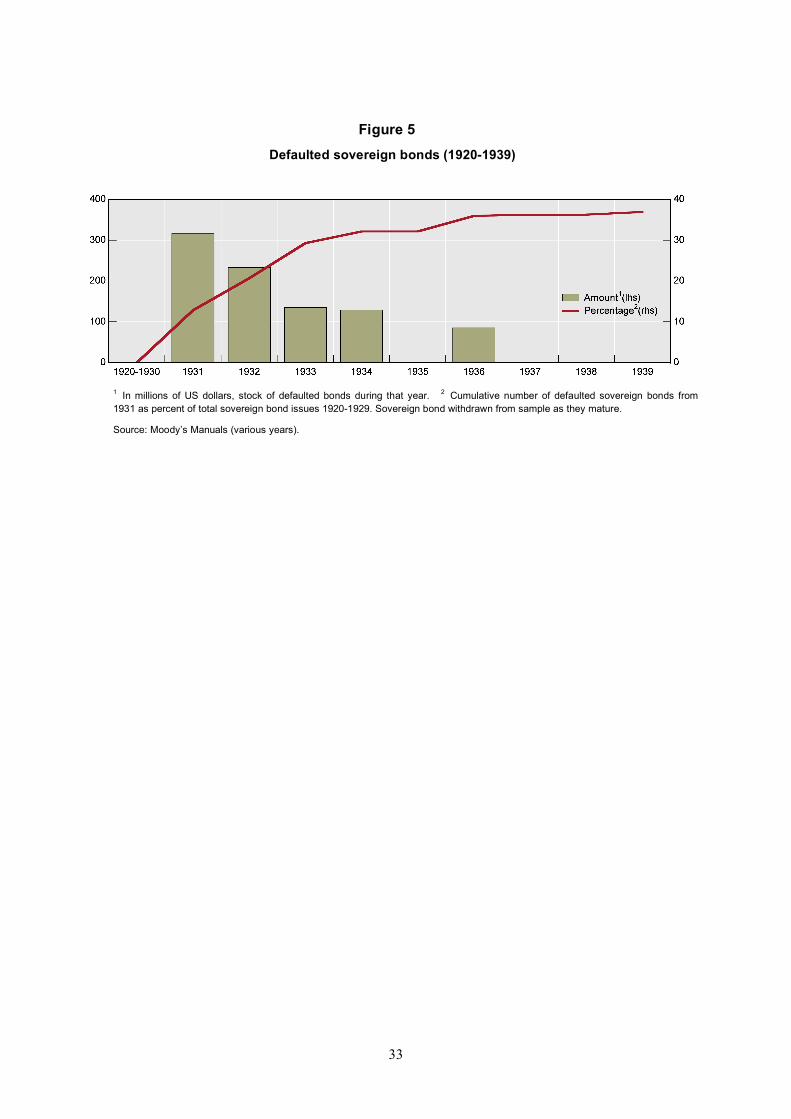
33
Figure 5 Defaulted sovereign bonds (1920-1939)
1 In millions of US dollars, stock of defaulted bonds during that year. 2 Cumulative number of defaulted sovereign bonds from 1931 as percent of total sovereign bond issues 1920-1929. Sovereign bond withdrawn from sample as they mature.
Source: Moody’s Manuals (various years).
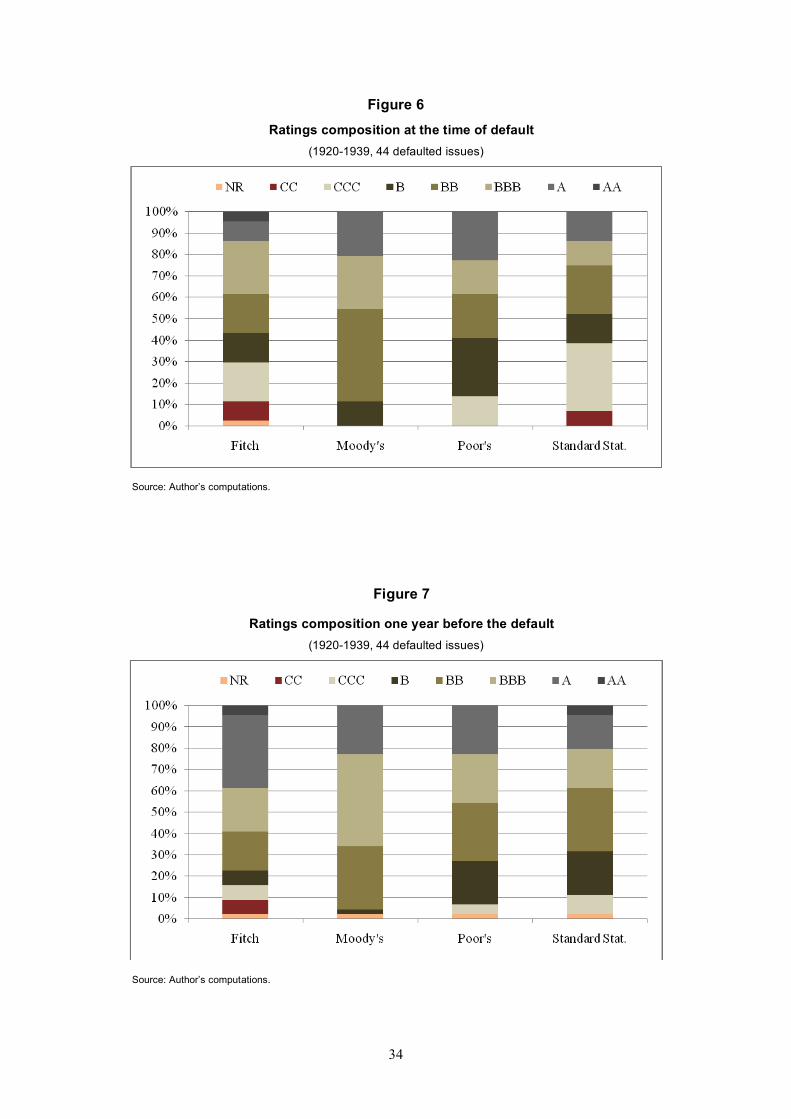
34
Figure 6 Ratings composition at the time of default
(1920-1939, 44 defaulted issues)
Source: Author’s computations.
Figure 7
Ratings composition one year before the default (1920-1939, 44 defaulted issues)
Source: Author’s computations.

35
Figure 8 Cumulative Accuracy Profiles: 3 Cases

36
Figure 9 Cumulative Accuracy Profiles: Bankers vs. Agencies
Source: Authors computations (see text). Underwriters’ accuracy profile is computed on the basis of the number of loans brought to market and defaulted upon. Underwriters’ market shares derived by authors from Moody’s handbooks.

37
Table 1. Products offered by the Agencies
Fitch Moody’s Poor’s Standard Statistics
Name of the Main Publication Compiling Ratings
Fitch Stock and Bond Manual
Moody’s Manuals of Investments
Poor's Volumes Standard [Statistics] Bond Books
Frequency of the Main Publication
Annual Annual Annual Monthly
Thickness of Annual Publications if Applicable
1930: 2,500 pages (a)
1930: 10,000 pages (b)
1930: 6,000 pages (c)
Not applicable
Price $35 (d) $100 (e) Unknown Not applicable
Publications with Other Frequencies
Daily, Semi- Weekly, Weekly, Monthly, Quarterly (f)
Daily, Weekly, Monthly
Four times a week, Weekly, Quarterly
Daily, Weekly, Monthly
Other Publications Starting
Daily, Semi- Weekly, Weekly, Monthly: 1928 (g) Quarterly: 1935 (h)
Weekly, Monthly: 1910 (i) Daily: 1932 (j)
Weekly: 1932 Four times a week: 1934 (k) Quarterly: 1934 (k)
Daily, Weekly, Monthly: 1922 (l)
Specific Publication Dedicated to Qualitative Analysis
Not until 1928 (m)
Yes (n) Not until 1932 (o)
Yes (p)
Name and Frequency of the Specific Publication Dedicated to Qualitative Analysis
“Fitch Revisions”, Semi-Weekly (q)
“Moody’s Investment Letters”, Weekly
“Poor’s Analytical Services – Bonds & Stocks”, Weekly
“Standard Daily Trade Service”, Daily
Price of the Specific Publication Dedicated to Qualitative Analysis
$150 (annual subscription) (r)
$150 (annual subscription) (r)
$120 (annual subscription) (s)
$180 (annual subscription) (t)
Academic Advisers Members of the Board
No No (u) No Yes (Profs. Scott, Davenport and Parry) (v)
Offices/Representatives Outside the United States (interwar)
Not until 1933 (w) Yes (x) Unknown Yes (y)
Locations of Foreign Offices/Representatives if Applicable
Montreal and London (z)
London (x) N.A. London, Berlin, Paris, Geneva, Stockholm, Brussels, Panama Canal Zone, La Paz, Buenos Aires, Santiago, Warsaw (y)
Listed Company No Yes, from 1928 No No
(a) “Fitch Stock and Bond Manual 1930”. (b) Aggregation of “Moody’s Railroad Manual 1930”, “Moody’s Industrial Manual 1930”, “Moody’s Public Utility Manual 1930”, and “Moody’s Government and Municipal Manual 1930”. (c) Estimation based on the consultation of various Poor’s Volumes in 1929, 1930 and 1931. (d) “Fitch Stock and Bond Manual 1930” price. (e) Total sum of “Moody’s Railroad Manual 1930”, “Moody’s Industrial Manual 1930”, “Moody’s Public Utility Manual 1930”, and “Moody’s Government and Municipal Manual 1930” prices.

38
(f) Fitch Bond Books’ introductions indicate “Daily, Semi-Weekly, Weekly, Monthly, Quarterly” publications although we could not find these sources. (g) First indication found in “Fitch Bond Book 1928”. (h) First indication found in “Fitch Bond Book 1935”. (i) Babson (1910). (j) Based on the description of Moody’s Manuals released in 1932. (k) First indication in “Poor’s Industry Service – News, Facts, Forecasts” (1934). (l) First indication found in “Standard Daily Trade Service”, February 1922. (m) Based on the description of “Fitch Revisions” services found in “Fitch Bond Book 1928”. (n) Based on the consultation of “Moody’s Manuals” and “Moody’s Investment Letters” released from 1918. (o) Based on the consultation of “Poor’s Volumes” published from 1922 and “Poor’s Analytical Services – Bonds & Stocks” released from 1932. (p) Based on the consultation of “Standard Daily Trade Service” released from 1922. (q) Based on the description of “Fitch Revisions” services found in “Fitch Bond Book 1929”. (r) Subscription prices in 1929. (s) Subscription prices in 1923 (Wall Street Journal, July 6, 1923). (t) Subscription prices in 1931. (u) “Moody’s Manuals” and “Investment Letters” published between 1922 and 1927 mention Max Winkler, PhD, but he is an employee of the agency. (v) See “Standard Daily Trade Service” publications released in 1922. (w) Found in “Fitch Bond Book 1933”. (x) Based on the consultation of “Moody’s Manuals” and “Moody’s Investment Letters” released from 1918. (y) Based on the consultation of “Standard Daily Trade Service” released from 1922. (z) Found in “Fitch Bond Book 1933” and “Fitch Bond Book 1938”.

39
Table 2
Ratings: Data Source
Fitch Moody’s Poor’s Standard Statistics
Business Starting 1913 1900 1868 1922
Ratings begin 1924 1909 1916 1922
Sovereign Ratings Begin 1924 1918 1922 1924
Name of Source Fitch Bond Book
Moody’s Manual of Investments – American and Foreign Government Securities
Poor's bank, government and municipal volume
Standard [Statistics] Bond Book
Frequency of Our Source Annual Annual Annual Monthly
Month of publication August January March December(a)
Separate Sovereign Volume (interwar) No Yes Varies No
Periods available (interwar) 1924-1939 1918-1939 1922-1939 1924-1939
Periods we used 1927-1936 1927-1936 1927-1936 1927-1936
Source: Authors.
(a) The choice of December from Standard Statistics monthly sources to compile annual data was arbitrary.

40
Table 3
Correspondence across ratings
Fitch Moody’s Poor’s Standard “Majority interpretation”
AAA Aaa A** A1+ Highest
AA Aa A* A1 High
A A A A Sound
BBB Baa B** B1+ Good
BB Ba B* B1 Fair
B B B B Somewhat speculative
CCC Caa C** C1+ Speculative
CC Ca C* C1 Highly speculative
C C C C Extremely speculative
DDD -- D** D1+ Low or weak
DD -- D* D1 Small or very weak
D -- D D Practically valueless
Source: Harold 1938, p 75.

41
Table 4
1-year default rates (1928-1937)
1928 1929 1930 1931 1932 1933 1934 1935 1936 1937 Average
1928-371
Fitch AAA 0 0 0 0 0 0 0 0 0 0 0 AA 0 0 0 11 0 0 0 0 0 0 2 A 0 0 0 24 0 13 0 0 0 0 5 BBB 0 0 0 27 10 0 0 0 0 0 4 BB 0 0 0 0 56 0 13 0 25 0 9 B 33 0 0 0 25 10 CCC 80 33 0 50 56 IG 0 0 0 16 4 3 0 0 0 0 3 SG 0 0 0 0 56 23 10 0 25 13 16 Moody’s AAA 0 0 0 0 0 0 0 0 AA 0 0 0 0 0 0 0 0 0 0 0 A 0 0 0 28 5 0 0 0 0 0 4 BBB 0 0 0 35 36 20 6 0 10 0 10 BB 0 0 0 17 60 45 20 0 0 17 19 B 0 0 50 0 17 CCC IG 0 0 0 16 7 8 4 0 4 0 4 SG 0 0 0 17 60 45 17 0 13 14 18 Poor’s AAA 0 0 0 0 0 0 0 0 0 0 0 AA 0 0 0 0 0 0 0 0 0 A 0 0 0 18 4 8 0 0 0 0 4 BBB 0 0 0 30 4 0 0 0 5 0 5 BB 0 0 0 8 38 7 17 0 25 0 10 B 0 0 0 0 50 78 33 0 0 0 27 CCC 0 0 50 100 33 IG 0 0 0 17 3 4 0 0 2 0 3 SG 0 0 0 7 40 35 19 0 20 7 15 Standard AAA 0 0 0 0 0 0 0 0 0 0 0 AA 0 0 0 0 0 0 0 0 0 0 0 A 0 0 0 16 0 0 0 0 0 0 3 BBB 0 0 0 13 5 15 0 0 0 0 4 BB 0 0 0 38 5 0 33 0 10 11 7 B 0 0 0 29 30 0 0 0 33 0 13 CCC 50 100 73 33 0 50 0 59 IG 0 0 0 9 2 5 0 0 0 0 2 SG 0 0 0 38 22 23 23 0 20 8 16 1 Weighted by the number of issues. Source:Author’s calculations Note: For Tables 4-6, rating-based cohorts for each year are formed on the basis on the last observed rating the previous year. The reported rates for Tables 4-6 are the percentage of securities in each cohort that defaulted over that year (Table 4), that year and the next two years (Table 5), and that year and the next four years (Table 6).

42
Table 5
3-year default rates (1928-1937)
1928 1929 1930 1931 1932 1933 1934 1935 1936 1937 Average
1928-371
Fitch AAA 0 0 0 0 0 0 0 0 0 0 0 AA 0 0 6 16 6 0 0 0 0 0 5 A 0 17 28 45 25 13 0 0 0 0 18 BBB 0 26 64 60 30 0 0 0 0 0 18 BB 0 0 29 100 67 7 27 11 25 0 20 B 33 0 0 50 50 19 CCC 90 67 67 100 83 IG 0 13 22 31 19 3 0 0 0 0 13 SG 0 0 29 100 67 30 21 18 42 25 28 Moody’s AAA 0 0 0 0 0 0 0 0 AA 0 0 0 0 8 0 0 0 0 0 1 A 0 25 28 45 32 0 0 0 0 0 17 BBB 0 33 75 82 73 28 9 4 10 0 28 BB 0 0 40 50 60 55 40 25 33 33 37 B 100 50 50 0 50 CCC IG 0 13 22 30 22 11 5 2 4 0 13 SG 0 0 40 50 60 55 50 30 38 29 38 Poor’s AAA 0 0 0 0 0 0 0 0 0 0 0 AA 0 0 0 0 0 0 0 0 0 A 0 15 18 24 21 8 0 0 0 0 11 BBB 0 24 40 52 19 0 0 0 5 0 17 BB 0 0 45 69 69 29 25 7 25 0 31 B 0 0 0 0 50 78 67 20 25 20 39 CCC 100 100 100 100 100 IG 0 14 20 26 15 4 0 0 2 0 11 SG 0 0 42 60 67 48 38 19 40 14 36 Standard AAA 0 0 0 0 0 0 0 0 0 0 0 AA 0 4 4 9 10 0 0 0 0 0 3 A 0 27 33 25 0 0 0 0 0 0 10 BBB 0 25 10 40 30 15 0 0 25 33 16 BB 0 18 64 50 11 5 50 13 20 11 22 B 0 0 71 86 80 33 25 33 33 0 51 CCC 83 100 82 67 100 50 0 78 IG 0 12 11 20 14 5 0 0 2 3 8 SG 0 14 67 71 41 31 46 27 27 8 37 1 Weighted by the number of issues. Source: Authors’ calculations.

43
Table 6 5-year default rates (1928-1937)
1928 1929 1930 1931 1932 1933 1934 1935 1936 1937 Average
1928-371
Fitch AAA 0 0 0 4 0 0 0 0 0 0 1 AA 0 0 11 16 6 0 0 0 0 0 6 A 14 23 40 47 25 13 0 0 0 0 23 BBB 29 58 82 60 37 0 0 0 19 57 32 BB 67 50 43 100 78 15 27 11 25 0 28 B 33 0 0 50 75 24 CCC 100 100 100 100 100 IG 12 23 31 33 22 3 0 0 7 11 19 SG 67 50 43 100 78 38 24 23 42 38 37 Moody’s AAA 0 0 0 0 0 0 0 0 AA 0 0 4 4 8 0 0 0 0 0 2 A 13 42 52 48 32 0 0 0 5 7 25 BBB 88 83 81 82 91 32 9 4 20 22 41 BB 0 0 40 50 80 73 60 38 33 33 46 B 100 50 50 0 50 CCC IG 15 25 32 32 25 13 5 2 10 14 20 SG 0 0 40 50 80 73 67 40 38 29 46 Poor’s AAA 0 0 0 0 0 0 0 0 0 0 0 AA 0 0 0 0 0 0 0 0 0 A 10 15 24 26 21 8 0 0 0 0 13 BBB 13 52 64 57 19 0 0 0 20 17 27 BB 71 50 55 69 85 36 25 7 25 38 46 B 0 0 0 0 100 100 100 40 25 20 55 CCC 100 100 100 100 100 IG 8 22 30 28 15 4 0 0 9 6 15 SG 63 44 50 60 87 61 44 24 40 36 50 Standard AAA 0 0 0 0 0 0 0 0 0 0 0 AA 5 4 8 9 10 0 0 0 0 0 5 A 13 47 61 25 0 0 0 0 0 0 16 BBB 13 33 30 53 30 15 0 0 25 100 23 BB 63 55 64 50 21 10 50 13 50 44 38 B 50 67 86 86 90 67 25 50 33 0 66 CCC 83 100 91 100 100 50 0 85 IG 7 17 21 23 14 5 0 0 2 9 12 SG 60 57 71 71 50 40 54 33 47 33 52 1 Weighted by the number of issues. Source: Authors’ calculations.

44
Table 7
The accuracy ratios for agency ratings and average rating Fitch Moody’s Poor’s Standard Average rating
1-year horizon
1931 0.30 0.49 0.27 0.46 0.45
1932 0.74 0.77 0.58 0.69 0.72
1933 0.70 0.63 0.58 0.63 0.64
1934 0.52 0.51 0.75 0.76 0.83
1936 0.85 0.61 0.71 0.85 0.72
Mean (1931-36) 0.62 0.60 0.58 0.68 0.67
Median (1931-36) 0.70 0.61 0.58 0.69 0.72
3-year horizon
1929 0.40 0.54 0.31 0.41 0.51
1932 0.40 0.54 0.38 0.43 0.47
1935 0.70 0.70 0.80 0.84 0.85
Mean (1929-36) 0.53 0.60 0.54 0.59 0.63
Median (1929-36) 0.46 0.61 0.49 0.58 0.60
5-year horizon
1929 0.49 0.57 0.48 0.51 0.57
1934 0.58 0.66 0.71 0.72 0.77
Mean (1928-36) 0.52 0.59 0.55 0.60 0.61
Median (1928-36) 0.55 0.57 0.54 0.61 0.58
Source: Author’s calculations. Note: The rating category for each year’s securities is determined as in Tables 4-6.

45
Table 8
Difference between the accuracy ratios for agency ratings and for yield-implied ratings
Fitch Moody’s Poor’s Standard Average rating
1-year horizon
1931 -0.18 -0.08 -0.37 -0.20 -0.18
1932 0.17 0.20 -0.07 0.00 0.05
1933 -0.05 -0.17 -0.18 -0.16 -0.13
1934 0.00 0.01 0.13 0.19 0.28
1936 -0.04 -0.12 -0.17 -0.02 -0.17
Mean (1931-36) -0.02 -0.03 -0.13 -0.04 -0.03
Median (1931-36) 0.13 0.03 -0.06 0.00 0.05
3-year horizon
1929 0.09 0.29 0.03 0.18 0.20
1932 -0.17 -0.04 -0.23 -0.16 -0.13
1935 -0.24 -0.12 -0.03 -0.03 -0.09
Mean (1929-36) -0.09 0.03 -0.08 -0.02 -0.01
Median (1929-36) -0.15 0.03 -0.14 -0.05 -0.01
5-year horizon
1929 0.05 0.19 0.08 0.11 0.12
1934 -0.08 0.06 0.05 0.02 0.12
Mean (1928-36) -0.08 0.02 -0.05 0.00 0.00
Median (1928-36) -0.02 0.01 -0.05 0.02 -0.01
Source: Author’s calculations. Note: The rating category for each year’s securities is determined as in Tables 4-6. The market yields upon which the yield implied ratings were calculated is taken to be the yield of the security at the beginning of the year.

46
Appendix: 1) Example of Moody’s Ratings (Dominican Republic, 1927, p. 444 of the Manual):
2) Formula for the Accuracy Ratio (AR).
This formula is computed using the difference between the cumulative distribution of
realizations and the cumulative distribution of ratings or:
agencygivenaofratingsRRR
ND
lessandRratedissuersofnumbertotalN
lessandRrateddefaultsofnumbertotalD
issuersofnumbertotalN
defaultsofnumbertotalD
where
DN
NNDDAR
i
iR
iR
RRR
RiRRiR
i
i
i
ii
!=
=
=
=
=
=
!!+
= "=
!!
max1
00
,...,
,...,
0,
)5.02
))(((2
max1
11
3) Formula for the Yield Implied Ratings
The goal is to compute the vector of brackets that minimize loss function P(b). In the following
formula the (x)+ operator takes value zero when result within brackets is negative.

47
P(b) = wj s j!bi( j )+( )
+
+ wj bi( j )! ! s j( )
+"#
$%j&
Where:
i(j) = agency rating index of issue j.
sj = spread of issue j over US bonds (for simplicity, since our computations are annual, and one
average US yield is considered, we have performed computations over yields rather than spreads,
without loss of generality).
bi( j )+= upper threshold for rating j by agency i.
bi( j )!= lower threshold for rating j by agency i.
wj= rate chosen i j to level off the contribution of each rating bucket

48
4) Table 4. Background data.
Name of the bond Maturity Date of default
Moody’s rating at the time of default (last observed date
of the rating)
Poor’s rating at the time of default
(last observed date of the rating)
Fitch rating at the time of default
(last observed date of the rating)
Standard Statistics rating at the time of
default (last observed date of the
rating) Bolivia 7s 1927 1958 01/01/1931 Baa (January 1930) B** (March 1930) BBB (August 1930) C1+ (Dec. 1930) Dominican Rep. 5,5s 1922 1942 01/01/1931 A (January 1930) A (March 1930) AA (August 1930) B1+ (Dec. 1930) Dominican Rep. 5,5s 1926 1940 01/01/1931 A (January 1930) A (March 1930) AA (August 1930) B1 (Dec. 1930) Bolivia Ext 7s 1928 1969 01/03/1931 Ba (January 1931) B** (March 1930) BBB (August 1930) C1+ (Dec. 1930) Bolivia Dollar 6s 1917 1940 01/04/1931 Ba (January 1931) B** (March 1931) BBB (August 1930) B (Dec. 1930) Peru Ext 6s 1928 1961 01/04/1931 Ba (January 1931) B** (March 1931) A (August 1930) B1 (Dec. 1930) Bolivia Ext 8s 1922 1947 01/05/1931 Ba (January 1931) C** (March 1931) BBB (August 1930) B (Dec. 1930) Peru Ext 6s 1927 1960 01/06/1931 Ba (January 1931) B* (March 1931) A (August 1930) B1 (Dec. 1930) Chile Ext 6s of 1927 1961 01/08/1931 A (January 1931) A (March 1931) BBB (August 1931) A (Dec. 1930) Chile Ext 6s of 1928 1961 01/09/1931 A (January 1931) A (March 1931) BBB (August 1931) A (Dec. 1930) Chile Ext 6s of 1929 1962 01/09/1931 A (January 1931) A (March 1931) BBB (August 1931) A (Dec. 1930) Peru Ext 7s 1927 1959 01/09/1931 Baa (January 1931) B* (March 1931) B (August 1931) B1+ (Dec. 1930) Chile Ext 6s 1926 1960 01/10/1931 A (January 1931) A (March 1931) BBB (August 1931) A (Dec. 1930) Chile Ext 7s 1922 1942 01/11/1931 A (January 1931) A (March 1931) BBB (August 1931) A (Dec. 1930) Chile Ext 6s 1930 1963 01/11/1931 A (January 1931) A (March 1931) NR (August 1931) A (Dec. 1930) Brazil Ext gold 8s 1921 1941 01/12/1931 Baa (January 1931) B* (March 1931) BB (August 1931) C1+ (Dec. 1930) Brazil Central Ry 7s 1922 1952 01/12/1931 Ba (January 1931) B (March 1931) BB (August 1931) C1+ (Dec. 1930) Chile Ext Ry 6s 1928 1961 01/01/1932 A (January 1931) A (March 1931) BBB (August 1931) C1+ (Dec. 1931) Brazil Ext 6,5s 1926 1957 01/04/1932 B (January 1932) B (March 1932) BB (August 1931) C1+ (Dec. 1931) Brazil Ext 6,5s 1927 1957 15/04/1932 B (January 1932) C** (March 1932) BB (August 1931) C1+ (Dec. 1931) Greece 7s 1924 1964 01/05/1932 Baa (January 1932) B* (March 1932) BBB (August 1931) B1+ (Dec. 1931) Salvador 7s 1924 1957 01/07/1932 Ba (January 1932) C** (March 1932) A (August 1931) B (Dec. 1931) Greece 6s 1928 1968 01/08/1932 Baa (January 1932) B (March 1932) CC (August 1932) B1 (Dec. 1931) Yugoslavia 8s 1922 1962 01/11/1932 Ba (January 1932) B* (March 1932) B (August 1932) B (Dec. 1931) Bulgaria Stab 7,5s 1928 1968 15/11/1932 Ba (January 1932) B* (March 1932) CCC (August 1932) B (Dec. 1931) Salvador Cust 1st 8s 1923 1948 01/01/1933 Baa (January 1932) B (March 1932) CCC (August 1932) C1 (Dec. 1932) Panama Ext 5s 1928 1963 15/05/1933 Ba (January 1933) B** (March 1933) A (August 1932) B1+ (Dec. 1932) Bulgaria 7s 1927 1967 01/07/1933 B (January 1933) B (March 1933) CCC (August 1932) C1 (Dec. 1932) Colombia Ext 6s 1927 1961 01/07/1933 Ba (January 1933) B (March 1933) CC (August 1932) C1+ (Dec. 1932) Uruguay 8s 1921 1946 01/08/1933 Ba (January 1933) B (March 1933) CCC (August 1933) C1+ (Dec. 1932) Costa Rica P Ry 7,5s 1927 1949 01/09/1933 B (January 1933) C** (March 1933) CCC (August 1933) C1 (Dec. 1932) Colombia Ext 6s 1928 1961 01/10/1933 Ba (January 1933) B (March 1933) CC (August 1933) C1+ (Dec. 1932) Uruguay Ext 6s 1926 1960 01/11/1933 Ba (January 1933) B (March 1933) CCC (August 1933) C1+ (Dec. 1932) Uruguay SF 6s 1930 1964 01/11/1933 Ba (January 1933) B (March 1933) CCC (August 1933) C1+ (Dec. 1932) Cuba PW 5,5s 1930 1945 31/12/1933 Ba (January 1933) A (March 1933) B (August 1933) B (Dec. 1933) Hungary 7,5s 1924 1944 01/02/1934 Ba (January 1934) B (March 1933) CCC (August 1933) C1+ (Dec. 1933) Germany 7s 1924 1949 15/10/1934 Baa (January 1934) B* (March 1934) BB (August 1934) B1 (Dec. 1933) Germany 5,5s 1930 1965 01/12/1934 Baa (January 1934) B* (March 1934) B (August 1934) B1 (Dec. 1933) Poland Ext 8s 1925 1950 01/06/1936 Baa (January 1936) B** (March 1936) BB (August 1935) B1 (Dec. 1935) Poland Ext 6s 1920 1940 01/10/1936 Baa (January 1936) B* (March 1936) BB (August 1936) B1 (Dec. 1935) Poland Ext Stab 7s 1927 1947 01/10/1936 Baa (January 1936) B** (March 1936) BB (August 1936) B1 (Dec. 1935) Costa Rica Ext 7s 1926 1951 01/11/1936 B (January 1936) C** (March 1936) CC (August 1936) C1+ (Dec. 1935) Brazil Fund 5s 1931 1951 01/11/1937 Ba (January 1937) C** (March 1937) B (August 1937) B1 (Dec. 1936) Austria 7s Inter 1930 1957 31/05/1938 Ba (January 1938) B (March 1938) B (August 1937) B1+ (Dec. 1937) Notes: 44 bonds in our sample defaulted in the 1930s. The average numbers of months elapsed between the dates of collection of the ratings and the dates of default are very near: 4.9 for Fitch, 5.4 for Poor’s, 6.2 for Standard Statistics, and 6.8 for Moody’s (authors’ computations).
Related Documents