Welcome message from author
This document is posted to help you gain knowledge. Please leave a comment to let me know what you think about it! Share it to your friends and learn new things together.
Transcript


The inability to read and write well may not be a direct cause of criminal behavior,
but low literacy and crime are related. Daily life is harder for people with low literacy, so
they are more likely to feel frustrated and dissatisfied. People with low literacy skills
usually have equally inadequate problem-solving skills. People who have low literacy
skills tend to be less active citizens than other people. They are less likely to get
involved in community activities like sports, school groups, church groups, and so on. As
a result, they often feel isolated and vulnerable, and many of them feel like outcasts.
This may partly explain why people who have low literacy are statistically more likely to
be involved in crime – either as the offender or the victim. It may also help to explain
why low literacy costs American businesses and taxpayers more than $225 billion
annually. (Target Crime with Literacy, policeabc.ca)
The average incarcerated adult in the U.S. scores so low in the ability to
understand and work with numbers — numeracy skills, in research parlance — that they
lag behind the unemployed, according to a report released November 15, 2016 by the
National Center for Education Statistics. The report looked at the educational
background and work history of prison inmates. It found that greater percentages of
incarcerated adults scored at the lowest levels of proficiency in literacy and numeracy
skills when compared to the overall U.S. population. The report also found that while
roughly two-thirds of prisoners said they had a paid job in the year before they entered
prison, about a quarter reported that their income came from “illegal sources.”
2016 NCEC Annual Report Card Page i

There long has been debate about the role prison-based education programs can
play in preparing inmates to return to society and keeping them from returning to prison.
According to a 2014 RAND Corporation, a nonprofit research organization, report,
prison inmates who receive general education and vocational training are significantly
less likely to return to prison after release and are more likely to find employment than
peers who do not receive such opportunities. The findings, from the largest-ever meta-
analysis of correctional educational studies, suggest that prison education programs are
cost effective, with a $1 investment in prison education reducing incarceration costs by
$4 to $5 during the first three years post-release.
“We found strong evidence that correctional education plays a role in reducing
recidivism,” said Lois Davis, the project's lead researcher and a senior policy researcher
at RAND. “Our findings are clear that providing inmates education programs and
vocational training helps keep them from returning to prison and improves their future
job prospects.”
Researchers found that inmates who participate in correctional education
programs have 43 percent lower odds of returning to prison than those who do not. The
estimate is based on studies that carefully account for motivation and other differences
between correctional education recipients and non-recipients. Employment after release
was 13 percent higher among prisoners who participated in either academic or
vocational education programs than those who did not. Those who participated in
vocational training were 28 percent more likely to be employed after release from prison
than who did not receive such training. The findings also suggest that prison education
programs are cost effective. The direct costs of providing education are estimated to be
from $1,400 to $1,744 per inmate, with re-incarceration costs being $8,700 to $9,700
less for each inmate who received correctional education as compared to those who did
not.
Recidivism remains high nationally, with four in 10 inmates returning to prison
within three years of release. “Our findings suggest that we no longer need to debate
whether correctional education works,” Davis said. “As corrections officials struggle to
cope during a period of constrained government spending prison education is an
approach that may help save money in even the short term,” Davis said. -Excerpt from
2014 RAND Corporation Report: How Effective Is Correctional Education, and Where
Do We Go from Here? ISBN:97-0-8330-8493-4
2016 NCEC Annual Report Card Page ii

The State of Nevada Correctional Education Consortium (NCEC) was
established in 2012, consisting of four local school districts and the State of Nevada
Departments of Corrections (NDOC) and Education (NDE). During 2014, it expanded;
its current membership includes: Carson City School District, Clark County School
District, NDOC, NDE, Elko County School District, Humboldt County School District,
Lincoln County School District, Nye County School District, Pershing County School
District, and White Pine County School District.
The NCEC mission is to prepare NDOC inmates for successful community
reintegration by engaging school districts and state departments in best practice models,
thereby promoting secondary education excellence and innovation. Benefits of the
consortium include:
Improving the capacity and expertise of Nevada’s correctional educators
by providing professional development programs for all staff
Encouraging the sharing of resources among partners
Creating opportunities for grant writing
Increasing effectiveness of advocacy for policy change
The NCEC 2016 annual report card is vitally important in providing statistical data
and information on the consortium’s delivery of correctional education. The report card
is based on evidence instead of anecdote. The NCEC annual report will allow NDOC to
document the efficacy of the consortium and based on the data collected, it will be a test
of Nevada’s larger re-entry program. Changes resulting from this annual report are
aimed at improving public safety and reducing recidivism rates among NDOC ex-
offenders.
2016 NCEC Annual Report Card Page iii

FOREWORD ________________________________________________________________ i-ii
PREFACE ___________________________________________________________________ iii
EXECUTIVE SUMMARY _______________________________________________ 1-3
INTRODUCTION _____________________________________________________ 4-5
DATA COMPILATION _______________________________________________ 6-12
FINDINGS ___________________________________________________________ 13
ACTION PLAN ____________________________________________________ 14-16
FLOWCHART ________________________________________________________ 17
CONCLUSION ____________________________________________________ 18-20

Prison literacy and education programs give inmates a second chance at an
honest, healthy, and productive life. These programs give inmates the skills they need
to get steady jobs when they are released, which reduces their chances of re-offending.
With literacy and other training, ex-offenders return to their communities with a more
positive self-image. They feel proud of what they have achieved, and their new skills
and self-esteem help them avoid one of the main causes of criminal activity–
unemployment.
Recognizing the workforce and public safety benefits of educating inmates and
linking them with employment, NCEC has made it a top priority to optimize limited
resources, by working smarter and more efficiently. There are more than 13,000
inmates in the Department of Corrections. Data show that upon entry:
The majority were unemployed at the time of arrest and without a work history.
49.7% lack a high school diploma (self-declared on inmate’s Presentence
Investigation Report, actual percentage maybe higher).
All NDOC facilities offer educational services to inmates, including seven
Prisons/Correctional Centers: Ely State Prison, Florence McClure Women’s
Correctional Center, High Desert State Prison, Lovelock Correctional Center, Northern
Nevada Correctional Center, Southern Desert Correctional Center and Warm Springs
Correctional Center; in addition to ten Conservation Camps and two Transitional
Centers: Carlin Conservation Camp, Ely Conservation Camp, Humboldt Conservation
Camp, Jean Conservation Camp, Pioche Conservation Camp, Stewart Conservation,
Three Lakes Valley Conservation Camp, Three Lakes Valley Boot Camp, Tonopah
Conservation Camp and Wells Conservation Camp and Casa Grande Transitional
Center and Northern Nevada Transitional Housing.
2016 NCEC Annual Report Card Page 1

The majority of vocational programs are offered at the seven
Prisons/Correctional Centers. Vocational programs include: Advanced Computers, Air
Conditioning and Heating, Auto Mechanics, Braille, Business, Certified Screen Printer,
Collision Repair, Computers, Construction, Cosmetology, Culinary Arts,
Entrepreneurship, Horticulture, ServSafe, Small Engine Repair, and Welding. All
educational and above mentioned vocational programs are offered by the specific
School District established in each of NDOC’s facility jurisdictions. Districts include:
Carson City School District, Clark County School District, Elko County School District,
Humboldt County School District, Lincoln County School District, Nye County School
District, Pershing County School District, and White Pine County School District.
The NCEC Report Card findings are drawn from non-experimental direct analysis
and incorporate both quantitative and qualitative data collecting, organizing and
analyzing. The Reporting time frame for NCEC’s 2016 Report Card is July 1, 2015-
June 30, 2016.
Quantitative data compilation concluded:
6,771 inmates eligible for secondary education services. Additional 6,862
inmates eligible for vocational certification. (Source: 2016 NDOC WEB
Reports-Secondary Services Priority Report)
7,919 NDOC inmates enrolled in NDE educational/vocational programs
throughout the State of Nevada. (Source-NDE Adult High School
Programs (AHSP) 2015-16 Report)
275 High School Equivalency (HSE) Certificates awarded. (Source-NDE
AHSP 2015-16 Report)
287 High School Diplomas (HSDs) awarded. (Source-NDE AHSP 2015-
16 Report)
1,196 Vocational Certificates awarded. (Source-NDE AHSP 2015-16
Report)
4,017.54 total credits earned and waived. (Source-NDE AHSP 2015-16
Report)
Qualitative data compilation concluded:
NDOC inmates who complete education programs are more successful
after release than those who do not complete programs.
Education completion increases success even among offender groups that
normally have higher recidivism rates.
2016 NCEC Annual Report Card Page 2

2016 NCEC Annual Report Card Page 3
On-going challenges facing NCEC include creating systems to link different
data streams together and universal access to data among members, state
agencies/departments, local, county, city governments and community based
organizations; thereby improving and increasing ex-offenders’ access to the re-entry
education continuum upon release.

Without credentials, attaining family-sustaining employment on the outside can be a major hurdle. The effects of this challenge are rarely confined to the former inmate, but are instead felt throughout a community via increased rates of unemployment, poverty, and, ultimately, crime.-
According to the U.S. Bureau of Justice Statistics (BJS), the United States has
the largest prison population in the world, and the second-highest per-capita
incarceration rate. In October 2013, the incarceration rate of the United States of
America was the highest in the world, at 716 per 100,000 of the national population.
While the United States represents about 4.4 percent of the world's population, it houses
around 22 percent of the world's prisoners. Additionally, 4,751,400 adults in 2013 (1 in
51) were on probation or on parole. In total, 6,899,000 adults were under correctional
supervision (probation, parole, jail, or prison) in 2013. Corrections (which includes
prisons, jails, probation, and parole) cost the United States close to $74 billion in 2007.
The following summary represents the Bureau of Justice Statistics, National Prisoner
Statistics, from 2013 to 2014.
The number of prisoners held by state and federal correctional authorities on
December 31, 2014 (1,561,500) decreased by 15,400 (down 1%) from year-
end 2013.
The federal prison population decreased by 5,300 inmates (down 2.5%) from
2013 to 2014, the second consecutive year of decline.
On December 31, 2014, state and federal correctional authorities held
1,508,600 individuals sentenced to more than 1 year in prison, 11,800 fewer
inmates than at year-end 2013.
The number of women in prison who were sentenced to more than 1 year
increased by 1,900 offenders (up 2%) in 2014 from 104,300 in 2013 to 106,200
in 2014.
In 2014, 6% of all black males ages 30 to 39 were in prison, compared to 2% of
Hispanic and 1% of white males in the same age group.
2016 NCEC Annual Report Card Page 4

Violent offenders made up 54% of the state male prison population at year-end 2013,
the most recent year for which data were available.
The Board of Prisons (BOP) housed 40,000 prisoners in private secure and non-
secure facilities at year-end 2014, which represents 19% of the total federal prison
population.
Half of males (50%) and more than half of females (59%) in federal prison were
serving time for drug offenses on September 30, 2014.
Overall, the U.S. prison population decreased by 1% in 2014. However, the State of
Nevada actually saw a 1% increase in its adult prison population from 2012 (12,564) to
2016 (13,633) with an increase of 1.3% female inmates (2012-975 to 2016-1224) and an
increase of 1% male inmates (2012-11,551 to 2016-12,409). More than half of all inmates
in the United States serve maximum sentences of less than eight years, and many are
released well before their sentences are completed. Over 93% of NDOC inmates will be
released. Not surprisingly, newly released inmates are far more likely than other job
applicants to be high school dropouts — and a high school diploma may not be enough. A
study from Georgetown University’s Center on Education and the Workforce predicts that
half of all jobs created this decade will require some postsecondary education.
A University of Missouri study of state prisoners showed that reincarceration rates
“were nearly cut in half for former inmates with a full-time job compared to similar inmates
who are unemployed” (Cronin, 2011). The same study showed that every inmate who
leaves the system saves that state an average of $25,000 per year. By cutting the
reincarceration rate in half, $2.7 billion per year could be saved. An inmate’s ability to
make it on the outside depends on whether he (or she) is returning to a stable family,
whether or not there are any mental health or substance abuse issues, and is based upon
the individual’s education and employability skills.
The following research, together with national best practice models, directs NDOC’s
correctional education policy and practice. The following report presents timely, accurate
and reliable data to guide policy and practice in the delivery of secondary correctional
education throughout the State of Nevada. The consortium’s 2016 educational outcomes,
comparisons to 2012, 2013, 2014, 2015 data, overview of NCEC’s 2016 goals and
estimates of potential cost savings to the state of Nevada are examined in the following
2016 NCEC report card. The NCEC decision-making process relies on measuring
progress based on actual data from school districts and NDOC’s Nevada Offender
Tracking Information System (NOTIS).
2016 NCEC Annual Report Card Page 5

12000
12200
12400
12600
12800
13000
13200
13400
13600
13800
2012 2013 2014 2015 2016
Population 12564 12636 12743 12956 13633
NDOC CORRECTIONAL POPULATION
Annually, approximately, 5,660 NDOC offenders are released and 5,965 are
confined-over 93% of NDOC inmates are released. (Source: NOTIS WEB Reports;
Admissions and Releases, December, 2012/2016.) For purposes of this report,
NDOC’s 2016 inmate population was estimated at 13,633 an increase of one percent
compared to same time in 2015 when the population was estimated at 12,956.
(Source: NOTIS WEB Reports; Daily Count, Month Average, June 30, 2015/2016.)
The following charts provide an overview of NDOC’s statistics, NCEC’s 2016 outcomes
and compares data from 2012, 2013, 2014 and 2015.
2012-2016 NDOC TOTAL POPULATION
COMPARISON
2016 NCEC Annual Report Card Page 6

4800
5000
5200
5400
5600
5800
6000
6200
6400
2012 2013 2014 2015 Averages
Admissions 5606 5843 6144 6276 5967.25
Releases 5383 5894 5623 5746 5661.5
NDOC ADMISSIONS AND RELEASES
0
2000
4000
6000
8000
10000
12000
14000
2012 2013 2014 2015 2016
Male 12535 12808 11691 12087 12492
Female 1017 1066 1073 1157 1243
NDOC CORRECTIONAL POPULATION MALE/FEMALE COMPARISON
MONTH AVERAGE (NOVEMBER)
2012-2016 NDOC TOTAL POPULATION
FEMALE/MALE COMPARISON
2012-2015 NDOC ADMISSIONS AND RELEASES
COMPARISON
2016 NCEC Annual Report Card Page 7

0
1000
2000
3000
4000
5000
6000
7000
8000
2012 2013 2014 2015 2016
Enrollments 3857 4501 5557 5346 7919
CORRECTIONAL EDUCATION ENROLLMENTS
0
500
1000
1500
2000
2500
3000
3500
4000
4500
5000
CCAE CCSD ECSD HCSD LCSD NCSD PCSD WPCSD
2013 691 2207 0 88 0 27 792 696
2014 1058 2541 34 143 74 49 864 794
2015 1110 2194 74 38 137 35 952 806
2016 977 4680 111 0 206 29 1036 880
2013-2015 CORRECTIONAL EDUCATION ENROLLMENT COMPARISON
2012-2016 CORRECTIONAL EDUCATION
ENROLLMENTS COMPARISON
2013-2015 CORRECTIONAL EDUCATION
ENROLLMENTS COMPARISON BY DISTRICT
2016 NCEC Annual Report Card Page 8
0
50
100
150
200
250
300
350
400
450
2012 2013 2014 2015 2016
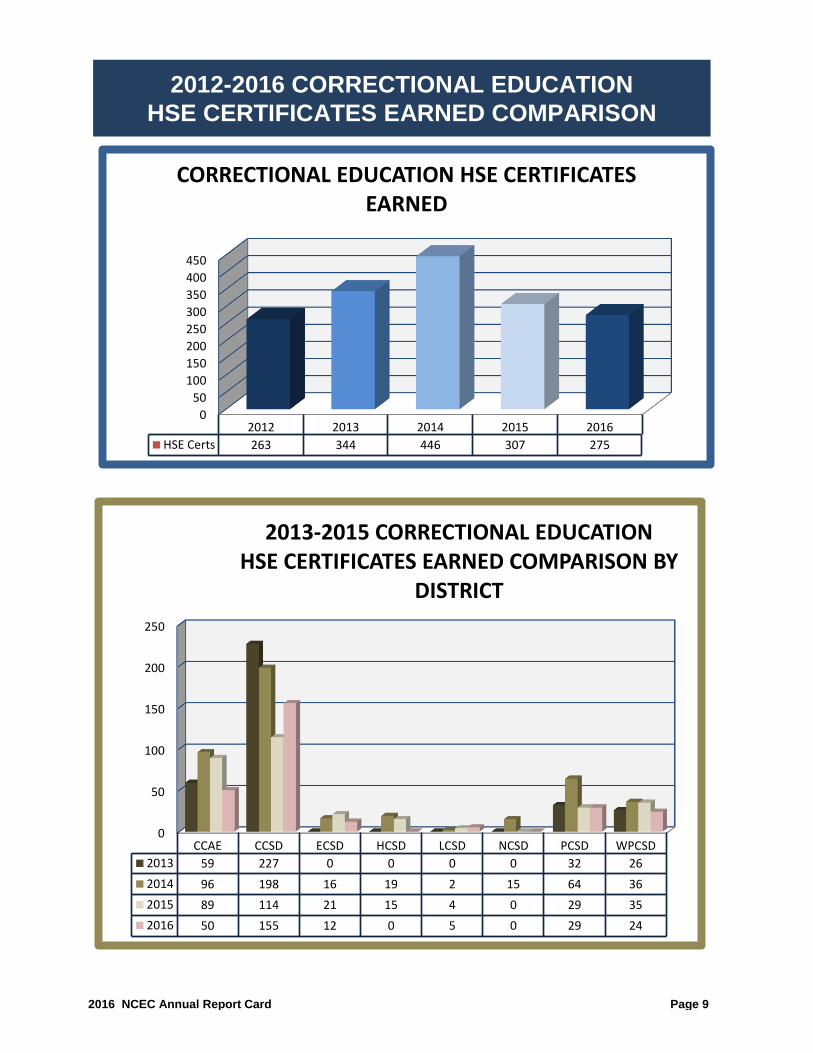
HSE Certs 263 344 446 307 275
CORRECTIONAL EDUCATION HSE CERTIFICATES EARNED
0
50
100
150
200
250
CCAE CCSD ECSD HCSD LCSD NCSD PCSD WPCSD
2013 59 227 0 0 0 0 32 26
2014 96 198 16 19 2 15 64 36
2015 89 114 21 15 4 0 29 35
2016 50 155 12 0 5 0 29 24
2013-2015 CORRECTIONAL EDUCATION HSE CERTIFICATES EARNED COMPARISON BY
DISTRICT
2012-2016 CORRECTIONAL EDUCATION
HSE CERTIFICATES EARNED COMPARISON
2016 NCEC Annual Report Card Page 9

0
50
100
150
200
250
300
350
400
2012 2013 2014 2015 2016
HSDS 173 327 366 291 287
2012-2016 CORRECTIONAL EDUCATION HIGH SCHOOL DIPLOMAS EARNED
COMPARISON
0
20
40
60
80
100
120
140
160
180
CCAE CCSD ECSD HCSD LCSD NCSD PCSD WPCSD
2013 76 168 0 0 0 0 34 49
2014 84 167 0 4 35 3 32 41
2015 98 103 3 4 0 1 37 45
2016 86 83 7 0 1 1 43 66
2013-2016 CORRECTIONAL EDUCATION HIGH SCHOOL DIPLOMAS EARNED
COMPARISON BY DISTRICT
2016 NCEC Annual Report Card Page 10
2012-2016 CORRECTIONAL EDUCATION
HIGH SCHOOL DIPLOMAS EARNED COMPARISON

0
50
100
150
200
250
300
350
400
CCAE CCSD ECSD HCSD LCSD NCSD PCSD WPCSD
2015 113 140 0 0 137 0 356 123
2016 123 333 0 0 139 0 399 202
2015-2016 CORRECTIONAL EDUCATION VOCATIONAL CERTIFICATES EARNED COMPARISON
BY DISTRICT
0
200
400
600
800
1000
1200
2015 2016
Voc Certs 869 1196
2015-2016 CORRECTIONAL EDUCATION VOCATIONAL CERTIFICATES EARNED
COMPARISON
2016 NCEC Annual Report Card Page 11
2015-2016 CORRECTIONAL EDUCATION
VOCATIONAL CERTIFICATES EARNED

$0.00
$200.00
$400.00
$600.00
$800.00
$1,000.00
$1,200.00
$1,400.00
$1,600.00
2012 2013 2014 2015 2016
EXPENDITURE PER STUDENT $1,543.00 $1,356.00 $985.00 $1,059.00 $628.00
CORRECTIONAL EDUCATION EXPENDITURE PER STUDENT
2012-2016 CORRECTIONAL EDUCATION
EXPENDITURE PER STUDENT COMPARISON
2016 NCEC Annual Report Card Page 12

NCEC 2016 STATISTICS
NDOC Total population: 13,633.
6,771 inmates eligible for secondary education services. Additional 6,862
inmates eligible for vocational certification. (Source: 2016 NDOC WEB
Reports-Secondary Services Priority Report)
7,919 NDOC inmates enrolled in NDE educational/vocational programs
throughout the State of Nevada an increase of 32.5% compared to 5346 in
2015. (Source-NDE Adult High School Programs (AHSP) 2015-16 Report)
275 HSE Certificates awarded a decrease of 11.6% compared to 307 in
2015. (Source-NDE AHSP 2015-16 Report)
287 HSDPs awarded a decrease of 1.4% compared to 291 in 2015. .
(Source-NDE AHSP 2015-16 Report)
1,196 Vocational Certificates awarded an increase of 37.6% compared to
869 in 2015. (Source-NDE AHSP 2015-16 Report)
4,017.54 total credits earned and waived an increase of 5.3% compared to
3,814.84 in 2015. (Source-NDE AHSP 2015-16 Report)
$628.00 expenditure per student a decrease of 40.7% compared to
$1,059.00 in 2015.
NDOC inmates who complete education programs are more
successful after release than those who do not complete programs
Education completion increases success even among offender groups
that normally have higher recidivism rates.
For every $1.00 spent on adult correctional education, it yields a
benefit of $6.00 to the State of Nevada.
.
2016 NCEC Annual Report Card Page 13

Review NDOC’s current Education Referral Policy and Process to ensure accuracy of the inmate’s Presentencing Sentencing Interview (PSI).
Implement an Offender Case Management System that will provide a mechanism to better track inmates’ educational and occupational programming needs.
More inmates needing Education Services will be served.
80% of incoming inmates will have an ICP developed and loaded into the NOTIS’s case management module.
January 2016
September 2016
Draft new Policy (modify existing Education AR) for NDOC’s Programs Division.
At intake, NDOC staff will begin planning for the inmate’s successful transition back to the community. All inmates entering NDOC will have an electronic, comprehendible and interactive Individual Case Plan (ICP) developed employing evidence-based practices and principles.
The ICP will identify specific activities to be performed and skills to be learned by the inmate. The inmate will be held accountable for carrying out the activities identified during the intake process.
The ICP will “travel” with the inmate during his/her entire incarceration and out into the community while on supervision.
# 1. 2.
Monthly enrollment numbers by School Districts.
Intake/classification-number of ICPs loaded into NOTIS.
NDOC/NCEC ACTION PLAN 2015-2016
# GOAL ACTIVITY RESULTS MEASUREMENT TIMELINE MET/NOT MET
Met-NDOC Referrals to Education Increasing, however PSI information needs to be verified prior to referral.
Not Met-Currently under review with NOTIS Management
2016 NCEC Annual Report Card Page 14
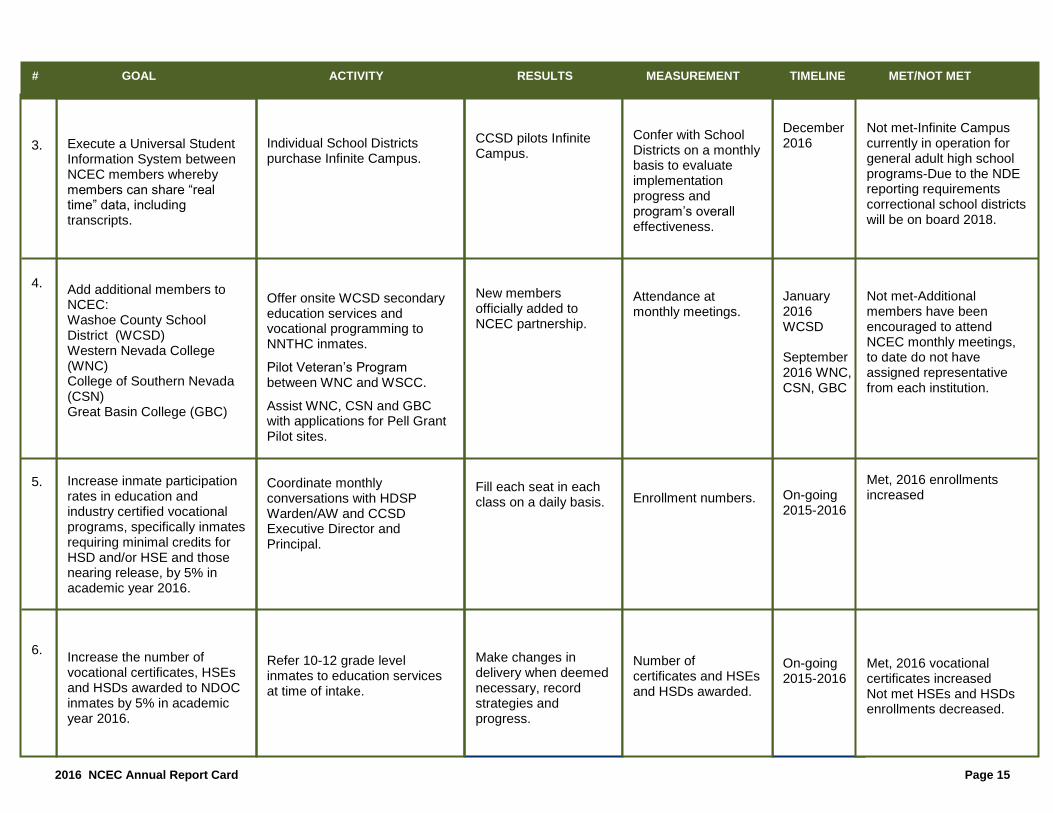
Execute a Universal Student Information System between NCEC members whereby members can share “real time” data, including transcripts.
Add additional members to NCEC: Washoe County School District (WCSD) Western Nevada College (WNC) College of Southern Nevada (CSN) Great Basin College (GBC)
Increase inmate participation rates in education and industry certified vocational programs, specifically inmates requiring minimal credits for HSD and/or HSE and those nearing release, by 5% in academic year 2016.
Increase the number of vocational certificates, HSEs and HSDs awarded to NDOC inmates by 5% in academic year 2016.
CCSD pilots Infinite Campus.
New members officially added to NCEC partnership.
Fill each seat in each class on a daily basis.
Make changes in delivery when deemed necessary, record strategies and progress.
December 2016 January 2016 WCSD September 2016 WNC, CSN, GBC On-going 2015-2016 On-going 2015-2016
Individual School Districts purchase Infinite Campus.
Offer onsite WCSD secondary education services and vocational programming to NNTHC inmates.
Pilot Veteran’s Program between WNC and WSCC.
Assist WNC, CSN and GBC with applications for Pell Grant Pilot sites.
Coordinate monthly conversations with HDSP Warden/AW and CCSD Executive Director and Principal.
Refer 10-12 grade level inmates to education services at time of intake.
3. 4. 5. 6.
Confer with School Districts on a monthly basis to evaluate implementation progress and program’s overall effectiveness.
Attendance at monthly meetings.
Enrollment numbers.
Number of certificates and HSEs and HSDs awarded.
# GOAL ACTIVITY RESULTS MEASUREMENT TIMELINE MET/NOT MET
Not met-Infinite Campus currently in operation for general adult high school programs-Due to the NDE reporting requirements correctional school districts will be on board 2018. Not met-Additional members have been encouraged to attend NCEC monthly meetings, to date do not have assigned representative from each institution. Met, 2016 enrollments increased Met, 2016 vocational certificates increased Not met HSEs and HSDs enrollments decreased.
2016 NCEC Annual Report Card Page 15
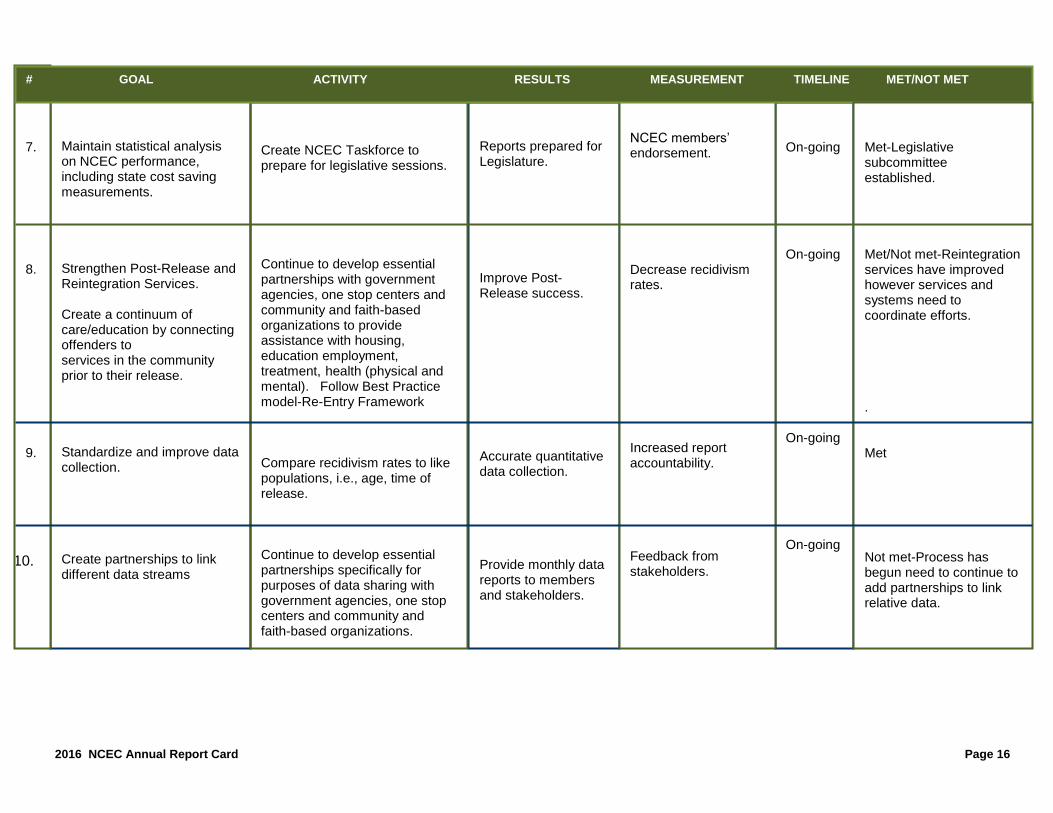
Maintain statistical analysis on NCEC performance, including state cost saving measurements. Strengthen Post-Release and Reintegration Services. Create a continuum of care/education by connecting offenders to services in the community prior to their release. Standardize and improve data collection. Create partnerships to link different data streams
Reports prepared for Legislature.
Improve Post-Release success.
Accurate quantitative data collection.
Provide monthly data reports to members and stakeholders.
On-going On-going On-going On-going
Create NCEC Taskforce to prepare for legislative sessions.
Continue to develop essential partnerships with government agencies, one stop centers and community and faith-based organizations to provide assistance with housing, education employment, treatment, health (physical and mental). Follow Best Practice model-Re-Entry Framework Compare recidivism rates to like populations, i.e., age, time of release. Continue to develop essential partnerships specifically for purposes of data sharing with government agencies, one stop centers and community and faith-based organizations.
7. 8. 9.
10.
NCEC members’ endorsement.
Decrease recidivism rates.
Increased report accountability.
Feedback from stakeholders.
# GOAL ACTIVITY RESULTS MEASUREMENT TIMELINE MET/NOT MET
Met-Legislative subcommittee established. Met/Not met-Reintegration services have improved however services and systems need to coordinate efforts. . Met
Not met-Process has begun need to continue to add partnerships to link relative data.
2016 NCEC Annual Report Card Page 16

EDUCATION
Adult Education Career, Technical Training Post-Secondary Education
Record educational/vocational obtainment and progress into
NOTIS
GREEN TECH
DRY CLEANING
AUTOCAD
BUSINESS
COMPUTERS
ONSTRUCTION
CULINARY
SEX OFFENDER
EDUCATION
CAMP
AUTO Medical Referrals Psychiatric Referrals
PRERELEASE ACTIVITIES
Transfer and update data. Help inmate with revisions
of his/her ICP Refer inmates to
community-based education programs.
through in-reach services and program referrals.
Establish community’s point people for tracking
individual’s progress. Record information into
NOTIS
COMMUNITY INTAKE
Help inmate with revisions of his/her ICP
and applications for financial aid.
Use assessment data and education plan to
determine most effective use of individual’s time
under community supervision. Establish
community’s point people for tracking individual’s
progress. Record information into NOTIS
Moment of
Release
INDIVIDUAL CASE PLAN (ICP) Assess knowledge, skills, and occupational interests using universal assessment tool. Addresses the needs of the
offender including education, employment, substance abuse
treatment, mental health treatment, family reunification, post release services, and areas which are needed to facilitate successful
reintegration into the community. Upload into NOTIS
Criminogenic Needs
Prioritized Record
information into NOTIS
CORRECTIONS INTAKE Interview Inmate
Medical Assessment NRAS Administered Initial Mental Health
Assessment Secondary Education
Prioritization Literacy Level, Age, Probable Release
Record information into NOTIS
PROPOSED 2016 NDOC FLOWCHART
SUCCESS Long term employment, living
wage, promotional opportunities, successful transition to the
community.
SUBSTANCE ABUSE
TREATMENT
PROGRAMS
2016 NCEC Annual Report Card Page 17

The evidence is in: raising literacy rates in the community contributes to
reducing crime and lowering recidivism. Since 2008, the financial crisis has had a
profound social and economic impact on the US’s most vulnerable communities. Literacy
influences individual capability in all spheres of life. In times of economic instability, low
literacy makes individuals and communities more vulnerable to inequality, increasing the
risk of social exclusion and undermining social mobility.
Criminal offenders have lower average literacy levels than the general
population. Neighborhoods with lower literacy levels have higher crime rates. Literacy
programs in prisons have resulted in positive outcomes (such as being able to maintain
employment) and reduced rates of re-offending. Unfortunately, inmates who have low
literacy are less likely to use the services available to them. They are also less able to
benefit from the life skills and rehabilitative programs offered, or that a judge ordered
them to take at sentencing. Anger management training and drug rehabilitation
programs usually involve reading, so these programs may not be as beneficial to an
offender who has low literacy.
On November 16, 2016, U.S. Secretary of Education John B. King Jr. called for
more high-quality education programs within correctional facilities – especially, since
nearly all of America’s 1.5 million incarcerated individuals will eventually reenter society.
2016 NCEC Annual Report Card Page 18

.
In a dear colleague letter that coincides with a report showing low-literacy skills
among the incarcerated, King urged states to make use of expanded resources under
the Workforce Innovation and Opportunity Act. With help from the Workforce Innovation
and Opportunity Act, states can shrink achievement gaps, equip prisoners with skills and
credentials to find sustainable employment. “In order to reduce recidivism, it is important
for these individuals to become productive and contributing members of our society,”
King wrote. “Providing these individuals with opportunity, advancement, and
rehabilitation is not only the right thing to do, it also positions our country to remain
economically competitive in a global economy. To foster this reintegration and reduce
recidivism, we as a nation must continue to expand and develop correctional education
and reentry support programs.”
The economic and social returns far outweigh the cost of providing literacy
training to prisoners. NCEC’s data and statistical analysis support this conclusion.
Correctional Education is fundamental to all other correctional goals. It serves as a
prerequisite to the success of many of the other kinds of programming. The more literate
the inmate, the more he or she may benefit from all other forms of programming and
training. With that said, the quality of education delivery is crucial. NCEC educators face
a classroom full of students with varied learning styles, educational needs, and school
and work experiences, and learning for these students is often difficult, frustrating,
challenging-but necessary.
The aim of the consortium is to implement correctional education best
practices with consistency and effectiveness throughout the state of Nevada. Research
from the National Center for Literacy Education (NCLE) shows that educators in every
subject area and role are eager to work together to deepen literacy learning: Across
fields, 77% of educators, principals, and librarians agreed that developing student
literacy is one of the most important responsibilities they have. It also showed that
educators are committed to common-sense changes to improve teaching and learning
practices: they most value time to co-plan with colleagues to create new lessons or
instructional strategies and to analyze how their students are developing and what they
can do together to advance progress. The consortium is committed to an annual in-
service day. Correctional educators throughout the State of Nevada will come together
and share their strengths and resources, different ways of achieving goals and different
approaches to teaching methods.
2015 NCEC Annual Report Card Page 19

In summary, the NCEC Report card was developed to assess the effectiveness
of correctional education throughout the State of Nevada. The report card helps
inform management actions, budget requests, and legislative proposals directed at
achieving results. It examines various factors that contribute to the effectiveness of a
program and requires that conclusions be explained and substantiated with evidence.
2016 NCEC Annual Report Card Page 20
The coordinated efforts of many can accomplish more than the efforts of one or a few separately.

ATTACHMENT A

Reentry Education Framework

Reentry Education Framework
Table of Content
Page Number
About Us
Transition Process
Reentry Education Student Flow Chart
Education Services
Checklist for Connecting Reentry Education
Programs to Career Pathways
Education Services Tool
Strategic Partnerships
Reentry Resource Mapping Tip Sheet
Infrastructure
Sustainability
1
2
3
4
5
6
7
8
9
10

Reentry Education Framework
1
About Us
The Reentry Education Tool Kit was created by RTI International with support from the U.S. Department
of Education, Office of Career, Technical, and Adult Education (OCTAE), to help education providers and
their partners create a reentry education continuum in their communities. The tool kit and corresponding
report, The Reentry Education Framework: Guidelines for Providing High-Quality Education for Adults
Involved in the Criminal justice System, are based on a demonstration of the Reentry Education Model.
The Reentry Education Model
Developed in 2012 by RTI International with support from OCTAE, the Reentry Education Model
addressed the disconnects among facility- and community-based education services, including a lack of
alignment between curriculum and instructional practices, an inability to share student data and track
long-term outcomes, and inadequate staff capacity and training.
Promoting Reentry Success Through the Continuity of Education Opportunities (PRSCEO)
Initiative
In 2013, the U.S. Department of Justice provided OCTAE with Second Chance Act funds to award grants
to three demonstration sites to implement the Reentry Education Model. The sites were Barton
Community College in Great Bend, Kansas; Lancaster Lebanon Intermediate Unit 13 in Lancaster,
Pennsylvania; and Western Technical College in La Crosse, Wisconsin. An implementation study was
conducted by Strix Research LLC to document the grantees’ experiences and lessons learned
implementing the Model.
Improved Reentry Education (IRE) Init
In 2015, OCTAE awarded grants to the following nine demonstration sites that are developing reentry
education continuums in their communities: Washburn University of Topeka, Topeka, Kansas; Barton
County Community College, Great Bend, Kansas; Essex County College, Newark, New Jersey; Miami-
Dade County, Florida; Lorain County Community College, Elyria, Ohio; Lancaster-Lebanon Intermediate
Unit 13, Lancaster, Pennsylvania; Western Technical College, La Cross, Wisconsin; Pennsylvania
Department of Corrections, Pennsylvania; and United Teen Equality Center, Inc., Lowell, Massachusetts.

Reentry Education Framework
2
Transition Processes
Reentry education providers should work closely with their partners to assess students’ needs and risks,
identify services and support needed, and develop a service delivery schedule that takes into account
various transition points. Specific approaches to easing transitions may depend on whether a provider is
working with a prison, jail, or in the community.
Transitions into and out of prisons
Prison-based providers should create a structured intake and prerelease process that includes:
o Assessing students' knowledge, skills, and occupational interests.
o Engaging students in creating an education and career plan.
o Determining students’ eligibility for and the timing of education services.
o Referring students to community-based programs.
o Sharing data with community partners to prepare for a student’s release.
Transitions into and out of jails
With little time or notice to help students prepare for release, jail-based providers should focus on making
program referrals and strengthening partnerships with community services to facilitate students' transition
into the community.
Transitions in the community
Community-based providers may serve students who have had varied experiences with the criminal
justice system. Providers therefore should create a flexible approach to verify students' education record,
administer assessments, create an education and career plan, and direct students to appropriate
services.
Reentry Education Framework
3
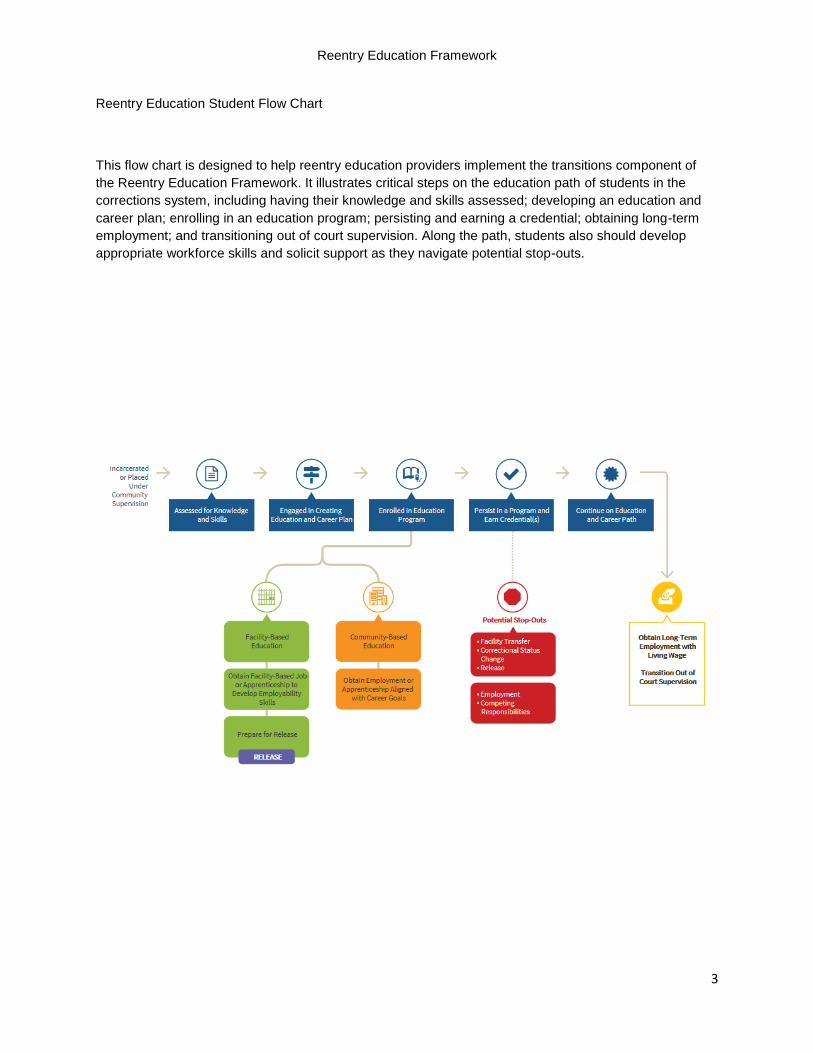
Reentry Education Student Flow Chart
This flow chart is designed to help reentry education providers implement the transitions component of
the Reentry Education Framework. It illustrates critical steps on the education path of students in the
corrections system, including having their knowledge and skills assessed; developing an education and
career plan; enrolling in an education program; persisting and earning a credential; obtaining long-term
employment; and transitioning out of court supervision. Along the path, students also should develop
appropriate workforce skills and solicit support as they navigate potential stop-outs.
Reentry Education Framework
4
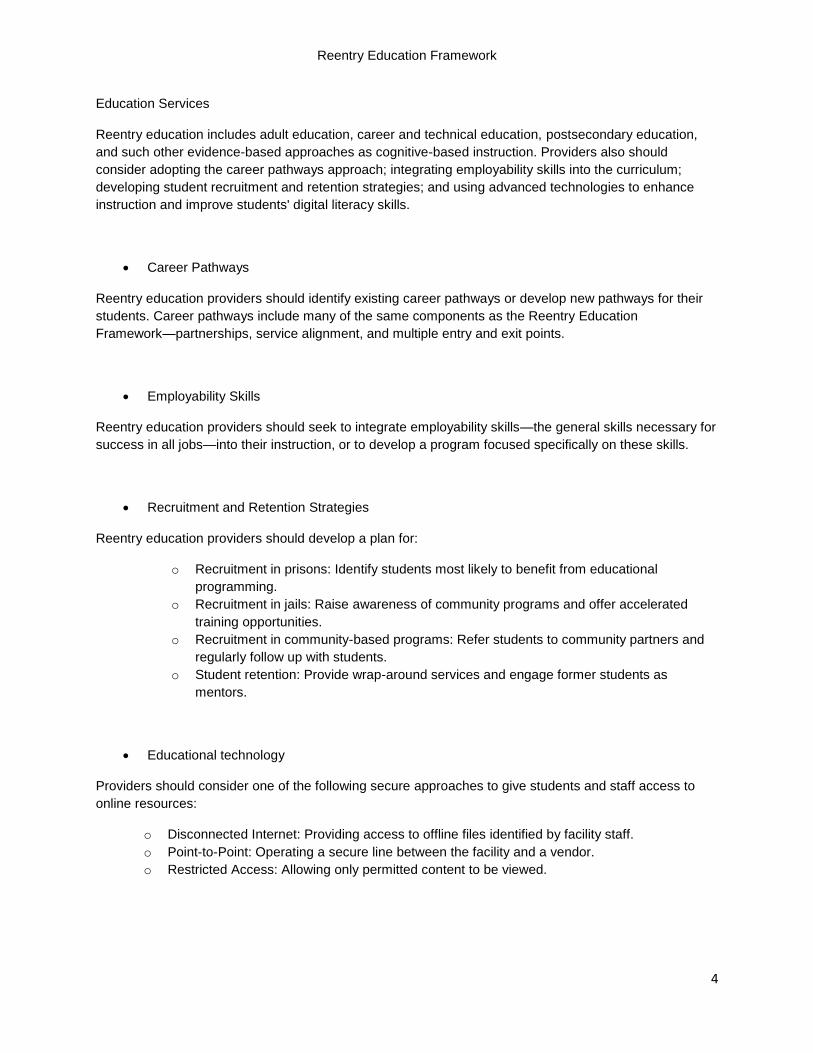
Education Services
Reentry education includes adult education, career and technical education, postsecondary education,
and such other evidence-based approaches as cognitive-based instruction. Providers also should
consider adopting the career pathways approach; integrating employability skills into the curriculum;
developing student recruitment and retention strategies; and using advanced technologies to enhance
instruction and improve students' digital literacy skills.
Career Pathways
Reentry education providers should identify existing career pathways or develop new pathways for their
students. Career pathways include many of the same components as the Reentry Education
Framework—partnerships, service alignment, and multiple entry and exit points.
Employability Skills
Reentry education providers should seek to integrate employability skills—the general skills necessary for
success in all jobs—into their instruction, or to develop a program focused specifically on these skills.
Recruitment and Retention Strategies
Reentry education providers should develop a plan for:
o Recruitment in prisons: Identify students most likely to benefit from educational
programming.
o Recruitment in jails: Raise awareness of community programs and offer accelerated
training opportunities.
o Recruitment in community-based programs: Refer students to community partners and
regularly follow up with students.
o Student retention: Provide wrap-around services and engage former students as
mentors.
Educational technology
Providers should consider one of the following secure approaches to give students and staff access to
online resources:
o Disconnected Internet: Providing access to offline files identified by facility staff.
o Point-to-Point: Operating a secure line between the facility and a vendor.
o Restricted Access: Allowing only permitted content to be viewed.

Reentry Education Framework
5
Checklist for Connecting Reentry Education Programs to Career Pathways
The Reentry Education Framework is intended to connect education services offered within correctional
facilities seamlessly to those offered in the community. This requires the support of many partners, a
strong program infrastructure, and aligned education and training services. Career pathways operate on
many of the same principles, offering a network of partnerships and services to help individuals improve
their knowledge and skills so that they can pursue further education and employment opportunities within
an industry sector. Reentry education can prepare individuals to enter a career pathway, which can help
them improve their employability and secure better jobs when they reenter the workforce.
The below checklist outlines steps for aligning reentry education programs with local career pathways.
These steps assume that career pathways already exist in your communities, as they are different from
the steps a state or region would take to design a pathway. Use the checklist to guide your research on
local pathways and explore other community resources.
This checklist is designed to support reentry education providers implementing the education services
component of the Reentry Education Framework.
Understand how the Reentry Education Framework aligns with the U.S. Department of Labor
Career Pathways Toolkit.
Research local industries offering viable career opportunities for individuals with criminal
backgrounds.
o Credit Reports and Employment Background Checks, Federal Trade Commission
o Federal Bonding Program, U.S. Department of Labor and the McLaughlin Company.
o EEOC Enforcement Guidance, U.S. Equal Employment Opportunity Commission
o National Inventory of the Collateral Consequences of Conviction, ABA Criminal Justice
Section
o Reentry Mythbusters, Council of State Governments – see employment topics related to
federal bonding, tax benefits for employers, and federal hiring policies
o Work Opportunity Tax Credit, U.S. Department of Labor and Internal Revenue Service
Contact reentry education partners who also may be part of a career pathway, including, for
example, community colleges, adult education providers, one-stop centers, and workforce
boards. For more information, see if your partners participate in any national or state career
pathways initiatives, such as:
o Advancing CTE in State and Local Career Pathways
o Accelerating Opportunity
o Alliance for Quality Career Pathways
o Moving Pathways Forward
o Pathways to Prosperity
Help reentry education participants understand the benefits of career pathways. For example,
create a free customized career pathways map: http://oregon.ctepathways.org/.

Reentry Education Framework
6
Education Services Tool
Use the following handout to help inform your partners about existing and emerging approaches to
providing incarcerated students and their instructors with access to advanced technologies. Adopting
educational technology is recommended as part of the education services component of the Reentry
Education Framework.
Educational Technology in Corrections Handout
Corrections agencies and their education partners increasingly are exploring ways to use educational
technology to help prepare students to join our globally networked society; support an education
continuum for incarcerated individuals; expand the professional development resources available to
instructors; expand the reach of correctional education services; and ease the reentry process by allowing
incarcerated individuals to prepare for release. They are using one of the following three approaches to
provide secure access:
o Isolated Local Server
An isolated local server approach moves Internet content to a facility’s LAN so that the documents can be
made available to anyone — administrators, teachers, and students — with access to the offline
collection. This approach provides the most security, outside of barring access to any Internet content.
However, it requires frequent uploading of Internet content to stay current, and it does not provide real-
time access to the Internet or student outcome data to support instruction.
o Point-to-Point Secure Line
A point-to-point or dedicated line operates via a virtual circuit setup between the facility and a vendor.
Internet content is streamed through the vendor’s server. This approach provides real-time access to the
Internet and data to support instruction. It also provides a high level of security but can be expensive
because of vendor fees.
o Restricted Internet Connection
A restricted Internet connection has routers and firewalls on each end that permits only certain Internet
content to come through the system. This requires (1) all nonessential software programs and utilities
from the computer to be removed, often referred to as “hardening” equipment; and (2) content to be
preapproved, commonly referred to as "white listing." It also can be expensive because of monthly vendor
fees. However, it provides real-time access to the Internet and data to support instruction. It also provides
a high level of security but is not as secure as the isolated local server and point-to-point approaches.

Reentry Education Framework
7
Strategic Partnerships
Partnerships are essential to the success of an education continuum. Reentry education providers must
collaborate with correctional facilities, parole and probation officers, social and employment services, and
employers. Effective partnership practices include mapping resources to identify potential partners and
establishing a formal partnership agreement.
Mapping Partnership Resources
Reentry education providers should conduct an assessment of potential partner organizations that could
support the reentry process. Providers also should create a resource map to connect students to support
and employment services.
Establishing a Partnership Agreement
Providers should establish a formal partnership agreement or join an existing group to ensure that
partners develop:
o Common goals and objectives
o A plan for regular communication
o A process for measuring success

Reentry Education Framework
8
Reentry Resource Mapping Tip Sheet
Because funds for education programs serving the corrections population are limited, partnerships are
essential for program success. Partners can provide additional services, such as employment services
(e.g., career counseling and job readiness training) and social support (e.g., counseling, mentoring, and
addiction treatment). A Resource Map can help link incarcerated students—pre- and post-release—to
partners offering these needed services.
This tool is designed to support reentry education providers implementing the strategic partnerships
component of the Reentry Education Framework.
Target Users
Reentry education providers will populate and manage the resource map, which will be used to identify
new partners, community resources, and support for their students.
When to Use
Reentry education providers adopting the Reentry Education Framework should start by conducting a
needs assessment, which includes identifying existing partners. The resource map should be populated
with the partners identified during that process and then managed and updated regularly.
How to Use
In its most basic form, a resource map can be as simple as a comprehensive list of partners, managed in
a spreadsheet or database. Resource maps also can be created with more advanced software, including
features such as geographical information system maps, text messages, and interactivity. Reentry
education providers should determine if their community has an existing reentry resource mapping tool
(e.g., developed by a local reentry council) and, if so, request access to the tool. Otherwise, providers
needing to develop their own re-source mapping tool should use available open source tools, such as
Resource Map and Story Map Shortlist.
Regardless of the level of sophistication of the resource map, the tool should include the following fields:
o Agency name
o Program name
o Services provided
o Contact person
o Address
o City, state, zip code
o County or geographical zone
o Phone number, email address,
and fax
o Days and hours
o Appointment required?
o Referral required?
o Language(s) spoken
o Eligibility requirements
o Program exclusions
o Space availability
o Documents required
o Fee structure
o Website address
o Weekend days and hours
o Comments

Reentry Education Framework
9
Infrastructure
To build or strengthen a reentry education continuum, providers need a solid program infrastructure that
includes adequate programmatic resources and program capacity, data collection and evaluation
procedures, and policies supportive of reentry education.
Programmatic Resources
Reentry education providers should:
o Have a diverse and steady funding base leveraging public and private resources.
o Solicit in-kind materials (e.g., equipment) and human resources, such as peer tutors, to
keep costs manageable.
o Leverage partner resources to avoid duplication and maximize available support.
o Secure student support, including inmate wages and financial aid, to encourage program
participation and persistence.
Program Capacity
Reentry education providers should:
o Have sufficient space in the jail or prison to offer classes.
o Secure adequate equipment to support classroom instruction (e.g., computer hardware and
software).
o Train staff in techniques tailored to the corrections population, such as motivational
interviewing.
Data Collection and Evaluation
Reentry education providers should:
o Keep accurate, complete, and timely data on program participation and outcomes through a
centralized electronic data system.
o Evaluate program success, including areas needing improvement, modifications made, and
student outcomes.
Policies
Reentry education providers should:
o Collaborate with partners to advocate for changes in federal and state policies that create
barriers to successful reentry.
o Strengthen program and partners' administrative policies that support education and
training programs for students in the corrections population.

Reentry Education Framework
10
Sustainability
Sustainability is an ongoing process enabling providers to ensure that their reentry education continuum
persists through changes in resources, staff, and other components. A sustainability strategy involves not
only identifying new resources, but also maintaining program goals, principles, and activities.
Sustainability Strategy
The following activities can help reentry education providers develop a short-term sustainability strategy:
o Assess organizational readiness and capacity for sustainability.
o Maximize resources such as staff, volunteers, and internal and external partnerships.
o Engage partners and key stakeholders and develop communication strategies to ensure
widespread support of the program.
o Develop a sustainability plan, including funding strategies.
Related Documents