INFOGRAPHIC April 2020 Rate of Living Alone by Rurality and Age Purpose Living alone is increasingly common and is associated with higher risk of social isolation and poor health for populations without access to appropriate support and resources. Little is known about how rates of living alone vary by rurality, however. In this infographic, we iden- tify rates of living alone for all adults and within specific age groups using two different classifications of rurality. Data To compute rates of living alone by rurality and age, we use sum- mary data from the U.S. Census Bureau’s 2013-2017 American Com- munity Survey (ACS) 5-Year Estimates, acquired through the IPUMS National Historical Geographic Information System (www.nhgis.org). We limit all figures to adults in households (excluding children and people living in group quarters). Carrie Henning-Smith, PhD, MPH, MSW Jonathan Schroeder, PhD, MA Mariana S Tuttle, MPH Key Findings • Rates of living alone are higher in Census- defined urban areas than in rural areas across all age categories, but rates are also higher in non-metro counties than in metro counties. This seeming contradiction is possible because of the differences in how “urban areas” and “metro areas” are officially defined. • The higher rates in both urban areas and non- metro counties indicate that living alone is especially prevalent in outlying small cities and large villages (areas that are officially both urban and non-metro) but relatively uncommon in the surrounding “countryside” (officially rural areas in either metro or non- metro counties). • The likelihood of living alone increases with age, so areas with older populations generally have higher rates of living alone and vice versa. This partly explains the urban/rural trends. • Among non-metro counties, there is a pattern of high rates of living alone across the Great Plains and in a few smaller regions in the Upper Midwest, the Deep South, and the Mountain West. • When developing policies and programs to ensure that people living alone have appropriate support and resources, the higher rates in non-metro cities and in certain non-metro regions should receive special attention. rhrc.umn.edu 0 5 10 15 20 25 30 7.8 4.3 18 to 34 35 to 64 65+ Total Urban Rural 13 10 28.5 22.5 14.2 11.6 Figure 1: Percent Living Alone by Age and Census-Defined Rural/ Urban Location 7.4 12.3 26.8 13.5 6.6 13 28.2 14.9 0 5 10 15 20 25 30 18 to 34 35 to 64 65+ Total Metro Non-Metro Figure 2: Percent Living Alone by Age and Metropolitan/Non- Metropolitan County

Welcome message from author
This document is posted to help you gain knowledge. Please leave a comment to let me know what you think about it! Share it to your friends and learn new things together.
Transcript

INFOGRAPHICApril 2020
Rate of Living Alone by Rurality and AgePurpose Living alone is increasingly common and is associated with higher risk of social isolation and poor health for populations without access to appropriate support and resources. Little is known about how rates of living alone vary by rurality, however. In this infographic, we iden-tify rates of living alone for all adults and within specific age groups using two different classifications of rurality.
Data To compute rates of living alone by rurality and age, we use sum-mary data from the U.S. Census Bureau’s 2013-2017 American Com-munity Survey (ACS) 5-Year Estimates, acquired through the IPUMS National Historical Geographic Information System (www.nhgis.org). We limit all figures to adults in households (excluding children and people living in group quarters).
Carrie Henning-Smith, PhD, MPH, MSW
Jonathan Schroeder, PhD, MA
Mariana S Tuttle, MPH
Key Findings• Rates of living alone are higher in Census-
defined urban areas than in rural areas across all age categories, but rates are also higher in non-metro counties than in metro counties. This seeming contradiction is possible because of the differences in how “urban areas” and “metro areas” are officially defined.
• The higher rates in both urban areas and non-metro counties indicate that living alone is especially prevalent in outlying small cities and large villages (areas that are officially both urban and non-metro) but relatively uncommon in the surrounding “countryside” (officially rural areas in either metro or non-metro counties).
• The likelihood of living alone increases with age, so areas with older populations generally have higher rates of living alone and vice versa. This partly explains the urban/rural trends.
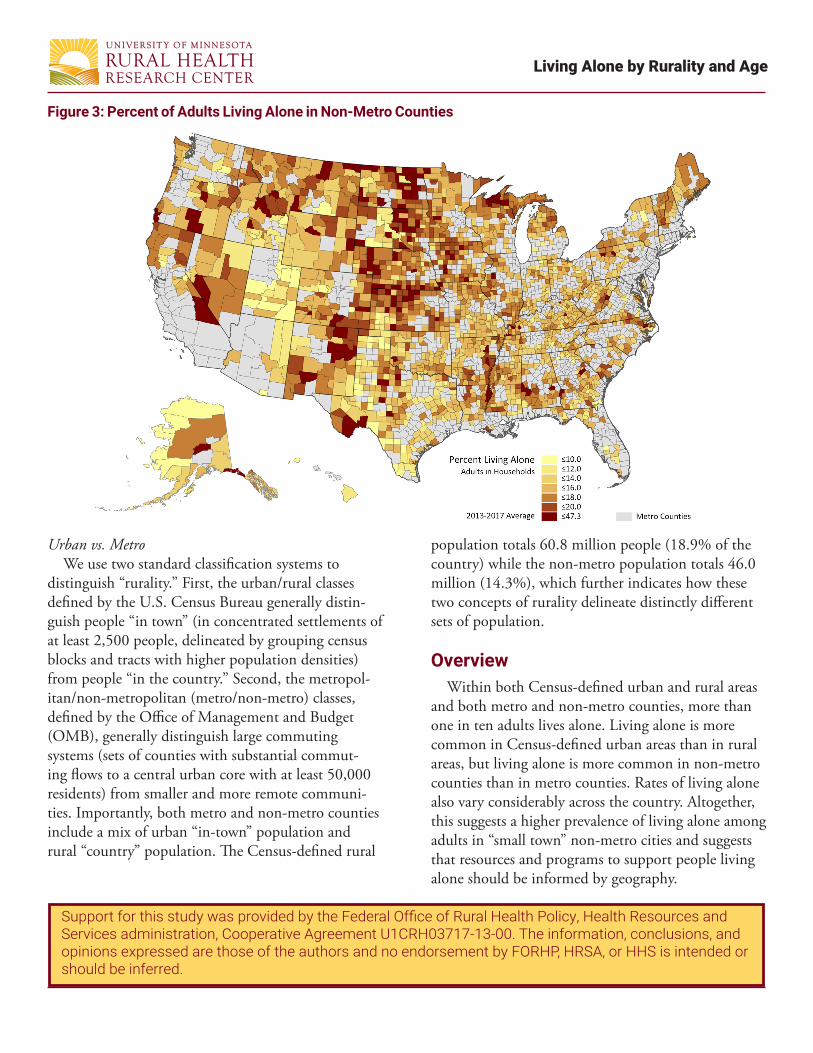
• Among non-metro counties, there is a pattern of high rates of living alone across the Great Plains and in a few smaller regions in the Upper Midwest, the Deep South, and the Mountain West.
• When developing policies and programs to ensure that people living alone have appropriate support and resources, the higher rates in non-metro cities and in certain non-metro regions should receive special attention.
rhrc.umn.edu
0
5
10
15
20
25
30
7.84.3
18 to 34 35 to 64 65+ Total
Urban Rural
1310
28.5
22.5
14.211.6
Figure 1: Percent Living Alone by Age and Census-Defined Rural/Urban Location
7.4
12.3
26.8
13.5
6.6
13
28.2
14.9
0
5
10
15
20
25
30
18 to 34 35 to 64 65+ Total
Metro Non-Metro
Figure 2: Percent Living Alone by Age and Metropolitan/Non-Metropolitan County
Living Alone by Rurality and Age
Urban vs. Metro We use two standard classification systems to distinguish “rurality.” First, the urban/rural classes defined by the U.S. Census Bureau generally distin-guish people “in town” (in concentrated settlements of at least 2,500 people, delineated by grouping census blocks and tracts with higher population densities) from people “in the country.” Second, the metropol-itan/non-metropolitan (metro/non-metro) classes, defined by the Office of Management and Budget (OMB), generally distinguish large commuting systems (sets of counties with substantial commut-ing flows to a central urban core with at least 50,000 residents) from smaller and more remote communi-ties. Importantly, both metro and non-metro counties include a mix of urban “in-town” population and rural “country” population. The Census-defined rural
Support for this study was provided by the Federal Office of Rural Health Policy, Health Resources and Services administration, Cooperative Agreement U1CRH03717-13-00. The information, conclusions, and opinions expressed are those of the authors and no endorsement by FORHP, HRSA, or HHS is intended or should be inferred.
population totals 60.8 million people (18.9% of the country) while the non-metro population totals 46.0 million (14.3%), which further indicates how these two concepts of rurality delineate distinctly different sets of population.
Overview Within both Census-defined urban and rural areas and both metro and non-metro counties, more than one in ten adults lives alone. Living alone is more common in Census-defined urban areas than in rural areas, but living alone is more common in non-metro counties than in metro counties. Rates of living alone also vary considerably across the country. Altogether, this suggests a higher prevalence of living alone among adults in “small town” non-metro cities and suggests that resources and programs to support people living alone should be informed by geography.
Figure 3: Percent of Adults Living Alone in Non-Metro Counties
Related Documents