ANNUAL SAFETY REPORT RASG-PA Ninth Edition Information produced with data from 2009 until 2018

Welcome message from author
This document is posted to help you gain knowledge. Please leave a comment to let me know what you think about it! Share it to your friends and learn new things together.
Transcript
ANNUALSAFETYREPORT
RASG-PA
Ninth Edition
Information produced with data from 2009 until 2018

This document is distributed under the sponsorship of the Regional Aviation Safety Group – Pan
America (RASG-PA) in the interest of information exchange. The RASG-PA assumes no liability
for its contents or use thereof.
1
Contents Foreword .....................................................................................................................................................2
Executive Summary ...................................................................................................................................3
About the report .........................................................................................................................................4
How this report is structured ...................................................................................................... 4
Sources of information ................................................................................................................ 6
Interacting with the Annual Safety Report .................................................................................. 7
Part One: Safety information ....................................................................................................................8
1. Reactive Safety Information ................................................................................................. 8
1.1 Pan American accident statistics and rates ................................................................. 8
1.2 NAM Region Analysis .................................................................................................... 9
1.3 CAR and SAM Regions Analysis .................................................................................. 11
1.4 Specific analysis ......................................................................................................... 14
2. Proactive Safety Information ............................................................................................. 20
2.1 Proactive information at the level of the States ......................................................... 20
2.2 Information at the level of the Air Operators ............................................................. 25
3. Predictive Safety Information ............................................................................................ 29
Part Two: Safety Intelligence ................................................................................................................. 32
1. Conclusions based on reactive information ...................................................................... 32
2. Conclusions based on proactive information .................................................................... 32
3. Conclusions based on predictive information ................................................................... 32
4. Safety Intelligence correlations ......................................................................................... 33
List of Acronyms .................................................................................................................................. - 34 -
2
Foreword The Regional Aviation Safety Group – Pan America (RASG-PA) was established in November 2008
with a vision to remain ahead of any risks to commercial aviation, seeking to achieve the highest
level of safety in the Pan American Region, as well as addressing global aviation safety matters
from a regional perspective.
RASG-PA membership includes representatives from all States/Territories of the International
Civil Aviation Organization (ICAO) North American (NAM), Caribbean (CAR) and South American
(SAM) Regions, international organizations and industry. ICAO serves as the group Secretariat,
providing administrative, coordination and technical support to the RASG-PA, its working groups,
and committees.
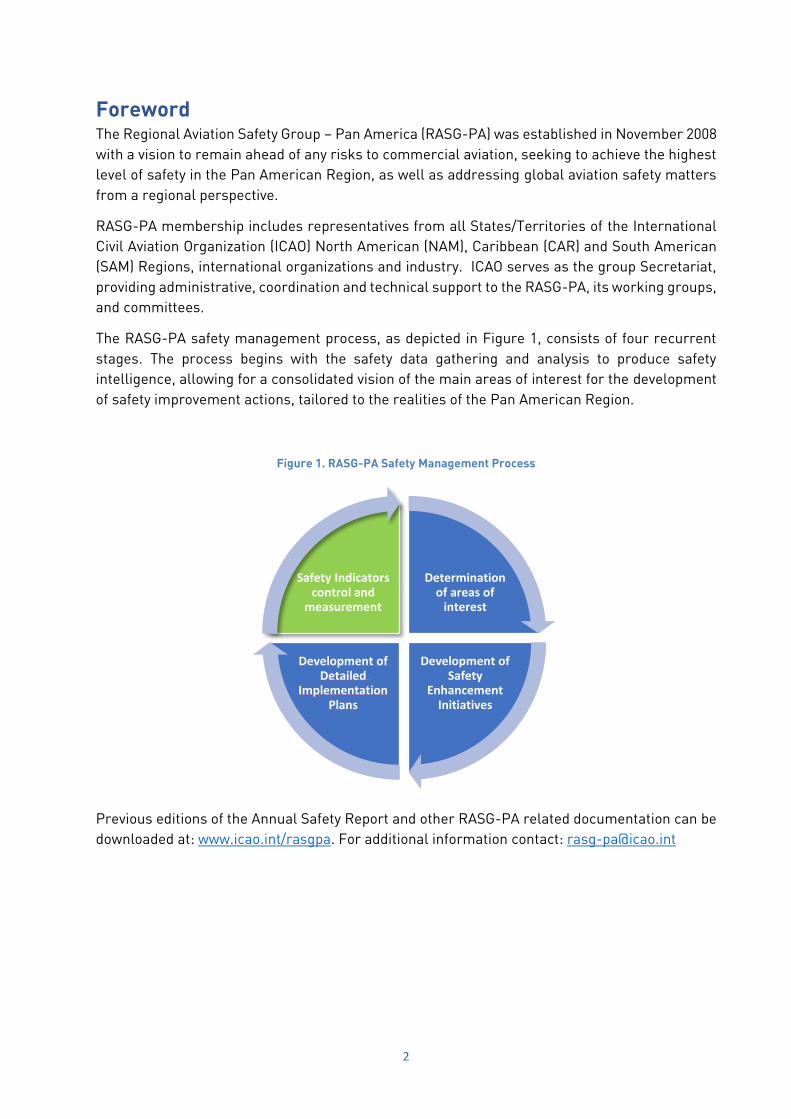
The RASG-PA safety management process, as depicted in Figure 1, consists of four recurrent
stages. The process begins with the safety data gathering and analysis to produce safety
intelligence, allowing for a consolidated vision of the main areas of interest for the development
of safety improvement actions, tailored to the realities of the Pan American Region.
Figure 1. RASG-PA Safety Management Process
Previous editions of the Annual Safety Report and other RASG-PA related documentation can be
downloaded at: www.icao.int/rasgpa. For additional information contact: [email protected]
Determination of areas of
interest
Development of Safety
Enhancement Initiatives
Development of Detailed
Implementation Plans
Safety Indicators control and
measurement
3
Executive Summary The results of the analysis of regional aviation safety data continue to show that the top categories
to focus safety enhancement initiatives (SEIs) remain:
Loss of Control In-flight (LOC-I)
Runway Excursion (RE)
Controlled Flight Into Terrain (CFIT)
Mid-Air Collision (MAC)
According to the statistics contained in this report, the number of accidents in 2018 in the Pan
American Region (ICAO NAM, CAR and SAM) for scheduled commercial air transport operations
involving aircraft with maximum take-off mass (MTOM) above 5,700 kilograms was higher than
the previous years, however, the accident rate was lower.
The four SEIs continue to show decreasing trends through the latest ten-year period, not only
while looking at the reactive data, but also according to the behaviour of their precursors, as
described in the predictive safety information section of this report.
The analysis conducted to determine correlations between the critical elements (CEs) of an
effective safety oversight system and areas of the ICAO Universal Safety Oversight Audit
Programme - Continuous Monitoring Approach (USOAP-CMA), showed that main findings for the
Pan American Region were related to CEs 4 (Technical personnel qualification and training), 7
(Surveillance obligations) and 8 (Resolution of safety concerns); in relation to Aerodrome and
Ground Aids (AGA) and Air Navigation Services (ANS) areas.
Considering the projected commercial traffic growth for CAR and SAM Regions, proactive
analysis also reinforces the necessity to improve ANS and AGA areas, especially in this Regions.
Information on Large Height Deviations (LHDs) registered in the CAR and SAM Regions during
2017 and 2018, shows that the technical error satisfies the goal of not exceeding 2.5 x 10⁻⁹ fatal
accidents per flight hour due to loss of standard vertical separation of 1,000 ft and all other
causes.
4
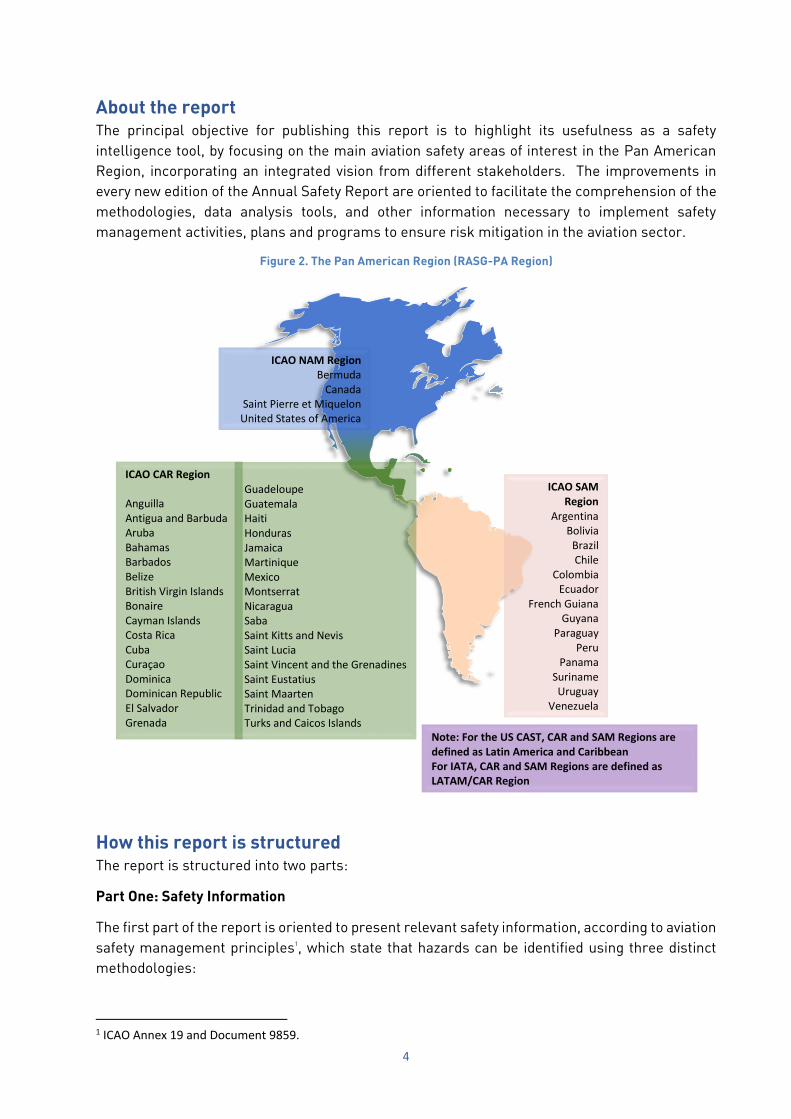
About the report The principal objective for publishing this report is to highlight its usefulness as a safety
intelligence tool, by focusing on the main aviation safety areas of interest in the Pan American
Region, incorporating an integrated vision from different stakeholders. The improvements in
every new edition of the Annual Safety Report are oriented to facilitate the comprehension of the
methodologies, data analysis tools, and other information necessary to implement safety
management activities, plans and programs to ensure risk mitigation in the aviation sector.
Figure 2. The Pan American Region (RASG-PA Region)
How this report is structured The report is structured into two parts:
Part One: Safety Information
The first part of the report is oriented to present relevant safety information, according to aviation
safety management principles1, which state that hazards can be identified using three distinct
methodologies:
1 ICAO Annex 19 and Document 9859.
ICAO NAM Region
Bermuda
Canada
Saint Pierre et Miquelon
United States of America
ICAO SAM Region
Argentina
Bolivia
Brazil Chile
Colombia
Ecuador French Guiana
Guyana
Paraguay
Peru
Panama
Suriname
Uruguay
Venezuela
ICAO CAR Region
Anguilla
Antigua and Barbuda
Aruba
Bahamas
Barbados
Belize
British Virgin Islands Bonaire Cayman Islands
Costa Rica
Cuba
Curaçao
Dominica
Dominican Republic
El Salvador Grenada Note: For the US CAST, CAR and SAM Regions are
defined as Latin America and Caribbean
For IATA, CAR and SAM Regions are defined as LATAM/CAR Region
Guadeloupe Guatemala
Haiti Honduras
Jamaica
Martinique
Mexico
Montserrat Nicaragua
Saba
Saint Kitts and Nevis
Saint Lucia
Saint Vincent and the Grenadines Saint Eustatius Saint Maarten
Trinidad and Tobago
Turks and Caicos Islands

5
1. Reactive: Refers to the analysis of results or past events. Through investigation processes,
hazards contributing to accidents or incidents can be identified. In this report, the reactive
section presents safety analysis based upon accidents and incidents, as shown in the following
figure.
Figure 3. Reactive Safety Data Analysis
2. Proactive: Refers to the analysis of existing conditions. Safety assurance processes, such as
audits or evaluations, could provide information on hazards into processes in place. The
proactive section of this report includes analysis of audit results for the States’ (ICAO
Standards and Recommended Practices implementation, traffic) and service providers as
IOSA (IATA Operational Safety Audits).
Figure 4. Proactive Safety Data Analysis
Specific analysis
Areas of analysis
Safety Data Sources
Accidents and incidents
Reporting culture of the States
ICAO Annex 13 compliance
Commercial air transport accidents
Fatality risk
Top categories
Top contributingfactors
Specific analysis
Areas of analysis
Safety Data Sources
States and Service
Providers
States
Exposure to risk
USOAP
Air Operators
IDISR (LAR 129 Operators)
IOSA findings (registered Operators)
6
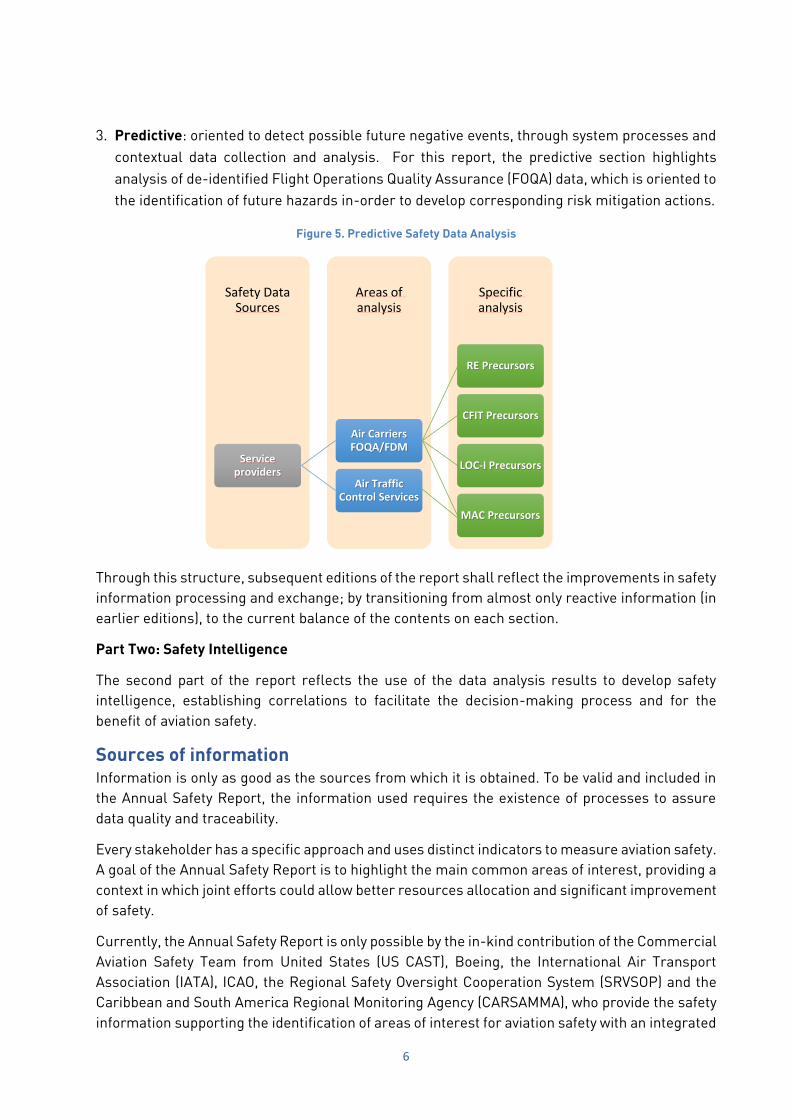
3. Predictive: oriented to detect possible future negative events, through system processes and
contextual data collection and analysis. For this report, the predictive section highlights
analysis of de-identified Flight Operations Quality Assurance (FOQA) data, which is oriented to
the identification of future hazards in-order to develop corresponding risk mitigation actions.
Figure 5. Predictive Safety Data Analysis
Through this structure, subsequent editions of the report shall reflect the improvements in safety
information processing and exchange; by transitioning from almost only reactive information (in
earlier editions), to the current balance of the contents on each section.
Part Two: Safety Intelligence
The second part of the report reflects the use of the data analysis results to develop safety
intelligence, establishing correlations to facilitate the decision-making process and for the
benefit of aviation safety.
Sources of information
Information is only as good as the sources from which it is obtained. To be valid and included in
the Annual Safety Report, the information used requires the existence of processes to assure
data quality and traceability.
Every stakeholder has a specific approach and uses distinct indicators to measure aviation safety.
A goal of the Annual Safety Report is to highlight the main common areas of interest, providing a
context in which joint efforts could allow better resources allocation and significant improvement
of safety.
Currently, the Annual Safety Report is only possible by the in-kind contribution of the Commercial
Aviation Safety Team from United States (US CAST), Boeing, the International Air Transport
Association (IATA), ICAO, the Regional Safety Oversight Cooperation System (SRVSOP) and the
Caribbean and South America Regional Monitoring Agency (CARSAMMA), who provide the safety
information supporting the identification of areas of interest for aviation safety with an integrated
Specific analysis
Areas of analysis
Safety Data Sources
Service providers
Air Carriers FOQA/FDM
RE Precursors
CFIT Precursors
LOC-I Precursors
MAC Precursors
Air Traffic Control Services

7
view. Other stakeholders are invited to contribute to aviation safety by providing useful
information for the Annual Safety Report, or by participating in the RASG-PA, its work groups and
committees.
Interacting with the Annual Safety Report As mentioned previously, the Annual Safety Report is intended to show the behavior of aviation
safety at a regional level, with a consolidated perspective amongst the stakeholders.
Users of the Annual Safety Report are invited to apply the proposed methodology; to establish a
starting point or a mechanism to improve safety data management by consolidating relevant
information from different sources, and by deepening the analysis of the exposed areas, to be
more representative of their specific reality and context.
8
Part One: Safety information
1. Reactive Safety Information Using the reactive methodology, this section is intended to assist with comprehending the
behavior of Safety in the Pan American Region, based upon the analysis of accidents and
incidents, according to the data provided by the US CAST, Boeing, IATA and ICAO.
It is important to note that each stakeholder captures a specific portion of data and develops
metrics applicable to particular areas of interest. The Annual Safety Report challenge is to
identify and apply the data to allow for a cross-sectional understanding of safety, thus
overcoming individual limitations. To develop the metrics in this report, commercial aviation
accidents data, gathered and processed by the different stakeholders was considered, according
to the following criterions.
ICAO data on accidents, serious incidents and incidents occurred during scheduled
commercial air transport operations, involving aircraft with maximum takeoff mass above
5,700 kg, classified by State of Occurrence. The analyzed time frame was 2009-2018.
Accidents occurred from 2009 to 2018 resulting in hull losses and/or onboard fatalities
involving western built aircraft during part 121 or equivalent operations (greater than 9
seats or greater than 7,500 pounds of cargo capacity), classified by the State of Operator,
provided by the US CAST.
IOSA results and accidents involving fixed-wing aircraft over 5,700 kg with jet or turboprop
propulsion engaged in commercial operations, in the time period 2013-2018, provided by
IATA.
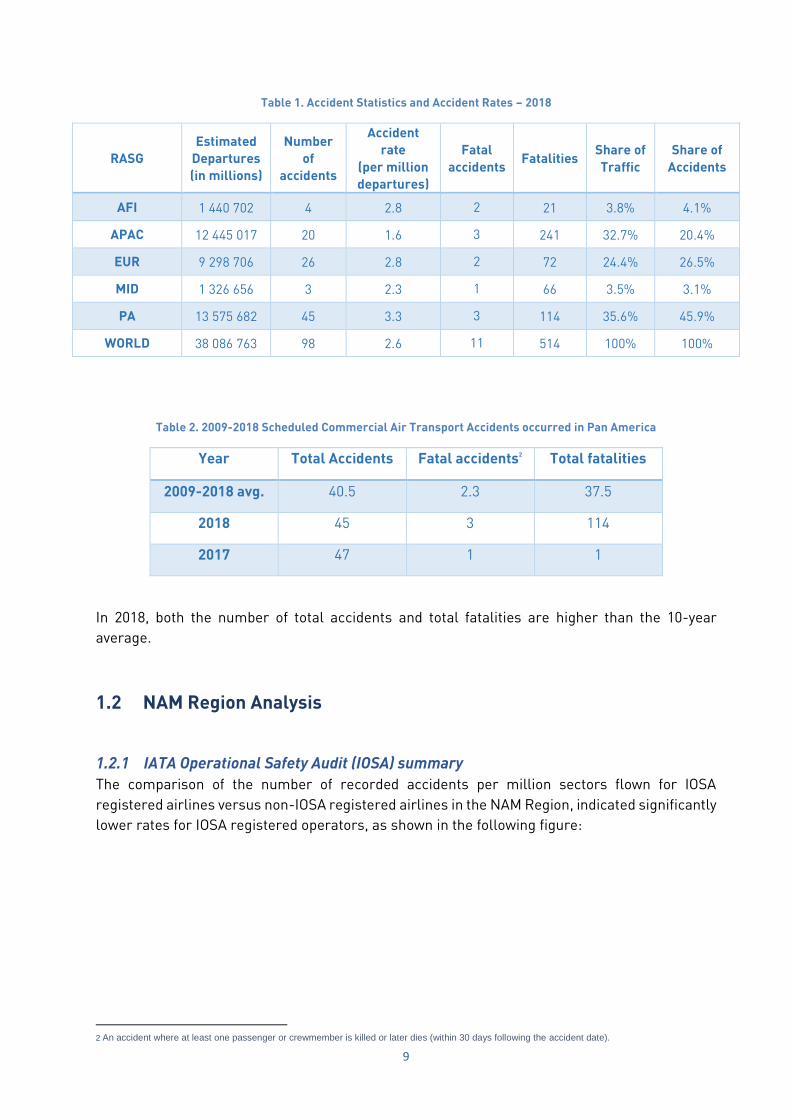
1.1 Pan American accident statistics and rates According to ICAO data, 45 accidents during regular commercial air transport operations,
involving aircraft above 5,700 kilograms occurred in Pan America, 3 of those accidents resulted
in fatalities.
The distribution of 2018 global accidents, fatal accidents and fatalities by RASGs (Regional
Aviation Safety Groups) is shown in table 1. Also, table 2 shows the specific numbers for the Pan
American Region.
9
Table 1. Accident Statistics and Accident Rates – 2018
RASG
Estimated
Departures
(in millions)
Number
of
accidents
Accident
rate
(per million
departures)
Fatal
accidents Fatalities
Share of
Traffic
Share of
Accidents
AFI 1 440 702 4 2.8 2 21 3.8% 4.1%
APAC 12 445 017 20 1.6 3 241 32.7% 20.4%
EUR 9 298 706 26 2.8 2 72 24.4% 26.5%
MID 1 326 656 3 2.3 1 66 3.5% 3.1%
PA 13 575 682 45 3.3 3 114 35.6% 45.9%
WORLD 38 086 763 98 2.6 11 514 100% 100%
Table 2. 2009-2018 Scheduled Commercial Air Transport Accidents occurred in Pan America
Year Total Accidents Fatal accidents2 Total fatalities
2009-2018 avg. 40.5 2.3 37.5
2018 45 3 114
2017 47 1 1
In 2018, both the number of total accidents and total fatalities are higher than the 10-year
average.
1.2 NAM Region Analysis
1.2.1 IATA Operational Safety Audit (IOSA) summary
The comparison of the number of recorded accidents per million sectors flown for IOSA
registered airlines versus non-IOSA registered airlines in the NAM Region, indicated significantly
lower rates for IOSA registered operators, as shown in the following figure:
2 An accident where at least one passenger or crewmember is killed or later dies (within 30 days following the accident date).
10
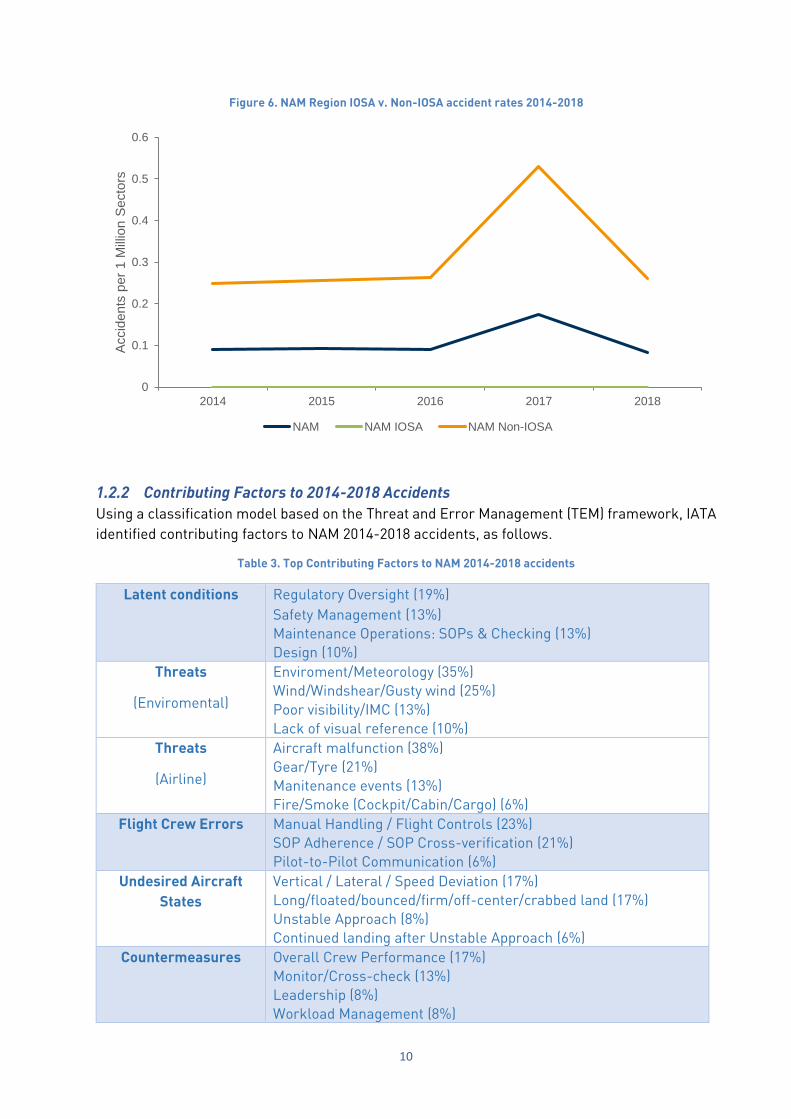
Figure 6. NAM Region IOSA v. Non-IOSA accident rates 2014-2018
1.2.2 Contributing Factors to 2014-2018 Accidents
Using a classification model based on the Threat and Error Management (TEM) framework, IATA
identified contributing factors to NAM 2014-2018 accidents, as follows.
Table 3. Top Contributing Factors to NAM 2014-2018 accidents
Latent conditions Regulatory Oversight (19%)
Safety Management (13%)
Maintenance Operations: SOPs & Checking (13%)
Design (10%)
Threats
(Enviromental)
Enviroment/Meteorology (35%)
Wind/Windshear/Gusty wind (25%)
Poor visibility/IMC (13%)
Lack of visual reference (10%)
Threats
(Airline)
Aircraft malfunction (38%)
Gear/Tyre (21%)
Manitenance events (13%)
Fire/Smoke (Cockpit/Cabin/Cargo) (6%)
Flight Crew Errors Manual Handling / Flight Controls (23%)
SOP Adherence / SOP Cross-verification (21%)
Pilot-to-Pilot Communication (6%)
Undesired Aircraft
States
Vertical / Lateral / Speed Deviation (17%)
Long/floated/bounced/firm/off-center/crabbed land (17%)
Unstable Approach (8%)
Continued landing after Unstable Approach (6%)
Countermeasures Overall Crew Performance (17%)
Monitor/Cross-check (13%)
Leadership (8%)
Workload Management (8%)
0
0.1
0.2
0.3
0.4
0.5
0.6
2014 2015 2016 2017 2018
Accid
ents
per
1 M
illio
n S
ecto
rs
NAM NAM IOSA NAM Non-IOSA
11
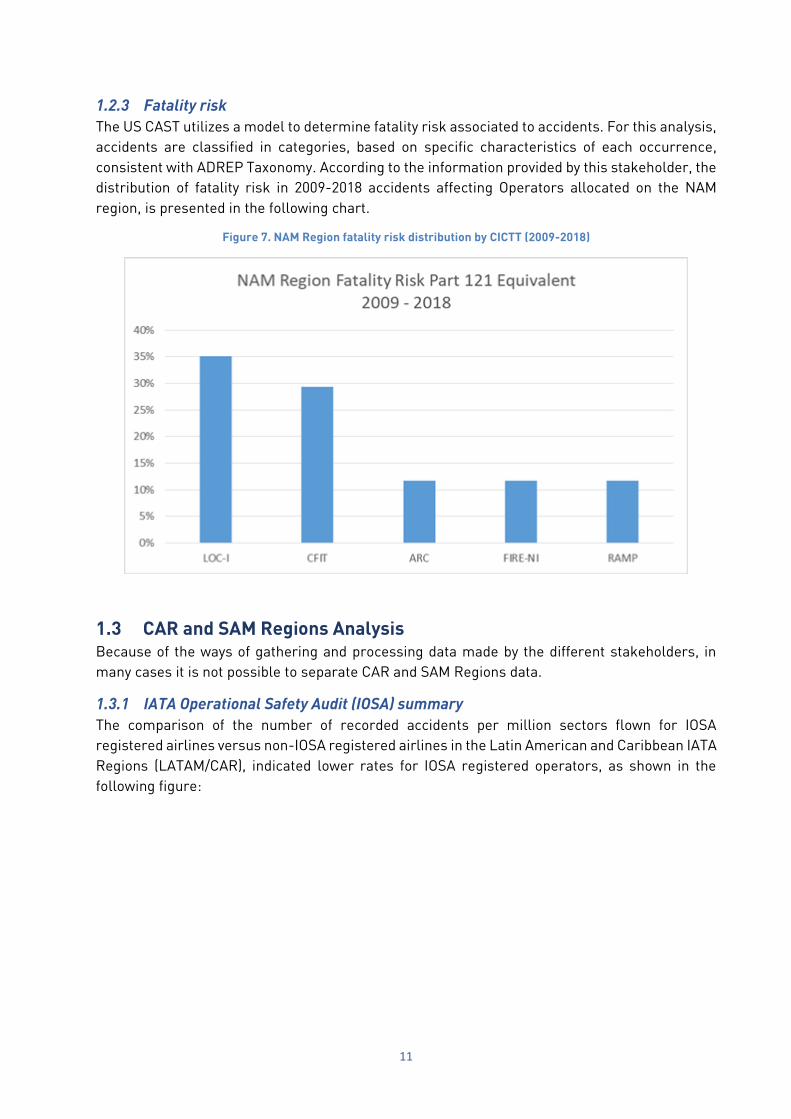
1.2.3 Fatality risk
The US CAST utilizes a model to determine fatality risk associated to accidents. For this analysis,
accidents are classified in categories, based on specific characteristics of each occurrence,
consistent with ADREP Taxonomy. According to the information provided by this stakeholder, the
distribution of fatality risk in 2009-2018 accidents affecting Operators allocated on the NAM
region, is presented in the following chart.
Figure 7. NAM Region fatality risk distribution by CICTT (2009-2018)
1.3 CAR and SAM Regions Analysis Because of the ways of gathering and processing data made by the different stakeholders, in
many cases it is not possible to separate CAR and SAM Regions data.
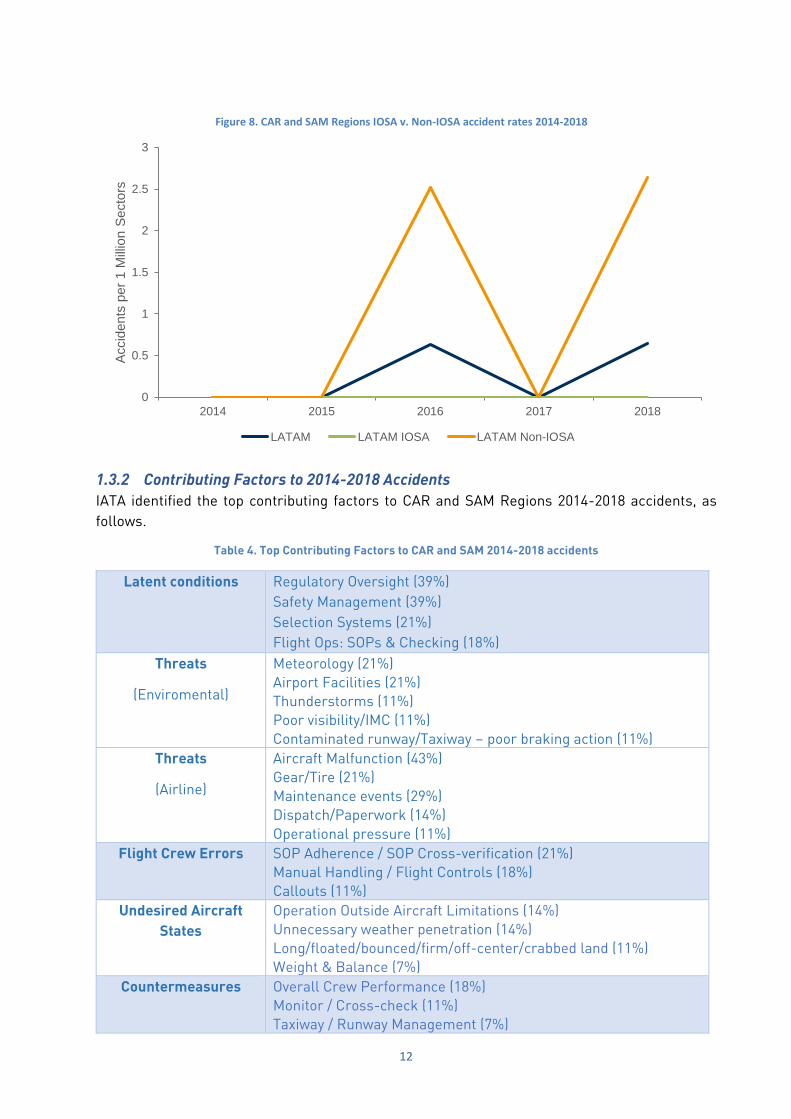
1.3.1 IATA Operational Safety Audit (IOSA) summary
The comparison of the number of recorded accidents per million sectors flown for IOSA
registered airlines versus non-IOSA registered airlines in the Latin American and Caribbean IATA
Regions (LATAM/CAR), indicated lower rates for IOSA registered operators, as shown in the
following figure:
12
1.3.2 Contributing Factors to 2014-2018 Accidents
IATA identified the top contributing factors to CAR and SAM Regions 2014-2018 accidents, as
follows.
Table 4. Top Contributing Factors to CAR and SAM 2014-2018 accidents
Latent conditions Regulatory Oversight (39%)
Safety Management (39%)
Selection Systems (21%)
Flight Ops: SOPs & Checking (18%)
Threats
(Enviromental)
Meteorology (21%)
Airport Facilities (21%)
Thunderstorms (11%)
Poor visibility/IMC (11%)
Contaminated runway/Taxiway – poor braking action (11%)
Threats
(Airline)
Aircraft Malfunction (43%)
Gear/Tire (21%)
Maintenance events (29%)
Dispatch/Paperwork (14%)
Operational pressure (11%)
Flight Crew Errors SOP Adherence / SOP Cross-verification (21%)
Manual Handling / Flight Controls (18%)
Callouts (11%)
Undesired Aircraft
States
Operation Outside Aircraft Limitations (14%)
Unnecessary weather penetration (14%)
Long/floated/bounced/firm/off-center/crabbed land (11%)
Weight & Balance (7%)
Countermeasures Overall Crew Performance (18%)
Monitor / Cross-check (11%)
Taxiway / Runway Management (7%)
0
0.5
1
1.5
2
2.5
3
2014 2015 2016 2017 2018
Accid
ents
per
1 M
illio
n S
ecto
rs
LATAM LATAM IOSA LATAM Non-IOSA
Figure 8. CAR and SAM Regions IOSA v. Non-IOSA accident rates 2014-2018
13
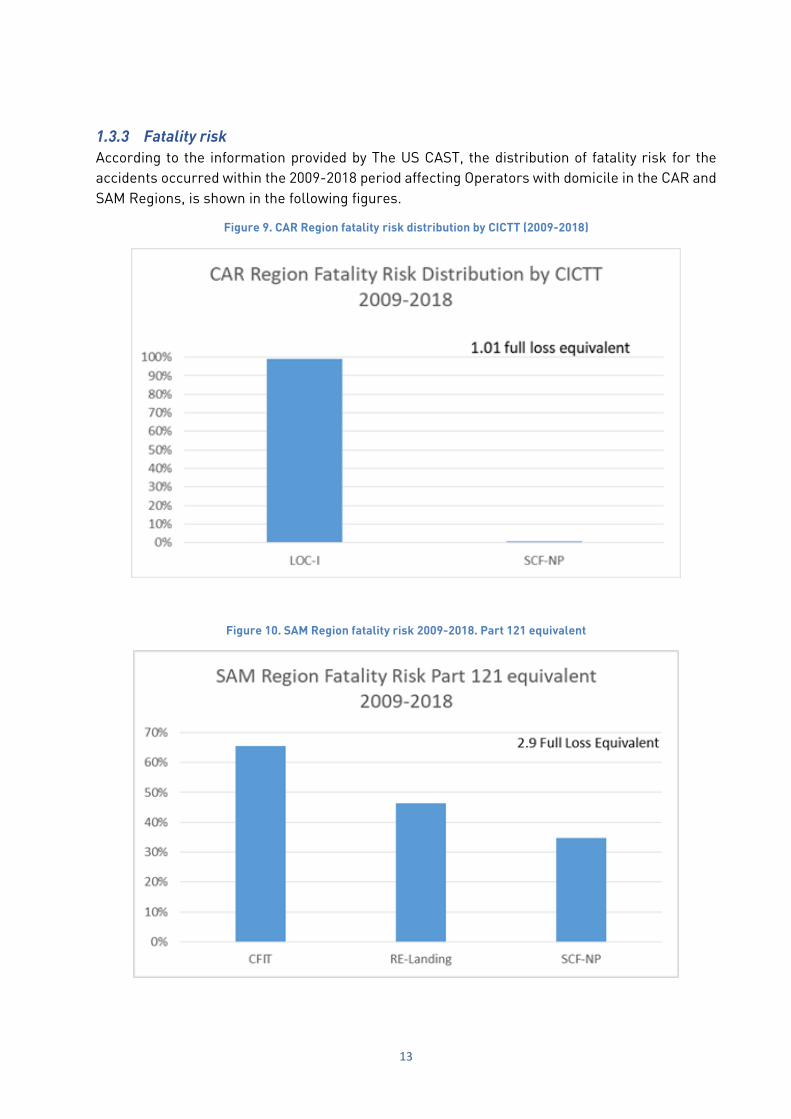
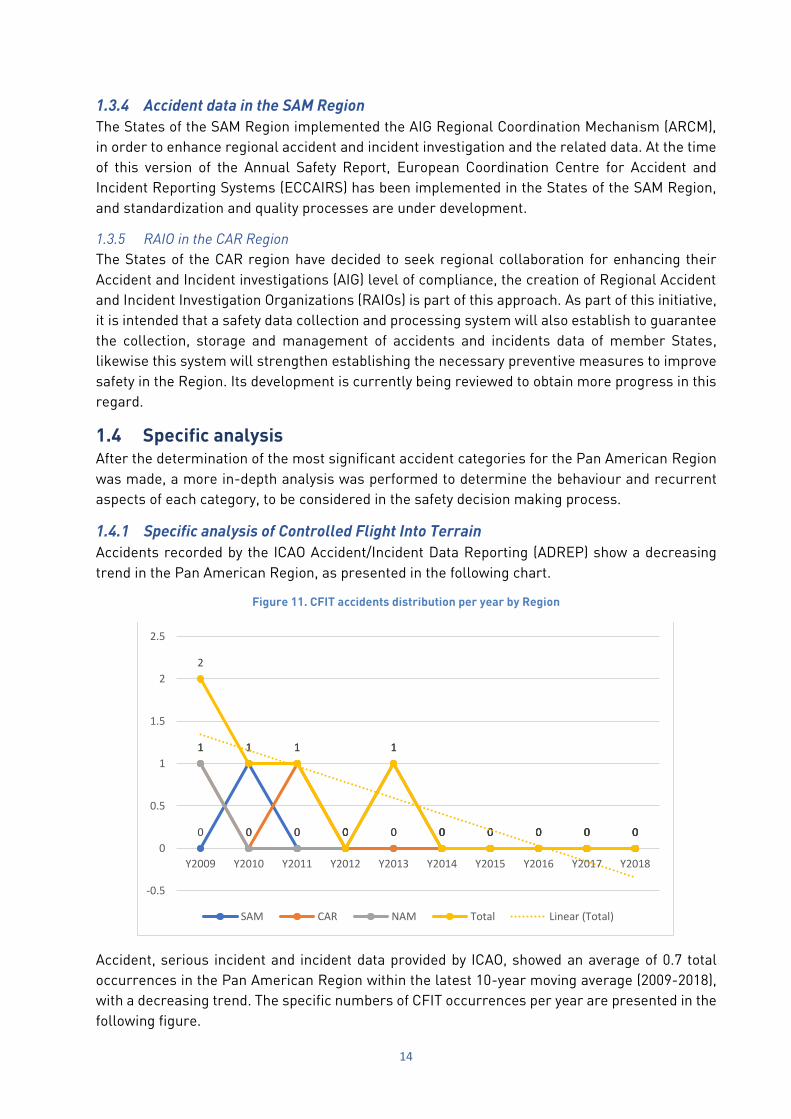
1.3.3 Fatality risk
According to the information provided by The US CAST, the distribution of fatality risk for the
accidents occurred within the 2009-2018 period affecting Operators with domicile in the CAR and
SAM Regions, is shown in the following figures.
Figure 9. CAR Region fatality risk distribution by CICTT (2009-2018)
Figure 10. SAM Region fatality risk 2009-2018. Part 121 equivalent
14
1.3.4 Accident data in the SAM Region
The States of the SAM Region implemented the AIG Regional Coordination Mechanism (ARCM),
in order to enhance regional accident and incident investigation and the related data. At the time
of this version of the Annual Safety Report, European Coordination Centre for Accident and
Incident Reporting Systems (ECCAIRS) has been implemented in the States of the SAM Region,
and standardization and quality processes are under development.
1.3.5 RAIO in the CAR Region
The States of the CAR region have decided to seek regional collaboration for enhancing their
Accident and Incident investigations (AIG) level of compliance, the creation of Regional Accident
and Incident Investigation Organizations (RAIOs) is part of this approach. As part of this initiative,
it is intended that a safety data collection and processing system will also establish to guarantee
the collection, storage and management of accidents and incidents data of member States,
likewise this system will strengthen establishing the necessary preventive measures to improve
safety in the Region. Its development is currently being reviewed to obtain more progress in this
regard.
1.4 Specific analysis After the determination of the most significant accident categories for the Pan American Region
was made, a more in-depth analysis was performed to determine the behaviour and recurrent
aspects of each category, to be considered in the safety decision making process.
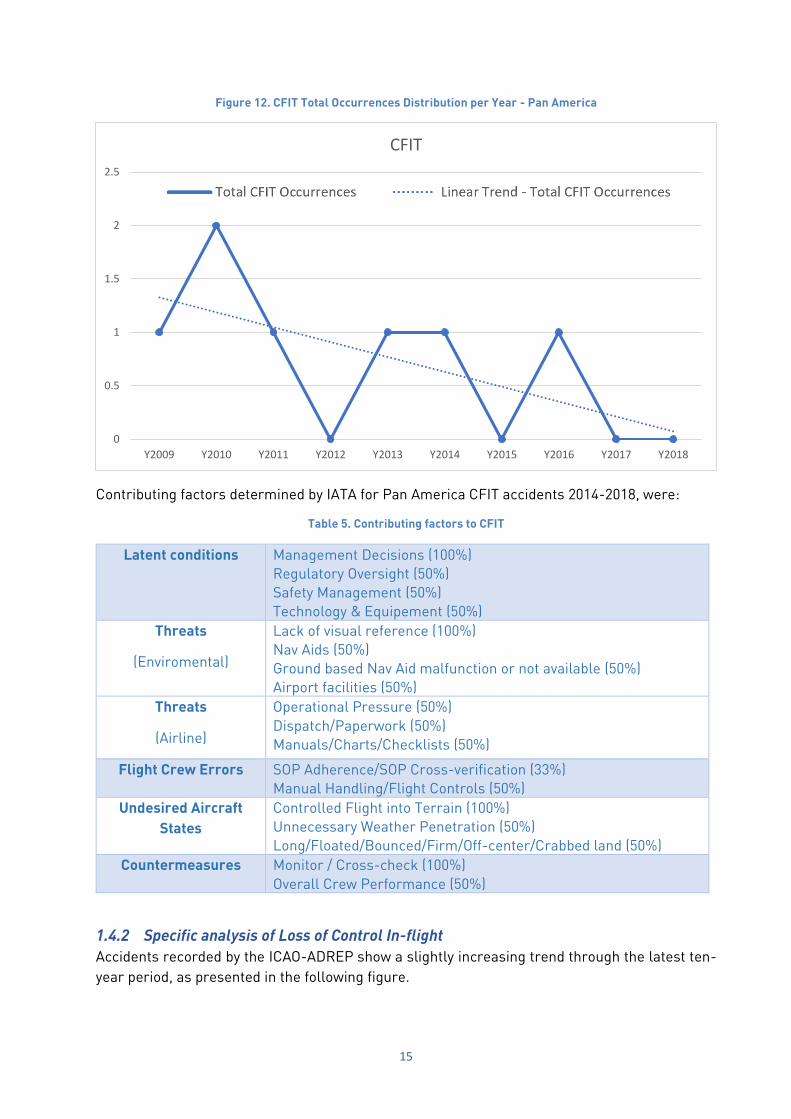
1.4.1 Specific analysis of Controlled Flight Into Terrain
Accidents recorded by the ICAO Accident/Incident Data Reporting (ADREP) show a decreasing
trend in the Pan American Region, as presented in the following chart.
Figure 11. CFIT accidents distribution per year by Region
Accident, serious incident and incident data provided by ICAO, showed an average of 0.7 total
occurrences in the Pan American Region within the latest 10-year moving average (2009-2018),
with a decreasing trend. The specific numbers of CFIT occurrences per year are presented in the
following figure.
0
1
0 0 0 0 0 0 0 0
1
0
1
0 0 0 0 0 0 0
1
0 0 0
1
0 0 0 0 0
2
1 1
0
1
0 0 0 0 0
-0.5
0
0.5
1
1.5
2
2.5
Y2009 Y2010 Y2011 Y2012 Y2013 Y2014 Y2015 Y2016 Y2017 Y2018
SAM CAR NAM Total Linear (Total)
15
Figure 12. CFIT Total Occurrences Distribution per Year - Pan America
Contributing factors determined by IATA for Pan America CFIT accidents 2014-2018, were:
Table 5. Contributing factors to CFIT
Latent conditions Management Decisions (100%)
Regulatory Oversight (50%)
Safety Management (50%)
Technology & Equipement (50%)
Threats
(Enviromental)
Lack of visual reference (100%)
Nav Aids (50%)
Ground based Nav Aid malfunction or not available (50%)
Airport facilities (50%)
Threats
(Airline)
Operational Pressure (50%)
Dispatch/Paperwork (50%)
Manuals/Charts/Checklists (50%)
Flight Crew Errors SOP Adherence/SOP Cross-verification (33%)
Manual Handling/Flight Controls (50%)
Undesired Aircraft
States
Controlled Flight into Terrain (100%)
Unnecessary Weather Penetration (50%)
Long/Floated/Bounced/Firm/Off-center/Crabbed land (50%)
Countermeasures Monitor / Cross-check (100%)
Overall Crew Performance (50%)
1.4.2 Specific analysis of Loss of Control In-flight
Accidents recorded by the ICAO-ADREP show a slightly increasing trend through the latest ten-
year period, as presented in the following figure.
0
0.5
1
1.5
2
2.5
Y2009 Y2010 Y2011 Y2012 Y2013 Y2014 Y2015 Y2016 Y2017 Y2018
CFIT
16
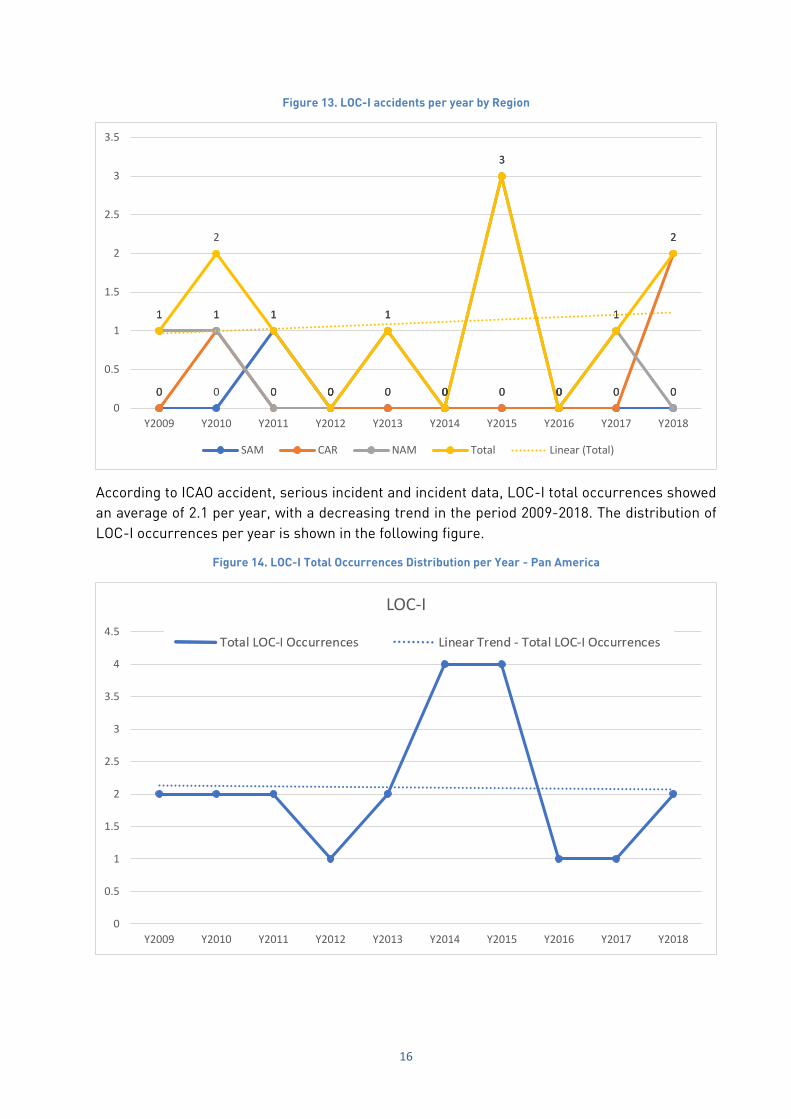
Figure 13. LOC-I accidents per year by Region
According to ICAO accident, serious incident and incident data, LOC-I total occurrences showed
an average of 2.1 per year, with a decreasing trend in the period 2009-2018. The distribution of
LOC-I occurrences per year is shown in the following figure.
Figure 14. LOC-I Total Occurrences Distribution per Year - Pan America
0 0
1
0 0 0 0 0 0 00
1
0 0 0 0 0 0 0
2
1 1
0 0
1
0
3
0
1
0
1
2
1
0
1
0
3
0
1
2
0
0.5
1
1.5
2
2.5
3
3.5
Y2009 Y2010 Y2011 Y2012 Y2013 Y2014 Y2015 Y2016 Y2017 Y2018
SAM CAR NAM Total Linear (Total)
0
0.5
1
1.5
2
2.5
3
3.5
4
4.5
Y2009 Y2010 Y2011 Y2012 Y2013 Y2014 Y2015 Y2016 Y2017 Y2018
LOC-I
17
Contributing factors determined for Pan America Loss of Control In-flight 2014-2018 accidents
by IATA were:
Table 6. Contributing factors to LOC-I
Latent conditions Regulatory Oversight (50%)
Safety Management (50%)
Selection Systems (33%)
Flight ops: Training Systems (33%)
Threats
(Enviromental)
Meteorology (33%)
Thunderstorms (17%)
Wind/Windshear/Gusty wind (17%)
Lack of visual Reference (17%)
Threats
(Airline)
Ground Events (17%)
Undesired Aircraft
States
Operation Outside Aircraft Limitations (33%)
Unnecessary Weather Penetration (17%)
Weight & Balance (17%)
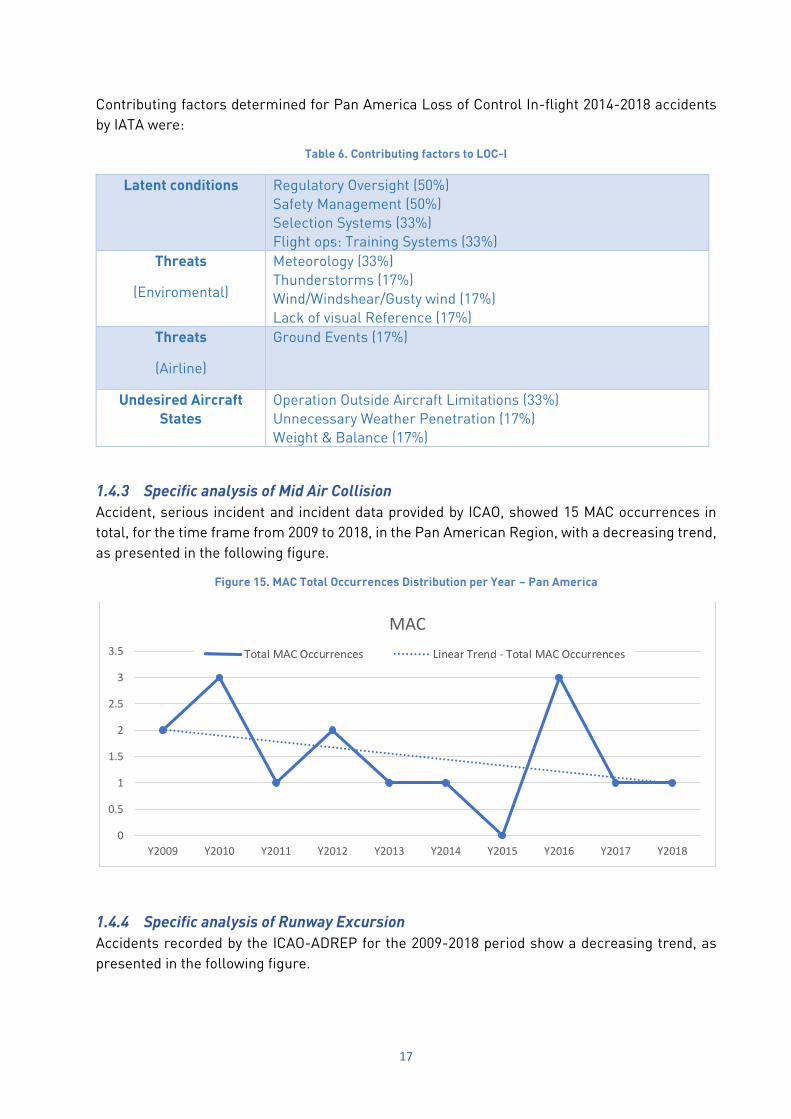
1.4.3 Specific analysis of Mid Air Collision
Accident, serious incident and incident data provided by ICAO, showed 15 MAC occurrences in
total, for the time frame from 2009 to 2018, in the Pan American Region, with a decreasing trend,
as presented in the following figure.
Figure 15. MAC Total Occurrences Distribution per Year – Pan America
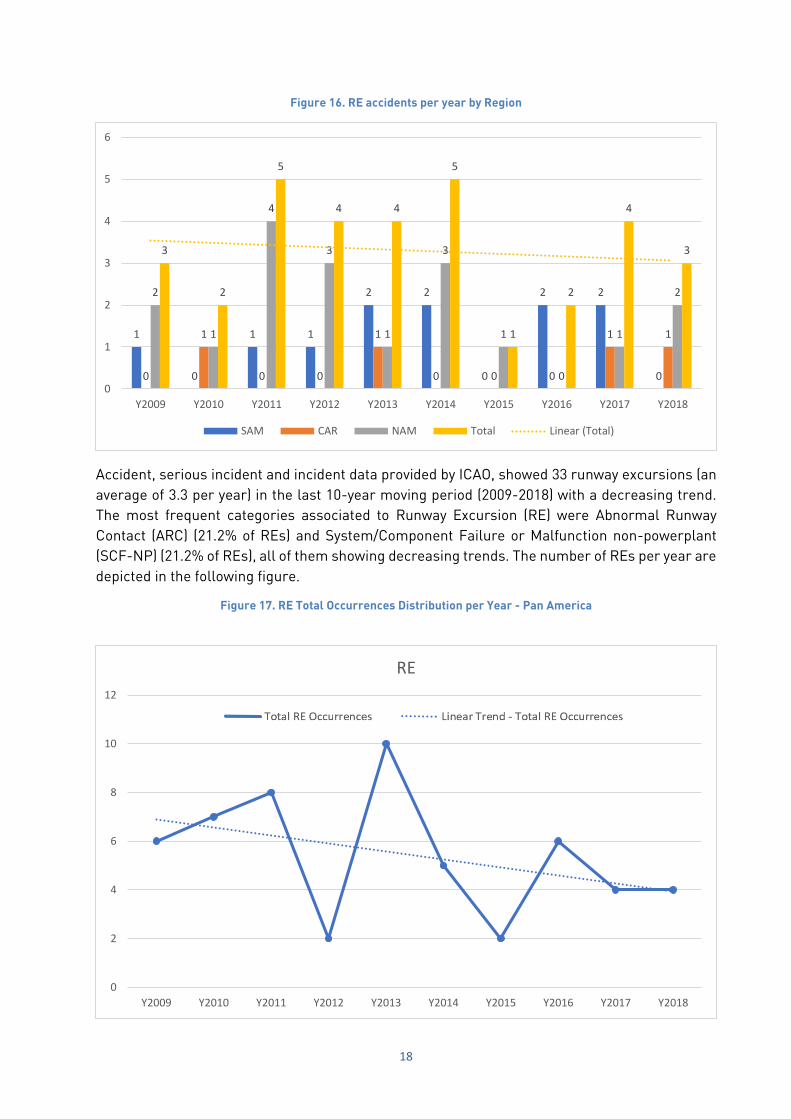
1.4.4 Specific analysis of Runway Excursion
Accidents recorded by the ICAO-ADREP for the 2009-2018 period show a decreasing trend, as
presented in the following figure.
0
0.5
1
1.5
2
2.5
3
3.5
Y2009 Y2010 Y2011 Y2012 Y2013 Y2014 Y2015 Y2016 Y2017 Y2018
MAC
18
Figure 16. RE accidents per year by Region
Accident, serious incident and incident data provided by ICAO, showed 33 runway excursions (an
average of 3.3 per year) in the last 10-year moving period (2009-2018) with a decreasing trend.
The most frequent categories associated to Runway Excursion (RE) were Abnormal Runway
Contact (ARC) (21.2% of REs) and System/Component Failure or Malfunction non-powerplant
(SCF-NP) (21.2% of REs), all of them showing decreasing trends. The number of REs per year are
depicted in the following figure.
Figure 17. RE Total Occurrences Distribution per Year - Pan America
1
0
1 1
2 2
0
2 2
00
1
0 0
1
0 0 0
1 1
2
1
4
3
1
3
1
0
1
2
3
2
5
4 4
5
1
2
4
3
0
1
2
3
4
5
6
Y2009 Y2010 Y2011 Y2012 Y2013 Y2014 Y2015 Y2016 Y2017 Y2018
SAM CAR NAM Total Linear (Total)
0
2
4
6
8
10
12
Y2009 Y2010 Y2011 Y2012 Y2013 Y2014 Y2015 Y2016 Y2017 Y2018
RE

19
Contributing factors for Pan America Runway Excursions 2014-2018 determined by IATA are
shown in the following table:
Table 7. Contributing factors to RE
Latent conditions Safety Management (18%)
Regulatory Oversight (12%)
Design (12%)
Threats
(Enviromental)
Meteorology (29%)
Wind/Windshear/Gusty wind (24%)
Airport Facilities (24%)
Contaminated runway/Taxiway – poor braking action (18%)
Threats
(Airline)
Aircraft Malfunction (41%)
Contained Engine Failure/Powerplant Malfunction (6%)
Maintenance events (6%)
Hydraulic System Failure (6%)
Flight Crew Errors SOP Adherence / SOP Cross-verification (29%)
Manual Handling / Flight Controls (18%)
Callouts (12%)
Undesired Aircraft
States
Long/floated/bounced/firm/off-center/crabbed land (29%)
Brakes / Thrust Reversers / Ground Spoilers (12%)
Rejected Take-off after V1 (12%)
Engine (12%)
Countermeasures Overall Crew Performance (24%)
Monitor/Cross check (12%)
Taxiway/Runway Management (12%)
20
2. Proactive Safety Information This section is intended to apply the proactive methodology to show the risk exposure level in
aviation, based upon the results of safety oversight and management processes.
At the level of the States, ICAO USOAP-CMA results and data from the Data Exchange Program
of Ramp Safety Inspections (IDISR program) were used to establish the current context for safety.
At the level of the operator, IOSA results were used by IATA to identify latent conditions that
eventually could affect safety.
2.1 Proactive information at the level of the States
2.1.1 ICAO Universal Safety Oversight Audit Programme - Continuous Monitoring
Approach (USOAP-CMA)
It is essential to ICAO that States establish, maintain and improve the eight critical elements of
an effective safety oversight system, as well as the eight technical areas.
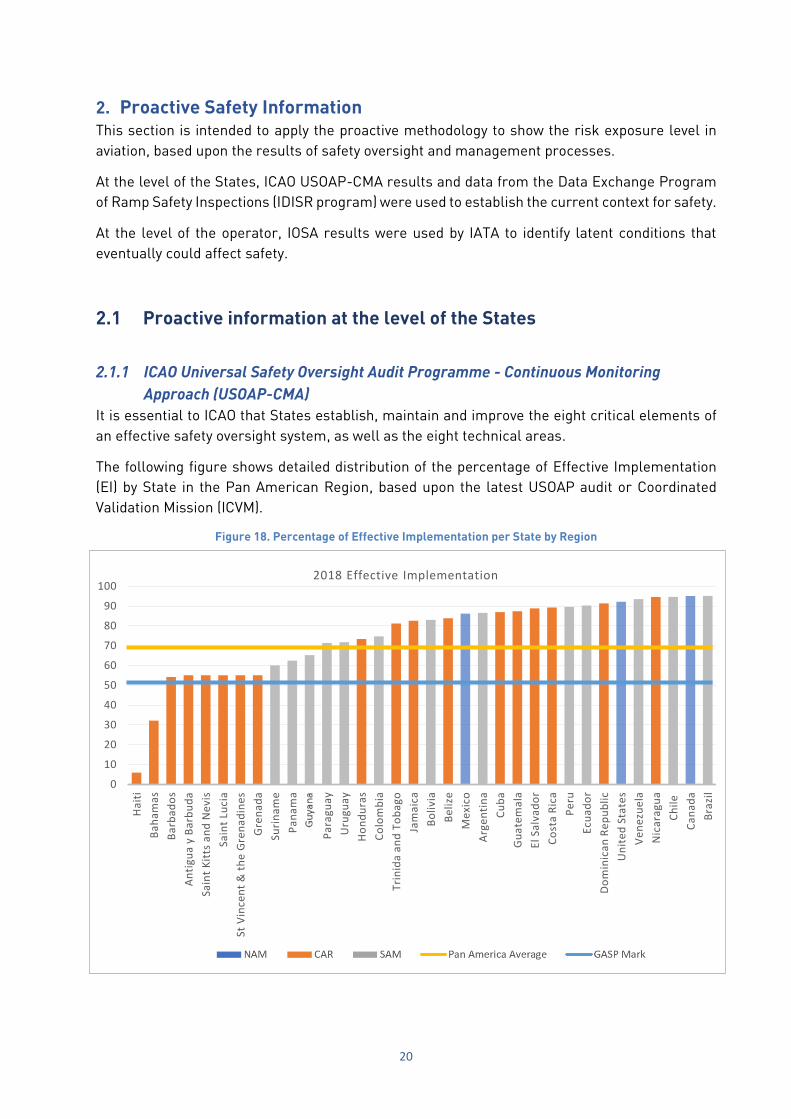
The following figure shows detailed distribution of the percentage of Effective Implementation
(EI) by State in the Pan American Region, based upon the latest USOAP audit or Coordinated
Validation Mission (ICVM).
Figure 18. Percentage of Effective Implementation per State by Region
0
10
20
30
40
50
60
70
80
90
100
Ha
iti
Ba
ha
ma
s
Ba
rba
do
s
An
tigu
a y
Ba
rbu
da
Sain
t K
itts
an
d N
evi
s
Sain
t Lu
cia
St V
ince
nt
& t
he
Gre
na
din
es
Gre
na
da
Suri
na
me
Pa
na
ma
Gu
aya
na
Pa
ragu
ay
Uru
gua
y
Ho
nd
ura
s
Co
lom
bia
Tri
nid
a a
nd
To
ba
go
Jam
aic
a
Bo
livi
a
Be
lize
Me
xico
Arg
en
tin
a
Cu
ba
Gu
ate
ma
la
El S
alv
ad
or
Co
sta
Ric
a
Pe
ru
Ecu
ad
or
Do
min
ica
n R
ep
ub
lic
Un
ite
d S
tate
s
Ve
ne
zue
la
Nic
ara
gua
Ch
ile
Ca
na
da
Bra
zil
2018 Effective Implementation
21
According to the previous chart, the average effective implementation in the Pan American
Region increased from 65.2% in 2010 to 74.59% as of December 2018, achieved as result of the
audits conducted on 31 States in the Region. According to ICAO Global Aviation Safety Plan
(GASP), States should target their efforts to increase and maintain effective implementation
above 60%.
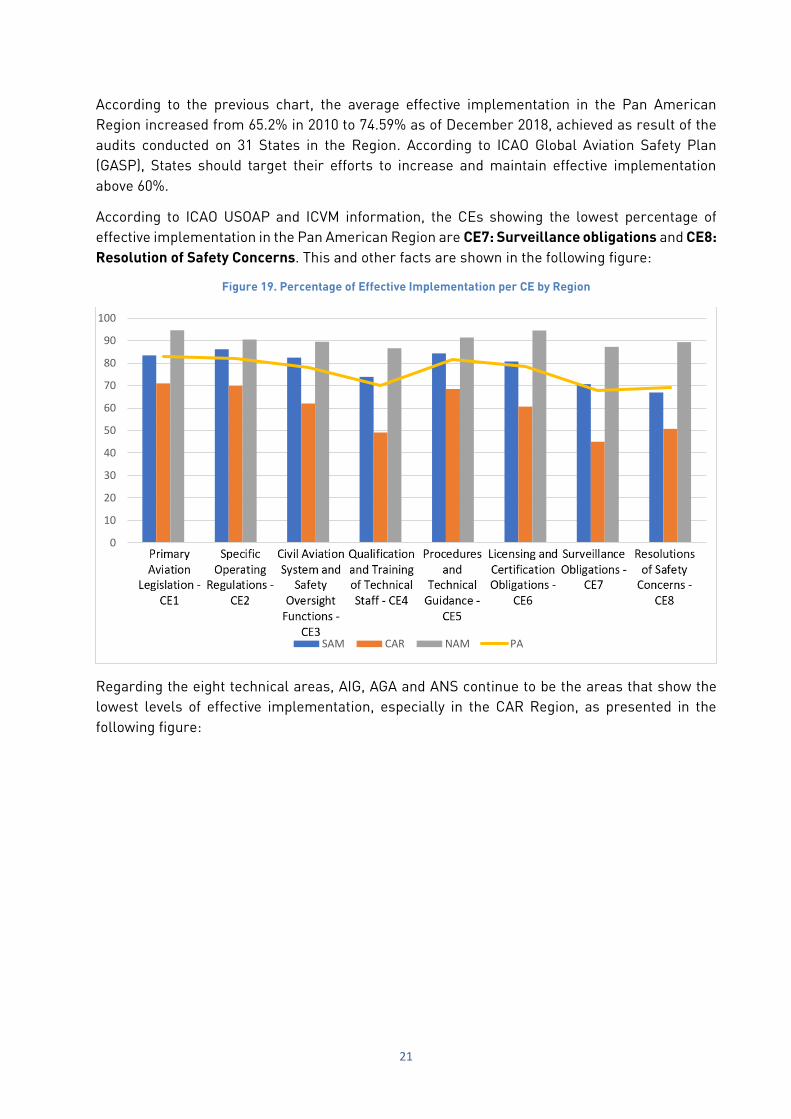
According to ICAO USOAP and ICVM information, the CEs showing the lowest percentage of
effective implementation in the Pan American Region are CE7: Surveillance obligations and CE8:
Resolution of Safety Concerns. This and other facts are shown in the following figure:
Figure 19. Percentage of Effective Implementation per CE by Region
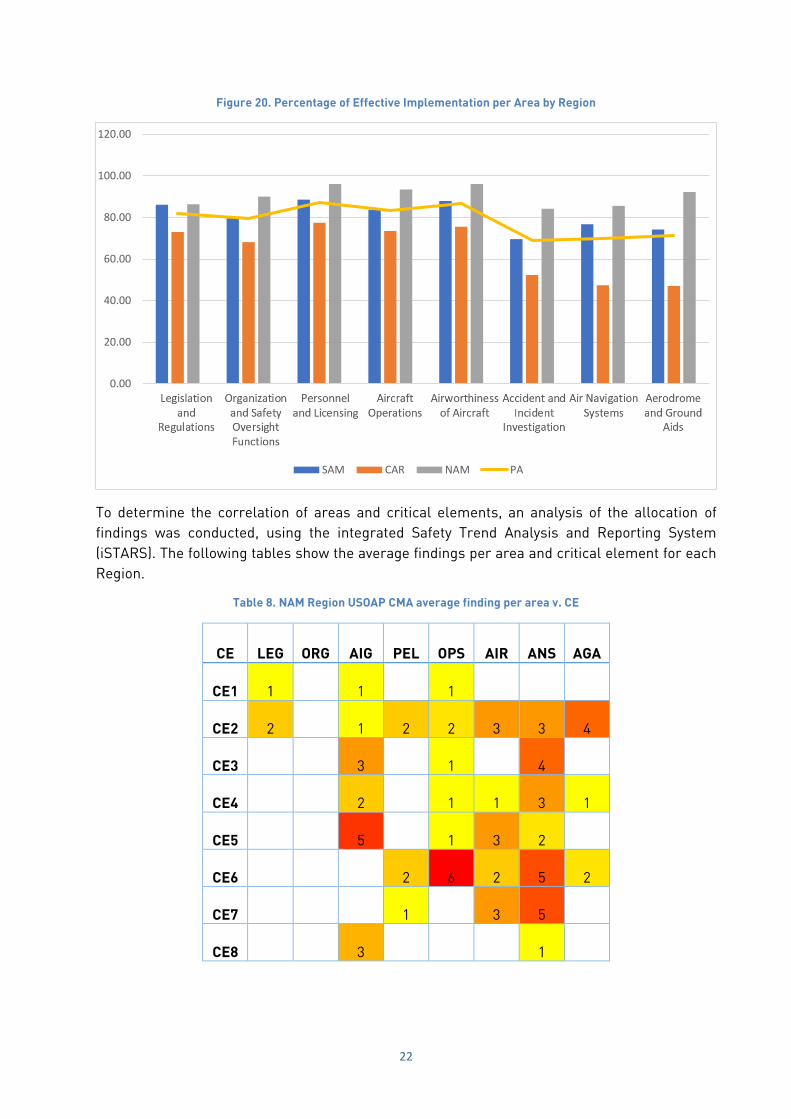
Regarding the eight technical areas, AIG, AGA and ANS continue to be the areas that show the
lowest levels of effective implementation, especially in the CAR Region, as presented in the
following figure:
0
10
20
30
40
50
60
70
80
90
100
CE-1 CE-2 CE-3 CE-4 CE-5 CE-6 CE-7 CE-8
SAM CAR NAM PA
22
Figure 20. Percentage of Effective Implementation per Area by Region
To determine the correlation of areas and critical elements, an analysis of the allocation of
findings was conducted, using the integrated Safety Trend Analysis and Reporting System
(iSTARS). The following tables show the average findings per area and critical element for each
Region.
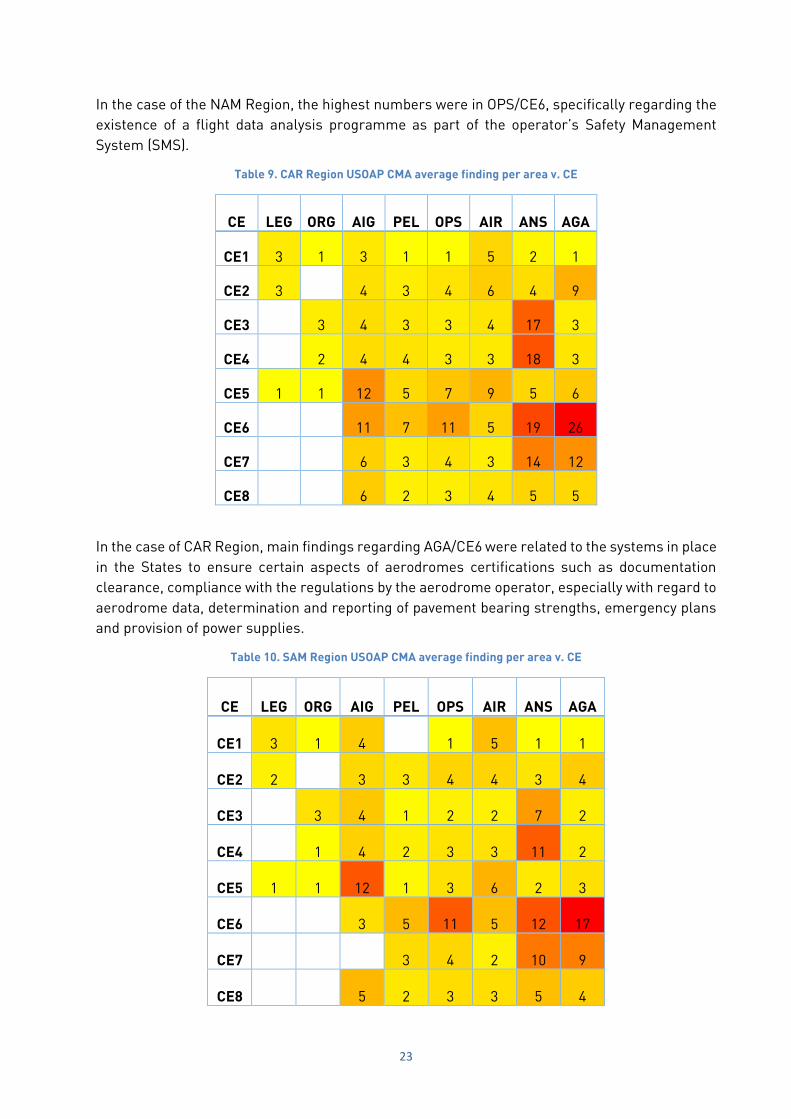
Table 8. NAM Region USOAP CMA average finding per area v. CE
CE LEG ORG AIG PEL OPS AIR ANS AGA
CE1 1 1 1
CE2 2 1 2 2 3 3 4
CE3 3 1 4
CE4 2 1 1 3 1
CE5 5 1 3 2
CE6 2 6 2 5 2
CE7 1 3 5
CE8 3 1
0.00
20.00
40.00
60.00
80.00
100.00
120.00
LEG ORG PEL OPS AIR AIG ANS AGA
SAM CAR NAM PA
23
In the case of the NAM Region, the highest numbers were in OPS/CE6, specifically regarding the
existence of a flight data analysis programme as part of the operator’s Safety Management
System (SMS).
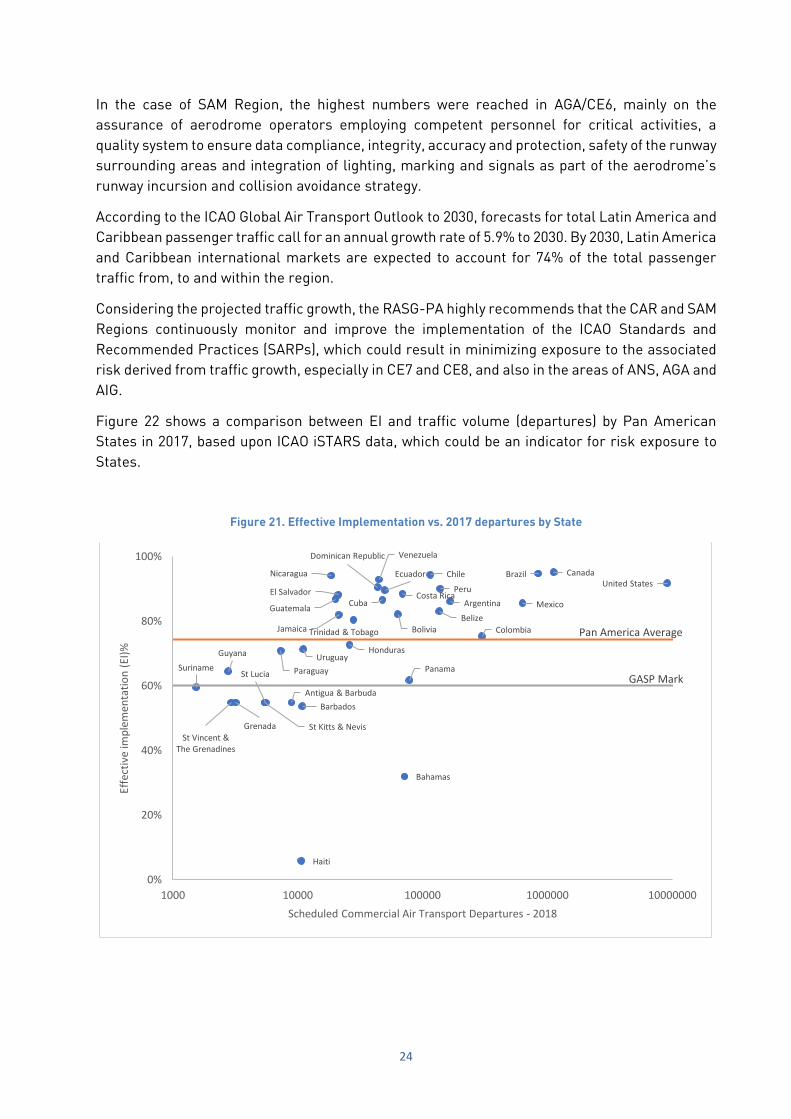
Table 9. CAR Region USOAP CMA average finding per area v. CE
CE LEG ORG AIG PEL OPS AIR ANS AGA
CE1 3 1 3 1 1 5 2 1
CE2 3 4 3 4 6 4 9
CE3 3 4 3 3 4 17 3
CE4 2 4 4 3 3 18 3
CE5 1 1 12 5 7 9 5 6
CE6 11 7 11 5 19 26
CE7 6 3 4 3 14 12
CE8 6 2 3 4 5 5
In the case of CAR Region, main findings regarding AGA/CE6 were related to the systems in place
in the States to ensure certain aspects of aerodromes certifications such as documentation
clearance, compliance with the regulations by the aerodrome operator, especially with regard to
aerodrome data, determination and reporting of pavement bearing strengths, emergency plans
and provision of power supplies.
Table 10. SAM Region USOAP CMA average finding per area v. CE
CE LEG ORG AIG PEL OPS AIR ANS AGA
CE1 3 1 4 1 5 1 1
CE2 2 3 3 4 4 3 4
CE3 3 4 1 2 2 7 2
CE4 1 4 2 3 3 11 2
CE5 1 1 12 1 3 6 2 3
CE6 3 5 11 5 12 17
CE7 3 4 2 10 9
CE8 5 2 3 3 5 4
24
In the case of SAM Region, the highest numbers were reached in AGA/CE6, mainly on the
assurance of aerodrome operators employing competent personnel for critical activities, a
quality system to ensure data compliance, integrity, accuracy and protection, safety of the runway
surrounding areas and integration of lighting, marking and signals as part of the aerodrome’s
runway incursion and collision avoidance strategy.
According to the ICAO Global Air Transport Outlook to 2030, forecasts for total Latin America and
Caribbean passenger traffic call for an annual growth rate of 5.9% to 2030. By 2030, Latin America
and Caribbean international markets are expected to account for 74% of the total passenger
traffic from, to and within the region.
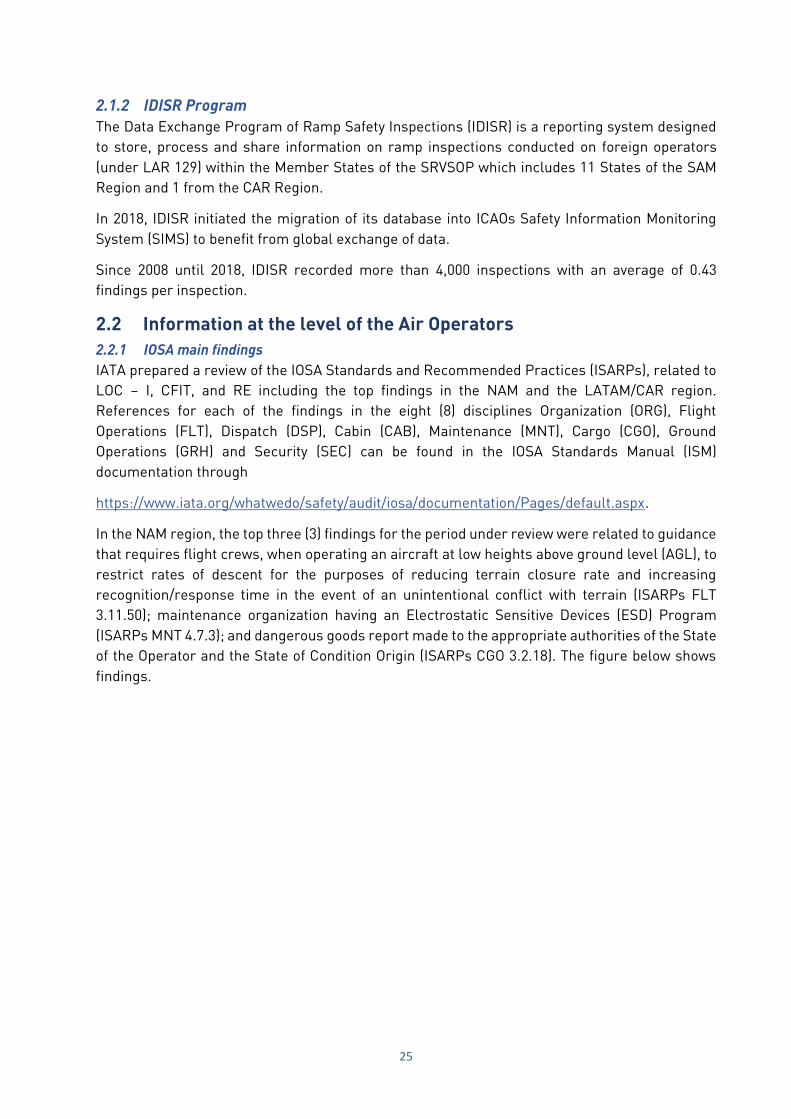
Considering the projected traffic growth, the RASG-PA highly recommends that the CAR and SAM
Regions continuously monitor and improve the implementation of the ICAO Standards and
Recommended Practices (SARPs), which could result in minimizing exposure to the associated
risk derived from traffic growth, especially in CE7 and CE8, and also in the areas of ANS, AGA and
AIG.
Figure 22 shows a comparison between EI and traffic volume (departures) by Pan American
States in 2017, based upon ICAO iSTARS data, which could be an indicator for risk exposure to
States.
Figure 21. Effective Implementation vs. 2017 departures by State
Antigua & Barbuda
Argentina
Bahamas
Barbados
BelizeBolivia
Brazil CanadaChile
Colombia
Costa RicaCuba
Dominican Republic
Ecuador
El Salvador
Grenada
Guatemala
Guyana
Haiti
Honduras
Jamaica
Mexico
Nicaragua
PanamaParaguay
Peru
St Kitts & Nevis
St Lucia
St Vincent & The Grenadines
Suriname
Trinidad & Tobago
United States
Uruguay
Venezuela
Pan America Average
GASP Mark
0%
20%
40%
60%
80%
100%
1000 10000 100000 1000000 10000000
Effe
ctiv
e im
ple
men
tati
on
(EI
)%
Scheduled Commercial Air Transport Departures - 2018
25
2.1.2 IDISR Program
The Data Exchange Program of Ramp Safety Inspections (IDISR) is a reporting system designed
to store, process and share information on ramp inspections conducted on foreign operators
(under LAR 129) within the Member States of the SRVSOP which includes 11 States of the SAM
Region and 1 from the CAR Region.
In 2018, IDISR initiated the migration of its database into ICAOs Safety Information Monitoring
System (SIMS) to benefit from global exchange of data.
Since 2008 until 2018, IDISR recorded more than 4,000 inspections with an average of 0.43
findings per inspection.
2.2 Information at the level of the Air Operators
2.2.1 IOSA main findings
IATA prepared a review of the IOSA Standards and Recommended Practices (ISARPs), related to
LOC – I, CFIT, and RE including the top findings in the NAM and the LATAM/CAR region.
References for each of the findings in the eight (8) disciplines Organization (ORG), Flight
Operations (FLT), Dispatch (DSP), Cabin (CAB), Maintenance (MNT), Cargo (CGO), Ground
Operations (GRH) and Security (SEC) can be found in the IOSA Standards Manual (ISM)
documentation through
https://www.iata.org/whatwedo/safety/audit/iosa/documentation/Pages/default.aspx.
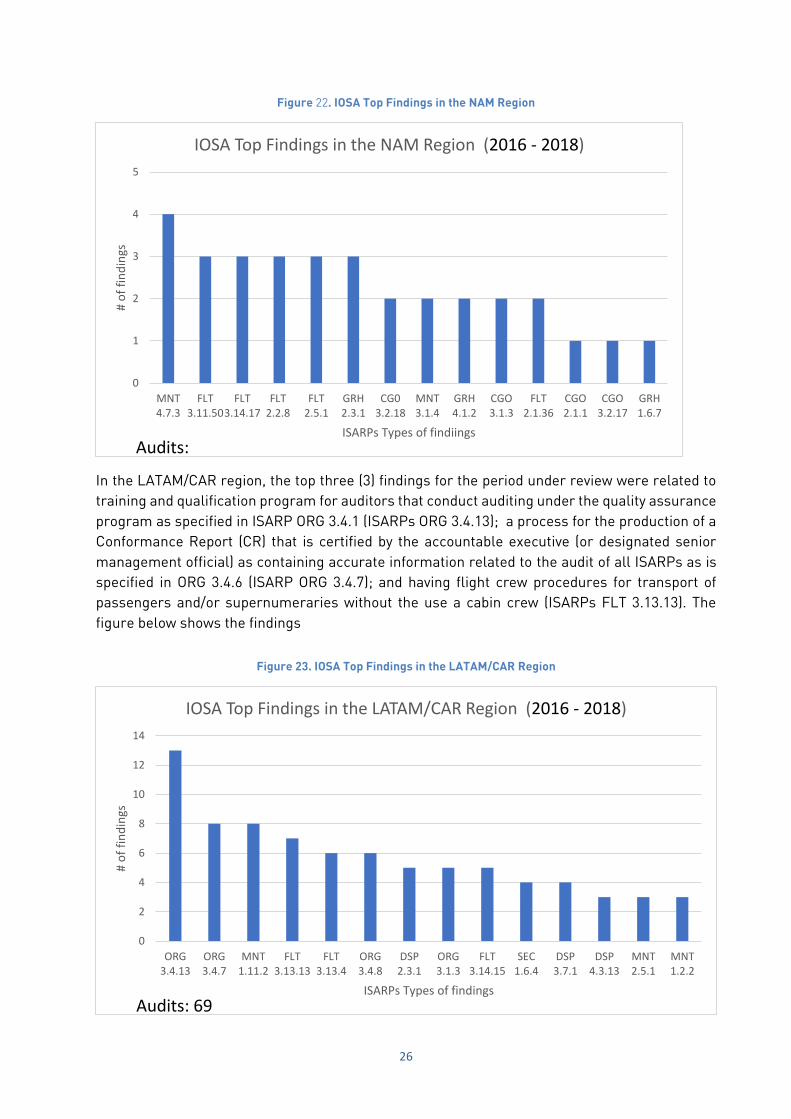
In the NAM region, the top three (3) findings for the period under review were related to guidance
that requires flight crews, when operating an aircraft at low heights above ground level (AGL), to
restrict rates of descent for the purposes of reducing terrain closure rate and increasing
recognition/response time in the event of an unintentional conflict with terrain (ISARPs FLT
3.11.50); maintenance organization having an Electrostatic Sensitive Devices (ESD) Program
(ISARPs MNT 4.7.3); and dangerous goods report made to the appropriate authorities of the State
of the Operator and the State of Condition Origin (ISARPs CGO 3.2.18). The figure below shows
findings.
26
Figure 22. IOSA Top Findings in the NAM Region
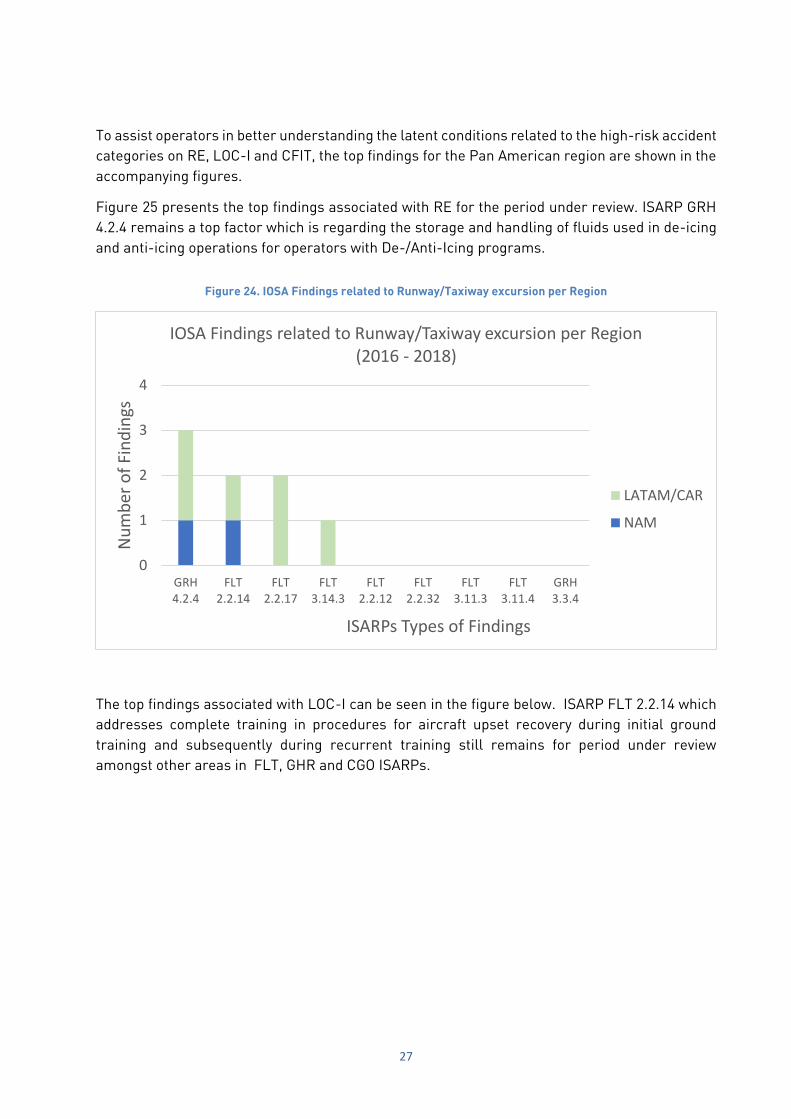
In the LATAM/CAR region, the top three (3) findings for the period under review were related to
training and qualification program for auditors that conduct auditing under the quality assurance
program as specified in ISARP ORG 3.4.1 (ISARPs ORG 3.4.13); a process for the production of a
Conformance Report (CR) that is certified by the accountable executive (or designated senior
management official) as containing accurate information related to the audit of all ISARPs as is
specified in ORG 3.4.6 (ISARP ORG 3.4.7); and having flight crew procedures for transport of
passengers and/or supernumeraries without the use a cabin crew (ISARPs FLT 3.13.13). The
figure below shows the findings
Figure 23. IOSA Top Findings in the LATAM/CAR Region
0
1
2
3
4
5
MNT4.7.3
FLT3.11.50
FLT3.14.17
FLT2.2.8
FLT2.5.1
GRH2.3.1
CG03.2.18
MNT3.1.4
GRH4.1.2
CGO3.1.3
FLT2.1.36
CGO2.1.1
CGO3.2.17
GRH1.6.7
# o
f fi
nd
ings
ISARPs Types of findiings
IOSA Top Findings in the NAM Region (2016 - 2018)
Audits:
0
2
4
6
8
10
12
14
ORG3.4.13
ORG3.4.7
MNT1.11.2
FLT3.13.13
FLT3.13.4
ORG3.4.8
DSP2.3.1
ORG3.1.3
FLT3.14.15
SEC1.6.4
DSP3.7.1
DSP4.3.13
MNT2.5.1
MNT1.2.2
# o
f fi
nd
ings
ISARPs Types of findings
IOSA Top Findings in the LATAM/CAR Region (2016 - 2018)
Audits: 69
27
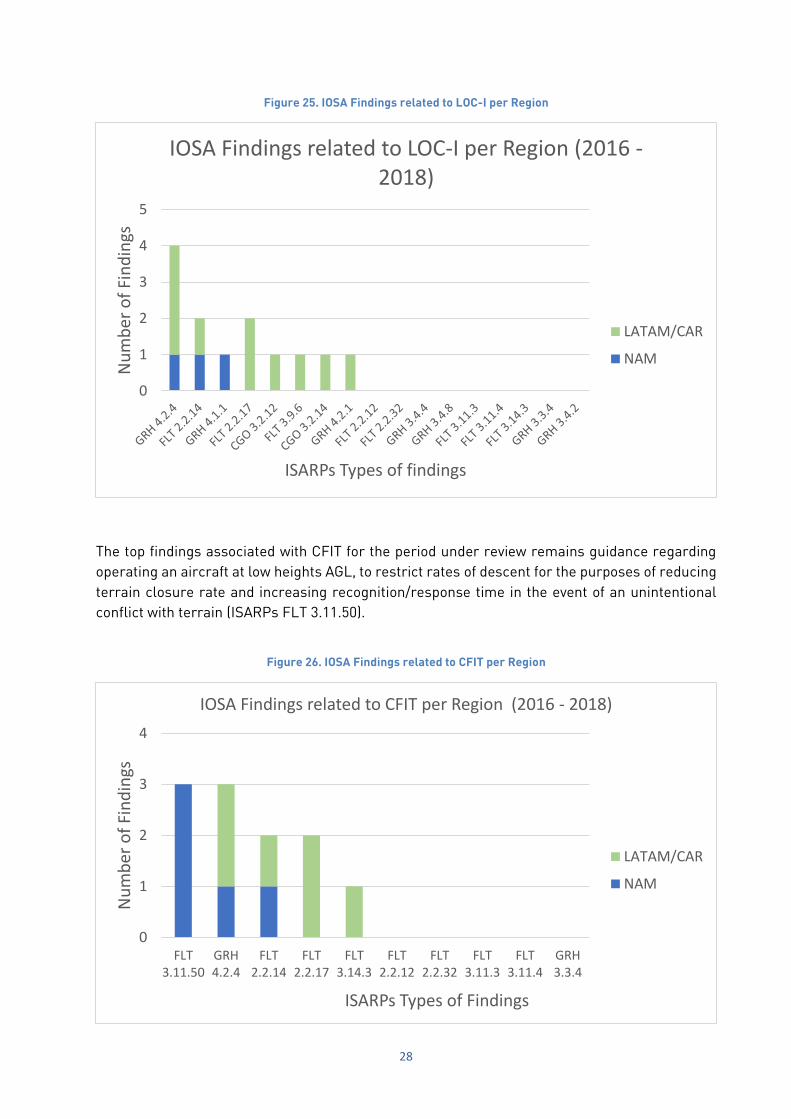
To assist operators in better understanding the latent conditions related to the high-risk accident
categories on RE, LOC-I and CFIT, the top findings for the Pan American region are shown in the
accompanying figures.
Figure 25 presents the top findings associated with RE for the period under review. ISARP GRH
4.2.4 remains a top factor which is regarding the storage and handling of fluids used in de-icing
and anti-icing operations for operators with De-/Anti-Icing programs.
Figure 24. IOSA Findings related to Runway/Taxiway excursion per Region
The top findings associated with LOC-I can be seen in the figure below. ISARP FLT 2.2.14 which
addresses complete training in procedures for aircraft upset recovery during initial ground
training and subsequently during recurrent training still remains for period under review
amongst other areas in FLT, GHR and CGO ISARPs.
0
1
2
3
4
GRH4.2.4
FLT2.2.14
FLT2.2.17
FLT3.14.3
FLT2.2.12
FLT2.2.32
FLT3.11.3
FLT3.11.4
GRH3.3.4
Nu
mb
er o
f Fi
nd
ings
ISARPs Types of Findings
IOSA Findings related to Runway/Taxiway excursion per Region (2016 - 2018)
LATAM/CAR
NAM
28
Figure 25. IOSA Findings related to LOC-I per Region
The top findings associated with CFIT for the period under review remains guidance regarding
operating an aircraft at low heights AGL, to restrict rates of descent for the purposes of reducing
terrain closure rate and increasing recognition/response time in the event of an unintentional
conflict with terrain (ISARPs FLT 3.11.50).
Figure 26. IOSA Findings related to CFIT per Region
0
1
2
3
4
5
Nu
mb
er o
f Fi
nd
ings
ISARPs Types of findings
IOSA Findings related to LOC-I per Region (2016 -2018)
LATAM/CAR
NAM
0
1
2
3
4
FLT3.11.50
GRH4.2.4
FLT2.2.14
FLT2.2.17
FLT3.14.3
FLT2.2.12
FLT2.2.32
FLT3.11.3
FLT3.11.4
GRH3.3.4
Nu
mb
er o
f Fi
nd
ings
ISARPs Types of Findings
IOSA Findings related to CFIT per Region (2016 - 2018)
LATAM/CAR
NAM
29
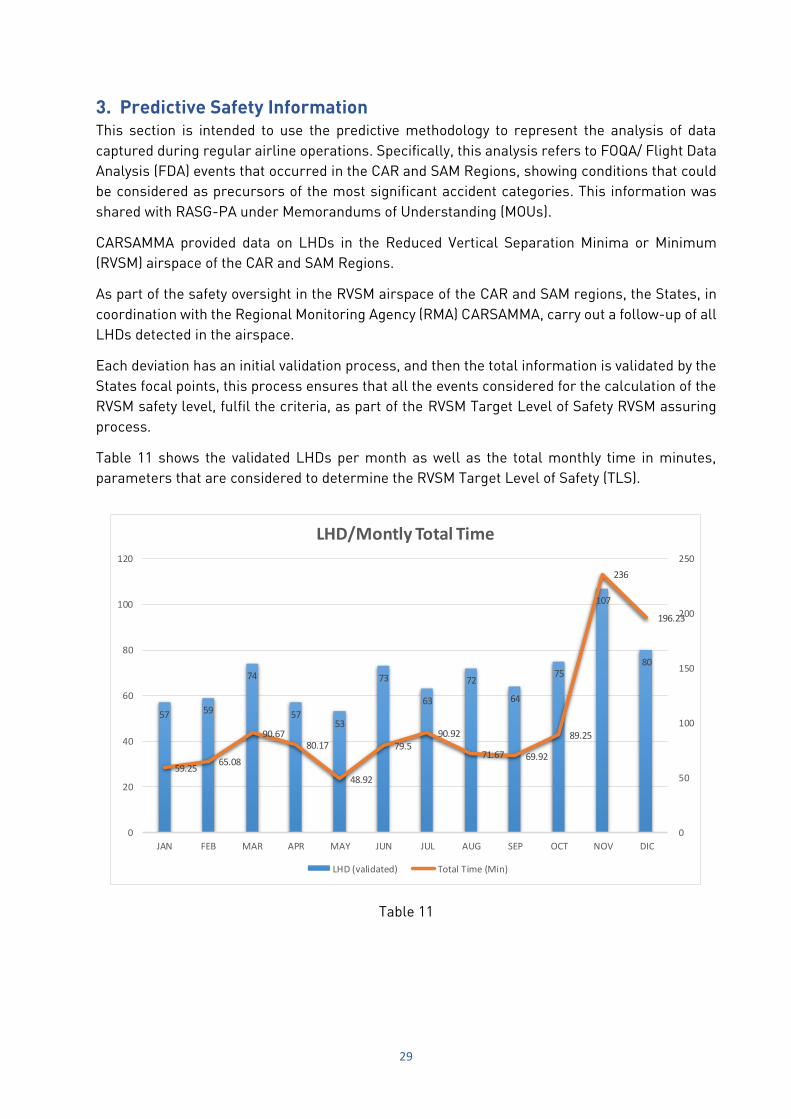
3. Predictive Safety Information This section is intended to use the predictive methodology to represent the analysis of data
captured during regular airline operations. Specifically, this analysis refers to FOQA/ Flight Data
Analysis (FDA) events that occurred in the CAR and SAM Regions, showing conditions that could
be considered as precursors of the most significant accident categories. This information was
shared with RASG-PA under Memorandums of Understanding (MOUs).
CARSAMMA provided data on LHDs in the Reduced Vertical Separation Minima or Minimum
(RVSM) airspace of the CAR and SAM Regions.
As part of the safety oversight in the RVSM airspace of the CAR and SAM regions, the States, in
coordination with the Regional Monitoring Agency (RMA) CARSAMMA, carry out a follow-up of all
LHDs detected in the airspace.
Each deviation has an initial validation process, and then the total information is validated by the
States focal points, this process ensures that all the events considered for the calculation of the
RVSM safety level, fulfil the criteria, as part of the RVSM Target Level of Safety RVSM assuring
process.
Table 11 shows the validated LHDs per month as well as the total monthly time in minutes,
parameters that are considered to determine the RVSM Target Level of Safety (TLS).
Table 11
57 59
74
5753
73
63
72
64
75
107
80
59.2565.08
90.6780.17
48.92
79.590.92
71.67 69.92
89.25
236
196.23
0
50
100
150
200
250
0
20
40
60
80
100
120
JAN FEB MAR APR MAY JUN JUL AUG SEP OCT NOV DIC
LHD/Montly Total Time
LHD (validated) Total Time (Min)
30
The Collision Risk Methodology (CRM) has been used for the safety assessment of RVSM airspace
in the Caribbean and South America. The estimated values of the CRM on operational and
technical error result from processing all LHDs received and validated in 2018.
The sample data to estimate the pass frequency and physical parameters, as well as the
dynamics of a typical aircraft for the assessment of vertical collision risk were collected from 1
December to 31 December 2018 from the 34 CAR/SAM Flight Information Regions (FIRs) with a
total of 1,038,066 hours of flights.
The risk values (table 12) were estimated based on the FIR values obtained after processing all
data received, compiled and processed in the specific CRM software:
a) The estimated total risk for the assessed FIRs is 2.32 x 10⁻⁹ under the TLS (5.0 x 10-
9).
b) The technical risk of the CAR/SAM FIRs meets the TLS value, not exceeding 2.5 x 10⁻⁹
fatal accidents per flight our due to loss of the standard vertical separation of 1,000 ft and
all other causes.
c) The operational risk does not have a predefined limit, in accordance with ICAO Doc 9574.
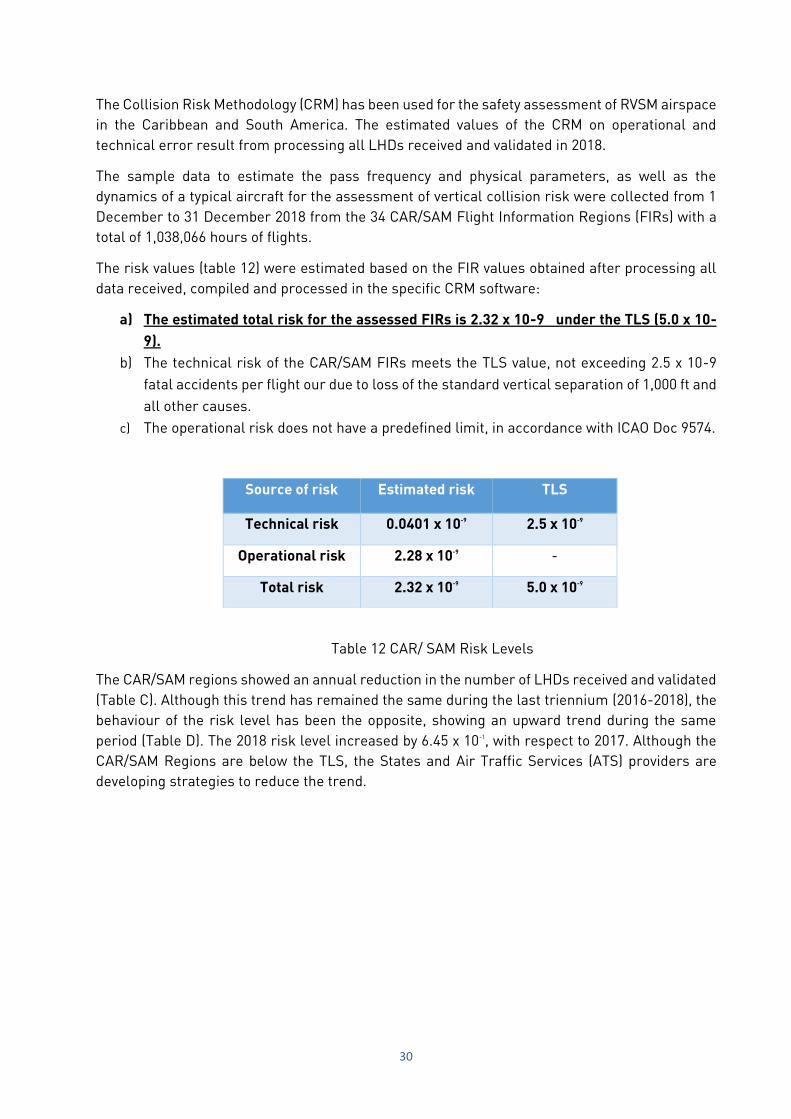
Table 12 CAR/ SAM Risk Levels
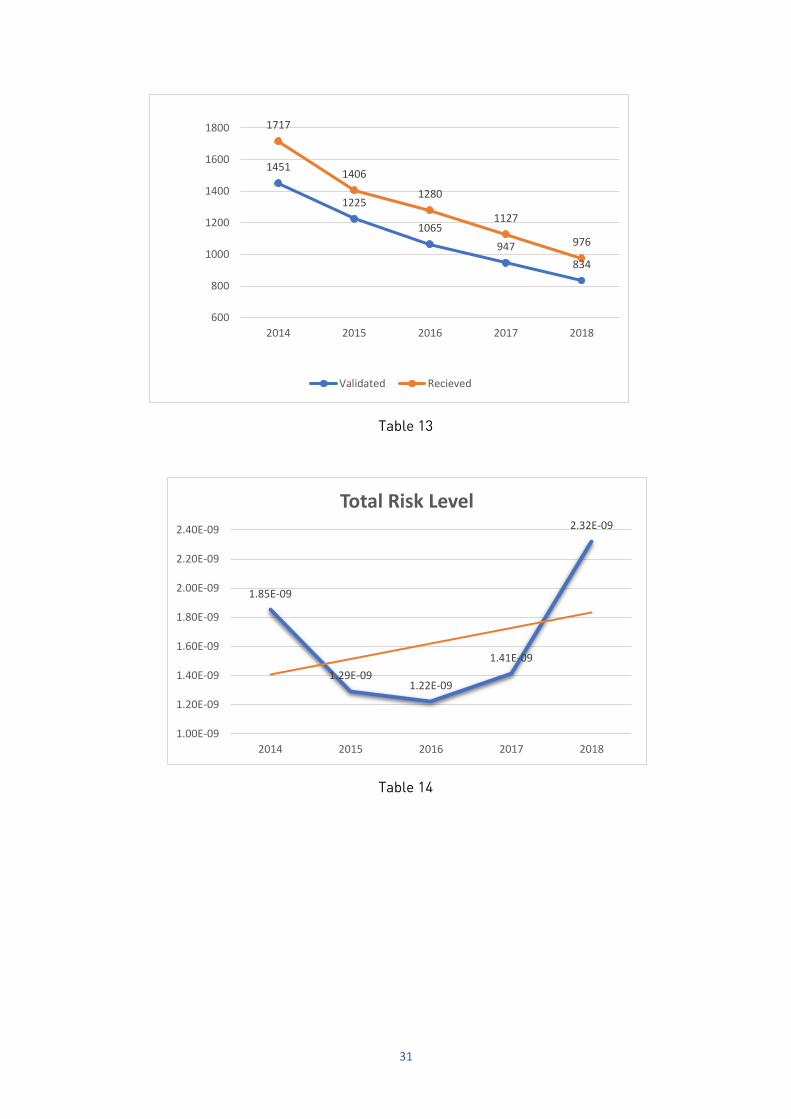
The CAR/SAM regions showed an annual reduction in the number of LHDs received and validated
(Table C). Although this trend has remained the same during the last triennium (2016-2018), the
behaviour of the risk level has been the opposite, showing an upward trend during the same
period (Table D). The 2018 risk level increased by 6.45 x 10⁻¹, with respect to 2017. Although the
CAR/SAM Regions are below the TLS, the States and Air Traffic Services (ATS) providers are
developing strategies to reduce the trend.
Source of risk Estimated risk TLS
Technical risk 0.0401 x 10⁻⁹ 2.5 x 10⁻⁹
Operational risk 2.28 x 10⁻⁹ -
Total risk 2.32 x 10⁻⁹ 5.0 x 10⁻⁹
31
Table 13
Table 14
1451
1225
1065
947
834
1717
1406
1280
1127
976
600
800
1000
1200
1400
1600
1800
2014 2015 2016 2017 2018
Validated Recieved
1.85E-09
1.29E-091.22E-09
1.41E-09
2.32E-09
1.00E-09
1.20E-09
1.40E-09
1.60E-09
1.80E-09
2.00E-09
2.20E-09
2.40E-09
2014 2015 2016 2017 2018
Total Risk Level
32
Part Two: Safety Intelligence This part of the report is intended to present correlations and conclusions based on the
information contained of the first part.
To be consistent with the structure of the first part of the report, conclusions are described
according to the safety analysis methodologies, and correlations are the result of the cross-
sectional analysis, thus increasing the frame of reference for safety decision making process.
1. Conclusions based on reactive information Accidents in the Pan American Region showed a decreasing trend across the ten years
period analyzed (2009-2018). In 2018 the accident rate was higher than world average.
The analyzed reactive data also highlighted Loss of Control In-flight (LOC-I), Runway
Excursion (RE), Controlled Flight into Terrain (CFIT) continue to be the top categories of
interest in the Pan American Region. All high risk categories but LOC-I showed
decreasing trends across the period.
As it relates to the Mid-Air Collision (MAC) category, serious incident and incident data,
showed a decreasing trend.
Management decisions, Safety management, and Regulatory oversight were identified as
the top latent conditions for 2013-2018 accidents in the both North America and Latin
America & Caribbean regions.
2. Conclusions based on proactive information Since the last edition of this report, the level of effective implementation (EI) of the critical
elements (CEs) below 60% decreased from 10 to 8 States in the Pan American Region
according to the ICAO Universal Safety Oversight Audit Programme - Continuous
Monitoring Approach (USOAP-CMA). Also, the regional effective implementation average
improved in more than 9% since 2010.
USOAP findings on Licensing and Certification obligations (CE 6) in the operations area
(OPS) was the most common in NAM Region, related to the existence of a flight data
analysis as part of SMS operators. In the case of CAR and SAM Regions, main findings
were also related to CE 6, but specifically in the Aerodrome and Ground Aids (AGA) area,
related to aerodrome data, runway safety areas and runway incursion and collision
avoidance.
Furthermore, due to the forecasted increase in regional traffic, risk exposure of the
States in the CAR and SAM Regions could be affected due to low EI in Air Navigation
Systems (ANS) including Aerodromes and Ground Aids (AGA) areas.
3. Conclusions based on predictive information Information on LHDs captured in the CAR and SAM Regions during 2017 and 2018,
determined the technical error satisfies the goal of not exceeding 2.5 x 10⁻⁹ fatal accidents
per flight hour due to loss of standard vertical separation of 1,000 ft and all other causes.
33
4. Safety Intelligence correlations Accidents and their precursors, presented in the first part of the report, provide a
perspective of the entire aviation system about safety. To manage safety in an efficient
manner, it is important to maintain reliability in safety information and intelligence, which
is only achievable by developing and improving safety data gathering, validation, exchange
and analysis processes.
Even though different stakeholders maintain their own initiatives for safety data collection
and analysis, the development of safety reports could allow the aviation community to
obtain a harmonized view of the aviation system. Stakeholders are encouraged to use
ADREP, US CAST, ISARPs and other standardized taxonomies, which could facilitate
addressing a shared comprehension of conditions and situations related to safety.
Technological improvement in the aviation system requires fast and complete data
exchange. In the age of intelligence, data availability is key to be up to date. Applied to
safety, decision making on data transformed into information should support proper and
timely response to key issues. Stakeholders are invited to use the areas showed in this
Annual Safety Report to develop more in-depth analysis oriented to support the
establishment of indicators, acceptable levels of safety and safety targets.
---------------------
List of Acronyms
ADREP Accident/Incident Data Reporting System
(ICAO)
ADRM Aerodrome
ARC Abnormal Runway Contact
AFI Africa (IATA Region) and Regional Aviation
Safety Group-Africa-Indian Ocean (RASG-
AFI)
AGL Above Ground Level
AIG Accident and Incident investigations
AIS Aeronautical Information Service
AMAN Abrupt manoeuvre
APAC Regional Aviation Safety Group - Asia and
Pacific Regions (RASG-APAC)
ARC Abnormal runway contact
ARCM AIG Regional Cooperation Mechanism
ASPAC Asia/Pacific (IATA Region)
ASRT Annual Safety Report Team
ATM Air Traffic Management,
Communications, Surveillance
ATS Air Traffic Services
BIRD Birdstrike
CAB Cabin (IOSA)
CABIN Cabin safety events
CAR Caribbean (ICAO Region)
CARSAMMA Caribbean and South America
Regional Monitoring Agency
CEs Critical Elements (ICAO)
CFIT Controlled flight into terrain
CGO Cargo Operations (IOSA)
CIS Commonwealth of Independent States
(IATA Region)
CMA Continuous monitoring approach
CR Conformance Report (IOSA)
CRM Collision Risk Methodology
DGAC Directorate General of Civil Aviation
DIPs Detailed Implementation Plans
DSP Dispatch (IOSA)
ECCAIRS European Coordination Centre for
Accident and Incident Reporting Systems
E-GPWS Enhanced Ground Proximity Warning
System
EI Effective Implementation of ICAO SARPs
ESD Electrostatic Sensitive Devices
EUR Europe (ICAO and IATA Region) and
Regional Aviation Safety Group - Europe
(RASG-EUR)
EVAC Evacuation
FDA Flight Data Analysis
FDM Flight Data Monitoring
FIR Flight Information Region
FLT Flight Operations (IOSA)
F-NI Fire/smoke (none-impact).
FOQA Flight Operations Quality Assurance
F-POST Fire/Smoke (post-impact)
FUEL Fuel related
GASP ICAO Global Aviation Safety Plan
GCOL Ground collision
GPWS Ground Proximity Warning System
GRH Ground Handling Operations (IOSA)
GSI Global Safety Initiative
IATA International Air Transport Association
ICAO International Civil Aviation Organization
ICE Icing
ICVM ICAO Coordinated Validation Missions
IDISR Data Exchange Program of Ramp Safety
Inspections
IMC Instrument meteorological conditions
IOSA IATA Operational Safety Audit
ISARPs IOSA Safety and Recommended Practices
ISTARS ICAO Integrated Safety Trend Analysis
and Reporting System
LALT Low altitude operations
LAR Latin American Aeronautical Regulation
LATAM/CAR Latin America and Caribbean (IATA
Regions)
LHDs Large Height Deviations
LOC-G Loss of control - ground
LOC-I Loss of control - inflight
MAC AIRPROX/TCAS alert/loss of
separation/near miss collisions/mid-air
collisions
MID Regional Aviation Safety Group - Middle
East (RASG-MID)
MNT Aircraft Engineering and Maintenance
(IOSA)
MENA Middle East and North Africa (IATA
Region)
- 35 -
MOU Memorandum of Understanding
MTOM Maximum Take-off Mass
NAM North America (ICAO and IATA Region)
NASIA North Asia (IATA Region)
OTHR Other
ORG Organization and Management System
(ORG)
PA-RAST Pan America – Regional Aviation Safety
Team
RA Resolution Advisory
RAIO Regional Accident and Incident
Investigation Organization
RAMP Ground handling operations
RASG-PA Regional Aviation Safety Group – Pan
America
RASGs Regional Aviation Safety Groups
RE Runway excursion (departure or landing)
RI Runway Incursion
RI-A Runway Incursion – Animal
RI-VAP Runway Incursion – vehicle, aircraft or
person
RMA Regional Monitoring Agency
(CARSAMMA)
RVSM Reduced Vertical Separation Minima or
Minimum
SAM South America (ICAO Region)
SARPS Standards and Recommended Practices
(ICAO)
SEC Security Management (IOSA)
SEIs Safety Enhancement Initiatives
SCF-NP System/component failure or malfunction
(non-powerplant)
SCF-PP Powerplant failure or malfunction
SEC Security-related
SIMS ICAO Safety Information Monitoring
System
SMS Safety Management System
SOP Standard Operating Procedure
SRVSOP Regional Safety Oversight Cooperation
System
TCAS Traffic Collision and Avoidance System
TCAS RA Traffic Collision and Avoidance System-
Resolution Advisory
TEM Threat and Error Management
TLS Target Level of Safety (RVSM)
TURB Turbulence encounter
UNK Unknown or Undetermined
US CAST Commercial Aviation Safety Team (United
States)
USOAP Universal Safety Oversight Audit
Programme
USOS Undershoot/Overshoot
WSTRW Wind shear or thunderstorm
36
CREDITS – CRÉDITOS
RASG-PA thanks the members of the RASG-PA Annual Safety Report Team (ASRT) that
contributed to the elaboration of this RASG-PA Annual Safety Report – Special Edition.
RASG-PA agradece a los miembros del Equipo del Informe Anual de Seguridad
Operacional (ASRT) que contribuyeron a la elaboración de este Informe Anual de
Seguridad Operacional – Edición Especial.
Gunter Ertel
The Boeing Company
Floyd Abang
International Air Transport Association – IATA
Javier Puente
International Civil Aviation Organization – ICAO/OACI
Roberto Sosa
International Civil Aviation Organization – ICAO/OACI
-oOo-
37
Related Documents