Ras Al Khaimah Ceramics PSC and its subsidiaries Consolidated financial statements 31 December 2013

Welcome message from author
This document is posted to help you gain knowledge. Please leave a comment to let me know what you think about it! Share it to your friends and learn new things together.
Transcript
Ras Al Khaimah Ceramics PSC and its subsidiaries
Consolidated financial statements 31 December 2013

Ras Al Khaimah Ceramics PSC and its subsidiaries
Consolidated financial statements 31 December 2013 Contents Page
Directors’ report 1 - 6
Independent auditors’ report 7
Consolidated income statement 8
Consolidated statement of profit or loss and other comprehensive income 9
Consolidated statement of financial position 10
Consolidated statement of cash flows 11 - 12
Consolidated statement of changes in equity 13 - 14
Notes to the consolidated financial statements 15 – 82
Report of the Board of Directors
1
To the Shareholders,
The Directors are pleased to present their report on the business & operations along with Audited Consolidated Financial Statements for the year ended 31st December, 2013.
The past year has been a challenging year for the global economy and for the Middle East region with several economic and regional issues and collapse of political stability. These challenges were faced by the Company applying its business model of diversified market and supply chain strategies to mitigate the revenue and price risks in its core ceramics businesses. The Company expects higher opportunities in near future, locally, as Dubai has won the bid for hosting Expo 2020.
Summary of Results
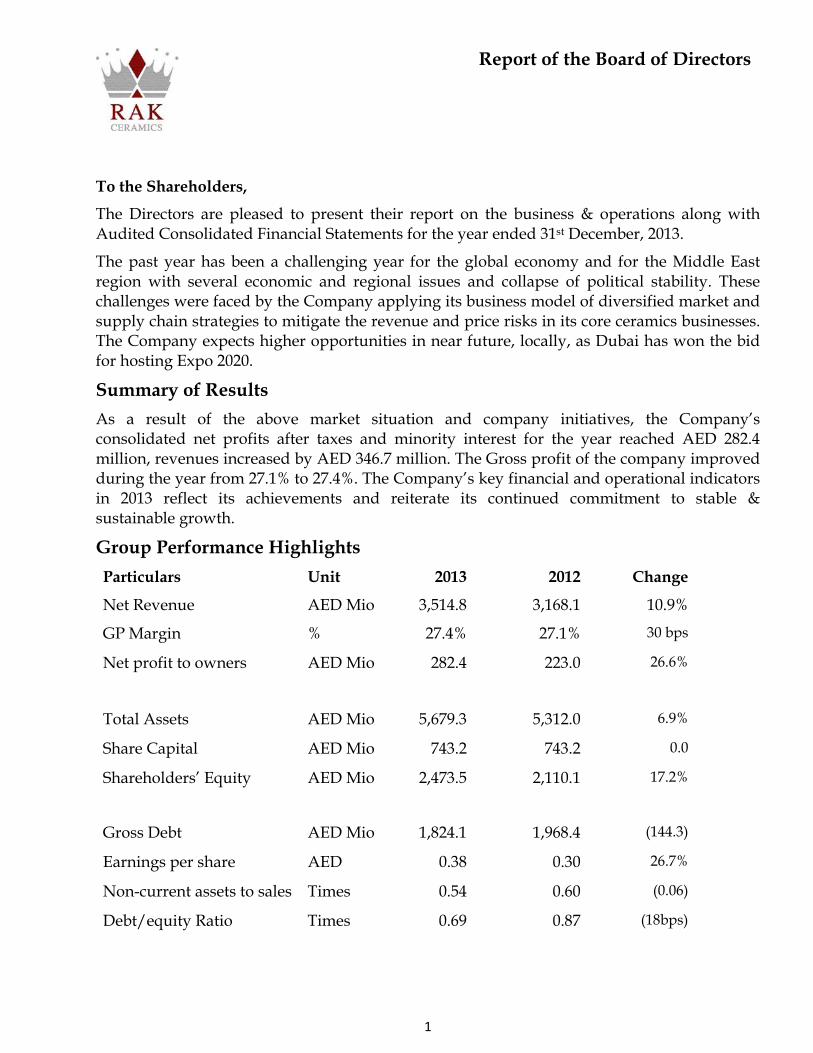
As a result of the above market situation and company initiatives, the Company’s consolidated net profits after taxes and minority interest for the year reached AED 282.4 million, revenues increased by AED 346.7 million. The Gross profit of the company improved during the year from 27.1% to 27.4%. The Company’s key financial and operational indicators in 2013 reflect its achievements and reiterate its continued commitment to stable & sustainable growth.
Group Performance Highlights
Particulars Unit 2013 2012 Change
Net Revenue AED Mio 3,514.8 3,168.1 10.9%
GP Margin % 27.4% 27.1% 30 bps
Net profit to owners
AED Mio
282.4 223.0 26.6%
Total Assets AED Mio 5,679.3 5,312.0 6.9%
Share Capital AED Mio 743.2 743.2 0.0
Shareholders’ Equity AED Mio 2,473.5 2,110.1 17.2%
Gross Debt AED Mio 1,824.1 1,968.4 (144.3)
Earnings per share AED 0.38 0.30 26.7%
Non-current assets to sales Times 0.54 0.60 (0.06)
Debt/equity Ratio Times 0.69 0.87 (18bps)
Report of the Board of Directors
2
Results Analysis
The 2013 results were achieved by the Company in the above strategic context focusing on quality of earnings.-In 2013, the company leveraged its export relationships in over 150 countries in its core ceramic markets and continued to foster growth of investments made in related manufacturing industrial businesses with reduction in activities related to Contracting business focusing on reduction in scale and recovery/ protection of assets. It also continued close monitoring and control of production and operating costs to improve its profitability despite the recessionary conditions and contraction in the construction markets world-wide. Accordingly,
The Company’s consolidated Revenues in 2013 increased as compared to 2012 and stood at AED 3.5 billion. The increase in revenue has been witnessed in all segments, ceramic segment (AED 102.3 Mio +3.6%); contracting segment (AED 211.2 Mio +87.2%); Others segment (AED 46.9Mio +50.4%); while other industrial segment decreased (AED 13.7 Mio -18.4%).
As compared to last year Consolidated Gross Profit increased by 12.3% to reach AED 962.7 million as against AED 856.9 million reached in 2012.
The Administrative, selling and financial expenses for the year decreased by 8.4% to reach AED 800.6 million as compared to AED 873.6 million in previous year. Administrative expenses decreased due defensive provisions & impairment policy for inventory & receivables in 2012; while selling expenses increased in line with volume towards rebates & freight expenses. However finance cost declined due to loan amortization & effective liquidity management.
The Consolidated Net Profit increased by 21.6% to reach AED 272.3 million as against AED 224.0 million in 2012.
The consolidated Non-Current Assets decreased by 1.0% to reach AED 1.88 billion from AED 1.90 billion in 2012.
The consolidated Current Assets increased by 11.3% to reach AED 3.80 billion.
The consolidated Long Term liabilities increased by 95.4% to reach AED 1.0 billion as against AED 511.9 million in 2012.
The consolidated Current Liabilities decreased by 19.8% to reach AED 2.0 billion.
The Gross debt remains to acceptable level as a result effective debt management.

Report of the Board of Directors
3
Board of Directors
The Board of Directors of the Company comprises
1. Mohammad bin Saud Al Qasimi, Chairman
2. Ahmad bin Humaid Al Qasimi
3. HamadAbdallah Al Muttawa
4. Dr. Mohammad Abdul Latif
5. Khaled Abdullah Yousef
Environment related CSR Activities:
Can Collection Day (28th February 2013): RAK Ceramics participated in Can Collection Day organised by Emirates Environmental Group (EEG), where RAK Ceramics’ employees collected over 200 kgs of cans from within the premises.
RAK Environmental Protection Development Authority’s Environmental Best Practice Initiative Program Sponsorship (24thMarch 2013): RAK Ceramics was one of the main sponsors of EPDA’s Best Practice Initiative Program that aimed to protect and preserve the environment.
Earth Day (22nd April 2013): RAK Ceramics hosted an annual tree planting ceremony on Earth Day at its manufacturing vicinity where trees were planted by the employees. During the year 2013, 3,000 trees were planted making a total of 10,000 trees planted since 2010.
Regional Environmental Clean-up Day (24th April 2013): RAK Ceramics collaborated with RAK EPDA to participate in Regional Environmental Clean-up Day to clean up the beach side in Ras Al Khaimah, where RAK Ceramics’ employees collected 500kg of waste.
EPDA Conference: Global Warming Sustainable Cities (5th-7th May 2013): RAK Ceramics was one of the sponsors of 2nd International Conference on Global Warming: Sustainable Cities, where RAK Ceramics had a stand focusing on eco-friendly products and environmentally-friendly manufacturing processes.
World Environment Day (5th June 2013): RAK Ceramics participated in World Environmental Day by recycling e-waste generated from used IT electronic devices and equipments. The company employees collected about half a tonne of e-waste such as old computers, printers, toners, cartridges etc during a drive.
UAE Clean-up Campaign (11th December 2013): RAK Ceramics participated in the 12th edition of UAE Clean-up UAE Campaign 2013, where the company employees and senior managers volunteered to clean-up a section of beach during the activity.

Report of the Board of Directors
4
Employee related CSR Activities:
World Cancer Day (4th February 2013): RAK Ceramics hosted a lecture and individual check-up on ‘World Cancer Day’ to educate employees about cancer, encourage its prevention and to stress the importance of early detection.
World No Tobacco Day (31st May 2013): RAK Ceramics launched an ‘Anti- Smoking Campaign’ on World No Tobacco Day in the smoking zone area within RAK Ceramics premises where a subtle message was designed around smoking bins to remind smokers to take necessary action as tobacco has only negative effect on the health.
Ramadan Iftar (July 2013): During the holy month of Ramadan, RAK Ceramics provided daily Iftar meals to all its Muslim factory employees on its premises.
RAK Football Stadium & Children’s Park Inauguration (24th November 2013): RAK Ceramics opened a Football Stadium and a children’s park for the employees and their children to encourage them to engage in sporting activities.
World Anti-Obesity Day Campaign (27th November 2013): RAK Ceramics in collaboration with VLCC organized an Anti-Obesity Campaign on World Anti-Obesity Day which included a lecture and individual health assessment for employees in order to create awareness about obesity, causes and its ill effects.
Society CSR Activities
RAK Terry Fox Run (1st March 2013): RAK Ceramics was one of the sponsors of annual RAK Terry Fox Run where more than 100 RAK Ceramics’ employees participated in the charitable event that aims to raise money for cancer research projects in the UAE University Hospital in Al Ain, accredited by the International Union against Cancer in Geneva.
Educational Tours: RAK Ceramics hosted educational tours for students of internationally acclaimed universities like University of Maryland- USA, EDHEC Business School-France and École Polytechnique Fédérale de Lausanne University-Switzerland, George Town University-USA and FIIB University-India etc, to give exposure to the budding talent.
Donation of Tiles & Grout for Teenagers with Special Needs (19th May 2013): RAK Ceramics donated tiles to Stepping Stones Vocational Program, which aimed to raise funds to support children with Autism and Developmental Disorders.
BIT Fest Sponsorship (16th May 2013): RAK Ceramics sponsored an educational initiative “Business Intelligence and Technology Fest”; an interschool quiz competition organized by Birla Institute of Technology, Ras Al Khaimah.

Report of the Board of Directors
5
Dress A Million Campaign (July 2013): RAK Ceramics participated in “Dress A Million Campaign”, launched by the Dubai Government and RAK Ceramics employees raised funds to provide clothes to 1,500 needy children worldwide.
Uttarakhund Relief Fund (31st July 2013): RAK Ceramics’ employees raised funds for Uttarrakhand relief, where the relief items were sent across to the victims of floods through Dubai-based Uttarrakhand Association.
Typhoon Haiyan Relief Fund (November 2013): RAK Ceramics launched a fund raising drive for Typhoon Haiyan Victims, where the employees raised funds and provided aid to help the victims. The donations were given in cash and in kind to help provide relief after the storm wrecked havoc in Philippines.
Ramadan Bowling and Volleyball Tournament Sponsorship (17th-31st July 2013): To support various sporting initiatives in the emirate of Ras Al Khaimah, RAK Ceramics sponsored Ramadan Bowling Event and Volley Ball Tournament during the month of Ramadan. RAK Ceramics also sponsored its team’s participation in the Ramadan Football Tournament where the team emerged as the champions of the league.
Ethical Brand Summit Sponsorship (1st September 2013): RAK Ceramics was one of the sponsors of CMO Asia’s Ethical Brand Summit, aimed to promote ethical brands and socially responsible business practices in an age of consumer-driven transparency, accountability and responsibility.
RAK Animal Welfare Centre 2014 Calendar Sponsorship: RAK Ceramics was one of the sponsors of RAK Animal Welfare Center’s 2014 Calendar, produced by RAK Animal Welfare Center, an organization that works for animal care and welfare.
Financial Reporting
The Company’s key accounting policies are articulated in its annual report and are committed to meeting the required financial disclosure norms and standards applicable to it. The Directors of the Company, to the best of their knowledge and belief, state that:
1. The financial statements, prepared by the management, fairly present its financial position, the result of its operation, cash flows and changes in equity.
2. The Company has maintained proper books of accounts.
3. Appropriate accounting policies have been consistently applied in preparation of financial statements and accounting estimates are based on reasonable and prudent judgment.
4. International financial reporting standards (IFRS) as applicable and reported have been followed in preparation of these financial statements.

8
Ras Al Khaimah Ceramics PSC and its subsidiaries
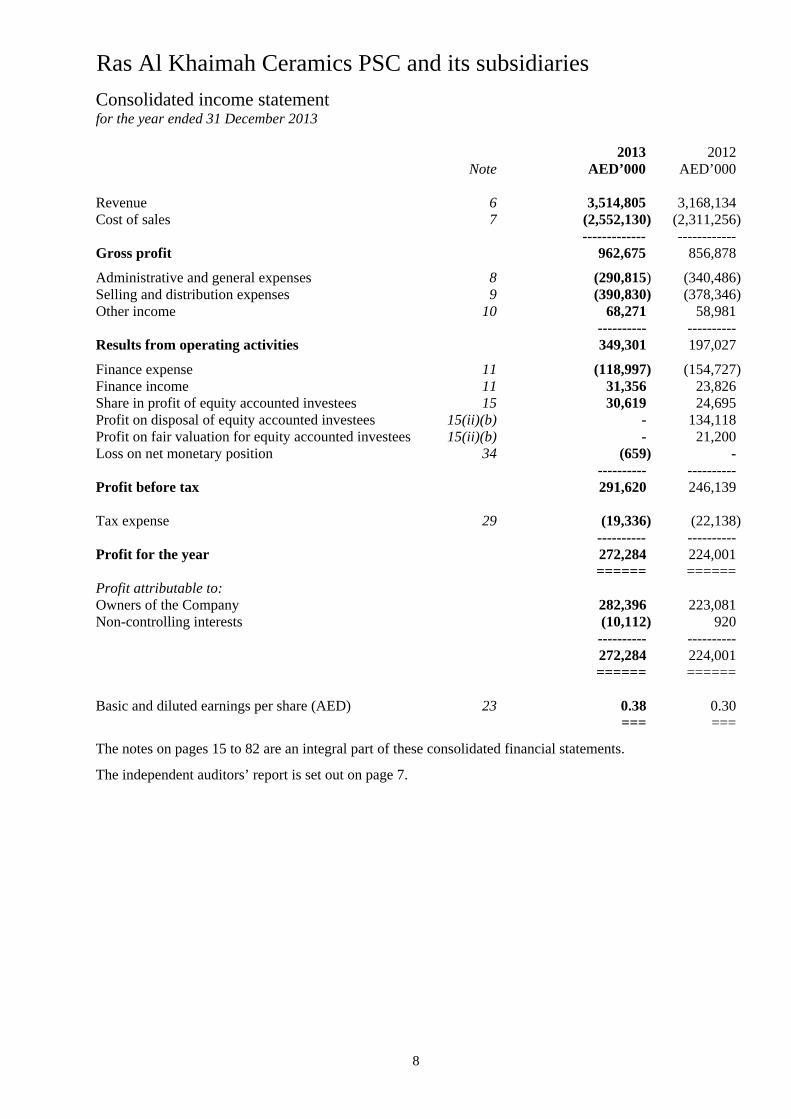
Consolidated income statement for the year ended 31 December 2013 2013 2012 Note AED’000 AED’000 Revenue 6 3,514,805 3,168,134 Cost of sales 7 (2,552,130) (2,311,256) ------------- ------------ Gross profit 962,675 856,878
Administrative and general expenses 8 (290,815) (340,486) Selling and distribution expenses 9 (390,830) (378,346) Other income 10 68,271 58,981 ---------- ---------- Results from operating activities 349,301 197,027
Finance expense 11 (118,997) (154,727) Finance income 11 31,356 23,826 Share in profit of equity accounted investees 15 30,619 24,695 Profit on disposal of equity accounted investees 15(ii)(b) - 134,118 Profit on fair valuation for equity accounted investees 15(ii)(b) - 21,200 Loss on net monetary position 34 (659) - ---------- ---------- Profit before tax 291,620 246,139 Tax expense 29 (19,336) (22,138) ---------- ---------- Profit for the year 272,284 224,001 ====== ====== Profit attributable to: Owners of the Company 282,396 223,081 Non-controlling interests (10,112) 920 ---------- ---------- 272,284 224,001 ====== ====== Basic and diluted earnings per share (AED) 23 0.38 0.30 === ===
The notes on pages 15 to 82 are an integral part of these consolidated financial statements.
The independent auditors’ report is set out on page 7.

9
Ras Al Khaimah Ceramics PSC and its subsidiaries
Consolidated statement of profit or loss and other comprehensive income for the year ended 31 December 2013 2013 2012 AED’000 AED’000 Profit for the year 272,284 224,001 Other comprehensive income Items that may be reclassified subsequently to profit or loss:
Foreign currency translation differences (46,509) (228,572) ---------- ---------- Total comprehensive income for the year 225,775 (4,571) ===== ===== Total comprehensive income attributable to:
Owners of the Company 236,713 24,953 Non-controlling interests (10,938) (29,524) ---------- -------- Total comprehensive income for the year 225,775 (4,571) ====== ===== The notes on pages 15 to 82 are an integral part of these consolidated financial statements.
The independent auditors’ report is set out on page 7.

11
Ras Al Khaimah Ceramics PSC and its subsidiaries
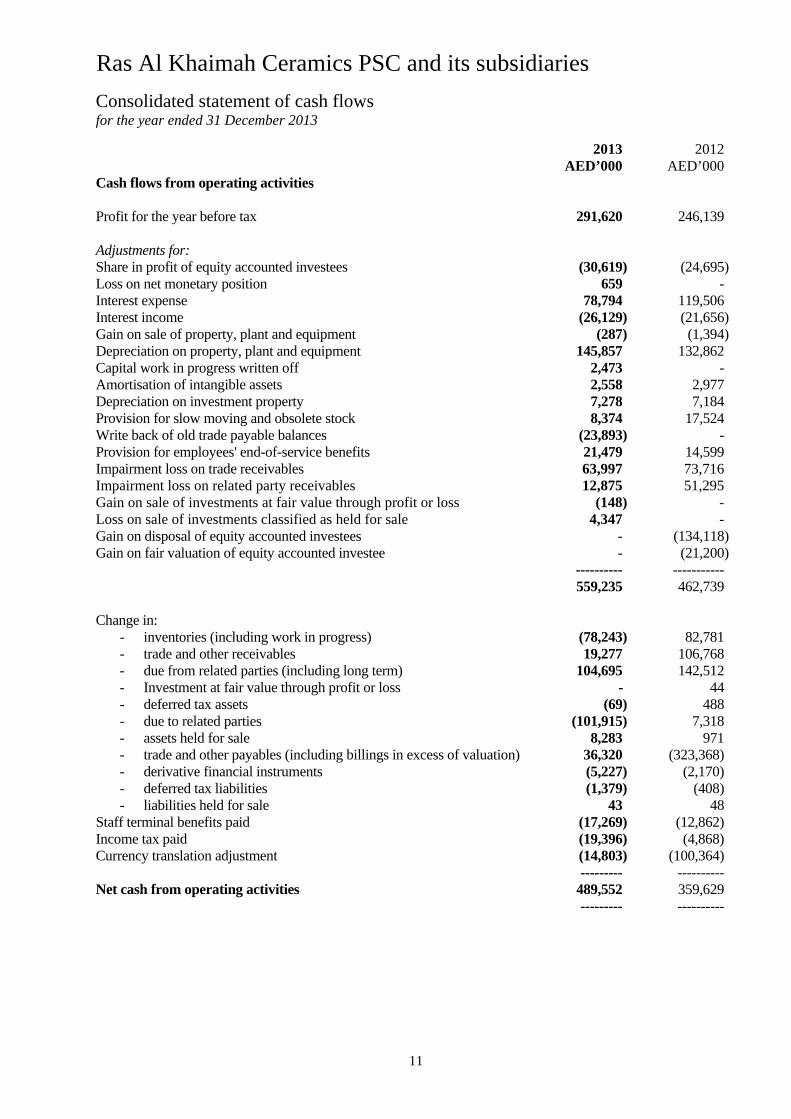
Consolidated statement of cash flows for the year ended 31 December 2013
2013 2012 AED’000 AED’000 Cash flows from operating activities Profit for the year before tax 291,620 246,139 Adjustments for: Share in profit of equity accounted investees (30,619) (24,695) Loss on net monetary position 659 - Interest expense 78,794 119,506 Interest income (26,129) (21,656) Gain on sale of property, plant and equipment (287) (1,394) Depreciation on property, plant and equipment 145,857 132,862 Capital work in progress written off 2,473 - Amortisation of intangible assets 2,558 2,977 Depreciation on investment property 7,278 7,184 Provision for slow moving and obsolete stock 8,374 17,524 Write back of old trade payable balances (23,893) - Provision for employees' end-of-service benefits 21,479 14,599 Impairment loss on trade receivables 63,997 73,716 Impairment loss on related party receivables 12,875 51,295 Gain on sale of investments at fair value through profit or loss (148) - Loss on sale of investments classified as held for sale 4,347 - Gain on disposal of equity accounted investees - (134,118) Gain on fair valuation of equity accounted investee - (21,200) ---------- ----------- 559,235 462,739 Change in:
- inventories (including work in progress) (78,243) 82,781 - trade and other receivables 19,277 106,768 - due from related parties (including long term) 104,695 142,512 - Investment at fair value through profit or loss - 44 - deferred tax assets (69) 488 - due to related parties (101,915) 7,318 - assets held for sale 8,283 971 - trade and other payables (including billings in excess of valuation) 36,320 (323,368) - derivative financial instruments (5,227) (2,170) - deferred tax liabilities (1,379) (408) - liabilities held for sale 43 48
Staff terminal benefits paid (17,269) (12,862) Income tax paid (19,396) (4,868) Currency translation adjustment (14,803) (100,364) --------- ---------- Net cash from operating activities 489,552 359,629 --------- ----------
12
Ras Al Khaimah Ceramics PSC and its subsidiaries
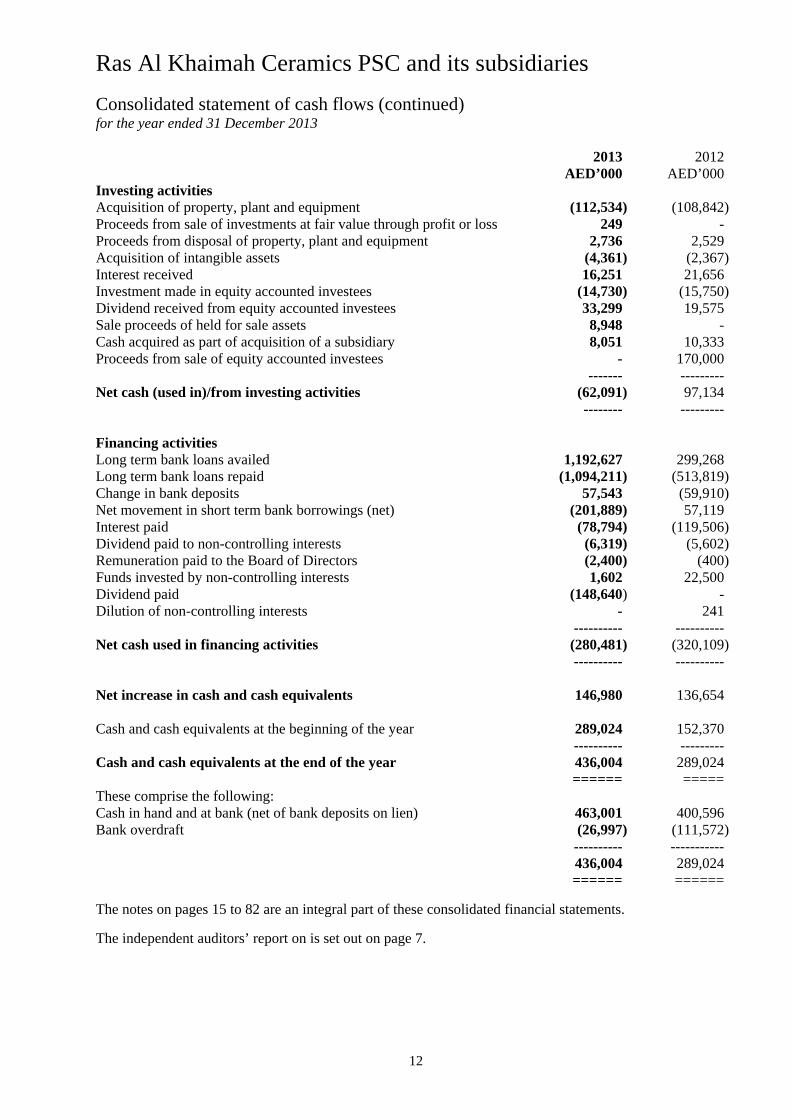
Consolidated statement of cash flows (continued) for the year ended 31 December 2013 2013 2012 AED’000 AED’000 Investing activities Acquisition of property, plant and equipment (112,534) (108,842) Proceeds from sale of investments at fair value through profit or loss 249 - Proceeds from disposal of property, plant and equipment 2,736 2,529 Acquisition of intangible assets (4,361) (2,367) Interest received 16,251 21,656 Investment made in equity accounted investees (14,730) (15,750) Dividend received from equity accounted investees 33,299 19,575 Sale proceeds of held for sale assets 8,948 - Cash acquired as part of acquisition of a subsidiary 8,051 10,333 Proceeds from sale of equity accounted investees - 170,000 ------- --------- Net cash (used in)/from investing activities (62,091) 97,134 -------- --------- Financing activities Long term bank loans availed 1,192,627 299,268 Long term bank loans repaid (1,094,211) (513,819) Change in bank deposits 57,543 (59,910) Net movement in short term bank borrowings (net) (201,889) 57,119 Interest paid (78,794) (119,506) Dividend paid to non-controlling interests (6,319) (5,602) Remuneration paid to the Board of Directors (2,400) (400) Funds invested by non-controlling interests 1,602 22,500 Dividend paid (148,640) - Dilution of non-controlling interests - 241 ---------- ---------- Net cash used in financing activities (280,481) (320,109) ---------- ----------
Net increase in cash and cash equivalents 146,980 136,654 Cash and cash equivalents at the beginning of the year 289,024 152,370 ---------- --------- Cash and cash equivalents at the end of the year 436,004 289,024 ====== ===== These comprise the following: Cash in hand and at bank (net of bank deposits on lien) 463,001 400,596 Bank overdraft (26,997) (111,572) ---------- ----------- 436,004 289,024 ====== ======
The notes on pages 15 to 82 are an integral part of these consolidated financial statements.
The independent auditors’ report on is set out on page 7.
13
Ras Al Khaimah Ceramics PSC and its subsidiaries
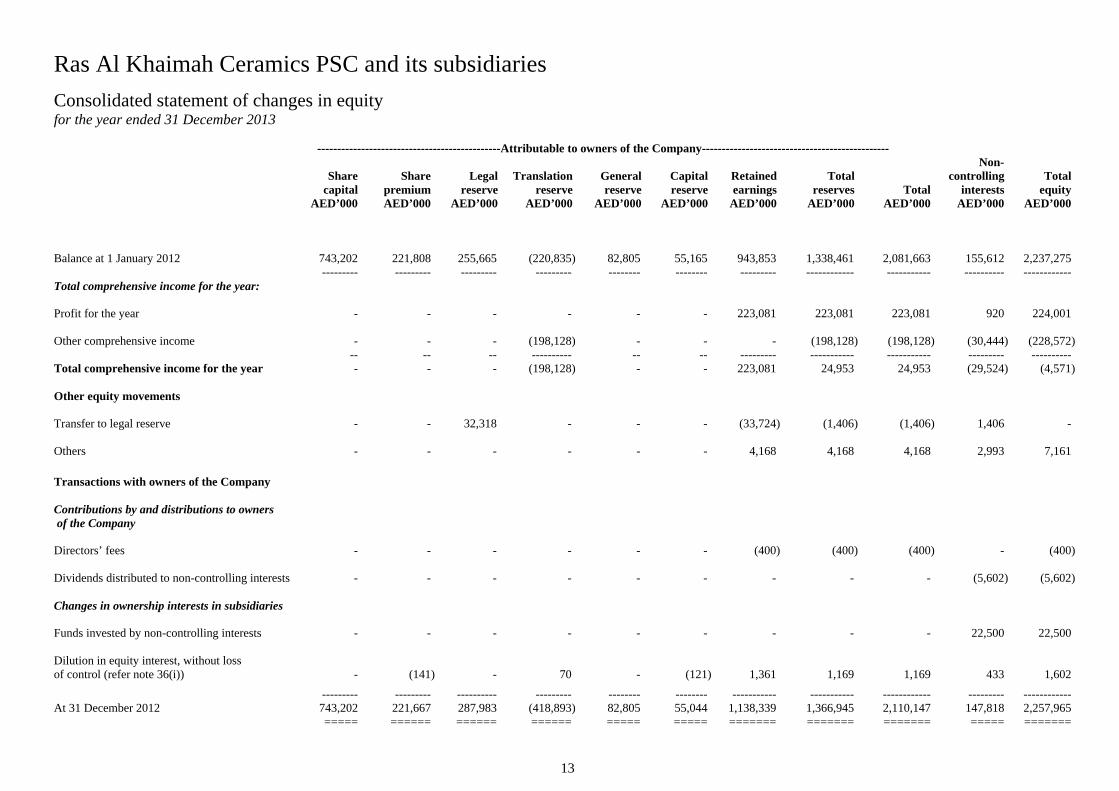
Consolidated statement of changes in equity for the year ended 31 December 2013
----------------------------------------------Attributable to owners of the Company----------------------------------------------- Non-
Share Share Legal Translation General Capital Retained Total controlling Total capital premium reserve reserve reserve reserve earnings reserves Total interests equity AED’000 AED’000 AED’000 AED’000 AED’000 AED’000 AED’000 AED’000 AED’000 AED’000 AED’000 Balance at 1 January 2012 743,202 221,808 255,665 (220,835) 82,805 55,165 943,853 1,338,461 2,081,663 155,612 2,237,275 --------- --------- --------- --------- -------- -------- --------- ------------ ----------- ---------- ------------ Total comprehensive income for the year: Profit for the year - - - - - - 223,081 223,081 223,081 920 224,001 Other comprehensive income - - - (198,128) - - - (198,128) (198,128) (30,444) (228,572) -- -- -- ---------- -- -- --------- ----------- ----------- --------- ---------- Total comprehensive income for the year - - - (198,128) - - 223,081 24,953 24,953 (29,524) (4,571) Other equity movements Transfer to legal reserve - - 32,318 - - - (33,724) (1,406) (1,406) 1,406 - Others - - - - - - 4,168 4,168 4,168 2,993 7,161
Transactions with owners of the Company Contributions by and distributions to owners of the Company Directors’ fees - - - - - - (400) (400) (400) - (400) Dividends distributed to non-controlling interests - - - - - - - - - (5,602) (5,602) Changes in ownership interests in subsidiaries Funds invested by non-controlling interests - - - - - - - - - 22,500 22,500 Dilution in equity interest, without loss of control (refer note 36(i)) - (141) - 70 - (121) 1,361 1,169 1,169 433 1,602
--------- --------- ---------- --------- -------- -------- ----------- ----------- ------------ --------- ------------ At 31 December 2012 743,202 221,667 287,983 (418,893) 82,805 55,044 1,138,339 1,366,945 2,110,147 147,818 2,257,965 ===== ====== ====== ====== ===== ===== ======= ======= ======= ===== =======

14
Ras Al Khaimah Ceramics PSC and its subsidiaries
Consolidated statement of changes in equity (continued) for the year ended 31 December 2013 -----------------------------------------------Attributable to owners of the Company----------------------------------------------------- Non- Share Share Legal Translation General Capital Retained Total controlling Total capital premium reserve reserve reserve reserve earnings reserves Total interests equity AED’000 AED’000 AED’000 AED’000 AED’000 AED’000 AED’000 AED’000 AED’000 AED’000 AED’000 Balance at 1 January 2013 743,202 221,667 287,983 (418,893) 82,805 55,044 1,138,339 1,366,945 2,110,147 147,818 2,257,965 --------- --------- --------- -------- -------- -------- --------- ------------ ----------- ---------- ------------ Total comprehensive income for the year:
Profit for the year - - - - - - 282,396 282,396 282,396 (10,112) 272,284
Other comprehensive income - - - (45,683) - - - (45,683) (45,683) (826) (46,509) -- -- -- -------- -- -- --------- ----------- ---------- --------- ---------- Total comprehensive income for the year - - - (45,683) - - 282,396 236,713 236,713 (10,938) 225,775
Other equity movements
Transfer to legal reserve - - 38,184 - - - (38,184) - - - -
Allocation of legal reserve on acquisition of a subsidiary (note 5(a)) - - 27,688 - - - (27,688) - - - -
Hyperinflationary effect (refer note 34) - - - - - - 135,766 135,766 135,766 33,941 169,707
Transactions with owners of the Company
Contributions by and distributions to owners of the Company
Directors’ fees - - - - - - (2,400) (2,400) (2,400) - (2,400)
Dividends distributed to non-controlling interests - - - - - - - - - (6,319) (6,319)
Dividend declared and paid - - - - - - (148,640) (148,640) (148,640) - (148,640)
Changes in ownership interests in subsidiaries
Funds invested by non-controlling interests - - - - - - - - - 1,602 1,602
Acquisition of subsidiary under common control (refer note (5(a)) - - - - - - 141,876 141,876 141,876 - 141,876 Disposal of subsidiaries (refer note 5(b)) - - - - - - - - - (131) (131) --------- --------- ---------- --------- -------- -------- ----------- ----------- ------------ --------- ------------ At 31 December 2013 743,202 221,667 353,855 (464,576) 82,805 55,044 1,481,465 1,730,260 2,473,462 165,973 2,639,435 ===== ===== ====== ====== ===== ===== ======= ======= ======= ===== =======
The notes on pages 15 to 82 are an integral part of these consolidated financial statements.
In accordance with the Ministry of Economy interpretation of Article 118 of the UAE Federal Law No. 8 of 1984 (as amended), Directors’ fees have been treated as an appropriation from equity.

Ras Al Khaimah Ceramics PSC and its subsidiaries
Notes to the consolidated financial statements for the year ended 31 December 2013
15
1 Reporting entity
Ras Al Khaimah Ceramics PSC ("the Company" or “the Holding Company”) was incorporated under Emiri Decree No. 6/89 dated 26 March 1989 as a limited liability company in the Emirate of Ras Al Khaimah, UAE. Subsequently, under Emiri Decree No. 9/91 dated 6 July 1991, the legal status of the Company was changed to Public Shareholding Company. The registered address of the Company is P.O. Box 4714, Al Jazeerah Al Hamra City, Ras Al Khaimah, United Arab Emirates. The Company is listed on Abu Dhabi stock exchange, UAE. These consolidated financial statements as at and for the year ended 31 December 2013 comprises the Company and its subsidiaries (collectively referred to as “the Group” and individually as “Group entities”) and the Group’s interest in associates and jointly controlled entities. The Group’s subsidiaries and equity accounted investees, their principal activities and the Group’s interest have been disclosed in note 36 to these consolidated financial statements.
The principal activities of the Company are manufacturing and sale of a variety of ceramic products including tiles, bathroom sets and sanitary wares. The Company and certain entities in the Group are also engaged in investing in other entities, in UAE or globally, that exercise similar or ancillary activities. Accordingly, the Company also acts as a Holding Company of the Group entities. The Group is also engaged in contracting and other industrial manufacturing activities.
2 Basis of preparation (a) Statement of compliance
These consolidated financial statements have been prepared in accordance with International Financial Reporting Standards (“IFRS”) and comply with the relevant Articles of the Company and the UAE Federal Law No. 8 of 1984 (as amended).
(b) Basis of measurement These consolidated financial statements have been prepared on a historical cost basis except in
respect of the following which are measured as follows: derivative financial instruments at fair value; held for sale assets and liabilities at lower of carrying amounts and fair value less cost to sell;
and investments at fair value through profit or loss at fair value.
(c) Functional and presentation currency These consolidated financial statements are presented in United Arab Emirates Dirham (“AED”),
which is the functional currency of the Company. All financial information presented in AED has been rounded to the nearest thousand, unless otherwise indicated.
(d) Use of estimates and judgments The preparation of consolidated financial statements in conformity with IFRS requires
management to make judgments, estimates and assumptions that affect the application of accounting policies and reported amounts of assets, liabilities, income and expenses. Actual results may differ from these estimates.
Estimates and underlying assumptions are reviewed by management on an ongoing basis.
Revisions to accounting estimates are recognised in the period in which the estimate is revised and in any future periods affected.
In particular, information about significant areas of estimation uncertainty and critical judgments in applying accounting policies that have the most significant effect on the amounts recognised in the consolidated financial statements are described in note 37.

Ras Al Khaimah Ceramics PSC and its subsidiaries
Notes to the consolidated financial statements for the year ended 31 December 2013
16
2 Basis of preparation (continued)
(e) Measurement of fair values
A number of the Group’s accounting policies and disclosures require the measurement of fair values, for both financial and non-financial assets and liabilities.
The Management have overall responsibility for overseeing all significant fair value measurements, including Level 3 fair values. Management regularly reviews significant unobservable inputs and valuation adjustment. If third party information, such as broker quotes or pricing services, is used to measure fair values, then the management assesses the evidence obtained from the third parties to support the conclusion that such valuations meet the requirement of IFRS, including the level in the fair value hierarchy in which such valuations should be classified. When measuring the fair value of an asset or a liability, the Group uses market observable data as far as possible. Fair values are categorised into different levels in a fair value hierarchy based on the inputs used in the valuation techniques as follows:
Level 1: quoted prices (unadjusted) in active markets for identical assets or liabilities.
Level 2: inputs other than quoted prices included within Level 1 that are observable for the
asset or liability, either directly (i.e., as prices) or indirectly (i.e., derived from prices).
Level 3: inputs for the asset or liability that are not based on observable market data (unobservable inputs).
If inputs used to measure the fair value of an asset or liability might be categorised in different levels of the fair value hierarchy, then the fair value measurement is categorised in its entirety in the same level of the fair value hierarchy as the lowest level input that is significant to the entire measurement. The Group recognises transfers between levels of the fair value hierarchy at the end of the reporting period during which the change has occurred.
Further information about the assumptions made in measuring fair values is included in the following notes:
Note 20–assets / liabilities held for sale;
Note 14 – investment property; and
Note 33 – financial instruments.

Ras Al Khaimah Ceramics PSC and its subsidiaries
Notes (continued)
17
3 Changes in accounting policies
The Group has adopted the following new standards and amendments to standards, including any consequential amendments to other standards, with date of initial application of 1 January 2013. - Amendments IAS 1: Presentation of Items of Other Comprehensive Income - IFRS 10: Consolidated Financial Statements - IFRS 11: Joint Arrangements - IFRS 12: Disclosure of Interests in Other Entities - IFRS 13: Fair Value Measurement - Disclosures – Offsetting Financial Assets and Financial Liabilities (amendments to IFRS 7) Presentation of Items of Other Comprehensive Income As a result of amendments to IAS 1, the Group has modified the presentation of Other Comprehensive Income in its statement of profit or loss and OCI, to present separately items that would have be reclassified to profit or loss from those that would never be. Comparative information has been represented accordingly. Subsidiaries
As a result of adoption of IFRS 10, the Group has changed its accounting policy with respect to determining whether it has control over and consequently whether it consolidates its investee. IFRS 10 introduces a new control model that focuses on whether the Group has power over an investee, exposure or right to variable returns from its involvement with the investee and ability to use its power to affect those returns. In accordance with the transitional provisions of IFRS 10, the Group has re-assessed the control conclusion for its investees at 1 January 2013. The re-assessment of control did not result in identification of any additional investee being controlled on a de facto control circumstances and accordingly, the change in accounting policy had no impact on the Group’s consolidated financial statements. Joint Arrangements As a result of adoption of IFRS 11, the Group has changed its accounting policy for its interests in joint arrangements. Under IFRS 11, the Group has classified its interests in joint arrangements as either joint ventures or joint operations depending on the Group’s rights to the assets and obligations for the liabilities of the arrangements. When making this assessment, the Group considers the structure of the arrangements, the legal form, the contractual terms and other facts and circumstances. The Group has revalued its involvement in its jointly arrangement and has reclassified the investment from a jointly controlled entity to a joint venture. Notwithstanding the reclassification, the investment continues to be recognised by applying the equity method and there has been no impact on the recognised assets, liabilities and comprehensive income of the Group.

Ras Al Khaimah Ceramics PSC and its subsidiaries
Notes (continued)
18
3 Changes in accounting policies (continued)
Disclosure of Interests in Other Entities As a result of IFRS 12, the Group has expanded its disclosures about its interests in subsidiaries and equity accounted investees (see notes 15 and 31). Fair Value Measurement IFRS 13 establishes a single framework for measuring fair value and making disclosure about fair value measurements when such measurements are required or permitted by IFRSs. It unifies the definition of fair value as the price that would be received to sell an asset or paid to transfer a liability in orderly transactions between market participants at the measurements date. It replaces and expands the disclosure requirements about the fair value measurements in other IFRSs, including IFRS 7. In accordance with the transitional provisions of IFRS 13, the Group has applied the fair value measurement guidance prospectively and has not provided any comparative information for new disclosures. Notwithstanding the above, the change had no significant impact on the measurements of the Group’s assets and liabilities. As a result, the Group has included additional disclosures in this regard (see notes 20, 14 and 33). Offsetting of financial assets and financial liabilities As a result of the amendments of IFRS7, the Group has expanded its disclosure about the offsetting of the financial assets and financial liabilities.
4 Significant accounting policies The accounting policies set out below have been applied consistently to all periods presented in these consolidated financial statements, and have been applied consistently by Group entities except for the changes as per note 3.
Basis of consolidation These consolidated financial statements comprise the consolidated statement of financial position and the consolidated results of operations of the Company and its subsidiaries (collectively referred to as “the Group”) on a line by line basis together with the Group’s share in the net assets of its equity accounted investees. The principal subsidiaries, associates and jointly controlled entities have been disclosed in note 36 to the consolidated financial statements.
Business combinations
Business combinations are accounted for using the acquisition method as at the acquisition date, which is the date on which control is transferred to the Group. Control is the power to govern the financial and operating policies of an entity so as to obtain benefits from its activities. In assessing control, the Group takes into consideration potential voting rights that currently are exercisable. Judgement is applied in determining the acquisition date and determining whether control is transferred from one party to another.
Ras Al Khaimah Ceramics PSC and its subsidiaries
Notes (continued)
19
4 Significant accounting policies (continued)
Basis of consolidation (continued) Business combinations (continued) The Group measures goodwill at the acquisition date as the fair value of the consideration transferred; plus the recognised amount of any non-controlling interests in the acquiree; less the net recognised amount (generally fair value) of the identifiable assets acquired and liabilities assumed. Any gain on the bargain purchase is recognised immediately in profit or loss.
The consideration transferred does not include amounts related to the settlement of pre-existing relationships. Such amounts are generally recognised in profit or loss. Consideration transferred also includes the fair value of any contingent consideration. Any contingent consideration payable is recognised at fair value at the acquisition date. If the contingent consideration is classified as equity, it is not re-measured and settlement is accounted for within equity. Otherwise, subsequent changes to the fair value of the contingent consideration are recognised in profit or loss. A contingent liability of the acquiree is assumed in a business combination only if such a liability represents a present obligation and arises from a past event, and its fair value can be measured reliably.
Transaction costs that the Group incurs in connection with a business combination are expensed as incurred, other than those associated with the issue of debt or equity securities.
Acquisition of entities under common control
Business combinations arising from the acquisition of interests in entities that are under the common control of the shareholders that control the Group are accounted for using book values of the acquired entities on the date of acquisition of interest in these entities. The components of equity of the acquired entities are added to the same components within the Group equity and any gain/loss arising is recognised directly in equity. Non-controlling interests in the acquired entities, on the date of acquisition, are separately disclosed in the Group’s financial statements
Subsidiaries
Subsidiaries are entities controlled by the Group. The Group controls an entity when it is exposed to, or has right to, variable returns from its involvement with the entity and has ability to affect those returns through its power over the entity. The financial statements of subsidiaries are included in the consolidated financial statement of the Group from the date on which control commences until the date on which control ceases. Non controlling interests (“NCI”)
The Group measures any non-controlling interests at its proportionate interest in the identifiable net assets of the acquiree. Changes in the Group’s interest in a subsidiary that do not result in a loss of control are accounted for as transactions with owners in their capacity as owners. Adjustments to non-controlling interests are based on a proportionate amount of the net assets of the subsidiary.

Ras Al Khaimah Ceramics PSC and its subsidiaries
Notes (continued)
20
4 Significant accounting policies (continued)
Basis of consolidation (continued)
Loss of control
Upon the loss of control, the Group derecognises the assets and liabilities of the subsidiary, any non-controlling interests and other components of equity related to the subsidiary. Any surplus or deficit arising on the loss of control is recognised in profit or loss. If the Group retains any interest in the previous subsidiary, then such interest is measured at fair value at the date that control is lost. Subsequently it is accounted for as an equity-accounted investee or as an available-for-sale financial asset depending on the level of influence retained.
Investments in equity accounted investees The Group’s interest in equity accounted investees comprises interests in associates and a joint venture.
Associates are those entities in which the Group has significant influence, but not control, over the financial and operating policies. A joint venture is an arrangement in which the Group has joint control, whereby the Group has rights to the net assets of the arrangement, rather than rights to its assets and obligation for its liabilities. Stepped acquisition When an acquisition is completed by a series of successive transactions, the Group re-measures its previously held equity interest in the aquiree at its acquisition date, fair value and recognises the resulting gain or loss, if any, in profit or loss. Any amount recognised in other comprehensive income related to the previously held equity interest is recognised on the same basis as would be required if the Group had disposed of the previously held equity interest directly. Transactions eliminated on consolidation Intra-group balances and transactions, and any unrealised income and expenses arising from intra-group transactions, are eliminated in preparing the consolidated financial statements. Unrealised gains arising from transactions with equity-accounted investees are eliminated against the investment to the extent of the Group's interest in the investee. Unrealised losses are eliminated in the same way as unrealised gains, but only to the extent that there is no evidence of impairment. Hyperinflation The financial statements of subsidiary companies whose functional currency is the currency of a hyperinflationary economy are adjusted for inflation in accordance with the procedures described in note 34 prior to their translation to AED. Once restated, all items of the financial statements are converted to AED using the closing exchange rate. Amounts shown for prior years for comparative purposes are not restated at consolidation level as the presentation currency of the Group is not of a hyperinflationary economy. On consolidation, the effect of price changes in the prior periods on the financial statements of the subsidiary has been recognised directly in the consolidated statement of changes in equity.

Ras Al Khaimah Ceramics PSC and its subsidiaries
Notes (continued)
21
4 Significant accounting policies (continued)
Hyperinflation (continued) To determine the existence of hyperinflation, the Group assesses the qualitative characteristics of the economic environment of the country, such as the trends in inflation rates over the previous three years. The financial statements of subsidiaries whose functional currency is the currency of a hyperinflationary economy are adjusted to reflect the changes in purchasing power of the local currency, such that all items in the statement of financial position not expressed in current terms (non-monetary items) are restated by applying a general price index at the reporting date and all income and expenses are restated quarterly by applying appropriate conversion factors as defined in note 34. The difference between initial adjusted amounts is taken to profit or loss. Foreign currency
Foreign currency transactions
Transactions in foreign currencies are translated to the respective functional currencies of Group entities at exchange rates at the dates of the transactions. Monetary assets and liabilities denominated in foreign currencies are translated to the functional currency at the exchange rate at the reporting date. The foreign currency gain or loss on monetary items is the difference between amortised cost in the functional currency at the beginning of the year, adjusted for effective interest and payments during the year, and the amortised cost in foreign currency translated at the exchange rate at the end of the year.
Non-monetary assets and liabilities denominated in foreign currencies that are measured at fair value are translated to the functional currency at the exchange rate at the date that the fair value was determined. Non-monetary items in a foreign currency that are measured based on historical cost are not translated.
Foreign currency differences arising on translation are generally recognised in profit or loss, except for the differences arising on the translation of available-for-sale equity investments (except on impairment in which case foreign currency differences that have been recognised in other comprehensive income are reclassified to profit or loss), financial liability designated as a hedge of the net investment in a foreign operation to that extent that the hedge is effective and a qualifying cash flow hedge to the extent that the hedge is effective. These differences are recognised in other comprehensive income. Foreign operations
The assets and liabilities of foreign operations, including goodwill and fair value adjustments arising on acquisition, are translated to AED at exchange rates at the reporting date. The income and expenses of foreign operations are translated to AED at exchange rates at the dates of the transactions.
Ras Al Khaimah Ceramics PSC and its subsidiaries
Notes (continued)
22
4 Significant accounting policies (continued)
Foreign currency (continued) Foreign operations (continued)
Foreign currency differences are recognised in other comprehensive income, and presented in the foreign currency translation reserve (referred as “translation reserve” in the consolidated financial statements) in equity. However, if the foreign operation is a non-wholly owned subsidiary, then the relevant proportion of the translation difference is allocated to non-controlling interests. When a foreign operation is disposed of such that control, significant influence or joint control is lost, the cumulative amount in the translation reserve related to that foreign operation is reclassified to profit or loss as part of the gain or loss on disposal. When the Group disposes of only part of its interest in a subsidiary that includes a foreign operation while retaining control, the relevant proportion of the cumulative amount is reattributed to non-controlling interests. When the Group disposes of only part of its investment in an associate or joint venture that includes a foreign operation while retaining significant influence or joint control, the relevant proportion of the cumulative amount is reclassified to profit or loss.
When the settlement of a monetary item receivable from or payable to a foreign operation is neither planned nor likely in the foreseeable future, foreign currency gains and losses arising from such item are considered to form part of a net investment in the foreign operation and are recognised in other comprehensive income, and presented in the translation reserve in equity. Financial instruments The Group classifies non-derivative financial assets into the following categories: financial assets at fair value through profit or loss and loan and receivables.
The Group classifies non-derivative financial liabilities into the other financial liabilities category. Non-derivative financial assets and financial liabilities – recognition and derecognition
The Group initially recognises loans and receivables and debt securities issued on the date that they are originated. All other financial assets and financial liabilities are recognised initially on the trade date.
The Group derecognises a financial asset when the contractual rights to the cash flows from the asset expire, or it transfers the rights to receive the contractual cash flows in a transaction in which substantially all the risks and rewards of ownership of the financial asset are transferred, or it neither transfer nor retains substantially all of the risks and rewards of ownership and does not retain control over the transferred assets. Any interest in such transferred financial assets that is created or retained by the Group is recognised as a separate asset or liability.
The Group derecognises a financial liability when its contractual obligations are discharged or cancelled, or expire. Financial assets and financial liabilities are offset and the net amount presented in the statement of financial position when, and only when, the Group has a legal right to offset the amounts and intends either to settle them on a net basis or to realise the asset and settle the liability simultaneously.

Ras Al Khaimah Ceramics PSC and its subsidiaries
Notes (continued)
23
4 Significant accounting policies (continued)
Financial instruments (continued)
Non-derivative financial assets – measurement
Financial assets at fair value through profit or loss
A financial asset is classified as fair value through profit or loss if it is classified as held for trading or is designated as such upon initial recognition. Directly attributable transaction costs are recognised in profit and loss as incurred. Financial assets at fair value through profit or loss are measured at fair value and changes therein, including any interest or dividend income, are recognised in profit or loss. Loans and receivables
These assets are initially recognised at fair value plus any directly attributable transaction costs. Subsequent to initial recognition, loans and receivables are measured at amortised cost using the effective interest method, less any impairment losses.
Cash and cash equivalents
In the consolidated statement of cash flows, cash and cash equivalents includes cash balances and call deposits with original maturities of three month or less from the acquisition date. Fixed deposits under lien against certain bank facilities are not included as part of cash and cash equivalents. Non-derivative financial liabilities -measurement Non- derivative financial liabilities are initially recognised at fair value less any directly attributable transaction costs. Subsequent to initial recognition, these financial liabilities are measured at amortised cost using the effective interest method. Share capital Ordinary shares are classified as equity. Incremental costs directly attributable to the issue of ordinary shares are recognised as a deduction from equity, net of any tax effects.
Derivative financial instruments and hedge accounting The Group holds derivative financial instruments to hedge its foreign currency and interest rate risk exposures.
On initial designation of the derivative as a hedging instrument, the Group formally documents the relationship between the hedging instrument and hedged item, including the risk management objectives and strategy in undertaking the hedge transaction and the hedged risk, together with the methods that will be used to assess the effectiveness of the hedging relationship. The Group makes an assessment, both at the inception of the hedge relationship as well as on an ongoing basis, of whether the hedging instruments are expected to be highly effective in offsetting the changes in the fair value or cash flows of the respective hedged items attributable to the hedged risk, and whether the actual results of each hedge are within a range of 80% - 125%. For a cash flow hedge of a forecast transaction, the transaction should be highly probable to occur and should present an exposure to variations in cash flows that ultimately could affect reported profit or loss.
Ras Al Khaimah Ceramics PSC and its subsidiaries
Notes (continued)
24
4 Significant accounting policies (continued)
Financial instruments (continued)
Derivative financial instruments and hedge accounting (continued)
Derivatives are recognised initially at fair value; attributable transaction costs are recognised in profit or loss as incurred. Subsequent to initial recognition, derivatives are measured at fair value, and changes therein are accounted for as described below. Cash flow hedges Where a derivative financial instrument is designated as a hedge of the variability in cash flows of a recognised asset or liability, or a highly probable forecasted transaction, the effective part of any gain or loss on the derivative financial instrument is recognised under other comprehensive income. When the forecasted transaction subsequently results in the recognition of a non-financial asset or non-financial liability, or the forecast transaction for a non-financial asset or non-financial liability occurs, the associated cumulative gain or loss is removed from other comprehensive income and is included in the initial cost or other carrying amount of the non-financial asset or liability. If a hedge of a forecasted transaction subsequently results in the recognition of a financial asset or a financial liability, the associated gains and losses that were recognised directly in other comprehensive income are reclassified into profit or loss in the same period or periods during which the asset acquired or liability assumed affects profit or loss. For cash flow hedges, other than those covered by the preceding two policy statements, the associated cumulative gain or loss is removed from other comprehensive income and recognized in profit or loss in the same period or periods during which the hedged forecast transaction affects profit or loss. The ineffective part of any gain or loss is recognised immediately in profit or loss. When a hedging instrument expires or is sold, terminated or exercised, or the entity revokes designation of the hedge relationship but the hedged forecast transaction is still expected to occur, the cumulative gain or loss at that point remains in equity and is recognised in accordance with the above policy when the transaction occurs. If the hedged transaction is no longer expected to take place, the cumulative unrealised gain or loss recognised in other comprehensive income is recognised immediately in profit or loss.
Other non-trading derivatives
When a derivative financial instrument is not designated in a hedge relationship that qualifies for hedge accounting, all changes in its fair value are recognised immediately in profit or loss.
Ras Al Khaimah Ceramics PSC and its subsidiaries
Notes (continued)
25
4 Significant accounting policies (continued) Property, plant and equipment
Recognition and measurement
Items of property plant and equipment are measured at cost less accumulated depreciation and accumulated impairment losses (see accounting policy on impairment), if any. Cost includes expenditure that is directly attributable to the acquisition of the asset. The cost of self-constructed assets includes the following:
the cost of materials and direct labour; any other costs directly attributable to bringing the assets to a working condition for their
intended use; and Capitalised borrowing costs.
Purchased software that is integral to the functionality of the related equipment is capitalised as part of that equipment. When parts of an item of property, plant and equipment have different useful lives, they are accounted for as separate items (major components) of property, plant and equipment. Any gain or loss on disposal of an item of property, plant and equipment (calculated as the difference between the net proceeds from disposal and the carrying amount of the item) is recognised in profit or loss. Reclassification to investment property When the use of a property changes from owner-occupied to investment property, the property is reclassified as investment property considering that the accounting policy for investment property is the ‘Cost Model’ in accordance with IAS 40.
Subsequent cost
Subsequent expenditure is capitalised only when it is probable that the future economic benefits associated with the expenditure will flow to the Group. Ongoing repairs and maintenance is expensed as incurred.
Depreciation
Depreciation is calculated to write off the cost of items of property, plant and equipment less their estimated residual values using the straight-line basis over their estimated useful lives. Depreciation is generally recognised in profit or loss, unless the amount is included in the carrying amount of another asset. Leased assets are depreciated over the shorter of the lease term and their useful lives unless it is reasonably certain that the Group will obtain ownership by the end of the lease term. Land is not depreciated.
Items of property, plant and equipment are depreciated from the date that they are available for use, or in respect of internally constructed assets, from the date that the asset is completed and ready for use.

Ras Al Khaimah Ceramics PSC and its subsidiaries
Notes (continued)
26
4 Significant accounting policies (continued)
Property, plant and equipment (continued) Depreciation (continued)
The estimated useful lives for the current and comparative years of significant items of property, plant and equipment are as follows:
Life (years) Buildings 30-35 Plant and equipment 5-15 Furniture and fixtures 3 Vehicles 3-5 Roads and asphalting 10 Quarry and land development 10 Office equipment 3
Depreciation methods, useful lives and residual values are reviewed at each reporting date and adjusted if appropriate. The useful life and residual value of certain items of property, plant and equipment were revised in 2013 (refer note 12(iv)). Capital work in progress
Capital work in progress is stated at cost less impairment, if any, until the construction is completed. Upon completion of construction, the cost of such assets together with the cost directly attributable to construction, including capitalised borrowing costs are transferred to the respective class of asset. No depreciation is charged on capital work in progress.
Intangible assets Goodwill
Goodwill that arises on the acquisition of subsidiaries is presented in the statement of financial position. For the measurement of goodwill at initial recognition refer accounting policy on business combination. Subsequent measurement Goodwill is measured at cost less accumulated impairment losses. In respect of equity accounted investees, the carrying amount of goodwill is included in the carrying amount of the investment, and any impairment loss is allocated to the carrying amount of the equity accounted investee as a whole.
Other intangible assets Other intangible assets that are acquired by the Group and have finite useful lives are measured at cost less accumulated amortisation and accumulated impairment losses, if any. Subsequent expenditure
Subsequent expenditure is capitalised only when it increases the future economic benefits embodied in the specific asset to which it relates. All other expenditure, including expenditure on internally generated goodwill and brands, is recognised in profit or loss as incurred.

Ras Al Khaimah Ceramics PSC and its subsidiaries
Notes (continued)
27
4 Significant accounting policies (continued)
Intangible assets (continued) Amortisation
Intangible assets are amortised on a straight-line basis in profit or loss over their estimated useful lives of 5 to15 years from the date that they are available for use.
Amortisation methods, useful lives and residual values are reviewed at each reporting date and adjusted if appropriate.
Investment property
Investment property is property held either to earn rental income or for capital appreciation or for both, but not for sale in the ordinary course of business, use in the production or supply of goods or rendering services or for administrative purposes.
Investment property is accounted for using the “Cost Model” under the International Accounting Standard 40 “Investment Property” and is stated at cost less accumulated depreciation and impairment losses, if any. Depreciation on buildings is charged over its estimated useful life of 30 to 35 years. Cost includes expenditure that is directly attributable to the acquisition of the investment property. The cost of self-constructed investment property includes the cost of materials and direct labour, any other costs directly attributable to bringing the investment property to a working condition for their intended use and capitalised borrowing costs. Any gain or loss on disposal of an investment property (calculated as the difference between the net proceeds from disposal and the carrying amount of the item) is recognised in profit or loss.
When the use of a property changes such that it is reclassified as property, plant and equipment or inventory, the transfer is effected at the carrying value of such property at the date of reclassification.
Leased assets
Leases in terms of which the Group assumes substantially all of the risks and rewards of ownership are classified as finance leases. On initial recognition, the leased asset is measured at an amount equal to the lower of its fair value and the present value of the minimum lease payments. Subsequent to initial recognition, the asset is accounted for in accordance with the accounting policy applicable to that asset.
Other leases are operating leases and are not recognised in the Group's statement of financial position.
Inventories
Inventories are measured at the lower of cost and net realisable value. The cost of inventories is based on the weighted average cost principle, and includes expenditure incurred in acquiring the inventories, production or conversion costs, and other costs incurred in bringing them to their existing location and condition. In the case of manufactured inventories and work in progress, cost includes an appropriate share of production overheads based on normal operating capacity. Net realisable value is the estimated selling price in the ordinary course of business, less the estimated costs of completion and selling expenses.

Ras Al Khaimah Ceramics PSC and its subsidiaries
Notes (continued)
28
4 Significant accounting policies (continued)
Construction contracts in progress / Billings in excess of valuation
Construction contracts in progress represent the gross unbilled amount expected to be collected from customers for contract work performed to date. It is measured at cost plus profit recognised to date less progress billings and recognised losses. Cost includes all expenditure related directly to specific projects and an allocation of fixed and variable overheads incurred in the Group's contract activities based on normal operating capacity.
Losses expected on completion of a contract are recognised immediately in profit or loss. For contracts where progress billings exceed contract revenue, the excess is included in current liabilities as billings in excess of valuations.
Impairment
Non-derivative financial assets
Financial assets not classified as at fair value through profit or loss, including an interest in an equity-accounted investee, are assessed at each reporting date to determine whether there is objective evidence that it is impaired. A financial asset is impaired if there is objective evidence of impairment as a result of one or more events that occurred after the initial recognition of the asset, and that loss event(s) had an impact on the estimated future cash flows of that asset that can be estimated reliably.
Objective evidence that financial assets are impaired includes default or delinquency by a debtor, restructuring of an amount due to the Group on terms that the Group would not consider otherwise, indications that a debtor or issuer will enter bankruptcy, adverse changes in the payment status of borrowers or issuers, economic conditions that correlate with defaults or the disappearance of an active market for a security.
Financial assets measured at amortised cost
The Group considers evidence of impairment for financial assets measured at amortised cost (loans and receivables) at both a specific asset and collective level. All individually significant assets are assessed for specific impairment. Those found not to be specifically impaired are then collectively assessed for any impairment that has been incurred but not yet identified. Assets that are not individually significant are collectively assessed for impairment by grouping together assets with similar risk characteristics.
In assessing collective impairment, the Group uses historical trends of the probability of default, the timing of recoveries and the amount of loss incurred, adjusted for management's judgement as to whether current economic and credit conditions are such that the actual losses are likely to be greater or lesser than suggested by historical trends.
An impairment loss in respect of a financial asset measured at amortised cost is calculated as the difference between its carrying amount and the present value of the estimated future cash flows discounted at the asset's original effective interest rate. Losses are recognised in profit or loss and reflected in an allowance account against loans and receivables. Interest on the impaired asset continues to be recognised. When an event occurring after the impairment was recognised causes the amount of impairment loss to decrease, the decrease in impairment loss is reversed through profit or loss.
Equity accounted investees
An impairment loss in respect of an equity accounted investee is measured by comparing the recoverable amount of the investment with its carrying amount. An impairment loss is recognised in profit or loss, and is reversed if there has been a favourable change in the estimates used to determine the recoverable amount.
Ras Al Khaimah Ceramics PSC and its subsidiaries
Notes (continued)
29
4 Significant accounting policies (continued)
Impairment (continued) Non financial assets
The carrying amounts of the Group's non-financial assets, other than inventories and deferred tax assets, are reviewed at each reporting date to determine whether there is any indication of impairment. If any such indication exists, then the asset's recoverable amount is estimated. Goodwill and indefinite-lived intangible assets are tested annually for impairment. An impairment loss is recognised if the carrying amount of an asset or cash-generating unit (CGU) exceeds its recoverable amount. The recoverable amount of an asset or CGU is the greater of its value in use and its fair value less costs to sell. In assessing value in use, the estimated future cash flows are discounted to their present value using a pre-tax discount rate that reflects current market assessments of the time value of money and the risks specific to the asset or CGU. For impairment testing, assets are grouped together into the smallest group of assets that generates cash inflows from continuing use that are largely independent of the cash inflows of other assets or CGUs. Subject to an operating segment ceiling test, CGUs to which goodwill has been allocated are aggregated so that the level at which impairment testing is performed reflects the lowest level at which goodwill is monitored for internal reporting purposes. Goodwill acquired in a business combination is allocated to groups of CGUs that are expected to benefit from the synergies of the combination.
Impairment losses are recognised in profit or loss. Impairment losses recognised in respect of CGUs are allocated first to reduce the carrying amount of any goodwill allocated to the CGU (group of CGUs), and then to reduce the carrying amounts of the other assets in the CGU (group of CGUs) on a pro rata basis.
An impairment loss in respect of goodwill is not reversed. For other assets, an impairment loss is reversed only to the extent that the asset's carrying amount does not exceed the carrying amount that would have been determined, net of depreciation or amortisation, if no impairment loss had been recognised. Employee benefits
Short- term employee benefits
Short-term employee benefit obligations are measured on an undiscounted basis and are expensed as the related service is provided. A liability is recognised for the amount expected to be paid under short-term cash bonus or profit-sharing plans if the Group has a present legal or constructive obligation to pay this amount as a result of past service provided by the employee, and the obligation can be estimated reliably.
Defined contribution plans
Obligations for contributions to defined contribution plans are recognised as the related services are provided. Prepaid contributions are recognised as an asset to the extent that a cash refund or a reduction in future payments is available.
Ras Al Khaimah Ceramics PSC and its subsidiaries
Notes (continued)
30
4 Significant accounting policies (continued)
Employee benefits (continued) Terminal benefits
The provision for staff terminal benefits is based on the liability that would arise if the employment of all staff were terminated at the reporting date and is calculated in accordance with the provisions of UAE Federal Labour Law and the relevant local laws applicable to overseas subsidiaries. Management considers these as long-term obligations and accordingly they are classified as long-term liabilities.
Provisions
Provisions are determined by discounting the expected future cash flows at a pre-tax rate that reflects current market assessments of the time value of money and the risks specific to the liability. The unwinding of the discount is recognised as finance cost.
Warranties
A provision for warranties is recognised when the underlying products or services are sold, based on historical warranty data and a weighting of possible outcomes against their associated probabilities.
Assets and liabilities held for sale Non-current assets, or disposal groups comprising assets and liabilities, are classified as held-for-sale if it is highly probable that they will be recovered primarily through sale rather than through continuing use. Immediately before classification as held-for-sale, the assets, or components of a disposal group, are remeasured in accordance with the Group’s other accounting policies. Thereafter, generally the assets, or disposal group, are measured at the lower of their carrying amount and fair value less costs to sell. Any impairment loss on a disposal group is allocated first to goodwill, and then to the remaining assets and liabilities on a pro rata basis, except that no loss is allocated to inventories, financial assets, deferred tax assets, employee benefit assets, investment property or biological assets, which continue to be measured in accordance with the Group’s other accounting policies. Impairment losses on initial classification as held-for-sale and subsequent gains and losses on remeasurement are recognised in profit or loss. Gains are not recognised in excess of any cumulative impairment loss. Once classified as held for sale, intangible assets and property, plant and equipment are no longer amortised or depreciated, and any equity accounted investee is no longer equity accounted.
Ras Al Khaimah Ceramics PSC and its subsidiaries
Notes (continued)
31
4 Significant accounting policies (continued)
Revenue
Sale of goods
Revenue from the sale of goods in the course of ordinary activities is measured at the fair value of the consideration received or receivable, net of returns, trade discounts and volume rebates. Revenue is recognised when persuasive evidence exists, usually in the form of an executed sales agreement, that the significant risks and rewards of ownership have been transferred to the customer, recovery of the consideration is probable, the associated costs and possible return of goods can be estimated reliably, there is no continuing management involvement with the goods, and the amount of revenue can be measured reliably. If it is probable that discounts will be granted and the amount can be measured reliably, then the discount is recognised as a reduction of revenue as the sales are recognised.
Rendering of services
Revenue from services rendered is recognised in profit or loss in proportion to the stage of completion of the transaction at the reporting date. The stage of completion is assessed by reference to surveys of work performed.
Construction contracts
Contract revenue includes the initial amount agreed in the contract plus any variations in contract work, claims and incentive payments, to the extent that it is probable that they will result in revenue and can be measured reliably. As soon as the outcome of the construction contract can be estimated reliably, contract revenue is recognised in profit or loss in proportion to the stage of completion of the contract. Contract expenses are recognised as incurred unless they create an asset related to future contract activity. The percentage of completion is estimated on the basis of proportion that the actual cost bears to the total estimated contract cost. When the outcome of a construction contract cannot be estimated reliably, contract revenue is recognised only to the extent of contract costs incurred that are likely to be recoverable. An expected loss on a contract is recognised immediately in profit or loss.
Rental income
Rental income from investment property is recognised as revenue on a straight-line basis over the term of the lease. Lease incentives granted are recognised as an integral part of the total rental income, over the term of the lease. Dividend income Dividend income is recognised in profit or loss on the date that the Group’s right to receive the payment is established.
Ras Al Khaimah Ceramics PSC and its subsidiaries
Notes (continued)
32
4 Significant accounting policies (continued)
Finance income and finance costs
Finance income comprises interest income on fixed deposits, amounts due from related parties and trade receivables. Interest income is recognised in profit or loss as it accrues, using the effective interest rate method.
Finance cost comprises interest expense on bank borrowings and amounts due to related parties. All borrowing costs are recognised in profit or loss using the effective interest rate method. However, borrowing costs that are directly attributable to the acquisition or construction of a qualifying asset are capitalised as part of the cost of that asset. A qualifying asset is an asset that necessarily takes a substantial period of time to get ready for its intended use or sale. Capitalisation of borrowing costs ceases when substantially all the activities necessary to prepare the asset for its intended use or sale are complete.
Foreign currency gains and losses are reported on a net basis as either finance income or finance cost depending on whether the foreign currency movements are in a net gain or net loss position.
Tax
Tax expense comprises current and deferred tax. Current tax and deferred tax is recognised in profit or loss except to the extent that it relates to a business combination, or items recognised directly in equity or in other comprehensive income. Current tax
Current tax is the expected tax payable or receivable on the taxable income or loss for the year, using tax rates enacted or substantively enacted at the reporting date, and any adjustment to tax payable in respect of previous years.
Deferred tax
Deferred tax is recognised in respect of temporary differences between the carrying amounts of assets and liabilities for financial reporting purposes and the amounts used for taxation purposes. The amount of deferred tax provided is based on the expected manner of realisation or settlement of the carrying value of assets and liabilities using tax rates enacted or substantially enacted at the reporting date.
Deferred tax assets and liabilities are offset if there is a legally enforceable right to offset current tax assets and liabilities, and they relate to taxes levied by the same tax authority on the same taxable entity, or on different tax entities, but they intend to settle current tax assets and liabilities on a net basis or their tax assets and liabilities will be realised simultaneously.
A deferred tax asset is recognised for unused tax losses, tax credits and deductible temporary differences to the extent that it is probable that future taxable profits will be available against which they can be utilised. Deferred tax assets are reviewed at each reporting date and are reduced to the extent that it is no longer probable that the related tax benefit will be realised.

Ras Al Khaimah Ceramics PSC and its subsidiaries
Notes (continued)
33
4 Significant accounting policies (continued)
Tax (continued) Deferred tax (continued) A deferred tax is not recognised for: Temporary differences on the initial recognition of assets or liabilities in a transaction that is
not a business combination and that affects neither accounting nor taxable profit or loss; Temporary differences related to investments in subsidiaries, associates and joint
arrangements to the extent that the Group is able to control the timing of the reversal of the temporary differences and it is probable that they will not reverse in the foreseeable future; and
Taxable temporary differences arising on the initial recognition of goodwill.
Zakat
In respect of operations in certain subsidiaries and equity accounted investees, zakat is provided in accordance with relevant fiscal regulations. Zakat is recognised in profit or loss except to the extent it relates to items recognised directly in equity, in which case it is recognised in equity.
The provision for zakat is charged to profit or loss. Additional amount, if any, that may become due on finalisation of an asset is accounted for in the year in which assessment is finalised.
Leases
Lease payments
In respect of finance lease, lease payments are apportioned between finance charges and reduction of lease liability so as to achieve a constant rate of interest on the remaining balance of liability. Finance charges are reflected in profit or loss.
Leases in terms of which the lessor effectively retains all risks and rewards of ownership are classified as operating lease. Operating leases payments are recognised as an expense in profit or loss on a straight-line basis over the term of the lease. Lease incentives received are recognised as an integral part of the total lease expense, over the term of the lease. Earnings per share
The Group presents basic and diluted earnings per share data for its ordinary shares. Basic earnings per share is calculated by dividing the profit or loss attributable to ordinary shareholders of the Company by the weighted average number of ordinary shares outstanding during the year, adjusted for own shares held. Diluted earnings per share is determined by adjusting the profit or loss attributable to ordinary shareholders and the weighted average number of ordinary shares outstanding, adjusted for own shares held, for the effects of all dilutive potential ordinary shares. Government grants Government grants are recognised at nominal value when there is reasonable assurance that they will be received and the Group will comply with the conditions associated with the grant. Grants that compensate the Group for expenses incurred are recognised in the profit or loss on a systematic basis in the same periods in which the expenses are recognised.

Ras Al Khaimah Ceramics PSC and its subsidiaries
Notes (continued)
34
4 Significant accounting policies (continued)
Segment reporting An operating segment is a component of the Group that engages in business activities from which it may earn revenues and incur expenses, including revenues and expenses that relate to transactions with any of the Group’s other components. Segment results that are reported to the Company’s CEO (the chief operating decision maker) include items directly attributable to a segment as well as those that can be allocated on a reasonable basis. Segment capital expenditure is the total cost incurred during the year to acquire property, plant and equipment, and intangible assets other than goodwill. New standards and interpretations not yet adopted A number of new standards, amendments to standards and interpretations are effective for the annual periods beginning after 1 January 2013, and have not been applied in preparing these consolidated financial statements. Those which may be relevant to the Group are set out below. The Group does not plan to adopt this standard early. IFRS 9 Financial instruments (2010), IFRS 9 Financial instruments (2009): IFRS 9 (2009)
introduces new requirements for the classification and measurement of financial assets. Under IFRS 9 (2009), financial assets are classified and measured based on the business model in which they are held and the characteristics of their contractual cash flows. IFRS 9 (2010) introduces additional changes relating to financial liabilities. The IASB currently has an active project to make limited amendments to the classification and measurement requirements of IFRS 9 and add new requirements to address the impairment of financial assets and hedge accounting. IFRS 9 (2010 and 2009) is effective for annual periods beginning on or after 1 January 2015, with early adoption permitted.
5 Acquisition and disposal of subsidiaries and non-controlling interests
(a) Acquisitions Acquisition of a subsidiary in 2013
Effective 1 January 2013, the Company has obtained control of Al Hamra Construction Company LLC (a jointly controlled entity until 31 December 2012) by transfer of 50 percent of the shares and voting rights in that entity from a related party at a nominal consideration of AED 100 (refer note 28). The Company’s holding in this entity is now 100%. Considering that the investee is under common control of the majority shareholders of the Company, the acquisition accounting had been done based on book values at the date of acquisition. Al Hamra Construction Company LLC is engaged mainly in the construction of commercial and residential properties. Also refer note 15.
In the period from acquisition of controlling interest in Al Hamra Construction Company LLC up to 31 December 2013, the investee contributed revenue of AED 335.37 million and profit of AED 83.78 million to the Group’s results.

Ras Al Khaimah Ceramics PSC and its subsidiaries
Notes (continued)
35
5 Acquisition and disposal of subsidiaries and non-controlling interests (continued)
(a) Acquisitions (continued) Acquisition of a subsidiary in 2013(continued)
The book values of the identifiable assets and liabilities of Al Hamra Construction LLC acquired by the Company were as follows:
Book value AED’000
Assets: Property, plant and equipment 56,228 Investments 30 Loans and advances 17,665 Inventory and work in progress 30,174 Trade receivables 51,533 Due from related parties 366,931 Cash in hand and at bank 8,051
---------- Total assets acquired 530,612
---------- Liabilities: Trade and other payables 153,441 Due to related parties 40,493 Bank borrowings 43,792 Provision for employees’ end-of-service benefits 9,134
---------- Total liabilities acquired 246,860
----------
Net assets acquired 283,752 ======
Consideration paid - Book value of pre-existing interest in Al Hamra Construction Company LLC (refer note 15) (141,876)
======
Gain on acquisition recognised in equity 141,876 ======
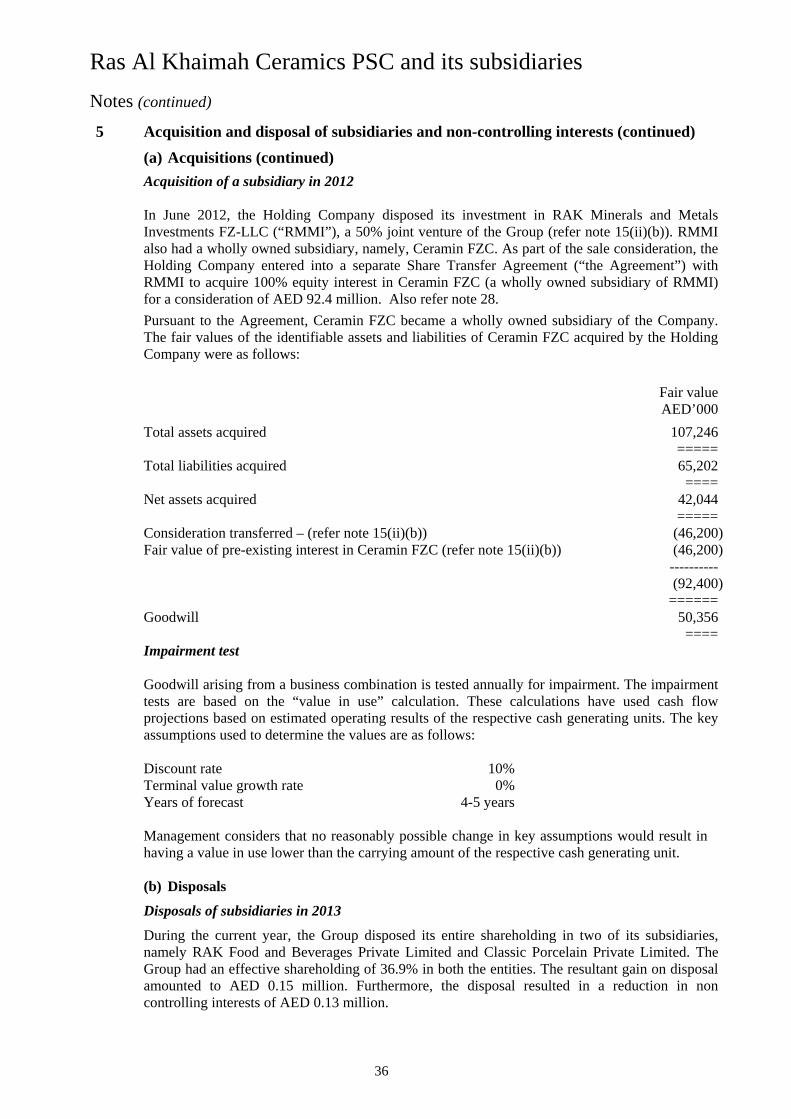
Ras Al Khaimah Ceramics PSC and its subsidiaries
Notes (continued)
36
5 Acquisition and disposal of subsidiaries and non-controlling interests (continued)
(a) Acquisitions (continued)
Acquisition of a subsidiary in 2012
In June 2012, the Holding Company disposed its investment in RAK Minerals and Metals Investments FZ-LLC (“RMMI”), a 50% joint venture of the Group (refer note 15(ii)(b)). RMMI also had a wholly owned subsidiary, namely, Ceramin FZC. As part of the sale consideration, the Holding Company entered into a separate Share Transfer Agreement (“the Agreement”) with RMMI to acquire 100% equity interest in Ceramin FZC (a wholly owned subsidiary of RMMI) for a consideration of AED 92.4 million. Also refer note 28.
Pursuant to the Agreement, Ceramin FZC became a wholly owned subsidiary of the Company. The fair values of the identifiable assets and liabilities of Ceramin FZC acquired by the Holding Company were as follows:
Fair value AED’000
Total assets acquired 107,246 =====
Total liabilities acquired 65,202 ====
Net assets acquired 42,044 =====
Consideration transferred – (refer note 15(ii)(b)) (46,200)Fair value of pre-existing interest in Ceramin FZC (refer note 15(ii)(b)) (46,200)
---------- (92,400) ======
Goodwill 50,356 ==== Impairment test
Goodwill arising from a business combination is tested annually for impairment. The impairment tests are based on the “value in use” calculation. These calculations have used cash flow projections based on estimated operating results of the respective cash generating units. The key assumptions used to determine the values are as follows:
Discount rate 10% Terminal value growth rate 0% Years of forecast 4-5 years
Management considers that no reasonably possible change in key assumptions would result in having a value in use lower than the carrying amount of the respective cash generating unit. (b) Disposals
Disposals of subsidiaries in 2013
During the current year, the Group disposed its entire shareholding in two of its subsidiaries, namely RAK Food and Beverages Private Limited and Classic Porcelain Private Limited. The Group had an effective shareholding of 36.9% in both the entities. The resultant gain on disposal amounted to AED 0.15 million. Furthermore, the disposal resulted in a reduction in non controlling interests of AED 0.13 million.

Ras Al Khaimah Ceramics PSC and its subsidiaries
Notes (continued)
37
6 Revenue 2013 2012 AED’000 AED’000
Sale of goods 2,944,992 2,846,072 Rendering of services 116,195 79,687 Construction contract revenue 453,618 242,375 ------------ ----------- 3,514,805 3,168,134 ======= =======
7 Cost of sales 2013 2012 AED’000 AED’000
Raw materials consumed 1,169,671 1,012,861 Provision for slow moving and obsolete inventory (refer note 16) 8,374 17,524 Provision for write down of inventory to net realisable value (refer note 16) 32,535 40,121 Direct labour 268,731 254,658 Power and fuel 183,112 200,006 LPG and natural gases 269,822 288,658 Depreciation (refer note 12) 122,335 105,328 Repairs and maintenance 258,548 303,197 Amortisation of intangible assets (refer note 13) 123 377 Sub-contractors’ fee 170,865 4,351 Others 68,014 84,175
------------ ----------- 2,552,130 2,311,256 ======= =======
8 Administrative and general expenses 2013 2012 AED’000 AED’000
Staff costs 91,943 86,211 Depreciation (refer note 12) 20,889 23,949 Depreciation on investment properties (refer note 14) 7,278 7,184 Telephone, postal and office supplies 12,178 12,192 Repairs and maintenance 16,970 14,713 Legal and professional fee 9,713 8,414 Rental cost 8,385 10,941 Utility expenses 4,187 3,194 Security charges 3,808 3,002 Amortisation of intangible assets (refer note 13) 2,435 2,600 Impairment loss on trade receivables (refer note 33) 63,997 73,716 Impairment loss on amounts due from related parties (refer note 33) 12,875 51,295 Loss on sale of investments classified as held for sale 4,347 - Loss on revaluation of investments at fair value through profit or loss (refer note 21) - 44 Insurance cost 10,889 7,694 Others 20,921 35,337 ---------- ---------- 290,815 340,486 ====== ======

Ras Al Khaimah Ceramics PSC and its subsidiaries
Notes (continued)
38
9 Selling and distribution expenses 2013 2012
AED’000 AED’000
Staff costs 70,321 64,334 Freight and transportation 161,010 144,811 Performance rebates 84,796 75,590 Advertisement and promotions 55,116 72,806 Travel and entertainment 2,547 4,406 Depreciation (refer note 12) 2,633 3,585 Others 14,407 12,814 ---------- --------- 390,830 378,346 ====== =====
10 Other income 2013 2012 AED’000 AED’000
Rental income from investment properties (refer note 14) 18,378 22,497 Sale of scrap and miscellaneous items 18,017 13,715 Insurance claims 238 337 Gain on disposal of property, plant and equipment 287 1,395 Tax subsidies (i) 746 4,458 Capital gain on sale of investments 148 - Supplier settlement discounts (ii) 9,642 933 Other miscellaneous income 20,815 15,646 -------- -------- 68,271 58,981 ===== =====
(i) This represents sales tax and custom duty subsidies received by a Group entity in India. (ii) Pertains to discounts received from suppliers as part of the settlement negotiations.
11 Finance income and expense 2013 2012 AED’000 AED’000
Finance income
Interest on fixed deposits 6,554 5,657 Net change in the fair value of derivatives (refer note 27(iii)) 5,227 2,170 Interest on amounts due from related parties (including unwinding of discount on long term receivables) (refer note 28) 14,364 4,037 Others 5,211 11,962 -------- --------- 31,356 23,826 ===== ===== Finance expense
Interest on bank borrowings 77,146 98,238 Interest on amounts due to related parties (refer note 28) 1,648 1,741 Bank charges 21,231 19,527 Net foreign exchange loss 18,972 35,221 --------- --------- 118,997 154,727 ===== =====
Net finance expense recognised in profit or loss 87,641 130,901 ===== =====
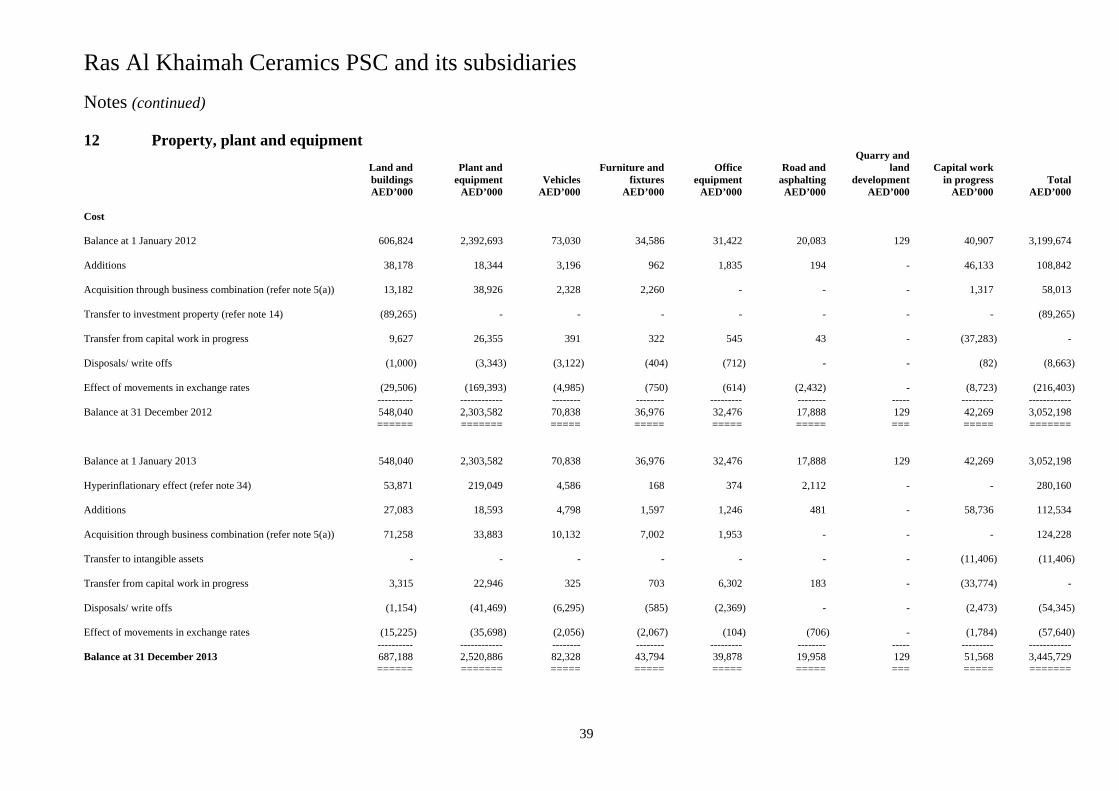
Ras Al Khaimah Ceramics PSC and its subsidiaries
Notes (continued)
39
12 Property, plant and equipment Quarry and Land and Plant and Furniture and Office Road and land Capital work buildings equipment Vehicles fixtures equipment asphalting development in progress Total AED’000 AED’000 AED’000 AED’000 AED’000 AED’000 AED’000 AED’000 AED’000 Cost Balance at 1 January 2012 606,824 2,392,693 73,030 34,586 31,422 20,083 129 40,907 3,199,674 Additions 38,178 18,344 3,196 962 1,835 194 - 46,133 108,842 Acquisition through business combination (refer note 5(a)) 13,182 38,926 2,328 2,260 - - - 1,317 58,013 Transfer to investment property (refer note 14) (89,265) - - - - - - - (89,265) Transfer from capital work in progress 9,627 26,355 391 322 545 43 - (37,283) - Disposals/ write offs (1,000) (3,343) (3,122) (404) (712) - - (82) (8,663) Effect of movements in exchange rates (29,506) (169,393) (4,985) (750) (614) (2,432) - (8,723) (216,403) ---------- ------------ -------- -------- --------- -------- ----- --------- ------------ Balance at 31 December 2012 548,040 2,303,582 70,838 36,976 32,476 17,888 129 42,269 3,052,198 ====== ======= ===== ===== ===== ===== === ===== ======= Balance at 1 January 2013 548,040 2,303,582 70,838 36,976 32,476 17,888 129 42,269 3,052,198 Hyperinflationary effect (refer note 34) 53,871 219,049 4,586 168 374 2,112 - - 280,160 Additions 27,083 18,593 4,798 1,597 1,246 481 - 58,736 112,534 Acquisition through business combination (refer note 5(a)) 71,258 33,883 10,132 7,002 1,953 - - - 124,228 Transfer to intangible assets - - - - - - - (11,406) (11,406) Transfer from capital work in progress 3,315 22,946 325 703 6,302 183 - (33,774) - Disposals/ write offs (1,154) (41,469) (6,295) (585) (2,369) - - (2,473) (54,345) Effect of movements in exchange rates (15,225) (35,698) (2,056) (2,067) (104) (706) - (1,784) (57,640) ---------- ------------ -------- -------- --------- -------- ----- --------- ------------ Balance at 31 December 2013 687,188 2,520,886 82,328 43,794 39,878 19,958 129 51,568 3,445,729 ====== ======= ===== ===== ===== ===== === ===== =======

Ras Al Khaimah Ceramics PSC and its subsidiaries
Notes (continued)
40
12 Property, plant and equipment (continued) Quarry and Land and Plant and Furniture and Office Road and land Capital work buildings equipment Vehicles fixtures equipment asphalting development in progress Total AED’000 AED’000 AED’000 AED’000 AED’000 AED’000 AED’000 AED’000 AED’000 Accumulated depreciation and impairment losses At 1 January 2012 224,257 1,621,692 60,775 18,411 26,261 13,557 129 - 1,965,082 Charge for the year 17,235 103,632 5,382 3,439 2,455 719 - - 132,862 Acquisition through business combination (refer note 5(a)) 4,545 14,496 2,044 1,780 - - - - 22,865 Transfer to investment property (refer note 14) (4,945) - - - - - - - (4,945) On disposals/ write offs (999) (2,987) (2,485) (319) (658) - - - (7,448) Effect of movements in exchange rates (11,100) (77,872) (4,121) (722) (419) (1,251) - - (95,485) ---------- ------------ -------- -------- --------- -------- ----- --- ------------ Balance at 31 December 2012 228,993 1,658,961 61,595 22,589 27,639 13,025 129 - 2,012,931 ====== ======= ===== ===== ===== ===== === == ======= Balance at 1 January 2013 228,993 1,658,961 61,595 22,589 27,639 13,025 129 - 2,012,931 Hyperinflationary effect (refer note 34) 24,001 98,458 3,702 58 117 658 - - 126,994 Charge for the year 22,827 110,543 4,295 3,743 3,651 798 - - 145,857 Acquisition through business combination (refer note 5(a)) 17,556 33,436 9,324 6,060 1,624 - - - 68,000 On disposals/ write offs (1,141) (39,714) (5,858) (551) (2,157) - - - (49,421) Effect of movements in exchange rates (2,609) (21,231) (1,662) (1,570) (13) (527) - - (27,612) ---------- ------------ -------- -------- --------- -------- ----- -- ------------ Balance at 31 December 2013 289,627 1,840,453 71,396 30,329 30,861 13,954 129 - 2,276,749 ====== ======= ===== ===== ===== ===== === = ======= Net book value At 31 December 2013 397,561 680,433 10,932 13,465 9,017 6,004 - 51,568 1,168,980 ===== ====== ===== ====== ===== ===== == ===== ======= At 31 December 2012 319,047 644,621 9,243 14,387 4,837 4,863 - 42,269 1,039,267 ===== ===== ==== ==== === ==== == ===== =======

Ras Al Khaimah Ceramics PSC and its subsidiaries
Notes (continued)
41
12 Property, plant and equipment (continued)
The depreciation charge has been allocated as follows: 2013 2012 AED’000 AED’000
Cost of sales (refer note 7) 122,335 105,328 Administrative and general expenses (refer note 8) 20,889 23,949
Selling and distribution expenses (refer note 9) 2,633 3,585 ---------- ---------
145,857 132,862 ====== ======
(i) Land and buildings
The Group’s certain factory buildings and investment properties are constructed on plots of land measuring 46,634,931 sq.ft. which were received from the Government of Ras Al Khaimah under an Emiri Decree, free of cost as a Government grant. These plots of land are recorded at nominal value. Also refer note 14.
(ii) Capital work-in-progress
Capital work in progress mainly includes building structure under construction and heavy equipment, machinery and software under installation.
(iii) Transfer to investment properties
In the previous year, the Group had transferred a hotel building with the net book value of AED 84.32 million to investment property which was leased to a third party to earn rental income (refer note 14).
(iv) Change in estimates
During the current year, management has carried out a review of the useful lives of property, plant and equipment and buildings and has revised the useful life of plant and equipment from 10 years to 15 years and buildings from 22 years to 30 years of their Group entities, RAK (Gao Yao) Ceramics Co. Limited and RAK Universal Plastics Industries LLC. The revision in estimated useful life is effective from 1 January 2013 and has been treated as a change in accounting estimate in accordance with International Accounting Standard (“IAS”) 8, ‘Accounting policies, changes in accounting estimates and errors’ and applied prospectively from the effective date. Had there been no such change in estimate of useful life, the depreciation charge for property, plant and equipment for the year ended 31 December 2013 would have been higher and the profit for the year would have been lower by AED 7.91 million. The effect of this change on the depreciation expense recognised in profit or loss, in future years is as follows: 2014 2015 2016 2017 2018 Later -----------------------(AED in millions)------------------------ (Decrease) / increase in depreciation expense (7.68) (7.69) 0.56 2.60 2.75 9.46

Ras Al Khaimah Ceramics PSC and its subsidiaries
Notes (continued)
42
13 Intangible assets 2013 2012 AED’000 AED’000
Balance at 1 January 7,077 7,932 Additions during the year (including transfer from property, plant and equipment) 15,767 2,986 Amortisation during the year (2,558) (2,977) Effect of movements in exchange rates 173 (864) -------- ------- Balance at 31 December 20,459 7,077 ==== ====
Intangible assets mainly include an ERP software (SAP) which is implemented during the current year in the Holding Company and licenses acquired to use formulation for pharmaceutical products in Bangladesh. These are amortised over the period for which the software is used and licence is acquired, which is in the range from 5 to15 years. Amortisation for the year has been allocated as follows:
2013 2012 AED’000 AED’000
Cost of sales (refer note 7) 123 377 Administrative and general expenses (refer note 8) 2,435 2,600
------- ------ 2,558 2,977 ==== ====
14 Investment properties
2013 2012 AED’000 AED’000
Cost
Balance at 1 January 266,342 176,805 Transfers from property, plant and equipment (refer note (i) below) - 89,265 Effect of movements in exchange rates (1,187) 272 ---------- ---------- Balance at 31 December 265,155 266,342
====== =====
Accumulated depreciation and impairment losses
2013 2012 AED’000 AED’000
Balance at 1 January 35,713 23,584 Charge for the year (refer note 8) 7,278 7,184 Transfer from property, plant and equipment (refer note 12) - 4,945 --------- --------- Balance 31 December 42,991 35,713
===== ===== Net book value – at 31 December 222,164 230,629
====== ===== Fair value – at 31 December 398,205 361,995
====== =====
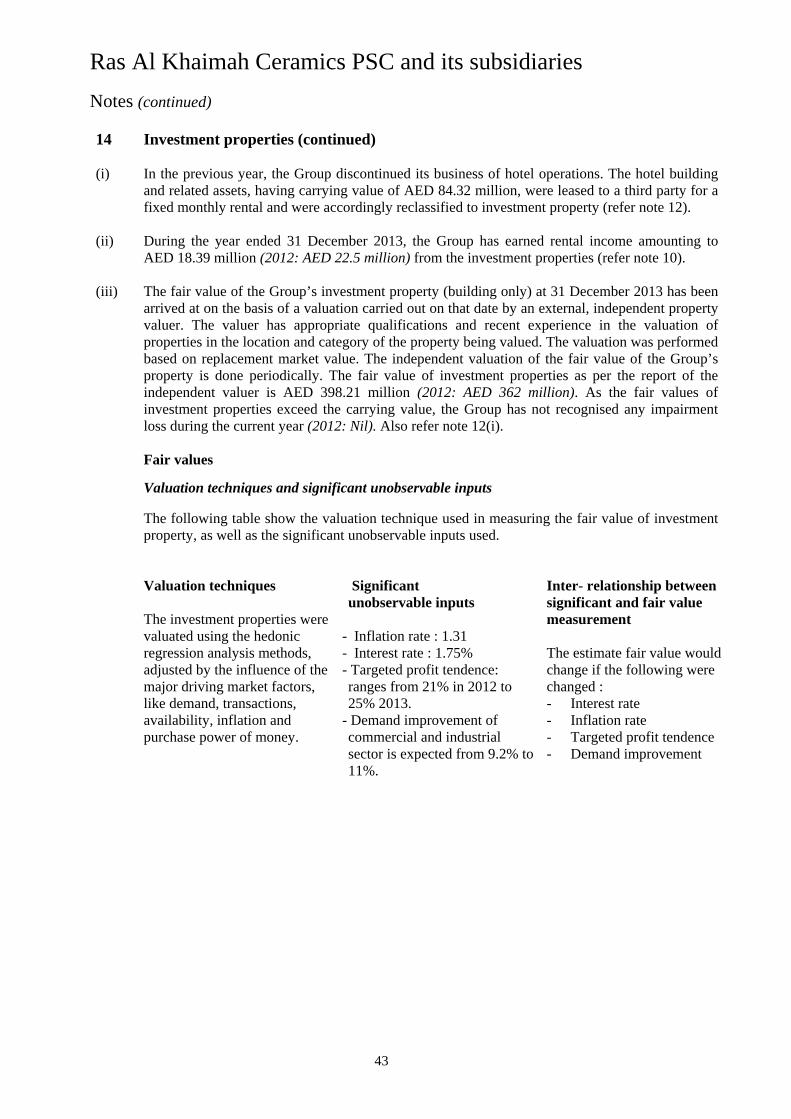
Ras Al Khaimah Ceramics PSC and its subsidiaries
Notes (continued)
43
14 Investment properties (continued)
(i) In the previous year, the Group discontinued its business of hotel operations. The hotel building
and related assets, having carrying value of AED 84.32 million, were leased to a third party for a fixed monthly rental and were accordingly reclassified to investment property (refer note 12).
(ii) During the year ended 31 December 2013, the Group has earned rental income amounting to AED 18.39 million (2012: AED 22.5 million) from the investment properties (refer note 10).
(iii) The fair value of the Group’s investment property (building only) at 31 December 2013 has been
arrived at on the basis of a valuation carried out on that date by an external, independent property valuer. The valuer has appropriate qualifications and recent experience in the valuation of properties in the location and category of the property being valued. The valuation was performed based on replacement market value. The independent valuation of the fair value of the Group’s property is done periodically. The fair value of investment properties as per the report of the independent valuer is AED 398.21 million (2012: AED 362 million). As the fair values of investment properties exceed the carrying value, the Group has not recognised any impairment loss during the current year (2012: Nil). Also refer note 12(i).
Fair values
Valuation techniques and significant unobservable inputs
The following table show the valuation technique used in measuring the fair value of investment property, as well as the significant unobservable inputs used. Valuation techniques The investment properties were valuated using the hedonic regression analysis methods, adjusted by the influence of the major driving market factors, like demand, transactions, availability, inflation and purchase power of money.
Significant unobservable inputs
- Inflation rate : 1.31 - Interest rate : 1.75% - Targeted profit tendence: ranges from 21% in 2012 to 25% 2013.
- Demand improvement of commercial and industrial sector is expected from 9.2% to 11%.
Inter- relationship between significant and fair value measurement The estimate fair value would change if the following were changed : - Interest rate - Inflation rate - Targeted profit tendence - Demand improvement
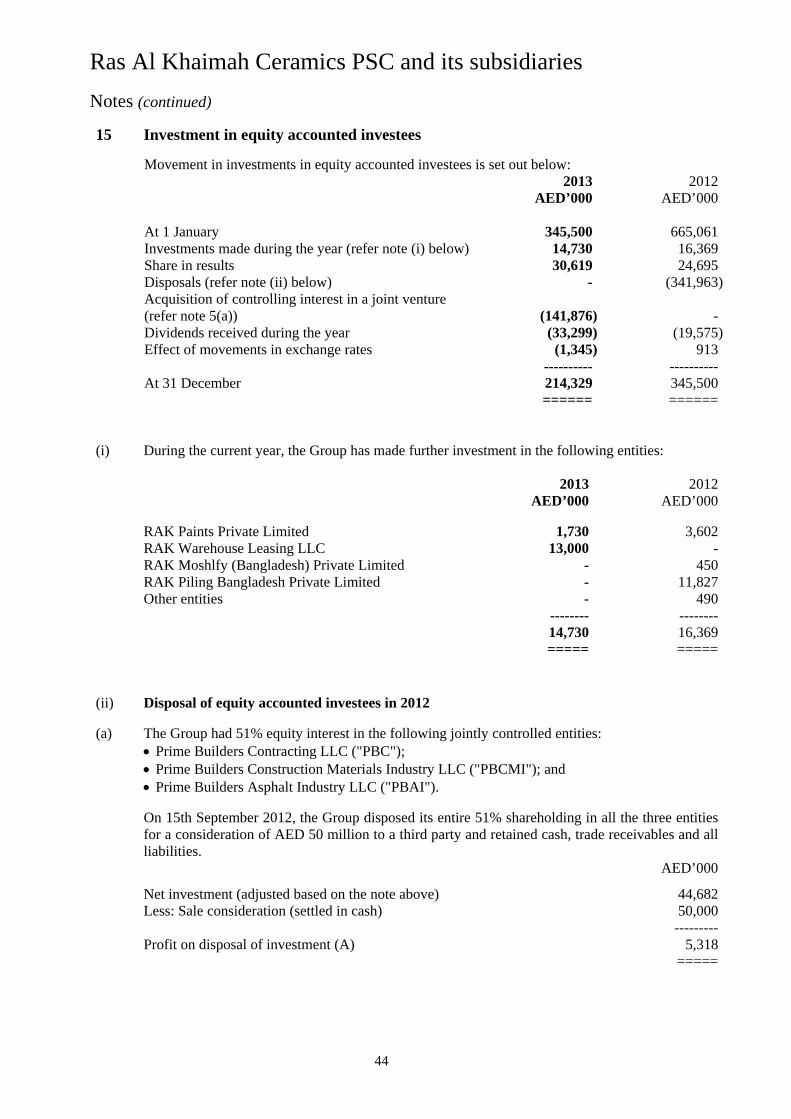
Ras Al Khaimah Ceramics PSC and its subsidiaries
Notes (continued)
44
15 Investment in equity accounted investees
Movement in investments in equity accounted investees is set out below: 2013 2012
AED’000 AED’000
At 1 January 345,500 665,061 Investments made during the year (refer note (i) below) 14,730 16,369 Share in results 30,619 24,695 Disposals (refer note (ii) below) - (341,963) Acquisition of controlling interest in a joint venture (refer note 5(a)) (141,876) - Dividends received during the year (33,299) (19,575) Effect of movements in exchange rates (1,345) 913 ---------- ---------- At 31 December 214,329 345,500 ====== ======
(i) During the current year, the Group has made further investment in the following entities: 2013 2012 AED’000 AED’000 RAK Paints Private Limited 1,730 3,602 RAK Warehouse Leasing LLC 13,000 - RAK Moshlfy (Bangladesh) Private Limited - 450 RAK Piling Bangladesh Private Limited - 11,827 Other entities - 490 -------- -------- 14,730 16,369 ===== =====
(ii) Disposal of equity accounted investees in 2012
(a) The Group had 51% equity interest in the following jointly controlled entities: Prime Builders Contracting LLC ("PBC"); Prime Builders Construction Materials Industry LLC ("PBCMI"); and Prime Builders Asphalt Industry LLC ("PBAI").
On 15th September 2012, the Group disposed its entire 51% shareholding in all the three entities for a consideration of AED 50 million to a third party and retained cash, trade receivables and all liabilities.
AED’000
Net investment (adjusted based on the note above) 44,682 Less: Sale consideration (settled in cash) 50,000
--------- Profit on disposal of investment (A) 5,318
=====

Ras Al Khaimah Ceramics PSC and its subsidiaries
Notes (continued)
45
15 Investment in equity accounted investees (continued) (ii) Disposal of equity accounted investees in 2012 (continued)
(b) The Group had 50% equity interest in a jointly controlled entity “RAK Mineral and Metals Investment FZC” (“RMMI”). RMMI owns a 100% subsidiary known as Ceramin FZC. On 28 June 2012, the Group disposed its entire 50% shareholding in RMMI to a related party, and recognised a profit of AED 128.8 million on disposal of RMMI.
AED’000
Net carrying value of investment 130,900 Less: Sale consideration (refer note below) 259,700
--------- Profit on disposal of investment in RMMI (B) 128,800 ====== Total profit on disposal of equity accounted investees (A+B) 134,118 =====
The consideration was partly settled by transfer of 100% shareholding in Ceramin FZC valued at AED 92.40 million (refer note 5) and partly by cash of AED 120 million and cash receivable of AED 47.30 million. The receivables amount was included in other related party receivables (refer note 28).
The above amount includes profit on fair valuation of the Group’s existing 50% equity interest in Ceramin, amounting to AED 21.2 million (refer note 5).
The above transactions were carried out in the ordinary course of business of the Group.
(c) The Group had disposed off its 24% equity interest in a jointly controlled entity “Prestige Land Private Company” to a related party at carrying value of AED 116.22 million. As per the terms of the agreement, the amount was to be paid in ten equal annual instalments of AED 14.3 million commencing from 2013 till 2022 (also refer note 28).
(d) The Group had disposed off its entire shareholding in MEC and MEC FZC to a related party, at
carrying value of AED 131.21 million. As per the terms of the agreement, the amount was to be paid in ten equal annual instalments of AED 16 million commencing from 2013 till 2022 (refer note 28).
(iii) In 2012, three of the Group’s equity accounted investees, namely Elegance Ceramiche SRL, RAK
Ceramics ITALIA SRL and RAK Distribution Europe SRL were merged into RAK Distribution Europe SRL resulting in a reduction in ownership interest by 10%, 10% and 45% respectively. Accordingly a loss of AED 0.62 million was recorded. Furthermore, the Group’s investment in RAK Distribution Europe SRL is held in the name of one Director of the Company for the beneficial interest of the Group.
(iv) The Group has not recognised losses of RAK Ceramics UK Limited and RAK Ceramics GmBH
amounting to AED 0.83 million and AED 1.4 million (2012: AED 1.79 million and Nil) respectively over and above the Group’s initial investment, since the Group has no obligation in respect of these losses.

Ras Al Khaimah Ceramics PSC and its subsidiaries
Notes (continued)
46
15 Investment in equity accounted investees (continued)
The following summarises the information relating to each of the Group’s investment in equity accounted investees.
Equity accounted investees within UAE outside UAE Total
December 2013 2012 2013 2012 2013 2012
-----------------------------------------------------------AED ‘000---------------------------------
Non-current assets 210,932 257,652 74,018 88,068 284,950 345,720 Current assets 257,257 786,330 409,799 312,189 667,056 1,098,519 Non-current liabilities 67,357 115,478 27,904 53,298 95,261 168,776 Current liabilities 101,037 389,197 347,043 206,000 448,080 595,197
Net assets 299,795 539,307 108,870 140,959 408,665 680,266
Group’s share of net assets 147,565 271,904 66,920 80,310 214,485 352,214
Elimination of unrealised profit on downstream sales - 9 156 6,705 156 6,714
Carrying amount of interest in equity accounted investees 147,565 271,895 66,764 73,605 214,329 345,500
==== ==== ===== ===== ===== ======
Revenue 303,992 542,444 557,427 613,959 861,419 1,156,403 Profit and total comprehensive income 71,638 69,770 320 14,000 71,958 83,770 Group’s share 33,069 24,115 (2,294) 7,294 30,775 31,409
Elimination of unrealised profit on downstream sales - 9 156 6,705 156 6,714
Group’s share of profit and total comprehensive income 33,069 24,106 (2,450) 589 30,619 24,695
Dividend received by the Group 24,080 18,652 9,219 923 33,299 19,575 ===== ===== ==== === ===== =====

Ras Al Khaimah Ceramics PSC and its subsidiaries
Notes (continued)
47
16 Inventories 2013 2012 AED’000 AED’000
Finished goods 603,885 533,719 Less: Provision for slow moving and obsolete inventories (27,114) (21,875) ---------- ---------- 576,771 511,844 Raw materials 306,042 280,043 Goods-in-transit 39,499 51,744 Work-in-progress 22,239 15,023 Stores and spares 208,655 210,538 ----------- ---------- 1,153,206 1,069,192 Less: Provision for slow moving raw materials and stores and spares * (37,513) (34,378) ------------ ------------ 1,115,693 1,034,814 ======= =======
* Stores and spares are depreciated based on the useful life of the plant until they are issued to the factory for capitalisation. The depreciation charge is recognised in these consolidated financial statements under provision for inventories.
During the year, the Group recognised a write-down of finished goods inventory to net realisable value of AED 32.54 million against the cost of AED 210.25 million (2012: AED 40.12 million against the cost of 166.54 million ) (refer note 7).
Inventories amounting to AED 190.37 million (2012: AED 103.13 million) are subject to a charge in favour of banks against facilities obtained by the Group (refer note 24(vii)).
The movement in provision for slow moving inventories is as follows:
2013 2012 AED’000 AED’000
As at 1 January 56,253 38,729 Charge for the year (refer note 7) 8,374 17,524 --------- -------- At 31 December 64,627 56,253 ===== =====
17 Trade and other receivables 2013 2012 AED’000 AED’000
Trade receivables 1,073,704 1,087,103 Less: Allowance for impairment losses (181,855) (150,723) ---------- ----------- 891,849 936,380 Advances 95,951 80,662 Deposits 13,097 12,003 Other receivables 109,759 69,554 ------------ ------------ 1,110,656 1,098,599 ======= =======
Trade receivables amounting to AED 186.18 million (2012: AED 65.85 million) are subject to a charge in favour of banks against facilities obtained by the Group (refer note 24(vii)).
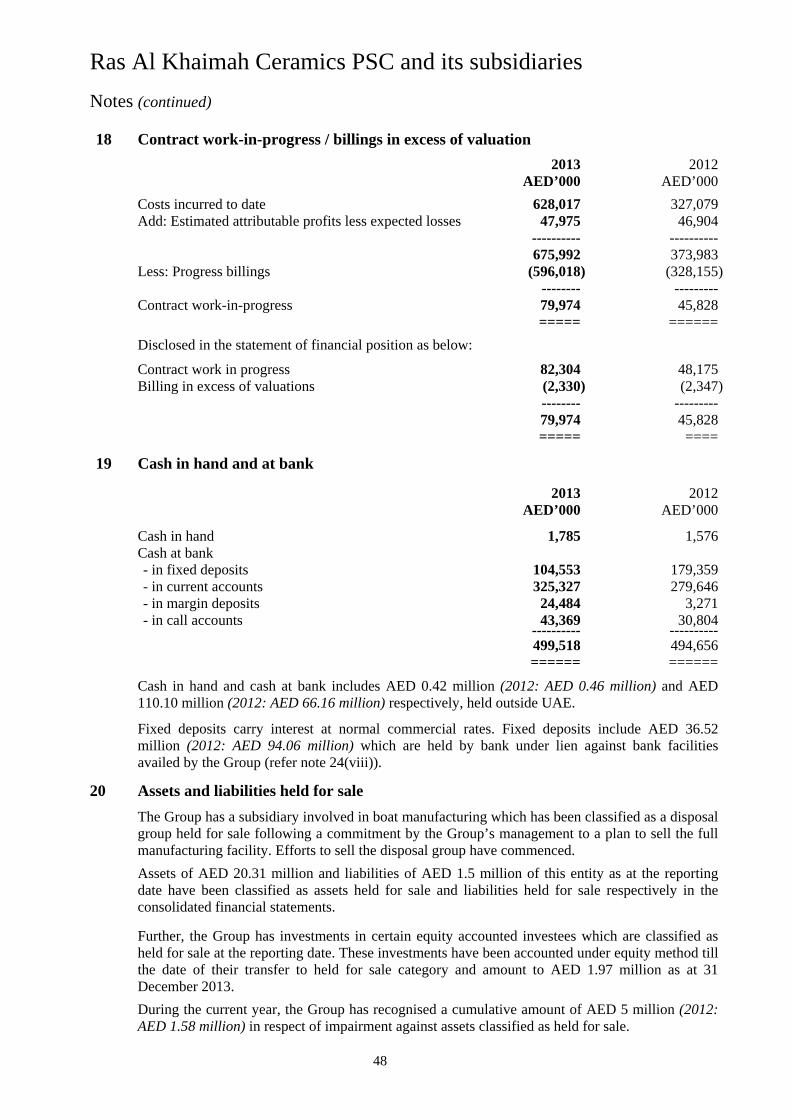
Ras Al Khaimah Ceramics PSC and its subsidiaries
Notes (continued)
48
18 Contract work-in-progress / billings in excess of valuation
2013 2012 AED’000 AED’000
Costs incurred to date 628,017 327,079 Add: Estimated attributable profits less expected losses 47,975 46,904 ---------- ---------- 675,992 373,983
Less: Progress billings (596,018) (328,155) -------- ---------
Contract work-in-progress 79,974 45,828 ===== ======
Disclosed in the statement of financial position as below:
Contract work in progress 82,304 48,175 Billing in excess of valuations (2,330) (2,347) -------- --------- 79,974 45,828 ===== ====
19 Cash in hand and at bank
2013 2012 AED’000 AED’000
Cash in hand 1,785 1,576 Cash at bank - in fixed deposits 104,553 179,359 - in current accounts 325,327 279,646 - in margin deposits 24,484 3,271 - in call accounts 43,369 30,804 ---------- ---------- 499,518 494,656 ====== ======
Cash in hand and cash at bank includes AED 0.42 million (2012: AED 0.46 million) and AED 110.10 million (2012: AED 66.16 million) respectively, held outside UAE.
Fixed deposits carry interest at normal commercial rates. Fixed deposits include AED 36.52 million (2012: AED 94.06 million) which are held by bank under lien against bank facilities availed by the Group (refer note 24(viii)).
20 Assets and liabilities held for sale
The Group has a subsidiary involved in boat manufacturing which has been classified as a disposal group held for sale following a commitment by the Group’s management to a plan to sell the full manufacturing facility. Efforts to sell the disposal group have commenced.
Assets of AED 20.31 million and liabilities of AED 1.5 million of this entity as at the reporting date have been classified as assets held for sale and liabilities held for sale respectively in the consolidated financial statements.
Further, the Group has investments in certain equity accounted investees which are classified as held for sale at the reporting date. These investments have been accounted under equity method till the date of their transfer to held for sale category and amount to AED 1.97 million as at 31 December 2013.
During the current year, the Group has recognised a cumulative amount of AED 5 million (2012: AED 1.58 million) in respect of impairment against assets classified as held for sale.

Ras Al Khaimah Ceramics PSC and its subsidiaries
Notes (continued)
49
21 Investments at fair value through profit or loss
In 2012, the Group carried investment in certain equity securities amounting AED 0.1 million which were classified as investments at fair value through profit or loss. During the current year, the Group has disposed off its investment in equity securities, classified at fair value through profit or loss, at a gain AED 0.15 million (refer note 10).
In the previous year, the Group had recognised a loss on revaluation of these investments at the reporting amounting to AED 0.04 million (refer note 8).
Information about the Group’s exposure to credit and market risk, and fair value measurement, is included in note 33.
22 Capital and reserves 2013 2012 AED’000 AED’000 (i) Share capital
Authorised and issued 170,000,000 shares of AED 1 each paid up in cash 170,000 170,000
573,202,460 shares of AED 1 each issued as bonus shares 573,202 573,202 ---------- --------- 743,202,460 shares of AED 1 each 743,202 743,202
===== =====
The holders of ordinary shares are entitled to receive dividends declared and are entitled to one vote per share at meetings of the Company. All shares rank equally with regard to the Company’s residual assets.
(ii) Share premium reserve AED’000 On the issue of shares of: - Ras Al Khaimah Ceramics PSC (refer note (a) below) 165,000 - RAK Ceramics (Bangladesh) Limited, Bangladesh (refer note (b) below) 60,391 Less: Share issue expenses (3,583) ---------- Total 221,808 ====== (a) In October 1998, the shareholders of the Company resolved to issue 15 million ordinary shares at
an exercise price of AED 12 per share resulting in share premium of AED 165 million.
(b) In February 2010, the shareholders of RAK Ceramics (Bangladesh) Limited resolved to issue 44.51 million ordinary shares at an exercise price of AED 1.36 per share resulting in share premium of AED 60.39 million. The share issue costs resulting from the increase in share capital of RAK Ceramics (Bangladesh) Limited of AED 3.58 million was recognised as a reduction in equity.
(iii) Translation reserve
The translation reserve comprises all foreign currency differences arising from the translation of the financial statements of foreign operations, as well as from the translation of monetary items that form part of Group’s net investment in foreign operations.

Ras Al Khaimah Ceramics PSC and its subsidiaries
Notes (continued)
50
22 Capital and reserves (continued)
(iv) Legal reserve
In accordance with the Articles of Association of entities in the Group and Article 255 of UAE Federal Law No. 8 of 1984 (as amended), 10% of the net profit for the year of the individual entities to which the law is applicable, has been transferred to a statutory reserve. Such transfers may be discontinued when the reserve equals 50% of the paid up share capital of these entities. This reserve is non-distributable except in certain circumstances as mentioned in the above Law. The consolidated statutory reserve reflects transfers made post acquisition for these subsidiary companies.
(v) General reserve General reserve of AED 82.8 million (2012: AED 82.8 million) represents net profit of prior years retained in reserve. This reserve is distributable.
(vi) Capital reserve
Capital reserve of AED 55.04 million (2012: AED 55.04 million) represents the Group’s share of retained earnings capitalised by various subsidiaries. The capital reserve is non-distributable.
(vii) Proposed dividend
For 2013, the Directors have proposed a cash dividend of AED 0.20 per share which will be submitted for approval of the shareholders at the Company’s Annual General Meeting in March 2014. On 23 April 2013, the shareholders of the Company in their Annual General Meeting approved the cash dividend (AED 0.2 per share) which was proposed by the Board of Directors.
(viii) Director’s fee At the Annual General Meeting (AGM) held on 23 April 2013, the shareholders approved the proposed Directors’ fees amounting to AED 2.4 million for the year ended 31 December 2012 which has been paid during the year.
23 Earnings per share
The calculation of basic earnings per share at 31 December 2013 is based on the profit attributable to ordinary shareholders of the Company of AED 282.4 million (2012: AED 223.08 million), and the weighted average number of ordinary shares outstanding of 743,202 thousand (2012: 743,202 thousand), calculated as follows: 2013 2012
Net profit attributable to owners of the Company (AED’000) 282,396 223,081 ====== ====== Weighted average number of shares outstanding (‘000s) 743,202 743,202 ====== ====== Earnings per share (AED) 0.38 0.30 === ===
There was no dilution effect on the basic earnings per share as the Company does not have any such outstanding commitment as at the reporting date.

Ras Al Khaimah Ceramics PSC and its subsidiaries
Notes (continued)
51
24 Bank borrowings 2013 2012 AED’000 AED’000
Short-term Bank overdrafts 26,997 111,572 Short-term loans 501,215 421,561 Trust receipts 48,861 286,613 Current portion of long-term loans 332,269 711,618 --------- ------------ 909,342 1,531,364 ===== =======
Long-term Bank loans 1,247,060 1,148,644 Less: Current portion of long-term loans (332,269) (711,618)
----------- ---------- 914,791 437,026 ====== ======
The terms and conditions of outstanding long-term loans were as follows: 2013 2012 Currency Interest range AED’000 AED’000 AUD 6.6% - 8.2% 19,898 25,924 BDT 14% - 17% 1,475 1,524 AED 4% - 8% 679 87,508 EUR 0.9% - 5.55% 38,766 52,490 INR 9.7%-10.3% 10,167 69 USD 2.25% - 3.25% 1,176,075 981,129 ------------ ------------ Total 1,247,060 1,148,644 ======= =======
The Group has obtained long term and short term facilities from various banks for financing acquisition of assets, project financing or to meet its working capital requirements. Majority of these bank borrowings are denominated either in the functional currencies of the respective borrowing entities or in USD, a currency against which the functional currency of the Company is pegged. Rate of interest on the above bank loans are based on normal commercial rates. The Group has taken interest rate swaps and currency swaps to hedge a portion of its interest rate risk and currency risk (refer note 27). The maturity profile of term loans range from 2014 to 2020.
These bank borrowings are secured by:
(i) Negative pledge over certain assets of the Group; (ii) Pari-passu rights with other unsecured and unsubordinated creditors; (iii) Mortgage / hypothecation of relevant motor vehicles in favour of the bank (refer note 12); (iv) Promissory note for AED 139 million; (v) Assignment of insurance over furniture, fixtures and equipments of certain Group entities
in favour of the bank; (vi) Corporate guarantee of the Company; (vii) Hypothecation of inventories and receivable of certain Group entities (refer notes 16 and
17); and (viii) Fixed deposits held under lien (refer note 19).
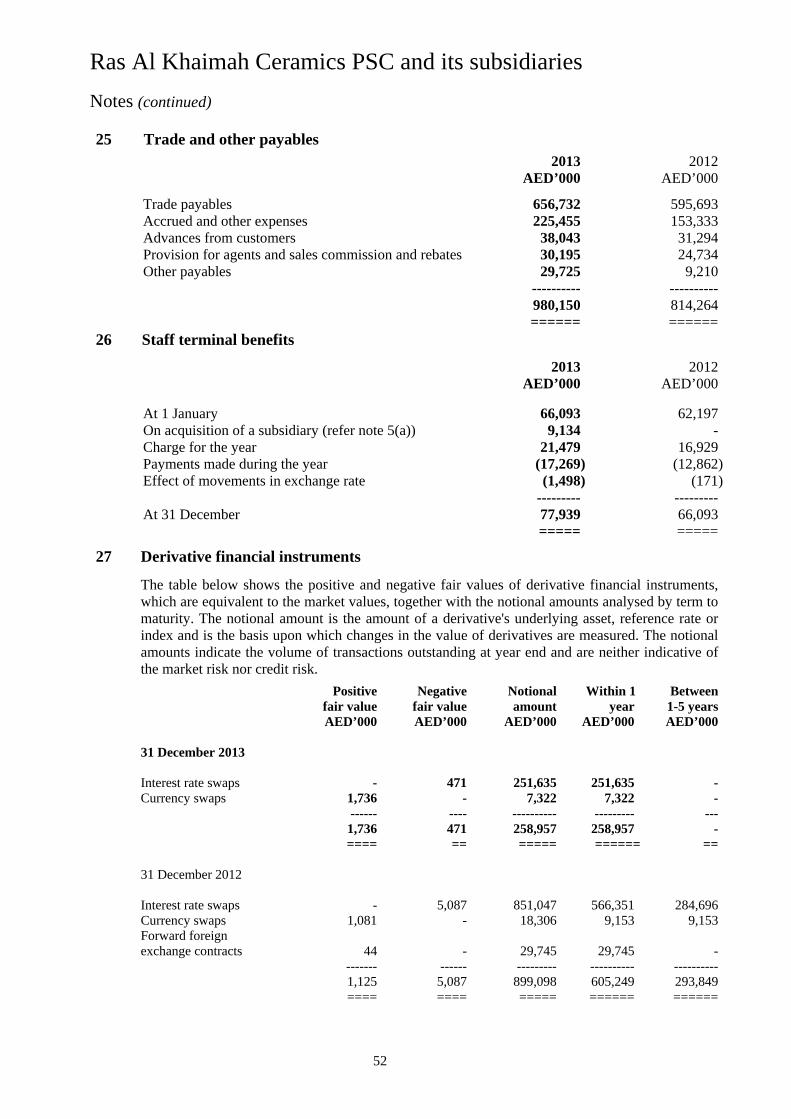
Ras Al Khaimah Ceramics PSC and its subsidiaries
Notes (continued)
52
25 Trade and other payables
2013 2012 AED’000 AED’000
Trade payables 656,732 595,693 Accrued and other expenses 225,455 153,333 Advances from customers 38,043 31,294 Provision for agents and sales commission and rebates 30,195 24,734 Other payables 29,725 9,210 ---------- ---------- 980,150 814,264 ====== ======
26 Staff terminal benefits
2013 2012 AED’000 AED’000
At 1 January 66,093 62,197 On acquisition of a subsidiary (refer note 5(a)) 9,134 - Charge for the year 21,479 16,929 Payments made during the year (17,269) (12,862) Effect of movements in exchange rate (1,498) (171) --------- --------- At 31 December 77,939 66,093 ===== =====
27 Derivative financial instruments
The table below shows the positive and negative fair values of derivative financial instruments, which are equivalent to the market values, together with the notional amounts analysed by term to maturity. The notional amount is the amount of a derivative's underlying asset, reference rate or index and is the basis upon which changes in the value of derivatives are measured. The notional amounts indicate the volume of transactions outstanding at year end and are neither indicative of the market risk nor credit risk.
Positive Negative Notional Within 1 Between fair value fair value amount year 1-5 years AED’000 AED’000 AED’000 AED’000 AED’000 31 December 2013
Interest rate swaps - 471 251,635 251,635 - Currency swaps 1,736 - 7,322 7,322 - ------ ---- ---------- --------- --- 1,736 471 258,957 258,957 - ==== == ===== ====== == 31 December 2012 Interest rate swaps - 5,087 851,047 566,351 284,696 Currency swaps 1,081 - 18,306 9,153 9,153 Forward foreign exchange contracts 44 - 29,745 29,745 - ------- ------ --------- ---------- ---------- 1,125 5,087 899,098 605,249 293,849 ==== ==== ===== ====== ======
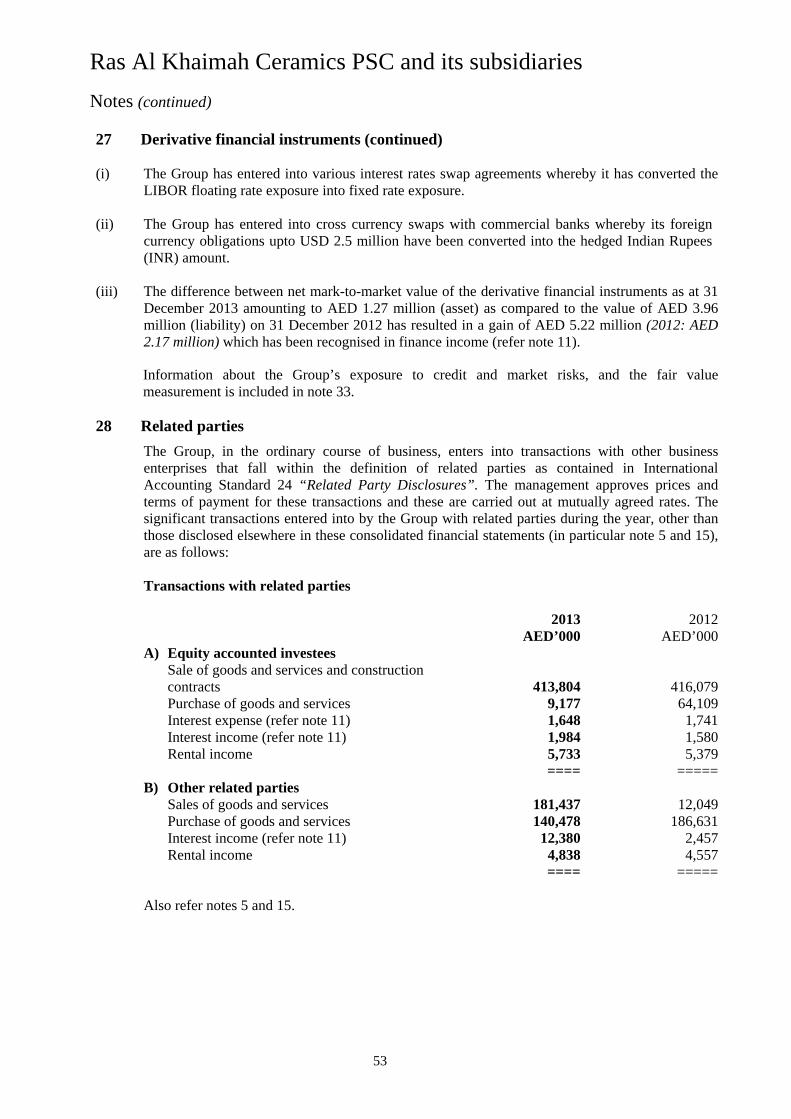
Ras Al Khaimah Ceramics PSC and its subsidiaries
Notes (continued)
53
27 Derivative financial instruments (continued)
(i) The Group has entered into various interest rates swap agreements whereby it has converted the
LIBOR floating rate exposure into fixed rate exposure. (ii) The Group has entered into cross currency swaps with commercial banks whereby its foreign
currency obligations upto USD 2.5 million have been converted into the hedged Indian Rupees (INR) amount.
(iii) The difference between net mark-to-market value of the derivative financial instruments as at 31
December 2013 amounting to AED 1.27 million (asset) as compared to the value of AED 3.96 million (liability) on 31 December 2012 has resulted in a gain of AED 5.22 million (2012: AED 2.17 million) which has been recognised in finance income (refer note 11).
Information about the Group’s exposure to credit and market risks, and the fair value measurement is included in note 33.
28 Related parties
The Group, in the ordinary course of business, enters into transactions with other business enterprises that fall within the definition of related parties as contained in International Accounting Standard 24 “Related Party Disclosures”. The management approves prices and terms of payment for these transactions and these are carried out at mutually agreed rates. The significant transactions entered into by the Group with related parties during the year, other than those disclosed elsewhere in these consolidated financial statements (in particular note 5 and 15), are as follows: Transactions with related parties 2013 2012 AED’000 AED’000 A) Equity accounted investees
Sale of goods and services and construction contracts 413,804 416,079 Purchase of goods and services 9,177 64,109 Interest expense (refer note 11) 1,648 1,741 Interest income (refer note 11) 1,984 1,580 Rental income 5,733 5,379 ==== =====
B) Other related parties Sales of goods and services 181,437 12,049 Purchase of goods and services 140,478 186,631 Interest income (refer note 11) 12,380 2,457 Rental income 4,838 4,557 ==== =====
Also refer notes 5 and 15.
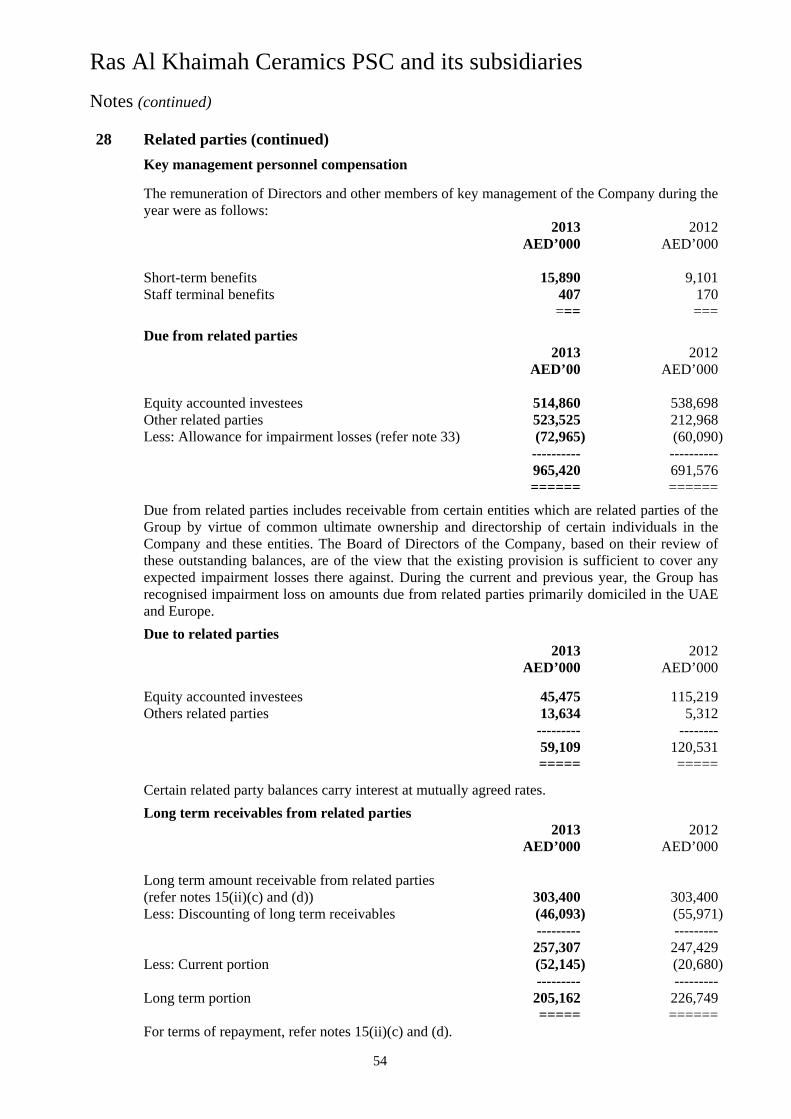
Ras Al Khaimah Ceramics PSC and its subsidiaries
Notes (continued)
54
28 Related parties (continued)
Key management personnel compensation
The remuneration of Directors and other members of key management of the Company during the year were as follows: 2013 2012 AED’000 AED’000
Short-term benefits 15,890 9,101 Staff terminal benefits 407 170 === ===
Due from related parties 2013 2012 AED’00 AED’000
Equity accounted investees 514,860 538,698 Other related parties 523,525 212,968 Less: Allowance for impairment losses (refer note 33) (72,965) (60,090) ---------- ---------- 965,420 691,576 ====== ======
Due from related parties includes receivable from certain entities which are related parties of the Group by virtue of common ultimate ownership and directorship of certain individuals in the Company and these entities. The Board of Directors of the Company, based on their review of these outstanding balances, are of the view that the existing provision is sufficient to cover any expected impairment losses there against. During the current and previous year, the Group has recognised impairment loss on amounts due from related parties primarily domiciled in the UAE and Europe.
Due to related parties 2013 2012 AED’000 AED’000
Equity accounted investees 45,475 115,219 Others related parties 13,634 5,312 --------- --------
59,109 120,531 ===== =====
Certain related party balances carry interest at mutually agreed rates.
Long term receivables from related parties 2013 2012 AED’000 AED’000
Long term amount receivable from related parties (refer notes 15(ii)(c) and (d)) 303,400 303,400 Less: Discounting of long term receivables (46,093) (55,971)
--------- --------- 257,307 247,429
Less: Current portion (52,145) (20,680) --------- ---------
Long term portion 205,162 226,749 ===== ======
For terms of repayment, refer notes 15(ii)(c) and (d).

Ras Al Khaimah Ceramics PSC and its subsidiaries
Notes (continued)
55
29 Income tax Tax expense relates to corporation tax payable on the profits earned by certain Group entities
which operate in taxable jurisdictions, as follows:
2013 2012 AED’000 AED’000
Current tax Current year 22,169 23,184
Deferred tax Originating and reversal of temporary tax differences 2,988 11,046 Adjustment for prior years (5,821) (12,092) --------- --------- Total deferred tax (2,833) (1,046)
--------- --------- Tax expense for the year 19,336 22,138 ===== ===== Provision for tax 87,260 68,169 ===== ===== Deferred tax liability 7,440 8,819 ==== ==== Deferred tax asset 2,678 2,609 ==== ====
The Company operates in a tax free jurisdiction. The Group’s consolidated effective tax rate is 6.63% for 2013 (2012: 8.99%) which is primarily due to the effect of tax rates in foreign jurisdictions.
30 Contingent liabilities and commitments
2013 2012 AED’000 AED’000
Letters of guarantee 190,417 92,415 Letters of credit 67,823 46,896 Capital commitments 555 5,646 VAT and other tax contingencies 58,321 33,216
===== =====
In some jurisdictions, the tax returns for certain years have not been reviewed by the tax authorities. However, the Group’s management is satisfied that adequate provisions have been made for potential tax contingencies.
Certain other contingent liabilities may arise during normal course of the Group’s contracting business, which based on the information presently available, cannot be quantified at this stage. However, in the opinion of the management these contingent liabilities are not likely to be material.
The Company has issued bank guarantees for advances obtained by related parties from commercial banks. Guarantees outstanding as at 31 December 2013 amount to AED 190.41 million (31 December 2012: AED 92.41 million).
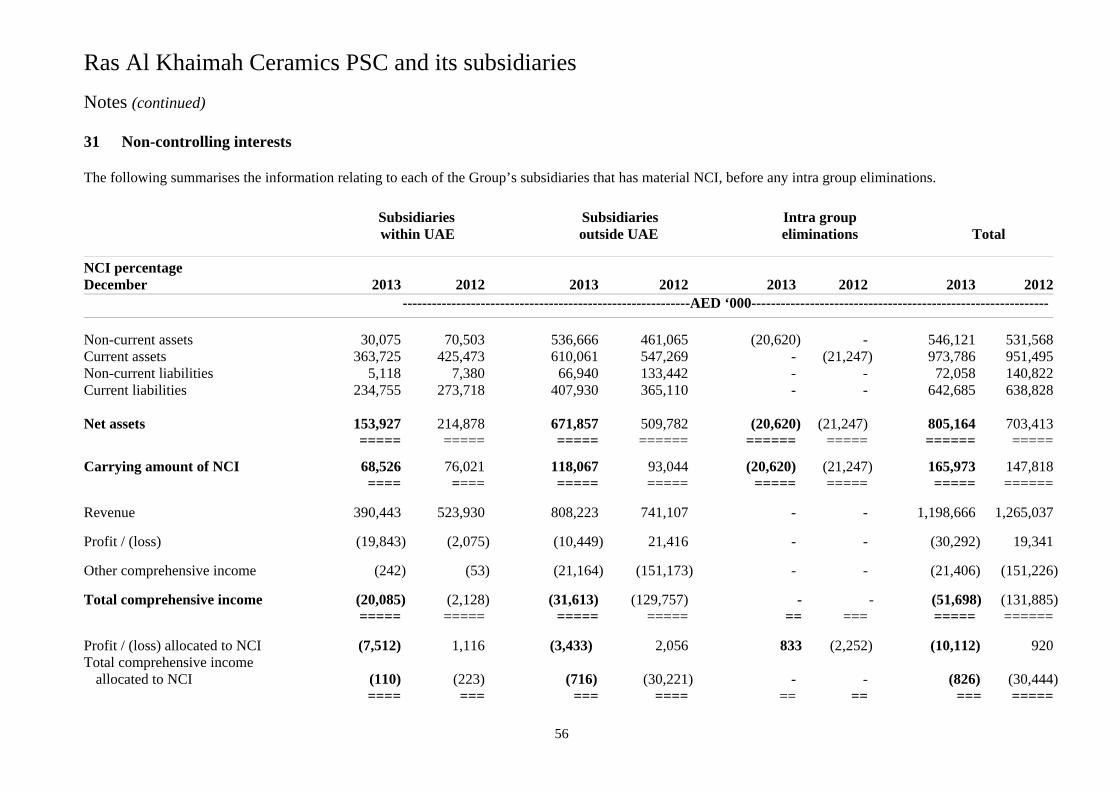
Ras Al Khaimah Ceramics PSC and its subsidiaries
Notes (continued)
56
31 Non-controlling interests
The following summarises the information relating to each of the Group’s subsidiaries that has material NCI, before any intra group eliminations.
Subsidiaries Subsidiaries Intra group within UAE outside UAE eliminations Total
NCI percentage December 2013 2012 2013 2012 2013 2012 2013 2012
-----------------------------------------------------------AED ‘000-------------------------------------------------------------
Non-current assets 30,075 70,503 536,666 461,065 (20,620) - 546,121 531,568 Current assets 363,725 425,473 610,061 547,269 - (21,247) 973,786 951,495 Non-current liabilities 5,118 7,380 66,940 133,442 - - 72,058 140,822 Current liabilities 234,755 273,718 407,930 365,110 - - 642,685 638,828
Net assets 153,927 214,878 671,857 509,782 (20,620) (21,247) 805,164 703,413
===== ===== ===== ====== ====== ===== ====== =====
Carrying amount of NCI 68,526 76,021 118,067 93,044 (20,620) (21,247) 165,973 147,818 ==== ==== ===== ===== ===== ===== ===== ======
Revenue 390,443 523,930 808,223 741,107 - - 1,198,666 1,265,037
Profit / (loss) (19,843) (2,075) (10,449) 21,416 - - (30,292) 19,341
Other comprehensive income (242) (53) (21,164) (151,173) - - (21,406) (151,226)
Total comprehensive income (20,085) (2,128) (31,613) (129,757) - - (51,698) (131,885) ===== ===== ===== ===== == === ===== ======
Profit / (loss) allocated to NCI (7,512) 1,116 (3,433) 2,056 833 (2,252) (10,112) 920 Total comprehensive income
allocated to NCI (110) (223) (716) (30,221) - - (826) (30,444) ==== === === ==== == == === =====
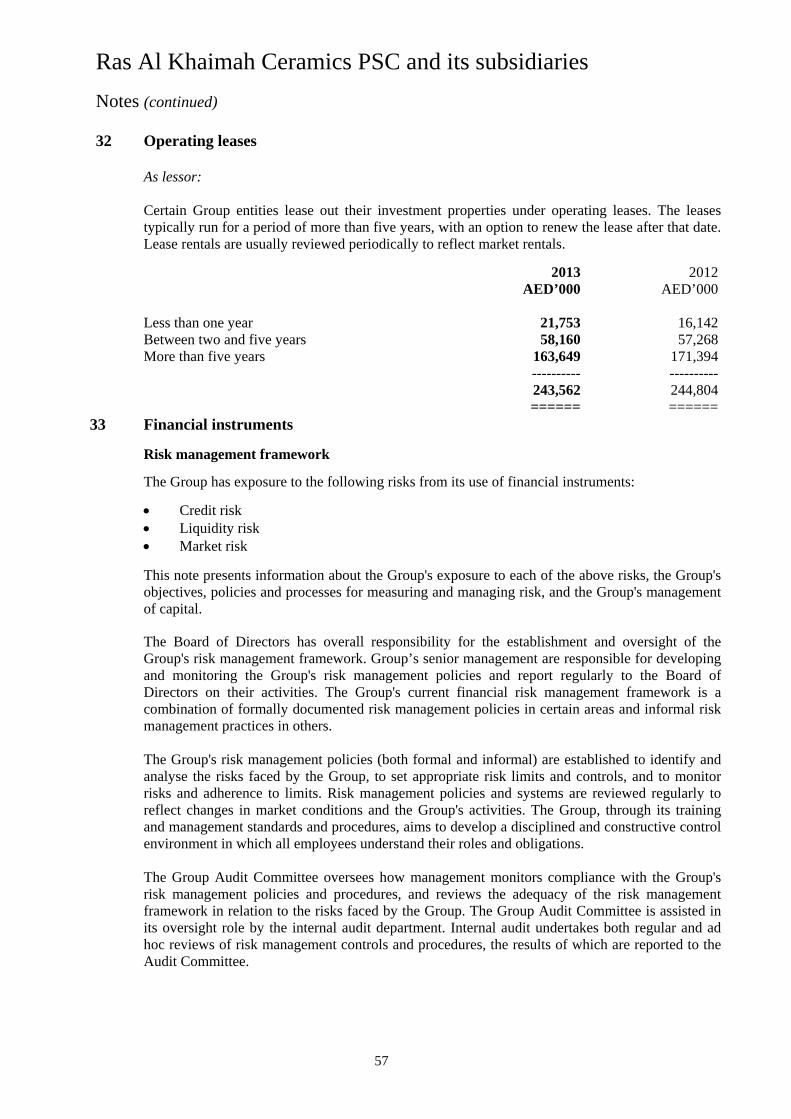
Ras Al Khaimah Ceramics PSC and its subsidiaries
Notes (continued)
57
32 Operating leases
As lessor: Certain Group entities lease out their investment properties under operating leases. The leases typically run for a period of more than five years, with an option to renew the lease after that date. Lease rentals are usually reviewed periodically to reflect market rentals.
2013 2012 AED’000 AED’000
Less than one year 21,753 16,142 Between two and five years 58,160 57,268 More than five years 163,649 171,394
---------- ---------- 243,562 244,804 ====== ======
33 Financial instruments
Risk management framework
The Group has exposure to the following risks from its use of financial instruments:
Credit risk Liquidity risk Market risk
This note presents information about the Group's exposure to each of the above risks, the Group's objectives, policies and processes for measuring and managing risk, and the Group's management of capital. The Board of Directors has overall responsibility for the establishment and oversight of the Group's risk management framework. Group’s senior management are responsible for developing and monitoring the Group's risk management policies and report regularly to the Board of Directors on their activities. The Group's current financial risk management framework is a combination of formally documented risk management policies in certain areas and informal risk management practices in others. The Group's risk management policies (both formal and informal) are established to identify and analyse the risks faced by the Group, to set appropriate risk limits and controls, and to monitor risks and adherence to limits. Risk management policies and systems are reviewed regularly to reflect changes in market conditions and the Group's activities. The Group, through its training and management standards and procedures, aims to develop a disciplined and constructive control environment in which all employees understand their roles and obligations. The Group Audit Committee oversees how management monitors compliance with the Group's risk management policies and procedures, and reviews the adequacy of the risk management framework in relation to the risks faced by the Group. The Group Audit Committee is assisted in its oversight role by the internal audit department. Internal audit undertakes both regular and ad hoc reviews of risk management controls and procedures, the results of which are reported to the Audit Committee.

Ras Al Khaimah Ceramics PSC and its subsidiaries
Notes (continued)
58
33 Financial instruments (continued)
Risk management framework (continued) As part of the application of the risk management policies, senior management is also responsible for development and implementation of controls to address operational risks arising from a wide variety of causes associated with the Group's processes, personnel, technology and infrastructure, and from external factors arising from legal and regulatory requirements, political and economic stability in the jurisdictions that the Group operates and generally accepted standards of corporate behavior.
At 31 December 2013, the Group has a subsidiary in Iran, RAK Ceramics PJSC Limited (“RAK Iran”) which is engaged in the manufacturing and sale of ceramic tiles and has net assets amounting to AED 215.57 million (2012: AED 122.79 million) as at that date. Due to the political situation in Iran and the imposition of stricter financial and trade sanctions and oil embargo, the repatriation of funds through banking channels from Iran has become exceedingly difficult. Furthermore, the Iranian currency has de-valued by 55% against the US Dollar in the period from 1 January 2012 to 31 December 2012. However, the currency has relatively stabilised in 2013. Subsequent to year end, discussions on relation to easing of sanctions raises hope for the economy.
The Board of Directors of the Company have reviewed the Group’s exposure in Iran at the reporting date in view of the current global and political conditions and the factors outlined above and are of the view that the Group will be able to recover the investments in Iran as well as arrange for the repatriation of funds and accordingly are of the view that no allowance for impairment is required to be created in these consolidated financial statements for the year ended 31 December 2013. During the previous year, the Group disposed an investment in an associate in Iran (refer note 15(ii)(c)).
The Group's non-derivative financial liabilities comprise bank borrowings, trade and other payables and balances due to related parties. The Group has various financial assets such as trade and other receivables, cash and cash equivalents and due from related parties.
The Group also holds into derivative instruments, primarily interest rate swap, currency swaps and forward currency contracts. The purpose is to manage the interest rate risk and currency risk arising from the Group's operations and its sources of finance. As the part of Group’s strategy, no trading in derivatives is undertaken. Credit risk Credit risk is the risk of financial loss to the Group if a customer or counterparty to a financial instrument fails to meet its contractual obligations, and arises principally from the Group's trade and other receivables, due from related parties and balances with bank. The maximum exposure to credit risk is equal to the carrying amount of these instruments.
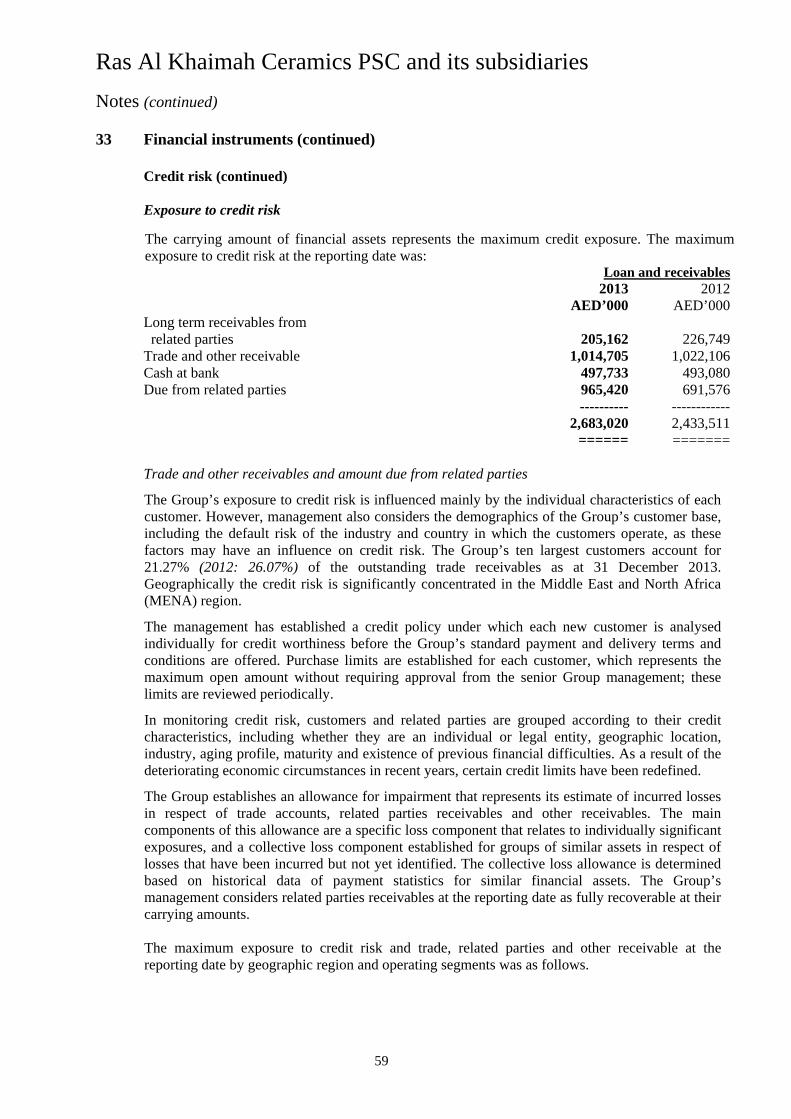
Ras Al Khaimah Ceramics PSC and its subsidiaries
Notes (continued)
59
33 Financial instruments (continued)
Credit risk (continued) Exposure to credit risk
The carrying amount of financial assets represents the maximum credit exposure. The maximum exposure to credit risk at the reporting date was: Loan and receivables 2013 2012 AED’000 AED’000 Long term receivables from related parties 205,162 226,749 Trade and other receivable 1,014,705 1,022,106 Cash at bank 497,733 493,080 Due from related parties 965,420 691,576 ---------- ------------ 2,683,020 2,433,511 ====== ======= Trade and other receivables and amount due from related parties
The Group’s exposure to credit risk is influenced mainly by the individual characteristics of each customer. However, management also considers the demographics of the Group’s customer base, including the default risk of the industry and country in which the customers operate, as these factors may have an influence on credit risk. The Group’s ten largest customers account for 21.27% (2012: 26.07%) of the outstanding trade receivables as at 31 December 2013. Geographically the credit risk is significantly concentrated in the Middle East and North Africa (MENA) region.
The management has established a credit policy under which each new customer is analysed individually for credit worthiness before the Group’s standard payment and delivery terms and conditions are offered. Purchase limits are established for each customer, which represents the maximum open amount without requiring approval from the senior Group management; these limits are reviewed periodically.
In monitoring credit risk, customers and related parties are grouped according to their credit characteristics, including whether they are an individual or legal entity, geographic location, industry, aging profile, maturity and existence of previous financial difficulties. As a result of the deteriorating economic circumstances in recent years, certain credit limits have been redefined.
The Group establishes an allowance for impairment that represents its estimate of incurred losses in respect of trade accounts, related parties receivables and other receivables. The main components of this allowance are a specific loss component that relates to individually significant exposures, and a collective loss component established for groups of similar assets in respect of losses that have been incurred but not yet identified. The collective loss allowance is determined based on historical data of payment statistics for similar financial assets. The Group’s management considers related parties receivables at the reporting date as fully recoverable at their carrying amounts. The maximum exposure to credit risk and trade, related parties and other receivable at the reporting date by geographic region and operating segments was as follows.
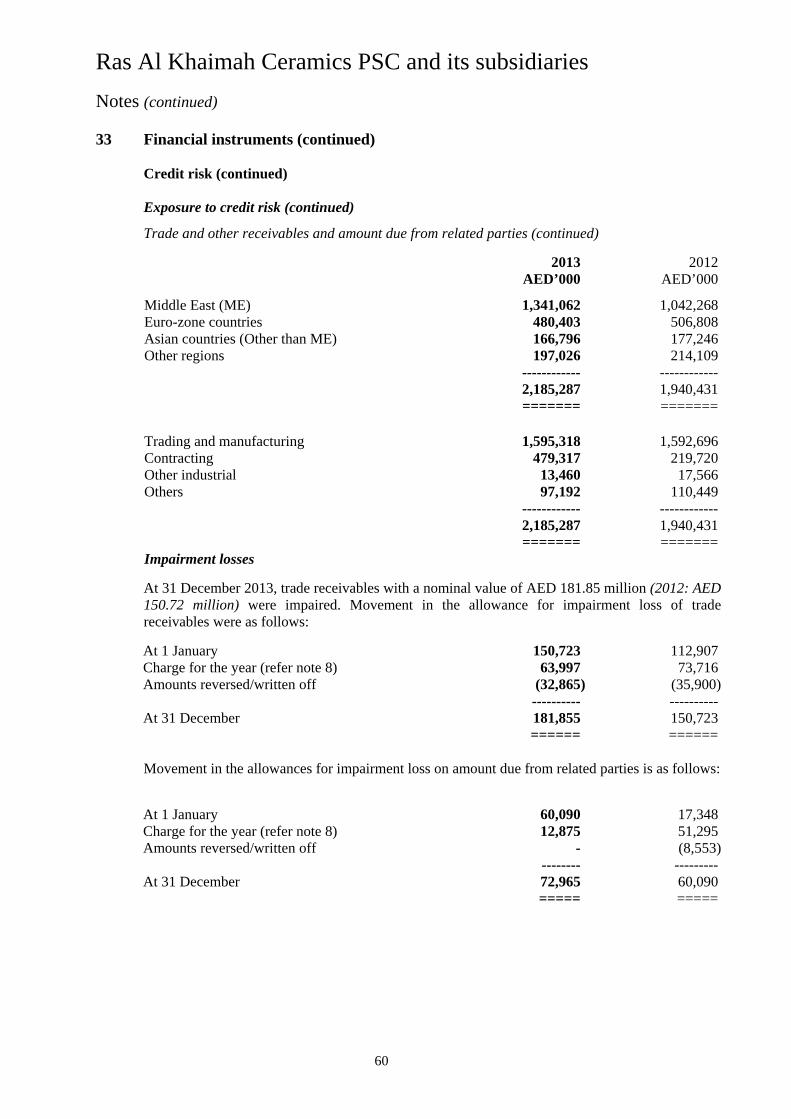
Ras Al Khaimah Ceramics PSC and its subsidiaries
Notes (continued)
60
33 Financial instruments (continued)
Credit risk (continued) Exposure to credit risk (continued)
Trade and other receivables and amount due from related parties (continued)
2013 2012 AED’000 AED’000
Middle East (ME) 1,341,062 1,042,268 Euro-zone countries 480,403 506,808 Asian countries (Other than ME) 166,796 177,246 Other regions 197,026 214,109 ------------ ------------ 2,185,287 1,940,431 ======= =======
Trading and manufacturing 1,595,318 1,592,696 Contracting 479,317 219,720 Other industrial 13,460 17,566 Others 97,192 110,449 ------------ ------------ 2,185,287 1,940,431 ======= ======= Impairment losses
At 31 December 2013, trade receivables with a nominal value of AED 181.85 million (2012: AED 150.72 million) were impaired. Movement in the allowance for impairment loss of trade receivables were as follows:
At 1 January 150,723 112,907 Charge for the year (refer note 8) 63,997 73,716 Amounts reversed/written off (32,865) (35,900) ---------- ---------- At 31 December 181,855 150,723
====== ====== Movement in the allowances for impairment loss on amount due from related parties is as follows:
At 1 January 60,090 17,348 Charge for the year (refer note 8) 12,875 51,295 Amounts reversed/written off - (8,553) -------- --------- At 31 December 72,965 60,090
===== =====

Ras Al Khaimah Ceramics PSC and its subsidiaries
Notes (continued)
61
33 Financial instruments (continued)
Credit risk (continued) Impairment losses (continued)
At 31 December, the ageing of unimpaired trade receivables is as follows: Neither |----------Past due but not impaired---------| past due nor <180 180-360 >360 Total impaired days days days AED’000 AED’000 AED’000 AED’000 AED’000 2013 891,849 310,984 321,610 127,338 131,917 ====== ====== ===== ======= ======= 2012 936,380 333,175 319,855 140,063 143,287 ===== ===== ===== ===== =====
Unimpaired receivables are expected, on the basis of past experience, segment behaviour and extensive analysis of customer credit risk to be fully recoverable. It is not the practice of the Group to obtain collateral securities over receivables and the vast majorities are therefore, unsecured. Balances with banks The Group limits its exposure to credit risk by placing balances with international and local banks. Given the profile of its bankers, management does not expect any counter party to fail to meet its obligations. The bank balances are held with the banks and financial institution counterparties, which are rated BAA1 to AA3, based on the rating agency “Moody’s” ratings. Derivative The derivatives are entered into with the banks and financial institution counterparties, which are rated BAA1 to AA3, based on the rating agency “Moody’s” ratings. Guarantee The Group’s policy is to provide financial guarantees only to subsidiaries and joint ventures. At 31 December 2013, the Company has issued a guarantee to certain banks in respect of credit facilities granted to five subsidiaries and joint ventures.

Ras Al Khaimah Ceramics PSC and its subsidiaries
Notes (continued)
62
33 Financial instruments (continued)
Market risk
Market risk is the risk that changes in market prices, such as foreign exchange rates, interest rates, and equity price will affect the Group's income or the value of its holdings of financial instruments. The objective of market risk management is to manage and control market risk exposures within acceptable parameters, while optimising the return.
Currency risk
The Group is exposed to currency risk on sales, purchases and borrowings that are denominated in a currency other than the respective functional currencies of the Group entities. The entities within the Group which have AED as their functional currency are not exposed to currency risk on transactions denominated in USD as AED is currently pegged to USD at a fixed rate. However, USD denominated transactions carried out by Group entities has been partially hedged using the currency swaps contract. The currencies giving rise to this risk are primarily USD, EURO and GBP.
The Group enters into forward exchange contracts to hedge its currency risk, generally with a maturity of less than one year from the reporting date. The Group also has currency swap arrangements with a maturity of more than 1 year.
Interest on borrowings is denominated in the currency of respective borrowing, Generally, borrowings are denominated in currencies that match the cash flows generated by the underlying operations of the Group.
In respect of other monetary assets and liabilities denominated in foreign currencies, the Group's policy is to ensure that its net exposure is kept to an acceptable level by buying or selling foreign currencies at spot rates when necessary to address short-term imbalances.
Exposure to currency risk
The Group’s exposure to foreign currency risk is as follows:
GBP USD EURO 31 December 2013 |-------------------‘000------------------|
Trade and other receivable (including due from related parties) 109 137,511 38,678 Cash and bank balances 6,438 28,046 6,408 Trade and other payables (615) (31,728) (17,713) Bank loans - (397,474) (5,337) ------ ---------- -------- Net statement of financial position exposure 5,932 (263,645) 22,036 Forward exchange transaction - 1,993 -
------- --------- -------- Net exposure 5,932 (261,652) 22,036
==== ====== ====
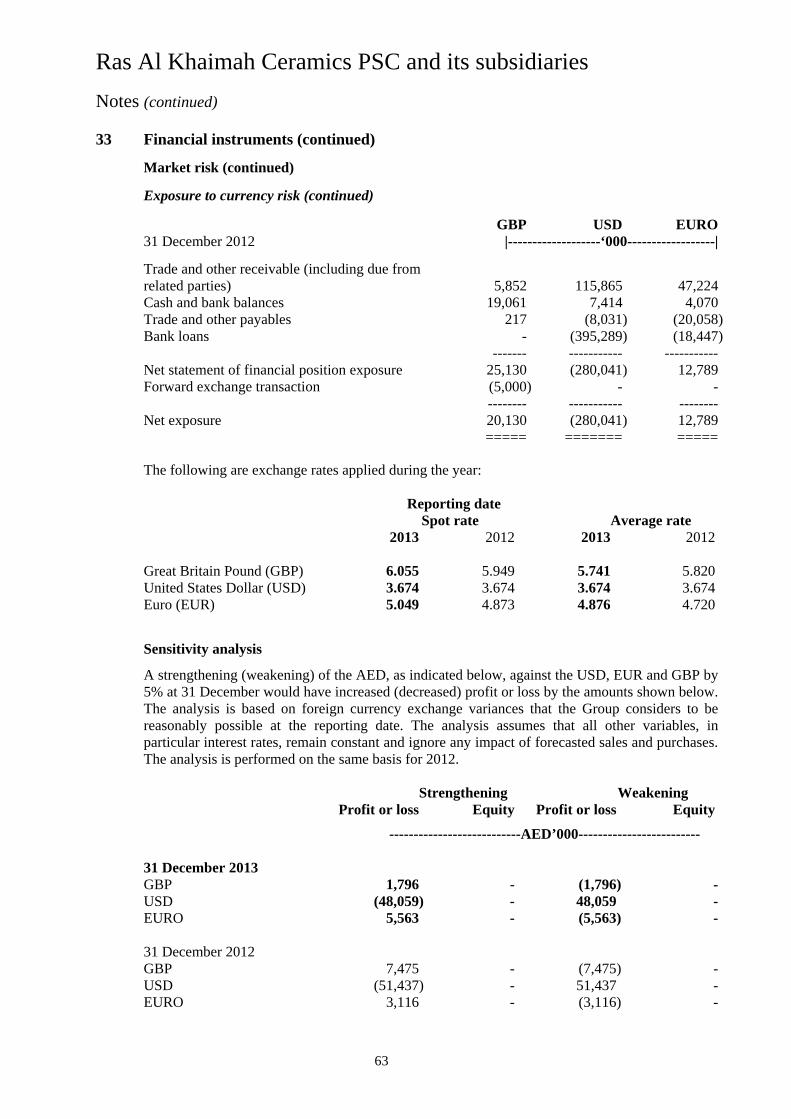
Ras Al Khaimah Ceramics PSC and its subsidiaries
Notes (continued)
63
33 Financial instruments (continued)
Market risk (continued)
Exposure to currency risk (continued)
GBP USD EURO 31 December 2012 |-------------------‘000------------------|
Trade and other receivable (including due from related parties) 5,852 115,865 47,224 Cash and bank balances 19,061 7,414 4,070 Trade and other payables 217 (8,031) (20,058) Bank loans - (395,289) (18,447)
------- ----------- ----------- Net statement of financial position exposure 25,130 (280,041) 12,789 Forward exchange transaction (5,000) - -
-------- ----------- -------- Net exposure 20,130 (280,041) 12,789
===== ======= =====
The following are exchange rates applied during the year: Reporting date Spot rate Average rate 2013 2012 2013 2012
Great Britain Pound (GBP) 6.055 5.949 5.741 5.820 United States Dollar (USD) 3.674 3.674 3.674 3.674 Euro (EUR) 5.049 4.873 4.876 4.720
Sensitivity analysis
A strengthening (weakening) of the AED, as indicated below, against the USD, EUR and GBP by 5% at 31 December would have increased (decreased) profit or loss by the amounts shown below. The analysis is based on foreign currency exchange variances that the Group considers to be reasonably possible at the reporting date. The analysis assumes that all other variables, in particular interest rates, remain constant and ignore any impact of forecasted sales and purchases. The analysis is performed on the same basis for 2012.
Strengthening Weakening Profit or loss Equity Profit or loss Equity
---------------------------AED’000-------------------------
31 December 2013 GBP 1,796 - (1,796) - USD (48,059) - 48,059 - EURO 5,563 - (5,563) -
31 December 2012 GBP 7,475 - (7,475) - USD (51,437) - 51,437 - EURO 3,116 - (3,116) -

Ras Al Khaimah Ceramics PSC and its subsidiaries
Notes (continued)
64
33 Financial instruments (continued)
Interest rate risk
The Group's exposure to the risk of changes in market interest rates relates primarily to the Group's long-term debt obligations with floating interest rates.
The Group's policy is to manage its interest cost using a mix of fixed and variable rate debts. To manage this, the Group enters into interest rate swaps, whereby the Group agrees to exchange, at specified intervals, the difference between fixed and variable rate interest amounts calculated by reference to an agreed-upon notional principal amount. These swaps are designated to hedge underlying debt obligations. At 31 December 2013, after taking into account the effect of interest rate swaps, approximately 18% (2012: 45%) of the Group's term loans are at a fixed rate of interest.
At the reporting date, the interest rate profile of the Group’s interest bearing financial instruments was: 2013 2012 AED’000 AED’000 Fixed rate instruments
Financial assets Fixed deposits 104,553 179,359 Margin deposits 24,484 3,271 Long term receivables from related parties 205,162 226,749 ====== ====== Financial liabilities Bank borrowings 332,551 895,295 ===== =====
Variable rate instruments
Financial assets Due from related parties 37,122 64,327 ===== =====
Financial liabilities Due to related parties 42,617 66,936 Bank borrowings 1,491,582 1,073,095 ======= ======= Fair value sensitivity analysis for fixed rate instruments
The Group does not account for any fixed rate financial assets and liabilities at fair value through profit or loss. Therefore a change in interest rates at the reporting date would not affect profit or loss.
Cash flow sensitivity analysis for variable rate instruments
A change of 100 basis points in interest rates at the reporting date would have increased/ (decreased) profit or loss by the amounts shown below. The analysis assumes that all other variables, in particular foreign currency rates, remain constant. This analysis is performed on the same basis for 2012.
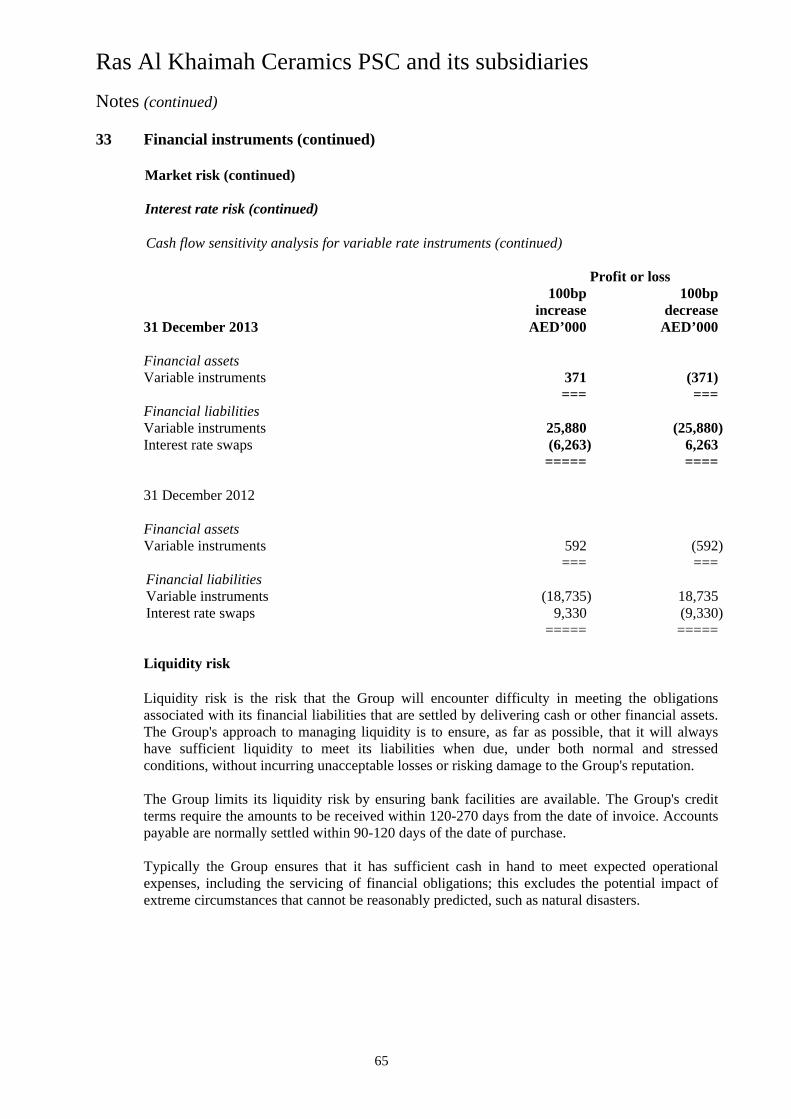
Ras Al Khaimah Ceramics PSC and its subsidiaries
Notes (continued)
65
33 Financial instruments (continued)
Market risk (continued) Interest rate risk (continued)
Cash flow sensitivity analysis for variable rate instruments (continued) Profit or loss 100bp 100bp increase decrease 31 December 2013 AED’000 AED’000 Financial assets Variable instruments 371 (371) === === Financial liabilities Variable instruments 25,880 (25,880) Interest rate swaps (6,263) 6,263 ===== ==== 31 December 2012 Financial assets Variable instruments 592 (592) === === Financial liabilities Variable instruments (18,735) 18,735 Interest rate swaps 9,330 (9,330) ===== ===== Liquidity risk
Liquidity risk is the risk that the Group will encounter difficulty in meeting the obligations associated with its financial liabilities that are settled by delivering cash or other financial assets. The Group's approach to managing liquidity is to ensure, as far as possible, that it will always have sufficient liquidity to meet its liabilities when due, under both normal and stressed conditions, without incurring unacceptable losses or risking damage to the Group's reputation.
The Group limits its liquidity risk by ensuring bank facilities are available. The Group's credit terms require the amounts to be received within 120-270 days from the date of invoice. Accounts payable are normally settled within 90-120 days of the date of purchase.
Typically the Group ensures that it has sufficient cash in hand to meet expected operational expenses, including the servicing of financial obligations; this excludes the potential impact of extreme circumstances that cannot be reasonably predicted, such as natural disasters.

Ras Al Khaimah Ceramics PSC and its subsidiaries
Notes (continued)
66
33 Financial instruments (continued)
Liquidity risk (continued) The following are the remaining contractual maturities of the Group’s financial liabilities at the reporting dates, including estimated interest payments:
---------------- Contractual cash flows ----------------
Carrying 2 months 2-12 1-2 More than amount Total or less months years 2 years AED’000 AED’000 AED’000 AED’000 AED’000 AED’000
At 31 December 2013 Non-derivative financial liabilities
Bank borrowings 1,824,136 (1,912,076) (82,641) (867,514) (335,010) (626,911) Trade and other payables 1,067,410 (1,067,410) (175,465) (867,640) (24,305) - Due to related parties 59,109 (59,109) (44,763) (14,346) - - Derivative financial liabilities
Interest rate swaps 471 (471) (471) - - - ----------- ----------- --------- ----------- --------- ---------- 2,951,126 (3,039,066) (303,340) (1,749,500) (359,315) (626,911) ====== ======= ===== ======= ====== ====== At 31 December 2012 Non-derivative financial liabilities
Bank borrowings 1,968,390 (2,026,121) (426,983) (869,520) (672,962) (56,656) Trade and other payables 853,815 (853,486) (329,636) (523,850) - Due to related parties 120,531 (120,530) (25,286) (95,244) - - Derivative financial liabilities
Interest rate swaps 5,087 (5,087) (5,087) - - - Cross currency swaps 1,081 (1,081) (1,081) - - - Forward foreign exchange contracts 44 (44) (44) - - - ------------ ----------- --------- ----------- --------- --------- 2,948,948 (3,006,349) (788,117) (1,488,614) (672,962) (56,656) ======= ======= ===== ======= ====== =====
Equity risk
The Group is not significantly exposed to equity price risk. Capital management
The Group’s policy is to maintain a strong capital base to sustain future development of the business and maintain investor and creditor confidence. The Board seeks to maintain a balance between the higher returns and the advantages and security offered by a sound capital position.

Ras Al Khaimah Ceramics PSC and its subsidiaries
Notes (continued)
67
33 Financial instruments (continued)
Capital management (continued) The Group manages its capital structure and make adjustments to it in light of changes in business conditions. Capital comprises share capital, share premium reserve, capital reserve, legal reserve, translation reserve, general reserve and retained earnings and amounts to AED 2,639 million as at 31 December 2013 (2012: AED 2,257 million). Debt comprised interest bearing loans and borrowings. The debt equity ratio at the reporting date was as follows: 2013 2012 AED’000 AED’000
Equity 2,639,435 2,257,965 ======= ======= Debt 1,824,133 1,968,390 ======= ======= Debt equity ratio 0.69 0.87 === === There is no change in the Group’s approach for capital management during the current year.
Fair values
(a) Accounting classifications and fair values
The Group holds financial liabilities, measured at fair value which are classified in Level 2 at the reporting date (includes interest rate swaps and cross currency swaps). Further, the Group does not disclose the fair values of financial instruments such as trade and other receivables, trade and other payables, due from / due to related parties, trade and other payables and bank borrowings because their fair value approximates to their book values due to the current nature of these instruments as the effect of discounting is immaterial. In case they are non-current in nature, the fair value is estimated based on the present value of future cash flows, discounted at the market rate of interest at the reporting date.
(b) Valuation techniques and significant unobservable inputs
The valuation technique used in measuring Level 2 fair values, as well as the significant unobservable inputs used is market comparison technique is as follows;

Ras Al Khaimah Ceramics PSC and its subsidiaries
Notes (continued)
68
33 Financial instruments (continued)
Fair values (b) Valuation techniques and significant unobservable inputs (continued) Financial instruments measured at fair value The fair values of interest rate swap and cross currency swap are based on quotation/ rates provided by the counterparty banks and financial institutions.
34 Hyperinflationary accounting
IAS 29 requires that financial statements prepared in the currency of a hyperinflationary economy be stated in terms of a measuring unit current at the statement of financial position date and that corresponding figures for previous periods be stated in the same terms to the latest statement of financial position date. This has been applied in RAK Ceramics PJSC Limited, a subsidiary in Iran, and hence the impact has been calculated by means of conversion factors derived from the Consumer Price Index (CPI). The conversion factors used to restate the financial statements of the subsidiary are as follows:
Index Conversion factor
31 December 2013 489 1.315 31 December 2012 372 1.383 31 December 2011 269 1.224 31 December 2005 104

Ras Al Khaimah Ceramics PSC and its subsidiaries
Notes (continued)
69
34 Hyperinflationary accounting (continued)
The above mentioned restatement is affected as follows:
i. Financial statements prepared in the currency of a hyperinflationary economy are stated after applying the measuring unit current at statement of financial position date and corresponding figures for the previous period are stated on the same basis. Monetary assets and liabilities are not restated because they are already expressed in terms of the monetary unit current at the statement of financial position date. Monetary items are money held and items to be recovered or paid in money;
ii. Non-monetary assets and liabilities that are not carried at amounts current at the statement of financial position date and components of shareholders’ equity are restated by applying the relevant conversion factors;
iii. Comparative financial statements are restated using general inflation indices in terms of the measuring unit current at the statement of financial position date;
iv. All items in the income statement are restated by applying the relevant quarterly average or year-end conversion factors; and
v. The effect on the net monetary position of the Group is included in the consolidated statement of profit or loss as a monetary loss from hyperinflation.
The application of the IAS 29 restatement procedures has the effect of amending certain accounting policies at the subsidiary’s level which are used in the preparation of the financial statements under the historical cost conversion. The impact of hyperinflationary accounting on the consolidated financial statements due to Iran subsidiary is as follows: 1 January 2013 Impact on statement of financial position AED’000
Increase in property plant and equipment 153,166 Increase in inventories 14,966 Increase in other non-monetary assets 1,575 ----------- Increase in net book value 169,707 ====== Allocated to: Increase in opening equity and non controlling interest due to
cumulative hyperinflation since incorporation 169,707 ===== 2013 Impact on profit or loss: AED’000
Increase in depreciation charge for the year 23,808 Loss on net monetary position 659 --------- 24,467 =====
Furthermore, Sudan has also been concluded to be a hyperinflationary economy in 2013. However, considering that the impact of restatement of financial information of the subsidiary in Sudan does not have a material impact on the results of the Group, hyperinflationary accounting has not been performed.
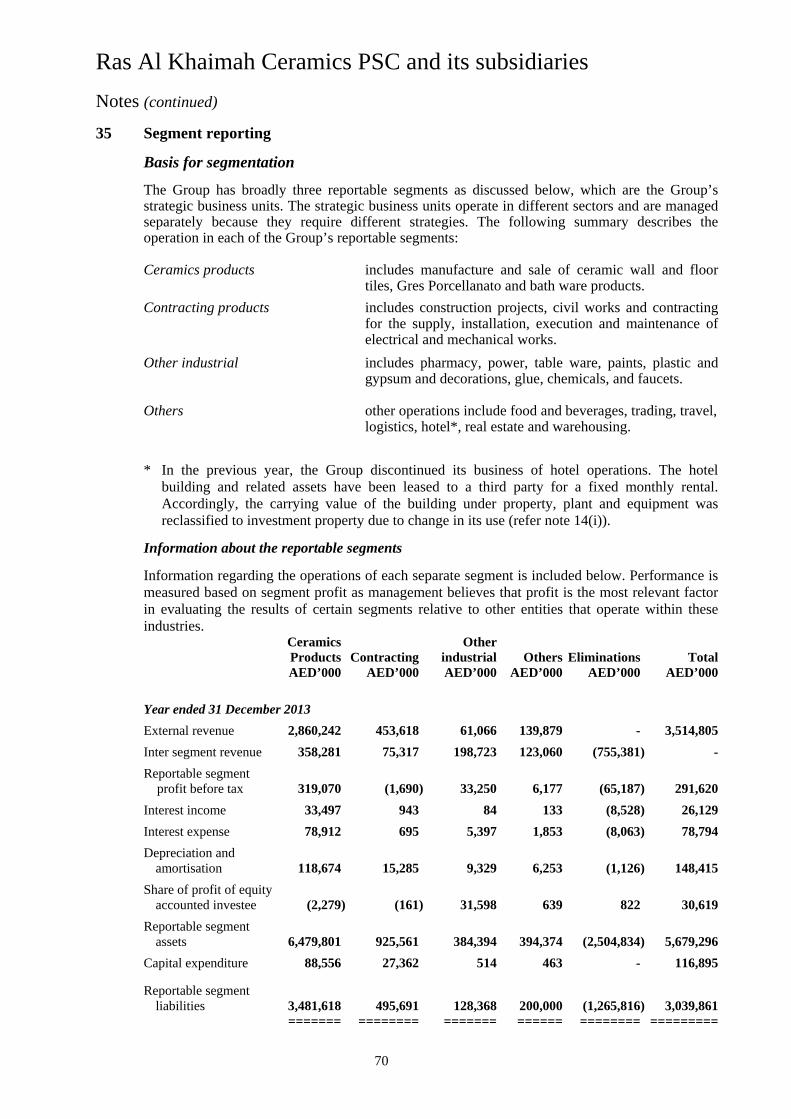
Ras Al Khaimah Ceramics PSC and its subsidiaries
Notes (continued)
70
35 Segment reporting
Basis for segmentation
The Group has broadly three reportable segments as discussed below, which are the Group’s strategic business units. The strategic business units operate in different sectors and are managed separately because they require different strategies. The following summary describes the operation in each of the Group’s reportable segments:
Ceramics products includes manufacture and sale of ceramic wall and floor
tiles, Gres Porcellanato and bath ware products.
Contracting products includes construction projects, civil works and contracting for the supply, installation, execution and maintenance of electrical and mechanical works.
Other industrial includes pharmacy, power, table ware, paints, plastic and gypsum and decorations, glue, chemicals, and faucets.
Others other operations include food and beverages, trading, travel,
logistics, hotel*, real estate and warehousing.
* In the previous year, the Group discontinued its business of hotel operations. The hotel building and related assets have been leased to a third party for a fixed monthly rental. Accordingly, the carrying value of the building under property, plant and equipment was reclassified to investment property due to change in its use (refer note 14(i)).
Information about the reportable segments
Information regarding the operations of each separate segment is included below. Performance is measured based on segment profit as management believes that profit is the most relevant factor in evaluating the results of certain segments relative to other entities that operate within these industries. Ceramics Other Products Contracting industrial Others Eliminations Total AED’000 AED’000 AED’000 AED’000 AED’000 AED’000
Year ended 31 December 2013
External revenue 2,860,242 453,618 61,066 139,879 - 3,514,805
Inter segment revenue 358,281 75,317 198,723 123,060 (755,381) -
Reportable segment profit before tax 319,070 (1,690) 33,250 6,177 (65,187) 291,620
Interest income 33,497 943 84 133 (8,528) 26,129
Interest expense 78,912 695 5,397 1,853 (8,063) 78,794
Depreciation and amortisation 118,674 15,285 9,329 6,253 (1,126) 148,415
Share of profit of equity accounted investee (2,279) (161) 31,598 639 822 30,619
Reportable segment assets 6,479,801 925,561 384,394 394,374 (2,504,834) 5,679,296
Capital expenditure 88,556 27,362 514 463 - 116,895
Reportable segment liabilities 3,481,618 495,691 128,368 200,000 (1,265,816) 3,039,861
======= ======== ======= ====== ======== =========

Ras Al Khaimah Ceramics PSC and its subsidiaries
Notes (continued)
71
35 Segment reporting (continued)
Information about the reportable segments (continued)
Ceramics Other Products Contracting industrial Others Eliminations Total AED’000 AED’000 AED’000 AED’000 AED’000 AED’000
Year ended 31 December 2012
External revenue 2,757,959 242,375 74,792 93,008 - 3,168,134
Inter segment revenue 403,455 21,494 86,920 159,681 (671,550) -
Reportable segment profit before tax 274,590 (23,830) 16,103 20,302 (41,026) 246,139
Interest income 12,515 431 12 323 (3,587) 9,694
Interest expense 95,967 1,406 2,439 3,754 (3,587) 99,979
Depreciation and amortisation 106,822 10,862 11,656 6,499 - 135,839
Share of profit of equity accounted investee 1,382 (4,928) 26,144 4,361 (2,264) 24,695
Reportable segment assets 6,232,302 576,667 404,162 401,522 (2,302,656) 5,311,997
Capital expenditure 100,967 3,489 4,339 6,119 - 114,914
Reportable segment liabilities 3,589,099 335,650 146,590 217,594 (1,234,902) 3,054,032
====== ===== ===== ====== ======== =======
Geographical information
The ceramic products, contracting and other industrial segments are managed on worldwide basis, but operate manufacturing facilities primarily in UAE, India, Sudan, Iran, China and Bangladesh.
In presenting information on the basis of geography, segment revenue is based on the geographical location of customers and segment assets are based on the geographical location of the assets. Investment in equity accounted investees is presented based on the geographical location of the entity holding the investment. Revenue 2013 2012 AED’000 AED’000
Middle East (ME) 1,930,681 1,525,316 Euro zone countries 390,499 422,892 Asian countries (other than ME) 800,307 802,101 Others 393,318 417,825 ----------- ----------- 3,514,805 3,168,134 ======= ======= Non-current assets
Middle East (ME) 1,227,954 1,247,902 Asian countries (other than ME) 575,844 533,777 Others 80, 330 120,508 ------------ ------------ 1,884,128 1,902,187 ======= =======

Ras Al Khaimah Ceramics PSC and its subsidiaries
Notes (continued)
72
35 Segment reporting (continued)
Reconciliation of reportable segment 2013 2012 AED’000 AED’000 Revenues
Total revenue for reportable segments 4,270,186 3,839,684 Elimination of inter segment revenue (755,381) (671,550) ------------ ----------- 3,514,805 3,168,134 ======= =======
Profit after tax
Total profit or loss for reportable segments after tax 306,852 240,331 Elimination of inter-segment profits (65,187) (41,026) Share of profit of equity accounted investees 30,619 24,696
---------- --------- 272,284 224,001 ====== ====== Assets Total assets for reportable segment 5,464,967 4,966,497 Equity accounted investees 214,329 345,500 ----------- ---------- 5,679,296 5,311,997 ======= ======= Liabilities
Total liabilities for reportable segments 3,039,861 3,054,032 ====== =====
Other material items
Interest income 26,129 9,694 Interest expense 78,794 99,979 Capital expenditure 116,899 114,914 Depreciation and amortization 148,415 135,839 ====== ======
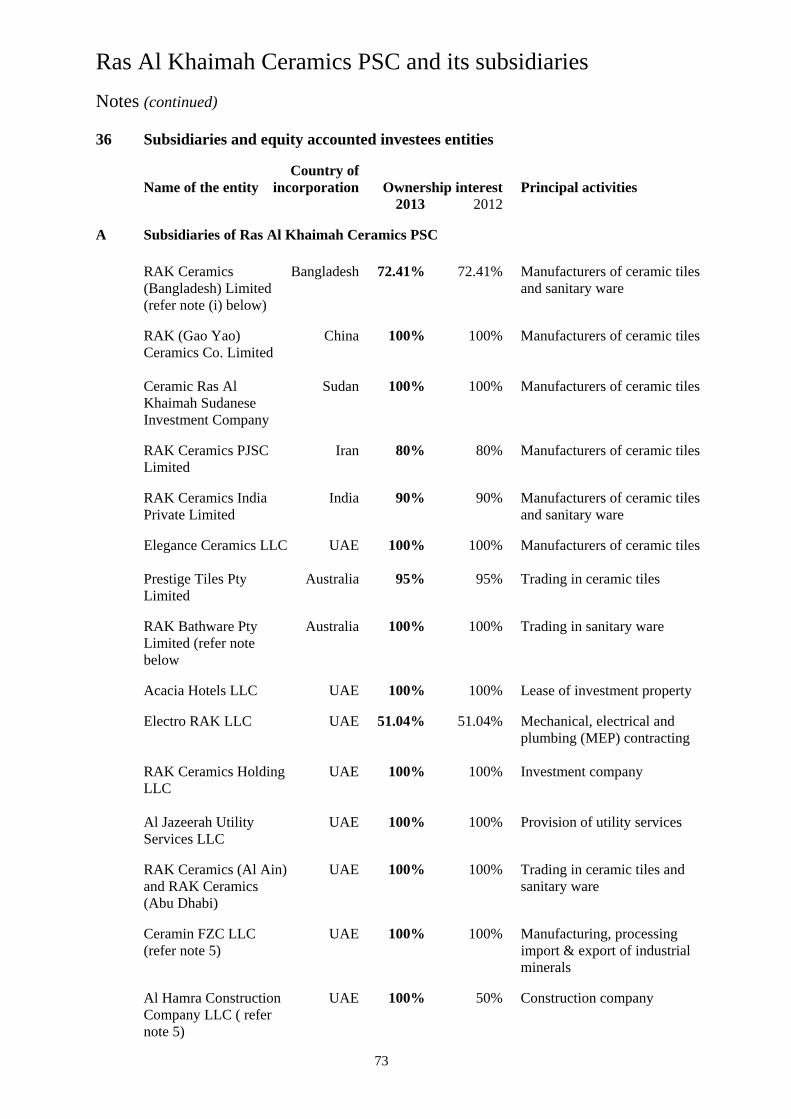
Ras Al Khaimah Ceramics PSC and its subsidiaries
Notes (continued)
73
36 Subsidiaries and equity accounted investees entities
Country of
Name of the entity incorporation Ownership interest Principal activities 2013 2012
A Subsidiaries of Ras Al Khaimah Ceramics PSC
RAK Ceramics Bangladesh 72.41% 72.41% Manufacturers of ceramic tiles (Bangladesh) Limited and sanitary ware (refer note (i) below) RAK (Gao Yao) China 100% 100% Manufacturers of ceramic tiles Ceramics Co. Limited Ceramic Ras Al Sudan 100% 100% Manufacturers of ceramic tiles Khaimah Sudanese Investment Company RAK Ceramics PJSC Iran 80% 80% Manufacturers of ceramic tiles Limited RAK Ceramics India India 90% 90% Manufacturers of ceramic tiles Private Limited and sanitary ware Elegance Ceramics LLC UAE 100% 100% Manufacturers of ceramic tiles Prestige Tiles Pty Australia 95% 95% Trading in ceramic tiles Limited RAK Bathware Pty Australia 100% 100% Trading in sanitary ware Limited (refer note below Acacia Hotels LLC UAE 100% 100% Lease of investment property Electro RAK LLC UAE 51.04% 51.04% Mechanical, electrical and plumbing (MEP) contracting RAK Ceramics Holding UAE 100% 100% Investment company LLC Al Jazeerah Utility UAE 100% 100% Provision of utility services Services LLC RAK Ceramics (Al Ain) UAE 100% 100% Trading in ceramic tiles and and RAK Ceramics sanitary ware (Abu Dhabi) Ceramin FZC LLC UAE 100% 100% Manufacturing, processing (refer note 5) import & export of industrial minerals Al Hamra Construction UAE 100% 50% Construction company Company LLC ( refer note 5)

Ras Al Khaimah Ceramics PSC and its subsidiaries
Notes (continued)
74
36 Subsidiaries and equity accounted investees entities (continued)
Country of Name of the entity incorporation Ownership interest Principal activities 2013 2012
B Subsidiaries of RAK Ceramics Bangladesh Limited
RAK Power Private Bangladesh 57% 57% Power generation for captive Limited consumption RAK Pharmaceuticals Bangladesh 55% 55% Manufacturing of Private Limited pharmaceuticals RAK Food and Bangladesh - 51% Manufacturing of food and food Beverages Private products Limited (refer note 5) Classic Porcelain Bangladesh - 51% Manufacturing of porcelain Private Limited (refer 5) tableware
C Subsidiaries of Electro RAK LLC Encom Trading LLC UAE 90% 90% Trading in electrical goods RAK Industries LLC UAE 97% 97% Manufacturing and trading of (refer note (ii) below) switchgears Emirates Heavy UAE 50% 50% Heavy industrial engineering and Engineering LLC related fabrication works (refer note (iii) below) Electro RAK (India) India 51% 51% Electrical, plumbing, ducting, Private Limited air - conditioning works
D Subsidiary of Emirates Heavy Engineering LLC RAK Fabrication LLC UAE 100% 100% Fabrication contract works (refer note (iv) below)
E Subsidiaries of RAK Ceramics Holding LLC RAK Piling LLC UAE 76% 76% Piling and foundation works RAK Watertech LLC UAE 90% 90% Waste-water treatment works Al Hamra Aluminium and UAE 75% 75% Aluminium and glass works Glass Industries LLC RAK Paints LLC UAE 100% 100% Manufacturers of paints and allied products
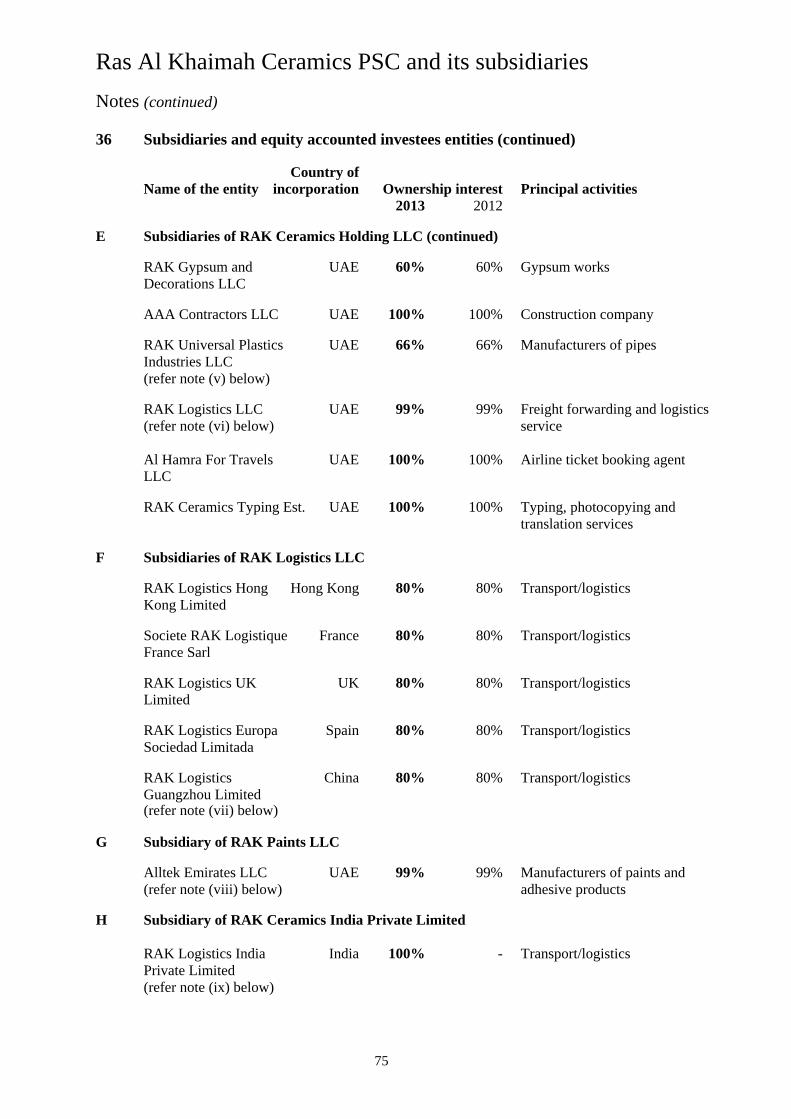
Ras Al Khaimah Ceramics PSC and its subsidiaries
Notes (continued)
75
36 Subsidiaries and equity accounted investees entities (continued)
Country of Name of the entity incorporation Ownership interest Principal activities 2013 2012
E Subsidiaries of RAK Ceramics Holding LLC (continued) RAK Gypsum and UAE 60% 60% Gypsum works Decorations LLC AAA Contractors LLC UAE 100% 100% Construction company RAK Universal Plastics UAE 66% 66% Manufacturers of pipes Industries LLC (refer note (v) below) RAK Logistics LLC UAE 99% 99% Freight forwarding and logistics (refer note (vi) below) service Al Hamra For Travels UAE 100% 100% Airline ticket booking agent LLC RAK Ceramics Typing Est. UAE 100% 100% Typing, photocopying and translation services
F Subsidiaries of RAK Logistics LLC RAK Logistics Hong Hong Kong 80% 80% Transport/logistics Kong Limited Societe RAK Logistique France 80% 80% Transport/logistics France Sarl RAK Logistics UK UK 80% 80% Transport/logistics Limited RAK Logistics Europa Spain 80% 80% Transport/logistics Sociedad Limitada RAK Logistics China 80% 80% Transport/logistics Guangzhou Limited (refer note (vii) below)
G Subsidiary of RAK Paints LLC Alltek Emirates LLC UAE 99% 99% Manufacturers of paints and (refer note (viii) below) adhesive products
H Subsidiary of RAK Ceramics India Private Limited RAK Logistics India India 100% - Transport/logistics Private Limited (refer note (ix) below)
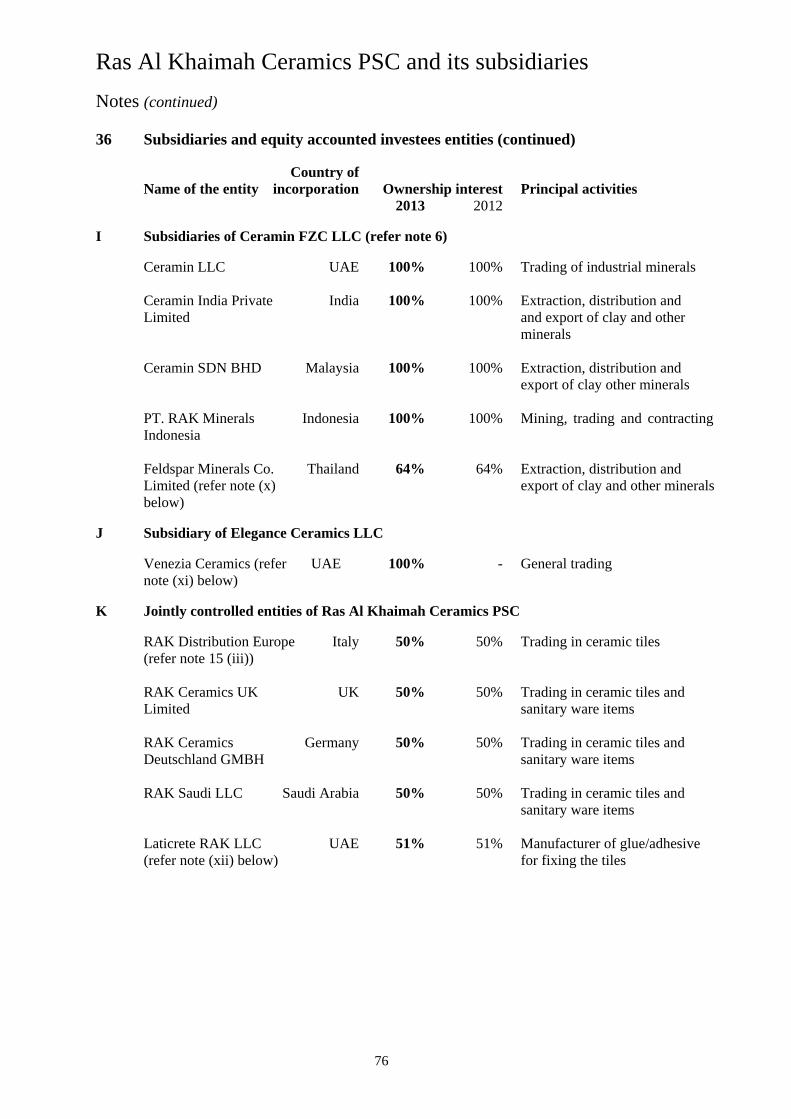
Ras Al Khaimah Ceramics PSC and its subsidiaries
Notes (continued)
76
36 Subsidiaries and equity accounted investees entities (continued)
Country of Name of the entity incorporation Ownership interest Principal activities 2013 2012
I Subsidiaries of Ceramin FZC LLC (refer note 6) Ceramin LLC UAE 100% 100% Trading of industrial minerals Ceramin India Private India 100% 100% Extraction, distribution and Limited and export of clay and other minerals Ceramin SDN BHD Malaysia 100% 100% Extraction, distribution and export of clay other minerals PT. RAK Minerals Indonesia 100% 100% Mining, trading and contracting Indonesia Feldspar Minerals Co. Thailand 64% 64% Extraction, distribution and Limited (refer note (x) export of clay and other minerals below)
J Subsidiary of Elegance Ceramics LLC Venezia Ceramics (refer UAE 100% - General trading note (xi) below) K Jointly controlled entities of Ras Al Khaimah Ceramics PSC
RAK Distribution Europe Italy 50% 50% Trading in ceramic tiles (refer note 15 (iii)) RAK Ceramics UK UK 50% 50% Trading in ceramic tiles and Limited sanitary ware items RAK Ceramics Germany 50% 50% Trading in ceramic tiles and Deutschland GMBH sanitary ware items RAK Saudi LLC Saudi Arabia 50% 50% Trading in ceramic tiles and sanitary ware items Laticrete RAK LLC UAE 51% 51% Manufacturer of glue/adhesive (refer note (xii) below) for fixing the tiles

Ras Al Khaimah Ceramics PSC and its subsidiaries
Notes (continued)
77
36 Subsidiaries and equity accounted investees entities (continued)
Country of Name of the entity incorporation Ownership interest Principal activities 2013 2012
K Jointly controlled entities of Ras Al Khaimah Ceramics PSC (continued) Manufacturing of porcelain RAK Porcelain LLC UAE 50% 50% tableware RAK Chimica LLC UAE 55.55% 55.55% Manufacturing of chemicals (refer note (xii) below) used in ceramic industries Kludi RAK LLC (refer UAE 51% 51% Manufacturing of water tap note (xii) below) faucets etc. RAK Warehouse Leasing UAE 50% 50% Leasing industrial warehouse LLC spaces ARAK International Saudi Arabia 50% 50% Trading in ceramics tile Trading Company RAK Ceramics Holding Georgia 51% 51% Trading in ceramic tiles and LLC Georgia (refer note sanitary ware items (xii) below) Agora Commerce and Congo 50% 50% Investment company Investments FZ-LLC RAK Holdings Private Bangladesh 40% 40% Investment company Limited
L Associates of RAK Ceramics (Bangladesh) Limited RAK Securities and Bangladesh 35% 35% Providing security services Services Private Limited RAK Paints Private Bangladesh 47% 40% Manufacturing paints Limited (refer note (xiii) below) RAK Moshfly (BD) Bangladesh 20% 20% Manufacturing pesticides Private Limited
M Associate of Ceramin FZC LLC
Palang Suriya Company Thailand 40% 40% Extraction, distribution and Limited export of clay and other minerals

Ras Al Khaimah Ceramics PSC and its subsidiaries
Notes (continued)
78
36 Subsidiaries and equity accounted investees entities (continued)
Country of Name of the entity incorporation Ownership interest Principal activities 2013 2012
N Subsidiary of Ceramin India Private Limited Shri Shiridi Sai Mines India 97% 97% Mining activities
O Jointly controlled entity of Prestige Tiles Pty Limited Massa Imports Pty Australia 50% 50% Trading in ceramic tiles Limited
P Jointly controlled entity of RAK Piling LLC RAK Piling Bangladesh 50% 50% Real estate development, Bangladesh Private mechanical and civil works Limited (refer note (xiv) below)
Q Jointly controlled entity of RAK Ceramics Holding LLC Keraben Gulf LLC (refer UAE 51% 51% General trading note (xii) below)
R Jointly controlled entity of RAK Logistics LLC RAK Logistics South Africa 40% 40% Transport/logistics South Africa (Pty) Limited
S Joint venture of Sherewin Holdings MEC Coal Pte Limited Singapore - - Coal mining business (refer note 15 (ii)(d))
T Discontinued operations - held for sale (refer note 20) Setrim En Chartreuse France - 100% Trading in ceramic tiles SCI Du Gresivaudan France - 100% Trading in ceramic tiles and sanitary ware RAK Ceramics France - 100% Trading in ceramic tiles and France sanitary ware SCI DU Golfe France - 100% Warehousing services RAK Global Logistics UAE 51% 51% Logistics LLC RAK Composites UAE 80% 80% Boat manufacturing LLC RAK Luminar LLC UAE 100% 100% Trading in electrical goods
Ras Al Khaimah Ceramics PSC and its subsidiaries
Notes (continued)
79
36 Subsidiaries and equity accounted investees entities (continued)
(i) During 2012, the Group sold 500,000 numbers of shares out of total 278,388,935 issued and paid
up shares. Shares were sold through the automated trading system of Dhaka Stock Exchange Limited. Accordingly the shareholding decreased from 72.59% to 72.41%
(ii) The Group holds 70% equity interest in RAK Industries LLC through Electro RAK LLC. In
addition to this, Encom Trading LLC in which Electro RAK LLC holds 90% equity interest, also has 30% equity interest in RAK Industries LLC resulting in a 97% holding by Electro RAK LLC. Accordingly, the Group effectively holds 49.51% equity interest of RAK Industries LLC.
(iii) In addition to the 50% equity interest in Emirates Heavy Engineering LLC held through Electro
RAK LLC, the Group also holds the remaining 50% equity interest through RAK Ceramics Holdings LLC, a fully owned subsidiary of the Group. Accordingly, the Group effectively holds 75.5% equity interest in Emirates Heavy Engineering LLC.
(iv) RAK Fabrication LLC is a wholly owned subsidiary of Emirates Heavy Engineering LLC. The
Group holds 75.5% equity interest in Emirates Heavy Engineering LLC, 50% through RAK Ceramics Holding LLC and 25.5% through Electro RAK LLC. Accordingly, the Group effectively holds 75.5% equity interest of RAK Fabrication LLC.
(v) The Group holds 66% equity interest in RAK Universal Plastics LLC through RAK Ceramics
Holding LLC. In addition to this, RAK Watertech LLC in which RAK Ceramics Holding LLC holds 90% equity interest, also has 24% equity interest in RAK Universal Plastic LLC. Accordingly, the Group effectively holds 87.6% equity interest in RAK Universal Plastics LLC.
(vi) In addition to the 99% equity interest held in RAK Logistics LLC, the Group also holds the remaining 1% through Al Hamra Construction Company LLC (a fully owned subsidiary of the Group). Accordingly, the Group effectively holds 100% equity interest in RAK Logistics LLC.
(vii) RAK Logistics Guangzhou Limited is a wholly owned subsidiary of RAK Logistics Hong Kong
Limited. The Group holds 80% equity interest in RAK Logistics Hong Kong Limited through RAK Logistics LLC. Accordingly, the Group effectively holds 80% equity interest in RAK Logistics Guangzhou Limited.
(viii) In addition to 99% equity interest in Altek Emirates LLC held by RAK Paints LLC, the Group
also holds remaining 1% equity interest which is held by RAK Ceramics Holding LLC, a fully owned subsidiary of the Group. Accordingly the entity has been treated as fully owned subsidiary of the Group.
(ix) During the year, the Group has incorporated RAK Logistics India Private Limited, India to carry
on and undertake the business as logistics solution providers, charterers and related jobs. Hence, the Company is a fully owned subsidiary of the Group.
(x) Ceramin FZC holds 40% equity interest in Feldspar Minerals Company Limited. In addition to
this, Palang Suriya Company Limited in which Ceramin FZC holds 40% equity interest, also has 60% equity interest in this entity. Accordingly, the Group effectively holds 64% equity interest of Feldspar Minerals Company Limited.
(xi) During the current year, the Group has incorporated Venezia Ceramics (“Establishment”) in UAE
to carry on the business of general trading.

Ras Al Khaimah Ceramics PSC and its subsidiaries
Notes (continued)
80
36 Subsidiaries and equity accounted investees entities (continued)
(xii) Laticrete RAK LLC, RAK Chimica LLC, Kludi RAK LLC, RAK Ceramics Holding LLC
Georgia and Keraben Gulf LLC have been considered as Joint Ventures of the Group since the Group exercise only joint control over the financial and operating policies of these entities with other partners.
(xiii) During the year, the Group has acquired 35,000 numbers of shares of RAK Paints Private Limited
out of total 500,000 issued and paid up shares. The Group now holds 235,000 numbers of shares. Accordingly, shareholding has increased from 40% to 47%.
(xiv) During 2012, the Group entered into a joint venture agreement with certain third parties to set up
RAK Piling Bangladesh Private Limited for the purpose of carrying out real estate development and other related activities. The Group has 50% equity interest and joint control along with the other shareholders over the operations and management of this entity. Accordingly the entity has been considered as a jointly controlled entity in these consolidated financial statements.
(xv) During 2012, the Group derecognised its investment in Al Hamra Global Investment FZ-LLC and
RAK Pharmacy LLC as both of the Companies were not operational.
37 Significant accounting estimates and judgements
The Group makes estimates and assumptions that affect the reported amounts of assets and liabilities within the next financial year. Estimates and judgements are continually evaluated and are based on historical experience and other factors, including expectations of future events that are believed to be reasonable under the circumstances. Significant areas of estimation uncertainty and critical judgements in applying accounting policies that have the most significant effect on amounts recognised in the consolidated financial statements are as follows.
Revenue from construction contracts
Revenue from construction contracts is recognised in profit or loss when the outcome of the contract can be estimated reliably. The measurement of contract revenue is affected by a variety of uncertainties that depend on the outcome of future events. The estimates often need to be revised as events occur and uncertainties are resolved. Therefore, the amount of contract revenue may increase or decrease from period to period.
Project stage of completion and cost to complete estimates
At each date of the consolidated statement of financial position, the Group is required to estimate stage of completion and costs to complete on fixed price and modified fixed price contracts. These estimates require the Group to make estimates of future costs to be incurred, based on work to be performed beyond the reporting date. These estimates also include the cost of potential claim by contractors and the costs of meeting other contractual obligations to the customers. Effects of any revision to these estimates are reflected in the year in which these estimates are revised.

Ras Al Khaimah Ceramics PSC and its subsidiaries
Notes (continued)
81
37 Significant accounting estimates and judgements (continued)
Estimated useful life and residual value of property, plant and equipment and investment properties The Group estimates the useful lives of property, plant and equipment and investment property based on the period over which the assets are expected to be available for use. The estimated useful lives are reviewed periodically and are updated if expectations differ from previous estimates due to physical wear and tear, technical or commercial obsolescence and legal or other limits on the use of the assets. In addition, estimation of the useful lives of property and equipment is based on collective assessment of industry practice, internal technical evaluation and on the historical experience with similar assets. It is possible, however, that future results of operations could be materially affected by changes in estimates brought about by changes in factors mentioned above. The amounts and timing of recorded expenses for any period would be affected by changes in these factors and circumstances. The Group’s management has carried out a review of the residual values and useful lives of property, plant and equipment and investment properties during the current year and certain revisions have been made. Refer note 12.
Fair valuation of investment properties
The Group follows the cost model under IAS 40 whereby investment properties are stated at cost less accumulated depreciation and impairment losses, if any. Fair value of investment properties are disclosed in note 14 of the consolidated financial statements. The fair values for building have been determined taking into consideration the discounted cash flow revenues. Fair values for land have been determined having regard to recent market transactions for similar properties in the same location as the Group’s investment properties. Should the key assumptions change, the fair value of investment properties may significantly change and result in an impairment of the investment properties. Provision for obsolete inventories and net realisable value write down on inventories The Group reviews its inventory to assess loss on account of obsolescence and any write down for net realisable value adjustment on a regular basis. In determining whether provision for obsolescence should be recorded in profit and loss, the Group makes judgments as to whether there is any observable data indicating that there is any future saleability of the product and the net realisable value for such product. Provision for net realisable value write down is made where the net realisable value is less than cost based on best estimates by the management. The provision for obsolescence of inventory is based on its ageing and the past trend of consumption.
Impairment of goodwill
Goodwill is tested annually for impairment and carried at cost less accumulated impairment
losses (refer accounting policy on impairment). Testing for impairment requires management to estimate the recoverable amount of the cash generating unit to which the goodwill is allocated.
Impairment of property, plant and equipment and intangible assets
Property, plant and equipment are tested for impairment when there is an indication of impairment. Testing for impairment of these property, plant and equipment and intangible assets requires management to estimate the recoverable amount of the cash generating unit.
Ras Al Khaimah Ceramics PSC and its subsidiaries
Notes (continued)
82
37 Significant accounting estimates and judgements (continued)
Impairment losses on receivables The Group reviews its receivables to assess impairment at least on an annual basis. The Group’s credit risk is primarily attributable to its trade, related party and other receivables. In determining whether impairment losses should be recognised in profit and loss, the Group makes judgements as to whether there is any observable data indicating that there is a measurable decrease in the estimated future cash flows. Accordingly, an allowance for impairment is made where there is an identified loss event or condition which, based on previous experience, is evidence of a reduction in the recoverability of the cash flows. Identifiable assets and liabilities taken over on acquisition of subsidiaries The Group separately recognises assets and liabilities on the acquisition of a subsidiary when it is probable that the associated economic benefits will flow to the acquirer or when, in the case of liability, it is probable that an outflow of economic resources will be required to settle the obligation and the fair value of the asset or liability can be measured reliably. Intangible assets and contingent liabilities are separately recognised when they meet the criteria for recognition set out in IFRS 3. Current and deferred tax In determining the amount of current and deferred tax the Group takes into account the impact of uncertain tax positions and whether additional taxes and interest may be due. The Group believes that its accruals for tax liabilities are adequate for all open tax years based on its assessment of many factors, including interpretations of tax law and prior experience. This assessment relies on estimates and assumptions and may involve a series of judgements about future events. New information may become available that causes the Group to change its judgement regarding the adequacy of existing tax liabilities; such changes to tax liabilities will impact tax expense in the period in which a determination is made.
Consolidation – de facto control As a result of adoption of IFRS 10, the Group has changed its accounting policy with respect to determining whether it has control over and consequently whether it consolidates its investee. As part of the new control model, the Group has assessed for all its investees whether it has power over an investee, exposure or right to variable returns from its involvement with the investee and ability to use its power to affect those returns. In determining control, judgements have been exercised on the relationship of the Group with the investees based on which conclusions have been drawn.
38 Subsequent events
There have been no significant events subsequent to 31 December 2013 up to the date of authorisation of these financial statements which would have a material effect on these consolidated financial statements.
Related Documents