Rare earth elements as provenance indicators in North Australian estuarine and coastal marine sediments Niels Crosley Munksgaard * , Kezia Lim, David Livingstone Parry School of Biological, Environmental and Chemical Sciences, Northern Territory University, Darwin, NT 0909, Australia Received 14 May 2002; received in revised form 8 September 2002; accepted 13 September 2002 Abstract Rare earth elements (REE) in three grain size fractions of clay-dominated estuarine and coastal sediments from the North Australian coastline have been investigated for use as potential provenance indicators. Comparisons of data based on instrumental neutron activation analysis and inductively coupled plasma mass spectrometry revealed that HF digestions of zircon-bearing samples resulted in unsatisfactory recovery of REE. Instead, a relatively simple, fast and safe partial digestion using HClO 4 + HNO 3 was used to extract REE mainly from clay minerals while excluding extraction of REE from zircons. A comparison with published data for primary rock units within river catchments showed that the main REE systematics has been preserved in downstream clay-rich sediments. Analysis of variance of La/Gd (PAAS) , La/Yb (PAAS) and Eu/Eu* (PAAS) ratios in five areas showed that the <63 lm fraction possessed the greatest discriminating power. All five areas could be distinguished from each other at highly significant levels based on one or more of these ratios. Ó 2003 Elsevier Science B.V. All rights reserved. keywords: rare earth elements; instrumental neutron activation analysis; inductively coupled plasma mass spectrometery; digests; clays; provenance 1. Introduction It is the strong partition of rare earth elements (REE) into the particulate phase, their coherent behaviour during weathering, erosion and fluvial transportation and their high resistance to chemical mobilisation (McLennan, 1992; McLennan & Taylor, 1980) which underlie the use of REE in sediments as provenance indicators (e.g. Klaver & van Weering, 1993; Vital, Stattegger, & Garbe-Schonberg, 1999). In geological samples REE have commonly been determined by instrumental neutron activation analysis (INAA) (e.g. Orvini, Speziali, Salvini, & Herborg, 2000). The main advantage of INAA is that samples do not need to be solubilised. However, limitations include the need to access a nuclear reactor, high cost, long cooling time and often a limit to the number of REE that can be analysed. Inductively coupled plasma mass spectrometry (ICPMS), on the other hand, has a capability for relatively easy, cheap and fast analysis of all the REE at low detection limits but the difficulties in achieving complete dissolution can be substantial (Diegor, Longerich, Abrajano, & Horn, 2001; Jarvis, 1992; Sholkovitz, 1990). Digestion methods include rapid microwave techniques (Ivanova, Djingova, Korhammer, & Markert, 2001; Jarvis, 1992; Sen Gupta & Bertrand, 1995), externally heated pressure vessels and open beaker methods (Date & Hutchinson, 1987; Diegor et al., 2001; Jarvis, 1992). Commonly, HF is used in combination with other acids to effect total dissolution of silicate minerals. The use of HF requires management of the associated safety hazard. Alkaline fusion has been found to be a necessary pre-dissolution step for some refractory min- erals (Sholkovitz, 1990). In the present study, the ultimate objective is to use REE compositions of estuarine and coastal sediments as provenance indicators. Such sediments may act as sinks for river borne pollutants (Chapman & Wang, 2001) and provenance indicators may be useful in predicting the * Corresponding author. Environmental Analytical Chemistry Unit, Faculty of Science Information Technology and Education, Northern Territory University, Darwin, NT 0909, Australia. E-mail address: [email protected] (N.C. Munksgaard). Estuarine, Coastal and Shelf Science 57 (2003) 399–409 0272-7714/03/$ - see front matter Ó 2003 Elsevier Science B.V. All rights reserved. doi:10.1016/S0272-7714(02)00368-2

Welcome message from author
This document is posted to help you gain knowledge. Please leave a comment to let me know what you think about it! Share it to your friends and learn new things together.
Transcript
Estuarine, Coastal and Shelf Science 57 (2003) 399–409
Rare earth elements as provenance indicatorsin North Australian estuarine and coastal marine sediments
Niels Crosley Munksgaard*, Kezia Lim, David Livingstone Parry
School of Biological, Environmental and Chemical Sciences, Northern Territory University, Darwin, NT 0909, Australia
Received 14 May 2002; received in revised form 8 September 2002; accepted 13 September 2002
Abstract
Rare earth elements (REE) in three grain size fractions of clay-dominated estuarine and coastal sediments from the NorthAustralian coastline have been investigated for use as potential provenance indicators. Comparisons of data based on instrumental
neutron activation analysis and inductively coupled plasma mass spectrometry revealed that HF digestions of zircon-bearingsamples resulted in unsatisfactory recovery of REE. Instead, a relatively simple, fast and safe partial digestion usingHClO4+HNO3 was used to extract REE mainly from clay minerals while excluding extraction of REE from zircons. Acomparison with published data for primary rock units within river catchments showed that the main REE systematics has been
preserved in downstream clay-rich sediments. Analysis of variance of La/Gd(PAAS), La/Yb(PAAS) and Eu/Eu*(PAAS) ratios in fiveareas showed that the <63lm fraction possessed the greatest discriminating power. All five areas could be distinguished from eachother at highly significant levels based on one or more of these ratios.
� 2003 Elsevier Science B.V. All rights reserved.
keywords: rare earth elements; instrumental neutron activation analysis; inductively coupled plasma mass spectrometery; digests; clays; provenance
1. Introduction
It is the strong partition of rare earth elements (REE)into the particulate phase, their coherent behaviourduring weathering, erosion and fluvial transportationand their high resistance to chemical mobilisation(McLennan, 1992; McLennan & Taylor, 1980) whichunderlie the use of REE in sediments as provenanceindicators (e.g. Klaver & van Weering, 1993; Vital,Stattegger, & Garbe-Schonberg, 1999). In geologicalsamples REE have commonly been determined byinstrumental neutron activation analysis (INAA) (e.g.Orvini, Speziali, Salvini, & Herborg, 2000). The mainadvantage of INAA is that samples do not need to besolubilised. However, limitations include the need toaccess a nuclear reactor, high cost, long cooling time and
* Corresponding author. Environmental Analytical Chemistry Unit,
Faculty of Science Information Technology and Education, Northern
Territory University, Darwin, NT 0909, Australia.
E-mail address: [email protected]
(N.C. Munksgaard).
0272-7714/03/$ - see front matter � 2003 Elsevier Science B.V. All rights r
doi:10.1016/S0272-7714(02)00368-2
often a limit to the number of REE that can be analysed.Inductively coupled plasma mass spectrometry(ICPMS), on the other hand, has a capabilityfor relatively easy, cheap and fast analysis of all theREE at low detection limits but the difficulties inachieving complete dissolution can be substantial(Diegor, Longerich, Abrajano, & Horn, 2001; Jarvis,1992; Sholkovitz, 1990). Digestionmethods include rapidmicrowave techniques (Ivanova, Djingova, Korhammer,& Markert, 2001; Jarvis, 1992; Sen Gupta & Bertrand,1995), externally heated pressure vessels and open beakermethods (Date & Hutchinson, 1987; Diegor et al., 2001;Jarvis, 1992). Commonly, HF is used in combination withother acids to effect total dissolution of silicate minerals.The use of HF requires management of the associatedsafety hazard. Alkaline fusion has been found to be anecessary pre-dissolution step for some refractory min-erals (Sholkovitz, 1990).
In the present study, the ultimate objective is to useREE compositions of estuarine and coastal sediments asprovenance indicators. Such sediments may act as sinksfor river borne pollutants (Chapman &Wang, 2001) andprovenance indicators may be useful in predicting the
eserved.
400 N.C. Munksgaard et al. / Estuarine, Coastal and Shelf Science 57 (2003) 399–409
origin and pathways of pollutants. The potential for theuse of REE arises because of the large variation inprimary geological units between some of the NorthAustralian catchments. The present paper reports onan initial investigation of this potential by determin-ing REE compositions of sediments from four rivers/estuaries and one coastal area. Investigations were fo-cused on identifying an efficient analytical methodand on determining the distribution of REE as a func-tion of grain size and mineralogy as there is potentialfor physical REE fractionation during fluvial transpor-tation (McLennan, 1992; Taylor & McLennan, 1988).With the specific objective of using REE as provenanceindicators a partial digestion procedure using HClO4
and HNO3 was investigated. This procedure has ad-vantages in simplicity, speed and safety. It will beshown that such a digest of clay-dominated sedimentscan provide REE signatures that allow discriminationbetween catchments where there is sufficient vari-ation in the REE compositions of eroding geologicalunits.
2. Study area
The Adelaide River (131�159E, 12�119S), the DalyRiver (130�199E, 13�379S), the Norman River (140�509E,17�339S) and the Bynoe River (a deltaic branch of the
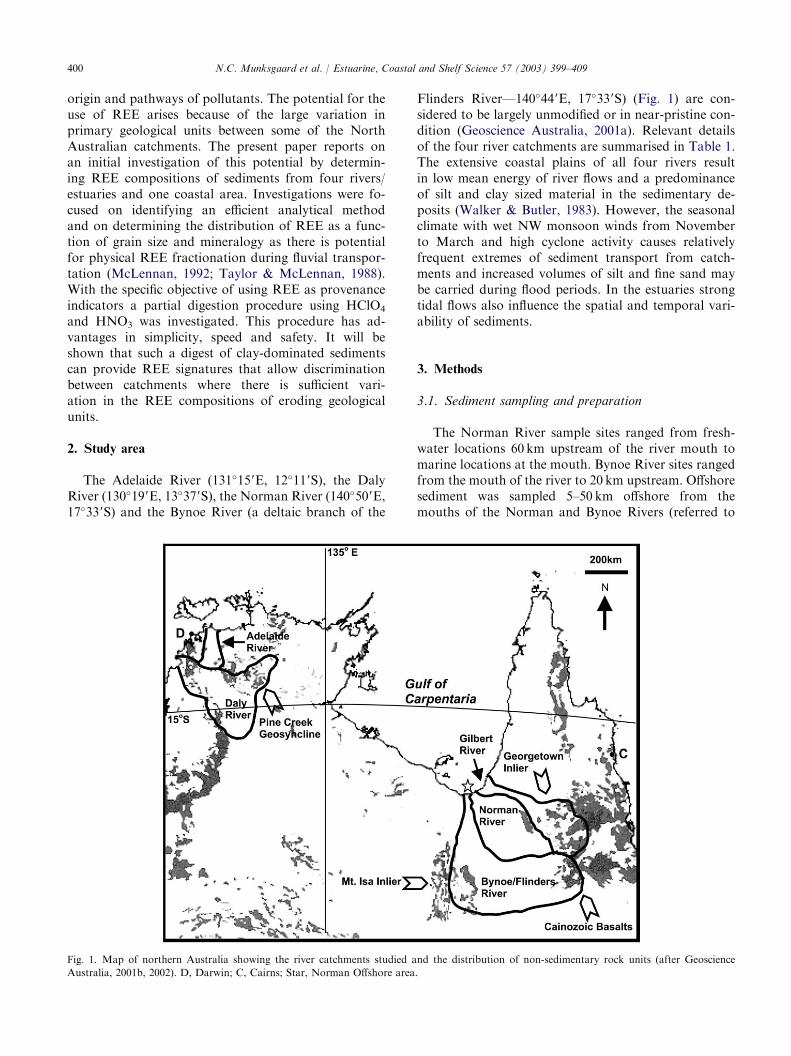
Flinders River—140�449E, 17�339S) (Fig. 1) are con-sidered to be largely unmodified or in near-pristine con-dition (Geoscience Australia, 2001a). Relevant detailsof the four river catchments are summarised in Table 1.The extensive coastal plains of all four rivers resultin low mean energy of river flows and a predominanceof silt and clay sized material in the sedimentary de-posits (Walker & Butler, 1983). However, the seasonalclimate with wet NW monsoon winds from Novemberto March and high cyclone activity causes relativelyfrequent extremes of sediment transport from catch-ments and increased volumes of silt and fine sand maybe carried during flood periods. In the estuaries strongtidal flows also influence the spatial and temporal vari-ability of sediments.
3. Methods
3.1. Sediment sampling and preparation
The Norman River sample sites ranged from fresh-water locations 60 km upstream of the river mouth tomarine locations at the mouth. Bynoe River sites rangedfrom the mouth of the river to 20 km upstream. Offshoresediment was sampled 5–50 km offshore from themouths of the Norman and Bynoe Rivers (referred to
Fig. 1. Map of northern Australia showing the river catchments studied and the distribution of non-sedimentary rock units (after Geoscience
Australia, 2001b, 2002). D, Darwin; C, Cairns; Star, Norman Offshore area.
401N.C. Munksgaard et al. / Estuarine, Coastal and Shelf Science 57 (2003) 399–409
Table 1
Features of the hillslope regions of the Daly, Adelaide, Bynoe/Flinders and Norman River catchments
Daly River Adelaide River Bynoe/Flinders River Norman River
Total catchment (km2) 53,776 7216 109,460 49,588
Geological province/unit Pine Creek: geosyncline (1);
Daly Basin (2);
McArthur Basin (3)
Pine Creek: geosyncline (1);
mesozoic cover unit (2)
Mt. Isa Inlier (eastern
foldbelt) (1);
Sturgeon volcanic
province (2)
Georgetown Inlier
(Croydon subprovince)
Major rock types (1) Metasediment, gneisses,
granites; (2,3) sandstone
and volcanics
(1) Metasediments, gneisses,
granites; (2) sandstone,
siltstone
(1) Metasediments,
metavolcanics, granitoids;
(2) basalts
Ignimbrites, rhyolites,
granites
Felsic igneous rocks (%)a 43 50 24 100
Geomorphology (1) Strongly undulating
foothills and ridges;
(2,3) plateaus, tablelands
(1) Low rounded to steep
sided hills; (2) mesas
(1) Dissected plateau, strike
ridges; (2) plateau
Dissected plateau,
undulating hills
Soil development (1,2,3) Sandy or loamy
lithosols, lateritic
podzolics
(1,2) Sandy or loamy
lithosols, lateritic podzolics
(1) Shallow lithosols, much
rock outcrop; (2) poorly
developed brown-red soils
Lithosols, very shallow
on volcanic rocks
a Estimated coverage of �felsic volcanics� and �granites� as a proportion of the non-sedimentary rock units (Geoscience Australia, 2001b).
Mainly after Ahmad, Wygralak, Ferenczi, and Bajwah (1993), Geoscience Australia (2001b), Henderson (1980), Isbell and Hubble (1983), Kruse
et al. (1994), Stephenson, Griffin, and Sutherland (1980) and Withnall, Bain, and Rubenach (1980). Numbers in brackets refer to geological province/
unit.
as Norman Offshore) and included the sandy edges ofdepositional banks in front of the Norman River(referred to as Norman Channel Banks). Sampling inthe Adelaide River ranged from freshwater sites 150 kmupstream of the mouth to marine sites at the mouth,whereas the Daly River sites ranged from freshwater toestuarine sites 140–60 km upstream of the mouth.Bottom sediment (approx. 5 kg) was sampled with a�Van Veen� stainless steel grab penetrating to 10 cmdepth. Several sites were sampled in triplicate. Mostsamples were wet-sieved to 2mm–63 lm and <63 lmfractions but several samples were further divided into63–20 lm and <20 lm fractions for more detailedinvestigations. Samples were oven-dried at 60 �C overnight and homogenised with an automated agate mortarand pestle.
3.2. Grain size distribution and mineralogy
Grain size data were obtained by laser diffractionanalysis (CSIRO Division of Minerals) except for theDaly and Adelaide River samples for which data wereobtained by wet sieving. Quantitative mineralogical datafor the <63 lm grain size fraction were obtained by X-ray diffraction analysis (CSIRO Land and Water) andheavy minerals were identified by scanning electronmicroscopy (SEM) and energy dispersive X-ray analysis.
3.3. INAA analysis
Samples were analysed by instrumental neutronactivation for La, Ce, Nd, Sm, Eu, Tb, Ho, Yb and Luusing the Australian Nuclear Science and Technology
Organisation’s HIFAR reactor. The detection limitsranged from 0.01 ppm for Lu to 1.0 ppm for Nd.
3.4. Acid digestion and ICPMS analysis
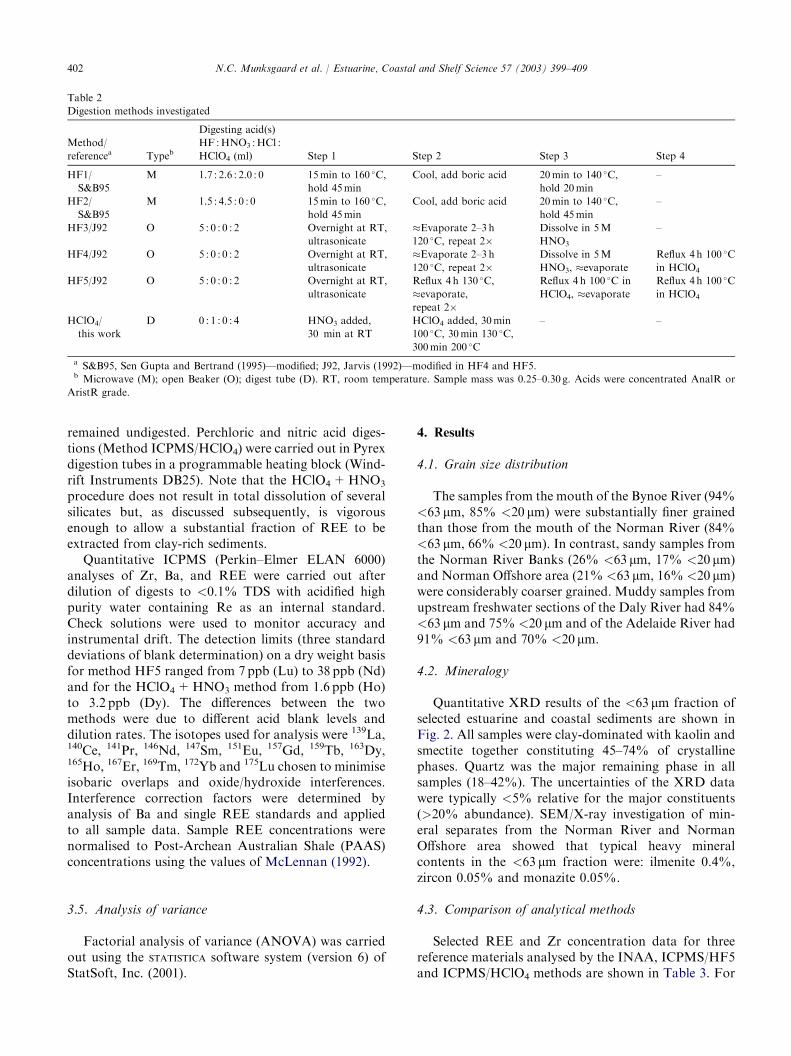
A selection of samples of three grain size fractionsfrom the Bynoe and Norman Rivers and three certifiedreference sediments (NIST 2704, NIST 2711 and IAEASoil-7) were subjected to different acid digestion pro-cedures (Table 2). INAA results were available for allof these samples. Reference materials, blanks and dupli-cates were included in each method.
Two HF digestion methods were investigated usingmicrowave heating in pressure vessels (CEM MSP1000).Method HF1 was based on the method of Sen Gupta andBertrand (1995) using HF+HNO3+HCl but withscaled down sample mass and acid volume and with anextended digestion time.Method HF2 differed fromHF1in using the HF+HNO3 combination recommended byUSEPA method 3052 (USEPA, 1996) and further ex-tending the digestion time. None of these methodsresulted in complete digestion and dilutions formed gel-like precipitates upon standing. Longer duration openbeaker digestions were also tested with the HF+HClO4
method of Jarvis (1992) with samples being ultra-sonicated before heating (Method HF3). Some reductionof undissolved residue was achieved compared to themicrowave methods but digestions remained incomplete.The method was repeated (Method HF4) with a finalreflux in HClO4 which led to a more stable finalsolution. The last HF method tested (Method HF5)added three HF refluxing steps and a repeated HClO4
reflux step instead of the intermediate HNO3 dissolutionstep and resulted in the most complete and stable di-gest solution. However, some faintly visible particles
402 N.C. Munksgaard et al. / Estuarine, Coastal and Shelf Science 57 (2003) 399–409
Table 2
Digestion methods investigated
Method/
referencea Typeb
Digesting acid(s)
HF :HNO3 :HCl :
HClO4 (ml) Step 1 Step 2 Step 3 Step 4
HF1/
S&B95
M 1.7 : 2.6 : 2.0 : 0 15min to 160 �C,
hold 45min
Cool, add boric acid 20min to 140 �C,
hold 20min
–
HF2/
S&B95
M 1.5 : 4.5 : 0 : 0 15min to 160 �C,
hold 45min
Cool, add boric acid 20min to 140 �C,
hold 45min
–
HF3/J92 O 5 : 0 : 0 : 2 Overnight at RT,
ultrasonicate
�Evaporate 2–3 h
120 �C, repeat 2�Dissolve in 5M
HNO3
–
HF4/J92 O 5 : 0 : 0 : 2 Overnight at RT,
ultrasonicate
�Evaporate 2–3 h
120 �C, repeat 2�Dissolve in 5M
HNO3, �evaporate
Reflux 4 h 100 �C
in HClO4
HF5/J92 O 5 : 0 : 0 : 2 Overnight at RT,
ultrasonicate
Reflux 4 h 130 �C,
�evaporate,
repeat 2�
Reflux 4 h 100 �C in
HClO4, �evaporate
Reflux 4 h 100 �C
in HClO4
HClO4/
this work
D 0 : 1 : 0 : 4 HNO3 added,
30 min at RT
HClO4 added, 30min
100 �C, 30min 130 �C,
300min 200 �C
– –
a S&B95, Sen Gupta and Bertrand (1995)—modified; J92, Jarvis (1992)—modified in HF4 and HF5.b Microwave (M); open Beaker (O); digest tube (D). RT, room temperature. Sample mass was 0.25–0.30 g. Acids were concentrated AnalR or
AristR grade.
remained undigested. Perchloric and nitric acid diges-tions (Method ICPMS/HClO4) were carried out in Pyrexdigestion tubes in a programmable heating block (Wind-rift Instruments DB25). Note that the HClO4+HNO3
procedure does not result in total dissolution of severalsilicates but, as discussed subsequently, is vigorousenough to allow a substantial fraction of REE to beextracted from clay-rich sediments.
Quantitative ICPMS (Perkin–Elmer ELAN 6000)analyses of Zr, Ba, and REE were carried out afterdilution of digests to <0.1% TDS with acidified highpurity water containing Re as an internal standard.Check solutions were used to monitor accuracy andinstrumental drift. The detection limits (three standarddeviations of blank determination) on a dry weight basisfor method HF5 ranged from 7ppb (Lu) to 38 ppb (Nd)and for the HClO4+HNO3 method from 1.6 ppb (Ho)to 3.2 ppb (Dy). The differences between the twomethods were due to different acid blank levels anddilution rates. The isotopes used for analysis were 139La,140Ce, 141Pr, 146Nd, 147Sm, 151Eu, 157Gd, 159Tb, 163Dy,165Ho, 167Er, 169Tm, 172Yb and 175Lu chosen to minimiseisobaric overlaps and oxide/hydroxide interferences.Interference correction factors were determined byanalysis of Ba and single REE standards and appliedto all sample data. Sample REE concentrations werenormalised to Post-Archean Australian Shale (PAAS)concentrations using the values of McLennan (1992).
3.5. Analysis of variance
Factorial analysis of variance (ANOVA) was carriedout using the STATISTICA software system (version 6) ofStatSoft, Inc. (2001).
4. Results
4.1. Grain size distribution
The samples from the mouth of the Bynoe River (94%<63 lm, 85% <20 lm) were substantially finer grainedthan those from the mouth of the Norman River (84%<63 lm, 66% <20 lm). In contrast, sandy samples fromthe Norman River Banks (26% <63 lm, 17% <20 lm)and Norman Offshore area (21% <63 lm, 16% <20 lm)were considerably coarser grained. Muddy samples fromupstream freshwater sections of the Daly River had 84%<63 lm and 75% <20 lm and of the Adelaide River had91% <63 lm and 70% <20 lm.
4.2. Mineralogy
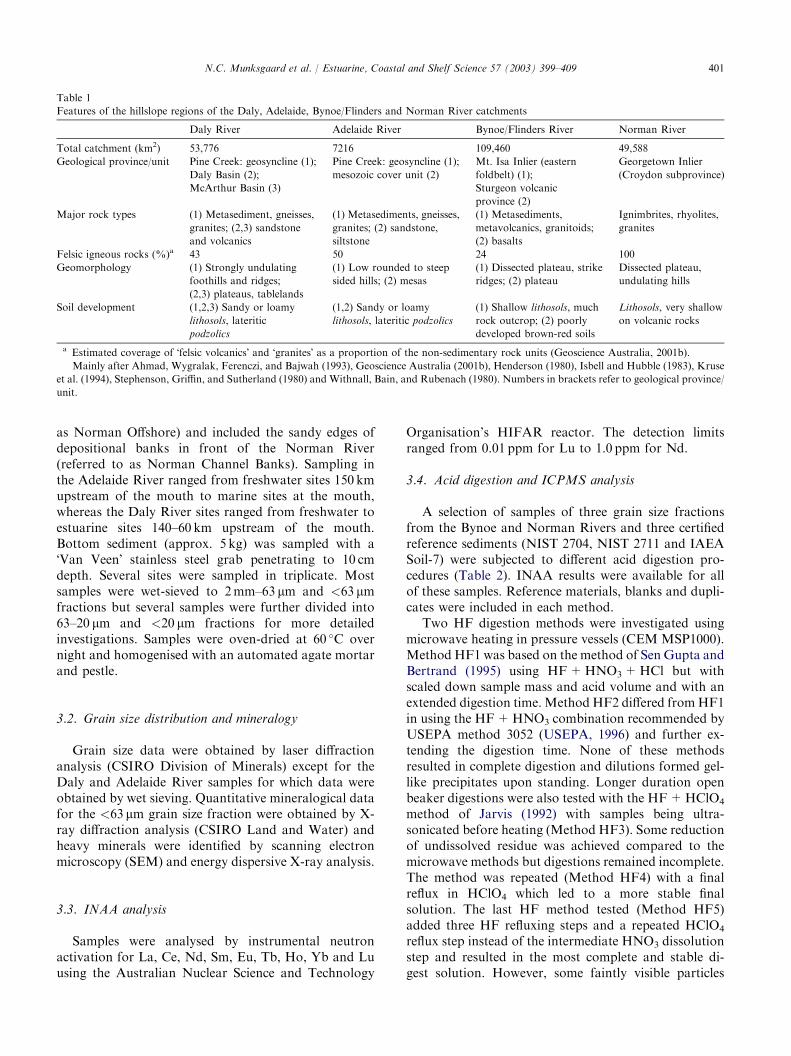
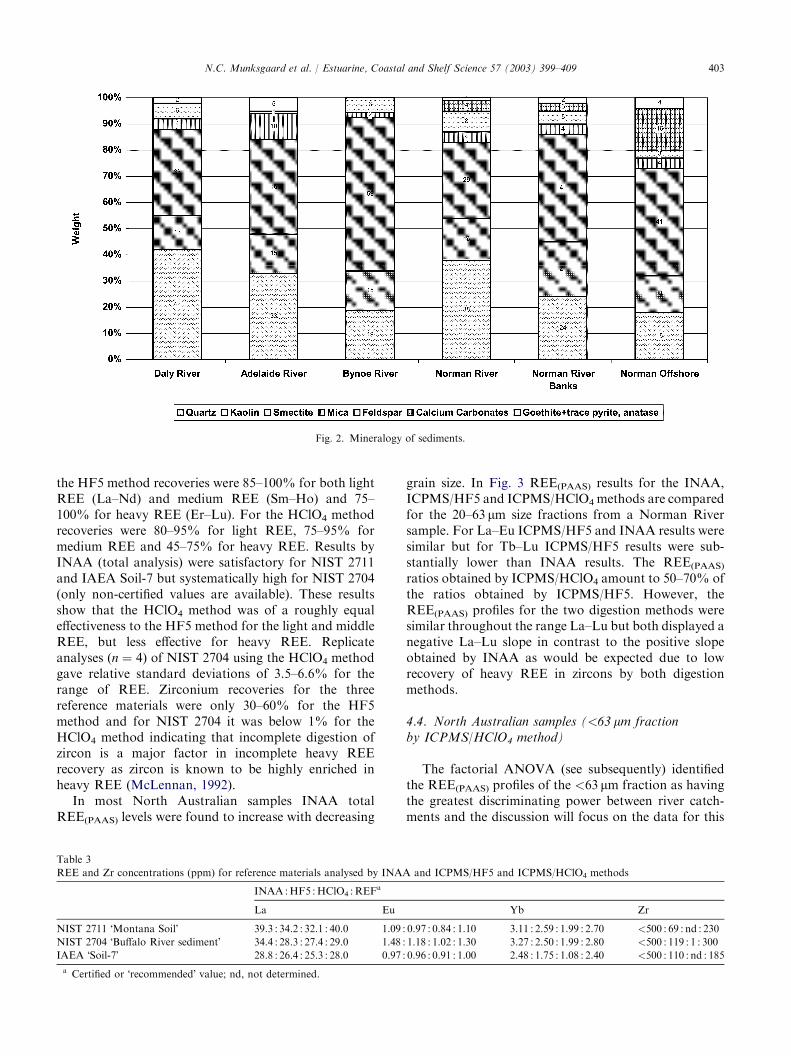
Quantitative XRD results of the <63 lm fraction ofselected estuarine and coastal sediments are shown inFig. 2. All samples were clay-dominated with kaolin andsmectite together constituting 45–74% of crystallinephases. Quartz was the major remaining phase in allsamples (18–42%). The uncertainties of the XRD datawere typically <5% relative for the major constituents(>20% abundance). SEM/X-ray investigation of min-eral separates from the Norman River and NormanOffshore area showed that typical heavy mineralcontents in the <63 lm fraction were: ilmenite 0.4%,zircon 0.05% and monazite 0.05%.
4.3. Comparison of analytical methods
Selected REE and Zr concentration data for threereference materials analysed by the INAA, ICPMS/HF5and ICPMS/HClO4 methods are shown in Table 3. For
403N.C. Munksgaard et al. / Estuarine, Coastal and Shelf Science 57 (2003) 399–409
Fig. 2. Mineralogy of sediments.
the HF5 method recoveries were 85–100% for both lightREE (La–Nd) and medium REE (Sm–Ho) and 75–100% for heavy REE (Er–Lu). For the HClO4 methodrecoveries were 80–95% for light REE, 75–95% formedium REE and 45–75% for heavy REE. Results byINAA (total analysis) were satisfactory for NIST 2711and IAEA Soil-7 but systematically high for NIST 2704(only non-certified values are available). These resultsshow that the HClO4 method was of a roughly equaleffectiveness to the HF5 method for the light and middleREE, but less effective for heavy REE. Replicateanalyses (n ¼ 4) of NIST 2704 using the HClO4 methodgave relative standard deviations of 3.5–6.6% for therange of REE. Zirconium recoveries for the threereference materials were only 30–60% for the HF5method and for NIST 2704 it was below 1% for theHClO4 method indicating that incomplete digestion ofzircon is a major factor in incomplete heavy REErecovery as zircon is known to be highly enriched inheavy REE (McLennan, 1992).
In most North Australian samples INAA totalREE(PAAS) levels were found to increase with decreasing
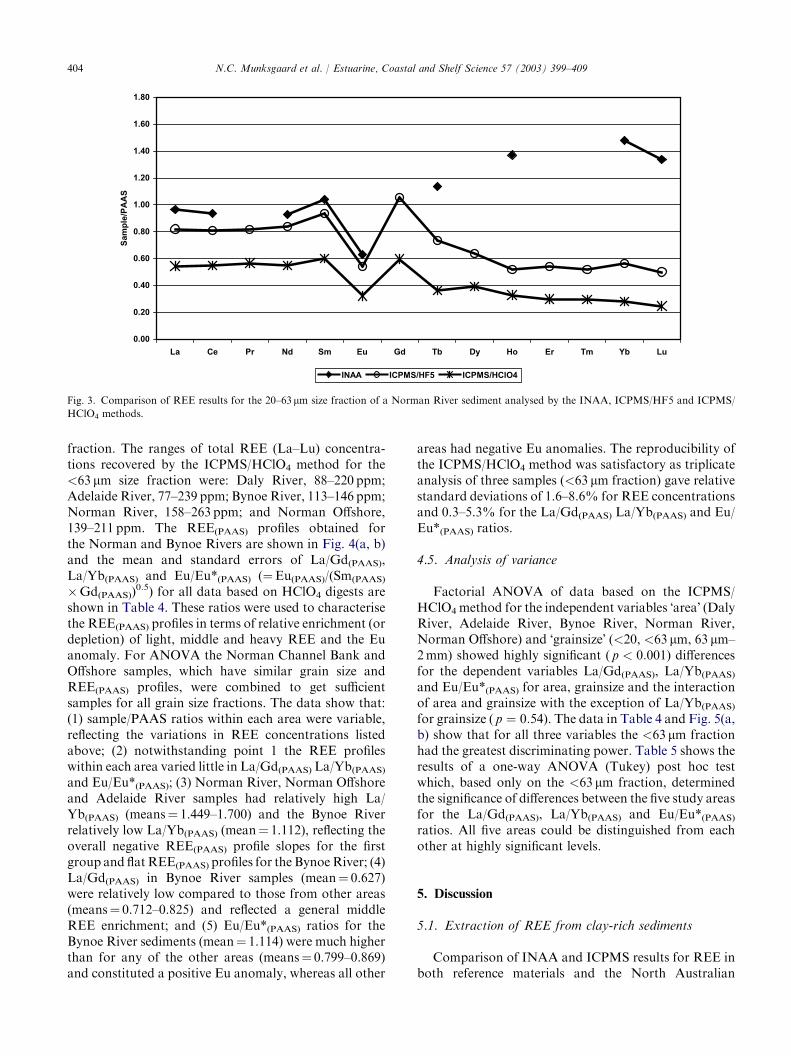
grain size. In Fig. 3 REE(PAAS) results for the INAA,ICPMS/HF5 and ICPMS/HClO4 methods are comparedfor the 20–63 lm size fractions from a Norman Riversample. For La–Eu ICPMS/HF5 and INAA results weresimilar but for Tb–Lu ICPMS/HF5 results were sub-stantially lower than INAA results. The REE(PAAS)
ratios obtained by ICPMS/HClO4 amount to 50–70% ofthe ratios obtained by ICPMS/HF5. However, theREE(PAAS) profiles for the two digestion methods weresimilar throughout the range La–Lu but both displayed anegative La–Lu slope in contrast to the positive slopeobtained by INAA as would be expected due to lowrecovery of heavy REE in zircons by both digestionmethods.
4.4. North Australian samples (<63 lm fractionby ICPMS/HClO4 method)
The factorial ANOVA (see subsequently) identifiedthe REE(PAAS) profiles of the <63 lm fraction as havingthe greatest discriminating power between river catch-ments and the discussion will focus on the data for this
Table 3
REE and Zr concentrations (ppm) for reference materials analysed by INAA and ICPMS/HF5 and ICPMS/HClO4 methods
INAA :HF5 :HClO4 :REFa
La Eu Yb Zr
NIST 2711 �Montana Soil� 39.3 : 34.2 : 32.1 : 40.0 1.09 : 0.97 : 0.84 : 1.10 3.11 : 2.59 : 1.99 : 2.70 <500 : 69 : nd : 230
NIST 2704 �Buffalo River sediment� 34.4 : 28.3 : 27.4 : 29.0 1.48 : 1.18 : 1.02 : 1.30 3.27 : 2.50 : 1.99 : 2.80 <500 : 119 : 1 : 300
IAEA �Soil-7� 28.8 : 26.4 : 25.3 : 28.0 0.97 : 0.96 : 0.91 : 1.00 2.48 : 1.75 : 1.08 : 2.40 <500 : 110 : nd : 185
a Certified or �recommended� value; nd, not determined.
404 N.C. Munksgaard et al. / Estuarine, Coastal and Shelf Science 57 (2003) 399–409
Fig. 3. Comparison of REE results for the 20–63lm size fraction of a Norman River sediment analysed by the INAA, ICPMS/HF5 and ICPMS/
HClO4 methods.
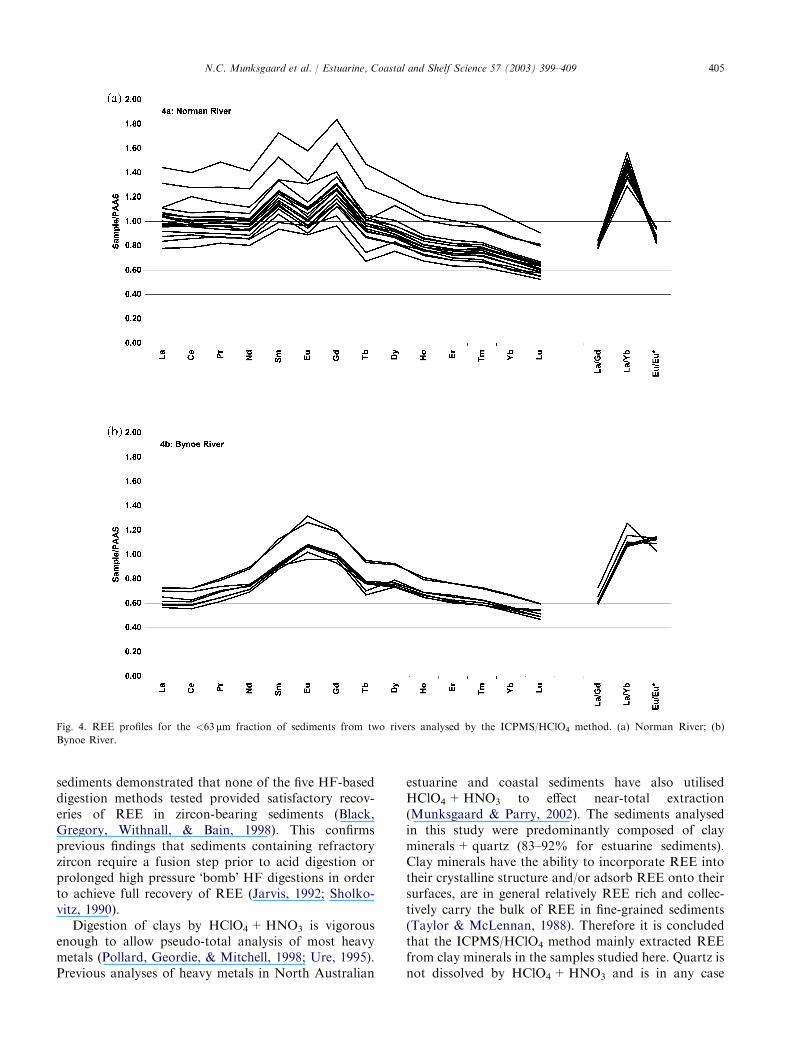
fraction. The ranges of total REE (La–Lu) concentra-tions recovered by the ICPMS/HClO4 method for the<63 lm size fraction were: Daly River, 88–220 ppm;Adelaide River, 77–239 ppm; Bynoe River, 113–146 ppm;Norman River, 158–263 ppm; and Norman Offshore,139–211 ppm. The REE(PAAS) profiles obtained forthe Norman and Bynoe Rivers are shown in Fig. 4(a, b)and the mean and standard errors of La/Gd(PAAS),La/Yb(PAAS) and Eu/Eu*(PAAS) (¼Eu(PAAS)/(Sm(PAAS)
�Gd(PAAS))0.5) for all data based on HClO4 digests are
shown in Table 4. These ratios were used to characterisethe REE(PAAS) profiles in terms of relative enrichment (ordepletion) of light, middle and heavy REE and the Euanomaly. For ANOVA the Norman Channel Bank andOffshore samples, which have similar grain size andREE(PAAS) profiles, were combined to get sufficientsamples for all grain size fractions. The data show that:(1) sample/PAAS ratios within each area were variable,reflecting the variations in REE concentrations listedabove; (2) notwithstanding point 1 the REE profileswithin each area varied little in La/Gd(PAAS) La/Yb(PAAS)
and Eu/Eu*(PAAS); (3) Norman River, Norman Offshoreand Adelaide River samples had relatively high La/Yb(PAAS) (means¼ 1.449–1.700) and the Bynoe Riverrelatively low La/Yb(PAAS) (mean¼ 1.112), reflecting theoverall negative REE(PAAS) profile slopes for the firstgroup and flat REE(PAAS) profiles for the BynoeRiver; (4)La/Gd(PAAS) in Bynoe River samples (mean¼ 0.627)were relatively low compared to those from other areas(means¼ 0.712–0.825) and reflected a general middleREE enrichment; and (5) Eu/Eu*(PAAS) ratios for theBynoe River sediments (mean¼ 1.114) were much higherthan for any of the other areas (means¼ 0.799–0.869)and constituted a positive Eu anomaly, whereas all other
areas had negative Eu anomalies. The reproducibility ofthe ICPMS/HClO4 method was satisfactory as triplicateanalysis of three samples (<63 lm fraction) gave relativestandard deviations of 1.6–8.6% for REE concentrationsand 0.3–5.3% for the La/Gd(PAAS) La/Yb(PAAS) and Eu/Eu*(PAAS) ratios.
4.5. Analysis of variance
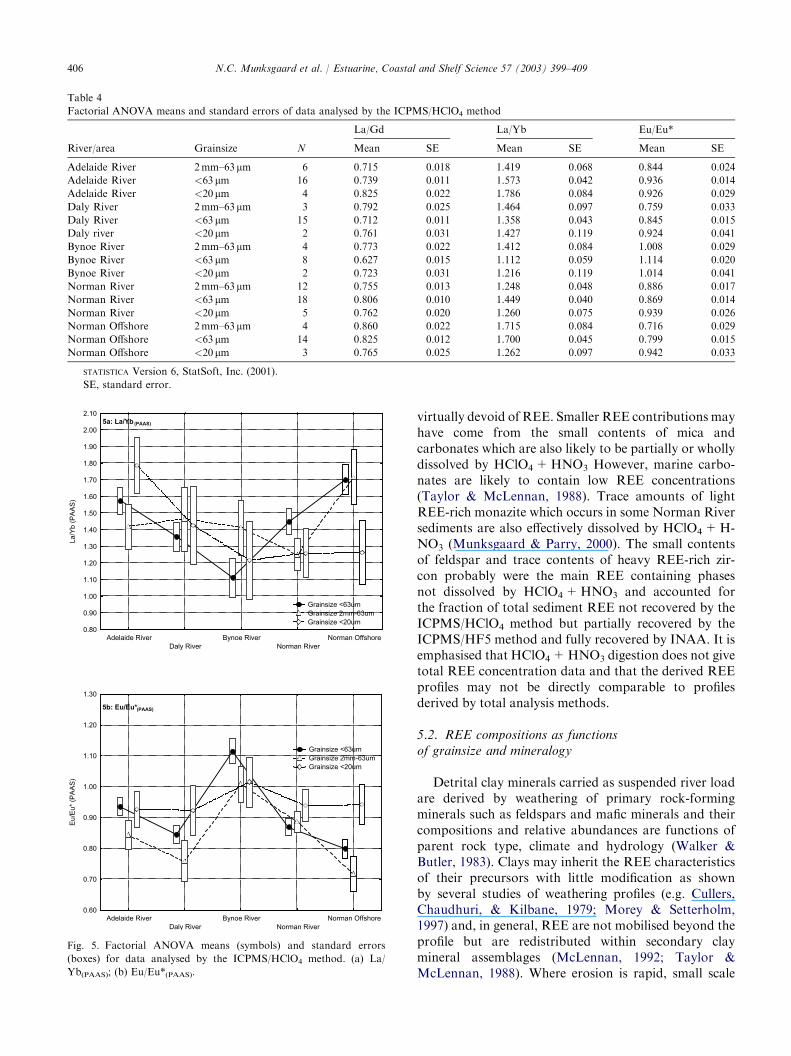
Factorial ANOVA of data based on the ICPMS/HClO4 method for the independent variables �area� (DalyRiver, Adelaide River, Bynoe River, Norman River,Norman Offshore) and �grainsize� (<20, <63 lm, 63 lm–2mm) showed highly significant ( p < 0:001) differencesfor the dependent variables La/Gd(PAAS), La/Yb(PAAS)
and Eu/Eu*(PAAS) for area, grainsize and the interactionof area and grainsize with the exception of La/Yb(PAAS)
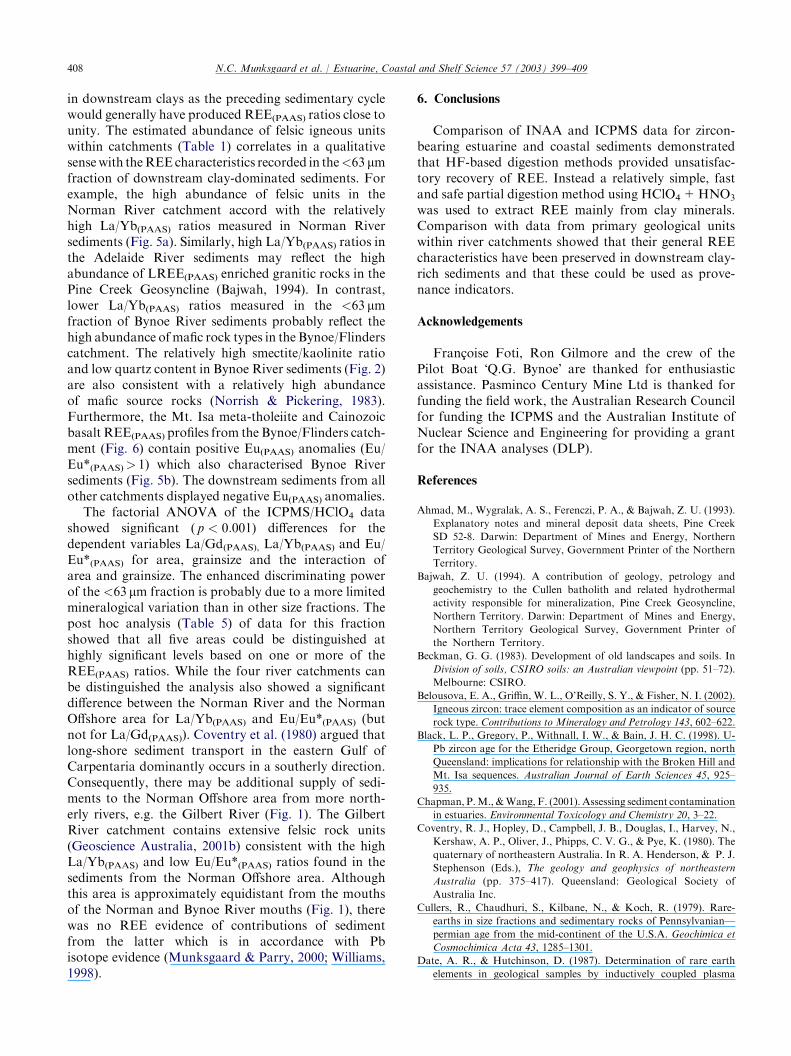
for grainsize ( p ¼ 0:54). The data in Table 4 and Fig. 5(a,b) show that for all three variables the <63 lm fractionhad the greatest discriminating power. Table 5 shows theresults of a one-way ANOVA (Tukey) post hoc testwhich, based only on the <63 lm fraction, determinedthe significance of differences between the five study areasfor the La/Gd(PAAS), La/Yb(PAAS) and Eu/Eu*(PAAS)
ratios. All five areas could be distinguished from eachother at highly significant levels.
5. Discussion
5.1. Extraction of REE from clay-rich sediments
Comparison of INAA and ICPMS results for REE inboth reference materials and the North Australian
405N.C. Munksgaard et al. / Estuarine, Coastal and Shelf Science 57 (2003) 399–409
Fig. 4. REE profiles for the <63 lm fraction of sediments from two rivers analysed by the ICPMS/HClO4 method. (a) Norman River; (b)
Bynoe River.
sediments demonstrated that none of the five HF-baseddigestion methods tested provided satisfactory recov-eries of REE in zircon-bearing sediments (Black,Gregory, Withnall, & Bain, 1998). This confirmsprevious findings that sediments containing refractoryzircon require a fusion step prior to acid digestion orprolonged high pressure �bomb� HF digestions in orderto achieve full recovery of REE (Jarvis, 1992; Sholko-vitz, 1990).
Digestion of clays by HClO4+HNO3 is vigorousenough to allow pseudo-total analysis of most heavymetals (Pollard, Geordie, & Mitchell, 1998; Ure, 1995).Previous analyses of heavy metals in North Australian
estuarine and coastal sediments have also utilisedHClO4+HNO3 to effect near-total extraction(Munksgaard & Parry, 2002). The sediments analysedin this study were predominantly composed of clayminerals+quartz (83–92% for estuarine sediments).Clay minerals have the ability to incorporate REE intotheir crystalline structure and/or adsorb REE onto theirsurfaces, are in general relatively REE rich and collec-tively carry the bulk of REE in fine-grained sediments(Taylor & McLennan, 1988). Therefore it is concludedthat the ICPMS/HClO4 method mainly extracted REEfrom clay minerals in the samples studied here. Quartz isnot dissolved by HClO4+HNO3 and is in any case
406 N.C. Munksgaard et al. / Estuarine, Coastal and Shelf Science 57 (2003) 399–409
Table 4
Factorial ANOVA means and standard errors of data analysed by the ICPMS/HClO4 method
La/Gd La/Yb Eu/Eu*
River/area Grainsize N Mean SE Mean SE Mean SE
Adelaide River 2mm–63lm 6 0.715 0.018 1.419 0.068 0.844 0.024
Adelaide River <63lm 16 0.739 0.011 1.573 0.042 0.936 0.014
Adelaide River <20lm 4 0.825 0.022 1.786 0.084 0.926 0.029
Daly River 2mm–63lm 3 0.792 0.025 1.464 0.097 0.759 0.033
Daly River <63lm 15 0.712 0.011 1.358 0.043 0.845 0.015
Daly river <20lm 2 0.761 0.031 1.427 0.119 0.924 0.041
Bynoe River 2mm–63lm 4 0.773 0.022 1.412 0.084 1.008 0.029
Bynoe River <63lm 8 0.627 0.015 1.112 0.059 1.114 0.020
Bynoe River <20lm 2 0.723 0.031 1.216 0.119 1.014 0.041
Norman River 2mm–63lm 12 0.755 0.013 1.248 0.048 0.886 0.017
Norman River <63lm 18 0.806 0.010 1.449 0.040 0.869 0.014
Norman River <20lm 5 0.762 0.020 1.260 0.075 0.939 0.026
Norman Offshore 2mm–63lm 4 0.860 0.022 1.715 0.084 0.716 0.029
Norman Offshore <63lm 14 0.825 0.012 1.700 0.045 0.799 0.015
Norman Offshore <20lm 3 0.765 0.025 1.262 0.097 0.942 0.033
STATISTICA Version 6, StatSoft, Inc. (2001).
SE, standard error.
Fig. 5. Factorial ANOVA means (symbols) and standard errors
(boxes) for data analysed by the ICPMS/HClO4 method. (a) La/
Yb(PAAS); (b) Eu/Eu*(PAAS).
virtually devoid of REE. Smaller REE contributions mayhave come from the small contents of mica andcarbonates which are also likely to be partially or whollydissolved by HClO4+HNO3 However, marine carbo-nates are likely to contain low REE concentrations(Taylor & McLennan, 1988). Trace amounts of lightREE-rich monazite which occurs in some Norman Riversediments are also effectively dissolved by HClO4+H-NO3 (Munksgaard & Parry, 2000). The small contentsof feldspar and trace contents of heavy REE-rich zir-con probably were the main REE containing phasesnot dissolved by HClO4+HNO3 and accounted forthe fraction of total sediment REE not recovered by theICPMS/HClO4 method but partially recovered by theICPMS/HF5 method and fully recovered by INAA. It isemphasised that HClO4+HNO3 digestion does not givetotal REE concentration data and that the derived REEprofiles may not be directly comparable to profilesderived by total analysis methods.
5.2. REE compositions as functionsof grainsize and mineralogy
Detrital clay minerals carried as suspended river loadare derived by weathering of primary rock-formingminerals such as feldspars and mafic minerals and theircompositions and relative abundances are functions ofparent rock type, climate and hydrology (Walker &Butler, 1983). Clays may inherit the REE characteristicsof their precursors with little modification as shownby several studies of weathering profiles (e.g. Cullers,Chaudhuri, & Kilbane, 1979; Morey & Setterholm,1997) and, in general, REE are not mobilised beyond theprofile but are redistributed within secondary claymineral assemblages (McLennan, 1992; Taylor &McLennan, 1988). Where erosion is rapid, small scale
407N.C. Munksgaard et al. / Estuarine, Coastal and Shelf Science 57 (2003) 399–409
REE differences within the weathering profile may berapidly re-homogenised in sedimentary deposits due tomixing during fluvial transportation (Morey & Setter-holm, 1997). The general characteristics of primary rockREE systematics may thus be preserved in downstreamclay-rich sediments derived from such rocks. However,
Table 5
ANOVA Tukey post hoc test of ICPMS/HClO4 data for the <63 lmfraction
River/Area
Adelaide
River
Daly
River
Bynoe
River
Norman
River
Unequal N HSD; variable La/Gd (river L63 lm)a
Daly River 0.0881
Bynoe River 0.0001** 0.0001**
Norman River 0.0001** 0.0001** 0.0001**
Norman Offshore 0.0001** 0.0001** 0.0001** 0.4187
Unequal N HSD; variable La/Yb (river L63 lm)b
Daly River 0.0001**
Bynoe River 0.0001** 0.0001**
Norman River 0.0015** 0.0431** 0.0001**
Norman Offshore 0.0026** 0.0001** 0.0001** 0.0001**
Unequal N HSD; variable Eu/Eu* (river L63 lm)c
Daly River 0.0001**
Bynoe River 0.0001** 0.0001**
Norman River 0.0001** 0.2738 0.0001**
Norman Offshore 0.0001** 0.0039** 0.0001** 0.0001**
STATISTICA Version 6, StatSoft, Inc. (2001).
**Significant p-values are p < 0:05.a Probabilities for post hoc tests error: between MS¼ 0.00083,
df¼ 66.000.b Probabilities for post hoc tests error: between MS¼ 0.00762,
df¼ 66.000.c Probabilities for post hoc tests error: between MS¼ 0.00105,
df¼ 66.000.
varying downstream transport regimes (e.g. fluvialenergy level) may cause grain sorting based on sizeand/or density and cause difficulty in using whole-sediment REE chemistry as a provenance indicator(McLennan, 1992). For example, changes in whole-sediment REE profiles could result from varying down-stream contents of heavy REE-rich zircon unrelated toany change in provenance. Therefore, when using clay-bound REE as a provenance indicator, HClO4+HNO3
digestion is advantageous due to its exclusion of theREE content of zircon. Irrespective of this, individualigneous zircons can be used successfully to discriminatebetween parent rock types based on their trace element(including REE) composition (Belousova, Griffin,O’Reilly, & Fisher, 2002).
5.3. REE as provenance indicators
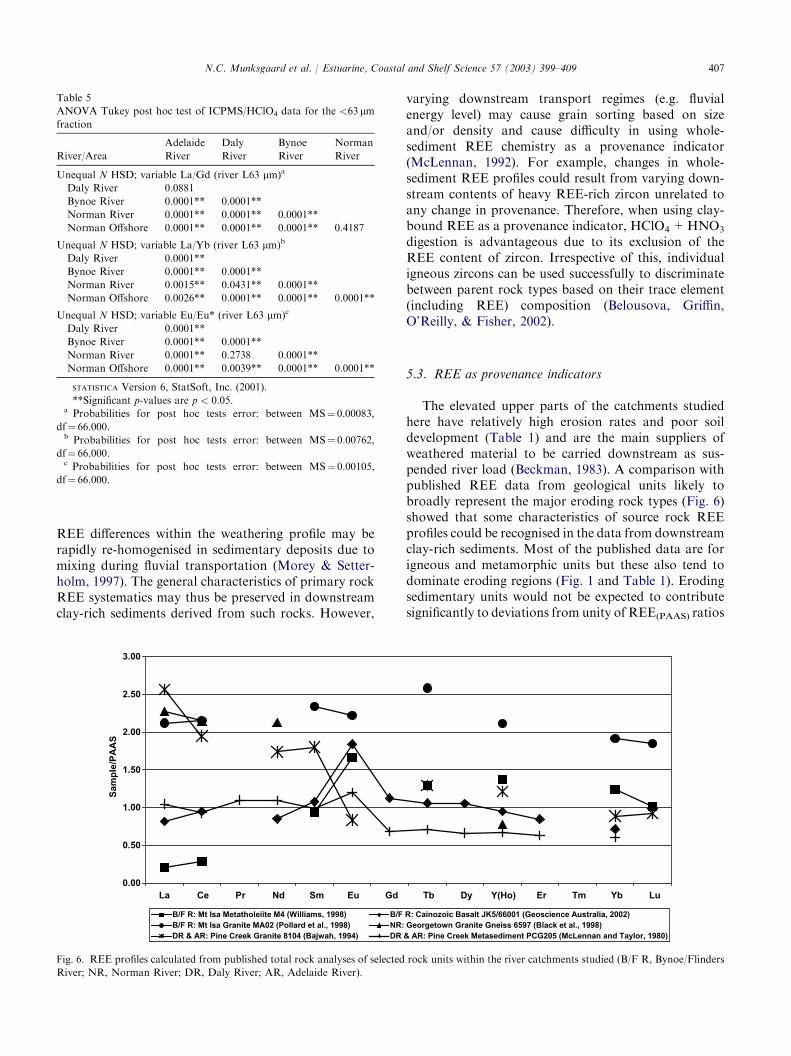
The elevated upper parts of the catchments studiedhere have relatively high erosion rates and poor soildevelopment (Table 1) and are the main suppliers ofweathered material to be carried downstream as sus-pended river load (Beckman, 1983). A comparison withpublished REE data from geological units likely tobroadly represent the major eroding rock types (Fig. 6)showed that some characteristics of source rock REEprofiles could be recognised in the data from downstreamclay-rich sediments. Most of the published data are forigneous and metamorphic units but these also tend todominate eroding regions (Fig. 1 and Table 1). Erodingsedimentary units would not be expected to contributesignificantly to deviations from unity of REE(PAAS) ratios
Fig. 6. REE profiles calculated from published total rock analyses of selected rock units within the river catchments studied (B/F R, Bynoe/Flinders
River; NR, Norman River; DR, Daly River; AR, Adelaide River).
408 N.C. Munksgaard et al. / Estuarine, Coastal and Shelf Science 57 (2003) 399–409
in downstream clays as the preceding sedimentary cyclewould generally have produced REE(PAAS) ratios close tounity. The estimated abundance of felsic igneous unitswithin catchments (Table 1) correlates in a qualitativesensewith theREEcharacteristics recorded in the<63 lmfraction of downstream clay-dominated sediments. Forexample, the high abundance of felsic units in theNorman River catchment accord with the relativelyhigh La/Yb(PAAS) ratios measured in Norman Riversediments (Fig. 5a). Similarly, high La/Yb(PAAS) ratios inthe Adelaide River sediments may reflect the highabundance of LREE(PAAS) enriched granitic rocks in thePine Creek Geosyncline (Bajwah, 1994). In contrast,lower La/Yb(PAAS) ratios measured in the <63 lmfraction of Bynoe River sediments probably reflect thehigh abundance ofmafic rock types in the Bynoe/Flinderscatchment. The relatively high smectite/kaolinite ratioand low quartz content in Bynoe River sediments (Fig. 2)are also consistent with a relatively high abundanceof mafic source rocks (Norrish & Pickering, 1983).Furthermore, the Mt. Isa meta-tholeiite and Cainozoicbasalt REE(PAAS) profiles from the Bynoe/Flinders catch-ment (Fig. 6) contain positive Eu(PAAS) anomalies (Eu/Eu*(PAAS)> 1) which also characterised Bynoe Riversediments (Fig. 5b). The downstream sediments from allother catchments displayed negative Eu(PAAS) anomalies.
The factorial ANOVA of the ICPMS/HClO4 datashowed significant ( p < 0:001) differences for thedependent variables La/Gd(PAAS), La/Yb(PAAS) and Eu/Eu*(PAAS) for area, grainsize and the interaction ofarea and grainsize. The enhanced discriminating powerof the <63 lm fraction is probably due to a more limitedmineralogical variation than in other size fractions. Thepost hoc analysis (Table 5) of data for this fractionshowed that all five areas could be distinguished athighly significant levels based on one or more of theREE(PAAS) ratios. While the four river catchments canbe distinguished the analysis also showed a significantdifference between the Norman River and the NormanOffshore area for La/Yb(PAAS) and Eu/Eu*(PAAS) (butnot for La/Gd(PAAS)). Coventry et al. (1980) argued thatlong-shore sediment transport in the eastern Gulf ofCarpentaria dominantly occurs in a southerly direction.Consequently, there may be additional supply of sedi-ments to the Norman Offshore area from more north-erly rivers, e.g. the Gilbert River (Fig. 1). The GilbertRiver catchment contains extensive felsic rock units(Geoscience Australia, 2001b) consistent with the highLa/Yb(PAAS) and low Eu/Eu*(PAAS) ratios found in thesediments from the Norman Offshore area. Althoughthis area is approximately equidistant from the mouthsof the Norman and Bynoe River mouths (Fig. 1), therewas no REE evidence of contributions of sedimentfrom the latter which is in accordance with Pbisotope evidence (Munksgaard & Parry, 2000; Williams,1998).
6. Conclusions
Comparison of INAA and ICPMS data for zircon-bearing estuarine and coastal sediments demonstratedthat HF-based digestion methods provided unsatisfac-tory recovery of REE. Instead a relatively simple, fastand safe partial digestion method using HClO4+HNO3
was used to extract REE mainly from clay minerals.Comparison with data from primary geological unitswithin river catchments showed that their general REEcharacteristics have been preserved in downstream clay-rich sediments and that these could be used as prove-nance indicators.
Acknowledgements
Francoise Foti, Ron Gilmore and the crew of thePilot Boat �Q.G. Bynoe� are thanked for enthusiasticassistance. Pasminco Century Mine Ltd is thanked forfunding the field work, the Australian Research Councilfor funding the ICPMS and the Australian Institute ofNuclear Science and Engineering for providing a grantfor the INAA analyses (DLP).
References
Ahmad, M., Wygralak, A. S., Ferenczi, P. A., & Bajwah, Z. U. (1993).
Explanatory notes and mineral deposit data sheets, Pine Creek
SD 52-8. Darwin: Department of Mines and Energy, Northern
Territory Geological Survey, Government Printer of the Northern
Territory.
Bajwah, Z. U. (1994). A contribution of geology, petrology and
geochemistry to the Cullen batholith and related hydrothermal
activity responsible for mineralization, Pine Creek Geosyncline,
Northern Territory. Darwin: Department of Mines and Energy,
Northern Territory Geological Survey, Government Printer of
the Northern Territory.
Beckman, G. G. (1983). Development of old landscapes and soils. In
Division of soils, CSIRO soils: an Australian viewpoint (pp. 51–72).
Melbourne: CSIRO.
Belousova, E. A., Griffin, W. L., O’Reilly, S. Y., & Fisher, N. I. (2002).
Igneous zircon: trace element composition as an indicator of source
rock type. Contributions to Mineralogy and Petrology 143, 602–622.
Black, L. P., Gregory, P., Withnall, I. W., & Bain, J. H. C. (1998). U-
Pb zircon age for the Etheridge Group, Georgetown region, north
Queensland: implications for relationship with the Broken Hill and
Mt. Isa sequences. Australian Journal of Earth Sciences 45, 925–
935.
Chapman, P.M., &Wang, F. (2001). Assessing sediment contamination
in estuaries. Environmental Toxicology and Chemistry 20, 3–22.
Coventry, R. J., Hopley, D., Campbell, J. B., Douglas, I., Harvey, N.,
Kershaw, A. P., Oliver, J., Phipps, C. V. G., & Pye, K. (1980). The
quaternary of northeastern Australia. In R. A. Henderson, & P. J.
Stephenson (Eds.), The geology and geophysics of northeastern
Australia (pp. 375–417). Queensland: Geological Society of
Australia Inc.
Cullers, R., Chaudhuri, S., Kilbane, N., & Koch, R. (1979). Rare-
earths in size fractions and sedimentary rocks of Pennsylvanian—
permian age from the mid-continent of the U.S.A. Geochimica et
Cosmochimica Acta 43, 1285–1301.
Date, A. R., & Hutchinson, D. (1987). Determination of rare earth
elements in geological samples by inductively coupled plasma
409N.C. Munksgaard et al. / Estuarine, Coastal and Shelf Science 57 (2003) 399–409
source mass spectrometry. Journal of Analytical Atomic Spectrom-
etry 2, 269–276.
Diegor, W., Longerich, H., Abrajano, T., & Horn, I. (2001). Appli-
cability of a high pressure digestion technique to the analysis of
sediment and soil samples by inductively coupled plasma-mass
spectrometry. Analytica Chimica Acta 431, 195–207.
Geoscience Australia ‘‘Ozestuaries’’ database (2001). Geoscience
Australia, Department of Industry, Tourism and Resources,
Canberra. Available: http://www.agso.gov.au/oracle/ozestuaries/
Geoscience Australia National geoscience datasets (2001). Geoscience
Australia, Department of Industry, Tourism and Resources,
Canberra. Available: http://www.agso.gov.au/oracle/agsocat/
Geoscience Australia Geochemical database (2002). Geoscience
Australia, Department of Industry, Tourism and Resources,
Canberra.
Henderson, R. A. (1980). Structural outline and summary geological
history for northeastern Australia. In R. A. Henderson, & P. J.
Stephenson (Eds.), The geology and geophysics of northeastern
Australia (pp. 1–26). Queensland: Geological Society of Australia
Inc.
Isbell, R. F., & Hubble, G. D. (1983). North-eastern plains (IV). In
Division of soils, CSIRO soils: an Australian viewpoint (pp. 201–
210). Melbourne: CSIRO.
Ivanova, Ju., Djingova, R., Korhammer, S., & Markert, B. (2001). On
the microwave digestion of soils and sediments for determination
of lanthanides and some toxic and essential elements by inductively
coupled plasma source mass spectrometry. Talanta 54, 567–574.
Jarvis, I. (1992). Sample preparation for ICP-MS. In K. E. Jarvis,
A. L. Gray, & R. S. Houk (Eds.), Handbook of inductively coupled
plasma mass spectrometry (pp. 172–224). London: Chapman and
Hall.
Klaver, G. Th., & van Weering, T. C. E. (1993). Rare earth element
fractionation by selective sediment dispersal in surface sediments:
the Skagerrak. Marine Geology 111, 345–359.
Kruse, P. D., Sweet, I. P., Stuart-Smith, P. G., Wygralak, A. S.,
Pieters, P. E., & Crick, I. H. (1994). Explanatory notes, Katherine
SD 53-9. Darwin: Department of Mines and Energy, Northern
Territory Geological Survey. Government Printer of the Northern
Territory.
McLennan, S. M. (1992). Rare earth elements in sedimentary rocks:
Influence of provenance and sedimentary processes. In B. R. Lipin,
& G. A. McKay (Eds.), Geochemistry and mineralogy of rare earth
elements, Reviews in Mineralogy 21. Washington, DC: Mineralog-
ical Society of America.
McLennan, S. M., & Taylor, S. R. (1980). Rare earth elements in
sedimentary rocks, granites and uranium deposits of the Pine Creek
geosyncline. In J. Ferguson, & A. B. Coleby (Eds.), Uranium in the
Pine Creek geosyncline (pp. 175–190). Vienna: IAEA.
Morey, G. B., & Setterholm, D. R. (1997). Rare earth elements in
weathering profiles and sediments of Minnesota: implications for
provenance studies. Journal of Sedimentary Research 67, 105–115.
Munksgaard, N. C., & Parry, D. L. (2000). Anomalous lead isotope
ratios and provenance of offshore sediments, Gulf of Carpentaria,
northern Australia. Australian Journal of Earth Sciences 47, 771–
777.
Munksgaard, N. C., & Parry, D. L. (2002). Metals, arsenic and lead
isotopes in near-pristine estuarine and marine coastal sediments
from northern Australia. Marine and Freshwater Research 53, 719–
729.
Norrish, K., & Pickering, J. G. (1983). Clay minerals. In Division of
soils, CSIRO soils: an Australian viewpoint (pp. 201–210).
Melbourne: CSIRO.
Orvini, E., Speziali, M., Salvini, A., & Herborg, C. (2000). Rare earth
elements determination in environmental matrices by INAA.
Microchemical Journal 67, 97–104.
Pollard, J. P., Geordie, M., & Mitchell, L. C. (1998). Geochemistry of
post-1540ma granites in the Cluncurry District, Northwest
Queensland. Economic Geology 93, 1330–1344.
Sen Gupta, J. G., & Bertrand, N. B. (1995). Direct ICP-MS
determination of trace and ultratrace elements in geological
materials after decomposition in a microwave oven. Talanta 42,
1595–1607.
Sholkovitz, E. R. (1990). Rare-earth elements in marine sediments and
geochemical standards. Chemical Geology 88, 333–347.
Stephenson, P. J., Griffin, T. J., & Sutherland, F. L. (1980). Cainozoic
volcanism in northeastern Australia. In R. A. Henderson, & P. J.
Stephenson (Eds.), The geology and geophysics of northeastern
Australia (pp. 349–374). Queensland: Geological Society of
Australia Inc.
Taylor, S. R., & McLennan, S. M. (1988). The significance of the rare
earths in geochemistry and cosomochemistry. In K. A. Jr.
Gschneidner, & L. Eyring (Eds.), Handbook on the physics and
chemistry of rare earths Vol. 11 (pp. 485–578). Amsterdam:
Elsevier.
Ure, A. M. (1995). Methods for analysis for heavy metals in soils. In B.
J. Alloway (Ed.), Heavy metals in soils (pp. 11–37). Glasgow:
Blackie Academic and Professional.
USEPA (1996). Method 3052, microwave assisted acid digestion of
siliceous and organically based matrices. Revision 0 (pp. 20).
Washington, DC: United States Environmental Protection Agency.
Vital, H., Stattegger, K., & Garbe-Schonberg, C. D. (1999).
Composition and trace-element geochemistry of detrital clay and
heavy-mineral suites of the lowermost Amazon River: a prove-
nance study. Journal of Sedimentary Research Section 69, 563–575.
Walker, P. H., & Butler, B. E. (1983). Fluvial processes. In Division of
soils, CSIRO soils: an Australian viewpoint (pp. 83–90). Melbourne:
CSIRO.
Williams, P. J. (1998). Magmatic iron enrichment in high-iron
metatholeiites associated with �Broken Hill-type� Pb–Zn–Ag
deposits, Mt. Isa eastern succession. Australian Journal of Earth
Sciences 45, 389–396.
Withnall, I. W., Bain, J. H. C., & Rubenach, M. J. (1980). The
precambrian geology ofNortheastQueensland. InR.A.Henderson,
& P. J. Stephenson (Eds.), The geology and geophysics of north-
eastern Australia (pp. 109–128). Queensland: Geological Society of
Australia Inc.
Related Documents