1 Rare earth elements and uranium geochemistry in the Al-Kora phosphorite province, Late Cretaceous, northwestern Jordan Abdulkader M. Abed*, Oday Jaber, Mustafa Al Kuisi and Rushdi Sadaqah Department of Geology, The University of Jordan, Amman 11942, Jordan *Corresponding author: [email protected] Abstract Sixty three samples representing the phosphorite deposits of the Al-Kora province in northwest Jordan are analyzed for their major and certain trace elements including the rare earths and uranium. They are collected from four sections: Tubna, Dair Abu Sa'id, Wadi Al-Arab and Wadi Ziglab. The samples studied are mainly phosphorite packstone/grainstone consisting of phosphate intraclasts and vertebrate skeletal fragments (bone and teeth) of varying sizes, associated with minor carbonate wackestones. Laminated, in situ phosphorites, sometimes called pristine phosphorites, are also present. The Al-Kora phosphorites are authigenic; i.e. precipitated from the interstitial solutions enriched with the phosphate ion. Carbonate fluorapatite (CFA) or francolite is the dominant mineral. Geochemical data suggest that the analyzed elements can be grouped into: a) land-derived detrital clay group (Al2O3, Fe2O3, TiO2, K2O, Cr, Ga, Hf, Nb, Rb, Th, and Zr). This group constitutes less than 5% of the total elemental concentrations in the analyzed samples, b) marine or seawater-derived phosphate-carbonate group (P2O5, CaO, MgO, Na2O, Ba, Sr, U, Y, and the 14 REE), making the bulk of the samples studied, c) organic matter/detrital clay group (Cr, Ni, Mo, Cu, Pb, As, Zn, and Sb). Uranium substitutes for Ca in the CFA structure with a range from 1 to 186 ppm for all samples including carbonates, with an average of 58.4 ppm. Average for the phosphate-only samples is 101 ppm. The shale normalized REE patterns exhibit a distinct seawater-derived mineral patterns. The patterns are characterized by an enhanced negative Ce anomaly and an enriched heavy REE. This signal (pattern) seems to have survived the phosphogenesis processes. Average Ce anomaly is – 0.76, including the carbonate samples. It indicates the fractionation of Ce 3+ into Ce 4+ and the deposition of the latter in oxic, or possibly oxygen minimum, seawater. It, thus, confirms the oxic water conditions of the Neo-Tethys Ocean at the time of deposition. Keywords: Phosphorite, Rare earth elements, Ce anomaly, Uranium, Al-Kora, NW Jordan.

Welcome message from author
This document is posted to help you gain knowledge. Please leave a comment to let me know what you think about it! Share it to your friends and learn new things together.
Transcript
1
Rare earth elements and uranium geochemistry in the Al-Kora phosphorite
province, Late Cretaceous, northwestern Jordan
Abdulkader M. Abed*, Oday Jaber, Mustafa Al Kuisi and Rushdi Sadaqah
Department of Geology, The University of Jordan, Amman 11942, Jordan
*Corresponding author: [email protected]
Abstract
Sixty three samples representing the phosphorite deposits of the Al-Kora province in
northwest Jordan are analyzed for their major and certain trace elements including the rare
earths and uranium. They are collected from four sections: Tubna, Dair Abu Sa'id, Wadi
Al-Arab and Wadi Ziglab.
The samples studied are mainly phosphorite packstone/grainstone consisting of phosphate
intraclasts and vertebrate skeletal fragments (bone and teeth) of varying sizes, associated
with minor carbonate wackestones. Laminated, in situ phosphorites, sometimes called
pristine phosphorites, are also present. The Al-Kora phosphorites are authigenic; i.e.
precipitated from the interstitial solutions enriched with the phosphate ion. Carbonate
fluorapatite (CFA) or francolite is the dominant mineral. Geochemical data suggest that
the analyzed elements can be grouped into: a) land-derived detrital clay group (Al2O3,
Fe2O3, TiO2, K2O, Cr, Ga, Hf, Nb, Rb, Th, and Zr). This group constitutes less than
5% of the total elemental concentrations in the analyzed samples, b) marine or
seawater-derived phosphate-carbonate group (P2O5, CaO, MgO, Na2O, Ba, Sr, U, Y, and
the 14 REE), making the bulk of the samples studied, c) organic matter/detrital clay group
(Cr, Ni, Mo, Cu, Pb, As, Zn, and Sb). Uranium substitutes for Ca in the CFA structure
with a range from 1 to 186 ppm for all samples including carbonates, with an average of
58.4 ppm. Average for the phosphate-only samples is 101 ppm.
The shale normalized REE patterns exhibit a distinct seawater-derived mineral patterns.
The patterns are characterized by an enhanced negative Ce anomaly and an enriched
heavy REE. This signal (pattern) seems to have survived the phosphogenesis processes.
Average Ce anomaly is – 0.76, including the carbonate samples. It indicates the
fractionation of Ce3+ into Ce4+ and the deposition of the latter in oxic, or possibly oxygen
minimum, seawater. It, thus, confirms the oxic water conditions of the Neo-Tethys Ocean
at the time of deposition.
Keywords: Phosphorite, Rare earth elements, Ce anomaly, Uranium, Al-Kora, NW
Jordan.
2
INTRODUCTION
Phosphorites are wide-spread in Jordan, as part of the Middle East – North Africa –
northern South America and the Caribbean phosphogenic province. Phosphorite
deposition was associated with the formation and evolution of the Neo-Tethys Ocean,
thus also known as the Tethyan phosphorite province. The Tethyan province
accommodates more than half the phosphorite deposits of the world (Notholt et al. 1989;
Jasinski, 2011). Phosphorite deposition throughout this province occurred during the Late
Cretaceous-Eocene (Lucas and Prévôt-Lucas, 1995; Follmi, 1996; Van Kauwenbergh, 2010; Abed, 2013). This is the period when the Neo-Tethys Ocean was an east-west seaway with an active trans-global current circulation (TCC) acting as upwelling currents, necessary for the formation of phosphorites (Follmi, 1996; Abed, 2013). This highly productive phosphogenic regime came to a halt when the Neo-Tethys Ocean started its final stages of closure because of the continuous northwards movement of the Afro-Arabian Plate, its initial subduction beneath the Eurasian Plate, and the final collision with it at around the end of the Eocene (Sharland, et al., 2001; Stampfli and Borrel, 2002; Powell and
Moh'd, 2011, 2012). In the eastern Mediterranean alone, around 20 billion tons of high grade phosphorites are concentrated in a relatively small area in western Iraq, NW Saudi Arabia, SE Syria, Jordan and Palestine (Abed, 2013). The majority
of these reserves are present in Al-Jalamid in northwestern Saudi Arabi and in the Ga'ara
basin in western Iraq (Riddler et al., 1989; Jacobs International, 1992; Al-Bassam, 2007).
Phosphorites in Jordan were discovered early in the twentieth century, and the Jordan
Phosphate Mines Company (JMPC) started mining at Ruseifa since 1953. In the 1960s
and 1970s, mining started in Al-Hisa and Al-Abyad mines in central Jordan and their
deposits are nearly exhausted. In 1988, the Eshidiyya mine was opened after the closure
of the Ruseifa mines in the same year (Fig. 1). The future of the phosphorite mining
industry in Jordan is concentrated in the Eshidiyya where 1 billion tons of proved reserves
are present (JMPC, 2013).
On the other hand, Al-Kora phosphorite deposits in northwestern Jordan were discovered
in the early 1980s (Mikbel and Abed, 1985), where more than 350 million tons of high
grade phosphorites were reported (Fig. 1). Abed and Al-Agha (1989) and Sadaqah (2000)
had shown that the phosphorite deposits are present in a wider area than previously
mapped by Mikbel and Abed (1985). At the moment, the Jordan Phosphate Mines
Company (JMPC) is not considering the mining of Al-Kora deposits because the area is
highly populated compared with the desert area of Eshidiyya mines and because of
transport costs to the Gulf of Aqaba (Fig. 1). However, the Al-Kora deposits remain as
future reserves that can be exploited when other resources are depleted. The aim of this work is to a) investigate the rare earth elements (REE) geochemistry of
the Al-Kora phosphorite deposits, and b) study the distribution of uranium in these
phosphorites as a response to Jordan's efforts to use nuclear energy as a partial substitute
for fossil fuel.
GEOLOGICAL SETTING
The investigated phosphorites are present in the Al-Kora province, west of Irbid, in the
extreme northwestern part of Jordan (Fig. 1). These deposits are far to the north from the
conventional phosphorite deposits in central and southern Jordan. They belong to the
same formation, Al-Hisa Phosphorite Formation (AHP), or simply Al-Hisa Formation

3
(Powell, 1989). The age of the AHP is, upper Campanian-lower Maastrichtian (early
Maastrichtian: Burdon, 1959;, Hamam, 1977; Abed and Ashour, 1987; and Capetta et al.,
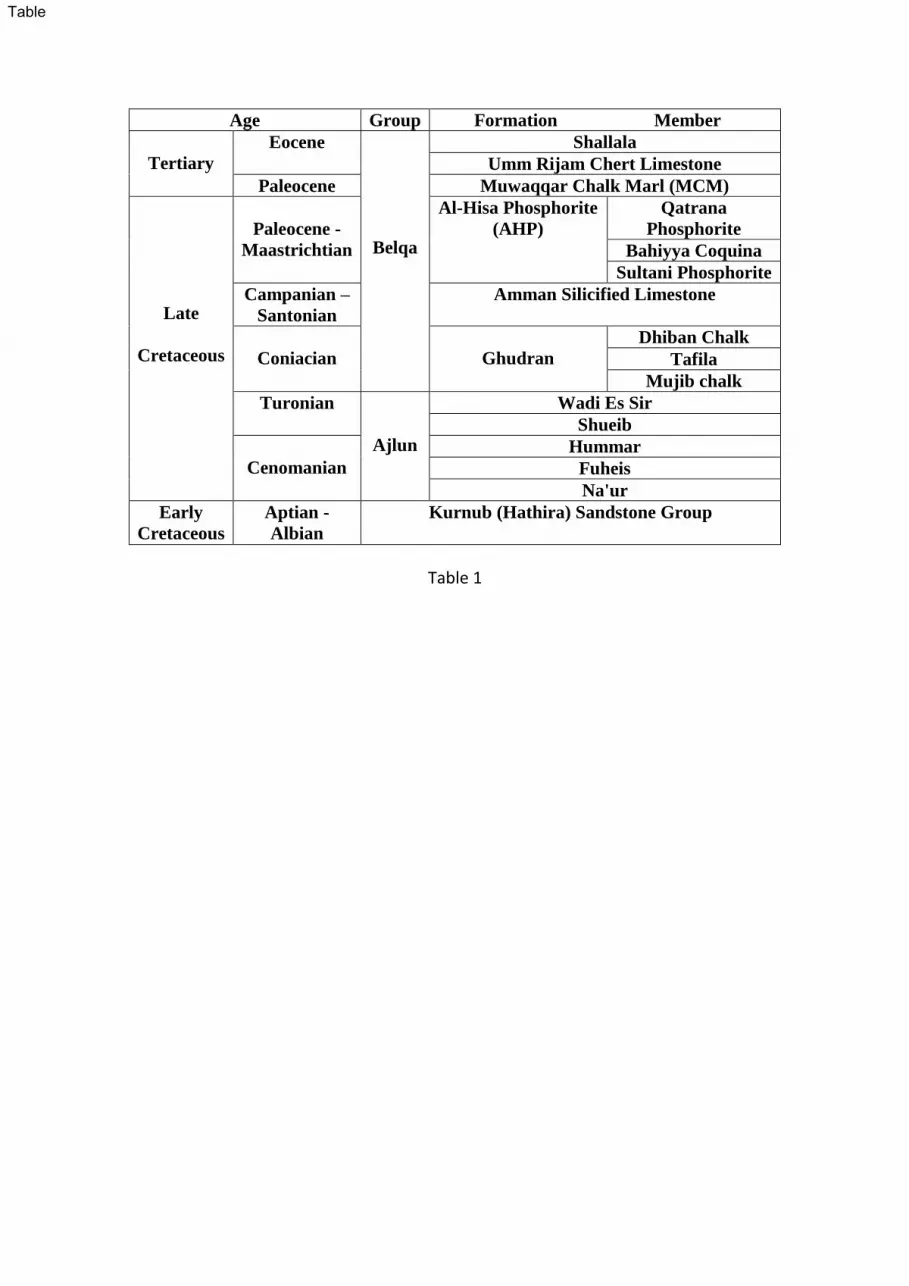
1996; late Campanian: Bender, 1974; Pufahl et al., 2003; Powell and Moh'd, 2011). Table
1 shows the stratigraphic nomenclature of the Belqa Group which includes the AHP. The
AHP is divided, in central and southern Jordan, into three formal members, namely: the
Sultani Member at the base, the Bahiyya Coquina as the middle member, and the Qatrana
Member at the top. The major phosphorite deposits in Jordan are concentrated especially
in the upper part of the AHP or the Qatrana Member (Bender, 1974; El-Hiari, 1985;
Powell, 1989; Abed and Sadaqah, 1998).
Al-Kora province is folded with varying degrees of intensity, which explains the presence
of the outcrops of the AHP within anticline structures such as the Tubna and Dair Abu
Sa'id areas. Other outcrops of the AHP are present in deeply cut wadis under the much
thicker Muwaqqar Formation overlying the phosphorites such as the deposits of Wadi Al-
Arab to the NW of Kufr Asad and in Wadi Ziglab WNW of Dair Abu Sa'id (Fig. 1).
Four sections are measured in this work. They are the Tubna section from a road cut
below this village, Dair Abu Sa'id section along the main road leading to Irbid, Wadi Al-
Arab section to the northwest of Kufr Asad town, and the Wadi Ziglab section from a
deep wadi cut leading to the Ziglab Dam. Fig. 1 shows the localities of the four sections
while Fig. 2 shows the lithology of them. The thickness of the AHP in the Al-Kora
province is less than 10 m. This is a highly reduced thickness compared with the
formation thickness in Ruseifa and central Jordan (All-Hisa and Al-Abyad) where it
reaches 65 m. One of the reasons for the reduced thickness is the absence of the middle
member of the AHP, the Bahiyya Coquina, which could be more than 30 m thick in
central Jordan (Abed and Sadaqah, 1998). The Bahiyya Coquina consists of oyster
buildups or bioherms that can be seen from Ruseifa in the north to the Eshidiyya in the
extreme south, thus indicating a drastic difference in the depositional environment of the
AHP in Al-Kora compared with these localities (Bender, 1974; El-Hiari, 1985; Abed and
Sadaqah, 1998; Powell and Moh'd, 2012).
The highest grade phosphorite deposits in the Al-Kora province are the uppermost three
metres or so, that consist of continuous, friable high grade deposits. Towards the lower
parts of the section some bedded chert horizons do interfere with the phosphorites.
METHODOLOGY
Sixty three (63) representative samples were collected from the four sections measured.
The samples were taken from all the lithologies encountered in the field: limestone, marl,
chert, phosphatic limestone and marl, silicified phosphates and pure phosphorites. All
samples were thin sectioned and stained for petrographic investigation following standard
methodology of thin sectioning and staining. Part of each sample was pulverized by
means of A Teema mill to pass 200 mesh for mineralogical and chemical analysis.
Mineralogical analysis was made by means of an x-ray diffractometer (XRD) on the
random powder. All the samples were run using a scanning rate of 2º/min. from 2 to 65º
2θ, range 4x10³ and a chart speed 2 cm/min on a Philips Xpert MPD housed in the
Geology Department, University of Jordan.
Around 20 g of the powder of each sample were sent to ACME Laboratories, Vancouver,
Canada for chemical analysis. The sample powder was fused with lithium
metaborate/tetraborate, and then digested with nitric acid. The resultant solution was
analyzed by ICP-ES for major and trace elements while the rare earth elements were
analyzed by ICP-MS. Some samples were run in duplicates to ensure reproducibility.
4
Loss on ignition (LOI%) at 550oC is performed on duplicates of each sample. The powder
is weighed in crucibles and then transferred into a furnace for two hours at 105o C. The
crucibles are then taken to a desiccator to cool down before being weighed to determine
the humidity contents of the sample powder. At this stage, the water adsorbed on the clay
minerals and other material is removed. The cooled crucibles are then transferred into an
oven with 550oC for two hours, cooled in a desiccator and weighed for their organic
matter contents. Normally, the differences between the duplicate samples are less than
3%. The measurement is repeated if the error is more than 5% (e.g. Abella and Zimmer,
2007). Structural water of certain minerals such as the clay minerals especially kaolinite,
and othermineral like goethite and gypsum, can cause a serious error to LOI% at 550oC
depending on their abundance in the samples analyzed (e.g. Sun et al., 2009). However,
the clay mineral contents in the analyzed samples are too small to affect the use of LOI%
at 550oC as a measure to organic matter. Furthermore, no other minerals with appreciable
percentage of structural water, such as gypsum, or goethite are seen in the x-ray
diffraction charts of the random samples powder.
Few samples of the high grade phosphorites were analyzed for their F and CO32- contents.
Flourine is analyzed by spectrophotometry where the sample solution is treated with
certain reagent to develop a colour. The intensity of the colour is proportional to the
concentration of F in the sample (e.g. Yamamura et al., 1962; Bargouthi and amereih,
2012). The structural carbonate, CO32-residing in the crystal structure of francolite, is
calculated by the pair-peak method on the XRD chart (Gulbrandson, 1970). ). It is now
well known that CO32- substitutes for PO4
3- along the a-axis (e.g 410 peak at 51.6° 2θ),
but not along the vertical c-axis (004 peak at 53.1° 2θ) (McClellan and Lehr, 1969;
Gulbrandson, 1970; McClellan, 1980; McClellan and Kauvenbergh 1990). Because the
radii of the CO32- and PO4
3- ions are not the same, the d-spacing along the a-axis is
changed while the d-spacing along the c-axis keeps constant. Consequently, the angular
difference between two XRD peaks is measured on the XRD chart (Δ2θ (004) – (410))
and is used as a measure to the content of CO32- in phosphorite samples. The regression
between the CO32 contents and (Δ2θ (004) – (410)) has a standard error in the order of
0.55. Thus, there is no problem with the reproducibility and precision of the CO32-
contents because of the good control on the measurements of (Δ2θ (004) – (410)) on the
XRD charts, however, the accuracy of the pair-peak method is in the order of 10%.
Results and discussion
Petrography
Petrographic investigation shows that the samples studied consist of a relatively pure
phosphorites on one hand and a pure carbonates on the other hand, with intermediate
composition of most other samples. The carbonates consist essentially of planktonic
foraminifera embedded in a micrite matrix (Fig. 3A). The ratio of tests to micrite is
variable, but the sections seen are all wackestones, microfacies type 1 (MF1). The
abundance of both planktonic foraminifera and micrite indicate a basinal or offshore, open
marine environment (Flugel, 2004).
Phosphate is present with the carbonates to produce phosphatic wackestones (MF 2, Fig.
3B). The latter can grade up to calcareous phosphorite wackestone when the phosphate
material becomes dominant (MF 3, Fig. 3C).The particles consist of planktonic
foraminifera with similar size, and/or larger, phosphate particles (intraclasts and skeletal
fragments) plus in situ, elongated, wavy phosphate mud lamina usually embedded with
the micrite lamina (Fig. 3D). This type of laminated phosphorite is called here pristine
phosphorite; i.e. not reworked.
5
True or high grade phosphorites are represented by phosphorite packstones (MF 4, Fig.
4A) and phosphorite grainstones (MF5, Fig, 4B). In both microfacies, the phosphate
particles consist, predominantly, of phosphate intraclasts of varying sizes and vertebrate
skeletal fragments (bones and teeth) in a micrite matrix or calcite cement respectively.
Some foraminiferal tests may be present. Foraminiferal tests are rarely phosphatized. The
presence of high accumulations of phosphate particles may be interpreted as due to the
reworking of pre existing phosphatic carbonate fancies such as those describe in MF 2 in
a relatively shallower marine conditions. The absence or the low percentage of micrite in
phosphorite grainstones and packstones can be taken as due to winnowing associated with
the reworking process. These two microfacies represent the upper 2-3 m of the four
sections investigated and consist of high grade phosphorite deposits with up 35 % P2O5.
See below.
Millimeter scale lamination is not uncommon in the above mentioned microfacies. In the
typical examples, such as Fig. 4C, a phosphatic carbonate wackestone is alternating with
phosphorite packstones/grainstone. Most probably, reworking and winnowing of the
former can produce the latter due to slight changes in the environment of deposition.
Quartz, when present, is very angular and most probably of biogenic origin (Fig. 4D).
The Al-Kora province is around 400 km to the north of the shorelines of the Neo-Tethys
platform. Consequently, transportation of detrital quartz to the study area might be
difficult (Powell and Moh'd, 2011, Abed, 2013). The few samples with high silica
contents in the chemical analysis are due to the presence of the biogenic quartz and the
partial or complete silicification of few samples. They are present in association with
chert beds towards the base of the measured sections.
Mineralogy
The investigated samples consist predominantly of apatite with calcite and minor quartz.
Because of the abundance of the carbonate and fluorine in the apatite structure, the apatite
species present in the studied samples is carbonate fluorapatite (CFA) also called
francolite (Bentor, 1980; McClellan and Kauvenbergh1990).
Geochemistry
Thirty two (32) elements were analyzed in 63 samples from the Al-Kora phosphorite
province in northwestern Jordan (Table 2) excluding the REE and Y which are shown in
Table 3. Statistical analysis using the correlation coefficient and R-mode factor analysis
indicates that the analyzed elements are distributed within the following mineralogical
phases.
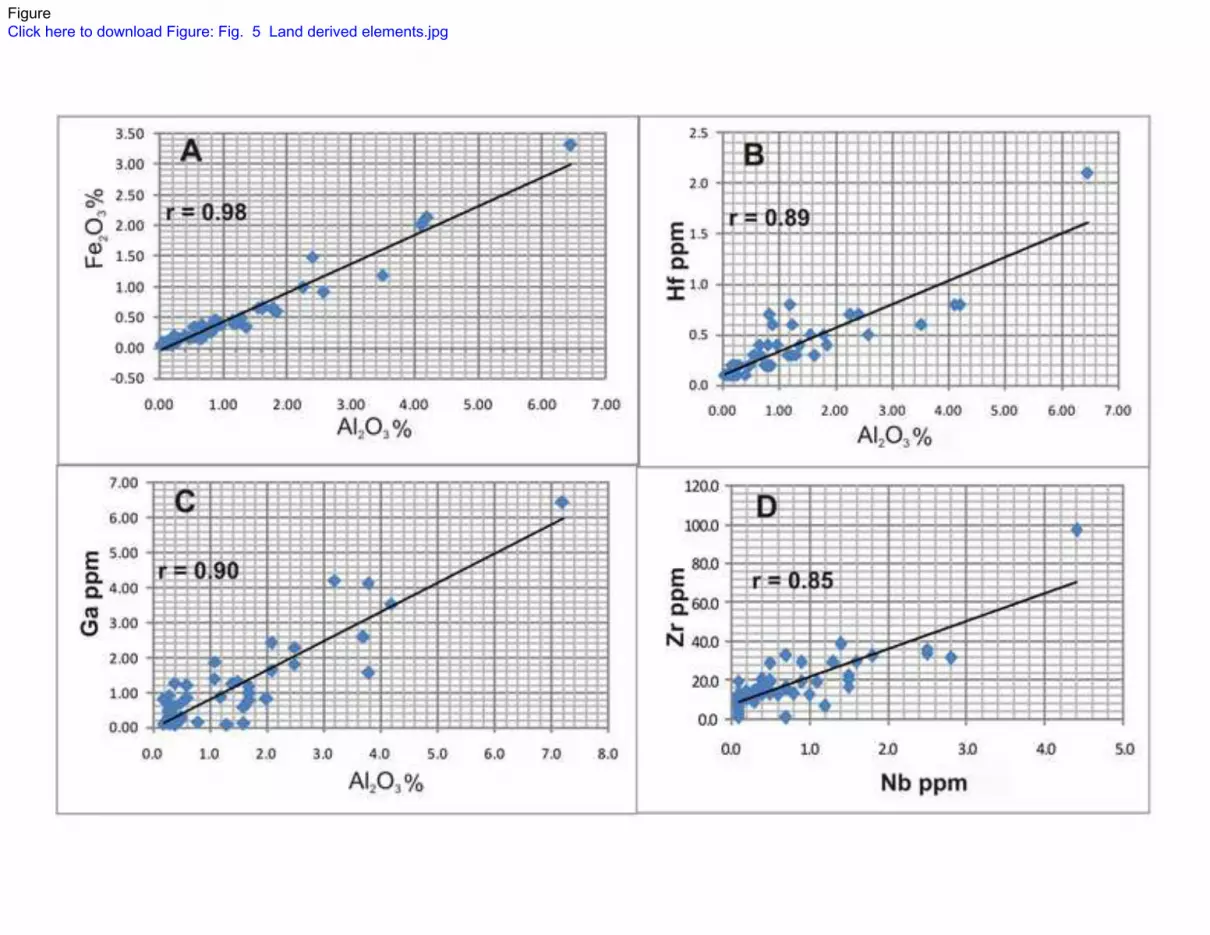
1. Elements associated with land-derived detrital clay material This phase includes the following elements: Al2O3, Fe2O3, TiO2, K2O, Cr, Ga, Hf,
Nb, Rb, Th, and Zr. Aluminum is the lead element in this group which is usually
taken as indicative of the clay fraction within the sedimentary rocks (Krauskopf and Bird, 1995; Brownlow, 1996). Table 2 shows that Al2O3 has an average of
0.91 % with a minimum of 0.4 and a maximum of 6.45%. If all the Al2O3 is within
the detrital clay minerals, and regardless of the type of the clay mineral present,
the clay fraction in the samples analyzed will be less than 5% in average (Weaver
and Polland, 1975). In other words, the land- derived elements forms around 5%
of the samples studied. The three major elements Al2O3, Fe2O3 and K2O are

6
present within the crystal structure of the clay minerals depending on the type of
the clay minerals (e.g. Weaver and Polland, 1975). The TiO2, Th and Zr form their
own detrital minerals such as tourmaline, thorite and zircon respectively. They are
transported and deposited with the clay fraction as fine discrete minerals. Niobium
(Nb) substitutes for Ti despite the fact that it can, rarely, form its own mineral.
Gallium substitutes for Al, Hf substitutes for Zr, and Rb substitutes for K (e.g.
Krauskopf and Bird, 1995; Brownlow, 1996; White, 1997). All the above
mentioned elements have a highly significant correlation coefficient with Al2O3
and between each others. Fig. 5 shows diagrammatically few representative plots
between Al2O3 and each of Fe2O3, Ga and Hf with correlation coefficients more
than 0.89, while Fig. 5 d is a plot between Zr and Nb with r = 0.85.
Average SiO2 content is 16.50% in all 63 samples and does not correlate
positively with Al2O3 or any one of elements in the detrital phase discussed above;
meaning that the major content of the silica is not associated or accommodated in
the detrital clay phase. This average is too large to be accommodated in the less
than 5% detritals. Thin section investigation revealed two types of silica in the
studied samples. First, it occurs as a discrete, very angular quartz grains and in a
rare case chert rock fragments. Both the quartz grains and the chert rock fragment
are, most probably, of biogenic origin. The biogenic origin of quartz is indicated
by the fact that the quartz grains have a very angular shape throughout the samples
investigated. Such highly angular quartz grains cannot be of siliclast origin,
transported 400 km from the continent where the shorelines of the Late Cretaceous
Tethys Ocean to the south and southeast, were located (Powell and Moh'd, 2011;
Abed, 2013). The rare chert rock fragments are most probably derived from the
chert interbedded with the phosphorites in the AHP Formation. The biogenic
origin of the bedded chert in the Amman and Al-Hisa Phosphorite Formations of
Jordan was discussed at length by Abed and Kraishan (1991). The second source
of silica is the partial or total silicification of some samples. For example, samples
Tbn3 and Tbn 5 are completely silicified and have 95.41 and 97.92 SiO2%
respectively. .
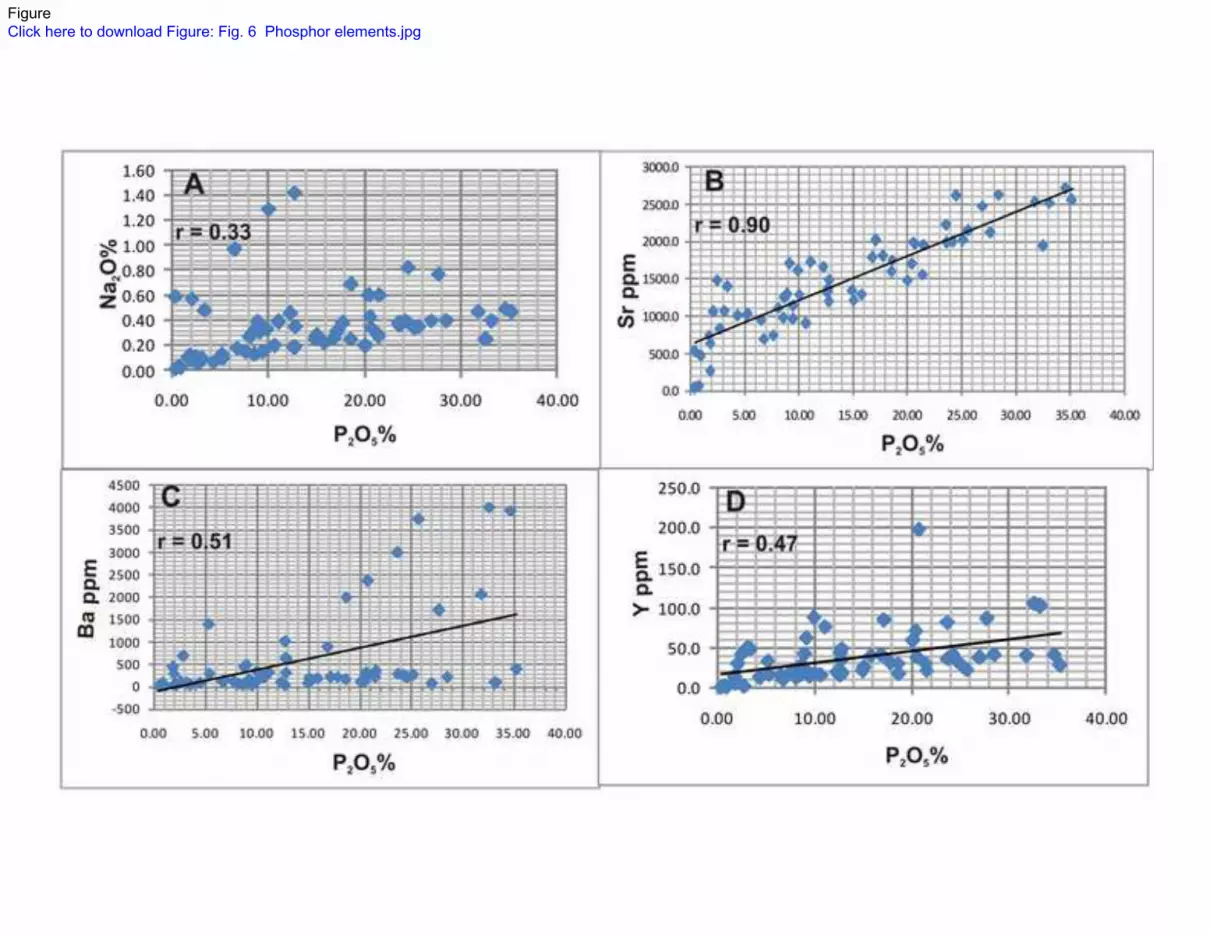
2. Elements associated with the seawater-derived phosphorite-carbonate
material This phase includes P2O5, CaO, MgO, Na2O, Ba, Sr, U, Y, and the 14 rare earth
elements (REE). Fig. 6 shows some representative binary plots from this group.
P2O5 and CaO are the two major elements making the framework of the CFA
mineral. However, the low correlation coefficient (r=0.38) between the two
elements, despite being positively significant, is explained by the presence of
substantial amount of calcium also in the carbonates as calcite and dolomite. MgO
is present in a very few samples as late diagenetic dolomite rhombs. Na2O
substitutes for calcium in the francolite structure with a significant positive
correlation as shown in Fig. 6A (McClellan and Kauvenbergh 1990).
Strontium follows Ca in its minerals. Because the CFA crystal structure is more
open than the tight calcite structure, the high Sr values (up to 2500 ppm Sr) are
accommodated in the CFA not in the calcite as shown in Fig. 6B (r=0.90) (Prevot
and Lucas, 1980; McClellan, 1980). Barium forms its own minerals especially the
sulphate and carbonate which are not detected in the samples studied. However,
Ba, in the studied samples, is substituting for Ca (r = 0.51). Ba has a relatively
large ion, larger than Sr, and the higher contents of Ba, more than 500 ppm, are
most probably accommodated in the CFA structure as shown in Fig. 6C. Uranium,

7
Y (Fig. 6D, r=0.47) and the REE substitute for Ca in the CFA structure with a
higher positive correlation as discussed below.
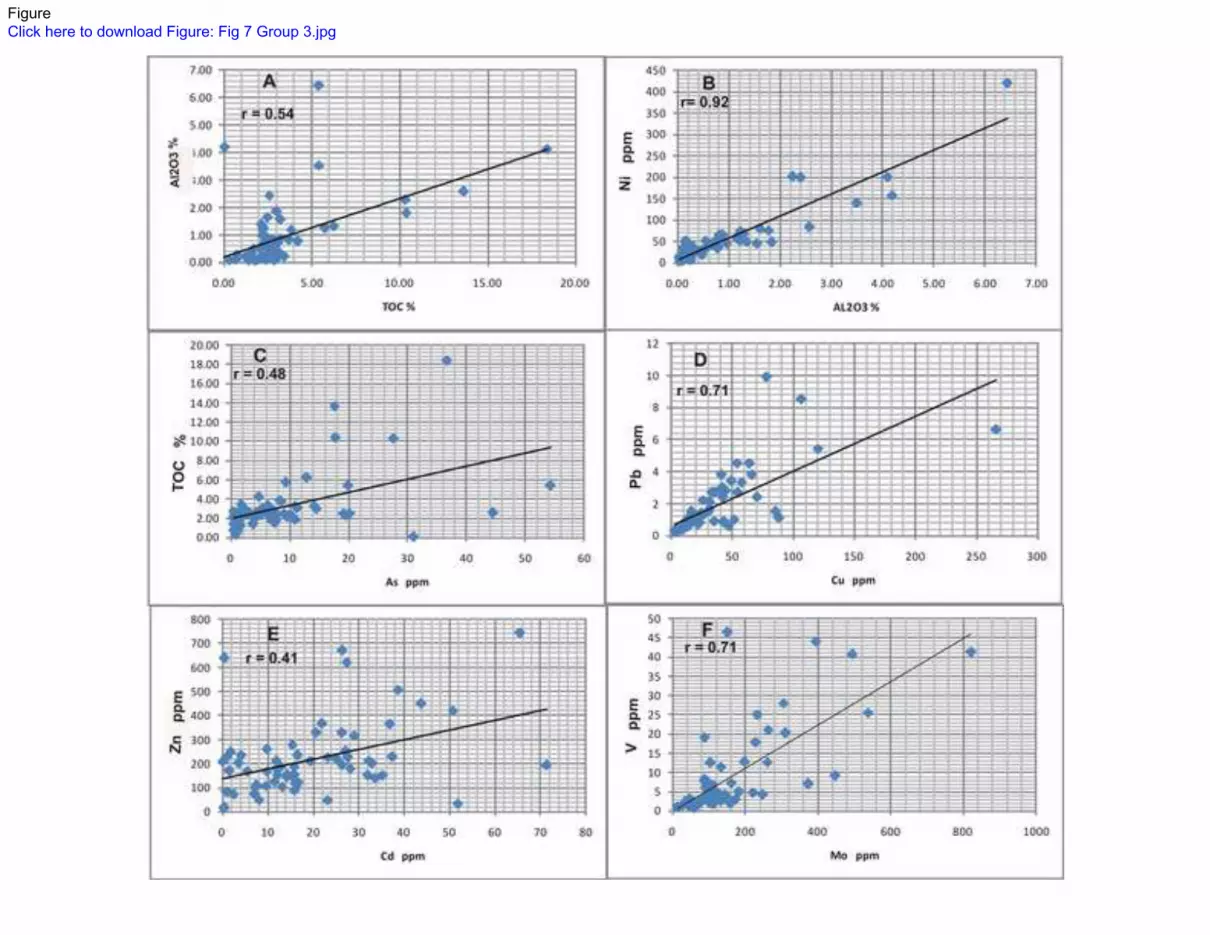
3. Elements associated with total organic matter and the detrital clays This phase includes Ni, Mo, Cu, Pb, As, Zn, and V. These elements seem to be
adsorbed onto the total organic matter (TOC) and/or the detrital clays or both (e.g.
Prevot, 1990). Statistical analysis shows that the organic matter has a significant
positive correlation with Al2O3 (r = 0.54, Fig. 7A) and the other elements in the
detrital phase. This relationship is most probably due to that both constituents, the
TOC and the clays, are admixed as a fine grained matrix in the samples analyzed,
and consequently, they behave similarly. However, the relationship between these
elements and the TOC is weaker than with the detrital clays. This is indicated by a
lower, but still significant, correlation coefficients with the TOC ranging from
0.31 to 0.48; e.g. r between TOC and each of Ni, Mo, Cu, Pb, As, Zn, and V are
0.48, 0.47, 0.31, 0.33, 0.48, 0.40, and 0.41 respectively. As an example As is
plotted in Fig. 7c. The range of r between these elements and the detrital clays
varies between 0.54 to 0.92; e.g. with Ni, Fig, 7B. In both cases all the correlation
coefficients are statistically significant. The remaining parts in Fig. 7 shows some
representative binary plots indicating the interrelationships amongst these
elements such as Pb and Cu, (r=0.71, Fig. 7D), Zn and Cd (r=0.41, Fig. 7E), and V
and Mo (r=0.0.71, Fig. 7F).
All said above, the lower correlation coefficients of these elements with the
TOC/clay fraction, mentioned above, might be due to the fact that this group of
elements can also be present in the CFA structure. Al-Kuisi et al., (2015), while
studying groundwater pollution in northwestern Jordan, showed that Mo as MO42-
substitutes for PO43- in the CFA of the phosphorite deposits of the Al-Kora
province. They connected the high Mo concentrations in groundwater with the
phosphorites deposits. Abed et al., (2014) explained the high concentration of V in
the Eshidiyya phosphorites in southern Jordan through the substitution of VO43-
for PO43- in the CFA structure (Nathan, 1984; McKelvey et al., (1986). Al-Kuisi
et al., (2015) had demonstrated the presence of a positive relationship between As
and the phosphorite deposits in groundwater throughout Jordan. Altschuler (1980)
had also demonstrated that Zn is enriched in the CFA more than twice its presence
in shale as due to substitution with Ca. Cadmium is known to substitute for Ca and
the commercial quality of the phosphorite deposits depends on the levels of Cd
(e.g. Altschuler, 1980; Prevot, 1990). The low and not significant correlation
coefficients between all these elements and P2O5 may be explained by the
abundance of TOC which has mimicked their relationship with the CFA.
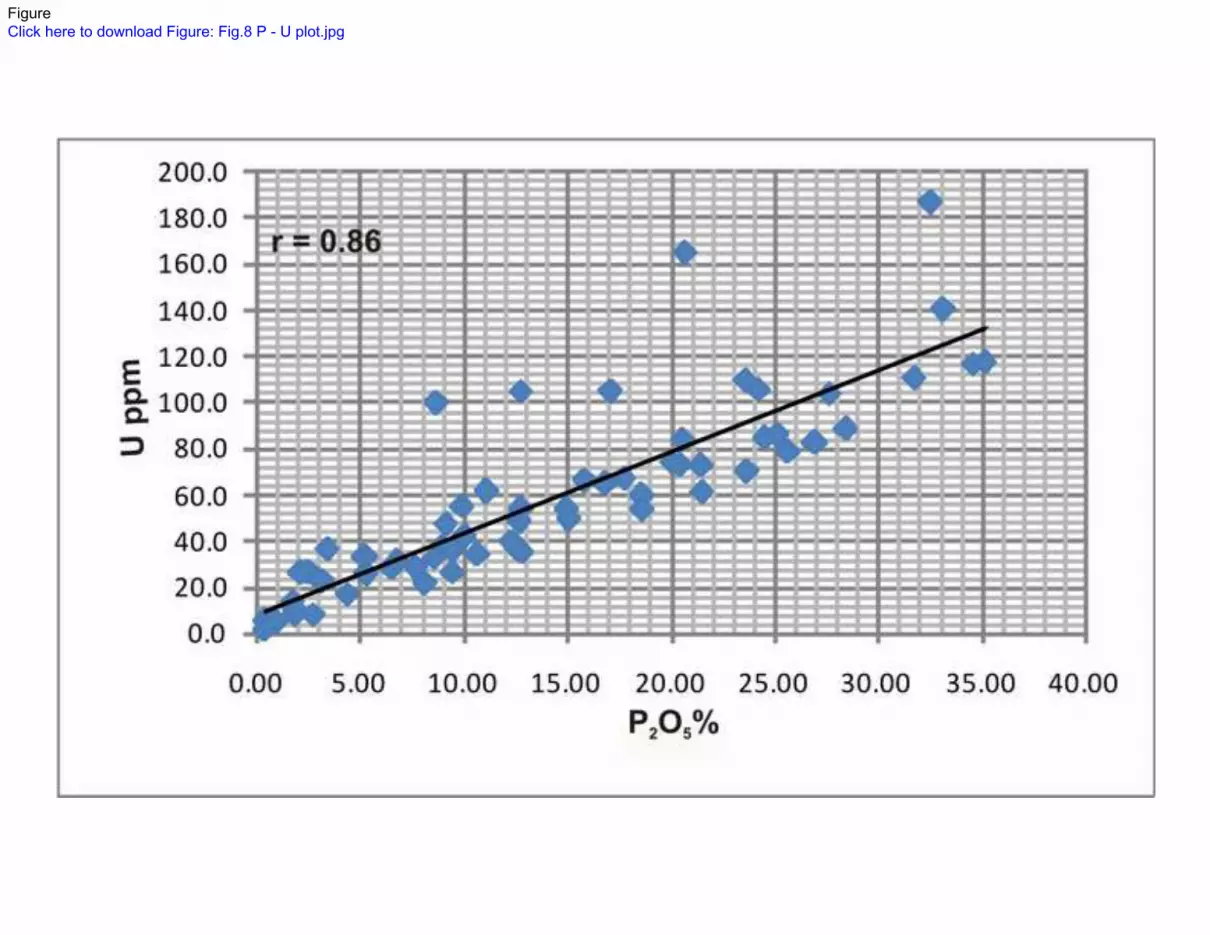
Uranium distribution and geochemistry
Uranium replaces Ca in the apatite structure in hexavalent coordination, while calcite does
not allow much U to replace Ca due to its lower coordination in the calcite crystal
structure compared to apatite (McClellan, 1980; Slansky, 1986). Correlation coefficient
(r) with P2O5 is 0.86 for the 63 samples analyzed (Fig. 8), r is still significant with CaO
but much lower, 0.34, because of its being present also in calcite. It seems that there is no
relationship with the total organic matter and uranium as indicated by a low, not
significant correlation (r=-0.04).
Sadaqah (2000) reported a relatively higher values for U in the Al-Kora phosphorites,
especially in Kufr Asad section. Some of the his results are in excess of 300 ppm U. Table
4 compares the U contents in the major phosphorite deposits in Jordan. The low average
8
of the Al-Kora province is certainly due to the inclusion of almost pure carbonates in the
samples analyzed, attested by the CaO and P2O5% in Table 2. The average of the
phosphorite samples with more 19.5 % P2O5 (equals around 50% francolite) is 101 ppm.
The latter average lies within the range of the other high grade Jordanian phosphorites
(e.g. Abed, 2011)
Rare earth elements (REE)
Total REE (∑REE), in the analyzed samples, ranges between 1.83 - 240.49 ppm with an
average of 44.57 ppm. The lower ∑REE is in carbonate samples with around 1% P2O5,
while the higher total is for the true phosphorites with more than 19.5% P2O5. The ∑REE
is too low for any economic value of the Al-Kora phosphorite deposits. However, the
analysis of the REE gives insight on the provenance and depositional environment of the
studied material.
Bedded phosphorites are well known of being of marine origin (e.g. Bentor, 1980).
Marine sediments, with regard to REE behavior, can be divided into two types. First, is
the terrestrial or land derived particulate matter carried to the sea in suspension. This type
of material carries the original signature of the REE pattern of the land source with no
appreciable fractionation within the 14 REE. Consequently, the REE pattern would be
rather similar to that of shale; i.e. flat patterns (e.g. Piper, 1974; Sholkovitz et al., 1994;
Piper and Bau. 2013). Second, is the sediment derived from the dissolved load to the sea
which suffers fractionation in oxidized seawater. For example, cerium (Ce), in particular,
is oxidized from the soluble Ce 3+ to the highly insoluble Ce 4+, which is removed from
seawater, and consequently, creates a negative Ce abundance in seawater and the
sediments derived from it such as carbonate fluorapatite (CFA), glauconite, opal and the
like. The removed Ce 4+is, most probably, adsorbed on oxyhydroxides of Mn and Fe of
the oceans, which may explain the positive Ce anomaly in, for example, Mn nodules on
the ocean floor (e.g. Wright et al., 1987). Also, the REE in the sea water derived
sediments can be further fractionated through complexation especially with CO32-, which
leads to higher concentrations of the heavy REE relative to the light REE (e.g. Elderfield
et al., 1981; Lee and Byrne, 1993; Sholkovitz et al., 1994; Luo and Byrne., 2004).
The REE patterns for the four sections of the studied samples, normalized to the North
American Shale Composite (NASC), are shown in Fig. 9. Normalization is made by
dividing each REE element in the studied sample by the respective element in NASC and
recording the ratio. All the plots show a negative Ce anomaly and an enrichment of the
heavy REE relative to the light elements; typical of the worldwide CFA pattern (e.g.
Wildman and Haskin, 1965; McArthur and Walsh, 1984; Wright et al., 1987; Piper and
Bau, 2013). Amongst the other seawater derived sediments such glauconite, biogenic
carbonates, opal, and phillipsite, the CFA pattern is the closest to the REE pattern of
seawater. This might indicate little or no changes to the CFA composition after formation
(Dumoulin et al., 2011).
The CFA does not precipitate directly from seawater. There is a general agreement that
phosphorites form under upwelling regimes (e.g. Glenn et al., 1994; Follmi, 1996;
Hathorne et al., 2012; Abed, 2013; Alsenz et al., 2013; Follmi et al., 2015). Upwelling
currents spread deep, cold marine water on the sea surface of the relatively shallow
continental platforms. Deep, cold water is usually rich in nutriants such Si and P which
are the basic food for the phytoplanktons; the lowest step in marine food chains which
inhabit the photic zone or the upper 100-200 m of the sea water column. Thus, it increases
the bioproductivity of the photoic zone which leads to higher content of organic-rich
sediments in the upwelling area. Bacterial metabolism of organic matter liberates

9
phosphate to pore water of the sediments in the upper millimeters or centimeters at the sea
floor (e.g. Goldhammer et al., 2010; Baily et al. 2013; Hiatt eta al., 2015). It seems that
the majority of the P in modern phosphorites is derived from organic matter (Froelich et
al. 1982).This enhances the concentration of phosphates in the pore water and the
precipitation of francolite. Pore water concentrations in modern Peru margin
phosphogenic sediments ranges from 7 μmol/g up to extremes of 3700μmol/g, which is
due to bacterial breakdown of organic matter (Filippelli, 1997). Amorphous calcium
phosphate precipitates first which crystallizes into francolite while the sediments are
millimeters to centimeters below the seafloor. While still in contact with seawater,
francolite uptakes many major and trace elements such as, Mg, Na, F, Sr, REE (e.g.
Arning et al., 2009). Francolite precipitates either authigenically from the pore water solution after being
enriched in PO4 after shallow burial or diagenetically through the replacement of pre
existing sediments by similarly enriched interstitial solutions (e.g. Glenn et al, 1994). The
Al-Kora phosphorites are dominantly authigenic with very few foraminiferal tests seen
phosphatized in only 5 thin sections. In these thin sections, phosphatized shells are present
beside non phosphatized ones. (Fig. 10).
In most of the high grade phosphorites, reworking and winnowing follow the precipitation
of the CFA (e.g. Glenn et al., 1994; Riggs et al., 2000). Despite all these processes
involved in the making of ancient phosphorites, the seawater signal in the REE pattern is
kept very close to that of seawater, which is the case of the Al=Kora deposits.
All that said, there are some sporadic examples where the above described CFA pattern is
different; e.g. the organic rich, phosphatic shales of the Upper Carboniferous of
midcontinent North America (Cruse et al. 2000). Here, the middle REE elements are
enriched with no negative Ce anomaly except in the phosphate nodules where the REE
patterns are similar to CFA described above. In our opinion, the CFA pattern, most
probably, is obliterated by the abundant siliclastics in the shale samples while it is kept
clear in the phosphate nodules where the siliclastics are minor or absent.
Ce Anomaly
The Ce anomaly is a prominent feature in the REE patterns. It is calculated in this section
by the following equation (McArthur and Walsh, 1984).
Ce anomaly = log [Cen/(Lan + Ndn)], where "n" refers to the shale normalized value. It is conducted on whole rock powder, not
on separated phosphate grains or vertebrate skeletal fragments.
The Ce anomaly in the samples investigated ranges between -0.53 and -0.95 with an
average of -0.76. Samples with high P2O5%, seem to have rather highly negative Ce
anomalies. For example, samples Dair8, Dair13a and Tbn11 have -0.89, -0.95, and -0.86
anomalies, with P2O5% 35.24, 26.99, and 27.72 respectively. However, there is a
significant positive correlation coefficient (r) between the Ce anomaly and P2O5%
equaling 0.57 (Fig. 11A). Also, there is a positive relationship between the less negative
Ce anomalies samples with the higher Al2O3%. For example, the three samples with the
least negative Ce anomalies, Dair13b, 13c and Asad1a, -0.53, -0.54 and -0.57 have 1.04,
6.61 and 2.14 Al2O3% respectively. See also Fig. 11 B
There are ample works on the geochemistry of REE and the Ce anomaly of the present-
day ocean water. Examples include the Pacific Ocean (e.g. De Bar et al., 1985; Ruhlin and
Owen, 1986; Moller et al., 1992; Alibo and Nozaki, 1999; Piper and Bau, 2013), the
Atlantic Ocean (e.g. De Bar et al., 1985; Hogdahl et al., 1968; Piper, 1974; Hathorne et
al., 2012; Piper and Bau, 2013), and the Indian Ocean (e.g. Varghese, 2004; Balaram et
10
al., 2015). All these works, and many more, clearly indicated the presence of a negative
Ce anomaly in preset-day sea water, that the Ce anomaly increases with depth, and
increases with remoteness from the continental margins. Because the CFA forms on the
sea floor in the upper few millimeters to centimeters; i.e. in contact with the relatively
deeper seawater, that would directly explains the negative Ce anomaly in the CFA.This is
in agreement with the fact that ocean water at present is oxygenated. This led to the
general agreement that the Ce anomaly can serve as an indicator to the redox potential of
the seawater, and the negative Ce anomaly records the oxic condition of the ocean water
(e.g. De Baar et al., 1985; Wright et al., 1987; German and Elderfield, 1990; Piepgras and
Jacobsen, 1992; Sholkovitz, 1994; Piper an Bau, 2013).
Because the REE pattern and Ce anomaly in the CFA, as discussed above, are the closest
to the REE of seawater, Wright et al., (1987) advocated the extrapolation of the use of the
Ce anomaly in the CFA as a proxy to the redox potential in ancient seawater.
Consequently, the negativity of the Ce anomaly of the CFA in ancient phosphorites, has
been successfully extrapolated backwards, with some setbacks, to indicate the redox
potential of the paleooceanic water masses and their relationship with the atmosphere O2
abundance. Examples on the successful use of the CFA in this respect include the Late
Cretaceous phosphorites of the Paris Basin and the Permian Phosphoria deposits (e.g.
Jarvis, 1984; Piper, 2001).
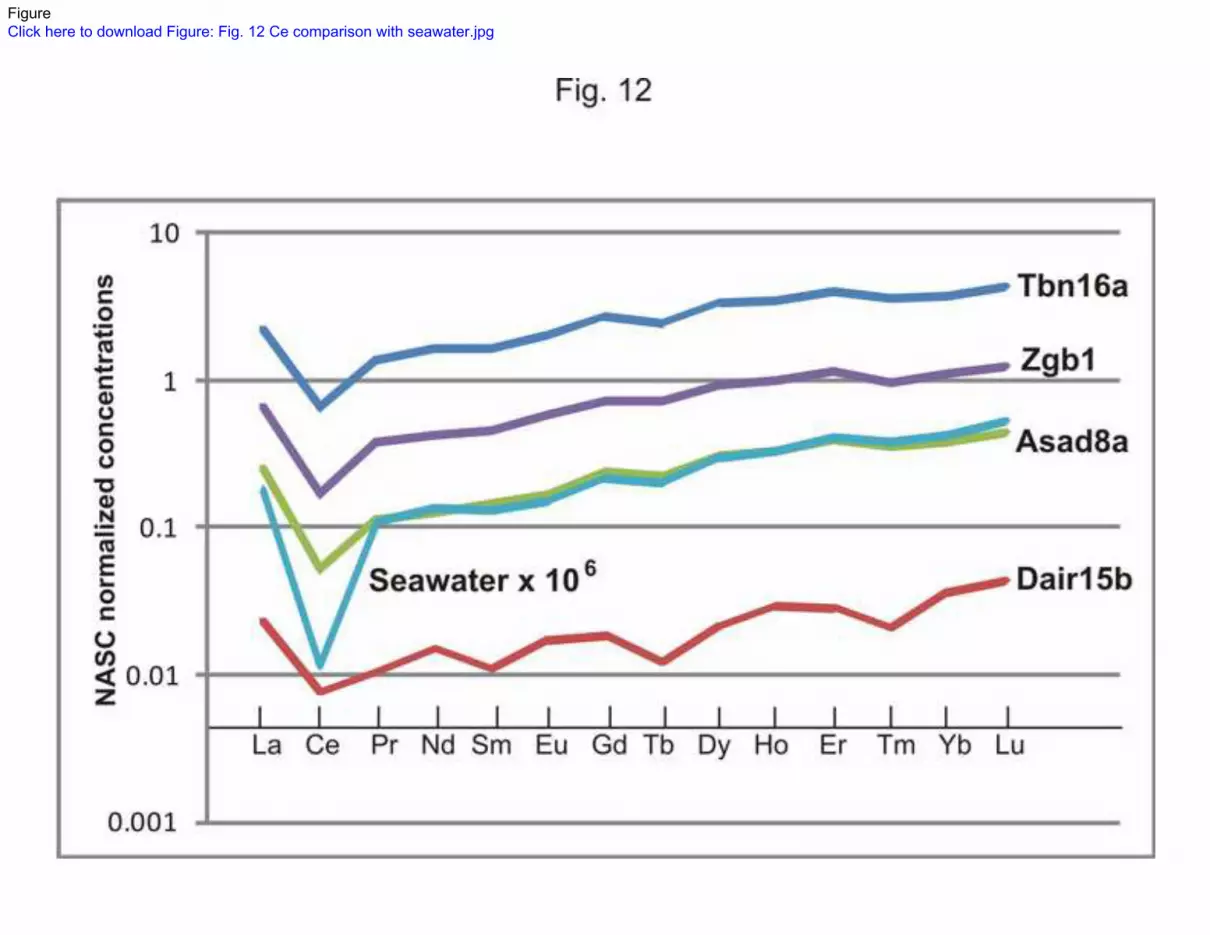
The negative Ce anomalies of the Al-Kora phosphorites samples are compared to that of
present–day ocean water (Table 3).The seawater sample was obtained from 2000 m water
depth in the Atlantic sector of the Southern Ocean (Hathorne et al., 2012). Four samples
are selected from the four studied localities and plotted and compared with seawater
sample in Fig. 12. Fig. 12 and Table 3 show that the Al-Kora phosphorites samples
compare well with the seawater REE pattern and Ce anomaly. This would indicate that
the deposition of Al-Kora phosphorites was from oxic seawater, or possibly from the
oxygen minimum zone (OMZ), during the late Campanian-early Maastrichtian. Indeed,
the ocean water masses were oxygenated during this period of the latest Late Cretaceous
(e.g. Wang et al., 2011; Voigt et al., 2013). Also, the eastern Mediterranean phosphorites,
including the Al-Kora deposits, as well as those of North Africa and parts of southern
Europe, were deposited from the intense, westerly flowing, Tethyan Circumglobal
Current (TCC). The TCC served as an upwelling current for those areas, spreading P and
Si nutrients onto the surface platforms water, thus enhancing bioproductivity and
consequently the phosphorite formation (e.g. Follmi and Delamette, 1991; Stampli and
Borrel, 2002; Abed 2013).
CONCLUSIONS
1. Al-Kora phosphorites are dominantly granular (pelletal) phosphorites
packstones/grainstones with minor laminated, in situ, pristine phosphorites.
Because of the extreme rarity of phosphatized fossils, the Al-Kora deposits are
considered authigenic in nature.
2. Based on the statistical correlations and factor analysis, the analyzed elements are
distributed into: a) land-derived detrital clay group loaded with Al2O3, Fe2O3,
TiO2, K2O, Cr, Ga, Hf, Nb, Rb, Th, and Zr, making less than 5% of the of the
samples analyzed. b) marine or seawater-derived phosphate-carbonate group
loaded with P2O5, CaO, MgO, Na2O, Ba, Sr, U, Y, and the 14 rare earth elements
(REE), making the bulk of the samples, c) organic matter/detrital clays group
loaded with Cr, Ni, Mo, Cu, Pb, As, Zn, and Sb.
11
3. Uranium resides in the CFA structure substituting for Ca. It averages 58.4 ppm
with a range of 1 -186 ppm. The average for the phosphate only samples is 101
ppm, which is comparable with other phosphorite deposits in Jordan. The low
values are for the carbonate samples
4. REE average is 44.5 ppm, too low to be of economic potential. Normalized REE
patterns with NASC have a distinct negative Ce anomaly and enriched heavy REE
relative to light REE, which is typical of seawater derived minerals. This signal
seems not have been affected by the diagenetic processes associated with the
formation of the CFA.
5. The Ce anomaly averages - 0.76 for all samples analyzed, being more negative for
the phosphorite-only samples. This negative Ce anomaly confirms the oxygenated
conditions of the Neo-Tethys Ocean water conditions at the time of deposition of
Al-Kora phosphorites during the late Campanian-early Maastrichtian of the Late
Cretaceous. Consequently, the CFA can be used as an indicator for the seawater
paleoredox conditions.
Acknowledgements
We would like to thank the Deanship of Scientific Research at the University of Jordan
for financially supporting this work. The authors are grateful to the anonymous referees of
the Arabian J0urnal of Geosciences for their ideas and comments which greatly improved
the manuscript.

12
References
Abed AM (2011) Review of uranium in the Jordanian phosphorites: Distribution,
genesis and industry. Jordan Journal of Earth and Environmental Sciences, 4, 35-45
Abed AM (2013) The eastern Mediterranean phosphorite giants: an interplay between
tectonics and upwelling. GeoArabia, 18, 67-94.
Abed AM and Ashour M (1987) Petrography and age determination of the NW Jordan
phosphorites. Dirasat, 14, 247-63.
Abed AM and Al-Agha MR (1989) Petrography, geochemistry and origin of the NW
Jordan phosphorites. Journal of the Geological Society, London, 146, p. 499-506.
Abed AM and Sadaqah R (1998) Role of Upper Cretaceous oyster buildups in the
deposition and accumulation of high-grade phosphorites in central Jordan. Journal of
Sedimentary Research, 68, 1009-1020.
Abed AM Saffarini GA and Sadaqah RM (2014) Spatial distribution of uranium and
vanadium in the upper phosphorite member in Eshidiyya basin, southern Jordan.
Arabian Journal of Geosciences (Springer), 7(1), 253-271 and DOI 10.1007/s12517-
013-0837-1.
Abella SR and Zimmer BW (2007) Estimating organic carbon from loss-on-ignition in
Northern Arizona forest soils. Am. J. Soil Sci. Soc.,71, 545-550.
Al-Bassam KS (2007) Mineral resources of western Iraq. In The Geology of Iraqi
Western Desert. Iraqi Bulletin of Geology and Mining, Special Issue,3, 145-168.
Alibo DS and Nozaki Y (1999) Rare earth elements in seawater: Particle association,
shale-normalization, and Ce oxidation. Geochimica et Cosmochimica Acta, 63, 363–
372.
Al-Kuisi M and Abed AM (2015). Spatial Distribution Patterns of Molybdenum (Mo)
Concentrations in Potable Groundwater in Northern Jordan. Environmental Monitoring
and Assessment. DOI: 10. 1007s 10661-015-4264-5.
Al-Kuisi M Abed AM Mashal K and Saffarini G (2015) Hydrogeochemistry of
groundwater from karstic limestone aquifer highlighting arsenic contamination-Case
study from Jordan. Arabian Journal of Geosciences, DOI 10.1007/s12517-015-1919-z
Alsenz H Regnery J Ashckenazi-Polivoda S Meilijson A Ron-Yankovich L Abramovich
S Illner P Almogi-Labin A Feinstein S Berner Z and Püttmann W (2013) Sea surface
temperature record of a Late Cretaceous tropical Southern Tethys upwelling system.
Palaeogeography, Palaeoclimatology, Palaeoecology, 392, 350–358.
Arning ET Birgel D Brunner, B., and Peckmann, Joural (2009.Bacterial formation of
phosphatic laminites off Peru. Geobiology 7, 295–307.
Bailey JV Corsetti FA Greene SE Crosby CH Liu P and Orphan VJ (2013) Filamentous
sulfur bacteria preserved in modern and ancient phosphatic sediments: implications for
the role of oxygen and bacteria in phosphogenesis. Geobiology 11, 397–405.
Balaram V Roy P Subramanyam KSV Durai L Ram Moham M Satayanarayanan M
Sawant SS Kalyan Kamal SS and Vani K (2015) REE geochemistry from Afanasy-
Nikitin Seamount in north central Indian Ocean by high resolution inductively coupled
plasma mass spectrometry. Indian Journal of Geo-Marine Science, 44,
Barghouthi, Z. and Amereih, S. (2012) Spectrophotometric determination of fluoride in
drinking water using aluminium complexes of triphenylmethane dyes. American
Journal of Analytical Chemistry, 3, 651-655
Bender F (1974) Geology of Jordan. Borntraeger, Berlin, 196 p.
Bentor YK (1980) Phosphorites: the unsolved problems. Marine phosphorites (ed Bentor,
Y.K.), Society of Economic Paleontologists and Mineralogists, Special Publications
29, 3-18.
Brownlow AH (1996) Geochemistry, second ed. Prentice Hall, New Jersey.
13
Burdon, D.J. 1959. Handbook of the geology of Jordan. Government of Jordan, Amman.
82 p.
Capetta H Pfeil F Schmidt-Kittler N and Martini E (1996). New biostratigraphic data
on the marine Upper Cretaceous and Paleogene of Jordan. Unpublished report by the
Jordan Phosphate Mining Company, Amman.
Cruse AM Lyons TW. and kidder DL (2000) Rare-earth element behavior in phosphates
and organic-rich host shales: An example from the Upper Carboniferous of
midcontinent North America. Society of Economic Paleontologists and Mineralogists
Spec. Public. 66, 445-453.
De Baar D Bacon D Brewer MP and Bruland PG (1985) Rare earth elements in the
Pacific and Atlantic Oceans, Geochim. Cosmochim. Acta, 49, 1943-1959.
Dumoulin JA Slack JF Whalen MT and Harris AG (2011) Depositional eetting and
geochemistry of phosphorites and metalliferous black shales in the Carboniferous-
Permian Lisburne Group, Northern Alaska. US Geological Survey Professional Paper
1776.
Elderfield H Hawkesworth CJ Greaves MJ and Calvert SE (1981) Rare earth element
geochemistry of oceanic ferromanganese nodules and associated sediments. Geochim.
Cosmochim. Acta, 45, 513-528.
El-Hiyari M (1985) The geology of Jabal Al-Mutarammil, Map sheets No 3252, III.
National Mapping Project, Bulletin 1, Natural Resources Authority, Amman, Jordan.
Filippelli GM (1997) Controls on phosphorus concentration and accumulation in oceanic
sediments. Marine Geology, 139, 231–240.
Flügel E (2004) Microfacies of carbonate rocks. Springer: Berlin.
Follmi KB (1996) The phosphorus cycle, phosphogenesis and marine phosphate-rich
deposits. Earth Science Review, 40, p. 55-124.
Föllmi KB Hofmann H Chiaradia M de Kaenel E Frijia G and Parente M (2015) Miocene
phosphate-rich sediments in Salento (southern Italy). Sedimentary Geology, 327, 55–
71
Follmi KB and Delamette M (1991) Model simulation of Mid-Cretaceous ocean
circulation: technical comments. Science, 251, 94-95.
Froelich PN Bender ML Luedtke NA Heath GR and DeVries T (1982) The marine
phosphorus cycle. American Journal of Science, 282, 474–511.
German CR and Elderfield H (1990) Application of the Ce Anomaly as a
PaleoredoxIndicatior: The Ground Rules, Paleoceanography, 5, 823-833.
Glenn CR Follmi KB Riggs SR Baturin GN Grimm KA Trappe J Abed AM Galli-Oliver
C Garrison RE Ilyin AV Jehl C Rohrlich V Sadaqah R Schidlowski M Sheldon R and
Siegmund H (1994) Phosphorus and phosphorites: Sedimentology and environments of
formation. Eclogae Geologicae Helvetiae, 87, 747-788.
Goldhammer, T Brüchert V Ferdelman TG and Zabel M (2010) Microbial sequestration
of phosphorus in anoxic upwelling sediments. Nature Geoscience 3, 557–561.
Gulbrandson RA (1970) Relation of carbon dioxide content of apatite of the Phosphoria
Formation to regional facies. U.S. Geol. Surv. Prof. Paper 700B, B9-B13.
Hamam KA (1977) Forminifera from the Maastrichtian bearing strata of Al-Hisa, Jordan.
Journal of Foramiferal Research, 7, p. 34-43.
Hathorne EC Haley B. Stichel T. Grasse P. Zieringer M. and Frank M. (2012), Online
preconcentration ICP-MS analysis of rare earth elements in seawater. Geochem.
Geophys. Geosyst., 13, Q01020, doi:10.1029/2011GC003907.
Hiatt EE Pufahl PK and Edwards CT (2015) Sedimentary phosphate and associated fossil
bacteria in a Paleoproterozoic tidal flat in the 1.85 Ga Michigamme Formation,
Michigan, USA. Sedimentary Geology, 319, 24–39.
14
Hogdahl T Melson S and Bowen V (1968) Neutron activation analysis of lanthanide
elements in seawater. Adv. Chem. Ser., 73, 308--325
Jacobs International (1992) Unpublished report, Al-Jalamid Phosphate Project, v. 2,
Geology and Reserves, for the Saudi Arabian Deputy Ministry for Mineral Resources.
Jarvis I (1984) Rare Earth Element Geochemistry of Late Cretaceous Chalks and
Phosphorites from Northern France, Geological Survey of India Special Publication,
17, 179-190.
Jasinski SM (2011) Phosphate rock. In Mineral Commodity Summaries 2011, USGS,
United States Government Printing Office, Washington, D.C.
JMPC (2013) Jordan Phosphate Mines Company annual report
Lee JH and Byrne RH (1993) Complexation of Trivalent Rare Earth Elements (Ce, Eu,
Gd, Tb, Yb) by Carbonate. Geochimica et Cosmochimica Acta, 57, 295-302.
Luo YR and Byrne RH (2004) Carbonate Complexation of Yttrium and the Rare Earth
Elements in Natural Waters. Geochimica et Cosmochimica Acta, 68, 691-699.
Krauskopf K and Bird D (1995) Introduction to geochemistry, 3rd ed. McGraw Hill,
Boston
Lucas J and Prevot-Lucas L (1995) Tethyan phosphates and bioproductites. In A.E.M.
Nairn and F.G. Stehli (Eds.), The Ocean Basins and Margins - The Tethys Ocean.
Plenum Press, 8, p. 367-391.
Masri M (1963) Unpublished report on the geology of the Amman-Zerqa Area. Central
Water Authority, Amman, Jordan.
McArthur JM and Walsh JN (1984) Rare earth elements geochemistry in phosphorites.
Chemical Geology, 47, 191-220.
Mckelvey V E Strobell JD And Slaughter AI (1986). The vanadiferous zone of the
Phosphoria Formation in western Wyoming and southern Idaho. U. S. Geol. Surv.
Prof. Paper. Alexandria. 1465, 27p.
McClellan GH (1980) Mineralogy of carbonate-fluorapatite. J. Geol. Soc. London. 137,
675-681.
McClellnn GH and Lehr JR (1969) Crystal-chemical investigation of natural apatites:
Am. Mineralogist, 54, 1374-1391.
McClellan GH and Kauvenbergh SJV (1990). Mineralogy of sedimentary apatite. In : A.
J. G. Notholt and I. Jarvis (Eds.) Phosphorite Research and Development. Geol. Soc.
London Spec. Publ., 52, 23-31.
Mikbel Sh and Abed AM (1985) Discovery of large phosphate deposits in NW Jordan.
Dirasat, 12, 125-124.
Moller P Dulski P and Luck J (1992) Determination of rare earth elements in
seawater by inductively coupled pIasma-mass spectrometry. Spectrochimica Acta,
478,1379-1387.
Nathan Y (1984) The mineralogy and geochemistry of phosphorites. In: Nriagu, J. O.
and Moore, P. O. (eds), Phosphate minerals. Springer, Berlin :275-291.
Notholt AJ Sheldon RP and Davidson DF (1989) Phosphate deposits of the world, v. 2,
Phosphate Rock Resources. Cambridge University Press.
Piepgras DJ and Jacobsen SB (1992) The Behavior of Rare Earth Elements in Seawater:
Precise Determination of Variations in the North Pacific Water Column. Geochim.
Cosmochim. Acta, 56, 1851-1862.
Piper DZ (1974) Rare earth elements in the sedimentary cycle. Chemical Geology, 14,
285-304.
Piper DZ (2001) Marine Chemistry of the Permian Phosphoria Formation and Basin,
Southeast Idaho. Econ. Geol., 96, 599-620.

15
Piper DZ and Bau M (2013) Normalized Rare Earth Elements in Water, Sediments, and
Wine: Identifying Sources and Environmental Redox Conditions. American Journal
of Analytical Chemistry, 4, 69-83
Powell J (1989) Stratigraphy and sedimentation of the Phanerozoic rocks in central and
south Jordan, part B: Kurnub, Ajlun and Belqa Groups. Geology Directorate Bulletin,
11, Natural Resources Authority of Jordan, Amman.
Powell J and Moh'd BK (2011) Evolution of Cretaceous to Eocene alluvial and
carbonate platform sequences in central and south Jordan. GeoArabia, 16, no. 4, p. 29-
82.
Powell J and Moh'd BK (2012) Early diagenesis of chalk-chert-phosphorite hardgrounds
(Coniacian -Campanian) of central Jordan; implications for sedimentation on a Late
Cretaceous shallow pelagic ramp. GeoArabia, 17, no. 4, 17-38.
Prevot L And Lucas J (1980). Behaviour of some trace elements in phosphatic sedimentary
formations. In: Y. K. Bentor (Ed.), Marine Phosphorites. SEPM Special Publ. 29, 31-41.
Prevot L (1990) Geochemistry, Petrography, Genesis of Cretaceous-Eocene Phosphorites;
The Ganntour deposit (Morocco): a type example. Societe Geologique de France,
Paris, 232p.
Pufahl PK Grimm KA Abed AM and Sadaqah R (2003) Upper Cretaceous (Campanian)
phosphorites in Jordan: implications for the formation of a south Tethyan phosphorite
giant. Sedimentary Geology, 161, 175-205.
Riddler PK Van Eck M and Farasani AM (1989). The phosphorite deposits of the Sirhan-
Turayf region, northern Saudi Arabia. In A.J.G. Notholt, R.P. Sheldon and D.F.
Davidson (Eds.), Phosphate Deposits of the World, v. 2, Phosphate Rock Resources.
Cambridge University Press, p.332-339.
Riggs S Snyder SW Ames D and Stille P (2000) Chrono-stratigraphy of Upper Cenozoic
Phosphorites on the North Carolina Continental Margin and the Oceanographic
Implications for Phosphogenesis. Society of Economic Paleontologists and
Mineralogists Spec. Public. 66, 369-385.
Ruhlin DE and Owen RM (1986) The rare earth element geochemistry of
hydrothermal sediments from the East Pacific Rise: Examination of a seawater
scavenging mechanism. Geochimica et Cosmochimica Acta, 50, 393400.
Sadaqah RM (2000) Phosphogenesis, geochemistry, stable isotopes and depositional
sequence of the Upper Cretaceous phosphorite formation in Jordan. Unpubl PhD
thesis, Univ of Jordan, Amman, 257 pp
Sharland PR Higher R Casey DM Davies RB Hall SH Heward AP Horbury AD and
Simmons MD (2001) Arabian plate sequence stratigraphy. GeoArabia Special
Publication 2, Gulf PetroLink, Bahrain, 371p.
Sholkovitz ER Landing WM and Lewis BL (1994) Ocean particle chemistry: The
fractionation of the rare earth elements suspended particle and seawater. Geochimica et
Cosmochimica Acta, 58, 1567-1579.
Slansky M (1986) Geology of sedimentary phosphates. Elsevier, Amsterdam.
Stampfli GM. and Borrel H (2002) A plate tectonic model for the Paleozoic and Mesozoic
constrained by dynamic plate boundaries and restored synthetic oceanic isochrones. Earth
and Planetary Science Letters, 196, 17-33.
Sun H, Nelson M., Chen, F. and Husch, J. (2009) Direct Spectrophotometric
Fluoride Determination. Canadian Journal of Soil Science, 89(5), 603-610. Van Kauwenbergh SJ (2010) World phosphate rock reserves and resources. International
Fertilizer Development Center (IFDC), Technical Bulletin 75, Muscle Shoals,
Alabama.
16
Varghese S (2004) Geochemistry of rare earth elements and trace metals along the
western continental shelf of India. Un published Ph. D thesis, Cochin University of
Science and Technology, Kochi, India.
Voigt S Jung C Friedrich O Frank M Teschner C and Hoffmann J (2013) Tectonically
restricted deep-ocean circulation at the end of the Cretaceous greenhouse. Earth and
Planetary Science Letters, 369-370, 169-177.
Wang C Hu X Huang Y Wagreich M Scott R and Hay W (2011) Cretaceous oceanic red
beds as possible consequence of oceanic anoxic events. Sed. Geol., 235, 27-37.
Weaver C and Polland L (1975) The chemistry of clay minerals. Elsevier Scientific
Publication, Amsterdam
Wildman TR. and Haskin L (1965) Rare-Earth Elements in Ocean Sediments. Journal of
Geophysical Research, 70, 2905-2911.
White WM (1997) Geochemistry. Cornell University, USA. <http://www.geo.
cornell.edu/geology/classes/geo455/Chapters.HTML>.
Wright J Schrader H and Holster W (1987) Paleoredox variations in ancient oceans
recorded by rare earth elements in fossil apatite. Geochim. Cosmochim. Acta, 51, 631-
644.
Yamamura SS, Wade, MA and Sikes JH (1962) Direct spectrophotometric fluoride
determination. Anal. Chem., 34 (10), 1308–1312
17
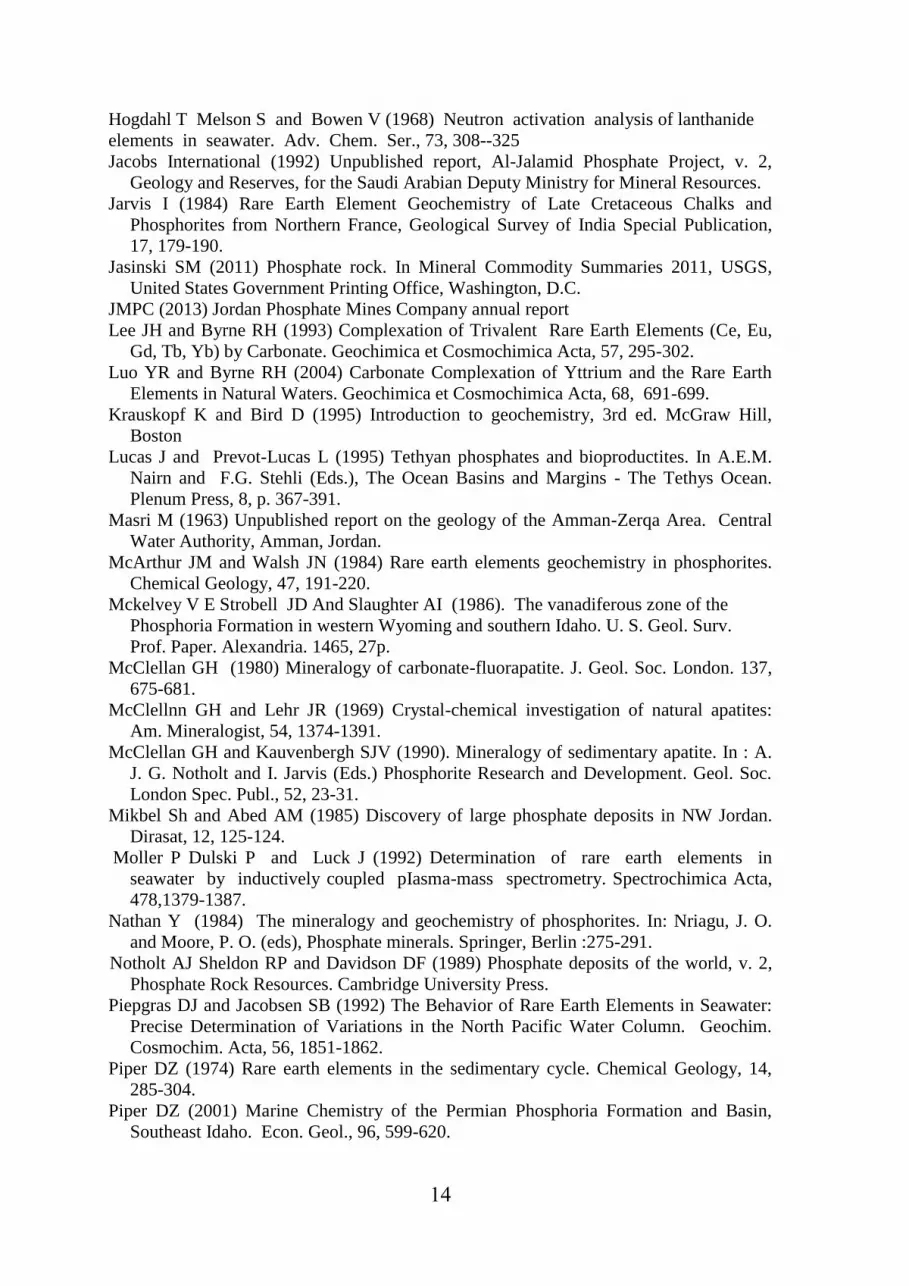
AppendixI
Structural carbonates (%) in the francolite using the pair-peak method (Guldbrandsen for
some samples from Dair Abu Sa'id section., 1970)
Sample No. CO32- %
Dair2 3.10%
Dair3 3.0
Dair4 2.95
Dair6 3.0
Dair8 1.85
Dair10 4.5
Dair11 3.20
Dair12 2.90
Dair13b 3.30
Dair15a 1.80
Dair16 6.0
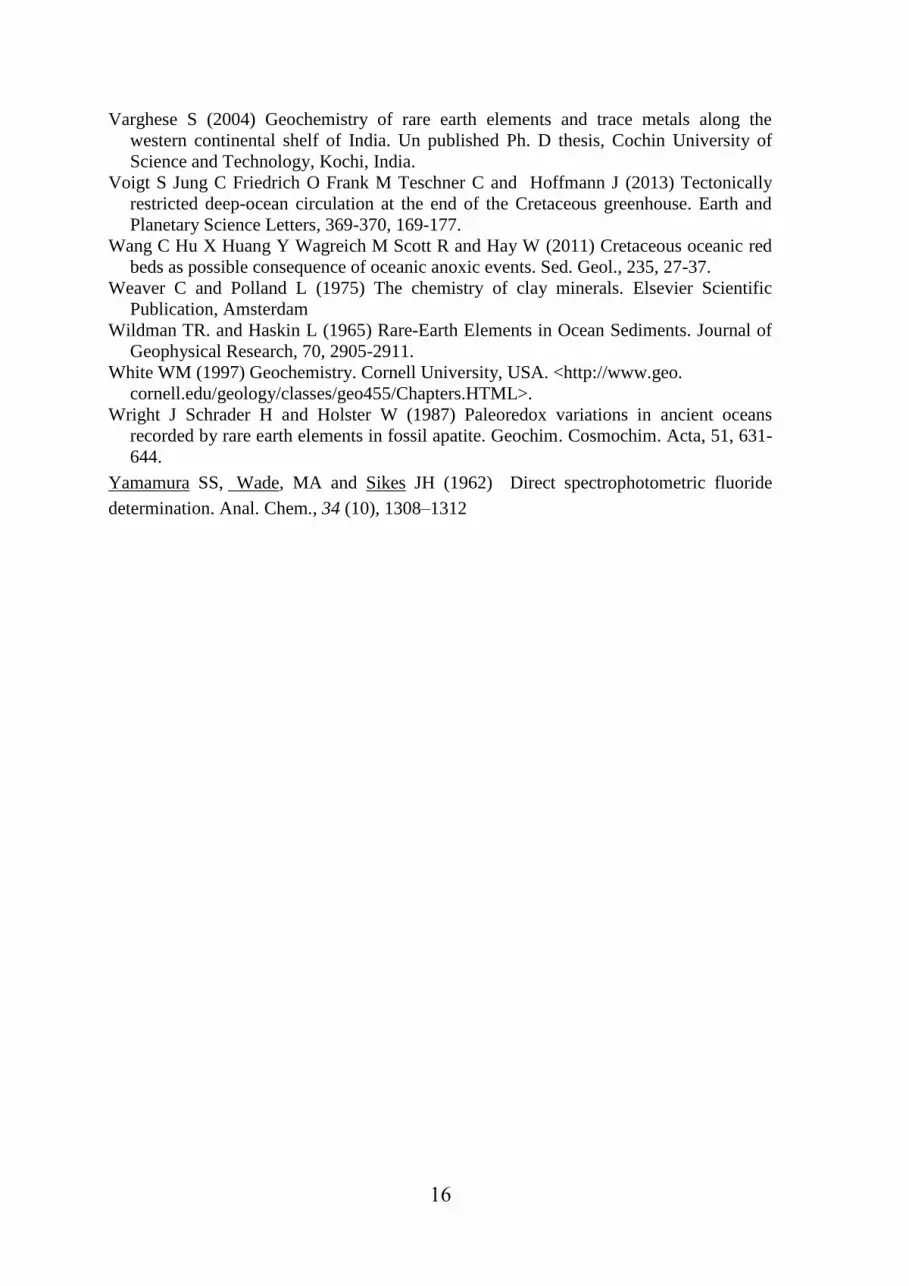
Appendix II
Flouride contents in some samples of the study area
Sample No. F %
Dair2 3.31
Dair3 1.52
Dair4 0.95
Dair6 2.87
Dair8 3.97
Dair10 1.13
Dair11 0.82
Dair12 3.13
Dair13b 0.31
Dair15a 3.21
Dair16 1.76

FigureClick here to download Figure: Fig. 1 Location map.jpg

FigureClick here to download Figure: Fig. 2 sections.jpg

FigureClick here to download Figure: Fig. 3 Petrography.jpg

FigureClick here to download Figure: Fig. 4 Petrography 2.jpg
FigureClick here to download Figure: Fig. 5 Land derived elements.jpg
FigureClick here to download Figure: Fig. 6 Phosphor elements.jpg
FigureClick here to download Figure: Fig 7 Group 3.jpg
FigureClick here to download Figure: Fig.8 P - U plot.jpg

FigureClick here to download Figure: Fig. 9 REE patterns.jpg

FigureClick here to download Figure: Fig. 10 Phosphatized forams.jpg

FigureClick here to download Figure: Fig. 11 Ce Anamaly corr plots.jpg
FigureClick here to download Figure: Fig. 12 Ce comparison with seawater.jpg
Formation Member Group Age
Shallala
Belqa
Eocene
Tertiary Umm Rijam Chert Limestone
Muwaqqar Chalk Marl (MCM) Paleocene
Qatrana
Phosphorite
Al-Hisa Phosphorite
(AHP)
Paleocene -
Maastrichtian
Late
Cretaceous
Bahiyya Coquina
Sultani Phosphorite
Amman Silicified Limestone Campanian –
Santonian
Dhiban Chalk
Ghudran
Coniacian Tafila
Mujib chalk
Wadi Es Sir
Ajlun
Turonian
Shueib
Hummar
Cenomanian Fuheis
Na'ur
Kurnub (Hathira) Sandstone Group Aptian -
Albian
Early
Cretaceous
Table 1
Table
Related Documents


![Gipsy King - Bembemma · Trumpet in Bb Trumpet in Bb Percussion Kora Kora Kora Upright Bass Tape Sampler Keyboard [Brass] Orchestra Hit Kora Kora 3 Melody 1](https://static.cupdf.com/doc/110x72/5e811497da85a8239818ab80/gipsy-king-trumpet-in-bb-trumpet-in-bb-percussion-kora-kora-kora-upright-bass.jpg)