Pergamon @Original Contribution Illtrasound in Med. CG Biol.. Vol. 71. No. Y. pp. I lY%l2OY, 1995 Copyright Q lY95 Elsevwr Science Inc. Printed in the USA. All rtghts reserved 0301-Sh29/Y5 $9.50 + .oo 0301-5629(95)02013-T RAPID VOLUME FLOW RATE ESTIMATION USING TRANSVERSE COLOUR DOPPLER IMAGING P A PICOT, tB M. FRUITMAN,’ R. N. RANKIN+ * and A. FENSTER+’ . . ‘Departments of Medical Biophysics and *Faculty of Medicine and *University Hospital, University of Western Ontario, London, Ontario, Canada; and “Imaging Research Laboratories, Robarts Research Institute, London, Ontario, Canada (Received 29 December 1994; in jnal form 31 May 1995) Abstract-A system is described in which the volume flow rate of blood in a vessel is determined using transverse colour Doppler ultrasound imaging. The system measures rapidly the two-dimensional velocity profile of blood flowing through a vessel. By integration of the measured velocity profiles the volume flow rate of blood in the vessel is obtained. The Doppler angle is obtained from the included angle between two imaging planes, and their respective average measured flows. This technique yields instantaneous and average flow rate in real time, and permits long flow recordings to be made and stored digitally. The error is less than 5% over a 8:l flow rate range. Key Words: Ultrasonics, Doppler ultrasound, Blood flow, Volume flow, Colour doppler. INTRODUCTION Noninvasive Doppler sonography provides informa- tion on blood velocity and is widely accepted as a useful technique for assessing vascular diseases. How- ever, in some situations, in addition to the velocity, the volume flow rate of blood is of clinical importance ( Ackroyd et al. 1986; Lantz et al. 1979) _ For example, blood volume flow rate measurements in the common carotid can be used as a predictor of stenosisof both common and internal carotid arteries. In principle, a significant degree of stenosiswill result in a measur- ably decreased volume flow rate. Investigators have attempted to quantify this volume flow rate reduction using different sonographic techniques with varying degrees of success (Ackroyd et al. 1986; Meyd et al. 1992; Uematsu et al. 1983). Some authors have sug- gested that the ratio of blood flow rates of the unaf- fected and stenotic carotid arteries is the best predictor of carotid stenosis (Meyd et al. 1992). Volume flow rate measurements have also been suggested as a tech- nique for short- and long-term follow-up of carotid endarterectomy (Uematsu et al. 1983). Volume flow rate measurements may also be ap- plied in the diagnosisand treatment of vascular malfor- Address correspondence to: Dr. Paul A. Picot, Imaging Re- search Laboratories, Robarts Research Institute, 100 Perth Drive, London, ON N6A 5K8, Canada. mations. Specifically, the measurement of volume flow rate in the common carotid artery may help to distin- guish arteriovenous malformations and fistulae, which are high-flow lesions, from venous malformations, which are low-flow lesions (Rak et al. 1992). Renal dialysis patients may also benefit from volume flow rate measurements (Nakajima et al. 1987), because either inadequate or excessive flow through angioac- cessfistulae can have pernicious clinical consequences (Lantz et al. 1979). Several techniqueshave been developed to estimate blood volume flow rate from Doppler velocity measure- ments,each with characteristicadvantages and disadvan- tages, which have beendetailedby Gill ( 1985 ) andEvans et al. (1989a). A very common technique employs pulsed Doppler ultrasound to measure the peak velocity in a small sample volume at the centre of a vessel.Some velocity profile is assumed, usually parabolic for periph- eral vasculature, and plug (flat) for the aortic root, and the average velocity across the vessel is inferred. The volume flow rate is then computed as the product of this average velocity and the vessel cross-sectional area, obtained from a separate vessel diameter measurement. This approach makes the assumptionthat the vessel is circular, and ignores changesin vessel size through the cardiac cycle. It also depends on accurate localization of the Doppler samplevolume in the centre of the vessel. A variation of this technique usesa very large sample 1199

Welcome message from author
This document is posted to help you gain knowledge. Please leave a comment to let me know what you think about it! Share it to your friends and learn new things together.
Transcript
Pergamon
@Original Contribution
Illtrasound in Med. CG Biol.. Vol. 71. No. Y. pp. I lY%l2OY, 1995 Copyright Q lY95 Elsevwr Science Inc.
Printed in the USA. All rtghts reserved 0301-Sh29/Y5 $9.50 + .oo
0301-5629(95)02013-T
RAPID VOLUME FLOW RATE ESTIMATION USING TRANSVERSE COLOUR DOPPLER IMAGING
P A PICOT, tB M. FRUITMAN,’ R. N. RANKIN+ * and A. FENSTER+’ . . ‘Departments of Medical Biophysics and *Faculty of Medicine and *University Hospital,
University of Western Ontario, London, Ontario, Canada; and “Imaging Research Laboratories, Robarts Research Institute, London, Ontario, Canada
(Received 29 December 1994; in jnal form 31 May 1995)
Abstract-A system is described in which the volume flow rate of blood in a vessel is determined using transverse colour Doppler ultrasound imaging. The system measures rapidly the two-dimensional velocity profile of blood flowing through a vessel. By integration of the measured velocity profiles the volume flow rate of blood in the vessel is obtained. The Doppler angle is obtained from the included angle between two imaging planes, and their respective average measured flows. This technique yields instantaneous and average flow rate in real time, and permits long flow recordings to be made and stored digitally. The error is less than 5% over a 8:l flow rate range.
Key Words: Ultrasonics, Doppler ultrasound, Blood flow, Volume flow, Colour doppler.
INTRODUCTION
Noninvasive Doppler sonography provides informa- tion on blood velocity and is widely accepted as a useful technique for assessing vascular diseases. How- ever, in some situations, in addition to the velocity, the volume flow rate of blood is of clinical importance ( Ackroyd et al. 1986; Lantz et al. 1979) _ For example, blood volume flow rate measurements in the common carotid can be used as a predictor of stenosis of both common and internal carotid arteries. In principle, a significant degree of stenosis will result in a measur- ably decreased volume flow rate. Investigators have attempted to quantify this volume flow rate reduction using different sonographic techniques with varying degrees of success (Ackroyd et al. 1986; Meyd et al. 1992; Uematsu et al. 1983). Some authors have sug- gested that the ratio of blood flow rates of the unaf- fected and stenotic carotid arteries is the best predictor of carotid stenosis (Meyd et al. 1992). Volume flow rate measurements have also been suggested as a tech- nique for short- and long-term follow-up of carotid endarterectomy (Uematsu et al. 1983).
Volume flow rate measurements may also be ap- plied in the diagnosis and treatment of vascular malfor-
Address correspondence to: Dr. Paul A. Picot, Imaging Re- search Laboratories, Robarts Research Institute, 100 Perth Drive, London, ON N6A 5K8, Canada.
mations. Specifically, the measurement of volume flow rate in the common carotid artery may help to distin- guish arteriovenous malformations and fistulae, which are high-flow lesions, from venous malformations, which are low-flow lesions (Rak et al. 1992). Renal dialysis patients may also benefit from volume flow rate measurements (Nakajima et al. 1987), because either inadequate or excessive flow through angioac- cess fistulae can have pernicious clinical consequences (Lantz et al. 1979).
Several techniques have been developed to estimate blood volume flow rate from Doppler velocity measure- ments, each with characteristic advantages and disadvan- tages, which have been detailed by Gill ( 1985 ) and Evans et al. (1989a). A very common technique employs pulsed Doppler ultrasound to measure the peak velocity in a small sample volume at the centre of a vessel. Some velocity profile is assumed, usually parabolic for periph- eral vasculature, and plug (flat) for the aortic root, and the average velocity across the vessel is inferred. The volume flow rate is then computed as the product of this average velocity and the vessel cross-sectional area, obtained from a separate vessel diameter measurement. This approach makes the assumption that the vessel is circular, and ignores changes in vessel size through the cardiac cycle. It also depends on accurate localization of the Doppler sample volume in the centre of the vessel. A variation of this technique uses a very large sample
1199
1200 Ultrasound in Medicine and Biology Volume 21. Numhel 9. IWi
volume to obtain a mean velocity measurement from the entire blood vessel of interest, thus eliminating the veloc- ity profile assumption and relaxing the accurate localiza- tion requirement. This variation demands an accurate mean velocity estimator, still requires a separate vessel diameter measurement, and also assumes a circular ves- sel. The attenuation-compensated flowmeter approach (Evans et al. 1989a, 1989~: Hottinger and Meindl 1979 ) attempts to infer the blood vessel area by measuring the returned power, thus eliminating the assumption of vessel circularity and the requirement for vessel diameter mea- surement. It also requires an accurate mean velocity esti- mator, and requires accurate returned power measure- ment for the vessel area estimation. It also requires an agile transducer that can alternately generate first a very large sample volume for mean velocity estimation, and then a small sample volume for power measurement. Another technique using colour M-mode directly mea- sures a one-dimensional velocity profile, and monitors changes in the vessel diameter through the cardiac cycle, but still assumes a circular artery (Juul et al. 1991; Picot and Embree 1994). Other techniques exist that require dedicated transducers, such as one described by Uematsu (1981).
In this article, we describe a new blood flow mea- surement technique that attempts to avoid the limitations discussed above by using colour Doppler ultrasound im- aging to measure directly both the functional shape of the blood vessel and the velocity profile within it in real time. We characterize this technique’s performance in vitro and discuss potential sources of error. We also dem- onstrate its use measuring carotid artery blood flow in a volunteer, and measuring common femoral flow in a patient undergoing femoral angioplasty.
MATERIALS AND METHODS
Apprmch Our approach to volume flow rate measurement
described in this article differs from other volume flow rate estimation techniques by providing a method for directly measuring the flow velocity profile, thus avoiding a separate vessel diameter measurement. The technique uses transverse ( cross-sectional ) colour Doppler ultrasound images, and affords the real-time measurement of both the two-dimensional (2D) veloc- ity profile and the functional diameter of a blood ves- sel. This approach has been attempted previously (Ki- tabatake et al. 1990)) and was successful in producing 2D velocity profiles by assuming a circular vessel and estimating the Doppler angle from the eccentricity of the 2D image. This assumption resulted in large errors, particularly in pulsatile flow and in vessels smaller than the aorta and, as such, this method is not well suited to quantitative volume flow rate measurement.
In the volume flow rate estimation technique de- scribed here. the Doppler angle is determined sepa- rately, from a pair of Doppler measurements taken at two different angles, thus removing the circularity assumption and its attendant errors. In our technique, the volume flow measurement is performed as follows. At each of the two measurement angles, colour Dopp- ler ultrasound images are digitised. These colour Doppler images represent, in gradations of colour, a set of velocity measurement sites spaced approxi- mately 0.5 to 1 .O mm across a 2D image plane. Since the velocity measurement site is generally larger than the digitised image picture elements (pixels 1. each ve- locity measurement site in the image plane is interpo- lated by the ultrasound instrument to cover several pixels in the digitised image. The digitised colour Doppler images are then converted into 2D velocity profiles using a calibrated colour-to-velocity mapping technique described by Rickey et al. ( 1992 ) .
In these images (or velocity profiles ), the true blood velocity at time t in each pixel i in the image is given by the measured velocity, u, (t ), divided by the cosine of the Doppler angle. The pixel area projected on the vessel cross-section is given by the product of the image pixel area, AA, with the sine of the Doppler angle [eqn ( 1 )] . Thus, the How rate AQ, ( t ) through each pixel at time I is
AQ,(t, = 2 AA sin H
To obtain the volume flow rate through the vessel, we sum the individual contributions from all pixels in the image. For simplicity, we introduce V(t), the sum of the measured velocities over all pixels, scaled by the pixel area:
,p I
V(t) = c u,(t)AA (2)
thus, the volume flow rate Q at time t is
Q(f) = ,H ‘ln “g u;(t)&4 ,
= tan HV(t) (3)
where: 0 is the angle between the ultrasound image plane and the vessel axis (Doppler angle) ; uj (t) is the measured velocity at each pixel; V(t) is the summed two-dimensional velocity profile, scaled by the pixel area; AA is the area of each pixel in the image plane; and npix is the number of pixels in the image plane.
Since calculation of the volume flow rate from
Rapid volume flow rate estimation using transverse colour 0 PICOT ef al. 1201
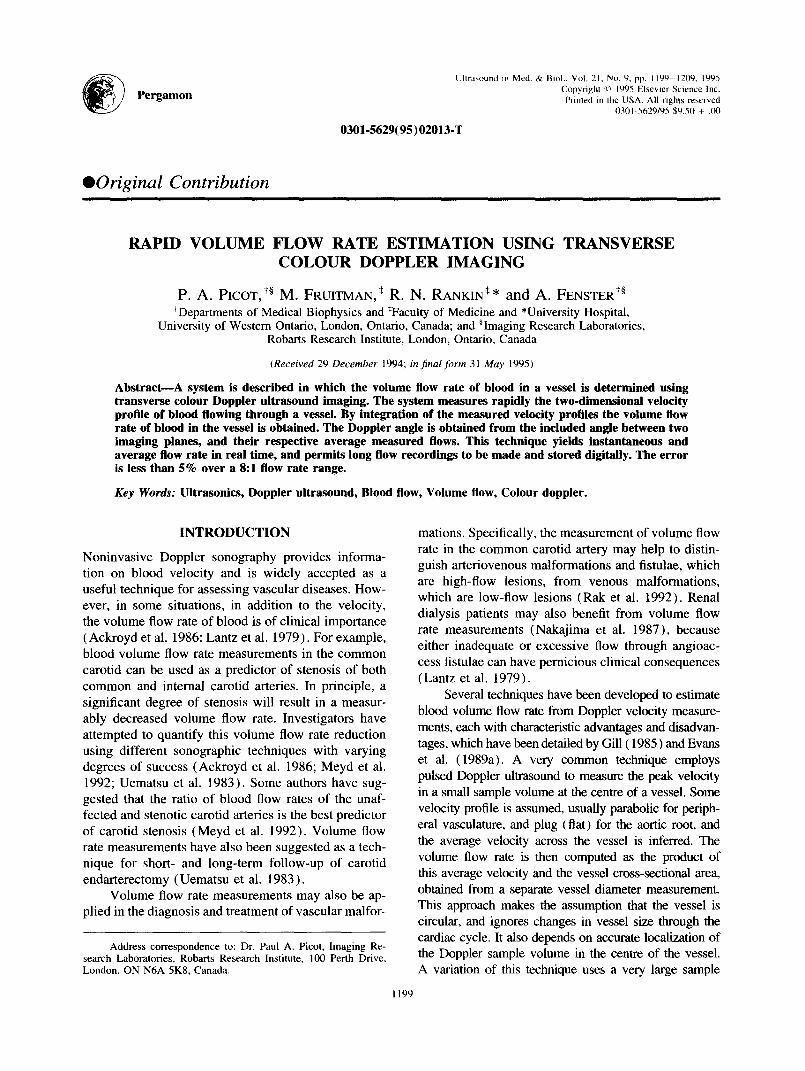
Fig. 1. An angle bracket is used to fix the probe angle, and an optional base-plate was placed on the patient’s skin in line with the blood vessel. This bracket fixed the probe angle at 59.8” for the measurements described in this study. A scale visible on the far side of the base aided in transducer
positioning.
typical colour Doppler images involves only a few tens of thousands of image pixels per second, these flow rate estimates are readily computed in real time, and may be presented to the operator as a scrolling graph, and as cycle-to-cycle volume flow rate in milliliters per minute.
To obtain accurate volume flow rate estimates, the values described above, 8, uj and AA, must be accurately determined. The following section details our approach.
Instrumentation
Doppler angle determination. A conventional col- our Doppler ultrasound instrument (Ultramark 9, ATL, Bothell, WA) was modified by mounting a linear array scanhead on a frame that fixed the angle of the image plane with respect to the skin surface, as shown in Fig. I. The frame consists of a flat base 28 cm long and 11 cm wide, with a 23 cm by 6.5 cm opening, through which the scanhead insonifies the tissue. The scanhead is securely attached to an angle bracket that rides on ledges within the opening in the base. The angle bracket is free to slide along the base and may be lifted to rotate the scanhead to view a vessel from the opposite direction. The angle bracket fixes the angle of the scanhead with respect to the base. Although this angle is well defined, it is not the Doppler angle, and the true Doppler angle is not yet known.
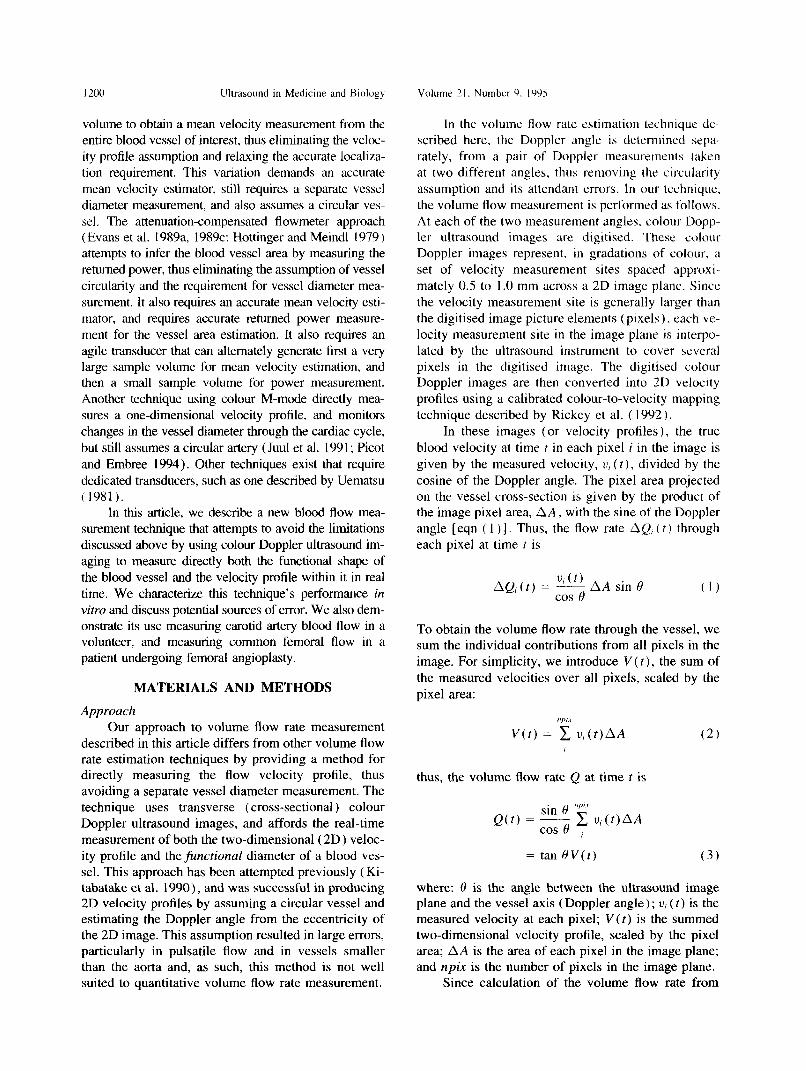
Because the flow rate estimate is sensitive to the Doppler angle, it must be determined accurately. Fig- ure 2 shows the uncertainty in the flow rate estimate [computed from eqn ( 1 )] resulting solely from various uncertainties in the estimate of the Doppler angle. This figure shows that the uncertainty in the flow rate esti- mate is at a minimum at a Doppler angle of 45”, and varies little for angles between 30” and 60”. For ease of scanhead access to the vessel of interest and to minimise the apparent depth of the vessel, Doppler angles at the higher end of the range, i.e., closer to perpendicular, are favoured. Thus, for this study the scanhead was preset at a fixed angle of 59.8” ? 0.4” with respect to the base by means of the angle bracket shown in Fig. 1. Since blood vessels will not necessar- ily be parallel to the skin, the true Doppler angle must be determined by other means, such as the technique described below.
The true Doppler angle is determined by per- forming two volume flow rate measurements, QU< t) and Qh (t) , at two different Doppler angles at the same site in the vessel, as shown in Fig. 3. This is accom- plished by holding the frame base fixed on the skin surface and lifting, rotating, and replacing the scanhead and angle bracket to view the vessel at the same loca- tion but from the opposite direction. Since the two measurements are obtained within a short period of time at the same site in the vessel, we assume that the temporal average of the flow rate in the vessel is the
I I I I I ” I .p- k 12- ---- 2” uncertainty
- 1’ uncertainty .E 2 1(-J- - - _ 0.5’ uncertainty
g 8 -=-___ -- -______- --- __-* .-
3 6-
F E 4-
2 T 2 --- _______ ------- I- 1
; 0: 30 40 50 60 70 80
Doppler angle (degrees)
Fig. 2. Although the Doppler angle was fixed at 59.8” for this study, it may be freely chosen over a wide range. However, the angle selected must be known accurately to permit accurate computation of volume flow rate. This graph illustrates the uncertainty in the volume flow rate measurement due solely to OS”, 1” and 2” uncertainties in the Doppler angle, versus Dopp- ler angle. The uncertainty in measured flow rate due to uncer- tainty in Doppler angle is a minimum for Doppler angles near 45”, although a more favoured angle is near 60”, due to scan-
head access and vessel depth considerations.

I ?.I)2 Ultrasound in Medicine and Biology Volume 2 I, Number Y. IYYS
Kition b position
\ I
blood vessel X i I , \ \ I’ \
/’ \ \
Fig. 3. For accurate volume flow rate determination, the Doppler angle must be determined. In this study, volume flow rate measurements are made at the same site from two viewing positions. The average volume flow rate is assumed to remain the same between the two measurements. The Doppler angle is computed from the two measured values and the accurately known included angle between the two viewing positions (see text). The true volume flow rate is
then computed using this Doppler angle.
same for the two measurements, i.e.. Q‘, = Q,). Thus, from eqn (3):
tan 0,,c = tan O,,V,,
where
f, V(t,At v, = r-0
T (4)
and x represents n or b, At is the interimage period, and T is the total digitization time. T should span an integral number of cardiac cycles from diastole to dias- tale, where the flow rate is at a minimum and uncer- tainties in cardiac cycle period measurement will have minimal effect on the measurement of the mean veloc- ity. Similarly, T should span more than 10 cycles, in order to average the effects of cycle-to-cycle pulse volume variability.
From Fig. 3 it is apparent that tan eh = tan( 8, + LY ), where (Y is the included angle between the two image planes, and thus
tan 0,K = tan( 0,, + ff ) V, (5a)
From a tangent trigonometric addition formula, we ob- tain
- tan H + tan CY V, tan H,, = V,, ----fJ __.
I - tan H,, tan (Y (5b)
The true Doppler angle, H,,, may now be determined by solving eqn ( 5b ) for tan H,, :
tan H,,
V,, - V,, + (V, - V,,)’ - 4V, V,, tan’cv = !,2 tan ff
(6)
Equation (6) is valid only when V,, is positive, V,, is negative and u is acute, but more general solutions may be used here instead. The volume flow rate Q( t ) in the vessel, given in eqn (3), may then be calculated using eqn (6) and V,,(t). Because the angle bracket was fixed at 59.8” with respect to the base, the value for CY used in this study was 60.4”.
Velocity profile determinution,from colour Doppler irw aging
To obtain V,, and vi, the frame and scanhead as- sembly was placed on the skin, and aligned so that the vessel of interest passed through the imaging plane. i.e., the scan plane cut a cross-section of the blood vessel. In this presentation, the vessel appears elliptical with the long axis toward the scanhead. The ultrasound instrument typically performs approximately 100 col- our velocity measurements, interpolated to cover ap- proximately 1000 image pixels over an entire blood vessel cross-section in an image at rates between 10 and 30 images per second. Rickey et al. ( 1992) have shown that the velocity-to-colour mapping performed by clinical colour Doppler ultrasound instruments can be both accurate and precise. We therefore digitised the Red-Green-Blue (RGB) colour video output from the ultrasound instrument with a video digitiser (Vision 16 Frame Grabber, Vision Technologies, Fre- mont, CA, USA 1, installed in a 80386-based host com- puter and then transformed the colour image to a 2D velocity map, showing the blood velocity profile in the vessel. The 2D velocity profile was summed over the vessel in real time by the host computer [ eqn ( 2 )] and then scaled by the pixel area AA. The pixel area was obtained by calibrating the 2D images using a stretched-string phantom that had an accurately known spacing between strings (Picot et al. 1993). The re- sulting integrated 2D velocity profile, V(t). for each image was then scaled by the tangent of the Doppler angle to yield volume flow rate [ eqn ( 3 ) ] , which was presented to the operator as a scrolling graph, again in real time. The volume flow rate was saved in a data file for later analysis. The volume flow rate graph was also integrated in real time between the diastolic phases
Rapid volume flow rate estimation using transverse colour 0 PI(Y et ul. I203
of successive cardiac cycles, and the resulting cycle- to-cycle volume flow rate was presented to the operator in numerical form. The image acquisition rate was kept as fast as possible to avoid aliasing of the flow rate waveform. In our trials, the acquisition rate was typi- cally 25 s ‘.
Returned power compensation. The size of the blood vessel displayed in the colour Doppler image will change depending on the amount of received acoustic power, due to the approximately Gaussian sensitivity profile of a sample volume in the ultrasound beam. Thus, variations in the acoustic power returned from the blood or changes in the receiver gain will cause variations in the number of Doppler measure- ment sites that have sufficient returned power to permit a velocity estimate. Since the measurement sites at the vessel periphery exhibit a partial volume effect, where only part of the site is occupied by moving blood, it is those parts of the image that will be affected by variations in acoustic power or receiver gain. Variation in the size of the vessel being imaged thus results in an artefactual change in the measured volume flow rate. For consistent volume flow rate measurements, then. it is important to adjust the output power and colour gain of the ultrasound instrument to fix the aver- age returned power per voxel from the vessel at a predetermined value. For the purposes of these mea- surements, we assumed that the colour gain and output power controls have a similar effect on the measured flow rate.
To adjust the returned power level to an appropriate setting, the operator temporarily placed the instrument in its power-measurement mode, a measurement and dis- play mode available on autocorrelator-type colour Dopp- ler imaging systems. The colour power image produced was digitised and converted by a colour-to-power map- ping technique similar to the velocity measurement tech- nique described earlier. The mean power in a region in the centrc of the vessel was calculated and displayed as a thermometer-style bar. The region over which power was measured was limited to a uniform region entirely within the vessel, minimizing vessel size dependence. Then, the operator manually adjusted the acoustic power and colour gain to place the thermometer bar into a prede- fined target zone. The power level of the target zone was determined from in vitro tests with an accurate computer- controlled pump and a blood vessel phantom, described below. This power-compensation step required approxi- mately 30 s to perform. The operator then placed the ultrasound instrument in the velocity-measurement mode to continue to the how rate measurement.
Volume ,flow rate measurement A volume flow rate measurement proceeded as fol-
lows. The vessel of interest was first identified, and the
scanhead and angle bracket positioned on the skin to afford a cross-sectional view of the vessel of interest. The colour box depth and width were adjusted to yield the highest possible image rate, while still covering the entire vessel. The grey-scale (B-mode) intensity was set so that the brightest parts of the image were well below that required to suppress the colour information. and the colour overwrite priority was set to its highest setting, so that the B-mode image had no effect on the colour image or the colour-to-velocity conversion operation. The re- gion of interest, over which the volume flow rate mea- surement was performed, was adjusted by the operator using a trackball to match in size with the ultrasound instrument’s colour box. The acoustic power received from the vessel was measured and adjusted in the power- compensation step, as described above. Once the operator placed the instrument back in the velocity-measurement mode, the computer automatically began volume flow rate measurements and presented the results to the opera- tor. It is important to note that, at this stage, the measure- ment was uncorrected for Doppler angle, and thus, the true volume flow rate was not yet known. After 10 to 20 cardiac cycles, the operator rotated the scanhead 180” to view the vessel at the same location, but from the opposite direction, as shown in Fig. 3. A scale affixed to the base plate aided in spacing the two positions. This second uncorrected volume flow rate measurement was performed for another 10 to 20 cycles. From these two sets of measurements and the included angle between the two probe positions fixed by the angle bracket. the true Doppler angle was calculated and the true volume flow rate through the vessel was computed using eqn ( 3).
In vitro system evaluation
Measurement accuracy. The technique was char- acterized in vitro by pumping a known volume flow rate of blood-mimicking fluid using a computer-con- trolled flow simulator (Quest Image Inc., London. ON, Canada; Holdsworth et al. [ 19911) through a blood vessel phantom. The blood vessel phantom simulated vessels such as the femoral or the common carotid artery and was similar to that described by Rickey et al. ( 1994 ), and was constructed by pouring a molten agar mixture over a 0.64-cm-diameter brass tube set in an open-topped box. Barbed brass inlet and outlet fluid fittings for connection to the flow simulator pene- trated the box walls. The agar was allowed to harden, and then the brass tube was removed through one of the fittings to leave a well-defined lumen. The agar mixture contained distilled water with 3% agar (high strength A-6924; Sigma Chemical, St. Louis, MO) and 3% 50-pm cellulose particles (S-5504 Sigmacell. Sigma Chemical ) to produce tissue-equivalent scatter-
1204 Ultrasound in Medicine and Biology Volume 21. Number 9, 1995
1.2
3 g 1.0
! ! i j= 0.8
6 0.6 3=
$ 0.4 L
2
% 0.2
E 0.0
/c- J
i
(wall filter ‘1
(aliased)
0 5 10 15
true flow (rnLs“)
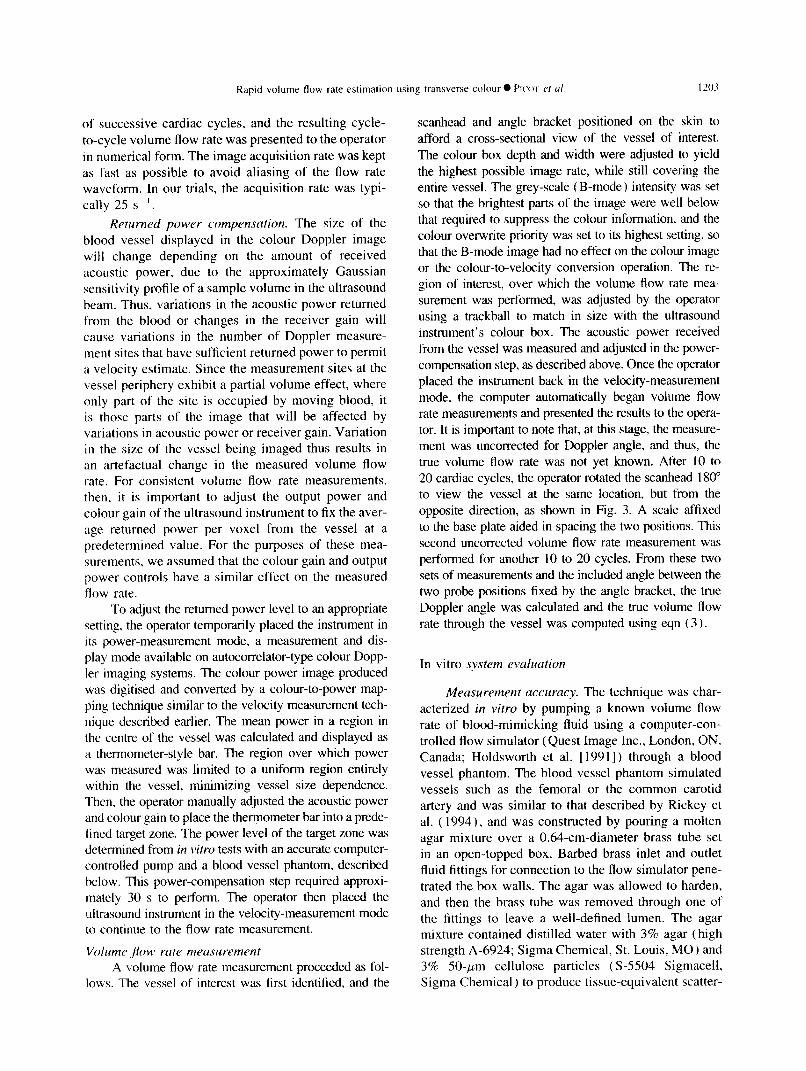
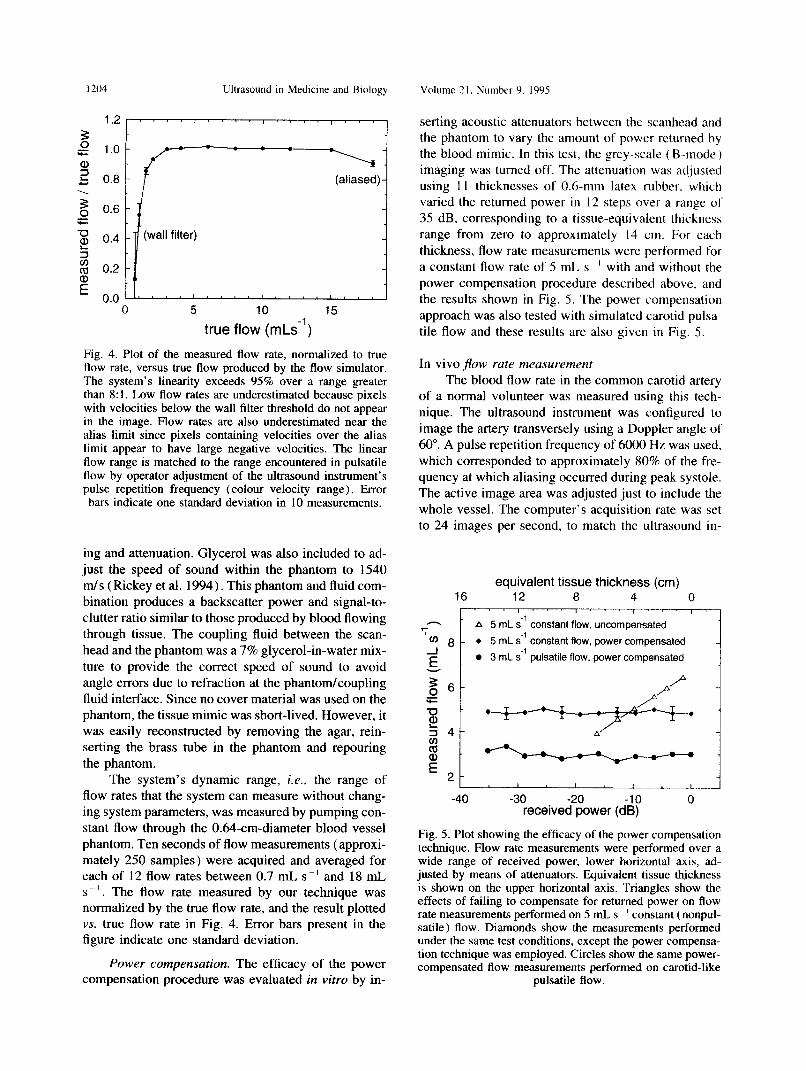
Fig. 4. Plot of the measured flow rate, normalized to true flow rate, versus true flow produced by the flow simulator. The system’s linearity exceeds 95% over a range greater than 8: I. Low flow rates are underestimated because pixels with velocities below the wall filter threshold do not appear in the image. Flow rates are also underestimated near the alias limit since pixels containing velocities over the alias limit appear to have large negative velocities. The linear flow range is matched to the range encountered in pulsatile flow by operator adjustment of the ultrasound instrument’s pulse repetition frequency (colour velocity range). Error bars indicate one standard deviation in 10 measurements.
ing and attenuation. Glycerol was also included to ad- just the speed of sound within the phantom to 1540 m/s (Rickey et al. 1994). This phantom aud fluid com- bination produces a backscatter power and signal-to- clutter ratio similar to those produced by blood flowing through tissue. The coupling fluid between the scan- head and the phantom was a 7% glycerol-in-water mix- ture to provide the correct speed of sound to avoid angle errors due to refraction at the phantom/coupling fluid interface. Since no cover material was used on the phantom, the tissue mimic was short-lived. However, it was easily reconstructed by removing the agar, rein- serting the brass tube in the phantom and repouring the phantom.
The system’s dynamic range, i.e., the range of flow rates that the system can measure without chang- ing system parameters, was measured by pumping con- stant flow through the O&l-cm-diameter blood vessel phantom. Ten seconds of flow measurements (approxi- mately 250 samples) were acquired and averaged for each of 12 flow rates between 0.7 mL s-’ and 18 mL s _‘. The flow rate measured by our technique was normalized by the true flow rate, and the result plotted vs. true flow rate in Fig. 4. Error bars present in the figure indicate one standard deviation.
Power compensation. The efficacy of the power compensation procedure was evaluated in vitro by in-
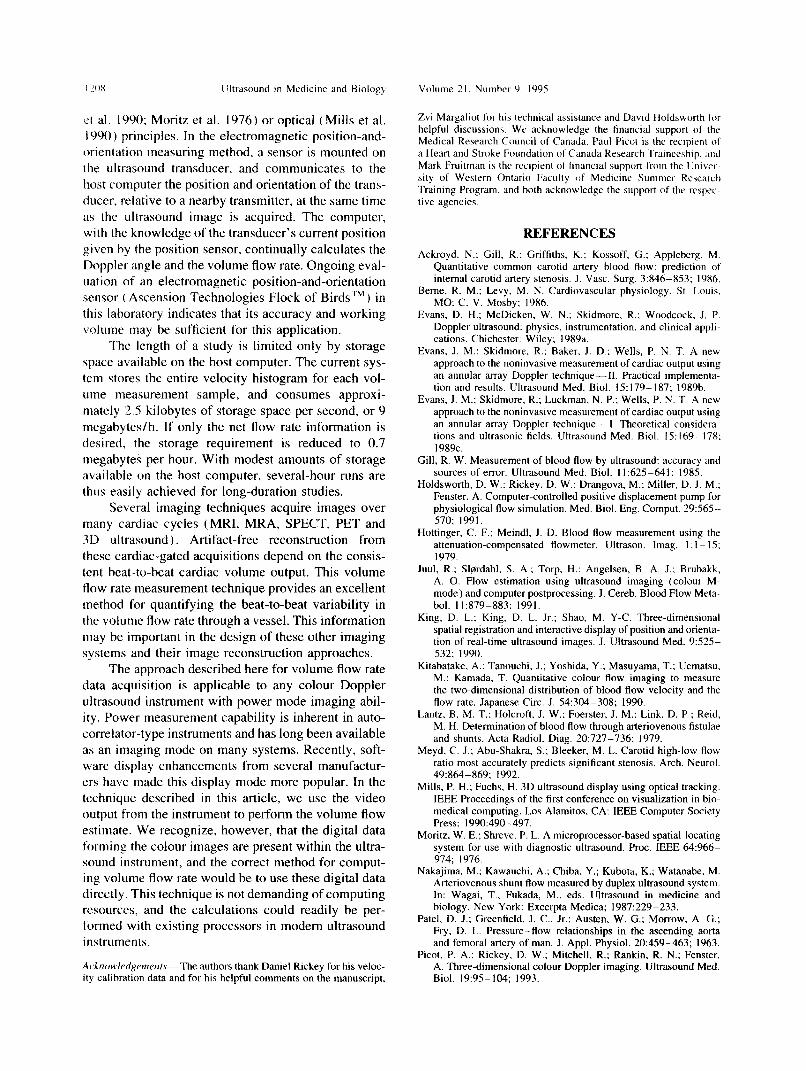
serting acoustic attenuators between the scanhead and the phantom to vary the amount of power returned by the blood mimic. In this test. the grey-scale ( B-mode ) imaging was turned off. The attenuation was adjusted using 11 thicknesses of 0.6-mm latex rubber. which varied the returned power in 12 steps over- a range of 35 dB. corresponding to a tissue-equivalent thickness range from zero to approximately 14 cm. For each thickness, flow rate measurements were performed for a constanl flow rate of 5 mL s ’ with and without the power compensation procedure described above, and the results shown in Fig. 5. The power compensation approach was also tested with simulated carotid pulsa- tile flow and these results are also given in Fig. 5.
In vivo jlow rate measurement The blood flow rate in the common carotid artery
of a normal volunteer was measured using this tech- nique. The ultrasound instrument was configured to image the artery transversely using a Doppler angle of 60”. A pulse repetition frequency of 6000 Hz was used. which corresponded to approximately 80% of the fre- quency at which aliasing occurred during peak systole. The active image area was adjusted just to include the whole vessel. The computer’s acquisition rate was set to 24 images per second, to match the ultrasound in-
equivalent tissue thickness (cm) 16 12 8 4 0
I r ‘. I, ’ , ” ’ , -
7 A 5 mL s-’ constant flow, uncompensated
cJZJ 8 - l 5 mL s-’ COnStant flow, power compensated
3 mL se1 pulsatile flow, power compensated
-40 -30 -20 -10 0 received power (dB)
Fig. 5. Plot showing the efficacy of the power compensation technique. Flow rate measurements were performed over a wide range of received power, lower horizontal axis, ad- justed by means of attenuators. Equivalent tissue thickness is shown on the upper horizontal axis. Triangles show the effects of failing to compensate for returned power on flow rate measurements performed on 5 mL, s ’ constant (nonpul- satile) flow. Diamonds show the measurements performed under the same test conditions, except the power compensa- tion technique was employed. Circles show the same power- compensated flow measurements performed on carotid-like
pulsatile flow.

Rapid volume flow rate estimation using transverse colour 0 PICXYI ct al. I205
83 ms 208 ms 333 ms
9
m
458 ms 583 ms 708 ms
(A)
#pixels/velocity bin ’
C d
c-
333 458
time post-ECG ‘R-wave (ms) (W
Fig. 6. Blood flow velocity profiles measured in the common carotid artery of a normal volunteer. Six samples are shown from a set of 24 acquired every 41.7 ms through a single 1.0-s cardiac cycle. Time labels are in milliseconds after “R” wave of the ECG. (A) Two-dimensional velocity profiles of the flow, obtained from the digitised colour images via the colour-to-velocity mapping technique, showing a parabolic systolic peak flow near 200 ms after “R” wave, and decreasing flow through diastole. Horizontal axes represent distance (mm) and vertical axes represent blood velocity (cm s ~’ ) through the imaging plane, corrected for Doppler angle. Alphabetical labels correspond to those in Figs. 6b and 7. (B) Velocity histograms computed from the velocity profiles shown in Fig. 6a. Velocity bins are unscaled velocity values from the colour-to-velocity mapping step, and are scaled by
PRF, Doppler angle, transmitted carrier frequency and speed of sound to yield true velocities.
strument’s imaging rate. For this test, 24 entire 2D velocity profiles were acquired and stored, comprising the flow information for one complete 1.0-s cardiac cycle. The velocity profiles and their velocity histo- grams were calculated and every third such profile and histogram shown in Fig. 6. The estimated volume flow rate was computed using the information in Fig. 6 and is shown in Fig. 7.
I 8 I I I I
4 1
0’ . ’ . ’ ’ ’ ’ ’ 0 200 400 600 800 1000
time post-ECG ‘R‘ wave (ms)
Fig. 7. Volume flow rates computed from each velocity pro- file image (some of which are shown in Fig. 6) plotted versus time after ECG “R” wave. Total flow through the 1.0-s cardiac cycle, computed as the sum of the individual how rate measurements multiplied by their measurement period, is 5.6 mL, yielding a flow rate of 336 mL/min. Labelled points correspond to the graphs with the same la-
bels shown in Fig. 6.
The technique was then tested in a clinical setting during a femoral angioplasty procedure. Blood flow rate measurements were recorded using the technique described above at a site upstream from a suspected stenotic region in the femoral artery. Measurements were performed at the following times during the angi- oplasty procedure: a baseline measurement prior to arteriography; postarteriography, but before angi- oplasty: postangioplasty, with the injection of 100 pg nitroglycerin; and after a 15min resting period. Two approximately 15-s recordings were made for each of the four measurements, for the determination of Dopp- ler angle and true volume flow rate. Two measurements showing the baseline and a marked increase in flow postangioplasty are shown in Fig. 8.
RESULTS
Figure 4 shows the measured volume flow rate normalized by the true flow rate, plotted versus the true flow rate produced by the flow simulator. Ideal measurements would yield a horizontal straight line with value of 1.0 over the entire range of flow rates. Since our technique is subject to the same limitations as ordinary Doppler ultrasound, it exhibits the effects of the wall filter at the low velocities and of aliasing at high velocities. Between 2.5 and 15 mL s -‘, how- ever, its error is less than 5%, and between 1.5 and 18 mLs -’ its error remains less than 15%. The flow rate range over which the technique is accurate may easily
Ultrasound in Medicine and Biology Volume 21. Number 9. 1995
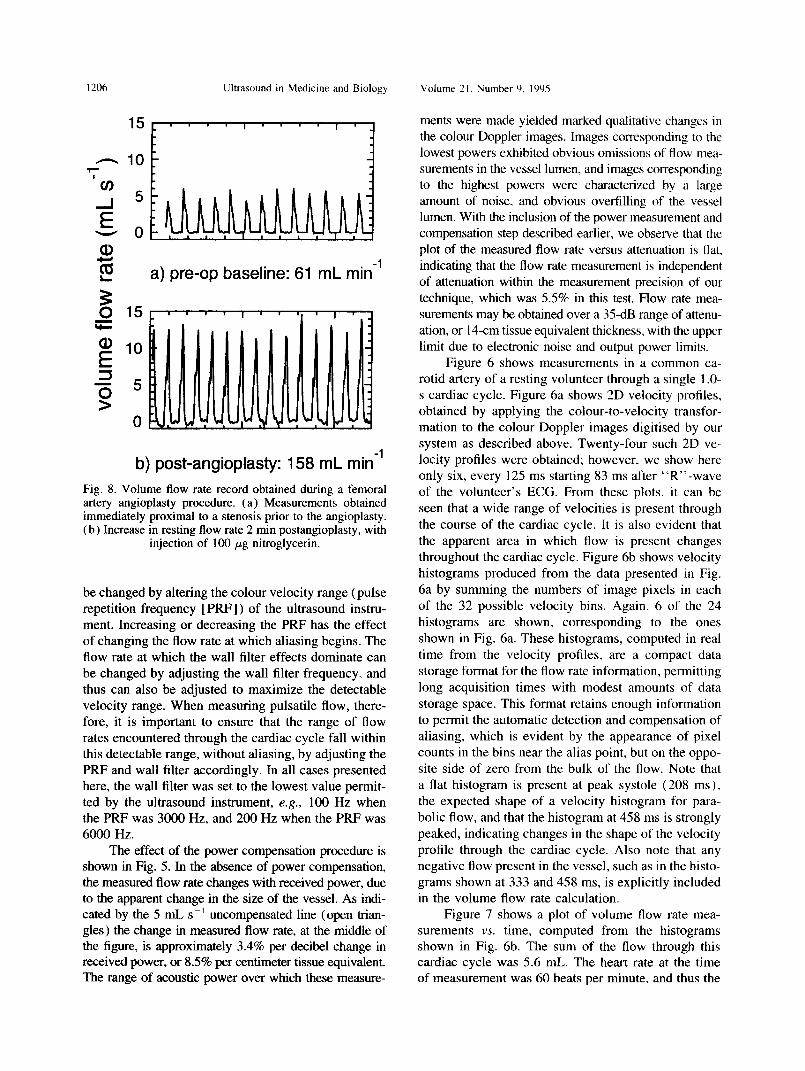
a 5 a) pre-op baseline: 61 mL min-’
b) post-angioplasty: 158 mL min-’ Fig. 8. Volume flow rate record obtained during a femoral artery angioplasty procedure. (a) Measurements obtained immediately proximal to a stenosis prior to the angioplasty. (b) Increase in resting flow rate 2 min postangioplasty, with
injection of 100 pg nitroglycerin.
be changed by altering the colour velocity range (pulse repetition frequency [ PRF] ) of the ultrasound instru- ment. Increasing or decreasing the PRF has the effect of changing the flow rate at which aliasing begins. The flow rate at which the wall filter effects dominate can be changed by adjusting the wall filter frequency. and thus can also be adjusted to maximize the detectable velocity range. When measuring pulsatile flow, there- fore, it is important to ensure that the range of flow rates encountered through the cardiac cycle fall within this detectable range, without aliasing, by adjusting the PRF and wall filter accordingly. In all cases presented here, the wall filter was set to the lowest value permit- ted by the ultrasound instrument, e.g., 100 Hz when the PRF was 3000 Hz, and 200 Hz when the PRF was 6000 Hz.
The effect of the power compensation procedure is shown in Fig. 5. In the absence of power compensation, the measured flow rate changes with received power, due to the apparent change in the size of the vessel. As indi- cated by the 5 mL s -’ uncompensated line (open trian- gles) the change in measured flow rate, at the middle of the figure, is approximately 3.4% per decibel change in received power, or 8.5% per centimeter tissue equivalent. The range of acoustic power over which these measure-
ments were made yielded marked qualitative changes in the colour Doppler images. Images corresponding to the lowest powers exhibited obvious omissions of flow mea- surements in the vessel lumen, and images corresponding to the highest powers were characterized by a large amount of noise. and obvious overfilling of the vessel lumen. With the inclusion of the power measurement and compensation step described earlier, we observe that the plot of the measured flow rate versus attenuation is flat. indicating that the flow rate measurement is independent of attenuation within the measurement precision of our technique, which was 5.5% in this test. Flow rate mea- surements may be obtained over a 35-dB range of attenu- ation. or 14-cm tissue equivalent thickness, with the upper limit due to electronic noise and output power limits.
Figure 6 shows measurements in a common ca- rotid artery of a resting volunteer through a single 1 .O- s cardiac cycle. Figure 6a shows 2D velocity profiles, obtained by applying the colour-to-velocity transfor- mation to the colour Doppler images digitised by our system as described above. Twenty-four such 2D ve- locity profiles were obtained; however, we show here only six, every 125 ms starting 83 ms after “R’‘-wave of the volunteer’s ECG. From these plots, it can be seen that a wide range of velocities is present through the course of the cardiac cycle. It is also evident that the apparent area in which flow is present changes throughout the cardiac cycle. Figure 6b shows velocity histograms produced from the data presented in Fig. 6a by summing the numbers of image pixels in each of the 32 possible velocity bins. Again, 6 of the 24 histograms are shown, corresponding to the ones shown in Fig. 6a. These histograms, computed in real time from the velocity profiles, are a compact data storage format for the flow rate information, permitting long acquisition times with modest amounts of data storage space. This format retains enough information to permit the automatic detection and compensation of aliasing, which is evident by the appearance of pixel counts in the bins near the alias point, but on the oppo- site side of zero from the bulk of the flow. Note that a flat histogram is present at peak systole (208 ms ), the expected shape of a velocity histogram for para- bolic flow, and that the histogram at 458 ms is strongly peaked, indicating changes in the shape of the velocity profile through the cardiac cycle. Also note that any negative flow present in the vessel, such as in the histo- grams shown at 333 and 458 ms, is explicitly included in the volume flow rate calculation.
Figure 7 shows a plot of volume flow rate mea- surements vs. time, computed from the histograms shown in Fig. 6b. The sum of the flow through this cardiac cycle was 5.6 mL. The heart rate at the time of measurement was 60 beats per minute, and thus the

Rapid volume flow rate estimation using transverse colour 0 PICWT et al. 13-07
volume flow rate was 336 mL/min, a value comparable to the 375 mL/min per carotid found in physiology texts (Berne and Levy 1986; Vander et al. 1985).
This technique was used to measure the volume flow rate in the femoral artery of a patient undergoing an angioplasty procedure. Figure 8 shows the results, in which volume flow measurements were made proxi- mal to the stenosis, in a normal part of the vessel. Each volume flow rate measurement, consisting of two approximately 15-s flow rate recordings, added ap- proximately 2 min to the procedure time. Figure 8a shows the volume flow rate recording measured prior to the angioplasty, in a resting leg. Figure 8b shows the flow rate recording at the same site measured im- mediately postangioplasty, and after the injection of 100 pg of nitroglycerin. The figure shows the marked increase in flow probably solely caused by the nitro- glycerin. This patient’s femoral flow rate returned to the preprocedure value within 15 min.
DISCUSSION
A benefit of this transverse-image based approach is that, unlike single-point or colour M-mode tech- niques, the volume flow rate estimate is not sensitive to translational positioning of the ultrasound trans- ducer. This useful property arises because the velocity measurements, and thus the flow, will be properly re- corded for blood vessels appearing anywhere within the active colour box of the ultrasound image. This removes one aspect of operator-induced variability in the estimate, and permits long-duration flow studies to be performed without the need continually to monitor transducer positioning, provided the Doppler angle re- mains fixed, perhaps with a rigid frame.
The volume flow rate measurement technique de- scribed in this article also removes assumptions about vessel circularity and is not sensitive to simple changes in position of the transducer, unlike flow rate estimates made with Doppler velocity measurements at a single point in the vessel. Since the 2D velocity profile is directly measured, our technique also removes assump- tions of its shape (typically assumed to be parabolic in other techniques ). However, our volume flow rate measurement approach makes several implicit assump- tions. For accurate flow rate measurements, it assumes that the Doppler angle is well known, implying that the average volume flow rate changes little between the two measurements used to compute the Doppler angle. This may preclude its use for the measurement of flow in arteries that exhibit slowly changing mean flow, and many veins. This technique also assumes that all the flow streamlines in a vessel at the measure- ment site are parallel, so that they all have the same
Doppler angle. This implies that a relatively straight vessel is required, that the flow is neither converging or diverging significantly, and that there be little turbu- lence. Thus, poststenotic measurements and measure- ments in highly diseased parts of vessels may result in inaccurate flow rate estimates due to unknown and time-varying Doppler angles. It is also assumed that the ultrasound sample volumes are small compared to the vessel, so that the vessel is sampled at several locations across its diameter. Thus, vessels smaller than 2 to 3 mm will have their velocity profiles inade- quately sampled and their diameters inaccurately esti- mated. Other assumptions related to the Doppler angle are that the scanhead is rotated about a line perpendicu- lar to the vessel axis between the two measurements and that the two scanhead positions lie on a line parallel to the vessel. The technique is relatively insensitive to these two errors. It is also assumed that the flow veloci- ties are measured rapidly enough to sample adequately changes in flow rate. To measure pulsatile flows accu- rately, the ultrasound system must maintain an image update rate sufficient to record the rapidly changing blood velocities. Since there is little power in flow components above 12 Hz (Pate1 et al. 1963; Wemick et al. 1984), a sample rate of 24 images per second is sufficient to sample adequately the velocities. Speed of sound considerations permit a colour Doppler imaging system to achieve this image sample rate over reason- able fields of view ( 1 cm) for depths less than approxi- mately 5 cm. Thus, given these constraints, our tech- nique is thus best suited to flow rate measurements in straight, superficial vessels.
Examination of eqn ( 1) shows that this technique is approximately twice as sensitive to uncertainties in Doppler angle than most other techniques, since the computation of both the true blood velocity measure- ment and the true cross-sectional area of the blood vessel is dependent on the Doppler angle. However, the relative changes in the volume flow rate magnitude and waveform shape may still be determined accu- rately, despite inaccuracies in the angle, which will affect only the absolute value of the measured flow rate. This feature may be used in examining changes in volume flow rate waveform with distance along the peripheral artery or vein, which may prove useful in the evaluation of peripheral vascular disease.
In the studies described in this report we mounted the scanhead on a mechanical bracket to fix the Dopp- ler angle. Experience with this technique demonstrated that a less restrictive technique for determining the Doppler angle would be beneficial. Several noncontact methods and devices exist for measuring the six dimen- sions of position and orientation of a scanhead, based on electromagnetic ( Raab et al. 1979). acoustic (Ring
/ !OX iiltrasound in Medicine and Biology Volume 71. Number 9. 1095
et al. 1990; Moritz et al. 1976) or optical (Mills et al. 1990) principles. In the electromagnetic position-and- orientation measuring method, a sensor is mounted on the ultrasound transducer, and communicates to the host computer the position and orientation of the trans- ducer, relative to a nearby transmitter, at the same time as the ultrasound image is acquired. The computer, with the knowledge of the transducer’s current position given hy the position sensor, continually calculates the Doppler angle and the volume flow rate. Ongoing eval- uation of an electromagnetic position-and-orientation sensor ( Ascension Technologies Flock of Birds rM ) in this laboratory indicates that its accuracy and working volume may be sufficient for this application.
The length of a study is limited only by storage space available on the host computer. The current sys- tem stores the entire velocity histogram for each vol- ume measurement sample, and consumes approxi- mately 2.5 kilobytes of storage space per second, or 9 megabytes/h. If only the net flow rate information is desired, the storage requirement is reduced to 0.7 megabytes per hour. With modest amounts of storage available on the host computer, several-hour runs are thus easily achieved for long-duration studies.
Several imaging techniques acquire images over many cardiac cycles (MRI, MRA, SPECT, PET and 3D ultrasound). Artifact-free reconstruction from these cardiac-gated acquisitions depend on the consis- tent beat-to-beat cardiac volume output. This volume flow rate measurement technique provides an excellent method for quantifying the beat-to-beat variability in the volume flow rate through a vessel. This information may be important in the design of these other imaging systems and their image reconstruction approaches.
The approach described here for volume flow rate data acquisition is applicable to any colour Doppler ultrasound instrument with power mode imaging abil- ity. Power measurement capability is inherent in auto- correlator-type instruments and has long been available as an imaging mode on many systems. Recently, soft- ware display enhancements from several manufactur- ers have made this display mode more popular. In the technique described in this article, we use the video output from the instrument to perform the volume flow estimate. We recognize, however, that the digital data forming the colour images are present within the ultra- sound instrument, and the correct method for comput- ing volume flow rate would be to use these digital data directly. This technique is not demanding of computing resources. and the calculations could readily be per- formed with existing processors in modem ultrasound instruments.
Ac,lno~rlrrl~emer~ts---The authors thank Daniel Rickey for his veloc- ity calibration data and for his helpful comments on the manuscript.
Zvi Margaliot for his technical assistance and David Holdsworth IOI- helpful discussions. We acknowledge the financial support of the Medical Research Council of Canada. Paul Picot is the recipient 01 a Heart and Stroke Foundation of Canada Research Traineeship. and Mark Fruitman is the recipient of. financial support from the IJnivel sity of Western Ontario Faculty of Medicine Summer Research Training Program. and both acknowledge the support of the rcspec- live agencies.
REFERENCES
Ackroyd, N.; Gill, R.: Griffiths. K.: Kossoff, G.: Appleherg. M. Quantitative common carotid artery blood flow: prediction of internal carotid artery stenosis. J. Vast. Surg. 3:846-853; 1986.
Beme, R. M.; Levy, M. N. Cardiovascular physiology. St. Louis. MO: C. V. Moshy; 1986.
Evans, D. H.; McDicken. W. N.; Skidmore, R.; Woodcock, J. P. Doppler ultrasound: physics, instrumentation, and clinical appli- cations. Chichester: Wiley; 1989a.
Evans. J. M.: Skidmore. R.; Baker. J. D.; Wells, P. N. T. A new approach to the noninvasive measurement of cardiac output using an annular array Doppler technique--II. Practical implementa- tion and results. Ultrasound Med. Biol. 15: 179- 187; 1989b.
Evans, J. M.: Skidmore, R.; Luckman. N. P.; Wells, P. N. T. A new approach to the noninvasive measurement of cardiac output using an annular array Doppler technique-I. Theoretical considera- tions and ultrasonic fields. Ultrasound Med. Biol. 15: 169-17X: 1989~.
Gill, R. W. Measurement of blood flow by ultrasound: accuracy and sources of error. Ultrasound Med. Biol. ll:625-641: 1985.
Holdsworth, D. W.; Rickey. D. W.: Drangova, M.; Miller, D. J. M.; Fenster. A. Computer-controlled positive displacement pump for physiological flow simulation. Med. Biol. Eng. Comput. 29:565- 570; 1991.
Hottinger. C. F.; Meindl, J. D. Blood flow measurement using the attenuation-compensated flowmeter. Ultrason. Imag. 1: I .- IS; 1979.
Juul, R.; Sl@rdahl, S. A.; Tarp, H.; Angelsen, B. A. J.; Bruhakk, A. 0. Flow estimation using ultrasound imaging (colour M- mode) and computer postprocessing. J. Cereb. Blood Flow Meta- hol. 11:879-883: 1991.
King, D. L.; King. D. L. Jr.; Shao, M. Y-C. Three-dimensional spatial registration and interactive display of position and orienta- tion of real-time ultrasound images. J. Ultrasound Med. 9:525- 532: 1990.
Kitabatake. A.; Tanouchi. J.; Yoshida, Y.; Masuyama, T.; Uematsu. M.; Kamada. T. Quantitative colour flow imaging to measure the two-dimensional distribution of blood flow velocity and the flow rate. Japanese Circ. J. 54304-308; 1990.
Lantz. B. M. T.: Holcroft. J. W.; Foerster, J. M.: Link. D. P.; Reid, M. H. Determination of blood flow through artetiovenous fistulae and shunts. Acta Radiol. Diag. 20:727-736; 1979.
Meyd. C. J.; Abu-Shakra, S.; Bleeker. M. L. Carotid high-low flow ratio most accurately predicts significant stenosis. Arch. Neurol. 49:864-869: 1992.
Mills, P. H.: Fuchs, H. 3D ultrasound display using optical tracking. IEEE Proceedings of the first conference on visualization in hio- medical computing. Los Alamitos. CA: IEEE Computer Society Press; 1990:490-497.
Moritz. W. E.; Shreve, P. L. A microprocessor-based spatial-locating system for use with diagnostic ultrasound. Proc. IEEE 64:966- 974; 1976.
Nakajima. M.; Kawauchi. A.; Chiba. Y.; Kubota, K.; Watanabe, M. Arteriovenous shunt flow measured by duplex ultrasound system. In: Wagai, T., Fukada, M., eds. Ultrasound in medicine and biology. New York: Excerpta Medica; 1987:229-233.
Patel, D. J.; Greenfield, J. C., Jr.; Austen, W. G.; Morrow. A. G.; Fry. D. L. Pressure-flow relationships in the ascending aorta and femoral artery of man. J. Appl. Physiol. 20:459-463; 1963.
Picot. P. A.: Rickey. D. W.; Mitchell, R.; Rankin. R. N.; Fenster. A. Three-dimensional colour Doppler imaging. Ultrasound Med. Biol. 19:95- 104; 1993.

Rapid volume flow rate estimation using transverse colour 0 P~co-r et al. I209
Picot, P. A.; Embree, P. M. Quantitative volume flow estimation using velocity profiles. IEEE Trans. Ultrason. Ferroelec. Freq. Contr. 41:340-345; 1994.
Raab, F. H.; Blood, E. B.; Steiner, T. 0.; Jones, H. R. Magnetic position and orientation tracking system. IEEE Trans. Aerospace Electron. Syst. 15:709-717; 1979.
Rak, K. M.; Yakes, W. F.; Ray, R. L.; Dreisbach, J. N.: Parker, S. H. MR imaging of symptomatic peripheral vascular malformations. Am. J. Radiol. 159:107-112; 1992.
Rickey, D. W.; Rankin, R. N.; Fenster, A. A velocity evaluation phantom for colour and pulsed Doppler instruments. Ultrasound Med. Biol. 18:479-494; 1992.
Rickey, D. W.; Picot, P. A.; Christopher. D. A.; Fenster, A. A wall-
less vessel phantom for Doppler ultrasound studies. Ultrasound Med. Biol. (in press); 1995.
Uematsu, S. Determination of volume of arterial blood flow by an ultrasonic device. J. Clin. Ultrasound 9:209-216: 1981.
Uematsu. S.: Yang, A.; Preziosi, T. J. Measurement of carotid blood flow in man and its clinical application, Stroke 14:256-266; 1983.
Vander, A. J.; Sherman, J. H.; Luciano, D. S. Human physiology- the mechanisms of body function (4th ed ). New York: McGraw- Hill; 1985.
Wemick, M. M.; Jones. N. B.; Morgon, J. Flexible hydraulic simula- tor for cardiovascular studies. Med. Biol. Eng. Comput. 22:86- 89; 1984.
Related Documents