Rapid quantitative measurement of CMRO 2 and CBF by dual administration of 15 O-labeled oxygen and water during a single PET scan—a validation study and error analysis in anesthetized monkeys Nobuyuki Kudomi, Takuya Hayashi, Noboru Teramoto, Hiroshi Watabe, Naoki Kawachi, Youichirou Ohta, Kyeong Min Kim and Hidehiro Iida Department of Investigative Radiology, Advanced Medical-Engineering Center, National Cardiovascular Center-Research Institute, Fujishirodai, Suita, Osaka, Japan Cerebral blood flow (CBF) and rate of oxygen metabolism (CMRO 2 ) may be quantified using positron emission tomography (PET) with 15 O-tracers, but the conventional three-step technique requires a relatively long study period, attributed to the need for separate acquisition for each of 15 O 2 ,H 2 15 O, and C 15 O tracers, which makes the multiple measurements at different physiologic conditions difficult. In this study, we present a novel, faster technique that provides a pixel-by-pixel calculation of CBF and CMRO 2 from a single PET acquisition with a sequential administration of 15 O 2 and H 2 15 O. Experiments were performed on six anesthetized monkeys to validate this technique. The global CBF, oxygen extraction fraction (OEF), and CMRO 2 obtained by the present technique at rest were not significantly different from those obtained with three-step method. The global OEF (gOEF) also agreed with that determined by simultaneous arterio-sinus blood sampling (gOEF AV ) for a physiologically wide range when changing the arterial PaCO 2 (gOEF ¼ 1.03gOEF AV þ 0.01, Po0.001). The regional values, as well as the image quality were identical between the present technique and three-step method for CBF, OEF, and CMRO 2 . In addition, a simulation study showed that error sensitivity of the present technique to delay or dispersion of the input function, and the error in the partition coefficient was equivalent to that observed for three-step method. Error sensitivity to cerebral blood volume (CBV) was also identical to that in the three-step and reasonably small, suggesting that a single CBV assessment is sufficient for repeated measures of CBF/CMRO 2 . These results show that this fast technique has an ability for accurate assessment of CBF/CMRO 2 and also allows multiple assessment at different physiologic conditions. Journal of Cerebral Blood Flow & Metabolism (2005) 25, 1209–1224. doi:10.1038/sj.jcbfm.9600118; published online 4 May 2005 Keywords: CBF; CMRO 2 ; dual tracer; PET; rapid measurement Introduction Positron emission tomography (PET) allows the quantitative measurement of regional cerebral blood flow (CBF) and the rate of oxygen metabolism (CMRO 2 ), which has enabled us to understand the pathophysiologic basis of cerebrovascular disorders. These measurements are achieved using a protocol involving separate PET scans, one after the admin- istration of each of three distinct 15 O-labeled radio- active tracers: H 2 15 O or C 15 O 2 for CBF, 15 O 2 for CMRO 2 , and C 15 O for cerebral blood volume (CBV) (Frackowiak et al, 1980a, b; Mintun et al, 1984; Lammertsma and Jones, 1983). However, the com- plex nature of this procedure and its relatively long protocol often limit its applicability and also makes it difficult to perform at different physiologic conditions. Quantitative images of CBF and CMRO 2 created with PET are calculated based on a single-tissue compartment model of oxygen and water kinetics Received 13 May 2004; revised 19 December 2004; accepted 12 January 2005; published online 4 May 2005 Correspondence: Dr N Kudomi, Department of Investigative Radiology, Advanced Medical-Engineering Center, National Cardio- vascular Center-Research Institute, 5-7-1, Fujishirodai, Suita, Osaka 565-8565, Japan. E-mail: [email protected] The present work was supported by the Program for Promotion of Fundamental Studies in Health Science of the Organization for Pharmaceuticals and Medical Devices Agency of Japan (PMDA), by Kobe Cluster, Ministry of Education, Culture, Sports, Science, and Technology (MEXT), and by the Japan Cardiovascular Research Foundation. Journal of Cerebral Blood Flow & Metabolism (2005) 25, 1209–1224 & 2005 ISCBFM All rights reserved 0271-678X/05 $30.00 www.jcbfm.com

Welcome message from author
This document is posted to help you gain knowledge. Please leave a comment to let me know what you think about it! Share it to your friends and learn new things together.
Transcript

Rapid quantitative measurement of CMRO2 andCBF by dual administration of 15O-labeled oxygenand water during a single PET scan—a validationstudy and error analysis in anesthetized monkeys
Nobuyuki Kudomi, Takuya Hayashi, Noboru Teramoto, Hiroshi Watabe, Naoki Kawachi,Youichirou Ohta, Kyeong Min Kim and Hidehiro Iida
Department of Investigative Radiology, Advanced Medical-Engineering Center, National CardiovascularCenter-Research Institute, Fujishirodai, Suita, Osaka, Japan
Cerebral blood flow (CBF) and rate of oxygen metabolism (CMRO2) may be quantified using positronemission tomography (PET) with 15O-tracers, but the conventional three-step technique requires arelatively long study period, attributed to the need for separate acquisition for each of 15O2, H2
15O,and C15O tracers, which makes the multiple measurements at different physiologic conditionsdifficult. In this study, we present a novel, faster technique that provides a pixel-by-pixel calculationof CBF and CMRO2 from a single PET acquisition with a sequential administration of 15O2 and H2
15O.Experiments were performed on six anesthetized monkeys to validate this technique. The globalCBF, oxygen extraction fraction (OEF), and CMRO2 obtained by the present technique at rest werenot significantly different from those obtained with three-step method. The global OEF (gOEF) alsoagreed with that determined by simultaneous arterio-sinus blood sampling (gOEFA�V) for aphysiologically wide range when changing the arterial PaCO2 (gOEF¼ 1.03gOEFA�V þ 0.01,Po0.001). The regional values, as well as the image quality were identical between the presenttechnique and three-step method for CBF, OEF, and CMRO2. In addition, a simulation study showedthat error sensitivity of the present technique to delay or dispersion of the input function, and theerror in the partition coefficient was equivalent to that observed for three-step method. Errorsensitivity to cerebral blood volume (CBV) was also identical to that in the three-step and reasonablysmall, suggesting that a single CBV assessment is sufficient for repeated measures of CBF/CMRO2.These results show that this fast technique has an ability for accurate assessment of CBF/CMRO2
and also allows multiple assessment at different physiologic conditions.Journal of Cerebral Blood Flow & Metabolism (2005) 25, 1209–1224. doi:10.1038/sj.jcbfm.9600118; published online4 May 2005
Keywords: CBF; CMRO2; dual tracer; PET; rapid measurement
Introduction
Positron emission tomography (PET) allows thequantitative measurement of regional cerebral blood
flow (CBF) and the rate of oxygen metabolism(CMRO2), which has enabled us to understand thepathophysiologic basis of cerebrovascular disorders.These measurements are achieved using a protocolinvolving separate PET scans, one after the admin-istration of each of three distinct 15O-labeled radio-active tracers: H2
15O or C15O2 for CBF, 15O2 forCMRO2, and C15O for cerebral blood volume (CBV)(Frackowiak et al, 1980a, b; Mintun et al, 1984;Lammertsma and Jones, 1983). However, the com-plex nature of this procedure and its relatively longprotocol often limit its applicability and also makesit difficult to perform at different physiologicconditions.
Quantitative images of CBF and CMRO2 createdwith PET are calculated based on a single-tissuecompartment model of oxygen and water kinetics
Received 13 May 2004; revised 19 December 2004; accepted 12January 2005; published online 4 May 2005
Correspondence: Dr N Kudomi, Department of InvestigativeRadiology, Advanced Medical-Engineering Center, National Cardio-vascular Center-Research Institute, 5-7-1, Fujishirodai, Suita,Osaka 565-8565, Japan.E-mail: [email protected]
The present work was supported by the Program for Promotion of
Fundamental Studies in Health Science of the Organization for
Pharmaceuticals and Medical Devices Agency of Japan (PMDA),
by Kobe Cluster, Ministry of Education, Culture, Sports, Science,
and Technology (MEXT), and by the Japan Cardiovascular
Research Foundation.
Journal of Cerebral Blood Flow & Metabolism (2005) 25, 1209–1224& 2005 ISCBFM All rights reserved 0271-678X/05 $30.00
www.jcbfm.com
(Frackowiak et al, 1980a, b; Mintun et al, 1984;Lammertsma and Jones, 1983). The steady-statemethod (Subramanyam et al, 1978; Lammertsmaet al, 1982; Correia et al, 1985; Okazawa et al,2001a, b) has been used in a number of studies inwhich quantitative images are estimated from dataacquired while in the steady state reached duringcontinuous inhalation of C15O2 and 15O2. Thismethod can be used using a simple procedure andmathematical formula, but still has several limita-tions. A prolonged data-acquisition period (approxi-mately 1 h) is required, and the procedure issensitive to error sources such as statistical noiseand tissue heterogeneity (Lammertsma et al, 1982;Correia et al, 1985). An additional drawback is therelatively high level of radiation exposure requiredto reach the steady state.
An alternative autoradiographic method (ARG)using only short administration times for each of thethree tracers (three-step ARG) has been developed(Mintun et al, 1984) and subsequently simplifiedand optimized (Iida et al, 1993; Sadato et al, 1993;Hatazawa et al, 1995; Shidahara et al, 2002; Hattoriet al, 2004). Cerebral blood flow images can beobtained by an H2
15O autoradiographic method,using a PET counts-versus-CBF nomogram, whichfollows a simple look-up table procedure (Raichleet al, 1983; Herscovitch et al, 1983; Kanno et al,1987); the quantitative accuracy of these images isimproved when input delay and dispersion arecorrected (Iida et al, 1986, 1988). Rate of oxygenmetabolism and the oxygen extraction fraction(OEF) can be estimated using data acquired during15O2 inhalation, but must be corrected for clearanceof radioactivity associated with CBF (Mintun et al,1984), CBV, and the level of recirculating radioactivewater (Iida et al, 1993). Although the total timerequired for three-step ARG is less than that of thesteady-state method, it still requires at least half anhour, with a large part of this period spent waitingfor radioactive decay between PET scans (more than10 mins).
There have been other attempts to obtain CBF andCMRO2 images more rapidly (Huang et al, 1986;Holden et al, 1988; Meyer et al, 1987; Ohta et al,1992; Ho and Feng, 1999). Mathematical refinementhas allowed images to be generated from data from asingle scan alone on a bolus inhalation of 15O2. Thequality of the image suffers, however, from statis-tical noise because of the lack of predictability of themultiple parameters of CBF, CMRO2, and the arterialvascular compartment (V0) and the limited acquisi-tion time (Meyer et al, 1987; Ohta et al, 1992).Therefore, this technique has not been generallyapplied in clinical settings, but has been usedprimarily for research purposes (Fujita et al, 1999;Vafaee and Gjedde, 2000; Okazawa et al, 2001a, b;Mintun et al, 2002).
In this study, we have developed a novel, rapidPET technique called the dual-tracer ARG method(DARG) that involves a single session of PET scan
during which two tracers of 15O2 and H215O are
sequentially administered. This approach can short-en the total study period for the CBF and CMRO2
measurement as compared with the three-step ARG,while maintaining the image quality and quantita-tive accuracy. A new formulation was derived sothat the residual radioactivity of the first tracer isaccounted for in the subsequent portion of thedynamic PET scan. We have then tested feasibilityof this technique in an experiment on six anesthe-tized monkeys. A set of simulation was alsoperformed to evaluate error sensitivity to possibleerror sources.
Materials and methods
Theory
The DARG protocol consists of a single dynamic PET scanconducted during the sequential administration of H2
15Oand 15O2 in a short time interval. To calculate values ofCBF, OEF, and CMRO2 from these data, a new mathema-tical formula was derived based on a previously describedsingle-tissue compartment model (Mintun et al, 1984).The formula was redesigned to be applicable to dataobtained after the administration of tracers in either order(H2
15O injection followed by 15O2 inhalation (H215O–15O2) or
15O2 inhalation followed by H215O injection (15O2–H2
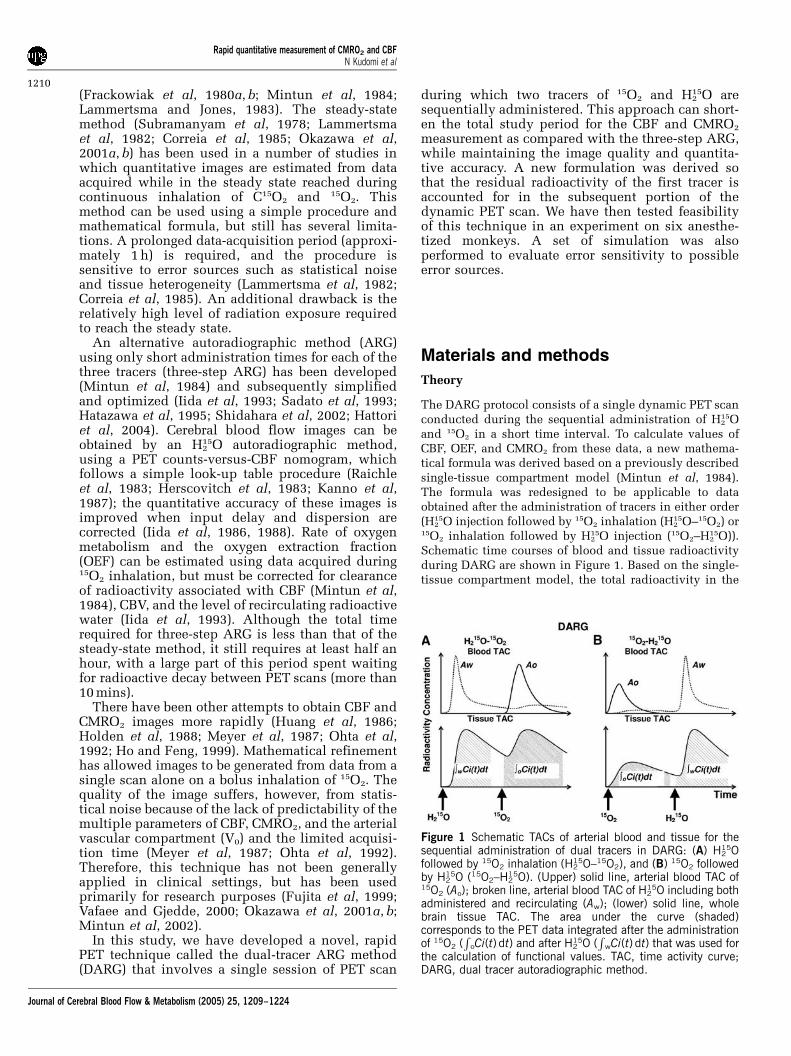
15O)).Schematic time courses of blood and tissue radioactivityduring DARG are shown in Figure 1. Based on the single-tissue compartment model, the total radioactivity in the
Figure 1 Schematic TACs of arterial blood and tissue for thesequential administration of dual tracers in DARG: (A) H2
15Ofollowed by 15O2 inhalation (H2
15O–15O2), and (B) 15O2 followedby H2
15O (15O2–H215O). (Upper) solid line, arterial blood TAC of
15O2 (Ao); broken line, arterial blood TAC of H215O including both
administered and recirculating (Aw); (lower) solid line, wholebrain tissue TAC. The area under the curve (shaded)corresponds to the PET data integrated after the administrationof 15O2 (
RoCi(t) dt) and after H2
15O (R
wCi(t) dt) that was used forthe calculation of functional values. TAC, time activity curve;DARG, dual tracer autoradiographic method.
Rapid quantitative measurement of CMRO2 and CBFN Kudomi et al
1210
Journal of Cerebral Blood Flow & Metabolism (2005) 25, 1209–1224
tissue, Ci(t) in Bq/mL, after 15O2 or H215O administration
can be expressed as
CiðtÞ ¼ fAwðtÞ � e�ðf=pÞt þ EfAoðtÞ � e�ðf=pÞt þ VBRHct
�ð1 � EFvÞAoðtÞ þ VAAwðtÞ ð1Þ
where Ao(t) and Aw(t) denote the arterial input functionfor oxygen and water in Bq/mL, f is CBF in mL 100/g min,E is the OEF, p is the blood/brain partition coefficientfor water in mL/g, VB or VA is the total or arterialpart of cerebral blood volume, respectively, RHct is thesmall-to-large vessel hematocrit ratio, Fv is the effectivevenous fraction, and # indicates the convolution integral.Note that equation (1) describes the kinetics of radio-activity and is valid after the administration of either 15Oor H2
15O or after the administration of both. The first termon the right-hand side describes the amount of waterentering the tissue, including both administrated andrecirculating water. The second represents the amount ofoxygen that enters the tissue and is immediately metabo-lized to water. The third and the fourth terms express theradioactivity of 15O2 and H2
15O in blood vessels, respec-tively. In the present study, we assumed that the last termis negligibly small compared with the radioactivity intissue according to the previous study (Iida et al, 2000).Then, we have
CiðtÞ ¼ fAwðtÞ � e�ðf=pÞt þ EfAoðtÞ � e�ðf=pÞt
þ VBRHctð1 � EFvÞAoðtÞ ð2Þ
To produce pixel-by-pixel functional maps using a look-up table procedure, the formula was rearranged as follows.Equation (2) was integrated for the periods of H2
15O (R
wdt)and 15O2 administration (
ROdt):Z
W
CiðtÞdt ¼ f
Z
W
Aw�e�ðf=pÞt dt þ Ef
Z
W
Ao�e�ðf=pÞt dt
þ VBRHctð1 � EFvÞZ
W
AoðtÞdt ð3Þ
E ¼R
O CiðtÞ � fR
O Aw � e�ðf=pÞt dt � VBRHct
RO AO dt
fR
O Aw � e�ðf=pÞt dt � VBRHctFvR
O AO dtð4Þ
In these equations,R
wCi(t)dt andR
oCi(t)dt correspond toacquired PET data summed after H2
15O and 15O2 adminis-tration, respectively (Figure 1). Note that the radioactivityof the first tracer remaining during data acquisition for thesecond tracer is already modeled in each equation. In thecase of 15O2–H2
15O, the amount of residual radioactivityfrom 15O2 in data obtained during the H2O segment(equation (3)) is expressed in the second and third termson the right-hand side. Likewise, for H2
15O–15O2, theresidual amount of H2
15O found in the data for the O2
segment (equation (4)) is represented by the first term onthe right-hand side. Equation (4) can be rewritten asfollows:
E ¼R
O CiðtÞ � fR
O Aw � e�ðf=pÞt dt � VBRHct
RO AO dt
fR
O AO � e�f=pt dt � VBRHctFvR
O AO dtð5Þ
Substituting equation (5) into equation (3), we obtainZ
W
CiðtÞdt ¼f
Z
W
Aw � e�ðf=pÞt dt þ VBRHct
Z
W
AoðtÞdt
þ ðfZ
W
Ao�e�ðf=pÞtdt � VBRHctFv
Z
W
AoðtÞdt
¼R
O CiðtÞ�fR
O Aw �e�ðf=pÞt dt�VBRHct
RO AO dt
fR
O AO � e�ðf=pÞt dt � VBRHctFvR
O AO dt
ð6ÞUsing equation (6), f can be estimated using a look-up
table procedure based on the observed PET data (R
wCi(t)dtand
RoCi(t)dt, VB) and the blood input functions (Ao and
Aw), as long as fixed values are assumed for P, Fv, and RHct.Next, E can be calculated using equation(5). Rate ofoxygen metabolism is then calculated from the estimated fand E, and the measured arterial oxygen content.
Positron Emission Tomography Experiments in anAnimal System
We measured CBF and CMRO2 using PET in six normalmonkeys (Macaca fascicularis; body weight¼ 5 kg) understable anesthesia. The PET protocol for this study wasdesigned to validate the global values of CBF (gCBF),CMRO2 (gCMRO2), and OEF (gOEF) generated usingDARG by comparing them to those obtained using three-step ARG and the gOEF value measured by simultaneousarterial and cerebral sinus (A–V) blood sampling(gOEFA�V). In all six animals, we performed three-stepARG, two sets of DARG (H2
15O–15O2 and 15O2–H215O), and
A–V sampling during normocapnia (Figure 2). In three ofthe six animals, A–V sampling and DARG with 15O2–H2
15Owere performed simultaneously not only during normo-capnia (PaCO2D40 mm Hg) but also while PaCO2 wasgraded (by changing the respiratory rate) at different threelevels: hypocapnia (PaCO2o33 mm Hg), mild hypercapnia(45oPaCO2 o50 mm Hg), and deep hypercapnia (Pa-CO2450 mm Hg). Animals were maintained and handledin accordance with the guidelines for animal researchoutlined in Human Care and Use of Laboratory Animals(Rockville, National Institute of Health/Office for Protec-tion from Research Risks, 1996). The study protocol wasapproved by Subcomittee for Laboratory Animal Welfare,National Cardiovascular Center.
Anaesthesia was induced with ketamine (10 mg/kg,intramuscularly) and maintained by intravenous propofol
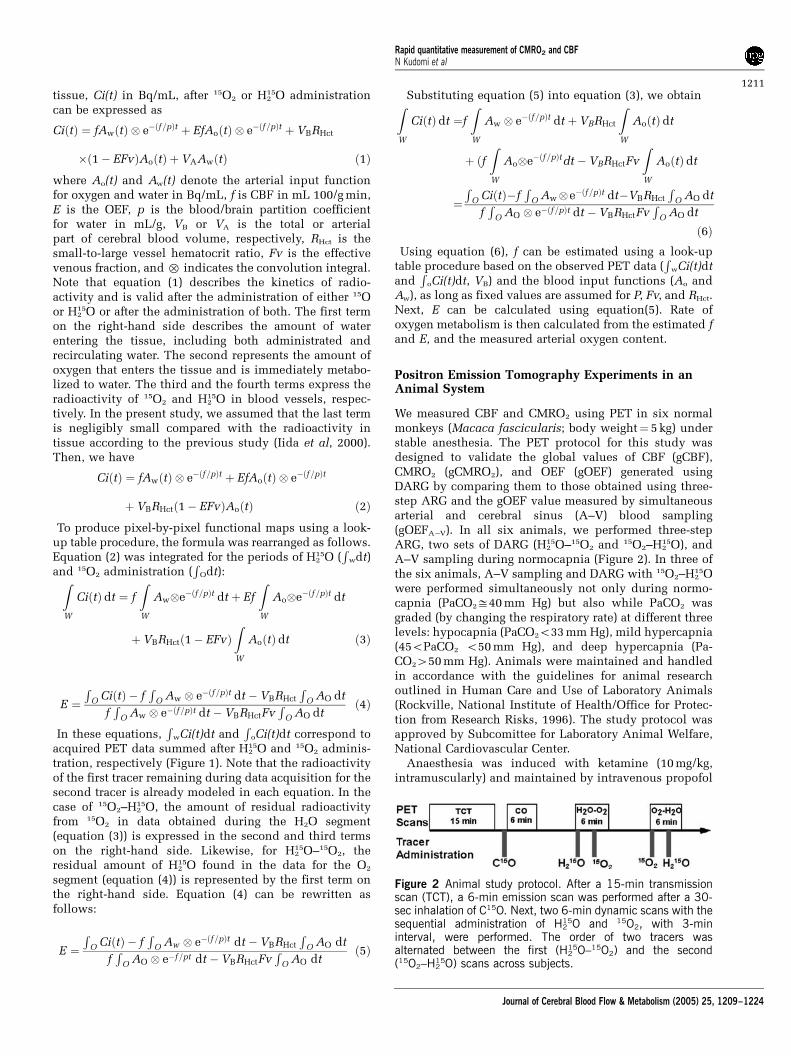
Figure 2 Animal study protocol. After a 15-min transmissionscan (TCT), a 6-min emission scan was performed after a 30-sec inhalation of C15O. Next, two 6-min dynamic scans with thesequential administration of H2
15O and 15O2, with 3-mininterval, were performed. The order of two tracers wasalternated between the first (H2
15O–15O2) and the second(15O2–H2
15O) scans across subjects.
Rapid quantitative measurement of CMRO2 and CBFN Kudomi et al
1211
Journal of Cerebral Blood Flow & Metabolism (2005) 25, 1209–1224

(4 mg/kg h) and vecuronium (0.05/mg kg h) during theexperiment. Animals were intubated and their respirationwas controlled by an anaesthetic ventilator (Cato; Drager,Germany) providing a gas mixture of 24% O2 and 76% N2.A catheter was inserted into the femoral artery for bloodsampling and into the anterior tibial vein for injection ofH2
15O and anaesthetic agents. Arterial blood pressure,heart rate, and endotidal CO2 levels were continuouslymonitored throughout the procedure. Arterial blood gasanalysis was performed to measure the O2 content and thePaCO2 level. To assist in data analysis, all animalsunderwent 3D T1-weighted magnetic resonance imaging(MRI) (IR-FSPGR, TR¼ 9.4 ms, TE¼ 2.1 ms, TI¼ 600 ms)using a 3 T MRI scanner (Signa LX VAH/I, GE, Milwaukee,USA) in advance of the PET study.
Positron emission tomography acquisition was per-formed in 2D mode using a PET scanner (ECAT HR,Siemens-CTI, Knoxville, USA). After a 900-sec transmis-sion scan with a rotating 68Ge–68Ga rod source, thedynamic scan began after the inhalation of C15O. After10 mins of radioactivity decay, 15O2 (2200 MBq) and thenH2
15O (370 MBq) were administered in sequence, each for a3-min interval during a 6-min dynamic PET scan(H2
15O–15O2) consisting of 63 frames of gradually increas-ing individual durations (24� 5, 6� 10, 30� 5, and3� 10 secs). We intended to increase the number of 5-secframes during the second tracer-appearance period,because of possible delay of the tracer administrationattributed to the synthesizer and/or injector. After 10 mins,a scan for 15O2–H2
15O was performed using the samedynamic data acquisition protocol. The order of 15O2–H2
15Oor H2
15O–15O2 was randomized across subjects. The 15O2
was inhaled for 20 secs in a slow bolus supplied via apolyethylene tube connected to the ventilator, and theH2
15O was injected over a period of 30 secs via the anteriortibial vein, accompanied by an additional bolus of salinefor flushing. For the three animals that received variationsin PaCO2, at least 30 mins were allotted to reach a steady-state PaCO2, after which 15O2–H2
15O DARG was performed.To obtain an arterial time–activity curve, arterial blood
was withdrawn continuously from the femoral arterythrough a catheter (0.6-mm inner diameter) using a syringepump (Harvard Apparatus, model 55–2309) with a with-draw speed of 0.45 mL/min, and the whole-blood radio-activity concentration was measured using a GSO inputfunction monitor system (Kudomi et al, 2003). We alsomeasured the radioactivity concentration in plasma toestimate the 15O-labeled water concentration produced asa metabolite of 15O2, for which 0.2 mL of blood wascentrifuged after manual sampling at eight time points: 30,50, 70, 90, 110, 130, 160, and 190 secs after 15O2
inhalation. The radioactivity for plasma and whole bloodwas measured by a well counter (NaI(Tl) scintillationcounter, Aloka, Japan) cross-calibrated to the PET scan,and expressed as Bq/mL.
Arterial–Sinus Blood Sampling
We performed arterial–sinus blood sampling to obtain aglobal OEF (gOEFA–V) based on the Kety–Schmidt method
(Kety and Schmidt, 1948). The sinus blood was sampledthrough a 3F catheter, which was introduced via thefemoral vein to the cerebral sinus using a high-resolutiondigital X-ray imaging system (GE Medical System, USA).To avoid mixing with venous blood draining fromextracranial tissues, the tip of the catheter was carefullyplaced at the angle of the cerebral sigmoid and transversesinuses, and its position was confirmed at the conclusionof each PET protocol. We sampled 0.2 mL of arterialand sinus blood simultaneously during each DARGPET scan and measured their oxygen content (CaO2 andCvO2, respectively). The gOEFA�V was calculated asfollows:
gOEFA�V ¼ ðCaO2 � CvO2Þ=CaO2
Data Processing
Corrections for dead time, the radioactive decay, andnormalization of detectors were performed using thesinogram-based method described previously (Shidaharaet al, 2002). Part of the corrected sinogram for theH2
15O–15O2 or 15O2–H215O scan was summed for each period
of labeled water (120 secs from the start time of waterinjection, or effectively 90 secs after the rise time of thetissue TAC), and oxygen intake (180 secs from the starttime of oxygen inhalation). The summed images werecorrected for attenuation using transmission data, andwere reconstructed using the filtered-back-projectionmethod with a 4-mm Gaussian filter. A reconstructedimage consisted of a 128� 128� 47 matrix with a pixelsize of 1.1� 1.1� 3.38 mm. In addition, dynamic sino-grams for the H2
15O–15O2 and 15O2–H215O scans were
reconstructed with same conditions as above and usedfor a nonlinear least-squares fitting (NLF) analysis.
To correct for the delay between the brain and bloodTACs, the whole brain TAC was obtained from thecorrected dynamic sinograms (Shidahara et al, 2002).The delay was estimated based on a method previouslydescribed (Iida et al, 1988). Briefly, three parameters, K1,k2, and delay (Dt), were determined using whole brain andblood TACs around the period of H2
15O injection with anNLF procedure (Iida et al, 1988; Shidahara et al, 2002).The dispersion time constant was fixed at 3 secs (Shida-hara et al, 2002).
To compute CBF, OEF, and CMRO2 as described above,it is necessary to obtain separated 15O2 and H2
15O inputfunctions (Ao and Aw) from the measured arterial TAC,because the arterial blood TAC measured during thesecond phase of the scan reflects not only the radioactivityof the second tracer but also the residual activity of thefirst. For the H2
15O–15O2 protocol, we first estimated theTAC for the residual radioactivity from the first tracer(H2
15O) administration remaining during the second periodby extrapolating the arterial TAC of the first phase by amodel of input function (Kudomi et al, 2002). We thensubtracted it from the measured total arterial TAC in thesecond phase to obtain a TAC for the second tracer.Second, the metabolic product (recirculating water)following 15O2 administration was estimated using theplasma radioactivity measured during the phase of 15O2
Rapid quantitative measurement of CMRO2 and CBFN Kudomi et al
1212
Journal of Cerebral Blood Flow & Metabolism (2005) 25, 1209–1224

and a fitting procedure described previously (Huang et al,1991; Iida et al, 1993). Next, it was added to theextrapolated residual H2
15O TAC to obtain a TAC forH2
15O (Aw), and also subtracted from the second TAC toobtain a pure TAC for 15O2 (Ao). For the 15O2–H2
15Oprotocol, we first obtained the TAC for recirculating waterduring the first phase of 15O2 administration as describedabove, and then separated the arterial TAC into pure TACsfor 15O2 (Ao) and for H2
15O (Aw) during the first phase.Second, we estimated the TAC for the residual radio-activity of 15O2 during the second phase by extrapolatingthe estimated arterial 15O2 TAC from the first phase asdescribed above, and then obtained Ao and Aw. Thepreliminary validation of this procedure is describedelsewhere (Kudomi et al, 2002).
The C15O sinogram data summed over 240 secs begin-ning at 120 secs after C15O inhalation, and reconstructed.The CBV images were then generated from the C15Oimages using the blood radioactivity concentrationaveraged over the scan period, with an assumptionof a peripheral-to-central hematocrit ratio (RHct) of 0.85(Phelps et al, 1979), a blood density of 1.06 g/mL, and abrain-tissue density of 1.04 g/mL (Lammertsma et al,1987).
A set of CBF, OEF, and CMRO2 images were calculatedaccording to the DARG technique, using a set of integratedimages (
RwCi(t)dt and
RoCi(t)dt), a CBV image (VB), and
TACs for H215O (Aw) and 15O2 (Ao) based on the formula
described above, assuming P¼ 0.8 mL/g (Iida et al, 1991)and Fv¼ 0.835 (Mintun et al, 1984). Corresponding imageswere also calculated according to the three-step ARGusing a procedure previously described (Shidahara et al,2002). Briefly, the CBF image was calculated using thereconstructed image for H2
15O, the initial part of theH2
15O–15O2 scan (0 to 120 secs,R
wCi(t)dt), and the corre-sponding arterial TAC using a look-up-table procedure.Similarly, the OEF and CMRO2 images were calculatedusing the 15O2 part of the 15O2–H2
15O scan (0 to 180 secs,RoCi(t)dt), with corrections for recirculating water and the
CBV compartment. Because C15O PET was performed onlyonce for each animal, the resulting CBV image was used tocalculate all DARG and three-step ARG images acquiredduring normocapnia and variable PaCO2 conditions.
Figure 3 Example of blood and tissue TACs from DARG, inwhich administration of 15O2 (2,200 MBq) was followed byH2
15O (370 MBq) with an interval of 3 mins during a 6-min PETscan. (A) Measured and estimated arterial TACs. Black dots,measured arterial TAC; solid line, estimated TAC of 15O2 (Ao)generated by subtracting 15O-labeled recirculating water fromthe observed value; broken line, estimated TAC of 15O-labeledwater (Aw) including recirculating and administered water (seedata processing in Materials and methods). (B) Measured andpredicted tissue TACs. Black dots, whole brain tissue TACmeasured by PET. Solid line, predicted tissue TAC estimatedfrom Ao and Aw with calculated functional values in a wholebrain ROI. The area under each curve (shaded) corresponds tothe PET data integrated after the administration of 15O2
(R
oCi(t) dt) and then after H215O (
RwCi(t) dt) that was used for
the calculation of functional values (see Theory section inMaterials and methods). Calculated functional values in thisROI are listed below, and TACs are shown without decaycorrection. TAC, time activity curve; DARG, dual tracerautoradiographic method.
Table 1 Global values of CBF (gCBF), OEF (gOEF), and CMRO2 (gCMRO2) calculated by three-step ARG and DARG, and gOEFcalculated by arterial-venous difference of oxygen contents
Three-step ARG DARG A–V
H215O–15O2
15O2–H215O
gCBF(mL 100/g min) 3079 3079 32711 —
gOEF 0.5170.07 0.5470.04 0.5670.06 0.5470.06
gCMRO2
(mL 100/g min) 2.770.4 2.770.2 2.970.4 —
Three-step ARG, conventional three-step autoradiographic method; DARG, dual tracer autoradiographic method; A–V, arterial–inus blood sampling method.Values are presented as mean7s.d. (n¼6).
Rapid quantitative measurement of CMRO2 and CBFN Kudomi et al
1213
Journal of Cerebral Blood Flow & Metabolism (2005) 25, 1209–1224
Data Analysis
To assess the consistency of the calculated physiologicvalues, we obtained and analyzed the global and regionalbrain values separately. Magnetic resonance imagingimages were de-skulled and coregistered to the CBF PETimage by a rigid body transformation using statisticparametric mapping software (SPM 99, Wellcome Depart-ment of Neurology, London, UK). A region of interest(ROI) for the whole brain was drawn in every slice on thecoregistered MRI images, using the GpetView (http://homepage2.nifty.com/peco/gpetview/gpetview.html) soft-ware, and transferred to all PET images obtained by three-step ARG and DARG (H2
15O–15O2 and 15O2–H215O) to
determine gCBF, gOEF, and gCMRO2. We compared eachvariable between DARG and three-step ARG, and the gOEFvalue was compared with that of gOEFA�V; all data arepresented as means7s.d. The paired t-test was applied toevaluate differences between methods, and Po0.05 wasconsidered statistically significant. We plotted gOEF fromDARG and gOEFA�V acquired during varied PaCO2 againsteach other and performed regression analysis.
Regional values for CBF and CMRO2 were obtainedin 24 circular ROIs of 5-mm in diameter: two in frontal,
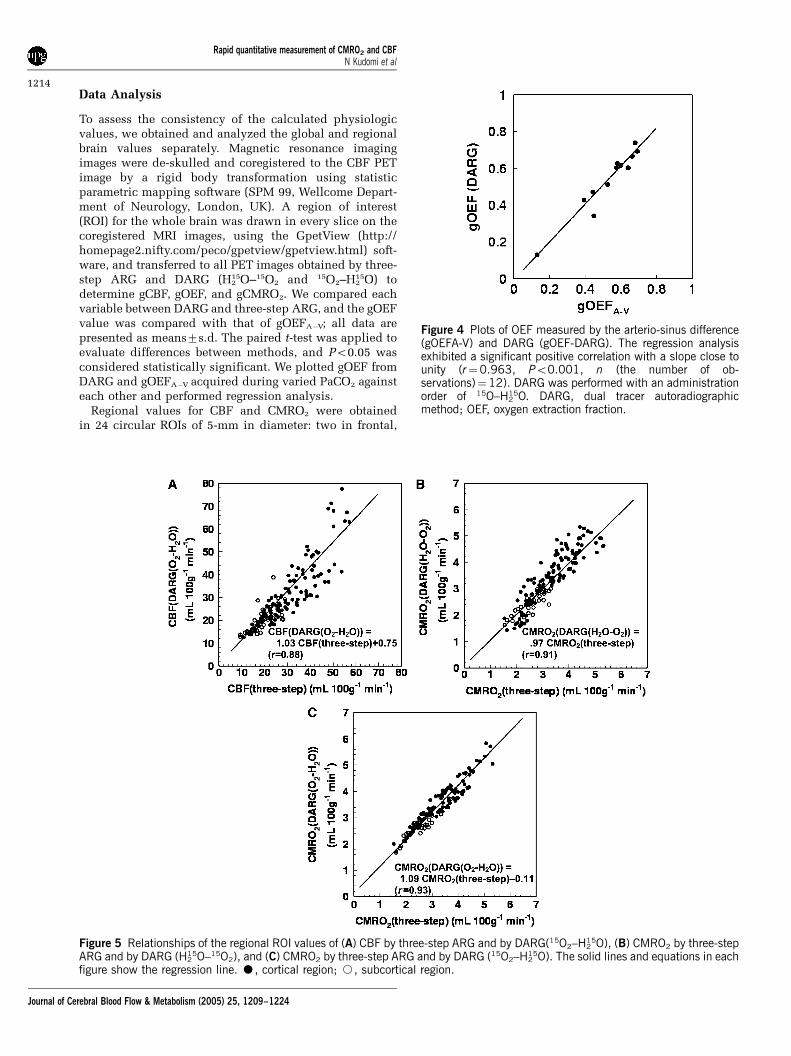
Figure 4 Plots of OEF measured by the arterio-sinus difference(gOEFA-V) and DARG (gOEF-DARG). The regression analysisexhibited a significant positive correlation with a slope close tounity (r¼0.963, Po0.001, n (the number of ob-servations)¼12). DARG was performed with an administrationorder of 15O–H2
15O. DARG, dual tracer autoradiographicmethod; OEF, oxygen extraction fraction.
Figure 5 Relationships of the regional ROI values of (A) CBF by three-step ARG and by DARG(15O2–H215O), (B) CMRO2 by three-step
ARG and by DARG (H215O–15O2), and (C) CMRO2 by three-step ARG and by DARG (15O2–H2
15O). The solid lines and equations in eachfigure show the regression line. K, cortical region; J, subcortical region.
Rapid quantitative measurement of CMRO2 and CBFN Kudomi et al
1214
Journal of Cerebral Blood Flow & Metabolism (2005) 25, 1209–1224

three in temporal, two in parietal, two in occipitalcortical regions, and three in subcortical regions; datawere recorded for each hemisphere. Although a great
attention has been made in selecting small ROIs, thepartial volume effect may not be minimized attributed tothe small size of the brain in monkeys (approximately
Table 2 Regional values in DARG and NLF
Dataset Region of interest CBF(mL 100/g min) OEF CMRO2 (mL 100/g min) p (mL/g)
DARG NLF DARG NLF DARG NLF NLF
H215O–15O2
Frontal Cx. 2776 2976 0.5170.10 0.5870.09 2.570.6 2.570.6 0.8170.11Temporal Cx. 42715 4079 0.5670.10 0.5870.07 3.070.8 2.870.8 0.7170.11Parietal Cx. 39713 32710 0.5170.10 0.5770.15 2.670.9 2.470.9 0.8370.08Occipital Cx. 37711 40715 0.4670.10 0.5670.07 3.571.6 2.970.9 0.7670.11Sub-Cx 2376 2778 0.6070.10 0.5970.06 2.070.4 2.070.8 0.6970.17
15O2–H215O
Frontal Cx. 3076 3076 0.5770.10 0.6070.09 3.170.4 3.270.3 0.7270.14Temporal Cx. 42715 37711 0.5870.10 0.5670.09 3.471.7 2.970.2 0.9070.11Parietal Cx. 41716 36710 0.6070.10 0.6170.09 3.470.8 3.370.4 0.9070.15Occipital Cx. 33714 3179 0.5870.10 0.5770.09 2.770.3 2.770.8 0.7670.18Sub-Cx 2677 2776 0.6170.10 0.6370.09 2.670.3 2.470.56 0.7070.11
NLF, nonlinear fitting method; DARG, dual ARG method; Cx., cortex; p, partition coefficient.For both H2
15O–15O2 and 15O2–H215O data sets, CBF, OEF, and CMRO2 values for each region did not differ between NLF and DARG (Paired t-test, P40.05).
Values are presented as mean7s.d. (n¼6).
Figure 6 Functional images from one monkey obtained by (a) three-step ARG, (b) DARG H215O–15O2, and (C) DARG 15O2–H2
15O.Images were axially sectioned at the level of the (A) lateral ventricle, (B) thalamus, and (C) cerebellum. Coregistered T1-weighted MRIimages are also presented at the upper left.
Rapid quantitative measurement of CMRO2 and CBFN Kudomi et al
1215
Journal of Cerebral Blood Flow & Metabolism (2005) 25, 1209–1224

50 mm in size). Regression analysis was performedcomparing the values of CBF and CMRO2 betweenthree-step ARG and either DARG sequence. To testthe validity of using a fixed p in the DARG protocol,regional CBF, OEF, and CMRO2 values were alsocalculated using the NLF technique. Using a Gaussian–Newton algorithm, three parameters of f, E, and pwere fitted to equation (2) using arterial input functionsfor H2O and O2, as determined previously. The CBVwas fixed at each ROI using the C15O scan value, and allother parameters were fixed at the same values asdescribed above. Tissue TACs for each region wereextracted by averaging four TACs in frontal regions, sixin temporal regions, four in parietal regions, four inoccipital cortical regions, and six in subcortical ROI; thoseROIs were projected to the dynamic PET images forH2O–O2 and O2H2O. In each region, CBF, OEF, andCMRO2 values were computed by NLF and DARG andcompared using a paired t-test. All data are presented asmeans7s.d., and Po0.05 was considered statisticallysignificant.
Error Analyses in Simulation
Error propagation was analyzed for four factors: delay anddispersion in arterial TAC, blood/tissue partition coeffi-cient (P), and cerebral blood volume (VB). It is known thatthe measured arterial TAC is delayed and more dispersedrelative to the true input TAC in the brain because of thetime it takes for blood to traverse the peripheral artery andcatheter tube before reaching the detector (Iida et al, 1986,1988, 1989, 2000; Lammertsma et al, 1990). Calculation ofCBF using ARG PET always uses a fixed partitioncoefficient throughout the whole brain (ranging 0.8 to0.9 mL/g) and does not evaluate it regionally (Herscovitchand Raichle, 1985; Iida et al, 1989, 1991; Shidahara et al,2002). An error in CBV measured by the PET scan may alsointroduce errors in calculating the cerebral oxygen con-sumption (Mintun et al, 1984; Lammertsma et al, 1987).
Typical arterial input functions for water (Aw) andoxygen (Ao) were obtained from one monkey in this studyand used after simulation as the true arterial TACs. Usingthese arterial TACs and equation (2), tissue TACs for water
Figure 7 Error propagation from the error in input delay time to the functional parameters: (A) CBF, (B) OEF, and (C) CMRO2. Positiveand negative values of error in delay time indicate over- and undercorrection of delay time, respectively, whereas zero (secs) in thetransverse axis corresponds to when the delay of measured artery input was accurately corrected to the true cerebral arterial input.Three-step ARG, conventional three-step autoradiographic method; H2
15O–15O2, DARG with H215O followed by 15O2; 15O2–H2
15O,DARG with 15O2 followed by H2
15O; DARG, dual tracer autoradiographic method.
Rapid quantitative measurement of CMRO2 and CBFN Kudomi et al
1216
Journal of Cerebral Blood Flow & Metabolism (2005) 25, 1209–1224
and oxygen were created using known values for normalbrain tissue (CBF¼ 50 mL 100/g min, OEF¼ 0.4,CBV¼ 0.04 mL/g, P¼ 0.8 mL/g, Fv¼ 0.835, andRHct¼ 0.85). These TACs were used as true tissue TACsfor three-step ARG. True tissue TACs for DARG werecreated by adding two tissue TACs for each tracer with atime lag of 3 mins, simulating the interval of administra-tion. To simulate the error propagation resulting fromerrors in estimated delay time and dispersion timeconstants, the error in delay time or dispersion time wasvaried from �4 to 4 secs, where a positive error representsan overcorrection of delay time or dispersion timeconstant, and a negative error represents undercorrection,as described previously (Iida et al, 2000). Values for CBF,OEF, and CMRO2 were calculated based on three-stepARG and DARG. To shift the dispersion time constants,the true arterial TAC was convoluted or deconvolutedwith a simple exponential (Iida et al, 1986; Kanno et al,1987). For simulating the error in the values of p and VB,the value of p was varied from 0.7 to 0.9 mL/g, and that ofVB from 0.02 to 0.06 mL/g; in each situation, tissue TACs
were created and CBF, OEF, and CMRO2 values werecalculated using these TACs, assuming P¼ 0.8 mL/g andVB¼ 0.04 mL/g. Errors in these calculated values arepresented as percentage differences from the normalvalues for each DARG and three-step ARG. In DARG,both orders of tracer administration were simulated.
Results
Animal Experiments
Figure 3 shows an example of measured andestimated blood TACs (Ao and Aw) and whole brainTAC in one 15O2–H2
15O DARG PET experiment. Inthis experiment, 15O2 (2,200 MBq) and H2
15O(370 MBq) were sequentially administrated in thatorder. As shown in this figure, the present methodfor extracting Aw and Ao TACs from measurements ofarterial blood TAC accurately predicted the timecourse of the whole brain TAC.
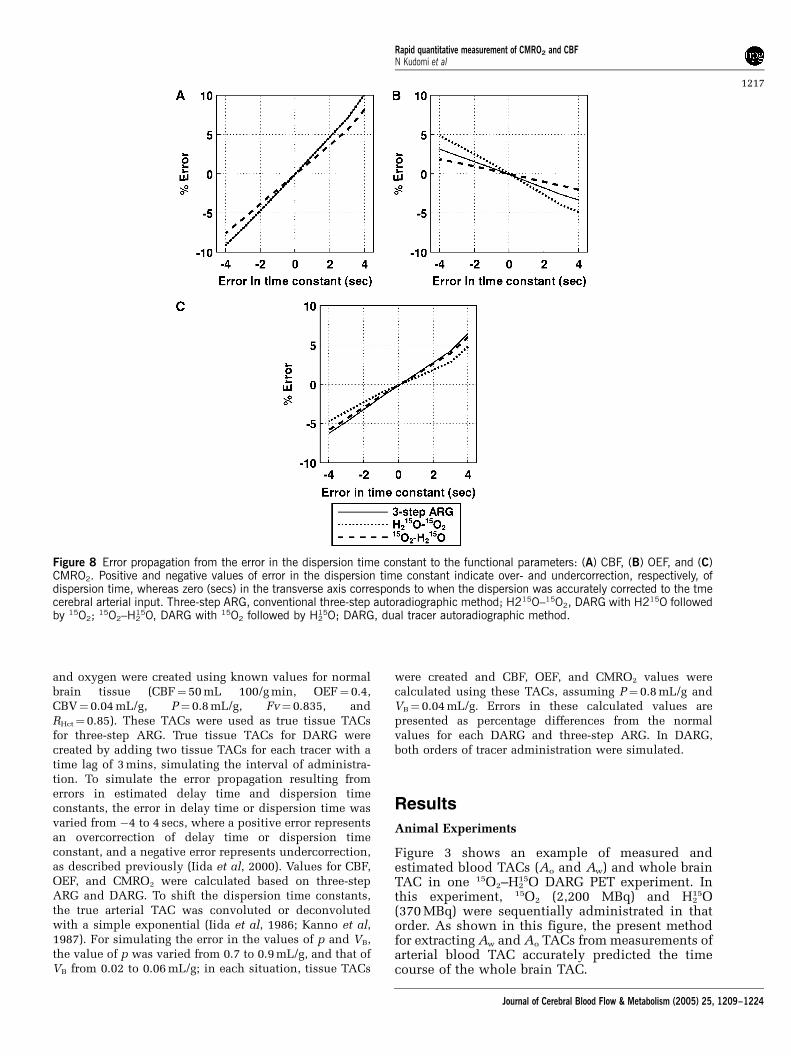
Figure 8 Error propagation from the error in the dispersion time constant to the functional parameters: (A) CBF, (B) OEF, and (C)CMRO2. Positive and negative values of error in the dispersion time constant indicate over- and undercorrection, respectively, ofdispersion time, whereas zero (secs) in the transverse axis corresponds to when the dispersion was accurately corrected to the tmecerebral arterial input. Three-step ARG, conventional three-step autoradiographic method; H215O–15O2, DARG with H215O followedby 15O2;
15O2–H215O, DARG with 15O2 followed by H2
15O; DARG, dual tracer autoradiographic method.
Rapid quantitative measurement of CMRO2 and CBFN Kudomi et al
1217
Journal of Cerebral Blood Flow & Metabolism (2005) 25, 1209–1224

In Table 1, quantitative values of gCBF, gCMRO2,and gOEF for whole brain are summarized. Thepaired t-test did not show any significant differencesin any variable between three-step ARG and eitherDARG sequence order (H2
15O–15O2 or 15O2–H215O)
(P40.05, n¼ 6). Also, there were no significantdifferences in gOEF between either of the PETmethods or the A–V method (P40.05, n¼ 6). Forthe measurements obtained during normocapnia,the PaCO2, PaO2, SaO2, and hemoglobin values were38.971.4 mm Hg, 119712 mm Hg, 97.3%71.2%,and 13.671.0 g/dL, respectively; all of these areconsidered within the normal range.
Figure 4 shows the DARG-derived gOEF valuesplotted against gOEFA�V values, all obtained duringPaCO2 variation. The best-fit regression line can beexpressed as gOEF¼ 1.03gOEFA�V�0.01 (r¼ 0.963,Po0.001, n¼ 12). The intercept is not significantlydifferent from zero (P40.05), and the slope of theline is close to unity. During these measurements,PaCO2 values ranged from 28 to 57 mm Hg.
The relationships of the regional ROI valuesbetween three-step ARG and DARG (H2
15O–15O2
and 15O2–H215O) are shown in Figure 5. The obtained
regression lines for CBF were CBF (DARG (H2O–O2))¼CBF (three-step)þ 0.00 mL 100/g/min (r¼ 1)and CBF (DARG (O2–H2O))¼ 1.03 CBF (three-step)þ 0.75 mL 100/g/min (r¼ 0.88). For CMRO2, theregression lines were CMRO2 (DARG (H2O–O2))¼ 0.97 CMRO2 (three-step)þ 0.00 mL 100/g/min (r¼ 0.91) and CMRO2 (DARG (O2–H2O))¼ 1.09CMRO2 (three-step)�0.11 mL 100/g/min (r¼ 0.93),and showed that the values of slope were notsignificantly different from the unity.
In Table 2, values of CBF, OEF, and CMRO2 inregional ROI computed by DARG and NLF are listedfor each data set for both 15O2–H2
15O and H215O–15O2.
In every region, for both data sets, the obtained CBF,OEF, and CMRO2 values did not differ significantlybetween NLF and DARG (paired t-test, P40.05). Ineach region, the estimated value of p for NLF wasnot different from the assumed value of 0.8 (one
Figure 9 Error propagation from the partition coefficient to the functional parameters: (A) CBF, (B) OEF, and (C) CMRO2. When thetrue p (transverse line) changed from 0.7 to 0.9 mL g�1, the size of the error in each variable calculated, assuming p¼0.8 mL g�1,was simulated. Three-step ARG, conventional three-step autoradiographic method; H2
15O–15O2, DARG with H215O followed by 15O2;
15O2–H215O, DARG with 15O2 followed by H2
15O; DARG, dual tracer autoradiographic method.
Rapid quantitative measurement of CMRO2 and CBFN Kudomi et al
1218
Journal of Cerebral Blood Flow & Metabolism (2005) 25, 1209–1224

sample t-test, P40.05); however, two-way analysisof variance with ‘region’ and ‘subject’ as factorsshowed a statistically significant effect of ‘region’ onp (F4, 30¼ 5.27, P¼ 0.029). Its mean was the smallestin the subcortex (0.69 to 0.70 mL/g). Consideringthat subcortical ROI size involves not only whitematter but also subcortical gray matter and ventri-cles, this result supports a previous notion thattissue mixtures cause an underestimation of p (Iidaet al, 1989). Therefore, these results suggest thatusing a fixed p value seems not to cause significantbias in CBF, OEF, and CMRO2.
Figure 6 provides a representative set of CBF, OEF,and CMRO2 images generated by DARG and three-step ARG. The functional images generated fromDARG were of comparable quality to those obtainedusing three-step ARG.
Error Analysis
Effects of delay correction errors: (Figure 7): ForCBF, the error sensitivity of the DARG-H2
15O–15O2
protocol was the same as that in three-step ARG,whereas the error sensitivity of the DARG-15O2–H2
15Oprotocol was smaller by 20%. For OEF, the errorsensitivity in DARG-H2
15O–15O2 was increased two-fold, while that in DARG-15O2–H2
15O was suppressedby 50%. For CMRO2, the error sensitivity in DARG-H2
15O–15O2 was suppressed by 40%, whereas that in15O2–H2
15O was almost equal to the value for three-step ARG. For example, when the error in themeasured delay was 2 secs, errors in DARG were atmost 5%, 3%, and 3% in CBF, OEF, and CMRO2,respectively. Considering that the error estimation ofdelay would be up to 2 secs in the present procedure(Kanno et al, 1987; Shidahara et al, 2002), theseresults indicate that the error sensitivity to delayassociated with DARG did not greatly exceed thatfrom three-step ARG.
Effects of dispersion correction errors (Figure 8): ForCBF, the error sensitivity in DARG H2
15O–15O2 wassimilar to that associated with three-step ARG; incontrast, that in 15O2–H2
15O was suppressed by 20%.
Figure 10 Error propagation from CBV to the functional parameters: (A) CBF, (B) OEF, and (C) CMRO2. When the true CBV(transverse line) changed from 0.02 to 0.06 mL g�1, the size of the error in each variable calculated, assuming CBV¼0.04 mL g�1,was simulated. Three-step ARG, conventional three-step autoradiographic method; H2
15O–15O2, DARG with H215O followed by 15O2;
15O2–H215O, DARG with 15O2 followed by H2
15O; DARG, dual tracer autoradiographic method.
Rapid quantitative measurement of CMRO2 and CBFN Kudomi et al
1219
Journal of Cerebral Blood Flow & Metabolism (2005) 25, 1209–1224

For OEF, the error sensitivity in H215O–15O2 was
increased two-fold, while that in 15O2–H215O was
decreased by 50%. For CMRO2, the error sensitivityin DARG H2
15O–15O2 was suppressed by 20%, butthat in 15O2–H2
15O was nearly equal to that of three-step ARG. The magnitude of errors introduced inCBF, OEF, and CMRO2 were less than 5% for allestimation procedures even if there was 2 secs oferror in estimating the time constant of dispersion(Iida et al, 1986). These results also indicate that theerror sensitivity to dispersion in DARG does notsignificantly exceed that associated with three-stepARG.
Effects of the partition coefficient (Figure 9): ForCBF, the error sensitivity in H2
15O–15O2 was thesame, and that in 15O2–H2
15O was enhanced two-fold,as compared with three-step ARG. For OEF, the errorsensitivity was enhanced three-fold in H2
15O–15O2
relative to three-step ARG, and the magnitude oferror was almost zero for 15O2–H2
15O. For CMRO2, theerror sensitivity was increased two-fold inH2
15O–15O2 and was the same in 15O2–H215O, as
compared with three-step ARG. Assuming that thevariation in p is 5%, the magnitude of error in theCBF estimated in 15O2–H2
15O was at most 3.5%,whereas the error in OEF and CMRO2 in H2
15O–15O2
was 7%. Although the error sensitivities inH2
15O–15O2 for OEF and CMRO2 were somewhatlarger than those associated with three-step ARG,the overall error sensitivity in DARG was similar tothat in three-step ARG.
Effects of blood volume (Figure 10): The errorsensitivities in both DARG experiments were iden-tical to those obtained from three-step ARG. Themagnitude of error introduced into the CBF estimatewere less than 1%, and that for OEF and CMRO2 wasless than 5% in all methods, even assuming a trueCBV of 0.06 mL/g.
This simulation study shows that the errorsensitivity introduced in the quantitative values ofCBF, OEF, and CMRO2 for the first phase of thedynamic PET scan used in DARG was nearly thesame as that in three-step ARG. In contrast, the errorfor the second phase was either enhanced orsuppressed, depending on the relationship of theerror between measured or assumed parameters andthe estimate of residual radioactivity.
Finally, we have estimated the sensitivity indiseased tissue that simulates decreased CBF withelevated OEF (f¼ 20 mL 100/g min and E¼ 0.7),namely the ischemic lesion. The magnitude of errorin the functional values of this tissue was roughlythe same in terms of delay and dispersion, and wasrelatively smaller in terms of p and CBV, than themagnitude of error for assumed normal tissue. Forexample, when assumed 5% error in P, the magni-tude of error introduced in CBF, OEF and CMRO2 inthe H2
15O–15O2 scan was 1.5%, 2%, and 2%
respectively, whereas that in H215O–15O2 was 3%,
0%, and 3%, respectively.
Discussion
In this study, we have proposed a novel, rapid PETtechnique for quantitative assessment of both CBFand CMRO2 from a single PET scanning withsequential administration of two tracers. This articledescribed the validity of this technique in anesthe-tized monkeys at rest and during varied PaCO2
conditions. There was no significant difference inCBF, OEF, or CMRO2 values at rest, as comparedwith those obtained using three-step ARG. Theestimated OEF values were also found to be in agood agreement with those derived from arterio-sinus blood sampling for a wide physiologic range.The image quality generated by DARG was identicalto that of three-step ARG. The simulation alsoshowed that the errors in the estimated parametersattributed to errors in delay, dispersion and theassumed partition coefficient was in the same levelas compared with that of the three-step ARG. Itshould also be noted that the error sensitivity to theCBV was reasonably small, namely almost no errorsin CBF, and only 75% errors in OEF and CMRO2 arecaused even if 750% errors are included in CBV.These findings suggest that the DARG techniqueprovides CBF and CMRO2 images with reasonableaccuracy and quality, and also allows multipleassessment of CBF/CMRO2, provided that a singleCBV scan is performed.
The DARG technique provides multiple parametermapping of CBF and CMRO2 from a single PET scanduring sequential administration of two tracers ofH2
15O and 15O2 (or 15O2 and H215O). Multiple tracer
approach has been applied to 11C-labeled tracers formapping multiple receptor ligands (Koeppe et al,2001). Another application of this approach is therepeat assessment of CBF. Watabe et al (2002)showed that CBF images can be quantitated at muchshorter interval than the previous protocol, typicallyat 90 secs, from sequential PET scanning duringrepeat H2
15O administration at 90 secs intervalThe measured OEF, CBF, and CMRO2 values
obtained in this study were consistent with previousstudies. OEF values in this study were 0.5170.07from three-step ARG, 0.5470.04 from DARG(H2
15O–15O2), 0.5670.06 from DARG (15O2–H215O),
and 0.5470.06 from arterio-sinus blood sampling.In anesthetized monkeys, Altman et al (1991)obtained OEF values of 0.5370.13 from arterio-sinus blood sampling. Using steady-state PET,others have measured OEFs ranging from 0.42 to0.58 in normal tissues of anesthetized monkeys(Altman et al, 1991; Pappata et al, 1993; Touzani etal, 1995; Young et al, 1996; Schumann et al, 1996;Frykholm et al, 2000). Moreover, the values of gCBFin the present PET study were 3079 mL 100/g minfrom three-step ARG, 3079 mL 100/g min from
Rapid quantitative measurement of CMRO2 and CBFN Kudomi et al
1220
Journal of Cerebral Blood Flow & Metabolism (2005) 25, 1209–1224

DARG (H215O–15O2), and 32711 mL 100/g min from
DARG (15O2–H215O), and the CMRO2 values were 2.7
70.4 from three-step ARG, 2.770.2 mL 100/g minfrom DARG (H2
15O–15O2), and 2.970.4 mL 100/g minfrom DARG (15O2–H2
15O). Previously reported valuesvaried from 27 to 37 mL 100/g min for CBF and 2.4 to3.4 mL 100/g min for CMRO2 (Altman et al, 1991;Pappata et al, 1993; Touzani et al, 1995; Young et al,1996; Schumann et al, 1996; Frykholm et al, 2000).Variations are because of the differences in monkeyspecies, physiologic conditions, anesthetic agentused, PET scanner, and methodology; the currentresults clearly show that the DARG method can beused to determine these physiologic parameterswith a high degree of accuracy.
There has not been systematic error sensitivityanalysis for the conventional three-step ARG meth-od. We thus have performed a simulation study toevaluate the error sensitivity for both the three-stepARG and DARG techniques. The error sensitivityappeared to be almost identical for all error sourcesestimated in the simulation. Small differences were,however, seen in particular cases obtained in thisexperiment. These differences may have arisenbecause of incorrect estimation of residual radio-activity in the second phase of the PET data. Forexample, when the true p is larger than the valueassumed for H2
15O–15O2, the CBF will be estimated aslarger than the true value. Thus, washout of waterwill be overestimated, leading to a lower estimate ofresidual radioactivity. Underestimation of the resi-dual radioactivity and large p values results in anoverestimation of oxygen uptake (OEF), thus in-creasing the error in the CMRO2 value. It is alsonotable that when the delay was overcorrected inH2
15O–15O2, the error in CMRO2 decreases comparedwith three-step ARG. The CBF becomes smaller thanthe true value and the amount of residual radio-activity will also be estimated to be smaller, causingoverestimation of oxygen uptake (OEF). As a result,similar magnitudes of overestimation of OEF andunderestimation of CBF will cancel the error inCMRO2.
The present model provides pixel-by-pixel esti-mates of CBF, CMRO2, and OEF based on data from asingle PET scan, assuming a constant partitioncoefficient (p) for H2
15O, as has been perfprmed forH2
15O autoradiography (Herscovitch et al, 1983;Raichle et al, 1983) and the three-step method(Mintun et al, 1984). The error in p propagates notonly to CBF but also to OEF and CMRO2. We used afixed value of 0.8 mL/g for p, which was empiricallydetermined so as to minimize the tissue mixtureassociated with the limited spatial resolution of PETscanner (Iida et al, 1989, 1991). The simulationstudy showed that the range of errors was almostwithin an acceptable range. Regional analysis alsoshowed that the CBF, OEF, and CMRO2 valuesprovided by DARG were consistent with by NLF innormal monkeys. Thus, using a fixed p value inDARG should not cause significant bias provided
that CBF, OEF, and CMRO2 are of interest. However,this should be further validated in humans, as theeffective p value could be affected by the tissuemixture and the magnitude of this effect might bedifferent in human (Iida et al, 1991).
Several previous studies showed the feasibility offixing a p value for H2
15O ARG (Herscovitch andRaichle, 1985; Kanno et al, 1987; Iida et al, 1989)and the three-step ARG (Mintun et al, 1984; Iida etal, 1993). One may argue the adequacy of thisassumption in diseased tissues, that is, the p valuesmay be increased in edematous regions, or de-creased in the area of necrotic tissue. In case CBFis reduced in such lesions, errors in the estimatedparameters would be small, because a linear rela-tionship is expected between the tissue-radioactiv-ity counts and the physiologic parameters, and the pdoes not contribute significantly to the kineticbehavior of the tracer accumulation. However, agreat error can be expected if CBF is at a high rangein the area of reduced p, as only a small change in pmay cause large changes in the tissue accumulationof the tracers. Exact magnitude is unknown, andshould be evaluated carefully for each of diseasedconditions.
The present method has several advantages overthree-step ARG. It eliminates the time required forradioactive decay between the H2
15O and 15O2 scans,thus shortening the procedure by at least 10 minscompared with the three-step method. Importantly,it also minimizes the error resulting from physiolo-gic fluctuations. Kinetic models of CBF-CMRO2
used in PET techniques assume constant physiolo-gic conditions throughout all PET scans, and CMRO2
is mathematically dependent on CBF. Thus, physio-logic changes during PET measurement may under-lie in part the errors in quantitative values. It is wellknown that CBF easily varies with PaCO2 (Grubb etal, 1974) and PaO2 (Borgstrom et al, 1975; Johanns-son and Siesjo, 1975); however, CMRO2 remainsconstant. In fact, Hattori et al (2004) recentlyshowed that OEF values in three-step method werenot identical to those in gOEFA�V in human,suggesting the presence of physiologic changeduring the measurement. The present method mayalso make physiologic interpretations of flow andmetabolism more accurate (Hayashi et al, 2003).Finally, it allows evaluation of coupling or uncou-pling of CBF and CMRO2 during functional activa-tion or pharmacological stress, such as that inducedby acetazolamide used for assessment of cerebralvascular reserves.
Ohta et al (1992) showed another technique forthe rapid estimation of CBF, OEF, and CMRO2 from a3-min single PET scan following bolus inhalation of15O2. This approach does not take into accountrecirculating water and involves a mathematicalformula with weighted integration to calculate thesequantitative values. However, the generated func-tional images suffer from statistical noise, which isattributed to the need for determination of multiple
Rapid quantitative measurement of CMRO2 and CBFN Kudomi et al
1221
Journal of Cerebral Blood Flow & Metabolism (2005) 25, 1209–1224
parameters from a small amount of time-varyingdata. Cerebral blood flow images, in particular,suffer significantly from noise; precise determina-tion of CBF often requires another PET scan withH2
15O injection (Meyer et al, 1987; Ohta et al, 1999;Fujita et al, 1999; Mintun et al, 2002). In contrast,the present approach can generate images of reason-able quality from a single 6-min PET scan. Althoughcurrently it still requires another C15O scan for CBVcorrection, we believe that an additional mathema-tical formulation strategy, such as the basis functionmethod (Gunn et al, 1997) could eliminate thisneed. In addition, to shorten the time for thetransmission scan, we could possibly apply asegmented attenuation correction technique (Xu etal, 1994, 1996). We believe that the total PET scantime for measuring CBF and CMRO2, for whichpatients need to be on the bed of the PET scanner,could be minimized to around 10 mins.
In the present study, the recirculating water in thearterial blood has been measured directly andcontinuously from separated plasma. This is labor-ious and may limit the use of this protocol forclinical studies. However, Iida et al (1993) haveestimated the amount of recirculating water andshowed that its amount can be predicted using asingle compartment model in three-step ARG innormal human subjects. This method eliminates theneed for plasma separation and simplifies the PETprocedure (Hatazawa et al, 1995; Shidahara et al,2002). However, as this method depends on inter-subject variation of the arterial 15O2 TAC (whichyields a bias in the CMRO2 in DARG), its validityrequires further evaluation in human studies.
Although the present study provided images ofrelatively good quality, image quality depends onmany different factors, such as the interval, (rela-tive) dose, and order of the two administered tracers.Given a shorter interval time between tracer admin-istrations, a larger amount of residual radioactivityfrom the first tracer remains during the imageacquisition for the second tracer, degrading thequality of the image calculated during the secondphase of the procedure. We fixed the time interval to3 mins in the present study based on preliminarysimulations (Iida et al, 2002), which suggested thatimages of an equivalent quality to three-step ARGcould be obtained if the time interval was at least3 mins. The deteriorated image quality because ofthe second tracer can be compensated for if theamount of the second tracer is increased, so long asthere are no mitigating factors such as scatter,random coincidence, and event loss because of deadtime. The effects on image quality resulting from thealteration of dosage parameters are complex, andparameter changes may interact in ways that inter-fere with each other. From a practical point of view,the reliability of specific parameters may be limitedby properties of each tracer that depend on thelabelling efficiency of H2
15O synthesis, and can differbetween supply facilities, as well as the distance
and flow rate from the synthesizer to the PETscanner. Further studies are required to optimizethese parameters to maximize image quality whenapplying this method to human studies.
In conclusion, although several issues remain tobe investigated, this study shows the feasibility ofrapid and simultaneous measurement of CBF andCMRO2 using a single PET scan and the sequentialadministration of two tracers. Both experimentaland simulation studies show that the DARG methodprovides reasonable accuracy for quantitative valuesof CBF, OEF, and CMRO2, and that the quality of theimages produced was comparable to that of three-step ARG. The present study suggests that thismethod may be applicable to the estimation of CBFand CMRO2 in humans, particularly in acute tosubacute ischemic patients or in the multipleassessment of CBF/CMRO2 at different physiologicconditions.
Acknowledgements
The authors gratefully acknowledge Mr N Ejima forproviding the operating cyclotron and daily main-tenance of the CTI ECAT HR, and would also like tothank the staff of the Department of InvestigativeRadiology, Research Institute, National Cardiovas-cular Center.
References
Altman DI, Lich LL, Powers WJ (1991) Brief inhalationmethod to measure cerebral oxygen extraction fractionwith PET: accuracy determination under pathologicconditions. J Nucl Med 32:1738–41
Borgstrom L, Johannsson H, Siesjo BK (1975) The relation-ship between arterial pO2 and cerebral blood flow inhypoxic hypoxia. Acta Physiol Scand 93:423–32
Correia JA, Alpert NM, Buxton RB, Ackerman RH (1985)Analysis of some errors in the measurement of oxygenextraction and oxygen consumption by the equilibriuminhalation method. J Cereb Blood Flow Metab 5:591–9
Frackowiak RS, Jones T, Lenzi GL, Heather JD (1980a)Regional cerebral oxygen utilization and blood flow innormal man using oxygen-15 and positron emissiontomography. Acta Neurol Scand 62:336–44
Frackowiak RS, Lenzi GL, Jones T, Heather JD (1980b)Quantitative measurement of regional cerebral bloodflow and oxygen metabolism in man using 15O andpositron emission tomography: theory, procedure, andnormal values. J Comput Assist Tomogr 4:727–36
Frykholm P, Andersson JL, Valtysson J, Silander HC,Hillered L, Persson L, Olsson Y, Yu WR, Westerberg G,Watanabe Y, Langstrom B, Enblad P (2000) A metabolicthreshold of irreversible ischemia demonstrated by PETin a middle cerebral artery occlusion-reperfusionprimate model. Acta Neurol Scand 102:18–26
Fujita H, Kuwabara H, Reutens DC, Gjedde A (1999)Oxygen consumption of cerebral cortex fails to increaseduring continued vibrotactile stimulation. J CerebBlood Flow Metab 19:266–71
Rapid quantitative measurement of CMRO2 and CBFN Kudomi et al
1222
Journal of Cerebral Blood Flow & Metabolism (2005) 25, 1209–1224
Grubb Jr RL, Raichle ME, Eichling JO, Ter-Pogossian MM(1974) The effects of changes in PaCO2 on cerebralblood volume, blood flow, and vascular mean transittime. Stroke 5:630–9
Gunn RN, Lammertsma AA, Hume SP, Cunningham VJ(1997) Parametric imaging of ligand-receptor binding inPET using a simplified reference region model. Neuro-image 6:279–87
Hatazawa J, Fujita H, Kanno I, Satoh T, Iida H, Miura S,Murakami M, Okudera T, Inugami A, Ogawa T,Shimosegawa E, Noguchi K, Shoji Y, Kanno I (1995)Regional cerebral blood flow, blood volume, oxygenextraction fraction, and oxygen utilization rate innormal volunteers measured by the autoradiographictechnique and the single breath inhalation method.Ann Nucl Med 9:15–21
Hattori N, Bergsneider M, Wu HM, Glenn TC, Vespa PM,Hovda DA, Phelps ME, Huang SC (2004) Accuracy of amethod using short inhalation of 15O–O2 for measuringcerebral oxygen extraction fraction with PET in healthyhumans. J Nucl Med 45:765–70
Hayashi T, Watabe H, Kudomi N, Kim KM, Enmi J,Hayashida K, Iida H (2003) A theoretical model ofoxygen delivery and metabolism for physiologic inter-pretation of quantitative cerebral blood flow andmetabolic rate of oxygen. J Cereb Blood Flow Metab23:1314–23
Herscovitch P, Markham J, Raichle ME (1983) Brain bloodflow measured with intravenous H2(15)O. I. Theory anderror analysis. J Nucl Med 24:782–9
Herscovitch P, Raichle ME (1985) What is the correct valuefor the brain–blood partition coefficient for water?J Cereb Blood Flow Metab 5:65–9
Ho D, Feng D (1999) Rapid algorithms for the constructionof cerebral blood flow and oxygen utilization imageswith oxygen-15 and dynamic positron emission tomo-graphy. Comput Methods Programs Biomed 58:99–117
Holden JE, Eriksson L, Roland PE, Stone-Elander S, WidenL, Kesselberg M (1988) Direct comparison of single-scan autoradiographic with multiple-scan least-squaresfitting approaches to PET CMRO2 estimation. J CerebBlood Flow Metab 8:671–80
Huang SC, Barrio JR, Yu DC, Chen B, Grafton S, MelegaWP, Hoffman JM, Satyamurthy N, Mazziotta JC, PhelpsME. (1991) Modelling approach for separating bloodtime–activity curves in positron emission tomographicstudies. Phys Med Biol 36:749–61
Huang SC, Feng DG, Phelps ME (1986) Model dependencyand estimation reliability in measurement of cerebraloxygen utilization rate with oxygen-15 and dynamicpositron emission tomography. J Cereb Blood FlowMetab 6:105–19
Iida H, Higano S, Tomura N, Shishido F, Kanno I, Miura S,Murakami M, Takahashi K, Sasaki H, Uemura K (1988)Evaluation of regional differences of tracer appearancetime in cerebral tissues using [15O] water and dynamicpositron emission tomography. J Cereb Blood FlowMetab 8:285–8
Iida H, Kanno I, Miura S, Murakami M, Takahashi K,Uemura K (1986) Error analysis of a quantitativecerebral blood flow measurement using H2(15)O auto-radiography and positron emission tomography, withrespect to the dispersion of the input function. J CerebBlood Flow Metab 6:536–45
Iida H, Kanno I, Miura S, Murakami M, Takahashi K,Uemura K (1989) A determination of the regional brain/blood partition coefficient of water using dynamic
positron emission tomography. J Cereb Blood FlowMetab 9:874–85
Iida H, Jones T, Miura S (1993) Modeling approach toeliminate the need to separate arterial plasma inoxygen-15 inhalation positron emission tomography.J Nucl Med 34:1333–40
Iida H, Kanno I, Miura S (1991) Rapid measurement ofcerebral blood flow with positron emission tomogra-phy. Chiba Found Symp 163:23–37; discussion 37–42
Iida H, Law I, Pakkenberg B, Krarup-Hansen A, Eberl S,Holm S, Hansen AK, Gundersen HJ, Thomsen C, SvarerC, Ring P, Friberg L, Paulson OB (2000) Quantitation ofregional cerebral blood flow corrected for partialvolume effect using O-15 water and PET: I. Theory,error analysis, and stereologic comparison. J CerebBlood Flow Metab 20:1237–51
Iida H, Miyake Y, Hayashi T, Kudomi N, Ogawa M,Teramoto N, Kim KM, Oka H, Hayashida K (2002) Anew strategy for rapid clinical imaging of rCMRO2,rCBF and rOEF using PET. J Nucl Med 43(Suppl):62P
Johannsson H, Siesjo BK (1975) Cerebral blood flow andoxygen consumption in the rat in hypoxic hypoxia.Acta Physiol Scand 93:269–76
Kanno I, Iida H, Miura S, Murakami M, Takahashi K,Sasaki H, Inugami A, Shishido F, Uemura K (1987) Asystem for cerebral blood flow measurement using anH2
15O autoradiographic method and positron emissiontomography. J Cereb Blood Flow Metab 7:143–53
Kety SS, Schmidt CF (1948) The nitrous oxide method forthe quantitative determination of cerebral blood flow inman: theory, procedure and normal values. J Clin Invest27:476–84
Koeppe RA, Raffel DM, Snyder SE, Ficaro EP, KilbournMR, Kuhl DE (2001) Dual-[11C]tracer single-acquisitionpositron emission tomography studies. J Cereb BloodFlow Metab 21:1480–92
Kudomi N, Choi C, Watabe H, Kim KM, Shidahara M,Ogawa M, Teramoto N, Sakamoto E, Iida H (2003)Development of a GSO Detector Assembly for aContinuous Blood Sampling System. IEEE Trans NuclSci 50:70–3
Kudomi N, Watabe H, Kim KM, Hayashida K, Hayashi T,Iida H (2002) Estimation of input function for rapiddual table ARG method. IEEE Nucl Sci Symp Con-ference Record M7–223
Lammertsma AA, Baron JC, Jones T (1987) Correction forintravascular activity in the oxygen-15 steady-statetechnique is independent of the regional hematocrit.J Cereb Blood Flow Metab 7:372–4
Lammertsma AA, Cunningham VJ, Deiber MP, Heather JD,Bloomfield PM, Nutt J, Frackowiak RS, Jones T (1990)Combination of dynamic and integral methods forgenerating reproducible functional CBF images. J CerebBlood Flow Metab 10:675–86
Lammertsma AA, Heather JD, Jones T, Frackowiak RS,Lenzi GL (1982) A statistical study of the steady statetechnique for measuring regional cerebral blood flowand oxygen utilisation using 15O. J Comput AssistTomogr 6:566–73
Lammertsma AA, Jones T (1983) Correction for thepresence of intravascular oxygen-15 in the steady-statetechnique for measuring regional oxygen extractionratio in the brain: 1. Description of the method. J CerebBlood Flow Metab 3:416–24
Meyer E, Tyler JL, Thompson CJ, Redies C, Diksic M,Hakim AM (1987) Estimation of cerebral oxygenutilization rate by single-bolus 15O2 inhalation and
Rapid quantitative measurement of CMRO2 and CBFN Kudomi et al
1223
Journal of Cerebral Blood Flow & Metabolism (2005) 25, 1209–1224

dynamic positron emission tomography. J Cereb BloodFlow Metab 7:403–14
Mintun MA, Raichle ME, Martin WR, Herscovitch P(1984) Brain oxygen utilization measured with O-15radiotracers and positron emission tomography. J NuclMed 25:177–87
Mintun MA, Vlassenko AG, Shulman GL, Snyder AZ(2002) Time-related increase of oxygen utilization incontinuously activated human visual cortex. Neuro-image 16:531–7
Ohta S, Meyer E, Thompson CJ, Gjedde A (1992) Oxygenconsumption of the living human brain measured aftera single inhalation of positron emitting oxygen. J Cereb.Blood Flow Metab 12:175–92
Ohta S, Reutens DC, Gjedde A (1999) Brief vibrotactilestimulation does not increase cortical oxygen con-sumption when measured by single inhalation ofpositron emitting oxygen. J Cereb Blood Flow Metab19:260–5
Okazawa H, Yamauchi H, Sugimoto K, Takahashi M,Toyoda H, Kishibe Y, Shio H (2001a) Quantitativecomparison of the bolus and steady-state methods formeasurement of cerebral perfusion and oxygen meta-bolism: positron emission tomography study using 15O-gas and water. J Cereb Blood Flow Metab 21:793–803
Okazawa H, Yamauchi H, Sugimoto K, Toyoda H, KishibeY, Takahashi M (2001b) Effects of acetazolamideon cerebral blood flow, blood volume, and oxygenmetabolism: a positron emission tomography studywith healthy volunteers. J Cereb Blood Flow Metab 21:1472–9
Pappata S, Fiorelli M, Rommel T, Hartmann A, DettmersC, Yamaguchi T, Chabriat H, Poline JB, Crouzel C, DiGiamberardino L, Baron JC (1993) PET study of changesin local brain hemodynamics and oxygen metabolismafter unilateral middle cerebral artery occlusion inbaboons. J Cereb Blood Flow Metab 13:416–24
Phelps ME, Huang SC, Hoffman EJ, Kuhl DE (1979)Validation of tomographic measurement of cerebralblood volume with C-11-labeled carboxyhemoglobin.J Nucl Med 20:328–34
Raichle ME, Martin WR, Herscovitch P, Mintun MA,Markham J (1983) Brain blood flow measured withintravenous H2
15O. II. Implementation and validation.J Nucl Med 24:790–8
Sadato N, Yonekura Y, Senda M, Iwasaki Y, Matoba N,Tamaki N, Sasayama S, Magata Y, Konishi J. (1993) PET
and the autoradiographic method with continuousinhalation of oxygen-15-gas: theoretical analysis andcomparison with conventional steady-state methods.J Nucl Med 34:1672–80
Schumann P, Touzani O, Young AR, Verard L, Morello R,MacKenzie ET (1996) Effects of indomethacin oncerebral blood flow and oxygen metabolism: a positronemission tomographic investigation in the anesthetizedbaboon. Neurosci Lett 220:137–41
Shidahara M, Watabe H, Kim KM, Oka H, Sago M, HayashiT, Miyake Y, Ishida Y, Hayashida K, Nakamura T, Iida H(2002) Evaluation of a commercial PET tomograph-based system for the quantitative assessment of rCBF,rOEF and rCMRO2 by using sequential administrationof 15O-labeled compounds. Ann Nucl Med 16:317–27
Subramanyam R, Alpert NM, Hoop Jr B, Brownell GL,Taveras JM (1978) A model for regional cerebral oxygendistribution during continuous inhalation of 15O2,C15O, and C15O2. J Nucl Med 19:48–53
Touzani O, Young AR, Derlon JM, Beaudouin V, MarchalG, Rioux P, Mezenge F, Baron JC, MacKenzie ET (1995)Sequential studies of severely hypometabolic tissuevolumes after permanent middle cerebral artery occlu-sion. A positron emission tomographic investigation inanesthetized baboons. Stroke 26:2112–9
Vafaee MS, Gjedde A (2000) Model of blood-brain transferof oxygen explains nonlinear flow-metabolism cou-pling during stimulation of visual cortex. J Cereb BloodFlow Metab 20:747–54
Watabe H, Konodo Y, Kim KM, Shidahara M, Iida H (2002)Shortening rCBF Measurement Interval in [15O]H2OPET. In: Brain imaging using PET (Senda M, Kimura Y,Herscovitch P, eds), San Diego: Academic Press,195–200
Xu M, Cutler PD, Luk WK (1996) Adaptive segmentedattenuation correction for whole-body PET imaging.IEEE Trans Nucl Sci 43:331–6
Xu M, Luk WK, Cutler PD, Digby WM (1994) Localthreshold for segmented attenuation correction of petimaging of the thorax. IEEE Trans Nucl Sci 41:1532–7
Young AR, Sette G, Touzani O, Rioux P, Derlon JM,MacKenzie ET, Baron JC (1996) Relationships betweenhigh oxygen extraction fraction in the acute stage andfinal infarction in reversible middle cerebral arteryocclusion: an investigation in anesthetized baboonswith positron emission tomography. J Cereb Blood FlowMetab 16:1176–88
Rapid quantitative measurement of CMRO2 and CBFN Kudomi et al
1224
Journal of Cerebral Blood Flow & Metabolism (2005) 25, 1209–1224
Related Documents