Molecular Ecology (2006) 15, 9–20 doi: 10.1111/j.1365-294X.2005.02807.x © 2006 Blackwell Publishing Ltd Blackwell Publishing Ltd FAST TRACK Rapid parallel evolutionary changes of gene transcription profiles in farmed Atlantic salmon CHRISTIAN ROBERGE,* SIGURD EINUM,† HELGA GUDERLEY * and LOUIS BERNATCHEZ * *Département de biologie, Université Laval, Québec, Canada G1K 7P4 and †Norwegian Institute for Nature Research, Trondheim, Norway Abstract Farmed salmon strains have been selected to improve growth rates as well as other traits of commercial interest but the 2 million farmed salmon escaping annually may enhance the risk of extinction of wild populations through genetic and ecological interactions. Here, we compare the transcription profiles of 3557 genes in the progeny of farmed and wild Atlantic salmon from Norway and Canada grown in controlled conditions, and demonstrate that five to seven generations of artificial selection led to heritable changes in gene transcription profiles, the average magnitude of the differences being 25% and 18% for at least 1.4% and 1.7% of the expressed genes in juvenile salmon from Norway and Canada, respectively. Moreover, genes showing significant transcription profile differences in both farmed strains (16%) all exhibited parallel changes. These findings, along with the identification of several genes whose expression profiles were modified through artificial selection, pro- vide new insights into the molecular basis of parallel evolution, and suggest how gene flow from farmed escapees may affect the genetic integrity of wild populations. Keywords: farmed salmon escapees, genome-wide transcription profiles, parallel evolution, recent evolution, salmon breeding, salmon conservation Received 14 June 2005; revision received 28 September 2005; accepted 20 October 2005 Introduction Consumers and environmentalists are increasingly con- cerned about the potential health and environmental consequences of producing genetically modified organisms. Yet, some of the criticisms of transgenic plants and animals may also apply to artificially selected breeds. In animals, strains selected for high production efficiency may be more susceptible to behavioural, physiological and immunological problems than wild populations (Rauw et al . 1998, 2000; Van der Waaij 2004). Also, many of the genetic changes accumulated in breeding strains are likely to be unknown. Selective breeding of Atlantic salmon ( Salmo salar ) was initiated in Norway in 1971 and is now intensively prac- tised in Chile, the United Kingdom, the United States, and Canada. In Norway, artificial selection was first limited to improving growth rate, but currently also targets traits such as age at sexual maturity, bacteria resistance, fat content and flesh colour. The selection response on each of these traits has been approximately 10% per generation (Gjoen & Bentsen 1997). However, phenotypic changes not specifically selected for have also been observed in Nor- wegian farmed salmon, including increased fat content in flesh (Rye & Gjerde 1996), poorer performance in the wild (Fleming et al . 2000; McGinnity et al . 2003) morphological and behavioural changes (Fleming & Einum 1997), increased growth hormone (GH) and insulin-like growth factor (IGF) levels (Fleming et al . 2002), as well as a higher feeding rate and food conversion efficiency (Thodesen et al . 1999). In Canada, the first breeding programme was initiated dur- ing the late 1980s, and targeted growth rate, age at sexual maturity, and more recently, bacteria resistance (Friars et al . 1995; O’Flynn et al . 1999). The last decade has seen the worldwide production of farmed Atlantic salmon outstrip that of fisheries (FAO 2004), and the problem of farmed salmon escapees has taken alarming proportions, with about 2 million farmed salmon escaping annually from their sea cages while the natural populations in the North Atlantic are estimated to comprise approximately 4 million individuals (McGinnity et al . 2003). Escaped farmed salmon are thought to greatly enhance the wild populations’ risk of extinction through genetic and ecological interactions (Fleming et al . 2000; Correspondence: Christian Roberge, Fax: 1-418-656-7176; E-mail: [email protected]

Welcome message from author
This document is posted to help you gain knowledge. Please leave a comment to let me know what you think about it! Share it to your friends and learn new things together.
Transcript

Molecular Ecology (2006)
15
, 9–20 doi: 10.1111/j.1365-294X.2005.02807.x
© 2006 Blackwell Publishing Ltd
Blackwell Publishing Ltd
FAST TRACK
Rapid parallel evolutionary changes of gene transcription profiles in farmed Atlantic salmon
CHRISTIAN ROBERGE,
*
S IGURD EINUM,
†
HELGA GUDERLEY
*
and LOUIS BERNATCHEZ
*
*
Département de biologie, Université Laval, Québec, Canada G1K 7P4 and
†
Norwegian Institute for Nature Research, Trondheim, Norway
Abstract
Farmed salmon strains have been selected to improve growth rates as well as other traits ofcommercial interest but the 2 million farmed salmon escaping annually may enhance therisk of extinction of wild populations through genetic and ecological interactions. Here, wecompare the transcription profiles of 3557 genes in the progeny of farmed and wild Atlanticsalmon from Norway and Canada grown in controlled conditions, and demonstrate thatfive to seven generations of artificial selection led to heritable changes in gene transcriptionprofiles, the average magnitude of the differences being 25% and 18% for at least 1.4% and1.7% of the expressed genes in juvenile salmon from Norway and Canada, respectively.Moreover, genes showing significant transcription profile differences in both farmedstrains (16%) all exhibited parallel changes. These findings, along with the identificationof several genes whose expression profiles were modified through artificial selection, pro-vide new insights into the molecular basis of parallel evolution, and suggest how gene flowfrom farmed escapees may affect the genetic integrity of wild populations.
Keywords
: farmed salmon escapees, genome-wide transcription profiles, parallel evolution, recentevolution, salmon breeding, salmon conservation
Received 14 June 2005; revision received 28 September 2005; accepted 20 October 2005
Introduction
Consumers and environmentalists are increasingly con-cerned about the potential health and environmentalconsequences of producing genetically modified organisms.Yet, some of the criticisms of transgenic plants and animalsmay also apply to artificially selected breeds. In animals,strains selected for high production efficiency may be moresusceptible to behavioural, physiological and immunologicalproblems than wild populations (Rauw
et al
. 1998, 2000;Van der Waaij 2004). Also, many of the genetic changesaccumulated in breeding strains are likely to be unknown.
Selective breeding of Atlantic salmon (
Salmo salar
) wasinitiated in Norway in 1971 and is now intensively prac-tised in Chile, the United Kingdom, the United States, andCanada. In Norway, artificial selection was first limitedto improving growth rate, but currently also targets traitssuch as age at sexual maturity, bacteria resistance, fatcontent and flesh colour. The selection response on each ofthese traits has been approximately 10% per generation
(Gjoen & Bentsen 1997). However, phenotypic changes notspecifically selected for have also been observed in Nor-wegian farmed salmon, including increased fat content inflesh (Rye & Gjerde 1996), poorer performance in the wild(Fleming
et al
. 2000; McGinnity
et al
. 2003) morphologicaland behavioural changes (Fleming & Einum 1997), increasedgrowth hormone (GH) and insulin-like growth factor (IGF)levels (Fleming
et al
. 2002), as well as a higher feeding rateand food conversion efficiency (Thodesen
et al
. 1999). InCanada, the first breeding programme was initiated dur-ing the late 1980s, and targeted growth rate, age at sexualmaturity, and more recently, bacteria resistance (Friars
et al
. 1995; O’Flynn
et al
. 1999).The last decade has seen the worldwide production
of farmed Atlantic salmon outstrip that of fisheries (FAO2004), and the problem of farmed salmon escapees hastaken alarming proportions, with about 2 million farmedsalmon escaping annually from their sea cages while thenatural populations in the North Atlantic are estimated tocomprise approximately 4 million individuals (McGinnity
et al
. 2003). Escaped farmed salmon are thought to greatlyenhance the wild populations’ risk of extinction throughgenetic and ecological interactions (Fleming
et al
. 2000;
Correspondence: Christian Roberge, Fax: 1-418-656-7176; E-mail:[email protected]
10
C . R O B E R G E
E T A L .
© 2006 Blackwell Publishing Ltd,
Molecular Ecology
, 15, 9–20
McGinnity
et al
. 2003), as well as by spreading diseases(Naylor
et al
. 2005). Knowledge of evolutionary changesinduced by salmon breeding is crucial for assessing theconsequences of genetic interactions between wild andescaped farmed salmon (Bentsen 1991). Namely, it isincreasingly acknowledged that evolutionary changes maystrongly depend on alterations in gene regulation (Wilson1976), and the microarray technology offers the possibilityof a genome-wide scan for gene transcription differencesbetween farmed and wild salmon. Yet, the oldest salmonbreeding programme has only operated for eight genera-tions and no microarray study in any species has assessedthe accumulation of heritable expression differencesfollowing so few generations of divergence. Recent studiesin salmonids suggest that evolution may be rapid for pheno-typic traits under strong selection (Hendry
et al
. 2000;Koskinen
et al
. 2003), but the genomic basis for such rapidchanges is unknown.
Due to the similarities in controlled selective regimes,breeding strains also represent a powerful system for stud-ies on parallel evolution. Parallel phenotypic evolution isconsidered one of the most eloquent manifestations of therole of selection in driving adaptive change (Harvey &Pagel 1991). Yet the genetic bases of parallel evolution arepoorly understood (Schluter
et al
. 2004). Genetic changesimplicated in natural phenotypic variation and evolutionof a given trait often involve a disproportionate use of thesame genes in independent parallel instances of pheno-typic evolution instead of affecting genes randomly pickedfrom the pool of all genes influencing this trait (Remington& Purugganan 2003; Schluter
et al
. 2004). This could eitherbe due to the similarly biased production of genetic vari-ation in close relatives (Haldane 1932; Schluter
et al
. 2004)or to a limited number of genes being actually important inphenotypic variation and evolution for a given trait (Stern2000; Remington & Purugganan 2003). To our knowledge,very few published studies have specifically investigatedparallelism in gene transcription (Ferea
et al
. 1999; Cooper
et al
. 2003).Here, we used a 3557-gene cDNA array (Rise
et al
. 2004)to compare levels of gene transcription in the progeny ofAtlantic salmon from the Norwegian National breedingprogramme first brood line (DOM1 or ‘population 1’
sensu
Gjedrem
et al
. 1991) and its main population of origin (riverNamsen, 64
°
27
′
0
′′
N, 11
°
28
′
0
′′
E), and from the Canadianbreeding programme (strain 84JC, St John River, from theAtlantic Salmon Broodstock Development Program inSt Andrews, New Brunswick) and its population of origin(St John River, 50
°
17
′
0
′′
N, 64
°
20
′
0
′′
W). Salmon of wildand farmed origin were reared under identical conditionswithin each country and transcription profiles of fish fromthe farmed strains and their wild counterparts were con-trasted on 23 microarrays (Canada, 13 involving 26 fry;Norway, 10 involving 20 fry).
Materials and methods
Fish crosses
Twenty wild and 20 farmed genitors were used to produce10 full-sibs pure wild families and 10 pure farmed familiesin both Norway and Canada, for a total of 40 families.Norwegian genitors were from the seventh generation ofthe Norwegian breeding programme first brood line andCanadian ones from the fifth generation of brood strain84JC. Fertilized eggs of both types were kept underidentical controlled conditions within systems [24 h darkness;yet temperatures were slightly different between countries:Norway, mean temperature (range) 3.9
°
C (0.8–11.1);Canada, mean water temperatures 0.5–1
°
C from Januaryto March, gradually rising in April to 4
°
C, and from 4
°
Cto 9
°
C by the first of June]. Because juvenile characteristicsplay a determinant role in the expression of life historytraits at later stages (Metcalfe
et al
. 1989), this study focuseson young of the year (fry stage). Sexually undifferentiatedfry were sampled at the yolk-sac resorption stage,before exogenous feeding. The number of families used isrelatively high compared to current standards for microarrayexperiments (see for instance Mackay
et al
. 2005), mini-mizing biases associated with individual parental effects,either by randomized sampling (Canada) or by using thesame number of fry from each family (Norway). For theCanadian fish, however, some of the families may havebeen over-represented (and others under-represented) inthe random sample. Genitors of wild origin were eithergrown from the egg in controlled conditions (Norway) orcaught in the wild and kept in controlled conditions forseveral months until spawning (Canada), allowing usto control for environmental effects. The rearing of theparents in a controlled environment is also expected toconsiderably reduce environmental maternal effects (whereoffspring from different females have different characteristicsdue to their mothers having lived in different environ-ments). Hence, differences in gene transcription related tomaternal effects are expected to be mainly due to geneticallybased maternal effects, which are heritable and may respondto selection. These may thus be an important source ofevolutionary changes among offspring of wild and farmedstocks, at least during the early stages, when genetic maternaleffects have most influence in salmonids (Perry
et al
. 2005).
RNA extraction, labelling and cDNA hybridization
Following sampling, all experiments were performedby the same person (C.R.), in the same laboratory (PavillonMarchand, Université Laval, Québec). Juveniles thathad been frozen in liquid nitrogen were homogenizedindividually in 4 mL TRI
zol
® Reagent using a Polytronhomogenizer, and total RNA was extracted in four separate
A T L A N T I C S A L M O N T R A N S C R I P T O M I C S A N D E V O L U T I O N
11
© 2006 Blackwell Publishing Ltd,
Molecular Ecology
, 15, 9–20
assays (to limit the error associated with the variability inthe RNA extraction efficiency). Briefly, 200
µ
L chloroform(Sigma) was added to each millilitre of fish homogenatein TRI
zol
. After mixing and centrifuging (12 000
g
, 4
°
C,15 min), the aqueous layers were transferred in new tubesand 1 mL isopropanol (Sigma) was added. The sampleswere then stored overnight at
−
80
°
C. The following day,the samples were centrifuged 1 h (12 000
g
, 4
°
C) and theisopropanol discarded. The pellets were washed with1 mL 70% ethanol, dried for 15 min at room temperature,resuspended in 40
µ
L non-DEPC treated nuclease-freewater (Ambion) and spiked with 1
µ
L RNAse inhibitor(Ambion). RNA integrity was verified with a 2100 Bio-Analyzer (Agilent). For each sample, 15
µ
g of the pooledRNA of the four separate extractions was then retro-transcribed and labelled using Genisphere 3DNA Array 50kit, Invitrogen’s Superscript II retro-transcriptase and Cy3and Alexa 647 dyes (Genisphere). The detailed protocolof the retro-transcription, labelling and hybridizationprocedures can be found at http://web.uvic.ca/cbr/grasp/(Genisphere Array 50 Protocol). Briefly, 15
µ
g totalRNA were reverse-transcribed by using special oligod(T) primers with 5
′
unique sequence overhangs for thelabelling reactions. Microarrays were prepared for hybrid-ization by washing twice for 5 min in 0.1% SDS, washingfive times for 1 min in MilliQ H
2
O, immersing 3 min in95
°
C MilliQ H
2
O, and drying by centrifugation (5 minat 800 RCF in 50 mL conical tubes). The cDNA washybridized to the microarrays in a formamide-basedbuffer (25% formamide, 4X SSC, 0.5% SDS, 2X Denhardt’ssolution) with competitor DNA [LNA dT bloker (Genisphere),human COT-1 DNA (Sigma)] for 16 h at 51
°
C in ahumidified hybridization oven. The arrays were washedonce for 5 min at 45
°
C (2X SSC, 0.1% SDS), twice for 3 minin 2X SSC, 0.1% SDS at room temperature (RT), twice for3 min in 1X SSC at RT, two times for 3 min in 0.1X SSC atRT, and dried by centrifugation. The Cy3 and Alexa 647fluorescent dye attached to DNA dendrimer probes (3DNAcapture reagent, Genisphere) were then hybridized tothe bound cDNA on the microarray using the samehybridization solution as earlier; the 3DNA capture reagentsbound to their complementary cDNA capture sequenceson the oligo d(T) primers. This second hybridization wasdone for 2 h at 51
°
C in a humidified hybridization oven.The arrays were then washed and dried as before.
Transcription profiles of fish from the farmed strainsand their wild counterparts were contrasted on 23 micro-arrays (Canada, 13 involving 26 fry; Norway, 10 involving20 fry). Since our main interest was in detecting changesdriven by artificial selection, one farmed and one wildjuvenile of the paired populations were compared directlyon each microarray. This simple design maximizes the sta-tistical power for detection of such differences for a givennumber of microarrays. Dye-sample coupling was balanced
between fry of wild and domestic origins in both systems(dye flip on the biological replicates). The cDNA microarraysused here were obtained through the Genomic Research onAtlantic Salmon Project (GRASP, available from Ben F.Koop, [email protected]) and comprises 3557 clones from 18high-complexity salmonid cDNA libraries, each printed asdouble, side-by-side spots on Telechem Superamine slides[6440 Atlantic salmon and 916 rainbow trout (
Oncorhyn-chus mykiss
) elements or spots; Rise
et al
. 2004]. Detailedinformation on the clones printed on the microarray can befound at http://web.uvic.ca/cbr/grasp/. Rise
et al
. (2004)provided information on the relative representation ofdiverse molecular functions in several cDNA libraries.However, they did not provide such information for thesequences printed on the cDNA microarray. Using theWeb-based tool FatiGO (Al Shahrour
et al
. 2004) as well asinformation available on the GRASP website, we calcu-lated the proportions of genes on the array involved inseveral biological processes (Fig. S1, Supplementary materials).Although calculated with all the information available,the results must be interpreted cautiously since geneontology (GO) information regarding biological processat level 4 was only available for 18% (631 genes) of thesequences on the array.
Signal detection, data preparation and statistical analysis
Signal was detected using a ScanArray scanner fromPackard BioScience. Spots were located and quantifiedwith the
quantarray
software, using the adaptive circlespot quantification method and keeping the mean value ofintensity for each spot. Local background and the datafrom bad spots were removed. Missing data were thenimputed using the K-nearest neighbours imputer in SAM(Tusher
et al
. 2001) (15 neighbours). Signals from pairs ofneighbouring replicate spots (PNRS) were averaged anddata were normalized by dividing by the channel mean. Toassess differences between wild and farmed salmon, datafrom Canada and Norway were analysed separately usinga mixed model of
anova
(Wolfinger
et al
. 2001) and the
r
/
maanova
package (Kerr
et al
. 2000, 2002). Genes withlow intensity data (mean intensity smaller than the meanintensity of the empty spot controls plus twice its standarddeviation in both channels) were removed from theanalysis, leaving 3058 and 2552 detected clones for theNorwegian and Canadian experiments, respectively. Underthe assumption that all null hypotheses are true, 31 and26 false positives at the
P
< 0.01 significance threshold areexpected by chance alone. Prepared data were correctedfor intensity-linked distortion using a regional LOWESSalgorithm and fitted to a mixed model of variance using the
r/maanova
package (www.jax.org/staff/churchill/labsite/software/Rmaanova/index.html). The model included the‘array’ term as a random term and the ‘sample type’ (farmed

12
C . R O B E R G E
E T A L .
© 2006 Blackwell Publishing Ltd,
Molecular Ecology
, 15, 9–20
or wild) and ‘dye’ terms as fixed terms. A permutation-based
F
-test (F2, with 1000 sample ID permutations) wasthen performed, and restricted maximum likelihood wasused to solve the mixed model equations. Variance homo-scedasticity was tested prior to each
anova
using the
F
-testfunction in the
E
xcel spreadsheet software.While our main interest was in detecting changes in
farmed vs. wild salmon, we were also interested in usingour data to assess for differences in transcription levelsbetween salmon from Norway (river Namsen) and Can-ada (St John River). To do this, normalized intensity dataobtained previously on separate arrays for wild indi-viduals of both origins were analysed together using an
anova
model with ‘dye’ and ‘country’ as fixed terms. The‘array’ term had to be removed from this model becauseexperimental variance associated with the array term wouldhave been confounded with that linked to the ‘country’term. This simpler model fits the data without notablebias, as verified by plotting the residuals vs. the fittedvalue for each gene in
r
/
maanova
(not shown). Since thearray-linked experimental variance is considered as random(Draghici 2003), removing the ‘array’ term from our modelis not expected to bias the conclusions of the analysis. Yet,it is not ideal since the array-linked experimental variancewill further inflate random error, making the test lesspowerful. Hence, while our experimental design was wellsuited for our main question of interest, this led to use aless powerful test to assess for differences between fishfrom Norway (river Namsen) and Canada (St John River).
Results
At a significance threshold for permutation corrected
P
values of
P
< 0.01, 68 and 74 pairs of neighbouringreplicate spots (PNRS) on the array represented genes withsignificantly different transcription levels in the progeny ofwild and farmed populations from Canada and Norway,respectively (Tables S1 and S2, Supplementary materials).After correcting for the expected number of false positives,this represented 1.4% and 1.7% of all detected PNRS forNorwegian and Canadian juveniles, respectively. Thesevalues represent conservative estimates of the proportionof genes for which the transcription level was modified byfive to seven generations of domestication, which may includethe effects of artificial selection, founder effects, geneticdrift and inadvertent selection due to artificial rearing or tothe selection of traits correlated to the traits of interest.
Potential caveats of this study include the difference ingenetic diversity between farmed and wild salmon as wellas the use of imputed data. First, a reduced genetic diver-sity is expected in farmed vs. wild salmon and was docu-mented for Norwegian fish (e.g. Norris
et al
. 1999). Thisdifference could be a problem when using
anova
. Thus,
F
-tests for variance homoscedasticity in gene transcription
profiles between farmed and wild salmon were performedfor each detected gene on the prepared data before per-forming the
anova
. In both the Canadian and Norwegiansystems, less significant genes than expected by chancealone were observed (at
P
< 0.05, 13 genes showed signi-ficant differences over 2552 tests in Canada and 20 genesover 3058 tests in Norway). These were considered as falsepositives. Only one of them (clone SK1-0197, similar to Betaactin 1) was present in the lists of genes showing significantdifferences between farmed and wild salmon (Norwegiansystem). Hence, reduced genetic diversity in farmed popu-lations does not ward against the use of
anova
in this study.Second, most microarray data analysis methods requirethat all the data be present. Missing data must therefore beimputed [here by using the K-nearest neighbours imputerin SAM (Tusher
et al
. 2001)], which could influence the results.In this study, only a very small subset of the data was miss-ing and had to be imputed (0.08% for the Canadian systemand 0.12% for the Norwegian one). Only two of the genesfor which a significant difference in transcription profile wasobserved between farmed and wild salmon had receivedan imputed value; both of these were in the Canadiansystem (nwh^18^87^nucleoside diphosphate kinase andpitl^504^374^ZipA). In these two cases, one value over26 (13 arrays, 2 side-by-side replicates averaged) wasimputed. As for nucleotide diphosphate kinase, two othernon-imputed clones showed equivalent results. Thus, dataimputation did not have much influence on our results.
Functional classification of the differentially expressed genes
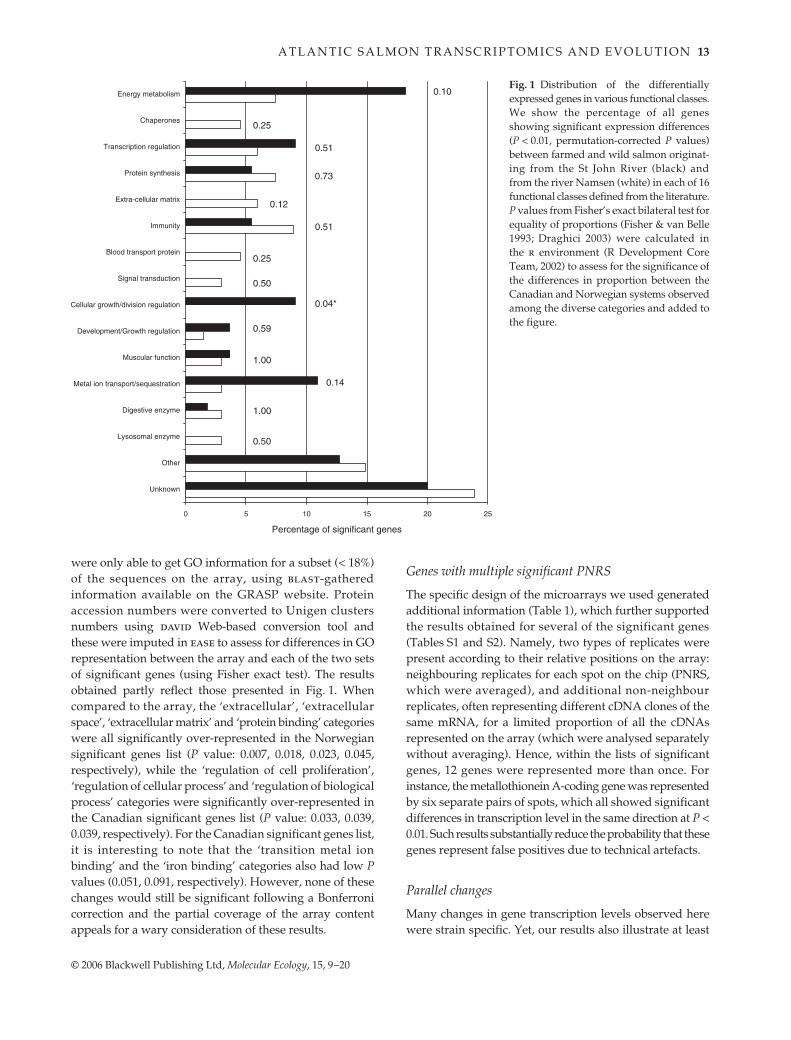
Changes in transcription profiles were observed in differentfunctional classes (Fig. 1). The proportion of significantchanges for genes implicated in protein synthesis andmuscle function was similar in Norway and Canada. Incontrast, the proportion of changes for genes implicatedin energy metabolism and metal ion sequestration wasgreater in the Canadian than in the Norwegian salmon,whereas the opposite pattern was observed for genescoding for molecular chaperones, blood transport proteinsand cellular matrix proteins. A Fisher exact test for equalityof proportions (Fisher & van Belle 1993; Draghici 2003) wasapplied to these data. Only the over-representation ofgenes implicated in regulation of cellular division andgrowth in the Canadian vs. Norwegian salmon significantgenes was significant at
P
> 0.05 (Fig. 1). Tools allowingmore reliable functional analysis of microarray data, suchas
david
/
ease
(Dennis
et al
. 2003; Hosack
et al
. 2003) or
onto
-
express
(Khatri
et al
. 2002) are presently poorlyadapted to the analysis of data from nonmodel speciescustom cDNA microarrays for several reasons, the firstone being the difficulty to get meaningful functionalannotations for all the clones on such arrays. Hence, we
A T L A N T I C S A L M O N T R A N S C R I P T O M I C S A N D E V O L U T I O N
13
© 2006 Blackwell Publishing Ltd,
Molecular Ecology
, 15, 9–20
were only able to get GO information for a subset (< 18%)of the sequences on the array, using
blast
-gatheredinformation available on the GRASP website. Proteinaccession numbers were converted to Unigen clustersnumbers using
david
Web-based conversion tool andthese were imputed in
ease
to assess for differences in GOrepresentation between the array and each of the two setsof significant genes (using Fisher exact test). The resultsobtained partly reflect those presented in Fig. 1. Whencompared to the array, the ‘extracellular’, ‘extracellularspace’, ‘extracellular matrix’ and ‘protein binding’ categorieswere all significantly over-represented in the Norwegiansignificant genes list (
P value: 0.007, 0.018, 0.023, 0.045,respectively), while the ‘regulation of cell proliferation’,‘regulation of cellular process’ and ‘regulation of biologicalprocess’ categories were significantly over-represented inthe Canadian significant genes list (P value: 0.033, 0.039,0.039, respectively). For the Canadian significant genes list,it is interesting to note that the ‘transition metal ionbinding’ and the ‘iron binding’ categories also had low Pvalues (0.051, 0.091, respectively). However, none of thesechanges would still be significant following a Bonferronicorrection and the partial coverage of the array contentappeals for a wary consideration of these results.
Genes with multiple significant PNRS
The specific design of the microarrays we used generatedadditional information (Table 1), which further supportedthe results obtained for several of the significant genes(Tables S1 and S2). Namely, two types of replicates werepresent according to their relative positions on the array:neighbouring replicates for each spot on the chip (PNRS,which were averaged), and additional non-neighbourreplicates, often representing different cDNA clones of thesame mRNA, for a limited proportion of all the cDNAsrepresented on the array (which were analysed separatelywithout averaging). Hence, within the lists of significantgenes, 12 genes were represented more than once. Forinstance, the metallothionein A-coding gene was representedby six separate pairs of spots, which all showed significantdifferences in transcription level in the same direction at P <0.01. Such results substantially reduce the probability that thesegenes represent false positives due to technical artefacts.
Parallel changes
Many changes in gene transcription levels observed herewere strain specific. Yet, our results also illustrate at least
Fig. 1 Distribution of the differentiallyexpressed genes in various functional classes.We show the percentage of all genesshowing significant expression differences(P < 0.01, permutation-corrected P values)between farmed and wild salmon originat-ing from the St John River (black) andfrom the river Namsen (white) in each of 16functional classes defined from the literature.P values from Fisher’s exact bilateral test forequality of proportions (Fisher & van Belle1993; Draghici 2003) were calculated inthe r environment (R Development CoreTeam, 2002) to assess for the significance ofthe differences in proportion between theCanadian and Norwegian systems observedamong the diverse categories and added tothe figure.

14 C . R O B E R G E E T A L .
© 2006 Blackwell Publishing Ltd, Molecular Ecology, 15, 9–20
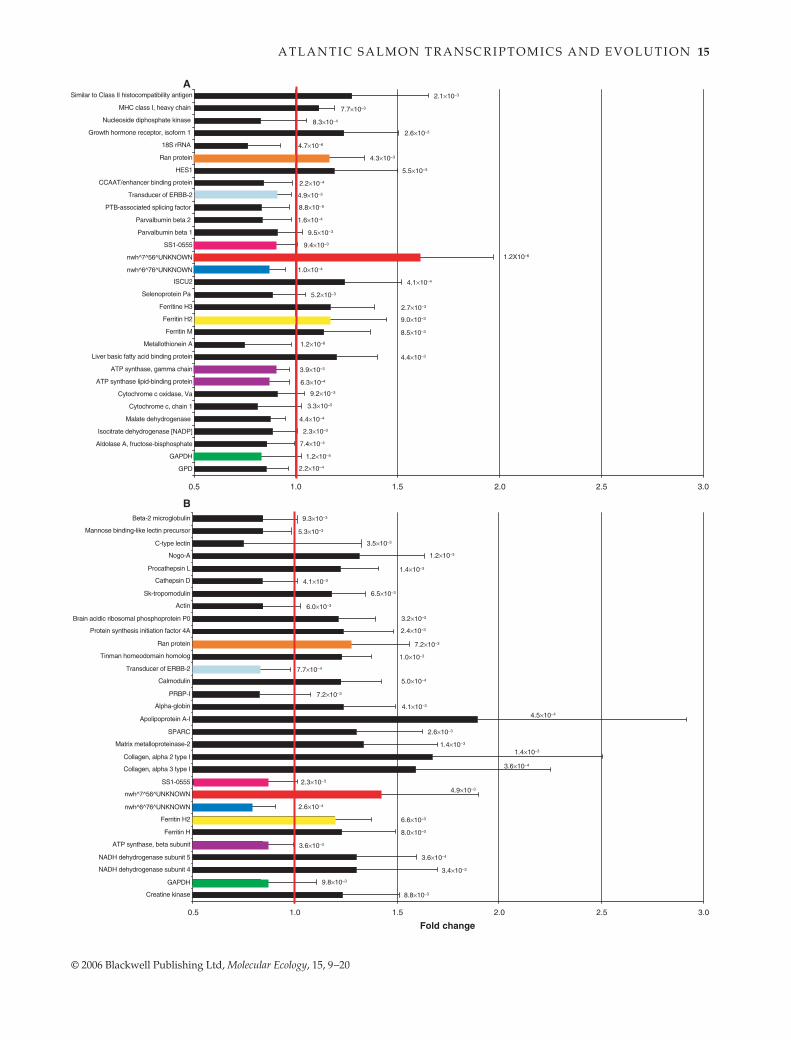
four distinct ways by which directional selection couldact on gene expression to result in parallel phenotypicevolution. First, equivalent changes could occur in thesame genes in populations submitted to similar selectiveregimes. Hence, seven genes showed significant expressiondifferences (P < 0.01) between farmed and wild salmon inboth Norway and Canada, and all changed in a paralleldirection (Fig. 2). The probability that seven genes showparallel changes by chance alone is P = 7.8 × 10⁻³, asevaluated using the binomial law with π = 0.5 (which isequivalent to the probability of at least seven successes
over seven iterations in a sign test with π = 0.5). Given thatsome of the parallel genes were down-regulated andothers up-regulated in the farmed strains, that they belongto very different functional groups and that no relation wasfound between them either through clustering analysis orwith the pathwayassist software (Ariadne Genomics), weconsider that the assumption of independence betweenthe genes required for this test is reasonable. These sevengenes represent 16% of the expected number of truepositives in each population. It is noteworthy that three ofthese genes had unknown functions. A second level of
OriginGenes with multiple significantPNRS
Average fold change P value
Canada Cytochrome c 0.8 3.3 × 10⁻⁵
0.8 1.9 × 10⁻⁴
0.9 6.7 × 10⁻³
Metallothionein A 0.7 1.2 × 10⁻⁶
0.8 1.1 × 10⁻⁴
0.8 1.1 × 10⁻⁴
0.8 1.4 × 10⁻⁴
0.7 2.8 × 10⁻⁶
0.9 1.8 × 10⁻³
GAPDH 0.9 4.4 × 10⁻⁴
0.8 1.2 × 10⁻⁵
0.9 2.8 × 10⁻³
0.9 8.4 × 10⁻⁴
Nucleoside diphosphate kinase 0.9 8.3 × 10⁻⁴
0.9 1.2 × 10⁻³
0.9 6.7 × 10⁻³
HES1 1.2 9.2 × 10⁻³
1.2 5.5 × 10⁻³
Brain protein (44-like) 0.9 2.1 × 10⁻³
0.9 4.0 × 10⁻³
Norway NADH dehydrogenase subunit 5 1.3 3.6 × 10⁻⁴
1.3 4.1 × 10⁻³
Calmodulin 1.3 5.0 × 10⁻⁴
1.3 6.7 × 10⁻³
1.2 6.0 × 10⁻³
1.2 9.0 × 10⁻³
Clone SS1-0555 0.8 2.3 × 10⁻³
0.9 9.9 × 10⁻³
Protein synthesis initiation factor 4A 1.2 2.4 × 10⁻³
1.2 6.7 × 10⁻³
Brain acidic ribosomal phosphoprotein P0 1.2 3.2 × 10⁻³
1.2 3.5 × 10⁻³
α-globin 1.3 4.1 × 10⁻³
1.2 5.4 × 10⁻³
Table 1 Genes for which multiple non-neighbour PNRS showed significant trans-cription level differences between theprogeny of wild and domestic salmon.For each PNRS of genes with multiplesignificant PNRS at the P < 0.01 threshold,the average fold change in farmed relativeto wild individuals from 13 (Norwegian) or10 (Canadian) arrays and the permutationcorrected (1000 permutations) P valuefrom the F-test on the mixed model ofanova is given
Fig. 2 (Opposition) Average fold change and standard deviation for a selection of genes differentially expressed between the progeny offarmed and wild salmon originating from (A) the St John River, Canada (mean of 13 microarrays), and (B) the river Namsen, Norway (meanof 10 microarrays). Permutation-corrected P values are given for each gene. For genes with multiple PNRS, only the smallest P valueobserved is given. A value above one (bold line) for a given gene represents overexpression in farmed relative to wild salmon. Coloursindicate parallel changes between Canadian and Norwegian salmon, either in genes coding for different subunits of the same functionalentity (ATP synthase) or in the same gene (the seven other instances). The genes in this figure were chosen either for their high level ofsignificance, their particular contextual interest, or because they showed parallel changes in expression in both systems.
A T L A N T I C S A L M O N T R A N S C R I P T O M I C S A N D E V O L U T I O N 15
© 2006 Blackwell Publishing Ltd, Molecular Ecology, 15, 9–20
16 C . R O B E R G E E T A L .
© 2006 Blackwell Publishing Ltd, Molecular Ecology, 15, 9–20
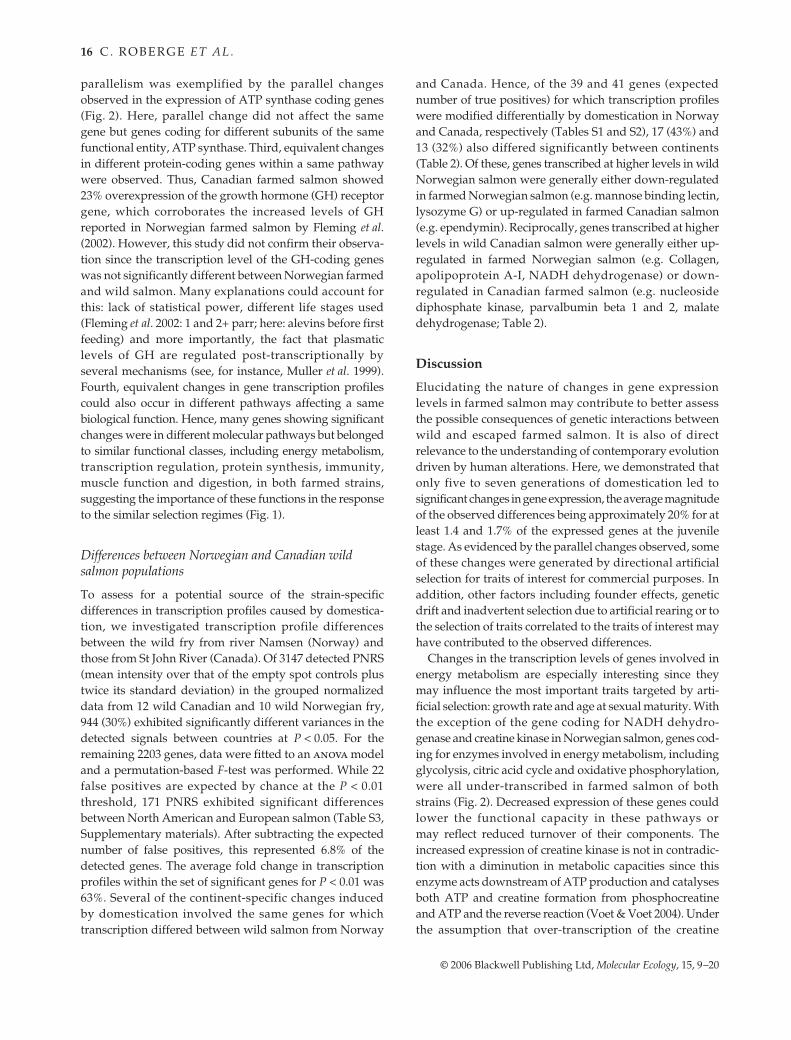
parallelism was exemplified by the parallel changesobserved in the expression of ATP synthase coding genes(Fig. 2). Here, parallel change did not affect the samegene but genes coding for different subunits of the samefunctional entity, ATP synthase. Third, equivalent changesin different protein-coding genes within a same pathwaywere observed. Thus, Canadian farmed salmon showed23% overexpression of the growth hormone (GH) receptorgene, which corroborates the increased levels of GHreported in Norwegian farmed salmon by Fleming et al.(2002). However, this study did not confirm their observa-tion since the transcription level of the GH-coding geneswas not significantly different between Norwegian farmedand wild salmon. Many explanations could account forthis: lack of statistical power, different life stages used(Fleming et al. 2002: 1 and 2+ parr; here: alevins before firstfeeding) and more importantly, the fact that plasmaticlevels of GH are regulated post-transcriptionally byseveral mechanisms (see, for instance, Muller et al. 1999).Fourth, equivalent changes in gene transcription profilescould also occur in different pathways affecting a samebiological function. Hence, many genes showing significantchanges were in different molecular pathways but belongedto similar functional classes, including energy metabolism,transcription regulation, protein synthesis, immunity,muscle function and digestion, in both farmed strains,suggesting the importance of these functions in the responseto the similar selection regimes (Fig. 1).
Differences between Norwegian and Canadian wild salmon populations
To assess for a potential source of the strain-specificdifferences in transcription profiles caused by domestica-tion, we investigated transcription profile differencesbetween the wild fry from river Namsen (Norway) andthose from St John River (Canada). Of 3147 detected PNRS(mean intensity over that of the empty spot controls plustwice its standard deviation) in the grouped normalizeddata from 12 wild Canadian and 10 wild Norwegian fry,944 (30%) exhibited significantly different variances in thedetected signals between countries at P < 0.05. For theremaining 2203 genes, data were fitted to an anova modeland a permutation-based F-test was performed. While 22false positives are expected by chance at the P < 0.01threshold, 171 PNRS exhibited significant differencesbetween North American and European salmon (Table S3,Supplementary materials). After subtracting the expectednumber of false positives, this represented 6.8% of thedetected genes. The average fold change in transcriptionprofiles within the set of significant genes for P < 0.01 was63%. Several of the continent-specific changes inducedby domestication involved the same genes for whichtranscription differed between wild salmon from Norway
and Canada. Hence, of the 39 and 41 genes (expectednumber of true positives) for which transcription profileswere modified differentially by domestication in Norwayand Canada, respectively (Tables S1 and S2), 17 (43%) and13 (32%) also differed significantly between continents(Table 2). Of these, genes transcribed at higher levels in wildNorwegian salmon were generally either down-regulatedin farmed Norwegian salmon (e.g. mannose binding lectin,lysozyme G) or up-regulated in farmed Canadian salmon(e.g. ependymin). Reciprocally, genes transcribed at higherlevels in wild Canadian salmon were generally either up-regulated in farmed Norwegian salmon (e.g. Collagen,apolipoprotein A-I, NADH dehydrogenase) or down-regulated in Canadian farmed salmon (e.g. nucleosidediphosphate kinase, parvalbumin beta 1 and 2, malatedehydrogenase; Table 2).
Discussion
Elucidating the nature of changes in gene expressionlevels in farmed salmon may contribute to better assessthe possible consequences of genetic interactions betweenwild and escaped farmed salmon. It is also of directrelevance to the understanding of contemporary evolutiondriven by human alterations. Here, we demonstrated thatonly five to seven generations of domestication led tosignificant changes in gene expression, the average magnitudeof the observed differences being approximately 20% for atleast 1.4 and 1.7% of the expressed genes at the juvenilestage. As evidenced by the parallel changes observed, someof these changes were generated by directional artificialselection for traits of interest for commercial purposes. Inaddition, other factors including founder effects, geneticdrift and inadvertent selection due to artificial rearing or tothe selection of traits correlated to the traits of interest mayhave contributed to the observed differences.
Changes in the transcription levels of genes involved inenergy metabolism are especially interesting since theymay influence the most important traits targeted by arti-ficial selection: growth rate and age at sexual maturity. Withthe exception of the gene coding for NADH dehydro-genase and creatine kinase in Norwegian salmon, genes cod-ing for enzymes involved in energy metabolism, includingglycolysis, citric acid cycle and oxidative phosphorylation,were all under-transcribed in farmed salmon of bothstrains (Fig. 2). Decreased expression of these genes couldlower the functional capacity in these pathways ormay reflect reduced turnover of their components. Theincreased expression of creatine kinase is not in contradic-tion with a diminution in metabolic capacities since thisenzyme acts downstream of ATP production and catalysesboth ATP and creatine formation from phosphocreatineand ATP and the reverse reaction (Voet & Voet 2004). Underthe assumption that over-transcription of the creatine
A T L A N T I C S A L M O N T R A N S C R I P T O M I C S A N D E V O L U T I O N 17
© 2006 Blackwell Publishing Ltd, Molecular Ecology, 15, 9–20
kinase gene translates into increased enzymatic activity,this could represent a more efficient ATP buffering byphosphocreatine in the Norwegian farmed salmon relativeto wild ones. Alternatively, heritable increase in the rela-tive mass of skeletal muscle, with its moderate aerobiccapacity and high levels of creatine kinase, could underliethe patterns observed in farmed salmon. In accordancewith the increased fat levels in the flesh of farmed salmon(Rye & Gjerde 1996), the gene for Apolipoprotein A-I, aconstituent of both chylomicrons and HDL, was stronglyover-transcribed in the farmed progeny from Norway, andthe transcription level of the gene for fatty acid bindingprotein was increased in Canadian farmed salmon. Alto-gether, these patterns are consistent with a reduction inbasal metabolic rate and an increased metabolic efficiencyof farmed juvenile salmon favouring allocation of resources
towards growth and fat deposition. Knowing that resist-ance to infection has been selected both in Norway andCanada farmed salmon, it is also noteworthy that twogenes coding for MHC antigens were over-transcribed infarmed salmon from Canada (Fig. 2).
We found evidence for parallelism in transcriptomeevolution at several distinct levels in this study. Thus, upto 16% of all transcription profile changes between farmedpopulations and their wild populations of origin occurredfor the same genes and in parallel for both farmed popu-lations. In these cases, there is therefore strong evidencefor the role of selection in driving phenotypic changes.Assuming that a large number of genes contribute to theexpression of the natural variation in polygenic traitsunder selection (e.g. growth rate and age at sexual matur-ity), parallel phenotypic evolution should rarely involve
Table 2 Relation between country-specific changes caused by domestication and between-country differences in transcription profiles.Genes for which both a country-specific domestication changes and between-country differences in gene transcription profiles wereobserved at the P < 0.01 significance threshold are presented with their average fold change between and within countries. A value superiorto 1 in the ‘between countries’ column represents an over-transcription in the Canadian compared to Norwegian salmon. A value above 1in the country-specific column represents an over-transcription in the domestic population compared to its wild population of origin.Asterisks indicate cases where the between-country differences seem partly counter-balanced by domestication-linked changes
Gene Between countries Norway Canada
HMG-1 2.29 1.27 *Malate dehydrogenase 2, NAD (mitochondrial) 1.85 0.87 *Parvalbumin beta 1 2.57 0.91 *Ferritin, middle subunit 3.96 1.14Salmo salar cDNA clone SK1-0455 1.69 1.16Mannose binding-like lectin 0.57 0.84 *Salmo salar cDNA clone SK1-0473 similar to Beta actin 1 2.15 1.64 *Salmo salar cDNA clone SS1-0134 1.73 0.83Salmo salar cDNA clone SS1-0466 similar to Ependymin 0.68 1.23 *Salmo salar cDNA clone lna^9^95^UNKNOWN 0.66 0.85 *Nucleoside diphosphate kinase 1.67 0.86–0.90 *Parvalbumin beta 1 1.89 0.91 *NADH dehydrogenase subunit 4 1.41 1.30 *Actin 2.23 0.84Fatty acid binding protein 1.60 1.16Glyceraldehyde 3-phosphate dehydrogenase 1.41 0.83 0.86Collagen alpha 3(I) 1.69 1.59 *LYSOZYME G 0.48 0.85 *Salmo salar cDNA clone SNN-1095 0.55 0.81 *APOLIPOPROTEIN A-I-1 PRECURSOR 1.45 1.89 *Creatine kinase (EC 2.7.3.2) 1.93 1.23 *Parvalbumin beta 2 1.52 0.83 *Ferritin middle subunit 1.32 1.14P0 acidic ribosomal phophoprotein 1.71 1.21–1.22 *Collagen alpha 2(I) chain precursor 1.93 1.67 *Secreted protein, acidic, rich in cysteine (SPARC) 1.53 1.30 *Beta-2 microglobulin 1.23 0.84Salmo salar cDNA clone lna^9^26^UNKNOWN 0.69 0.89Ferritin H-2 1.42 1.20 1.16High choriolytic enzyme 1 precursor 1.49 1.20Selenoprotein precursor 1.28 0.89 *Lysozyme 0.56 0.85 *

18 C . R O B E R G E E T A L .
© 2006 Blackwell Publishing Ltd, Molecular Ecology, 15, 9–20
the same genes (Schluter et al. 2004). Three major non-mutually exclusive explanations were proposed to accountfor changes in the same genes in two independent lineageshaving evolved in parallel: (i) the similarly biased pro-duction of genetic variation in close relatives (Haldane 1932;Schluter et al. 2004); (ii) a limited number of genes beingactually important in phenotypic variation and evolutionfor a given trait (Stern 2000; Remington & Purugganan2003); or (iii) developmental constraints shared betweenclosely related groups (e.g. West-Eberhard 2003). It is note-worthy that three of the parallel genes we observed haveunknown functions: their parallel expression changes inboth breeding strains suggest they might affect growth rateor age at sexual maturity, giving a first glimpse of theirpotential functions. Yet, we also observed parallel changesin the expression of genes coding for different subunits ofthe ATP synthase (Fig. 2), equivalent changes for differentgenes within pathways and the representation of commonfunctional classes in the significant changes. These levels ofparallelism not necessarily involving the same genes, aswell as the fact that most observed changes are strain spe-cific, suggest that selection also acted on genes for whichgenetic variation was not biased in a similar way in Nor-wegian and Canadian salmon. Accordingly, significantdifferences in both gene expression variance and meanbetween the wild Norwegian and Canadian salmon wereobserved, which could modify their responses to similarselection regimes. Also, 43% (Canada) and 32% (Norway)of the genes for which transcription profiles differedbetween farmed and wild fish also differed significantlybetween the wild populations of river Namsen (Norway)and St John River (Canada). Of these, genes transcribed athigher levels in wild Norwegian salmon were generallyeither down-regulated in farmed Norwegian salmon (e.g.mannose binding lectin, lysozyme G) or up-regulated infarmed Canadian salmon (e.g. ependymin). Reciprocally,genes transcribed at higher levels in wild Canadian salmonwere generally either up-regulated in farmed Norwegiansalmon (e.g. Collagen, apolipoprotein A-I, NADHdehydrogenase) or down-regulated in Canadian farmedsalmon (e.g. nucleoside diphosphate kinase, parvalbuminbeta 1 and 2, malate dehydrogenase; Table 2). This illus-trates how pre-existing differences in gene expression pro-files can modify the way by which two related populationsrespond to selection. It also suggests that genetic or develop-mental constraints can limit the contribution of a givengene to the evolution of a phenotype under directionalselection.
Substantial genetic (based on neutral markers) andheritable phenotypic differences were observed betweenAtlantic salmon from Europe and North America (Ståhl1987; Phillips & Hartley 1988; Verspoor & McCarthy1997). Accordingly, we observed differences both in geneexpression variance (30% of the detected genes had non-
homogenous variances) and means (average change of63%, for 6.8% of the detected genes with homoscedasticvariances) between the progeny of wild individuals fromNorway and Canada. These differences could be causallylinked with some of the strain-specific differences in thedomestic strains (Table 2). Strain-specific changes betweenwild and domestic salmon may also be associated withdifferences in the selection regimes applied in Norwayand Canada.
In addition, this study provided a first identification ofmany structural genes for which average transcriptionlevels differ significantly between European and NorthAmerican salmon (Table S3). Among the most interestingof these are fish allergens (type I Collagen and parvalbu-mines), key genes of energy metabolism (malate dehydro-genase, NADH dehydrogenase, creatine kinase, GAPDH)and several ribosomal protein coding genes (Table S3).However, these results must be interpreted cautiouslysince they were obtained from only two wild populations.Clearly, studies involving more populations from bothcontinents will be needed to confirm whether the observeddifferences truly reflect general intercontinental differencesof expression at the early fry stage.
Finally, our results also exemplify how founder effects,genetic drift or inadvertent selection may have causednondesirable evolutionary changes in farmed salmon(McGinnity et al. 2003). Hence, previous studies revealed apositive correlation between growth rate and fat contentin Atlantic salmon (Quinton et al. 2005) and showed thatfarmed salmon have a higher fat content and eat more fre-quently (Thodesen et al. 1999). Our results provided strongevidence for a 21% underexpression (average of six PNRS)of the metallothionein (MT) A gene in Canadian farmedsalmon. Interestingly, it has been shown that MT-nullmouse are obese, as a result of a higher food intake andof an abnormal energy balance (Beattie et al. 1998), whichpoints towards a role for MT in the regulation of energybalance. MT is also a key factor in adaptation to heavy-metalenvironments (Posthuma & Vanstraalen 1993). Therefore,introgression of this reduced MT expression from farmedinto wild populations could reduce their resistance toenvironmental pollutants. Admittedly, the phenotypicimportance of the transcription level changes observed inthis study must be interpreted cautiously since the linkbetween transcription level and phenotypic expression issubjected to other levels of regulation. Studying the actualimpact of the transcription profile changes observed onphenotype variation and fitness will therefore represent anecessary and exciting challenge in future studies.
Acknowledgements
This work was supported by a research grant from Science andEngineering Research Canada (NSERC strategic programme) to

A T L A N T I C S A L M O N T R A N S C R I P T O M I C S A N D E V O L U T I O N 19
© 2006 Blackwell Publishing Ltd, Molecular Ecology, 15, 9–20
L.B., H.G. and J.J. Dodson, a post-graduate scholarship from theFonds Québécois de la Recherche sur la Nature et les Technologies(FQRNT) to C.R., and funding from the Research Council ofNorway to S.E. This study is a contribution to the research pro-grammes of CIRSA (Centre Inter-universitaire de Recherche sur leSaumon Atlantique) and Québec-Océan. We thank Trevor Goffand the staff from the Mactaquac Fish Hatchery, Department ofFisheries and Oceans (DFO) Canada and the staff at the NINAResearch Station, Ims, Norway, for their assistance in rearing fish.We are also grateful to Brian Glebe (DFO) for providing fish fromthe Canadian farmed strain, to Sean Rogers, Jon Slate and threeanonymous referees for their valuable input on an earlier versionof the manuscript, as well as to Hélène Crépeau and Gary Church-ill for their comments on statistical issues.
Supplementary materials
The supplementary material is available from http://www.blackwellpublishing.com/products/journals/suppmat/MEC/MEC2807/MEC2807sm.htm
Fig. S1 Distribution of 631 genes on the array with GO annotationat level 4 among different biological processes. Details of howGO annotations were linked to the salmon sequences areprovided on the grasp website (http://web.uvic.ca/cbr/grasp/geneIDmethods.v2.txt). Briefly, the blastx online tool was used tofind annotated polypeptidic sequences similar to those translatedfrom the sequences printed on the array. The calculation of theproportion of GO annotation in each biological process wasperformed using the Web-based tool FatiGO (Al-Shahrour et al.2004), using protein identifiers as inputs. Biological processes forwhich the observed proportion was under 2% were grouped in thecategory ‘other’.
Table S1 PNRS representing genes differentially expressedbetween the progeny of farmed and wild Canadian salmons. PNRSare classified in various biological/cellular functional groups.The average fold change in gene expression in farmed salmoncompared to wild individuals (data from 13 arrays) and itsstandard deviation is given for each PNRS, as well as P valuesobtained from the F-test on the mixed model of anova. Genes forwhich several PNRS were significant are in bold. Colours identifygenes or functional entities showing parallel changes in Canadaand Norway. Clone identification follows notation from thegrasp. GenBank Accession numbers refer to the GenBanksequence the most similar to the amplified cDNA portion spottedon the array
Table S2 PNRS representing genes differentially expressedbetween the progeny of farmed and wild Norwegian salmons.PNRS are classified in various biological/cellular functionalgroups. The average fold change in gene expression in farmedsalmon compared to wild individuals (data from 10 arrays) and itsstandard deviation is given for each PNRS, as well as P valuesobtained from the F-test on the mixed model of anova. Genes forwhich several PNRS were significant are in bold. Colours identifygenes or functional entities showing parallel changes in Canadaand Norway. Clone identification follows notation from thegrasp. GenBank Accession numbers refer to the GenBanksequence the most similar to the amplified cDNA portion spottedon the array
Table S3 PNRS representing the 171 genes differentiallyexpressed between the progeny of wild salmon from Norway(Namsen River) and Canada (St John River) at the P < 0.01threshold on permutation-based P values. The average foldchange in gene expression in Canadian compared to Norwegianwild individuals (data from 22 individuals) is given for eachPNRS, as well as P values obtained from the F-test on the anovamodel. GenBank Accession numbers refer to the GenBanksequence the most similar to the amplified cDNA portionspotted on the array. Clone identification follows notationfrom the grasp
References
Al Shahrour F, Diaz-Uriarte R, Dopazo J (2004) FatiGO: a web toolfor finding significant associations of Gene Ontology terms withgroups of genes. Bioinformatics, 20, 578–580.
Beattie JH, Wood AM, Newman AM et al. (1998) Obesity andhyperleptinemia in metallothionein (-I and -II) null mice.Proceedings of the National Academy of Sciences, USA, 95, 358–363.
Bentsen HB (1991) Quantitative genetics and management of wildpopulations. Aquaculture, 98, 263–266.
Cooper TF, Rozen DE, Lenski RE (2003) Parallel changes in geneexpression after 20,000 generations of evolution in Escherichiacoli. Proceedings of the National Academy of Sciences, USA, 100,1072–1077.
Dennis G, Sherman BT, Hosack DA et al. (2003) david: database forannotation, visualization, and integrated discovery. GenomeBiology, 4.
Draghici S (2003) Data Analysis Tools for DNA Microarrays. CRCPress, London.
FAO (2004) Fisheries Department statistical databases and software:FISHSTAT PLUS. Available from www.fao.org/fi/statist/FISOFT/FISHPLUS.asp.
Ferea TL, Botstein D, Brown PO, Rosenzweig RF (1999) Systematicchanges in gene expression patterns following adaptive evolu-tion in yeast. Proceedings of the National Academy of Sciences, USA,96, 9721–9726.
Fisher LD, van Belle G (1993) Biostatistics: A Methodology for HealthSciences. John Wiley & Sons, New York.
Fleming IA, Einum S (1997) Experimental tests of genetic diver-gence of farmed from wild Atlantic salmon due to domestica-tion. ICES Journal of Marine Science, 54, 1051–1063.
Fleming IA, Hindar K, Mjolnerod IB et al. (2000) Lifetime successand interactions of farm salmon invading a native population.Proceedings of the Royal Society of London. Series B, BiologicalSciences, 267, 1517–1523.
Fleming IA, Agustsson T, Finstad B, Johnsson JI, Bjornsson BT(2002) Effects of domestication on growth physiology and endo-crinology of Atlantic salmon (Salmo salar). Canadian Journal ofFisheries and Aquatic Sciences, 59, 1323–1330.
Friars GW, Bailey JK, Oflynn FM (1995) Applications of selectionfor multiple traits in cage-reared Atlantic salmon (Salmo salar).Aquaculture, 137, 213–217.
Gjedrem T, Gjoen HM, Gjerde B (1991) Genetic-origin of Nor-wegian farmed Atlantic salmon. Aquaculture, 98, 41–50.
Gjoen HM, Bentsen HB (1997) Past, present, and future of geneticimprovement in salmon aquaculture. ICES Journal of MarineScience, 54, 1009–1014.
Haldane JBS (1932) The Causes of Evolution. Longmans, London.
20 C . R O B E R G E E T A L .
© 2006 Blackwell Publishing Ltd, Molecular Ecology, 15, 9–20
Harvey PH, Pagel MD (1991) The Comparative Method in Evolution-ary Biology. Oxford University Press, Oxford, UK.
Hendry AP, Wenburg JK, Bentzen P, Volk EC, Quinn TP (2000)Rapid evolution of reproductive isolation in the wild: evidencefrom introduced salmon. Science, 290, 516–518.
Hosack DA, Dennis G, Sherman BT, Lane HC, Lempicki RA (2003)Identifying biological themes within lists of genes with ease.Genome Biology, 4, R70. doi: 10.1186/gb-2003-4-10-r70.
Kerr MK, Martin M, Churchill GA (2000) Analysis of variance forgene expression microarray data. Journal of ComputationalBiology, 7, 819–837.
Kerr MK, Afshari CA, Bennett L et al. (2002) Statistical analysis ofa gene expression microarray experiment with replication.Statistica Sinica, 12, 203–217.
Khatri P, Draghici S, Ostermeier GC, Krawetz SA (2002) Profilinggene expression using onto-express. Genomics, 79, 266–270.
Koskinen MT, Haugen TO, Primmer CR (2003) Corrigendum:Contemporary fisherian life-history evolution in small salmonidpopulations (vol. 419, p. 826, 2002). Nature, 421, 656.
Mackay TFC, Heinsohn SL, Lyman RF, Moehring AJ, Morgan TJ,Rollmann SM (2005) Genetics and genomics of Drosophila mat-ing behavior. Proceedings of the National Academy of Sciences,USA, 102, 6622–6629.
McGinnity P, Prodohl P, Ferguson K et al. (2003) Fitness reductionand potential extinction of wild populations of Atlantic salmon,Salmo salar, as a result of interactions with escaped farm salmon.Proceedings of the Royal Society of London. Series B, Biological Sciences,270, 2443–2450.
Metcalfe NB, Huntingford FA, Graham WD, Thorpe JE (1989)Early social-status and the development of life-history strategiesin Atlantic salmon. Proceedings of the Royal Society of London. SeriesB, Biological Sciences, 236, 7–19.
Muller EE, Locatelli V, Cocchi D (1999) Neuroendocrine controlof growth hormone secretion. Physiological Reviews, 79, 511–607.
Naylor R, Hindar K, Fleming IA et al. (2005) Fugitive salmon:assessing the risks of escaped fish from net-pen aquaculture.Bioscience, 55, 427–437.
Norris AT, Bradley DG, Cunningham EP (1999) Microsatellitegenetic variation between and within farmed and wild Atlanticsalmon (Salmo salar) populations. Aquaculture, 180, 247–264.
O’Flynn FM, Bailey JK, Friars GW (1999) Responses to twogenerations of index selection in Atlantic salmon (Salmo salar).Aquaculture, 173, 143–147.
Perry GML, Audet C, Bernatchez L (2005) Maternal genetic effectson adaptive divergence between anadromous and residentbrook charr during early life history. Journal of EvolutionaryBiology, 18, 1348–1361.
Phillips RB, Hartley SE (1988) Fluorescent banding-patterns of thechromosomes of the genus Salmo. Genome, 30, 193–197.
Posthuma L, Vanstraalen NM (1993) Heavy-metal adaptation interrestrial invertebrates — a review of occurrence, genetics,physiology and ecological consequences. Comparative Biochemistryand Physiology Part C: Pharmacology Toxicology and Endocrinology,106, 11–38.
Quinton CD, McMillan I, Glebe B (2005) Development of anAtlantic salmon Salmo salar genetic improvement program:genetic parameters of harvest body weight and carcass qualitytraits estimated with animal models. Aquaculture, 247, 211–217.
Rauw WM, Kanis E, Noordhuizen-Stassen EN, Grommers FJ (1998)Undesirable side effects of selection for high production efficiencyin farm animals: a review. Livestock Production Science, 56, 15–33.
Rauw WM, Luiting P, Bakken M et al. (2000) Behavioural differ-ences in non-reproductive adult females in a long-term selectionexperiment for litter size in mice. Applied Animal BehaviourScience, 66, 249–262.
Remington DL, Purugganan MD (2003) Candidate genes, quantita-tive trait loci, and functional trait evolution in plants. InternationalJournal of Plant Sciences, 164, S7–S20.
Rise ML, von Schalburg KR, Brown GD et al. (2004) Developmentand application of a salmonid EST database and cDNA micro-array: data mining and interspecific hybridization characteristics.Genome Research, 14, 478–490.
Rye M, Gjerde B (1996) Phenotypic and genetic parameters ofbody composition traits and flesh colour in Atlantic salmon,Salmo salar L. Aquaculture Research, 27, 121–133.
Schluter D, Clifford EA, Nemethy M, McKinnon JS (2004) Parallelevolution and inheritance of quantitative traits. AmericanNaturalist, 163, 809–822.
Ståhl G (1987) Genetic population structure of Atlantic salmon.In: Population Genetics and Fishery Management (eds Ryman N,Utter F), pp. 121–140. University of Washington Press, Seattle.
Stern DL (2000) Perspective: evolutionary developmental biologyand the problem of variation. Evolution, 54, 1079–1091.
Thodesen J, Grisdale-Helland B, Helland SJ, Gjerde B (1999) Feedintake, growth and feed utilization of offspring from wild andselected Atlantic salmon (Salmo salar). Aquaculture, 180, 237–246.
Tusher VG, Tibshirani R, Chu G (2001) Significance analysis ofmicroarrays applied to the ionizing radiation response. Proceed-ings of the National Academy of Sciences, USA, 98, 5116–5121.
Van der Waaij EH (2004) A resource allocation model describingconsequences of artificial selection under metabolic stress.Journal of Animal Science, 82, 973–981.
Verspoor E, McCarthy E (1997) Genetic divergence at the NAD+-dependent malic enzyme locus in Atlantic salmon from Europeand North America. Journal of Fish Biology, 51, 155–163.
Voet D, Voet JG (2004) Biochemistry. John Wiley & Sons, New York.West-Eberhard MJ (2003) Developmental Plasticity and Evolution.
Oxford University Press, New York.Wilson AC (1976) Gene regulation in evolution. In: Molecular
Evolution (ed. Ayala FJ), pp. 225–234. Sinauer Associates,Sunderland, Massachusetts.
Wolfinger RD, Gibson G, Wolfinger ED et al. (2001) Assessing genesignificance from cDNA microarray expression data via mixedmodels. Journal of Computational Biology, 8, 625–637.
This study is part of C. Roberge’s doctoral research in L.Bernatchez’s laboratory, which aims to study the genetic basis ofrecent evolution in Atlantic salmon, both in nature and throughartificial selection. S. Einum is interested in various aspects ofsalmon evolution and conservation, including assessing theeffects of interactions between wild and farmed salmon. Thisstudy also overlaps H. Guderley’s interest in biochemicaladaptation to changes in abiotic and biotic factors. The majorinterests of L. Bernatchez are in the understanding of the patternsand processes of molecular and organismal evolution, as well astheir significance to conservation.
Related Documents


