Rapid loss of Paraguay's Atlantic forest and the status of protected areas — A Landsat assessment Chengquan Huang a, ⁎ , Sunghee Kim b , Alice Altstatt a , John R.G. Townshend a , Paul Davis a,b , Kuan Song a,b , Compton J. Tucker c,a , Oscar Rodas d , Alberto Yanosky d , Rob Clay d , John Musinsky e a Department of Geography, University of Maryland, College Park, MD 20742, U.S.A. b Institute for Advanced Computer Studies, University of Maryland, College Park, MD 20742, U.S.A. c NASA/Goddard Space Flight Center, Greenbelt, MD 20771, U.S.A. d Guyra, Paraguay, Casilla de Correo: 1132, Asuncion, Paraguay e Conservation International, 1919 M Street, NW, Suite 600, Washington, DC 20036, U.S.A. Received 4 August 2006; received in revised form 12 September 2006; accepted 14 September 2006 Abstract Using Landsat images acquired since early 1970s, we have mapped the forest cover and change between 1989 and 2000, and estimated forest area in 1973 in Paraguay's Atlantic Forest Ecoregion (PAFE). The results revealed that as of 1973, 73.4% of the PAFE region was covered by forest. Since then, the proportion of forested area was quickly reduced to 40.7% by 1989 and further down to 24.9% by 2000. Two competing deforestation processes contributed to this rapid forest loss, with the first being driven by settlers and the second by large private land owners. During the 1989–2000 period, 80% of deforested areas were cleared by private land owners and 20% by the settlers. Protected areas slowed down forest loss within their boundaries, but not in their surrounding areas. The average percent forest loss in the area within 5 km from the boundary of Paraguay's major forested protected areas was 39% during the 1989–2000 period, which was essentially the same as that for the entire PAFE region during the same period. The high rates of forest loss in the areas surrounding the protected areas not only left the protected areas highly isolated as ecological “islands”, they may also be precursors to rapid forest loss within the protected areas. These protected areas are critical to the conservation of many species endemic or limited to the PAFE region and surrounding areas, and should be continuously monitored using recent and future satellite observations. © 2006 Elsevier Inc. All rights reserved. Keywords: Atlantic forest; Deforestation; Paraguay; Protected area 1. Introduction The Atlantic forest in South America has been identified as one of the top priority ecosystems for global biological con- servation (Myers, 1988; Olson & Dinerstein, 2002). The forest has extremely high levels of biodiversity, hosting an estimated 20,000 plant species and over 1300 non-fish vertebrate species (Mittermeier et al., 1999). The level of endemism is generally high. More than 6000 plant species, 60% mammal species, 30% reptiles, and 90% forest amphibians are thought to be endemic, with many found nowhere else on the Earth (Mittermeier et al., 1999; Myers et al., 2000). Much of the original Atlantic forest was in Brazil, spanning along the Atlantic coast from the northeast in the state of Rio Grande do Norte to the southernmost border, and extending inland to Argentina and Paraguay in the south. The vast major- ity of the original Atlantic forest in Brazil has disappeared. Estimates of remaining Atlantic forest in Brazil ranged from 1% to 12% (Saatchi et al., 2001). While the Atlantic forest in eastern Paraguay only accounts for a small portion of the geographic area of the Atlantic Forest ecoregion, it has an improportio- nately high level of species diversity. The number of vascular Remote Sensing of Environment xx (2006) xxx – xxx + MODEL RSE-06680; No of Pages 7 www.elsevier.com/locate/rse ⁎ Corresponding author. 2181 LeFrak Hall, Department of Geography, University of Maryland, College Park, MD 20742, U.S.A. Tel.: +1 301 314 2585; fax: +1 301 314 9299. E-mail address: [email protected] (C. Huang). 0034-4257/$ - see front matter © 2006 Elsevier Inc. All rights reserved. doi:10.1016/j.rse.2006.09.016 ARTICLE IN PRESS Please cite this article as: Chengquan Huang et al., Rapid loss of Paraguay's Atlantic forest and the status of protected areas — A Landsat assessment, Remote Sensing of Environment (2006), doi:10.1016/j.rse.2006.09.016

Welcome message from author
This document is posted to help you gain knowledge. Please leave a comment to let me know what you think about it! Share it to your friends and learn new things together.
Transcript
nt xx (2006) xxx–xxx
+ MODEL
RSE-06680; No of Pages 7
www.elsevier.com/locate/rse
ARTICLE IN PRESS
Remote Sensing of Environme
Rapid loss of Paraguay's Atlantic forest and the statusof protected areas — A Landsat assessment
Chengquan Huang a,⁎, Sunghee Kim b, Alice Altstatt a, John R.G. Townshend a,Paul Davis a,b, Kuan Song a,b, Compton J. Tucker c,a, Oscar Rodas d,
Alberto Yanosky d, Rob Clay d, John Musinsky e
a Department of Geography, University of Maryland, College Park, MD 20742, U.S.A.b Institute for Advanced Computer Studies, University of Maryland, College Park, MD 20742, U.S.A.
c NASA/Goddard Space Flight Center, Greenbelt, MD 20771, U.S.A.d Guyra, Paraguay, Casilla de Correo: 1132, Asuncion, Paraguay
e Conservation International, 1919 M Street, NW, Suite 600, Washington, DC 20036, U.S.A.
Received 4 August 2006; received in revised form 12 September 2006; accepted 14 September 2006
Abstract
Using Landsat images acquired since early 1970s, we have mapped the forest cover and change between 1989 and 2000, and estimated forestarea in 1973 in Paraguay's Atlantic Forest Ecoregion (PAFE). The results revealed that as of 1973, 73.4% of the PAFE region was covered byforest. Since then, the proportion of forested area was quickly reduced to 40.7% by 1989 and further down to 24.9% by 2000. Two competingdeforestation processes contributed to this rapid forest loss, with the first being driven by settlers and the second by large private land owners.During the 1989–2000 period, 80% of deforested areas were cleared by private land owners and 20% by the settlers. Protected areas slowed downforest loss within their boundaries, but not in their surrounding areas. The average percent forest loss in the area within 5 km from the boundary ofParaguay's major forested protected areas was 39% during the 1989–2000 period, which was essentially the same as that for the entire PAFEregion during the same period. The high rates of forest loss in the areas surrounding the protected areas not only left the protected areas highlyisolated as ecological “islands”, they may also be precursors to rapid forest loss within the protected areas. These protected areas are critical to theconservation of many species endemic or limited to the PAFE region and surrounding areas, and should be continuously monitored using recentand future satellite observations.© 2006 Elsevier Inc. All rights reserved.
Keywords: Atlantic forest; Deforestation; Paraguay; Protected area
1. Introduction
The Atlantic forest in South America has been identified asone of the top priority ecosystems for global biological con-servation (Myers, 1988; Olson & Dinerstein, 2002). The foresthas extremely high levels of biodiversity, hosting an estimated20,000 plant species and over 1300 non-fish vertebrate species(Mittermeier et al., 1999). The level of endemism is generally
⁎ Corresponding author. 2181 LeFrak Hall, Department of Geography,University of Maryland, College Park, MD 20742, U.S.A. Tel.: +1 301 3142585; fax: +1 301 314 9299.
E-mail address: [email protected] (C. Huang).
0034-4257/$ - see front matter © 2006 Elsevier Inc. All rights reserved.doi:10.1016/j.rse.2006.09.016
Please cite this article as: Chengquan Huang et al., Rapid loss of Paraguay's AtlanSensing of Environment (2006), doi:10.1016/j.rse.2006.09.016
high. More than 6000 plant species, 60% mammal species, 30%reptiles, and 90% forest amphibians are thought to be endemic,with many found nowhere else on the Earth (Mittermeier et al.,1999; Myers et al., 2000).
Much of the original Atlantic forest was in Brazil, spanningalong the Atlantic coast from the northeast in the state of RioGrande do Norte to the southernmost border, and extendinginland to Argentina and Paraguay in the south. The vast major-ity of the original Atlantic forest in Brazil has disappeared.Estimates of remaining Atlantic forest in Brazil ranged from 1%to 12% (Saatchi et al., 2001). While the Atlantic forest in easternParaguay only accounts for a small portion of the geographicarea of the Atlantic Forest ecoregion, it has an improportio-nately high level of species diversity. The number of vascular
tic forest and the status of protected areas — A Landsat assessment, Remote
Table 1Landsat images used in this study and their acquisition dates
MSS images (1973) TM (1989) and ETM+ (2000) images
WRS1 Acquisition date WRS2 Acquisition date
Path Row Path Row 1989 2000
240 77 05/23/1975 224 77 05/24/1990 03/03/2001240 78 02/23/1973 224 78 04/19/1989 08/05/1999240 79 03/231973 224 79 05/13/1989 03/03/2001241 76 03/14/1973 225 76 11/25/1988 08/01/2001241 77 09/15/1972 225 77 11/18/1991 09/18/2001241 78 02/24/1973 225 78 03/22/1988 08/30/2000241 79 09/15/1972 225 79 01/10/1988 08/01/2001242 76 03/15/1973 226 76 07/06/1989 03/01/2001242 77 03/15/1973 226 77 06/23/1987 03/14/2000
The Worldwide Reference System (WRS) used to index the MSS images(WRS1) is different from that used to index the TM and ETM+ images (WRS2).The format of the acquisition date is mm/dd/yyyy.
2 C. Huang et al. / Remote Sensing of Environment xx (2006) xxx–xxx
ARTICLE IN PRESS
plant species in eastern Paraguay was estimated at the orderof 10,000 (Zardini, 1993), while the number of invertebratespecies in Paraguay was around 100,000 (Catterson & Fragano,2004). Many species endemic or limited to the Atlantic Foresthave been documented in Paraguay, including 5 species ofsocial wasps, 7 amphibian species, 11 reptile species, and 11mammal species, with some found in Paraguay only (Fragano &Clay, 2003). Much of Paraguay's Atlantic forest remained“intact” before 1940, with the main form of deforestation beingselective logging (Cartes, 2003). Since then, however, forestclearance became the major form of deforestation. Massiveloss of Paraguay's forest resources has been reported sincethe 1970s, especially in eastern Paraguay (FAO, 1993, 2001;Sanjurjo & Gauto, 1996).
Using images acquired by the Landsat satellite series, wehave systematically mapped the spatial extent of forest cover in1989 and 2000 and the change between the two epochs for theentire country of Paraguay (Kim et al., submitted for publi-cation), and estimated the total forest area within Paraguay'sAtlantic Forest Ecoregion in the early 1970s using a systematicsampling approach. In this communication, we report on thestatus of Paraguay's Atlantic forest and its change since 1970sbased on analysis of satellite observations, provide insightinto the driving forces of the changes through analyzing thespatial patterns of mapped changes, and discuss the status of theprotected areas in this region.
2. Data and methods
The study area was defined by intersecting Paraguay'scountry boundary with the Atlantic Forest Ecoregion developedby the World Wildlife Foundation (WWF) through the Global200 project (Olson & Dinerstein, 2002). The resultant area of85,502 km2 will be referred to as Paraguay's Atlantic ForestEcoregion (PAFE) hereafter. Nine spatially neighboring Land-sat images were required to make a wall-to-wall coverage ofthe PAFE region. Three sets of Landsat images were used inthis analysis. The first set consisted of Multi-Spectral Scanner(MSS) images having a nominal acquisition year of 1973. Thesecond set consisted of Thematic Mapper (TM) images having anominal acquisition year of 1989. The third set consisted ofEnhanced Thematic Mapper Plus (ETM+) images having anominal acquisition year of 2000. The pixel size of the MSSimages was 57 m and that for TM and ETM+ images was28.5 m. Table 1 lists the images used in this study.
The Landsat images were geometrically and radiometricallycorrected using standard image preprocessing methods (Irish,2000). Furthermore, theMSS andTM images were orthorectifiedto achieve high geolocation accuracy (Tucker et al., 2004). TheETM+ images were coregistered to TM images using manuallycollected ground control points. The residual coregistration errorbetween the two sets of images was less than 0.5 pixel.
2.1. 1989–2000 forest cover change mapping and validation
The TM and ETM+ images were used to develop a wall-to-wall forest cover change map using an iterative clustering-
Please cite this article as: Chengquan Huang et al., Rapid loss of Paraguay's AtlanSensing of Environment (2006), doi:10.1016/j.rse.2006.09.016
supervised labeling (ICSL) method. This method was used toanalyze one pair of TM–ETM+ images at a time. It consisted ofunsupervised clustering using the isodata algorithm (Tou &Gonzalez, 1974) and supervised labeling of clusters usingtraining pixels, and was applied iteratively to resolve spectralconfusions among the concerned classes. Requiring intensivehuman inputs, this method could produce highly reliable resultseven when the input images were acquired in different seasonsof the year (e.g. Steininger et al., 2001). It was previously usedto produce forest cover change products for pan-Amazon coun-tries including Bolivia, Peru, Columbia, and Ecuador (Town-shend et al., 1995). More details on the ICSL method wereprovided by Kim et al. (submitted for publication). The pro-duced map had four major classes: forest, non-forest, water, anddeforestation. The first three classes refer to pixels thatremained the same class in both nominal years 1989 and2000. The deforestation class refers to pixels being forest in1989 and non-forest in 2000. Bad data such as cloud andshadow in either or both dates were labeled appropriately.
The developed forest cover change map was validated atthree levels. First, because the ICSL method required intensivehuman interventions, the change map was consistently inspectedagainst the input images as the map was developed. Anymisclassification errors identified at this stage were fixed.Second, the change map was carefully evaluated by all authorsof this paper and by some local experts who had extensiveknowledge on Paraguay's land cover. Finally, some high spatialresolution data were available to this study, including aQuickBird image covering a single area of 64 km2 and 136aerial photos clustered at five locations covering a total area of91.8 km2. With the QuickBird image acquired in 2002 and theaerial photos acquired between 1999 and 2003, these highresolution images were used as reference data to assess theaccuracy of the mapped forest cover in the 2000 epoch for theareas covered by them.We first split the forest cover change mapinto a 1989 forest cover map and a 2000 forest cover map. Wethen randomly selected 325 samples within the area covered bytheQuickBird image and 392 samples within the area covered bythe 136 aerial photos. Here each sample was a 28.5 m TM pixel.The actual cover type at each sample location was determined by
tic forest and the status of protected areas — A Landsat assessment, Remote
3C. Huang et al. / Remote Sensing of Environment xx (2006) xxx–xxx
ARTICLE IN PRESS
visually interpreting the high resolution images. Overall accu-racy as well as user's and producer's accuracies for the two areaswas calculated according to Stehman (1997).
2.2. Forest cover estimation for 1973
Because theMSS images had different spatial resolutions andspectral characteristics than the TM images, forest cover changebetween nominal year 1973 and 1989 was not mapped using thewall-to-wall approach. In order to estimate the total forest area innominal year 1973, we visually interpreted samples systemat-ically selected across the entire PAFE region. Specifically,samples were selected at an interval of 0.15° in both latitudinaland longitudinal directions. This yielded 342 samples for theentire study area. For each sample location, a window of 3 by 3MSS pixels (2.9 ha) centered at the sample location was visuallyinterpreted to determine if the sample location was forest or non-forest. To ensure that forest areas estimated using this samplingapproach and that calculated based on the wall-to-wall mappingapproach were comparable, we also applied the samplingapproach to the 1989 TM images and obtained almost the sameestimate of total forest area as that derived using the wall-to-wallmapping approach. The total forest area estimated using the twoapproaches only differed by 0.4%.
2.3. Change pattern analysis
In order to understand the social economic driving forces offorest change, we analyzed the spatial patterns of mappedchanges. While many social economic forces may have con-tributed to forest loss in this region (Macedo&Cartes, 2003), twoof them stood out in eastern Paraguay. One was the country'slong time perception of forest as unproductive land. Forest wasviewed as “an obstacle to agricultural production and a land ofwild animals and vermin” (Cartes, 2003). The other factor waswidespread land disputes caused by long time inequalities in landtenure. Due to lack of public land to be offered under settlementplans, private lands were often “invaded” and expropriated bysettlers, resulting in two competing deforestation processes. Onthe one hand, the land expropriated by squatters was converted tosmall patches of farmland, typically 10 ha per plot (Nagel, 1999).
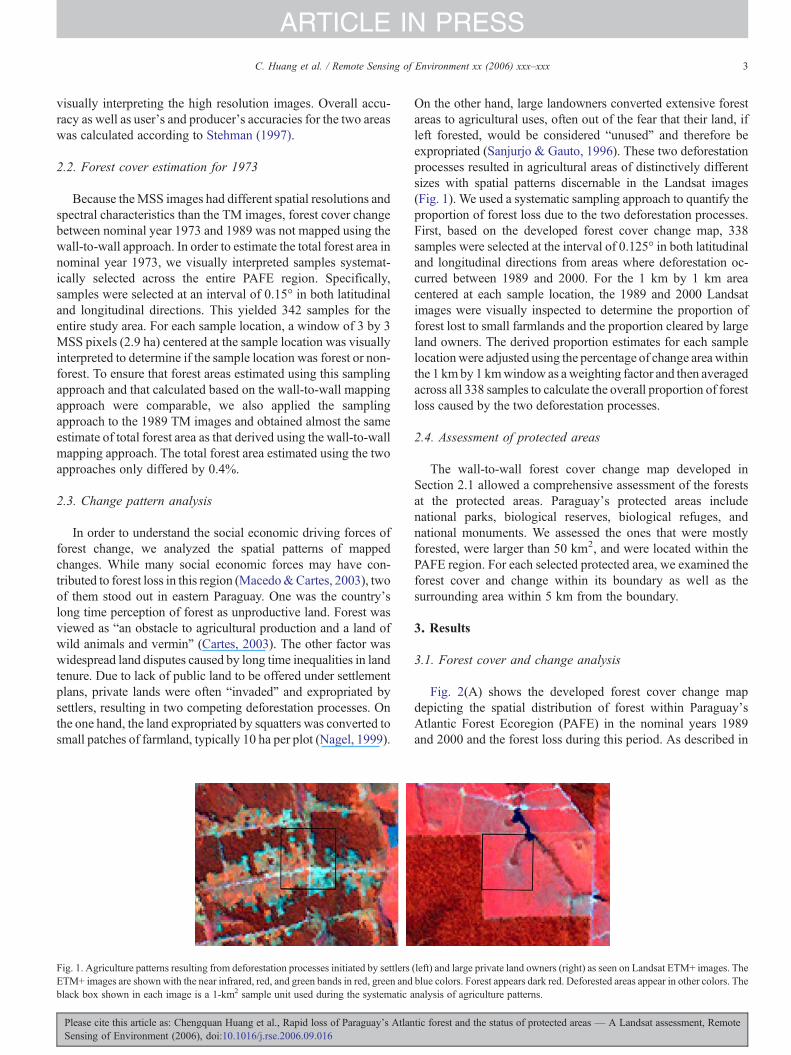
Fig. 1. Agriculture patterns resulting from deforestation processes initiated by settlersETM+ images are shown with the near infrared, red, and green bands in red, green andblack box shown in each image is a 1-km2 sample unit used during the systematic a
Please cite this article as: Chengquan Huang et al., Rapid loss of Paraguay's AtlanSensing of Environment (2006), doi:10.1016/j.rse.2006.09.016
On the other hand, large landowners converted extensive forestareas to agricultural uses, often out of the fear that their land, ifleft forested, would be considered “unused” and therefore beexpropriated (Sanjurjo & Gauto, 1996). These two deforestationprocesses resulted in agricultural areas of distinctively differentsizes with spatial patterns discernable in the Landsat images(Fig. 1). We used a systematic sampling approach to quantify theproportion of forest loss due to the two deforestation processes.First, based on the developed forest cover change map, 338samples were selected at the interval of 0.125° in both latitudinaland longitudinal directions from areas where deforestation oc-curred between 1989 and 2000. For the 1 km by 1 km areacentered at each sample location, the 1989 and 2000 Landsatimages were visually inspected to determine the proportion offorest lost to small farmlands and the proportion cleared by largeland owners. The derived proportion estimates for each samplelocationwere adjusted using the percentage of change area withinthe 1 kmby 1 kmwindow as aweighting factor and then averagedacross all 338 samples to calculate the overall proportion of forestloss caused by the two deforestation processes.
2.4. Assessment of protected areas
The wall-to-wall forest cover change map developed inSection 2.1 allowed a comprehensive assessment of the forestsat the protected areas. Paraguay's protected areas includenational parks, biological reserves, biological refuges, andnational monuments. We assessed the ones that were mostlyforested, were larger than 50 km2, and were located within thePAFE region. For each selected protected area, we examined theforest cover and change within its boundary as well as thesurrounding area within 5 km from the boundary.
3. Results
3.1. Forest cover and change analysis
Fig. 2(A) shows the developed forest cover change mapdepicting the spatial distribution of forest within Paraguay'sAtlantic Forest Ecoregion (PAFE) in the nominal years 1989and 2000 and the forest loss during this period. As described in
(left) and large private land owners (right) as seen on Landsat ETM+ images. Theblue colors. Forest appears dark red. Deforested areas appear in other colors. Thenalysis of agriculture patterns.
tic forest and the status of protected areas — A Landsat assessment, Remote
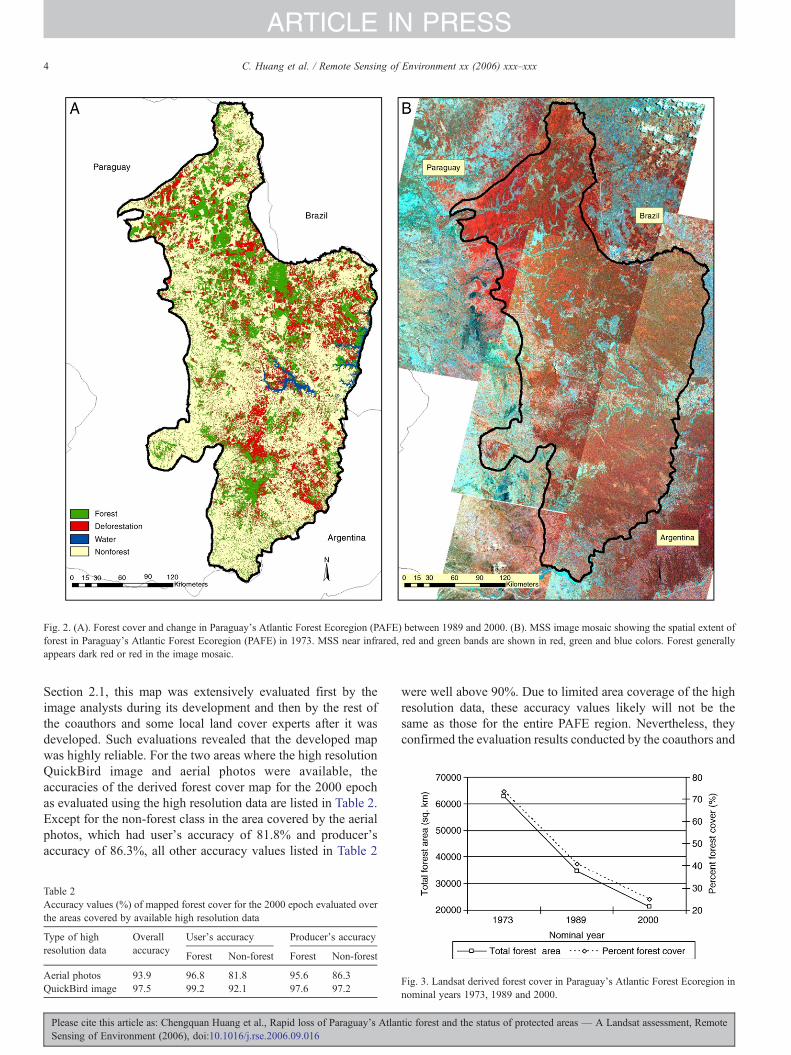
Fig. 2. (A). Forest cover and change in Paraguay's Atlantic Forest Ecoregion (PAFE) between 1989 and 2000. (B). MSS image mosaic showing the spatial extent offorest in Paraguay's Atlantic Forest Ecoregion (PAFE) in 1973. MSS near infrared, red and green bands are shown in red, green and blue colors. Forest generallyappears dark red or red in the image mosaic.
4 C. Huang et al. / Remote Sensing of Environment xx (2006) xxx–xxx
ARTICLE IN PRESS
Section 2.1, this map was extensively evaluated first by theimage analysts during its development and then by the rest ofthe coauthors and some local land cover experts after it wasdeveloped. Such evaluations revealed that the developed mapwas highly reliable. For the two areas where the high resolutionQuickBird image and aerial photos were available, theaccuracies of the derived forest cover map for the 2000 epochas evaluated using the high resolution data are listed in Table 2.Except for the non-forest class in the area covered by the aerialphotos, which had user's accuracy of 81.8% and producer'saccuracy of 86.3%, all other accuracy values listed in Table 2
Table 2Accuracy values (%) of mapped forest cover for the 2000 epoch evaluated overthe areas covered by available high resolution data
Type of highresolution data
Overallaccuracy
User's accuracy Producer's accuracy
Forest Non-forest Forest Non-forest
Aerial photos 93.9 96.8 81.8 95.6 86.3QuickBird image 97.5 99.2 92.1 97.6 97.2
Please cite this article as: Chengquan Huang et al., Rapid loss of Paraguay's AtlanSensing of Environment (2006), doi:10.1016/j.rse.2006.09.016
were well above 90%. Due to limited area coverage of the highresolution data, these accuracy values likely will not be thesame as those for the entire PAFE region. Nevertheless, theyconfirmed the evaluation results conducted by the coauthors and
Fig. 3. Landsat derived forest cover in Paraguay's Atlantic Forest Ecoregion innominal years 1973, 1989 and 2000.
tic forest and the status of protected areas — A Landsat assessment, Remote
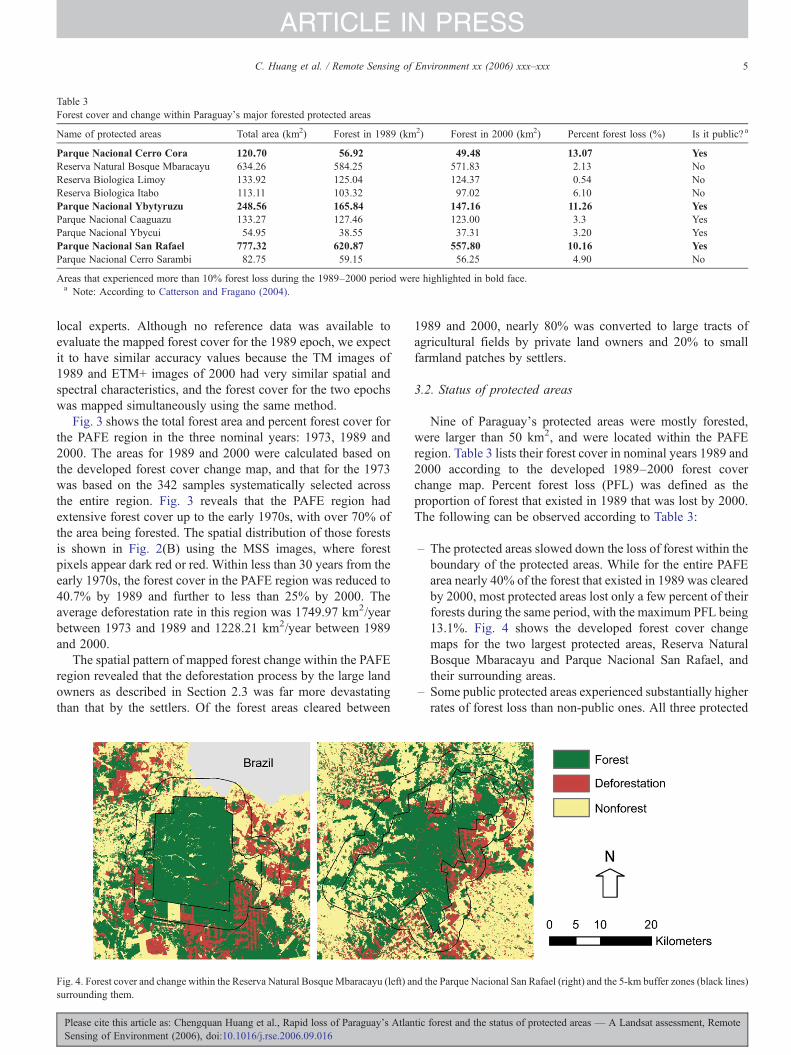
Table 3Forest cover and change within Paraguay's major forested protected areas
Name of protected areas Total area (km2) Forest in 1989 (km2) Forest in 2000 (km2) Percent forest loss (%) Is it public? a
Parque Nacional Cerro Cora 120.70 56.92 49.48 13.07 YesReserva Natural Bosque Mbaracayu 634.26 584.25 571.83 2.13 NoReserva Biologica Limoy 133.92 125.04 124.37 0.54 NoReserva Biologica Itabo 113.11 103.32 97.02 6.10 NoParque Nacional Ybytyruzu 248.56 165.84 147.16 11.26 YesParque Nacional Caaguazu 133.27 127.46 123.00 3.3 YesParque Nacional Ybycui 54.95 38.55 37.31 3.20 YesParque Nacional San Rafael 777.32 620.87 557.80 10.16 YesParque Nacional Cerro Sarambi 82.75 59.15 56.25 4.90 No
Areas that experienced more than 10% forest loss during the 1989–2000 period were highlighted in bold face.a Note: According to Catterson and Fragano (2004).
5C. Huang et al. / Remote Sensing of Environment xx (2006) xxx–xxx
ARTICLE IN PRESS
local experts. Although no reference data was available toevaluate the mapped forest cover for the 1989 epoch, we expectit to have similar accuracy values because the TM images of1989 and ETM+ images of 2000 had very similar spatial andspectral characteristics, and the forest cover for the two epochswas mapped simultaneously using the same method.
Fig. 3 shows the total forest area and percent forest cover forthe PAFE region in the three nominal years: 1973, 1989 and2000. The areas for 1989 and 2000 were calculated based onthe developed forest cover change map, and that for the 1973was based on the 342 samples systematically selected acrossthe entire region. Fig. 3 reveals that the PAFE region hadextensive forest cover up to the early 1970s, with over 70% ofthe area being forested. The spatial distribution of those forestsis shown in Fig. 2(B) using the MSS images, where forestpixels appear dark red or red. Within less than 30 years from theearly 1970s, the forest cover in the PAFE region was reduced to40.7% by 1989 and further to less than 25% by 2000. Theaverage deforestation rate in this region was 1749.97 km2/yearbetween 1973 and 1989 and 1228.21 km2/year between 1989and 2000.
The spatial pattern of mapped forest change within the PAFEregion revealed that the deforestation process by the large landowners as described in Section 2.3 was far more devastatingthan that by the settlers. Of the forest areas cleared between
Fig. 4. Forest cover and change within the Reserva Natural BosqueMbaracayu (left) asurrounding them.
Please cite this article as: Chengquan Huang et al., Rapid loss of Paraguay's AtlanSensing of Environment (2006), doi:10.1016/j.rse.2006.09.016
1989 and 2000, nearly 80% was converted to large tracts ofagricultural fields by private land owners and 20% to smallfarmland patches by settlers.
3.2. Status of protected areas
Nine of Paraguay's protected areas were mostly forested,were larger than 50 km2, and were located within the PAFEregion. Table 3 lists their forest cover in nominal years 1989 and2000 according to the developed 1989–2000 forest coverchange map. Percent forest loss (PFL) was defined as theproportion of forest that existed in 1989 that was lost by 2000.The following can be observed according to Table 3:
– The protected areas slowed down the loss of forest within theboundary of the protected areas. While for the entire PAFEarea nearly 40% of the forest that existed in 1989 was clearedby 2000, most protected areas lost only a few percent of theirforests during the same period, with the maximum PFL being13.1%. Fig. 4 shows the developed forest cover changemaps for the two largest protected areas, Reserva NaturalBosque Mbaracayu and Parque Nacional San Rafael, andtheir surrounding areas.
– Some public protected areas experienced substantially higherrates of forest loss than non-public ones. All three protected
nd the Parque Nacional San Rafael (right) and the 5-km buffer zones (black lines)
tic forest and the status of protected areas — A Landsat assessment, Remote
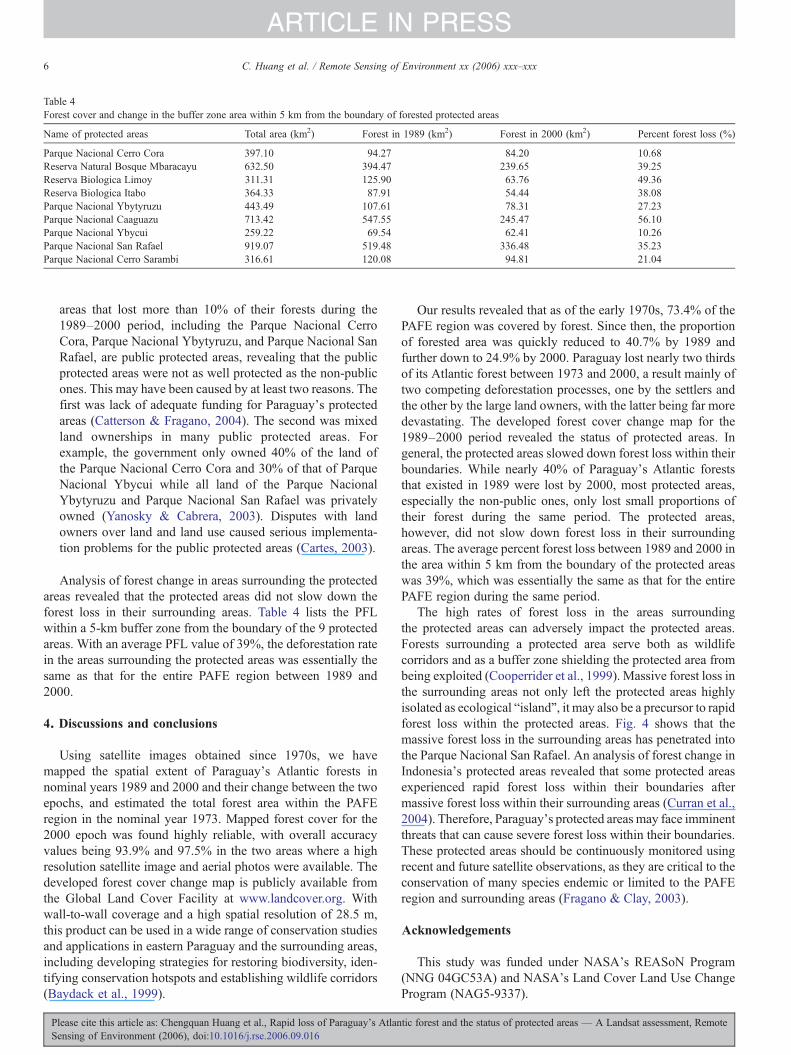
Table 4Forest cover and change in the buffer zone area within 5 km from the boundary of forested protected areas
Name of protected areas Total area (km2) Forest in 1989 (km2) Forest in 2000 (km2) Percent forest loss (%)
Parque Nacional Cerro Cora 397.10 94.27 84.20 10.68Reserva Natural Bosque Mbaracayu 632.50 394.47 239.65 39.25Reserva Biologica Limoy 311.31 125.90 63.76 49.36Reserva Biologica Itabo 364.33 87.91 54.44 38.08Parque Nacional Ybytyruzu 443.49 107.61 78.31 27.23Parque Nacional Caaguazu 713.42 547.55 245.47 56.10Parque Nacional Ybycui 259.22 69.54 62.41 10.26Parque Nacional San Rafael 919.07 519.48 336.48 35.23Parque Nacional Cerro Sarambi 316.61 120.08 94.81 21.04
6 C. Huang et al. / Remote Sensing of Environment xx (2006) xxx–xxx
ARTICLE IN PRESS
areas that lost more than 10% of their forests during the1989–2000 period, including the Parque Nacional CerroCora, Parque Nacional Ybytyruzu, and Parque Nacional SanRafael, are public protected areas, revealing that the publicprotected areas were not as well protected as the non-publicones. This may have been caused by at least two reasons. Thefirst was lack of adequate funding for Paraguay's protectedareas (Catterson & Fragano, 2004). The second was mixedland ownerships in many public protected areas. Forexample, the government only owned 40% of the land ofthe Parque Nacional Cerro Cora and 30% of that of ParqueNacional Ybycui while all land of the Parque NacionalYbytyruzu and Parque Nacional San Rafael was privatelyowned (Yanosky & Cabrera, 2003). Disputes with landowners over land and land use caused serious implementa-tion problems for the public protected areas (Cartes, 2003).
Analysis of forest change in areas surrounding the protectedareas revealed that the protected areas did not slow down theforest loss in their surrounding areas. Table 4 lists the PFLwithin a 5-km buffer zone from the boundary of the 9 protectedareas. With an average PFL value of 39%, the deforestation ratein the areas surrounding the protected areas was essentially thesame as that for the entire PAFE region between 1989 and2000.
4. Discussions and conclusions
Using satellite images obtained since 1970s, we havemapped the spatial extent of Paraguay's Atlantic forests innominal years 1989 and 2000 and their change between the twoepochs, and estimated the total forest area within the PAFEregion in the nominal year 1973. Mapped forest cover for the2000 epoch was found highly reliable, with overall accuracyvalues being 93.9% and 97.5% in the two areas where a highresolution satellite image and aerial photos were available. Thedeveloped forest cover change map is publicly available fromthe Global Land Cover Facility at www.landcover.org. Withwall-to-wall coverage and a high spatial resolution of 28.5 m,this product can be used in a wide range of conservation studiesand applications in eastern Paraguay and the surrounding areas,including developing strategies for restoring biodiversity, iden-tifying conservation hotspots and establishing wildlife corridors(Baydack et al., 1999).
Please cite this article as: Chengquan Huang et al., Rapid loss of Paraguay's AtlanSensing of Environment (2006), doi:10.1016/j.rse.2006.09.016
Our results revealed that as of the early 1970s, 73.4% of thePAFE region was covered by forest. Since then, the proportionof forested area was quickly reduced to 40.7% by 1989 andfurther down to 24.9% by 2000. Paraguay lost nearly two thirdsof its Atlantic forest between 1973 and 2000, a result mainly oftwo competing deforestation processes, one by the settlers andthe other by the large land owners, with the latter being far moredevastating. The developed forest cover change map for the1989–2000 period revealed the status of protected areas. Ingeneral, the protected areas slowed down forest loss within theirboundaries. While nearly 40% of Paraguay's Atlantic foreststhat existed in 1989 were lost by 2000, most protected areas,especially the non-public ones, only lost small proportions oftheir forest during the same period. The protected areas,however, did not slow down forest loss in their surroundingareas. The average percent forest loss between 1989 and 2000 inthe area within 5 km from the boundary of the protected areaswas 39%, which was essentially the same as that for the entirePAFE region during the same period.
The high rates of forest loss in the areas surroundingthe protected areas can adversely impact the protected areas.Forests surrounding a protected area serve both as wildlifecorridors and as a buffer zone shielding the protected area frombeing exploited (Cooperrider et al., 1999). Massive forest loss inthe surrounding areas not only left the protected areas highlyisolated as ecological “island”, it may also be a precursor to rapidforest loss within the protected areas. Fig. 4 shows that themassive forest loss in the surrounding areas has penetrated intothe Parque Nacional San Rafael. An analysis of forest change inIndonesia's protected areas revealed that some protected areasexperienced rapid forest loss within their boundaries aftermassive forest loss within their surrounding areas (Curran et al.,2004). Therefore, Paraguay's protected areas may face imminentthreats that can cause severe forest loss within their boundaries.These protected areas should be continuously monitored usingrecent and future satellite observations, as they are critical to theconservation of many species endemic or limited to the PAFEregion and surrounding areas (Fragano & Clay, 2003).
Acknowledgements
This study was funded under NASA's REASoN Program(NNG 04GC53A) and NASA's Land Cover Land Use ChangeProgram (NAG5-9337).
tic forest and the status of protected areas — A Landsat assessment, Remote
7C. Huang et al. / Remote Sensing of Environment xx (2006) xxx–xxx
ARTICLE IN PRESS
References
Baydack, R. K., Campa, H. I., & Haufler, J. B. (Eds.). (1999). Practicalapproaches to the conservation of biological diversity (pp. 313).Washington,DC: Island Press.
Cartes, J. L. (2003). Brief history of conservation in the interior Atlantic forest.In C. Galindo-Leal & I.d.G. Camara (Eds.), The Atlantic forest ofSouth America: Biodiversity status, threats, and outlook (pp. 269−287).Washington: Island Press.
Catterson, T. M., & Fragano, F. V. (2004). Tropical forestry and biodiversityconservation in Paraguay: Final report of a section 118/119 assessment,EPIQ II task no. 1. Asuncion, Paraguay: USAID.
Cooperrider, A. Y., Day, S., & Jacoby, C. (1999). The bioreserve strategyfor conserving biodiversity. In R. K. Baydack, H. I. Campa, & J. B. Haufler(Eds.), Practical approaches to the conservation of biological diversity(pp. 35−53). Washington, DC: Island Press.
Curran, L. M., Trigg, S. N., McDonald, A. K., Astiani, D., Hardiono, Y. M.,Siregar, P., et al. (2004). Lowland forest loss in protected areas of IndonesianBorneo. Science, 303, 1000.
FAO (1993). Global forest resources assessment 1990 — Tropical countries.FAO forestry paper, vol. 112. Rome: Food and Agriculture Organizationof the United Nations.
FAO (2001). Global forest resources assessment 2000 — Main report. FAOforestry paper, vol. 140. Rome: Food and Agriculture Organization of theUnited Nations.
Fragano, F., & Clay, R. (2003). Biodiversity status of the interior Atlantic forestof Paraguay. In C. Galindo-Leal & I.d.G. Camara (Eds.), The Atlantic forestof South America: Biodiversity status, threats, and outlook (pp. 288−309).Washington: Island Press.
Irish, R. R. (2000). Landsat 7 science data user's handbook. NationalAeronautics and Space Administration http://ltpwww.gsfc.nasa.gov/IAS/handbook/handbook_toc.html.
Kim, S., Altstatt, A., Huang, C., Song, K., Townshend, J. R. G., Davis, P., et al.,(submitted for publication). Assessment of Paraguay's forest cover changeusing Landsat observations. Global and Planetary Change.
Macedo, A. M., & Cartes, J. L. (2003). Socioeconomic drivers in the interiorAtlantic forest. In C. Galindo-Leal & I.d.G. Camara (Eds.), The Atlantic forestof South America: Biodiversity status, threats, and outlook (pp. 310−324).Washington: Island Press.
Mittermeier, R. A., Myers, N., & Mittermeier, C. G. (1999). Hotspots: Earth'sbiologically richest and most endangered terrestrial ecoregions (pp. 430).Washington, DC: CEMEX and Conservation International.
Please cite this article as: Chengquan Huang et al., Rapid loss of Paraguay's AtlanSensing of Environment (2006), doi:10.1016/j.rse.2006.09.016
Myers, N. (1988). Threatened biotas: “Hot spots” in tropical forests. TheEnvironmentalist, 8, 187−208.
Myers, N., Mittermeier, R. A., Mittermeier, C. G., Fonseca, G. B. D., & Kent,J. (2000). Biodiversity hotspots for conservation priorities. Nature, 403,853−858.
Nagel, B. Y. (1999). “Unleashing the fury”: The cultural discourse of ruralviolence and land rights in Paraguay. Comparative Studies in Society andHistory, 41, 148−181.
Olson, D. M., & Dinerstein, E. (2002). The global 200: Priority ecoregionsfor global conservation. Annals of the Missouri Botanical Garden, 89,199−224.
Saatchi, S., Agosti, D., Alger, K., Delabie, J., & Musinsky, J. (2001).Examining fragmentation and loss of primary forest in the southern BahianAtlantic forest of Brazil with radar imagery. Conservation Biology, 15,867−875.
Sanjurjo, M., & Gauto, R. (1996). Paraguay. In C. S. Harcourt & J. A. Sayer(Eds.),The conservation atlas of tropical forests: The Americas (pp. 286−293).New York: Simon & Schuster.
Stehman, S. V. (1997). Selecting and interpreting measures of thematicclassification accuracy. Remote Sensing of Environment, 62, 77−89.
Steininger, M. K., Desch, A., Bell, V., Ernst, P., Tucker, C. J., Townshend,J. R. G., et al. (2001). Tropical deforestation in the Bolivian Amazon.Environmental Conservation, 28, 127−134.
Tou, J. T., & Gonzalez, R. C. (1974). Pattern recognition principles (pp. appliedmathematics and computation. London: Addison-Wesley PublishingCompany.
Townshend, J. R. G., Bell, V., Desch, A. C., Havlicek, C., Justice, C. O.,Lawrence, W. E., et al. (1995). The NASA Landsat Pathfinder HumidTropical Deforestation Project. Land satellite information in the next decade(pp. 76−87). Virginia: Tyson's Corner.
Tucker, C. J., Grant, D. M., & Dykstra, J. D. (2004). NASA's globalorthorectified Landsat data set. Photogrammetric Engineering & RemoteSensing, 70, 313−322.
Yanosky, A., & Cabrera, E. (2003). Conservation capacity in the interior Atlanticforest of Paraguay. In C. Galindo-Leal & I.d.G. Camara (Eds.), The Atlanticforest of South America: Biodiversity status, threats, and outlook (pp.328−354). Washington: Island Press.
Zardini, E. M. (1993). Paraguay's floristic inventory. Research & Exploration,9, 128−131.
tic forest and the status of protected areas — A Landsat assessment, Remote
Related Documents