BIODIVERSITY RESEARCH Rapid deforestation threatens mid-elevational endemic birds but climate change is most important at higher elevations J. Berton C. Harris 1,2 *, Dadang Dwi Putra 3 , Stephen D. Gregory 1,4 , Barry W. Brook 1 , Dewi M. Prawiradilaga 5 , Navjot S. Sodhi 6† , Dan Wei 7 and Damien A. Fordham 1 1 Environment Institute and School of Earth and Environmental Sciences, University of Adelaide, Adelaide, SA 5005, Australia, 2 Woodrow Wilson School of Public and International Affairs, Princeton University, Princeton, NJ 08542, USA, 3 Celebes Bird Club, Jl. Thamrin 63A, Palu, Central Sulawesi, Indonesia, 4 Game and Wildlife Conservation Trust, Salmon and Trout Research Centre, Wareham BH20 6BB, UK 5 Division of Zoology, Research Centre for Biology-LIPI, Jl. Raya Bogor Km 46, Cibinong-Bogor, 16911, Indonesia, 6 Department of Biological Sciences, National University of Singapore, 14 Science Drive 4, Singapore, 117543, Singapore, 7 Stawell Secondary College, Patrick St., Stawell, Vic., 3380, Australia *Correspondence: J. Berton C. Harris, Woodrow Wilson School of Public and International Affairs, Princeton University, Robertson Hall 406, Princeton, NJ 08544, USA. E-mails: [email protected], [email protected] † Deceased. ABSTRACT Aim Deforestation and climate change are two of the most serious threats to tropical birds. Here, we combine fine-scale climatic and dynamic land cover models to forecast species vulnerability in rain forest habitats. Location Sulawesi, Indonesia. Methods We sampled bird communities on four mountains across three sea- sons in Lore Lindu National Park, Sulawesi, Indonesia (a globally important hotspot of avian endemism), to characterize relationships between elevation and abundance. Deforestation from 2000 to 2010 was quantified, and predic- tors of deforestation were identified. Future forest area was projected under two land use change scenarios – one assuming current deforestation rates and another assuming a 50% reduction in deforestation. A digital elevation model and an adiabatic lapse rate were used to create a fine-scale map of temperature in the national park. Then, the effects of climate change were projected by fitting statistical models of species abundance as a function of current tempera- ture and forecasting future abundance based on warming from low- and high- emissions climate change. Results The national park lost 11.8% of its forest from 2000 to 2010. Model- based projections indicate that high-elevation species (white-eared myza Myza sarasinorum and Sulawesi leaf-warbler Phylloscopus sarasinorum) might be buf- fered from deforestation because their ranges are isolated from human settlement, but these species may face steep population declines from climate change (by as much as 61%). The middle-elevation sulphur-bellied whistler Pachycephala sulfu- riventer is predicted to undergo minor declines from climate change (8–11% reduction), while deforestation is predicted to cause larger declines of 13–19%. Main conclusions The biological richness and rapid deforestation now occur- ring inside the national park emphasize the need for increased enforcement, while our modelling suggests that climate change is most threatening to high- elevation endemics. These findings are likely applicable to other highland tropi- cal sites where deforestation is encroaching from below and climate change is stressing high-elevation species from above. Keywords Climate change, endemism, habitat loss, Indonesia, Myza sarasinorum, Pachy- cephala sulfuriventer, Phylloscopus sarasinorum, protected area, Southeast Asia, tropics. DOI: 10.1111/ddi.12180 ª 2014 John Wiley & Sons Ltd http://wileyonlinelibrary.com/journal/ddi 1 Diversity and Distributions, (Diversity Distrib.) (2014) 1–13 A Journal of Conservation Biogeography Diversity and Distributions

Welcome message from author
This document is posted to help you gain knowledge. Please leave a comment to let me know what you think about it! Share it to your friends and learn new things together.
Transcript

BIODIVERSITYRESEARCH
Rapid deforestation threatensmid-elevational endemic birds butclimate change is most important athigher elevationsJ. Berton C. Harris1,2*, Dadang Dwi Putra3, Stephen D. Gregory1,4, Barry W.
Brook1, Dewi M. Prawiradilaga5, Navjot S. Sodhi6†, Dan Wei7 and Damien
A. Fordham1
1Environment Institute and School of Earth
and Environmental Sciences, University of
Adelaide, Adelaide, SA 5005, Australia,2Woodrow Wilson School of Public and
International Affairs, Princeton University,
Princeton, NJ 08542, USA, 3Celebes Bird
Club, Jl. Thamrin 63A, Palu, Central
Sulawesi, Indonesia, 4Game and Wildlife
Conservation Trust, Salmon and Trout
Research Centre, Wareham BH20 6BB, UK5Division of Zoology, Research Centre for
Biology-LIPI, Jl. Raya Bogor Km 46,
Cibinong-Bogor, 16911, Indonesia,6Department of Biological Sciences, National
University of Singapore, 14 Science Drive 4,
Singapore, 117543, Singapore, 7Stawell
Secondary College, Patrick St., Stawell, Vic.,
3380, Australia
*Correspondence: J. Berton C. Harris,
Woodrow Wilson School of Public and
International Affairs, Princeton University,
Robertson Hall 406, Princeton, NJ 08544,
USA.
E-mails: [email protected],
†Deceased.
ABSTRACT
Aim Deforestation and climate change are two of the most serious threats to
tropical birds. Here, we combine fine-scale climatic and dynamic land cover
models to forecast species vulnerability in rain forest habitats.
Location Sulawesi, Indonesia.
Methods We sampled bird communities on four mountains across three sea-
sons in Lore Lindu National Park, Sulawesi, Indonesia (a globally important
hotspot of avian endemism), to characterize relationships between elevation
and abundance. Deforestation from 2000 to 2010 was quantified, and predic-
tors of deforestation were identified. Future forest area was projected under
two land use change scenarios – one assuming current deforestation rates and
another assuming a 50% reduction in deforestation. A digital elevation model
and an adiabatic lapse rate were used to create a fine-scale map of temperature
in the national park. Then, the effects of climate change were projected by
fitting statistical models of species abundance as a function of current tempera-
ture and forecasting future abundance based on warming from low- and high-
emissions climate change.
Results The national park lost 11.8% of its forest from 2000 to 2010. Model-
based projections indicate that high-elevation species (white-eared myza Myza
sarasinorum and Sulawesi leaf-warbler Phylloscopus sarasinorum) might be buf-
fered from deforestation because their ranges are isolated from human settlement,
but these species may face steep population declines from climate change (by as
much as 61%). The middle-elevation sulphur-bellied whistler Pachycephala sulfu-
riventer is predicted to undergo minor declines from climate change (8–11%reduction), while deforestation is predicted to cause larger declines of 13–19%.
Main conclusions The biological richness and rapid deforestation now occur-
ring inside the national park emphasize the need for increased enforcement,
while our modelling suggests that climate change is most threatening to high-
elevation endemics. These findings are likely applicable to other highland tropi-
cal sites where deforestation is encroaching from below and climate change is
stressing high-elevation species from above.
Keywords
Climate change, endemism, habitat loss, Indonesia, Myza sarasinorum, Pachy-
cephala sulfuriventer, Phylloscopus sarasinorum, protected area, Southeast Asia,
tropics.
DOI: 10.1111/ddi.12180ª 2014 John Wiley & Sons Ltd http://wileyonlinelibrary.com/journal/ddi 1
Diversity and Distributions, (Diversity Distrib.) (2014) 1–13A
Jou
rnal
of
Cons
erva
tion
Bio
geog
raph
yD
iver
sity
and
Dis
trib
utio
ns

INTRODUCTION
Tropical mountain ranges are critical centres of avian ende-
mism, with about 10% of the world’s bird species being
restricted to tropical highlands (>500-m elevation; Harris
et al., 2011). Steep slopes and high elevations reduce the
pressure of anthropogenic habitat degradation and other
threats such as hunting on many of these species, resulting
in most highland tropical birds being considered of ‘least
concern’ (Sekercioglu et al., 2008; BirdLife International,
2013). Rapid habitat loss means that the bulk of IUCN-
listed species in tropical regions are found in the lowlands,
close to the concentration of human activity (e.g. Brooks
et al., 1997). While highland species have been buffered
from habitat loss in the past, the recent growth of human
populations and the demands of economic development
have put increasing pressure on higher-elevation habitats
(Soh et al., 2006). In coming decades, climate change also
threatens to reduce the habitat available for montane species
(La Sorte & Jetz, 2010; Noske, 2010), with many highland
tropical species facing climate-change-induced range shifts
combined with habitat contraction (Pounds et al., 2005;
Peh, 2007; Forero-Medina et al., 2011a,b; Harris et al., 2012;
Sekercioglu et al., 2012). This is a particularly serious con-
cern for species with few adaptation options, such as moun-
taintop endemics and those with narrow elevational ranges
(Colwell et al., 2008). Worryingly, the impacts of habitat
loss, climate change and other extinction drivers such as
invasive species are likely to interact synergistically (Brook
et al., 2008).
Given this context, studies that forecast species extirpa-
tion vulnerability due to habitat loss, climate change and
their interaction are urgently needed from the tropics. Two
previous analyses used coarse land cover scenarios and an
adiabatic lapse rate (estimate of temperature loss with
increasing elevation) to estimate the vulnerability of the
world’s birds to climate change and habitat loss, and found
that approximately 500 species (5% of the global total) may
go extinct by 2100 under a mid-range warming projection
by global climate models (Jetz et al., 2007; Sekercioglu
et al., 2008). Yet few analyses have projected spatially expli-
cit estimates of tropical deforestation (Soares-Filho et al.,
2006; Cannon et al., 2007; Bird et al., 2012; Green et al.,
2013; Rosa et al., 2013), and fewer still have combined fine-
scale land cover and climate models to produce regional
projections of extirpation vulnerability (Gregory et al.,
2012).
Southeast Asia’s combination of biological richness, varied
landscapes and severe on-going anthropogenic impacts
makes it a clear candidate for exploring the influence of hab-
itat loss and climate change on tropical biodiversity. South-
east Asia has one of the highest concentrations of endemic
species in the world, as a result of the region’s numerous
islands, tectonic history and fluctuating sea levels (Sodhi &
Brook, 2006). Unfortunately, regional deforestation is so
rapid that many species may lose the majority of their range
in the next 20 years (Bradshaw et al., 2009; Miettinen et al.,
2011). Within Southeast Asia, the Sulawesi region of
Indonesia is of special interest because it is among the
world’s richest hotspots of avian endemism, with 42 species
found nowhere else (Coates & Bishop, 1997). Despite this
diversity, Sulawesi is ornithologically one of the least studied
areas in the world, with higher elevations particularly poorly
sampled, and as a result, new bird taxa are still regularly
described (e.g. Madika et al., 2011).
In this study, we combine new data from the field with
global climate and dynamic landscape models to forecast vul-
nerability of endemic birds in Lore Lindu National Park,
Sulawesi. Although Lore Lindu is one of the island’s most
biodiverse reserves, it has suffered from rapid human
encroachment over the last decade (Cannon et al., 2007). We
used three middle- and high-elevation endemic birds as case-
study species to explore the potential effects of habitat loss
and climate change on Lore Lindu’s birds. Given that habitat
loss is pervasive at lower elevations in Sulawesi (Cannon
et al., 2007), and the forecasts of detrimental impacts in pre-
vious climate change studies (e.g. Colwell et al., 2008), we
hypothesized that: (1) habitat loss would threaten middle-
elevation species more than high-elevation species; and (2)
climate change would particularly threaten narrow-ranged
high-elevation species.
METHODS
Study site
Lore Lindu National Park covers 2290 km2 of Central
Sulawesi and is home to approximately 78% of Sulawesi’s
endemic bird species (Coates & Bishop, 1997; Lee et al.,
2007), making it one of the island’s most important pro-
tected areas (Fig. 1). The national park is under considerable
pressure from an increasing human population due to
migration from more populous parts of Indonesia, expansion
of cacao agriculture and illegal logging (Weber et al., 2007;
Clough et al., 2009). Most of the park lies above 1000-m ele-
vation (Fig. S1 in Supporting Information), and 96% of the
park was covered with primary forest in 2000.
Field sampling
We collected avian occurrence data on Mt. Nokilalaki (825–
2365 m; S 1°15.3′, E 120° 10′), Mt. Rorekatimbu (1265–
2525 m; S 1° 17′, E 120° 19′), Mt. Dali (1295–2280 m; S 1°43′, E 120° 9′) and Mt. Rano Rano (480–1920 m; S 1° 39′, E120° 7′) (Fig. 1). These four peaks are among the tallest
mountains in Central Sulawesi and are located at opposite
ends of Lore Lindu, providing broad coverage of elevations
and regions of the park. Our sampling effort was representa-
tive of the distribution of elevations in the park with forested
middle elevations most thoroughly sampled (Fig. S1). In
Appendix S1, we list coordinates of sampling sites and notes
on their land cover in 2010. Our study species are much less
2 Diversity and Distributions, 1–13, ª 2014 John Wiley & Sons Ltd
J. B. C. Harris et al.

common or absent below 1000 m, so our focus on higher
elevations should not substantially impact our results.
We sampled bird communities with 10-minute duration,
50-m-radius point counts, separated by 250 horizontal
metres, along elevational gradients on mountain trails and
roads (Ralph et al., 1995). We sampled 149 points, 126 of
which were forested and within the elevational ranges of our
three study species (Appendix S1). When sampling along
roads (only done on parts of Mt. Rorekatimbu), we entered
the forest ~ 50 m from the road to do the point counts. We
controlled for seasonal variation in abundance by surveying
in three seasons (September–November 2009, May–June
2010 and January–February 2011). Each point was sampled
once in each season (points were visited three times in total).
Co-author D.D.P., who has >10 years’ experience identifying
Central Sulawesi birds by sight and sound, was the primary
observer in all surveys. We practiced distance estimation with
audio playback and a measuring tape to make the aural
50 m estimate more accurate. A Nikon Forestry 550 laser
range finder was used to check visual distance estimates.
Variability in detection may affect abundance estimates
during point counts (Tingley & Beissinger, 2009). We maxi-
mized detection by only censusing birds in the morning on
clear days with little wind (from dawn to 10:30). The poten-
tial for bias from differing detection probabilities along the
altitudinal gradient was evaluated by converting counts to
presence/absence data and modelling the probability of occu-
pancy along the gradient in package unmarked in R v2.14.1
(Fiske & Chandler, 2011; R Development Core Team, 2011).
Given that avian detectability may vary by season, we com-
pared occupancy models that incorporated seasonal variation
in detectability to those that modelled the effect of tempera-
ture on occupancy alone: Ψ(temperature)p(.),Ψ(.)p(season),
Ψ(temperature)p(season), and Ψ(.)p(.). Temperature was
calculated from elevation using an adiabatic lapse rate, and
season was a categorical variable that represented our three
sampling sessions. The Ψ(temperature)p(season) model was
top-ranked for all study species (wAIC of 0.54, 1.0, and 0.92
for Myza sarasinorum, Phylloscopus sarasinorum and
Pachycephala sulfuriventer, respectively). This occupancy
Figure 1 Location of Lore Lindu
National Park and our study area and
sampling sites. The two holes in the
national park are annexed village areas.
N indicates Mt. Nokilalaki, R indicates
Mt. Rorekatimbu, D indicates Mt. Dali,
and RR indicates Mt. Rano Rano.
Diversity and Distributions, 1–13, ª 2014 John Wiley & Sons Ltd 3
Climate and deforestation impacts on tropical birds

relationship was compared with probability of presence from
a binomial model that related temperature to presence/
absence. We postulated that if occupancy (which explicitly
accounts for detection probability) and probability of pres-
ence were similarly related to temperature, then there was no
systematic bias stemming from low detection probability
(Tingley & Beissinger, 2009).
Case-study species
For case-study species, we selected three locally common
endemic birds that differed in their altitudinal habitat prefer-
ences: middle-elevation Pachycephala sulfuriventer (sulphur-
bellied whistler), high-elevation Phylloscopus sarasinorum
(Sulawesi leaf-warbler) and mountaintop Myza sarasinorum
(white-eared myza) (Fig. 2; see Supporting Information for
more natural history information). We refer to the moun-
taintop Myza sarasinorum and high-elevation Phylloscopus
sarasinorum collectively as ‘high-elevation’ species. The three
species were chosen, in part, because they are rarely or never
seen in non-forest habitats in Lore Lindu (our data; Sodhi
et al., 2005; Maas et al., 2009).
Modelling abundance
We characterized the current relationship between tempera-
ture and abundance and forecast the potential effects of
climate change on bird abundance. Temperature alone is a
strong climatic driver of bird distributions in humid tropical
regions (e.g. Shoo et al., 2005a; Forero-Medina et al.,
2011b). We modelled temperature as a function of elevation
using an adiabatic lapse rate conversion. This is because tem-
perature is strongly correlated with elevation on tropical
mountains (Smith & Young, 1987; Bush et al., 2004), chang-
ing rapidly over small horizontal distances (Raxworthy et al.,
2008), and because fine-scale spatial climate layers for
Sulawesi are highly uncertain or unavailable at resolutions
below that of global climate models (Hijmans et al., 2005).
We used a locally measured lapse rate (6.1°C lost per 1000-
m elevation gained) to convert a fine-scale digital elevation
model (30 arc seconds, srtm.csi.cgiar.org) into an average
annual temperature layer of the same resolution. This was
carried out by relating temperature from a lowland weather
station to elevation via the lapse rate (see Appendix S2 for
details).
We then used statistical models to relate temperature to
abundance. We first converted bird abundance estimates
from birds per 0.79 ha (the area encompassed by 50-m point
count circles) to birds per 0.85 ha (30-arc-second cell in
Mea
n nu
mbe
r of
bird
s pe
r su
rvey
0 500 1000 1500 2000 2500 30000.0
0.2
0.4
0.6
0.8
1.0
1.2
1.4
1.6Pachycephala sulfuriventer
Elevation (m)
0.0
0.2
0.4
0.6
0.8
1.0
1.2
1.4
1.6
0 500 1000 1500 2000 2500 3000
Myza sarasinorum
0.0
0.2
0.4
0.6
0.8
1.0
1.2
1.4
1.6
0 500 1000 1500 2000 2500 3000
Phylloscopus sarasinorum
Figure 2 Abundance distributions of study species along
elevational gradients on four mountains in Central Sulawesi.
Average abundance per point count from three sampling
sessions � standard errors are shown. Data from all sample
points are shown including point count surveys where the
species was not recorded.
4 Diversity and Distributions, 1–13, ª 2014 John Wiley & Sons Ltd
J. B. C. Harris et al.

central Sulawesi). Given the strong dependence of the study
species on forest habitats, we set cells without forest as
unsuitable. For the response variable, we considered using
the mean of the counts from the three sampling sessions or
the sum of the counts. We chose to use the sum of the
counts because 47–75% of the counts were zero, depending
on study species, and rounded means would cause a strong
downwards bias in abundance estimates. For example, birds
were frequently recorded singly in only one sampling session,
which gives a mean abundance of 0.33, which rounds to
zero. Nonetheless, the sum of the counts should be viewed
as an upward estimate of abundance. We analysed the zero-
inflated data using a two-step hurdle modelling approach.
Firstly, we modelled the probability of presence, assuming a
binomial distribution and therefore defining suitable habitats
where this probability is non-null. Then, we modelled the
abundance in suitable habitats only, using a truncated
Poisson distribution (Potts & Elith, 2006; Jackman, 2011).
Hurdle models often out-perform other zero-inflated regres-
sion approaches based on integrated distributions (Potts &
Elith, 2006; Zeileis et al., 2008) and are relatively straightfor-
ward to interpret. For each species, we compared linear and
second-order polynomial parameterizations for temperature
to test for nonlinear (e.g. mid-range optimal) relationships
between temperature and abundance that are to be expected
in elevational species distributions (McCain, 2009). Aspect
(compass direction) was also evaluated as a predictor of bird
abundance. Models were built using the pscl package
(Jackman, 2011), and model comparison was carried out in
a maximum-likelihood multimodel inference framework
(Burnham & Andersen, 2002).
Unlike previous lapse-rate-climate-change studies, we eval-
uated the performance of the presence/absence component
of our hurdle models by calculating mean prediction error
(leave-one-out cross-validation), kappa statistics and the area
under the received operating characteristic curve, using the
PresenceAbsence package (Freeman & Moisen, 2008). We
converted from probability of presence to binary presence/
absence using the maximized the sum of sensitivity and spec-
ificity as the threshold (Jim�enez-Valverde & Lobo, 2007).
Population size indices and climate-change
projections
We used the abundance ~ temperature relationships from the
hurdle models of each species (Fig. S2) to generate represen-
tative measures of current population size in our ‘study area’
– portions of the national park that lay within 10 km of our
sampling sites (93,908 ha, approximately 42% of the park;
Fig. 1). We did this by taking the sum of the predicted abun-
dance in each forested cell in the study area (see deforestation
projections below). The resulting population size indices are
more informative than range area metrics that assume cells
of equal carrying capacity because abundance ~ range area
relationships are typically nonlinear (Shoo et al., 2005a; Ford-
ham et al., 2012a). In this study, we report population size
indices as well as range area (all suitable cells) results. By
modelling cell-based abundance directly, we did not need to
make the unrealistic assumption of uniform abundance inside
an elevational bin (Shoo et al., 2005a,b; Gasner et al., 2010).
To project the effects of climate change on future popula-
tion size, we overlaid coarse climate projections on the fine-
scale temperature layer for each year from 2010 to 2050. The
climate projections are mean annual temperature layers,
downscaled to 0.5°, that were generated by combining cli-
mate anomalies from an ensemble of regionally skilful global
climate models using MAGICC/SCENGEN (Fordham et al.,
2012b, 2013) and a gridded temperature dataset that was
chosen because no digital elevation model was used in its
preparation (CRU 3.1 TS; http://badc.nerc.ac.uk/home/index.
html). Climate layers were generated for policy (low) and
reference (high) emissions scenarios, which are similar to the
Representative Concentration Pathway scenarios of RCP6
and RCP2.5, respectively (Van Vuuren et al., 2011) (see
Appendix S2 for details). We modelled the effects of global
warming by recalculating the population size indices using
the parameterizations of the original hurdle models, but
based on the new temperature values in each cell for each
year of projection. Our approach assumes full dispersal and
that the abundance ~ temperature relationship remains the
same as observed today (Shoo et al., 2005a; Gasner et al.,
2010).
Deforestation projections
We measured deforestation and modelled the effects of future
deforestation on our case-study species. We used a raster land
cover dataset that was derived from MODIS imagery and cre-
ated to monitor deforestation in Southeast Asia for this analy-
sis (Miettinen et al., 2011). The relevant land cover categories
for Lore Lindu are lowland (sea level to 750 m), lower mon-
tane (750–1500 m) and upper montane (1500 m +) forest (wecollapsed these as ‘forest’), plantation/regrowth (mostly
degraded forest and secondary vegetation in Lore Lindu), and
mosaic and open (collapsed as ‘agriculture’).
The first step was to measure deforestation by comparing
forest cover in the national park in 2000 and 2010. Then,
following Gregory et al. (2012), we used random forest mod-
els to relate observed land use change to five spatial variables:
elevation, slope, distance from the park boundary, distance
from roads and distance from villages (see Appendix S2 for
details). We used the model to project the amount of forest
cover remaining in the park by 2050 based on two scenarios:
(1) a scenario that maintained deforestation at the current
rate and (2) a scenario that assumed increased enforcement
and (arbitrarily) cut the deforestation rate by half. To simu-
late the loss of easily logged sites in this mountainous
national park, the current rate scenario modelled a 50%
decline in the rate of deforestation once 20% of the park’s
forest had been converted. We chose not to project beyond
the year 2050 because of high uncertainty about forest
management in the far future.
Diversity and Distributions, 1–13, ª 2014 John Wiley & Sons Ltd 5
Climate and deforestation impacts on tropical birds

RESULTS
Predictors of abundance
Phylloscopus sarasinorum and Myza sarasinorum preferred
higher elevations and had narrower ranges compared with
Pachycephala sulfuriventer (Fig. 2). The high-elevation spe-
cies also tended to be more common than Pachycephala
sulfuriventer (Fig. 2). The linear parameterization of temper-
ature was the best predictor of Myza sarasinorum abun-
dance, while the second-degree quadratic function of
temperature was the best predictor for the other two spe-
cies (Table 1). There was no support for aspect as a predic-
tor of abundance for any of the study species (Table 1).
The fitted binomial components of the hurdle models
matched the patterns of occupancy (Fig. S3), suggesting
that there was no systematic bias from low detection proba-
bility. Our combination of fitted hurdle-abundance models
and the temperature layer created with the lapse rate sug-
gests our study area could currently support approximately
14,000, 40,000, and 70,000 individuals of Myza sarasinorum,
Phylloscopus sarasinorum and Pachycephala sulfuriventer,
respectively (Table S1). The model validation methods
found 24.5% prediction error, kappa = 0.81 � 0.06, and
AUC = 0.97 for Myza sarasinorum; 43.9% prediction error,
kappa = 0.52 � 0.08, and AUC = 0.82 for Phylloscopus
sarasinorum; and 47.9% prediction error; kappa = 0.42 �0.08, and AUC = 0.74 for Pachycephala sulfuriventer
(Fig. S4).
Deforestation and climate change
Our analysis indicates that Lore Lindu National Park was
deforested extremely rapidly from 2000 to 2010 (11.8%
cleared), which was faster than Sulawesi as a whole (10.8%;
Miettinen et al., 2011) (Table 2). The most important pre-
dictors of deforestation were elevation, slope and distance
from roads (Fig. S5), with lower rates at higher elevations, in
steeper areas, and further from roads. Our land use-change
models predict that widespread deforestation of the national
park may occur in the coming decades (34–40% of the park
deforested by 2050), even if the deforestation rate is cut by
half (Table 2; Fig. 3). Similarities in predicted forest loss
between the two scenarios were the result of both scenarios
quickly reaching 20% deforestation, and the deforestation
rate consequently being halved (to simulate the loss of easily
logged areas). Deforestation in the study area was slightly
greater than in the national park. This difference probably
resulted because the heavily impacted valley between Mts.
Nokilalaki and Rorekatimbu takes up a disproportionate
amount of the study area compared with the national park
as a whole (Fig. 3; Table 2).
The climate models predicted 0.7–0.9°C of warming in the
region by 2050 for low- and high-emissions scenarios,
respectively. This predicted warming is forecast to cause up
to a 47% decline in range area for the mountaintop Myza
sarasinorum, while deforestation will only invoke minor
declines of <4% (Fig. 4; Table S1). Projected climate change
also had much larger impacts on population size of Myza
Table 1 Table of hurdle model results for abundance of three case-study montane tropical bird species in Sulawesi, Indonesia. Temp
stands for temperature (continuous predictor). Aspect is the cardinal direction faced from the point count (4 nominal categories)
Species Model % DE Evidence ratio DAICc wi df
Myza sarasinorum Temp 37.9 0 0.789 4
Temp + temp2 38.3 4.1 2.8 0.194 6
Temp + aspect 39.5 52.4 7.9 0.015 10
Temp + temp2 + aspect 39.6 344.3 11.7 0.002 12
Null 0 >10,000 89.3 0 2
Aspect 4.4 >10,000 90.3 0 8
Phylloscopus sarasinorum Temp + temp2 19.9 0 0.918 6
Temp + temp2 + aspect 22.1 12.5 5.0 0.074 12
Temp 15.6 116.8 9.5 0.008 4
Temp + aspect 17.5 2522.1 15.7 0 10
Null 0 >10,000 54.8 0 2
Aspect 2.7 >10,000 58.4 0 8
Pachycephala sulfuriventer Temp + temp2 6.4 0 0.956 6
Temp + temp2 + aspect 8.1 24.1 6.4 0.040 12
Null 0 531.8 12.6 0.002 2
Temp 1.2 551.9 12.6 0.002 4
Temp + aspect 4.3 1519.4 14.7 0.001 10
Aspect 2.6 3473.4 16.3 0 8
df indicates the degrees of freedom; DAICc shows the difference between the model AICc (Akaike’s Information Criterion corrected for small sam-
ple sizes) and the minimum AICc in the set of models; AICc weights (wi) show the relative likelihood of model i; %DE is percentage deviance
explained by the model; an evidence ratio (wtop model / wi) of 5 indicates that the top-ranked model is 5 times better supported by the data than
the reference model.
6 Diversity and Distributions, 1–13, ª 2014 John Wiley & Sons Ltd
J. B. C. Harris et al.
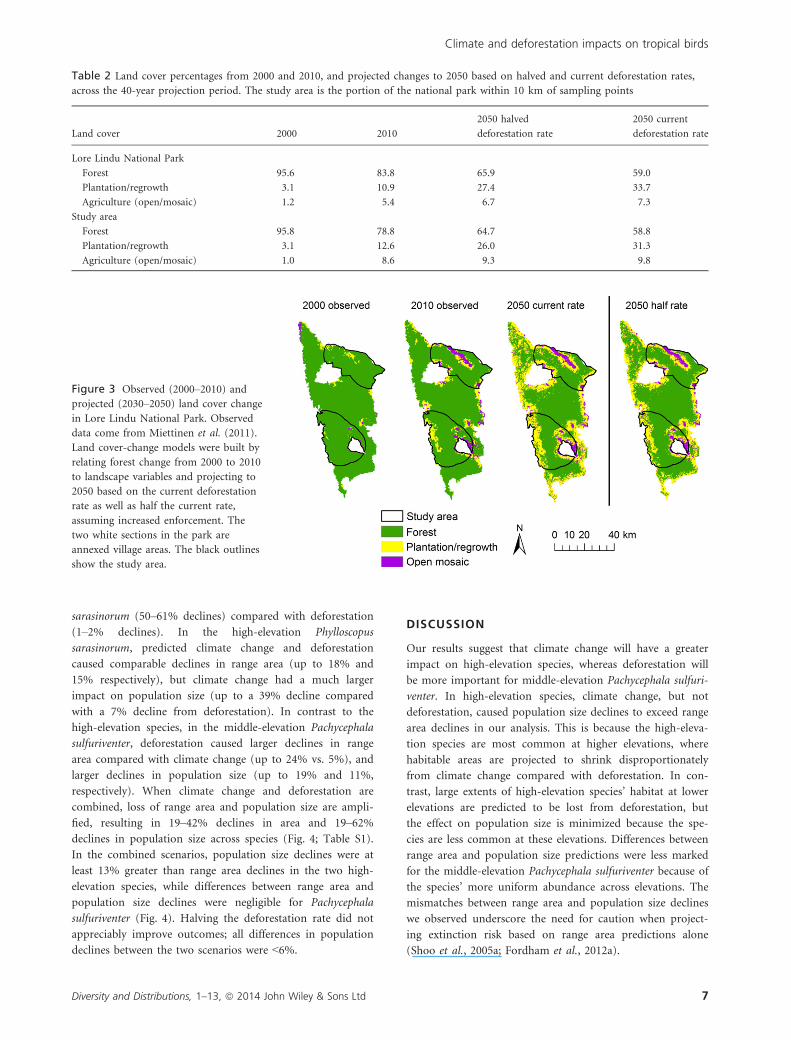
sarasinorum (50–61% declines) compared with deforestation
(1–2% declines). In the high-elevation Phylloscopus
sarasinorum, predicted climate change and deforestation
caused comparable declines in range area (up to 18% and
15% respectively), but climate change had a much larger
impact on population size (up to a 39% decline compared
with a 7% decline from deforestation). In contrast to the
high-elevation species, in the middle-elevation Pachycephala
sulfuriventer, deforestation caused larger declines in range
area compared with climate change (up to 24% vs. 5%), and
larger declines in population size (up to 19% and 11%,
respectively). When climate change and deforestation are
combined, loss of range area and population size are ampli-
fied, resulting in 19–42% declines in area and 19–62%
declines in population size across species (Fig. 4; Table S1).
In the combined scenarios, population size declines were at
least 13% greater than range area declines in the two high-
elevation species, while differences between range area and
population size declines were negligible for Pachycephala
sulfuriventer (Fig. 4). Halving the deforestation rate did not
appreciably improve outcomes; all differences in population
declines between the two scenarios were <6%.
DISCUSSION
Our results suggest that climate change will have a greater
impact on high-elevation species, whereas deforestation will
be more important for middle-elevation Pachycephala sulfuri-
venter. In high-elevation species, climate change, but not
deforestation, caused population size declines to exceed range
area declines in our analysis. This is because the high-eleva-
tion species are most common at higher elevations, where
habitable areas are projected to shrink disproportionately
from climate change compared with deforestation. In con-
trast, large extents of high-elevation species’ habitat at lower
elevations are predicted to be lost from deforestation, but
the effect on population size is minimized because the spe-
cies are less common at these elevations. Differences between
range area and population size predictions were less marked
for the middle-elevation Pachycephala sulfuriventer because of
the species’ more uniform abundance across elevations. The
mismatches between range area and population size declines
we observed underscore the need for caution when project-
ing extinction risk based on range area predictions alone
(Shoo et al., 2005a; Fordham et al., 2012a).
Table 2 Land cover percentages from 2000 and 2010, and projected changes to 2050 based on halved and current deforestation rates,
across the 40-year projection period. The study area is the portion of the national park within 10 km of sampling points
Land cover 2000 2010
2050 halved
deforestation rate
2050 current
deforestation rate
Lore Lindu National Park
Forest 95.6 83.8 65.9 59.0
Plantation/regrowth 3.1 10.9 27.4 33.7
Agriculture (open/mosaic) 1.2 5.4 6.7 7.3
Study area
Forest 95.8 78.8 64.7 58.8
Plantation/regrowth 3.1 12.6 26.0 31.3
Agriculture (open/mosaic) 1.0 8.6 9.3 9.8
Figure 3 Observed (2000–2010) andprojected (2030–2050) land cover change
in Lore Lindu National Park. Observed
data come from Miettinen et al. (2011).
Land cover-change models were built by
relating forest change from 2000 to 2010
to landscape variables and projecting to
2050 based on the current deforestation
rate as well as half the current rate,
assuming increased enforcement. The
two white sections in the park are
annexed village areas. The black outlines
show the study area.
Diversity and Distributions, 1–13, ª 2014 John Wiley & Sons Ltd 7
Climate and deforestation impacts on tropical birds

2010 2020 2030 2040 2050
010
2030
4050
60
Per
cent
age
of p
opul
atio
n lo
st
Policy climate changeReference climate changeHalf deforestationCurrent deforestation
Year2010 2020 2030 2040 2050
010
2030
4050
60
Half + policyHalf + referenceCurrent + policyCurrent + reference
(a) Myza sarasinorum percentage population lost
2010 2020 2030 2040 2050
010
2030
4050
60
Per
cent
age
of r
ange
are
a lo
st
Policy climate changeReference climate changeHalf deforestationCurrent deforestation
Year2010 2020 2030 2040 2050
010
2030
4050
60
Half + policyHalf + referenceCurrent + policyCurrent + reference
(b) Myza sarasinorum percentage range area lost
2010 2020 2030 2040 2050
010
2030
4050
60
Per
cent
age
of p
opul
atio
n lo
st
Policy climate changeReference climate changeHalf deforestationCurrent deforestation
2010 2020 2030 2040 2050
010
2030
4050
60
Half + policyHalf + referenceCurrent + policyCurrent + reference
Year
(c) Phylloscopus sarasinorum percentage population lost
Figure 4 Projected percentage population and range area declines from climate change and deforestation for a (a–b) mountaintop
species, Myza sarasinorum, (c–d) high-elevation species, Phylloscopus sarasinorum, and (e–f) middle-elevation species, Pachycephala
sulfuriventer. The three study species are birds that are endemic to Sulawesi, Indonesia. The policy scenario models emissions mitigation;
reference indicates high-emissions climate change; current indicates the current deforestation rate; half indicates reducing the current
deforestation rate by half.
8 Diversity and Distributions, 1–13, ª 2014 John Wiley & Sons Ltd
J. B. C. Harris et al.
2010 2020 2030 2040 2050
010
2030
4050
60
Per
cent
age
of r
ange
are
a lo
stPolicy climate changeReference climate changeHalf deforestationCurrent deforestation
Year2010 2020 2030 2040 2050
010
2030
4050
60
Half + policyHalf + referenceCurrent + policyCurrent + reference
(d) Phylloscopus sarasinorum percentage range area lost
2010 2020 2030 2040 2050
010
2030
4050
60
Per
cent
age
of p
opul
atio
n lo
st
Policy climate changeReference climate changeHalf deforestationCurrent deforestation
Year
2010 2020 2030 2040 2050
010
2030
4050
60Half + policyHalf + referenceCurrent + policyCurrent + reference
(e) Pachycephala sulfuriventer percentage population lost
2010 2020 2030 2040 2050
010
2030
4050
60
Per
cent
age
of r
ange
are
a lo
st
Policy climate changeReference climate changeHalf deforestationCurrent deforestation
2010 2020 2030 2040 2050
010
2030
4050
60
Half + policyHalf + referenceCurrent + policyCurrent + reference
Year
(f) Pachycephala sulfuriventer percentage range area lost
Figure 4 Continued
Diversity and Distributions, 1–13, ª 2014 John Wiley & Sons Ltd 9
Climate and deforestation impacts on tropical birds

The results indicate that management strategies should be
tailored to species based on their elevational distributions,
with greater emphasis placed on climate adaptation strategies
for high-elevation species and reducing deforestation for
middle-elevation species. Our results agree with other studies
that suggest highland tropical endemic birds (most of which
are currently considered of ‘least concern’ in the IUCN Red
List) are threatened with extinction in the medium term
(Williams et al., 2003; Shoo et al., 2005a; Sekercioglu et al.,
2008; Gasner et al., 2010; La Sorte & Jetz, 2010).
From 2000 to 2010, Sulawesi lost approximately 11% of
its forest, and 12% of Lore Lindu National Park (which hosts
78% of the island’s endemic bird species) was cleared. This
deforestation rate is among the fastest of any Indonesian
protected area so far reported (Linkie et al., 2004; Gaveau
et al., 2009). Our projections indicate approximately 40% of
the park will be deforested by 2050 even if the deforestation
rate is cut by half. Such large-scale deforestation will cause
substantial declines in forest-dependent birds that are ende-
mic to Sulawesi (Sodhi et al., 2005; Maas et al., 2009). Most
deforestation in the region leads to permanent conversion,
so substantial regeneration should not be expected (Clough
et al., 2009). It should be a priority of the Indonesian gov-
ernment and the conservation community to work towards
halting deforestation inside the national park, especially in
the particularly sensitive mid-elevational regions that are
most vulnerable to the synergy of direct habitat loss from
clearing and indirect climate-related shifts (see Forero-Med-
ina et al., 2011a). Maintaining large forested protected areas,
such as Lore Lindu, will likely give species critical scope to
respond to climate change (Beale et al., 2013).
Our lapse-rate modelling approach could under- or over-
estimate the impacts of climate change on tropical birds.
Our approach could over-estimate declines if species shift
slower than predicted by the lapse rate. Studies have docu-
mented moths, reptiles, amphibians and birds shifting
upwards more slowly than the lapse rate (Raxworthy et al.,
2008; Chen et al., 2009; Forero-Medina et al., 2011b), but
other (lower resolution) studies from Asia had mixed results,
with some birds shifting faster than predicted (Peh, 2007;
Harris et al., 2012). We believe our estimates of potential cli-
mate-change impacts are conservative (at least for the high-
emissions scenario) because we limited our forecasts to 2050
and because nonlinear increases in species endangerment
from each degree of warming (because of range contraction)
were predicted in a previous global study (Sekercioglu et al.,
2008).
Our approach made several other assumptions that should
be considered as caveats when interpreting our results. When
modelling population changes from climate change, we
assumed (due to absence of alternatives) full dispersal and
that the current abundance ~ temperature relationship was
maintained over time (Shoo et al., 2005a; Gasner et al.,
2010), despite future climate-induced shifts in range attri-
butes and suitability. In addition, we were only able to test
two predictors of species abundance (temperature and
aspect). In the current situation, temperature explains 6–38%
of the variation in abundance and 11–64% in presence/
absence depending on study species. Our population indices
should be considered upper estimates of true population size
because the sum of the counts was the response variable;
still, this should not strongly affect the percentage changes in
population size (Fig. 4). We were also unable to consider
species interactions, which are important determinants of
species ranges (Jankowski et al., 2010, 2013; Gifford &
Kozak, 2011). Myza sarasinorum likely competes with its ele-
vational replacement species Myza celebensis at lower eleva-
tions (see Supporting Information). In addition, we could
not model vegetation shifts (or lack thereof) from climate
change (Feeley & Silman, 2010), or incorporate explicitly the
potential synergistic feedbacks between threats, both of which
can be important drivers of species distributions. It is also
possible that our study species respond to shorter and moss-
ier trees, which are correlated with elevation. In addition, all
land cover change inference was based on a comparison
between two time periods (2000 and 2010) because no other
years were available.
If rapid deforestation continues inside of Sulawesi’s Lore
Lindu National Park, endemic species will have much less
scope to adapt to the stresses of climate change. Management
efforts should therefore account for the differential pressures
of deforestation and climate change on middle- and high-ele-
vation species. Our results provide important new field data
and forecasts to reinforce previous studies that suggested
highland tropical birds are threatened with substantial popu-
lation declines from climate change. Our study demonstrates
how models can be linked to predict the relative impacts of
fine-scale habitat loss and climate change on population
status in poorly known tropical regions.
ACKNOWLEDGEMENTS
Abdul Rahman gave dedicated assistance in the field over
several months. We are grateful to Morgan Tingley for statis-
tical advice. The following individuals also gave valuable
assistance in the field: Leo Nar, Raimon, Obi, Pinto and Ro-
lex. Yann Clough, Anty Ilfianti, Iris Motzke, Thomas Wanger
and Arno Wielgoss gave vital logistical assistance. We are
grateful to Mathew Brown, Xingli Giam, Jonathan Green and
members of the Global Ecology Lab at the University of
Adelaide for technical assistance. Leighton Reid, Brett Schef-
fers, David Wilcove and three anonymous referees gave valu-
able comments on the manuscript. Funding came from the
Loke Wan Tho Memorial Foundation and an EIPR scholar-
ship at the University of Adelaide. The Ministry of RISTEK
of the Republic of Indonesia and the Lore Lindu National
Park office kindly issued permits for this research.
REFERENCES
Beale, C.M., Baker, N.E., Brewer, M.J. & Lennon, J.J. (2013)
Protected area networks and savannah bird biodiversity in
10 Diversity and Distributions, 1–13, ª 2014 John Wiley & Sons Ltd
J. B. C. Harris et al.
the face of climate change and land degradation. Ecology
Letters, 16, 1061–1068.
Bird, J.P., Buchanan, G.M., Lees, A.C., Clay, R.P., Develey,
P.F., Y�epez, I. & Butchart, S.H. (2012) Integrating spatially
explicit habitat projections into extinction risk assessments:
a reassessment of Amazonian avifauna incorporating
projected deforestation. Diversity and Distributions, 18,
273–281.
BirdLife International (2013) BirdLife International data zone.
Available at: http://www.birdlife.org/datazone.html (accessed
1 January 2013).
Bradshaw, C.J.A., Sodhi, N.S. & Brook, B.W. (2009) Tropical
turmoil: a biodiversity tragedy in progress. Frontiers in
Ecology and the Environment, 7, 79–87.
Brook, B.W., Sodhi, N.S. & Bradshaw, C.J.A. (2008) Syner-
gies among extinction drivers under global change. Trends
in Ecology & Evolution, 23, 453–460.
Brooks, T.M., Pimm, S.L. & Collar, N.J. (1997) Deforestation
predicts the number of threatened birds in insular south-
east Asia. Conservation Biology, 11, 382–394.
Burnham, K.P. & Andersen, D.R. (2002) Model selection and
multimodel inference, 2nd edn. Springer, New York.
Bush, M.B., Silman, M.R. & Urrego, D.H. (2004)
48,000 years of climate and forest change in a biodiversity
hot spot. Science, 303, 827–829.
Cannon, C.H., Summers, M., Harting, J.R. & Kessler, P.J.A.
(2007) Developing conservation priorities based on forest
type, condition, and threats in a poorly known ecoregion:
Sulawesi, Indonesia. Biotropica, 39, 747–759.
Chen, I.C., Shiu, H.-J., Benedick, S., Holloway, J.D., Chey,
V.K., Barlow, H.S., Hill, J.K. & Thomas, C.D. (2009) Eleva-
tion increases in moth assemblages over 42 years on a
tropical mountain. Proceedings of the National Academy of
Sciences USA, 106, 1479–1483.
Clough, Y., Faust, H. & Tscharntke, T. (2009) Cacao boom
and bust: sustainability of agroforests and opportunities for
biodiversity conservation. Conservation Letters, 2, 197–205.
Coates, B.J. & Bishop, K.D. (1997) A guide to the birds of
Wallacea. Dove publications, Alderly, Qld, Australia.
Colwell, R.K., Brehm, G., Cardelus, C.L., Gilman, A.C. &
Longino, J.T. (2008) Global warming, elevational range
shifts, and lowland biotic attrition in the wet tropics. Sci-
ence, 322, 258–261.
Feeley, K.J. & Silman, M.R. (2010) Land-use and climate
change effects on population size and extinction risk of
Andean plants. Global Change Biology, 16, 3215–3222.
Fiske, I. & Chandler, R. (2011) Unmarked: an R Package for
fitting hierarchical models of wildlife occurrence and abun-
dance. Journal of Statistical Software, 43, 1–23.
Fordham, D.A., Akc�akaya, H.R., Ara�ujo, M.B., Elith, J.,
Keith, D., Pearson, R., Auld, T.D., Mellin, C., Morgan,
J.W., Regan, T.J., Tozer, M., Watts, M.J., White, M., Win-
tle, B., Yates, C. & Brook, B.W. (2012a) Plant extinction
risk under climate change: are forecast range shifts alone a
good indicator of species vulnerability to global warming?
Global Change Biology, 18, 1357–1371.
Fordham, D.A., Wigley, T.M.L., Watts, M.J. & Brook, B.W.
(2012b) Strengthening forecasts of climate change impacts
with multi-model ensemble averaged projections using
MAGICC/SCENGEN 5.3. Ecography, 35, 4–8.
Fordham, D.A., Akc�akaya, H.R., Ara�ujo, M.B., Keith, D.A. &
Brook, B.W. (2013) Tools for integrating range change,
extinction risk and climate change information into
conservation management. Ecography, 36, 956–964.
Forero-Medina, G., Joppa, L. & Pimm, S.L. (2011a) Con-
straints to species’ elevational range shifts as climate
changes. Conservation Biology, 25, 163–171.
Forero-Medina, G., Terborgh, J., Socolar, S.J. & Pimm, S.L.
(2011b) Elevational ranges of birds on a tropical montane
gradient lag behind warming temperatures. PLoS ONE, 6,
e28535.
Freeman, E.A. & Moisen, G. (2008) PresenceAbsence: an R
package for presence-absence model analysis. Journal of
Statistical Software, 23, 1–31.
Gasner, M.R., Jankowski, J.E., Ciecka, A.L., Kyle, K.O. &
Rabenold, K.N. (2010) Projecting the local impacts of
climate change on a Central American montane avian
community. Biological Conservation, 143, 1250–1258.
Gaveau, D.L.A., Epting, J., Lyne, O., Linkie, M., Kumara, I.,
Kanninen, M. & Leader-Williams, N. (2009) Evaluating
whether protected areas reduce tropical deforestation in
Sumatra. Journal of Biogeography, 36, 2165–2175.
Gifford, M.E. & Kozak, K.H. (2011) Islands in the sky or
squeezed at the top? Ecological causes of elevational
range limits in montane salamanders. Ecography, 35, 193–
203.
Green, J.M.H., Larrosa, C., Burgess, N.D., Balmford, A.,
Johnston, A., Mbilinyi, B.P., Platts, P.J. & Coad, L. (2013)
Deforestation in an African biodiversity hotspot: extent,
variation and the effectiveness of protected areas. Biological
Conservation, 164, 62–72.
Gregory, S.D., Brook, B.W., Goossens, B., Ancrenaz, M.,
Alfred, R., Ambu, L.N. & Fordham, D.A. (2012) Long-term
field data and climate-habitat models show that orangutan
persistence depends on effective forest management and
greenhouse gas mitigation. PLoS ONE, 7, e43846.
Harris, J.B.C., Sekercioglu, C.H., Sodhi, N.S., Fordham, D.A.,
Paton, D.C. & Brook, B.W. (2011) The tropical frontier in
avian climate impact research. Ibis, 153, 877–882.
Harris, J.B.C., Yong, D.L., Sheldon, F.H., Boyce, A.J., Eaton,
J.A., Bernard, H., Biun, A., Langevin, A., Martin, T.E. &
Wei, D. (2012) Using diverse data sources to detect eleva-
tional range changes of birds on Mt. Kinabalu, Malaysian
Borneo. Raffles Bulletin of Zoology, 25, 189–239.
Hijmans, R.J., Cameron, S.E., Parra, J.L., Jones, P.G. & Jarvis,
A. (2005) Very high resolution interpolated climate sur-
faces for global land areas. International Journal of Clima-
tology, 25, 1965–1978.
Jackman, S. (2011) pscl: classes and methods for R developed
in the Political Science Computational Laboratory. Stanford
University, Stanford, CA. Version 1.04.1.
Diversity and Distributions, 1–13, ª 2014 John Wiley & Sons Ltd 11
Climate and deforestation impacts on tropical birds
Jankowski, J.E., Robinson, S.K. & Levey, D.J. (2010)
Squeezed at the top: interspecific aggression may
constrain elevational ranges in tropical birds. Ecology, 91,
1877–1884.
Jankowski, J.E., Londo~no, G.A., Robinson, S.K. & Chappell,
M.A. (2013) Exploring the role of physiology and biotic
interactions in determining elevational ranges of tropical
animals. Ecography, 36, 1–12.
Jetz, W., Wilcove, D.S. & Dobson, A.P. (2007) Projected
impacts of climate and land-use change on the global
diversity of birds. PLoS Biology, 5, 1211–1219.
Jim�enez-Valverde, A. & Lobo, J.M. (2007) Threshold criteria
for conversion of probability of species presence to either-
or presence-absence. Acta Oecologica, 31, 361–369.
La Sorte, F.A. & Jetz, W. (2010) Projected range contractions
of montane biodiversity under global warming. Proceedings
of the Royal Society B: Biological Sciences, 277, 3401–3410.
Lee, T.M., Sodhi, N.S. & Prawiradilaga, D.M. (2007) The
importance of protected areas for the forest and endemic
avifauna of Sulawesi (Indonesia). Ecological Applications,
17, 1727–1741.
Linkie, M., Smith, R.J. & Leader-Williams, N. (2004)
Mapping and predicting deforestation patterns in the low-
lands of Sumatra. Biodiversity and Conservation, 13, 1809–
1818.
Maas, B., Putra, D.D., Waltert, M., Clough, Y., Tscharntke,
T. & Schulze, C.H. (2009) Six years of habitat modification
in a tropical rainforest margin of Indonesia do not affect
bird diversity but endemic forest species. Biological Conser-
vation, 142, 2665–2671.
Madika, B., Putra, D.D., Harris, J.B.C., Yong, D.L., Mallo,
F.N., Rahman, A., Prawiradilaga, D.M. & Rasmussen, P.C.
(2011) An undescribed Ninox hawk owl from the highlands
of Central Sulawesi, Indonesia? Bulletin of the British Orni-
thologists’ Club, 131, 94–102.
McCain, C.M. (2009) Global analysis of bird elevational
diversity. Global Ecology and Biogeography, 18, 346–360.
Miettinen, J., Shi, C. & Liew, S.C. (2011) Deforestation rates
in insular Southeast Asia between 2000 and 2010. Global
Change Biology, 17, 2261–2270.
Noske, R.A. (2010) Potential impacts of climate change on
the birds of Indonesia. Proceedings of the International Ger-
man Alumni Summer School Program. Impact of climate
change on biodiversity: does nature conservation need new
strategies? (ed. by J. Slowik, M. Pangau-Adam and K. Bar-
ua), pp. 23–37. Cuvillier Verlag, G€ottingen, Germany.
Peh, K.S.H. (2007) Potential effects of climate change on ele-
vational distributions of tropical birds in Southeast Asia.
Condor, 109, 437–441.
Potts, J.M. & Elith, J. (2006) Comparing species abundance
models. Ecological Modelling, 199, 153–163.
Pounds, J.A., Fogden, M.P.L. & Masters, K.L. (2005)
Responses of natural communities to climate change in a
highland tropical forest. Climate change and biodiversity
(ed. by T. Lovejoy and L. Hannah), pp. 70–74. Yale Uni-
versity Press, New Haven, CT.
R Development Core Team (2011) R: a language and envi-
ronment for statistical computing. Version 2.14.1. R Founda-
tion for Statistical Computing, Vienna.
Ralph, C.J., Sauer, J.R. & Droege, S. (1995) Monitoring bird
populations by point counts. US Forest Service General
Technical Report PSW-GTR-149. USDA, Forest Service,
Pacific Southwest Research Station, Albany, CA.
Raxworthy, C.J., Pearson, R.G., Rabibisoa, N., Rak-
otondrazafy, A.M., Ramanamanjato, J.B., Raselimanana,
A.P., Wu, S., Nussbaum, R.A. & Stone, D.A. (2008) Extinc-
tion vulnerability of tropical montane endemism from
warming and upslope displacement: a preliminary appraisal
for the highest massif in Madagascar. Global Change Biol-
ogy, 14, 1703–1720.
Rosa, I.M., Purves, D., Souza, C. Jr & Ewers, R.M. (2013)
Predictive modelling of contagious deforestation in the
Brazilian Amazon. PLoS ONE, 8, e77231.
Sekercioglu, C.H., Schneider, S.H., Fay, J.P. & Loarie, S.R.
(2008) Climate change, elevational range shifts, and bird
extinctions. Conservation Biology, 22, 140–150.
Sekercioglu, C.H., Primack, R.B. & Wormworth, J. (2012)
The effects of climate change on tropical birds. Biological
Conservation, 148, 1–18.
Shoo, L.P., Williams, S.E. & Hero, J.M. (2005a) Potential de-
coupling of trends in distribution area and population size
of species with climate change. Global Change Biology, 11,
1469–1476.
Shoo, L.P., Williams, S.E. & Hero, J.M. (2005b) Climate
warming and the rainforest birds of the Australian Wet
Tropics: using abundance data as a sensitive predictor of
change in total population size. Biological Conservation,
125, 335–343.
Smith, A.P. & Young, T.P. (1987) Tropical alpine plant ecol-
ogy. Annual Review of Ecology and Systematics, 18, 137–158.
Soares-Filho, B.S., Nepstad, D.C., Curran, L.M., Cerqueira,
G.C., Garcia, R.A., Ramos, C.A., Voll, E., McDonald, A.,
Lefebvre, P. & Schlesinger, P. (2006) Modelling conserva-
tion in the Amazon basin. Nature, 440, 520–523.
Sodhi, N.S. & Brook, B.W. (2006) Southeast Asian biodiver-
sity in crisis. Cambridge University Press, London, UK.
Sodhi, N.S., Koh, L.P., Prawiradilaga, D.M., Darjono,
Tinulele, I., Putra, D.D. & Tan, T.H.T. (2005) Land use
and conservation value for forest birds in Central Sulawesi
(Indonesia). Biological Conservation, 122, 547–558.
Soh, M.C.K., Sodhi, N.S. & Lim, S.L.H. (2006) High sensitiv-
ity of montane bird communities to habitat disturbance in
Peninsular Malaysia. Biological Conservation, 129, 149–166.
Tingley, M.W. & Beissinger, S.R. (2009) Detecting range
shifts from historical species occurrences: new perspectives
on old data. Trends in Ecology & Evolution, 24, 625–633.
Van Vuuren, D.P., Edmonds, J., Kainuma, M., Riahi, K.,
Thomson, A., Hibbard, K., Hurtt, G.C., Kram, T., Krey, V.
& Lamarque, J.-F. (2011) The representative concentration
pathways: an overview. Climatic Change, 109, 5–31.
Weber, R., Faust, H., Schippers, B., Shohibuddin, M.,
Mamar, S., Sutarto, E. & Kreisel, W. (2007) Migration and
12 Diversity and Distributions, 1–13, ª 2014 John Wiley & Sons Ltd
J. B. C. Harris et al.

ethnicity as cultural driving forces of land use change in
the rainforest margin of Central Sulawesi, Indonesia. The
stability of tropical rainforest margins: linking ecological, eco-
nomic and social constraints of land use and conservation
(ed. by T. Tscharntke, C. Leuschner, E. Guhardja and M.
Zeller), pp. 415–434. Springer Verlag, Berlin.
Williams, S.E., Bolitho, E.E. & Fox, S. (2003) Climate change
in Australian tropical rainforests: an impending environ-
mental catastrophe. Proceedings of the Royal Society B: Bio-
logical Sciences, 270, 1887–1892.
Zeileis, A., Kleiber, C. & Jackman, S. (2008) Regression models
for count data in R. Journal of Statistical Software, 27, 1–25.
SUPPORTING INFORMATION
Additional Supporting Information may be found in the
online version of this article:
Appendix S1 Coordinates, elevation and land cover of the
point counts.
Appendix S2 Detailed methods.
Figure S1 Histograms of elevation, forest cover and sampling
effort within the study area.
Figure S2 Relationships between temperature and abundance
from fitted hurdle models for each study species.
Figure S3 Plots comparing probability of occupancy to
probability of presence from the binomial component of
hurdle models for the study species.
Figure S4 Plots of receiver operating characteristic curves
showing predictive ability of the binomial part of hurdle
models the study species.
Figure S5 Variable importance plots from random forest
models that predicted deforestation in the study area.
Table S1 Projected reductions in the population size index
and range area for the study species under climate and land
use change scenarios.
Table S2 Land cover classification errors in Miettinen et al.’s
(2011) dataset at our 149 sampling points.
BIOSKETCH
The authors are part of the Global Change Ecology group at
the University of Adelaide. Research in the group addresses
the effects of global change on biodiversity.
Author contributions: J.B.C.H., N.S.S., D.A.F., B.W.B. and
D.M.P. conceived the ideas; D.D.P. and J.B.C.H. collected
the data; J.B.C.H., S.D.G. and D.W. analysed the data; all
authors wrote the paper.
Editor: Bethany Bradley
Diversity and Distributions, 1–13, ª 2014 John Wiley & Sons Ltd 13
Climate and deforestation impacts on tropical birds
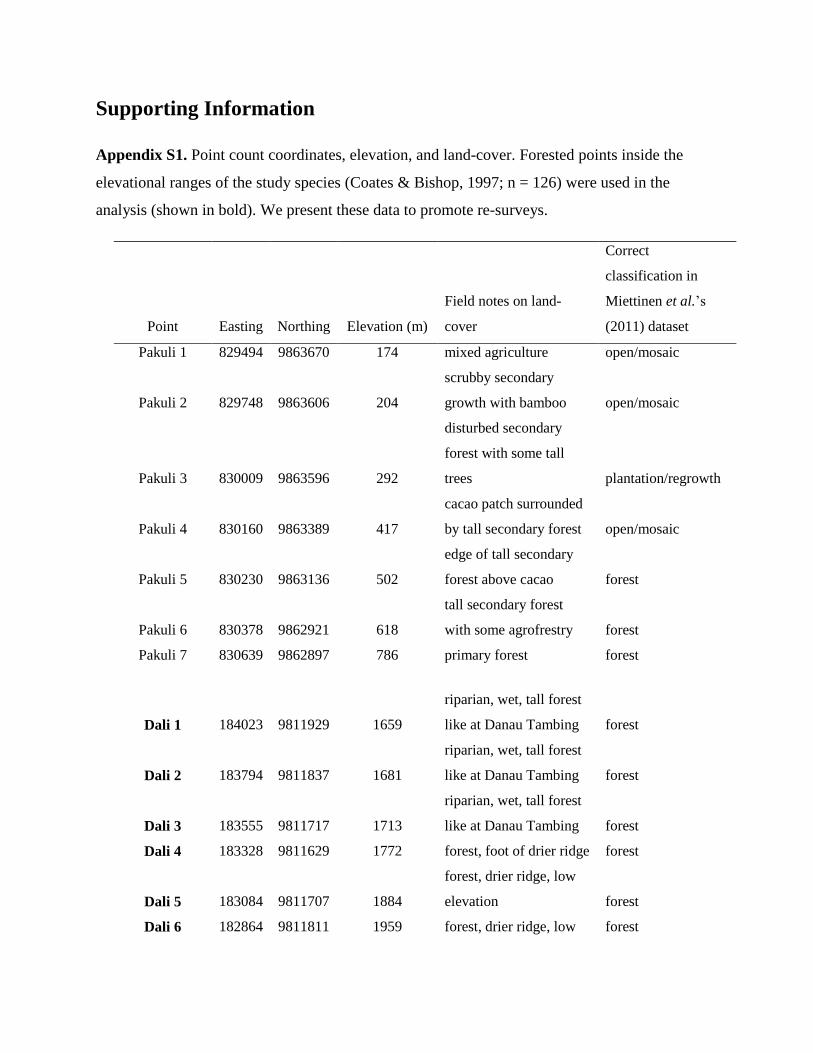
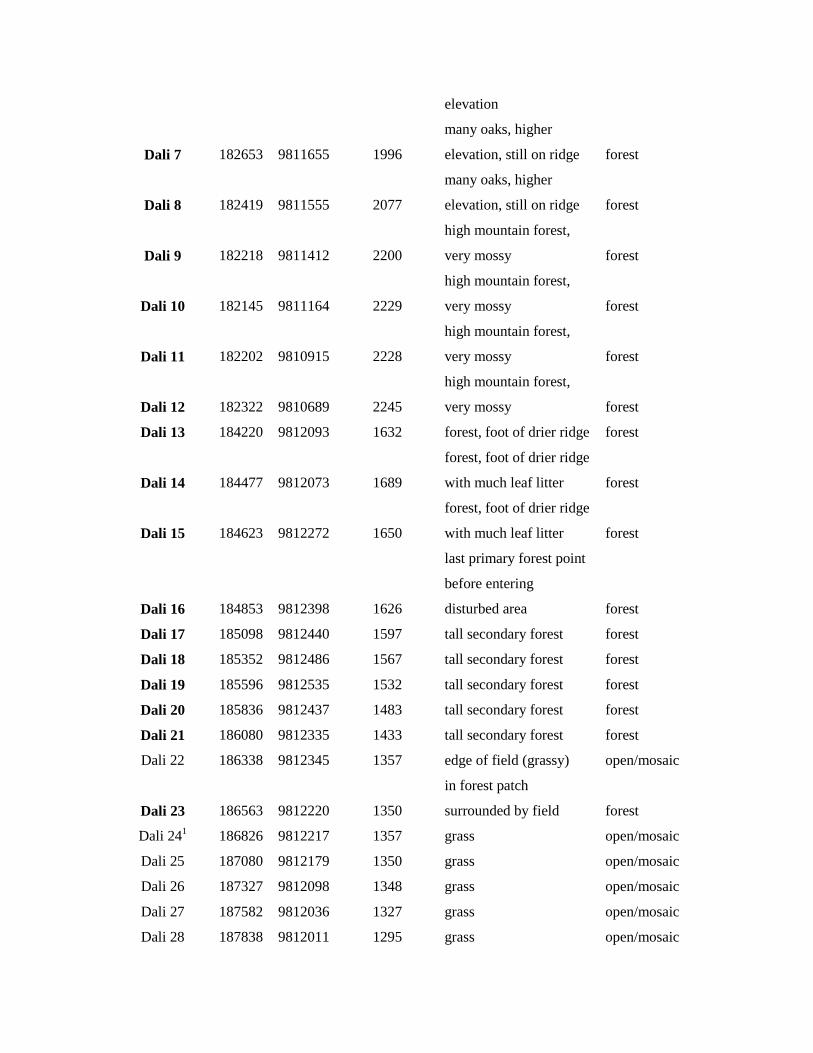
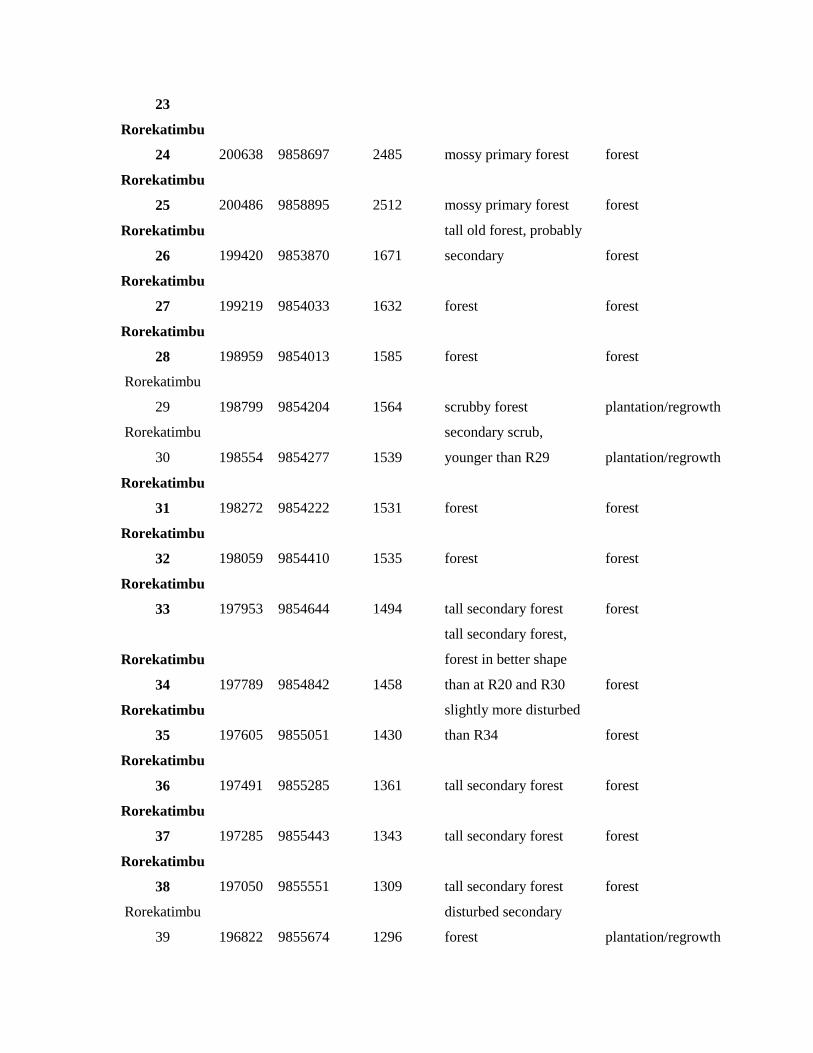
Supporting Information
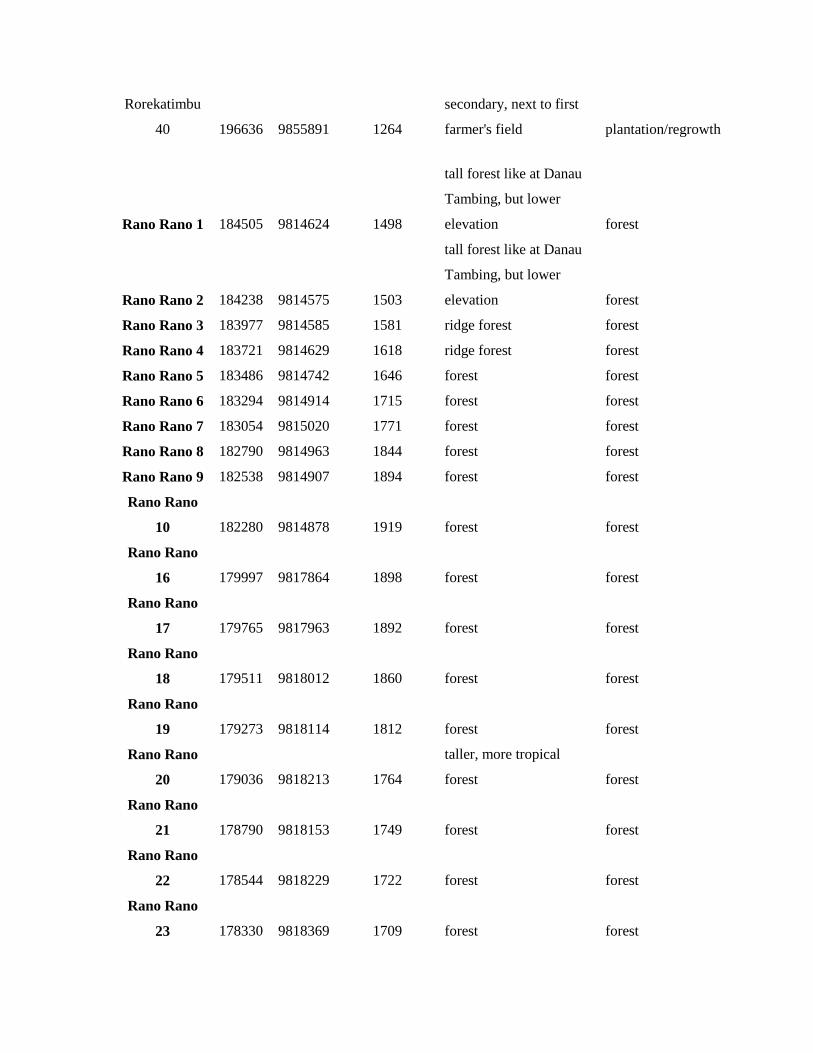
Appendix S1. Point count coordinates, elevation, and land-cover. Forested points inside the
elevational ranges of the study species (Coates & Bishop, 1997; n = 126) were used in the
analysis (shown in bold). We present these data to promote re-surveys.
Point Easting Northing Elevation (m)
Field notes on land-
cover
Correct
classification in
Miettinen et al.’s
(2011) dataset
Pakuli 1 829494 9863670 174 mixed agriculture open/mosaic
Pakuli 2 829748 9863606 204
scrubby secondary
growth with bamboo open/mosaic
Pakuli 3 830009 9863596 292
disturbed secondary
forest with some tall
trees plantation/regrowth
Pakuli 4 830160 9863389 417
cacao patch surrounded
by tall secondary forest open/mosaic
Pakuli 5 830230 9863136 502
edge of tall secondary
forest above cacao forest
Pakuli 6 830378 9862921 618
tall secondary forest
with some agrofrestry forest
Pakuli 7 830639 9862897 786 primary forest forest
Dali 1 184023 9811929 1659
riparian, wet, tall forest
like at Danau Tambing forest
Dali 2 183794 9811837 1681
riparian, wet, tall forest
like at Danau Tambing forest
Dali 3 183555 9811717 1713
riparian, wet, tall forest
like at Danau Tambing forest
Dali 4 183328 9811629 1772 forest, foot of drier ridge forest
Dali 5 183084 9811707 1884
forest, drier ridge, low
elevation forest
Dali 6 182864 9811811 1959 forest, drier ridge, low forest
elevation
Dali 7 182653 9811655 1996
many oaks, higher
elevation, still on ridge forest
Dali 8 182419 9811555 2077
many oaks, higher
elevation, still on ridge forest
Dali 9 182218 9811412 2200
high mountain forest,
very mossy forest
Dali 10 182145 9811164 2229
high mountain forest,
very mossy forest
Dali 11 182202 9810915 2228
high mountain forest,
very mossy forest
Dali 12 182322 9810689 2245
high mountain forest,
very mossy forest
Dali 13 184220 9812093 1632 forest, foot of drier ridge forest
Dali 14 184477 9812073 1689
forest, foot of drier ridge
with much leaf litter forest
Dali 15 184623 9812272 1650
forest, foot of drier ridge
with much leaf litter forest
Dali 16 184853 9812398 1626
last primary forest point
before entering
disturbed area forest
Dali 17 185098 9812440 1597 tall secondary forest forest
Dali 18 185352 9812486 1567 tall secondary forest forest
Dali 19 185596 9812535 1532 tall secondary forest forest
Dali 20 185836 9812437 1483 tall secondary forest forest
Dali 21 186080 9812335 1433 tall secondary forest forest
Dali 22 186338 9812345 1357 edge of field (grassy) open/mosaic
Dali 23 186563 9812220 1350
in forest patch
surrounded by field forest
Dali 241 186826 9812217 1357 grass open/mosaic
Dali 25 187080 9812179 1350 grass open/mosaic
Dali 26 187327 9812098 1348 grass open/mosaic
Dali 27 187582 9812036 1327 grass open/mosaic
Dali 28 187838 9812011 1295 grass open/mosaic

Nokilalaki 1 184603 9866234 823 cacao open/mosaic
Nokilalaki 2 184372 9866133 854 mixed agriculture open/mosaic
Nokilalaki 3 184183 9865973 886 mixed agriculture open/mosaic
Nokilalaki 4 184114 9865733 915 mixed agriculture open/mosaic
Nokilalaki 5 184102 9865485 943
mixed agriculture, a few
remnant trees in riparian
corridor open/mosaic
Nokilalaki 6 184158 9865244 973 mixed agriculture open/mosaic
Nokilalaki 7 184235 9865006 1003
mixed agricuture and
grass open/mosaic
Nokilalaki 8 184256 9864757 1032
second growth (small
patch) plantation/regrowth
Nokilalaki 9 184037 9864644 1063
primary forest next to
edge forest
Nokilalaki 10 183897 9864424 1110 forest forest
Nokilalaki 11 183656 9864340 1178 forest forest
Nokilalaki 12 183476 9864187 1210 forest forest
Nokilalaki 13 183338 9863999 1277 forest forest
Nokilalaki 14 183233 9863780 1378 forest forest
Nokilalaki 15 183117 9863563 1486 forest forest
Nokilalaki 16 183063 9863314 1544 forest forest
Nokilalaki 17 182975 9863083 1611 forest forest
Nokilalaki 18 182966 9862831 1674 forest forest
Nokilalaki 19 183047 9862597 1736 forest forest
Nokilalaki 20 183060 9862354 1835 forest forest
Nokilalaki 21 183306 9862303 1915 forest forest
Nokilalaki 22 183540 9862213 2024 forest forest
Nokilalaki 23 183685 9862014 2060 forest forest
Nokilalaki 24 183873 9861849 2052 forest forest
Nokilalaki 25 184087 9861723 2171 forest forest
Nokilalaki 26 184199 9861502 2215 forest forest
Nokilalaki 27 184353 9861304 2278 forest forest
Nokilalaki 28 184524 9861124 2340 forest forest

Nokilalaki 29 184722 9860969 2362 forest forest
Rorekatimbu
1 199662 9853794 1695
tall secondary forest
along trail with older
forest off trail forest
Rorekatimbu
2 199683 9854041 1761
tall secondary forest
along trail with older
forest off trail forest
Rorekatimbu
3 199939 9854082 1803
tall secondary forest
along trail with older
forest off trail forest
Rorekatimbu
4 200115 9854272 1855
tall secondary forest
along trail with older
forest off trail forest
Rorekatimbu
5 200349 9854366 1883
tall secondary forest
along trail with older
forest off trail forest
Rorekatimbu
6 200471 9854581 1921
tall secondary forest
along trail with older
forest off trail forest
Rorekatimbu
7 200430 9854828 1984
tall secondary forest
along trail with older
forest off trail forest
Rorekatimbu
8 200483 9855076 2027
tall secondary forest
along trail with older
forest off trail forest
Rorekatimbu
9 200696 9855221 2040
tall secondary forest
along trail with older
forest off trail forest
Rorekatimbu
10 200597 9855449 2038
tall secondary forest
along trail with older
forest off trail forest
Rorekatimbu
11 200487 9855675 2072
tall secondary forest
along trail with older forest

forest off trail
Rorekatimbu
12 200349 9855887 2055
tall secondary forest
along trail with older
forest off trail forest
Rorekatimbu
13 200226 9856114 2108
tall secondary forest
along trail with older
forest off trail forest
Rorekatimbu
14 200111 9856345 2140
tall secondary forest
along trail with older
forest off trail forest
Rorekatimbu
15 200223 9856565 2160
tall secondary forest
along trail with older
forest off trail forest
Rorekatimbu
16 200229 9856816 2158
tall secondary forest
along trail with older
forest off trail forest
Rorekatimbu
17 200363 9857029 2170
tall secondary forest
along trail with older
forest off trail forest
Rorekatimbu
18 200519 9857229 2224
tall secondary forest
along trail with older
forest off trail forest
Rorekatimbu
19 200664 9857430 2245
tall secondary forest
along trail with older
forest off trail forest
Rorekatimbu
20 200643 9857713 2311
tall secondary forest
along trail with older
forest off trail forest
Rorekatimbu
21 200614 9857967 2366 mossy primary forest forest
Rorekatimbu
22 200546 9858202 2369 mossy primary forest forest
Rorekatimbu 200568 9858455 2399 mossy primary forest forest
23
Rorekatimbu
24 200638 9858697 2485 mossy primary forest forest
Rorekatimbu
25 200486 9858895 2512 mossy primary forest forest
Rorekatimbu
26 199420 9853870 1671
tall old forest, probably
secondary forest
Rorekatimbu
27 199219 9854033 1632 forest forest
Rorekatimbu
28 198959 9854013 1585 forest forest
Rorekatimbu
29 198799 9854204 1564 scrubby forest plantation/regrowth
Rorekatimbu
30 198554 9854277 1539
secondary scrub,
younger than R29 plantation/regrowth
Rorekatimbu
31 198272 9854222 1531 forest forest
Rorekatimbu
32 198059 9854410 1535 forest forest
Rorekatimbu
33 197953 9854644 1494 tall secondary forest forest
Rorekatimbu
34 197789 9854842 1458
tall secondary forest,
forest in better shape
than at R20 and R30 forest
Rorekatimbu
35 197605 9855051 1430
slightly more disturbed
than R34 forest
Rorekatimbu
36 197491 9855285 1361 tall secondary forest forest
Rorekatimbu
37 197285 9855443 1343 tall secondary forest forest
Rorekatimbu
38 197050 9855551 1309 tall secondary forest forest
Rorekatimbu
39 196822 9855674 1296
disturbed secondary
forest plantation/regrowth
Rorekatimbu
40 196636 9855891 1264
secondary, next to first
farmer's field plantation/regrowth
Rano Rano 1 184505 9814624 1498
tall forest like at Danau
Tambing, but lower
elevation forest
Rano Rano 2 184238 9814575 1503
tall forest like at Danau
Tambing, but lower
elevation forest
Rano Rano 3 183977 9814585 1581 ridge forest forest
Rano Rano 4 183721 9814629 1618 ridge forest forest
Rano Rano 5 183486 9814742 1646 forest forest
Rano Rano 6 183294 9814914 1715 forest forest
Rano Rano 7 183054 9815020 1771 forest forest
Rano Rano 8 182790 9814963 1844 forest forest
Rano Rano 9 182538 9814907 1894 forest forest
Rano Rano
10 182280 9814878 1919 forest forest
Rano Rano
16 179997 9817864 1898 forest forest
Rano Rano
17 179765 9817963 1892 forest forest
Rano Rano
18 179511 9818012 1860 forest forest
Rano Rano
19 179273 9818114 1812 forest forest
Rano Rano
20 179036 9818213 1764
taller, more tropical
forest forest
Rano Rano
21 178790 9818153 1749 forest forest
Rano Rano
22 178544 9818229 1722 forest forest
Rano Rano
23 178330 9818369 1709 forest forest

Rano Rano
24 178161 9818569 1620 forest forest
Rano Rano
25 177971 9818749 1570 forest forest
Rano Rano
26 177791 9818918 1516 forest forest
Rano Rano
27 177593 9819091 1459 forest forest
Rano Rano 28 177410 9819272 1403
secondary forest, edge
of regenerating field plantation/regrowth
Rano Rano
29 177269 9819487 1354 forest forest
Rano Rano
30 177170 9819721 1282 return to primary forest forest
Rano Rano
31 177065 9819953 1283 forest forest
Rano Rano
32 176971 9820191 1252 forest forest
Rano Rano
33 176887 9820438 1206 forest forest
Rano Rano 34 173323 9821909 480
bamboo, scrubby
woodland above river open/mosaic
Rano Rano 35 173449 9821678 616 young secondary forest open/mosaic
Rano Rano 36 173688 9821560 684 secondary forest plantation/regrowth
Rano Rano 37 173867 9821377 716 a field open/mosaic
Rano Rano
38 174075 9821218 768
0.18 km from RR 39 to
RR 38 lightly disturbed
primary forest forest
Rano Rano
39 174268 9821046 838 primary forest forest
Rano Rano
40 174464 9820878 874
becoming disturbed, but
still tall forest; rattan
trails forest

Rano Rano
41 174694 9820755 876
primary forest nearby;
some rattan collection forest
Rano Rano
42 174944 9820684 884
primary forest with
bamboo (continues until
RR 41) forest
Rano Rano 43 175194 9820614 917 scruby area near forest plantation/regrowth
Rano Rano
44 175400 9820445 979 primary forest forest
Rano Rano
45 175658 9820423 993 primary forest forest
Rano Rano
46 175798 9820644 1034 primary forest forest
Rano Rano
47 176023 9820778 1042 forest forest
Rano Rano
48 176283 9820802 1108 forest forest
Rano Rano
49 176544 9820765 1159 forest forest
Rano Rano
50 176702 9820588 1220 forest forest
1Points Dali 24-28, Rorekatimbu 21-25 are outside of the national park.
Appendix S2. Supplementary Methods
Details on study species
Myza sarasinorum (white-eared myza) is a medium-sized honeyeater that inhabits montane
forest and mossy elfin forest (1700–2800 m), especially on ridges, where it feeds on nectar and
gleans insects from the understory to the canopy (Coates & Bishop, 1997; Higgins et al., 2008).
M. sarasinorum is replaced by the smaller, less conspicuous, M. celebensis (dark-eared myza) at
lower altitudes. M. sarasinorum is a pugnacious defender of flowers (Coates & Bishop, 1997);
we postulate that M. celebensis would be subordinate to M. sarasinorum. Phylloscopus
sarasinorum (Sulawesi leaf-warbler) inhabits the midstory and canopy of montane forest where
it gleans and hover-gleans small arthropods, often in association with mixed-species foraging
flocks (Coates & Bishop, 1997; Alström et al., 2006). Phylloscopus sarasinorum is found from
600 to 3500 m. There are no other resident Phylloscopus on Sulawesi. Pachycephala
sulfuriventer (sulphur-bellied whistler), is found in upland forest where it forages for insects
along branches and tree trunks from the understory to the canopy (Coates & Bishop, 1997;
Boles, 2007). P. sulfuriventer is found from sea level to 2500 m, mainly above 800 m. There are
no other Pachycephala on Sulawesi. Coracornis raveni (maroon-backed whistler) is an
inconspicuous inhabitant of the lower levels of montane forest from 1500–2300 m. There is no
information on potential competitive interactions between C. raveni and P. sulfuriventer. None
of the study species’ nests have been described, and none are threatened with extinction (Alström
et al., 2006; Boles, 2007; Higgins et al., 2008; BirdLife International, 2013).
Abundance models
We used the Poisson component of the hurdle abundance model for each species to check for
overdispersion. The residual deviance divided by the degrees of freedom from the top-ranked
Poisson model for each species was close to one (0.6–1.3 for the three study species). This
indicated our data were not substantially overdispersed (Crawley, 2007), and Poisson errors were
supported over negative binomial (Potts & Elith, 2006).

Land-cover change modeling
Miettinen et al. (2012) classified land-cover in Southeast Asia in 2000 and 2010 at a 250 m
resolution. We evaluated the accuracy of the land-cover data in our study areas by comparing the
land-cover type we observed at each bird sampling point to the layer classification. We found the
layer had 87% accuracy along our 149 points, which is similar to the overall accuracy across the
region (85%; Miettinen et al., 2012; Table S2).
In the land-cover projections, deforestation represented the permanent conversion of
forest to degraded (plantation/regrowth) or cleared (open/mosaic) land. We did not model forest
regeneration because conversion is usually permanent in Central Sulawesi (Weber et al., 2007;
Clough et al., 2009). Deforestation was modeled as an annual transition matrix, projected as a
discrete-transition Markov Chain (Takada et al., 2010). To identify which raster cells would be
changed at each time step, and to which class they would change, we used 2010 land-cover
prediction probabilities from random forest models relating land-cover change to the spatial
variables mentioned above (Liaw & Wiener, 2002; Hijmans & van Etten, 2012). The models
assigned each cell a probability of class membership in each land-cover class calculated as the
proportion of iterations in which they were assigned to that class. A cell’s predicted 2010 land-
cover class is that which has the highest probability of class membership. We calculated each
cell's vulnerability to change as the maximum probability of membership to any other land-cover
class (Eastman et al., 1995). For each time step, the land-cover change model calculated how
many and which raster cells to change, based on the deforestation projections and cell
vulnerabilities, and then altered their land-cover class to that with the second highest probability
of class membership.
Lowland temperature, adiabatic lapse rate, and climate modeling
The closest lowland weather station with the most complete recent observations was the GHCN
Gorontalo station (ID number 50397048000, 0.52° N, 123.07° E, elevation 2 m,
http://www.ncdc.noaa.gov/ghcnm/v3.php station). We calculated annual mean temperature from
2007–2010 at the station.
The best temperature records for Lore Lindu National Park come from two
meteorological research stations. We calculated the lapse rate by relating temperate to elevation

at the 417 m elevation Gimpu meteorological station (c. 1.6° S, 120.1°E; mean annual
temperature from 2002–2006; Schwendenmann et al., 2010), and the 1,400 m elevation Bariri
meteorological tower (c. 1.7° S, 120.3°E; mean annual temperature from six months of
measurements in 2011–2012). This calculation resulted in a lapse rate of 6.1°C of temperature
loss per 1000 m of elevation gained. This estimate is similar to lapse rates calculated globally
that range from 5–6°C (Sarmiento, 1986; Smith & Young, 1987; Kitayama, 1992; Gaffen et al.,
2000; Bush et al., 2004) and lapse rates calculated in Sulawesi from shorter temperature records
(7 °C on Mt. Rantemario from approximately five days of measurements (Whitten et al., 2002,
pers. comm.) and ~ 6.8 °C in the Mt. Nokilalaki region from two months of measurements
(Musser, 1982)).
We modelled the effect of climate change on abundance for each year from 2010–2050
according to two emissions scenarios: a no-climate-policy reference scenario (no greenhouse gas
emission stabilization; MiniCAM Ref.) and a corresponding policy (stabilization) scenario
(MiniCAM, Level 1) designed to stabilize at an equivalent CO2 concentration of 450 ppm
(Clarke et al., 2007; Wigley et al., 2009). Seven regionally skillful Atmosphere-Ocean General
Circulation Models (BCCRBCM2, CCCMA–31, CSIR0–30, GFDLCM20, MIROCMED,
CCSM–30 and UKHADGEM) were used to generate an annual time series of multi-model
averaged climate projections using MAGICC/SCENGEN (Fordham et al., 2012). These were
downscaled to a grid cell resolution of 0.5° (approximately 50 km) using the “change factor”
method, where the low-resolution multi-model averaged predicted change in temperature was
added directly to a higher resolution baseline observed climatology − an interpolated temperature
dataset that was developed without the support of a digital elevation model (CRU 3.1 TS;
http://badc.nerc.ac.uk/home/index.html).

Supplementary Figures
Figure S1. Elevation and 2010 forest cover of (a) Lore Lindu National Park and (b) the study
area (within 10 km of sampling points). Cells are approximately 0.85 ha; forest cover data come

from Miettinen et al. (2011). (c) Sampling effort by elevation within the study area (one
sampling session; hatched bars).
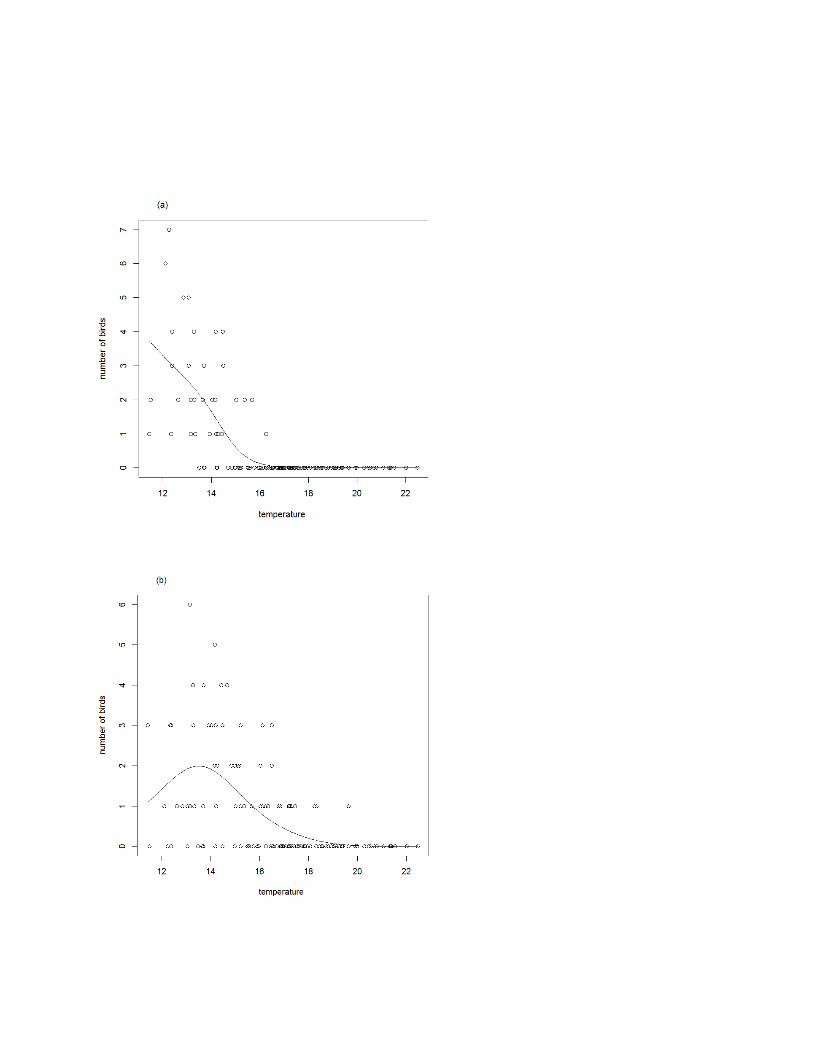

Fig. S2. Relationships between temperature and abundance from fitted hurdle models. (a) Myza
sarasinorum, (b) Phylloscopus sarasinorum, (c) Pachycephala sulfuriventer. The linear
parameterization of temperature was the best predictor of Myza sarasinorum abundance, while
the second degree quadratic function of temperature was the best predictor for the other two
species.


Figure S3. Plots comparing probability of occupancy (from occupancy models from three
sampling sessions) to probability of presence from the binomial component of hurdle models. (a)
Myza sarasinorum, (b) Phylloscopus sarasinorum, (c) Pachycephala sulfuriventer.


Figure S4. Plots of receiver operating characteristic curves showing predictive ability of the
binomial part of hurdle models for (A) Myza sarasinorum, (B) Phylloscopus sarasinorum, (C)
Pachycephala sulfuriventer at different discrimination thresholds. The gray line shows a random
prediction where the model is unable to distinguish between occupied and unoccupied sites. The
area under the receiver operating characteristic curve (AUC) is given.
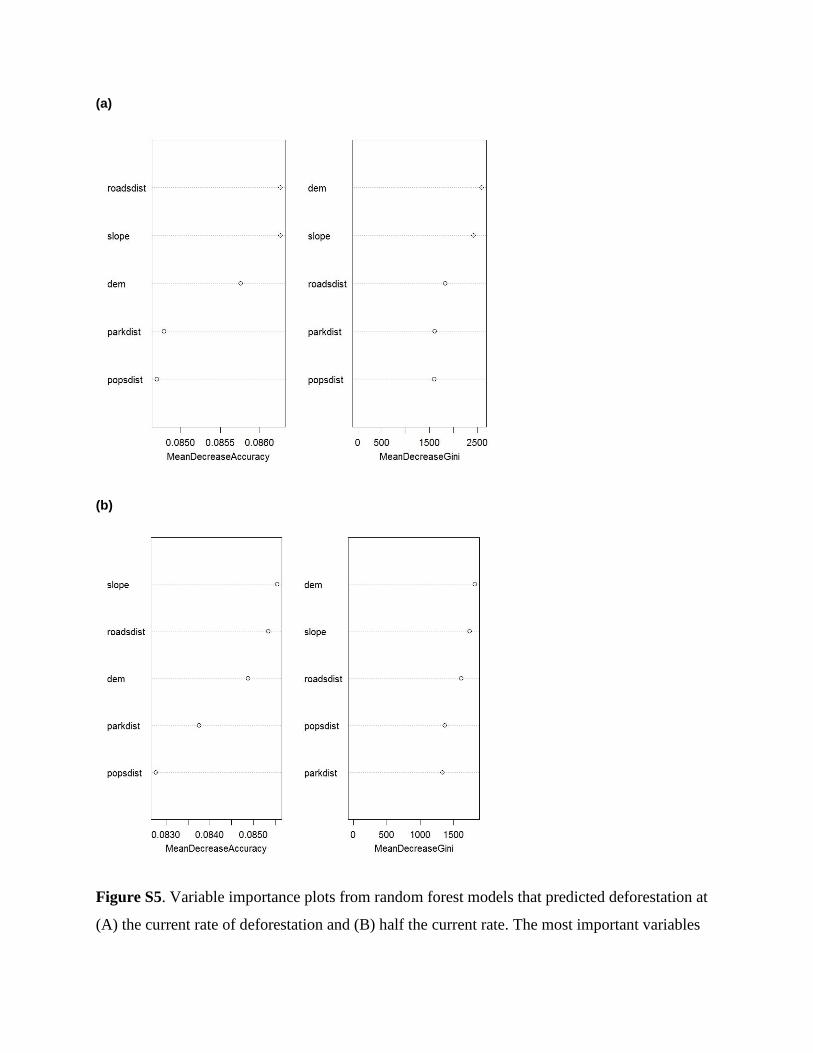
(a)
(b)
Figure S5. Variable importance plots from random forest models that predicted deforestation at
(A) the current rate of deforestation and (B) half the current rate. The most important variables

are displayed at the top of the plot. dem stands for elevation, roadsdist stands for distance from
roads, popsdist stands for distance from villages, parkdist stands for distance from park
boundary. Mean decrease accuracy measures how much the inclusion of a predictor in the model
reduces classification error, while mean decrease Gini measures the role a predictor variable
plays in partitioning the data into defined classes. See Liaw and Wiener (2002) for more details.

Supplementary Tables
Table S1. Projected reductions in the population size index (number of birds in the study area)
and range area (hectares) by 2050 for the three study species under climate and land-use change
scenarios.
climate change deforestation climate change + deforestation
Species baseline
(2010) policy reference
half
rate
current
rate
half +
policy
half +
reference
current
+
policy
current +
reference
Population size (number of birds)
Myza
sarasinorum 13,917 6,917 5,437 13,757 13,641 6,855 5,391 6,813 5,360
Phylloscopus
sarasinorum 38,486 26,637 23,517 36,732 35,751 25,654 22,704 25,080 22,222
Pachycephala
sulfuriventer 71,179 65,392 63,168 61,846 57,728 58,011 56,394 54,657 53,280
Habitat area (hectares)
Myza
sarasinorum 17,648 11,071 9,420 17,306 17,067 10,960 9,334 10,850 9,256
Phylloscopus
sarasinorum 60,558 54,118 51,660 53,076 49,846 48,330 46,699 45,795 44,426
Pachycephala
sulfuriventer 72,026 69,539 68,573 59,816 54,476 58,585 58,050 53,845 53,532
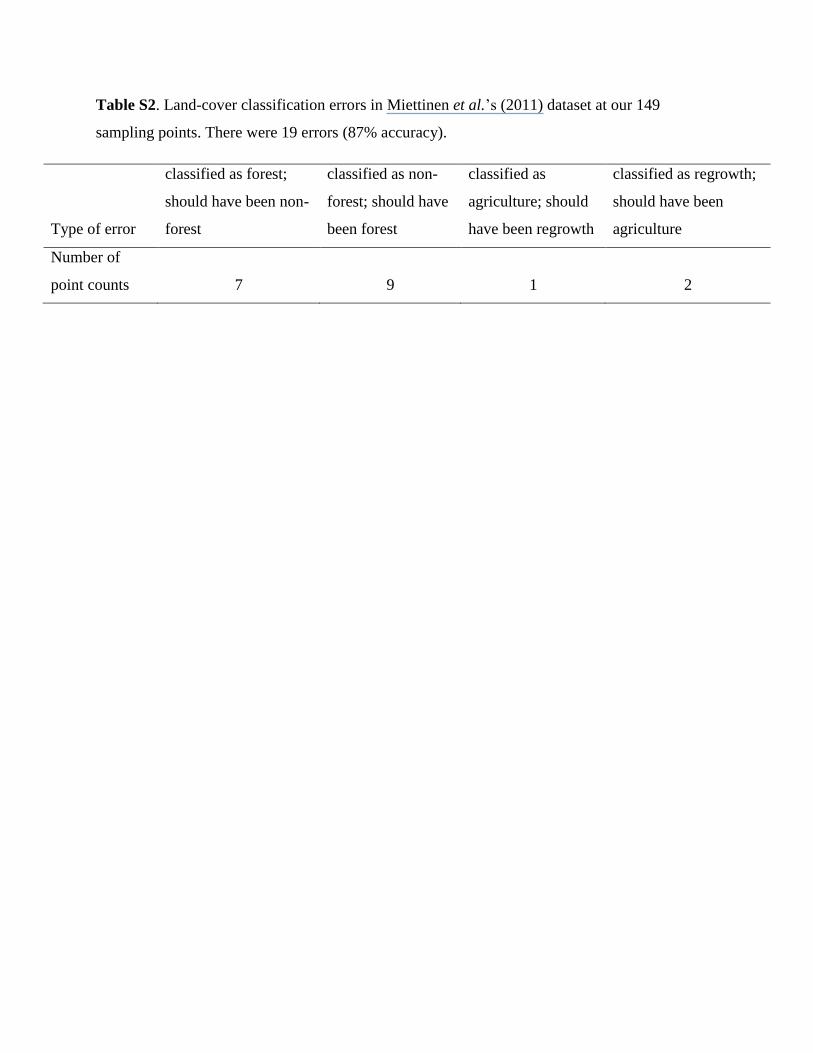
Table S2. Land-cover classification errors in Miettinen et al.’s (2011) dataset at our 149
sampling points. There were 19 errors (87% accuracy).
Type of error
classified as forest;
should have been non-
forest
classified as non-
forest; should have
been forest
classified as
agriculture; should
have been regrowth
classified as regrowth;
should have been
agriculture
Number of
point counts 7 9 1 2

References
Alström, P., Aymí, R., Clement, P., Dyrcz, A., Gargallo, G., Hawkins, A. F. A., Madge, S. C.,
Pearson, D. J. & Svensson, L. (2006) Family Silviidae (old world warblers). Handbook of
the birds of the world. Volume 11: old world flycatchers to old world warblers. (ed. by J.
del Hoyo, A. Elliot and D. A. Christie), pp. 492–712. Lynx Edicions, Barcelona, Spain.
BirdLife International (2013) BirdLife International data zone. Available at:
http://www.birdlife.org/datazone.html (accessed 1 January 2013).
Boles, W. E. 2007. Family Pachycephalidae (whistlers). Handbook of the birds of the world.
Volume 12: picathartes to tits and chickadees. (ed. by J. del Hoyo, A. Elliot and D. A.
Christie), pp. 374–437. Lynx Edicions, Barcelona, Spain.
Bush, M. B., Silman, M. R. & Urrego, D. H. (2004) 48,000 years of climate and forest change in
a biodiversity hot spot. Science, 303, 827–829.
Clarke, L. E., Edmonds, J. A., Jacoby, H. D., Pitcher, H., Reilly, J. M. & Richels, R. (2007)
Scenarios of greenhouse gas emissions and atmospheric concentrations. A report by the
climate change science program and the subcommittee on global change research.
Washington, DC.
Clough, Y., Faust, H. & Tscharntke, T. (2009) Cacao boom and bust: sustainability of
agroforests and opportunities for biodiversity conservation. Conservation Letters, 2, 197–
205.
Coates, B. J. & Bishop, K. D. (1997) A guide to the birds of Wallacea. Alderly, QLD, Australia,
Dove publications.
Crawley, M. J. (2007) The R book. Chichester, Wiley.
Eastman, J., Jin, W., Kyem, P. & Toledano, J. (1995) Raster procedures for multi-criteria/multi-
objective decisions. Photogrammetric Engineering and Remote Sensing, 61, 539–547.
Fordham, D. A., Wigley, T. M. L. & Brook, B. W. (2012) Multi-model climate projections for
biodiversity risk assessments. Ecological Applications, 32, 3317–3331.
Fordham, D. A., Wigley, T. M. L., Watts, M. J. & Brook, B. W. (2012) Strengthening forecasts
of climate change impacts with multi-model ensemble averaged projections using
MAGICC/SCENGEN 5.3. Ecography, 35, 4–8.

Gaffen, D. J., Santer, B. D., Boyle, J. S., Christy, J. R., Graham, N. E. & Ross, R. J. (2000)
Multidecadal changes in the vertical temperature structure of the tropical troposphere.
Science, 287, 1242.
Higgins, P. J., Christidis, L. and Ford, H. A. (2008) Family Melaphagidae (honeyeaters).
Handbook of the birds of the world. Volume 13: penduline-tits to shrikes. (ed. by J. del
Hoyo, A. Elliot and D. A. Christie), pp. 498–691. Lynx Edicions, Barcelona, Spain.
Hijmans, R. J. & van Etten, J. (2012) raster: geographic analysis and modeling with raster data.
R package. Version 1.9–82. Available at: http://CRAN.R-project.org/package=raster.
Kitayama, K. (1992) An altitudinal transect study of the vegetation on Mount Kinabalu, Borneo.
Vegetatio, 102, 149–171.
Liaw, A. & Wiener, M. (2002) Classification and regression by randomForest. R News, 2, 18–22.
Miettinen, J., Shi, C. & Liew, S. C. (2011) Deforestation rates in insular Southeast Asia between
2000 and 2010. Global Change Biology, 17, 2261–2270.
Miettinen, J., Shi, C., Tan, W. J., Chin, S. & Liew, S. C. (2012) 2010 land cover map of insular
Southeast Asia in 250-m spatial resolution. Remote Sensing Letters, 3, 11–20.
Musser, G. G. (1982) Crunomys and the small-bodied shrew rats native to the Philippine Islands
and Sulawesi (Celebes). Bulletin of the American Museum of Natural History, 174, 1–95.
Potts, J. M. & Elith, J. (2006) Comparing species abundance models. Ecological Modelling, 199,
153–163.
Sarmiento, G. (1986) Ecologically crucial features of climate in high tropical mountains. High
altitude tropical biogeography. (ed. by F. Vuilleumier and M. Monasterio), pp. 11–45.
Oxford University Press, Oxford, UK.
Schwendenmann, L., Veldkamp, E., Moser, G., Hölscher, D., Köhler, M., Clough, Y., Anas, I.,
Djajakirana, G., Erasmi, S., Hertel, D., Leitner, D., Leuschner, C., Michalzik, B.,
Propastin, P., Tjoa, A., Tscharntke, T. & van Straaten, O. (2010) Effects of an
experimental drought on the functioning of a cacao agroforestry system, Sulawesi,
Indonesia. Global Change Biology, 16, 1515–1530.
Smith, A. P. & Young, T. P. (1987) Tropical alpine plant ecology. Annual Review of Ecology
and Systematics, 18, 137–158.
Takada, T., Miyamoto, A. & Hasegawa, S. (2010) Derivation of a yearly transition probability
matrix for land-use dynamics and its applications. Landscape Ecology, 25, 561–572.

Weber, R., Faust, H., Schippers, B., Shohibuddin, M., Mamar, S., Sutarto, E. & Kreisel, W.
(2007) Migration and ethnicity as cultural driving forces of land use change in the
rainforest margin of Central Sulawesi, Indonesia. The stability of tropical rainforest
margins: linking ecological, economic and social constraints of land use and
conservation. (ed. by T. Tscharntke, C. Leuschner, E. Guhardja and M. Zeller), pp. 415–
434. Springer Verlag, Berlin.
Whitten, T., Henderson, G. S. & Mustafa, M. (2002) The ecology of Sulawesi. The ecology of
Indonesia series, vol. 4. Hong Kong, Periplus Editions.
Wigley, T. M. L., Clarke, L. E., Edmonds, J. A., Jacoby, H. D., Paltsev, S., Pitcher, H., Reilly, J.
M., Richels, R., Sarofim, M. C. & Smith, S. J. (2009) Uncertainties in climate
stabilization. Climatic Change, 97, 85–121.
Related Documents