IEEE TRANSACTIONS ON INFORMATION TECHNOLOGY IN BIOMEDICINE, VOL. 3, NO. 2, JUNE 1999 125 Rapid Automated Tracing and Feature Extraction from Retinal Fundus Images Using Direct Exploratory Algorithms Ali Can, Hong Shen, James N. Turner, Howard L. Tanenbaum, and Badrinath Roysam, Member, IEEE Abstract—Algorithms are presented for rapid, automatic, ro- bust, adaptive, and accurate tracing of retinal vasculature and analysis of intersections and crossovers. This method improves upon prior work in several ways: 1) automatic adaptation from frame to frame without manual initialization/adjustment, with few tunable parameters; 2) robust operation on image sequences exhibiting natural variability, poor and varying imaging condi- tions, including over/under-exposure, low contrast, and artifacts such as glare; 3) does not require the vasculature to be connected, so it can handle partial views; and 4) operation is efficient enough for use on unspecialized hardware, and amenable to deadline-driven computing, being able to produce a rapidly and monotonically improving sequence of usable partial results. Increased computation can be traded for superior tracing perfor- mance. Its efficiency comes from direct processing on gray-level data without any preprocessing, and from processing only a minimally necessary fraction of pixels in an exploratory manner, avoiding low-level image-wide operations such as thresholding, edge detection, and morphological processing. These properties make the algorithm suited to real-time, on-line (live) processing and is being applied to computer-assisted laser retinal surgery. Index Terms—Biomedical image processing, blood vesels, fea- ture extraction, laser biomedical applications, real-time systems, tracking. I. INTRODUCTION O F INTEREST is the real-time tracing of the vasculature and analysis of intersections and crossovers in live high- resolution retinal fundus image sequences (1024 1024, 30 frames/s). Applications include montage synthesis and navigation for reliable laser surgery [1], [2], perimetry, and post-operative change detection. While the amount of work done in ophthalmic vasculature tracing is limited [1], [3]–[7], much related work has been done in X-ray angiography [8]–[30]. The present work has resulted in the adaptation, after appropriate refinements, of techniques developed for X-ray images to ophthalmology. Real-time live ophthalmic processing presents several chal- lenges [1], such as high image variability, the need for reliable processing in the face of nonideal imaging conditions, high Manuscript received June 2, 1998; revised December 30, 1998. This work was supported by the National Science Foundation under Grant MIP-9412500 and Grant MIP-9634206. A. Can, H. Shen, and B. Roysam are with the Electrical and Computer Science Engineering Department, Rensselaer Polytechnic Institute, Troy, NY 12180-3590 USA (e-mail: [email protected]). J. N. Turner is with the BME Department, Rensselaer Polytechnic Institute, Troy, NY 12180-3590 USA, and also with the Wadsworth Center for Labo- ratories and Research, NYS-DOH, Albany, NY 12201-0509 USA. H. L. Tanenbaum is with The Center for Sight, Albany, NY 12204 USA. Publisher Item Identifier S 1089-7771(99)01796-3. data rates, and short computation deadlines. Large variability is observed between angiograms from different patients—even if healthy, with the situation worsening when pathologies exist. For the same patient, variability is observed under differing imaging conditions (see Fig. 1) and during the course of a treatment. Unlike industrial vision problems where the conditions can be carefully controlled, retinal angiograms are frequently subject to improper illumination, glare, fadeout, loss of focus, and artifacts arising from reflection, refraction, and dispersion. These effects are compounded by unavoidable body and eye movements. This is true for even the best available retinal imaging system. This issue does not arise for nonlive imaging since the photographer can capture the images when the imaging conditions are optimal. Real-time analysis calls for the handling of large volumes of data in short periods of time. Even as computing speeds increase, it is likely that the data rates will continue to stress image computing systems as frame rates, image sizes, number of bits per pixel, and potentially, the number of spectral channels [31], [32], inevitably grow in the future. This paper presents algorithms that are not only adaptive enough to be useful and reliable but are also efficient enough to handle the high data rates of interest, even on standard workstations. II. BACKGROUND Broadly, two approaches exist for vasculature analysis. One approach [3]–[6], [8], hereafter referred to as the “pixel- processing approach,” works by adaptive filtering or seg- mentation, followed by thinning and branch point analysis. These methods require the processing of every image pixel and numerous operations per pixel. When these operations are highly regular, they may be implemented on fast workstations [8] and pipelined accelerators [6]. Some artificial intelli- gence methods also require similar methods for preprocessing [9]–[11]. Generally, these methods scale poorly with image size and are unable to provide useful partial results if a computational deadline occurs. The second approach, exemplified by this paper and several others [8], [12], is referred to as vessel tracking, vectorial tracking, or tracing. These methods work by first locating an initial point and then exploiting local image properties to trace the vasculature recursively. They only process pixels close to the vasculature, avoiding the processing of every image pixel, and so are appropriately called “exploratory algorithms.” They have several properties that make them 1089–7771/99$10.00 1999 IEEE

Welcome message from author
This document is posted to help you gain knowledge. Please leave a comment to let me know what you think about it! Share it to your friends and learn new things together.
Transcript
IEEE TRANSACTIONS ON INFORMATION TECHNOLOGY IN BIOMEDICINE, VOL. 3, NO. 2, JUNE 1999 125
Rapid Automated Tracing and FeatureExtraction from Retinal Fundus ImagesUsing Direct Exploratory Algorithms
Ali Can, Hong Shen, James N. Turner, Howard L. Tanenbaum, and Badrinath Roysam,Member, IEEE
Abstract—Algorithms are presented for rapid, automatic, ro-bust, adaptive, and accurate tracing of retinal vasculature andanalysis of intersections and crossovers. This method improvesupon prior work in several ways: 1) automatic adaptation fromframe to frame without manual initialization/adjustment, withfew tunable parameters; 2) robust operation on image sequencesexhibiting natural variability, poor and varying imaging condi-tions, including over/under-exposure, low contrast, and artifactssuch as glare; 3) does not require the vasculature to be connected,so it can handle partial views; and 4) operation is efficientenough for use on unspecialized hardware, and amenable todeadline-driven computing, being able to produce a rapidlyand monotonically improving sequence of usable partial results.Increased computation can be traded for superior tracing perfor-mance. Its efficiency comes from direct processing on gray-leveldata without any preprocessing, and from processing only aminimally necessary fraction of pixels in an exploratory manner,avoiding low-level image-wide operations such as thresholding,edge detection, and morphological processing. These propertiesmake the algorithm suited to real-time, on-line (live) processingand is being applied to computer-assisted laser retinal surgery.
Index Terms—Biomedical image processing, blood vesels, fea-ture extraction, laser biomedical applications, real-time systems,tracking.
I. INTRODUCTION
OF INTEREST is the real-time tracing of the vasculatureand analysis of intersections and crossovers in live high-
resolution retinal fundus image sequences (10241024,30 frames/s). Applications include montage synthesis andnavigation for reliable laser surgery [1], [2], perimetry, andpost-operative change detection. While the amount of workdone in ophthalmic vasculature tracing is limited [1], [3]–[7],much related work has been done in X-ray angiography[8]–[30]. The present work has resulted in the adaptation, afterappropriate refinements, of techniques developed for X-rayimages to ophthalmology.
Real-time live ophthalmic processing presents several chal-lenges [1], such as high image variability, the need for reliableprocessing in the face of nonideal imaging conditions, high
Manuscript received June 2, 1998; revised December 30, 1998. This workwas supported by the National Science Foundation under Grant MIP-9412500and Grant MIP-9634206.
A. Can, H. Shen, and B. Roysam are with the Electrical and ComputerScience Engineering Department, Rensselaer Polytechnic Institute, Troy, NY12180-3590 USA (e-mail: [email protected]).
J. N. Turner is with the BME Department, Rensselaer Polytechnic Institute,Troy, NY 12180-3590 USA, and also with the Wadsworth Center for Labo-ratories and Research, NYS-DOH, Albany, NY 12201-0509 USA.
H. L. Tanenbaum is with The Center for Sight, Albany, NY 12204 USA.Publisher Item Identifier S 1089-7771(99)01796-3.
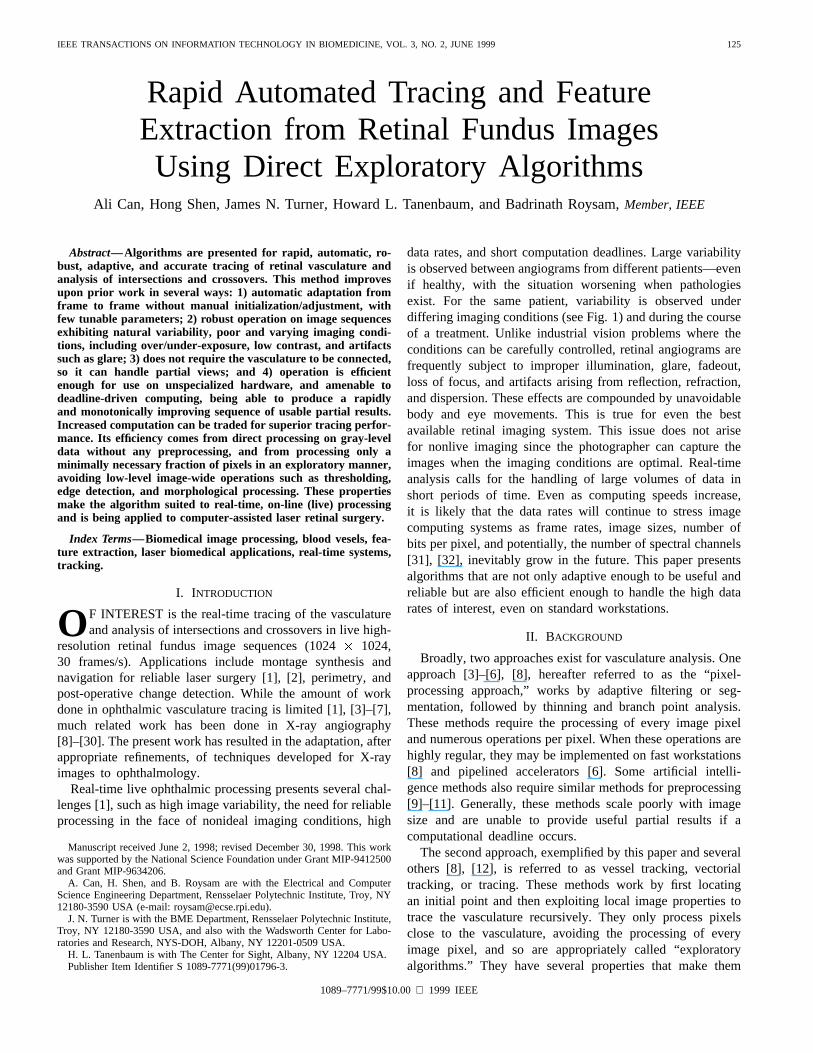
data rates, and short computation deadlines. Large variabilityis observed between angiograms from different patients—evenif healthy, with the situation worsening when pathologiesexist. For the same patient, variability is observed underdiffering imaging conditions (see Fig. 1) and during the courseof a treatment. Unlike industrial vision problems where theconditions can be carefully controlled, retinal angiograms arefrequently subject to improper illumination, glare, fadeout,loss of focus, and artifacts arising from reflection, refraction,and dispersion. These effects are compounded by unavoidablebody and eye movements. This is true for even the bestavailable retinal imaging system. This issue does not arisefor nonlive imaging since the photographer can capture theimages when the imaging conditions are optimal. Real-timeanalysis calls for the handling of large volumes of data inshort periods of time. Even as computing speeds increase,it is likely that the data rates will continue to stress imagecomputing systems as frame rates, image sizes, number ofbits per pixel, and potentially, the number of spectral channels[31], [32], inevitably grow in the future. This paper presentsalgorithms that are not only adaptive enough to be useful andreliable but are also efficient enough to handle the high datarates of interest, even on standard workstations.
II. BACKGROUND
Broadly, two approaches exist for vasculature analysis. Oneapproach [3]–[6], [8], hereafter referred to as the “pixel-processing approach,” works by adaptive filtering or seg-mentation, followed by thinning and branch point analysis.These methods require the processing of every image pixeland numerous operations per pixel. When these operations arehighly regular, they may be implemented on fast workstations[8] and pipelined accelerators [6]. Some artificial intelli-gence methods also require similar methods for preprocessing[9]–[11]. Generally, these methods scale poorly with imagesize and are unable to provide useful partial results if acomputational deadline occurs.
The second approach, exemplified by this paper and severalothers [8], [12], is referred to as vessel tracking, vectorialtracking, or tracing. These methods work by first locatingan initial point and then exploiting local image properties totrace the vasculature recursively. They only process pixelsclose to the vasculature, avoiding the processing of everyimage pixel, and so are appropriately called “exploratoryalgorithms.” They have several properties that make them
1089–7771/99$10.00 1999 IEEE
126 IEEE TRANSACTIONS ON INFORMATION TECHNOLOGY IN BIOMEDICINE, VOL. 3, NO. 2, JUNE 1999
Fig. 1. Sample live retinal video angiograms from healthy (upper two rows) and pathologic eyes (lower two rows) from different patients, illustratingimage variability. When controlling a surgical tool in an on-line system, it is necessary to be able to trace as many frames as possible and to be ableto detect frames that were not processed satisfactorily.
attractive for real-time live high-resolution processing, sincethey scale well with image size, can provide useful partialresults, and are highly adaptive while being efficient. As anaside, numerous papers have been published on vectorizationof binarized images within the document image processingliterature [33]. Also, a parameterized variation of the tracingapproach, known as “snakes” [13], [21], is not considered heresince it is unattractive for tracing branched structures due toproblems with initialization.
Broadly, three exploratory processing techniques are de-scribed in the literature. In the first technique, commonly usedin quantitative coronary analysis (QCA), the initial and endpoints of the vessel (sometimes also the direction and width)are entered manually [14]–[23]. Although these algorithms arevery accurate, they are unsuitable for real-time retinal image
processing since they require manual input and suffer fromhigh computational time, which are not compelling constraintsin QCA. In the second technique, the algorithm starts witha manually-entered initial point and an initial direction, andrecursively tracks the entire arterial tree [24], [25], using abreadth-first search. This would not be useful for retinal imagessince the vessels are not necessarily connected, especiallyin partial views. In the third technique, the algorithms auto-matically extract the vascular tree without intervention. Theywork well for coronary angiograms and have been appliedto three-dimensional (3-D) reconstruction [34]–[37]. Most ofthe techniques [26]–[29] utilize the centerline gray-level in-tensities. In retinal angiograms, although the blood vessels aredarker than the local background, areas like the fovea are alsodark relative to the average background. This consideration has
CAN et al.: RAPID AUTOMATED TRACING AND FEATURE EXTRACTION FROM RETINAL FUNDUS IMAGES 127
motivated us to develop algorithms that rely on more localizedcues, such as contrast and edge gradients, similar to some ofthe methods used in QCA [17]–[19]. This choice also enablesour algorithms to be more robust to lighting related artifactssuch as glare, dropouts, and overexposed frames that can easilyoccur in retinal images, especially the pathological ones ofmost interest.
The algorithm of Collorec and Coatrieux [26] is mostclosely related to the present work. Indeed, our work over-comes two “hard problems” described by Coatrieuxet al. [12],namely: 1) robust and accurate handling of branching andcrossover points and 2) improved handling of discontinuousregions by relying on local contrast, and edge information (asopposed to gray values), instead of a global intensity threshold.It also overcomes their “looping” artifact by using an improvedstopping criterion. Some tracing accuracy improvement is alsogained by a more accurate angular discretization, more filteringacross and along the vessels, and more careful handling ofthe discrete image space. Computationally, our algorithm iscomparably attractive. The strict rules used by our algorithmfor validation and verification of initial seed points allow it toreject many artifactual seed points, making up for the highercomplexity in the core tracing computations.
III. M ETHODS
Fig. 1 shows some sample images exhibiting typical varia-tions in brightness, contrast, the presence of imaging artifacts,and pathologies. Nevertheless, it can be assumed that vesselshave a lower reflectance compared to the local background.Also, they have well-defined edges, and the intensity withinthe vessels varies smoothly. Finally, the vessels are locallycontinuous, and changes in direction between branching pointsare smooth. It is expected that the vessels are not all connectedsince the image in question could represent a partial view. Oc-casionally, portions of vessels may appear hollow, somewhatsimilar to stenoses in X-ray images [Fig. 2(d)] due to certainpathological, blood flow, or imaging conditions. Finally, it isassumed that the images are corrupted minimally by Gaussiannoise.
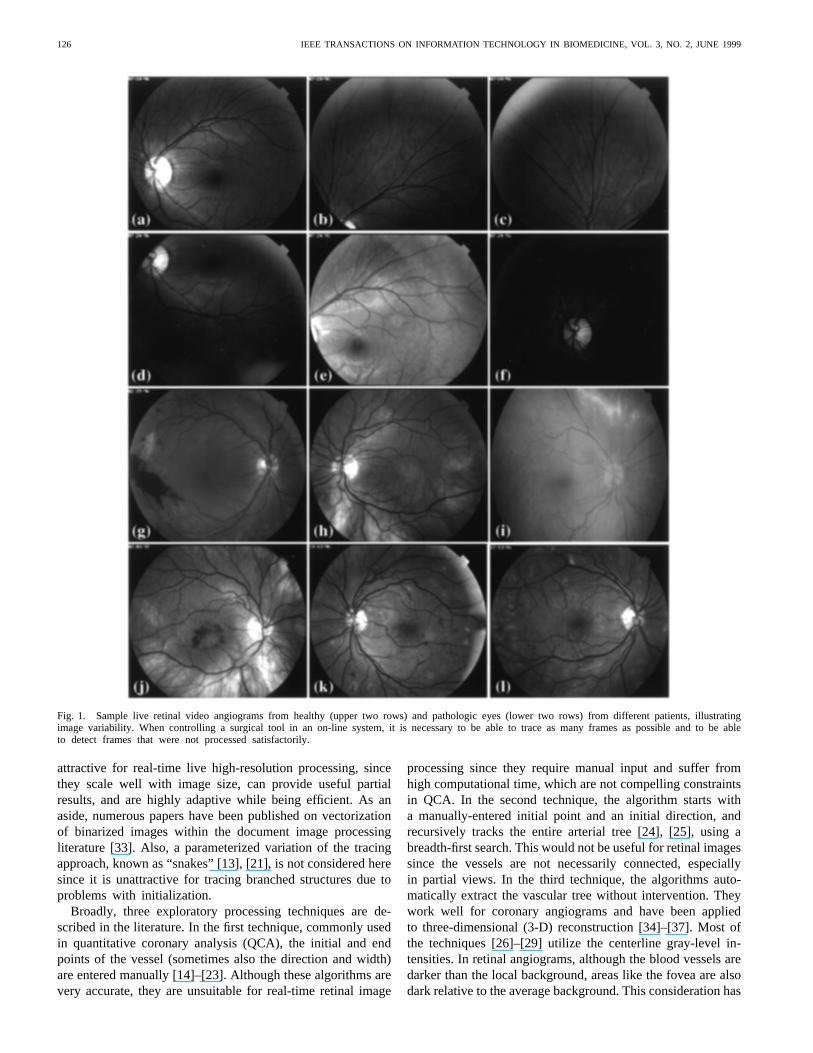
The tracing method is based on adaptive exploratory pro-cessing of the image, directly at the image intensity level,without preprocessing, avoiding image-wide pixel-processingoperations such as grayscale filters, edge operators, morpho-logical filters, and segmentation. Each stage of the algorithm isdesigned to identify and restrict the computations to only themost relevant and promising locality of pixels. The computa-tions themselves are all performed in fixed-point arithmeticusing mostly local shift and add operations. The first stepof the algorithm explores the image along a grid of one-pixel-wide lines, estimating the frame contrast and brightnesslevels, and seeking out local gray-level minima [Fig. 2(a)].Prior to using any of these minima as a seed point for tracing,they are tested for validity using a set of strict validation andverification rules, described in Section III-E. The second stepof the algorithm is a sequence of exploratory searches initiatedat each of the validated seed points. Specific mechanisms areused to pool the results of the many exploratory searches, andto avoid repeated searches (described further in Section III-
F). Mechanisms are also described to detect critical pointssuch as vessel crossovers, branch points, and end points (seeSection III-G).
A. Directional Matched Low-Pass Differentiator Templates
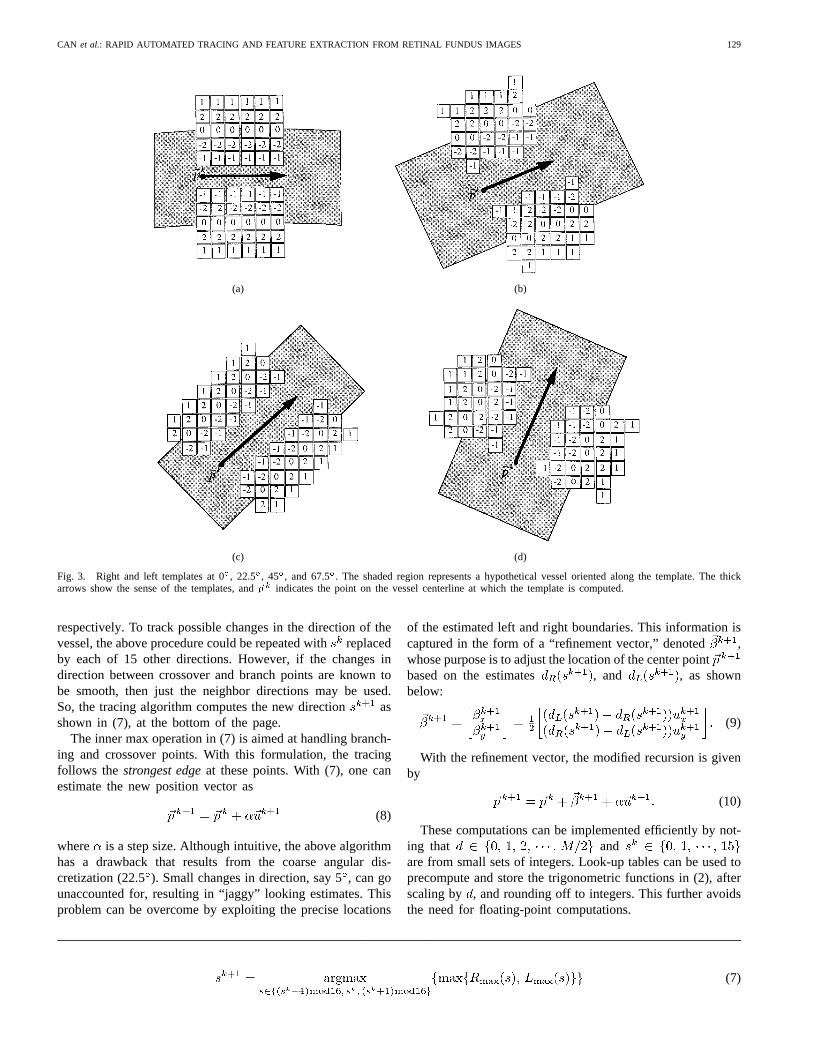
The core tracing algorithm is based on the use of a setof two-dimensional (2-D) correlation kernels that act as low-pass differentiators [37] perpendicular to the direction of thevessels, and low-pass averaging filters along the vessel. Forinstance, a part of a blood vessel that is locally oriented alongthe axis [Fig. 3(a)] can be detected using the peak responseof the following correlation kernel:
(1)
where represents a convolution operator in thedirection.In this paper, a kernel of the above form with was used.For computational efficiency, the constant factor was dropped.With this, the computation only involves fixed-point shift andadd operations. For convenience of exposition, the templatesin Fig. 3 are grouped as left and right templates. The lefttemplates find the edge location in the 90counterclockwisedirection, and similarly right templates are tuned to the rightboundary. The thick arrow in Fig. 3 indicates the sense of thetemplates. The location at the base of the arrow indicatesthe point on the vessel centerline at which the template iscomputed.
Vessel boundaries at arbitrary angles can be detected by ker-nels that are obtained by rotating (1). An exact rotation wouldyield fractional weights, and the computational advantages ofthe above kernel would be lost. This motivated an exhaustivesearch for kernels that approximate the ideally rotated templatein (1), using weights of 1 and 2, and meeting the constraintthat the sum of the squares of the weights are the same forany angle. The latter constraint ensures that, when multipletemplates are correlated at a point on the boundary of a vessel,the one that is closest to the direction of the blood vesselalso produces the highest response. This search yielded a setof templates which for , had the angular quantizationerror, i.e., the angle between the gradient estimate computedfor the template, and the corresponding ideal direction (one of16 possible), of no more than 1. For the templates in Fig. 3,the angles of rotation are discretized to 16 values, separated by22.5 , and each template has the same sum of squared weightsvalue of 60. They can be computed using fixed-point additionand shift operations alone, without multiplications.
The above design is neither unique nor optimal. In principle,it is desirable to select the kernels so that they function asmatched filters [14]. Such an optimal design was avoidedin this work in favor of a suboptimal but computationallyadvantageous design.
B. Application of the Templates to Recursive Tracing of Vessels
Starting from a point and an initial orientation on avessel, the templates can be used to estimate the next point
128 IEEE TRANSACTIONS ON INFORMATION TECHNOLOGY IN BIOMEDICINE, VOL. 3, NO. 2, JUNE 1999
Fig. 2. (a) Grid search for seed points. Dots indicate detected local minima. (b) A result of running the validation rules for every pixel in the image. Straightportions of vessels, and portions that are not “hollow” [e.g., boxed region in (c)] are detected. (c) Points in (b) that resulted in more than 10 iterations. (d)Enlarged view of the boxed region in (c). Fig. 8 shows that the algorithm is not affected by such hollow regions.
on the vessel and its orientation in a recursivemanner, where the superscriptis the iteration number, with
specifying the seed point [see Fig. 4(a)]. The procedurefor obtaining the seed points automatically is described inSection III-E. Let denote a unit vector along the bloodvessel at point . Since the directions are quantized, it ishelpful to refer to directions by their indices. Specifically, ifis an index, assuming values from the set ,into the 16 quantized directions, then the unit vectorcanbe written as follows:
(2)
Denote the right and left templates in the directionasand , respectively. Let and denote thecorrelations between the image data , and the right andleft templates in direction , respectively, i.e., the “templateresponses,”
(3)
(4)
Given the current position and the direction , the rightand left templates are correlated with the local image data atpixels starting from along the two directions perpendicularto the unit vector , respectively. For the hypothesizeddirection , the right and left edge locations are estimatedto be at the locations where and aremaximum. The search for the maximum is limited to a distance
in each direction, where is the maximum expectedwidth of a blood vessel. A value of 26 pixels was used in ourwork based on measurements from numerous images. For eachgiven direction , the above search produces two numbers.
is the maximum value of the template response,and is the distance from the centerline at which themaximum response occurs. Mathematically
(5)
(6)
The corresponding quantities for the other direction aredefined similarly and are denoted , and ,
CAN et al.: RAPID AUTOMATED TRACING AND FEATURE EXTRACTION FROM RETINAL FUNDUS IMAGES 129
(a) (b)
(c) (d)
Fig. 3. Right and left templates at 0�, 22.5�, 45�, and 67.5�. The shaded region represents a hypothetical vessel oriented along the template. The thickarrows show the sense of the templates, and~pk indicates the point on the vessel centerline at which the template is computed.
respectively. To track possible changes in the direction of thevessel, the above procedure could be repeated withreplacedby each of 15 other directions. However, if the changes indirection between crossover and branch points are known tobe smooth, then just the neighbor directions may be used.So, the tracing algorithm computes the new direction asshown in (7), at the bottom of the page.
The inner max operation in (7) is aimed at handling branch-ing and crossover points. With this formulation, the tracingfollows the strongest edgeat these points. With (7), one canestimate the new position vector as
(8)
where is a step size. Although intuitive, the above algorithmhas a drawback that results from the coarse angular dis-cretization (22.5). Small changes in direction, say 5, can gounaccounted for, resulting in “jaggy” looking estimates. Thisproblem can be overcome by exploiting the precise locations
of the estimated left and right boundaries. This information iscaptured in the form of a “refinement vector,” denoted ,whose purpose is to adjust the location of the center pointbased on the estimates , and , as shownbelow:
(9)
With the refinement vector, the modified recursion is givenby
(10)
These computations can be implemented efficiently by not-ing that andare from small sets of integers. Look-up tables can be used toprecompute and store the trigonometric functions in (2), afterscaling by , and rounding off to integers. This further avoidsthe need for floating-point computations.
(7)
130 IEEE TRANSACTIONS ON INFORMATION TECHNOLOGY IN BIOMEDICINE, VOL. 3, NO. 2, JUNE 1999
(a) (b)
(c) (d)
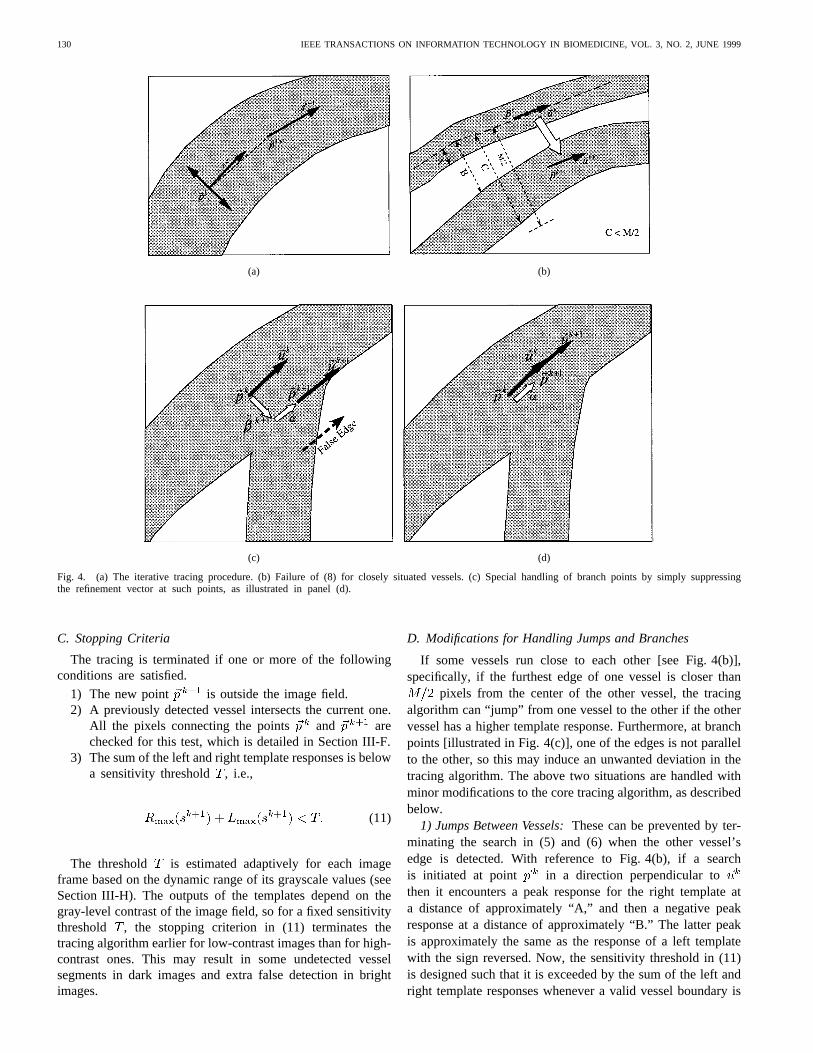
Fig. 4. (a) The iterative tracing procedure. (b) Failure of (8) for closely situated vessels. (c) Special handling of branch points by simply suppressingthe refinement vector at such points, as illustrated in panel (d).
C. Stopping Criteria
The tracing is terminated if one or more of the followingconditions are satisfied.
1) The new point is outside the image field.2) A previously detected vessel intersects the current one.
All the pixels connecting the points and arechecked for this test, which is detailed in Section III-F.
3) The sum of the left and right template responses is belowa sensitivity threshold , i.e.,
(11)
The threshold is estimated adaptively for each imageframe based on the dynamic range of its grayscale values (seeSection III-H). The outputs of the templates depend on thegray-level contrast of the image field, so for a fixed sensitivitythreshold , the stopping criterion in (11) terminates thetracing algorithm earlier for low-contrast images than for high-contrast ones. This may result in some undetected vesselsegments in dark images and extra false detection in brightimages.
D. Modifications for Handling Jumps and Branches
If some vessels run close to each other [see Fig. 4(b)],specifically, if the furthest edge of one vessel is closer than
pixels from the center of the other vessel, the tracingalgorithm can “jump” from one vessel to the other if the othervessel has a higher template response. Furthermore, at branchpoints [illustrated in Fig. 4(c)], one of the edges is not parallelto the other, so this may induce an unwanted deviation in thetracing algorithm. The above two situations are handled withminor modifications to the core tracing algorithm, as describedbelow.
1) Jumps Between Vessels:These can be prevented by ter-minating the search in (5) and (6) when the other vessel’sedge is detected. With reference to Fig. 4(b), if a searchis initiated at point in a direction perpendicular tothen it encounters a peak response for the right template ata distance of approximately “A,” and then a negative peakresponse at a distance of approximately “B.” The latter peakis approximately the same as the response of a left templatewith the sign reversed. Now, the sensitivity threshold in (11)is designed such that it is exceeded by the sum of the left andright template responses whenever a valid vessel boundary is
CAN et al.: RAPID AUTOMATED TRACING AND FEATURE EXTRACTION FROM RETINAL FUNDUS IMAGES 131
detected [see (12)]. This motivates the following criterion forterminating the search in (5) and (6). Ifdenotes a point alongthe search line, where , the search is terminated forthe right templates if
(12)
The criterion for terminating the search in the other directionis analogous.
2) Unwanted Deviations at Branching Points:Althoughthe algorithm for selection of the new direction operatescorrectly at branching points, the mechanism for selecting thenew point does not. As illustrated in Fig. 4(c), the righttemplate is matched to a false boundary at the branching ofthe vessel. In this case, the refinement vector introducessignificant error at branching points, so the next pointcan be computed more accurately by simply suppressing therefinement vector, and using (8) instead of (10) at branchingpoints [Fig. 4(d)]. To implement this switching between twoformulas, a criterion is needed to detect branching points.
At the branching points, while the output of the templatethat is matched to the true boundary in the estimated direction
is high, the output of the template matched to thefalse boundary is usually low, since the direction of thebranching side vessel is different from [see Fig. 4(c)].This motivates the following test. A point is declared as abranch/crossover if
(13)
where is a fixed threshold. The absolute value is used sincethe branching can occur on either side. In our work, thethreshold is chosen as 1/3, i.e., when the response of thefalse boundary is half of the response of the true boundary.The above test is only performed when the estimated directionsof the left and right boundaries are different.
E. Automatic Selection of the Initial Points and Directions
This section presents an automatic two-step method basedon grid analysis for estimating the initial seed points and theinitial directions. The first step is similar to the procedure usedby Collorec and Coatrieux [26]. The second step represents animprovement.
Step 1—Line Searches over a Coarse Grid:Ideally, if thevessels in an image were all connected, the tracing algorithmwould need to be initiated at just one point. However, thiscondition is not met in retinal angiograms. Furthermore, thetracing algorithm described above is designed (for compu-tational reasons) to follow the strongest edge whenever abranch point is encountered, rather than performing a breadth-first search on the vasculature. For these reasons, the tracingalgorithm is initiated at several points, and the traces arecombined. The seed points are identified by performing aset of line searches over the image, using a set of gridlines as illustrated in Fig. 2(a). The gray-level values on each
line are low-pass filtered using a discrete approximation (0.25,0.5, 0.25) to a one-dimensional (1-D) Gaussian kernel. Thiskernel is computationally attractive, since it is composed onlyof local fixed-point shift and add operations. Local intensityminima are detected [indicated by dots in Fig. 2(a)] on this lineusing a neighborhood size , using a 1-D sliding window.Small values of are needed to detect thin vessels. However,this leads to the detection of multiple local minima on thickvessels. To prevent this, must be chosen to be equal orhigher than the widest expected vessel, i.e.,. In our work,
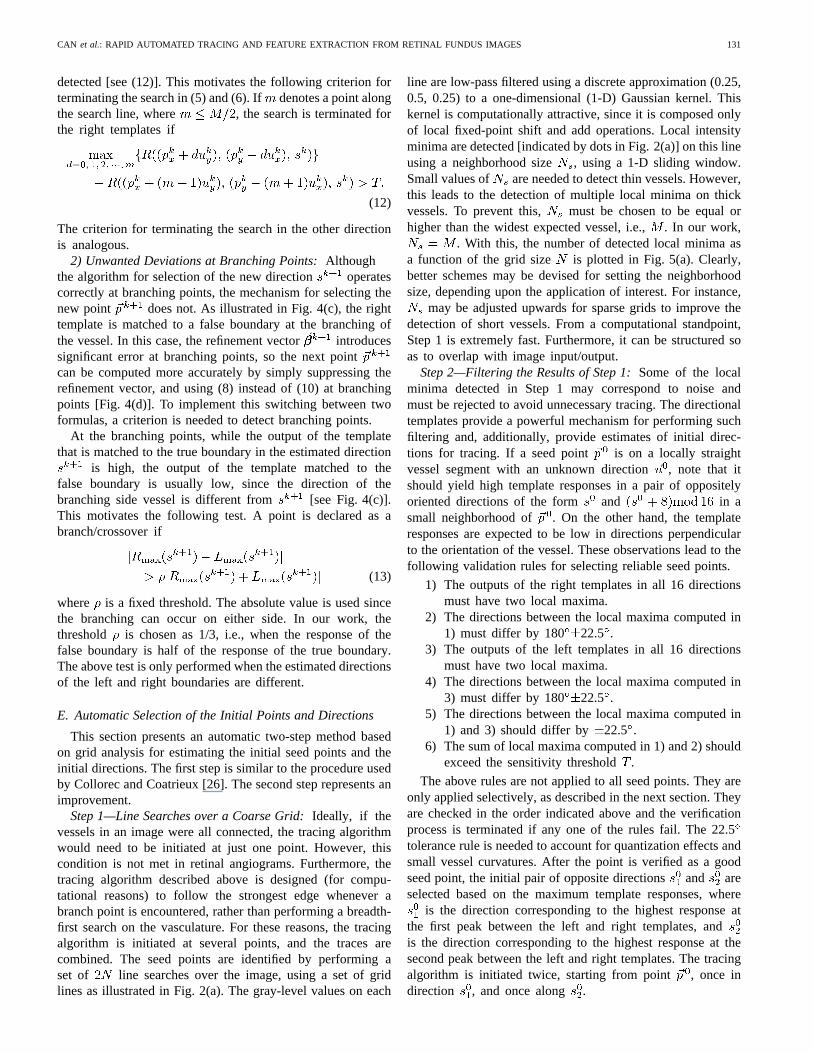
. With this, the number of detected local minima asa function of the grid size is plotted in Fig. 5(a). Clearly,better schemes may be devised for setting the neighborhoodsize, depending upon the application of interest. For instance,
may be adjusted upwards for sparse grids to improve thedetection of short vessels. From a computational standpoint,Step 1 is extremely fast. Furthermore, it can be structured soas to overlap with image input/output.
Step 2—Filtering the Results of Step 1:Some of the localminima detected in Step 1 may correspond to noise andmust be rejected to avoid unnecessary tracing. The directionaltemplates provide a powerful mechanism for performing suchfiltering and, additionally, provide estimates of initial direc-tions for tracing. If a seed point is on a locally straightvessel segment with an unknown direction, note that itshould yield high template responses in a pair of oppositelyoriented directions of the form and in asmall neighborhood of . On the other hand, the templateresponses are expected to be low in directions perpendicularto the orientation of the vessel. These observations lead to thefollowing validation rules for selecting reliable seed points.
1) The outputs of the right templates in all 16 directionsmust have two local maxima.
2) The directions between the local maxima computed in1) must differ by 180 22.5 .
3) The outputs of the left templates in all 16 directionsmust have two local maxima.
4) The directions between the local maxima computed in3) must differ by 180 22.5 .
5) The directions between the local maxima computed in1) and 3) should differ by 22.5 .
6) The sum of local maxima computed in 1) and 2) shouldexceed the sensitivity threshold.
The above rules are not applied to all seed points. They areonly applied selectively, as described in the next section. Theyare checked in the order indicated above and the verificationprocess is terminated if any one of the rules fail. The 22.5tolerance rule is needed to account for quantization effects andsmall vessel curvatures. After the point is verified as a goodseed point, the initial pair of opposite directionsand areselected based on the maximum template responses, where
is the direction corresponding to the highest response atthe first peak between the left and right templates, andis the direction corresponding to the highest response at thesecond peak between the left and right templates. The tracingalgorithm is initiated twice, starting from point , once indirection , and once along .
132 IEEE TRANSACTIONS ON INFORMATION TECHNOLOGY IN BIOMEDICINE, VOL. 3, NO. 2, JUNE 1999
(a) (b)
(c) (d)
(e) (f)
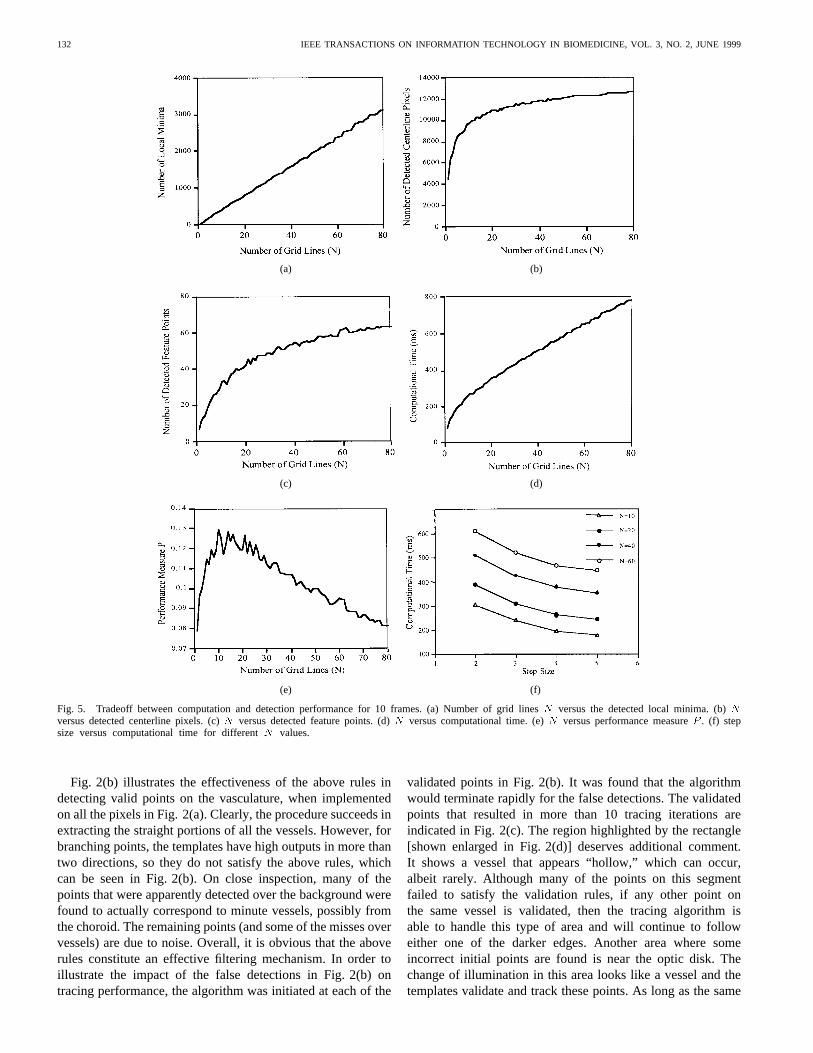
Fig. 5. Tradeoff between computation and detection performance for 10 frames. (a) Number of grid linesN versus the detected local minima. (b)Nversus detected centerline pixels. (c)N versus detected feature points. (d)N versus computational time. (e)N versus performance measureP . (f) stepsize versus computational time for differentN values.
Fig. 2(b) illustrates the effectiveness of the above rules indetecting valid points on the vasculature, when implementedon all the pixels in Fig. 2(a). Clearly, the procedure succeeds inextracting the straight portions of all the vessels. However, forbranching points, the templates have high outputs in more thantwo directions, so they do not satisfy the above rules, whichcan be seen in Fig. 2(b). On close inspection, many of thepoints that were apparently detected over the background werefound to actually correspond to minute vessels, possibly fromthe choroid. The remaining points (and some of the misses overvessels) are due to noise. Overall, it is obvious that the aboverules constitute an effective filtering mechanism. In order toillustrate the impact of the false detections in Fig. 2(b) ontracing performance, the algorithm was initiated at each of the
validated points in Fig. 2(b). It was found that the algorithmwould terminate rapidly for the false detections. The validatedpoints that resulted in more than 10 tracing iterations areindicated in Fig. 2(c). The region highlighted by the rectangle[shown enlarged in Fig. 2(d)] deserves additional comment.It shows a vessel that appears “hollow,” which can occur,albeit rarely. Although many of the points on this segmentfailed to satisfy the validation rules, if any other point onthe same vessel is validated, then the tracing algorithm isable to handle this type of area and will continue to followeither one of the darker edges. Another area where someincorrect initial points are found is near the optic disk. Thechange of illumination in this area looks like a vessel and thetemplates validate and track these points. As long as the same
CAN et al.: RAPID AUTOMATED TRACING AND FEATURE EXTRACTION FROM RETINAL FUNDUS IMAGES 133
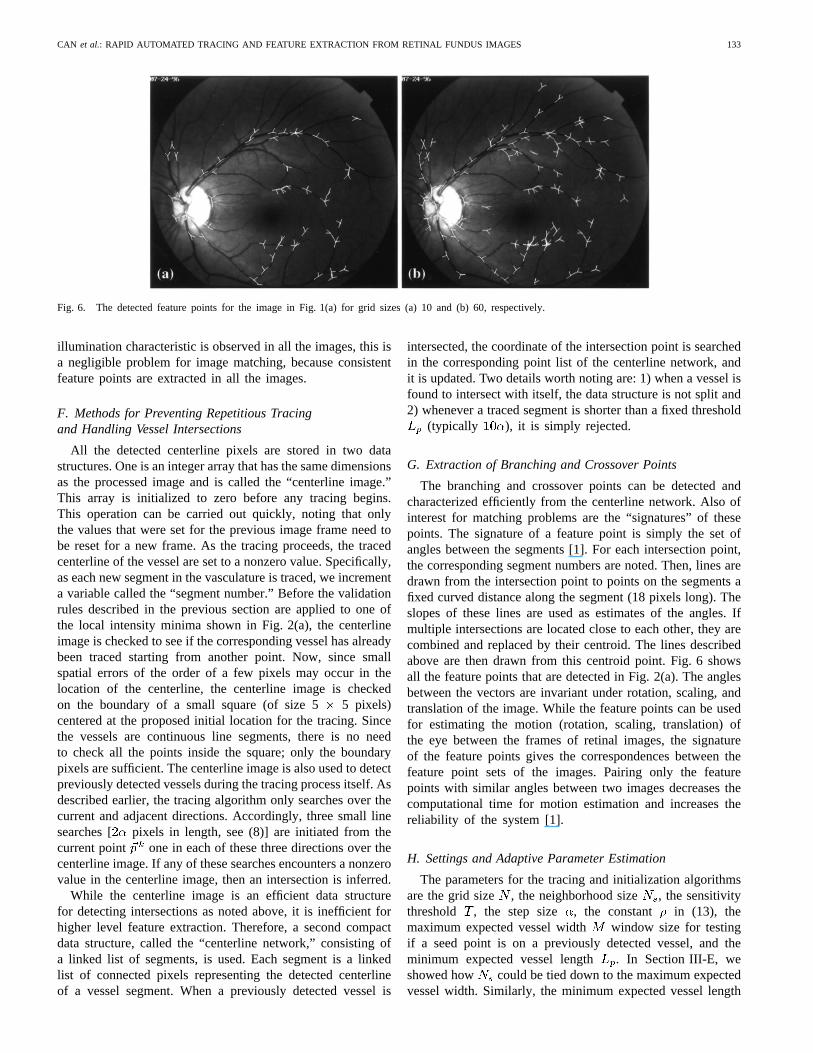
Fig. 6. The detected feature points for the image in Fig. 1(a) for grid sizes (a) 10 and (b) 60, respectively.
illumination characteristic is observed in all the images, this isa negligible problem for image matching, because consistentfeature points are extracted in all the images.
F. Methods for Preventing Repetitious Tracingand Handling Vessel Intersections
All the detected centerline pixels are stored in two datastructures. One is an integer array that has the same dimensionsas the processed image and is called the “centerline image.”This array is initialized to zero before any tracing begins.This operation can be carried out quickly, noting that onlythe values that were set for the previous image frame need tobe reset for a new frame. As the tracing proceeds, the tracedcenterline of the vessel are set to a nonzero value. Specifically,as each new segment in the vasculature is traced, we incrementa variable called the “segment number.” Before the validationrules described in the previous section are applied to one ofthe local intensity minima shown in Fig. 2(a), the centerlineimage is checked to see if the corresponding vessel has alreadybeen traced starting from another point. Now, since smallspatial errors of the order of a few pixels may occur in thelocation of the centerline, the centerline image is checkedon the boundary of a small square (of size 55 pixels)centered at the proposed initial location for the tracing. Sincethe vessels are continuous line segments, there is no needto check all the points inside the square; only the boundarypixels are sufficient. The centerline image is also used to detectpreviously detected vessels during the tracing process itself. Asdescribed earlier, the tracing algorithm only searches over thecurrent and adjacent directions. Accordingly, three small linesearches [ pixels in length, see (8)] are initiated from thecurrent point one in each of these three directions over thecenterline image. If any of these searches encounters a nonzerovalue in the centerline image, then an intersection is inferred.
While the centerline image is an efficient data structurefor detecting intersections as noted above, it is inefficient forhigher level feature extraction. Therefore, a second compactdata structure, called the “centerline network,” consisting ofa linked list of segments, is used. Each segment is a linkedlist of connected pixels representing the detected centerlineof a vessel segment. When a previously detected vessel is
intersected, the coordinate of the intersection point is searchedin the corresponding point list of the centerline network, andit is updated. Two details worth noting are: 1) when a vessel isfound to intersect with itself, the data structure is not split and2) whenever a traced segment is shorter than a fixed threshold
(typically ), it is simply rejected.
G. Extraction of Branching and Crossover Points
The branching and crossover points can be detected andcharacterized efficiently from the centerline network. Also ofinterest for matching problems are the “signatures” of thesepoints. The signature of a feature point is simply the set ofangles between the segments [1]. For each intersection point,the corresponding segment numbers are noted. Then, lines aredrawn from the intersection point to points on the segments afixed curved distance along the segment (18 pixels long). Theslopes of these lines are used as estimates of the angles. Ifmultiple intersections are located close to each other, they arecombined and replaced by their centroid. The lines describedabove are then drawn from this centroid point. Fig. 6 showsall the feature points that are detected in Fig. 2(a). The anglesbetween the vectors are invariant under rotation, scaling, andtranslation of the image. While the feature points can be usedfor estimating the motion (rotation, scaling, translation) ofthe eye between the frames of retinal images, the signatureof the feature points gives the correspondences between thefeature point sets of the images. Pairing only the featurepoints with similar angles between two images decreases thecomputational time for motion estimation and increases thereliability of the system [1].
H. Settings and Adaptive Parameter Estimation
The parameters for the tracing and initialization algorithmsare the grid size , the neighborhood size , the sensitivitythreshold , the step size , the constant in (13), themaximum expected vessel width window size for testingif a seed point is on a previously detected vessel, and theminimum expected vessel length . In Section III-E, weshowed how could be tied down to the maximum expectedvessel width. Similarly, the minimum expected vessel length

134 IEEE TRANSACTIONS ON INFORMATION TECHNOLOGY IN BIOMEDICINE, VOL. 3, NO. 2, JUNE 1999
is closely related to the algorithm step size. Indeed, itmakes sense to reject any vessel segments that are shorterthan a convenient fixed multiple of step sizes. Accordingly,we have set to in our work. This is also the minimumnumber of tracing iterations for a trace to be accepted. Thisparameter can be varied considerably without affecting theresults significantly.
Increasing the grid size improves the probability ofdetecting vessels at the expense of computation. Fig. 5(a)shows the nearly linear relationship between the number ofdetected local minima and the grid size. The graph in Fig. 5(b)demonstrates improved detection of vessels, as measured bythe number of detected centerline pixels, as a function of thegrid size. The rapid increase for small values of(less than6) can be mostly attributed to the thick and long vessels.The subsequent slower increase and leveling off is mostlydue to the secondary and tertiary vessels. Fig. 5(c), whichplots the number of feature points detected, denoted, asa function of grid size exhibits a corresponding increase.The improved detection performance noted above entails in-creased computation. Fig. 5(d) plots the computational time,denoted , of the algorithm for the same image (notincluding the time for reading/writing). For increasing, thenumber of the initial points that are checked for verificationincreases and the new vessel segments are traced, hence thecomputational time increases. A simple method to tradeoffcomputation and feature detection performance is to considerthe ratio of , and the computation time , as an overallperformance measure. Fig. 5(e) plots this ratio, denoted,as a function of the grid size. This graph exhibits a broadpeak between 10 and 30, indicating that for grid sizes inthis range, the cost-performance tradeoff is reasonable. Forthe computer hardware available to us (150 MHz SGI Indy),
was chosen as 10, which yields an average computationtime of about 200 ms. The above performance measure maybe refined/customized further. For instance, one may wantto consider the reliability of each feature point itself. Thosecorresponding to primary vessels are more reliable comparedto the ones on the secondary and tertiary vessels. Furthermore,the above measure is strongly influenced by image matchingproblems. Finally, the computation time is machine-dependent.Machine-independent measures of computational burden suchas worst-case complexity are not particularly useful sincethe images vary greatly and the computation times varyaccordingly.
Another parameter is the step size. If is too large,the centerline becomes jagged and the estimated next pointcan easily occur outside the vessels, especially for the minutevessels, since directions are quantized to only 16 values. In thiscase, the tracing algorithm would terminate prematurely, and,if the rest of the vessel is detected by a different initial point,false feature points may be obtained. On the other hand, smallvalues of result in more accurate tracing at the expenseof more computation. Fig. 5(f) plots the computational timeas a function of . In our experience, the values offor high-resolution (1024 1024 pixels) images andfor video-resolution (640 480 pixels) images representacceptable tradeoffs.
The threshold must be estimated for each new frame.This parameter is used in (11) to define the stopping criterionfor the tracing, in (12) to prevent the tracing algorithm fromjumping to a nearby vessel, and in Step 6) of the procedurefor validation of initial points prior to invoking the tracingalgorithm. An examination of the template design (Fig. 3)reveals that, neglecting quantization errors, the response of theleft/right templates to a single unit of difference in backgroundand foreground gray levels is 18. So, the minimum value of
should be 36, corresponding to a contrast of just one graylevel. At the other extreme, must never exceed 36 timesthe maximum gray-level value. An efficient estimation ofmay be made based on the grid analysis step, which performsa sampling across the image. The local minima on the gridlines are points with a high probability of being on vessels,so the average gray-level value at the local minima is a goodestimate for the average gray-level intensity of the vessels
. Complementarily, the average gray level of the imagebackground, denoted , can be estimated from the remainingpoints on the grid lines. The contrast in the image frame isestimated as the absolute difference between the foregroundand background estimates. Accordingly,is set as follows:
(14)
where is a scaling factor whose value lies between 0 and 1and can be thought of as a percentage of the average contrast.Low values of makes the tracing more sensitive to noiseand quantization errors. High values ofmake it terminateprematurely. This effect is illustrated in Fig. 7(a)–(d) in whichthe tracing algorithm was initiated from the same starting pointfor various values of . The length of the traced segmentis plotted in Fig. 7(e). For reference, this segment was alsotraced manually. The manually measured length of the vesselwas 251 pixels. Values of the sensitivity parameter between5%–35% give traced lengths close to 251 pixels, indicating therobustness of this method. The result of running the tracingalgorithm on the image in Fig. 2(a) using avalue in thisrange (21%) is shown in Fig. 8(a)–(c).
IV. EXPERIMENTAL RESULTS
The images were captured using a TOPCON TRC-50IA fun-dus camera using red-free illumination, and a Kodak Megaplus1.4 CCD sensor attached to the top. The acquired images wereat a resolution of 1024 1024 using the Topcon ImagenetH-1024 digital imaging software. The images were of fullydilated healthy as well as pathological eyes. The patients wereallowed to move their eyes freely. The static high-resolutionimages were captured regardless of visual quality to simulatelive imaging.
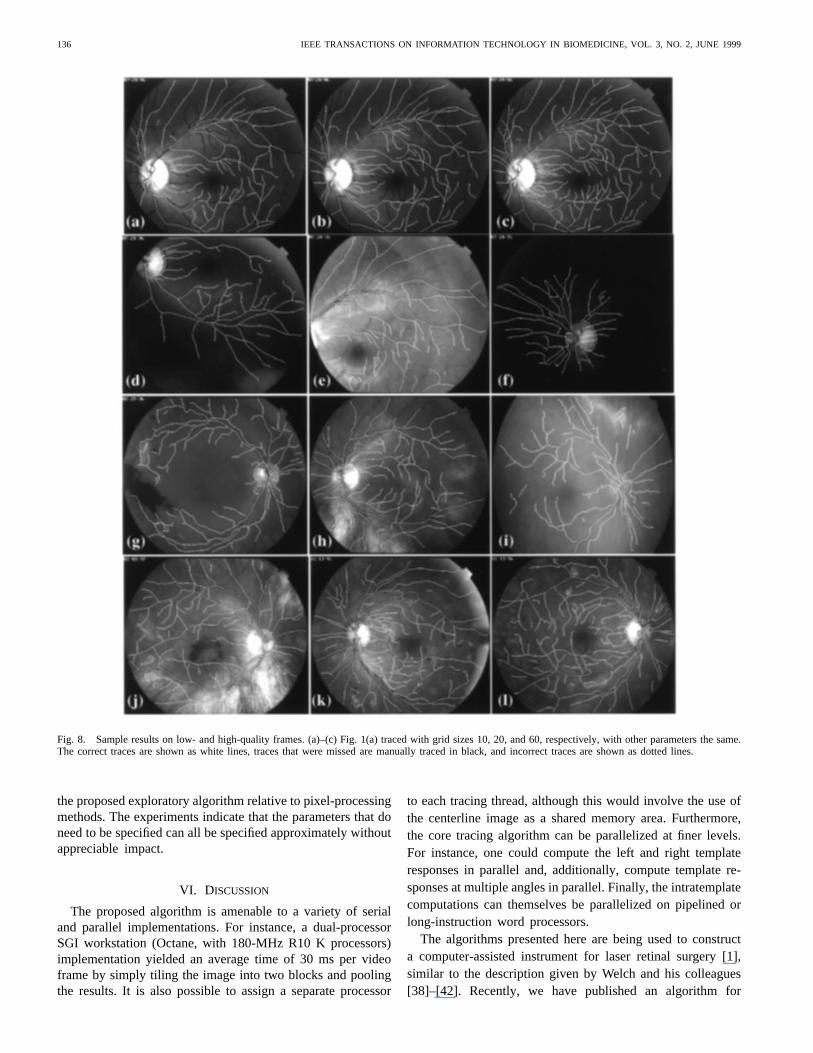
Fig. 8 presents the tracing results on one healthy eye un-der various imaging conditions and settings (a)–(f), and sixpathological eyes (g)–(l). The latter is a subset of our muchlarger collection. Specifically, panels (a)–(c) show the resultsof setting the grid size to 10, 20, and 60, respectively.In these frames, the correct algorithm-generated traces arepresented as lines, the traces that were missed by the algorithmare manually traced, and indicated as black lines, and those that

CAN et al.: RAPID AUTOMATED TRACING AND FEATURE EXTRACTION FROM RETINAL FUNDUS IMAGES 135
(a) (b) (c) (d)
(e)
Fig. 7. Illustrating the impact of� for a sample image. (a) Manually traced result (251 pixels). (b)–(d) Automatic tracing result starting at the same locationat the bottom, and with� of 5%, 21%, and 55%, respectively. (e) Sensitivity parameter versus detected length of a vessel segment.
were algorithm-generated but clearly incorrect are presented asdotted lines. Clearly, increasing leads to improved detectionof the secondary and tertiary vasculature segments. It must benoted that, even for the lower value of grid size, the mainvessels are detected successfully. Panels (d)–(l) show examplesof tracing on low-quality and pathologic frames. The algorithmis able to adapt remarkably well to small amounts of defocusand significant changes in illumination level. Fig. 6(a) and (b)shows the increased number of feature points when the gridsize is increased from 10 to 60.
V. CONCLUSIONS
This work has resulted in refinement and successful adapta-tion of exploratory tracing methods to live ophthalmic images.These images differ from X-ray images in that they are darker,have lower contrast in the region of most interest (the fovea),have higher signal-to-noise ratio, and are affected by differentnoise factors—frequent improper illumination, glare, fadeout,
overexposure, loss of focus, motion, and artifacts arising fromcurvature, reflection, refraction, and dispersion. Our algorithmimproves upon the cited works in terms of speed, automation,robustness, freedom from artifacts, and robust analysis ofbranches and crossovers in the specific context of ophthalmol-ogy. The design of our algorithm was driven by computationalconsiderations as much as by detection performance. Allcomputations can be implemented in fixed-point arithmetic,and the templates are based on a search in discrete spacefor computationally advantageous approximations to the idealvalues. To illustrate, we implemented the Sobel edge detectoron the images presented in Fig. 1 of this paper on the samecomputer that was used to generate the timing results in Fig. 5,using the same compiler settings. When just the square ofSobel magnitude was computed, i.e., without the square rootoperation, and without the trigonometric operations to computethe edge angles, it required an average of 440 ms for the1024 1024 size images. Comparing this with the timingresults in Fig. 5(f) illustrates the computational efficiency of
136 IEEE TRANSACTIONS ON INFORMATION TECHNOLOGY IN BIOMEDICINE, VOL. 3, NO. 2, JUNE 1999
Fig. 8. Sample results on low- and high-quality frames. (a)–(c) Fig. 1(a) traced with grid sizes 10, 20, and 60, respectively, with other parameters the same.The correct traces are shown as white lines, traces that were missed are manually traced in black, and incorrect traces are shown as dotted lines.
the proposed exploratory algorithm relative to pixel-processingmethods. The experiments indicate that the parameters that doneed to be specified can all be specified approximately withoutappreciable impact.
VI. DISCUSSION
The proposed algorithm is amenable to a variety of serialand parallel implementations. For instance, a dual-processorSGI workstation (Octane, with 180-MHz R10 K processors)implementation yielded an average time of 30 ms per videoframe by simply tiling the image into two blocks and poolingthe results. It is also possible to assign a separate processor
to each tracing thread, although this would involve the use ofthe centerline image as a shared memory area. Furthermore,the core tracing algorithm can be parallelized at finer levels.For instance, one could compute the left and right templateresponses in parallel and, additionally, compute template re-sponses at multiple angles in parallel. Finally, the intratemplatecomputations can themselves be parallelized on pipelined orlong-instruction word processors.
The algorithms presented here are being used to constructa computer-assisted instrument for laser retinal surgery [1],similar to the description given by Welch and his colleagues[38]–[42]. Recently, we have published an algorithm for
CAN et al.: RAPID AUTOMATED TRACING AND FEATURE EXTRACTION FROM RETINAL FUNDUS IMAGES 137
real-time retinal tracking and location determination for video-resolution images [1]. This algorithm is based on using thepoint templates of Barrettet al. [39], [42] for small movementsat a fixed magnification, and a slower matching procedure (800ms) to reestablish tracking whenever the point templates fail,which occurs whenever low-quality frames are encountered,whenever the magnification is adjusted, and whenever thesystem is being started for the first time. Though effective, ourearlier method had a disadvantage relating to the procedure forreestablishing tracking. It required extensive low-level pixelprocessing. This prompted an investigation of better scalingmethods, leading to the exploratory methods reported here.With the present formulation, in combination with the pointtemplates of Barrett et al., it is possible to perform all thecomputations for the surgery system in an exploratory manner.The exploratory approach is computationally more attractive(250 ms versus 800 ms) and scales better with image size.It also yields more compact signatures for the crossover andbranching points [1]. It must be noted that the tracing algorithmis only invoked when the point templates [39]–[42] fail. Whenthis occurs, the present algorithm is constantly applied to newframes, and a tracking lock is attempted until it succeeds. Inthis context, it isnot essential,although desirable, for thetracing algorithm presented in this paper to operate at 30frame/s. As noted earlier, this has been achieved for video-resolution image streams.
ACKNOWLEDGMENT
The authors would like to thank the staff at the Center forSight, especially photographers G. Howe and M. Fish, forassisting with image acquisition. The authors appreciate theinsightful inputs of Dr. G. Nagy at Rensselaer PolytechnicInstitute, especially regarding vectorization methods from thedocument image analysis literature. Finally, the authors givemany thanks to K. Al-Kofahi for various valuable inputs andto E. Balduf for the dual-processor frame-rate video-basedimplementation.
REFERENCES
[1] D. E. Becker, A. Can, H. L. Tanenbaum, J. N. Turner, and B. Roysam,“Image processing algorithms for retinal montage synthesis, mapping,and real-time location determination,”IEEE Trans. Biomed. Eng.,vol.45, pp. 105–118, Jan. 1998.
[2] A. A. Mahurkar, M. A. Vivino, B. L. Trus, E. M. Kuehl, M. B.Datiles, III, and M. I. Kaiser-Kupfer, “Constructing retinal fundusphotomontages,”Investigative Ophthalmol. & Visual Sci.,vol. 37, no.8, pp. 384–401, pp. 1675–1683, July 1996.
[3] M. H. Goldbaum, N. Katz, S. Chaudhuri, M. Nelson, and P. Kube,“Digital image processing for ocular fundus images,”Ophthalmol. Clin.N. Amer.,vol. 3, no. 3, pp. 447–466, Sept. 1990.
[4] M. H. Goldbaum, V. Kouznetsova, B. L. Cote, W. E. Hart, and M.Nelson, “Automated registration of digital ocular fundus images forcomparison of lesions,”SPIE: Ophthalmic Technologies III,vol. 1877,pp. 94–99, 1993.
[5] T. M. Clark, W. R. Freeman, and M. H. Goldbaum, “Digital overlay offluorescein angiograms and fundus images for treatment of subretinalneovascularization,”Retina—J. Retinal and Vitreous Diseases,vol. 2,no. 12, pp. 118–126, 1992.
[6] S. Chaudhuri, S. Chatterjee, N. Katz, M. Nelson, and M. Goldbaum,“Detection of blood vessels in retinal images using two-dimensionalmatched filters,”IEEE Trans. Med. Imag.,vol. 8, pp. 263–269, Sept.1989.
[7] K. Stromland, A. Hellstrom, and T. Gustavsson, “Morphometry ofthe optic nerve and retinal vessels in children by computer-assistedimage analysis of fundus photographs,” inGraefe’s Arch. Clin. Exp.Ophthalmol. Berlin, Germany: Springer-Verlag, 1995, vol. 233, pp.150–153.
[8] R. Polli and G. Valli, “An algorithm for real-time vessel enhancementand detection,”Comput. Meth. Programs Biomed.,vol. 52, pp. 1–22,1997.
[9] A. S. Stansfield, “ANGY: A rule-based expert system for automaticsegmentation of coronary vessels from digital subtracted angiograms,”IEEE Trans. Pattern Anal. Mach. Intell.,vol. PAMI-8, pp. 188–199,Mar. 1986.
[10] J. Y. Catrox and D. Mischler, “An artificial intelligence approach formedical picture analysis,”Pattern Recogn. Lett.,vol. 8, pp. 123–130,1988.
[11] G. Coppini, M. Demi, R. Poli, and G. Valli, “An artificial vision systemfor X-ray images of human coronary trees,”IEEE Trans. Pattern Anal.Mach. Intell., vol. 15, pp. 156–162, Feb. 1993.
[12] J. L. Coatrieux, M. Garreau, R. Collorec, and C. Roux, “Computervision approaches for the three-dimensional reconstruction: Review andprospects,”Critical Rev. Biomed. Eng.,vol. 22, no. 1, pp. 1–38, 1994.
[13] L. H. Staib and J. S. Duncan, “Boundary finding with parametricallydeformable models,”IEEE Trans. Pattern Anal. Machine Intell.,vol.14, pp. 1061–1075, Nov. 1992.
[14] L. Zhou, M. S. Rzeszotarski, L. J. Singerman, and J. M. Chokreff, “Thedetection and quantification of retinopathy using digital angiograms,”IEEE Trans. Med. Imag.,vol. 13, pp. 619–626, Dec. 1994.
[15] Y. Sun, “Automated identification of vessel contours in coronary arte-riograms by an adaptive tracking algorithm,”IEEE Trans. Med. Imag.,vol. 8, pp. 78–88, Mar. 1989.
[16] P. J. H. van Cuyck, J. J. Gerbrands, and J. H. C. Reiber, “Automatedcenterline tracing in coronary angiograms,”Pattern Recog. ArtificialIntell., pp. 169–183, 1998.
[17] M. A. T. Figueiredo and J. M. N. Leitao, “A nonsmoothing approachto the estimation of vessel contours in angiograms,”IEEE Trans. Med.Imag., vol. 14, pp. 162–172, Mar. 1995.
[18] M. Sonka, M. D. Winniford, and S. M. Collins, “Reduction of failurerates in automated analysis of difficult images: Improved simultaneousdetection of left and right coronary borders,”Computers in Cardiology,pp. 111–114, 1992.
[19] M. Sonka, M. D. Winniford, and S. M. Collins, “Coronary borders incomplex images,”IEEE Trans. Med. Imag.,vol. 14, pp. 151–161, Mar.1995.
[20] M. Sonka, M. D. Winniford, X. Zhang, and S. M. Collins, “Lumencenterline detection in complex coronary angiograms,”IEEE Trans.Biomed. Imag.,vol. 41, pp. 520–528, June 1994.
[21] A. Klein, T. K. Egglin, J. S. Pollak, F. Lee, and A. A. Amini,“Identifying vascular features with orientation specific filters and B-spline snakes,”Computers in Cardiology,pp. 113–116, 1994.
[22] M. Hart and L. Holley, “A method of automated coronary artery trackingin unsubtracted angiograms,”Computers in Cardiology,pp. 93–96,1993.
[23] E. Mortensen, B. Morse, W. Barrett, and J. Udupa, “Adaptive bound-ary detection using live-wire two-dimensional dynamic programming,”Computers in Cardiology,pp. 635–638, 1992.
[24] Y. Liu and Y. Sun, “Recursive tracking of vascular networks inangiograms based on detection-deletion scheme,”IEEE Trans. Med.Imag., vol. 12, pp. 334–341, June 1993.
[25] S. Lu and S. Eiho, “Automatic detection of the coronary arterial contourswith sub-branches from an X-ray angiogram,”Computers in Cardiology,pp. 575–578, 1993.
[26] R. Collorec and J. L. Coatrieux, “Vectorial tracking and directed contourfinder for vascular network in digital subtraction angiography,”PatternRecog. Lett.,vol. 8, no. 5, pp. 353–358, Dec. 1988.
[27] T. V. Nguyen and J. Sklansky, “Computing the skeleton of coronaryarteries in cineangiograms,”Computers and Biomedical Research,vol.19, pp. 428–444, 1986.
[28] , “A fast skeleton-finder for coronary arteries,” inProceedingsInt. Conf. Pattern Recog.,Paris, France, 1986, pp. 481–483.
[29] T. Fukui, M. Yachida, and S. Tsuji, “Detection and tracking of bloodvessels in cine-angiograms,” inProc. 5th Int. Conf. Pattern Recog.,1980,pp. 59–64.
[30] P. H. Eichel, E. J. Delp, K. Koral, and A. J. Buda, “A method for a fullyautomatic definition of coronary arterial edges from cineangiograms,”IEEE Trans. Med. Imag.,vol. 7, pp. 313–320, Dec. 1988.
[31] H. Shen, “Optical instrumentation and real-time image processing al-gorithms for simultaneous ICG and red-free video angiography of theretina,” M.S. thesis, Rensselaer Polytechnic Inst., Troy, NY, 1996.
138 IEEE TRANSACTIONS ON INFORMATION TECHNOLOGY IN BIOMEDICINE, VOL. 3, NO. 2, JUNE 1999
[32] R. W. Flower and B. F. Hochheimer, “A clinical technique and apparatusfor simultaneous angiography of the separate retinal and choroidalcirculation,” Investigative Ophthalmol.,vol. 12, no. 4, pp. 248–261,Apr. 1973.
[33] R. D. T. Janssen and A. M. Vossepoel, “Adaptive vectorization of linedrawing images,”Computer Vision and Image Understanding,vol. 65,no. 1, pp. 38–56, Jan. 1997.
[34] M. Garreau, J. L. Coatrieux, R. Collorec, and C. Chardenon, “Aknowledge-based approach for 3-D reconstruction and labeling of vascu-lar networks from biplane angiographic projections,”IEEE Trans. Med.Imag., vol. 10, pp. 122–131, June 1991.
[35] L. V. Tran, R. C. Bahn, and J. Sklansky, “Reconstructing the crosssections of coronary arteries from biplane angiograms,”IEEE Trans.Med. Imag.,vol. 11, pp. 517–529, Dec. 1992.
[36] T. V. Nguyen and J. Sklansky, “Reconstructing the 3-D medical axescoronary arteries in single-view cineangiograms,”IEEE Trans. Med.Imag., vol. 13, pp. 61–73, Mar. 1994.
[37] Y. Sun, R. J. Lucariello, and S. A. Chiaramida, “Directional low-pass filtering for improved accuracy and reproducibility of stenosisquantification in coronary arteriograms,”IEEE Trans. Med. Imag.,vol.14, pp. 242–248, June 1995.
[38] A. J. Welch, “University of Texas lab studies tissue optics, ablation,automation,”Biomedical Optics: The Newsletter of the Biomedical Opt.Soc.,vol. 2, no. 2, May 1993.
[39] S. F. Barrett, M. R. Jerath, H. G. Rylander, and A. J. Welch, “Digitaltracking and control of retinal images,”Opt. Eng.,vol. 33, no. 1, pp.150–159, Jan. 1994.
[40] C. H. G. Wright, R. D. Ferguson, H. G. Rylander, III, A. J. Welch, andS. F. Barrett, “Hybrid approach to retinal tracking and laser aiming forphotocoagulation,”J. Biomed. Opt.,vol. 2, no. 2, pp. 195–203, Apr.1997.
[41] S. F. Barrett, M. R. Jerath, H. G. Rylander, III, and A. J. Welch,“Automated lesion placement in the rabbit eye,”Lasers in Surgery andMedicine,vol. 17, pp. 172–177, 1995.
[42] M. S. Markow, H. G. Rylander, and A. J. Welch, “Real-time algorithmfor retinal tracking,” IEEE Trans. Biomed. Eng.,vol. 40, no. 12, pp.1269–1281, Dec. 1993.
Ali Can received the B.S. degree in electrical engi-neering from the University of Gaziantep, Turkey, in1993, and the M.S. degree in computer and systemsengineering from Rensselaer Polytechnic Institute(RPI), Troy, NY, in 1997. He is currently workingtoward the Ph.D. degree at the same institution.
His research interests include biomedical imageanalysis and real-time applications, robust methodsfor motion, and structure estimation (2-D and 3-D)from image sequences.
Mr. Can is a member of the Microscopy Societyof America.
Hong Shenreceived the B.Eng. degree in electricalengineering from Tsinghua University, China, in1990, with concentration in optoelectronics and theM.Sc. degree in electrical engineering from Rens-selaer Polytechnic Institute in 1996. He is currentlyworking toward the Ph.D. degree in electrical andcomputer systems engineering.
From 1990 to 1994, he was a Research Engineerwith the Institute of Semiconductors, AcademicSinica, China. His current research includes im-age analysis and processing, medical imaging, andinstrumentation.
James N. Turner received the B.S. degree in en-gineering science in 1968, and the Ph.D. degree inbiophysics in 1973, from the State University ofNew York at Buffalo.
He did National Institutes of Health and NationalScience Foundation postdoctoral fellowships at theRoswell Park Memorial Institute, Buffalo, NY. Cur-rently, he is Director of the Three-DimensionalLight Microscopy Facility at the Wadsworth Cen-ter of the New York State Department of Health,Albany, NY. He is also Professor of Biomedical
Engineering at Rensselaer Polytechnic Institute, Troy, NY, and BiomedicalSciences in the School of Public Health of the University at Albany. Hisinterests focus on applications of light imaging methods and quantitativeimage analysis in biology and medicine, with special emphasis on the nervoussystem. He is on the editorial boards ofMicroscopy and MicroanalysisandMicroscopy Research Techniques,and has chaired numerous symposia in thearea of 3-D microscopy, both light and electron, at meetings of the MicroscopySociety of America.
Dr. Turner is a member of the Microscopy Society of America, theInternational Society for Analytical Cytology, AAAS, and the Society forNeuroscience. He frequently serves on National Institutes of Health advisorypanels.
Howard L. Tanenbaum received the B.Sc. andM.D.C.M. degrees from McGill University, Canada.
He has taught ophthalmology at various levels atthe University of Colorado, Fort Collins (1962 to1963), Montreal General Hospital (1968 to 1969),Jewish General Hospital, Montreal, Canada (1968to 1984), McGill University (1968 to 1984), andAlbany Medical College, Albany, NY (1984 to1987). He is currently director of The Center forSight, Albany, NY. His research interests are in pro-liferative vitreoretinal diseases, diabetic retinopathy,
neovascularization, and a variety of laser-related issues.Dr. Tanenbaum is a Fellow of the Royal College of Physicians and Surgeons
of Canada. He is a member of the Association for Research in Visionand Ophthalmology (ARVO), Canadian Medical Association, The RetinaSociety, the American Academy of Ophthalmology, the New York Academyof Science, the Quebec Retina Club, the Macula Society, the Northeast Eye,Ear, and Throat Society of New York, the New York State Medical Society,the New York State Ophthalmological Society, and The American MedicalAssociation. He is on the editorial committee of the National Eye TraumaRegistry and a contributing editor to theOphthalmic Practice Journal.
Badrinath Roysam (M’89) received the B.Tech.degree in electronics engineering from the IndianInstitute of Technology, Madras, India, in 1984, andthe M.S. and D.Sc. degrees in electrical engineeringfrom Washington University in St. Louis, MO, in1987 and 1989, respectively.
He has been at Rensselaer Polytechnic Institute,Troy, NY, since 1989, where he is currently anAssociate Professor in the Electrical, Computer, andSystems Engineering Department. He has consultedfor various major and small corporations on imaging
systems and image processing, and has assisted venture capital companies witha detailed analysis of startup companies. His current research interests are inthe areas of biomedical image analysis, optical instrumentation, high-speedand real-time computing architectures, parallel algorithms, and compellingmedical applications.
Dr. Roysam is a member of the Microscopy Society of America and theAssociation for Research in Vision and Ophthalmology.
Related Documents