RAPID ASSESSMENT OF TRAVEL PATTERNS IN DELHI - HORIZON YEAR 2030 & 2050 May 2017 School of Planning & Architecture New Delhi Authors: Prof. Dr. Sanjay Gupta Sandhya Dameniya

Welcome message from author
This document is posted to help you gain knowledge. Please leave a comment to let me know what you think about it! Share it to your friends and learn new things together.
Transcript
RAPID ASSESSMENT OF TRAVEL
PATTERNS IN DELHI - HORIZON YEAR
2030 & 2050
May 2017 School of Planning & Architecture New Delhi
Authors:
Prof. Dr. Sanjay Gupta
Sandhya Dameniya
School of Planning and Architecture, New Delhi
RAPID ASSESSMENT OF TRAVEL PATTERNS IN DELHI - HORIZON YEAR 2030 & 2050
1 Introduction
The main aim of the report is to assess the travel demand in NCT-Delhi. Under the CLIMATRANS Project, the assessment travel patterns is needed for the accomplishment of WP3 criteria which focus on outlines the trends (i.e. Population, Employees, Mobility rates etc.) and projections of the climate change impact in the case cities in 2050. The evaluation of the climate change impacts, by 2050, on the case cities under the BAU scenario in performed under WP3.
Data Source From the past transport related studies like RITES 1994; RITES, Planning for Mass Transit System for Delhi 1989; Transport Demand Forecast Study and Development of an Integrated Road cum Multi-Modal Public Transport Network for NCT of Delhi – RITES. 2010.
2 Base Year Trend (2011)
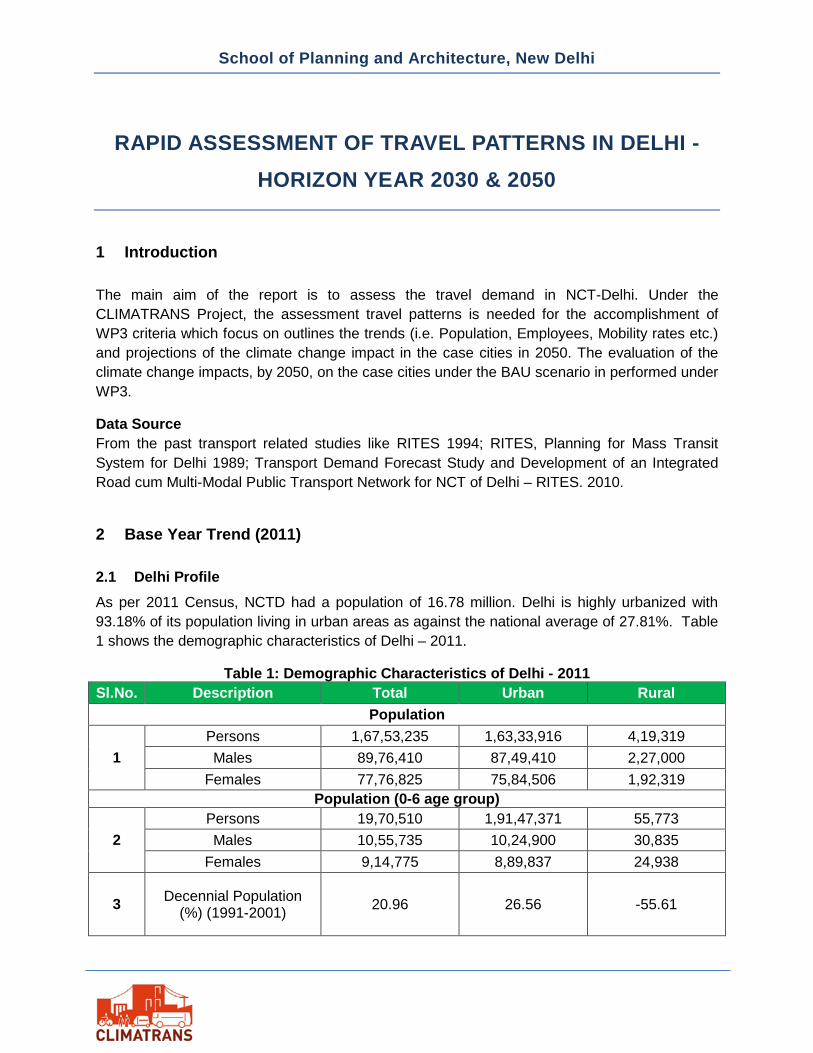
2.1 Delhi Profile As per 2011 Census, NCTD had a population of 16.78 million. Delhi is highly urbanized with 93.18% of its population living in urban areas as against the national average of 27.81%. Table 1 shows the demographic characteristics of Delhi – 2011.
Table 1: Demographic Characteristics of Delhi - 2011 Sl.No. Description Total Urban Rural
Population
1 Persons 1,67,53,235 1,63,33,916 4,19,319 Males 89,76,410 87,49,410 2,27,000
Females 77,76,825 75,84,506 1,92,319 Population (0-6 age group)
2 Persons 19,70,510 1,91,47,371 55,773 Males 10,55,735 10,24,900 30,835
Females 9,14,775 8,89,837 24,938
3 Decennial Population (%) (1991-2001) 20.96 26.56 -55.61
School of Planning and Architecture, New Delhi
Sl.No. Description Total Urban Rural
4 Literacy Rate (%) 86.34 86.43 82.67
5 Density of Population(Sq. km) 11,297 14,667 1,135
6 Sex Ratio (female per 1000 males) 866 867 847
Source: Statistical Abstract of Delhi – 2014
The other salient characteristics as observed from above Table 2.4 are as under:
• Total literacy rate of Delhi is 86.34 % as per provisional data 2011 comprising 91.03 % of men and 80.93% of women literacy rate. Delhi has the 9th place in literacy rate among all states/UTs.
• There has been a substantial increase in the overall sex-ratio, from 821 in 2001 to 866 in 2011.
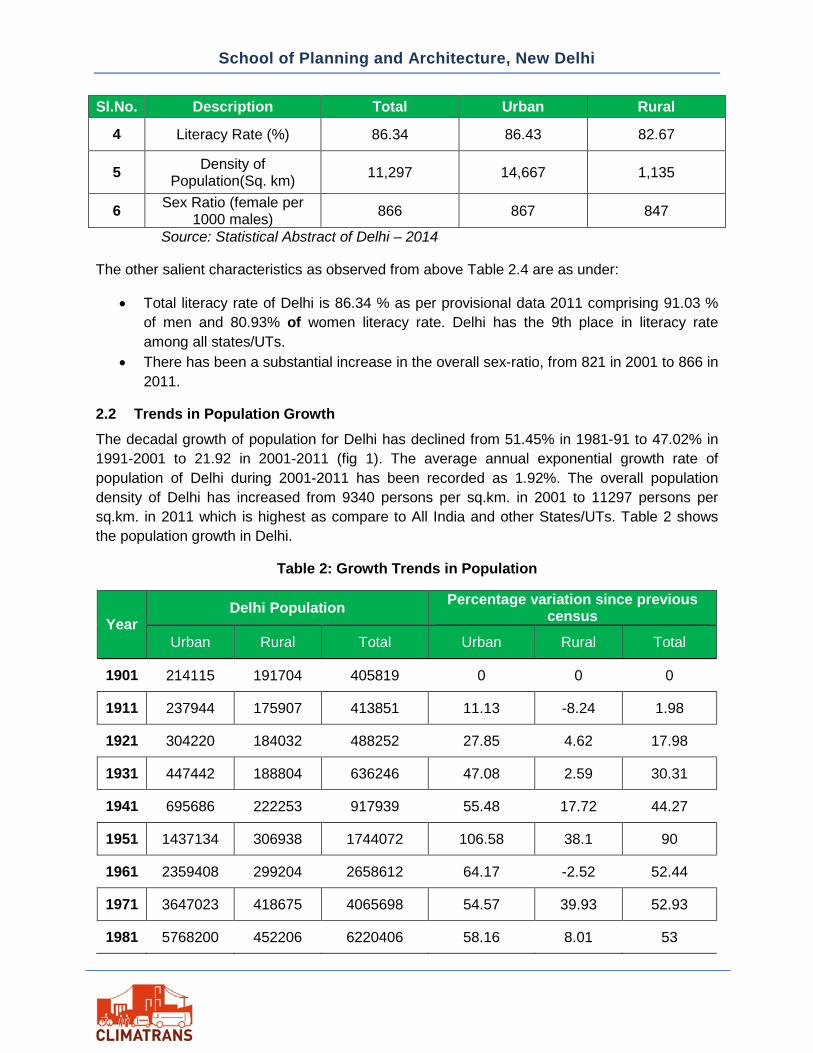
2.2 Trends in Population Growth The decadal growth of population for Delhi has declined from 51.45% in 1981-91 to 47.02% in 1991-2001 to 21.92 in 2001-2011 (fig 1). The average annual exponential growth rate of population of Delhi during 2001-2011 has been recorded as 1.92%. The overall population density of Delhi has increased from 9340 persons per sq.km. in 2001 to 11297 persons per sq.km. in 2011 which is highest as compare to All India and other States/UTs. Table 2 shows the population growth in Delhi.
Table 2: Growth Trends in Population
Year Delhi Population Percentage variation since previous
census Urban Rural Total Urban Rural Total
1901 214115 191704 405819 0 0 0
1911 237944 175907 413851 11.13 -8.24 1.98
1921 304220 184032 488252 27.85 4.62 17.98
1931 447442 188804 636246 47.08 2.59 30.31
1941 695686 222253 917939 55.48 17.72 44.27
1951 1437134 306938 1744072 106.58 38.1 90
1961 2359408 299204 2658612 64.17 -2.52 52.44
1971 3647023 418675 4065698 54.57 39.93 52.93
1981 5768200 452206 6220406 58.16 8.01 53
School of Planning and Architecture, New Delhi
Year Delhi Population Percentage variation since previous
census Urban Rural Total Urban Rural Total
1991 8471625 949019 9420644 46.87 109.86 51.45
2001 12905780 944727 13850507 52.34 -0.45 47.02
2011 16368899 419042 16787941 26.8 -55.6 21.2 Source: Statistical Abstract of Delhi – 2014
Figure 1: Decadal Growth of Population for Delhi (%)
Source: Statistical Abstract of Delhi 2014
2.3 Transport system
2.3.1 Road Network System The existing transport network in Delhi is “Ring and radial’ in nature. The transportation network in Delhi is predominantly road based with 1284 km of road per 100Sq.km. The total road length (km. lane) which was 14,316 km in 1981 which increased to 28,508 km in 2001 and 31,373 km in 2009 respectively.
2.3.2 Registered Vehicles and Trends in Motorisation
Delhi had a registered vehicle population of 7.45 million in 2011 having increased from 5.21 million in 1981 at a CAGR of 1.20%. Two-wheelers (63%) followed by passenger cars (32%) have major share in the fleet. Table 3 shows the growth trend of registered vehicles in Delhi.
11.1327.85
47.0855.48
106.5864.17
54.57 58.1646.87 52.34
26.80
-8.24
4.62 2.5917.72 38.1
-2.5239.93
8.01
109.86
-0.45
-55.6
1901 1911 1921 1931 1941 1951 1961 1971 1981 1991 2001 2011
Urban Rural
School of Planning and Architecture, New Delhi
Table 3: Growth Trends of Registered Motor Vehicles
Year
Personal Vehicles Commercial Vehicles Total Cars & Jeeps
Two-wheeler’s
Auto rickshaw Taxis Buses Good
Vehicles
1980-81 1,17,213 3,34,389 19,947 6,255 7,912 35,741 5,21,457 1985-86 1,74,890 6,37,267 30,354 8,654 13,815 58,925 9,23,905 1990-91 3,83,610 11,91,186 62,007 10,026 18,651 99,078 17,64,558 1995-96 6,17,585 17,07,528 77,884 13,384 27,473 1,31,877 25,75,731 1996-97 7,05,923 18,76,053 80,210 15,015 29,572 1,40,922 28,47,695 1999-00 7,65,470 19,91,710 80,210 16,654 32,333 1,46,668 30,33,045 2000-01 8,18,962 21,01,876 86,985 17,136 35,254 1,50,243 32,10,456 2001-02 8,69,820 21,84,581 86,985 17,762 37,733 1,56,157 33,53,038 2002-03 9,20,723 22,30,534 86,985 18,362 41,483 1,58,492 34,56,579 2003-04 9,68,894 22,65,955 86,985 20,628 47,578 1,61,650 35,51,690 2004-05 12,14,693 25,17,788 49,538 9,936 18,731 1,29,723 39,40,409 2005-06 13,14,672 26,65,750 52,905 11,495 21,962 1,35,671 42,02,455 2006-07 14,31,638 28,44,004 53,656 13,511 24,235 1,40,982 45,08,026 2007-08 14,66,641 30,62,536 73,644 20,693 43,500 1,41,996 48,09,010 2008-09 15,89,872 32,99,838 74,189 24,958 46,581 1,49,972 51,85,410 2009-10 20,13,680 40,55,229 86,482 45,240 58,047 1,93,205 64,51,883 2010-11 21,73,323 43,42,403 88,181 57,958 61,471 2,09,370 69,32,706 2011-12 23,43,113 46,44,146 88,197 69,780 64,033 2,28,886 74,38,155 2012-13 24,74,087 49,62,507 86,838 70,335 39,694 1,40,942 77,74,403 2013-14 26,29,343 52,97,697 91,840 78,686 40,947 1,54,654 82,93,167 2014-15 27,90,566 56,81,265 81,633 79,606 19,729 1,60,156 88,12,955
Source: Transport Department, GNCT of Delhi.
2.3.3 Mass Transport System Urban Bus Transport System
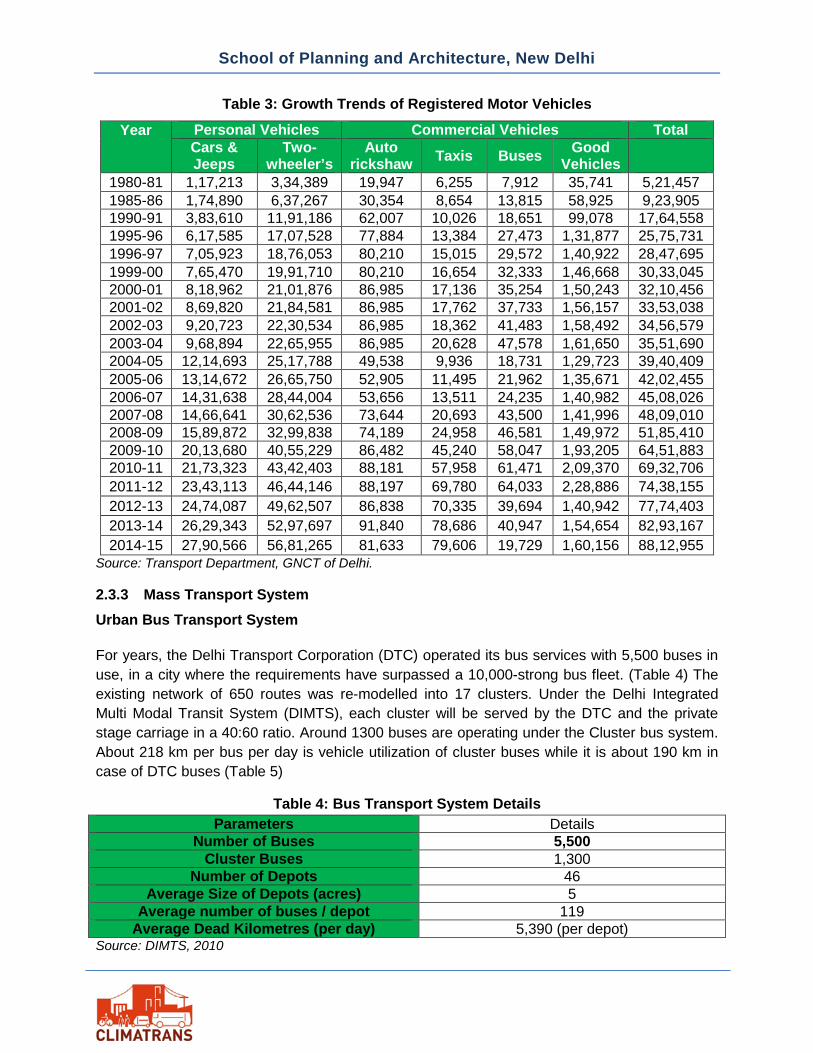
For years, the Delhi Transport Corporation (DTC) operated its bus services with 5,500 buses in use, in a city where the requirements have surpassed a 10,000-strong bus fleet. (Table 4) The existing network of 650 routes was re-modelled into 17 clusters. Under the Delhi Integrated Multi Modal Transit System (DIMTS), each cluster will be served by the DTC and the private stage carriage in a 40:60 ratio. Around 1300 buses are operating under the Cluster bus system. About 218 km per bus per day is vehicle utilization of cluster buses while it is about 190 km in case of DTC buses (Table 5)
Table 4: Bus Transport System Details Parameters Details
Number of Buses 5,500 Cluster Buses 1,300
Number of Depots 46 Average Size of Depots (acres) 5
Average number of buses / depot 119 Average Dead Kilometres (per day) 5,390 (per depot)
Source: DIMTS, 2010
School of Planning and Architecture, New Delhi
Table 5: Cluster Buses Performance Measurement
Attribute Unit of Measurement Cluster Buses Km Efficiency % 91.23
Fleet Utilization % 93.48 Vehicle Utilization Kms / Bus / Day 218.43
Gross Earning Rs. / Bus/ Day 7427 Accident Rate Number per 1 Lakh Kms 0.02
Passenger carried daily Numbers/Bus/Day +1000 Source: DIMTS, 2010
Delhi Metro Rail System
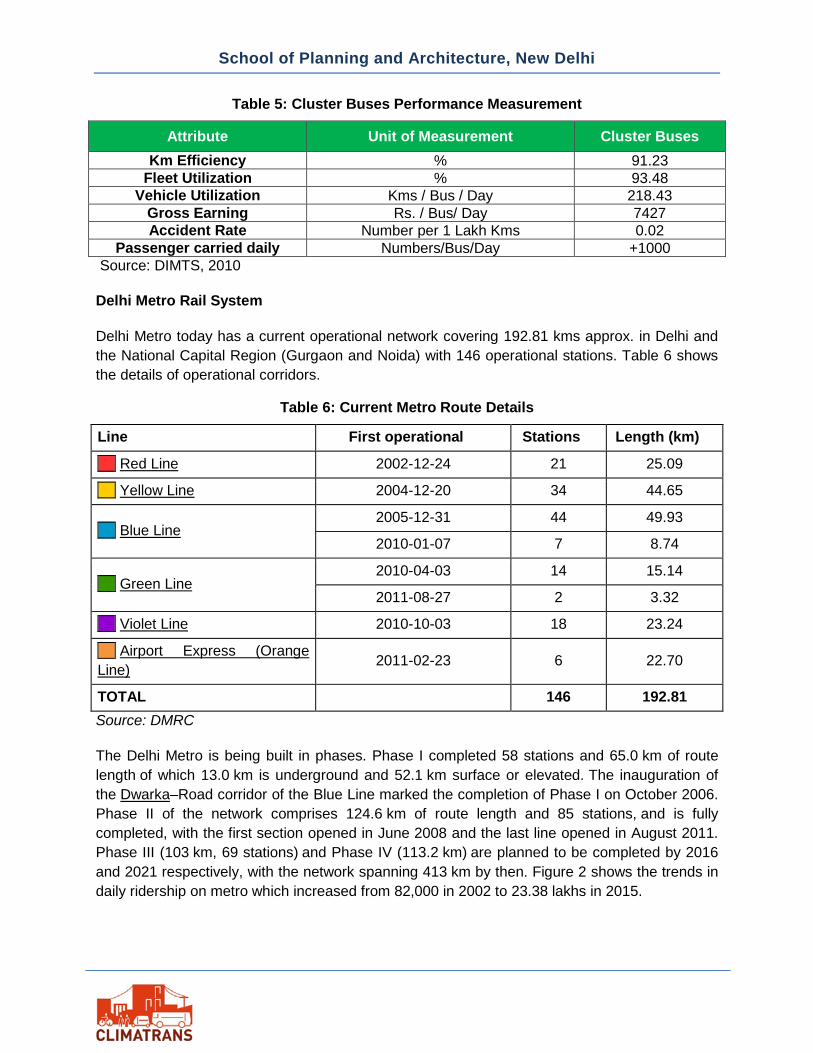
Delhi Metro today has a current operational network covering 192.81 kms approx. in Delhi and the National Capital Region (Gurgaon and Noida) with 146 operational stations. Table 6 shows the details of operational corridors.
Table 6: Current Metro Route Details
Line First operational Stations Length (km)
Red Line 2002-12-24 21 25.09
Yellow Line 2004-12-20 34 44.65
Blue Line 2005-12-31 44 49.93
2010-01-07 7 8.74
Green Line 2010-04-03 14 15.14
2011-08-27 2 3.32
Violet Line 2010-10-03 18 23.24
Airport Express (Orange Line) 2011-02-23 6 22.70
TOTAL 146 192.81 Source: DMRC
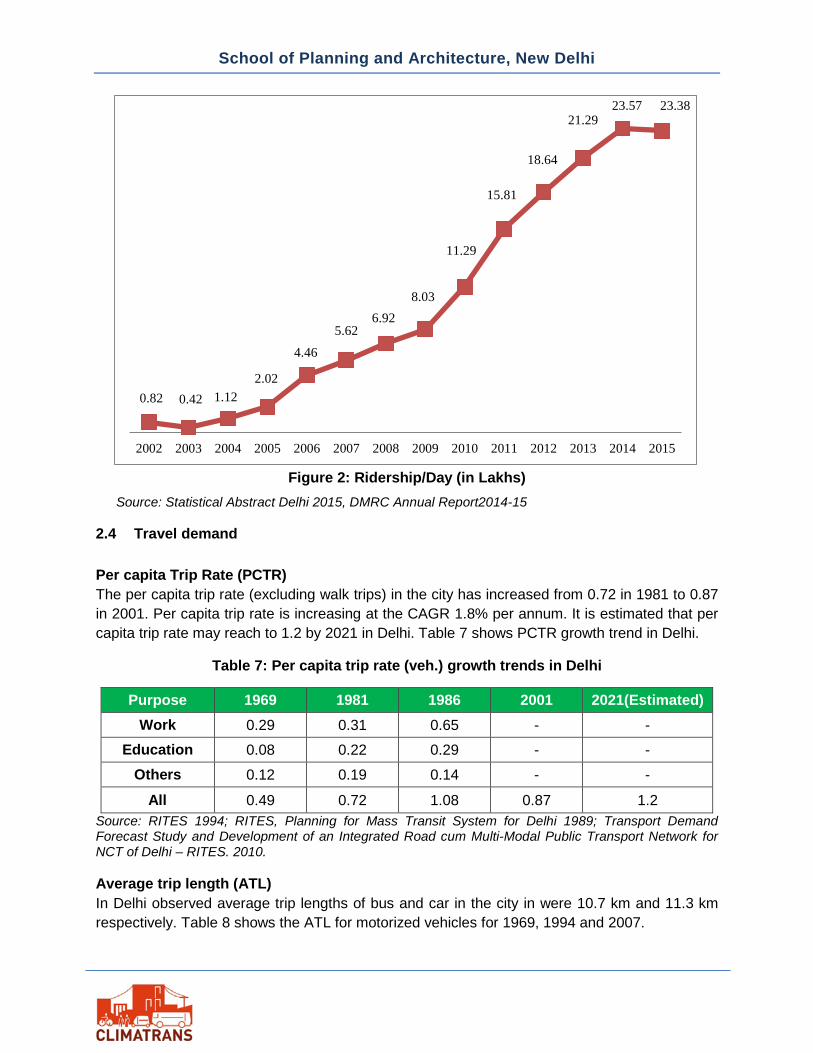
The Delhi Metro is being built in phases. Phase I completed 58 stations and 65.0 km of route length of which 13.0 km is underground and 52.1 km surface or elevated. The inauguration of the Dwarka–Road corridor of the Blue Line marked the completion of Phase I on October 2006. Phase II of the network comprises 124.6 km of route length and 85 stations, and is fully completed, with the first section opened in June 2008 and the last line opened in August 2011. Phase III (103 km, 69 stations) and Phase IV (113.2 km) are planned to be completed by 2016 and 2021 respectively, with the network spanning 413 km by then. Figure 2 shows the trends in daily ridership on metro which increased from 82,000 in 2002 to 23.38 lakhs in 2015.
School of Planning and Architecture, New Delhi
Figure 2: Ridership/Day (in Lakhs)
Source: Statistical Abstract Delhi 2015, DMRC Annual Report2014-15
2.4 Travel demand
Per capita Trip Rate (PCTR) The per capita trip rate (excluding walk trips) in the city has increased from 0.72 in 1981 to 0.87 in 2001. Per capita trip rate is increasing at the CAGR 1.8% per annum. It is estimated that per capita trip rate may reach to 1.2 by 2021 in Delhi. Table 7 shows PCTR growth trend in Delhi.
Table 7: Per capita trip rate (veh.) growth trends in Delhi
Purpose 1969 1981 1986 2001 2021(Estimated) Work 0.29 0.31 0.65 - -
Education 0.08 0.22 0.29 - - Others 0.12 0.19 0.14 - -
All 0.49 0.72 1.08 0.87 1.2 Source: RITES 1994; RITES, Planning for Mass Transit System for Delhi 1989; Transport Demand Forecast Study and Development of an Integrated Road cum Multi-Modal Public Transport Network for NCT of Delhi – RITES. 2010.
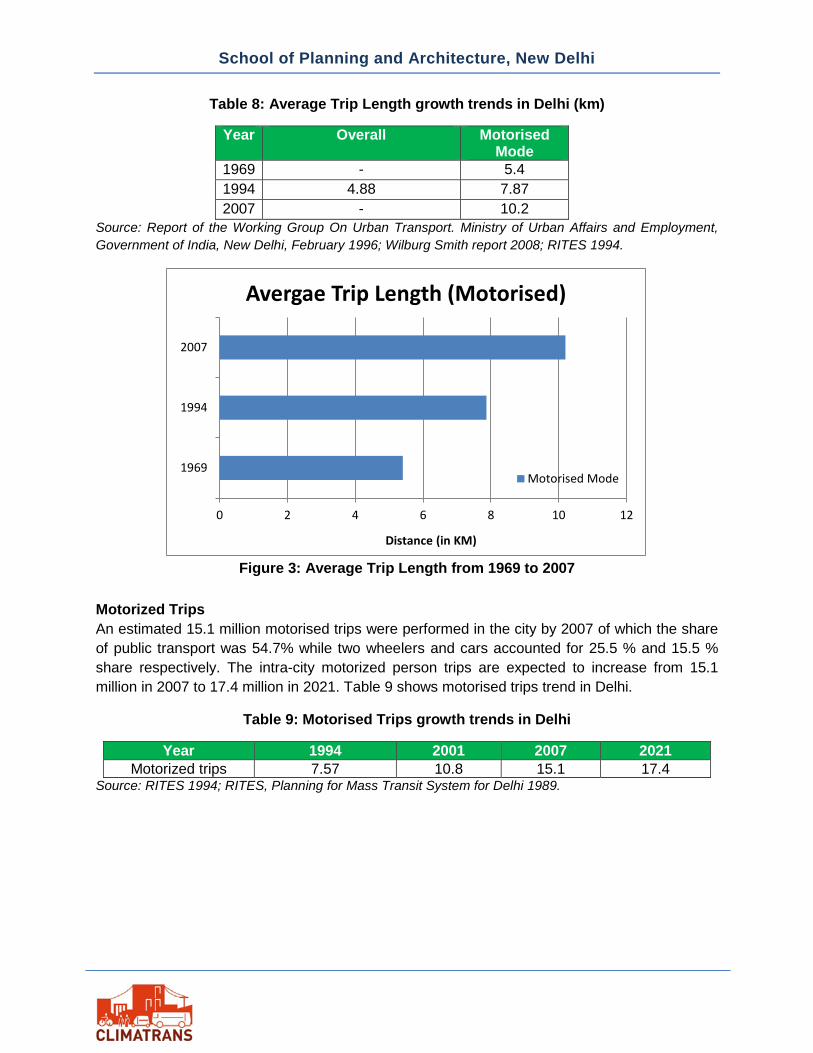
Average trip length (ATL) In Delhi observed average trip lengths of bus and car in the city in were 10.7 km and 11.3 km respectively. Table 8 shows the ATL for motorized vehicles for 1969, 1994 and 2007.
0.82 0.42 1.122.02
4.465.62
6.928.03
11.29
15.81
18.64
21.2923.57 23.38
2002 2003 2004 2005 2006 2007 2008 2009 2010 2011 2012 2013 2014 2015
School of Planning and Architecture, New Delhi
Table 8: Average Trip Length growth trends in Delhi (km)
Year Overall Motorised Mode
1969 - 5.4 1994 4.88 7.87 2007 - 10.2
Source: Report of the Working Group On Urban Transport. Ministry of Urban Affairs and Employment, Government of India, New Delhi, February 1996; Wilburg Smith report 2008; RITES 1994.
Figure 3: Average Trip Length from 1969 to 2007
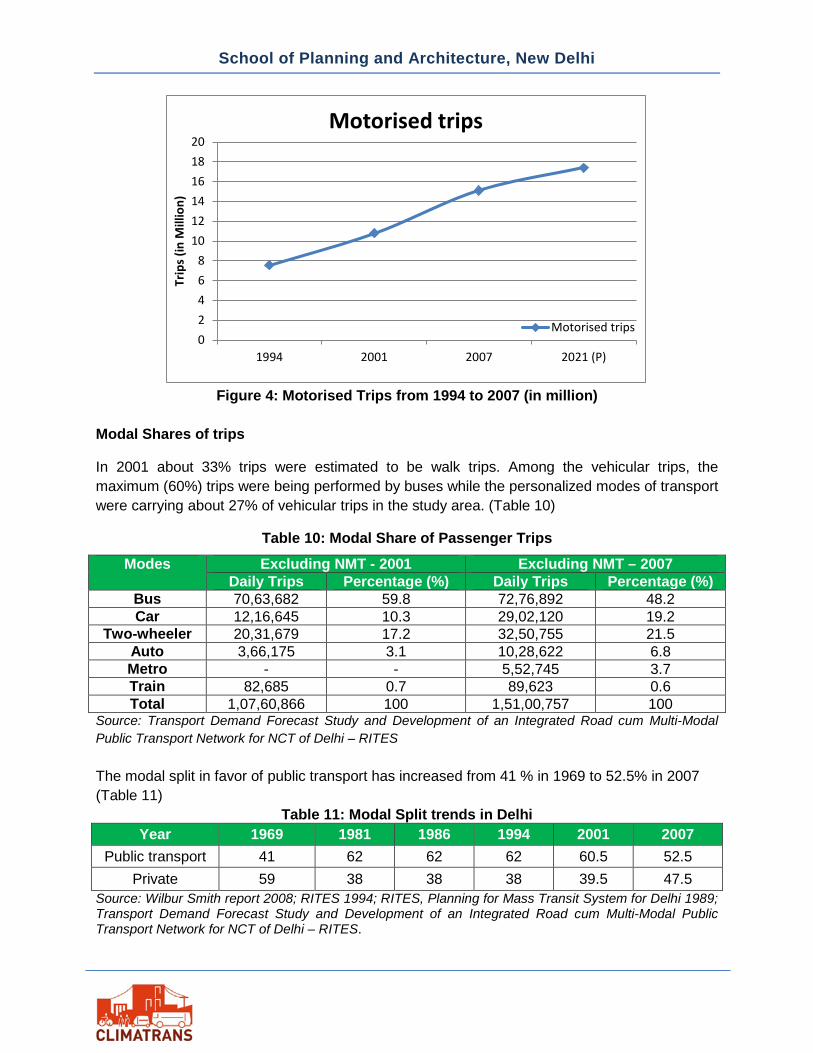
Motorized Trips An estimated 15.1 million motorised trips were performed in the city by 2007 of which the share of public transport was 54.7% while two wheelers and cars accounted for 25.5 % and 15.5 % share respectively. The intra-city motorized person trips are expected to increase from 15.1 million in 2007 to 17.4 million in 2021. Table 9 shows motorised trips trend in Delhi.
Table 9: Motorised Trips growth trends in Delhi
Year 1994 2001 2007 2021 Motorized trips 7.57 10.8 15.1 17.4
Source: RITES 1994; RITES, Planning for Mass Transit System for Delhi 1989.
0 2 4 6 8 10 12
1969
1994
2007
Distance (in KM)
Avergae Trip Length (Motorised)
Motorised Mode
School of Planning and Architecture, New Delhi
Figure 4: Motorised Trips from 1994 to 2007 (in million)
Modal Shares of trips
In 2001 about 33% trips were estimated to be walk trips. Among the vehicular trips, the maximum (60%) trips were being performed by buses while the personalized modes of transport were carrying about 27% of vehicular trips in the study area. (Table 10)
Table 10: Modal Share of Passenger Trips
Modes Excluding NMT - 2001 Excluding NMT – 2007 Daily Trips Percentage (%) Daily Trips Percentage (%)
Bus 70,63,682 59.8 72,76,892 48.2 Car 12,16,645 10.3 29,02,120 19.2
Two-wheeler 20,31,679 17.2 32,50,755 21.5 Auto 3,66,175 3.1 10,28,622 6.8 Metro - - 5,52,745 3.7 Train 82,685 0.7 89,623 0.6 Total 1,07,60,866 100 1,51,00,757 100
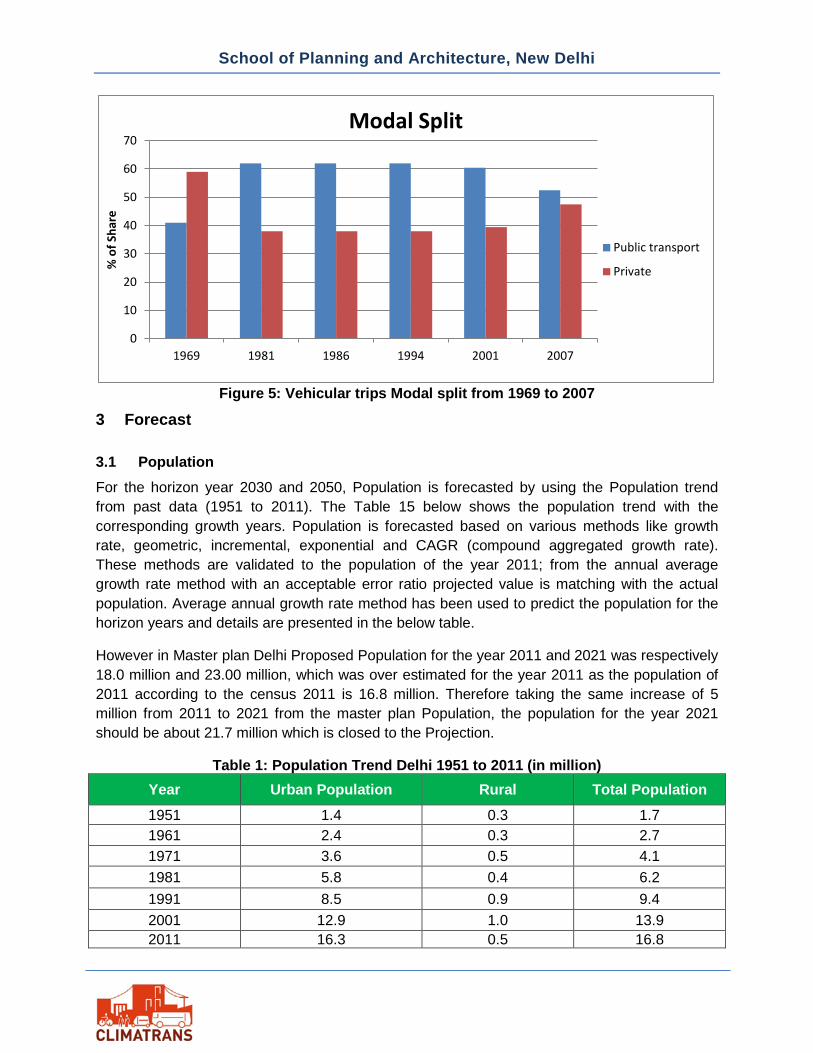
Source: Transport Demand Forecast Study and Development of an Integrated Road cum Multi-Modal Public Transport Network for NCT of Delhi – RITES The modal split in favor of public transport has increased from 41 % in 1969 to 52.5% in 2007 (Table 11)
Table 11: Modal Split trends in Delhi Year 1969 1981 1986 1994 2001 2007
Public transport 41 62 62 62 60.5 52.5 Private 59 38 38 38 39.5 47.5
Source: Wilbur Smith report 2008; RITES 1994; RITES, Planning for Mass Transit System for Delhi 1989; Transport Demand Forecast Study and Development of an Integrated Road cum Multi-Modal Public Transport Network for NCT of Delhi – RITES.
02468
101214161820
1994 2001 2007 2021 (P)
Trip
s (in
Mill
ion)
Motorised trips
Motorised trips
School of Planning and Architecture, New Delhi
Figure 5: Vehicular trips Modal split from 1969 to 2007
3 Forecast
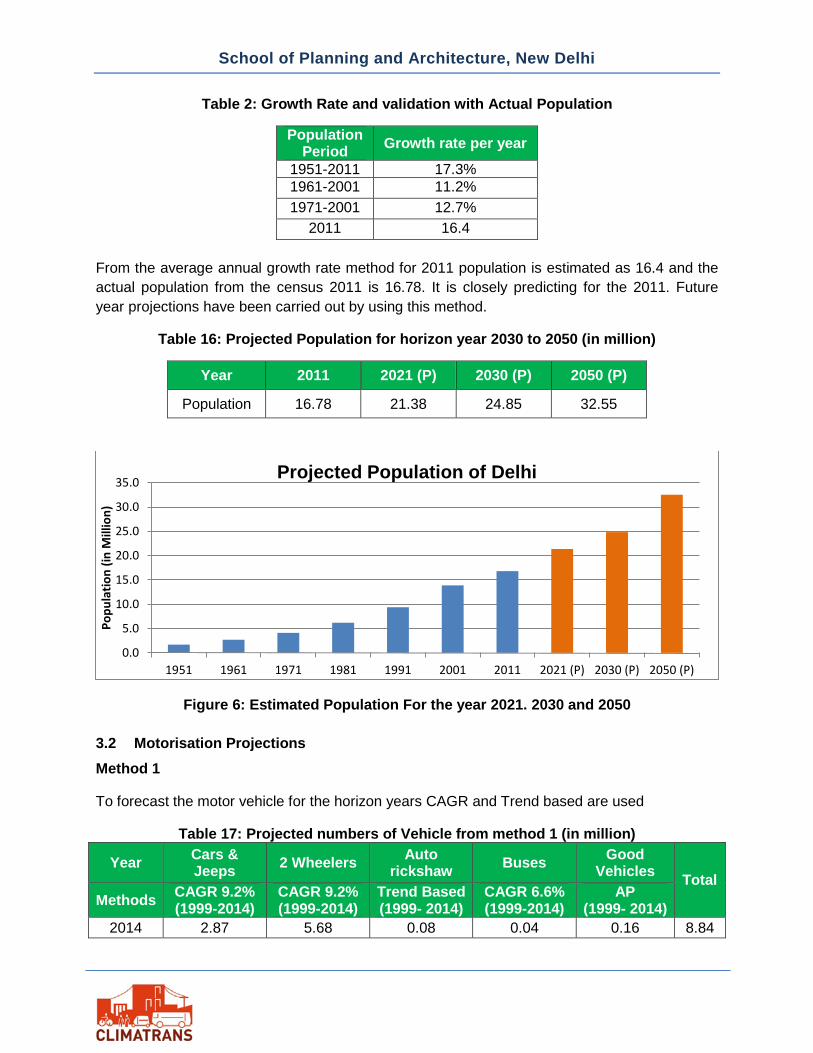
3.1 Population For the horizon year 2030 and 2050, Population is forecasted by using the Population trend from past data (1951 to 2011). The Table 15 below shows the population trend with the corresponding growth years. Population is forecasted based on various methods like growth rate, geometric, incremental, exponential and CAGR (compound aggregated growth rate). These methods are validated to the population of the year 2011; from the annual average growth rate method with an acceptable error ratio projected value is matching with the actual population. Average annual growth rate method has been used to predict the population for the horizon years and details are presented in the below table.
However in Master plan Delhi Proposed Population for the year 2011 and 2021 was respectively 18.0 million and 23.00 million, which was over estimated for the year 2011 as the population of 2011 according to the census 2011 is 16.8 million. Therefore taking the same increase of 5 million from 2011 to 2021 from the master plan Population, the population for the year 2021 should be about 21.7 million which is closed to the Projection.
Table 1: Population Trend Delhi 1951 to 2011 (in million) Year Urban Population Rural Total Population 1951 1.4 0.3 1.7 1961 2.4 0.3 2.7 1971 3.6 0.5 4.1 1981 5.8 0.4 6.2 1991 8.5 0.9 9.4 2001 12.9 1.0 13.9 2011 16.3 0.5 16.8
0
10
20
30
40
50
60
70
1969 1981 1986 1994 2001 2007
% o
f Sha
reModal Split
Public transport
Private
School of Planning and Architecture, New Delhi
Table 2: Growth Rate and validation with Actual Population
Population Period Growth rate per year
1951-2011 17.3% 1961-2001 11.2% 1971-2001 12.7%
2011 16.4 From the average annual growth rate method for 2011 population is estimated as 16.4 and the actual population from the census 2011 is 16.78. It is closely predicting for the 2011. Future year projections have been carried out by using this method.
Table 16: Projected Population for horizon year 2030 to 2050 (in million)
Year 2011 2021 (P) 2030 (P) 2050 (P)
Population 16.78 21.38 24.85 32.55
Figure 6: Estimated Population For the year 2021. 2030 and 2050
3.2 Motorisation Projections Method 1
To forecast the motor vehicle for the horizon years CAGR and Trend based are used
Table 17: Projected numbers of Vehicle from method 1 (in million)
Year Cars & Jeeps 2 Wheelers Auto
rickshaw Buses Good Vehicles Total
Methods CAGR 9.2% (1999-2014)
CAGR 9.2% (1999-2014)
Trend Based (1999- 2014)
CAGR 6.6% (1999-2014)
AP (1999- 2014)
2014 2.87 5.68 0.08 0.04 0.16 8.84
0.0
5.0
10.0
15.0
20.0
25.0
30.0
35.0
1951 1961 1971 1981 1991 2001 2011 2021 (P) 2030 (P) 2050 (P)
Popu
latio
n (in
Mill
ion)
Projected Population of Delhi
School of Planning and Architecture, New Delhi
2021 (P) 4.57 8.37 0.09 0.06 0.22 13.31 2030 (P) 6.75 11.82 0.09 0.09 0.30 19.05 2050 (P) 11.59 19.48 0.10 0.14 0.48 31.80
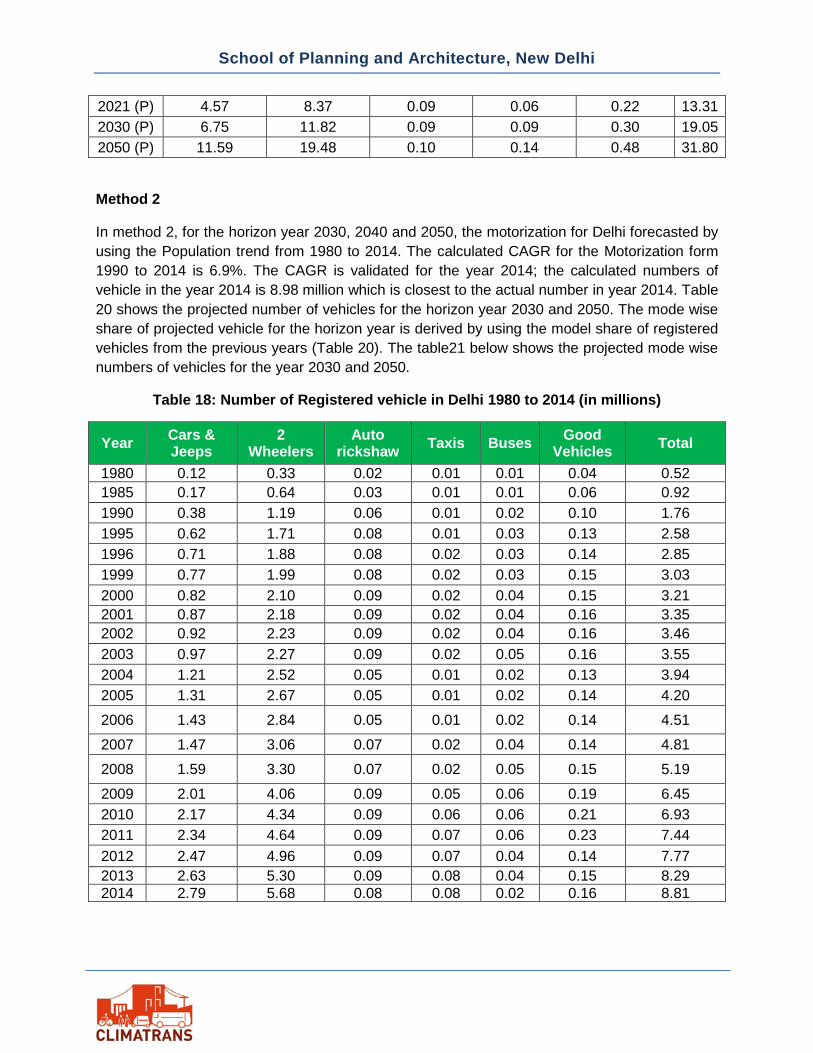
Method 2
In method 2, for the horizon year 2030, 2040 and 2050, the motorization for Delhi forecasted by using the Population trend from 1980 to 2014. The calculated CAGR for the Motorization form 1990 to 2014 is 6.9%. The CAGR is validated for the year 2014; the calculated numbers of vehicle in the year 2014 is 8.98 million which is closest to the actual number in year 2014. Table 20 shows the projected number of vehicles for the horizon year 2030 and 2050. The mode wise share of projected vehicle for the horizon year is derived by using the model share of registered vehicles from the previous years (Table 20). The table21 below shows the projected mode wise numbers of vehicles for the year 2030 and 2050.
Table 18: Number of Registered vehicle in Delhi 1980 to 2014 (in millions)
Year Cars & Jeeps
2 Wheelers
Auto rickshaw Taxis Buses Good
Vehicles Total
1980 0.12 0.33 0.02 0.01 0.01 0.04 0.52 1985 0.17 0.64 0.03 0.01 0.01 0.06 0.92 1990 0.38 1.19 0.06 0.01 0.02 0.10 1.76 1995 0.62 1.71 0.08 0.01 0.03 0.13 2.58 1996 0.71 1.88 0.08 0.02 0.03 0.14 2.85 1999 0.77 1.99 0.08 0.02 0.03 0.15 3.03 2000 0.82 2.10 0.09 0.02 0.04 0.15 3.21 2001 0.87 2.18 0.09 0.02 0.04 0.16 3.35 2002 0.92 2.23 0.09 0.02 0.04 0.16 3.46 2003 0.97 2.27 0.09 0.02 0.05 0.16 3.55 2004 1.21 2.52 0.05 0.01 0.02 0.13 3.94 2005 1.31 2.67 0.05 0.01 0.02 0.14 4.20 2006 1.43 2.84 0.05 0.01 0.02 0.14 4.51 2007 1.47 3.06 0.07 0.02 0.04 0.14 4.81 2008 1.59 3.30 0.07 0.02 0.05 0.15 5.19 2009 2.01 4.06 0.09 0.05 0.06 0.19 6.45 2010 2.17 4.34 0.09 0.06 0.06 0.21 6.93 2011 2.34 4.64 0.09 0.07 0.06 0.23 7.44 2012 2.47 4.96 0.09 0.07 0.04 0.14 7.77 2013 2.63 5.30 0.09 0.08 0.04 0.15 8.29 2014 2.79 5.68 0.08 0.08 0.02 0.16 8.81
School of Planning and Architecture, New Delhi
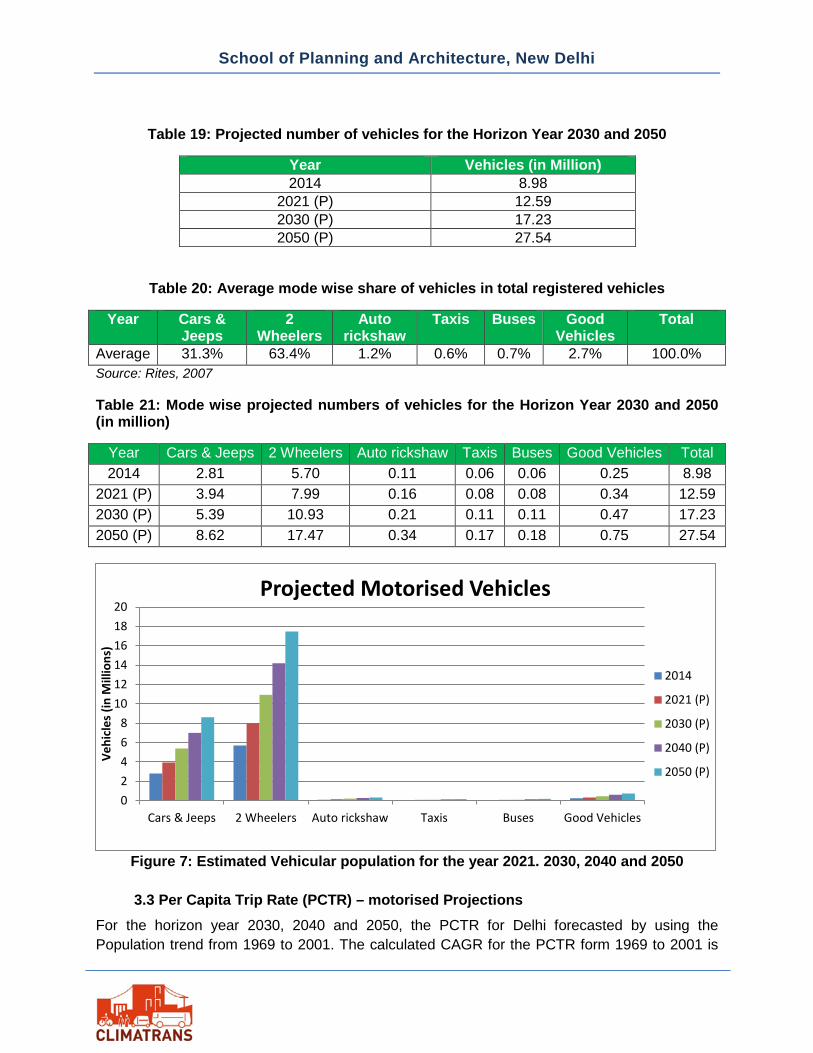
Table 19: Projected number of vehicles for the Horizon Year 2030 and 2050
Year Vehicles (in Million) 2014 8.98
2021 (P) 12.59 2030 (P) 17.23 2050 (P) 27.54
Table 20: Average mode wise share of vehicles in total registered vehicles
Year Cars & Jeeps
2 Wheelers
Auto rickshaw
Taxis Buses Good Vehicles
Total
Average 31.3% 63.4% 1.2% 0.6% 0.7% 2.7% 100.0% Source: Rites, 2007
Table 21: Mode wise projected numbers of vehicles for the Horizon Year 2030 and 2050 (in million)
Year Cars & Jeeps 2 Wheelers Auto rickshaw Taxis Buses Good Vehicles Total 2014 2.81 5.70 0.11 0.06 0.06 0.25 8.98
2021 (P) 3.94 7.99 0.16 0.08 0.08 0.34 12.59 2030 (P) 5.39 10.93 0.21 0.11 0.11 0.47 17.23 2050 (P) 8.62 17.47 0.34 0.17 0.18 0.75 27.54
Figure 7: Estimated Vehicular population for the year 2021. 2030, 2040 and 2050
3.3 Per Capita Trip Rate (PCTR) – motorised Projections For the horizon year 2030, 2040 and 2050, the PCTR for Delhi forecasted by using the Population trend from 1969 to 2001. The calculated CAGR for the PCTR form 1969 to 2001 is
02468
101214161820
Cars & Jeeps 2 Wheelers Auto rickshaw Taxis Buses Good Vehicles
Vehi
cles
(in
Mill
ions
)
Projected Motorised Vehicles
2014
2021 (P)
2030 (P)
2040 (P)
2050 (P)
School of Planning and Architecture, New Delhi
1.8%. The CAGR is validated for the year 2001. Projected PCTR for the horizon year 2030 and 2050 are presented in the below Table 23.
Table 22: Per capita Trip rate in Delhi from 1969 to 2001
Year PCTR 1969 0.49 1981 0.72 2001 0.87
Table 23: Projected Per Capita Trip Rate for the Horizon Year 2030 to 2050
Year PCTR 2001 0.85 2011 1.03 2021 1.14 2030 1.25 2050 1.45
3.4 Daily Motorised Trips Projections By using the projected per capita trip rate and projected population for the year 2030 and 2050 the daily motorized trips are estimated. The projected of daily motorised trips are with the acceptable error ration for the year 2021 with the 26.38 million motorised trips projected for the year 2021 in the DIMTS study 2010.
Table 24: Projected Motorised Trips (in million)
4. Modal Shares and VKT Forecasts
Method 1- Based on travel pattern Trend analysis
In this method the Horizon year Modal split and VKT (Vehicle kilometer travelled) are estimated based upon the past trend based travel analysis. Using the annual average growth rate and CAGR (Compound Aggregated Growth Rate) method modal split is estimated. From the past travel trend analysis it is observed bus share is decline and metro share is increasing. A basic assumptions is taken care in this scenario, overall PT share will increase in the horizon year. Metro ridership is estimated based on the past trend growth rate.
Year PCTR Daily Trips (Motorized) 2021 1.14 26.38 2030 1.25 31.06 2050 1.45 47.20
School of Planning and Architecture, New Delhi
By using the total projected trips for the 2030 and 2050 and the mode wise trip distribution of 2007 with the projected metro trips for the year 2030 and 2050, the proportion of trips by Bus, Two wheeler and car have been derived (Table 25).
Table 25: Year wise Metro Ridership details
Source: DMRC
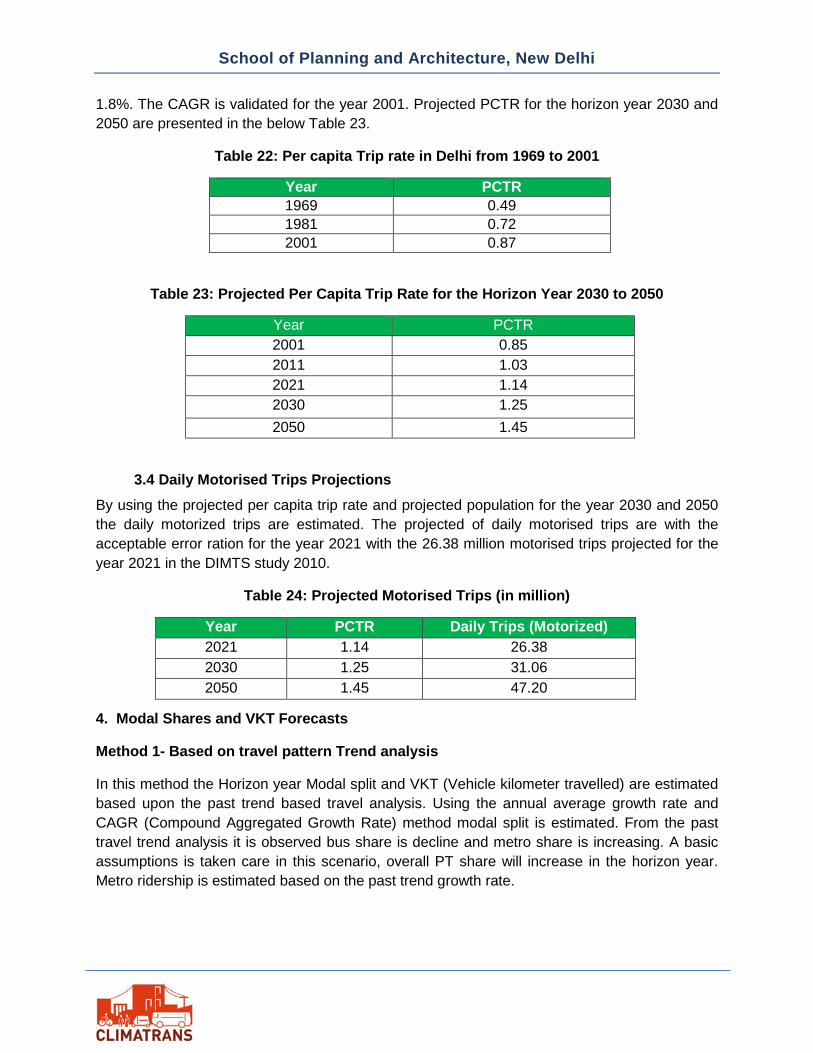
To estimate the horizon year metro ridership CAGR of 2005 to 2010 is used where in these years there was no network expansion has done so this period is consider for the metro ridership expansion. In the below (Table 26) estimated ridership for various year are presented.
Table 26: Estimated Year wise Metro Ridership details Year Ridership (in lakhs) 2021 30.10 2030 43.09 2050 84.40
Figure 8: Projected and existing Metro ridership for the year 2021, 2030 and 2050
0
10
20
30
40
50
60
70
80
90
2002 2004 2005 2010 2011 2021 2030 2050
Ride
rshi
p (in
Lak
hs)
Projected Ridership
Year Ridership (in lakhs) 2011 15.81 2012 18.64 2013 21.29 2014 23.57 2015 23.38
CAGR (2015 -2013) 4.79%
School of Planning and Architecture, New Delhi
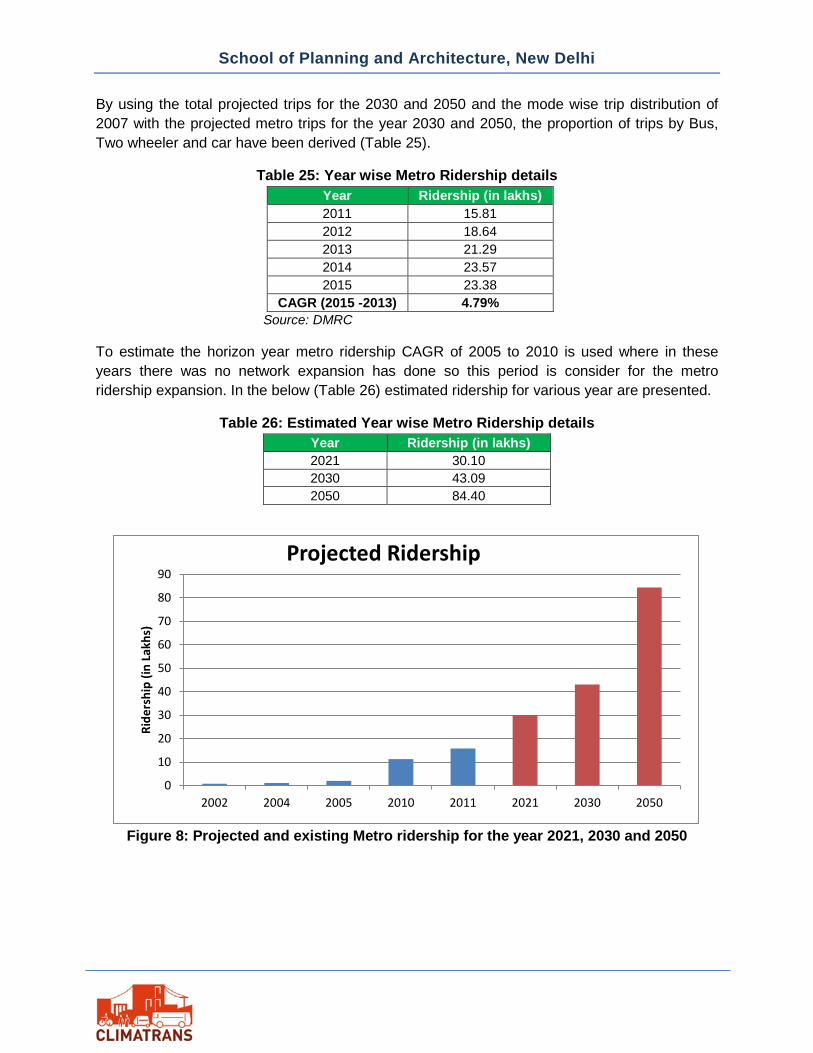
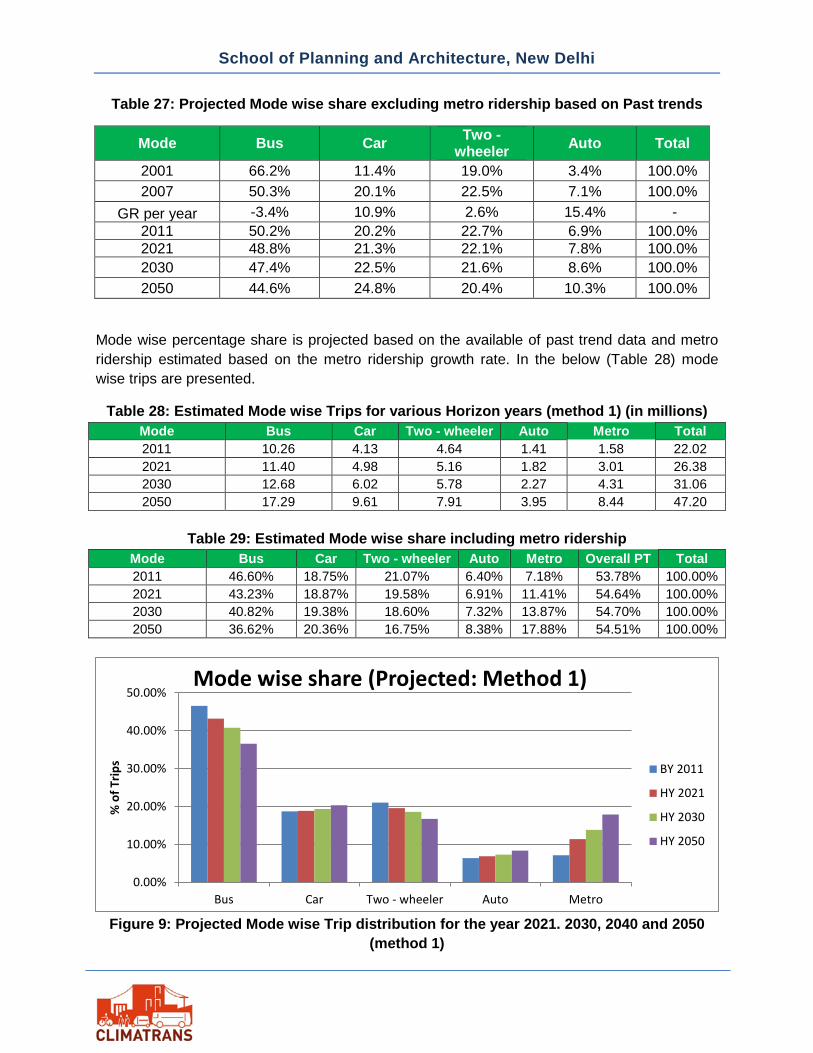
Table 27: Projected Mode wise share excluding metro ridership based on Past trends
Mode Bus Car Two - wheeler Auto Total
2001 66.2% 11.4% 19.0% 3.4% 100.0% 2007 50.3% 20.1% 22.5% 7.1% 100.0%
GR per year -3.4% 10.9% 2.6% 15.4% - 2011 50.2% 20.2% 22.7% 6.9% 100.0% 2021 48.8% 21.3% 22.1% 7.8% 100.0% 2030 47.4% 22.5% 21.6% 8.6% 100.0% 2050 44.6% 24.8% 20.4% 10.3% 100.0%
Mode wise percentage share is projected based on the available of past trend data and metro ridership estimated based on the metro ridership growth rate. In the below (Table 28) mode wise trips are presented.
Table 28: Estimated Mode wise Trips for various Horizon years (method 1) (in millions) Mode Bus Car Two - wheeler Auto Metro Total 2011 10.26 4.13 4.64 1.41 1.58 22.02 2021 11.40 4.98 5.16 1.82 3.01 26.38 2030 12.68 6.02 5.78 2.27 4.31 31.06 2050 17.29 9.61 7.91 3.95 8.44 47.20
Table 29: Estimated Mode wise share including metro ridership
Mode Bus Car Two - wheeler Auto Metro Overall PT Total 2011 46.60% 18.75% 21.07% 6.40% 7.18% 53.78% 100.00% 2021 43.23% 18.87% 19.58% 6.91% 11.41% 54.64% 100.00% 2030 40.82% 19.38% 18.60% 7.32% 13.87% 54.70% 100.00% 2050 36.62% 20.36% 16.75% 8.38% 17.88% 54.51% 100.00%
Figure 9: Projected Mode wise Trip distribution for the year 2021. 2030, 2040 and 2050
(method 1)
0.00%
10.00%
20.00%
30.00%
40.00%
50.00%
Bus Car Two - wheeler Auto Metro
% o
f Trip
s
Mode wise share (Projected: Method 1)
BY 2011
HY 2021
HY 2030
HY 2050
School of Planning and Architecture, New Delhi
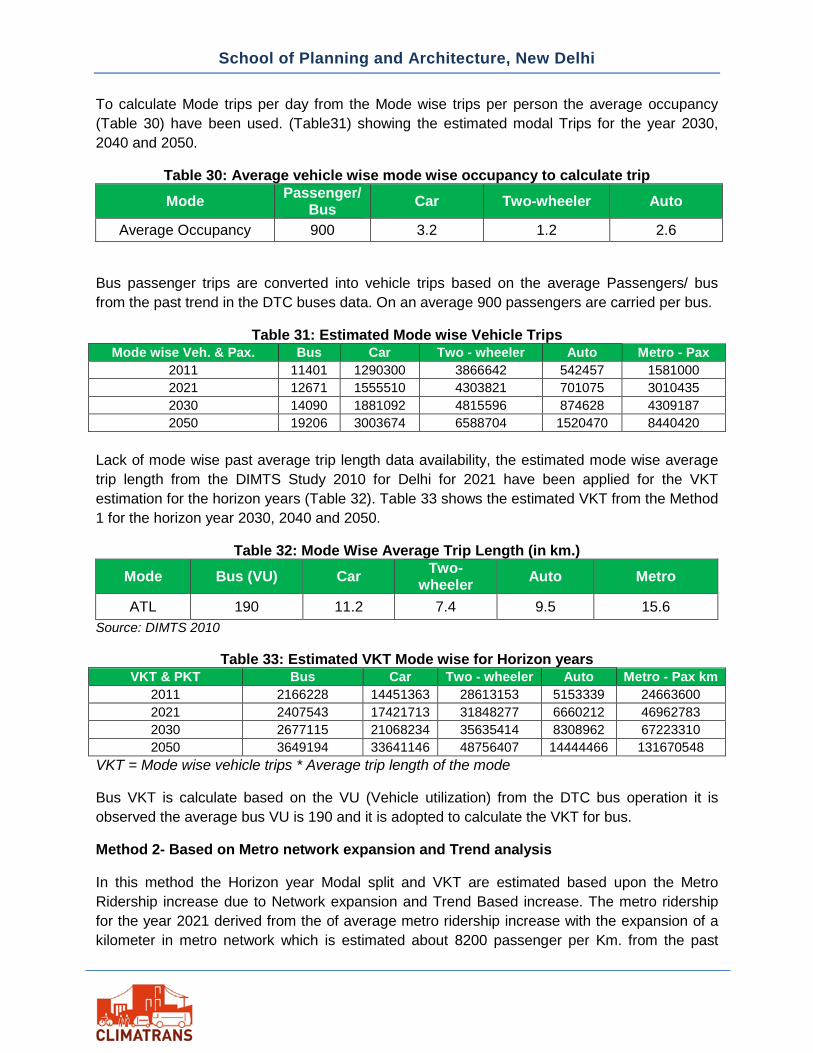
To calculate Mode trips per day from the Mode wise trips per person the average occupancy (Table 30) have been used. (Table31) showing the estimated modal Trips for the year 2030, 2040 and 2050.
Table 30: Average vehicle wise mode wise occupancy to calculate trip Mode Passenger/
Bus Car Two-wheeler Auto
Average Occupancy 900 3.2 1.2 2.6
Bus passenger trips are converted into vehicle trips based on the average Passengers/ bus from the past trend in the DTC buses data. On an average 900 passengers are carried per bus.
Table 31: Estimated Mode wise Vehicle Trips Mode wise Veh. & Pax. Bus Car Two - wheeler Auto Metro - Pax
2011 11401 1290300 3866642 542457 1581000 2021 12671 1555510 4303821 701075 3010435 2030 14090 1881092 4815596 874628 4309187 2050 19206 3003674 6588704 1520470 8440420
Lack of mode wise past average trip length data availability, the estimated mode wise average trip length from the DIMTS Study 2010 for Delhi for 2021 have been applied for the VKT estimation for the horizon years (Table 32). Table 33 shows the estimated VKT from the Method 1 for the horizon year 2030, 2040 and 2050.
Table 32: Mode Wise Average Trip Length (in km.) Mode Bus (VU) Car Two-
wheeler Auto Metro
ATL 190 11.2 7.4 9.5 15.6 Source: DIMTS 2010
Table 33: Estimated VKT Mode wise for Horizon years VKT & PKT Bus Car Two - wheeler Auto Metro - Pax km
2011 2166228 14451363 28613153 5153339 24663600 2021 2407543 17421713 31848277 6660212 46962783 2030 2677115 21068234 35635414 8308962 67223310 2050 3649194 33641146 48756407 14444466 131670548
VKT = Mode wise vehicle trips * Average trip length of the mode
Bus VKT is calculate based on the VU (Vehicle utilization) from the DTC bus operation it is observed the average bus VU is 190 and it is adopted to calculate the VKT for bus.
Method 2- Based on Metro network expansion and Trend analysis
In this method the Horizon year Modal split and VKT are estimated based upon the Metro Ridership increase due to Network expansion and Trend Based increase. The metro ridership for the year 2021 derived from the of average metro ridership increase with the expansion of a kilometer in metro network which is estimated about 8200 passenger per Km. from the past
School of Planning and Architecture, New Delhi
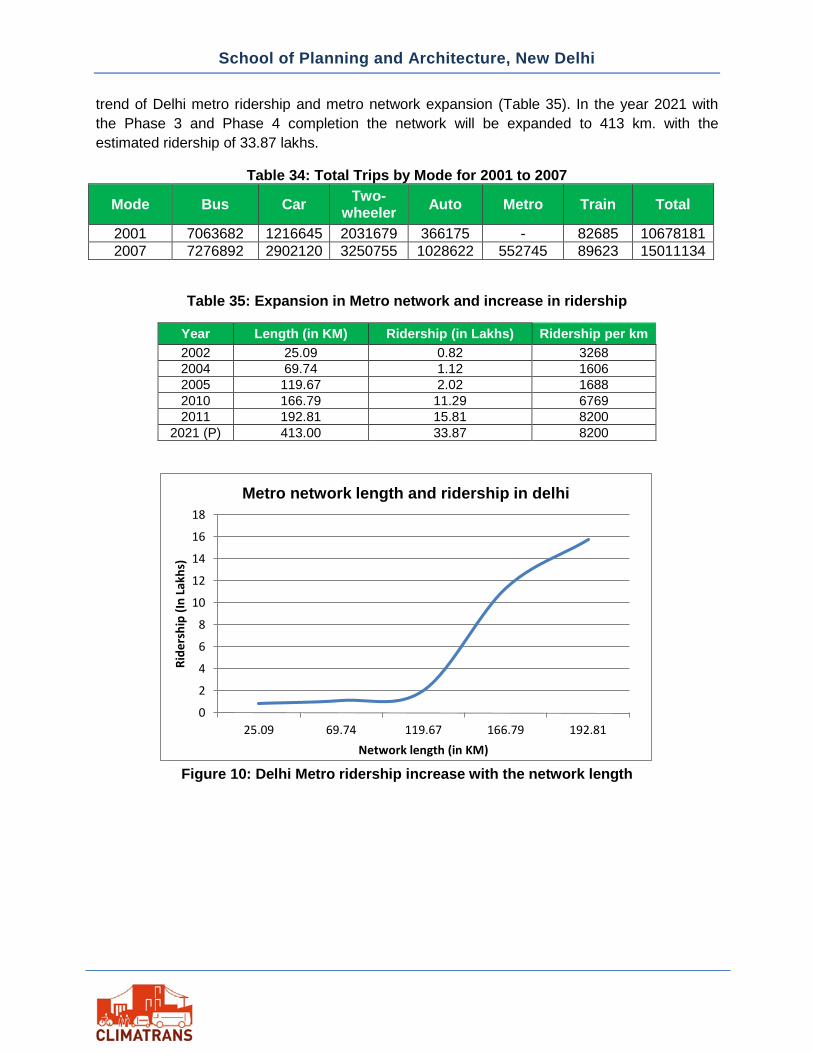
trend of Delhi metro ridership and metro network expansion (Table 35). In the year 2021 with the Phase 3 and Phase 4 completion the network will be expanded to 413 km. with the estimated ridership of 33.87 lakhs.
Table 34: Total Trips by Mode for 2001 to 2007
Mode Bus Car Two-wheeler Auto Metro Train Total
2001 7063682 1216645 2031679 366175 - 82685 10678181 2007 7276892 2902120 3250755 1028622 552745 89623 15011134
Table 35: Expansion in Metro network and increase in ridership
Year Length (in KM) Ridership (in Lakhs) Ridership per km 2002 25.09 0.82 3268 2004 69.74 1.12 1606 2005 119.67 2.02 1688 2010 166.79 11.29 6769 2011 192.81 15.81 8200
2021 (P) 413.00 33.87 8200
Figure 10: Delhi Metro ridership increase with the network length
0
2
4
6
8
10
12
14
16
18
25.09 69.74 119.67 166.79 192.81
Ride
rshi
p (In
Lak
hs)
Network length (in KM)
Metro network length and ridership in delhi
School of Planning and Architecture, New Delhi
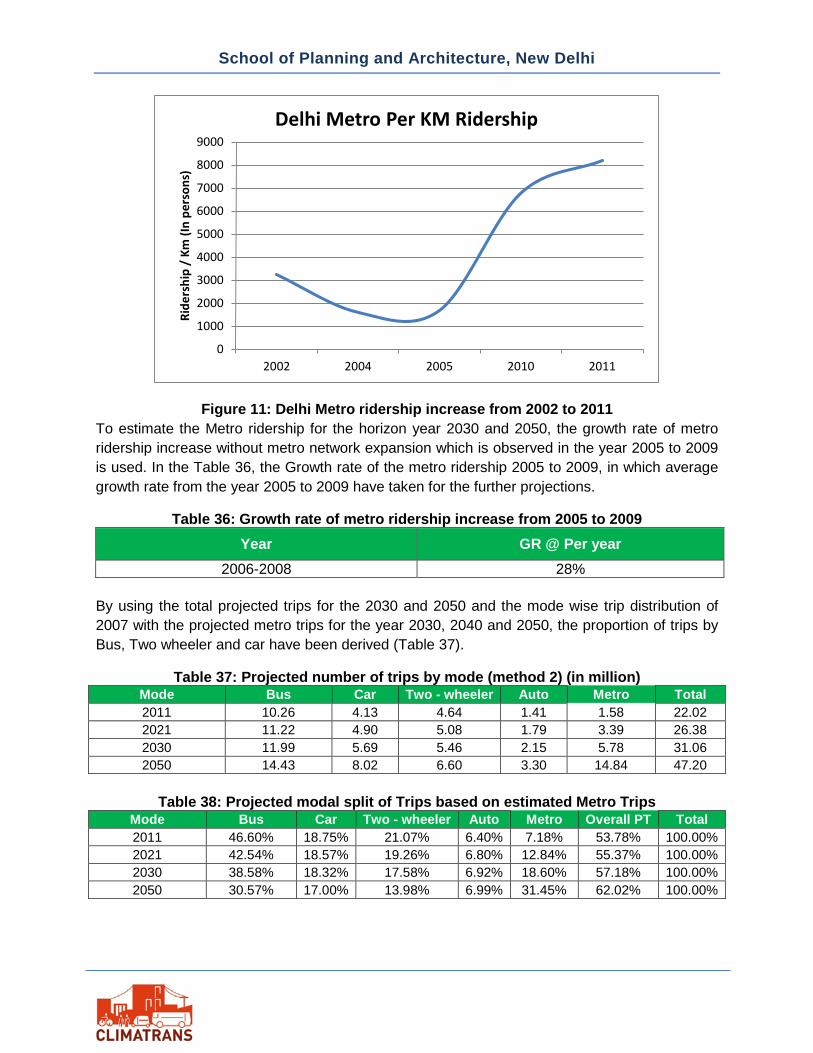
Figure 11: Delhi Metro ridership increase from 2002 to 2011 To estimate the Metro ridership for the horizon year 2030 and 2050, the growth rate of metro ridership increase without metro network expansion which is observed in the year 2005 to 2009 is used. In the Table 36, the Growth rate of the metro ridership 2005 to 2009, in which average growth rate from the year 2005 to 2009 have taken for the further projections.
Table 36: Growth rate of metro ridership increase from 2005 to 2009 Year GR @ Per year
2006-2008 28% By using the total projected trips for the 2030 and 2050 and the mode wise trip distribution of 2007 with the projected metro trips for the year 2030, 2040 and 2050, the proportion of trips by Bus, Two wheeler and car have been derived (Table 37).
Table 37: Projected number of trips by mode (method 2) (in million) Mode Bus Car Two - wheeler Auto Metro Total 2011 10.26 4.13 4.64 1.41 1.58 22.02 2021 11.22 4.90 5.08 1.79 3.39 26.38 2030 11.99 5.69 5.46 2.15 5.78 31.06 2050 14.43 8.02 6.60 3.30 14.84 47.20
Table 38: Projected modal split of Trips based on estimated Metro Trips
Mode Bus Car Two - wheeler Auto Metro Overall PT Total 2011 46.60% 18.75% 21.07% 6.40% 7.18% 53.78% 100.00% 2021 42.54% 18.57% 19.26% 6.80% 12.84% 55.37% 100.00% 2030 38.58% 18.32% 17.58% 6.92% 18.60% 57.18% 100.00% 2050 30.57% 17.00% 13.98% 6.99% 31.45% 62.02% 100.00%
0
1000
2000
3000
4000
5000
6000
7000
8000
9000
2002 2004 2005 2010 2011
Ride
rshi
p /
Km (I
n pe
rson
s)
Delhi Metro Per KM Ridership
School of Planning and Architecture, New Delhi
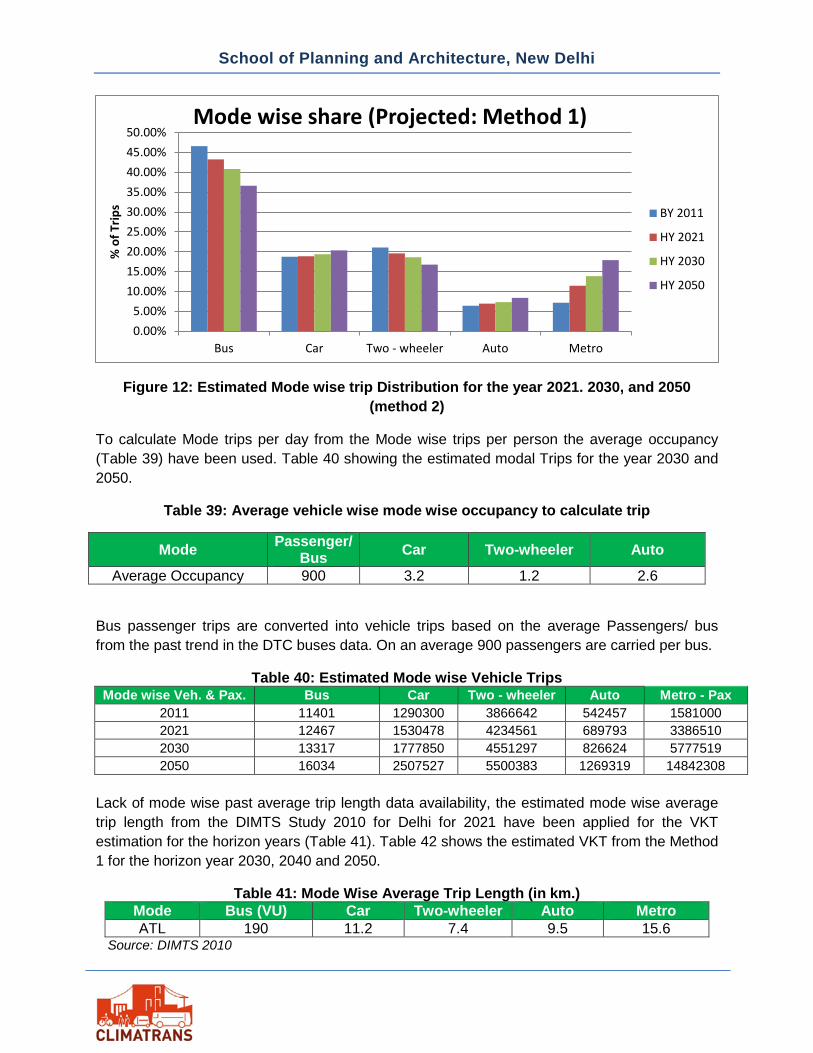
Figure 12: Estimated Mode wise trip Distribution for the year 2021. 2030, and 2050 (method 2)
To calculate Mode trips per day from the Mode wise trips per person the average occupancy (Table 39) have been used. Table 40 showing the estimated modal Trips for the year 2030 and 2050.
Table 39: Average vehicle wise mode wise occupancy to calculate trip
Mode Passenger/ Bus Car Two-wheeler Auto
Average Occupancy 900 3.2 1.2 2.6
Bus passenger trips are converted into vehicle trips based on the average Passengers/ bus from the past trend in the DTC buses data. On an average 900 passengers are carried per bus.
Table 40: Estimated Mode wise Vehicle Trips Mode wise Veh. & Pax. Bus Car Two - wheeler Auto Metro - Pax
2011 11401 1290300 3866642 542457 1581000 2021 12467 1530478 4234561 689793 3386510 2030 13317 1777850 4551297 826624 5777519 2050 16034 2507527 5500383 1269319 14842308
Lack of mode wise past average trip length data availability, the estimated mode wise average trip length from the DIMTS Study 2010 for Delhi for 2021 have been applied for the VKT estimation for the horizon years (Table 41). Table 42 shows the estimated VKT from the Method 1 for the horizon year 2030, 2040 and 2050.
Table 41: Mode Wise Average Trip Length (in km.) Mode Bus (VU) Car Two-wheeler Auto Metro ATL 190 11.2 7.4 9.5 15.6
Source: DIMTS 2010
0.00%5.00%
10.00%15.00%20.00%25.00%30.00%35.00%40.00%45.00%50.00%
Bus Car Two - wheeler Auto Metro
% o
f Trip
sMode wise share (Projected: Method 1)
BY 2011
HY 2021
HY 2030
HY 2050
School of Planning and Architecture, New Delhi
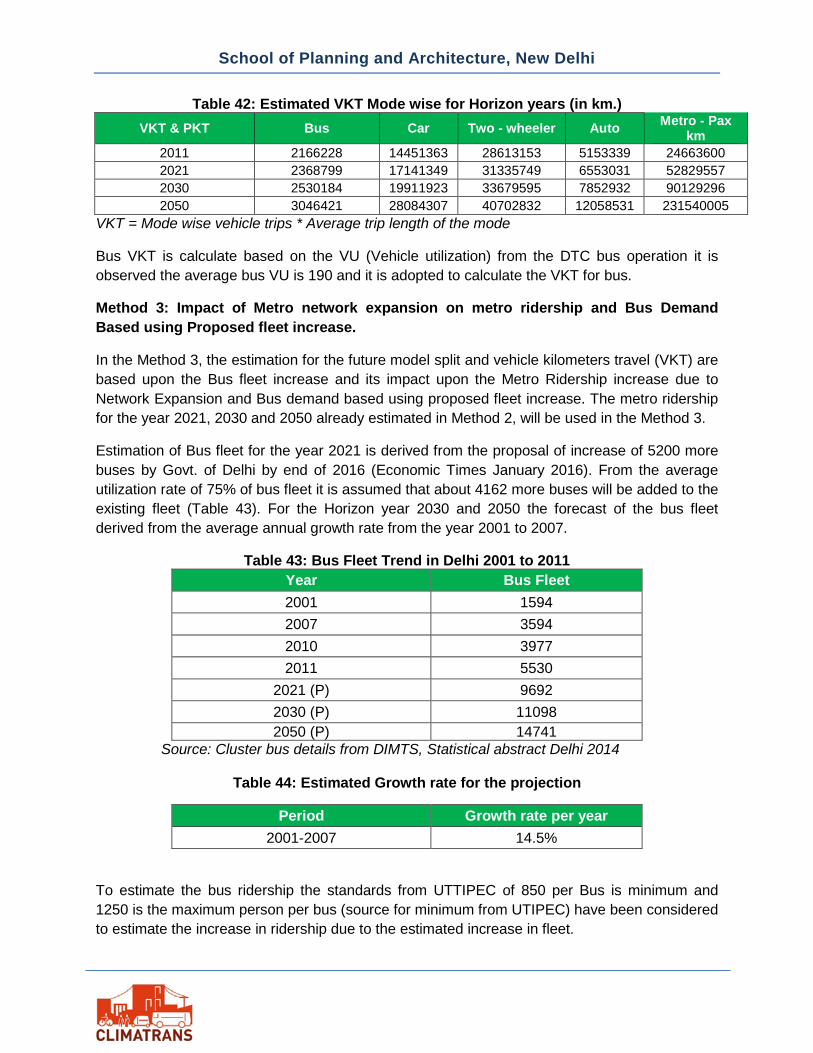
Table 42: Estimated VKT Mode wise for Horizon years (in km.) VKT & PKT Bus Car Two - wheeler Auto Metro - Pax
km 2011 2166228 14451363 28613153 5153339 24663600 2021 2368799 17141349 31335749 6553031 52829557 2030 2530184 19911923 33679595 7852932 90129296 2050 3046421 28084307 40702832 12058531 231540005
VKT = Mode wise vehicle trips * Average trip length of the mode
Bus VKT is calculate based on the VU (Vehicle utilization) from the DTC bus operation it is observed the average bus VU is 190 and it is adopted to calculate the VKT for bus.
Method 3: Impact of Metro network expansion on metro ridership and Bus Demand Based using Proposed fleet increase.
In the Method 3, the estimation for the future model split and vehicle kilometers travel (VKT) are based upon the Bus fleet increase and its impact upon the Metro Ridership increase due to Network Expansion and Bus demand based using proposed fleet increase. The metro ridership for the year 2021, 2030 and 2050 already estimated in Method 2, will be used in the Method 3.
Estimation of Bus fleet for the year 2021 is derived from the proposal of increase of 5200 more buses by Govt. of Delhi by end of 2016 (Economic Times January 2016). From the average utilization rate of 75% of bus fleet it is assumed that about 4162 more buses will be added to the existing fleet (Table 43). For the Horizon year 2030 and 2050 the forecast of the bus fleet derived from the average annual growth rate from the year 2001 to 2007.
Table 43: Bus Fleet Trend in Delhi 2001 to 2011 Year Bus Fleet 2001 1594 2007 3594 2010 3977 2011 5530
2021 (P) 9692 2030 (P) 11098 2050 (P) 14741
Source: Cluster bus details from DIMTS, Statistical abstract Delhi 2014
Table 44: Estimated Growth rate for the projection
Period Growth rate per year 2001-2007 14.5%
To estimate the bus ridership the standards from UTTIPEC of 850 per Bus is minimum and 1250 is the maximum person per bus (source for minimum from UTIPEC) have been considered to estimate the increase in ridership due to the estimated increase in fleet.
School of Planning and Architecture, New Delhi
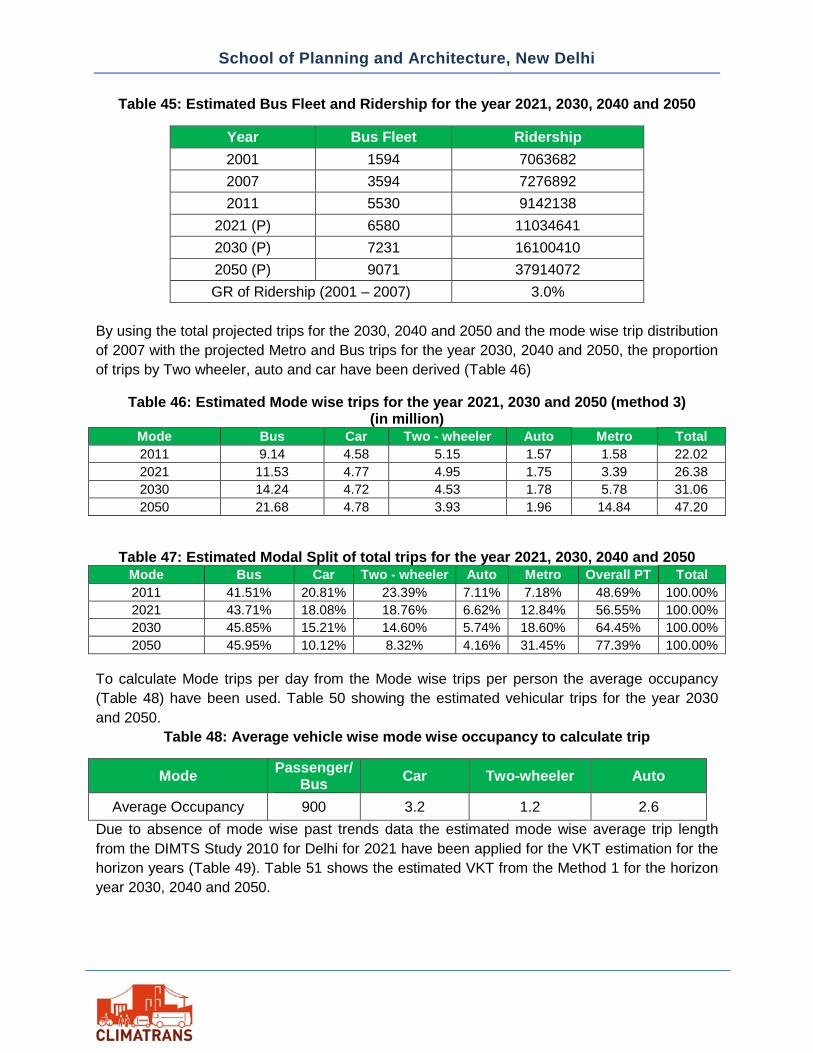
Table 45: Estimated Bus Fleet and Ridership for the year 2021, 2030, 2040 and 2050
Year Bus Fleet Ridership 2001 1594 7063682 2007 3594 7276892 2011 5530 9142138
2021 (P) 6580 11034641 2030 (P) 7231 16100410 2050 (P) 9071 37914072 GR of Ridership (2001 – 2007) 3.0%
By using the total projected trips for the 2030, 2040 and 2050 and the mode wise trip distribution of 2007 with the projected Metro and Bus trips for the year 2030, 2040 and 2050, the proportion of trips by Two wheeler, auto and car have been derived (Table 46)
Table 46: Estimated Mode wise trips for the year 2021, 2030 and 2050 (method 3) (in million)
Mode Bus Car Two - wheeler Auto Metro Total 2011 9.14 4.58 5.15 1.57 1.58 22.02 2021 11.53 4.77 4.95 1.75 3.39 26.38 2030 14.24 4.72 4.53 1.78 5.78 31.06 2050 21.68 4.78 3.93 1.96 14.84 47.20
Table 47: Estimated Modal Split of total trips for the year 2021, 2030, 2040 and 2050 Mode Bus Car Two - wheeler Auto Metro Overall PT Total 2011 41.51% 20.81% 23.39% 7.11% 7.18% 48.69% 100.00% 2021 43.71% 18.08% 18.76% 6.62% 12.84% 56.55% 100.00% 2030 45.85% 15.21% 14.60% 5.74% 18.60% 64.45% 100.00% 2050 45.95% 10.12% 8.32% 4.16% 31.45% 77.39% 100.00%
To calculate Mode trips per day from the Mode wise trips per person the average occupancy (Table 48) have been used. Table 50 showing the estimated vehicular trips for the year 2030 and 2050.
Table 48: Average vehicle wise mode wise occupancy to calculate trip
Mode Passenger/ Bus Car Two-wheeler Auto
Average Occupancy 900 3.2 1.2 2.6 Due to absence of mode wise past trends data the estimated mode wise average trip length from the DIMTS Study 2010 for Delhi for 2021 have been applied for the VKT estimation for the horizon years (Table 49). Table 51 shows the estimated VKT from the Method 1 for the horizon year 2030, 2040 and 2050.
School of Planning and Architecture, New Delhi
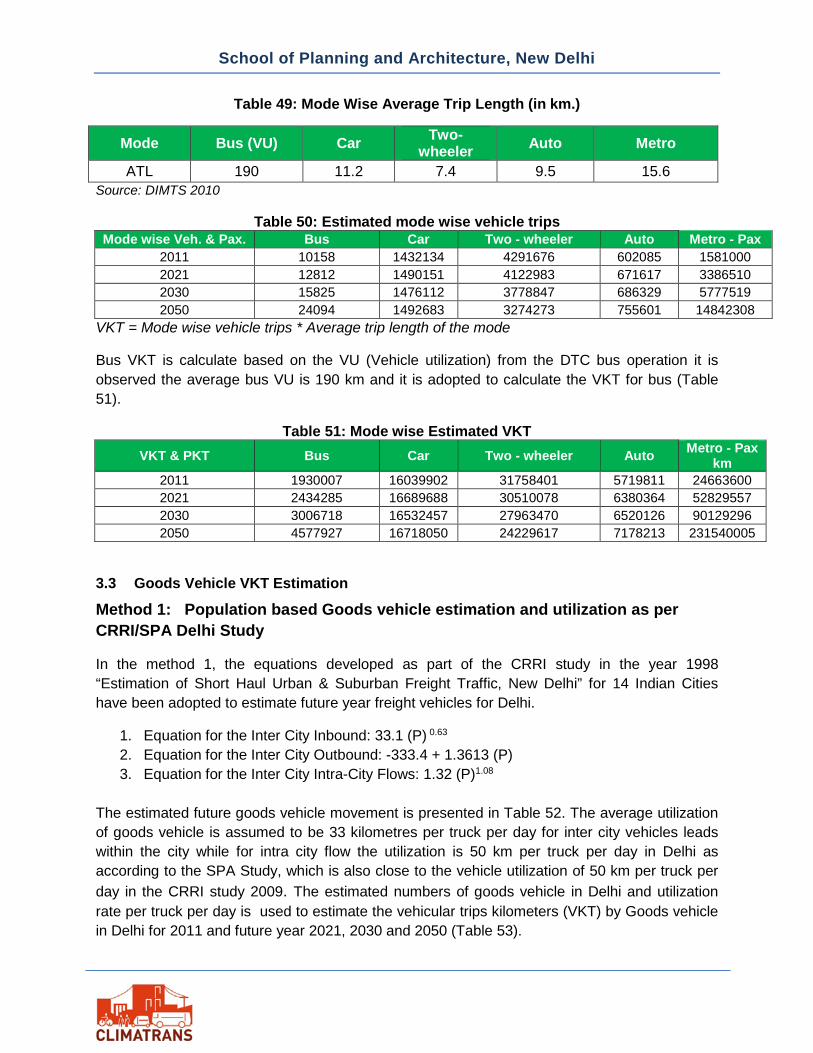
Table 49: Mode Wise Average Trip Length (in km.)
Mode Bus (VU) Car Two-wheeler Auto Metro
ATL 190 11.2 7.4 9.5 15.6 Source: DIMTS 2010
Table 50: Estimated mode wise vehicle trips Mode wise Veh. & Pax. Bus Car Two - wheeler Auto Metro - Pax
2011 10158 1432134 4291676 602085 1581000 2021 12812 1490151 4122983 671617 3386510 2030 15825 1476112 3778847 686329 5777519 2050 24094 1492683 3274273 755601 14842308
VKT = Mode wise vehicle trips * Average trip length of the mode
Bus VKT is calculate based on the VU (Vehicle utilization) from the DTC bus operation it is observed the average bus VU is 190 km and it is adopted to calculate the VKT for bus (Table 51).
Table 51: Mode wise Estimated VKT VKT & PKT Bus Car Two - wheeler Auto Metro - Pax
km 2011 1930007 16039902 31758401 5719811 24663600 2021 2434285 16689688 30510078 6380364 52829557 2030 3006718 16532457 27963470 6520126 90129296 2050 4577927 16718050 24229617 7178213 231540005
3.3 Goods Vehicle VKT Estimation
Method 1: Population based Goods vehicle estimation and utilization as per CRRI/SPA Delhi Study
In the method 1, the equations developed as part of the CRRI study in the year 1998 “Estimation of Short Haul Urban & Suburban Freight Traffic, New Delhi” for 14 Indian Cities have been adopted to estimate future year freight vehicles for Delhi.
1. Equation for the Inter City Inbound: 33.1 (P) 0.63 2. Equation for the Inter City Outbound: -333.4 + 1.3613 (P) 3. Equation for the Inter City Intra-City Flows: 1.32 (P)1.08
The estimated future goods vehicle movement is presented in Table 52. The average utilization of goods vehicle is assumed to be 33 kilometres per truck per day for inter city vehicles leads within the city while for intra city flow the utilization is 50 km per truck per day in Delhi as according to the SPA Study, which is also close to the vehicle utilization of 50 km per truck per day in the CRRI study 2009. The estimated numbers of goods vehicle in Delhi and utilization rate per truck per day is used to estimate the vehicular trips kilometers (VKT) by Goods vehicle in Delhi for 2011 and future year 2021, 2030 and 2050 (Table 53).
School of Planning and Architecture, New Delhi
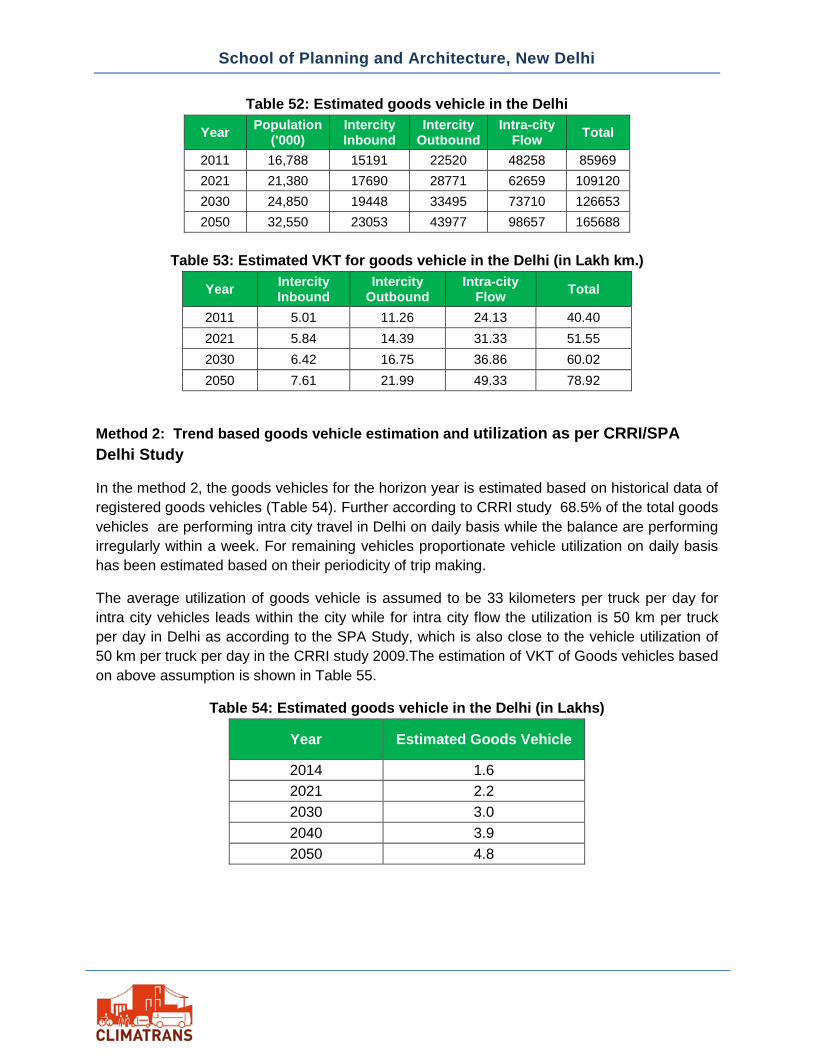
Table 52: Estimated goods vehicle in the Delhi
Year Population ('000)
Intercity Inbound
Intercity Outbound
Intra-city Flow Total
2011 16,788 15191 22520 48258 85969 2021 21,380 17690 28771 62659 109120 2030 24,850 19448 33495 73710 126653 2050 32,550 23053 43977 98657 165688
Table 53: Estimated VKT for goods vehicle in the Delhi (in Lakh km.)
Year Intercity Inbound
Intercity Outbound
Intra-city Flow Total
2011 5.01 11.26 24.13 40.40 2021 5.84 14.39 31.33 51.55 2030 6.42 16.75 36.86 60.02 2050 7.61 21.99 49.33 78.92
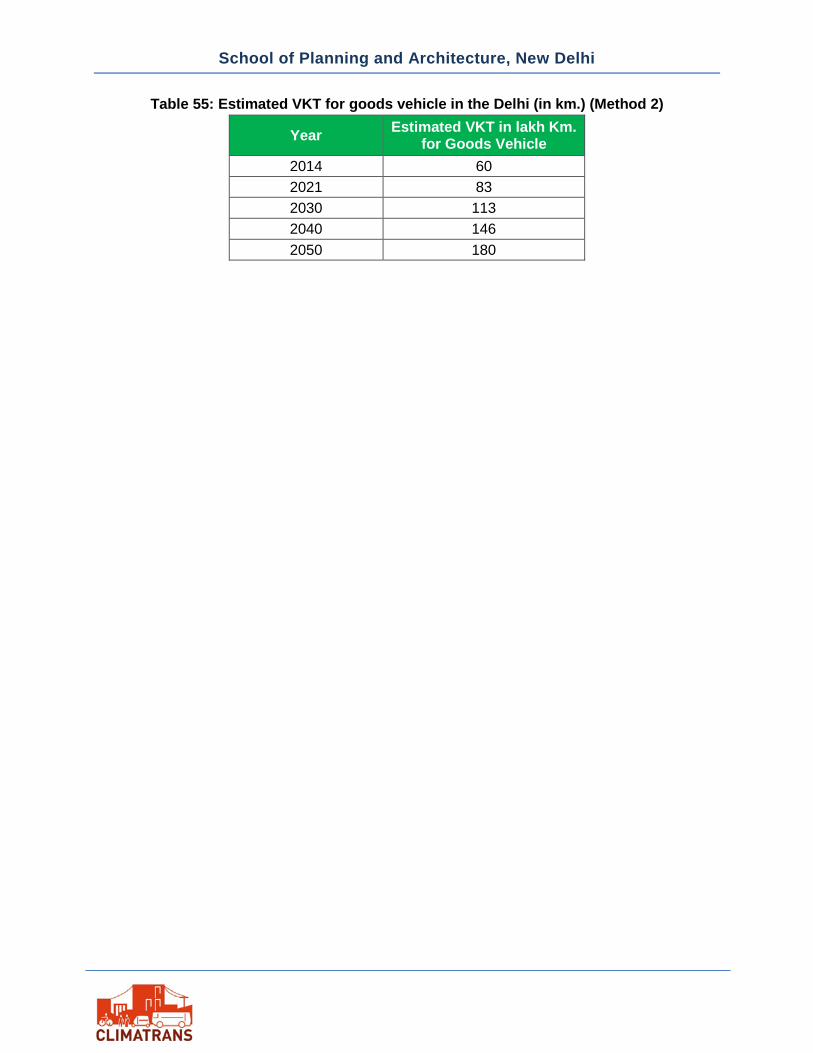
Method 2: Trend based goods vehicle estimation and utilization as per CRRI/SPA Delhi Study
In the method 2, the goods vehicles for the horizon year is estimated based on historical data of registered goods vehicles (Table 54). Further according to CRRI study 68.5% of the total goods vehicles are performing intra city travel in Delhi on daily basis while the balance are performing irregularly within a week. For remaining vehicles proportionate vehicle utilization on daily basis has been estimated based on their periodicity of trip making.
The average utilization of goods vehicle is assumed to be 33 kilometers per truck per day for intra city vehicles leads within the city while for intra city flow the utilization is 50 km per truck per day in Delhi as according to the SPA Study, which is also close to the vehicle utilization of 50 km per truck per day in the CRRI study 2009.The estimation of VKT of Goods vehicles based on above assumption is shown in Table 55.
Table 54: Estimated goods vehicle in the Delhi (in Lakhs)
Year Estimated Goods Vehicle
2014 1.6 2021 2.2 2030 3.0 2040 3.9 2050 4.8
School of Planning and Architecture, New Delhi
Table 55: Estimated VKT for goods vehicle in the Delhi (in km.) (Method 2)
Year Estimated VKT in lakh Km. for Goods Vehicle
2014 60 2021 83 2030 113 2040 146 2050 180
School of Planning and Architecture, New Delhi
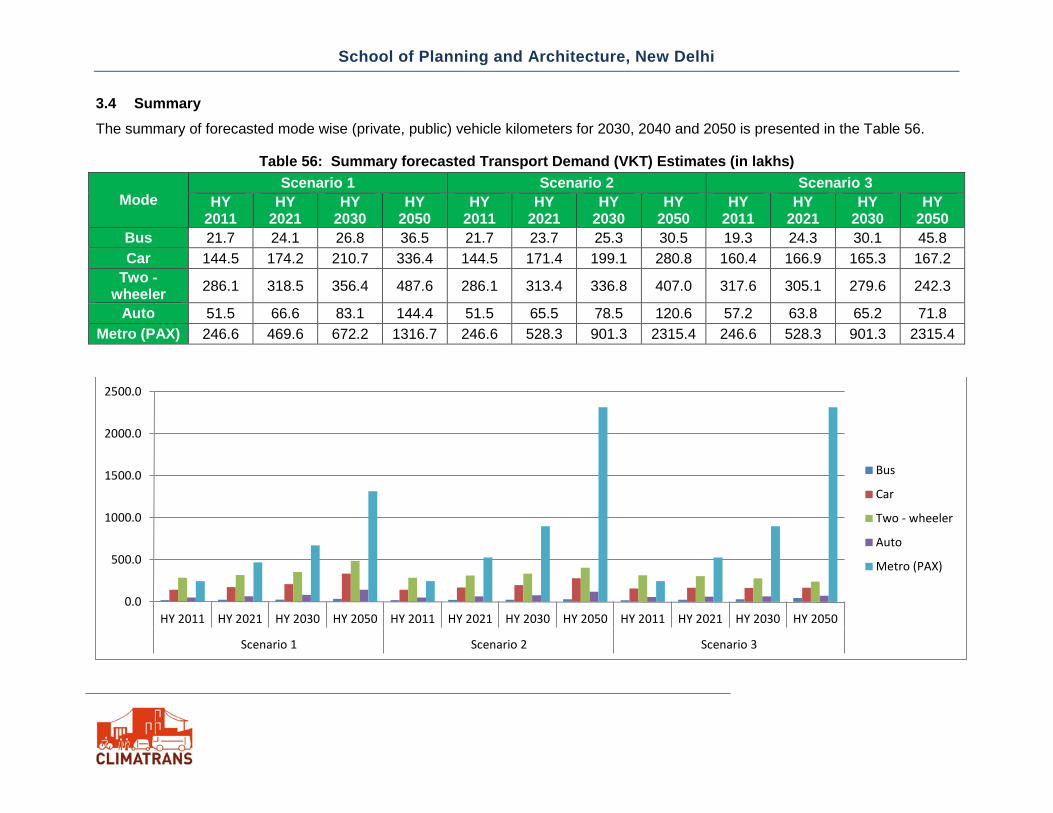
3.4 Summary The summary of forecasted mode wise (private, public) vehicle kilometers for 2030, 2040 and 2050 is presented in the Table 56.
Table 56: Summary forecasted Transport Demand (VKT) Estimates (in lakhs)
Mode Scenario 1 Scenario 2 Scenario 3
HY 2011
HY 2021
HY 2030
HY 2050
HY 2011
HY 2021
HY 2030
HY 2050
HY 2011
HY 2021
HY 2030
HY 2050
Bus 21.7 24.1 26.8 36.5 21.7 23.7 25.3 30.5 19.3 24.3 30.1 45.8 Car 144.5 174.2 210.7 336.4 144.5 171.4 199.1 280.8 160.4 166.9 165.3 167.2
Two - wheeler 286.1 318.5 356.4 487.6 286.1 313.4 336.8 407.0 317.6 305.1 279.6 242.3
Auto 51.5 66.6 83.1 144.4 51.5 65.5 78.5 120.6 57.2 63.8 65.2 71.8 Metro (PAX) 246.6 469.6 672.2 1316.7 246.6 528.3 901.3 2315.4 246.6 528.3 901.3 2315.4
0.0
500.0
1000.0
1500.0
2000.0
2500.0
HY 2011 HY 2021 HY 2030 HY 2050 HY 2011 HY 2021 HY 2030 HY 2050 HY 2011 HY 2021 HY 2030 HY 2050
Scenario 1 Scenario 2 Scenario 3
Bus
Car
Two - wheeler
Auto
Metro (PAX)
School of Planning and Architecture, New Delhi
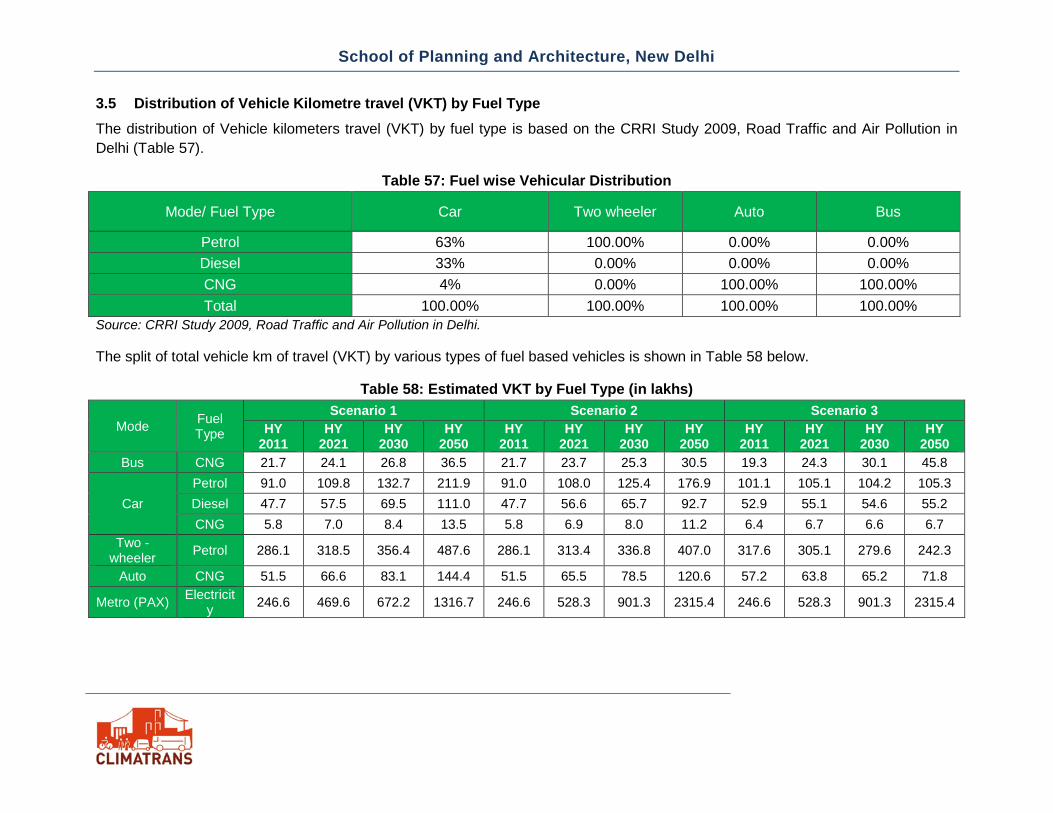
3.5 Distribution of Vehicle Kilometre travel (VKT) by Fuel Type The distribution of Vehicle kilometers travel (VKT) by fuel type is based on the CRRI Study 2009, Road Traffic and Air Pollution in Delhi (Table 57).
Table 57: Fuel wise Vehicular Distribution
Mode/ Fuel Type Car Two wheeler Auto Bus
Petrol 63% 100.00% 0.00% 0.00% Diesel 33% 0.00% 0.00% 0.00% CNG 4% 0.00% 100.00% 100.00% Total 100.00% 100.00% 100.00% 100.00%
Source: CRRI Study 2009, Road Traffic and Air Pollution in Delhi.
The split of total vehicle km of travel (VKT) by various types of fuel based vehicles is shown in Table 58 below.
Table 58: Estimated VKT by Fuel Type (in lakhs)
Mode Fuel Type
Scenario 1 Scenario 2 Scenario 3 HY
2011 HY
2021 HY
2030 HY
2050 HY
2011 HY
2021 HY
2030 HY
2050 HY
2011 HY
2021 HY
2030 HY
2050 Bus CNG 21.7 24.1 26.8 36.5 21.7 23.7 25.3 30.5 19.3 24.3 30.1 45.8
Car Petrol 91.0 109.8 132.7 211.9 91.0 108.0 125.4 176.9 101.1 105.1 104.2 105.3 Diesel 47.7 57.5 69.5 111.0 47.7 56.6 65.7 92.7 52.9 55.1 54.6 55.2 CNG 5.8 7.0 8.4 13.5 5.8 6.9 8.0 11.2 6.4 6.7 6.6 6.7
Two - wheeler Petrol 286.1 318.5 356.4 487.6 286.1 313.4 336.8 407.0 317.6 305.1 279.6 242.3
Auto CNG 51.5 66.6 83.1 144.4 51.5 65.5 78.5 120.6 57.2 63.8 65.2 71.8
Metro (PAX) Electricity 246.6 469.6 672.2 1316.7 246.6 528.3 901.3 2315.4 246.6 528.3 901.3 2315.4
Related Documents