NEXUS Agribusiness Solutions RAPID APPRAISAL OF POST HARVEST FACILITIES IN THE PHILIPPINES Final Report Nerlita M. Manalili Kevin F. Yaptenco Alessandro A. Manilay 25 th November 2015

Welcome message from author
This document is posted to help you gain knowledge. Please leave a comment to let me know what you think about it! Share it to your friends and learn new things together.
Transcript

NEXUS Agribusiness Solutions
RAPID APPRAISAL OF POST HARVEST FACILITIES IN THE PHILIPPINES
Final Report
Nerlita M. ManaliliKevin F. YaptencoAlessandro A. Manilay25th November 2015

Study LeaderValue Chain
Specialist
DR. NERLITA M. MANALILI
Asst. Study LeaderAgri Engineer
DR. KEVIN F. YAPTENCO
Economist PROF. ALESSANDRO A. MANILAY
Statistician PROF. NELITA M. LALICANResearch Support Engr CARISSA JOY E. OZOA
MS. IMELDA V. VALENTONMS. MARA MICHELLE Q.
PANGILINANMS. MONINA ANN P. SAGUIN
STUDY TEAM
NEXUS Agribusiness SolutionsSOURCE: Rolle and Mazaud 2003; Bautista and Esguerra 2012; PHILMECH 2012; http://www.gov.ph/2013/06/05/republic‐act‐no‐10601/
1977Launching of FAO Action
Program for the Prevention of Food Losses
and
Establishment of the ASEAN PHTRC in UP Los Baños
1975UN General Assembly resolution to reduce losses by 50% by 1985
1973UP‐Cornell Univ
program introduces postharvest research and education in UPLB
1968FAO “war on
waste” campaign
1967FAO holds
symposium on crop losses
1978NAPHIRE created
through Presidential Decree 1380
2003FAO Global
Initiative for Post‐Harvest
Development
1981NAPHIRE expands
beyond postharvest of rice and corn
2011DA (Regional Offices + PHILMECH) implement Rice Mech Program1997
Agriculture & Fishery Modernization Act signed into law,
recognizes importance of postharvest
2013RA 10601 (AFMECH
Law) is passed

Postharvest Losses in the Philippines: RICE PADDY
Operation Average
Harvesting 2.03
Piling 0.08
Threshing 2.18
Drying 5.86
Storage 0.80
Milling 5.52
TOTAL 16.47

Postharvest Losses in the Philippines: FRUITS AND VEGETABLES
Crop System loss (%)
Banana (‘Lakatan’) 15
Calamansi 13
Cabbage 19‐29
Mango 28Source: DA‐BPRE/UPLB‐PSSD (2009)

Establishment of Postharvest Facilities in the PhilippinesPROGRAMS OF THE DEPARTMENT OF AGRICULTURE
What are the impacts of these
projects?

General• Evaluate effectiveness of postharvest facilities and assets
Specific• Survey existing literature / secondary data to characterize PHF project selection, expenditures, assets and impacts
• Assess a representative set of PHF projects• Identify strengths and weaknesses in the project cycle of PHF projects
Project Objectives

• Literature review, initial data gathering
• Prioritization of PHF projects for evaluation
• Initial field assessments
• In‐depth field assessments
According to:• Size of investment• Potential impact• Relevance to government programs / thrusts• Duration of implementation• Representative distribution• Proximity to other PHF projects
Methodology

Project HighlightsPHF projects for evaluation
Island (Province) KOICA RPCsz MFT / BFTy Cold Chain Facilitiesx
LuzonRegion 1 (Pangasinan)
Region 2 (Aurora)
VisayasRegion 6 (Iloilo)
Region 7 (Bohol)
MindanaoRegion 11 / 12
zKOICA – Korean International Cooperation Agency; RPC – Rice Processing Center (PHILMECH Rice Mech Program)yMFT – Municipal Food Terminal; BFT – Barangay Food Terminal (DA‐AMAS Agri‐Pinoy Trading Centers Program)xDA‐PHILMECH Cold Chain Program

Project Highlights• Assessment of four
KOICA RPCs
• Assessment of FBDs, MFTs, BFTs, threshers, cold storage rooms

• South Korean grant = Php648‐M (2009‐2013)
• Philippine gov’t counterpart = Php136‐M, with Php20‐M operating capital per site (4 sites)
• Farmers’ organization counterpart = Php2‐M
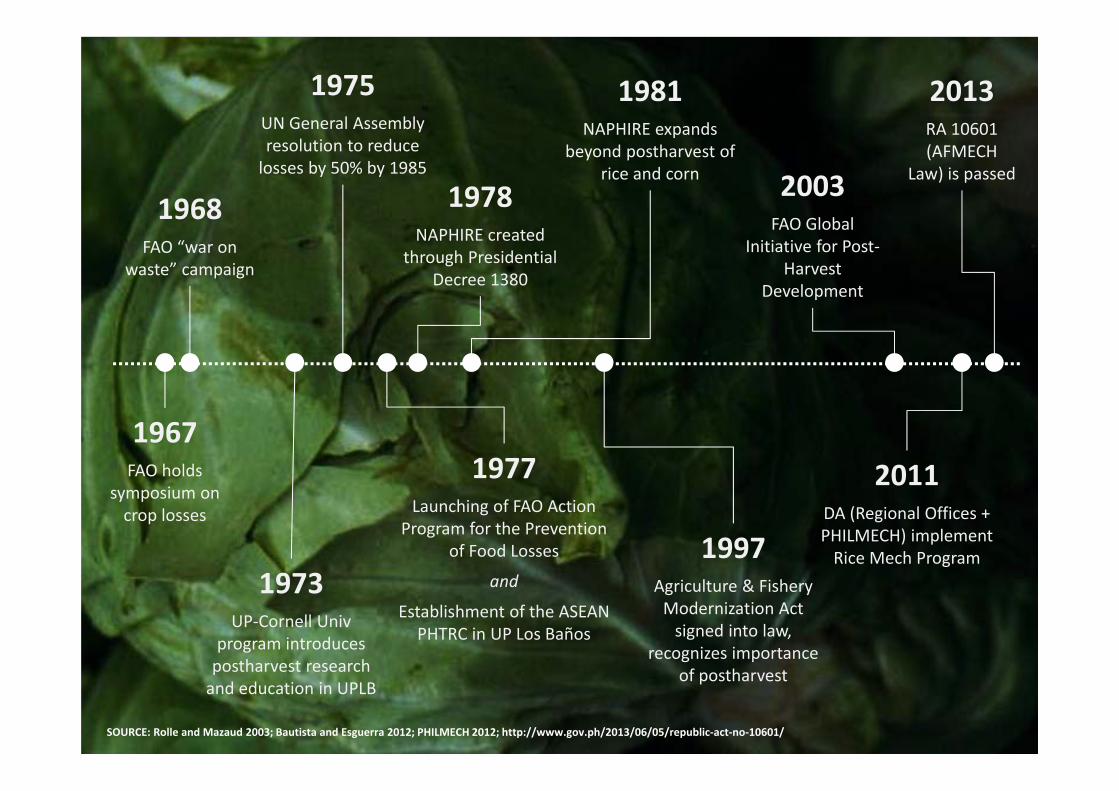
KOICA Rice Processing Centers (RPCs)
• Objectives:
1. Increase farmers’ income
2. Increase processing capacity for rice self‐sufficiency
Expected impact:
• Reduced post-harvest losses
• Generated employment
• Stabilized local prices
• Improved milled rice quality
KOICA RPCs

• Mech. dryers (5 units, 6 t/day per unit), multi‐pass rice mill (2.5 tons/hr), cargo trucks
• Storage warehouse (capacity = 22,000 bags milled rice)
• 65% milling recovery
• Pickup, delivery service
• Custom milling, drying (some RPC’s only)
KOICA RPCs
RPC BUILDINGRPC BUILDING
RECIRCULATING DRYERSRECIRCULATING DRYERS
RICE HUSKERS / ASPIRATORRICE HUSKERS / ASPIRATOR
RICE HULLERRICE HULLER
COLOR SORTERCOLOR SORTER
LENGTH GRADERLENGTH GRADER

Location of KOICA‐supported Rice Processing Centers in the Philippines. Shaded areas show the top five rice production areas (with respect to value or volume (Source: http://countrystat.bas.gov.ph/selection.asp).
• Baler (Aurora)
• Santa Barbara (Pangasinan)
• Pototan (Iloilo)
• Pilar (Bohol)
• Matanao (Davao del Sur)
KOICA RPCs

Sources of paddy for Pototan RPC (Iloilo)
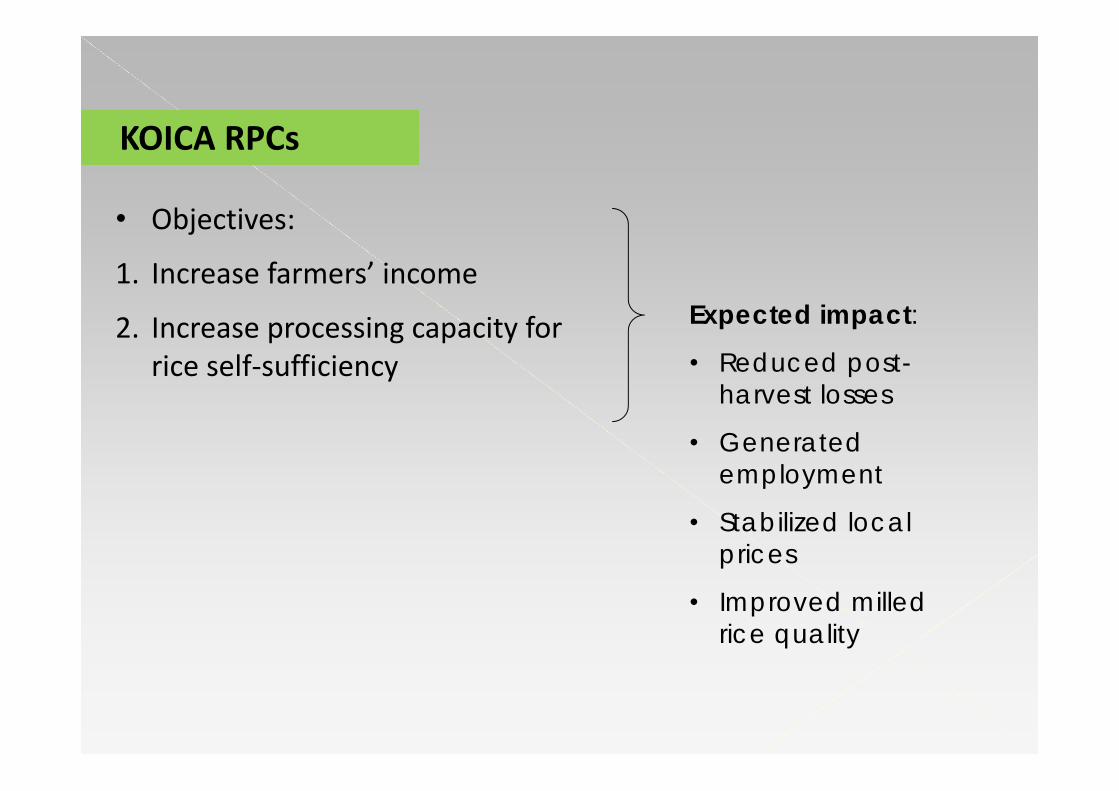
Sources of paddy for Sta. Barbara RPC (Pangasinan)

Sources of paddy for Pilar RPC (Bohol)

Sources of paddy for Matanao RPC (Davao)

Paddy procurement for RPC’szzBohol RPC data not available

Estimated areaz serviced by RPC’szBased on national average yield of 3.47 tons ha‐1
469 ha
771 haUntil Sept 2014 only
245 ha

0
5
10
15
20
25
30
35
0 10 20 30 40
Price of pad
dy (P
hp/kg)
Moisture content (%)
1st cropping (Jan‐May)2nd cropping (Jul‐Dec)
Pototan RPC buying price for paddy in 2014

Expected Impact Reported Findingsz Findings of External Assessment
Reduced post‐harvest losses
Reduced system loss by 4‐6%
Suppliers prefer selling wet paddy to RPC
Generated employment
Provided jobs for 33 professionals, 48 workers
Financial losses for 2 of 4 RPCs
zSource: Tolentino 2013
Outcomes: KOICA Rice Processing Centers

Expected Impact Reported Findingsz Findings of External Assessment
Stabilized local prices
Stable local prices especially during wet season
Feedback from farmers indicate improved prices even during peak harvest period
Improved milled rice quality
High head rice recovery, milling recovery = 65‐68%
Milled rice is premium gradey
zSource: Tolentino 2013yHead rice = 74%, brewer’s rice = 0%, damaged / discoloured grain = 0.4%, chalky / immature grain = 4.1%, red grain = 0%, MC = 13%
Outcomes: KOICA Rice Processing Centers

Agri‐Pinoy Food Terminals
• 12 regional trading centers
• 111 municipal food terminals (MFT) / barangay food terminals (BFT)
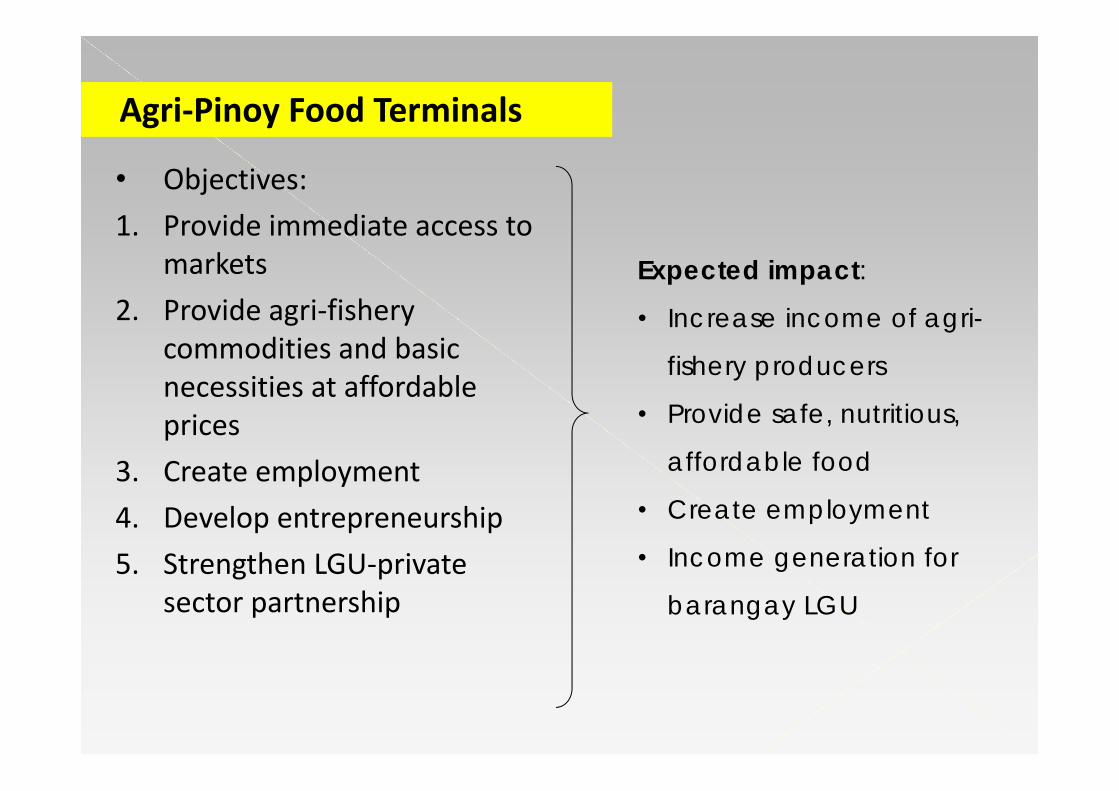
Agri‐Pinoy Food Terminals
• Objectives:1. Provide immediate access to
markets2. Provide agri‐fishery
commodities and basic necessities at affordable prices
3. Create employment4. Develop entrepreneurship5. Strengthen LGU‐private
sector partnership
Expected impact:
• Increase income of agri-
fishery producers
• Provide safe, nutritious,
affordable food
• Create employment
• Income generation for
barangay LGU
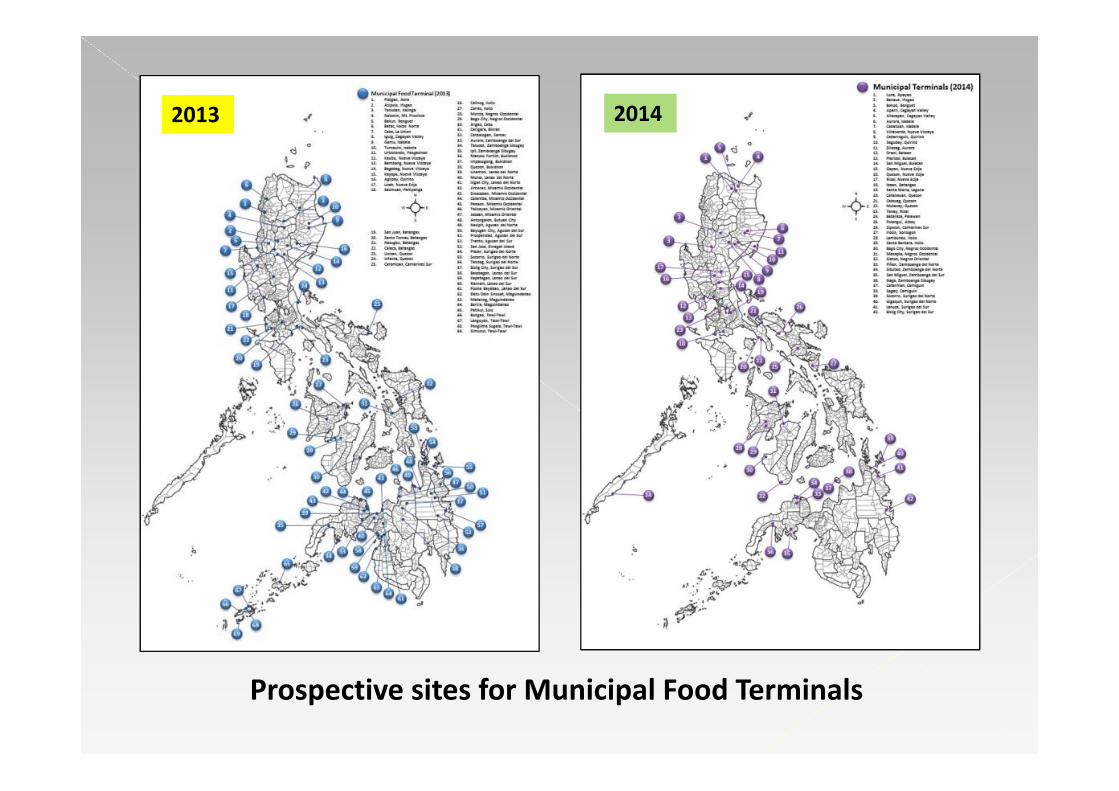
2013 2014
Prospective sites for Municipal Food Terminals

Municipal food terminals
• Funding = Php500,000 to Php1.5‐M for building construction
• Used as consolidation areas, for market preparation and trading
Agri‐Pinoy Food Terminals

Barangay food terminals
• Funding for trading capital, building improvement, training (Php150,000)
• Function as retail markets, provide clean, orderly environment
• Equipped with freezers, chillers, meat processing equipment, package sealers, weighing scales
Agri‐Pinoy Food Terminals

NEXUS Agribusiness Solutions

NEXUS Agribusiness Solutions

Objectives Reported Impactz Findings of Impact Assessment
Provide immediate access to markets
Lako‐lako system eliminated, transport cost reduced, farmers paid in cash, by barter
Eliminated transport costs, mechanical damage
Provide agri‐fishery commodities, basic necessities at affordable prices
One‐stop shop serves daily needs of housewives; organic farming encouraged
Sourced from backyard gardens, eliminated transport cost, wide variety of produce available
zSource: DA‐AFMIS 2013
Outcomes: Barangay Food Terminals

Objectives Reported Impactz Findings of Impact Assessment
Create employment
Hiring of personnelfor BFT,provide support to local businesses
Locals hired to tend BFTs & as farmhand for expanded production
Develop entrepreneurship
Expansion ofproduction areas, development of additional products
Provides support for small business ventures
Strengthen LGU‐private sector partnership
BFT collects user fees for maintenance, supplies ingredients to processors
zSource: DA‐AFMIS 2013
Outcomes: Barangay Food Terminals

Objectives Findings of Impact Assessment
Provide immediate access to markets
Lako‐lako system eliminated, transport cost reduced, growers obtain better selling prices
Provide agri‐fishery commodities and basic necessities at affordable prices
Facilitates exchange of goods between growers and traders
Create employment Loading and unloading employment opportunities were created, trucking/ transport opportunities expanded
Outcomes: Municipal Food Terminals

Objectives Findings of Impact Assessment
Develop entrepreneurship MFT collects market fees (arkabala) from traders, stall rentals
Strengthen LGU‐private sector partnership
Issues and concerns jointly addressed; Municipal Ordinance issued for sustained patronage of MFTs, and organizing loading unloading areas
Outcomes: Municipal Food Terminals

Flatbed Dryers
• Philippines deficient in dryer capacity by 14.9‐M tonsz
• Drying operation is most critical, incurs highest loss (5.86%)
• Total system loss = 16.5%
zSource: PHILMECH / PHILRICE 2013

• FIELDS program of DA provided upgraded versions of UPLB flatbed dryer in 2007, 2008
• Components: grain bin, fan, burnerz or furnace
zSource: Ragudo (2011)
Flatbed Dryers

PHILRICE
DA RFU
Check, validate completeness of
documents; endorse to GMA Rice Program
GMA Rice Program
Compile a short list of recipients
NABCOR
Provide detailed engineering designs and plans for drying
facilities and equipment
Received project funds for transfer to
cooperating agencies
Validate list of recipients
PHILMECH
Fund administration, management and disbursement
Compile list of qualified IAs
NIA
Organize IAs, provide training, coaching and mentoring
Ensure utilization of drying facilities
IA
Undergo training, provide feedback on utilization, operation and maintenance
Provide land, storage shed, initial operating cost, labor
Coordinate, implement and monitor all GMA Rice Program
activities in each region
Procurement, bidding, delivery, installation of drying facilities and equipment
DISSEMINATIONOF DRYERSUNDER THEFIELDS PROGRAM
DISSEMINATIONOF DRYERSUNDER THEFIELDS PROGRAM

Aspect Findings of Impact Assessment
Utilization Over‐utilized during wet season, especially during simultaneous harvests; underused during dry season
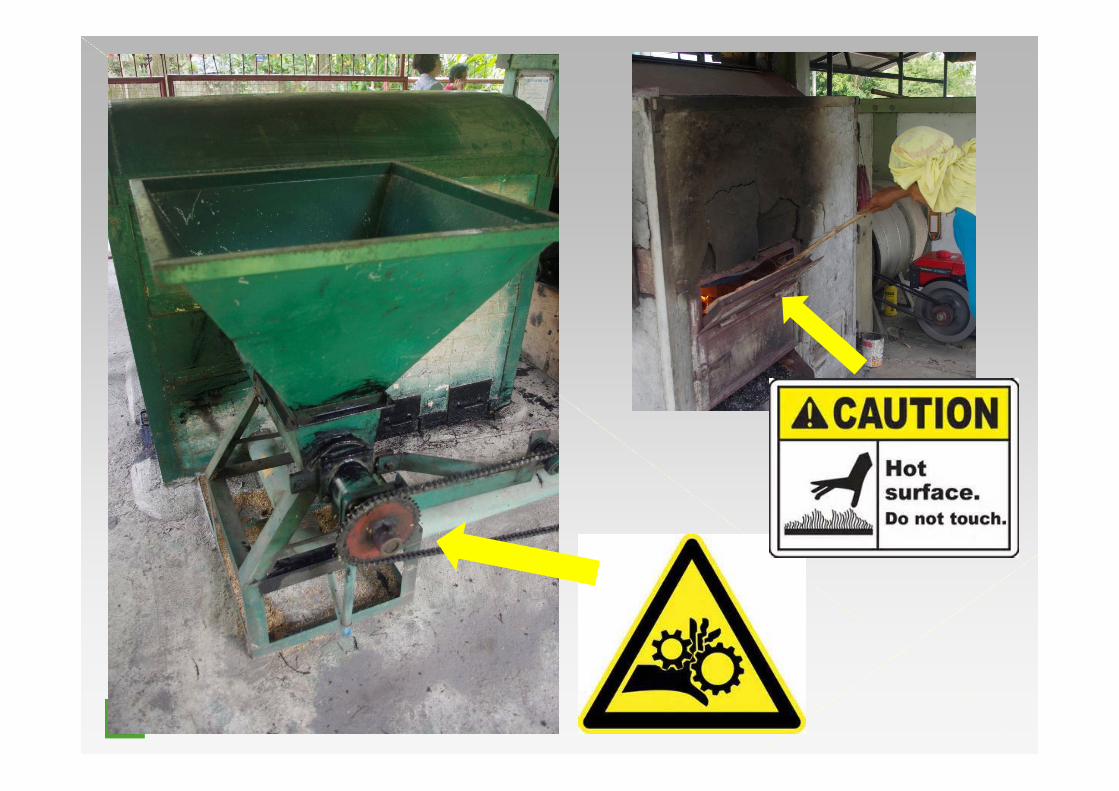
Durability Perforated flooring of grain bin prone to corrosion; replaced with bamboo slat floor overlaid with netting; cracking of concrete lining of biomass furnace
Condition of dryer
Thermometer not operating, flooring deformed
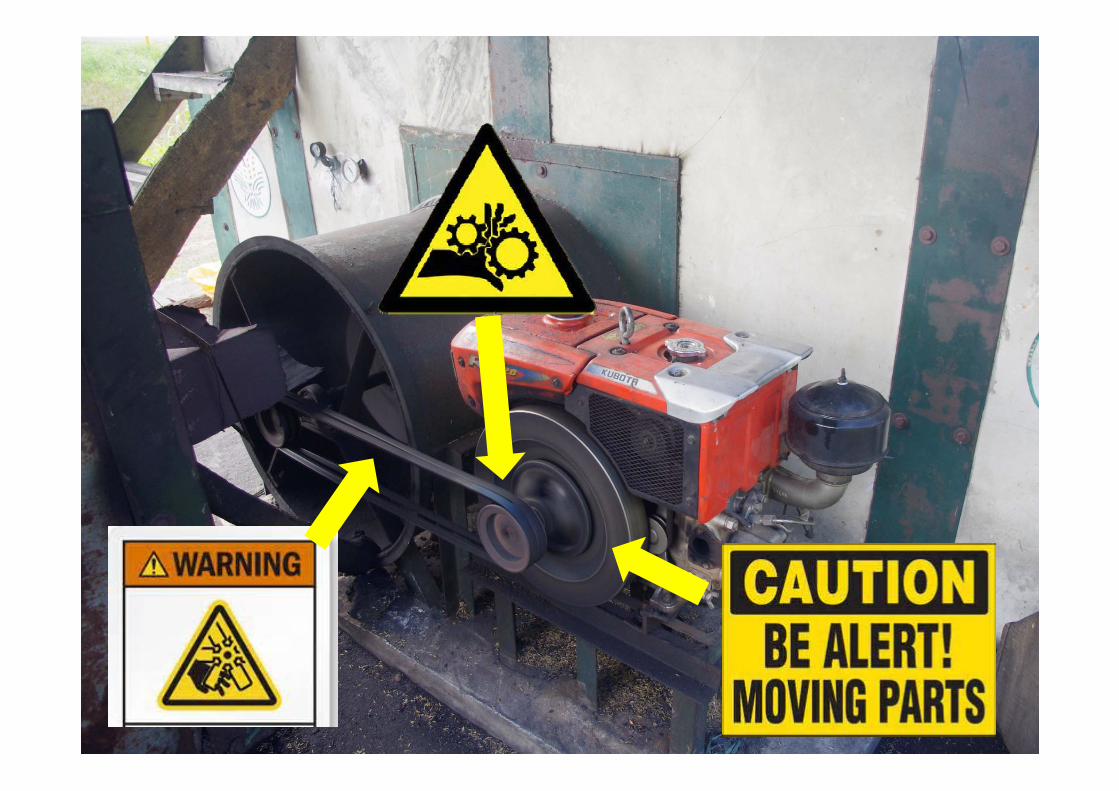
Operator safety
Absence of shields for rotating / moving components
Outcomes: Flatbed Dryers

Instrumentation should be labeled to indicate what parameter is being measured (e.g. plenum air temperature, pressure)
NEXUS Agribusiness Solutions
NEXUS Agribusiness Solutions

BENEFIT‐COST ANALYSIS OF THE IMPACT OF RICE POSTHARVEST TECHNOLOGY
PROJECTS

PHYSICAL LOSSES
Sundrying losses
Milling losses
VALUE (QUALITY) LOSSES
Delay in threshing
Delay in drying
TYPES OF POSTHARVEST LOSSES without appropriate PH technology
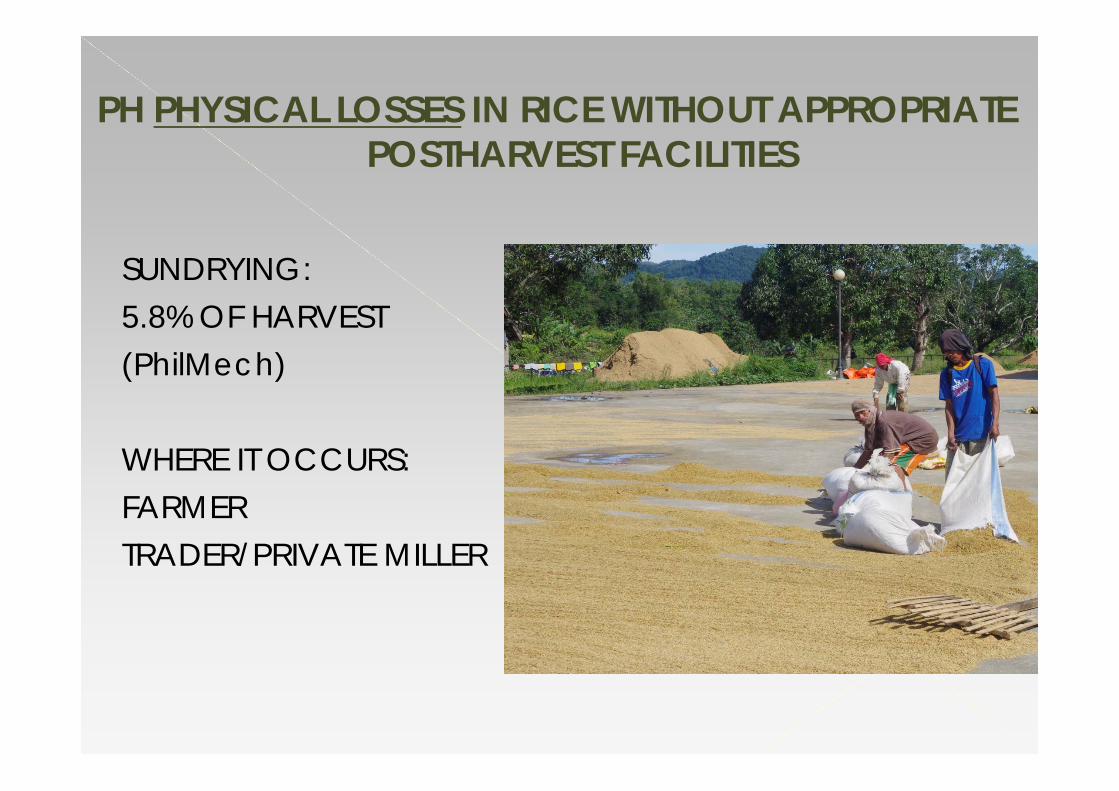
SUNDRYING: 5.8% OF HARVEST(PhilMech)
WHERE IT OCCURS:FARMER TRADER/PRIVATE MILLER
PH PHYSICAL LOSSES IN RICE WITHOUT APPROPRIATE POSTHARVEST FACILITIES
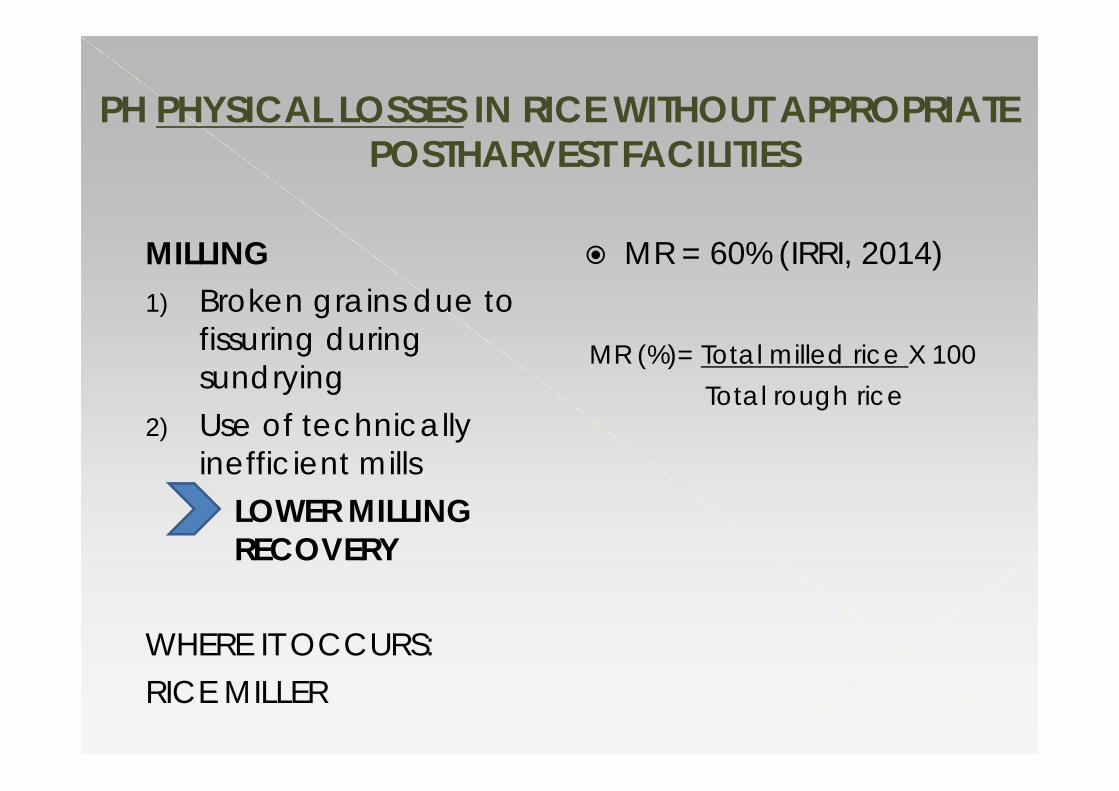
MILLING1) Broken grains due to
fissuring during sundrying
2) Use of technically inefficient mills
LOWER MILLING RECOVERY
WHERE IT OCCURS:RICE MILLER
MR = 60% (IRRI, 2014)
MR (%)= Total milled rice X 100Total rough rice
PH PHYSICAL LOSSES IN RICE WITHOUT APPROPRIATE POSTHARVEST FACILITIES
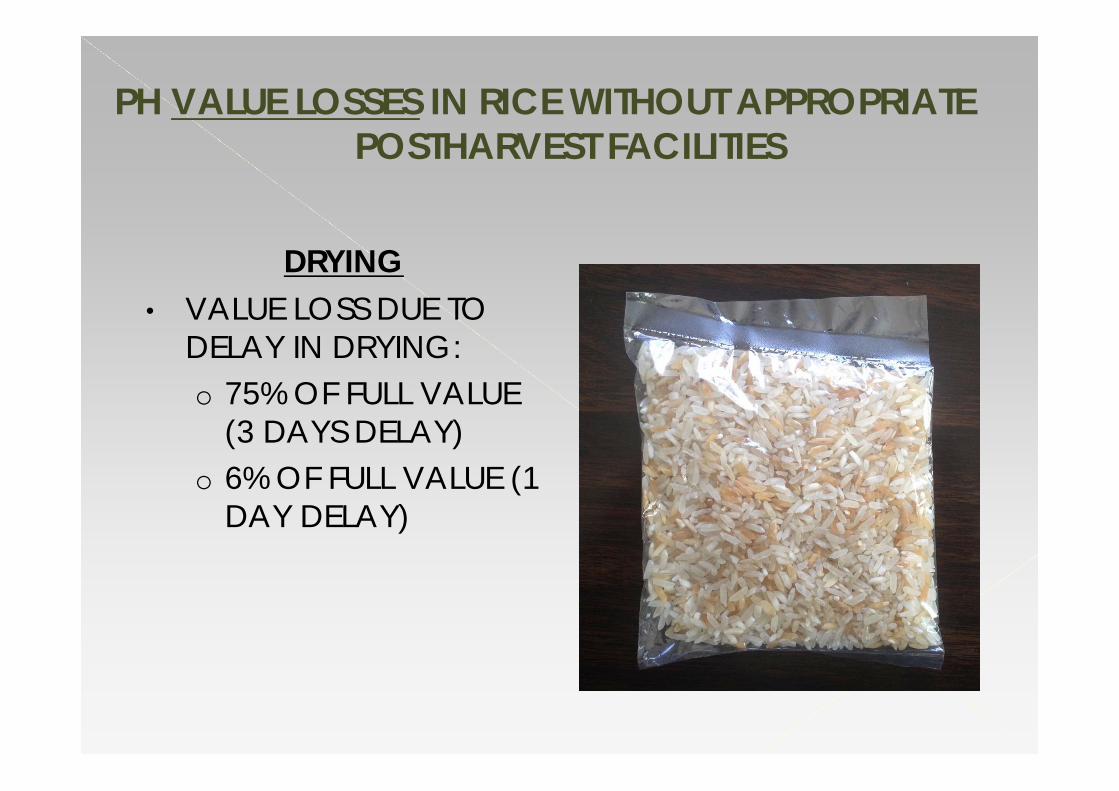
DRYING• VALUE LOSS DUE TO
DELAY IN DRYING:o 75% OF FULL VALUE
(3 DAYS DELAY)o 6% OF FULL VALUE (1
DAY DELAY)
PH VALUE LOSSES IN RICE WITHOUT APPROPRIATE POSTHARVEST FACILITIES
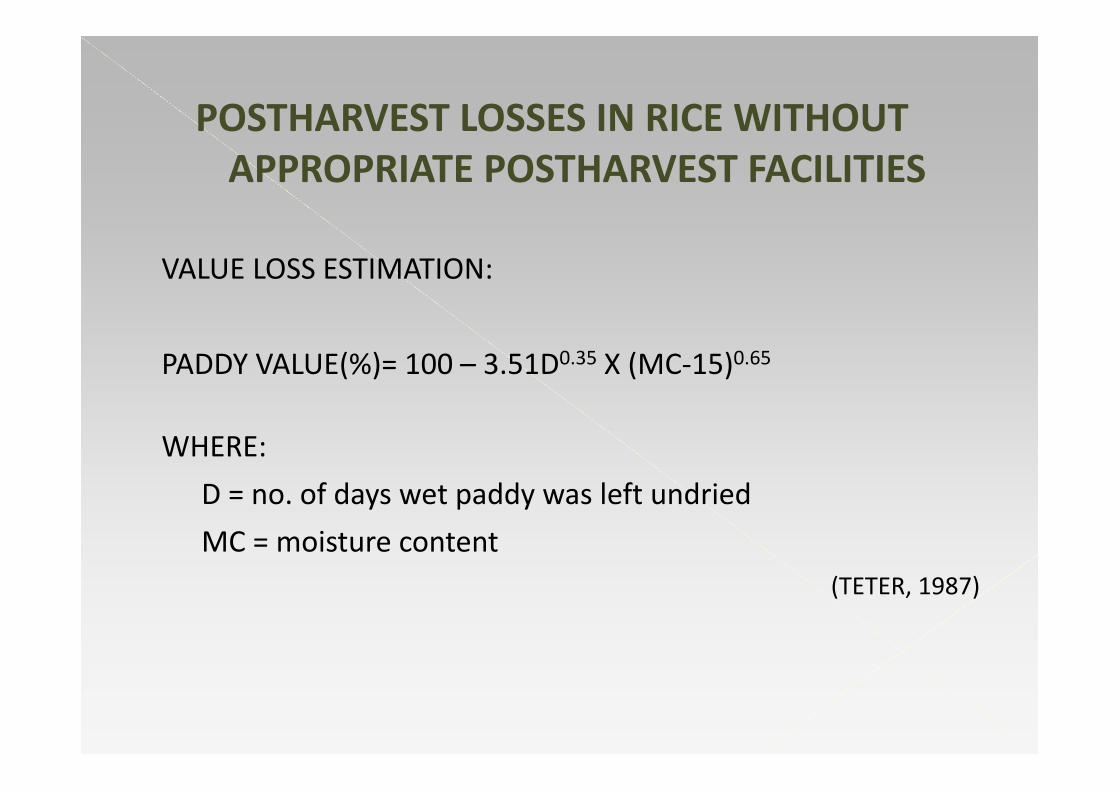
VALUE LOSS ESTIMATION:
PADDY VALUE(%)= 100 – 3.51D0.35 X (MC‐15)0.65
WHERE:D = no. of days wet paddy was left undriedMC = moisture content
(TETER, 1987)
POSTHARVEST LOSSES IN RICE WITHOUT APPROPRIATE POSTHARVEST FACILITIES
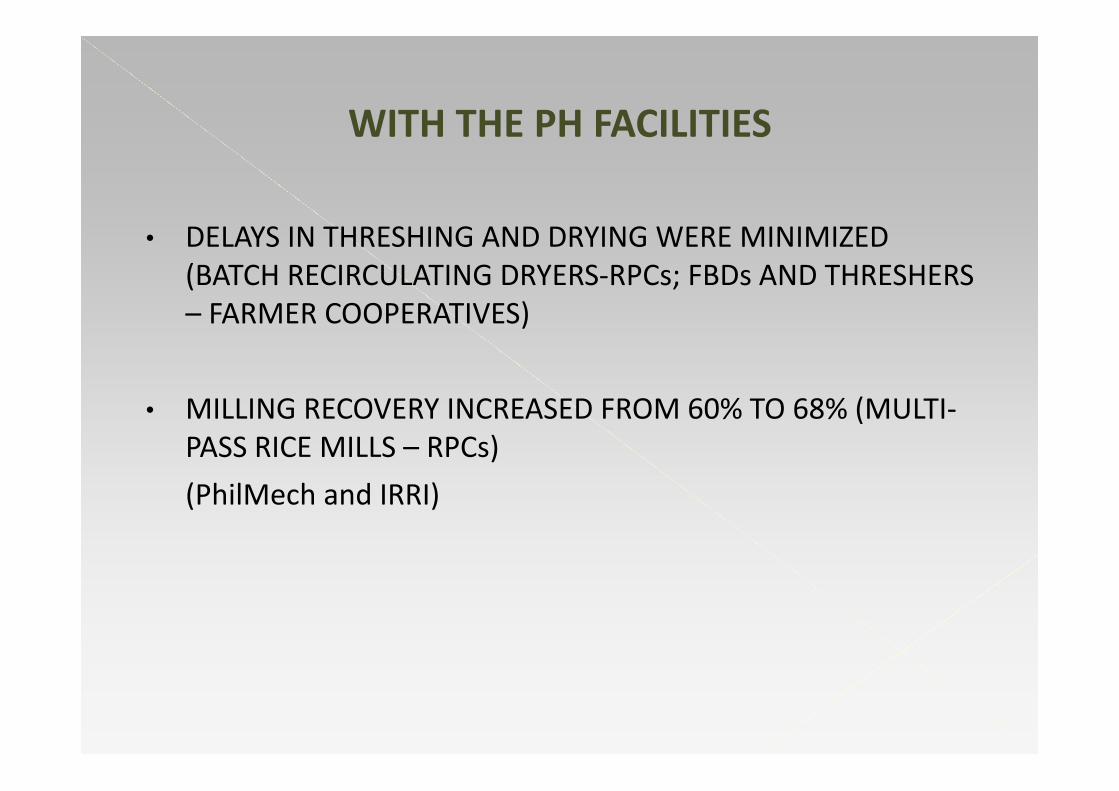
• DELAYS IN THRESHING AND DRYING WERE MINIMIZED (BATCH RECIRCULATING DRYERS‐RPCs; FBDs AND THRESHERS – FARMER COOPERATIVES)
• MILLING RECOVERY INCREASED FROM 60% TO 68% (MULTI‐PASS RICE MILLS – RPCs) (PhilMech and IRRI)
WITH THE PH FACILITIES

PH Losses in Rice With and Without Appropriate PH Technologies
0%
10%
20%
30%
40%
50%
60%
70%
80%
3 days delay 1 day delay Zero Delay
% of full value
Value Loss Due To Delay in Drying
0%
1%
2%
3%
4%
5%
6%
7%
Sundrying Mechanical Dryers
Physical Lossess
Physical Lossess Due to Drying

PH Losses in Rice With and Without AppropriatePH Technologies
56%
58%
60%
62%
64%
66%
68%
70%
Single/Double Pass Mills Multi‐Pass Mills
Milling Re
covery
Milling Recovery of Traditional and Modern Rice Mills
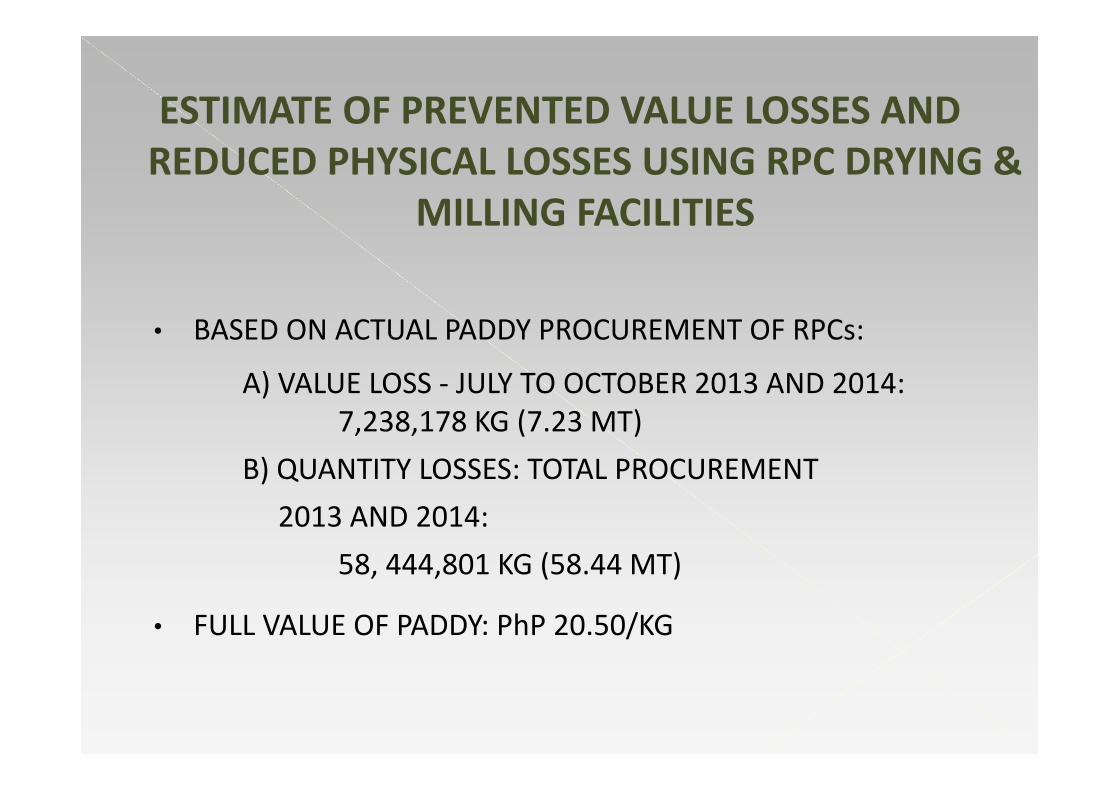
• BASED ON ACTUAL PADDY PROCUREMENT OF RPCs:
A) VALUE LOSS ‐ JULY TO OCTOBER 2013 AND 2014: 7,238,178 KG (7.23 MT)
B) QUANTITY LOSSES: TOTAL PROCUREMENT 2013 AND 2014:
58, 444,801 KG (58.44 MT)
• FULL VALUE OF PADDY: PhP 20.50/KG
ESTIMATE OF PREVENTED VALUE LOSSES AND REDUCED PHYSICAL LOSSES USING RPC DRYING &
MILLING FACILITIES

REDUCTION IN VALUE LOSS BY USING RPC DRYER
VALUE OF PADDY WITH ZERO DELAY IN DRYINGFull value:PhP148.38M
VALUE OF PADDY WITH 3 DAYS DELAY IN DRYING (SUNDRYING)75% of full valuePhP 110.85M
VALUE OF AVOIDED LOSS
PhP 37.53M
REDUCTION IN QUANTITY LOSSES BY USING RPC DRYER
RECIRCULATING BATCH‐TYPE DRYERS:No significant lossess
SUNDRYING (5.8% LOSSES)PhP 82.88M
VALUE OF AVOIDED LOSSESPhP 82.88M
REDUCTION IN QUANTITY LOSSES USING RPC RICE MILL
RPC MULTI‐PASS MILL67.5% MRPhP 1.5B
SINGLE‐ and DOUBLE‐PASS MILL60% MRPhP 1.33B
VALUE OF AVOIDEDLOSSESPhP 166.57M
TOTAL VALUE OF AVOIDED LOSSES PhP 286.97M

ITEM VALUE (PhP) ASSUMPTION
Reduced value loss (delay in drying)
14.8 M PhP 10/Kg (Vietnam, 2003)
Prevented physical losses (recirculating
batch dryer)
40.25 M 2.9% of paddy wt. being dried
Reduced physical losses (multi‐pass
mill)
111.05 M 65% MR
TOTAL 166.12 M
ESTIMATED REDUCTIONS IN PADDY VALUE AND QUANTITATIVE LOSSES USING CONSERVATIVE ASSUMPTIONS
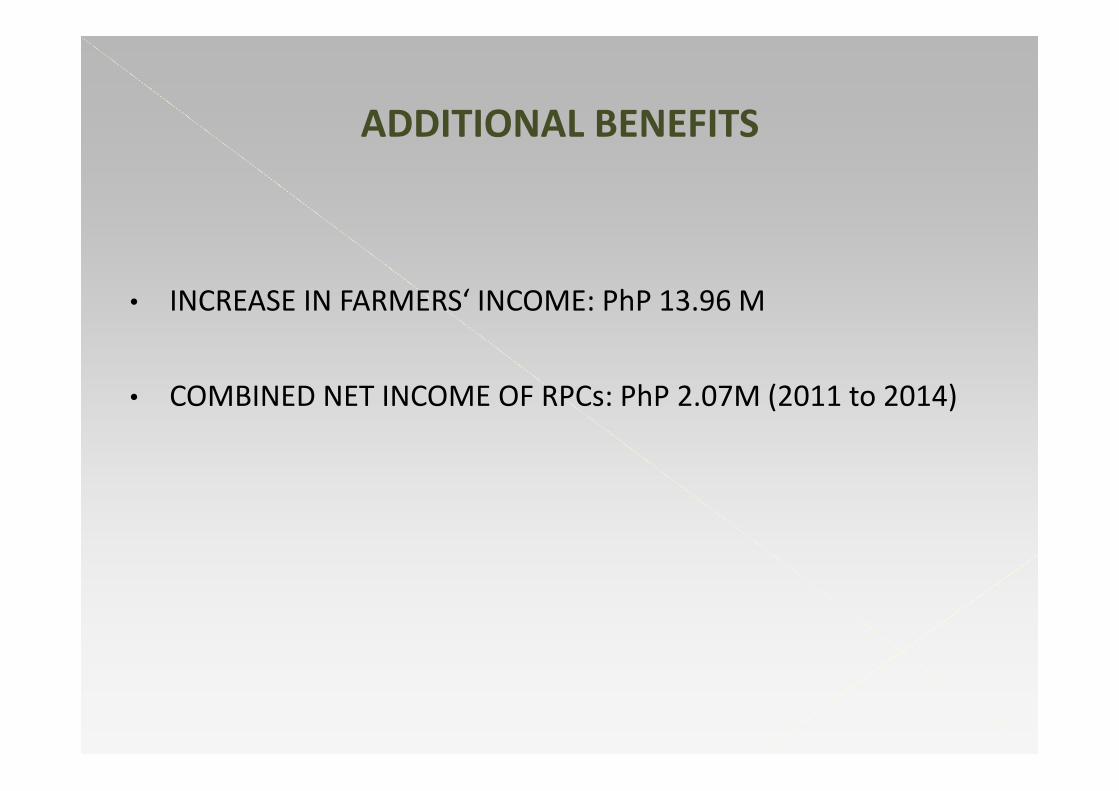
• INCREASE IN FARMERS‘ INCOME: PhP 13.96 M
• COMBINED NET INCOME OF RPCs: PhP 2.07M (2011 to 2014)
ADDITIONAL BENEFITS
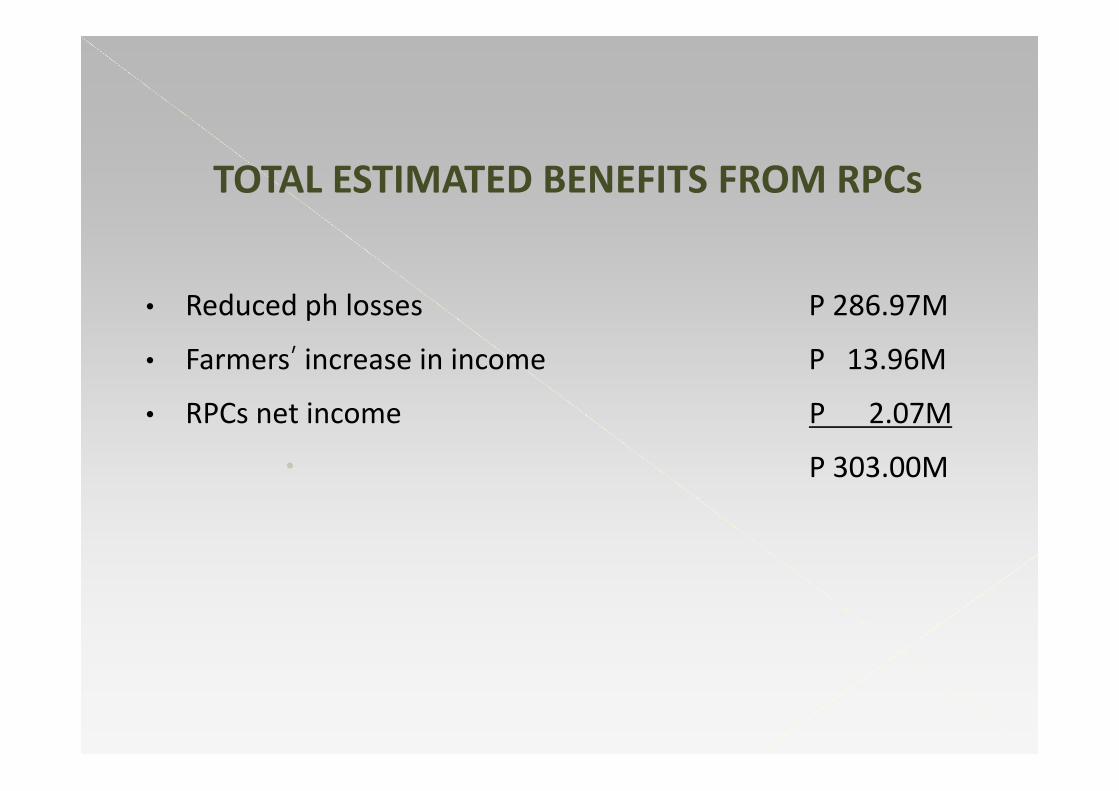
• Reduced ph losses P 286.97M
• Farmers’ increase in income P 13.96M
• RPCs net income P 2.07M
P 303.00M
TOTAL ESTIMATED BENEFITS FROM RPCs

• PhP 865 M: PROJECT COST• PhP 303.00 M: BENEFITS
• CAPITAL RECOVERY APPROACH TREATS THE BENEFITS FROM THE RPC PROJECT AS REPAYMENT TO THE CAPITAL INVESTMENT (PROJECT COST) AND DETERMINES THE PROPORTION OF THE PROJ COST THAT HAS BEEN RECOVERED.
BENEFIT‐COST ANALYSIS: CAPITAL RECOVERY APPROACH
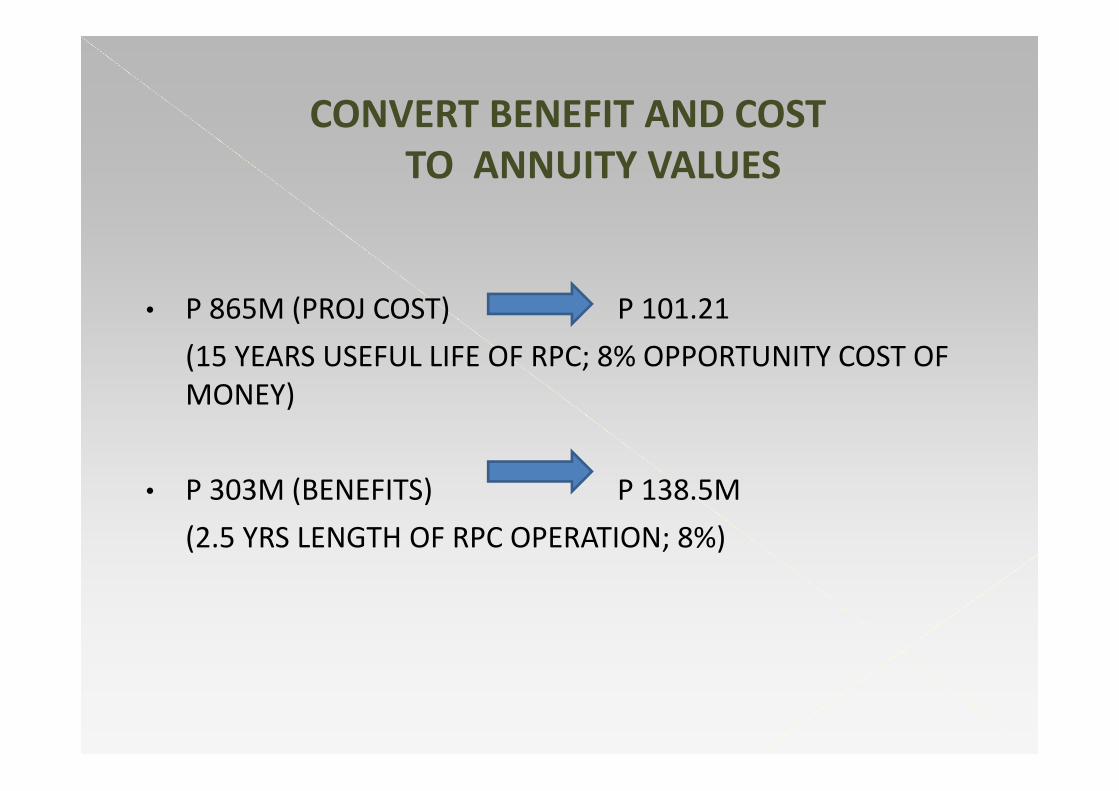
CONVERT BENEFIT AND COST TO ANNUITY VALUES
• P 865M (PROJ COST) P 101.21(15 YEARS USEFUL LIFE OF RPC; 8% OPPORTUNITY COST OF MONEY)
• P 303M (BENEFITS) P 138.5M(2.5 YRS LENGTH OF RPC OPERATION; 8%)

• CRR = 138.5M/101.21M = 1.37
• AFTER 2.5 YRS OF OPERATION, RPCs GENERATED A NET BENEFIT THAT WAS ABLE TO FULLY PAY ONE YEAR OF THE ANNUITY PLUS AN EXCESS OF 37% OF THE ANNUITY.
CAPITAL RECOVERY RATIO
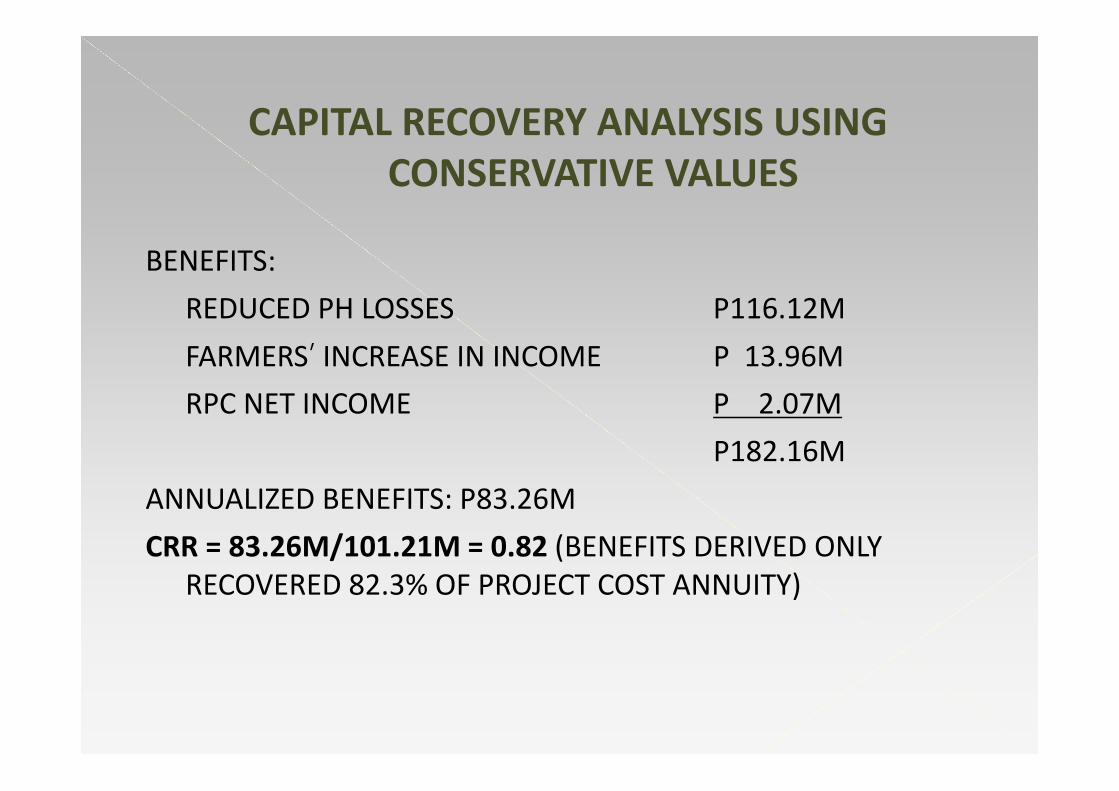
BENEFITS:REDUCED PH LOSSES P116.12MFARMERS’ INCREASE IN INCOME P 13.96MRPC NET INCOME P 2.07M
P182.16MANNUALIZED BENEFITS: P83.26MCRR = 83.26M/101.21M = 0.82 (BENEFITS DERIVED ONLY
RECOVERED 82.3% OF PROJECT COST ANNUITY)
CAPITAL RECOVERY ANALYSIS USING CONSERVATIVE VALUES

THE CR ANALYSIS SHOWS THAT THE RPC PROJECT IS SENSITIVE TO A REDUCTION IN THE ESTIMATED
BENEFITS (CRR = 0.82)
• FARMERS’ BENEFITS FROM FBDso FBDs more appreciated during the wet season harvesto low buying price for wet paddy o P 1.00/kg premium for dry paddyo Farmers who use FBDs sell paddy to private traders/millers (Credit‐mktg linkage)
FLATBED DRYERS (FBD)

o ONE FBD UNIT CAN ONLY SERVE ONE FARMER AT A TIME
o 8 HRS TO DRY ONE BATCH OF PADDY TO 14% MC
o FBDs are useful only if wet paddy can be dried
immediately (according to farmer respondents)
LIMITATION OF FBD PROGRAM
AN ADDITIONAL THRESHER FOR A FARMING COMMUNITY IS
CONSIDERED BENEFICIAL BECAUSE MOST FARMERS HARVEST
AT THE SAME TIME RESULTING IN SHORTAGE OF THRESHERS
PADDY MUST BE THRESHED SO FARMERS CAN SELL THEIR
HARVEST
THRESHERS
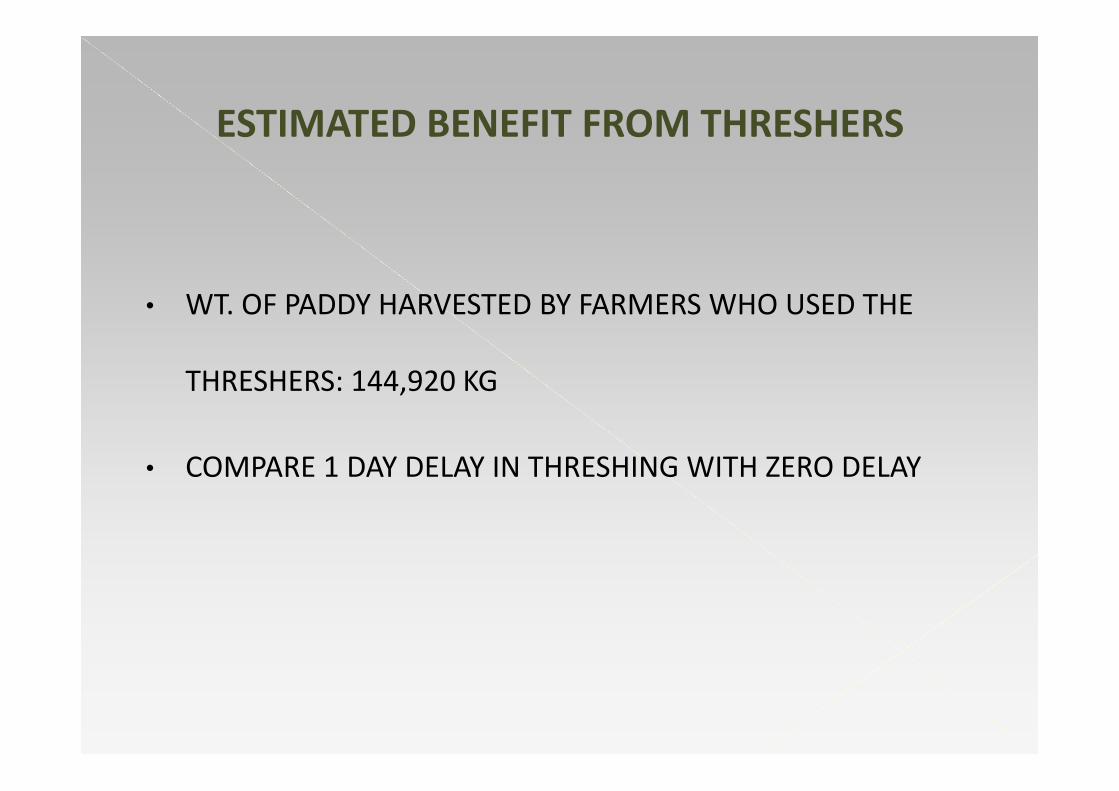
• WT. OF PADDY HARVESTED BY FARMERS WHO USED THE
THRESHERS: 144,920 KG
• COMPARE 1 DAY DELAY IN THRESHING WITH ZERO DELAY
ESTIMATED BENEFIT FROM THRESHERS

VALUE OF PREMIUM PADDY: P 20.50/KG
• VALUE OF PADDY WITH 1 DAY THRESHING DELAY: P 19.23/KG
(20.50 – (20.50 x 6.2%))
• Footnote: Determination of buying price by traders/millers
based on paddy condition is subjective

• PADDY VALUE WITH NO THRESHING DELAY:• 144,920 KG X 20.50/KG = P 2.97M
• PADDY VALUE WITH 1 DAY DELAY IN THRESHING:• 144,920 KG X P 19.23/KG = 2.78M
• VALUE LOSS = P190,000

• DELAYS IN THRESHING AND DRYING WERE MINIMIZED
(BATCH RECIRCULATING DRYERS‐RPCs; FBDs AND
THRESHERS – FARMER COOPERATIVES)
• MILLING RECOVERY INCREASED FROM 60% TO 67.5%
(MULTI‐PASS RICE MILLS – RPCs)
(PhilMech and IRRI)
OVERALL IMPACT OF RPCs, FBDs, THRESHERS

PHF within The Value Chain
Gaps and OpportunitiesProgram Planning and Implementation
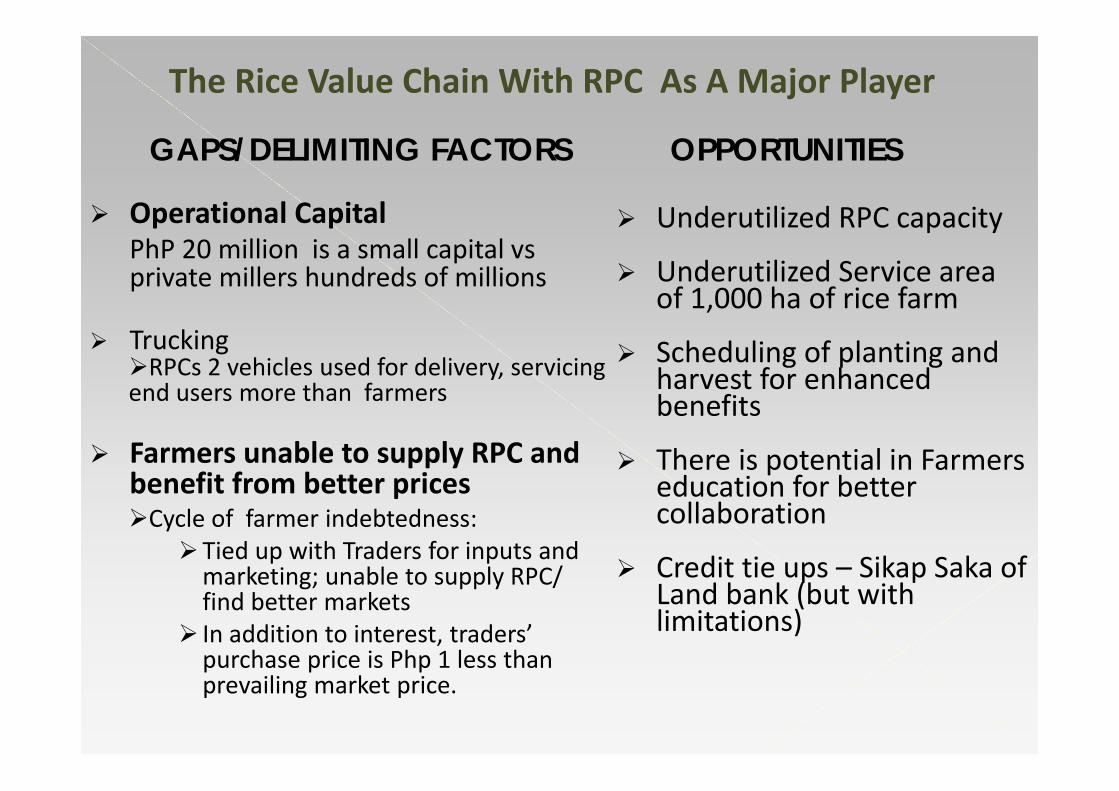
The Rice Value Chain With RPC As A Major Player
GAPS/DELIMITING FACTORS
Operational CapitalPhP 20 million is a small capital vs private millers hundreds of millions
TruckingRPCs 2 vehicles used for delivery, servicing end users more than farmers
Farmers unable to supply RPC and benefit from better pricesCycle of farmer indebtedness:
Tied up with Traders for inputs and marketing; unable to supply RPC/ find better markets
In addition to interest, traders’ purchase price is Php 1 less than prevailing market price.
OPPORTUNITIES
Underutilized RPC capacity
Underutilized Service area of 1,000 ha of rice farm
Scheduling of planting and harvest for enhanced benefits
There is potential in Farmers education for better collaboration
Credit tie ups – Sikap Saka of Land bank (but with limitations)

Basic Commodity Value Chain With MFT’s and BFTs As Major Players
GAPS/DELIMITING FACTORS
Non Viability of MFTs cold storage High energy cost of operations Limited Volume of utilization
Poor site selection proximity to well functioning markets) Unmet volume of transactions Facilities used for other uses (fast food )
OPPORTUNITIES
Trading group (buyer & seller) Incentives to produce more; higher market absorbtive capacity Better prices – direct transaction Convenience for sellers reduced long walks as peddlers
One stop trading venue with varied commodities
ConsumersMore commodities to choose Convenience comparable
prices to major markets Reduce transportation cost

BFTs Distribution per RegionBFTs Distribution per Region
*Values obtained from DA‐AMAS
18
45132
25
75
126
11
52
75
70
71
60
105
66
72 88
167
*Source: Mapsof.net
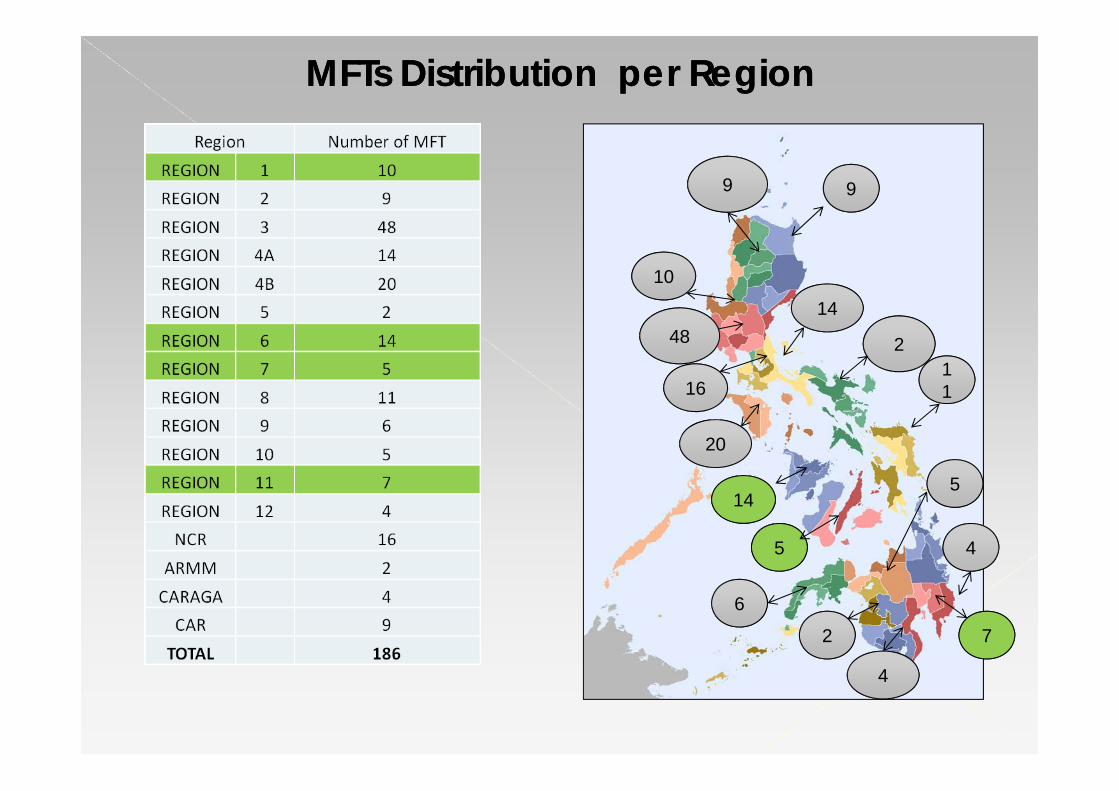
10
1448
20
9
2
14
5
6
11
5
4
4
16
2 7
9
MFTs Distribution per RegionMFTs Distribution per Region

Program Planning & ImplementationPlanning
Wanting preparatory activities prior to implementation• Beneficiaries unaware of
extent of contribution (power, capital)
• Confusion as to roles and responsibilities (spiced with political flavor)
Cushion programs on political interference
Need to trace back issues to Project cycle
Implementation
Organization & Management• “champions” who push program
cause/objectives are success factoro Iloilo RPC, Leon MFT & MAO
Focus: Solutions more than problems
Coping mechanisms reflects project leadership/teamwork (PH Mgt team, regional line agencies)
Balancing facilitating & regulatingroles difficult, but crucial andworks best for farmer’s interest

Conclusions and Recommendations
ConclusionRecommendationAreas for Further Study

Conclusions• RPCs increase farmer’s income through
o production of good quality milled rice ando reduction of postharvest losses.Potential maximized if paddy procurement capital is increased.
• FBDs and threshers of the Rice Mechanization Program,o preserve grain quality and reduce postharvest losses by:
o augmenting existing thresher and dryer capacities.• Food terminals
o were well managed and able to provide agri‐suppliers with access tomarkets,
o improve the availability of commodities and basic goods,o create employmento enable operators to become entrepreneurs and strengthen
partnership between LGUs and private sector.

Conclusions
Functioning PHF enhanced rice and basic commodity value chains
Expanded Production (RPC MFTs BFTs)› Enterprise establishment› Enterprise management know how rubbed on to members (BFT); put up of their own small businesses(opportunity dependent – Panglao, tourist area)
› Value addingHousehold Processing of produce otherwise marketed fresh due to presence of market options

Recommendations
Rice Processing Center Increase operating capital from 20
M to PHP40‐80M to scale up procurement.
additional cargo trucks for each RPC for timely pick up and delivery.
Could be the second phase of KOICA project ‐ to ensure RPC sustainability.
However, release of additional funds and inputs by DA should be subject to performance of each facility.
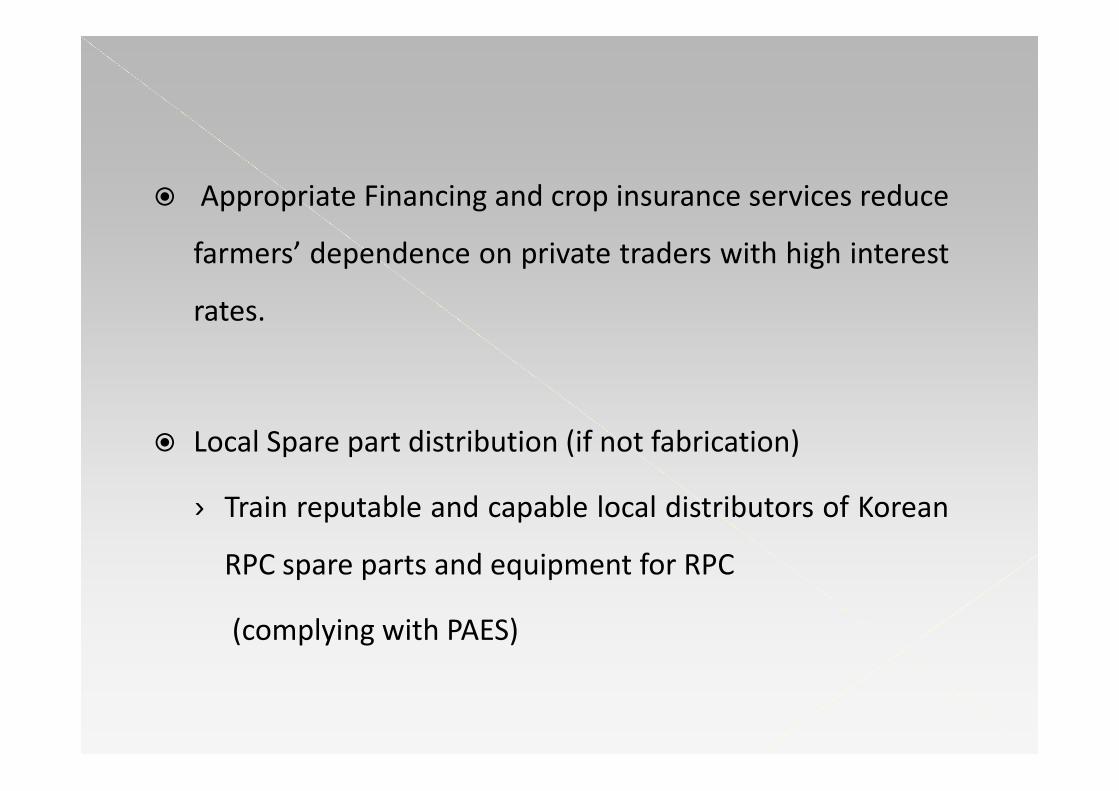
Appropriate Financing and crop insurance services reduce
farmers’ dependence on private traders with high interest
rates.
Local Spare part distribution (if not fabrication)
› Train reputable and capable local distributors of Korean
RPC spare parts and equipment for RPC
(complying with PAES)

Flatbed Dryers &Threshers
Closely monitor accredited fabricators to ensure
quality of disseminated units,
specification compliance
proper and timely servicing if
defects are present.

Thorough evaluation of project beneficiaries
proper site selection (maximize use of dryers)
Incorporate design improvements (safety and durability)
Continuous monitoring and testing by appropriate
government agencies (proper operation & maintenance of
FBDs)
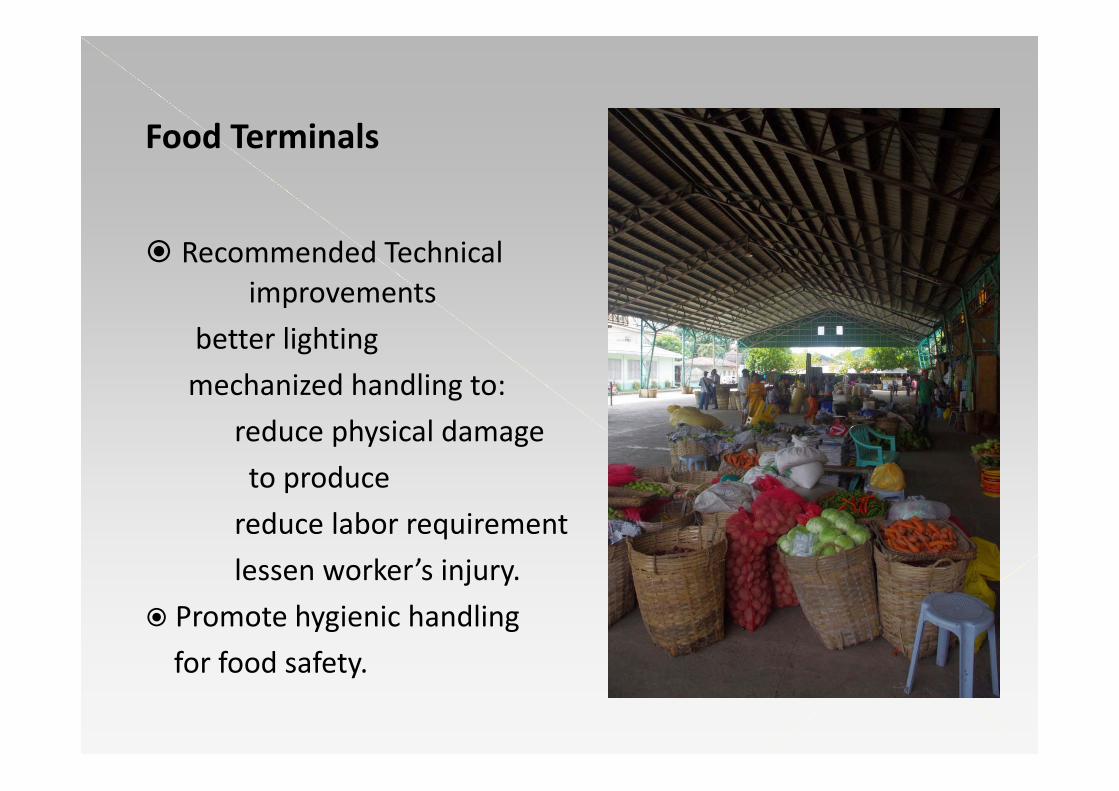
Food Terminals
Recommended Technical improvements
better lightingmechanized handling to:
reduce physical damage to producereduce labor requirement lessen worker’s injury.
Promote hygienic handling for food safety.
Project Planning and Implementation Well thought of Proposal: implementation strategy well developed . Short sighted planning is evident facilities established and maintained with scarce government
funds and without properly trained personnel Involve beneficiaries/project stakeholder as early as possible Strict adherence to project guidelines improve project implementation minimize political interference
Compliance of RPC products with NFA standards (milled rice) should be verified by mandated government agencies with corresponding action to correct violations
Recommendations

Measures of Performance For Better Decision ProcessRPC
• Service target areas of 1000 ha but with limited earnings or service other areas to sustain plant operation
• Cost Revenue treatmentGrant Mgt & Enterprise Mgt Not asset use is free or depreciated
• Treatment of added income spreading costs or simply profit add ons
• Sustainability measures clear as early as planning stage
MFT/BFTLocation selection far from existing trading
centers Farm to market roads a
problem Existence of production areas
within kilometer radius
Management Modality LGU Managed Cooperative Managed

Success and failures of MFT and BFT projects
need to be documented and
Disseminate results for learning insights.
To ensure maximum utilization,
› Include survey of existing food terminals and wet markets
during site selection stage

The study found the evaluated PHFs as worthy government(maybe in future private) investments, however, regularand thorough review should still be carried out to determinetheir further impact
Selection of sites and beneficiaries be based on a set of suitable criteria rather than a “divide by N” approach (prone to duplication and overlaps)
Strengthen information and education campaign on existing government programs ‐ inspite of years of program existence not many are availing of the said services.

Areas for Further Study
Possibility of locally produced RPC equipment,
parts and tools
Assessment of other PHF programs
› agricultural tramlines and
› cold chain programs
Documentation of PH best practices and
business models for outscaling/upscaling
In‐depth evaluation of success failure factors of
PHF across regions and organizational types

First Global Conference on PH Losses; Rome Oct 5‐7, 2015

NEXUS Agribusiness SolutionsNEXUS Agribusiness Solutions
Thank You!
Related Documents