Rapid and Robust Detection Methods for Poison and Microbial Contamination Melanie M. Hoehl,* ,†,‡ Peter J. Lu, # Peter A. Sims, § and Alexander H. Slocum † † Department of Mechanical Engineering, Massachusetts Institute of Technology, Cambridge, Massachusetts 02139, United States ‡ Harvard−MIT Division of Health Sciences and Technology, Cambridge, Massachusetts 02139, United States # Department of Physics and SEAS, Harvard University, Cambridge, Massachusetts 02138, United States § Columbia Initiative in Systems Biology, Department of Biochemistry and Molecular Biophysics, Columbia University Medical Center, New York, New York 10032, United States * S Supporting Information ABSTRACT: Real-time on-site monitoring of analytes is currently in high demand for food contamination, water, medicines, and ingestible household products that were never tested appropriately. Here we introduce chemical methods for the rapid quantification of a wide range of chemical and microbial contaminations using a simple instrument. Within the testing procedure, we used a multichannel, multisample, UV−vis spectrophotometer/fluorometer that employs two frequencies of light simultaneously to interrogate the sample. We present new enzyme- and dye-based methods to detect (di)ethylene glycol in consumables above 0.1 wt % without interference and alcohols above 1 ppb. Using DNA intercalating dyes, we can detect a range of pathogens (E. coli, Salmonella, V. Cholera, and a model for Malaria) in water, foods, and blood without background signal. We achieved universal scaling independent of pathogen size above 10 4 CFU/mL by taking advantage of the simultaneous measurement at multiple wavelengths. We can detect contaminants directly, without separation, purification, concentration, or incubation. Our chemistry is stable to ±1% for >3 weeks without refrigeration, and measurements require <5 min. KEYWORDS: UV absorption, fluorescence, detection, ethylene glycol, diethylene glycol, malaria, food pathogens, Salmonella, E. coli, V. cholera ■ INTRODUCTION Contamination of food, water, medicine, and ingestible household consumer products is a public health hazard that episodically causes thousands of deaths and each year sickens millions worldwide. 1,2 For example, lower cost ethylene glycol (EG) and diethylene glycol (DEG) have been substituted for the nontoxic glycerol, propylene glycol, and polyethylene glycol often used in medicines, household products, and foods. 3,4 Ingestion of even a small amount of EG or DEG can result in central nervous system depression, cardiopulmonary compro- mise, and kidney failure. 5−8 A longstanding problem that led to the 1938 Food, Drug and Cosmetic Act established the modern drug-approval process within the U.S. Food and Drug Administration (FDA). 9 DEG contamination remains a serious hazard today. 3 In the past 15 years, episodes of DEG poisoning have killed hundreds, particularly in developing countries. 5,8−21 In addition to chemical poisoning, contamination of food and water by microbes such as Escherichia coli and Salmonella in food 2,22−25 or Vibrio cholera in water 26,27 sickens millions (see the Supporting Information for recent contamination data). Existing laboratory methods to detect many common relevant chemicals and pathogens (such as GC, MS, optical spectroscopy, or electrochemistry 5,31,33−36 ) require specialized scientific equipment, a stable laboratory environment, a continuous refrigeration chain for reagents or antibodies, and/or specially trained staff, 28−33 all of which are expensive and generally preclude their use at the location of an outbreak or natural disaster. 34 Any detector for field use should rely on a simpler, more mechanically robust technology. There has thus been an effort to develop field-deployable diagnostic technologies (e.g., microfluidic, nanotechnology, or surface plasmon resonance methods) that can be used outside a stable laboratory environment. For the past 7 years, this has led to numerous publications about early-stage technologies. 33 How- ever, many of these technologies lack robustness or ease-of-use in the field and are usable for a single disease application only. 33 Here we introduce robust chemical methods and a simple instrument to rapidly quantify a wide range of chemical and microbial contaminations. We employed far-field optical detection, which is particularly practical because it does not require physical contact with the sample. Instead of using a commercial spectrophotometer, we developed a low-cost detection device to perform our tests (see the Supporting Information). The device achieves robustness and high sensitivity by concurrently detecting UV absorption and fluorescence. The use of an optical readout allows it to be applicable for the detection of a range of analytes. In this paper, we focus on the enzyme- and dye-based methods to quantify the concentration of several chemical contaminants and microbial pathogens in a wide range of household products, medicines, foods, and blood components. Received: February 25, 2012 Revised: May 22, 2012 Accepted: May 27, 2012 Published: May 28, 2012 Article pubs.acs.org/JAFC © 2012 American Chemical Society 6349 dx.doi.org/10.1021/jf300817h | J. Agric. Food Chem. 2012, 60, 6349−6358

Welcome message from author
This document is posted to help you gain knowledge. Please leave a comment to let me know what you think about it! Share it to your friends and learn new things together.
Transcript
Rapid and Robust Detection Methods for Poison and MicrobialContaminationMelanie M. Hoehl,*,†,‡ Peter J. Lu,# Peter A. Sims,§ and Alexander H. Slocum†
†Department of Mechanical Engineering, Massachusetts Institute of Technology, Cambridge, Massachusetts 02139, United States‡Harvard−MIT Division of Health Sciences and Technology, Cambridge, Massachusetts 02139, United States#Department of Physics and SEAS, Harvard University, Cambridge, Massachusetts 02138, United States§Columbia Initiative in Systems Biology, Department of Biochemistry and Molecular Biophysics, Columbia University MedicalCenter, New York, New York 10032, United States
*S Supporting Information
ABSTRACT: Real-time on-site monitoring of analytes is currently in high demand for food contamination, water, medicines,and ingestible household products that were never tested appropriately. Here we introduce chemical methods for the rapidquantification of a wide range of chemical and microbial contaminations using a simple instrument. Within the testing procedure,we used a multichannel, multisample, UV−vis spectrophotometer/fluorometer that employs two frequencies of lightsimultaneously to interrogate the sample. We present new enzyme- and dye-based methods to detect (di)ethylene glycol inconsumables above 0.1 wt % without interference and alcohols above 1 ppb. Using DNA intercalating dyes, we can detect a rangeof pathogens (E. coli, Salmonella, V. Cholera, and a model for Malaria) in water, foods, and blood without background signal. Weachieved universal scaling independent of pathogen size above 104 CFU/mL by taking advantage of the simultaneousmeasurement at multiple wavelengths. We can detect contaminants directly, without separation, purification, concentration, orincubation. Our chemistry is stable to ±1% for >3 weeks without refrigeration, and measurements require <5 min.
KEYWORDS: UV absorption, fluorescence, detection, ethylene glycol, diethylene glycol, malaria, food pathogens, Salmonella, E. coli,V. cholera
■ INTRODUCTIONContamination of food, water, medicine, and ingestiblehousehold consumer products is a public health hazard thatepisodically causes thousands of deaths and each year sickensmillions worldwide.1,2 For example, lower cost ethylene glycol(EG) and diethylene glycol (DEG) have been substituted forthe nontoxic glycerol, propylene glycol, and polyethylene glycoloften used in medicines, household products, and foods.3,4
Ingestion of even a small amount of EG or DEG can result incentral nervous system depression, cardiopulmonary compro-mise, and kidney failure.5−8 A longstanding problem that led tothe 1938 Food, Drug and Cosmetic Act established the moderndrug-approval process within the U.S. Food and DrugAdministration (FDA).9 DEG contamination remains a serioushazard today.3 In the past 15 years, episodes of DEG poisoninghave killed hundreds, particularly in developing countries.5,8−21
In addition to chemical poisoning, contamination of food andwater by microbes such as Escherichia coli and Salmonella infood2,22−25 or Vibrio cholera in water26,27 sickens millions (seethe Supporting Information for recent contamination data).Existing laboratory methods to detect many common
relevant chemicals and pathogens (such as GC, MS, opticalspectroscopy, or electrochemistry5,31,33−36) require specializedscientific equipment, a stable laboratory environment, acontinuous refrigeration chain for reagents or antibodies,and/or specially trained staff,28−33 all of which are expensiveand generally preclude their use at the location of an outbreakor natural disaster.34 Any detector for field use should rely on a
simpler, more mechanically robust technology. There has thusbeen an effort to develop field-deployable diagnostictechnologies (e.g., microfluidic, nanotechnology, or surfaceplasmon resonance methods) that can be used outside a stablelaboratory environment. For the past 7 years, this has led tonumerous publications about early-stage technologies.33 How-ever, many of these technologies lack robustness or ease-of-usein the field and are usable for a single disease application only.33
Here we introduce robust chemical methods and a simpleinstrument to rapidly quantify a wide range of chemical andmicrobial contaminations. We employed far-field opticaldetection, which is particularly practical because it does notrequire physical contact with the sample. Instead of using acommercial spectrophotometer, we developed a low-costdetection device to perform our tests (see the SupportingInformation). The device achieves robustness and highsensitivity by concurrently detecting UV absorption andfluorescence. The use of an optical readout allows it to beapplicable for the detection of a range of analytes. In this paper,we focus on the enzyme- and dye-based methods to quantifythe concentration of several chemical contaminants andmicrobial pathogens in a wide range of household products,medicines, foods, and blood components.
Received: February 25, 2012Revised: May 22, 2012Accepted: May 27, 2012Published: May 28, 2012
Article
pubs.acs.org/JAFC
© 2012 American Chemical Society 6349 dx.doi.org/10.1021/jf300817h | J. Agric. Food Chem. 2012, 60, 6349−6358
We developed or procured assays for detecting differentpoisons shown in Table 1. These have been known to appear at
all levels above those deemed safe by the U.S. FDA and theEuropean Community.10,28 We also measured the concen-tration of a range of primary alcohols in water, as alcohol ingroundwater is a sign of gasoline spills or leaks. In addition,using DNA intercalator dyes, we measured the concentration ofpathogenic microorganisms in common food materials thatordinarily contain little DNA, including Salmonella in egg white,E. coli in milk, and V. cholera in water, at levels known to causesymptoms. Finally, we used yeast with a genome sizecomparable to that of Plasmodium and quantified itsconcentration in a hematocyte suspension, as a rudimentarymodel for the detection of blood parasites, such as malaria. It isessential that the assays used work equally well on a range ofhousehold products without background noise causing falsereadings. To compensate for background noise, we tested twosamples.
■ MATERIALS AND METHODSInstrumentation. For detection, we used a detection device made
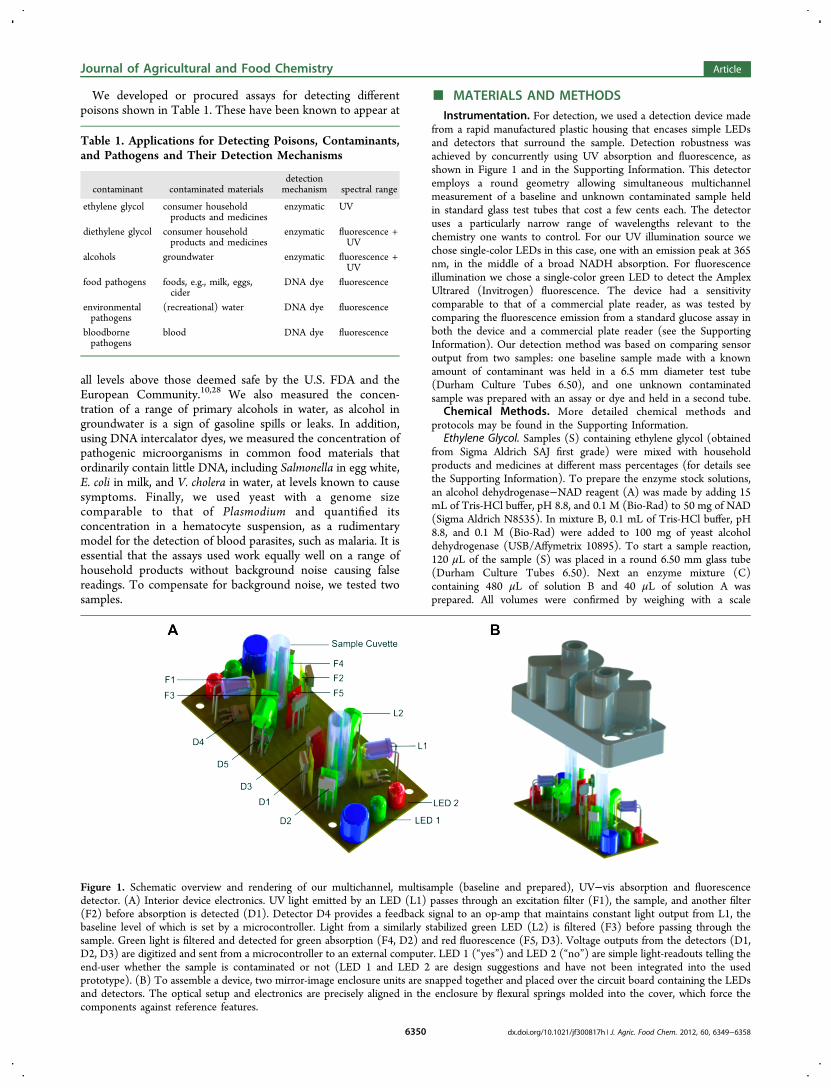
from a rapid manufactured plastic housing that encases simple LEDsand detectors that surround the sample. Detection robustness wasachieved by concurrently using UV absorption and fluorescence, asshown in Figure 1 and in the Supporting Information. This detectoremploys a round geometry allowing simultaneous multichannelmeasurement of a baseline and unknown contaminated sample heldin standard glass test tubes that cost a few cents each. The detectoruses a particularly narrow range of wavelengths relevant to thechemistry one wants to control. For our UV illumination source wechose single-color LEDs in this case, one with an emission peak at 365nm, in the middle of a broad NADH absorption. For fluorescenceillumination we chose a single-color green LED to detect the AmplexUltrared (Invitrogen) fluorescence. The device had a sensitivitycomparable to that of a commercial plate reader, as was tested bycomparing the fluorescence emission from a standard glucose assay inboth the device and a commercial plate reader (see the SupportingInformation). Our detection method was based on comparing sensoroutput from two samples: one baseline sample made with a knownamount of contaminant was held in a 6.5 mm diameter test tube(Durham Culture Tubes 6.50), and one unknown contaminatedsample was prepared with an assay or dye and held in a second tube.
Chemical Methods. More detailed chemical methods andprotocols may be found in the Supporting Information.
Ethylene Glycol. Samples (S) containing ethylene glycol (obtainedfrom Sigma Aldrich SAJ first grade) were mixed with householdproducts and medicines at different mass percentages (for details seethe Supporting Information). To prepare the enzyme stock solutions,an alcohol dehydrogenase−NAD reagent (A) was made by adding 15mL of Tris-HCl buffer, pH 8.8, and 0.1 M (Bio-Rad) to 50 mg of NAD(Sigma Aldrich N8535). In mixture B, 0.1 mL of Tris-HCl buffer, pH8.8, and 0.1 M (Bio-Rad) were added to 100 mg of yeast alcoholdehydrogenase (USB/Affymetrix 10895). To start a sample reaction,120 μL of the sample (S) was placed in a round 6.50 mm glass tube(Durham Culture Tubes 6.50). Next an enzyme mixture (C)containing 480 μL of solution B and 40 μL of solution A wasprepared. All volumes were confirmed by weighing with a scale
Table 1. Applications for Detecting Poisons, Contaminants,and Pathogens and Their Detection Mechanisms
contaminant contaminated materialsdetectionmechanism spectral range
ethylene glycol consumer householdproducts and medicines
enzymatic UV
diethylene glycol consumer householdproducts and medicines
enzymatic fluorescence +UV
alcohols groundwater enzymatic fluorescence +UV
food pathogens foods, e.g., milk, eggs,cider
DNA dye fluorescence
environmentalpathogens
(recreational) water DNA dye fluorescence
bloodbornepathogens
blood DNA dye fluorescence
Figure 1. Schematic overview and rendering of our multichannel, multisample (baseline and prepared), UV−vis absorption and fluorescencedetector. (A) Interior device electronics. UV light emitted by an LED (L1) passes through an excitation filter (F1), the sample, and another filter(F2) before absorption is detected (D1). Detector D4 provides a feedback signal to an op-amp that maintains constant light output from L1, thebaseline level of which is set by a microcontroller. Light from a similarly stabilized green LED (L2) is filtered (F3) before passing through thesample. Green light is filtered and detected for green absorption (F4, D2) and red fluorescence (F5, D3). Voltage outputs from the detectors (D1,D2, D3) are digitized and sent from a microcontroller to an external computer. LED 1 (“yes”) and LED 2 (“no”) are simple light-readouts telling theend-user whether the sample is contaminated or not (LED 1 and LED 2 are design suggestions and have not been integrated into the usedprototype). (B) To assemble a device, two mirror-image enclosure units are snapped together and placed over the circuit board containing the LEDsand detectors. The optical setup and electronics are precisely aligned in the enclosure by flexural springs molded into the cover, which force thecomponents against reference features.
Journal of Agricultural and Food Chemistry Article
dx.doi.org/10.1021/jf300817h | J. Agric. Food Chem. 2012, 60, 6349−63586350
(Mettler Toledo). To start the reaction in our device, 240 μL of C wasadded to each tube containing sample (S). A 5.4 wt % EG sample inbuffer was always run in parallel as a control.Diethylene Glycol and Alcohols. Samples (S) of diethylene glycol
and alcohols at different mass percentages were prepared in Tris-HClbuffer, pH 7.8, and 0.1 M (Bio-Rad). Stock solutions A and B (seeabove) were prepared. In addition, stock solutions of 0.05 wt %Amplex Ultrared in DMSO (solution D), 0.044 wt % horseradishperoxidase type 1 (Sigma Aldrich P8125) in Tris-HCl buffer, pH 7.8,0.1 M (solution E), 12 wt % peroxidase from Enterococcus faecalis(Megazyme, EC 1.11.1.1) in phosphate buffer, pH 6.0, 0.1 M (solutionF), and 0.2 mg/mL flavin adenin dinucleotide (Sigma Aldrich) indeionized water (solution G) were prepared. The final enzyme mixtureH contained 480 μL of solution B, 40 μL of solution A, and 20 μLeach of solutions D, E, F, and G. The reaction was started and read outas described for EG above. For the DEG samples, a reference sampleof 5.4 wt % DEG and for alcohols a sample of 5.4 × 10⁻³ wt % werealways run in the second chamber as a control.Enzyme and pH Optimization. To screen different alcohol
dehydrogenases for their specificity in reacting with DEG, wemeasured the fluorescence product in a plate reader (MolecularDevices) from our assay on 5.4 wt % EG samples in cough syrup andin glycerol, respectively. Pure buffer with one enzyme (USB) was usedas a control. The “relative interference” of each enzyme was measuredby dividing the initial fluorescence and UV reaction gradient of eachsample by the control. The pH of the assay solution was optimized byvarying the buffer pH from 6 to 9 and choosing the pH that gives thehighest signal-to-noise ratio. The use of NADH oxidase instead ofNADH peroxidase made the assay unstable, as NADH oxidasesolution decays within minutes at room temperature (see theSupporting Information for more detailed methods).E. coli, Salmonella, V. cholera Bacteria in Foods and Water. We
grew cultures of E. coli (strain DH5alpha), (Salmonella strain LT2Delta PhoP/Q S typhi), and V. cholera (strain VC O395NT). Bacteriawere stained with 2.5 μM Syto 85 (Invitrogen catalog no. S11366) indeionized water for 3−30 min at 250 rpm and 30 °C in the dark; theresulting solutions of stained bacteria are referred to as samples I. Theconcentration of bacteria in each solution I was measured using theabsorption value at 600 nm (Nanodrop 2000). We also stainedsamples of water (J), milk (K), and egg whites (L) with 2.5 μM Syto85. Water (J) and milk (K) samples were stained directly as describedabove. Egg whites (L) were first diluted at a volume ratio of 1:1 withdeionized water, then vortexed and filtered with a 100 μm filter (BD).The filtrate was centrifuged at 4300 rpm for 5 min, and the pellet wasreconstituted with water at the same volume of the original egg whitesample (L). We now prepared mixtures (M) of stained bacteria (I)with the respective stained products (J, K, and L) at different massfractions. Mass fractions were determined using a scale (MettlerToledo). To optically measure M using our detectors, 360 μL of astained sample mixture M was placed in a round 6.50 mm glass tube(Durham Culture Tubes 6.50). All volumes were confirmed byweighing the samples (Mettler Toledo). A negative, buffer-onlycontrol was run in parallel and measured in the detectors. For SytoxOrange staining, cells were lysed using CelLytic (Sigma Aldrich)reagents and stained with 0.1 μM Sytox Orange (Invitrogen catalogno. S-34861) in TE buffer for 5 min. Further protocols are described inthe Supporting Information, particularly those used for the dyeoptimization procedure.Yeast in Red Blood Cells (Malaria Model). Baker’s yeast (2.86 Mio
yeast cells/mL in distilled water) was stained with 5 μM Syto 85(Invitrogen catlog no. S11366) in deionized water for 5−60 min in thedark. After centrifugation, the bacteria were reconstituted with anequivolume amount of water in 0.5 g/mL sucrose (yielding solutionN). The concentration of bacteria of the resulting solution (N) wasmeasured using the absorption value at 600 nm (Nanodrop 2000).The same procedure was used to stain 2.86 Mio cells/mL bovine redblood cells (Lampire Biologicals 7240807) in sucrose−water, yieldingstained solution O. After cell staining, mixtures P containing thecomponents N and O at different mass fractions were preparedutilizing a scale (Mettler Toledo). For the measurement in our device,
360 μL of a stained sample mixture P (prepared above) was placed in around 6.50 mm glass tube (Durham Culture Tubes 6.50). Thevolumes were confirmed by weighing the samples (Mettler Toledo). Anegative, buffer-only control was run in parallel. For Sytox Orangestaining, cells were lysed using CelLytic (Sigma Aldrich) reagents (seethe Supporting Information) and stained with 0.1 μM Sytox Orange(Invitrogen catalog no. S-34861) in TE buffer for 5 min. Furtherprotocols are described in the Supporting Information, particularlythose used for the dye optimization procedure.
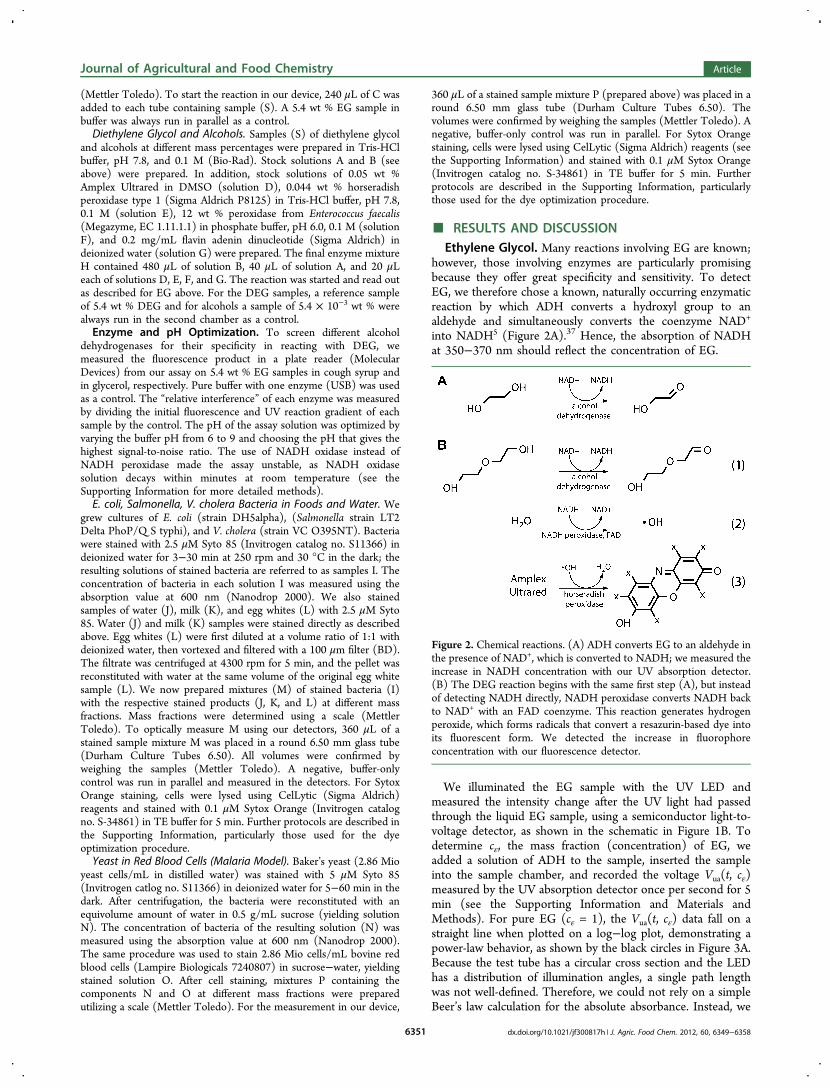
■ RESULTS AND DISCUSSIONEthylene Glycol. Many reactions involving EG are known;
however, those involving enzymes are particularly promisingbecause they offer great specificity and sensitivity. To detectEG, we therefore chose a known, naturally occurring enzymaticreaction by which ADH converts a hydroxyl group to analdehyde and simultaneously converts the coenzyme NAD+
into NADH5 (Figure 2A).37 Hence, the absorption of NADHat 350−370 nm should reflect the concentration of EG.
We illuminated the EG sample with the UV LED andmeasured the intensity change after the UV light had passedthrough the liquid EG sample, using a semiconductor light-to-voltage detector, as shown in the schematic in Figure 1B. Todetermine cε, the mass fraction (concentration) of EG, weadded a solution of ADH to the sample, inserted the sampleinto the sample chamber, and recorded the voltage Vua(t, cε)measured by the UV absorption detector once per second for 5min (see the Supporting Information and Materials andMethods). For pure EG (cε = 1), the Vua(t, cε) data fall on astraight line when plotted on a log−log plot, demonstrating apower-law behavior, as shown by the black circles in Figure 3A.Because the test tube has a circular cross section and the LEDhas a distribution of illumination angles, a single path lengthwas not well-defined. Therefore, we could not rely on a simpleBeer’s law calculation for the absolute absorbance. Instead, we
Figure 2. Chemical reactions. (A) ADH converts EG to an aldehyde inthe presence of NAD+, which is converted to NADH; we measured theincrease in NADH concentration with our UV absorption detector.(B) The DEG reaction begins with the same first step (A), but insteadof detecting NADH directly, NADH peroxidase converts NADH backto NAD+ with an FAD coenzyme. This reaction generates hydrogenperoxide, which forms radicals that convert a resazurin-based dye intoits fluorescent form. We detected the increase in fluorophoreconcentration with our fluorescence detector.
Journal of Agricultural and Food Chemistry Article
dx.doi.org/10.1021/jf300817h | J. Agric. Food Chem. 2012, 60, 6349−63586351

calibrated the device with samples of known cε in water, fromthe FDA safety limit of cε = 10−3 to cε = 1.28 In all cases weobserved lines on the log−log plot, Vua(t, cε) ∼ t−γ(cε), as shownwith colored symbols in Figure 3A. The power-law exponentmagnitudes γ(cε) monotonically increased with cε, as shownwith the blue circles in Figure 3B. An optical feedback loopensured that the LED intensity remained constant irrespectiveof environmental changes. Thus, there are no adjustableparameters in our determination of γ(cε). These datademonstrate our ability to measure cε in drinking water witha detection limit below 0.1 wt % EG, which has caused sicknessand death even in the United States,12 at all concentrationsdeemed unsafe by the FDA.Quantifying cε in water, however, does not itself demonstrate
the effectiveness of our detection methods in real-worldingestible products and medicines. These have a number ofother ingredients that could interfere with the reaction. Inparticular, most products involved in historical EG poisoningincidents normally have a large fraction of glycerol, propyleneglycol, or polyethylene glycol.6,10 These three-carbon glycols
have hydroxyl groups that ADH could, in principle, act upon,altering the measured reaction rate and obscuring the true cε.There are a number of ADH variants commercially available.Although in general they give similar results for cε in water,subtle differences in structure could have a greater impact ontheir relative sensitivity to EG in the presence of other glycols.We expected this sensitivity to be even more relevant for DEG(see below), as it is less reactive than EG due to its longercarbon chain. We hypothesized that we could screen therelative interference from glycols in different ADHs. This wouldallow us to pick the ADH with the least interference fromglycols compared with DEG. To investigate the effects of thesedifferences, we screened five different ADH variants forinterference by mixing DEG with glycerol and, separately,with a mixture containing polyethylene glycol. We thencompared the results of the DEG assay described below tothe same concentration of DEG in water (see Table 8 in theSupporting Information). For our assay we selected theparticular ADH variant (USB/Affymetrix) that exhibited theleast interference, and we used it in all subsequent measure-ments.Using the optimized ADH reaction we detected EG in real-
world scenarios, namely, household products containing glycols(see Figure 3B). We measured samples with different cε in avariety of unmodified ingestible household products, wherecontamination has led to historical poisonings that resulted infatalities: toothpaste, cough syrup, acetaminophen/paracetamolsyrup, and antihistamine (allergy) syrup.10 We chose severalname brands and generics of each type, to ensure a broadsampling, and repeated the measurements in the same way asfor water. Using the optimized ADH assay we found that γ(cε)increases monotonically with cε, as in the pure case shown inFigure 3A. We also observed that the numerical values of γ(cε)remain consistent irrespective of the product tested, as shownwith colored symbols in Figure 3B. Each data point is the resultof a single measurement. We observed that all data from allproducts collapse onto a single master curve (with a standarderror of 2.58%), which we indicate with a black line in thefigure. By optimizing the ADH enzyme variants, we removedany interference from other glycols normally present in theproducts. This enabled us to achieve universal scaling, with nofree-fitting parameters, for all products. Our enzyme methodcan quantify cε at all unsafe levels above the FDA limit of 0.1 wt%, in all real products involved in historical contaminationincidents. Our results furthermore suggest that the methodcould work well even in products in which EG contaminationhas not yet been observed.
Diethylene Glycol. Like EG, DEG poisoning has also killedthousands.4−21 We therefore repeated the ADH measurementsfor different DEG concentrations cδ in water, expecting it to beless reactive because of the longer carbon chain of DEGcompared to EG. Experimentally, we observed DEG to havesignificantly lower ADH activity, so that we could notdistinguish low concentrations of DEG with this simple UVabsorption assay alone. We therefore decided to amplify theDEG reaction products by adding enzymatic steps involvingfluorescence-based dyes. Fluorescent dyes principally shouldhave a higher signal-to-noise ratio than absorption. Beginningwith the ADH reaction, we hence reacted the NADH productwith NADH peroxidase and FAD, which generates free radicalsthat, in the presence of horseradish peroxidase, converts anessentially nonfluorescent resazurin-based dye into a resorufin-based fluorophore,38 as shown in Figure 1B. However, the pH
Figure 3. Detection of ethylene glycol contamination using UVabsorption. (A) Time evolution of output voltage Vua(t) from the UVdetectors, digitized as 16-bit integer, is shown on a log−log plot withsymbols for different EG concentrations cε in water. The data fall ontoa straight line for each sample, demonstrating power-law scaling. (B)The magnitude of the slope of each line γ(cε) varies monotonicallywith cε, shown with blue circles for pure EG. The γ(cε) values for avariety of different household products (colored triangles) andantifreeze (squares) all fall onto the same master curve, shown inblack as a guide to the eye, demonstrating a universal scaling of thismeasure of EG concentration, irrespective of product contaminated.FDA safety limit cε = 10−3 is indicated with a black vertical line. EGconcentrations of historical epidemics are indicated with bars, thecolor of which indicates the type of product contaminated, followingthe same color scheme as the data points; the number of deaths ineach incident is represented by the height of the bar, indicated on theright-hand vertical axis.
Journal of Agricultural and Food Chemistry Article
dx.doi.org/10.1021/jf300817h | J. Agric. Food Chem. 2012, 60, 6349−63586352

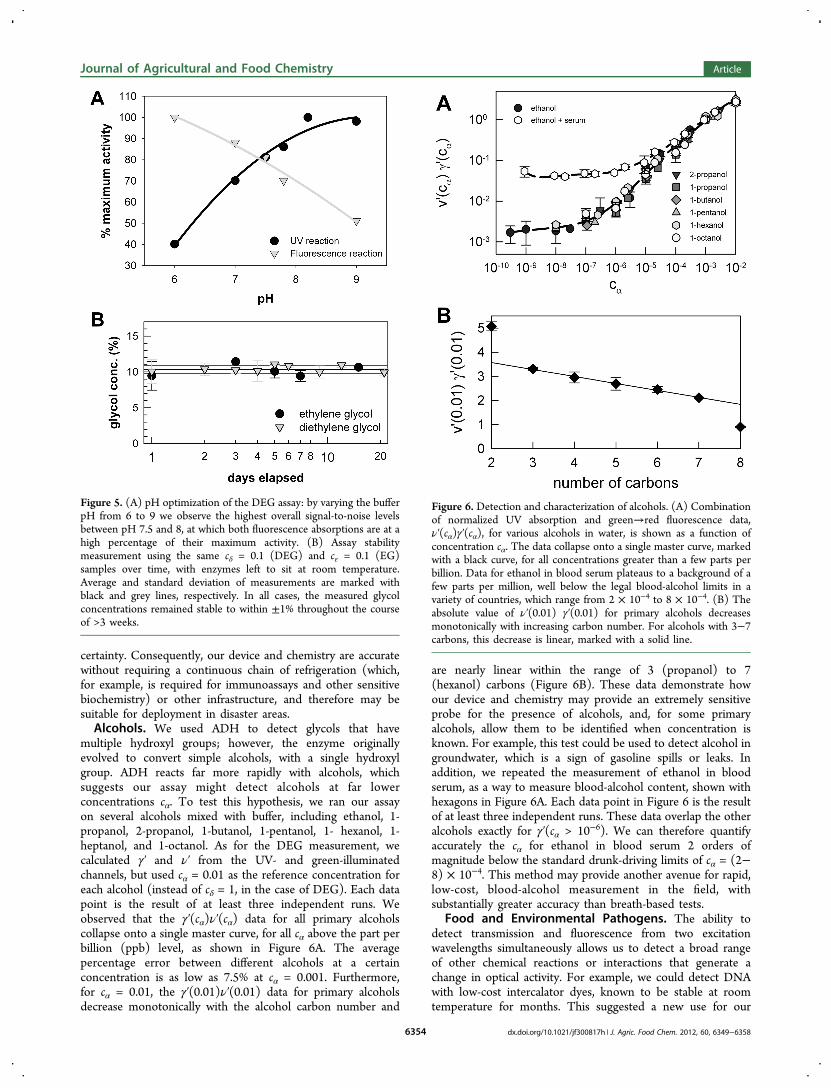
for maximum activity differs significantly for the differentcomponents in the reaction chain: ADH is most active at pH≥8; NADH peroxidase at pH 5; HRP at pH 6−6.5; and NADand FAD at pH 7. It was therefore not obvious that theseparticular steps could be coupled at a single fixed pH and stillresult in detectable fluorophore generation. We investigatedthis possibility by running the complete reaction chain under avariety of pH conditions (Figure 5A). We found the greatestamount of activity at pH 7.8, which we used for all subsequentmeasurements. We used NADH peroxidase, rather than NADHoxidase, as the latter solution is unstable and decays withinminutes at room temperature (see the Suppporting Informa-tion).Under the optimized assay conditions, a cδ = 1 sample
produced a visible red color change in a few minutes, whereas acδ = 0 did not. This result demonstrated, at least qualitatively,the success of the reaction chain in the presence of DEG.To more precisely quantify the progress of this reaction, we
added a green LED spaced 60° from the UV LED forexcitation, and two additional light detectors, using differentlycolored theater gel plastic to filter the green absorption and redfluorescence, were placed at 180° and 60°, respectively, relativeto the green LED. The round geometry of the sample chamber,as well as offsetting the UV and fluorescence LED activation,made this addition possible, without interfering with theexisting UV detection scheme. We could thus measureabsorption and fluorescence with two excitation wavelengths,which is not possible with a common square cuvette geometrytraditionally found in laboratory fluorometers and spectropho-tometers.To measure cδ in water, we mixed the enzymes and dye into
the sample and immediately collected voltage data over timefrom the green and red fluorescence detector, Vgf (t,cδ). As thereaction proceeded, the increase in fluorescence was manifestedas an increase in Vgf (t,cδ). These data fall onto a straight linewhen plotted on a semilog plot, demonstrating the exponentialfunctional form Vgf (t,cδ) ∼ eν(cδ)t as shown in Figure 4A. Wefound that the slope of this line, ν(cδ), increases monotonicallywith cδ. However, our reaction involves the coupling of threeenzymes and a dye, all of which may have slight variations inactivity due to environmental factors, which could significantlyinfluence ν(cδ). To account for these variations, we utilized thesecond, identical sample chamber of the sensor to simulta-neously run a 100% DEG sample as a standard reference. Usingνδ
1 ≡ ν(cδ = 1), as a normalization constant, we used thenormalized ν′(cδ) = ν (cδ)/ν
1δ to account partially for the effects
of variation in total enzyme activity. Furthermore, whilecollecting Vgf(t,cδ), the device also collected Vua(t,cδ) automati-cally. These UV data should be sensitive only to the activity ofthe ADH. Therefore, we calculated the quantity γ′(cδ) ≡ γ(cδ)/γ(cδ = 1), which provides a correction for the variations inabsolute ADH activity. Combining the fitted data from the UV-and green-illuminated channels, we observed that ν′(cδ)γ′(cδ)rises monotonically with cδ for DEG in water at all cδ > 0.001,the FDA safety limit, as shown in Figure 4B. Each data point inFigure 4B is the result of at least three independent runs, thepercentage errors of which decrease with increasing cδ. Thepercentage errors are on average 10%, and as low as 3.1% for cδ= 0.25. As in the EG case, we repeated the measurements forDEG in various household products: once again, we found thatthe data for some products collapse onto a single curve,although with slightly more scatter than in the EG case, asshown in Figure 4B. The scatter at each data point decreases
from 33 to 1.5% as cδ increases from 0.001 to 1. These datademonstrate our ability to detect DEG, just as for EG, in severalingestible household products and medicines.The ability to detect these contaminants in remote areas
would be greatly enhanced if the chemistry were stable withoutrefrigeration. Indeed, the enzymes and dyes we used arepackaged in dry, lyophilized form and can be shipped overnightwithout temperature control. How long the activities of thesecomponents remain consistent, however, is not well charac-terized. To test the longer term stability of our assays, wecreated large samples with cδ = 0.10 and cε = 0.10 and, over thecourse of several weeks, left all samples, and lyophilizedenzymes and dyes, at room temperature, without anytemperature control. For each measurement, we made a newenzyme solution and ran the EG and DEG assays. Strikingly, inall cases, the absolute variation in the measured glycolconcentrations was <±1%, even as the enzymes were at roomtemperature for >3 weeks, as shown in Figure 5B. These datademonstrate that our approach to normalizing variations by acombination of LED output stabilization, calibration withreference samples at known concentrations, and combiningdata from multiple channels allowed us to eliminate anychanges in enzyme activity within our measurement un-
Figure 4. Detection of diethylene glycol using a combination ofgreen→red fluorescence and UV absorption. (A) Time evolution ofoutput voltage Vgf(t) from the green→red fluorescence detector,digitized as 16-bit integer, is shown on a semilog plot with symbols fordifferent DEG concentrations in water; the data fall onto a straight linefor each sample, indicating exponential behavior. (B) Combination ofnormalized UV absorption and green→red fluorescence data,ν′(cδ)γ′(cδ), is shown with solid black circles for DEG in water; datafor other ingestible household products (other symbols) fall on thesame master curve (dashed line).
Journal of Agricultural and Food Chemistry Article
dx.doi.org/10.1021/jf300817h | J. Agric. Food Chem. 2012, 60, 6349−63586353
certainty. Consequently, our device and chemistry are accuratewithout requiring a continuous chain of refrigeration (which,for example, is required for immunoassays and other sensitivebiochemistry) or other infrastructure, and therefore may besuitable for deployment in disaster areas.Alcohols. We used ADH to detect glycols that have
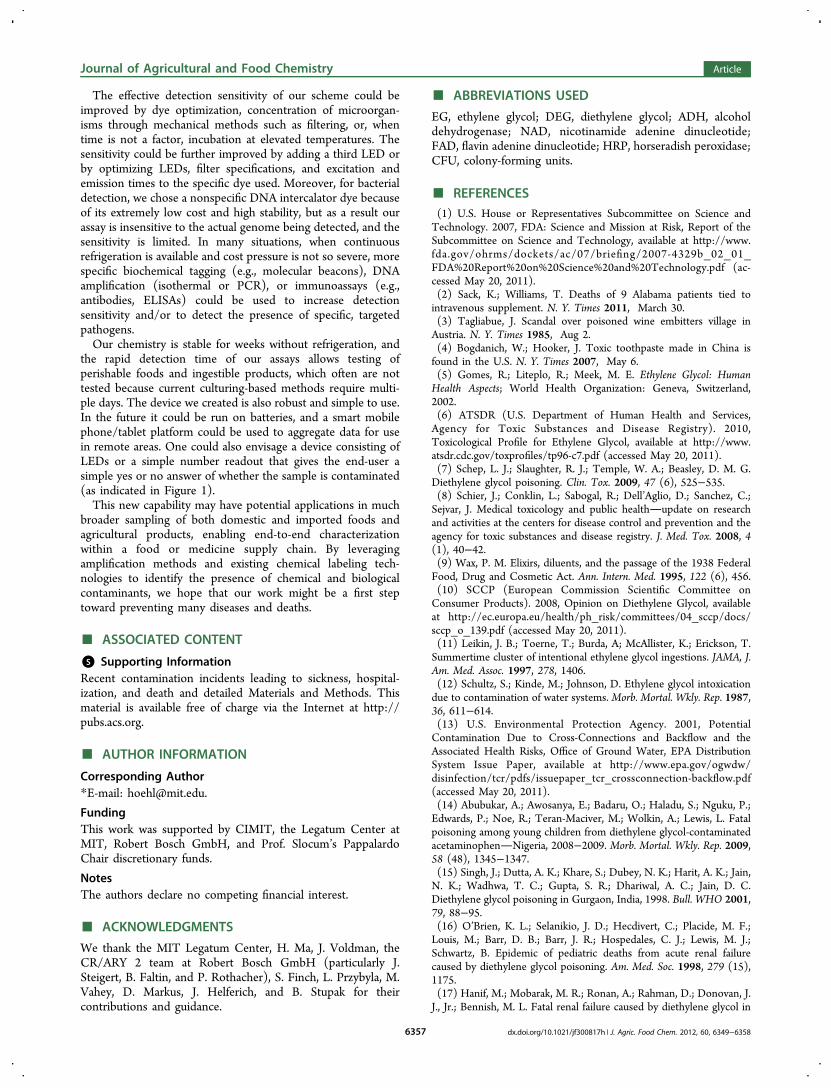
multiple hydroxyl groups; however, the enzyme originallyevolved to convert simple alcohols, with a single hydroxylgroup. ADH reacts far more rapidly with alcohols, whichsuggests our assay might detect alcohols at far lowerconcentrations cα. To test this hypothesis, we ran our assayon several alcohols mixed with buffer, including ethanol, 1-propanol, 2-propanol, 1-butanol, 1-pentanol, 1- hexanol, 1-heptanol, and 1-octanol. As for the DEG measurement, wecalculated γ′ and ν′ from the UV- and green-illuminatedchannels, but used cα = 0.01 as the reference concentration foreach alcohol (instead of cδ = 1, in the case of DEG). Each datapoint is the result of at least three independent runs. Weobserved that the γ′(cα)ν′(cα) data for all primary alcoholscollapse onto a single master curve, for all cα above the part perbillion (ppb) level, as shown in Figure 6A. The averagepercentage error between different alcohols at a certainconcentration is as low as 7.5% at cα = 0.001. Furthermore,for cα = 0.01, the γ′(0.01)ν′(0.01) data for primary alcoholsdecrease monotonically with the alcohol carbon number and
are nearly linear within the range of 3 (propanol) to 7(hexanol) carbons (Figure 6B). These data demonstrate howour device and chemistry may provide an extremely sensitiveprobe for the presence of alcohols, and, for some primaryalcohols, allow them to be identified when concentration isknown. For example, this test could be used to detect alcohol ingroundwater, which is a sign of gasoline spills or leaks. Inaddition, we repeated the measurement of ethanol in bloodserum, as a way to measure blood-alcohol content, shown withhexagons in Figure 6A. Each data point in Figure 6 is the resultof at least three independent runs. These data overlap the otheralcohols exactly for γ′(cα > 10−6). We can therefore quantifyaccurately the cα for ethanol in blood serum 2 orders ofmagnitude below the standard drunk-driving limits of cα = (2−8) × 10−4. This method may provide another avenue for rapid,low-cost, blood-alcohol measurement in the field, withsubstantially greater accuracy than breath-based tests.
Food and Environmental Pathogens. The ability todetect transmission and fluorescence from two excitationwavelengths simultaneously allows us to detect a broad rangeof other chemical reactions or interactions that generate achange in optical activity. For example, we could detect DNAwith low-cost intercalator dyes, known to be stable at roomtemperature for months. This suggested a new use for our
Figure 5. (A) pH optimization of the DEG assay: by varying the bufferpH from 6 to 9 we observe the highest overall signal-to-noise levelsbetween pH 7.5 and 8, at which both fluorescence absorptions are at ahigh percentage of their maximum activity. (B) Assay stabilitymeasurement using the same cδ = 0.1 (DEG) and cε = 0.1 (EG)samples over time, with enzymes left to sit at room temperature.Average and standard deviation of measurements are marked withblack and grey lines, respectively. In all cases, the measured glycolconcentrations remained stable to within ±1% throughout the courseof >3 weeks.
Figure 6. Detection and characterization of alcohols. (A) Combinationof normalized UV absorption and green→red fluorescence data,ν′(cα)γ′(cα), for various alcohols in water, is shown as a function ofconcentration cα. The data collapse onto a single master curve, markedwith a black curve, for all concentrations greater than a few parts perbillion. Data for ethanol in blood serum plateaus to a background of afew parts per million, well below the legal blood-alcohol limits in avariety of countries, which range from 2 × 10⁻⁴ to 8 × 10⁻⁴. (B) Theabsolute value of ν′(0.01) γ′(0.01) for primary alcohols decreasesmonotonically with increasing carbon number. For alcohols with 3−7carbons, this decrease is linear, marked with a solid line.
Journal of Agricultural and Food Chemistry Article
dx.doi.org/10.1021/jf300817h | J. Agric. Food Chem. 2012, 60, 6349−63586354

system, the detection of microbial DNA, which implies thepresence of its host organism, in materials where no DNAshould be found, such as recreational water and many foods,where contamination has led to lethal epidemics. To test ourability to detect such microbial contamination, we mixeddifferent microbial concentrations cμ of V. cholera, Salmonella,and E. coli bacteria in water, added a DNA intercalator dye,removed free dye, and then measured the final, static green−redfluorescence intensity Vgf
∞(cμ) Vgf∞(t→∞,cμ). The total
preparation and measurement time was only a few minutes.In both cases, we found that Vgf
∞(cμ) rises with cμ > 105 CFU/mL (CFU = colony-forming units), with a readily discernibledetection limit of 106 CFU/mL (based on Kaiser’s criterion, seethe Supporting Information). Our minimum detectable cμ iscomparable to total organism concentrations detected in severalhistorical epidemics.39,40 Furthermore, we tested the concen-tration of pathogens in pond water (Bow, NH) and measured abaseline activity indistinguishable from background levels indoubly distilled water. These data demonstrate the utility of ourmethod to potentially preventing recreational water epidemics,when fast turn-around times may be desirable. Even though themethods introduced here can detect bacteria at concentrationsfound in several historical epidemics,39,40 lower detection limitsmay be desirable because the presence of as low as 10 cells ofSalmonella or E. coli O157:H7 may be an infectious dose.41 TheEPA recommendation for recreational waters is around 1 CFU/mL,42 even though higher detection limits may be acceptable,especially when fast turn-around times are needed. To increasedetection sensitivity, we optimized the fluorescent dyes andused lysed cells rather than whole cells, where the DNA isexpected to be more accessible to the dyes. As shown in Figure8 we achieved a readily discernible detection limit of cμ = 104
CFU/mL (based on Kaiser’s criterion) by lysing the cells andusing the DNA dye Sytox Orange rather than Syto 85. SytoxOrange was chosen, as it is compatible with the current opticalsetup of the device. Further optimization of dyes and lysisconditions could improve this detection limit even more (seethe Supporting Information, part G).Another major area where DNA should not be present is in
foods that do not contain cellular tissue from animals or plants.Many of these, such as milk and eggs, have been involved inmassive food poisoning outbreaks when contaminated bybacteria such as E. coli or Salmonella.22,25 Unlike drinking water,however, these complex biological materials contain othercomponents with the potential to interfere with the DNAintercalator dyes. To test our ability to quantify microbialcontamination in these materials, we repeated the aboveprocedure with E. coli in milk and Salmonella in egg white,combinations that have caused lethal food poisonings in thepast. Once again, in both cases, Vgf
∞(cμ) rose with cμ. However,the curves of Vgf
∞(cμ) for the four bacterial data sets did notoverlap on the same curve, possibly due to differences inautofluorescence of the materials and foods. With a traditionalfluorometer, little could be done without further samplemodifications. The multichannel design of our detector,however, gave us a number of additional options, because wealso collected automatically the final, static green absorptionVgf∞(cμ) and UV→ red fluorescence Vuf
∞(cμ). We searched forcombinations of channel metrics for which all four bacteriacollapsed onto the same master curve. By trial, we founduniversal data collapse for the normalized multichannel metricVgf∞(cμ)((Vuf
∞(cμ)·Vga∞(cμ)))
1/2, as shown in Figure 7A. Again,using Syto 85 we found that Vgf
∞(cμ)((Vuf∞(cμ)Vga
∞(cμ)))1/2 rises
with cμ > 105 CFU/ml, with a readily discernible detection limitof 106 CFU/ml (Kaiser’s criterion). Given the similar spectralcharacteristics, we expect that using Sytox Orange wouldfurther reduce the detection limit to cμ ∼ 104 CFU/mL as inthe case of pure bacteria shown in Figure 8.These data demonstrate how our device can be used in a
general way to measure microbial concentration in substratesthat should not contain DNA, irrespective of particular bacteriaor substrate. This is particularly important in foods andmedicines, in which a wide range of bacteria are known to causepoisoning.25,26 We emphasize that our measurements weretaken directly on samples and require only a few minutes of dyeexposure. Our results were unchanged over various dyeincubation times from 3 to 30 min (see the SupportingInformation), in contrast to the hours or days required forculturing or PCR analysis.36 Our detection limit of 104 CFU/mL is comparable to most electrical, electrochemical (e.g.,impedance, DEP), and immunochemical biosensors, whichusually have detection limits between 103 and 105 CFU/mLwith an assay time of at least 2 h under ideal conditions.43−47
Other optical methods (e.g., SPR, IR, optical fibers, etc.) mayachieve even lower detection limits, but often require several
Figure 7. Detection of microbial contamination. (A) Combinednormalized multichannel data Vgf
∞(cμ)((Vuf∞(cμ)Vga
∞(cμ)))1/2 from DNA
intercalator dye in the presence of prokaryotic pathogens at differentconcentrations cμ. In all cases, the data from V. cholera in water, E. coliin water and in milk, and Salmonella in egg white all collapse onto thesame master curve (dotted line). This demonstrates universal, species-independent behavior of our bacterial detection scheme. (B)Rudimentary model for the detection of eukaryotic blood parasites,such as malaria. Combined normalized multichannel data Vgf
∞(cμ)/Vga∞(cμ)
3 for dyed yeast both in water (black triangles) and in red bloodcells (inverted gray triangles) scale onto the same master curve (dottedline), and at low concentration plateau to the background sample ofred blood cells alone (circles).
Journal of Agricultural and Food Chemistry Article
dx.doi.org/10.1021/jf300817h | J. Agric. Food Chem. 2012, 60, 6349−63586355

hours43 and/or cost around 2 orders of magnitude more thanthe sensor described here.41,48 Traditional methods (such ascell culture, PCR, or ELISAs) have lower detection limitsbetween 101 and 106 CFU/mL. However, they requireincubation of several hours (PCR 4−6 h) to days (culturemethods up to 5−7 days), as well as a stable laboratoryenvironment often in combination with expensive equipment.41
The introduced detection scheme may therefore be used as asimple, low-cost, first screen and line of defense for pathogencontamination in a range of consumer products, recreationalwater, medicines, and food products.Bloodborne Pathogens (e.g. Malaria). In addition to
prokaryotes, we could apply the same method to a eukaryoticbiological system in which the presence of DNA indicates thepresence of pathogenic microbial invasion. Several bloodbornepathogens, for example, malaria-causing plasmodium, invade
red blood cells (RBCs), which have no DNA of their own.Moreover, RBCs can be separated from other DNA-bearingcells in blood using existing low-cost methods.49 It might thusbe possible for our methodology to detect this type of parasiticblood infection. To test this concept qualitatively, we created arudimentary model for malarial invasion by dyeing suspensionsof yeast with Syto 85, which we chose because they are safe tohandle and have a total genome size about half that ofplasmodium. We dyed yeast both in water and mixed with redblood cells as a model for malaria. After a brief incubation, wemeasured fluorescence and absorption, following the protocolas for bacteria. As in the bacterial case, when using fluorescenceor absorption alone, different data sets scaled differently. Inparticular, the data for yeast in RBCs did not overlap that foryeast in water. We therefore combined the different parametersuntil we achieved universal data collapse. We found that, whennormalizing the green→red fluorescence intensity by the cubeof the green absorption, Vgf
∞(cμ)/Vga∞(cμ)
3, the data from bothsets fell onto the same curveand at low concentrationsasymptote to the baseline value we measure for RBCs alone, asshown in Figure 7B. Again, using Syto 85 we found thatVgf∞(cμ)/Vga
∞(cμ)3 rises with cμ at a detection limit of cμ > 8 × 10⁵
CFU/mL (based on Kaiser’s criterion). The detection limitcould again be improved by using lysed cells and the DNA−dyeSytox Orange instead of Syto 85. We therefore stained pure,lysed yeast cells with Sytox Orange and achieved a detectionlimit of cμ ∼104 CFU/mL as for the tested bacteria (see Figure8B). These preliminary data demonstrate that the intercalatorhas no significant background interference from residual RNAor ribosomal nucleotides in the RBCs. Therefore, our methodhas the potential to quantify rapidly in RBC suspensions theconcentration of bloodborne DNA-bearing parasites, such asplasmodium (malaria), trypanosoma (sleeping sickness andchagas), and the eggs of trematodes (schistosomiasis).In this paper, contaminants were detected directly in various
substances, without separation, purification, concentration, orincubation. New enzyme- and dye-based methods to detect(di)ethylene glycol in consumables above 0.1 wt % withoutinterference and alcohols above 1 ppb were introduced. UsingDNA intercalating dyes a range of pathogens in water, foods,and blood were detected without background signal at adetection limit of 104 CFU/mL. The detection scheme usesfluorescence and/or UV absorption measurements made onsamples in a small round test tube. Our simple system makespractical the multiple channels and samples that allow us tonormalize by references and combine data from differentsimultaneous measurements. The individual channels withinour detector have sensitivities comparable to commercialoptical laboratory instruments costing significantly more. Inaddition, contaminant concentrations we measured did notchange with background substrate, which demonstrates that ourdetection methods are broadly effective in a wide variety ofsubstances, and could apply in a general way to new substanceswhere contamination might not yet have been found.We emphasize that we have but scratched the surface of this
exciting area, and our preliminary results can be improved andextended in many ways. We have examined a limited number ofcontaminants, but our strategy should be applicable to anychemical reaction that in the presence of a contaminant leads toa change in optical activity. For example, commercial kits areavailable that use a fluorescence-generating reaction to detectmelamine in milk products.
Figure 8. Dye optimization. (A) Comparison of Sytox Orange andSyto 85 detection limits. Shown are the combined normalizedmultichannel data Vgf
∞(cμ)((Vuf∞(cμ)Vga
∞(cμ)))1/2 from DNA intercalator
dyes in the presence of E. coli cells at different concentrations cμ. UsingSytox Orange with lysed E. coli cells improves the detection limit to cμ= 104 CFU/mL, compared with 106 CFU/mL in Syto 85. (B)Validation of Sytox Orange staining for different bacteria (Salmonella,V. cholera, E. coli) and yeast. This graph shows Sytox Orange stainedlysed bacteria and lysed yeast cells at different concentrationsmeasured in a plate reader (the sensitivity of which is comparable tothe used device, see the Supporting Information). The fluorescencevalues are normalized by the pathogen genome size and are theaverages of three independent runs. A detection limit of cμ = 104 CFU/mL (based on Kaiser’s 3δ criterion) was achieved for all bacteria,demonstrating that Sytox Orange will improve the detection limit forall tested pathogens.
Journal of Agricultural and Food Chemistry Article
dx.doi.org/10.1021/jf300817h | J. Agric. Food Chem. 2012, 60, 6349−63586356
The effective detection sensitivity of our scheme could beimproved by dye optimization, concentration of microorgan-isms through mechanical methods such as filtering, or, whentime is not a factor, incubation at elevated temperatures. Thesensitivity could be further improved by adding a third LED orby optimizing LEDs, filter specifications, and excitation andemission times to the specific dye used. Moreover, for bacterialdetection, we chose a nonspecific DNA intercalator dye becauseof its extremely low cost and high stability, but as a result ourassay is insensitive to the actual genome being detected, and thesensitivity is limited. In many situations, when continuousrefrigeration is available and cost pressure is not so severe, morespecific biochemical tagging (e.g., molecular beacons), DNAamplification (isothermal or PCR), or immunoassays (e.g.,antibodies, ELISAs) could be used to increase detectionsensitivity and/or to detect the presence of specific, targetedpathogens.Our chemistry is stable for weeks without refrigeration, and
the rapid detection time of our assays allows testing ofperishable foods and ingestible products, which often are nottested because current culturing-based methods require multi-ple days. The device we created is also robust and simple to use.In the future it could be run on batteries, and a smart mobilephone/tablet platform could be used to aggregate data for usein remote areas. One could also envisage a device consisting ofLEDs or a simple number readout that gives the end-user asimple yes or no answer of whether the sample is contaminated(as indicated in Figure 1).This new capability may have potential applications in much
broader sampling of both domestic and imported foods andagricultural products, enabling end-to-end characterizationwithin a food or medicine supply chain. By leveragingamplification methods and existing chemical labeling tech-nologies to identify the presence of chemical and biologicalcontaminants, we hope that our work might be a first steptoward preventing many diseases and deaths.
■ ASSOCIATED CONTENT
*S Supporting InformationRecent contamination incidents leading to sickness, hospital-ization, and death and detailed Materials and Methods. Thismaterial is available free of charge via the Internet at http://pubs.acs.org.
■ AUTHOR INFORMATION
Corresponding Author*E-mail: [email protected].
FundingThis work was supported by CIMIT, the Legatum Center atMIT, Robert Bosch GmbH, and Prof. Slocum’s PappalardoChair discretionary funds.
NotesThe authors declare no competing financial interest.
■ ACKNOWLEDGMENTS
We thank the MIT Legatum Center, H. Ma, J. Voldman, theCR/ARY 2 team at Robert Bosch GmbH (particularly J.Steigert, B. Faltin, and P. Rothacher), S. Finch, L. Przybyla, M.Vahey, D. Markus, J. Helferich, and B. Stupak for theircontributions and guidance.
■ ABBREVIATIONS USED
EG, ethylene glycol; DEG, diethylene glycol; ADH, alcoholdehydrogenase; NAD, nicotinamide adenine dinucleotide;FAD, flavin adenine dinucleotide; HRP, horseradish peroxidase;CFU, colony-forming units.
■ REFERENCES(1) U.S. House or Representatives Subcommittee on Science andTechnology. 2007, FDA: Science and Mission at Risk, Report of theSubcommittee on Science and Technology, available at http://www.fda.gov/ohrms/dockets/ac/07/briefing/2007-4329b_02_01_FDA%20Report%20on%20Science%20and%20Technology.pdf (ac-cessed May 20, 2011).(2) Sack, K.; Williams, T. Deaths of 9 Alabama patients tied tointravenous supplement. N. Y. Times 2011, March 30.(3) Tagliabue, J. Scandal over poisoned wine embitters village inAustria. N. Y. Times 1985, Aug 2.(4) Bogdanich, W.; Hooker, J. Toxic toothpaste made in China isfound in the U.S. N. Y. Times 2007, May 6.(5) Gomes, R.; Liteplo, R.; Meek, M. E. Ethylene Glycol: HumanHealth Aspects; World Health Organization: Geneva, Switzerland,2002.(6) ATSDR (U.S. Department of Human Health and Services,Agency for Toxic Substances and Disease Registry). 2010,Toxicological Profile for Ethylene Glycol, available at http://www.atsdr.cdc.gov/toxprofiles/tp96-c7.pdf (accessed May 20, 2011).(7) Schep, L. J.; Slaughter, R. J.; Temple, W. A.; Beasley, D. M. G.Diethylene glycol poisoning. Clin. Tox. 2009, 47 (6), 525−535.(8) Schier, J.; Conklin, L.; Sabogal, R.; Dell’Aglio, D.; Sanchez, C.;Sejvar, J. Medical toxicology and public healthupdate on researchand activities at the centers for disease control and prevention and theagency for toxic substances and disease registry. J. Med. Tox. 2008, 4(1), 40−42.(9) Wax, P. M. Elixirs, diluents, and the passage of the 1938 FederalFood, Drug and Cosmetic Act. Ann. Intern. Med. 1995, 122 (6), 456.(10) SCCP (European Commission Scientific Committee onConsumer Products). 2008, Opinion on Diethylene Glycol, availableat http://ec.europa.eu/health/ph_risk/committees/04_sccp/docs/sccp_o_139.pdf (accessed May 20, 2011).(11) Leikin, J. B.; Toerne, T.; Burda, A; McAllister, K.; Erickson, T.Summertime cluster of intentional ethylene glycol ingestions. JAMA, J.Am. Med. Assoc. 1997, 278, 1406.(12) Schultz, S.; Kinde, M.; Johnson, D. Ethylene glycol intoxicationdue to contamination of water systems. Morb. Mortal. Wkly. Rep. 1987,36, 611−614.(13) U.S. Environmental Protection Agency. 2001, PotentialContamination Due to Cross-Connections and Backflow and theAssociated Health Risks, Office of Ground Water, EPA DistributionSystem Issue Paper, available at http://www.epa.gov/ogwdw/disinfection/tcr/pdfs/issuepaper_tcr_crossconnection-backflow.pdf(accessed May 20, 2011).(14) Abubukar, A.; Awosanya, E.; Badaru, O.; Haladu, S.; Nguku, P.;Edwards, P.; Noe, R.; Teran-Maciver, M.; Wolkin, A.; Lewis, L. Fatalpoisoning among young children from diethylene glycol-contaminatedacetaminophenNigeria, 2008−2009. Morb. Mortal. Wkly. Rep. 2009,58 (48), 1345−1347.(15) Singh, J.; Dutta, A. K.; Khare, S.; Dubey, N. K.; Harit, A. K.; Jain,N. K.; Wadhwa, T. C.; Gupta, S. R.; Dhariwal, A. C.; Jain, D. C.Diethylene glycol poisoning in Gurgaon, India, 1998. Bull. WHO 2001,79, 88−95.(16) O’Brien, K. L.; Selanikio, J. D.; Hecdivert, C.; Placide, M. F.;Louis, M.; Barr, D. B.; Barr, J. R.; Hospedales, C. J.; Lewis, M. J.;Schwartz, B. Epidemic of pediatric deaths from acute renal failurecaused by diethylene glycol poisoning. Am. Med. Soc. 1998, 279 (15),1175.(17) Hanif, M.; Mobarak, M. R.; Ronan, A.; Rahman, D.; Donovan, J.J., Jr.; Bennish, M. L. Fatal renal failure caused by diethylene glycol in
Journal of Agricultural and Food Chemistry Article
dx.doi.org/10.1021/jf300817h | J. Agric. Food Chem. 2012, 60, 6349−63586357
paracetamol elixir: the Bangladesh epidemic. Br. Med. J. 1995, 311(6997), 88.(18) Okuonghae, H. O.; Ighogboja, I. S.; Lawson, J. O.; Nwana, E. J.Diethylene glycol poisoning in Nigerian children. Ann. Trop. Paediatr.1992, 12 (3), 235.(19) Pandya, S. K. Letter from Bombay. An unmitigated tragedy. Br.Med. J. 1988, 297 (6641), 117.(20) Wax, P. M. It’s happening againanother diethylene glycolmass poisoning. Clin. Toxicol. 1996, 34 (5), 517−520.(21) Osterberg, R. E.; See, N. A. Toxicity of excipientsa Food andDrug Administration perspective. Int. J. Toxicol. 2003, 22 (5), 377.(22) Scallan, E.; Hoekstra, R. M.; Angulo, F. J.; Tauxe, R. V.;Widdowson, M. A.; Roy, S. L.; Jones, J. L.; Griffin, P. M. Foodborneillness acquired in the United Statesmajor pathogens. Emerg. Infect.Dis. 2011, 17, 7.(23) CDC (Centers for Disease Control and Prevention). 2011,Salmonella Outbreaks, available at http://www.cdc.gov/salmonella/outbreaks.html (accessed May 20, 2011).(24) CDC (Centers for Disease Control and Prevention). 2011,Outbreak Investigation of E. coli, available at http://www.cdc.gov/ecoli/outbreaks.html (accessed May 20, 2011).(25) Mead, P. S.; Slutsker, L.; Dietz, V.; McCaig, L. F.; Bresee, J. S.;Shapiro, C.; Griffin, P. M.; Tauxe, R. V. Food-related illness and deathin the United States. Emerg. Infect. Dis. 1999, 5 (5), 607.(26) Griffith, D. C.; Kelly-Hope, L. A.; Miller, M. A. Review ofreported cholera outbreaks worldwide, 1995−2005. Am. J. Trop. Med.Hyg. 2006, 75 (5), 973.(27) Theron, J.; Cilliers, J.; Du Preez, M.; Brozel, V. S.; Venter, S. N.Detection of toxigenic Vibrio cholerae from environmental watersamples by an enrichment broth cultivation−pit stop semi nested PCRprocedure. J. Appl. Microbiol. 2000, 89 (3), 539−546.(28) U.S. Food and Drug Administration. 2010, Guidance forIndustry: Testing of Glycerin for Diethylene Glycol, available ath t t p : / / w w w . f d a . g o v / d o w n l o a d s / D r u g s /GuidanceComplianceRegulatoryInformation/Guidances/ucm070347.pdf (accessed May 20, 2011).(29) Leonard, P.; Hearty, S.; Brennan, J.; Dunne, L.; Quinn, J.;Chakraborty, T.; O’Kennedy, R. Advances in biosensors for detectionof pathogens in food and water. Enzyme Microb. Technol. 2003, 32 (1),3−13.(30) Nugen, S. R.; Baeumner, A. J. Trends and opportunities in foodpathogen detection. Anal. Bioanal. Chem. 2008, 391 (2), 451−454.(31) Velusamy, V.; Arshak, K.; Korostynska, O.; Oliwa, K.; Adley, C.An overview of foodborne pathogen detection: in the perspective ofbiosensors. Biotechnol. Adv. 2010, 28 (2), 232−254.(32) Kenyon, A. S.; Shi, X.; Wang, Y. A. N. Simple, at-site detectionof diethylene glycol/ethylene glycol contamination of glycerin andglycerin-based raw materials by thin-layer chromatography. J. AOACInt. 1998, 81 (1), 44−50.(33) Yager, P.; Domingo, G. J.; Gerdes, J. Point-of-care diagnosticsfor global health. Annu. Rev. Biomed. Eng. 2008, 10, 107−144.(34) Kost, G. J. Newdemics, public health, small-world networks, andpoint-of-care testing. Point Care 2006, 5 (4), 138.(35) Fukushima, H.; Tsunomori, Y.; Seki, R. Duplex real-time SYBRgreen PCR assays for detection of 17 species of food-or waterbornepathogens in stools. J. Clin. Microbiol. 2003, 41 (11), 5134.(36) Yasmin, M.; Kawasaki, S.; Kawamoto, S. Evaluation of multiplexPCR system for simultaneous detection of Escherichia coli O157:H7,Listeria monocytogenes and Salmonella enteritidis in shrimp samples.Bangl. J. Microbiol. 2008, 24 (1), 42−46.(37) Eckfeldt, J. H.; Light, R. T. Kinetic ethylene glycol assay withuse of yeast alcohol dehydrogenase. Clin. Chem. 1980, 26 (9), 1278.(38) Batchelor, R. H.; Zhou, M. A resorufin-based fluorescent assayfor quantifying NADH. Anal. Biochem. 2002, 305 (1), 118.(39) Gadgil, A. Low cost UV disinfection system for developingcountries: field tests in South Africa. Annu. Rev. Energy Environ. Fed.1998, 23, 253.(40) Danley, A. A.; Watts, M. J. Installation of bio-sand filters inPetite Paradise, Haiti. Proc. Water Environ. Fed. 2009, 12, 3892−3897.
(41) Lazcka, O.; Del Campo, F.; Munoz, F. Pathogen detection: aperspective of traditional methods and biosensors. Biosens. Bioelectron.2007, 22, 1205−1217.(42) Noble, R.; Weisberg, S. A review of technologies for rapiddetection of bacteria in recreational waters. J. Water Health 2005, 3,381−392.(43) Yan, L.; Bashir, L. Electrical/electrochemical impedance forrapid detection of foodborne pathogenic bacteria. Biotechnol. Adv.2008, 26, 135−150.(44) Ivnitsk, D.; Abdel-Hamid, I; Atanasov, P.; Wilkins, E. Biosensorsfor detection of pathogenic bacteria. Biosens. Bioelectron. 1999, 14,599−624.(45) Ivnitsk, D.; Abdel-Hamid, I.; Atanasov, P.; Wilkins, E.; Stricker,S. Application of electrochemical biosensors for detection of foodpathogenic bacteria. Electroanalysis 2000, 12, 317−325.(46) Su, X. L.; Li, Y. A self-assembled monolayer-based piezoelectricimmunosensor for rapid detection of Escherichia coli O157:H7. Biosens.Bioelectron. 2004, 19 (6), 563−574.(47) Rand, A. G.; Ye, J.; Brown, C. W.; Letcher, S. V. Opticalbiosensors for food pathogen detection. Food Technol. 2002, 56 (3),32−39.(48) Personal communication and price enquiry with manufacturers.(49) Sriprawat, K.; Kaewpongsri, S.; Suwanarusk, R.; Leimanis, M. L.Effective and cheap removal of leukocytes and platelets fromPlasmodium vivax infected blood. Malaria J. 2009, 8 (1), 115.
Journal of Agricultural and Food Chemistry Article
dx.doi.org/10.1021/jf300817h | J. Agric. Food Chem. 2012, 60, 6349−63586358
Related Documents