Journal of Biomolecular NMR, 26: 215–240, 2003. KLUWER/ESCOM © 2003 Kluwer Academic Publishers. Printed in the Netherlands. 215 Rapid and accurate calculation of protein 1 H, 13 C and 15 N chemical shifts Stephen Neal, Alex M. Nip, Haiyan Zhang & David S. Wishart Faculty of Pharmacy & Pharmaceutical Sciences, University of Alberta, Edmonton, AB, T6G 2N8, Canada Received 22 November 2002; Accepted 6 March 2003 Key words: calculation, chemical shift, data mining, NMR, prediction, protein Abstract A computer program (SHIFTX) is described which rapidly and accurately calculates the diamagnetic 1 H, 13 C and 15 N chemical shifts of both backbone and sidechain atoms in proteins. The program uses a hybrid predictive ap- proach that employs pre-calculated, empirically derived chemical shift hypersurfaces in combination with classical or semi-classical equations (for ring current, electric field, hydrogen bond and solvent effects) to calculate 1 H, 13 C and 15 N chemical shifts from atomic coordinates. The chemical shift hypersurfaces capture dihedral angle, sidechain orientation, secondary structure and nearest neighbor effects that cannot easily be translated to analytical formulae or predicted via classical means. The chemical shift hypersurfaces were generated using a database of IUPAC-referenced protein chemical shifts – RefDB (Zhang et al., 2003), and a corresponding set of high resolution (<2.1 Å) X-ray structures. Data mining techniques were used to extract the largest pairwise contributors (from a list of ∼20 derived geometric, sequential and structural parameters) to generate the necessary hypersurfaces. SHIFTX is rapid (< 1 CPU second for a complete shift calculation of 100 residues) and accurate. Overall, the program was able to attain a correlation coefficient (r) between observed and calculated shifts of 0.911 ( 1 Hα), 0.980 ( 13 Cα), 0.996 ( 13 Cβ), 0.863 ( 13 CO), 0.909 ( 15 N), 0.741 ( 1 HN), and 0.907 (sidechain 1 H) with RMS errors of 0.23, 0.98, 1.10, 1.16, 2.43, 0.49, and 0.30 ppm, respectively on test data sets. We further show that the agreement between observed and SHIFTX calculated chemical shifts can be an extremely sensitive measure of the quality of protein structures. Our results suggest that if NMR-derived structures could be refined using heteronuclear chemical shifts calculated by SHIFTX, their precision could approach that of the highest resolution X-ray structures. SHIFTX is freely available as a web server at http://redpoll.pharmacy.ualberta.ca. Introduction Chemical shifts are the ‘mileposts’ of NMR spec- troscopy. Not only are they important as spectral markers, but their dependency on multiple electronic and geometric factors means that chemical shifts can potentially provide a rich source of structural informa- tion. However, these multiple dependencies make both the interpretation and accurate prediction of chemi- cal shifts exceedingly difficult – particularly for large molecules such as proteins. Fortunately, over the past decade, significant progress in chemical shift pre- diction has been made, both through computational advances (Williamson and Asakura, 1997; Case, 1998, ∗ To whom correspondence should be addressed. E-mail: [email protected] 2000; Wishart and Case, 2001) and through the rapid expansion of biomolecular chemical shift databases (Seavey et al., 1991; Zhang et al., 2003). Currently there are three main approaches for cal- culating protein chemical shifts from atomic coordi- nates: (1) Quantum mechanical, (2) classical, and (3) empirical. Quantum mechanical (QM) approaches employing density functional theory (DFT) have been used to very accurately calculate 1 H, 13 C and 15 N shifts for selected classes of residues in proteins (de- Dios et al., 1993; Le et al., 1995; Xu and Case, 2001, 2002). Classical approaches, which employ simplified or empirical equations derived from classical physics and experimental data, have been used to accurately calculate 1 H shifts for quite some time (Wagner et al., 1983; Dalgarno et al., 1983; Osapay and Case, 1991,

Welcome message from author
This document is posted to help you gain knowledge. Please leave a comment to let me know what you think about it! Share it to your friends and learn new things together.
Transcript
Journal of Biomolecular NMR, 26: 215–240, 2003.KLUWER/ESCOM© 2003 Kluwer Academic Publishers. Printed in the Netherlands.
215
Rapid and accurate calculation of protein 1H, 13C and 15N chemical shifts
Stephen Neal, Alex M. Nip, Haiyan Zhang & David S. WishartFaculty of Pharmacy & Pharmaceutical Sciences, University of Alberta, Edmonton, AB, T6G 2N8, Canada
Received 22 November 2002; Accepted 6 March 2003
Key words: calculation, chemical shift, data mining, NMR, prediction, protein
Abstract
A computer program (SHIFTX) is described which rapidly and accurately calculates the diamagnetic 1H, 13C and15N chemical shifts of both backbone and sidechain atoms in proteins. The program uses a hybrid predictive ap-proach that employs pre-calculated, empirically derived chemical shift hypersurfaces in combination with classicalor semi-classical equations (for ring current, electric field, hydrogen bond and solvent effects) to calculate 1H,13C and 15N chemical shifts from atomic coordinates. The chemical shift hypersurfaces capture dihedral angle,sidechain orientation, secondary structure and nearest neighbor effects that cannot easily be translated to analyticalformulae or predicted via classical means. The chemical shift hypersurfaces were generated using a database ofIUPAC-referenced protein chemical shifts – RefDB (Zhang et al., 2003), and a corresponding set of high resolution(<2.1 Å) X-ray structures. Data mining techniques were used to extract the largest pairwise contributors (from a listof ∼20 derived geometric, sequential and structural parameters) to generate the necessary hypersurfaces. SHIFTXis rapid (< 1 CPU second for a complete shift calculation of 100 residues) and accurate. Overall, the program wasable to attain a correlation coefficient (r) between observed and calculated shifts of 0.911 (1Hα), 0.980 (13Cα),0.996 (13Cβ), 0.863 (13CO), 0.909 (15N), 0.741 (1HN), and 0.907 (sidechain 1H) with RMS errors of 0.23, 0.98,1.10, 1.16, 2.43, 0.49, and 0.30 ppm, respectively on test data sets. We further show that the agreement betweenobserved and SHIFTX calculated chemical shifts can be an extremely sensitive measure of the quality of proteinstructures. Our results suggest that if NMR-derived structures could be refined using heteronuclear chemical shiftscalculated by SHIFTX, their precision could approach that of the highest resolution X-ray structures. SHIFTX isfreely available as a web server at http://redpoll.pharmacy.ualberta.ca.
Introduction
Chemical shifts are the ‘mileposts’ of NMR spec-troscopy. Not only are they important as spectralmarkers, but their dependency on multiple electronicand geometric factors means that chemical shifts canpotentially provide a rich source of structural informa-tion. However, these multiple dependencies make boththe interpretation and accurate prediction of chemi-cal shifts exceedingly difficult – particularly for largemolecules such as proteins. Fortunately, over the pastdecade, significant progress in chemical shift pre-diction has been made, both through computationaladvances (Williamson and Asakura, 1997; Case, 1998,
∗To whom correspondence should be addressed. E-mail:[email protected]
2000; Wishart and Case, 2001) and through the rapidexpansion of biomolecular chemical shift databases(Seavey et al., 1991; Zhang et al., 2003).
Currently there are three main approaches for cal-culating protein chemical shifts from atomic coordi-nates: (1) Quantum mechanical, (2) classical, and(3) empirical. Quantum mechanical (QM) approachesemploying density functional theory (DFT) have beenused to very accurately calculate 1H, 13C and 15Nshifts for selected classes of residues in proteins (de-Dios et al., 1993; Le et al., 1995; Xu and Case, 2001,2002). Classical approaches, which employ simplifiedor empirical equations derived from classical physicsand experimental data, have been used to accuratelycalculate 1H shifts for quite some time (Wagner et al.,1983; Dalgarno et al., 1983; Osapay and Case, 1991,
216
1994; Wishart et al., 1991; Herranz et al., 1992;Williamson et al., 1992). Empirical approaches, whichrely on chemical shift ‘hypersurfaces’ calculated fromdatabases of observed chemical shifts, are capable ofrapid, but only modestly accurate calculation of 1H,13C, and 15N shifts (Spera and Bax, 1991; Le andOldfield, 1994; Beger and Bolton, 1997; Wishart andNip, 1998; Iwadate et al., 1999). These hypersurfacesrelate chemical shifts to various empirical parameters(backbone angles, nearest neighbors, sidechain angles,secondary structure, etc.). Pre-calculated chemicalshift hyper-surfaces are also used in QM approachesto greatly accelerate the speed of their calculations (Xuand Case, 2001, 2002; Le et al., 1995).
As of yet, none of the three approaches has devel-oped to a stage where it can offer a rapid, accuratemethod to calculate all (i.e., sidechain and backbone1H, 13C and 15N) chemical shifts for all residues underall conditions (diamagnetic and paramagnetic). Ide-ally, if one could combine the speed and predictivebreadth of the empirical approaches with the accu-racy of the classical or QM approaches, then it mightbe possible to achieve this goal. Here we describea hybrid predictive method that attempts to combinethe empirical hypersurface approach with the classicalapproach to accurately and rapidly calculate essen-tially all diamagnetic shifts for all 20 amino acidresidues. The program, called SHIFTX, takes as inputa protein structure in Protein Data Bank format, andpredicts the diamagnetic 1H, 13C and 15N chemicalshifts of the protein’s backbone and sidechain atoms.Tests indicate that SHIFTX is rapid (about 1 sec on a2.2 GHz Pentium IV CPU for a complete shift cal-culation of 100 residues) and accurate. Overall, theprogram was able to attain a correlation coefficient(r) between observed and calculated shifts of 0.911(1Hα), 0.980 (13Cα), 0.996 (13Cβ), 0.863 (13CO),0.909 (15N), 0.741 (1HN), and 0.907 (sidechain 1H)with an RMS error of 0.23, 0.98, 1.10, 1.16, 2.43,0.49, and 0.30 ppm, respectively. We further showthat the agreement between observed and SHIFTX cal-culated chemical shifts can be an extremely sensitivemeasure of the accuracy and precision of protein struc-tures. We believe SHIFTX could serve as a valuabletool for refining and assessing protein structures, forvalidating and adjusting chemical shift assignments(Zhang et al., 2003) and potentially for generating3D protein structures using only chemical shift in-formation (Wishart and Case, 2001). A completedescription of SHIFTX, its performance, applicationsand limitations follows.
Methods
SHIFTX employs a hybrid predictive protocol thatuses a combination of classical equations and empir-ical ‘hypersurfaces’ to calculate chemical shifts fromatomic coordinate data. Classical equations are usedto calculate the effects of well-characterized physi-cal phenomena such as ring currents, H-bonds andelectric field effects. The chemical shift hypersur-faces (described in more detail below) are derivedfrom observed data and are fundamentally statisti-cal in nature. These hypersurfaces serve as a simplemethod for capturing complex, nonlinear, and multi-parametric interactions that do not lend themselvesto simple analytical expressions. A SHIFTX chem-ical shift calculation is therefore the sum of severalcomponents:
δcalc = δcoil + δRC + δEF + δHB + δHS, (1)
where δcoil is the random coil 1H, 13C or 15N chemicalshift (relative to DSS) of the amino acid as given byWishart et al. (1995b), δRC is the ring current shift, δEF
is the electric field contribution, δHB is the hydrogenbond contribution, and δHS is the contribution from thechemical shift hypersurfaces for the nucleus of interest(primarily the backbone dihedral angles). A SHIFTXprediction is composed of four phases: (1) Reading thePDB file; (2) checking and adding hydrogen atoms (ifnecessary); (3) calculating the classical contributions(ring currents, electric field effects, etc.); and 4) cal-culating the chemical shift hypersurface contributionsand summing them with the results of phase 3. Thesecalculations are performed for essentially all atomsthat can yield measurable chemical shifts. A more de-tailed description of each of the four phases, includingthe specific formulae, criteria and protocols is givenbelow.
File input
SHIFTX reads standard PDB files using file I/O meth-ods originally developed for VADAR (Wishart et al.,1994). The program will read in a specified chain froma multi-chain file (defaulting to the first chain if an-other is not specified) and ignores non-standard aminoacids, non-water heteroatoms and ligands (heme rings,metals etc.). Conditions that may impact the accuracyof predictions (missing atoms, numbering irregulari-ties, and chain breaks) are noted in the program output.The I/O portion of the program also loads the amino
217
acid sequence, determines nearest neighbors, calcu-lates dihedral angles, secondary structures, H-bondpartners, salt bridges and charge pairs. These para-meters are all used in evaluating the chemical shifthypersurfaces.
Hydrogen placement
SHIFTX initially determines if there are hydrogenatom coordinates provided in the PDB file. If not, theposition of HN atoms is calculated using the planeformed by the N, CA, and COn−1 atoms. The pro-ton is placed in this plane 0.86 Å from the N atomsuch that the angle formed by the H-N bond andthe N-COn−1 bond is 118.9 degrees. The HA atom(for non-glycine residues) is placed 1.0 Å from CA,such that it fills the 120 degree tetrahedron formedby CA, CB, N, and CO. For glycine, the two alphahydrogens are placed by rotating the vector formedby CA and N around the vector formed by CA andC by +120 and −120 degrees. All other hydrogensare added using the program REDUCE (Word et al.,1999; http://kinemage.biochem.duke.edu) which hasbeen incorporated into the SHIFTX web server.
Ring current effects
The presence of aromatic rings and their associatedring currents can have a profound effect on the chemi-cal shifts of nearby nuclei. As Osapay and Case (1991)have shown the effects of these currents are best cal-culated using the semi-classical methods of Haigh andMallion (1980). Our findings indicate that all hydro-gen nuclei can be affected by ring currents, as canthe CA, CB, CO, and N atoms. In calculating the ringcurrent contributions for a given protein, SHIFTX firstgenerates a list of susceptible atoms and a list of rings,and then calculates the influence of each ring on eachsuch atom. This influence is the product of a geo-metrical factor G, a target-specific constant F, and aring-specific intensity I (see Table 1). With the valuesof the latter two constants being determined throughparameter fitting.
For each ring, a normal is computed from thecross-product of two vectors originating from the firstring member and extending to the second and last ringmembers, respectively. The ring is deemed to lie ina plane perpendicular to this normal. Next, the pro-jection of the target atom onto the ring plane is found;this is designated point O for purposes of the followingcalculations. Finally, the areas of a series of trian-gles are computed, with the vertices of each triangle
being adjacent points on the ring and the point O. Be-cause each pair of adjacent ring atoms is considered(including the first and last atoms), there will be onetriangle for each ring member. These areas are alge-braic and may be positive or negative. For instance,consider vectors Ri and Rj from O to the ith and jth
ring members. The area of the triangle formed by thesethree points is negative if the cross product Ri x Rj isparallel to the ring normal, and positive if it is anti-parallel. The area of each triangle is then multipliedby a distance factor, given by
dij = 1
r3i
+ 1
r3j
, (2)
where ri = length of Ri and rj = length of Rj Thus thegeometrical factor G is given by:
G =∑
ringmembers
dik areaijO. (3)
G, the ring-specific intensity I, and the target nucleusfactor F are multiplied together to yield the total effecton the target nucleus’ chemical shift due to the givenring:
δRC = GIF. (4)
The ring-specific intensity factor (I) and target nu-cleus factors (F) were determined empirically usinga simple grid search optimization protocol (step sizeof 0.01) on the training database. The residue-specificleast square values (for I and F) suggested by Os-apay and Case (1991) were used as starting values.Note that in this formulation, F corresponds to Os-apay and Case’s parameter B but with the implicitassumption that F will vary for different target nu-clei (15N, 13C, 1HN, etc.) as a result of their differentshielding or differing electron cloud ‘mobility’. Ini-tially, the ring-current optimization was performedonly on the HA shifts wherein all five ring-specificintensity parameters and the target nucleus factor (atotal of six numbers) were allowed to vary. The re-sulting ring-specific intensity factors (I) are shown inTable 1 and were found to be quite similar to thosereported by Case and Osapay. The resulting value forF (5.13 × 10⁻⁶) also corresponds closely to the Bvalue of 5.45 × 10⁻⁶ determined by Osapay and Case(1991). The ring current optimization process was thenrepeated for other target nuclei by holding the I valuesconstant and allowing F to vary. Note that for heavynuclei (15N and 13C) the grid step was changed to 0.10.The resulting target nucleus factors (×106) were: 7.06for HN, 5.13 for HA and all other hydrogen atoms,
218
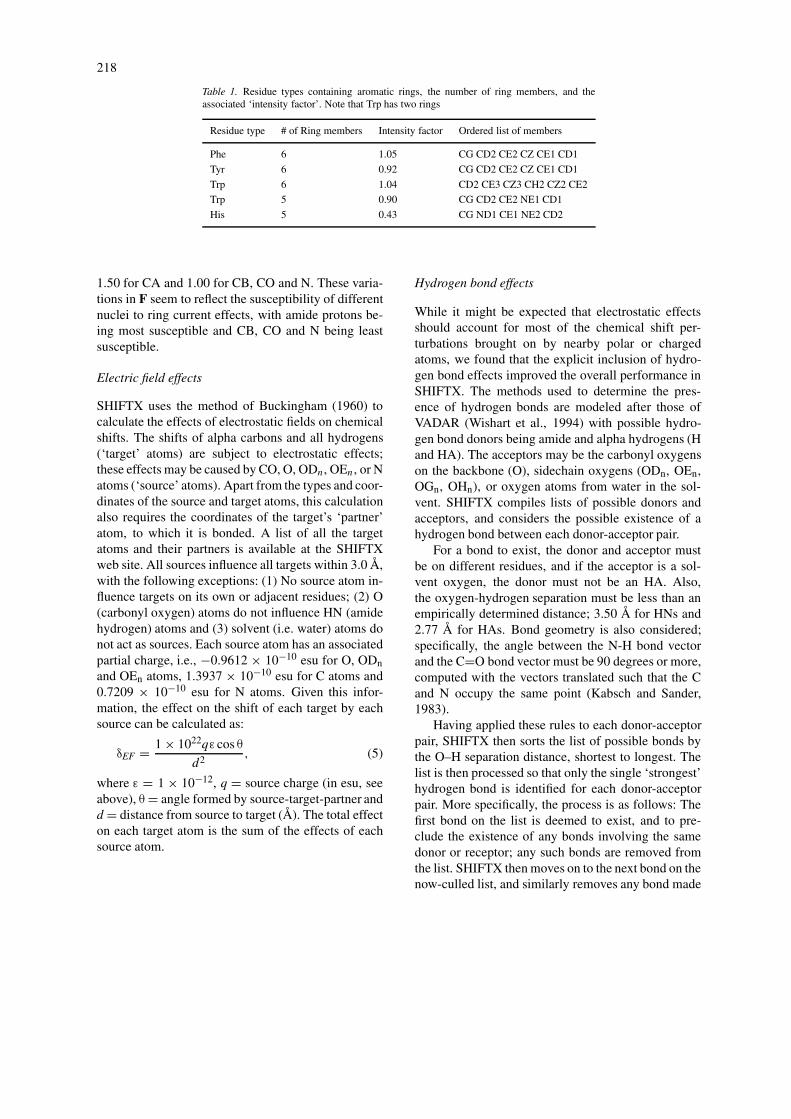
Table 1. Residue types containing aromatic rings, the number of ring members, and theassociated ‘intensity factor’. Note that Trp has two rings
Residue type # of Ring members Intensity factor Ordered list of members
Phe 6 1.05 CG CD2 CE2 CZ CE1 CD1
Tyr 6 0.92 CG CD2 CE2 CZ CE1 CD1
Trp 6 1.04 CD2 CE3 CZ3 CH2 CZ2 CE2
Trp 5 0.90 CG CD2 CE2 NE1 CD1
His 5 0.43 CG ND1 CE1 NE2 CD2
1.50 for CA and 1.00 for CB, CO and N. These varia-tions in F seem to reflect the susceptibility of differentnuclei to ring current effects, with amide protons be-ing most susceptible and CB, CO and N being leastsusceptible.
Electric field effects
SHIFTX uses the method of Buckingham (1960) tocalculate the effects of electrostatic fields on chemicalshifts. The shifts of alpha carbons and all hydrogens(‘target’ atoms) are subject to electrostatic effects;these effects may be caused by CO, O, ODn, OEn, or Natoms (‘source’ atoms). Apart from the types and coor-dinates of the source and target atoms, this calculationalso requires the coordinates of the target’s ‘partner’atom, to which it is bonded. A list of all the targetatoms and their partners is available at the SHIFTXweb site. All sources influence all targets within 3.0 Å,with the following exceptions: (1) No source atom in-fluence targets on its own or adjacent residues; (2) O(carbonyl oxygen) atoms do not influence HN (amidehydrogen) atoms and (3) solvent (i.e. water) atoms donot act as sources. Each source atom has an associatedpartial charge, i.e., −0.9612 × 10⁻¹⁰ esu for O, ODnand OEn atoms, 1.3937 × 10⁻¹⁰ esu for C atoms and0.7209 × 10−10 esu for N atoms. Given this infor-mation, the effect on the shift of each target by eachsource can be calculated as:
δEF = 1 × 10²²qε cos θ
d2 , (5)
where ε = 1 × 10⁻¹², q = source charge (in esu, seeabove), θ = angle formed by source-target-partner andd = distance from source to target (Å). The total effecton each target atom is the sum of the effects of eachsource atom.
Hydrogen bond effects
While it might be expected that electrostatic effectsshould account for most of the chemical shift per-turbations brought on by nearby polar or chargedatoms, we found that the explicit inclusion of hydro-gen bond effects improved the overall performance inSHIFTX. The methods used to determine the pres-ence of hydrogen bonds are modeled after those ofVADAR (Wishart et al., 1994) with possible hydro-gen bond donors being amide and alpha hydrogens (Hand HA). The acceptors may be the carbonyl oxygenson the backbone (O), sidechain oxygens (ODn, OEn,OGn, OHn), or oxygen atoms from water in the sol-vent. SHIFTX compiles lists of possible donors andacceptors, and considers the possible existence of ahydrogen bond between each donor-acceptor pair.
For a bond to exist, the donor and acceptor mustbe on different residues, and if the acceptor is a sol-vent oxygen, the donor must not be an HA. Also,the oxygen-hydrogen separation must be less than anempirically determined distance; 3.50 Å for HNs and2.77 Å for HAs. Bond geometry is also considered;specifically, the angle between the N-H bond vectorand the C=O bond vector must be 90 degrees or more,computed with the vectors translated such that the Cand N occupy the same point (Kabsch and Sander,1983).
Having applied these rules to each donor-acceptorpair, SHIFTX then sorts the list of possible bonds bythe O–H separation distance, shortest to longest. Thelist is then processed so that only the single ‘strongest’hydrogen bond is identified for each donor-acceptorpair. More specifically, the process is as follows: Thefirst bond on the list is deemed to exist, and to pre-clude the existence of any bonds involving the samedonor or receptor; any such bonds are removed fromthe list. SHIFTX then moves on to the next bond on thenow-culled list, and similarly removes any bond made
219
redundant, repeating this procedure until the end of thelist is reached. Tests conducted on a large portion ofthe training data revealed that the inclusion of multipleacceptors (i.e., bifurcated H-bonds) in the calculationof hydrogen bond effects actually diminished the over-all performance of SHIFTX. This finding is consistentwith the idea that hydrogen bonds are pseudo-sigma(i.e., covalent) bonds involving partial transfer of thehydrogen donor’s single electron to its acceptor atom(Baker and Hubbard, 1984).
The formulae developed by Wagner et al. (1983)and Wishart et al. (1991) for calculating the influ-ence of hydrogen bonds on HA and HN shifts wasadopted for this work. These workers found that ar−3 dependency (distance between donor and accep-tor) was most consistent with their experimental data.We optimized their δHB parameters for amide hydro-gens through a simple grid search of the two variableparameters (step size of 0.01) using our much largertraining database. For amide protons, the best fitformula accounting for δHB shifts is given by:
δHB = 0.75
r3− 0.99, (6)
where r = the hyrodgen-oxygen separation in Å. Theabove formula is valid for hydrogen bond lengths be-tween 1.5–3.5 Å. While the vast majority (>95%)of hydrogen bonds involve amide protons, the workof Wagner et al. (1983), Wishart et al. (1991) andDerewenda et al. (1995) clearly shows that alpha pro-tons can also be involved in hydrogen bonds and thatthis bonding can influence their chemical shifts. Con-sequently we included a second equation in SHIFTXto account for HA atoms which acted as hydrogenbond donors. For these hydrogen bonds a pseudo-sigmoidal potential was found to work best where theH-bond shift (δHB) is assumed to be constant between2.61–2.77 Å (long H-bonds) and 2.00-2.27 Å (shortbonds). For H-bonds between 2.61–2.27 Å the hy-drogen bond contribution to the HA chemical shift isgiven by:
δHB = 15.69
r3 − 0.67. (7)
If a glycine residue happens to have H-bonds onboth its HA’s, the resulting contribution to the δHBchemical shift is the mean of the individual δHB shifts.
Empirical chemical shift hypersurfaces
Previous studies (for example, Spera and Bax, 1991;Le and Oldfield, 1994; Wishart and Nip, 1998) have
shown the utility of torsion angle chemical shift hy-persurfaces in predicting chemical shifts; the essentialidea is to use to a residue’s backbone angles as pa-rameters to a lookup table which returns a chemicalshift value based on those parameters. The empiricallookup tables described herein are an extension of thesame idea to parameters other than local backbonetorsion angles. To develop these tables or hypersur-faces, a special data-mining program, called MINER,was created to search through a large set of pro-tein structural parameters thought to be important forchemical shift determination. MINER’s task was tofind which of those parameters or pairs of parameterswas most effective in calculating atom-specific chemi-cal shifts. ‘Effective’ in this context meant minimizingroot-mean-squared errors or maximizing correlationbetween the predicted and observed shifts; in practice,the two metrics produced essentially the same result.
In operation, MINER is supplied with a databasein which each row is a residue, and each column isa physical parameter of that residue; the parameterssupplied are listed in Table 2. In addition, each recordcontains the observed chemical shift for the nucleusof interest, and a ‘best guess’ at that shift, the latterconsisting of the sum of the classically calculable shiftcontributions (random coil, electrostatic, ring current,and hydrogen bond factors) for that nucleus. The in-put database is further divided into a ‘training set’ andone or more ‘test sets’; any predictions generated fromthe training set were evaluated against the test set toprevent overfitting.
MINER’s fundamental task is building chemicalshift hypersurfaces (or 2D matrices), with vertical andhorizontal axes each corresponding to one of the pre-calculated protein structural or sequence parameters.Each residue in the data set was assigned to one ormore cells in the table in accordance with the table’saxes and the residue’s parameter values. For example,if the table’s axes were ‘phi’ and ‘psi’ respectively,each residue with phi and psi angles in the range−180◦ to −170◦ would be assigned to the top-left cellin the table; if instead the residue had a psi angle of−165◦, it would instead be assigned to the second cellin the top row. The mean shift difference (the differ-ence between the observed and predicted shift, �δ)of the group of residues in each cell was calculated,forming a table of �δ values, which was then used tocompute a preliminary chemical shift hypersurface foreach residue. In the case of continuous quantities (tor-sion angles and bond lengths), cubic splines were usedto interpolate between table rows and columns; for dis-
220
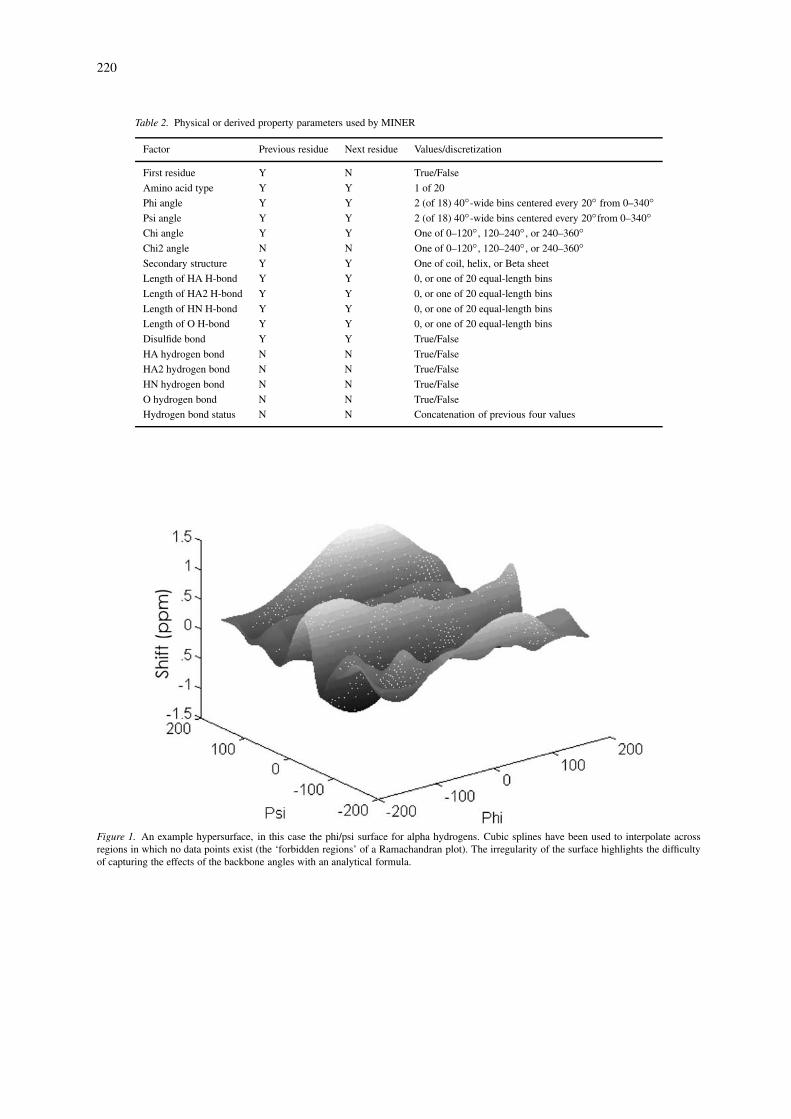
Table 2. Physical or derived property parameters used by MINER
Factor Previous residue Next residue Values/discretization
First residue Y N True/False
Amino acid type Y Y 1 of 20
Phi angle Y Y 2 (of 18) 40◦-wide bins centered every 20◦ from 0–340◦Psi angle Y Y 2 (of 18) 40◦-wide bins centered every 20◦from 0–340◦Chi angle Y Y One of 0–120◦, 120–240◦, or 240–360◦Chi2 angle N N One of 0–120◦, 120–240◦, or 240–360◦Secondary structure Y Y One of coil, helix, or Beta sheet
Length of HA H-bond Y Y 0, or one of 20 equal-length bins
Length of HA2 H-bond Y Y 0, or one of 20 equal-length bins
Length of HN H-bond Y Y 0, or one of 20 equal-length bins
Length of O H-bond Y Y 0, or one of 20 equal-length bins
Disulfide bond Y Y True/False
HA hydrogen bond N N True/False
HA2 hydrogen bond N N True/False
HN hydrogen bond N N True/False
O hydrogen bond N N True/False
Hydrogen bond status N N Concatenation of previous four values
Figure 1. An example hypersurface, in this case the phi/psi surface for alpha hydrogens. Cubic splines have been used to interpolate acrossregions in which no data points exist (the ‘forbidden regions’ of a Ramachandran plot). The irregularity of the surface highlights the difficultyof capturing the effects of the backbone angles with an analytical formula.
221
crete quantities (such as amino acid type) the surfacewas actually a simple lookup table. An example of aSHIFTX hypersurface is shown in Figure 1.
Using the above technique, MINER generated andevaluated more than 400 possible hypersurfaces, not-ing those that were useful in predicting chemicalshifts. Furthermore, because some of the structuralparameters used in these hypersurface calculationswere correlated to other parameters (both structuraland chemical shift parameters), it was important toeliminate these co-dependencies. Consequently a hy-persurface refinement procedure was implemented inMINER to select and optimize the best set of hyper-surfaces. Specifically, the refinement process involvedfive steps: First, for each possible pair of parame-ters, MINER constructed a table from the ‘training’set using the procedure outlined above, and computed�δ values for all residues. Secondly, a trial ‘newbest guess’ for each residue in the test set was com-puted from the sum of the ‘best guess’ and results ofthe previous step. The correlation of this ‘new bestguess’ to the observed chemical shifts was computed,as was the RMSD between the two. Third, after eachpossible pairing of parameters was evaluated in thisway, MINER selected the pair yielding the highestcorrelation and/or lowest RMSD, and used the hyper-surface thus generated to compute a new ‘best guess’.Fourth, an iterative optimization procedure was ap-plied to correct previous hypersurfaces, which mayhave ‘absorbed’ some of the error that rightfully ‘be-longs’ to the new hypersurface. Finally, this procedurewas repeated until no further improvement in RMSDor correlation was observed.
The above is a simplification of the actual pro-cedure, which incorporated a number of features topreserve the statistical validity of the results, andselected against pairing factors that do not actually in-teract. Objections may be raised to the presence of theobserved secondary structure as a parameter, when itis in fact derived from more fundamental parameters.Its inclusion here is a concession to the limitationsof the two dimensional surfaces which MINER gen-erates. The secondary structure in this case operatesas a mechanism by which MINER can select a subsetof the records in the database and generate a differentcurve or predictive rule for each such subset.
Training and testing databases
Two databases of protein structures and the cor-responding chemical shifts were used as input to
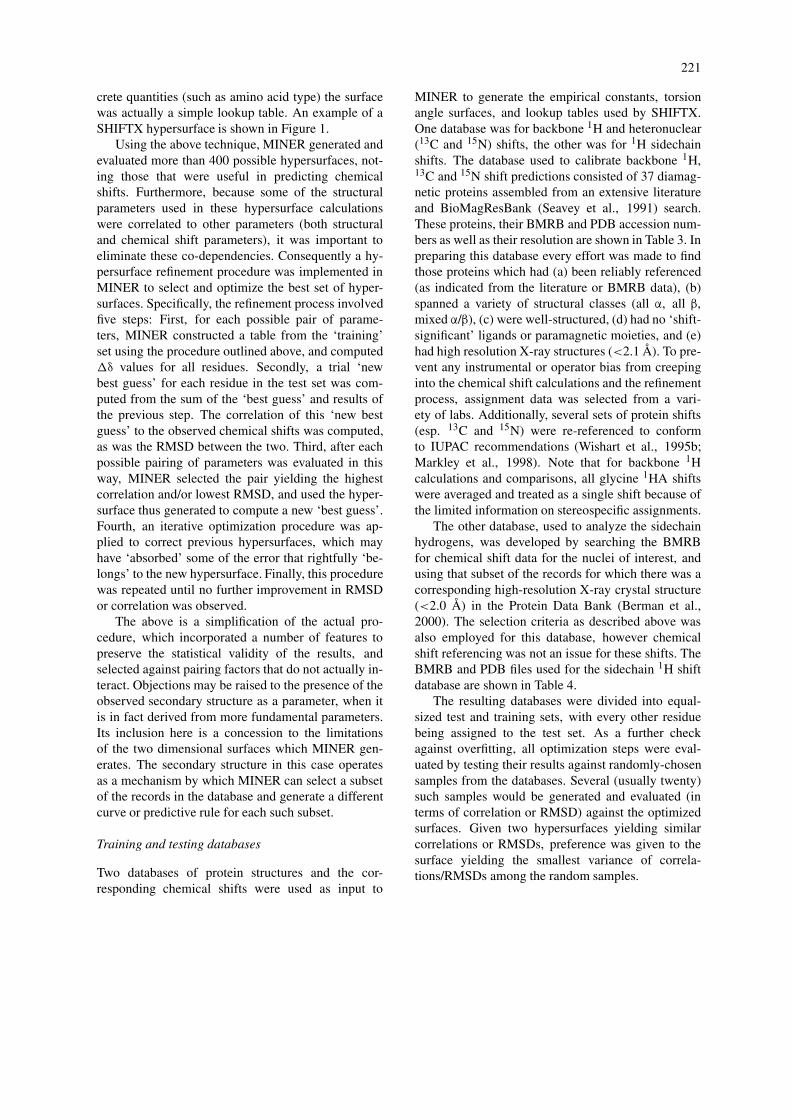
MINER to generate the empirical constants, torsionangle surfaces, and lookup tables used by SHIFTX.One database was for backbone 1H and heteronuclear(13C and 15N) shifts, the other was for 1H sidechainshifts. The database used to calibrate backbone 1H,13C and 15N shift predictions consisted of 37 diamag-netic proteins assembled from an extensive literatureand BioMagResBank (Seavey et al., 1991) search.These proteins, their BMRB and PDB accession num-bers as well as their resolution are shown in Table 3. Inpreparing this database every effort was made to findthose proteins which had (a) been reliably referenced(as indicated from the literature or BMRB data), (b)spanned a variety of structural classes (all α, all β,mixed α/β), (c) were well-structured, (d) had no ‘shift-significant’ ligands or paramagnetic moieties, and (e)had high resolution X-ray structures (<2.1 Å). To pre-vent any instrumental or operator bias from creepinginto the chemical shift calculations and the refinementprocess, assignment data was selected from a vari-ety of labs. Additionally, several sets of protein shifts(esp. 13C and 15N) were re-referenced to conformto IUPAC recommendations (Wishart et al., 1995b;Markley et al., 1998). Note that for backbone 1Hcalculations and comparisons, all glycine 1HA shiftswere averaged and treated as a single shift because ofthe limited information on stereospecific assignments.
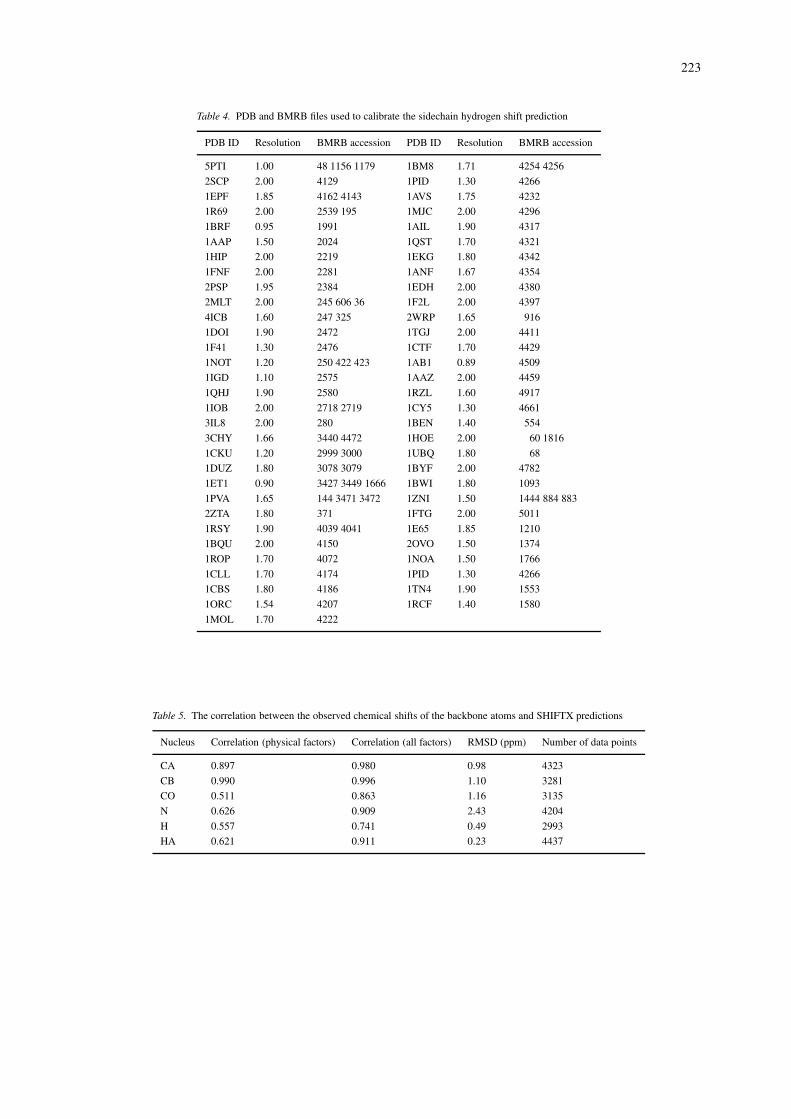
The other database, used to analyze the sidechainhydrogens, was developed by searching the BMRBfor chemical shift data for the nuclei of interest, andusing that subset of the records for which there was acorresponding high-resolution X-ray crystal structure(<2.0 Å) in the Protein Data Bank (Berman et al.,2000). The selection criteria as described above wasalso employed for this database, however chemicalshift referencing was not an issue for these shifts. TheBMRB and PDB files used for the sidechain 1H shiftdatabase are shown in Table 4.
The resulting databases were divided into equal-sized test and training sets, with every other residuebeing assigned to the test set. As a further checkagainst overfitting, all optimization steps were eval-uated by testing their results against randomly-chosensamples from the databases. Several (usually twenty)such samples would be generated and evaluated (interms of correlation or RMSD) against the optimizedsurfaces. Given two hypersurfaces yielding similarcorrelations or RMSDs, preference was given to thesurface yielding the smallest variance of correla-tions/RMSDs among the random samples.
222
Table 3. PDB and BMRB files used to calibrate backbone and heteronuclear shift predictions
PDB ID Protein name Resolution (Å) BMRB accession / reference
2ALP Alpha-lytic protease (L. enzymogenes) 1.70 (Cornilescu et al., 1999)
1GZI Antifreeze protein (Ocean pout) 1.80 (Wishart et al., 1997)
1A6K Myoglobin (Sperm whale) 1.10 4061
1A2P Barnase (B. amyloliquefaciens) 1.50 975
4ICB Calbindin D9K, minor A form (Pig) 1.60 390
1CLL Calmodulin (Drosophila) 1.70 547
1ROP ColE1 repressor protein (E. coli) 1.70 4072
1CEX Cutinase (F. solani) 1.00 4101
3EZM Cyanovirin-N (Nostoc ellipsosporum) 1.50 (Cornilescu et al., 1999)
2CPL Cyclophilin-A (Human) 1.63 (Cornilescu et al., 1999)
1HCB Carbonic anhydrase I (Human) 1.60 4022
1DMB D-maltodextrin-binding protein (E. coli) 1.80 4354
1ICM Fatty acid binding protein (Rat) 1.20 (Wishart et al., 1997)
1HFC Fibroblast collagenase (Human) 1.56 4064
4FGF Fibroblast growth factor (Human) 1.60 4091
1BKF FK506 binding protein (Human) 1.60 4077
1HVR HIV protease (HIV) 1.80 (Cornilescu et al., 1999)
4I1B Interleukin 1β (Human) 2.00 1061
3LZT Lysozyme (Chicken) 0.92 4562
1LZ1 Lysozyme (Human) 1.50 (Wishart et al., 1997)
1ONC P-30 protein (Northern leopard frog) 1.70 4371
5PTI Pancreatic trypsin inhibitor (Bovine) 1.00 46, 262, 485
1F3G Phosphocarrier protein III glc (E. coli) 2.10 (Cornilescu et al., 1999)
1ACF Profilin I (A. castellanii) 2.00 (Cornilescu et al., 1999)
1HKA Pyrophosphokinase (E. coli) 1.50 4299
5P21 RAS P21 (Human) 1.35 (Wishart et al., 1997)
1RUV Ribonuclease A (Bovine) 1.30 4031
2RN2 Ribonuclease H (E. coli) 1.48 (Wishart et al., 1997)
1RGE Ribonuclease S (S. aureofaciens) 1.15 4259
2RNT Ribonuclease T1 (Aspergillus oryzae) 1.80 (Wishart et al., 1997)
1SVN Savinase (Bacillus lentus) 1.40 (Cornilescu et al., 1999)
1SNC Staphylococcal nuclease (S. aureus) 1.65 (Cornilescu et al., 1999)
1MKA Thiol ester dehydrase (E. coli) 2.00 (Cornilescu et al., 1999)
2TRX Thioredoxin (E. coli) 1.68 (Wishart et al., 1997)
1ERT Thioredoxin – reduced (Human) 1.70 (Cornilescu et al., 1999)
1TOP Troponin C (Chicken) 1.78 4401
1UBQ Ubiquitin (Human) 1.80 (Cornilescu et al., 1999)
Results and discussion
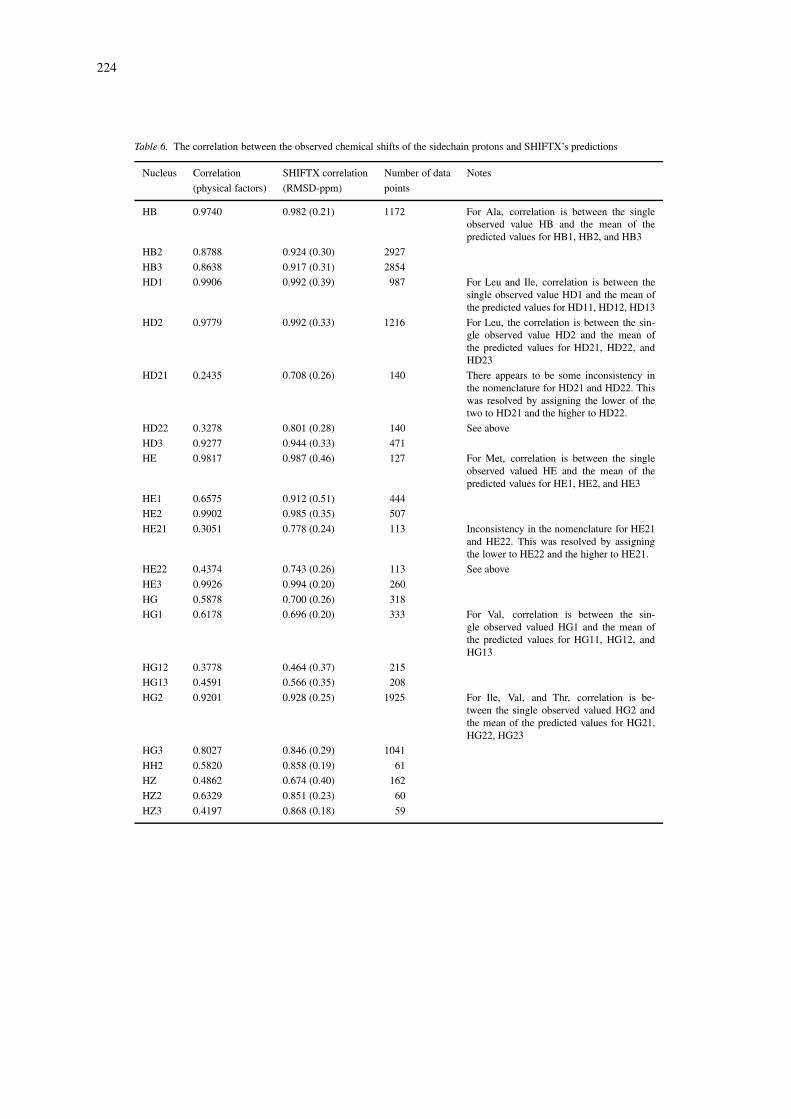
The correlation coefficients and RMS errors betweenthe observed and calculated shifts for each atom type(1H, 13C, 15N) as measured over all test proteins arelisted in Tables 5 and 6. A more complete listingthat breaks down the results in Tables 5 and 6 ac-cording to residue type and nucleus is provided at theSHIFTX web site. These tables list the correlation be-tween the observed values with the ‘best guess’ values
(incorporating the classical effects) and full SHIFTXpredictions (which incorporate the hypersurfaces). Tominimize the influence of probable mis-assignmentsand typographical errors in the input data, pointsfor which the error (predicted minus observed) wasgreater than three standard deviations from the meanerror were removed. Nuclei for which no observationswere available (HH, HH11, HH12, HH21, and HH22)are not listed. Of the 24 sidechain protons for which
223
Table 4. PDB and BMRB files used to calibrate the sidechain hydrogen shift prediction
PDB ID Resolution BMRB accession PDB ID Resolution BMRB accession
5PTI 1.00 48 1156 1179 1BM8 1.71 4254 4256
2SCP 2.00 4129 1PID 1.30 4266
1EPF 1.85 4162 4143 1AVS 1.75 4232
1R69 2.00 2539 195 1MJC 2.00 4296
1BRF 0.95 1991 1AIL 1.90 4317
1AAP 1.50 2024 1QST 1.70 4321
1HIP 2.00 2219 1EKG 1.80 4342
1FNF 2.00 2281 1ANF 1.67 4354
2PSP 1.95 2384 1EDH 2.00 4380
2MLT 2.00 245 606 36 1F2L 2.00 4397
4ICB 1.60 247 325 2WRP 1.65 916
1DOI 1.90 2472 1TGJ 2.00 4411
1F41 1.30 2476 1CTF 1.70 4429
1NOT 1.20 250 422 423 1AB1 0.89 4509
1IGD 1.10 2575 1AAZ 2.00 4459
1QHJ 1.90 2580 1RZL 1.60 4917
1IOB 2.00 2718 2719 1CY5 1.30 4661
3IL8 2.00 280 1BEN 1.40 554
3CHY 1.66 3440 4472 1HOE 2.00 60 1816
1CKU 1.20 2999 3000 1UBQ 1.80 68
1DUZ 1.80 3078 3079 1BYF 2.00 4782
1ET1 0.90 3427 3449 1666 1BWI 1.80 1093
1PVA 1.65 144 3471 3472 1ZNI 1.50 1444 884 883
2ZTA 1.80 371 1FTG 2.00 5011
1RSY 1.90 4039 4041 1E65 1.85 1210
1BQU 2.00 4150 2OVO 1.50 1374
1ROP 1.70 4072 1NOA 1.50 1766
1CLL 1.70 4174 1PID 1.30 4266
1CBS 1.80 4186 1TN4 1.90 1553
1ORC 1.54 4207 1RCF 1.40 1580
1MOL 1.70 4222
Table 5. The correlation between the observed chemical shifts of the backbone atoms and SHIFTX predictions
Nucleus Correlation (physical factors) Correlation (all factors) RMSD (ppm) Number of data points
CA 0.897 0.980 0.98 4323
CB 0.990 0.996 1.10 3281
CO 0.511 0.863 1.16 3135
N 0.626 0.909 2.43 4204
H 0.557 0.741 0.49 2993
HA 0.621 0.911 0.23 4437
224
Table 6. The correlation between the observed chemical shifts of the sidechain protons and SHIFTX’s predictions
Nucleus Correlation SHIFTX correlation Number of data Notes
(physical factors) (RMSD-ppm) points
HB 0.9740 0.982 (0.21) 1172 For Ala, correlation is between the singleobserved value HB and the mean of thepredicted values for HB1, HB2, and HB3
HB2 0.8788 0.924 (0.30) 2927
HB3 0.8638 0.917 (0.31) 2854
HD1 0.9906 0.992 (0.39) 987 For Leu and Ile, correlation is between thesingle observed value HD1 and the mean ofthe predicted values for HD11, HD12, HD13
HD2 0.9779 0.992 (0.33) 1216 For Leu, the correlation is between the sin-gle observed value HD2 and the mean ofthe predicted values for HD21, HD22, andHD23
HD21 0.2435 0.708 (0.26) 140 There appears to be some inconsistency inthe nomenclature for HD21 and HD22. Thiswas resolved by assigning the lower of thetwo to HD21 and the higher to HD22.
HD22 0.3278 0.801 (0.28) 140 See above
HD3 0.9277 0.944 (0.33) 471
HE 0.9817 0.987 (0.46) 127 For Met, correlation is between the singleobserved valued HE and the mean of thepredicted values for HE1, HE2, and HE3
HE1 0.6575 0.912 (0.51) 444
HE2 0.9902 0.985 (0.35) 507
HE21 0.3051 0.778 (0.24) 113 Inconsistency in the nomenclature for HE21and HE22. This was resolved by assigningthe lower to HE22 and the higher to HE21.
HE22 0.4374 0.743 (0.26) 113 See above
HE3 0.9926 0.994 (0.20) 260
HG 0.5878 0.700 (0.26) 318
HG1 0.6178 0.696 (0.20) 333 For Val, correlation is between the sin-gle observed valued HG1 and the mean ofthe predicted values for HG11, HG12, andHG13
HG12 0.3778 0.464 (0.37) 215
HG13 0.4591 0.566 (0.35) 208
HG2 0.9201 0.928 (0.25) 1925 For Ile, Val, and Thr, correlation is be-tween the single observed valued HG2 andthe mean of the predicted values for HG21,HG22, HG23
HG3 0.8027 0.846 (0.29) 1041
HH2 0.5820 0.858 (0.19) 61
HZ 0.4862 0.674 (0.40) 162
HZ2 0.6329 0.851 (0.23) 60
HZ3 0.4197 0.868 (0.18) 59
225
data was available, 14 had correlations greater than0.85, and all but seven had correlations greater than0.75. Five of the seven poor performers were nucleifor which stereoscopic labeling was questionable; allseven were protons for which limited amounts of data(fewer than 350 shifts) were available.
Hypersurfaces
The utility of the hypersurfaces in improving pre-dictions is obvious when the ‘physical factors only’predictions are compared with those made using thehypersurfaces. The improvement is particularly no-table in cases such as backbone 15N shifts, wherethe correlation increased from 0.626 to 0.909 whenthe hypersurfaces were applied. As with all of thebackbone nuclei, most of the improvement was dueto the application of a hypersurface utilizing the back-bone torsion angles. Other minor improvements in 15Nprediction were possible with the addition of hypersur-faces indexed by residue type/chi angle and predictedsecondary structure/preceding residue; this latter cap-tures the ‘nearest neighbour’ effect noted by earlierworkers (Wishart et al., 1995a; Braun et al., 1994).
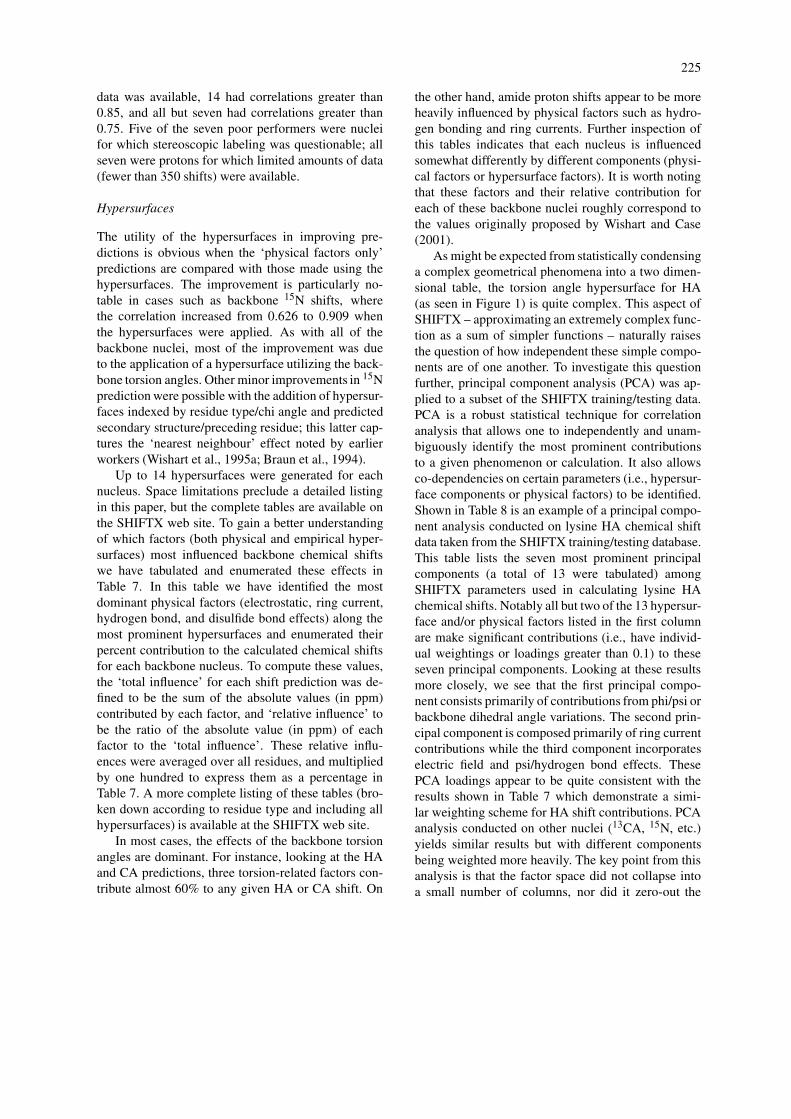
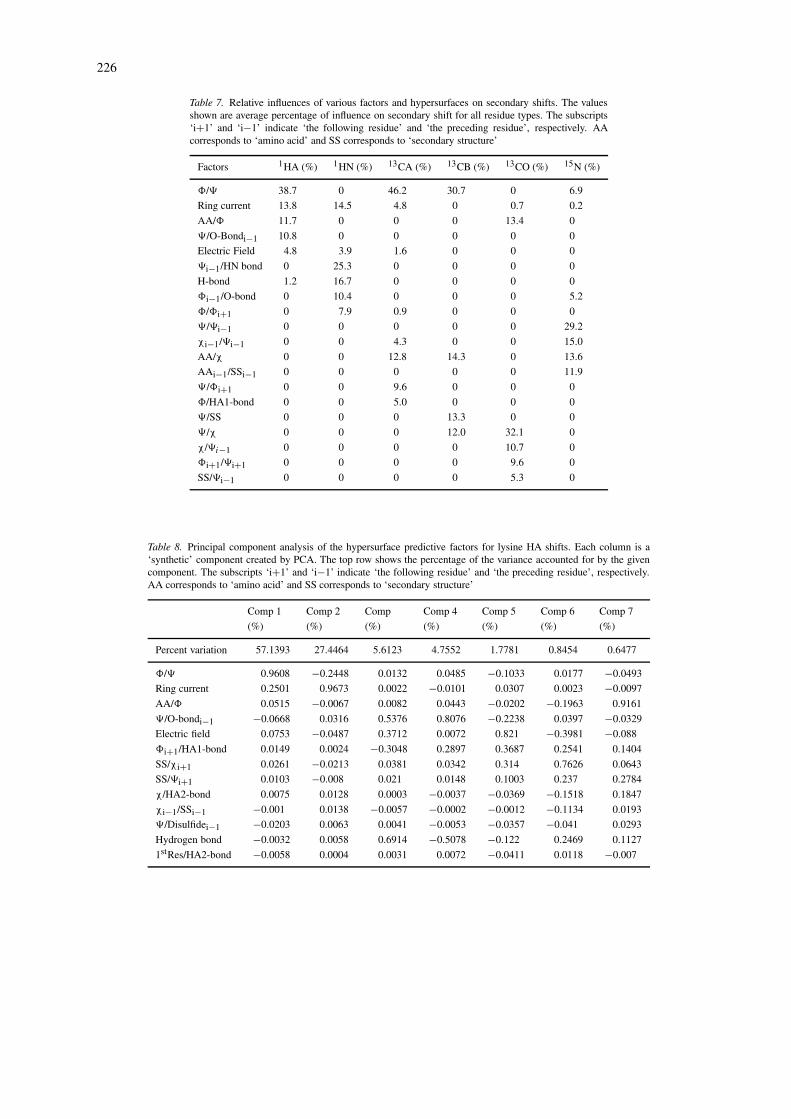
Up to 14 hypersurfaces were generated for eachnucleus. Space limitations preclude a detailed listingin this paper, but the complete tables are available onthe SHIFTX web site. To gain a better understandingof which factors (both physical and empirical hyper-surfaces) most influenced backbone chemical shiftswe have tabulated and enumerated these effects inTable 7. In this table we have identified the mostdominant physical factors (electrostatic, ring current,hydrogen bond, and disulfide bond effects) along themost prominent hypersurfaces and enumerated theirpercent contribution to the calculated chemical shiftsfor each backbone nucleus. To compute these values,the ‘total influence’ for each shift prediction was de-fined to be the sum of the absolute values (in ppm)contributed by each factor, and ‘relative influence’ tobe the ratio of the absolute value (in ppm) of eachfactor to the ‘total influence’. These relative influ-ences were averaged over all residues, and multipliedby one hundred to express them as a percentage inTable 7. A more complete listing of these tables (bro-ken down according to residue type and including allhypersurfaces) is available at the SHIFTX web site.
In most cases, the effects of the backbone torsionangles are dominant. For instance, looking at the HAand CA predictions, three torsion-related factors con-tribute almost 60% to any given HA or CA shift. On
the other hand, amide proton shifts appear to be moreheavily influenced by physical factors such as hydro-gen bonding and ring currents. Further inspection ofthis tables indicates that each nucleus is influencedsomewhat differently by different components (physi-cal factors or hypersurface factors). It is worth notingthat these factors and their relative contribution foreach of these backbone nuclei roughly correspond tothe values originally proposed by Wishart and Case(2001).
As might be expected from statistically condensinga complex geometrical phenomena into a two dimen-sional table, the torsion angle hypersurface for HA(as seen in Figure 1) is quite complex. This aspect ofSHIFTX – approximating an extremely complex func-tion as a sum of simpler functions – naturally raisesthe question of how independent these simple compo-nents are of one another. To investigate this questionfurther, principal component analysis (PCA) was ap-plied to a subset of the SHIFTX training/testing data.PCA is a robust statistical technique for correlationanalysis that allows one to independently and unam-biguously identify the most prominent contributionsto a given phenomenon or calculation. It also allowsco-dependencies on certain parameters (i.e., hypersur-face components or physical factors) to be identified.Shown in Table 8 is an example of a principal compo-nent analysis conducted on lysine HA chemical shiftdata taken from the SHIFTX training/testing database.This table lists the seven most prominent principalcomponents (a total of 13 were tabulated) amongSHIFTX parameters used in calculating lysine HAchemical shifts. Notably all but two of the 13 hypersur-face and/or physical factors listed in the first columnare make significant contributions (i.e., have individ-ual weightings or loadings greater than 0.1) to theseseven principal components. Looking at these resultsmore closely, we see that the first principal compo-nent consists primarily of contributions from phi/psi orbackbone dihedral angle variations. The second prin-cipal component is composed primarily of ring currentcontributions while the third component incorporateselectric field and psi/hydrogen bond effects. ThesePCA loadings appear to be quite consistent with theresults shown in Table 7 which demonstrate a simi-lar weighting scheme for HA shift contributions. PCAanalysis conducted on other nuclei (13CA, 15N, etc.)yields similar results but with different componentsbeing weighted more heavily. The key point from thisanalysis is that the factor space did not collapse intoa small number of columns, nor did it zero-out the
226
Table 7. Relative influences of various factors and hypersurfaces on secondary shifts. The valuesshown are average percentage of influence on secondary shift for all residue types. The subscripts‘i+1’ and ‘i−1’ indicate ‘the following residue’ and ‘the preceding residue’, respectively. AAcorresponds to ‘amino acid’ and SS corresponds to ‘secondary structure’
Factors 1HA (%) 1HN (%) 13CA (%) 13CB (%) 13CO (%) 15N (%)
�/� 38.7 0 46.2 30.7 0 6.9
Ring current 13.8 14.5 4.8 0 0.7 0.2
AA/� 11.7 0 0 0 13.4 0
�/O-Bondi−1 10.8 0 0 0 0 0
Electric Field 4.8 3.9 1.6 0 0 0
�i−1/HN bond 0 25.3 0 0 0 0
H-bond 1.2 16.7 0 0 0 0
�i−1/O-bond 0 10.4 0 0 0 5.2
�/�i+1 0 7.9 0.9 0 0 0
�/�i−1 0 0 0 0 0 29.2
χi−1/�i−1 0 0 4.3 0 0 15.0
AA/χ 0 0 12.8 14.3 0 13.6
AAi−1/SSi−1 0 0 0 0 0 11.9
�/�i+1 0 0 9.6 0 0 0
�/HA1-bond 0 0 5.0 0 0 0
�/SS 0 0 0 13.3 0 0
�/χ 0 0 0 12.0 32.1 0
χ/�i−1 0 0 0 0 10.7 0
�i+1/�i+1 0 0 0 0 9.6 0
SS/�i−1 0 0 0 0 5.3 0
Table 8. Principal component analysis of the hypersurface predictive factors for lysine HA shifts. Each column is a‘synthetic’ component created by PCA. The top row shows the percentage of the variance accounted for by the givencomponent. The subscripts ‘i+1’ and ‘i−1’ indicate ‘the following residue’ and ‘the preceding residue’, respectively.AA corresponds to ‘amino acid’ and SS corresponds to ‘secondary structure’
Comp 1 Comp 2 Comp Comp 4 Comp 5 Comp 6 Comp 7
(%) (%) (%) (%) (%) (%) (%)
Percent variation 57.1393 27.4464 5.6123 4.7552 1.7781 0.8454 0.6477
�/� 0.9608 −0.2448 0.0132 0.0485 −0.1033 0.0177 −0.0493
Ring current 0.2501 0.9673 0.0022 −0.0101 0.0307 0.0023 −0.0097
AA/� 0.0515 −0.0067 0.0082 0.0443 −0.0202 −0.1963 0.9161
�/O-bondi−1 −0.0668 0.0316 0.5376 0.8076 −0.2238 0.0397 −0.0329
Electric field 0.0753 −0.0487 0.3712 0.0072 0.821 −0.3981 −0.088
�i+1/HA1-bond 0.0149 0.0024 −0.3048 0.2897 0.3687 0.2541 0.1404
SS/χi+1 0.0261 −0.0213 0.0381 0.0342 0.314 0.7626 0.0643
SS/�i+1 0.0103 −0.008 0.021 0.0148 0.1003 0.237 0.2784
χ/HA2-bond 0.0075 0.0128 0.0003 −0.0037 −0.0369 −0.1518 0.1847
χi−1/SSi−1 −0.001 0.0138 −0.0057 −0.0002 −0.0012 −0.1134 0.0193
�/Disulfidei−1 −0.0203 0.0063 0.0041 −0.0053 −0.0357 −0.041 0.0293
Hydrogen bond −0.0032 0.0058 0.6914 −0.5078 −0.122 0.2469 0.1127
1stRes/HA2-bond −0.0058 0.0004 0.0031 0.0072 −0.0411 0.0118 −0.007
227
loadings on individual hypersurface/physical factors –both of which would indicate a strong co-dependenceamong the input factors. Nevertheless, these PCA re-sults (which are quite consistent with the results shownin Table 7) indicate that most chemical shifts for mostnuclei depend primarily on four or five major physi-cal factors or hypersurface contributions. Typically theminor contributions just add a few percentage points tothe overall quality of the fit.
Performance of 1H predictions
Overall, 1H shift predictions are seen to be highly cor-related with experimentally observed shifts, especiallyfor the side chain 1H’s. As expected, the weakest cor-relation is obtained for amide protons. These resultsare highly consistent with previously reported 1H shiftprediction methods (Williamson et al., 1992; Osapayand Case, 1991; Herranz et al., 1992). For instance theHA performance reported here of 0.911 compares fa-vorably to the value of 0.849 reported for Osapay andCase (1991), 0.747 reported for Asakura et al. (1992)and 0.730 reported for Herranz et al. (1992). Likewisethe HN results of 0.741 reported here compares wellto the value of 0.575 reported for Osapay and Case(1991) and 0.711 reported for Herranz et al (1992).Similarly, the correlation coefficient of 0.907 reportedhere for side chain 1H’s compare favorably to the valueof 0.899 reported by Osapay and Case (1991).
To conduct a more controlled comparison, we usedthe publicly available programs from Williamson (TO-TAL) and Case (SHIFTS) to predict the backbone 1Hshifts for a selection of five proteins (PDB accessions:193L, 4ICB, 1POH, 5PTI, and 5TNC) covering 520residues. We obtain correlations for HA predictionsof 0.796 (TOTAL) and 0.742 (SHIFTS) versus 0.917for SHIFTX. For HN predictions we get 0.548 (TO-TAL) and 0.336 (SHIFTS) versus 0.756 for SHIFTX.Clearly SHIFTX does comparatively well in protonshift calculation, however, there is still room forimprovement – particularly for amide protons. Thissuggests that either we still have an imperfect under-standing of all the contributions that lead to protein1H chemical shift variation (especially HN shifts) orthat the prediction methods have reached their limitbecause of coordinate imprecision in the training ortesting data. Our inclination is to believe it is more thelatter than the former.
Performance of 13C and 15N predictions
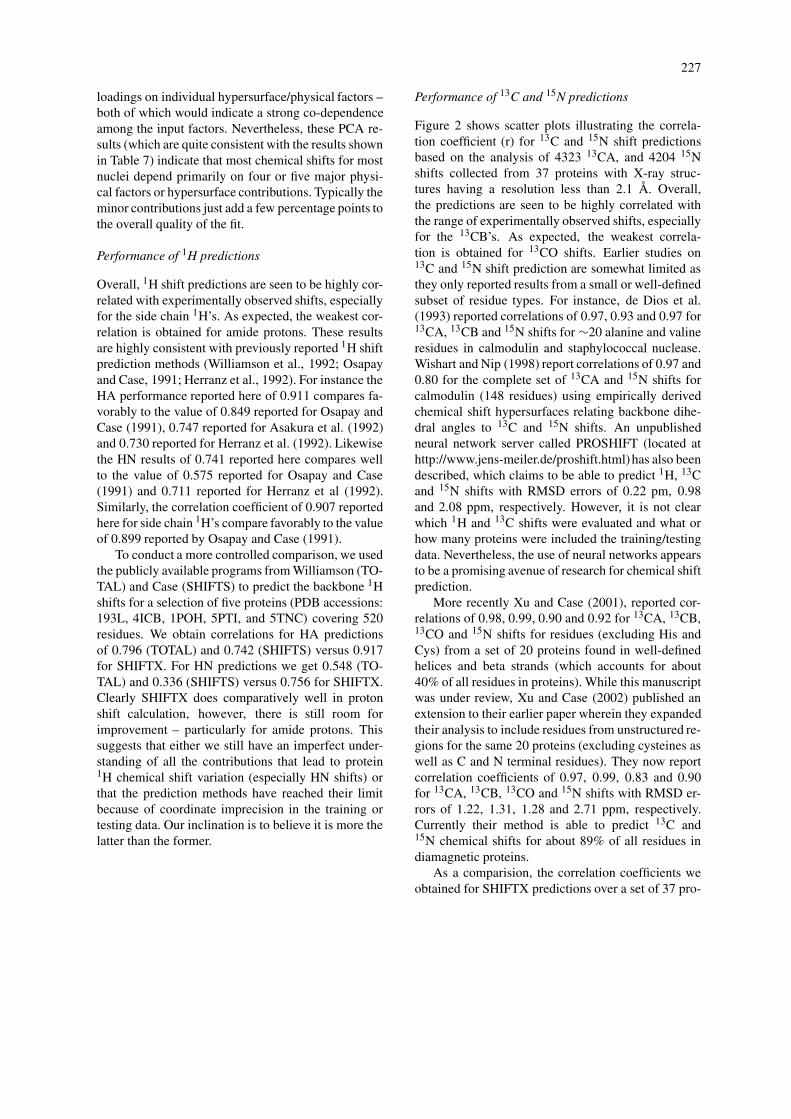
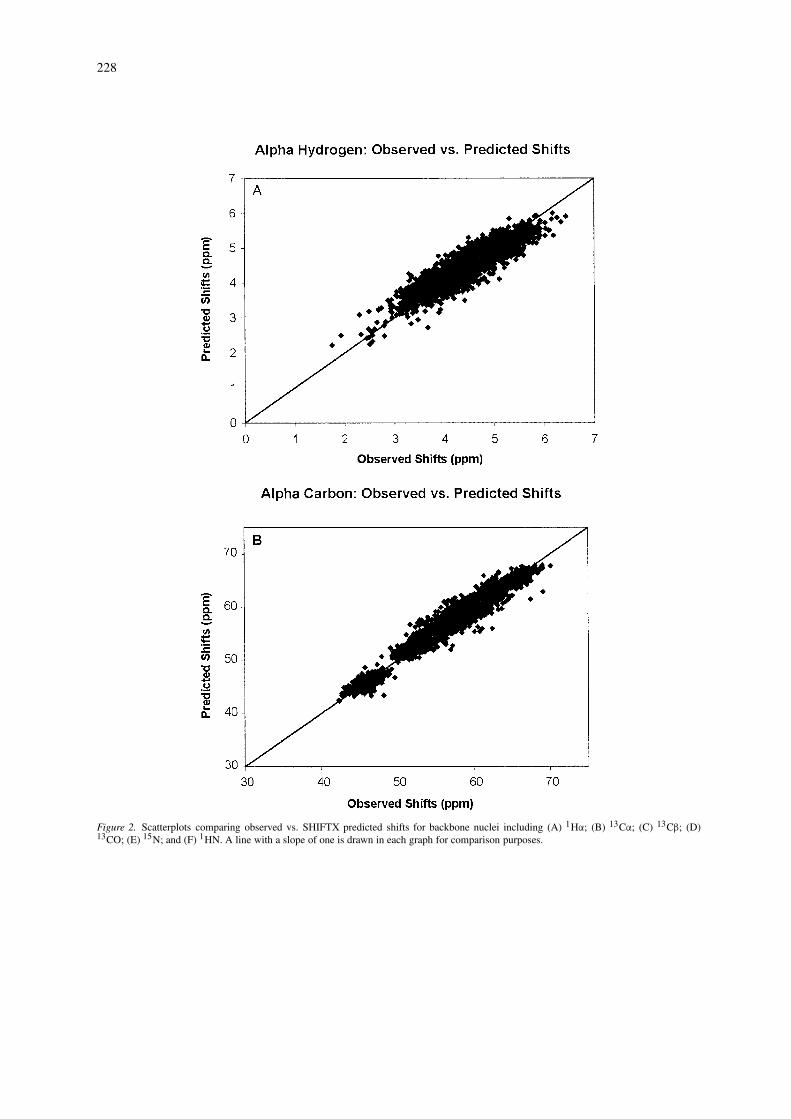
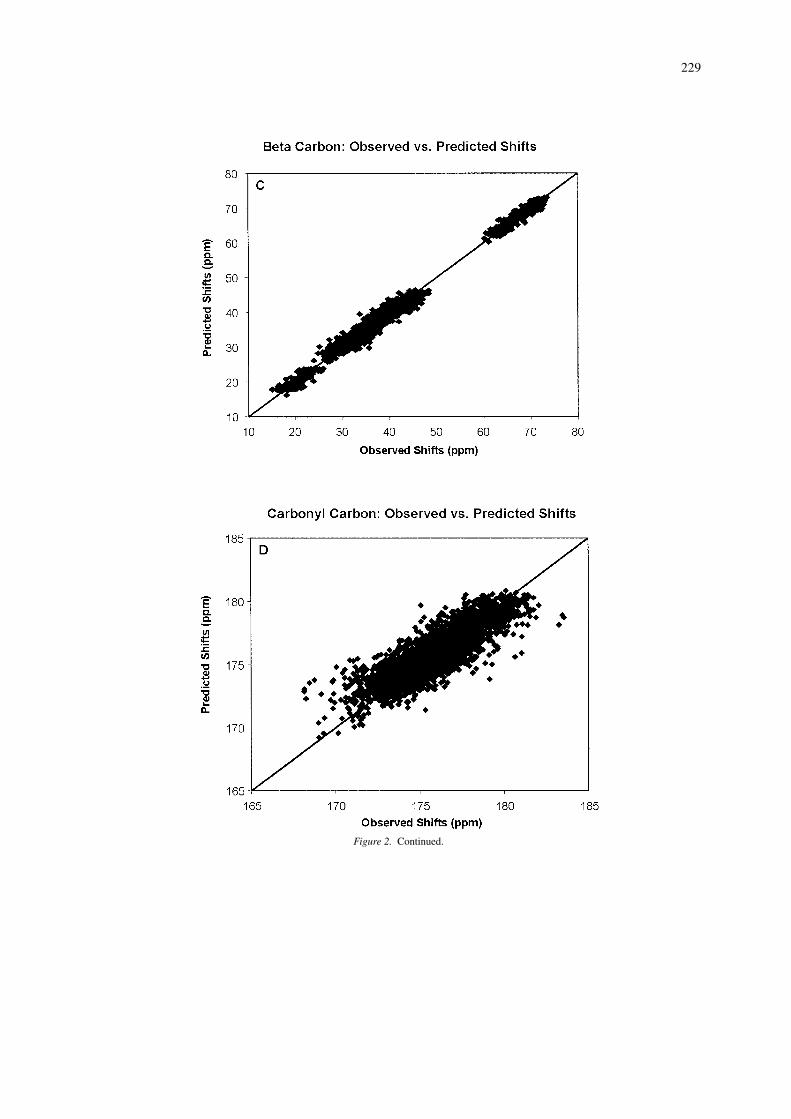
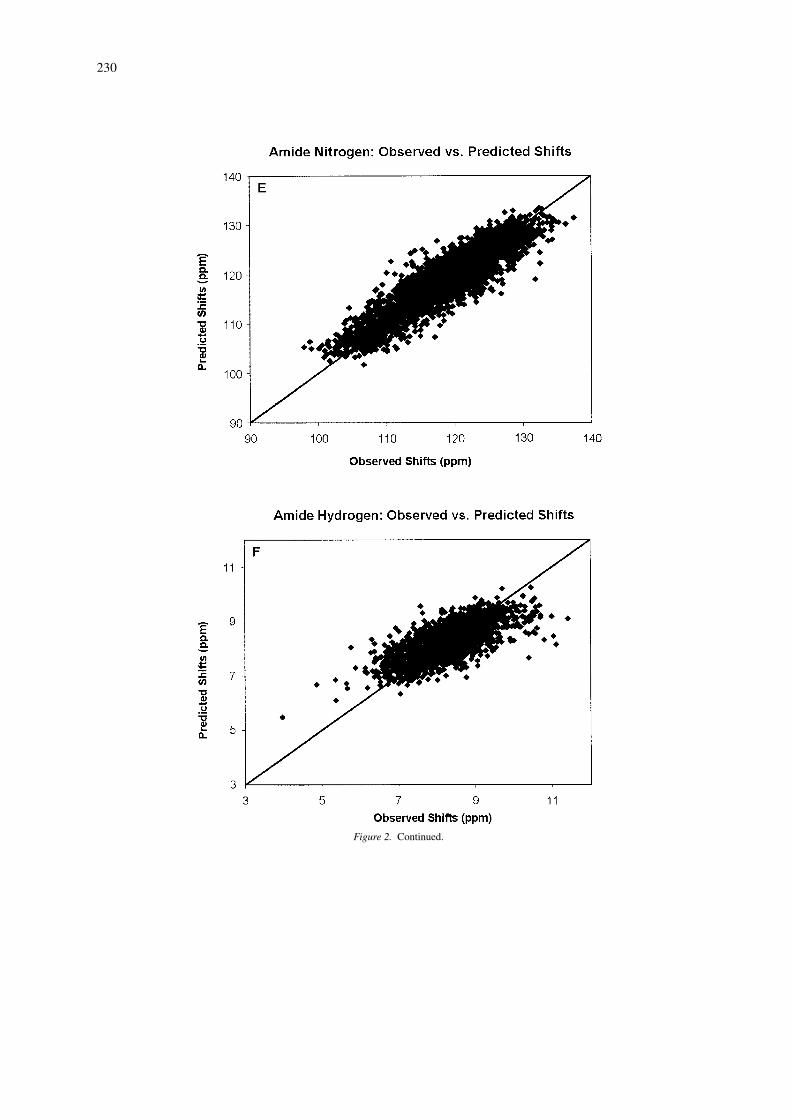
Figure 2 shows scatter plots illustrating the correla-tion coefficient (r) for 13C and 15N shift predictionsbased on the analysis of 4323 13CA, and 4204 15Nshifts collected from 37 proteins with X-ray struc-tures having a resolution less than 2.1 Å. Overall,the predictions are seen to be highly correlated withthe range of experimentally observed shifts, especiallyfor the 13CB’s. As expected, the weakest correla-tion is obtained for 13CO shifts. Earlier studies on13C and 15N shift prediction are somewhat limited asthey only reported results from a small or well-definedsubset of residue types. For instance, de Dios et al.(1993) reported correlations of 0.97, 0.93 and 0.97 for13CA, 13CB and 15N shifts for ∼20 alanine and valineresidues in calmodulin and staphylococcal nuclease.Wishart and Nip (1998) report correlations of 0.97 and0.80 for the complete set of 13CA and 15N shifts forcalmodulin (148 residues) using empirically derivedchemical shift hypersurfaces relating backbone dihe-dral angles to 13C and 15N shifts. An unpublishedneural network server called PROSHIFT (located athttp://www.jens-meiler.de/proshift.html)has also beendescribed, which claims to be able to predict 1H, 13Cand 15N shifts with RMSD errors of 0.22 pm, 0.98and 2.08 ppm, respectively. However, it is not clearwhich 1H and 13C shifts were evaluated and what orhow many proteins were included the training/testingdata. Nevertheless, the use of neural networks appearsto be a promising avenue of research for chemical shiftprediction.
More recently Xu and Case (2001), reported cor-relations of 0.98, 0.99, 0.90 and 0.92 for 13CA, 13CB,13CO and 15N shifts for residues (excluding His andCys) from a set of 20 proteins found in well-definedhelices and beta strands (which accounts for about40% of all residues in proteins). While this manuscriptwas under review, Xu and Case (2002) published anextension to their earlier paper wherein they expandedtheir analysis to include residues from unstructured re-gions for the same 20 proteins (excluding cysteines aswell as C and N terminal residues). They now reportcorrelation coefficients of 0.97, 0.99, 0.83 and 0.90for 13CA, 13CB, 13CO and 15N shifts with RMSD er-rors of 1.22, 1.31, 1.28 and 2.71 ppm, respectively.Currently their method is able to predict 13C and15N chemical shifts for about 89% of all residues indiamagnetic proteins.
As a comparision, the correlation coefficients weobtained for SHIFTX predictions over a set of 37 pro-
228
Figure 2. Scatterplots comparing observed vs. SHIFTX predicted shifts for backbone nuclei including (A) 1Hα; (B) 13Cα; (C) 13Cβ; (D)13CO; (E) 15N; and (F) 1HN. A line with a slope of one is drawn in each graph for comparison purposes.
229
Figure 2. Continued.
230
Figure 2. Continued.
231
teins were 0.980, 0.996, 0.863 and 0.909 for 13CA,13CB, 13CO and 15N shifts with RMSD errors of0.98, 1.10, 1.16 and 2.43 ppm respectively for allresidues (100% coverage). Despite their differencesin derivation and testing, the overall, the performancefor both SHIFTX and SHIFTS (Xu and Case, 2002)for heteronuclear chemical shift calculation appears tobe similar. It is possible that by combining SHIFTXand SHIFTS predictions together, one may be able tomodestly improve the overall quality of heteronuclearchemical shift calculations. Efforts are underway inour laboratory to investigate this possibility.
The key point we would like to make here is thatthe 1H, 13C and 15N shifts calculated by SHIFTXwere for all residues, in all conformations and forall proteins in the test set. No prior geometrical opti-mization or energy minimization were performed onthe input PDB file and the calculations for all 1H,13C and 15N shifts for each protein were done in lessthan 1 CPU second. We believe these performancecharacteristics are essential for using the programin practical situations pertaining to structure refine-ment, protein assignment, assignment validation andstructure validation.
Secondary validation
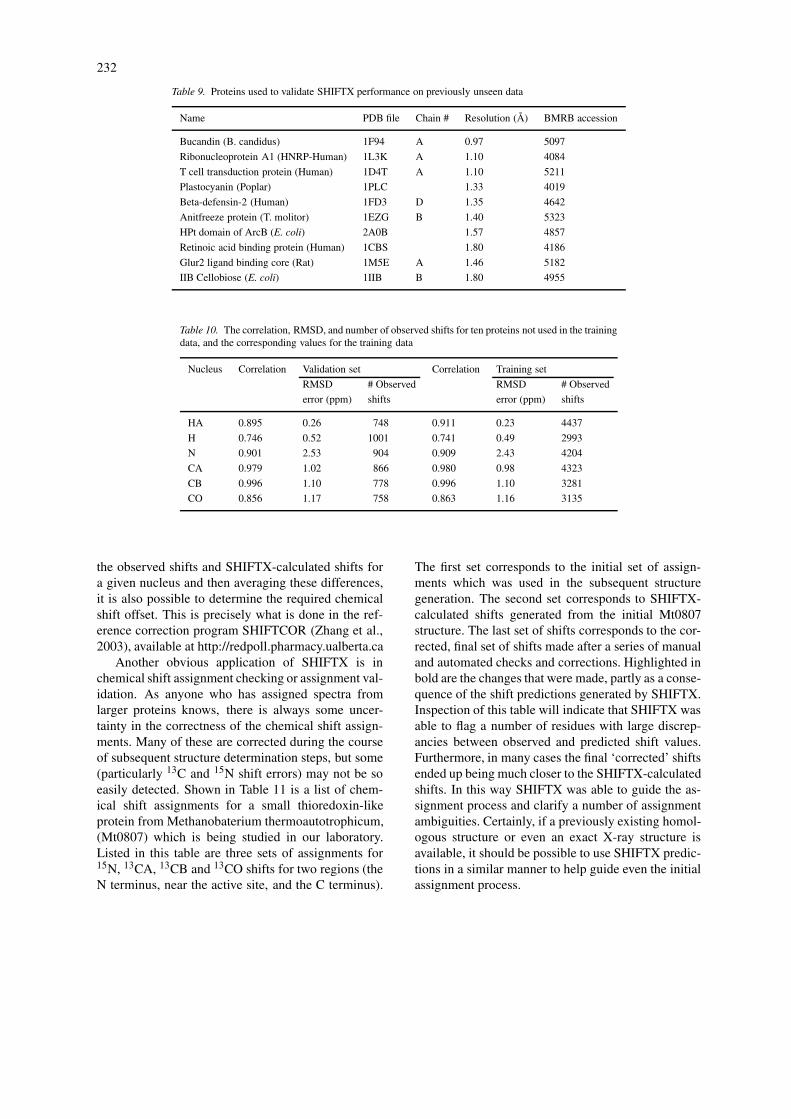
A frequent complaint about many predictive methodsis that they work well on the training and test data,but fail miserably when tried on a ‘novel’ set of pre-viously unseen data. This is a manifestation of theall-too-familiar problem of over-training. As a furthercheck on the validity and generality of SHIFTX weapplied the program to predicting the 1H, 13C and/or15N chemical shifts of a set of comparable high res-olution X-ray structures which were not included inthe original SHIFTX test/training set. Ten such pro-teins (Table 9) were identified. The correlation andRMSDs between the experimental and SHIFTX pre-dicted shifts for all backbone nuclei are shown inTable 10, along with the corresponding values for thetraining data. The results for the novel proteins areclearly comparable to those for the training data, andin the case of the amide hydrogens, the correlationis actually better for the previously-unseen proteins.We believe that these results adequately demonstratethe generality of SHIFTX, which is to say that themethods and formulas used by SHIFTX to make pre-dictions are valid outside of the proteins used to arriveat those methods and formulas.
Applications
Chemical shift calculations, if sufficiently accurate,can have a wide range of practical applications in pro-tein NMR. These include (1) aiding chemical shiftassignment; (2) chemical shift assignment validation;(3) chemical shift reference checking; (4) structure re-finement; (5) structure evaluation; and (6) structuregeneration. For instance, Williamson et al. (1995)have shown how 1H shift predictions based on thestructure of the G domain of protein B1 were clearlyable to identify two experimental mis-assignments.This paper also demonstrated that there is a good cor-relation between the accuracy of predicted 1H shiftsand the resolution of the corresponding structure..Subsequent studies by Kuszewski et al. (1995a, b) andOsapay et al. (1994) showed that chemical shift refine-ment using 1H, and then later, 13C shift ‘calculators’could be used to improve the quality of NMR-derivedprotein structures.
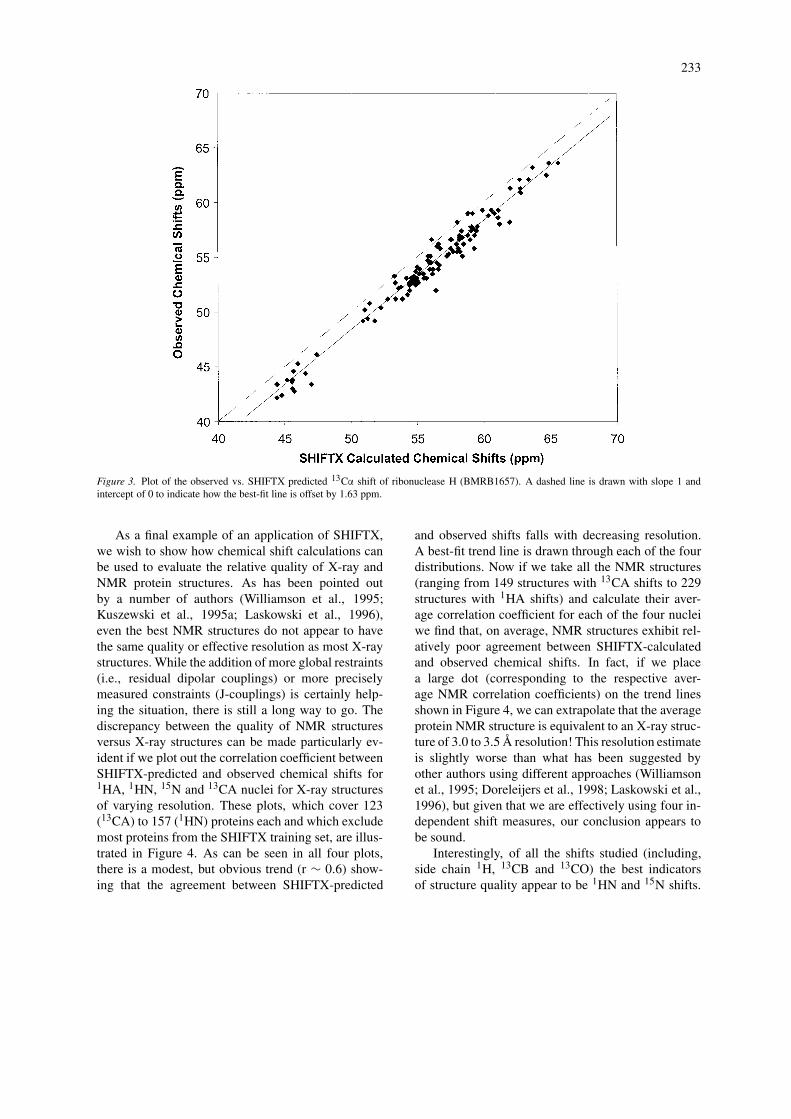
Here we wish to demonstrate how SHIFTX can beused in three specific applications: (a) Chemical shiftreference checking; (b) chemical shift assignment val-idation and (c) structure evaluation. The first applica-tion concerns a key issue in heteronuclear NMR – thatis the inconsistency of chemical shift referencing for13C and 15N nuclei. This subject has been discussedextensively in a number of recent reviews (Wishart andCase, 2001; Wishart and Sykes, 1994). While clearlydefined protocols do exist (Wishart et al., 1995b;Markley et al., 1998), it is estimated that nearly 25%of newly reported protein 13C and 15N shifts are im-properly referenced (Zhang et al., 2003). A key issueis how to identify and correct these chemical shift ref-erencing errors. Here we show that by using the 3Dstructure (either X-ray or NMR) of the protein of inter-est and calculating its 13C or 15N shifts with SHIFTXit is relatively easy to detect and correct these refer-encing errors. Illustrated in Figure 3 is a plot of theobserved versus SHIFTX-calculated 13CA shifts forribonuclease H (BMRB-1657; PDB 2RN2). A best fitline (solid line) drawn through the scatter plot showsthat the 13CA shifts have been systematically shiftedupfield by 1.6 ppm, relative to their properly refer-enced values (dashed line). The same kind of plotcould be generated for 1H and 15N chemical shiftsto calculate their offset values too. Simple scatterplots such as these could certainly help NMR spec-troscopists identify and correct referencing errors – aslong as an appropriate 3D structure is available. Alter-nately, by simply calculating the difference between
232
Table 9. Proteins used to validate SHIFTX performance on previously unseen data
Name PDB file Chain # Resolution (Å) BMRB accession
Bucandin (B. candidus) 1F94 A 0.97 5097
Ribonucleoprotein A1 (HNRP-Human) 1L3K A 1.10 4084
T cell transduction protein (Human) 1D4T A 1.10 5211
Plastocyanin (Poplar) 1PLC 1.33 4019
Beta-defensin-2 (Human) 1FD3 D 1.35 4642
Anitfreeze protein (T. molitor) 1EZG B 1.40 5323
HPt domain of ArcB (E. coli) 2A0B 1.57 4857
Retinoic acid binding protein (Human) 1CBS 1.80 4186
Glur2 ligand binding core (Rat) 1M5E A 1.46 5182
IIB Cellobiose (E. coli) 1IIB B 1.80 4955
Table 10. The correlation, RMSD, and number of observed shifts for ten proteins not used in the trainingdata, and the corresponding values for the training data
Nucleus Correlation Validation set Correlation Training set
RMSD # Observed RMSD # Observed
error (ppm) shifts error (ppm) shifts
HA 0.895 0.26 748 0.911 0.23 4437
H 0.746 0.52 1001 0.741 0.49 2993
N 0.901 2.53 904 0.909 2.43 4204
CA 0.979 1.02 866 0.980 0.98 4323
CB 0.996 1.10 778 0.996 1.10 3281
CO 0.856 1.17 758 0.863 1.16 3135
the observed shifts and SHIFTX-calculated shifts fora given nucleus and then averaging these differences,it is also possible to determine the required chemicalshift offset. This is precisely what is done in the ref-erence correction program SHIFTCOR (Zhang et al.,2003), available at http://redpoll.pharmacy.ualberta.ca
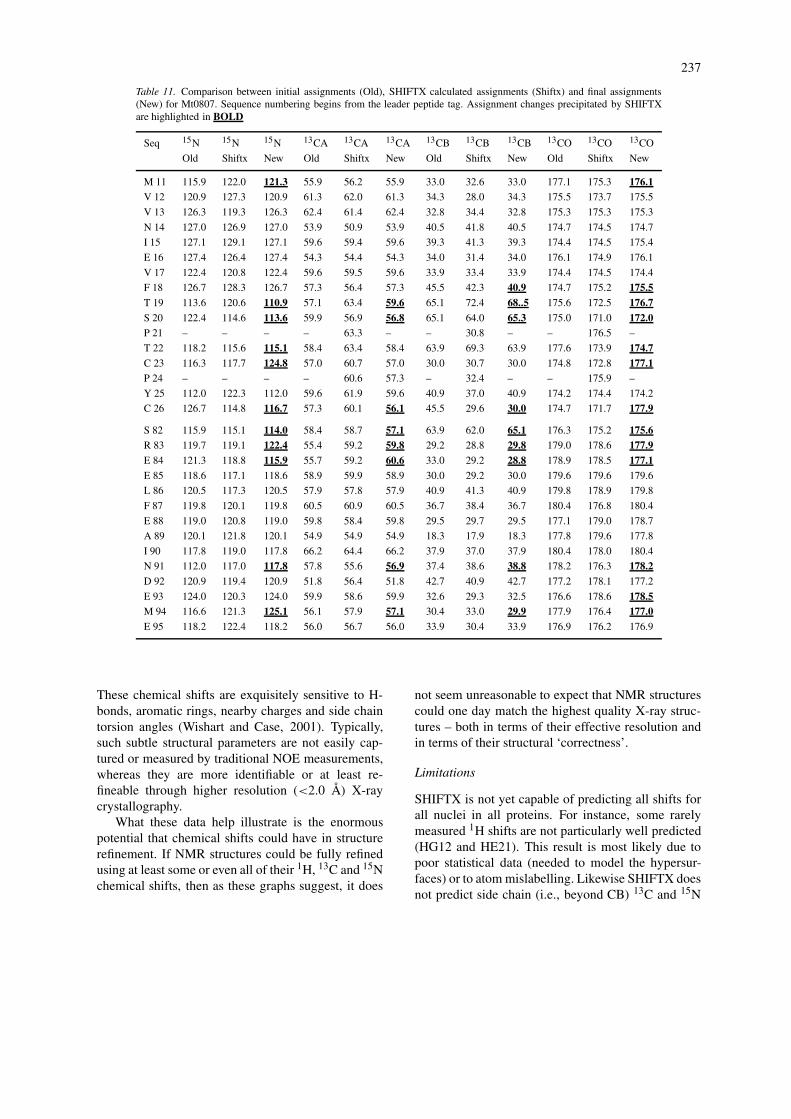
Another obvious application of SHIFTX is inchemical shift assignment checking or assignment val-idation. As anyone who has assigned spectra fromlarger proteins knows, there is always some uncer-tainty in the correctness of the chemical shift assign-ments. Many of these are corrected during the courseof subsequent structure determination steps, but some(particularly 13C and 15N shift errors) may not be soeasily detected. Shown in Table 11 is a list of chem-ical shift assignments for a small thioredoxin-likeprotein from Methanobaterium thermoautotrophicum,(Mt0807) which is being studied in our laboratory.Listed in this table are three sets of assignments for15N, 13CA, 13CB and 13CO shifts for two regions (theN terminus, near the active site, and the C terminus).
The first set corresponds to the initial set of assign-ments which was used in the subsequent structuregeneration. The second set corresponds to SHIFTX-calculated shifts generated from the initial Mt0807structure. The last set of shifts corresponds to the cor-rected, final set of shifts made after a series of manualand automated checks and corrections. Highlighted inbold are the changes that were made, partly as a conse-quence of the shift predictions generated by SHIFTX.Inspection of this table will indicate that SHIFTX wasable to flag a number of residues with large discrep-ancies between observed and predicted shift values.Furthermore, in many cases the final ‘corrected’ shiftsended up being much closer to the SHIFTX-calculatedshifts. In this way SHIFTX was able to guide the as-signment process and clarify a number of assignmentambiguities. Certainly, if a previously existing homol-ogous structure or even an exact X-ray structure isavailable, it should be possible to use SHIFTX predic-tions in a similar manner to help guide even the initialassignment process.
233
Figure 3. Plot of the observed vs. SHIFTX predicted 13Cα shift of ribonuclease H (BMRB1657). A dashed line is drawn with slope 1 andintercept of 0 to indicate how the best-fit line is offset by 1.63 ppm.
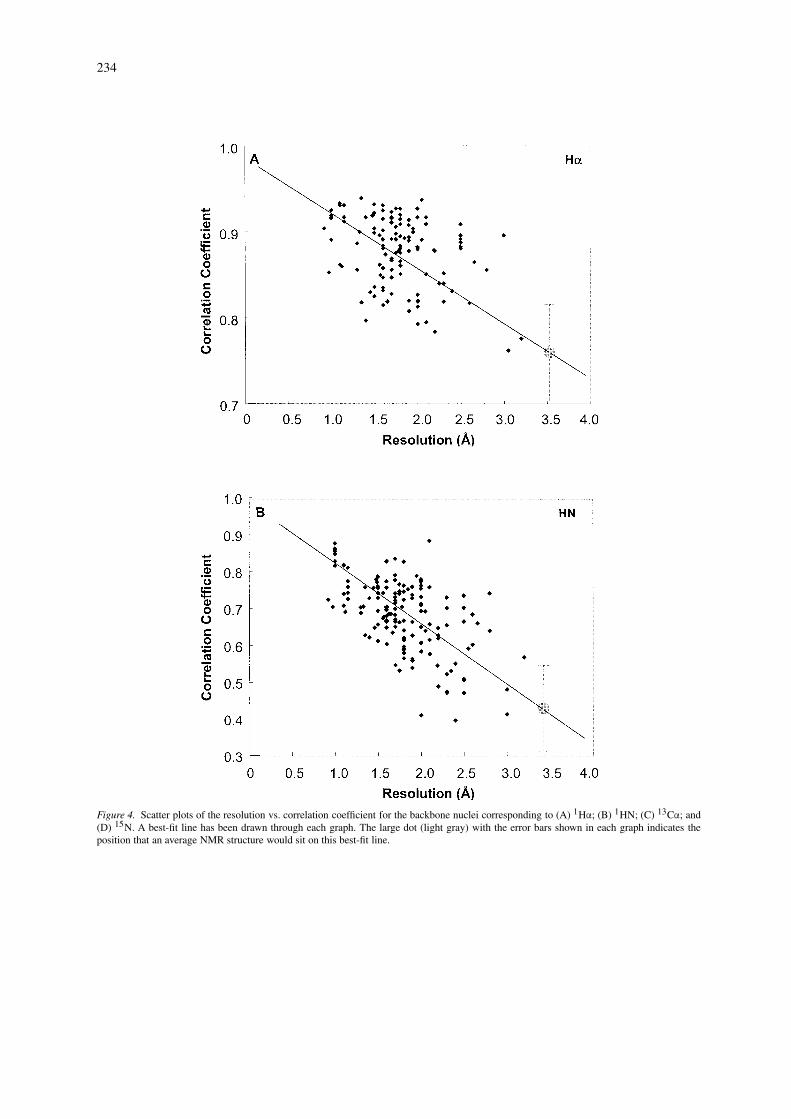
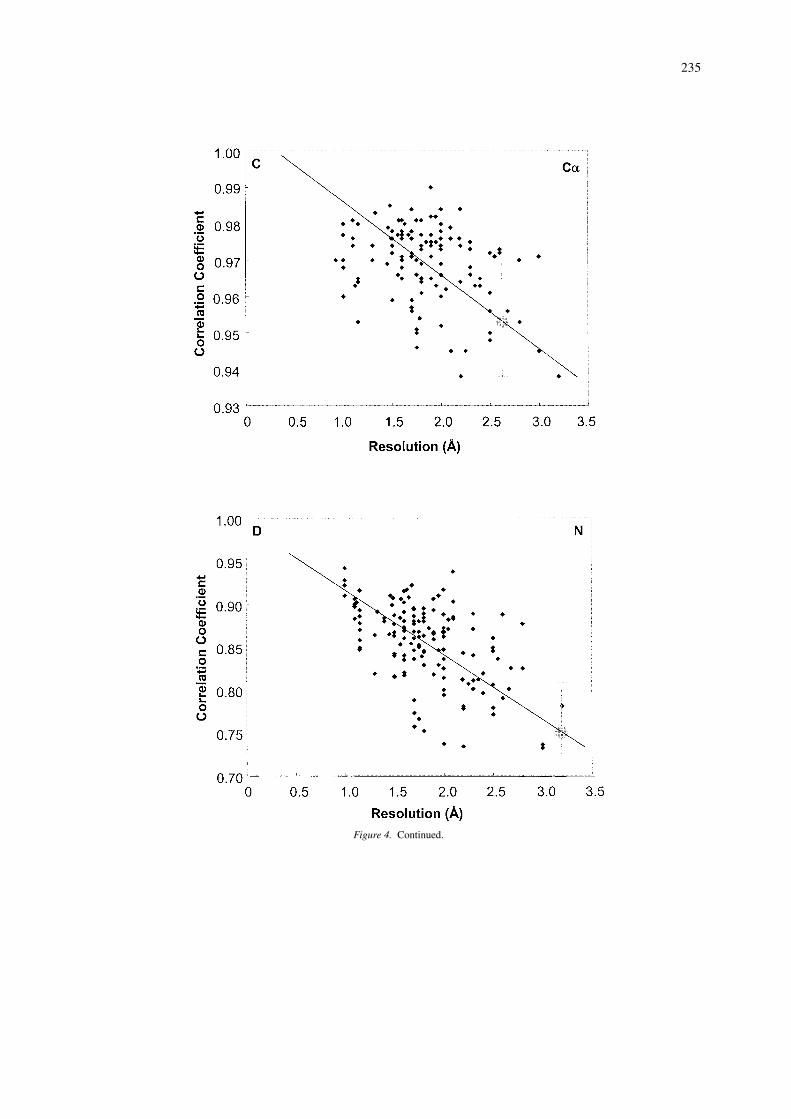
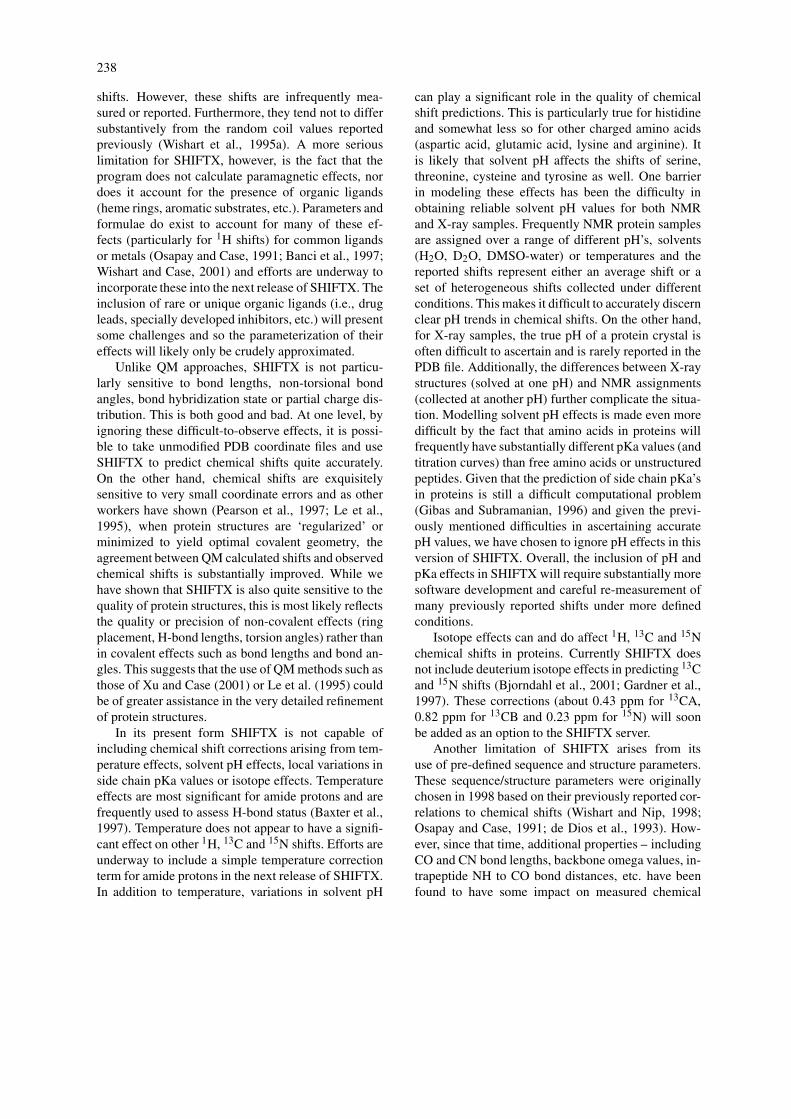
As a final example of an application of SHIFTX,we wish to show how chemical shift calculations canbe used to evaluate the relative quality of X-ray andNMR protein structures. As has been pointed outby a number of authors (Williamson et al., 1995;Kuszewski et al., 1995a; Laskowski et al., 1996),even the best NMR structures do not appear to havethe same quality or effective resolution as most X-raystructures. While the addition of more global restraints(i.e., residual dipolar couplings) or more preciselymeasured constraints (J-couplings) is certainly help-ing the situation, there is still a long way to go. Thediscrepancy between the quality of NMR structuresversus X-ray structures can be made particularly ev-ident if we plot out the correlation coefficient betweenSHIFTX-predicted and observed chemical shifts for1HA, 1HN, 15N and 13CA nuclei for X-ray structuresof varying resolution. These plots, which cover 123(13CA) to 157 (1HN) proteins each and which excludemost proteins from the SHIFTX training set, are illus-trated in Figure 4. As can be seen in all four plots,there is a modest, but obvious trend (r ∼ 0.6) show-ing that the agreement between SHIFTX-predicted
and observed shifts falls with decreasing resolution.A best-fit trend line is drawn through each of the fourdistributions. Now if we take all the NMR structures(ranging from 149 structures with 13CA shifts to 229structures with 1HA shifts) and calculate their aver-age correlation coefficient for each of the four nucleiwe find that, on average, NMR structures exhibit rel-atively poor agreement between SHIFTX-calculatedand observed chemical shifts. In fact, if we placea large dot (corresponding to the respective aver-age NMR correlation coefficients) on the trend linesshown in Figure 4, we can extrapolate that the averageprotein NMR structure is equivalent to an X-ray struc-ture of 3.0 to 3.5 Å resolution! This resolution estimateis slightly worse than what has been suggested byother authors using different approaches (Williamsonet al., 1995; Doreleijers et al., 1998; Laskowski et al.,1996), but given that we are effectively using four in-dependent shift measures, our conclusion appears tobe sound.
Interestingly, of all the shifts studied (including,side chain 1H, 13CB and 13CO) the best indicatorsof structure quality appear to be 1HN and 15N shifts.
234
Figure 4. Scatter plots of the resolution vs. correlation coefficient for the backbone nuclei corresponding to (A) 1Hα; (B) 1HN; (C) 13Cα; and(D) 15N. A best-fit line has been drawn through each graph. The large dot (light gray) with the error bars shown in each graph indicates theposition that an average NMR structure would sit on this best-fit line.
235
Figure 4. Continued.
236
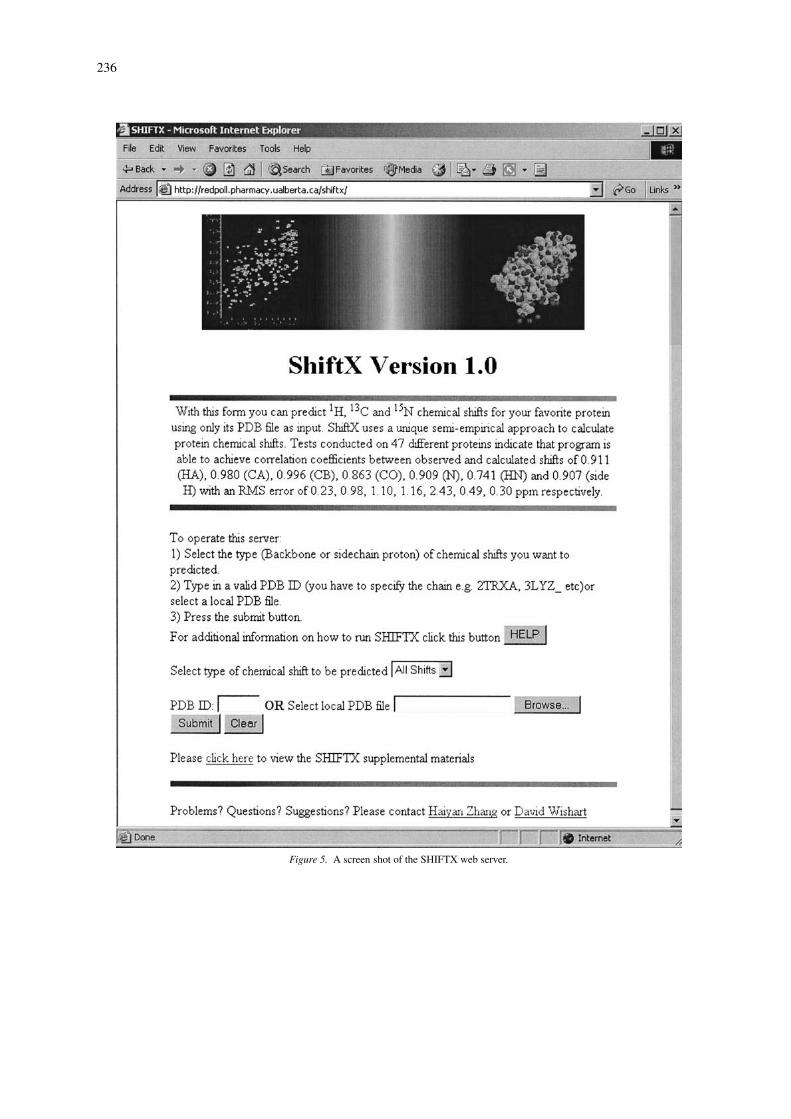
Figure 5. A screen shot of the SHIFTX web server.
237
Table 11. Comparison between initial assignments (Old), SHIFTX calculated assignments (Shiftx) and final assignments(New) for Mt0807. Sequence numbering begins from the leader peptide tag. Assignment changes precipitated by SHIFTXare highlighted in BOLD
Seq 15N 15N 15N 13CA 13CA 13CA 13CB 13CB 13CB 13CO 13CO 13CO
Old Shiftx New Old Shiftx New Old Shiftx New Old Shiftx New
M 11 115.9 122.0 121.3 55.9 56.2 55.9 33.0 32.6 33.0 177.1 175.3 176.1V 12 120.9 127.3 120.9 61.3 62.0 61.3 34.3 28.0 34.3 175.5 173.7 175.5
V 13 126.3 119.3 126.3 62.4 61.4 62.4 32.8 34.4 32.8 175.3 175.3 175.3
N 14 127.0 126.9 127.0 53.9 50.9 53.9 40.5 41.8 40.5 174.7 174.5 174.7
I 15 127.1 129.1 127.1 59.6 59.4 59.6 39.3 41.3 39.3 174.4 174.5 175.4
E 16 127.4 126.4 127.4 54.3 54.4 54.3 34.0 31.4 34.0 176.1 174.9 176.1
V 17 122.4 120.8 122.4 59.6 59.5 59.6 33.9 33.4 33.9 174.4 174.5 174.4
F 18 126.7 128.3 126.7 57.3 56.4 57.3 45.5 42.3 40.9 174.7 175.2 175.5T 19 113.6 120.6 110.9 57.1 63.4 59.6 65.1 72.4 68..5 175.6 172.5 176.7S 20 122.4 114.6 113.6 59.9 56.9 56.8 65.1 64.0 65.3 175.0 171.0 172.0P 21 – – – – 63.3 – – 30.8 – – 176.5 –
T 22 118.2 115.6 115.1 58.4 63.4 58.4 63.9 69.3 63.9 177.6 173.9 174.7C 23 116.3 117.7 124.8 57.0 60.7 57.0 30.0 30.7 30.0 174.8 172.8 177.1P 24 – – – – 60.6 57.3 – 32.4 – – 175.9 –
Y 25 112.0 122.3 112.0 59.6 61.9 59.6 40.9 37.0 40.9 174.2 174.4 174.2
C 26 126.7 114.8 116.7 57.3 60.1 56.1 45.5 29.6 30.0 174.7 171.7 177.9
S 82 115.9 115.1 114.0 58.4 58.7 57.1 63.9 62.0 65.1 176.3 175.2 175.6R 83 119.7 119.1 122.4 55.4 59.2 59.8 29.2 28.8 29.8 179.0 178.6 177.9E 84 121.3 118.8 115.9 55.7 59.2 60.6 33.0 29.2 28.8 178.9 178.5 177.1E 85 118.6 117.1 118.6 58.9 59.9 58.9 30.0 29.2 30.0 179.6 179.6 179.6
L 86 120.5 117.3 120.5 57.9 57.8 57.9 40.9 41.3 40.9 179.8 178.9 179.8
F 87 119.8 120.1 119.8 60.5 60.9 60.5 36.7 38.4 36.7 180.4 176.8 180.4
E 88 119.0 120.8 119.0 59.8 58.4 59.8 29.5 29.7 29.5 177.1 179.0 178.7
A 89 120.1 121.8 120.1 54.9 54.9 54.9 18.3 17.9 18.3 177.8 179.6 177.8
I 90 117.8 119.0 117.8 66.2 64.4 66.2 37.9 37.0 37.9 180.4 178.0 180.4
N 91 112.0 117.0 117.8 57.8 55.6 56.9 37.4 38.6 38.8 178.2 176.3 178.2D 92 120.9 119.4 120.9 51.8 56.4 51.8 42.7 40.9 42.7 177.2 178.1 177.2
E 93 124.0 120.3 124.0 59.9 58.6 59.9 32.6 29.3 32.5 176.6 178.6 178.5M 94 116.6 121.3 125.1 56.1 57.9 57.1 30.4 33.0 29.9 177.9 176.4 177.0E 95 118.2 122.4 118.2 56.0 56.7 56.0 33.9 30.4 33.9 176.9 176.2 176.9
These chemical shifts are exquisitely sensitive to H-bonds, aromatic rings, nearby charges and side chaintorsion angles (Wishart and Case, 2001). Typically,such subtle structural parameters are not easily cap-tured or measured by traditional NOE measurements,whereas they are more identifiable or at least re-fineable through higher resolution (<2.0 Å) X-raycrystallography.
What these data help illustrate is the enormouspotential that chemical shifts could have in structurerefinement. If NMR structures could be fully refinedusing at least some or even all of their 1H, 13C and 15Nchemical shifts, then as these graphs suggest, it does
not seem unreasonable to expect that NMR structurescould one day match the highest quality X-ray struc-tures – both in terms of their effective resolution andin terms of their structural ‘correctness’.
Limitations
SHIFTX is not yet capable of predicting all shifts forall nuclei in all proteins. For instance, some rarelymeasured 1H shifts are not particularly well predicted(HG12 and HE21). This result is most likely due topoor statistical data (needed to model the hypersur-faces) or to atom mislabelling. Likewise SHIFTX doesnot predict side chain (i.e., beyond CB) 13C and 15N
238
shifts. However, these shifts are infrequently mea-sured or reported. Furthermore, they tend not to differsubstantively from the random coil values reportedpreviously (Wishart et al., 1995a). A more seriouslimitation for SHIFTX, however, is the fact that theprogram does not calculate paramagnetic effects, nordoes it account for the presence of organic ligands(heme rings, aromatic substrates, etc.). Parameters andformulae do exist to account for many of these ef-fects (particularly for 1H shifts) for common ligandsor metals (Osapay and Case, 1991; Banci et al., 1997;Wishart and Case, 2001) and efforts are underway toincorporate these into the next release of SHIFTX. Theinclusion of rare or unique organic ligands (i.e., drugleads, specially developed inhibitors, etc.) will presentsome challenges and so the parameterization of theireffects will likely only be crudely approximated.
Unlike QM approaches, SHIFTX is not particu-larly sensitive to bond lengths, non-torsional bondangles, bond hybridization state or partial charge dis-tribution. This is both good and bad. At one level, byignoring these difficult-to-observe effects, it is possi-ble to take unmodified PDB coordinate files and useSHIFTX to predict chemical shifts quite accurately.On the other hand, chemical shifts are exquisitelysensitive to very small coordinate errors and as otherworkers have shown (Pearson et al., 1997; Le et al.,1995), when protein structures are ‘regularized’ orminimized to yield optimal covalent geometry, theagreement between QM calculated shifts and observedchemical shifts is substantially improved. While wehave shown that SHIFTX is also quite sensitive to thequality of protein structures, this is most likely reflectsthe quality or precision of non-covalent effects (ringplacement, H-bond lengths, torsion angles) rather thanin covalent effects such as bond lengths and bond an-gles. This suggests that the use of QM methods such asthose of Xu and Case (2001) or Le et al. (1995) couldbe of greater assistance in the very detailed refinementof protein structures.
In its present form SHIFTX is not capable ofincluding chemical shift corrections arising from tem-perature effects, solvent pH effects, local variations inside chain pKa values or isotope effects. Temperatureeffects are most significant for amide protons and arefrequently used to assess H-bond status (Baxter et al.,1997). Temperature does not appear to have a signifi-cant effect on other 1H, 13C and 15N shifts. Efforts areunderway to include a simple temperature correctionterm for amide protons in the next release of SHIFTX.In addition to temperature, variations in solvent pH
can play a significant role in the quality of chemicalshift predictions. This is particularly true for histidineand somewhat less so for other charged amino acids(aspartic acid, glutamic acid, lysine and arginine). Itis likely that solvent pH affects the shifts of serine,threonine, cysteine and tyrosine as well. One barrierin modeling these effects has been the difficulty inobtaining reliable solvent pH values for both NMRand X-ray samples. Frequently NMR protein samplesare assigned over a range of different pH’s, solvents(H2O, D2O, DMSO-water) or temperatures and thereported shifts represent either an average shift or aset of heterogeneous shifts collected under differentconditions. This makes it difficult to accurately discernclear pH trends in chemical shifts. On the other hand,for X-ray samples, the true pH of a protein crystal isoften difficult to ascertain and is rarely reported in thePDB file. Additionally, the differences between X-raystructures (solved at one pH) and NMR assignments(collected at another pH) further complicate the situa-tion. Modelling solvent pH effects is made even moredifficult by the fact that amino acids in proteins willfrequently have substantially different pKa values (andtitration curves) than free amino acids or unstructuredpeptides. Given that the prediction of side chain pKa’sin proteins is still a difficult computational problem(Gibas and Subramanian, 1996) and given the previ-ously mentioned difficulties in ascertaining accuratepH values, we have chosen to ignore pH effects in thisversion of SHIFTX. Overall, the inclusion of pH andpKa effects in SHIFTX will require substantially moresoftware development and careful re-measurement ofmany previously reported shifts under more definedconditions.
Isotope effects can and do affect 1H, 13C and 15Nchemical shifts in proteins. Currently SHIFTX doesnot include deuterium isotope effects in predicting 13Cand 15N shifts (Bjorndahl et al., 2001; Gardner et al.,1997). These corrections (about 0.43 ppm for 13CA,0.82 ppm for 13CB and 0.23 ppm for 15N) will soonbe added as an option to the SHIFTX server.
Another limitation of SHIFTX arises from itsuse of pre-defined sequence and structure parameters.These sequence/structure parameters were originallychosen in 1998 based on their previously reported cor-relations to chemical shifts (Wishart and Nip, 1998;Osapay and Case, 1991; de Dios et al., 1993). How-ever, since that time, additional properties – includingCO and CN bond lengths, backbone omega values, in-trapeptide NH to CO bond distances, etc. have beenfound to have some impact on measured chemical
239
shifts (Xu and Case, 2001). Hopefully the inclusionof these structural parameters and their correspond-ing hypersurfaces in future releases of SHIFTX shouldimprove its overall performance.
The fact that SHIFTX uses a hybrid approachdrawing on closed form analytical expressions in con-junction with empirical hypersurfaces and look-uptables makes the method somewhat less elegant thanQM methods or pure ‘classical’ approaches. It alsomakes SHIFTX less amenable to incorporation intomore standard structure refinement packages, such asAMBER or XPLOR, which rely on having smoothlydifferentiable functions for conjugate gradient or New-ton Raphson minimization. However, we have foundthat chemical shift optimization using SHIFTX canbe done relatively easily and effectively using a Sim-plex minimizer (which doesn’t require derivatives) orthrough Genetic algorithms or Monte Carlo searchesin torsion angle space. A report on this work will beforthcoming shortly.
Availability
SHIFTX is available as a web server at http://redpoll.pharmacy.ualberta.ca. A screen shot of the web serveris shown in Figure 5. Unsupported copies of theSHIFTX source and/or binary code (written in C, com-piled on Linux, Solaris, Irix, and Win32) may beobtained on request from the authors.
Acknowledgements
We with to thank Godwin Amegbey for providing hisassignment data on Mt0807 in advance of publication.Financial support by the Natural Sciences and Engi-neering Research Council (NSERC), Bristol–MyersSquibb and by the Protein Engineering Network ofCentres of Excellence (PENCE Inc.) is gratefullyacknowledged.
References
Baker, E.N. and Hubbard, R.E. (1984) Prog. Biophys. Mol. Biol.,44, 97–179.
Banci, L., Bertini, I., Savellini, G.G., Romagnoli, A., Turano, P.,Cremonini, M.A., Luchinat, C. and Gray, H.B. (1997) Prot.Struct. Funct. Gen., 29, 68–76.
Baxter, N.J. and Williamson, M.P. (1997) J. Biomol. NMR, 9, 359–369.
Beger, R.D. and Bolton, P.H. (1997) J. Biomol. NMR, 10, 129–142.
Berman, H.M., Westbrook, J., Feng, Z., Gilliland, G., Bhat, T.N.,Weissig, H., Shindyalov, I.N. and Bourne, P.E. (2000) Nucl.Acids Res., 28, 235–242.
Bjorndahl, T.C., Watson, M.S., Slupsky, C.M., Spyracopolous, L.,Sykes, B.D. and Wishart, D.S. (2001) J. Biomol. NMR, 19, 187–188.
Braun, D., Wider, G. and Wüthrich, K. (1994) J. Am. Chem. Soc.,116, 8466–8469.
Buckingham, A.D. (1960) Can. J. Chem., 38, 300–307.Case, D.A. (1998) Curr. Opin. Struct. Biol., 8, 624–630.Case, D.A. (2000) Curr. Opin. Struct. Biol., 10, 197–203.Cornilescu, G., Delaglio, F. and Bax, A. (1999) J. Biomol. NMR, 13,
289–302Dalgarno, D.C., Levine, B.A. and Williams, R.J.P. (1983) Biosci.
Rep., 3, 443–452.de Dios, A.C., Pearson, J.G. and Oldfield, E. (1993) Science, 260,
1491–1496.Derewenda, Z.S., Lee, L. and Derewenda, U. (1995) J. Mol. Biol.
252, 248–262.Doreleijers, J.F., Rullmann, J.A. and Kaptein, R. (1998) J. Mol.
Biol., 281, 149–164.Gardner, K.H., Rosen, M.K. and Kay, L.E. (1997) Biochemistry, 36,
1389–1401.Gibas, C.J. and Subramanian, S. (1996) Biophys. J. 71, 130–147.Haigh, C.W. and Mallion, R.B. (1980) Progr. NMR Spectrosc., 13,
303–344.Herranz, J., Gonzalez, C., Rico, M., Nieto, J.L., Santoro, J.,
Jimenez, M.A., Bruix, M., Neira, J.L. and Blanco, F.J. (1992)Magn. Reson. Chem., 30, 1012–1018.
Iwadate, M., Asakura, T. and Williamson, M.P. (1999) J. Biomol.NMR, 13, 199–211.
Kabsch, W. and Sander, C. (1983) Biopolymers, 22, 2577–2637.Kuszewski, J., Qin, J., Gronenborn, A.M. and Clore, G.M. (1995a)
J. Magn. Reson. B., 106, 92–96.Kuszewski, J., Gronenborn, A.M. and Clore, G.M. (1995b) J. Magn.
Reson., B107, 293–297.Laskowski, R.A., Rullmannn, J.A., MacArthur, M.W., Kaptein, R.
and Thornton, J.M. (1996) J. Biomol. NMR, 8, 477–486.Le, H. and Oldfield, E. (1994) J. Biomol. NMR, 4, 341–348.Le, H., Pearson, J.G., de Dios, A.C. and Oldfield, E. (1995). J. Am.
Chem. Soc. 117, 3800–3807.Markley, J.L., Bax, A., Arata, Y., Hilbers, C.W., Kaptein, R., Sykes,
B.D., Wright, P.E. and Wüthrich, K. (1998) J. Biomol. NMR, 12,1–23.
Osapay, K. and Case, D.A. (1991) J. Am. Chem. Soc., 113, 9436–9444.
Osapay, K. and Case, D.A. (1994) J. Biomol. NMR, 4, 215–230.Osapay, K., Theriault, Y., Wright, P.E. and Case, D.A. (1994) J.
Mol. Biol., 244, 183–197.Pearson, J.T., Le, H., Sanders, L.K., Godbout, N., Havlin, R.H. and
Oldfield, E. (1997) J. Am. Chem. Soc. 119, 11941–11950.Seavey, B.R., Farr, E.A., Westler, W.M. and Markley, J.L. (1991) J.
Biomol. NMR, 1, 217–236.Spera, S. and Bax, A. (1991) J. Am. Chem. Soc., 113, 5490–5492.Wagner, G., Pardi, A. and Wüthrich, K. (1983) J. Am. Chem. Soc.,
105, 5948.Williamson, M.P. and Asakura, T. (1997) Meth. Mol. Biol., 60, 53–
69.Williamson, M.P., Asakura, T., Nakamura, E. and Demura, M.
(1992) J. Biomol. NMR, 2, 93–98.Williamson, M.P., Kikuchi, J. and Asakura, T. (1995) J. Mol. Biol.,
247, 541–546.Wishart, D.S. and Case, D.A. (2001) Meth. Enzymol., 338, 3–34.

240
Wishart, D.S. and Nip, A.M. (1998) Biochem. Cell Biol., 76, 153–163.
Wishart, D.S. and Sykes, B.D. (1994) Meth. Enzymol., 239, 363–392.
Wishart, D.S., Bigam, C.G., Holm, A., Hodges, R.S. and Sykes,B.D. (1995a) J. Biomol. NMR, 5, 67–81.
Wishart, D.S., Bigam, C.G., Yao, J., Abildgaard, F., Dyson, H.J.,Oldfield, E., Markley, J.L. and Sykes, B.D. (1995b) J. Biomol.NMR, 6, 135–140.
Wishart, D.S., Sykes, B.D. and Richards, F.M. (1991) J. Mol. Biol.,222, 311–333.
Wishart, D.S., Willard, L., Richards, F.M. and Sykes, B.D. (1994)VADAR: A comprehensive program for protein structure evalu-ation. Version 1.2. Edmonton, Alberta, Canada.
Word, J.M., Lovell, S.C., Richardson, J.S. and Richardson, D.C.(1999) J. Mol. Biol., 285, 1733–1747.
Xu, X-P. and Case, D.A. (2001) J. Biomol. NMR, 21, 321–333.Xu, X-P. and Case, D.A. (2002) Biopolymers, 65, 408–423.Zhang, H., Neal, S. and Wishart, D.S. (2003) J. Biomol. NMR, 25,
173–195.
Related Documents