i LIKELY DEMAND OF VEGETABLES OF HIMACHAL PRADESH IN THE NEIGHBOURING CONSUMING STATES DURING NEXT TEN YEARS Study sponsored by Department of Agriculture, Government of Himachal Pradesh, Shimla Ranveer Singh C.s. Vaidya Anshuman Karol AGRO-ECONOMIC RESEARCH CENTRE HIMACHAL PRADESH UNIVERSITY SHIMLA-171005 (INDIA) JUNE 2006

Welcome message from author
This document is posted to help you gain knowledge. Please leave a comment to let me know what you think about it! Share it to your friends and learn new things together.
Transcript
i
LIKELY DEMAND OF VEGETABLES OF HIMACHAL PRADESH IN
THE NEIGHBOURING CONSUMING STATES DURING NEXT TEN
YEARS
Study sponsored by
Department of Agriculture, Government of Himachal Pradesh, Shimla
Ranveer Singh C.s. Vaidya
Anshuman Karol
AGRO-ECONOMIC RESEARCH CENTRE HIMACHAL PRADESH UNIVERSITY SHIMLA-171005 (INDIA)
JUNE 2006
ii
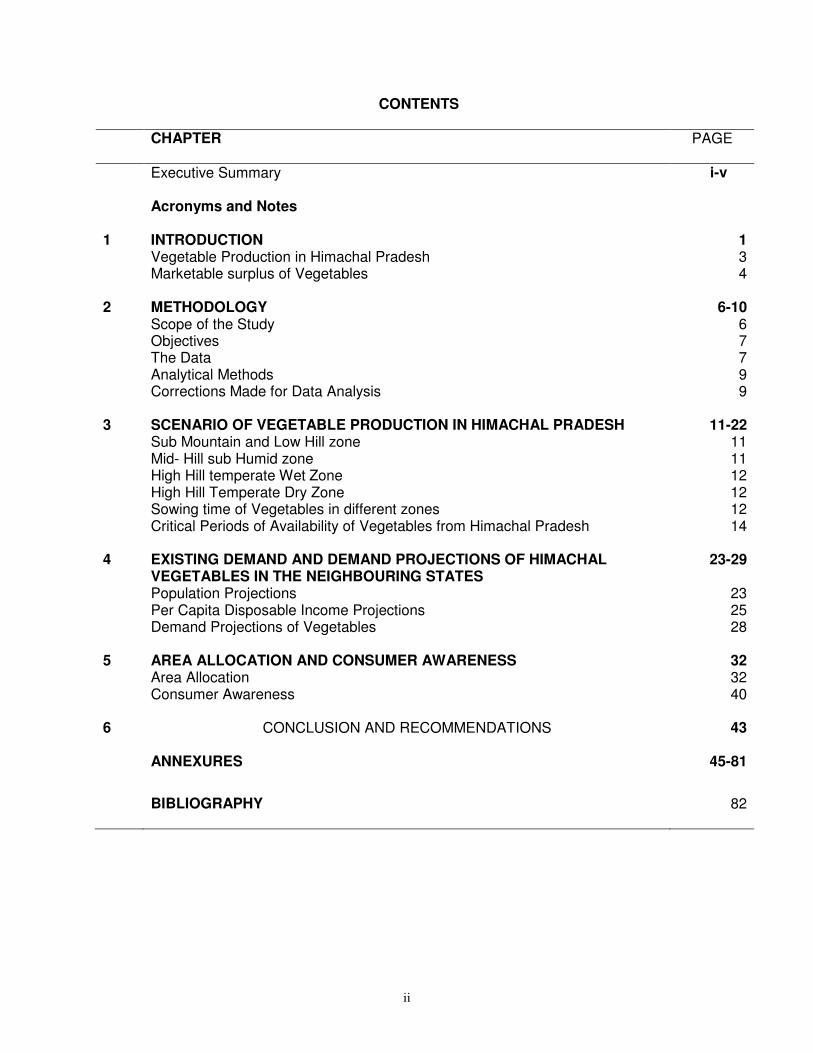
CONTENTS
CHAPTER PAGE
Executive Summary
i-v
Acronyms and Notes
1 INTRODUCTION 1 Vegetable Production in Himachal Pradesh 3 Marketable surplus of Vegetables 4
2 METHODOLOGY 6-10 Scope of the Study 6 Objectives 7 The Data 7 Analytical Methods 9 Corrections Made for Data Analysis 9
3 SCENARIO OF VEGETABLE PRODUCTION IN HIMACHAL PRADESH 11-22 Sub Mountain and Low Hill zone 11 Mid- Hill sub Humid zone 11 High Hill temperate Wet Zone 12 High Hill Temperate Dry Zone 12 Sowing time of Vegetables in different zones 12 Critical Periods of Availability of Vegetables from Himachal Pradesh 14
4 EXISTING DEMAND AND DEMAND PROJECTIONS OF HIMACHAL
VEGETABLES IN THE NEIGHBOURING STATES 23-29
Population Projections 23 Per Capita Disposable Income Projections 25 Demand Projections of Vegetables 28
5 AREA ALLOCATION AND CONSUMER AWARENESS 32 Area Allocation 32 Consumer Awareness 40
6 CONCLUSION AND RECOMMENDATIONS 43
ANNEXURES 45-81
BIBLIOGRAPHY 82
iii
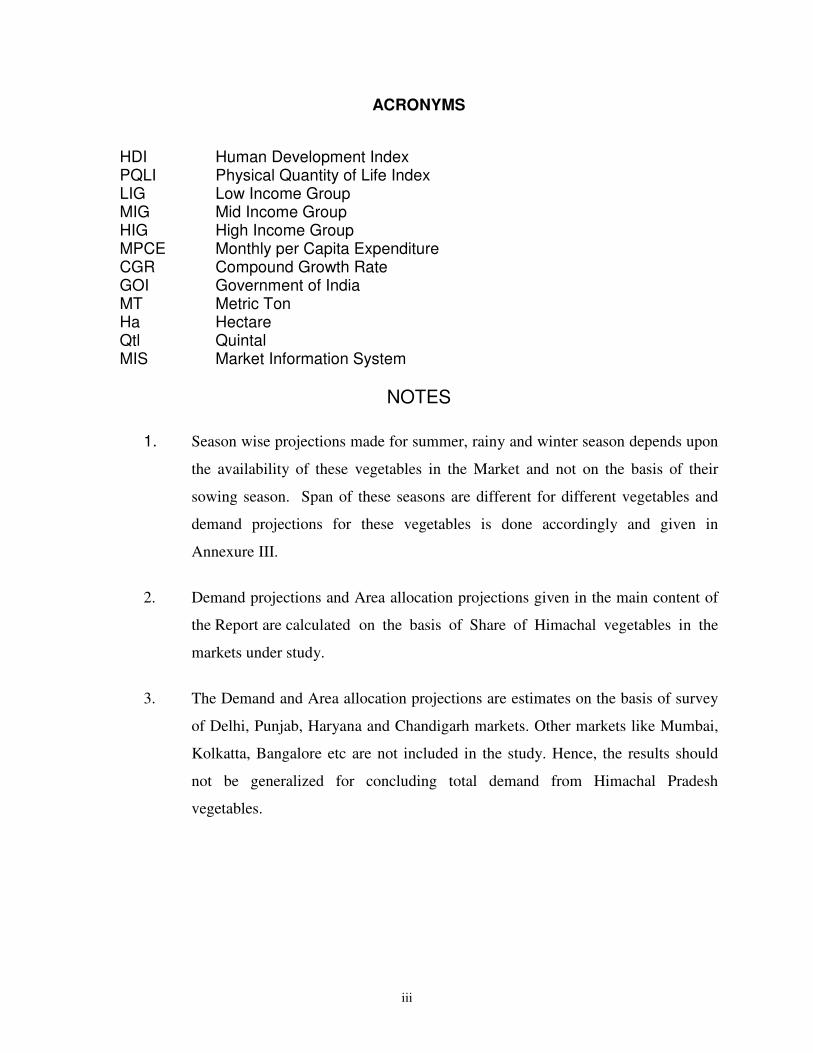
ACRONYMS
HDI Human Development Index PQLI Physical Quantity of Life Index LIG Low Income Group MIG Mid Income Group HIG High Income Group MPCE Monthly per Capita Expenditure CGR Compound Growth Rate GOI Government of India MT Metric Ton Ha Hectare Qtl Quintal MIS Market Information System
NOTES
1. Season wise projections made for summer, rainy and winter season depends upon
the availability of these vegetables in the Market and not on the basis of their
sowing season. Span of these seasons are different for different vegetables and
demand projections for these vegetables is done accordingly and given in
Annexure III.
2. Demand projections and Area allocation projections given in the main content of
the Report are calculated on the basis of Share of Himachal vegetables in the
markets under study.
3. The Demand and Area allocation projections are estimates on the basis of survey
of Delhi, Punjab, Haryana and Chandigarh markets. Other markets like Mumbai,
Kolkatta, Bangalore etc are not included in the study. Hence, the results should
not be generalized for concluding total demand from Himachal Pradesh
vegetables.
i
EXECUTIVE SUMMARY
Relevance of the Study
The work on long term demand and supply projections of fresh vegetables
produced in Himachal Pradesh is mainly confined to behaviour of production of
different vegetables in the state. The recent technological breakthrough in
agriculture has stressed the need for diversification which suggests that vegetables
are likely to provide exceptionally good opportunities to the economy of farmers as
well as state to develop at a rapid speed. Moreover, the vegetables have a rich
nutritional value. Hence, their importance cannot be overlooked and therefore,
accurate projections of demand and supply are a vital pre- requisite for any effective
policy. It is therefore, important to study the demand and supply scenario of fresh
vegetables of Himachal Pradesh being marketed in the neighbouring states like
Haryana, Punjab and Delhi and Chandigarh. With this background the present study
is would be conducted with the following specific objectives.
Objectives of the Study
1. To study the supply of various vegetables from Himachal Pradesh with a
view to analyse the critical periods when the vegetables should reach in
the market and new vegetables which are to be introduced in order to take
advantage of market demand in the neighbouring states.
2. To analyse the existing demand for Himachal vegetables and to project
demand for vegetables in the consuming markets of neighbouring states.
3. To suggest the area allocation and other policy measures keeping in view
the future demand for such vegetables.
Methodology
The data is collected from the main consuming centers of Himachal
vegetables. Delhi and Chandigarh are the two main markets where vegetables from
ii
Himachal Pradesh are marketed and consumed. Hence, these two markets will be
selected purposively. Other four markets will be selected from two neighbouring
states viz. Haryana and Punjab on the consideration that either the vegetables are
directly sent to these markets or they are being fed by the large markets of
Chandigarh and Delhi. In order to meet out the requirements of the different
objectives of the study, different statistical tools and techniques were used.
Household demand for vegetables, by and large, depends upon the size of the
family, family’s disposable income etc. Linear Demand function was used to
determine demand of different vegetables. On the basis of these projections, season
wise area allocation under important vegetables of Himachal Pradesh is obtained for
next 10 years i.e. from 2005-06 to 2015-16.
Main Findings
Population Projections
The aggregate demand for a commodity is nothing but the per capita demand
multiplied by the total population. On analysing the population projections for
different States and UT covered under this study, it was found that the growth of
urban population is higher. Since, urban population has higher per capita income
and disposable income, the urban population is the major consumer of vegetables in
these states. The results revealed that growth rate of urban population in the
selected states are higher than the growth rate of rural population. The urban
population grows at the rate of 51.36 percent in Delhi followed by 50.86, 39.65 and
37.56 percent in Haryana, Chandigarh and Punjab respectively.
Per Capita Disposable income Projections
An individual’s demand for a commodity depends upon the level of income in
addition to changes in relative prices, consumption habits, tastes and preferences
etc. The income of consumer is hard to assess and since consumption is actually
the function of disposable income, hence the projections of disposable income on
per capita per month basis were made. The per capita disposable income
iii
projections were made at constant prices over the period 2005-06 to 2015-16
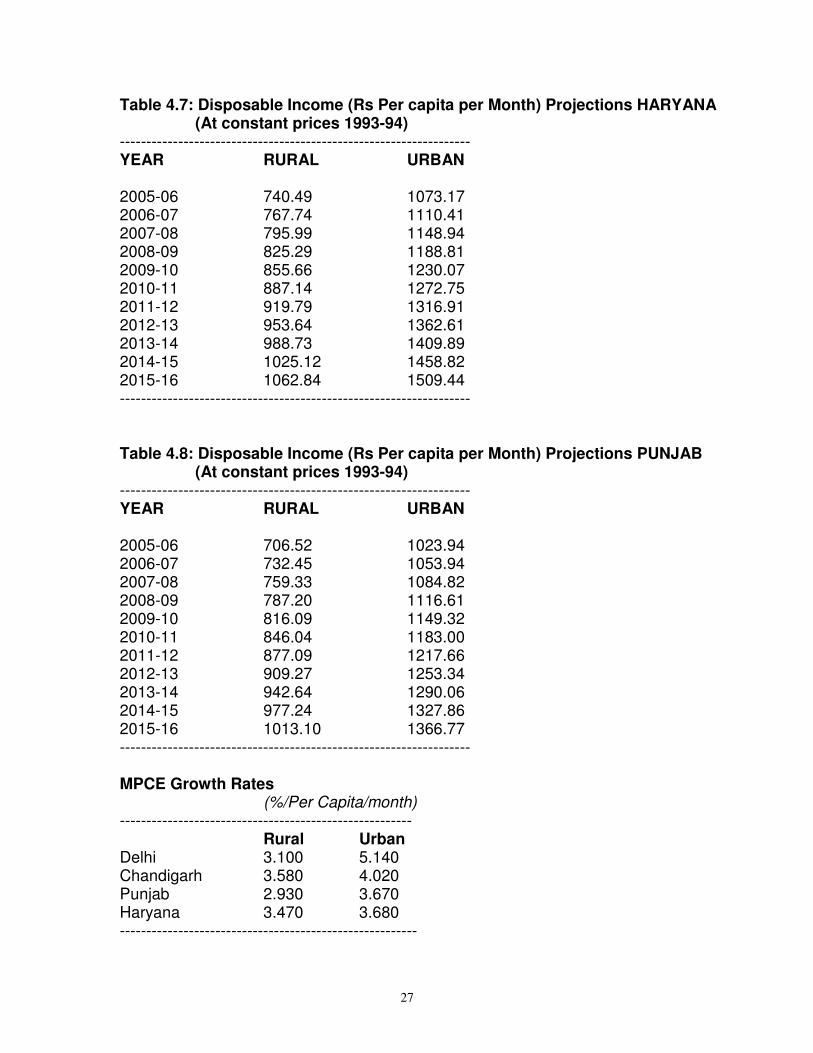
keeping 1993-94 as base. The results revealed that per capita per month disposable
income is higher in urban population as compared to rural population. The estimates
are highest for Chandigarh followed by Haryana, Punjab and Delhi.
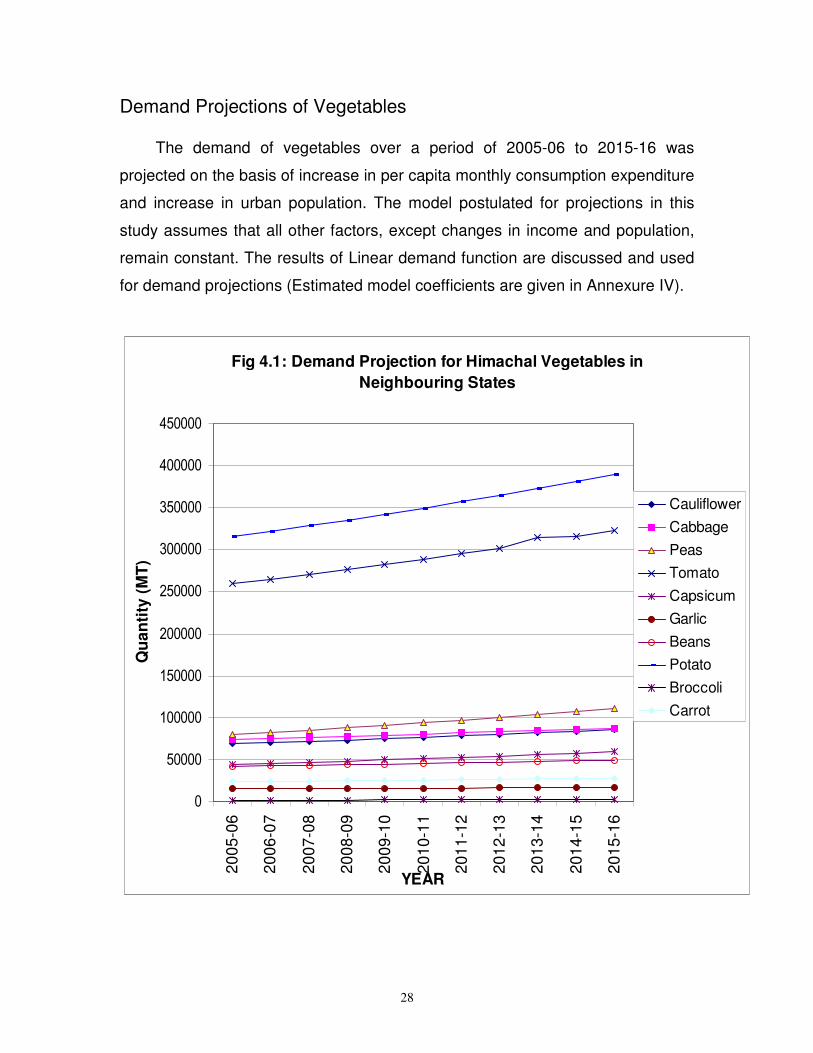
Demand Projections of Vegetables
The demand of vegetables over a period of 2005-06 to 2015-16 was projected
on the basis of increase in per capita monthly consumption expenditure and
increase in urban population. The model postulated for projections in this study
assumes that all other factors, except changes in income and population, remain
constant.
Himachal vegetables are available in the market during summer and rainy
seasons. Therefore, on analysing the results, it was found that demand for
cauliflower, cabbage, peas, tomato, capsicum, potato, carrot and broccoli tends to
increase in near future. Since these vegetables are off-seasonal in nature for the
markets covered under the study, hence, Himachal could have the major share in
the supply of these vegetables. Besides this, demand of exotic vegetables like
lettuce, asparagus, celery, Swiss chard, parsley, Brussels’s sprouts, broccoli, red
Cabbage, red and yellow capsicum etc. among the mid and high income population
is also very high. Presently the supply of these vegetables is very limited. Thus
these vegetables are affordable to five star hotels and large restaurants. Changing
life style of mid and high income class tends to include continental cuisine in their
daily diet. Hence, demand for these vegetables would increase in near future.
Area Allocation
On analysing the demand pattern for the next 10 years, it was found that the
demand of some important vegetables requires more area for their cultivation. Peas
Area under Pea cultivation in the State during 2004-05 was 15441 ha.
Peas are mainly grown in Lahaul –Spiti, Kinnaur and Shimla districts, which are
purely off-seasonal in nature and fetches very high price in the market. Though the
iv
projected area for 2005-06 comes out to be 7996 ha and shows a surplus area of
7445 ha, but this may be attributed to the fact that about 50 percent of the total
production of Pea goes to other markets like, Bangalore, Maharashtra, Kolkatta etc.
which are not covered under this study and some share out of this may also be
consumed within the State. Hence, area under peas should be increased to reap the
benefits of their high prices during the season.
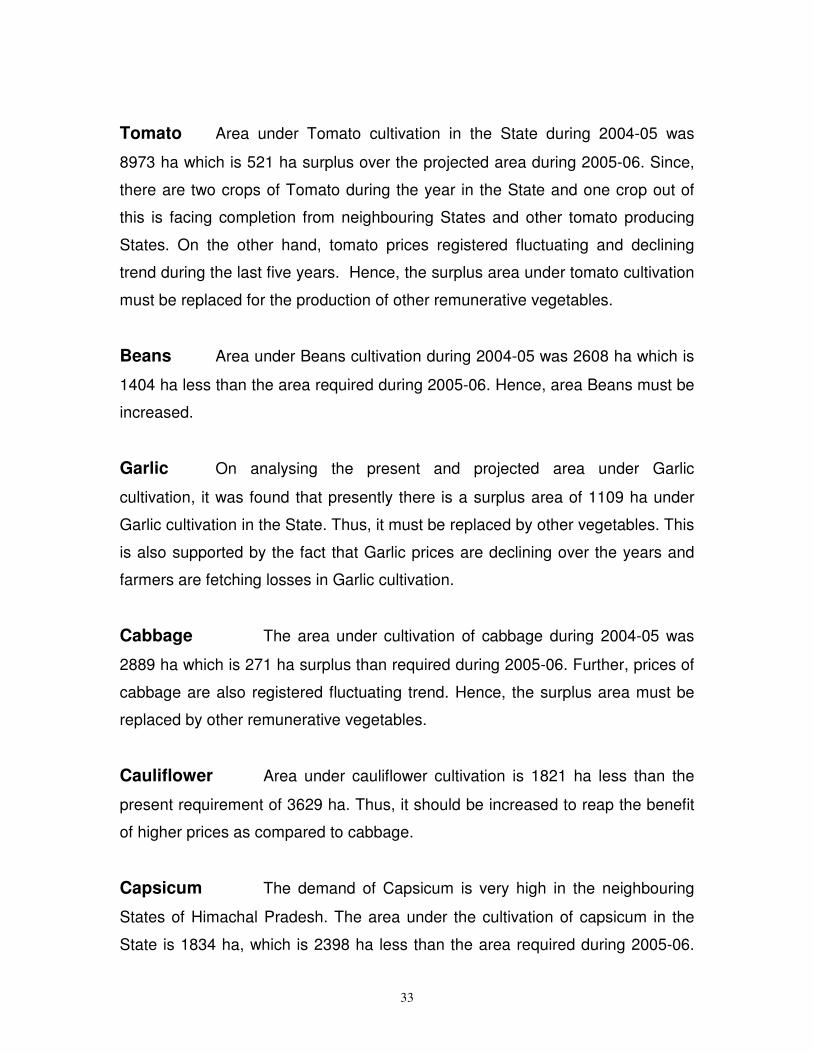
Tomato Area under Tomato cultivation in the State during 2004-05 was 8973
ha which is 521 ha surplus over the projected area during 2005-06. Since, there are
two crops of Tomato during the year in the State and one crop out of this is facing
completion from neighbouring States and other tomato producing States. On the
other hand, tomato prices registered fluctuating and declining trend during the last
five years. Hence, the surplus area under tomato cultivation must be replaced for
the production of other remunerative vegetables.
Beans Area under Beans cultivation during 2004-05 was 2608 ha which is
1404 ha less than the area required during 2005-06. Hence, area Beans must be
increased.
Garlic On analysing the present and projected area under Garlic cultivation, it
was found that presently there is a surplus area of 1109 ha under Garlic cultivation
in the State. Thus, it must be replaced by other vegetables. This is also supported by
the fact that Garlic prices are declining over the years and farmers are fetching
losses in Garlic cultivation.
Cabbage The area under cultivation of cabbage during 2004-05 was 2889
ha which is 271 ha surplus than required during 2005-06. Further, prices of cabbage
are also registered fluctuating trend. Hence, the surplus area must be replaced by
other remunerative vegetables.
Cauliflower Area under cauliflower cultivation is 1821 ha less than the
present requirement of 3629 ha. Thus, it should be increased to reap the benefit of
higher prices as compared to cabbage.
Capsicum The demand of Capsicum is very high in the neighbouring
States of Himachal Pradesh. The area under the cultivation of capsicum in the State
is 1834 ha, which is 2398 ha less than the area required during 2005-06. Hence, it
v
must be increased by replacing area under Tomato cultivation especially in Solan
district of Himachal Pradesh.
Potato Potato is an important off-seasonal seed crop of Lahaul-Spiti district of
Himachal Pradesh. Besides, it is also grown in Kinnaur and high hills of district
Shimla. Area under potato cultivation during 2004-05 was 14100 ha. On the basis of
demand projections, it was found that 12582 ha additional area is required to meet
the potato demand of neighbouring States.
Himachal Pradesh has a potential of becoming vegetable bowl of the country
because the State has diverse agro-climatic conditions and scope of growing off-
season vegetables is also very high. Most of the farmers of Himachal Pradesh are
marginal and many of them recognize that the potential income from growing
vegetables is higher than that of growing cereals. To achieve the desired results
area under vegetable cultivation should be increased in the State, area under exotic
vegetables must be increased immediately to bridge the gap between demand and
supply, there should be an advertising campaign for Himachal vegetables especially
exotic vegetables to get due share in the market, vegetable growers should organize
themselves into farmers’ cooperatives and link themselves with the district
cooperatives or State cooperatives, MIS should be strengthened for the timely
availability of information to the farmers so that they can plan their schedule for
growing vegetables and last but not the least to avoid crises and risks, early warning
systems and risk relief measures need to be in place to ensure economic security.
1
Chapter I
INTRODUCTION
Economic development is a long term process in which several forces and
factors of production work together to bring about an economic change for the
betterment. So, as to measure economic development, several criteria have been
noted viz., quantitative and qualitative. In recent years, the qualitative aspects are
gaining importance for which the ‘Human Development Index (HDI) and Physical
Quality of Life Index (PQLI)’ are used. Human development is conceived as a
process of enlarging human capabilities and choices. Apart from the basic
necessities, the human choices include long life, good health and an improvement in
the quality of life which includes a reduction in the ratio of poverty or hunger.
For ages, the main emphasis of cereal crops was just to feed the teaming
millions. But cereals alone offer little hope for raising farmers out of poverty. For this
new cropping systems are needed and vegetable farming is an excellent choice as a
cash crop. The gestation period of vegetables varies 3 to 4 months, produce higher
marketable surplus and generate higher prices at markets compared to cereals.
Vegetables are more suited for production on small and marginal land parcels,
where decreasing farm size, increasing number of operational holding are the major
problems of the cultivators. On an average, size of holding in India is 1.57 Hectares,
which is going down by further fragmentation of land holdings.
A strong vegetable sector in India will lead to economic growth through out
the country. Cultivating vegetables provides more jobs compared to cereal
production. The vegetable production will diversify and generate farm income
greater than other products. Vegetables farming develop management and
leadership skills among farmers and create service industries that can help entire
community.
2
With the suitable agro- climatic conditions prevailing in the country, India has
been the largest producer of vegetables in the world. The production of vegetables
in the country is growing at the rate of 4.14 percent per annum during the last
decade as presented in Table 1.1. Vegetable production was 90 million tonnes with
the total area under vegetable cultivation 6.2 million hectares during 2003-04. Indian
farmers grow an amazing number of different vegetables, 175 different types in all,
but potato, tomato, onion, cabbage and cauliflower accounts for 60 per cent of total
production. It is projected that the domestic vegetables requirement will rise from
current levels of 83-91 million tonnes to 151-193 million tonnes by 2030. Indian
farmers today cannot meet the high domestic demand for vegetables, as India
imports approximately $ 678 million of vegetables requirements.
(Shanmugasundaram, 2004).
Vegetables are the valuable source of proteins, minerals, vitamins and to
some extent carbohydrates. The Nutritional Expert Group prescribes a minimum of
2400- 3900 calories of energy, 55 g of proteins, 0.4- 0.5 g calcium, 20 mg iron etc. to
the adult. To fulfill these prescriptions, the simplest solution is the consumption of
vegetables, as they possess, all of these ingredients. Further, for a balanced diet, an
adult needs about, 280 g of vegetables per day, out of this about 85 g are leafy
vegetables and rest are other kind of vegetables. However, though there has been a
considerable increase in the production of vegetables, the much needed nutritional
status of the population has not improved much as the per capita availability of
vegetables is still far less than the recommended levels.
3
Table 1.1: Area, Production and Productivity of Vegetables in India
Year Area (000’ ha)
Production (000’ MT)
Productivity (MT/ha)
1991-92 5593 58532 10.5
1992-93 5045 63806 12.6
1993-94 4876 65787 13.5
1994-95 5013 67286 13.4
1995-96 5335 71594 13.4
1996-97 5515 75074 13.6
1997-98 5607 72683 13.0
1998-99 5873 87536 14.9
1999-2000 5991 90823 15.2
2000-01 6250 93849 15.0
2001-02 6156 88622 14.4
2002-03 6092 84815 13.9
CGR (%) 2.00 4.14 2.09
Source: Economic Survey, Various Issues, GOI
Vegetable Production in Himachal Pradesh
The agriculture in Himachal Pradesh is not merely an occupation but a way of
life and has become an essential part of the economic and cultural set up of the
state. Himachal Pradesh is known for off-season vegetables. These do not face any
competition from identical producer of the Plains, thus producers have an absolute
advantage in vegetable production as compared to other crops. This absolute
advantage of production fetches higher vegetables prices from markets of plains.
With the advent of new hybrid varieties of seeds, vegetables can be grown in
comparative harsh climatic conditions. Due to this reason the producers in the state
moving fast towards vegetable production. At present thirty-four vegetables crops
including exotic vegetables like Lettuce, Asparagus, Celery, Swiss Chard, Parsley,
Kale, Brussels’s Sprouts, Broccoli, Red Cabbage, etc. are being grown successfully.
The state is also famous for the production of disease free and quality potato seed
production. Other temperate vegetables like off-seasonal table potato, cabbage,
cauliflower, tomato, peas, turnip, radish, carrot and French beans are being
produced during the period when they cannot be grown in the adjoining plains and
4
they are in great demand. For this reason, hill vegetables are fetching higher prices
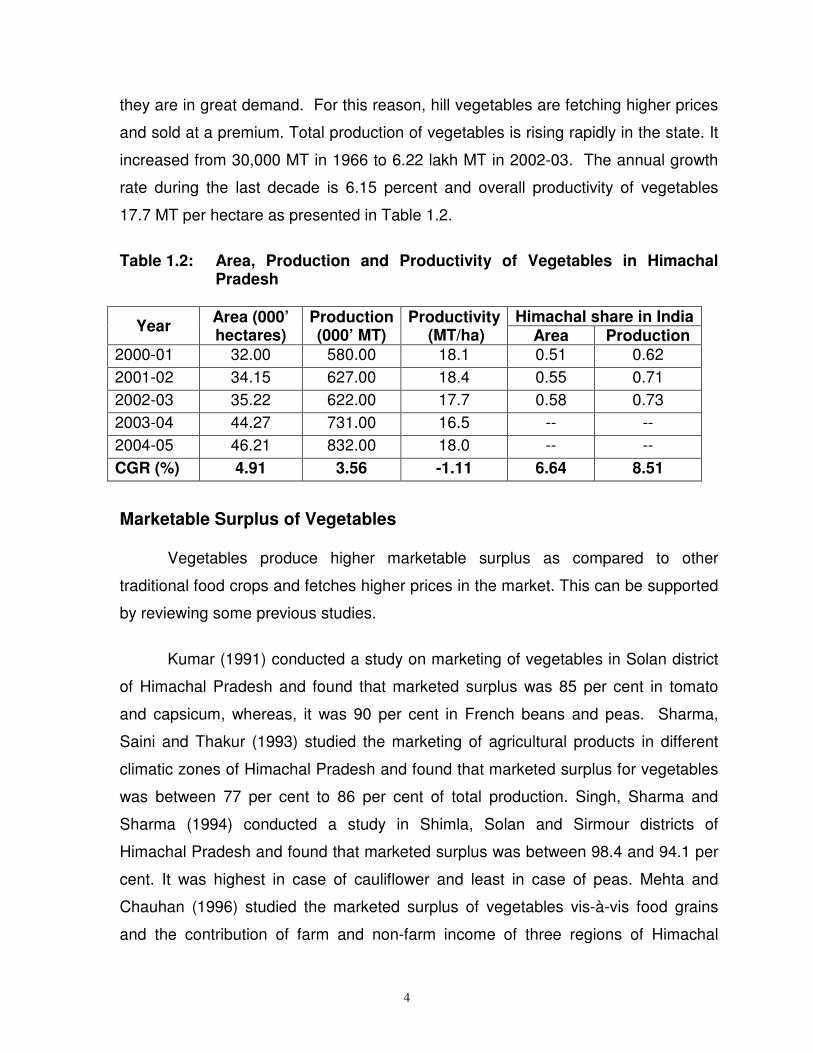
and sold at a premium. Total production of vegetables is rising rapidly in the state. It
increased from 30,000 MT in 1966 to 6.22 lakh MT in 2002-03. The annual growth
rate during the last decade is 6.15 percent and overall productivity of vegetables
17.7 MT per hectare as presented in Table 1.2.
Table 1.2: Area, Production and Productivity of Vegetables in Himachal
Pradesh
Year Area (000’ hectares)
Production (000’ MT)
Productivity (MT/ha)
Himachal share in India Area Production
2000-01 32.00 580.00 18.1 0.51 0.62
2001-02 34.15 627.00 18.4 0.55 0.71
2002-03 35.22 622.00 17.7 0.58 0.73
2003-04 44.27 731.00 16.5 -- --
2004-05 46.21 832.00 18.0 -- --
CGR (%) 4.91 3.56 -1.11 6.64 8.51
Marketable Surplus of Vegetables
Vegetables produce higher marketable surplus as compared to other
traditional food crops and fetches higher prices in the market. This can be supported
by reviewing some previous studies.
Kumar (1991) conducted a study on marketing of vegetables in Solan district
of Himachal Pradesh and found that marketed surplus was 85 per cent in tomato
and capsicum, whereas, it was 90 per cent in French beans and peas. Sharma,
Saini and Thakur (1993) studied the marketing of agricultural products in different
climatic zones of Himachal Pradesh and found that marketed surplus for vegetables
was between 77 per cent to 86 per cent of total production. Singh, Sharma and
Sharma (1994) conducted a study in Shimla, Solan and Sirmour districts of
Himachal Pradesh and found that marketed surplus was between 98.4 and 94.1 per
cent. It was highest in case of cauliflower and least in case of peas. Mehta and
Chauhan (1996) studied the marketed surplus of vegetables vis-à-vis food grains
and the contribution of farm and non-farm income of three regions of Himachal
5
Pradesh. Their study revealed that the marketed surplus of food grains was low in all
the regions while marketed surplus for vegetables was very high in all the regions.
Lal, Thakur and Sharma (1997) conducted a study in Kangra and Mandi districts of
Himachal Pradesh to estimate the marketable and marketed surplus and found that
surplus of different vegetables ranged between 83 and 97 per cent.
The proportion of marketable and marketed surplus of vegetables to the total
production is greater than that of the foodgrains. Sharma, Saini and Thakur (1993)
found that the proportion of foodgrains was in the range of 2.3 to 30.47 per cent on
different size of land holdings, but it was in the range of 77.7 to 87 per cent in case
of vegetables. Mehta and Chauhan (1996) in their study to estimate the marketed
surplus of vegetables vis-a-vis food grains in different regions of Himachal Pradesh
found that the marketed surplus of food grains was low in all the regions, whereas it
was very high in case of vegetables. Singh, Ratan and Bhati (2000) in their study in
Himachal Pradesh found that in case of fruits and vegetables, a very high proportion,
more than 90 per cent of the total produce goes to the markets as marketed surplus.
Marketed surplus in food grains like wheat, maize and paddy it was between 45 to
68 per cent.
6
Chapter II
METHODOLOGY
The main objective of economic planning in under developed countries is to
achieve a higher standard of living for the masses through more employment and
higher production leading to rapid increase in their real per capita income. A rise in
real per capita income is usually accompanied by an increase in demand for
different commodities. The importance of long term projections of economic growth,
their bearing on agricultural development and their significance to an economy
committed to planned development, need not to be over emphasized. An appraisal
of the magnitude of long term demand and supply for different commodities would
provide guidelines to planners in allocating various resources. Likewise, a realistic
assessment of the production possibilities would indicate the extent and direction in
which the imbalances are likely to arise in different sectors and regions.
The determination and direction of future demand requires knowledge of a
number of factors such as prices of the product, prices of substitutes, population.,
consumer behaviour and income. The validity and usefulness of the projections will
be conditioned by the extent to which these factors are taken into account while
arriving at the order of magnitude. In any such projection, attempt should be made to
derive alternative projections based upon different sets of assumptions regarding the
determinants of demand and supply over the projected period. For the purpose of
arriving at the range of demand projections, different assumptions with respect to the
increase in national income, growth of population, rise in per capita income and
change in income elasticity of demand etc. should be considered.
Scope of the Study
The work on long term demand and supply projections of fresh vegetables
produced in Himachal Pradesh is mainly confined to behaviour of production of
different vegetables in the state. The recent technological breakthrough in
agriculture has stressed the need for diversification which suggests that vegetables
7
are likely to provide exceptionally good opportunities to the economy of farmers as
well as state to develop at a rapid speed. Moreover, the vegetables have a rich
nutritional value. Hence, their importance cannot be overlooked and therefore,
accurate projections of demand and supply are a vital pre- requisite for any effective
policy. It is recognized that the estimates of demand and supply elasticities are
crucial, and a projection is only as good as these estimates. It is therefore, important
to study the demand and supply scenario of fresh vegetables of Himachal Pradesh
being marketed in the neighbouring states like Haryana, Punjab and Delhi. With this
background the present study was conducted with the following specific objectives.
Objectives
4. To study the supply of various vegetables from Himachal Pradesh with a
view to analyse the critical periods when the vegetables should reach in
the market and new vegetables which are to be introduced in order to take
advantage of market demand in the neighbouring states.
5. To analyse the existing demand for Himachal vegetables and to project
demand for vegetables in the consuming markets of neighbouring states.
6. To suggest the area allocation and other policy measures keeping in view
the future demand for such vegetables.
The Data
The objectives of the study requires that the data is collected from the main
consuming centers of Himachal vegetables. Delhi and Chandigarh are the two main
markets where vegetables from Himachal Pradesh are marketed and consumed.
Hence, these two markets were selected purposively. Other four markets was
selected from two neighbouring states viz. Haryana and Punjab on the consideration
that either the vegetables are directly sent to these markets or they are being fed by
the large markets of Chandigarh and Delhi. Reference period for the present study is
2005-06.
8
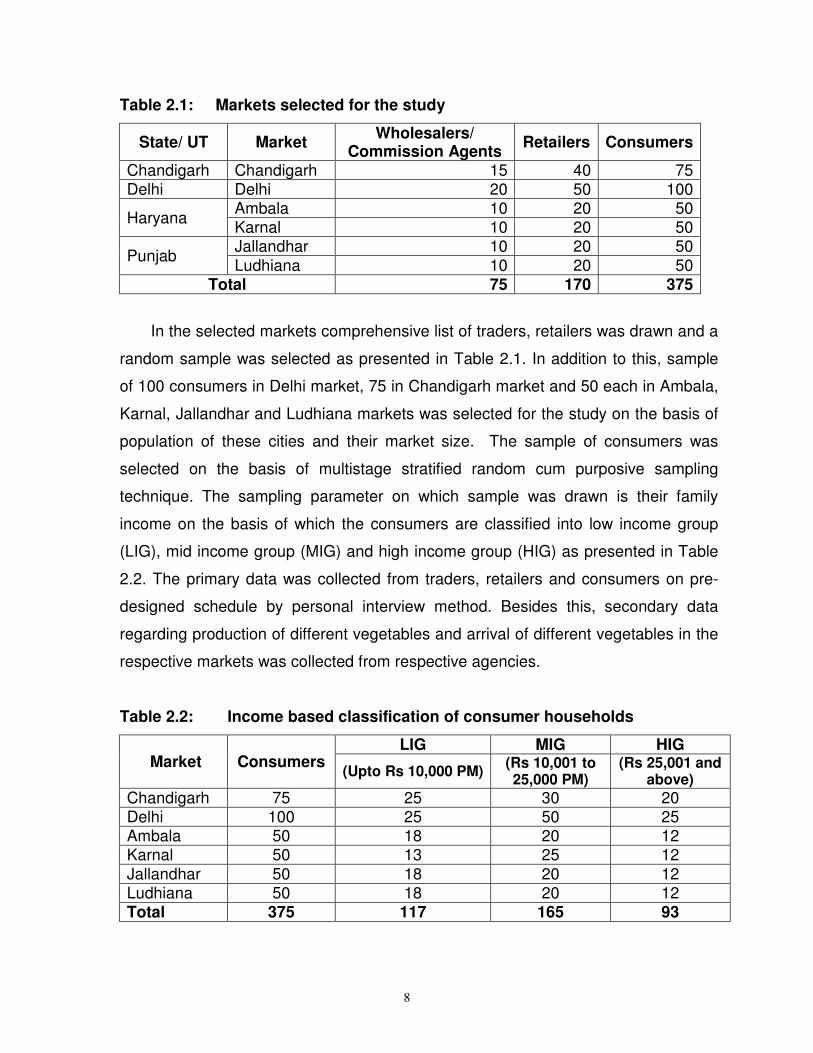
Table 2.1: Markets selected for the study
State/ UT Market Wholesalers/
Commission Agents Retailers Consumers
Chandigarh Chandigarh 15 40 75 Delhi Delhi 20 50 100
Haryana Ambala 10 20 50 Karnal 10 20 50
Punjab Jallandhar 10 20 50 Ludhiana 10 20 50
Total 75 170 375
In the selected markets comprehensive list of traders, retailers was drawn and a
random sample was selected as presented in Table 2.1. In addition to this, sample
of 100 consumers in Delhi market, 75 in Chandigarh market and 50 each in Ambala,
Karnal, Jallandhar and Ludhiana markets was selected for the study on the basis of
population of these cities and their market size. The sample of consumers was
selected on the basis of multistage stratified random cum purposive sampling
technique. The sampling parameter on which sample was drawn is their family
income on the basis of which the consumers are classified into low income group
(LIG), mid income group (MIG) and high income group (HIG) as presented in Table
2.2. The primary data was collected from traders, retailers and consumers on pre-
designed schedule by personal interview method. Besides this, secondary data
regarding production of different vegetables and arrival of different vegetables in the
respective markets was collected from respective agencies.
Table 2.2: Income based classification of consumer households
Market Consumers LIG MIG HIG
(Upto Rs 10,000 PM) (Rs 10,001 to 25,000 PM)
(Rs 25,001 and above)
Chandigarh 75 25 30 20 Delhi 100 25 50 25 Ambala 50 18 20 12 Karnal 50 13 25 12 Jallandhar 50 18 20 12 Ludhiana 50 18 20 12 Total 375 117 165 93
9
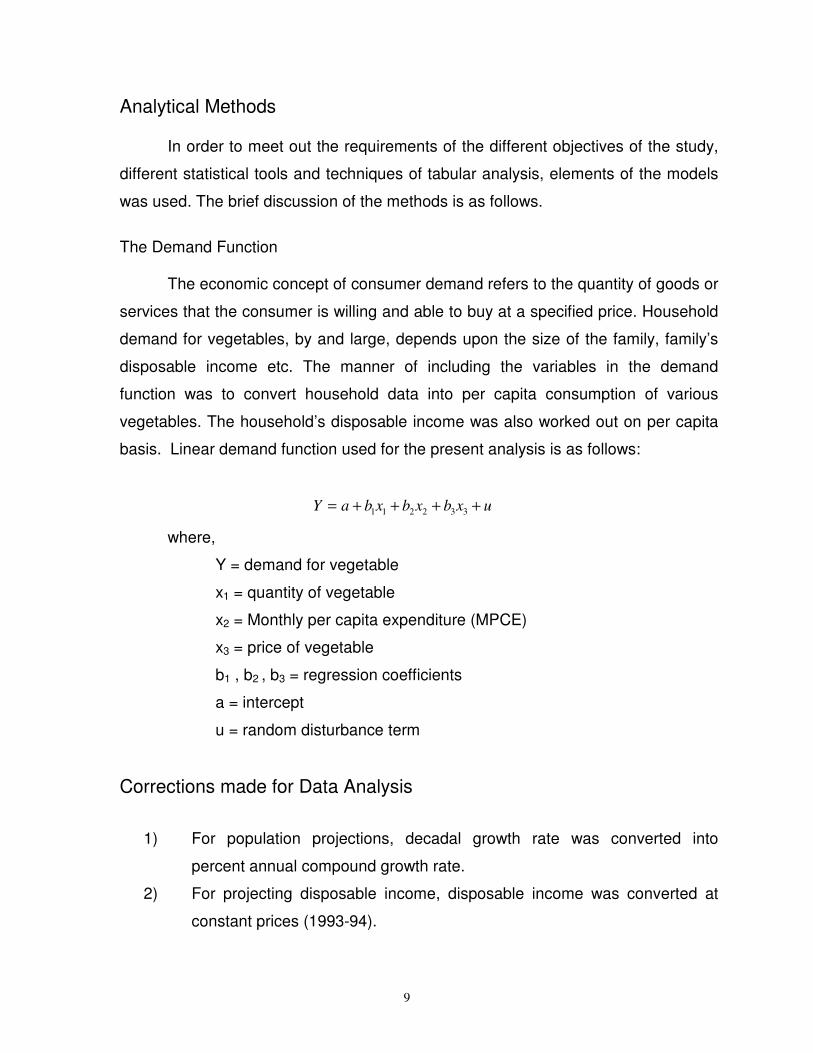
Analytical Methods
In order to meet out the requirements of the different objectives of the study,
different statistical tools and techniques of tabular analysis, elements of the models
was used. The brief discussion of the methods is as follows.
The Demand Function
The economic concept of consumer demand refers to the quantity of goods or
services that the consumer is willing and able to buy at a specified price. Household
demand for vegetables, by and large, depends upon the size of the family, family’s
disposable income etc. The manner of including the variables in the demand
function was to convert household data into per capita consumption of various
vegetables. The household’s disposable income was also worked out on per capita
basis. Linear demand function used for the present analysis is as follows:
uxbxbxbaY ++++= 332211
where,
Y = demand for vegetable
x1 = quantity of vegetable
x2 = Monthly per capita expenditure (MPCE)
x3 = price of vegetable
b1 , b2 , b3 = regression coefficients
a = intercept
u = random disturbance term
Corrections made for Data Analysis
1) For population projections, decadal growth rate was converted into
percent annual compound growth rate.
2) For projecting disposable income, disposable income was converted at
constant prices (1993-94).
10
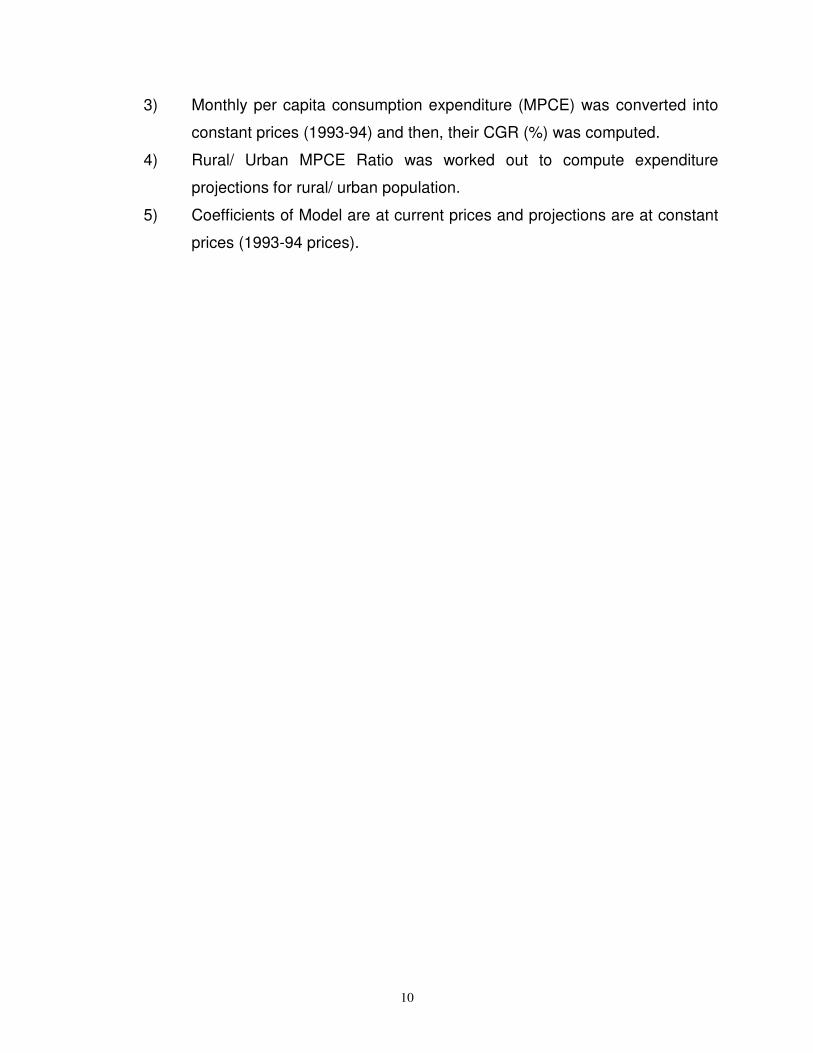
3) Monthly per capita consumption expenditure (MPCE) was converted into
constant prices (1993-94) and then, their CGR (%) was computed.
4) Rural/ Urban MPCE Ratio was worked out to compute expenditure
projections for rural/ urban population.
5) Coefficients of Model are at current prices and projections are at constant
prices (1993-94 prices).
11
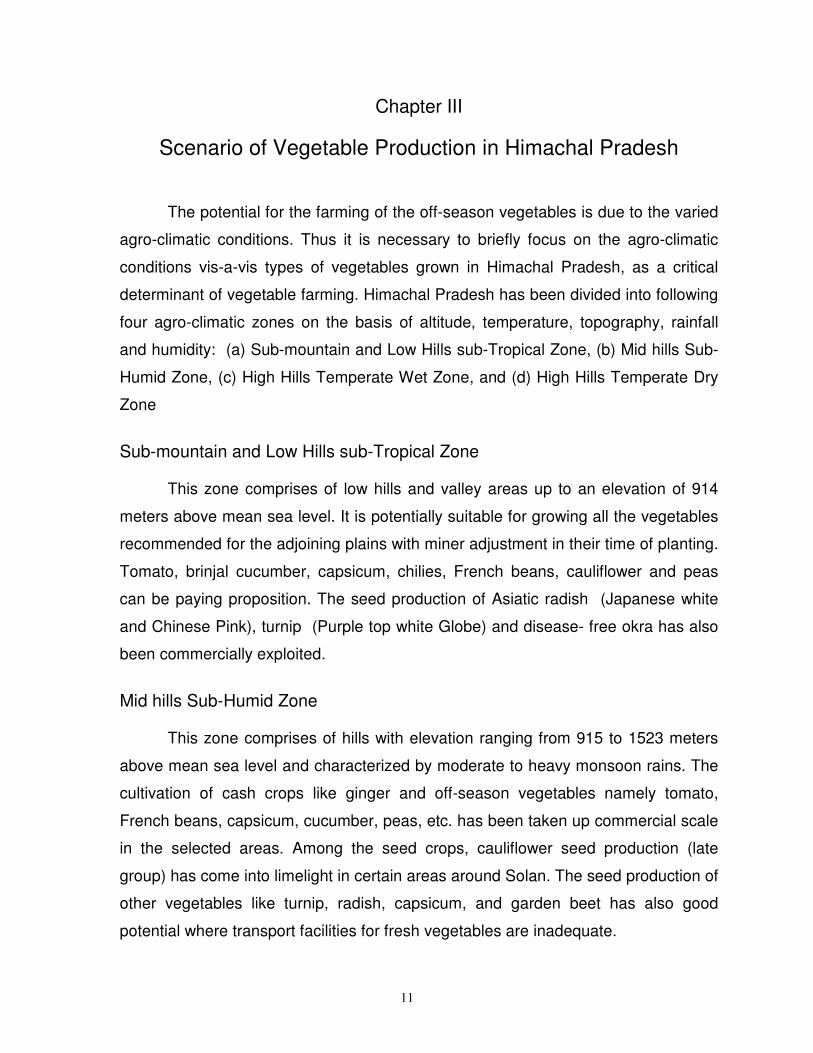
Chapter III
Scenario of Vegetable Production in Himachal Pradesh
The potential for the farming of the off-season vegetables is due to the varied
agro-climatic conditions. Thus it is necessary to briefly focus on the agro-climatic
conditions vis-a-vis types of vegetables grown in Himachal Pradesh, as a critical
determinant of vegetable farming. Himachal Pradesh has been divided into following
four agro-climatic zones on the basis of altitude, temperature, topography, rainfall
and humidity: (a) Sub-mountain and Low Hills sub-Tropical Zone, (b) Mid hills Sub-
Humid Zone, (c) High Hills Temperate Wet Zone, and (d) High Hills Temperate Dry
Zone
Sub-mountain and Low Hills sub-Tropical Zone
This zone comprises of low hills and valley areas up to an elevation of 914
meters above mean sea level. It is potentially suitable for growing all the vegetables
recommended for the adjoining plains with miner adjustment in their time of planting.
Tomato, brinjal cucumber, capsicum, chilies, French beans, cauliflower and peas
can be paying proposition. The seed production of Asiatic radish (Japanese white
and Chinese Pink), turnip (Purple top white Globe) and disease- free okra has also
been commercially exploited.
Mid hills Sub-Humid Zone This zone comprises of hills with elevation ranging from 915 to 1523 meters
above mean sea level and characterized by moderate to heavy monsoon rains. The
cultivation of cash crops like ginger and off-season vegetables namely tomato,
French beans, capsicum, cucumber, peas, etc. has been taken up commercial scale
in the selected areas. Among the seed crops, cauliflower seed production (late
group) has come into limelight in certain areas around Solan. The seed production of
other vegetables like turnip, radish, capsicum, and garden beet has also good
potential where transport facilities for fresh vegetables are inadequate.
12
High Hills Temperate Wet Zone
This high-hill temperate wet zone extends to areas with elevations ranging
from 1524 to 2472 meters above mean sea level. The climate is temperate with
moderate to heavy monsoon rains of about 100-200 cm. Snow is a usual feature
during winters and the temperatures are generally very low, thus preventing crop
growth from November to March. The important vegetables grown here are peas;
French beans, cauliflower, cabbage, radish, turnip, carrot, beet and leafy vegetables
during months for supply to the plains. Seed crops like turnip, radish, beet,
cabbage, etc. may be grown but rains may somehow affect the seed quality during
maturity periods of the seed-crops.
High Hills Temperate Dry Zone High altitude dry zone in the north-west comprises of Lahaul-Spiti, Kinnaur
and Bharmaur area of Chamba districts. This zone is characterized by low rainfall
during summer months (25-40 cm.) and heavy snowfall during winter months (3-5
meter). The cold dry temperature areas extend beyond 2472 meters above level and
the cultivation is being carried out only in summer season under irrigated conditions.
This area is ideally suited for the production of quality seed of temperate vegetables
and off-season vegetables like cabbage, cauliflower, peas, onion and root
vegetables.
Sowing time of Vegetables in different agro-climatic zones As it is clear from the foregoing discussion, the climate of the state is diverse
and is thus suitable for growing a large number of vegetable crops. The agro-climatic
conditions are such that vegetables production can be undertaken during the period,
when these crops cannot be grown in the plain area of the country, hence, the use of
the term off-season vegetable production. In Himachal Pradesh itself the sowing
time of the same vegetable is different in different agro-climatic zones. Thus it is
necessary to briefly focus on the sowing timing of the vegetables in Himachal
Pradesh, as critical determinant of vegetable farming.
13
Sowing time of Vegetables in Low Hills
In low hills zone the vegetables are sown all over the year. In the period from
January to April vegetables namely tomato, capsicum, brinjal, ladyfinger, french
beans, cucumber, bitter gourd, and spinach are sown. In the month of May to August
tomato, brinjal, ladyfinger, french beans, cucumber, bitter gourd, peas, cauliflower,
radish, carrot, and spinach are sown. In the month of September to December
tomato, capsicum, brinjal, peas, cauliflower, radish, carrot, and spinach are sown.
Sowing time of Vegetables in Mid Hills
As in low hills zone, in the mid hills zone the vegetables are also sown all
over the year. In the period from January to April vegetables namely tomato,
capsicum, brinjal, ladyfinger, french beans, cucumber, bitter gourd, and spinach are
sown. In the month of May to August tomato, capsicum, brinjal, ladyfinger, french
beans, cucumber, bitter gourd, cauliflower, turnip, radish, carrot, and spinach are
sown. In the month of September to December peas, cauliflower, turnip, radish,
carrot, and spinach are sown.
Sowing time of vegetables in High Hills
In this zone the production season is of six to nine months due to snowfall. In
the period from January to April vegetables namely tomato, ladyfinger, bitter gourd,
radish, carrot, peas and spinach are sown. In the month of May to August ladyfinger,
french beans, cauliflower, radish, and turnips are sown. In the month of September
to December peas and spinach are sown.
14
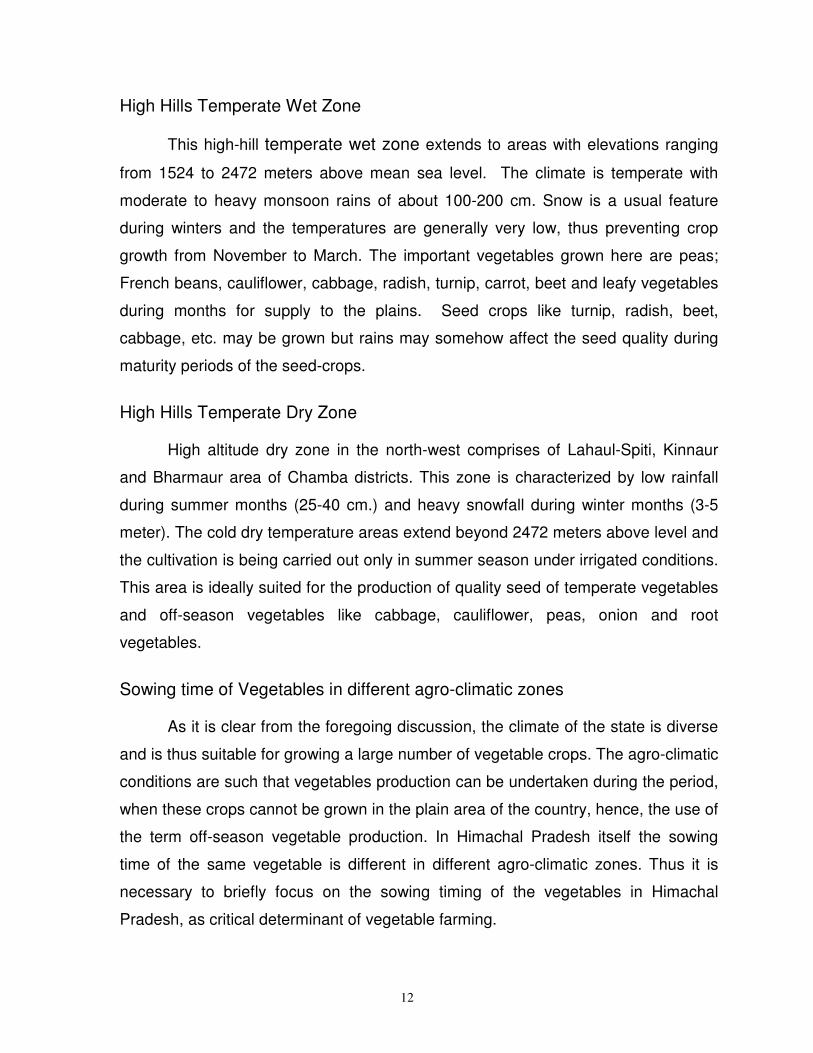
Table 3.1: Sowing time of different vegetable crops in different climatic zones
Name of Vegetable
Zone I Low Hills Zone II Mid Hills Zone III & Zone IV High Hills
Tomato March to May Feb., March-June April Capsicum Nov., Feb. and March March to May Brinjal Oct., March, May -
June March - May
Lady finger Feb.-March, July March- June April - May French beans Feb.-March and Aug. March - July April - June Cucumber Feb.-March, June March - May Bitter gourd Feb.-March, June March - May April Peas August - Nov. Sept.-Nov. Oct-Nov & March-April Cauliflower June - Nov. July -Sept. April - May Cabbage August - Oct. Sept.-Oct. April - June Turnip Sept.-Oct. July - August Radish August - Oct. July - Oct. March - August Carrot August -Sep. July -Sept. March - July Spinach July - Nov., Feb. -
March July -Sept. March- June, Sept.
Source: Cultural Practices for Vegetable Crops in Himachal Pradesh, Directorate of Extension Education, Dr. Y S Parmar University of Horticulture & Forestry, Solan, HP
Critical Periods of availability of Vegetables from Himachal Pradesh
Majority of vegetable production of Himachal Pradesh is off-season in nature.
The term off-season means that these vegetables can be produced in the state due
to varied climatic condition when the production of these vegetables is not
economically viable and only can be produced under ideal conditions of green
houses in controlled conditions in competing areas of neighboring states.
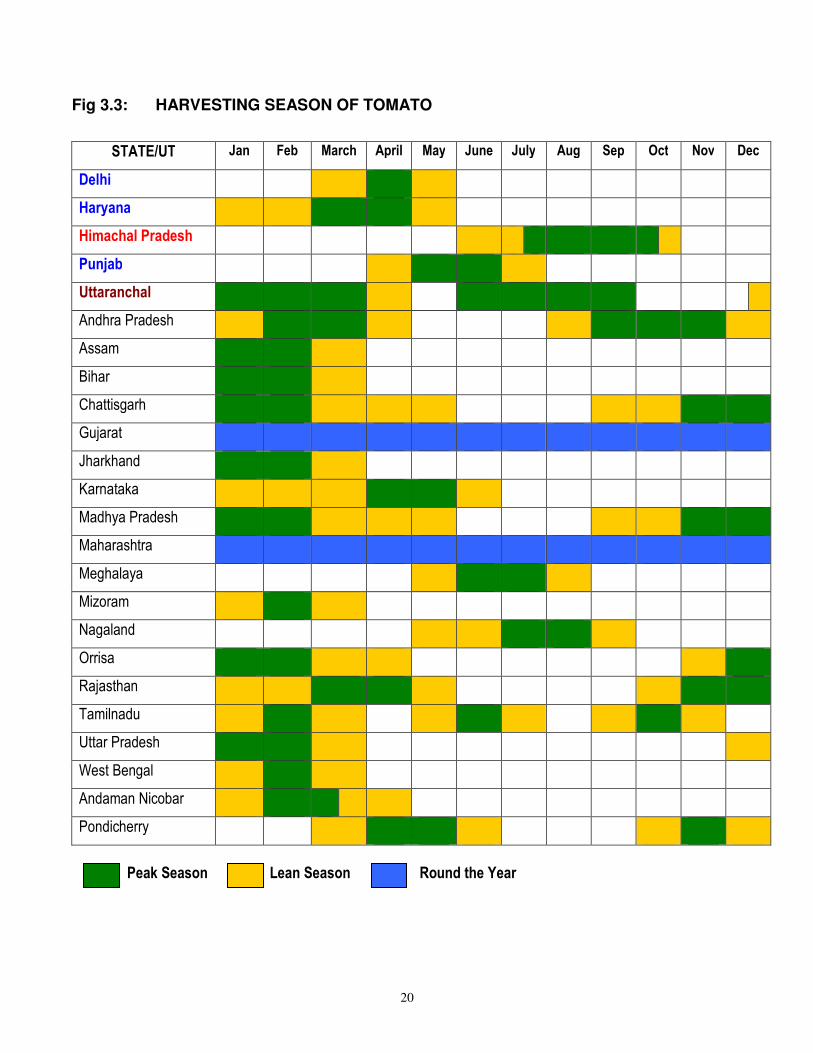
The production and marketing of tomato in neighboring /competing states
ends up to June. From first week of the July Himachal Pradesh is the sole supplier of
tomatoes up to second week of Oct. Further, Solan district has an advantage over
other tomatoes producing districts of Himachal and August onwards other major
tomato producing districts like Sirmour, Kullu and Bilaspur do not face any
competition from the other tomato producing states like Haryana, Punjab, Utter
Pradesh and Rajasthan etc.
15
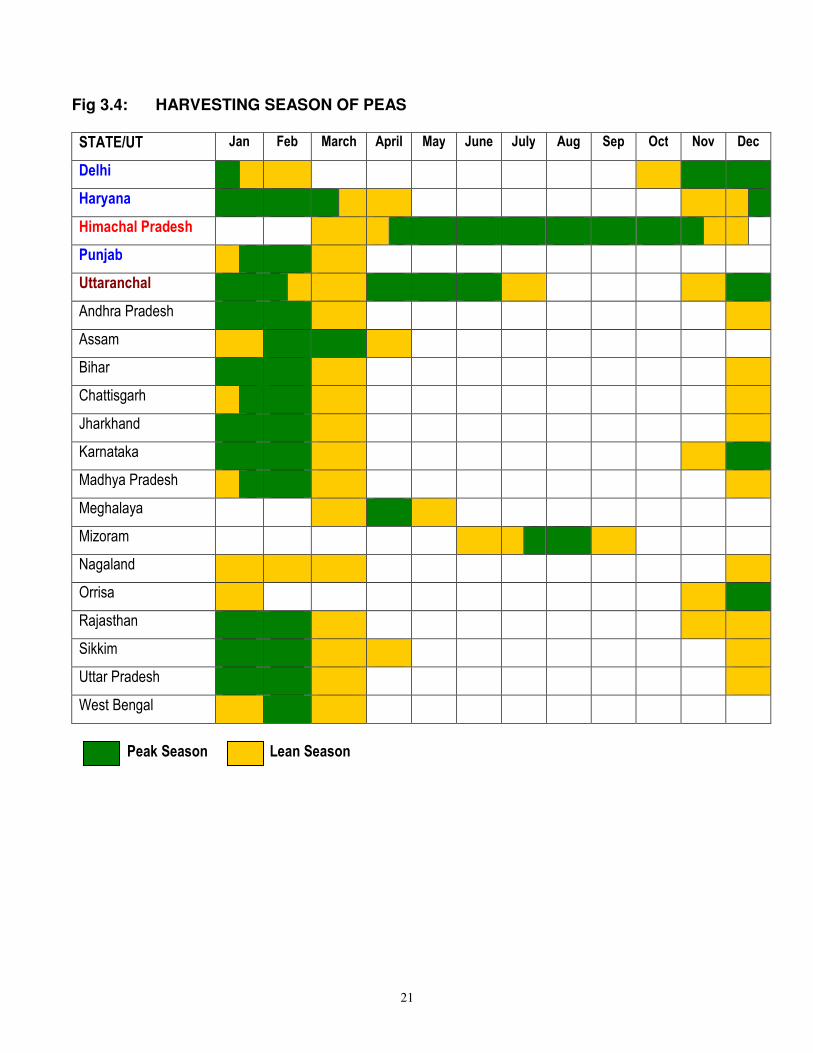
Peas are also produced during the month of July to October in the district of
Kullu and tribal districts of Kinnaur and Lahul & Spiti do not face any competition.
During the month of August and September markets of Punjab, Haryana and Delhi
terminal market gets supplies of peas from these districts and fetch very high price.
Capsicum is only produced in Himachal Pradesh and no competition from
other states.
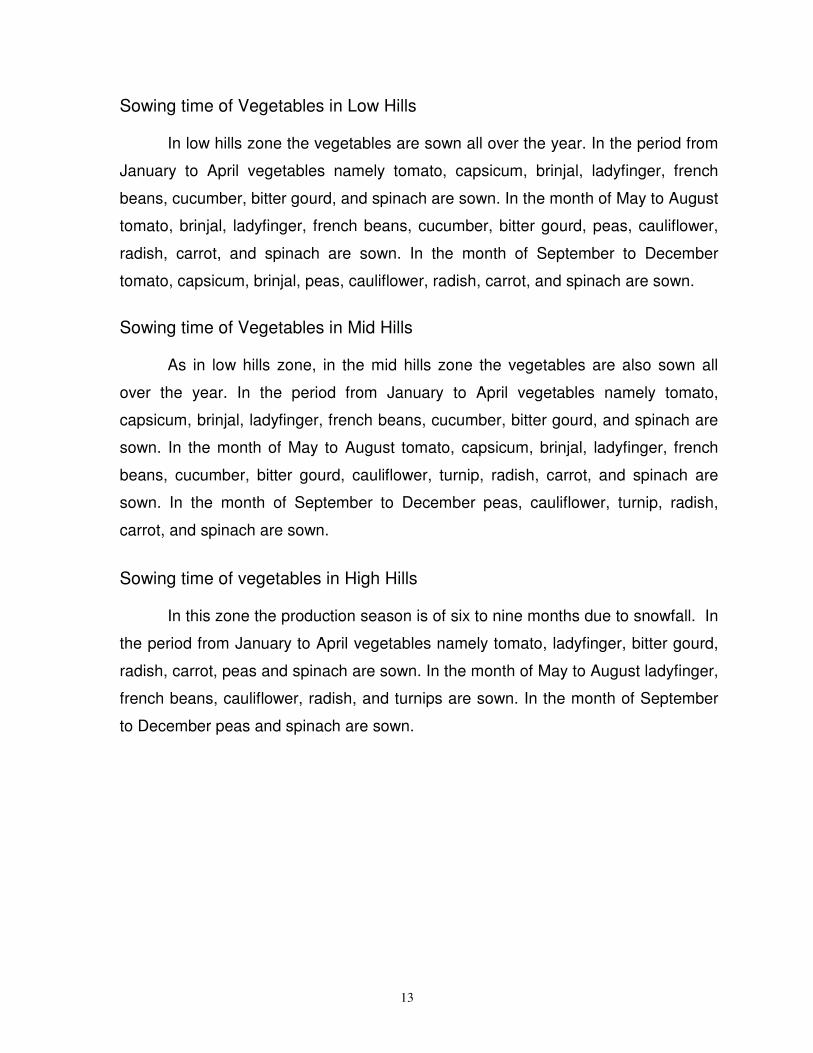
Table 3.2: Commercial Vegetable Crops in Different Agro-Climatic Zones
Zone Market Crops Seed Crops
Sub - tropical sub -montane and low-hills. (365-914m and 90-100cm. Rainfall)
Brinjal, Cucumber, Okra, Peas, Cauliflower, Potato
Asiatic radish, Okra, Onion, Cauliflower
Sub - temperate sub-humid (914 - 1523 m 90 - 100 cm. Rainfall)
Tomato, French beans, Capsicum, Cucumber, Peas, Ginger, Potato
Cauliflower (late group), Bell peper, Turnip, Capsicum, French beans, Table beet, Potato
Sub-temperate high hills. (1524- 2472 m 90 - 100cm. Rainfall)
Peas, French beans, Cauliflower, Cabbage, Radish, Turnip, Carrot, Beet, Potato
Potato
Dry-temperature high-hills Sub-temperate high hills. (1524 - 2472 m 90-100 cm. Rainfall)
Peas, Cole crops, Turnip, Onion
Cabbage, Beet, Potato, Peas, Chicory and temperate varieties of Radish and Turnip
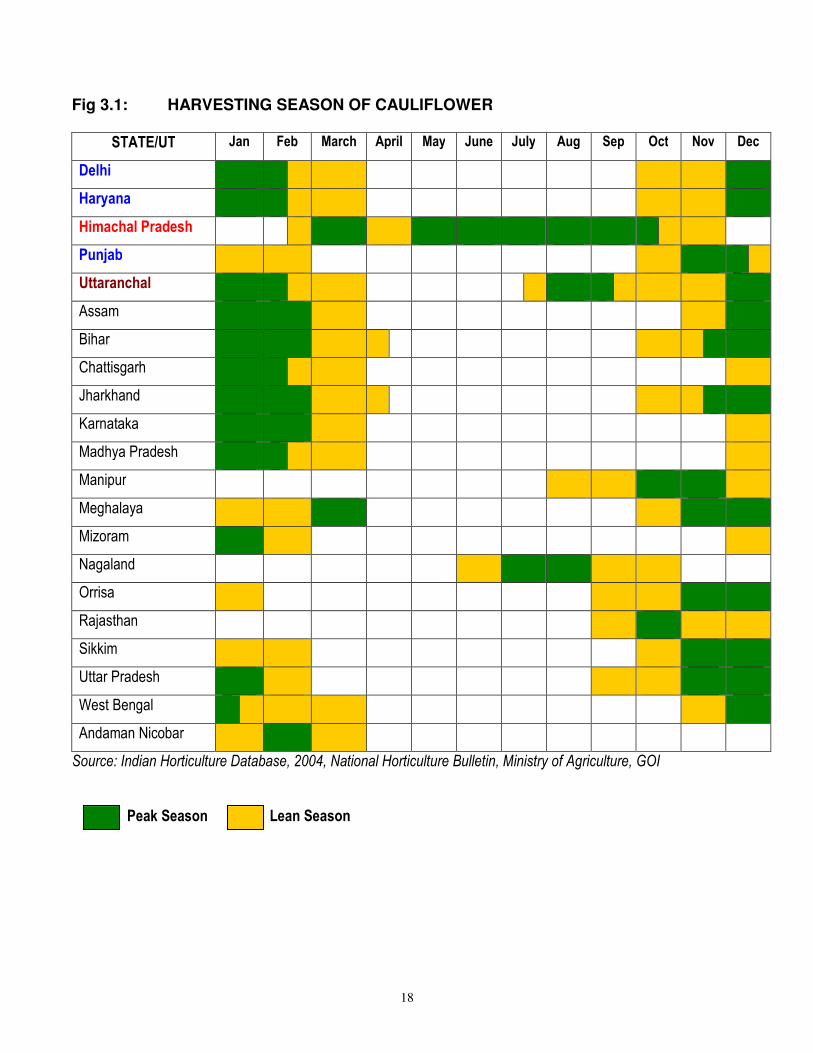
The cabbage produced in Kullu, Lahul & Spiti, Shimla and Solan do not face
any competition from other states from April to June.
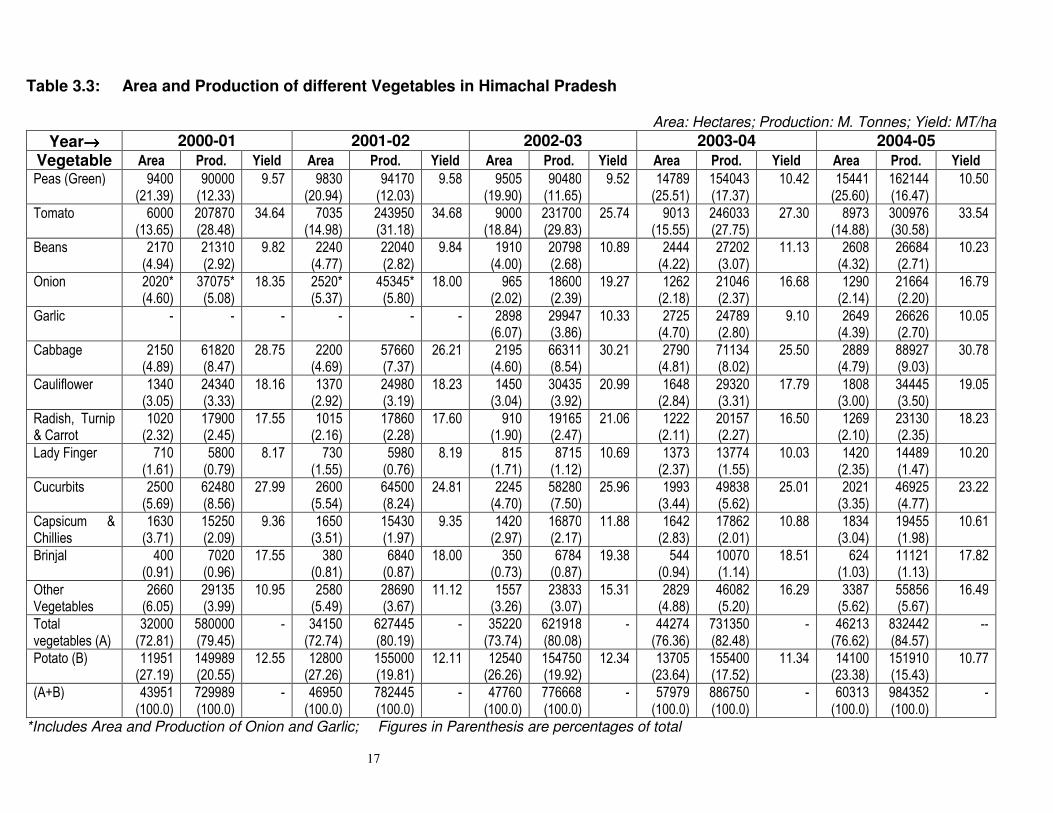
Similarly the Cauliflower produced from April to Oct produced in the districts
of Kullu, Solan, Mandi and Kinnaur do not face any competition. The cauliflower is
produced in Kullu through out the year except in the months of December to
February.
The cauliflower and Cabbage produced in heights of Kullu valley, Gharsa
Valley and Manikaran valley of Kullu have organic production up to some extent as
16
very less quantity of plant protection chemicals are used and have a very good
quality.
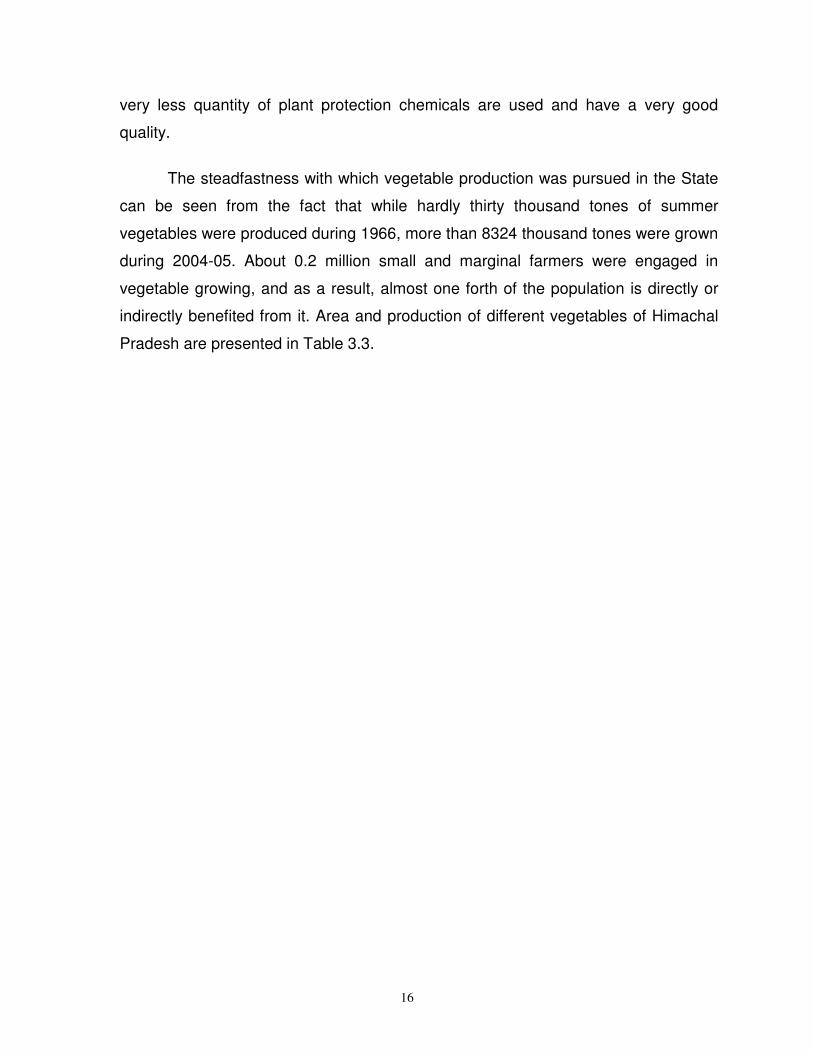
The steadfastness with which vegetable production was pursued in the State
can be seen from the fact that while hardly thirty thousand tones of summer
vegetables were produced during 1966, more than 8324 thousand tones were grown
during 2004-05. About 0.2 million small and marginal farmers were engaged in
vegetable growing, and as a result, almost one forth of the population is directly or
indirectly benefited from it. Area and production of different vegetables of Himachal
Pradesh are presented in Table 3.3.
17
Table 3.3: Area and Production of different Vegetables in Himachal Pradesh
Area: Hectares; Production: M. Tonnes; Yield: MT/ha
Year→→→→ 2000-01 2001-02 2002-03 2003-04 2004-05
Vegetable Area Prod. Yield Area Prod. Yield Area Prod. Yield Area Prod. Yield Area Prod. Yield
Peas (Green) 9400 (21.39)
90000 (12.33)
9.57 9830 (20.94)
94170 (12.03)
9.58 9505 (19.90)
90480 (11.65)
9.52 14789 (25.51)
154043 (17.37)
10.42 15441 (25.60)
162144 (16.47)
10.50
Tomato 6000 (13.65)
207870 (28.48)
34.64 7035 (14.98)
243950 (31.18)
34.68 9000 (18.84)
231700 (29.83)
25.74 9013 (15.55)
246033 (27.75)
27.30 8973 (14.88)
300976 (30.58)
33.54
Beans 2170 (4.94)
21310 (2.92)
9.82 2240 (4.77)
22040 (2.82)
9.84 1910 (4.00)
20798 (2.68)
10.89 2444 (4.22)
27202 (3.07)
11.13 2608 (4.32)
26684 (2.71)
10.23
Onion 2020* (4.60)
37075* (5.08)
18.35 2520* (5.37)
45345* (5.80)
18.00 965 (2.02)
18600 (2.39)
19.27 1262 (2.18)
21046 (2.37)
16.68 1290 (2.14)
21664 (2.20)
16.79
Garlic - - - - - - 2898 (6.07)
29947 (3.86)
10.33 2725 (4.70)
24789 (2.80)
9.10 2649 (4.39)
26626 (2.70)
10.05
Cabbage 2150 (4.89)
61820 (8.47)
28.75 2200 (4.69)
57660 (7.37)
26.21 2195 (4.60)
66311 (8.54)
30.21 2790 (4.81)
71134 (8.02)
25.50 2889 (4.79)
88927 (9.03)
30.78
Cauliflower 1340 (3.05)
24340 (3.33)
18.16 1370 (2.92)
24980 (3.19)
18.23 1450 (3.04)
30435 (3.92)
20.99 1648 (2.84)
29320 (3.31)
17.79 1808 (3.00)
34445 (3.50)
19.05
Radish, Turnip & Carrot
1020 (2.32)
17900 (2.45)
17.55 1015 (2.16)
17860 (2.28)
17.60 910 (1.90)
19165 (2.47)
21.06 1222 (2.11)
20157 (2.27)
16.50 1269 (2.10)
23130 (2.35)
18.23
Lady Finger 710 (1.61)
5800 (0.79)
8.17 730 (1.55)
5980 (0.76)
8.19 815 (1.71)
8715 (1.12)
10.69 1373 (2.37)
13774 (1.55)
10.03 1420 (2.35)
14489 (1.47)
10.20
Cucurbits 2500 (5.69)
62480 (8.56)
27.99 2600 (5.54)
64500 (8.24)
24.81 2245 (4.70)
58280 (7.50)
25.96 1993 (3.44)
49838 (5.62)
25.01 2021 (3.35)
46925 (4.77)
23.22
Capsicum & Chillies
1630 (3.71)
15250 (2.09)
9.36 1650 (3.51)
15430 (1.97)
9.35 1420 (2.97)
16870 (2.17)
11.88 1642 (2.83)
17862 (2.01)
10.88 1834 (3.04)
19455 (1.98)
10.61
Brinjal 400 (0.91)
7020 (0.96)
17.55 380 (0.81)
6840 (0.87)
18.00 350 (0.73)
6784 (0.87)
19.38 544 (0.94)
10070 (1.14)
18.51 624 (1.03)
11121 (1.13)
17.82
Other Vegetables
2660 (6.05)
29135 (3.99)
10.95 2580 (5.49)
28690 (3.67)
11.12 1557 (3.26)
23833 (3.07)
15.31 2829 (4.88)
46082 (5.20)
16.29 3387 (5.62)
55856 (5.67)
16.49
Total vegetables (A)
32000 (72.81)
580000 (79.45)
- 34150 (72.74)
627445 (80.19)
- 35220 (73.74)
621918 (80.08)
- 44274 (76.36)
731350 (82.48)
- 46213 (76.62)
832442 (84.57)
--
Potato (B) 11951 (27.19)
149989 (20.55)
12.55 12800 (27.26)
155000 (19.81)
12.11 12540 (26.26)
154750 (19.92)
12.34 13705 (23.64)
155400 (17.52)
11.34 14100 (23.38)
151910 (15.43)
10.77
(A+B) 43951 (100.0)
729989 (100.0)
- 46950 (100.0)
782445 (100.0)
- 47760 (100.0)
776668 (100.0)
- 57979 (100.0)
886750 (100.0)
- 60313 (100.0)
984352 (100.0)
-
*Includes Area and Production of Onion and Garlic; Figures in Parenthesis are percentages of total
18
Fig 3.1: HARVESTING SEASON OF CAULIFLOWER
STATE/UT Jan Feb March April May June July Aug Sep Oct Nov Dec
Delhi
Haryana
Himachal Pradesh
Punjab
Uttaranchal
Assam
Bihar
Chattisgarh
Jharkhand
Karnataka
Madhya Pradesh
Manipur
Meghalaya
Mizoram
Nagaland
Orrisa
Rajasthan
Sikkim
Uttar Pradesh
West Bengal
Andaman Nicobar
Source: Indian Horticulture Database, 2004, National Horticulture Bulletin, Ministry of Agriculture, GOI
Peak Season Lean Season
19
Fig 3.2: HARVESTING SEASON OF CABBAGE
STATE/UT Jan Feb March April May June July Aug Sep Oct Nov Dec
Delhi
Haryana
Himachal Pradesh
Punjab
Uttaranchal
Andhra Pradesh
Assam
Bihar
Chattisgarh
Gujarat
Jharkhand
Karnataka
Madhya Pradesh
Maharashtra
Manipur
Meghalaya
Mizoram
Nagaland
Orrisa
Rajasthan
Sikkim
Tamilnadu
Uttar Pradesh
West Bengal
Andaman Nicobar
Peak Season Lean Season
20
Fig 3.3: HARVESTING SEASON OF TOMATO
STATE/UT Jan Feb March April May June July Aug Sep Oct Nov Dec
Delhi
Haryana
Himachal Pradesh
Punjab
Uttaranchal
Andhra Pradesh
Assam
Bihar
Chattisgarh
Gujarat
Jharkhand
Karnataka
Madhya Pradesh
Maharashtra
Meghalaya
Mizoram
Nagaland
Orrisa
Rajasthan
Tamilnadu
Uttar Pradesh
West Bengal
Andaman Nicobar
Pondicherry
Peak Season Lean Season Round the Year
21
Fig 3.4: HARVESTING SEASON OF PEAS
STATE/UT Jan Feb March April May June July Aug Sep Oct Nov Dec
Delhi
Haryana
Himachal Pradesh
Punjab
Uttaranchal
Andhra Pradesh
Assam
Bihar
Chattisgarh
Jharkhand
Karnataka
Madhya Pradesh
Meghalaya
Mizoram
Nagaland
Orrisa
Rajasthan
Sikkim
Uttar Pradesh
West Bengal
Peak Season Lean Season
22
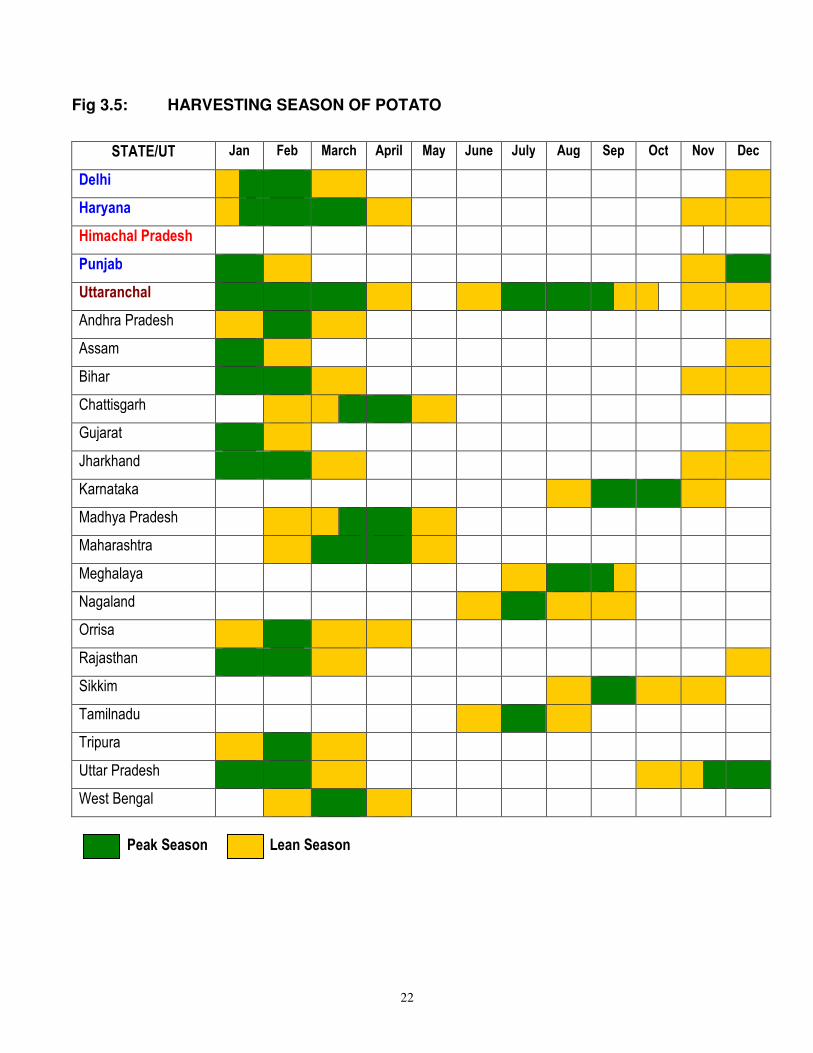
Fig 3.5: HARVESTING SEASON OF POTATO
STATE/UT Jan Feb March April May June July Aug Sep Oct Nov Dec
Delhi
Haryana
Himachal Pradesh
Punjab
Uttaranchal
Andhra Pradesh
Assam
Bihar
Chattisgarh
Gujarat
Jharkhand
Karnataka
Madhya Pradesh
Maharashtra
Meghalaya
Nagaland
Orrisa
Rajasthan
Sikkim
Tamilnadu
Tripura
Uttar Pradesh
West Bengal
Peak Season Lean Season
23
Chapter IV
Existing Demand and Demand Projections of Himachal Vegetables in the Neighbouring States
The projections of demand made in this study are based on a few
assumptions regarding the factors that influence demand like per capita income,
disposable income, relative price changes and growth of population and
disposable income during the next 10 years. The demand for a commodity is a
function determined by the price of the commodity, the prices of other
substitutes, the disposable income of the consumer, population, tastes and
habits of the people. Of these, the most important factors, which influence the
demand directly, are population and disposable income. Thus, the growth of
demand for vegetables is envisaged to depend primarily on the expected rate of
increase in real per capita disposable income and population.
Population Projections
The aggregate demand for a commodity is nothing but the per capita
demand multiplied by the total population. Population projections are usually
based on a few vital assumptions such as those relating to fertility, mortality and
migratory factors in particular. The changes taking place in any or all of these
factors will bring out accompanying changes in the population structure in the
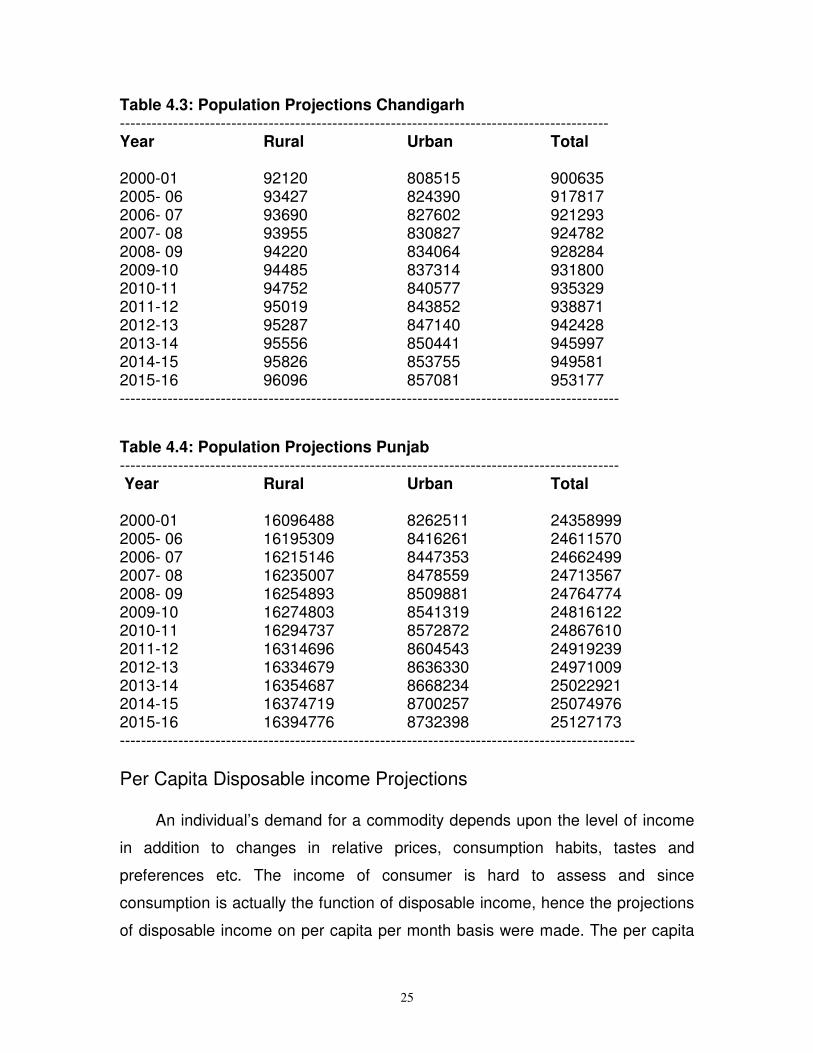
years to come. For population projections for the next 10 years decadal growth
rate was converted into percent annual growth rate and projections were made
accordingly. The population projections were made over the period 2005-06 to
2015-16 and presented in Tables 4.1 to 4.4.
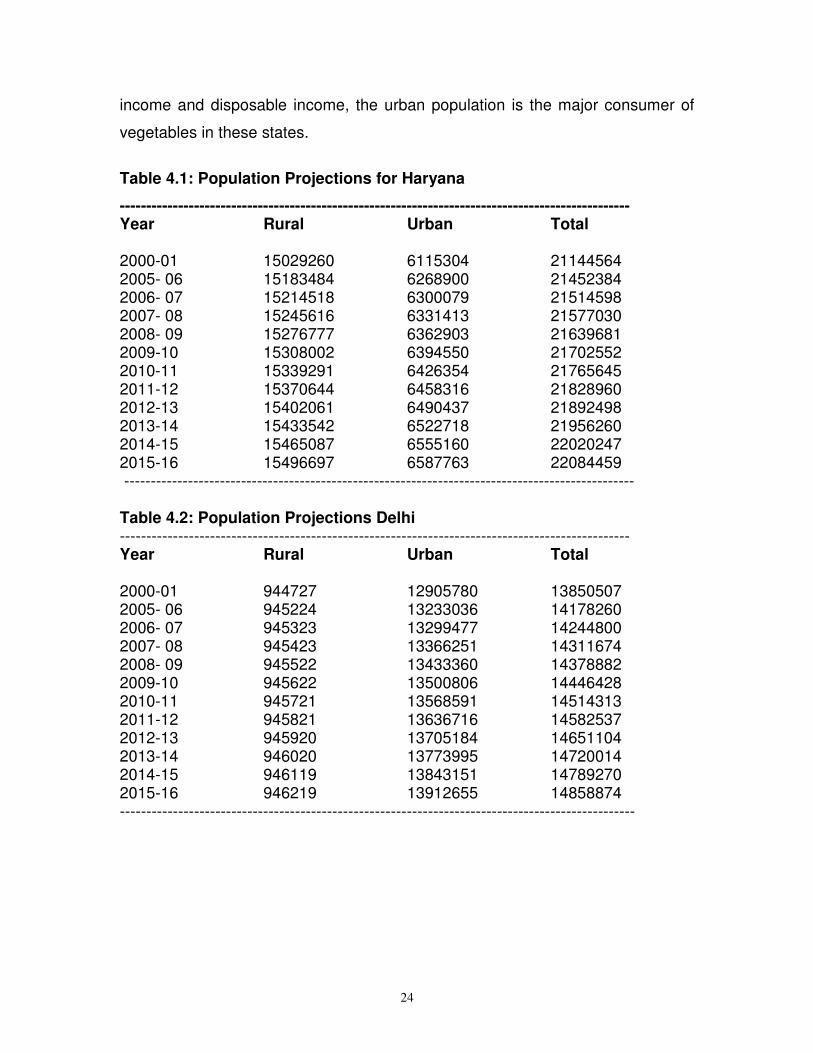
On analysing the population projections for different States and UT
covered under this study, it was found that the growth of urban population is
higher in the selected states. Since, urban population has higher per capita
24
income and disposable income, the urban population is the major consumer of
vegetables in these states.
Table 4.1: Population Projections for Haryana
------------------------------------------------------------------------------------------------ Year Rural Urban Total 2000-01 15029260 6115304 21144564 2005- 06 15183484 6268900 21452384 2006- 07 15214518 6300079 21514598 2007- 08 15245616 6331413 21577030 2008- 09 15276777 6362903 21639681 2009-10 15308002 6394550 21702552 2010-11 15339291 6426354 21765645 2011-12 15370644 6458316 21828960 2012-13 15402061 6490437 21892498 2013-14 15433542 6522718 21956260 2014-15 15465087 6555160 22020247 2015-16 15496697 6587763 22084459 ------------------------------------------------------------------------------------------------ Table 4.2: Population Projections Delhi ------------------------------------------------------------------------------------------------ Year Rural Urban Total 2000-01 944727 12905780 13850507 2005- 06 945224 13233036 14178260 2006- 07 945323 13299477 14244800 2007- 08 945423 13366251 14311674 2008- 09 945522 13433360 14378882 2009-10 945622 13500806 14446428 2010-11 945721 13568591 14514313 2011-12 945821 13636716 14582537 2012-13 945920 13705184 14651104 2013-14 946020 13773995 14720014 2014-15 946119 13843151 14789270 2015-16 946219 13912655 14858874 -------------------------------------------------------------------------------------------------
25
Table 4.3: Population Projections Chandigarh -------------------------------------------------------------------------------------------- Year Rural Urban Total 2000-01 92120 808515 900635 2005- 06 93427 824390 917817 2006- 07 93690 827602 921293 2007- 08 93955 830827 924782 2008- 09 94220 834064 928284 2009-10 94485 837314 931800 2010-11 94752 840577 935329 2011-12 95019 843852 938871 2012-13 95287 847140 942428 2013-14 95556 850441 945997 2014-15 95826 853755 949581 2015-16 96096 857081 953177 ----------------------------------------------------------------------------------------------
Table 4.4: Population Projections Punjab ---------------------------------------------------------------------------------------------- Year Rural Urban Total 2000-01 16096488 8262511 24358999 2005- 06 16195309 8416261 24611570 2006- 07 16215146 8447353 24662499 2007- 08 16235007 8478559 24713567 2008- 09 16254893 8509881 24764774 2009-10 16274803 8541319 24816122 2010-11 16294737 8572872 24867610 2011-12 16314696 8604543 24919239 2012-13 16334679 8636330 24971009 2013-14 16354687 8668234 25022921 2014-15 16374719 8700257 25074976 2015-16 16394776 8732398 25127173 -------------------------------------------------------------------------------------------------
Per Capita Disposable income Projections
An individual’s demand for a commodity depends upon the level of income
in addition to changes in relative prices, consumption habits, tastes and
preferences etc. The income of consumer is hard to assess and since
consumption is actually the function of disposable income, hence the projections
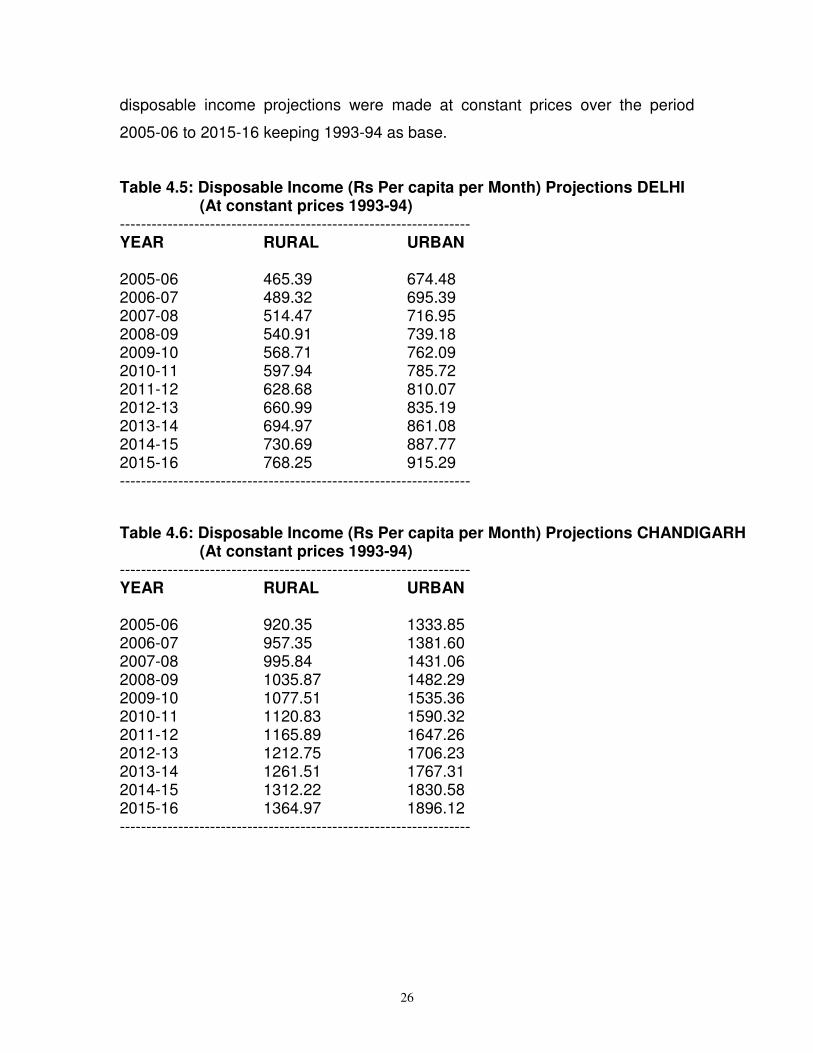
of disposable income on per capita per month basis were made. The per capita
26
disposable income projections were made at constant prices over the period
2005-06 to 2015-16 keeping 1993-94 as base.
Table 4.5: Disposable Income (Rs Per capita per Month) Projections DELHI (At constant prices 1993-94) ------------------------------------------------------------------ YEAR RURAL URBAN 2005-06 465.39 674.48 2006-07 489.32 695.39 2007-08 514.47 716.95 2008-09 540.91 739.18 2009-10 568.71 762.09 2010-11 597.94 785.72 2011-12 628.68 810.07 2012-13 660.99 835.19 2013-14 694.97 861.08 2014-15 730.69 887.77 2015-16 768.25 915.29 ------------------------------------------------------------------
Table 4.6: Disposable Income (Rs Per capita per Month) Projections CHANDIGARH (At constant prices 1993-94) ------------------------------------------------------------------ YEAR RURAL URBAN 2005-06 920.35 1333.85 2006-07 957.35 1381.60 2007-08 995.84 1431.06 2008-09 1035.87 1482.29 2009-10 1077.51 1535.36 2010-11 1120.83 1590.32 2011-12 1165.89 1647.26 2012-13 1212.75 1706.23 2013-14 1261.51 1767.31 2014-15 1312.22 1830.58 2015-16 1364.97 1896.12 ------------------------------------------------------------------
27
Table 4.7: Disposable Income (Rs Per capita per Month) Projections HARYANA (At constant prices 1993-94) ------------------------------------------------------------------ YEAR RURAL URBAN 2005-06 740.49 1073.17 2006-07 767.74 1110.41 2007-08 795.99 1148.94 2008-09 825.29 1188.81 2009-10 855.66 1230.07 2010-11 887.14 1272.75 2011-12 919.79 1316.91 2012-13 953.64 1362.61 2013-14 988.73 1409.89 2014-15 1025.12 1458.82 2015-16 1062.84 1509.44 ------------------------------------------------------------------ Table 4.8: Disposable Income (Rs Per capita per Month) Projections PUNJAB (At constant prices 1993-94) ------------------------------------------------------------------ YEAR RURAL URBAN 2005-06 706.52 1023.94 2006-07 732.45 1053.94 2007-08 759.33 1084.82 2008-09 787.20 1116.61 2009-10 816.09 1149.32 2010-11 846.04 1183.00 2011-12 877.09 1217.66 2012-13 909.27 1253.34 2013-14 942.64 1290.06 2014-15 977.24 1327.86 2015-16 1013.10 1366.77 ------------------------------------------------------------------ MPCE Growth Rates (%/Per Capita/month) ------------------------------------------------------- Rural Urban Delhi 3.100 5.140 Chandigarh 3.580 4.020 Punjab 2.930 3.670 Haryana 3.470 3.680 --------------------------------------------------------
28
Demand Projections of Vegetables
The demand of vegetables over a period of 2005-06 to 2015-16 was
projected on the basis of increase in per capita monthly consumption expenditure
and increase in urban population. The model postulated for projections in this
study assumes that all other factors, except changes in income and population,
remain constant. The results of Linear demand function are discussed and used
for demand projections (Estimated model coefficients are given in Annexure IV).
Fig 4.1: Demand Projection for Himachal Vegetables in
Neighbouring States
0
50000
100000
150000
200000
250000
300000
350000
400000
450000
20
05
-06
20
06
-07
20
07
-08
20
08
-09
20
09
-10
20
10
-11
20
11
-12
20
12
-13
20
13
-14
20
14
-15
20
15
-16
YEAR
Qu
an
tity
(M
T)
Cauliflower
Cabbage
Peas
Tomato
Capsicum
Garlic
Beans
Potato
Broccoli
Carrot
29
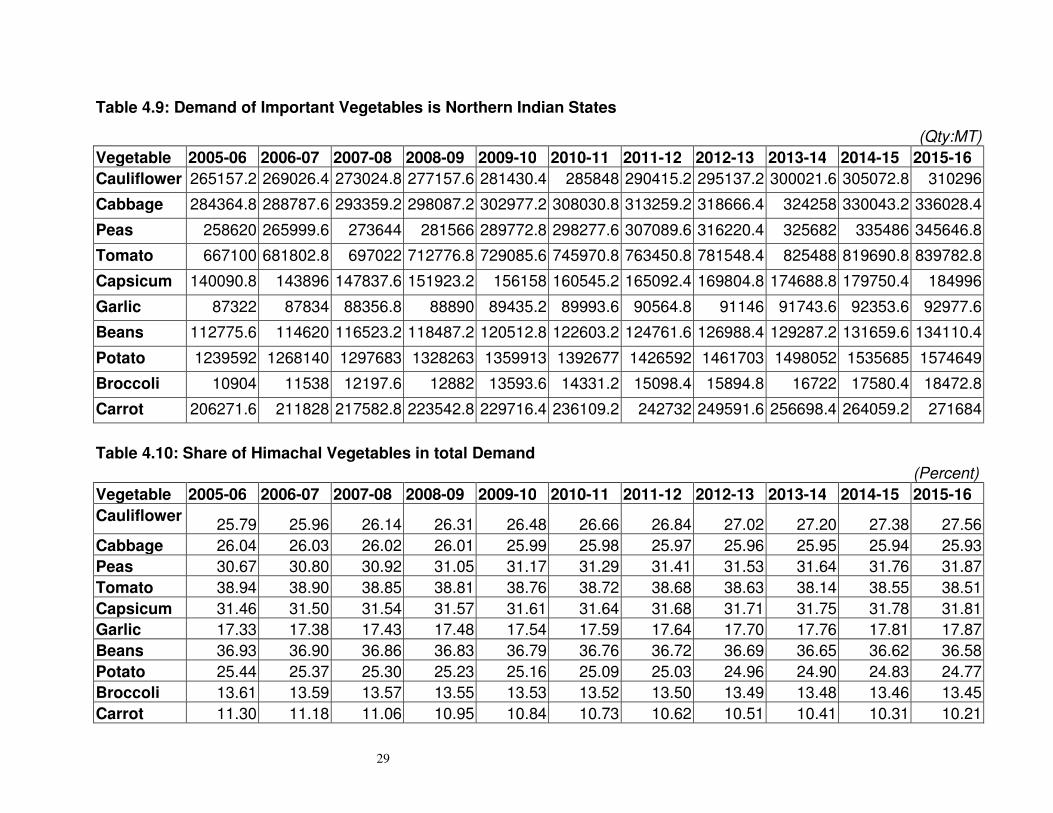
Table 4.9: Demand of Important Vegetables is Northern Indian States
(Qty:MT)
Vegetable 2005-06 2006-07 2007-08 2008-09 2009-10 2010-11 2011-12 2012-13 2013-14 2014-15 2015-16
Cauliflower 265157.2 269026.4 273024.8 277157.6 281430.4 285848 290415.2 295137.2 300021.6 305072.8 310296
Cabbage 284364.8 288787.6 293359.2 298087.2 302977.2 308030.8 313259.2 318666.4 324258 330043.2 336028.4
Peas 258620 265999.6 273644 281566 289772.8 298277.6 307089.6 316220.4 325682 335486 345646.8
Tomato 667100 681802.8 697022 712776.8 729085.6 745970.8 763450.8 781548.4 825488 819690.8 839782.8
Capsicum 140090.8 143896 147837.6 151923.2 156158 160545.2 165092.4 169804.8 174688.8 179750.4 184996
Garlic 87322 87834 88356.8 88890 89435.2 89993.6 90564.8 91146 91743.6 92353.6 92977.6
Beans 112775.6 114620 116523.2 118487.2 120512.8 122603.2 124761.6 126988.4 129287.2 131659.6 134110.4
Potato 1239592 1268140 1297683 1328263 1359913 1392677 1426592 1461703 1498052 1535685 1574649
Broccoli 10904 11538 12197.6 12882 13593.6 14331.2 15098.4 15894.8 16722 17580.4 18472.8
Carrot 206271.6 211828 217582.8 223542.8 229716.4 236109.2 242732 249591.6 256698.4 264059.2 271684
Table 4.10: Share of Himachal Vegetables in total Demand
(Percent)
Vegetable 2005-06 2006-07 2007-08 2008-09 2009-10 2010-11 2011-12 2012-13 2013-14 2014-15 2015-16
Cauliflower 25.79 25.96 26.14 26.31 26.48 26.66 26.84 27.02 27.20 27.38 27.56
Cabbage 26.04 26.03 26.02 26.01 25.99 25.98 25.97 25.96 25.95 25.94 25.93
Peas 30.67 30.80 30.92 31.05 31.17 31.29 31.41 31.53 31.64 31.76 31.87
Tomato 38.94 38.90 38.85 38.81 38.76 38.72 38.68 38.63 38.14 38.55 38.51
Capsicum 31.46 31.50 31.54 31.57 31.61 31.64 31.68 31.71 31.75 31.78 31.81
Garlic 17.33 17.38 17.43 17.48 17.54 17.59 17.64 17.70 17.76 17.81 17.87
Beans 36.93 36.90 36.86 36.83 36.79 36.76 36.72 36.69 36.65 36.62 36.58
Potato 25.44 25.37 25.30 25.23 25.16 25.09 25.03 24.96 24.90 24.83 24.77
Broccoli 13.61 13.59 13.57 13.55 13.53 13.52 13.50 13.49 13.48 13.46 13.45
Carrot 11.30 11.18 11.06 10.95 10.84 10.73 10.62 10.51 10.41 10.31 10.21

31
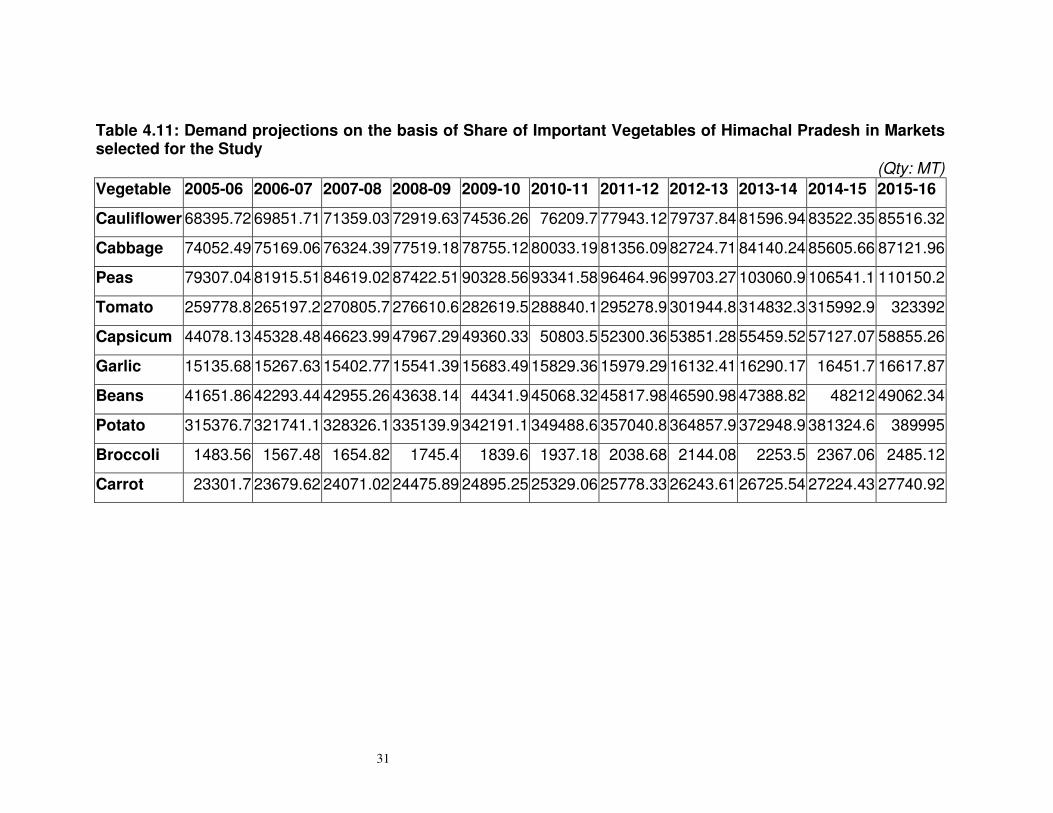
Table 4.11: Demand projections on the basis of Share of Important Vegetables of Himachal Pradesh in Markets selected for the Study
(Qty: MT)
Vegetable 2005-06 2006-07 2007-08 2008-09 2009-10 2010-11 2011-12 2012-13 2013-14 2014-15 2015-16
Cauliflower 68395.72 69851.71 71359.03 72919.63 74536.26 76209.7 77943.12 79737.84 81596.94 83522.35 85516.32
Cabbage 74052.49 75169.06 76324.39 77519.18 78755.12 80033.19 81356.09 82724.71 84140.24 85605.66 87121.96
Peas 79307.04 81915.51 84619.02 87422.51 90328.56 93341.58 96464.96 99703.27 103060.9 106541.1 110150.2
Tomato 259778.8 265197.2 270805.7 276610.6 282619.5 288840.1 295278.9 301944.8 314832.3 315992.9 323392
Capsicum 44078.13 45328.48 46623.99 47967.29 49360.33 50803.5 52300.36 53851.28 55459.52 57127.07 58855.26
Garlic 15135.68 15267.63 15402.77 15541.39 15683.49 15829.36 15979.29 16132.41 16290.17 16451.7 16617.87
Beans 41651.86 42293.44 42955.26 43638.14 44341.9 45068.32 45817.98 46590.98 47388.82 48212 49062.34
Potato 315376.7 321741.1 328326.1 335139.9 342191.1 349488.6 357040.8 364857.9 372948.9 381324.6 389995
Broccoli 1483.56 1567.48 1654.82 1745.4 1839.6 1937.18 2038.68 2144.08 2253.5 2367.06 2485.12
Carrot 23301.7 23679.62 24071.02 24475.89 24895.25 25329.06 25778.33 26243.61 26725.54 27224.43 27740.92
32
Chapter V
Area Allocation and Consumer Awareness
Area under different vegetables in Himachal Pradesh is increasing over the
period of time and caters to the vegetables demand of neighbouring States like
Punjab, Haryana, Chandigarh and Delhi. Himachal vegetables came into market
during summer and rainy seasons when there is a huge deficiency of vegetables
in the market. Himachal is the major supplier of vegetables like peas, tomato,
beans, cabbage, cauliflower, capsicum etc. and some exotic varieties of
vegetables. Presently, about 77 percent of the total area under vegetables is
cultivated under peas, tomato, beans, cabbage, cauliflower, cucurbits, and
capsicum.
On analysing the demand pattern for the next 10 years, it was found that the
demand of some vegetables require more area for their cultivation. The area
required under selected vegetables of Himachal Pradesh is presented in Table
5.1.
The analysis of present area and area required under important
vegetables of Himachal Pradesh, following trends are observed:
Peas Area under Pea cultivation in the State during 2004-05 was 15441
ha. Peas are mainly grown in Lahaul –Spiti, Kinnaur and Shimla districts, which
are purely off-seasonal in nature and fetches very high price in the market.
Though the projected area for 2005-06 comes out to be 7996 ha and shows a
surplus area of 7445 ha, but this may be attributed to the fact that about 50
percent of the total production of Pea goes to other markets like, Bangalore,
Maharashtra, Kolkatta etc. which are not covered under this study and some
share out of this may also be consumed within the State. Hence, area under
peas should be increased to reap the benefits of their high prices during the
season.
33
Tomato Area under Tomato cultivation in the State during 2004-05 was
8973 ha which is 521 ha surplus over the projected area during 2005-06. Since,
there are two crops of Tomato during the year in the State and one crop out of
this is facing completion from neighbouring States and other tomato producing
States. On the other hand, tomato prices registered fluctuating and declining
trend during the last five years. Hence, the surplus area under tomato cultivation
must be replaced for the production of other remunerative vegetables.
Beans Area under Beans cultivation during 2004-05 was 2608 ha which is
1404 ha less than the area required during 2005-06. Hence, area Beans must be
increased.
Garlic On analysing the present and projected area under Garlic
cultivation, it was found that presently there is a surplus area of 1109 ha under
Garlic cultivation in the State. Thus, it must be replaced by other vegetables. This
is also supported by the fact that Garlic prices are declining over the years and
farmers are fetching losses in Garlic cultivation.
Cabbage The area under cultivation of cabbage during 2004-05 was
2889 ha which is 271 ha surplus than required during 2005-06. Further, prices of
cabbage are also registered fluctuating trend. Hence, the surplus area must be
replaced by other remunerative vegetables.
Cauliflower Area under cauliflower cultivation is 1821 ha less than the
present requirement of 3629 ha. Thus, it should be increased to reap the benefit
of higher prices as compared to cabbage.
Capsicum The demand of Capsicum is very high in the neighbouring
States of Himachal Pradesh. The area under the cultivation of capsicum in the
State is 1834 ha, which is 2398 ha less than the area required during 2005-06.
34
Hence, it must be increased by replacing area under Tomato cultivation
especially in Solan district of Himachal Pradesh.
Potato Potato is an important off-seasonal seed crop of Lahaul-Spiti district
of Himachal Pradesh. Besides, it is also grown in Kinnaur and high hills of district
Shimla. Area under potato cultivation during 2004-05 was 14100 ha. On the
basis of demand projections, it was found that 12582 ha additional area is
required to meet the potato demand of neighbouring States.
35
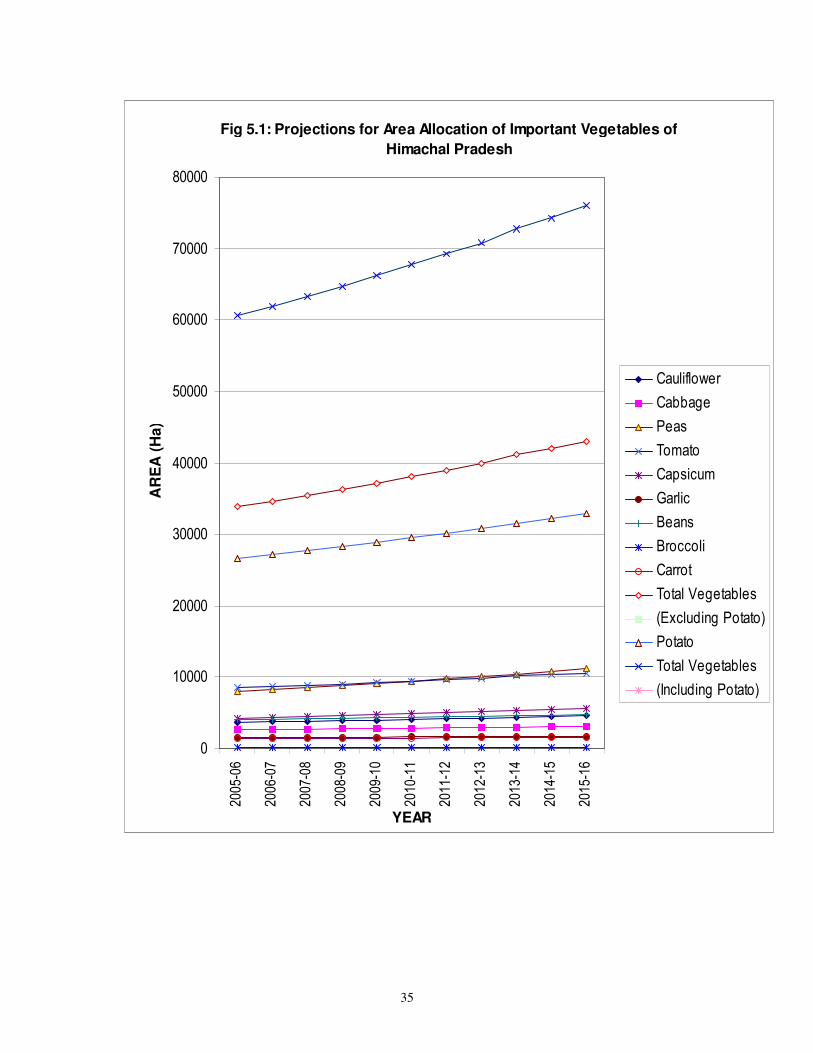
Fig 5.1: Projections for Area Allocation of Important Vegetables of
Himachal Pradesh
0
10000
20000
30000
40000
50000
60000
70000
80000
2005
-06
2006
-07
2007
-08
2008
-09
2009
-10
2010
-11
2011
-12
2012
-13
2013
-14
2014
-15
2015
-16
YEAR
AR
EA
(H
a)
Cauliflower
Cabbage
Peas
Tomato
Capsicum
Garlic
Beans
Broccoli
Carrot
Total Vegetables
(Excluding Potato)
Potato
Total Vegetables
(Including Potato)
36
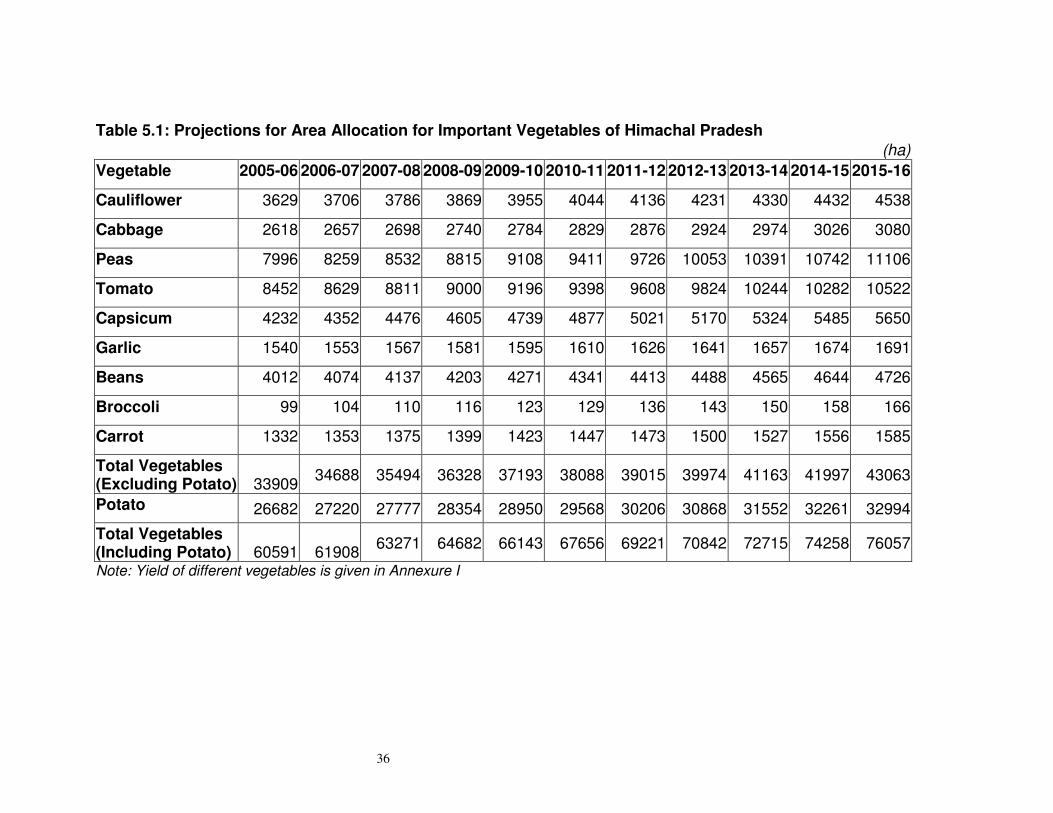
Table 5.1: Projections for Area Allocation for Important Vegetables of Himachal Pradesh
(ha)
Vegetable 2005-06 2006-07 2007-08 2008-09 2009-10 2010-11 2011-12 2012-13 2013-14 2014-15 2015-16
Cauliflower 3629 3706 3786 3869 3955 4044 4136 4231 4330 4432 4538
Cabbage 2618 2657 2698 2740 2784 2829 2876 2924 2974 3026 3080
Peas 7996 8259 8532 8815 9108 9411 9726 10053 10391 10742 11106
Tomato 8452 8629 8811 9000 9196 9398 9608 9824 10244 10282 10522
Capsicum 4232 4352 4476 4605 4739 4877 5021 5170 5324 5485 5650
Garlic 1540 1553 1567 1581 1595 1610 1626 1641 1657 1674 1691
Beans 4012 4074 4137 4203 4271 4341 4413 4488 4565 4644 4726
Broccoli 99 104 110 116 123 129 136 143 150 158 166
Carrot 1332 1353 1375 1399 1423 1447 1473 1500 1527 1556 1585
Total Vegetables (Excluding Potato) 33909
34688 35494 36328 37193 38088 39015 39974 41163 41997 43063
Potato 26682 27220 27777 28354 28950 29568 30206 30868 31552 32261 32994
Total Vegetables (Including Potato) 60591 61908
63271 64682 66143 67656 69221 70842 72715 74258 76057
Note: Yield of different vegetables is given in Annexure I
37
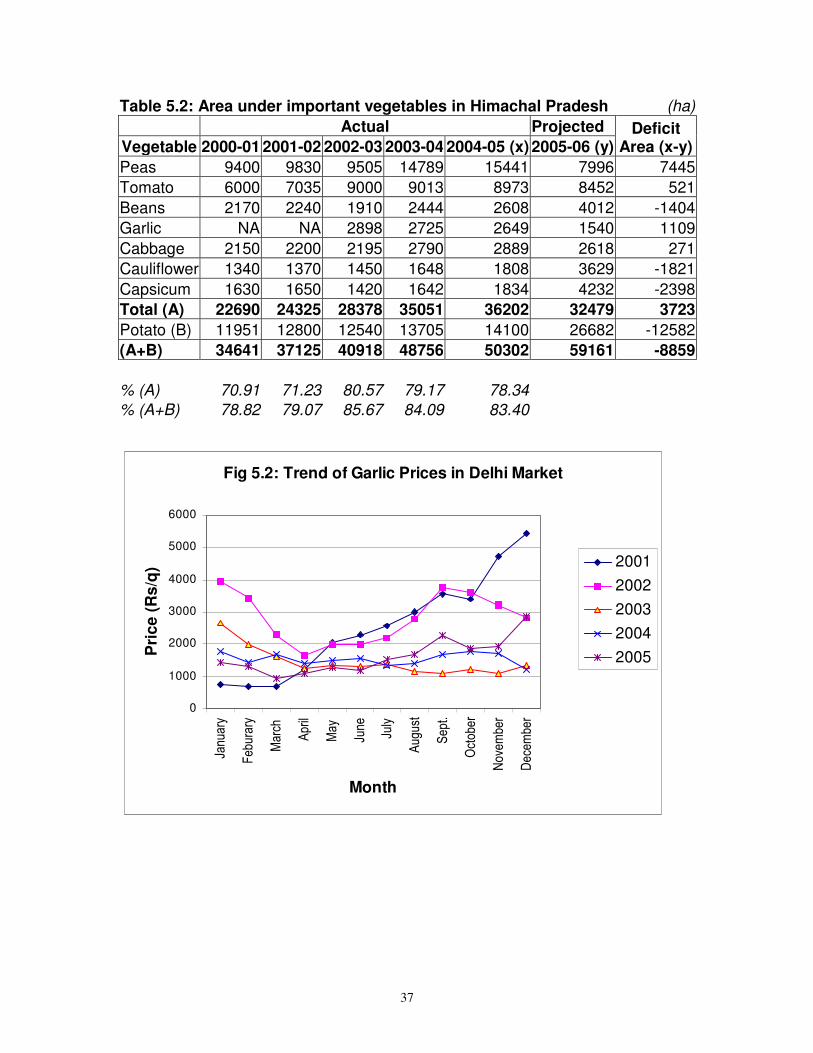
Table 5.2: Area under important vegetables in Himachal Pradesh (ha)
Actual Projected Deficit Area (x-y) Vegetable 2000-01 2001-02 2002-03 2003-04 2004-05 (x) 2005-06 (y)
Peas 9400 9830 9505 14789 15441 7996 7445
Tomato 6000 7035 9000 9013 8973 8452 521
Beans 2170 2240 1910 2444 2608 4012 -1404
Garlic NA NA 2898 2725 2649 1540 1109
Cabbage 2150 2200 2195 2790 2889 2618 271
Cauliflower 1340 1370 1450 1648 1808 3629 -1821
Capsicum 1630 1650 1420 1642 1834 4232 -2398
Total (A) 22690 24325 28378 35051 36202 32479 3723
Potato (B) 11951 12800 12540 13705 14100 26682 -12582
(A+B) 34641 37125 40918 48756 50302 59161 -8859
% (A) 70.91 71.23 80.57 79.17 78.34 % (A+B) 78.82 79.07 85.67 84.09 83.40
Fig 5.2: Trend of Garlic Prices in Delhi Market
0
1000
2000
3000
4000
5000
6000
Janu
ary
Feb
urar
y
Mar
ch
Apr
il
May
June
July
Aug
ust
Sep
t.
Oct
ober
Nov
embe
r
Dec
embe
r
Month
Pri
ce
(R
s/q
) 2001
2002
2003
2004
2005
38
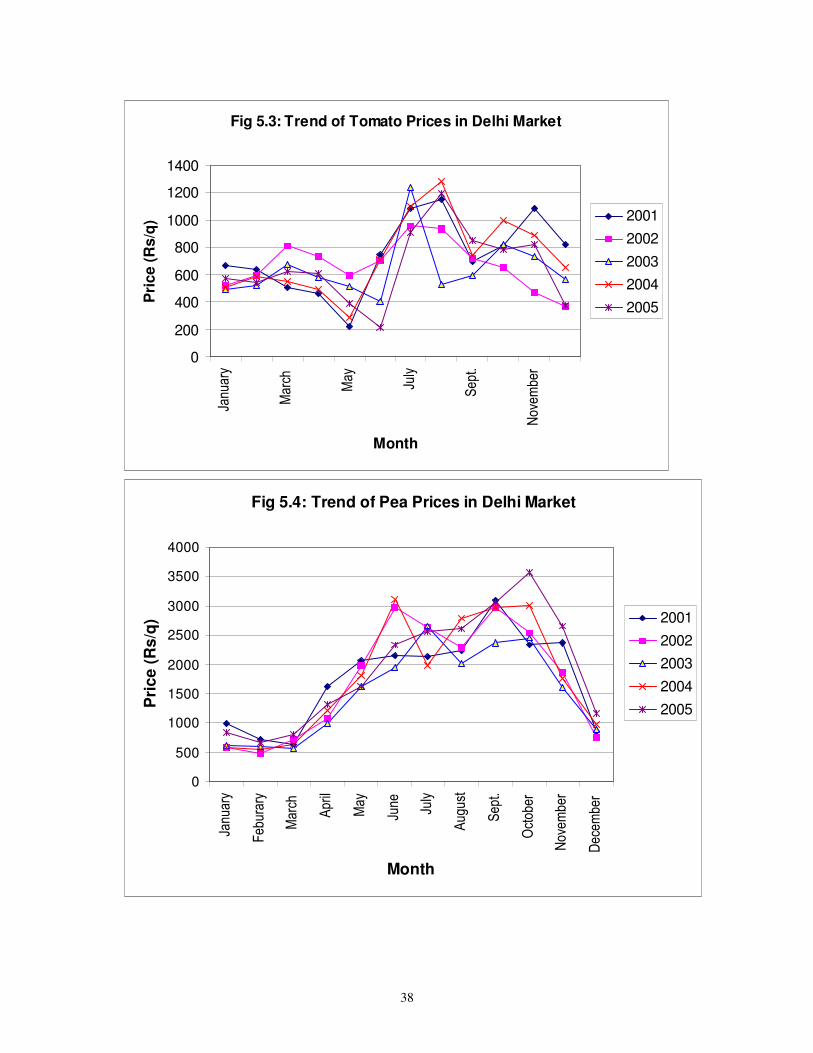
Fig 5.3: Trend of Tomato Prices in Delhi Market
0
200
400
600
800
1000
1200
1400
Janu
ary
Mar
ch
May
July
Sep
t.
Nov
embe
r
Month
Pri
ce (
Rs/q
) 2001
2002
2003
2004
2005
Fig 5.4: Trend of Pea Prices in Delhi Market
0
500
1000
1500
2000
2500
3000
3500
4000
Janu
ary
Feb
urar
y
Mar
ch
Apr
il
May
June July
Aug
ust
Sep
t.
Oct
ober
Nov
embe
r
Dec
embe
r
Month
Pri
ce
(R
s/q
) 2001
2002
2003
2004
2005
39
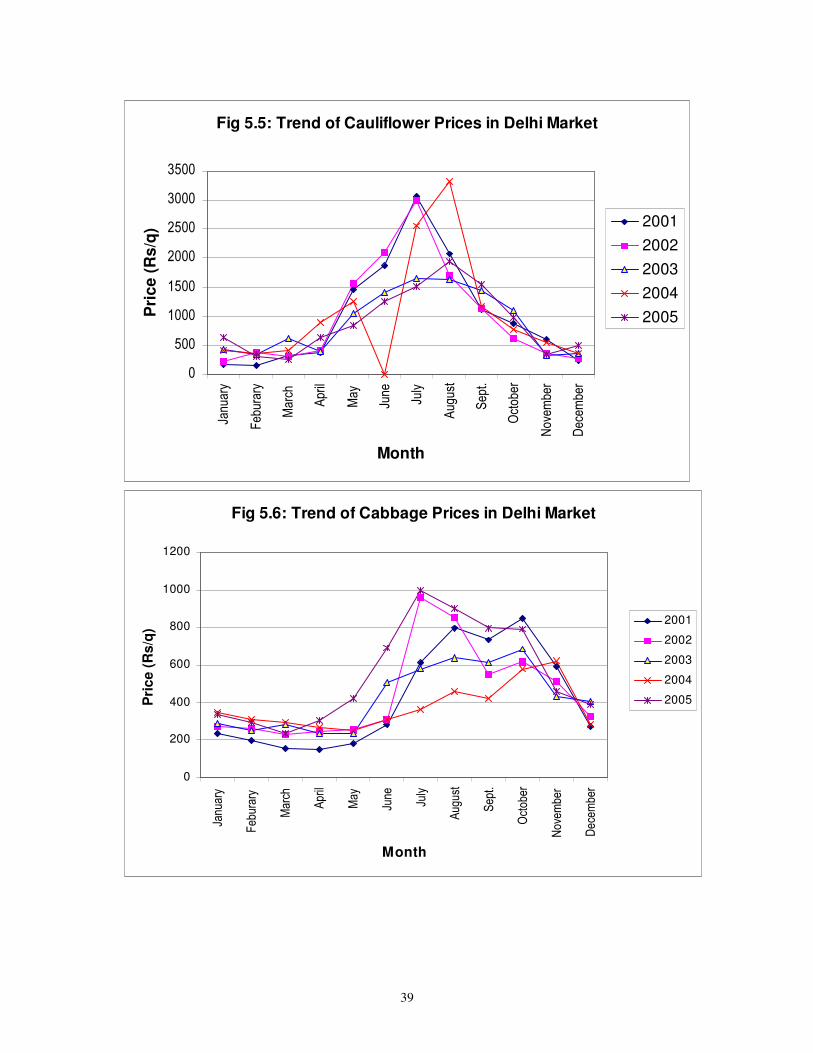
Fig 5.5: Trend of Cauliflower Prices in Delhi Market
0
500
1000
1500
2000
2500
3000
3500
Janu
ary
Feb
urar
y
Mar
ch
Apr
il
May
June
July
Aug
ust
Sep
t.
Oct
ober
Nov
embe
r
Dec
embe
r
Month
Pri
ce
(R
s/q
) 2001
2002
2003
2004
2005
Fig 5.6: Trend of Cabbage Prices in Delhi Market
0
200
400
600
800
1000
1200
Janu
ary
Feb
urar
y
Mar
ch
Apr
il
May
June
July
Aug
ust
Sep
t.
Oct
ober
Nov
embe
r
Dec
embe
r
Month
Pri
ce
(R
s/q
)
2001
2002
2003
2004
2005
40
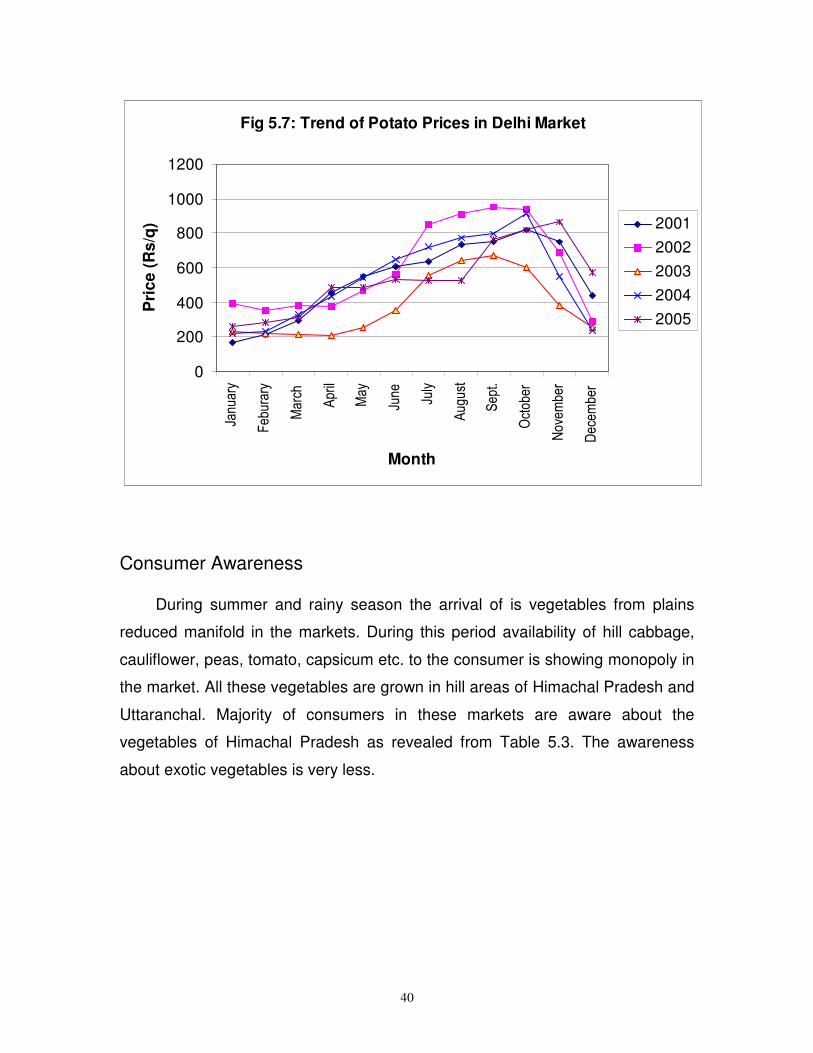
Fig 5.7: Trend of Potato Prices in Delhi Market
0
200
400
600
800
1000
1200
Janu
ary
Feb
urar
y
Mar
ch
Apr
il
May
June
July
Aug
ust
Sep
t.
Oct
ober
Nov
embe
r
Dec
embe
r
Month
Pri
ce
(R
s/q
) 2001
2002
2003
2004
2005
Consumer Awareness
During summer and rainy season the arrival of is vegetables from plains
reduced manifold in the markets. During this period availability of hill cabbage,
cauliflower, peas, tomato, capsicum etc. to the consumer is showing monopoly in
the market. All these vegetables are grown in hill areas of Himachal Pradesh and
Uttaranchal. Majority of consumers in these markets are aware about the
vegetables of Himachal Pradesh as revealed from Table 5.3. The awareness
about exotic vegetables is very less.
41
Table 5.3: Consumer Awareness about Himachal/ Hill Vegetables in different Markets
(Percent)
Vegetables Markets
Delhi Chandigarh Haryana Punjab
Cauliflower 79 62 50 48
Cabbage 73 63 52 54
Peas 82 79 71 80
Tomato 42 46 51 60
Capsicum 80 69 65 64
Garlic - - - -
Beans 35 41 30 25
Potato 80 81 80 81
Broccoli 43 54 40 42
Carrot 48 37 25 24
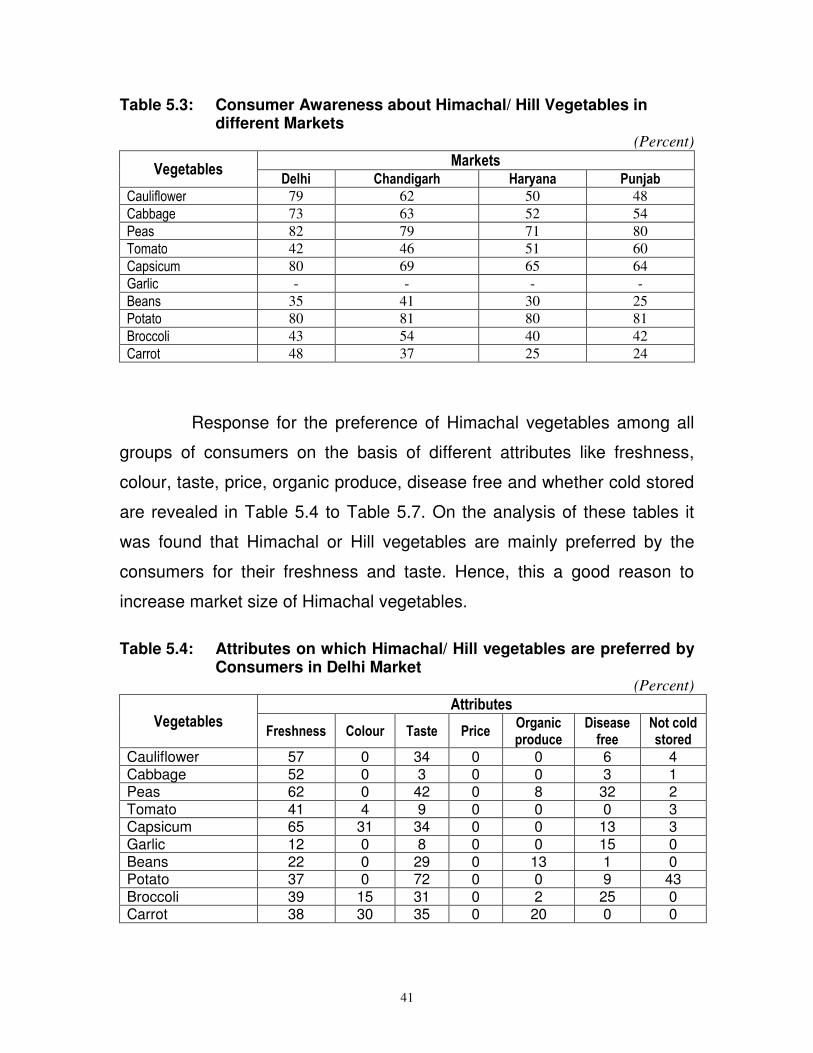
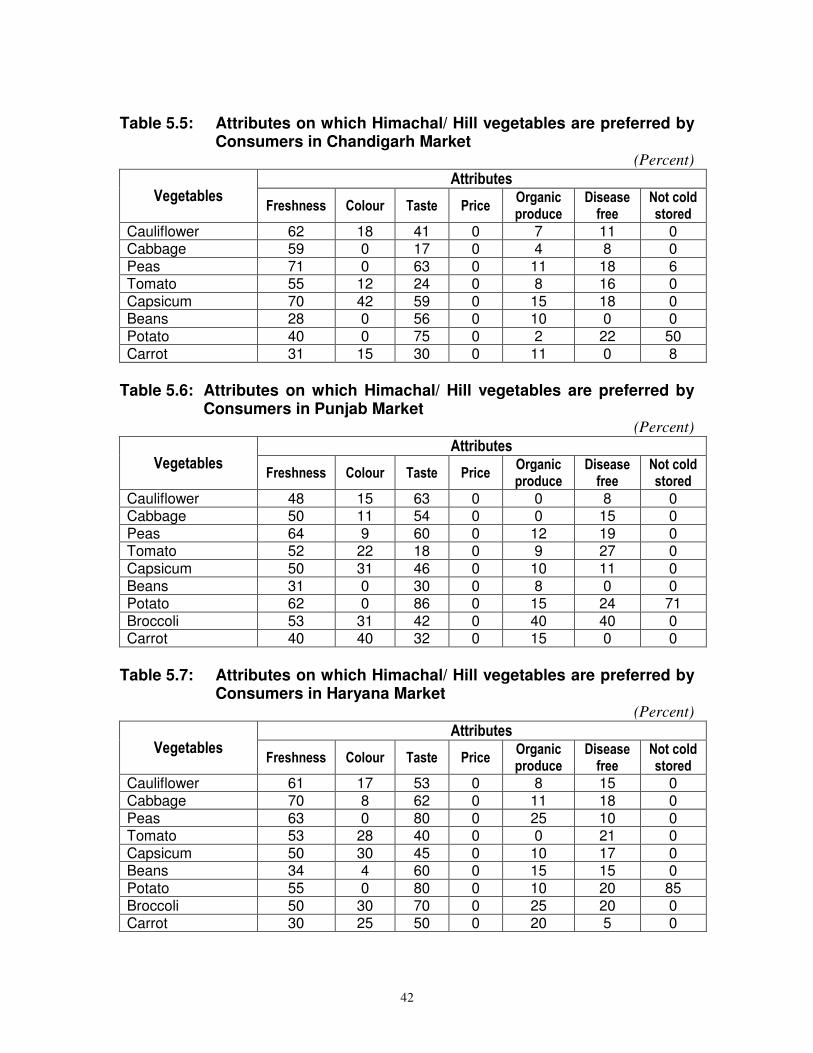
Response for the preference of Himachal vegetables among all
groups of consumers on the basis of different attributes like freshness,
colour, taste, price, organic produce, disease free and whether cold stored
are revealed in Table 5.4 to Table 5.7. On the analysis of these tables it
was found that Himachal or Hill vegetables are mainly preferred by the
consumers for their freshness and taste. Hence, this a good reason to
increase market size of Himachal vegetables.
Table 5.4: Attributes on which Himachal/ Hill vegetables are preferred by
Consumers in Delhi Market (Percent)
Vegetables Attributes
Freshness Colour Taste Price Organic produce
Disease free
Not cold stored
Cauliflower 57 0 34 0 0 6 4 Cabbage 52 0 3 0 0 3 1 Peas 62 0 42 0 8 32 2 Tomato 41 4 9 0 0 0 3 Capsicum 65 31 34 0 0 13 3 Garlic 12 0 8 0 0 15 0 Beans 22 0 29 0 13 1 0 Potato 37 0 72 0 0 9 43 Broccoli 39 15 31 0 2 25 0 Carrot 38 30 35 0 20 0 0
42
Table 5.5: Attributes on which Himachal/ Hill vegetables are preferred by
Consumers in Chandigarh Market (Percent)
Vegetables Attributes
Freshness Colour Taste Price Organic produce
Disease free
Not cold stored
Cauliflower 62 18 41 0 7 11 0 Cabbage 59 0 17 0 4 8 0 Peas 71 0 63 0 11 18 6 Tomato 55 12 24 0 8 16 0 Capsicum 70 42 59 0 15 18 0 Beans 28 0 56 0 10 0 0 Potato 40 0 75 0 2 22 50 Carrot 31 15 30 0 11 0 8
Table 5.6: Attributes on which Himachal/ Hill vegetables are preferred by
Consumers in Punjab Market (Percent)
Vegetables Attributes
Freshness Colour Taste Price Organic produce
Disease free
Not cold stored
Cauliflower 48 15 63 0 0 8 0 Cabbage 50 11 54 0 0 15 0 Peas 64 9 60 0 12 19 0 Tomato 52 22 18 0 9 27 0 Capsicum 50 31 46 0 10 11 0 Beans 31 0 30 0 8 0 0 Potato 62 0 86 0 15 24 71 Broccoli 53 31 42 0 40 40 0 Carrot 40 40 32 0 15 0 0
Table 5.7: Attributes on which Himachal/ Hill vegetables are preferred by
Consumers in Haryana Market (Percent)
Vegetables Attributes
Freshness Colour Taste Price Organic produce
Disease free
Not cold stored
Cauliflower 61 17 53 0 8 15 0 Cabbage 70 8 62 0 11 18 0 Peas 63 0 80 0 25 10 0 Tomato 53 28 40 0 0 21 0 Capsicum 50 30 45 0 10 17 0 Beans 34 4 60 0 15 15 0 Potato 55 0 80 0 10 20 85 Broccoli 50 30 70 0 25 20 0 Carrot 30 25 50 0 20 5 0
43
Chapter VI
Conclusions and Recommendations
During the course of study, it was observed that during summer and
rainy season, though the prices of vegetables remain high but the
consumers are forced to purchase even at these prices. After the mid of
November there seems a glut of vegetable arrival in the market especially
from West Bengal, Maharashtra, Gujarat, Punjab and Haryana. Summer
and Rainy season are the major periods for off-season vegetables of Himachal
Pradesh. Hence, by increasing the area under cultivation of vegetables or by
increasing their productivity the vegetable growers of Himachal can reap the
benefits of growing demand of neighbouring markets.
Himachal Pradesh has a potential of becoming vegetable bowl of the
country because the State has diverse agro-climatic conditions and scope of
growing off-season vegetables is also very high. Most of the farmers of Himachal
Pradesh are marginal and many of them recognize that the potential income from
growing vegetables is higher than that of growing cereals. They also recognise
that since vegetables are perishable, risks associated with growing vegetables
are also very high.
Demand of exotic vegetables like lettuce, asparagus, celery, swiss
chard, parsley, Brussels’s sprouts, broccoli, red cabbage, etc. among the mid
and high income population of Delhi is also very high. Presently, the supply of
these vegetables is very limited. Majority of these vegetables are imported from
other countries and sold at a very high price. Thus these vegetables are
affordable to five star hotels and large restaurants. Changing life style of mid and
high income class tends to include continental cuisine in their daily diet. Hence,
demand for these vegetables would increase in near future.
44
To achieve the desired results following steps should be taken:
1. Area under vegetable cultivation should be increased in the State.
2. Though the demand of exotic vegetables like, Broccoli, Brussels
Sprouts, Celery, Parsley, Red Cabbage, Yellow and Red Capsicum etc.
is not very high in the market, but it is mainly due to lack of awareness to
the consumers and their very high prices. Hence area under these
vegetables must be increased immediately to bridge the gap between
demand and supply.
3. There should be an advertising campaign for Himachal vegetables
especially exotic vegetables to get due share in the market.
4. Vegetable growers should organize themselves into farmers’
cooperatives and link themselves with the district cooperatives or State
cooperatives.
5. MIS should be strengthened for the timely availability of information to
the farmers so that they can plan their schedule for growing vegetables.
6. To avoid crises and risks, early warning systems and risk relief
measures need to be in place to ensure economic security.
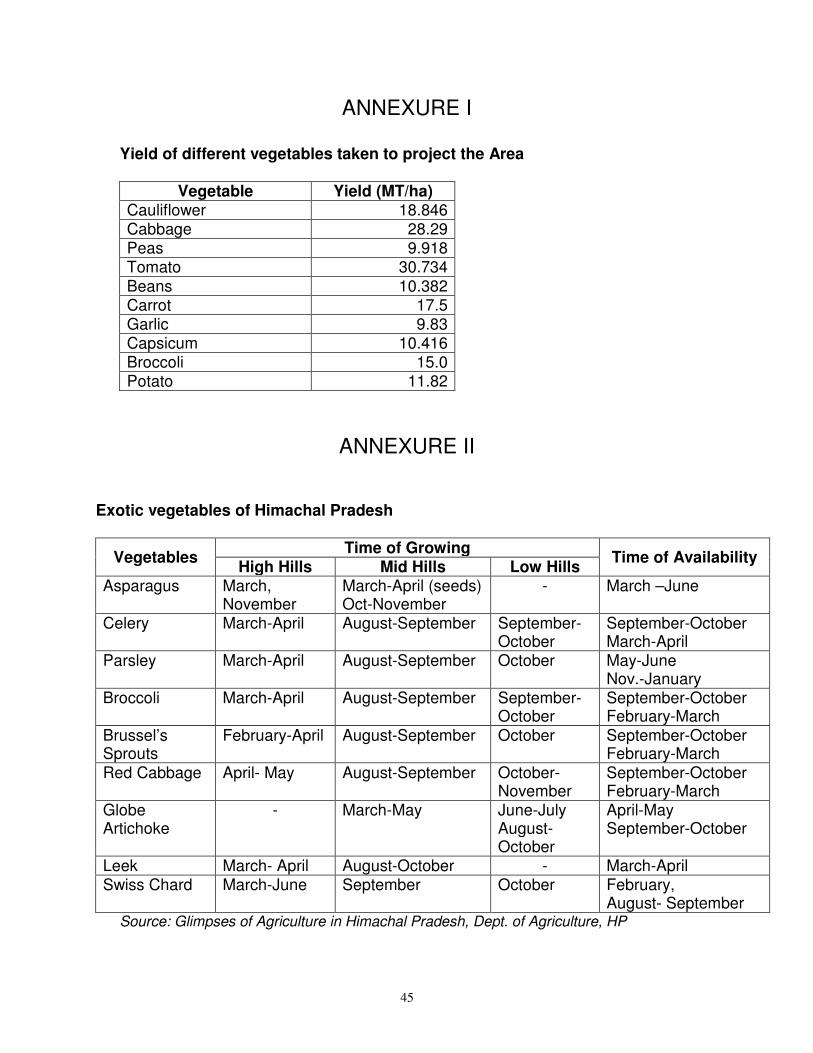
45
ANNEXURE I Yield of different vegetables taken to project the Area
Vegetable Yield (MT/ha) Cauliflower 18.846 Cabbage 28.29 Peas 9.918 Tomato 30.734 Beans 10.382 Carrot 17.5 Garlic 9.83 Capsicum 10.416 Broccoli 15.0 Potato 11.82
ANNEXURE II
Exotic vegetables of Himachal Pradesh
Vegetables Time of Growing
Time of Availability High Hills Mid Hills Low Hills
Asparagus March, November
March-April (seeds) Oct-November
- March –June
Celery March-April August-September September-October
September-October March-April
Parsley March-April August-September October May-June Nov.-January
Broccoli March-April August-September September-October
September-October February-March
Brussel’s Sprouts
February-April August-September October September-October February-March
Red Cabbage April- May August-September October-November
September-October February-March
Globe Artichoke
- March-May June-July August-October
April-May September-October
Leek March- April August-October - March-April Swiss Chard March-June September October February,
August- September Source: Glimpses of Agriculture in Himachal Pradesh, Dept. of Agriculture, HP
46
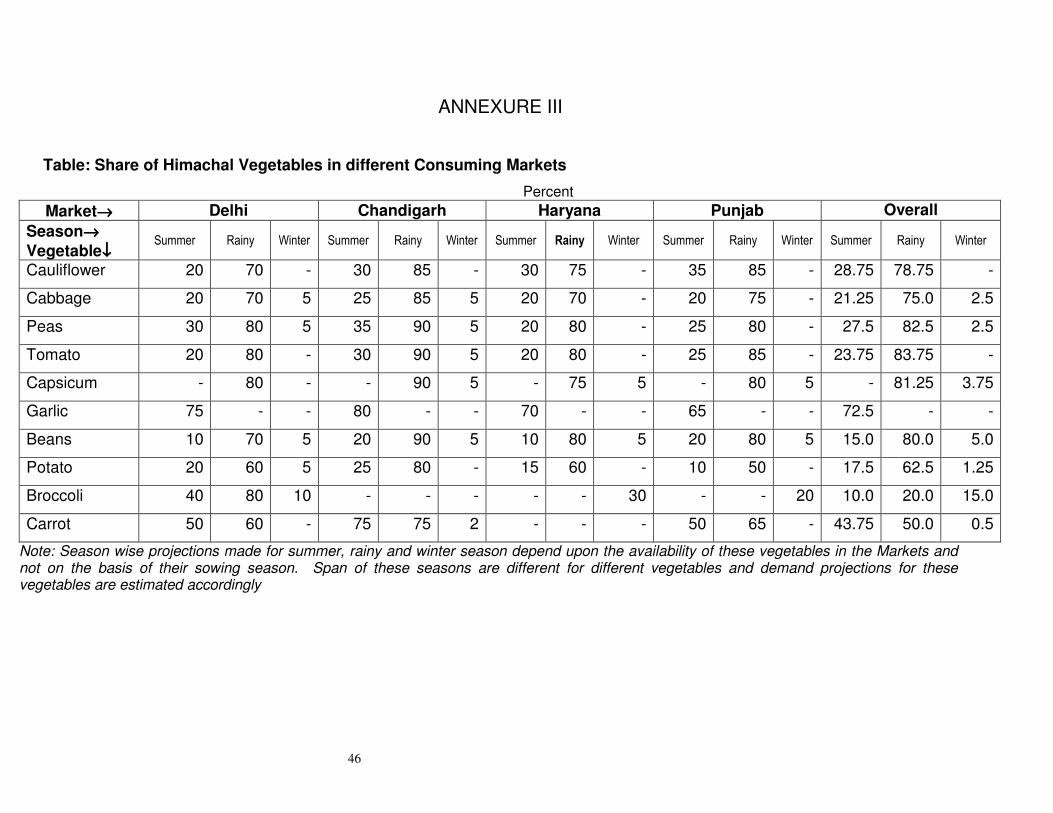
ANNEXURE III
Table: Share of Himachal Vegetables in different Consuming Markets
Percent
Market→→→→ Delhi Chandigarh Haryana Punjab Overall
Season→→→→
Vegetable↓↓↓↓ Summer Rainy Winter Summer Rainy Winter Summer Rainy Winter Summer Rainy Winter Summer Rainy Winter
Cauliflower 20 70 - 30 85 - 30 75 - 35 85 - 28.75 78.75 -
Cabbage 20 70 5 25 85 5 20 70 - 20 75 - 21.25 75.0 2.5
Peas 30 80 5 35 90 5 20 80 - 25 80 - 27.5 82.5 2.5
Tomato 20 80 - 30 90 5 20 80 - 25 85 - 23.75 83.75 -
Capsicum - 80 - - 90 5 - 75 5 - 80 5 - 81.25 3.75
Garlic 75 - - 80 - - 70 - - 65 - - 72.5 - -
Beans 10 70 5 20 90 5 10 80 5 20 80 5 15.0 80.0 5.0
Potato 20 60 5 25 80 - 15 60 - 10 50 - 17.5 62.5 1.25
Broccoli 40 80 10 - - - - - 30 - - 20 10.0 20.0 15.0
Carrot 50 60 - 75 75 2 - - - 50 65 - 43.75 50.0 0.5
Note: Season wise projections made for summer, rainy and winter season depend upon the availability of these vegetables in the Markets and not on the basis of their sowing season. Span of these seasons are different for different vegetables and demand projections for these vegetables are estimated accordingly
47
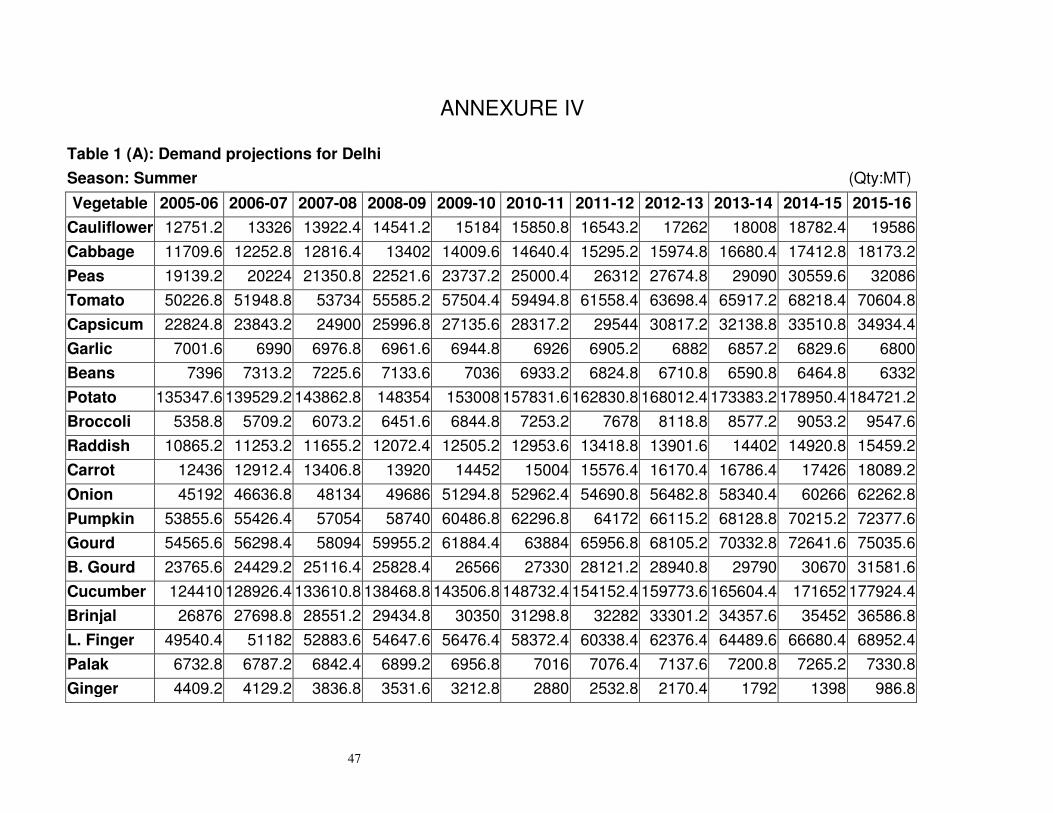
ANNEXURE IV
Table 1 (A): Demand projections for Delhi
Season: Summer (Qty:MT)
Vegetable 2005-06 2006-07 2007-08 2008-09 2009-10 2010-11 2011-12 2012-13 2013-14 2014-15 2015-16
Cauliflower 12751.2 13326 13922.4 14541.2 15184 15850.8 16543.2 17262 18008 18782.4 19586
Cabbage 11709.6 12252.8 12816.4 13402 14009.6 14640.4 15295.2 15974.8 16680.4 17412.8 18173.2
Peas 19139.2 20224 21350.8 22521.6 23737.2 25000.4 26312 27674.8 29090 30559.6 32086
Tomato 50226.8 51948.8 53734 55585.2 57504.4 59494.8 61558.4 63698.4 65917.2 68218.4 70604.8
Capsicum 22824.8 23843.2 24900 25996.8 27135.6 28317.2 29544 30817.2 32138.8 33510.8 34934.4
Garlic 7001.6 6990 6976.8 6961.6 6944.8 6926 6905.2 6882 6857.2 6829.6 6800
Beans 7396 7313.2 7225.6 7133.6 7036 6933.2 6824.8 6710.8 6590.8 6464.8 6332
Potato 135347.6 139529.2 143862.8 148354 153008 157831.6 162830.8 168012.4 173383.2 178950.4 184721.2
Broccoli 5358.8 5709.2 6073.2 6451.6 6844.8 7253.2 7678 8118.8 8577.2 9053.2 9547.6
Raddish 10865.2 11253.2 11655.2 12072.4 12505.2 12953.6 13418.8 13901.6 14402 14920.8 15459.2
Carrot 12436 12912.4 13406.8 13920 14452 15004 15576.4 16170.4 16786.4 17426 18089.2
Onion 45192 46636.8 48134 49686 51294.8 52962.4 54690.8 56482.8 58340.4 60266 62262.8
Pumpkin 53855.6 55426.4 57054 58740 60486.8 62296.8 64172 66115.2 68128.8 70215.2 72377.6
Gourd 54565.6 56298.4 58094 59955.2 61884.4 63884 65956.8 68105.2 70332.8 72641.6 75035.6
B. Gourd 23765.6 24429.2 25116.4 25828.4 26566 27330 28121.2 28940.8 29790 30670 31581.6
Cucumber 124410 128926.4 133610.8 138468.8 143506.8 148732.4 154152.4 159773.6 165604.4 171652 177924.4
Brinjal 26876 27698.8 28551.2 29434.8 30350 31298.8 32282 33301.2 34357.6 35452 36586.8
L. Finger 49540.4 51182 52883.6 54647.6 56476.4 58372.4 60338.4 62376.4 64489.6 66680.4 68952.4
Palak 6732.8 6787.2 6842.4 6899.2 6956.8 7016 7076.4 7137.6 7200.8 7265.2 7330.8
Ginger 4409.2 4129.2 3836.8 3531.6 3212.8 2880 2532.8 2170.4 1792 1398 986.8
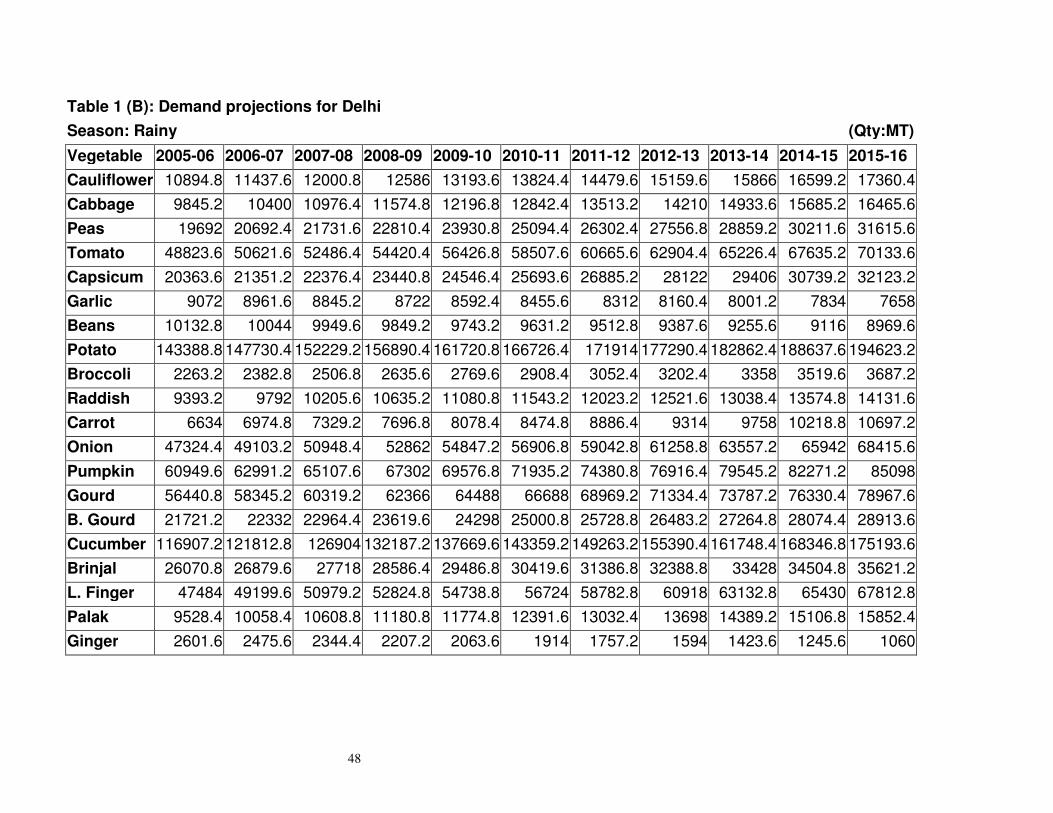
48
Table 1 (B): Demand projections for Delhi
Season: Rainy (Qty:MT)
Vegetable 2005-06 2006-07 2007-08 2008-09 2009-10 2010-11 2011-12 2012-13 2013-14 2014-15 2015-16
Cauliflower 10894.8 11437.6 12000.8 12586 13193.6 13824.4 14479.6 15159.6 15866 16599.2 17360.4
Cabbage 9845.2 10400 10976.4 11574.8 12196.8 12842.4 13513.2 14210 14933.6 15685.2 16465.6
Peas 19692 20692.4 21731.6 22810.4 23930.8 25094.4 26302.4 27556.8 28859.2 30211.6 31615.6
Tomato 48823.6 50621.6 52486.4 54420.4 56426.8 58507.6 60665.6 62904.4 65226.4 67635.2 70133.6
Capsicum 20363.6 21351.2 22376.4 23440.8 24546.4 25693.6 26885.2 28122 29406 30739.2 32123.2
Garlic 9072 8961.6 8845.2 8722 8592.4 8455.6 8312 8160.4 8001.2 7834 7658
Beans 10132.8 10044 9949.6 9849.2 9743.2 9631.2 9512.8 9387.6 9255.6 9116 8969.6
Potato 143388.8 147730.4 152229.2 156890.4 161720.8 166726.4 171914 177290.4 182862.4 188637.6 194623.2
Broccoli 2263.2 2382.8 2506.8 2635.6 2769.6 2908.4 3052.4 3202.4 3358 3519.6 3687.2
Raddish 9393.2 9792 10205.6 10635.2 11080.8 11543.2 12023.2 12521.6 13038.4 13574.8 14131.6
Carrot 6634 6974.8 7329.2 7696.8 8078.4 8474.8 8886.4 9314 9758 10218.8 10697.2
Onion 47324.4 49103.2 50948.4 52862 54847.2 56906.8 59042.8 61258.8 63557.2 65942 68415.6
Pumpkin 60949.6 62991.2 65107.6 67302 69576.8 71935.2 74380.8 76916.4 79545.2 82271.2 85098
Gourd 56440.8 58345.2 60319.2 62366 64488 66688 68969.2 71334.4 73787.2 76330.4 78967.6
B. Gourd 21721.2 22332 22964.4 23619.6 24298 25000.8 25728.8 26483.2 27264.8 28074.4 28913.6
Cucumber 116907.2 121812.8 126904 132187.2 137669.6 143359.2 149263.2 155390.4 161748.4 168346.8 175193.6
Brinjal 26070.8 26879.6 27718 28586.4 29486.8 30419.6 31386.8 32388.8 33428 34504.8 35621.2
L. Finger 47484 49199.6 50979.2 52824.8 54738.8 56724 58782.8 60918 63132.8 65430 67812.8
Palak 9528.4 10058.4 10608.8 11180.8 11774.8 12391.6 13032.4 13698 14389.2 15106.8 15852.4
Ginger 2601.6 2475.6 2344.4 2207.2 2063.6 1914 1757.2 1594 1423.6 1245.6 1060
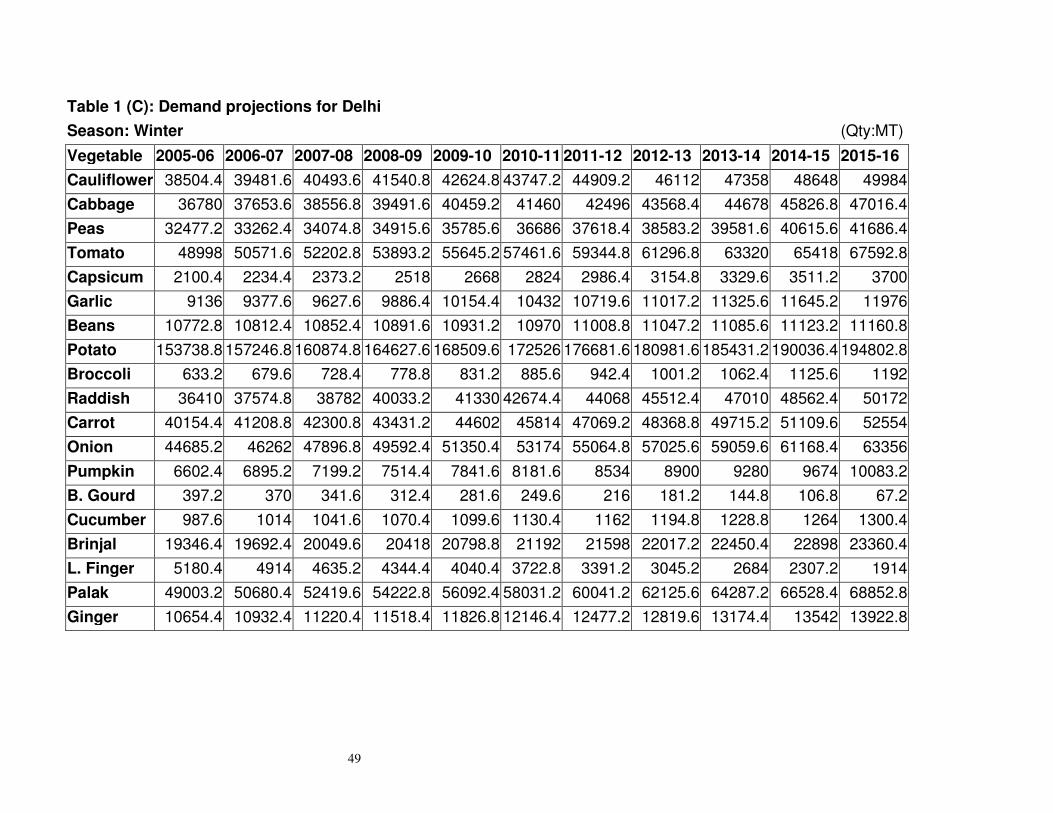
49
Table 1 (C): Demand projections for Delhi
Season: Winter (Qty:MT)
Vegetable 2005-06 2006-07 2007-08 2008-09 2009-10 2010-11 2011-12 2012-13 2013-14 2014-15 2015-16
Cauliflower 38504.4 39481.6 40493.6 41540.8 42624.8 43747.2 44909.2 46112 47358 48648 49984
Cabbage 36780 37653.6 38556.8 39491.6 40459.2 41460 42496 43568.4 44678 45826.8 47016.4
Peas 32477.2 33262.4 34074.8 34915.6 35785.6 36686 37618.4 38583.2 39581.6 40615.6 41686.4
Tomato 48998 50571.6 52202.8 53893.2 55645.2 57461.6 59344.8 61296.8 63320 65418 67592.8
Capsicum 2100.4 2234.4 2373.2 2518 2668 2824 2986.4 3154.8 3329.6 3511.2 3700
Garlic 9136 9377.6 9627.6 9886.4 10154.4 10432 10719.6 11017.2 11325.6 11645.2 11976
Beans 10772.8 10812.4 10852.4 10891.6 10931.2 10970 11008.8 11047.2 11085.6 11123.2 11160.8
Potato 153738.8 157246.8 160874.8 164627.6 168509.6 172526 176681.6 180981.6 185431.2 190036.4 194802.8
Broccoli 633.2 679.6 728.4 778.8 831.2 885.6 942.4 1001.2 1062.4 1125.6 1192
Raddish 36410 37574.8 38782 40033.2 41330 42674.4 44068 45512.4 47010 48562.4 50172
Carrot 40154.4 41208.8 42300.8 43431.2 44602 45814 47069.2 48368.8 49715.2 51109.6 52554
Onion 44685.2 46262 47896.8 49592.4 51350.4 53174 55064.8 57025.6 59059.6 61168.4 63356
Pumpkin 6602.4 6895.2 7199.2 7514.4 7841.6 8181.6 8534 8900 9280 9674 10083.2
B. Gourd 397.2 370 341.6 312.4 281.6 249.6 216 181.2 144.8 106.8 67.2
Cucumber 987.6 1014 1041.6 1070.4 1099.6 1130.4 1162 1194.8 1228.8 1264 1300.4
Brinjal 19346.4 19692.4 20049.6 20418 20798.8 21192 21598 22017.2 22450.4 22898 23360.4
L. Finger 5180.4 4914 4635.2 4344.4 4040.4 3722.8 3391.2 3045.2 2684 2307.2 1914
Palak 49003.2 50680.4 52419.6 54222.8 56092.4 58031.2 60041.2 62125.6 64287.2 66528.4 68852.8
Ginger 10654.4 10932.4 11220.4 11518.4 11826.8 12146.4 12477.2 12819.6 13174.4 13542 13922.8
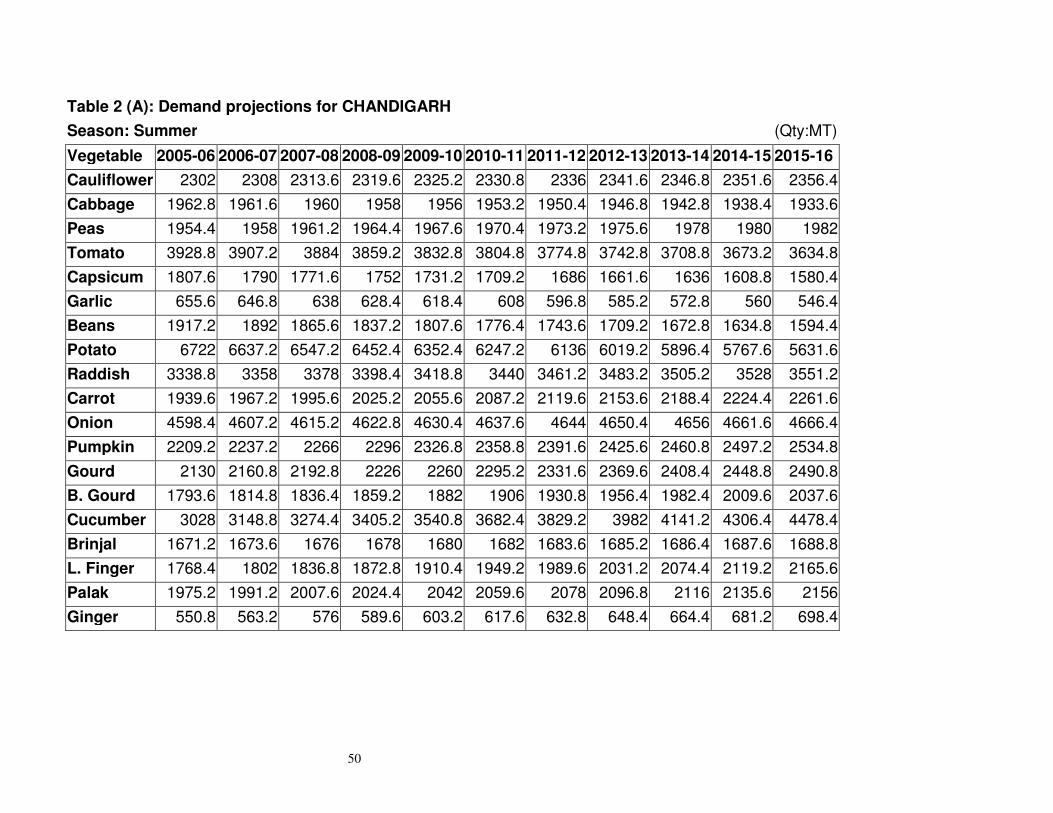
50
Table 2 (A): Demand projections for CHANDIGARH
Season: Summer (Qty:MT)
Vegetable 2005-06 2006-07 2007-08 2008-09 2009-10 2010-11 2011-12 2012-13 2013-14 2014-15 2015-16
Cauliflower 2302 2308 2313.6 2319.6 2325.2 2330.8 2336 2341.6 2346.8 2351.6 2356.4
Cabbage 1962.8 1961.6 1960 1958 1956 1953.2 1950.4 1946.8 1942.8 1938.4 1933.6
Peas 1954.4 1958 1961.2 1964.4 1967.6 1970.4 1973.2 1975.6 1978 1980 1982
Tomato 3928.8 3907.2 3884 3859.2 3832.8 3804.8 3774.8 3742.8 3708.8 3673.2 3634.8
Capsicum 1807.6 1790 1771.6 1752 1731.2 1709.2 1686 1661.6 1636 1608.8 1580.4
Garlic 655.6 646.8 638 628.4 618.4 608 596.8 585.2 572.8 560 546.4
Beans 1917.2 1892 1865.6 1837.2 1807.6 1776.4 1743.6 1709.2 1672.8 1634.8 1594.4
Potato 6722 6637.2 6547.2 6452.4 6352.4 6247.2 6136 6019.2 5896.4 5767.6 5631.6
Raddish 3338.8 3358 3378 3398.4 3418.8 3440 3461.2 3483.2 3505.2 3528 3551.2
Carrot 1939.6 1967.2 1995.6 2025.2 2055.6 2087.2 2119.6 2153.6 2188.4 2224.4 2261.6
Onion 4598.4 4607.2 4615.2 4622.8 4630.4 4637.6 4644 4650.4 4656 4661.6 4666.4
Pumpkin 2209.2 2237.2 2266 2296 2326.8 2358.8 2391.6 2425.6 2460.8 2497.2 2534.8
Gourd 2130 2160.8 2192.8 2226 2260 2295.2 2331.6 2369.6 2408.4 2448.8 2490.8
B. Gourd 1793.6 1814.8 1836.4 1859.2 1882 1906 1930.8 1956.4 1982.4 2009.6 2037.6
Cucumber 3028 3148.8 3274.4 3405.2 3540.8 3682.4 3829.2 3982 4141.2 4306.4 4478.4
Brinjal 1671.2 1673.6 1676 1678 1680 1682 1683.6 1685.2 1686.4 1687.6 1688.8
L. Finger 1768.4 1802 1836.8 1872.8 1910.4 1949.2 1989.6 2031.2 2074.4 2119.2 2165.6
Palak 1975.2 1991.2 2007.6 2024.4 2042 2059.6 2078 2096.8 2116 2135.6 2156
Ginger 550.8 563.2 576 589.6 603.2 617.6 632.8 648.4 664.4 681.2 698.4
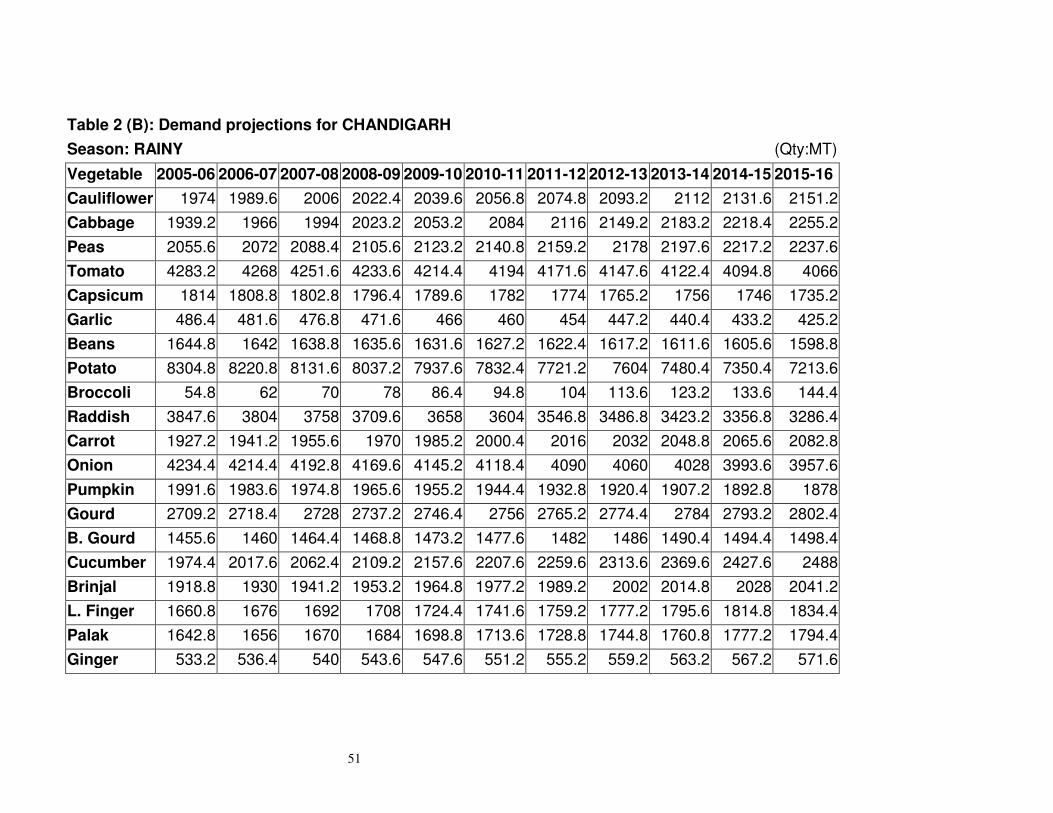
51
Table 2 (B): Demand projections for CHANDIGARH
Season: RAINY (Qty:MT)
Vegetable 2005-06 2006-07 2007-08 2008-09 2009-10 2010-11 2011-12 2012-13 2013-14 2014-15 2015-16
Cauliflower 1974 1989.6 2006 2022.4 2039.6 2056.8 2074.8 2093.2 2112 2131.6 2151.2
Cabbage 1939.2 1966 1994 2023.2 2053.2 2084 2116 2149.2 2183.2 2218.4 2255.2
Peas 2055.6 2072 2088.4 2105.6 2123.2 2140.8 2159.2 2178 2197.6 2217.2 2237.6
Tomato 4283.2 4268 4251.6 4233.6 4214.4 4194 4171.6 4147.6 4122.4 4094.8 4066
Capsicum 1814 1808.8 1802.8 1796.4 1789.6 1782 1774 1765.2 1756 1746 1735.2
Garlic 486.4 481.6 476.8 471.6 466 460 454 447.2 440.4 433.2 425.2
Beans 1644.8 1642 1638.8 1635.6 1631.6 1627.2 1622.4 1617.2 1611.6 1605.6 1598.8
Potato 8304.8 8220.8 8131.6 8037.2 7937.6 7832.4 7721.2 7604 7480.4 7350.4 7213.6
Broccoli 54.8 62 70 78 86.4 94.8 104 113.6 123.2 133.6 144.4
Raddish 3847.6 3804 3758 3709.6 3658 3604 3546.8 3486.8 3423.2 3356.8 3286.4
Carrot 1927.2 1941.2 1955.6 1970 1985.2 2000.4 2016 2032 2048.8 2065.6 2082.8
Onion 4234.4 4214.4 4192.8 4169.6 4145.2 4118.4 4090 4060 4028 3993.6 3957.6
Pumpkin 1991.6 1983.6 1974.8 1965.6 1955.2 1944.4 1932.8 1920.4 1907.2 1892.8 1878
Gourd 2709.2 2718.4 2728 2737.2 2746.4 2756 2765.2 2774.4 2784 2793.2 2802.4
B. Gourd 1455.6 1460 1464.4 1468.8 1473.2 1477.6 1482 1486 1490.4 1494.4 1498.4
Cucumber 1974.4 2017.6 2062.4 2109.2 2157.6 2207.6 2259.6 2313.6 2369.6 2427.6 2488
Brinjal 1918.8 1930 1941.2 1953.2 1964.8 1977.2 1989.2 2002 2014.8 2028 2041.2
L. Finger 1660.8 1676 1692 1708 1724.4 1741.6 1759.2 1777.2 1795.6 1814.8 1834.4
Palak 1642.8 1656 1670 1684 1698.8 1713.6 1728.8 1744.8 1760.8 1777.2 1794.4
Ginger 533.2 536.4 540 543.6 547.6 551.2 555.2 559.2 563.2 567.2 571.6
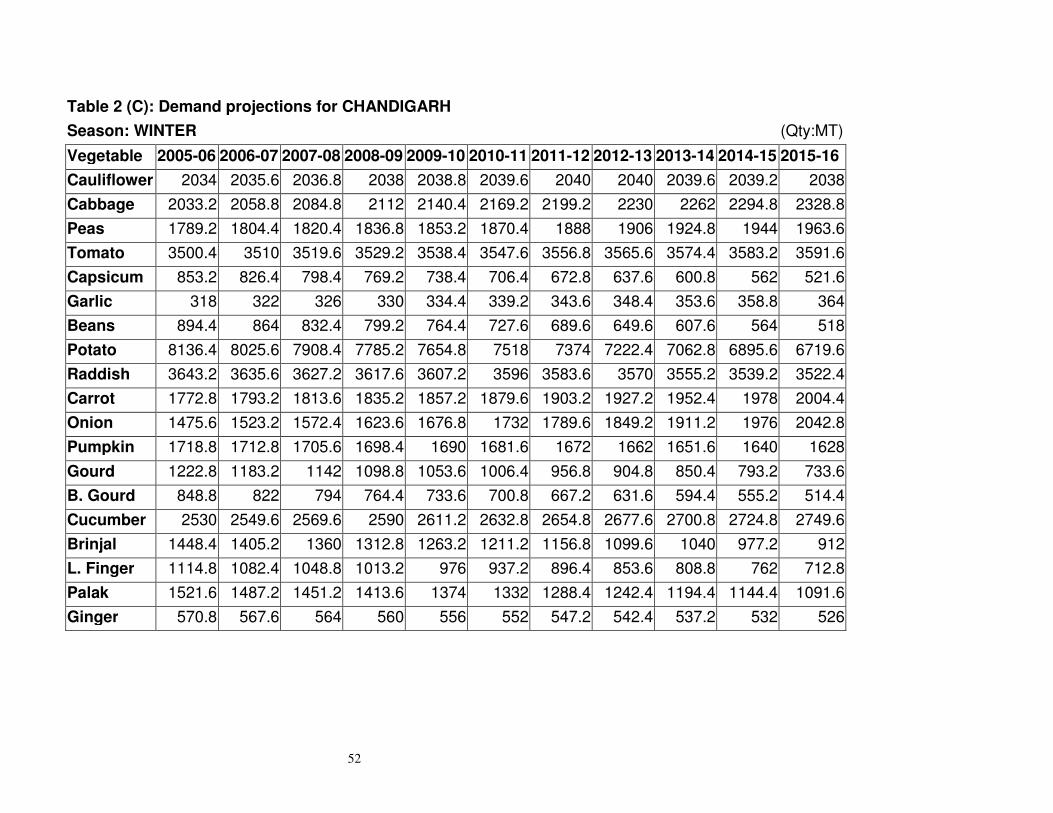
52
Table 2 (C): Demand projections for CHANDIGARH
Season: WINTER (Qty:MT)
Vegetable 2005-06 2006-07 2007-08 2008-09 2009-10 2010-11 2011-12 2012-13 2013-14 2014-15 2015-16
Cauliflower 2034 2035.6 2036.8 2038 2038.8 2039.6 2040 2040 2039.6 2039.2 2038
Cabbage 2033.2 2058.8 2084.8 2112 2140.4 2169.2 2199.2 2230 2262 2294.8 2328.8
Peas 1789.2 1804.4 1820.4 1836.8 1853.2 1870.4 1888 1906 1924.8 1944 1963.6
Tomato 3500.4 3510 3519.6 3529.2 3538.4 3547.6 3556.8 3565.6 3574.4 3583.2 3591.6
Capsicum 853.2 826.4 798.4 769.2 738.4 706.4 672.8 637.6 600.8 562 521.6
Garlic 318 322 326 330 334.4 339.2 343.6 348.4 353.6 358.8 364
Beans 894.4 864 832.4 799.2 764.4 727.6 689.6 649.6 607.6 564 518
Potato 8136.4 8025.6 7908.4 7785.2 7654.8 7518 7374 7222.4 7062.8 6895.6 6719.6
Raddish 3643.2 3635.6 3627.2 3617.6 3607.2 3596 3583.6 3570 3555.2 3539.2 3522.4
Carrot 1772.8 1793.2 1813.6 1835.2 1857.2 1879.6 1903.2 1927.2 1952.4 1978 2004.4
Onion 1475.6 1523.2 1572.4 1623.6 1676.8 1732 1789.6 1849.2 1911.2 1976 2042.8
Pumpkin 1718.8 1712.8 1705.6 1698.4 1690 1681.6 1672 1662 1651.6 1640 1628
Gourd 1222.8 1183.2 1142 1098.8 1053.6 1006.4 956.8 904.8 850.4 793.2 733.6
B. Gourd 848.8 822 794 764.4 733.6 700.8 667.2 631.6 594.4 555.2 514.4
Cucumber 2530 2549.6 2569.6 2590 2611.2 2632.8 2654.8 2677.6 2700.8 2724.8 2749.6
Brinjal 1448.4 1405.2 1360 1312.8 1263.2 1211.2 1156.8 1099.6 1040 977.2 912
L. Finger 1114.8 1082.4 1048.8 1013.2 976 937.2 896.4 853.6 808.8 762 712.8
Palak 1521.6 1487.2 1451.2 1413.6 1374 1332 1288.4 1242.4 1194.4 1144.4 1091.6
Ginger 570.8 567.6 564 560 556 552 547.2 542.4 537.2 532 526
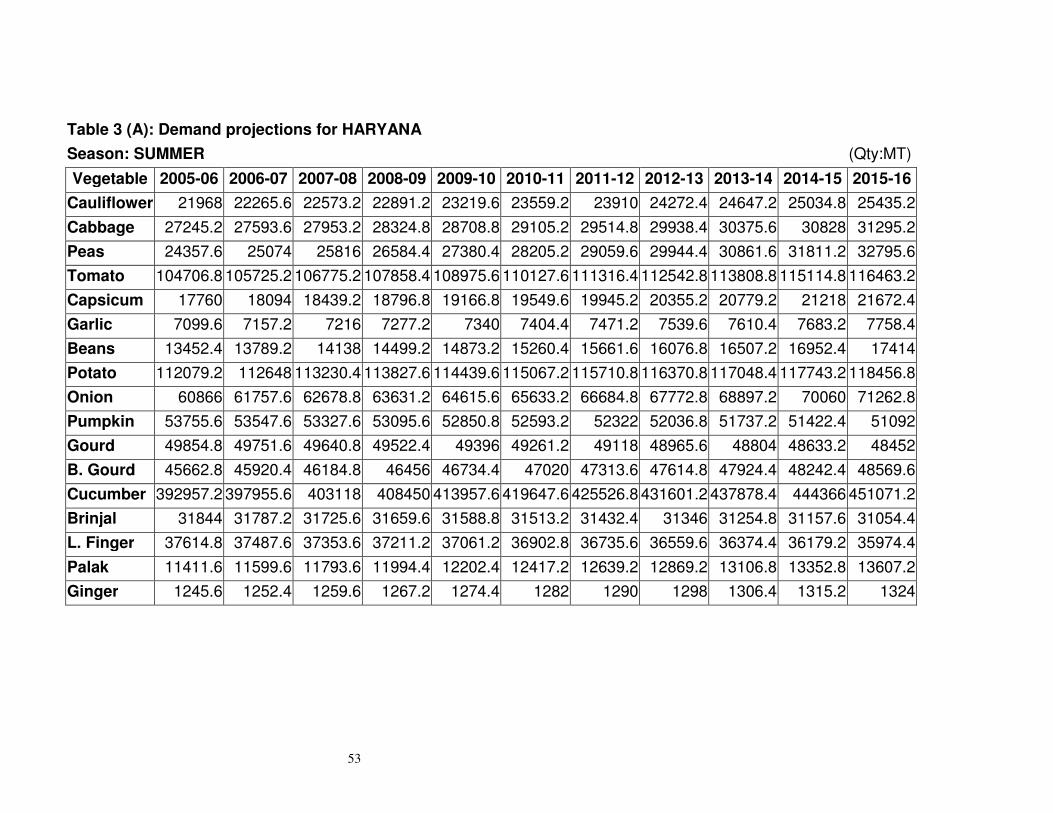
53
Table 3 (A): Demand projections for HARYANA
Season: SUMMER (Qty:MT)
Vegetable 2005-06 2006-07 2007-08 2008-09 2009-10 2010-11 2011-12 2012-13 2013-14 2014-15 2015-16
Cauliflower 21968 22265.6 22573.2 22891.2 23219.6 23559.2 23910 24272.4 24647.2 25034.8 25435.2
Cabbage 27245.2 27593.6 27953.2 28324.8 28708.8 29105.2 29514.8 29938.4 30375.6 30828 31295.2
Peas 24357.6 25074 25816 26584.4 27380.4 28205.2 29059.6 29944.4 30861.6 31811.2 32795.6
Tomato 104706.8 105725.2 106775.2 107858.4 108975.6 110127.6 111316.4 112542.8 113808.8 115114.8 116463.2
Capsicum 17760 18094 18439.2 18796.8 19166.8 19549.6 19945.2 20355.2 20779.2 21218 21672.4
Garlic 7099.6 7157.2 7216 7277.2 7340 7404.4 7471.2 7539.6 7610.4 7683.2 7758.4
Beans 13452.4 13789.2 14138 14499.2 14873.2 15260.4 15661.6 16076.8 16507.2 16952.4 17414
Potato 112079.2 112648 113230.4 113827.6 114439.6 115067.2 115710.8 116370.8 117048.4 117743.2 118456.8
Onion 60866 61757.6 62678.8 63631.2 64615.6 65633.2 66684.8 67772.8 68897.2 70060 71262.8
Pumpkin 53755.6 53547.6 53327.6 53095.6 52850.8 52593.2 52322 52036.8 51737.2 51422.4 51092
Gourd 49854.8 49751.6 49640.8 49522.4 49396 49261.2 49118 48965.6 48804 48633.2 48452
B. Gourd 45662.8 45920.4 46184.8 46456 46734.4 47020 47313.6 47614.8 47924.4 48242.4 48569.6
Cucumber 392957.2 397955.6 403118 408450 413957.6 419647.6 425526.8 431601.2 437878.4 444366 451071.2
Brinjal 31844 31787.2 31725.6 31659.6 31588.8 31513.2 31432.4 31346 31254.8 31157.6 31054.4
L. Finger 37614.8 37487.6 37353.6 37211.2 37061.2 36902.8 36735.6 36559.6 36374.4 36179.2 35974.4
Palak 11411.6 11599.6 11793.6 11994.4 12202.4 12417.2 12639.2 12869.2 13106.8 13352.8 13607.2
Ginger 1245.6 1252.4 1259.6 1267.2 1274.4 1282 1290 1298 1306.4 1315.2 1324
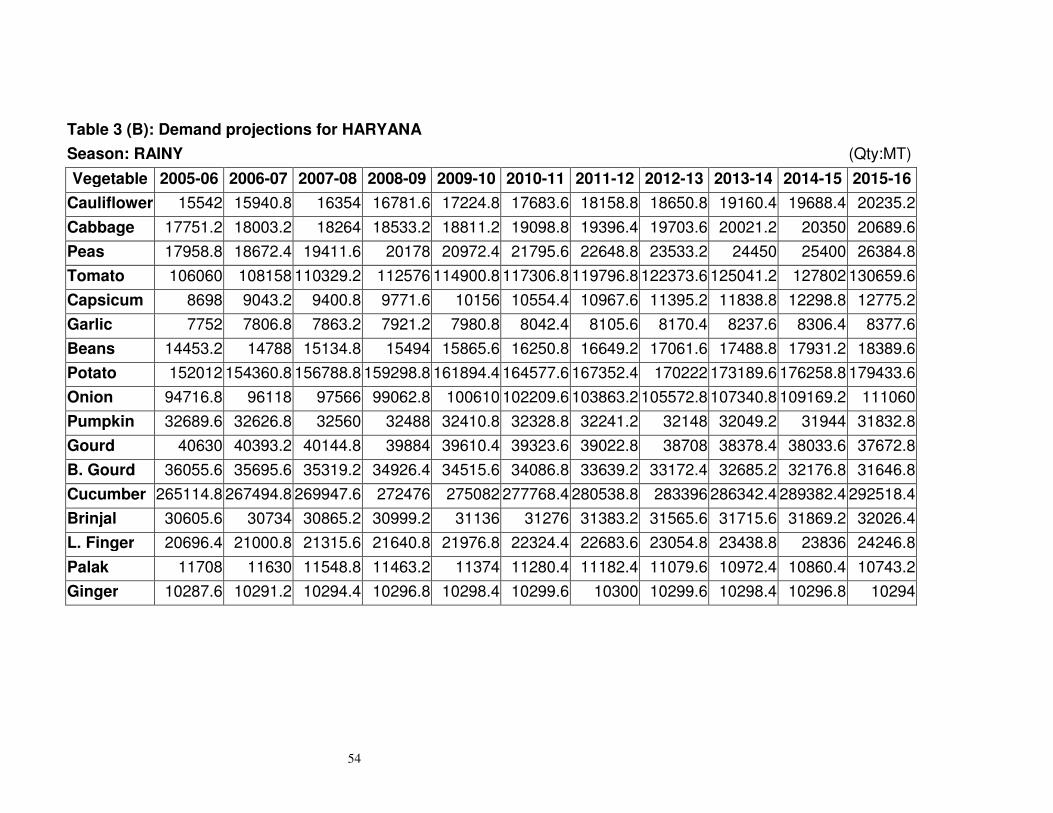
54
Table 3 (B): Demand projections for HARYANA
Season: RAINY (Qty:MT)
Vegetable 2005-06 2006-07 2007-08 2008-09 2009-10 2010-11 2011-12 2012-13 2013-14 2014-15 2015-16
Cauliflower 15542 15940.8 16354 16781.6 17224.8 17683.6 18158.8 18650.8 19160.4 19688.4 20235.2
Cabbage 17751.2 18003.2 18264 18533.2 18811.2 19098.8 19396.4 19703.6 20021.2 20350 20689.6
Peas 17958.8 18672.4 19411.6 20178 20972.4 21795.6 22648.8 23533.2 24450 25400 26384.8
Tomato 106060 108158 110329.2 112576 114900.8 117306.8 119796.8 122373.6 125041.2 127802 130659.6
Capsicum 8698 9043.2 9400.8 9771.6 10156 10554.4 10967.6 11395.2 11838.8 12298.8 12775.2
Garlic 7752 7806.8 7863.2 7921.2 7980.8 8042.4 8105.6 8170.4 8237.6 8306.4 8377.6
Beans 14453.2 14788 15134.8 15494 15865.6 16250.8 16649.2 17061.6 17488.8 17931.2 18389.6
Potato 152012 154360.8 156788.8 159298.8 161894.4 164577.6 167352.4 170222 173189.6 176258.8 179433.6
Onion 94716.8 96118 97566 99062.8 100610 102209.6 103863.2 105572.8 107340.8 109169.2 111060
Pumpkin 32689.6 32626.8 32560 32488 32410.8 32328.8 32241.2 32148 32049.2 31944 31832.8
Gourd 40630 40393.2 40144.8 39884 39610.4 39323.6 39022.8 38708 38378.4 38033.6 37672.8
B. Gourd 36055.6 35695.6 35319.2 34926.4 34515.6 34086.8 33639.2 33172.4 32685.2 32176.8 31646.8
Cucumber 265114.8 267494.8 269947.6 272476 275082 277768.4 280538.8 283396 286342.4 289382.4 292518.4
Brinjal 30605.6 30734 30865.2 30999.2 31136 31276 31383.2 31565.6 31715.6 31869.2 32026.4
L. Finger 20696.4 21000.8 21315.6 21640.8 21976.8 22324.4 22683.6 23054.8 23438.8 23836 24246.8
Palak 11708 11630 11548.8 11463.2 11374 11280.4 11182.4 11079.6 10972.4 10860.4 10743.2
Ginger 10287.6 10291.2 10294.4 10296.8 10298.4 10299.6 10300 10299.6 10298.4 10296.8 10294
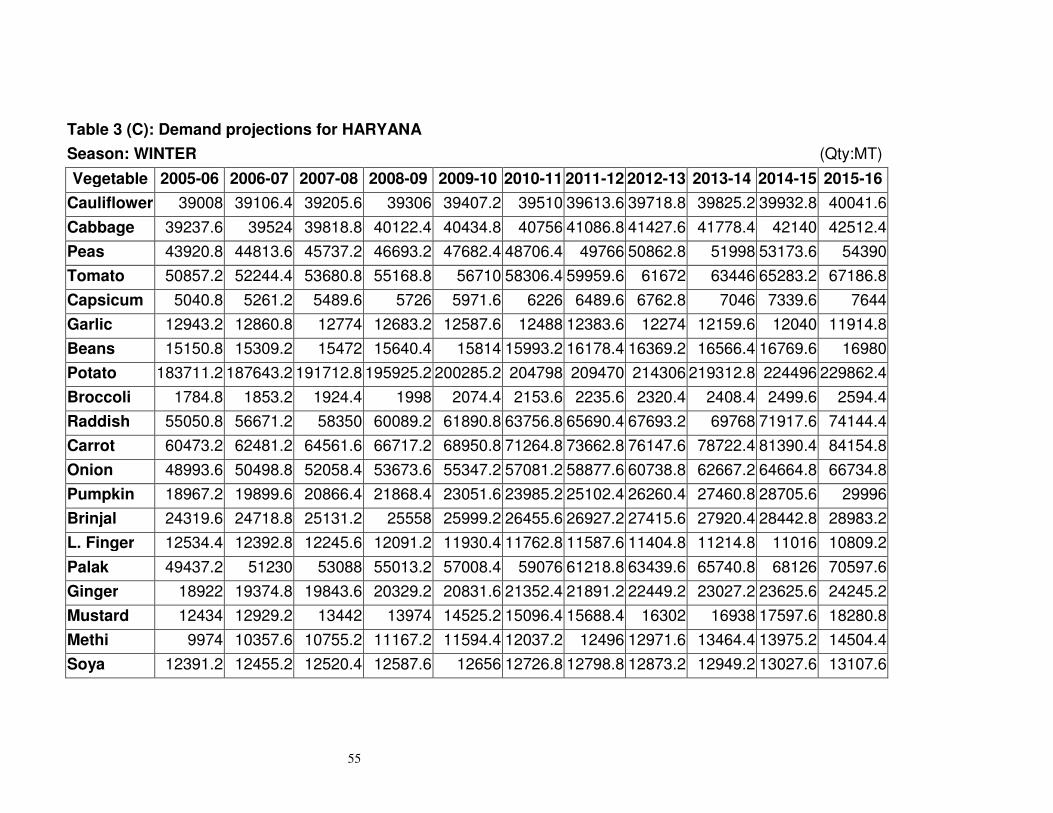
55
Table 3 (C): Demand projections for HARYANA
Season: WINTER (Qty:MT)
Vegetable 2005-06 2006-07 2007-08 2008-09 2009-10 2010-11 2011-12 2012-13 2013-14 2014-15 2015-16
Cauliflower 39008 39106.4 39205.6 39306 39407.2 39510 39613.6 39718.8 39825.2 39932.8 40041.6
Cabbage 39237.6 39524 39818.8 40122.4 40434.8 40756 41086.8 41427.6 41778.4 42140 42512.4
Peas 43920.8 44813.6 45737.2 46693.2 47682.4 48706.4 49766 50862.8 51998 53173.6 54390
Tomato 50857.2 52244.4 53680.8 55168.8 56710 58306.4 59959.6 61672 63446 65283.2 67186.8
Capsicum 5040.8 5261.2 5489.6 5726 5971.6 6226 6489.6 6762.8 7046 7339.6 7644
Garlic 12943.2 12860.8 12774 12683.2 12587.6 12488 12383.6 12274 12159.6 12040 11914.8
Beans 15150.8 15309.2 15472 15640.4 15814 15993.2 16178.4 16369.2 16566.4 16769.6 16980
Potato 183711.2 187643.2 191712.8 195925.2 200285.2 204798 209470 214306 219312.8 224496 229862.4
Broccoli 1784.8 1853.2 1924.4 1998 2074.4 2153.6 2235.6 2320.4 2408.4 2499.6 2594.4
Raddish 55050.8 56671.2 58350 60089.2 61890.8 63756.8 65690.4 67693.2 69768 71917.6 74144.4
Carrot 60473.2 62481.2 64561.6 66717.2 68950.8 71264.8 73662.8 76147.6 78722.4 81390.4 84154.8
Onion 48993.6 50498.8 52058.4 53673.6 55347.2 57081.2 58877.6 60738.8 62667.2 64664.8 66734.8
Pumpkin 18967.2 19899.6 20866.4 21868.4 23051.6 23985.2 25102.4 26260.4 27460.8 28705.6 29996
Brinjal 24319.6 24718.8 25131.2 25558 25999.2 26455.6 26927.2 27415.6 27920.4 28442.8 28983.2
L. Finger 12534.4 12392.8 12245.6 12091.2 11930.4 11762.8 11587.6 11404.8 11214.8 11016 10809.2
Palak 49437.2 51230 53088 55013.2 57008.4 59076 61218.8 63439.6 65740.8 68126 70597.6
Ginger 18922 19374.8 19843.6 20329.2 20831.6 21352.4 21891.2 22449.2 23027.2 23625.6 24245.2
Mustard 12434 12929.2 13442 13974 14525.2 15096.4 15688.4 16302 16938 17597.6 18280.8
Methi 9974 10357.6 10755.2 11167.2 11594.4 12037.2 12496 12971.6 13464.4 13975.2 14504.4
Soya 12391.2 12455.2 12520.4 12587.6 12656 12726.8 12798.8 12873.2 12949.2 13027.6 13107.6
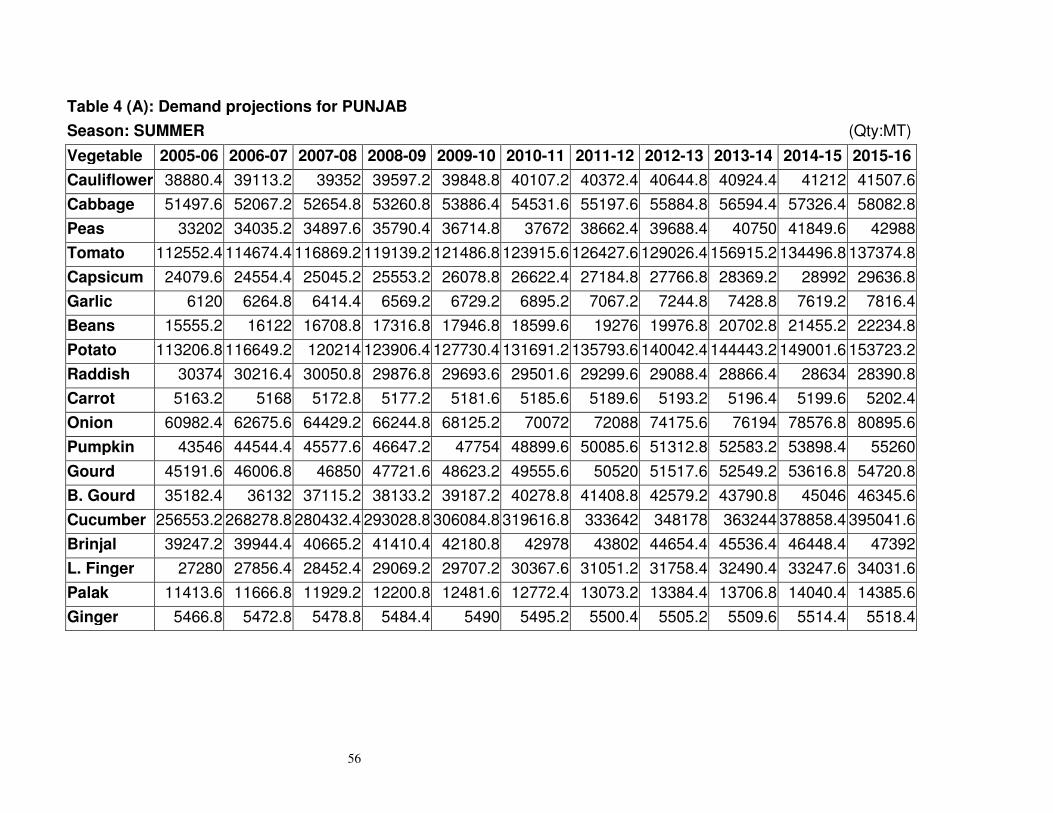
56
Table 4 (A): Demand projections for PUNJAB
Season: SUMMER (Qty:MT)
Vegetable 2005-06 2006-07 2007-08 2008-09 2009-10 2010-11 2011-12 2012-13 2013-14 2014-15 2015-16
Cauliflower 38880.4 39113.2 39352 39597.2 39848.8 40107.2 40372.4 40644.8 40924.4 41212 41507.6
Cabbage 51497.6 52067.2 52654.8 53260.8 53886.4 54531.6 55197.6 55884.8 56594.4 57326.4 58082.8
Peas 33202 34035.2 34897.6 35790.4 36714.8 37672 38662.4 39688.4 40750 41849.6 42988
Tomato 112552.4 114674.4 116869.2 119139.2 121486.8 123915.6 126427.6 129026.4 156915.2 134496.8 137374.8
Capsicum 24079.6 24554.4 25045.2 25553.2 26078.8 26622.4 27184.8 27766.8 28369.2 28992 29636.8
Garlic 6120 6264.8 6414.4 6569.2 6729.2 6895.2 7067.2 7244.8 7428.8 7619.2 7816.4
Beans 15555.2 16122 16708.8 17316.8 17946.8 18599.6 19276 19976.8 20702.8 21455.2 22234.8
Potato 113206.8 116649.2 120214 123906.4 127730.4 131691.2 135793.6 140042.4 144443.2 149001.6 153723.2
Raddish 30374 30216.4 30050.8 29876.8 29693.6 29501.6 29299.6 29088.4 28866.4 28634 28390.8
Carrot 5163.2 5168 5172.8 5177.2 5181.6 5185.6 5189.6 5193.2 5196.4 5199.6 5202.4
Onion 60982.4 62675.6 64429.2 66244.8 68125.2 70072 72088 74175.6 76194 78576.8 80895.6
Pumpkin 43546 44544.4 45577.6 46647.2 47754 48899.6 50085.6 51312.8 52583.2 53898.4 55260
Gourd 45191.6 46006.8 46850 47721.6 48623.2 49555.6 50520 51517.6 52549.2 53616.8 54720.8
B. Gourd 35182.4 36132 37115.2 38133.2 39187.2 40278.8 41408.8 42579.2 43790.8 45046 46345.6
Cucumber 256553.2 268278.8 280432.4 293028.8 306084.8 319616.8 333642 348178 363244 378858.4 395041.6
Brinjal 39247.2 39944.4 40665.2 41410.4 42180.8 42978 43802 44654.4 45536.4 46448.4 47392
L. Finger 27280 27856.4 28452.4 29069.2 29707.2 30367.6 31051.2 31758.4 32490.4 33247.6 34031.6
Palak 11413.6 11666.8 11929.2 12200.8 12481.6 12772.4 13073.2 13384.4 13706.8 14040.4 14385.6
Ginger 5466.8 5472.8 5478.8 5484.4 5490 5495.2 5500.4 5505.2 5509.6 5514.4 5518.4
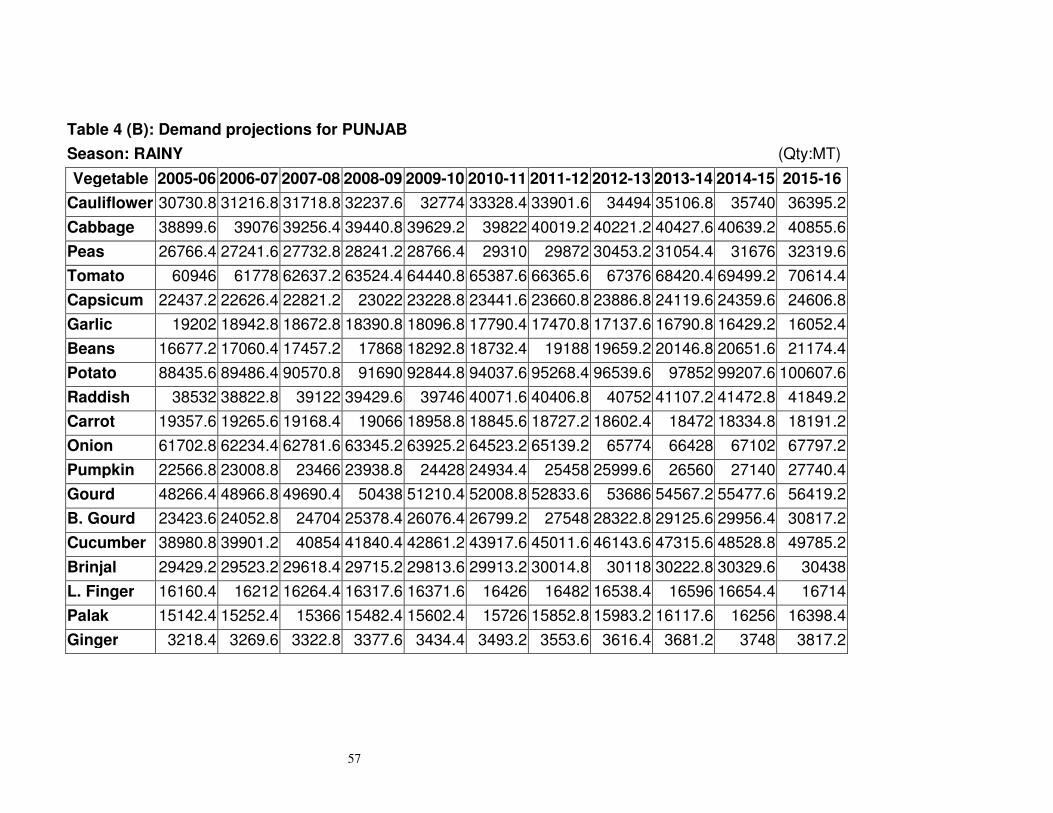
57
Table 4 (B): Demand projections for PUNJAB
Season: RAINY (Qty:MT)
Vegetable 2005-06 2006-07 2007-08 2008-09 2009-10 2010-11 2011-12 2012-13 2013-14 2014-15 2015-16
Cauliflower 30730.8 31216.8 31718.8 32237.6 32774 33328.4 33901.6 34494 35106.8 35740 36395.2
Cabbage 38899.6 39076 39256.4 39440.8 39629.2 39822 40019.2 40221.2 40427.6 40639.2 40855.6
Peas 26766.4 27241.6 27732.8 28241.2 28766.4 29310 29872 30453.2 31054.4 31676 32319.6
Tomato 60946 61778 62637.2 63524.4 64440.8 65387.6 66365.6 67376 68420.4 69499.2 70614.4
Capsicum 22437.2 22626.4 22821.2 23022 23228.8 23441.6 23660.8 23886.8 24119.6 24359.6 24606.8
Garlic 19202 18942.8 18672.8 18390.8 18096.8 17790.4 17470.8 17137.6 16790.8 16429.2 16052.4
Beans 16677.2 17060.4 17457.2 17868 18292.8 18732.4 19188 19659.2 20146.8 20651.6 21174.4
Potato 88435.6 89486.4 90570.8 91690 92844.8 94037.6 95268.4 96539.6 97852 99207.6 100607.6
Raddish 38532 38822.8 39122 39429.6 39746 40071.6 40406.8 40752 41107.2 41472.8 41849.2
Carrot 19357.6 19265.6 19168.4 19066 18958.8 18845.6 18727.2 18602.4 18472 18334.8 18191.2
Onion 61702.8 62234.4 62781.6 63345.2 63925.2 64523.2 65139.2 65774 66428 67102 67797.2
Pumpkin 22566.8 23008.8 23466 23938.8 24428 24934.4 25458 25999.6 26560 27140 27740.4
Gourd 48266.4 48966.8 49690.4 50438 51210.4 52008.8 52833.6 53686 54567.2 55477.6 56419.2
B. Gourd 23423.6 24052.8 24704 25378.4 26076.4 26799.2 27548 28322.8 29125.6 29956.4 30817.2
Cucumber 38980.8 39901.2 40854 41840.4 42861.2 43917.6 45011.6 46143.6 47315.6 48528.8 49785.2
Brinjal 29429.2 29523.2 29618.4 29715.2 29813.6 29913.2 30014.8 30118 30222.8 30329.6 30438
L. Finger 16160.4 16212 16264.4 16317.6 16371.6 16426 16482 16538.4 16596 16654.4 16714
Palak 15142.4 15252.4 15366 15482.4 15602.4 15726 15852.8 15983.2 16117.6 16256 16398.4
Ginger 3218.4 3269.6 3322.8 3377.6 3434.4 3493.2 3553.6 3616.4 3681.2 3748 3817.2
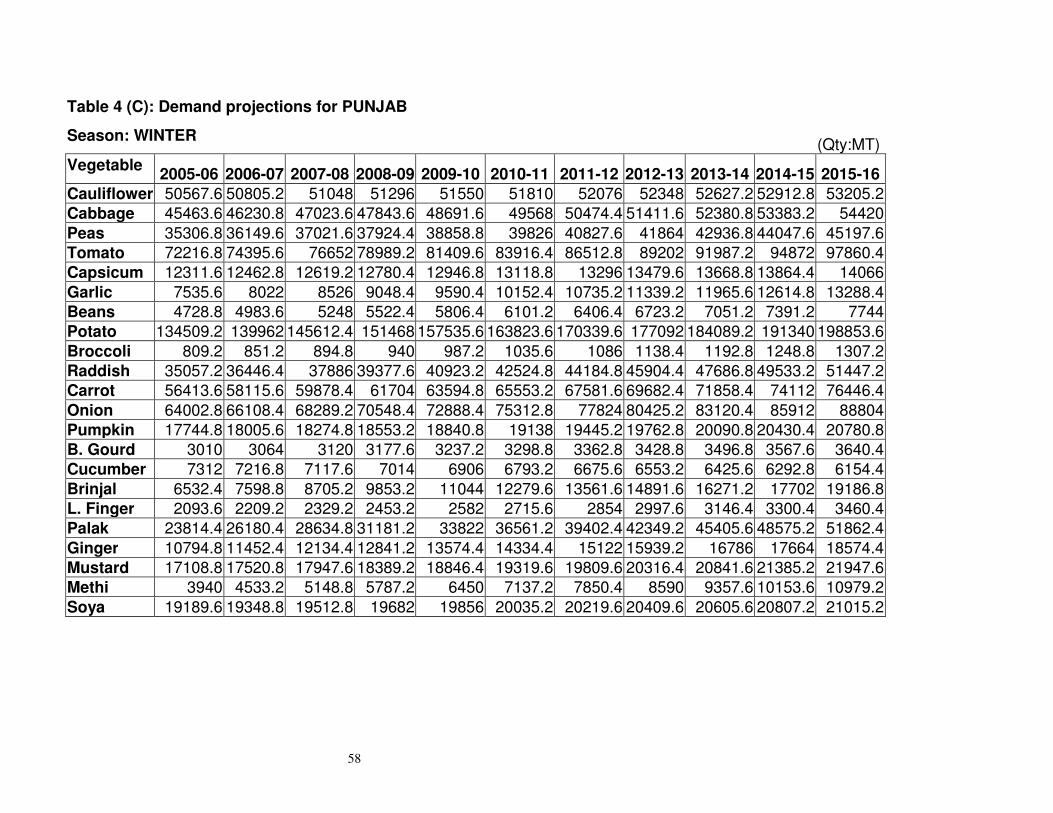
58
Table 4 (C): Demand projections for PUNJAB
Season: WINTER (Qty:MT)
Vegetable 2005-06 2006-07 2007-08 2008-09 2009-10 2010-11 2011-12 2012-13 2013-14 2014-15 2015-16
Cauliflower 50567.6 50805.2 51048 51296 51550 51810 52076 52348 52627.2 52912.8 53205.2 Cabbage 45463.6 46230.8 47023.6 47843.6 48691.6 49568 50474.4 51411.6 52380.8 53383.2 54420
Peas 35306.8 36149.6 37021.6 37924.4 38858.8 39826 40827.6 41864 42936.8 44047.6 45197.6 Tomato 72216.8 74395.6 76652 78989.2 81409.6 83916.4 86512.8 89202 91987.2 94872 97860.4 Capsicum 12311.6 12462.8 12619.2 12780.4 12946.8 13118.8 13296 13479.6 13668.8 13864.4 14066
Garlic 7535.6 8022 8526 9048.4 9590.4 10152.4 10735.2 11339.2 11965.6 12614.8 13288.4 Beans 4728.8 4983.6 5248 5522.4 5806.4 6101.2 6406.4 6723.2 7051.2 7391.2 7744 Potato 134509.2 139962 145612.4 151468 157535.6 163823.6 170339.6 177092 184089.2 191340 198853.6
Broccoli 809.2 851.2 894.8 940 987.2 1035.6 1086 1138.4 1192.8 1248.8 1307.2 Raddish 35057.2 36446.4 37886 39377.6 40923.2 42524.8 44184.8 45904.4 47686.8 49533.2 51447.2 Carrot 56413.6 58115.6 59878.4 61704 63594.8 65553.2 67581.6 69682.4 71858.4 74112 76446.4
Onion 64002.8 66108.4 68289.2 70548.4 72888.4 75312.8 77824 80425.2 83120.4 85912 88804 Pumpkin 17744.8 18005.6 18274.8 18553.2 18840.8 19138 19445.2 19762.8 20090.8 20430.4 20780.8 B. Gourd 3010 3064 3120 3177.6 3237.2 3298.8 3362.8 3428.8 3496.8 3567.6 3640.4 Cucumber 7312 7216.8 7117.6 7014 6906 6793.2 6675.6 6553.2 6425.6 6292.8 6154.4
Brinjal 6532.4 7598.8 8705.2 9853.2 11044 12279.6 13561.6 14891.6 16271.2 17702 19186.8 L. Finger 2093.6 2209.2 2329.2 2453.2 2582 2715.6 2854 2997.6 3146.4 3300.4 3460.4 Palak 23814.4 26180.4 28634.8 31181.2 33822 36561.2 39402.4 42349.2 45405.6 48575.2 51862.4
Ginger 10794.8 11452.4 12134.4 12841.2 13574.4 14334.4 15122 15939.2 16786 17664 18574.4 Mustard 17108.8 17520.8 17947.6 18389.2 18846.4 19319.6 19809.6 20316.4 20841.6 21385.2 21947.6 Methi 3940 4533.2 5148.8 5787.2 6450 7137.2 7850.4 8590 9357.6 10153.6 10979.2
Soya 19189.6 19348.8 19512.8 19682 19856 20035.2 20219.6 20409.6 20605.6 20807.2 21015.2
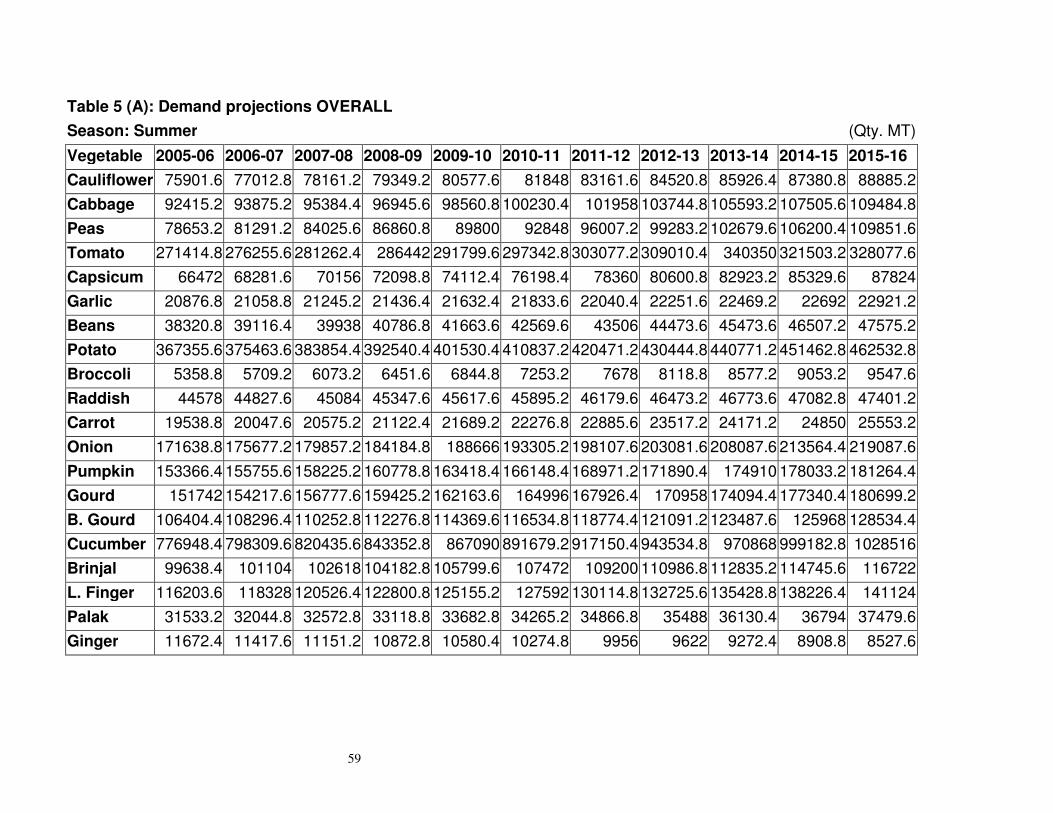
59
Table 5 (A): Demand projections OVERALL
Season: Summer (Qty. MT)
Vegetable 2005-06 2006-07 2007-08 2008-09 2009-10 2010-11 2011-12 2012-13 2013-14 2014-15 2015-16
Cauliflower 75901.6 77012.8 78161.2 79349.2 80577.6 81848 83161.6 84520.8 85926.4 87380.8 88885.2
Cabbage 92415.2 93875.2 95384.4 96945.6 98560.8 100230.4 101958 103744.8 105593.2 107505.6 109484.8
Peas 78653.2 81291.2 84025.6 86860.8 89800 92848 96007.2 99283.2 102679.6 106200.4 109851.6
Tomato 271414.8 276255.6 281262.4 286442 291799.6 297342.8 303077.2 309010.4 340350 321503.2 328077.6
Capsicum 66472 68281.6 70156 72098.8 74112.4 76198.4 78360 80600.8 82923.2 85329.6 87824
Garlic 20876.8 21058.8 21245.2 21436.4 21632.4 21833.6 22040.4 22251.6 22469.2 22692 22921.2
Beans 38320.8 39116.4 39938 40786.8 41663.6 42569.6 43506 44473.6 45473.6 46507.2 47575.2
Potato 367355.6 375463.6 383854.4 392540.4 401530.4 410837.2 420471.2 430444.8 440771.2 451462.8 462532.8
Broccoli 5358.8 5709.2 6073.2 6451.6 6844.8 7253.2 7678 8118.8 8577.2 9053.2 9547.6
Raddish 44578 44827.6 45084 45347.6 45617.6 45895.2 46179.6 46473.2 46773.6 47082.8 47401.2
Carrot 19538.8 20047.6 20575.2 21122.4 21689.2 22276.8 22885.6 23517.2 24171.2 24850 25553.2
Onion 171638.8 175677.2 179857.2 184184.8 188666 193305.2 198107.6 203081.6 208087.6 213564.4 219087.6
Pumpkin 153366.4 155755.6 158225.2 160778.8 163418.4 166148.4 168971.2 171890.4 174910 178033.2 181264.4
Gourd 151742 154217.6 156777.6 159425.2 162163.6 164996 167926.4 170958 174094.4 177340.4 180699.2
B. Gourd 106404.4 108296.4 110252.8 112276.8 114369.6 116534.8 118774.4 121091.2 123487.6 125968 128534.4
Cucumber 776948.4 798309.6 820435.6 843352.8 867090 891679.2 917150.4 943534.8 970868 999182.8 1028516
Brinjal 99638.4 101104 102618 104182.8 105799.6 107472 109200 110986.8 112835.2 114745.6 116722
L. Finger 116203.6 118328 120526.4 122800.8 125155.2 127592 130114.8 132725.6 135428.8 138226.4 141124
Palak 31533.2 32044.8 32572.8 33118.8 33682.8 34265.2 34866.8 35488 36130.4 36794 37479.6
Ginger 11672.4 11417.6 11151.2 10872.8 10580.4 10274.8 9956 9622 9272.4 8908.8 8527.6
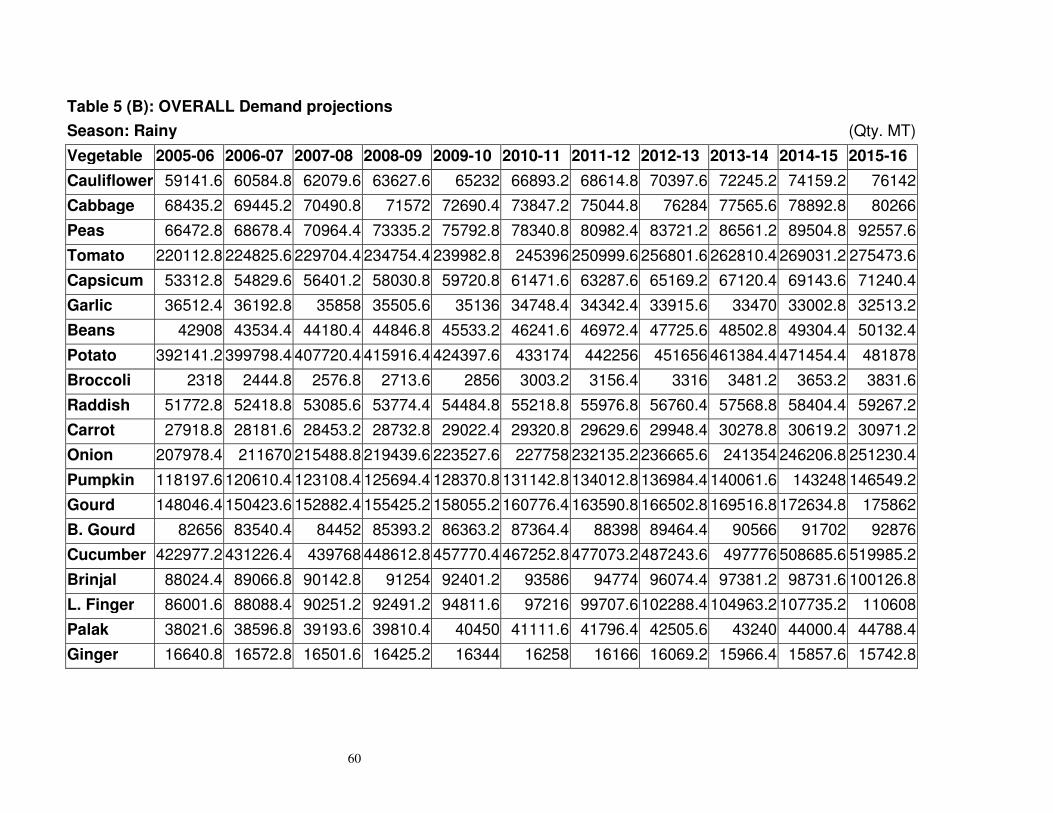
60
Table 5 (B): OVERALL Demand projections
Season: Rainy (Qty. MT)
Vegetable 2005-06 2006-07 2007-08 2008-09 2009-10 2010-11 2011-12 2012-13 2013-14 2014-15 2015-16
Cauliflower 59141.6 60584.8 62079.6 63627.6 65232 66893.2 68614.8 70397.6 72245.2 74159.2 76142
Cabbage 68435.2 69445.2 70490.8 71572 72690.4 73847.2 75044.8 76284 77565.6 78892.8 80266
Peas 66472.8 68678.4 70964.4 73335.2 75792.8 78340.8 80982.4 83721.2 86561.2 89504.8 92557.6
Tomato 220112.8 224825.6 229704.4 234754.4 239982.8 245396 250999.6 256801.6 262810.4 269031.2 275473.6
Capsicum 53312.8 54829.6 56401.2 58030.8 59720.8 61471.6 63287.6 65169.2 67120.4 69143.6 71240.4
Garlic 36512.4 36192.8 35858 35505.6 35136 34748.4 34342.4 33915.6 33470 33002.8 32513.2
Beans 42908 43534.4 44180.4 44846.8 45533.2 46241.6 46972.4 47725.6 48502.8 49304.4 50132.4
Potato 392141.2 399798.4 407720.4 415916.4 424397.6 433174 442256 451656 461384.4 471454.4 481878
Broccoli 2318 2444.8 2576.8 2713.6 2856 3003.2 3156.4 3316 3481.2 3653.2 3831.6
Raddish 51772.8 52418.8 53085.6 53774.4 54484.8 55218.8 55976.8 56760.4 57568.8 58404.4 59267.2
Carrot 27918.8 28181.6 28453.2 28732.8 29022.4 29320.8 29629.6 29948.4 30278.8 30619.2 30971.2
Onion 207978.4 211670 215488.8 219439.6 223527.6 227758 232135.2 236665.6 241354 246206.8 251230.4
Pumpkin 118197.6 120610.4 123108.4 125694.4 128370.8 131142.8 134012.8 136984.4 140061.6 143248 146549.2
Gourd 148046.4 150423.6 152882.4 155425.2 158055.2 160776.4 163590.8 166502.8 169516.8 172634.8 175862
B. Gourd 82656 83540.4 84452 85393.2 86363.2 87364.4 88398 89464.4 90566 91702 92876
Cucumber 422977.2 431226.4 439768 448612.8 457770.4 467252.8 477073.2 487243.6 497776 508685.6 519985.2
Brinjal 88024.4 89066.8 90142.8 91254 92401.2 93586 94774 96074.4 97381.2 98731.6 100126.8
L. Finger 86001.6 88088.4 90251.2 92491.2 94811.6 97216 99707.6 102288.4 104963.2 107735.2 110608
Palak 38021.6 38596.8 39193.6 39810.4 40450 41111.6 41796.4 42505.6 43240 44000.4 44788.4
Ginger 16640.8 16572.8 16501.6 16425.2 16344 16258 16166 16069.2 15966.4 15857.6 15742.8
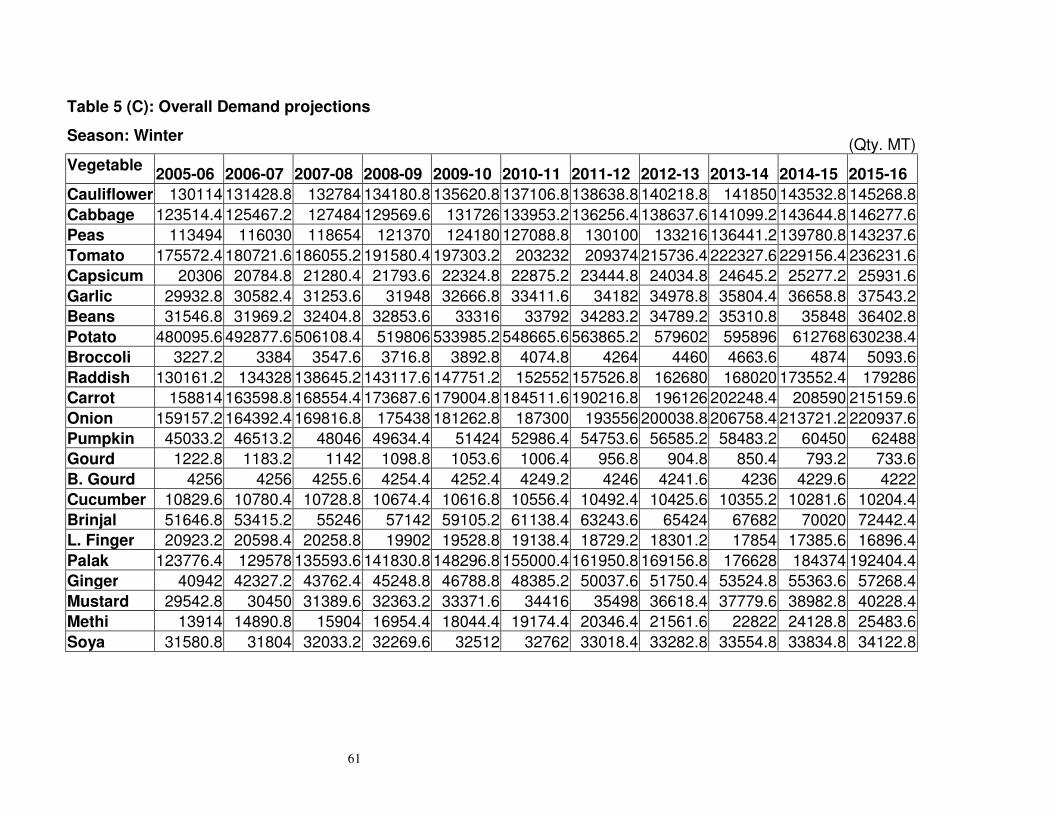
61
Table 5 (C): Overall Demand projections
Season: Winter (Qty. MT)
Vegetable 2005-06 2006-07 2007-08 2008-09 2009-10 2010-11 2011-12 2012-13 2013-14 2014-15 2015-16
Cauliflower 130114 131428.8 132784 134180.8 135620.8 137106.8 138638.8 140218.8 141850 143532.8 145268.8
Cabbage 123514.4 125467.2 127484 129569.6 131726 133953.2 136256.4 138637.6 141099.2 143644.8 146277.6
Peas 113494 116030 118654 121370 124180 127088.8 130100 133216 136441.2 139780.8 143237.6
Tomato 175572.4 180721.6 186055.2 191580.4 197303.2 203232 209374 215736.4 222327.6 229156.4 236231.6
Capsicum 20306 20784.8 21280.4 21793.6 22324.8 22875.2 23444.8 24034.8 24645.2 25277.2 25931.6
Garlic 29932.8 30582.4 31253.6 31948 32666.8 33411.6 34182 34978.8 35804.4 36658.8 37543.2
Beans 31546.8 31969.2 32404.8 32853.6 33316 33792 34283.2 34789.2 35310.8 35848 36402.8
Potato 480095.6 492877.6 506108.4 519806 533985.2 548665.6 563865.2 579602 595896 612768 630238.4
Broccoli 3227.2 3384 3547.6 3716.8 3892.8 4074.8 4264 4460 4663.6 4874 5093.6
Raddish 130161.2 134328 138645.2 143117.6 147751.2 152552 157526.8 162680 168020 173552.4 179286
Carrot 158814 163598.8 168554.4 173687.6 179004.8 184511.6 190216.8 196126 202248.4 208590 215159.6
Onion 159157.2 164392.4 169816.8 175438 181262.8 187300 193556 200038.8 206758.4 213721.2 220937.6
Pumpkin 45033.2 46513.2 48046 49634.4 51424 52986.4 54753.6 56585.2 58483.2 60450 62488
Gourd 1222.8 1183.2 1142 1098.8 1053.6 1006.4 956.8 904.8 850.4 793.2 733.6
B. Gourd 4256 4256 4255.6 4254.4 4252.4 4249.2 4246 4241.6 4236 4229.6 4222
Cucumber 10829.6 10780.4 10728.8 10674.4 10616.8 10556.4 10492.4 10425.6 10355.2 10281.6 10204.4
Brinjal 51646.8 53415.2 55246 57142 59105.2 61138.4 63243.6 65424 67682 70020 72442.4
L. Finger 20923.2 20598.4 20258.8 19902 19528.8 19138.4 18729.2 18301.2 17854 17385.6 16896.4
Palak 123776.4 129578 135593.6 141830.8 148296.8 155000.4 161950.8 169156.8 176628 184374 192404.4
Ginger 40942 42327.2 43762.4 45248.8 46788.8 48385.2 50037.6 51750.4 53524.8 55363.6 57268.4
Mustard 29542.8 30450 31389.6 32363.2 33371.6 34416 35498 36618.4 37779.6 38982.8 40228.4
Methi 13914 14890.8 15904 16954.4 18044.4 19174.4 20346.4 21561.6 22822 24128.8 25483.6
Soya 31580.8 31804 32033.2 32269.6 32512 32762 33018.4 33282.8 33554.8 33834.8 34122.8
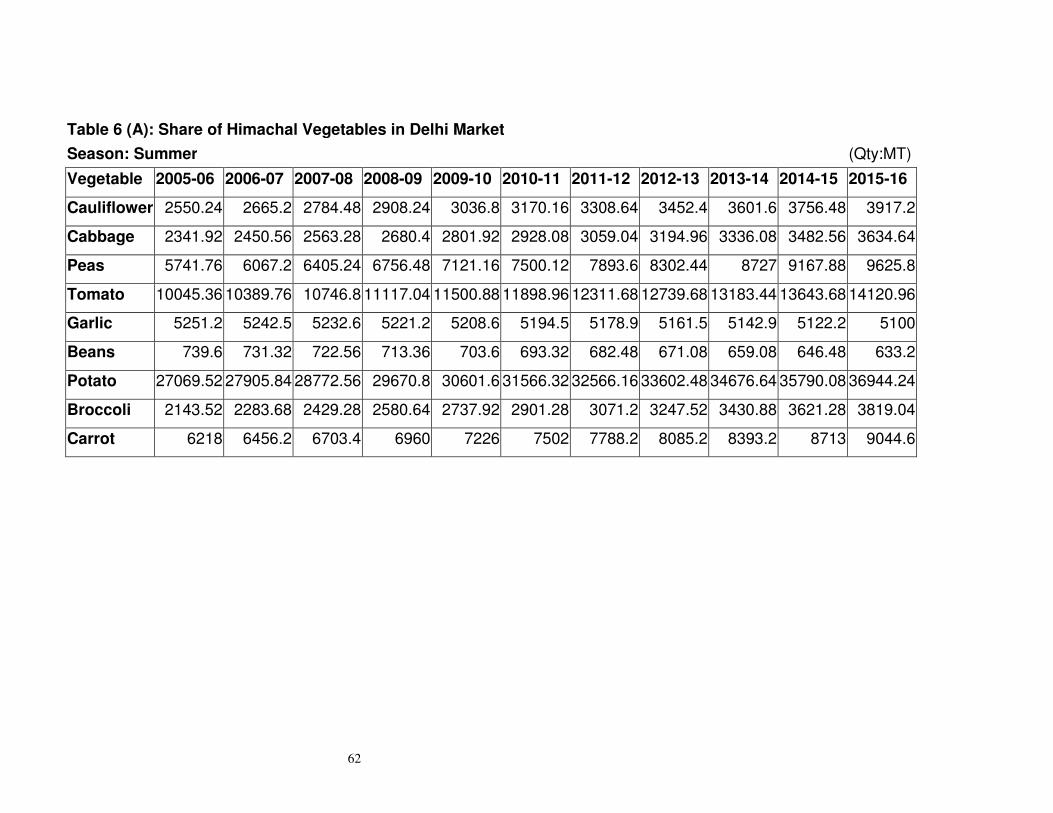
62
Table 6 (A): Share of Himachal Vegetables in Delhi Market
Season: Summer (Qty:MT)
Vegetable 2005-06 2006-07 2007-08 2008-09 2009-10 2010-11 2011-12 2012-13 2013-14 2014-15 2015-16
Cauliflower 2550.24 2665.2 2784.48 2908.24 3036.8 3170.16 3308.64 3452.4 3601.6 3756.48 3917.2
Cabbage 2341.92 2450.56 2563.28 2680.4 2801.92 2928.08 3059.04 3194.96 3336.08 3482.56 3634.64
Peas 5741.76 6067.2 6405.24 6756.48 7121.16 7500.12 7893.6 8302.44 8727 9167.88 9625.8
Tomato 10045.36 10389.76 10746.8 11117.04 11500.88 11898.96 12311.68 12739.68 13183.44 13643.68 14120.96
Garlic 5251.2 5242.5 5232.6 5221.2 5208.6 5194.5 5178.9 5161.5 5142.9 5122.2 5100
Beans 739.6 731.32 722.56 713.36 703.6 693.32 682.48 671.08 659.08 646.48 633.2
Potato 27069.52 27905.84 28772.56 29670.8 30601.6 31566.32 32566.16 33602.48 34676.64 35790.08 36944.24
Broccoli 2143.52 2283.68 2429.28 2580.64 2737.92 2901.28 3071.2 3247.52 3430.88 3621.28 3819.04
Carrot 6218 6456.2 6703.4 6960 7226 7502 7788.2 8085.2 8393.2 8713 9044.6
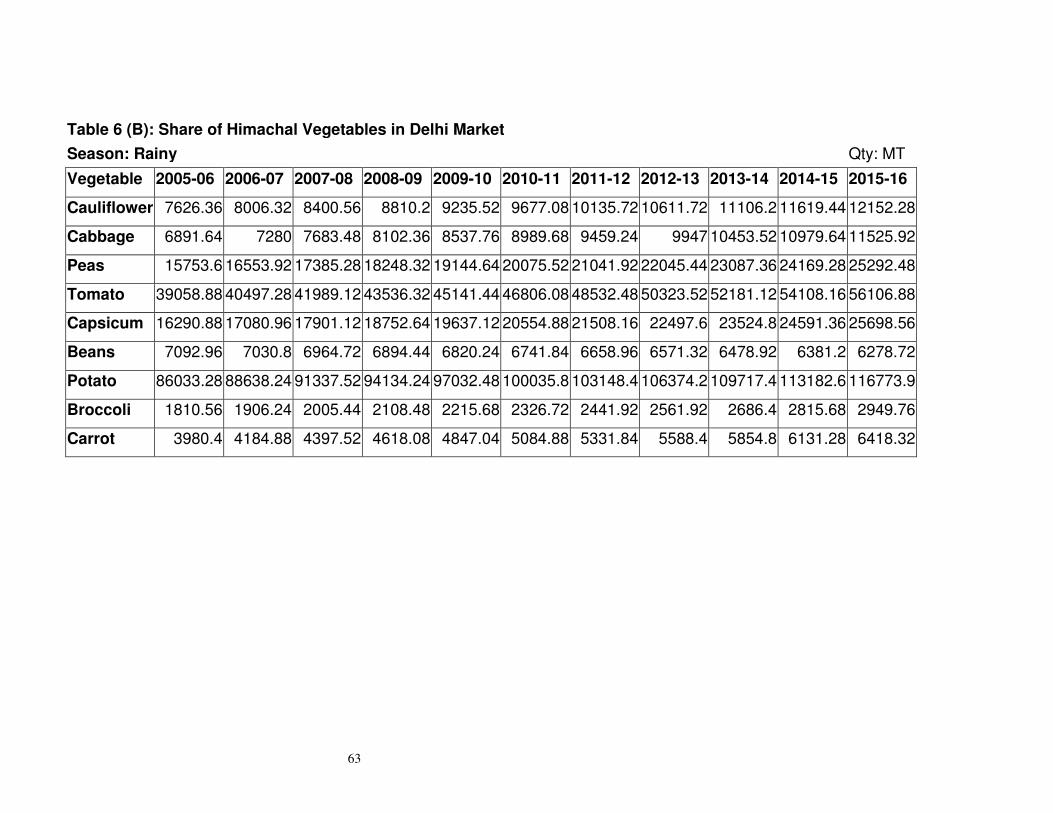
63
Table 6 (B): Share of Himachal Vegetables in Delhi Market
Season: Rainy Qty: MT
Vegetable 2005-06 2006-07 2007-08 2008-09 2009-10 2010-11 2011-12 2012-13 2013-14 2014-15 2015-16
Cauliflower 7626.36 8006.32 8400.56 8810.2 9235.52 9677.08 10135.72 10611.72 11106.2 11619.44 12152.28
Cabbage 6891.64 7280 7683.48 8102.36 8537.76 8989.68 9459.24 9947 10453.52 10979.64 11525.92
Peas 15753.6 16553.92 17385.28 18248.32 19144.64 20075.52 21041.92 22045.44 23087.36 24169.28 25292.48
Tomato 39058.88 40497.28 41989.12 43536.32 45141.44 46806.08 48532.48 50323.52 52181.12 54108.16 56106.88
Capsicum 16290.88 17080.96 17901.12 18752.64 19637.12 20554.88 21508.16 22497.6 23524.8 24591.36 25698.56
Beans 7092.96 7030.8 6964.72 6894.44 6820.24 6741.84 6658.96 6571.32 6478.92 6381.2 6278.72
Potato 86033.28 88638.24 91337.52 94134.24 97032.48 100035.8 103148.4 106374.2 109717.4 113182.6 116773.9
Broccoli 1810.56 1906.24 2005.44 2108.48 2215.68 2326.72 2441.92 2561.92 2686.4 2815.68 2949.76
Carrot 3980.4 4184.88 4397.52 4618.08 4847.04 5084.88 5331.84 5588.4 5854.8 6131.28 6418.32
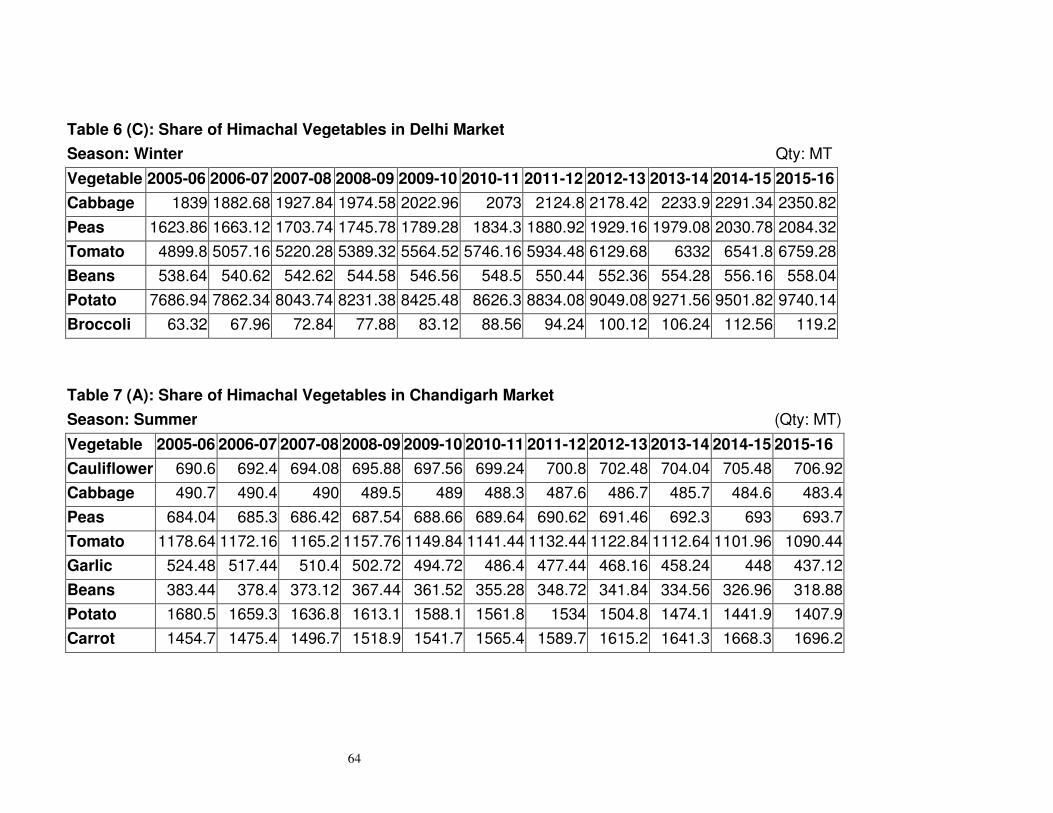
64
Table 6 (C): Share of Himachal Vegetables in Delhi Market
Season: Winter Qty: MT
Vegetable 2005-06 2006-07 2007-08 2008-09 2009-10 2010-11 2011-12 2012-13 2013-14 2014-15 2015-16
Cabbage 1839 1882.68 1927.84 1974.58 2022.96 2073 2124.8 2178.42 2233.9 2291.34 2350.82
Peas 1623.86 1663.12 1703.74 1745.78 1789.28 1834.3 1880.92 1929.16 1979.08 2030.78 2084.32
Tomato 4899.8 5057.16 5220.28 5389.32 5564.52 5746.16 5934.48 6129.68 6332 6541.8 6759.28
Beans 538.64 540.62 542.62 544.58 546.56 548.5 550.44 552.36 554.28 556.16 558.04
Potato 7686.94 7862.34 8043.74 8231.38 8425.48 8626.3 8834.08 9049.08 9271.56 9501.82 9740.14
Broccoli 63.32 67.96 72.84 77.88 83.12 88.56 94.24 100.12 106.24 112.56 119.2
Table 7 (A): Share of Himachal Vegetables in Chandigarh Market
Season: Summer (Qty: MT)
Vegetable 2005-06 2006-07 2007-08 2008-09 2009-10 2010-11 2011-12 2012-13 2013-14 2014-15 2015-16
Cauliflower 690.6 692.4 694.08 695.88 697.56 699.24 700.8 702.48 704.04 705.48 706.92
Cabbage 490.7 490.4 490 489.5 489 488.3 487.6 486.7 485.7 484.6 483.4
Peas 684.04 685.3 686.42 687.54 688.66 689.64 690.62 691.46 692.3 693 693.7
Tomato 1178.64 1172.16 1165.2 1157.76 1149.84 1141.44 1132.44 1122.84 1112.64 1101.96 1090.44
Garlic 524.48 517.44 510.4 502.72 494.72 486.4 477.44 468.16 458.24 448 437.12
Beans 383.44 378.4 373.12 367.44 361.52 355.28 348.72 341.84 334.56 326.96 318.88
Potato 1680.5 1659.3 1636.8 1613.1 1588.1 1561.8 1534 1504.8 1474.1 1441.9 1407.9
Carrot 1454.7 1475.4 1496.7 1518.9 1541.7 1565.4 1589.7 1615.2 1641.3 1668.3 1696.2
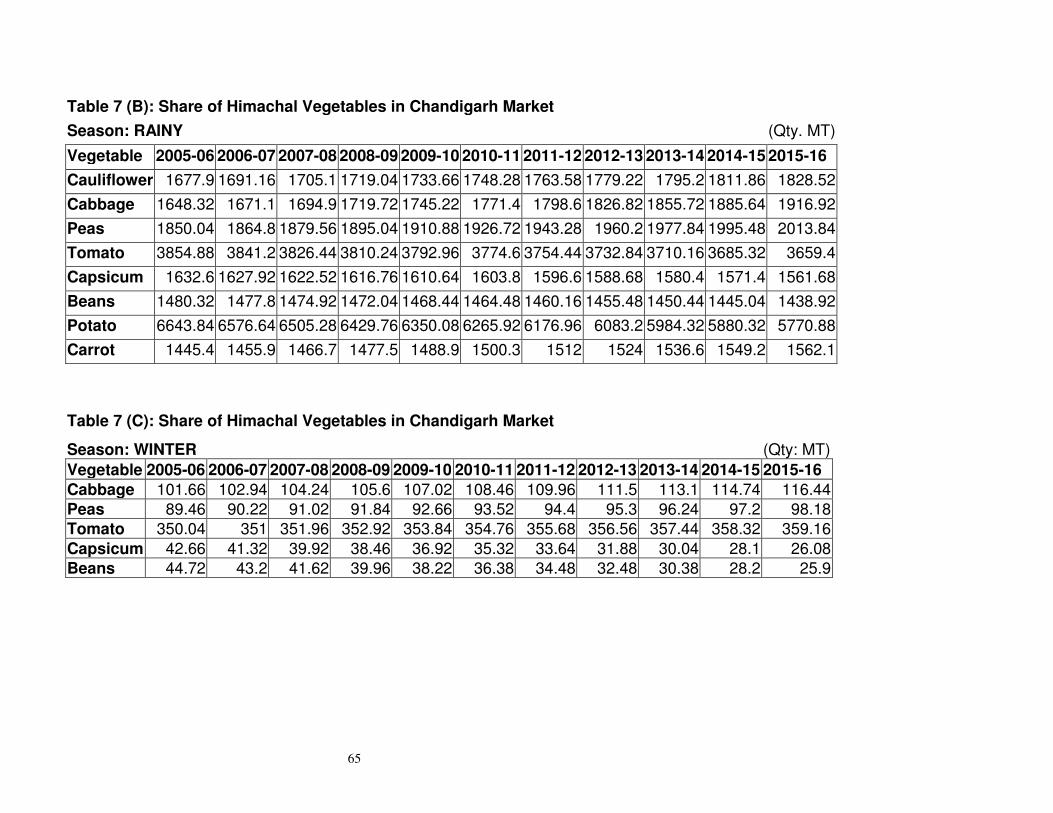
65
Table 7 (B): Share of Himachal Vegetables in Chandigarh Market
Season: RAINY (Qty. MT)
Vegetable 2005-06 2006-07 2007-08 2008-09 2009-10 2010-11 2011-12 2012-13 2013-14 2014-15 2015-16
Cauliflower 1677.9 1691.16 1705.1 1719.04 1733.66 1748.28 1763.58 1779.22 1795.2 1811.86 1828.52
Cabbage 1648.32 1671.1 1694.9 1719.72 1745.22 1771.4 1798.6 1826.82 1855.72 1885.64 1916.92
Peas 1850.04 1864.8 1879.56 1895.04 1910.88 1926.72 1943.28 1960.2 1977.84 1995.48 2013.84
Tomato 3854.88 3841.2 3826.44 3810.24 3792.96 3774.6 3754.44 3732.84 3710.16 3685.32 3659.4
Capsicum 1632.6 1627.92 1622.52 1616.76 1610.64 1603.8 1596.6 1588.68 1580.4 1571.4 1561.68
Beans 1480.32 1477.8 1474.92 1472.04 1468.44 1464.48 1460.16 1455.48 1450.44 1445.04 1438.92
Potato 6643.84 6576.64 6505.28 6429.76 6350.08 6265.92 6176.96 6083.2 5984.32 5880.32 5770.88
Carrot 1445.4 1455.9 1466.7 1477.5 1488.9 1500.3 1512 1524 1536.6 1549.2 1562.1
Table 7 (C): Share of Himachal Vegetables in Chandigarh Market
Season: WINTER (Qty: MT)
Vegetable 2005-06 2006-07 2007-08 2008-09 2009-10 2010-11 2011-12 2012-13 2013-14 2014-15 2015-16
Cabbage 101.66 102.94 104.24 105.6 107.02 108.46 109.96 111.5 113.1 114.74 116.44 Peas 89.46 90.22 91.02 91.84 92.66 93.52 94.4 95.3 96.24 97.2 98.18 Tomato 350.04 351 351.96 352.92 353.84 354.76 355.68 356.56 357.44 358.32 359.16
Capsicum 42.66 41.32 39.92 38.46 36.92 35.32 33.64 31.88 30.04 28.1 26.08 Beans 44.72 43.2 41.62 39.96 38.22 36.38 34.48 32.48 30.38 28.2 25.9
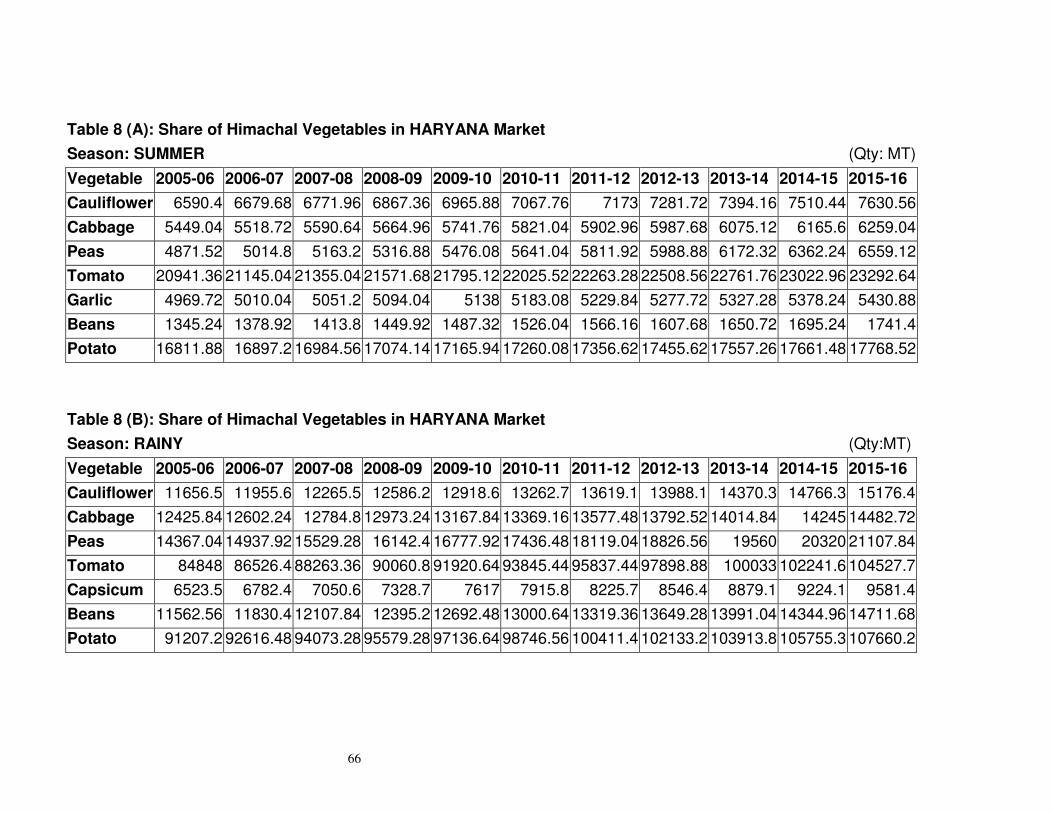
66
Table 8 (A): Share of Himachal Vegetables in HARYANA Market
Season: SUMMER (Qty: MT)
Vegetable 2005-06 2006-07 2007-08 2008-09 2009-10 2010-11 2011-12 2012-13 2013-14 2014-15 2015-16
Cauliflower 6590.4 6679.68 6771.96 6867.36 6965.88 7067.76 7173 7281.72 7394.16 7510.44 7630.56
Cabbage 5449.04 5518.72 5590.64 5664.96 5741.76 5821.04 5902.96 5987.68 6075.12 6165.6 6259.04
Peas 4871.52 5014.8 5163.2 5316.88 5476.08 5641.04 5811.92 5988.88 6172.32 6362.24 6559.12
Tomato 20941.36 21145.04 21355.04 21571.68 21795.12 22025.52 22263.28 22508.56 22761.76 23022.96 23292.64
Garlic 4969.72 5010.04 5051.2 5094.04 5138 5183.08 5229.84 5277.72 5327.28 5378.24 5430.88
Beans 1345.24 1378.92 1413.8 1449.92 1487.32 1526.04 1566.16 1607.68 1650.72 1695.24 1741.4
Potato 16811.88 16897.2 16984.56 17074.14 17165.94 17260.08 17356.62 17455.62 17557.26 17661.48 17768.52
Table 8 (B): Share of Himachal Vegetables in HARYANA Market
Season: RAINY (Qty:MT)
Vegetable 2005-06 2006-07 2007-08 2008-09 2009-10 2010-11 2011-12 2012-13 2013-14 2014-15 2015-16
Cauliflower 11656.5 11955.6 12265.5 12586.2 12918.6 13262.7 13619.1 13988.1 14370.3 14766.3 15176.4
Cabbage 12425.84 12602.24 12784.8 12973.24 13167.84 13369.16 13577.48 13792.52 14014.84 14245 14482.72
Peas 14367.04 14937.92 15529.28 16142.4 16777.92 17436.48 18119.04 18826.56 19560 20320 21107.84
Tomato 84848 86526.4 88263.36 90060.8 91920.64 93845.44 95837.44 97898.88 100033 102241.6 104527.7
Capsicum 6523.5 6782.4 7050.6 7328.7 7617 7915.8 8225.7 8546.4 8879.1 9224.1 9581.4
Beans 11562.56 11830.4 12107.84 12395.2 12692.48 13000.64 13319.36 13649.28 13991.04 14344.96 14711.68
Potato 91207.2 92616.48 94073.28 95579.28 97136.64 98746.56 100411.4 102133.2 103913.8 105755.3 107660.2
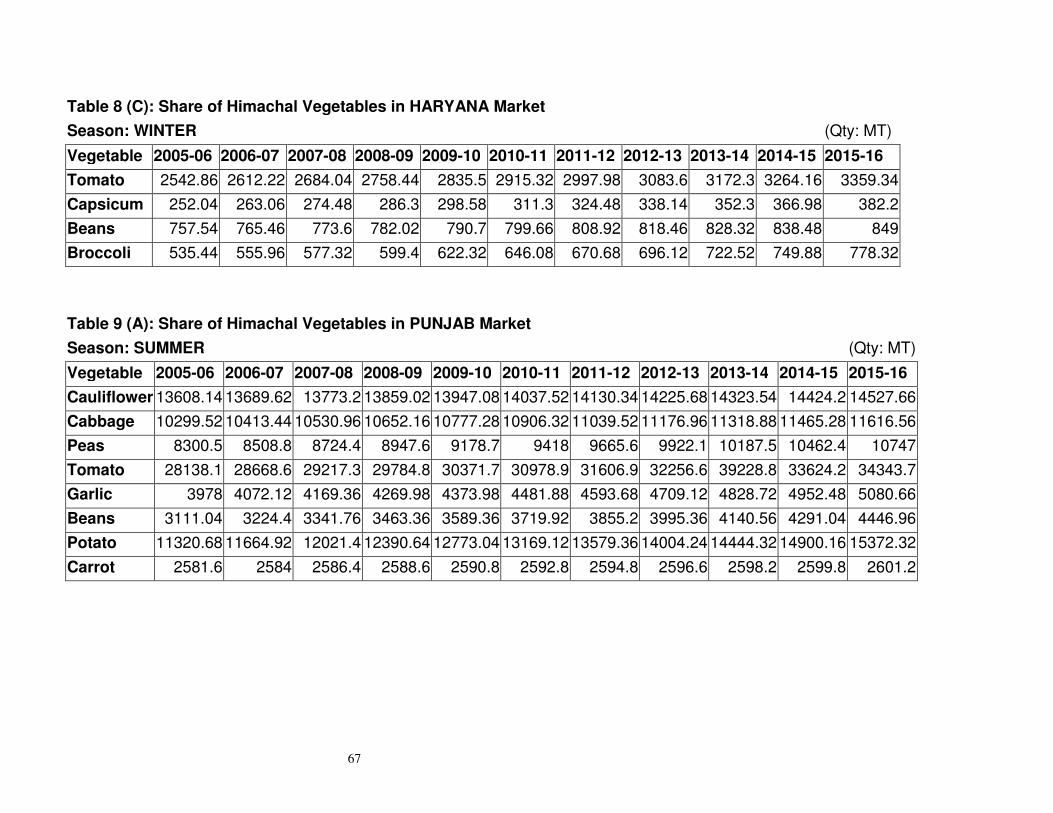
67
Table 8 (C): Share of Himachal Vegetables in HARYANA Market
Season: WINTER (Qty: MT)
Vegetable 2005-06 2006-07 2007-08 2008-09 2009-10 2010-11 2011-12 2012-13 2013-14 2014-15 2015-16
Tomato 2542.86 2612.22 2684.04 2758.44 2835.5 2915.32 2997.98 3083.6 3172.3 3264.16 3359.34
Capsicum 252.04 263.06 274.48 286.3 298.58 311.3 324.48 338.14 352.3 366.98 382.2
Beans 757.54 765.46 773.6 782.02 790.7 799.66 808.92 818.46 828.32 838.48 849
Broccoli 535.44 555.96 577.32 599.4 622.32 646.08 670.68 696.12 722.52 749.88 778.32
Table 9 (A): Share of Himachal Vegetables in PUNJAB Market
Season: SUMMER (Qty: MT)
Vegetable 2005-06 2006-07 2007-08 2008-09 2009-10 2010-11 2011-12 2012-13 2013-14 2014-15 2015-16
Cauliflower 13608.14 13689.62 13773.2 13859.02 13947.08 14037.52 14130.34 14225.68 14323.54 14424.2 14527.66
Cabbage 10299.52 10413.44 10530.96 10652.16 10777.28 10906.32 11039.52 11176.96 11318.88 11465.28 11616.56
Peas 8300.5 8508.8 8724.4 8947.6 9178.7 9418 9665.6 9922.1 10187.5 10462.4 10747
Tomato 28138.1 28668.6 29217.3 29784.8 30371.7 30978.9 31606.9 32256.6 39228.8 33624.2 34343.7
Garlic 3978 4072.12 4169.36 4269.98 4373.98 4481.88 4593.68 4709.12 4828.72 4952.48 5080.66
Beans 3111.04 3224.4 3341.76 3463.36 3589.36 3719.92 3855.2 3995.36 4140.56 4291.04 4446.96
Potato 11320.68 11664.92 12021.4 12390.64 12773.04 13169.12 13579.36 14004.24 14444.32 14900.16 15372.32
Carrot 2581.6 2584 2586.4 2588.6 2590.8 2592.8 2594.8 2596.6 2598.2 2599.8 2601.2
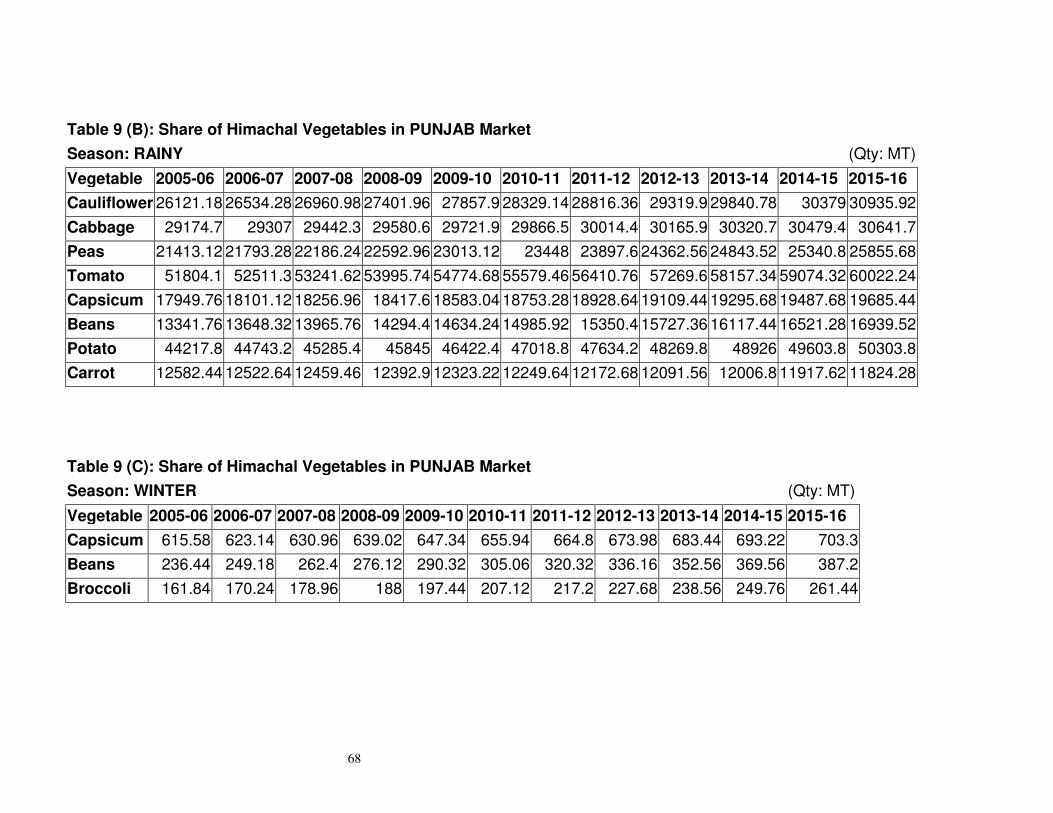
68
Table 9 (B): Share of Himachal Vegetables in PUNJAB Market
Season: RAINY (Qty: MT)
Vegetable 2005-06 2006-07 2007-08 2008-09 2009-10 2010-11 2011-12 2012-13 2013-14 2014-15 2015-16
Cauliflower 26121.18 26534.28 26960.98 27401.96 27857.9 28329.14 28816.36 29319.9 29840.78 30379 30935.92
Cabbage 29174.7 29307 29442.3 29580.6 29721.9 29866.5 30014.4 30165.9 30320.7 30479.4 30641.7
Peas 21413.12 21793.28 22186.24 22592.96 23013.12 23448 23897.6 24362.56 24843.52 25340.8 25855.68
Tomato 51804.1 52511.3 53241.62 53995.74 54774.68 55579.46 56410.76 57269.6 58157.34 59074.32 60022.24
Capsicum 17949.76 18101.12 18256.96 18417.6 18583.04 18753.28 18928.64 19109.44 19295.68 19487.68 19685.44
Beans 13341.76 13648.32 13965.76 14294.4 14634.24 14985.92 15350.4 15727.36 16117.44 16521.28 16939.52
Potato 44217.8 44743.2 45285.4 45845 46422.4 47018.8 47634.2 48269.8 48926 49603.8 50303.8
Carrot 12582.44 12522.64 12459.46 12392.9 12323.22 12249.64 12172.68 12091.56 12006.8 11917.62 11824.28
Table 9 (C): Share of Himachal Vegetables in PUNJAB Market
Season: WINTER (Qty: MT)
Vegetable 2005-06 2006-07 2007-08 2008-09 2009-10 2010-11 2011-12 2012-13 2013-14 2014-15 2015-16
Capsicum 615.58 623.14 630.96 639.02 647.34 655.94 664.8 673.98 683.44 693.22 703.3
Beans 236.44 249.18 262.4 276.12 290.32 305.06 320.32 336.16 352.56 369.56 387.2
Broccoli 161.84 170.24 178.96 188 197.44 207.12 217.2 227.68 238.56 249.76 261.44
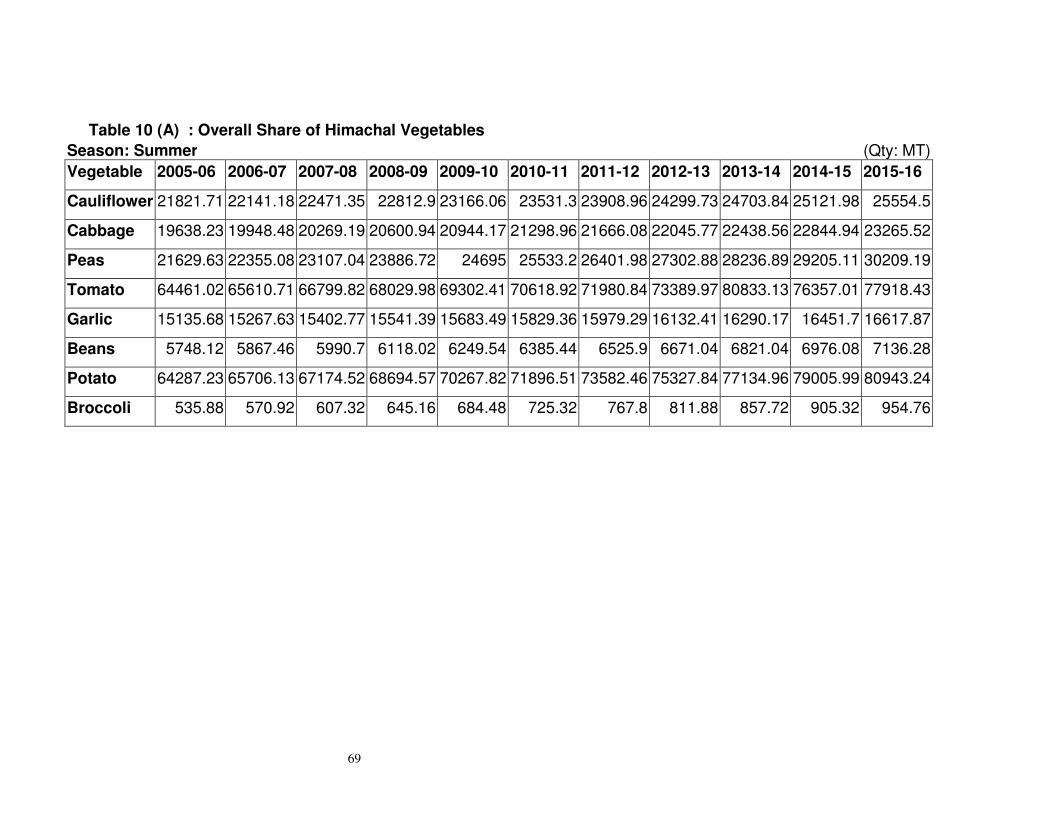
69
Table 10 (A) : Overall Share of Himachal Vegetables
Season: Summer (Qty: MT)
Vegetable 2005-06 2006-07 2007-08 2008-09 2009-10 2010-11 2011-12 2012-13 2013-14 2014-15 2015-16
Cauliflower 21821.71 22141.18 22471.35 22812.9 23166.06 23531.3 23908.96 24299.73 24703.84 25121.98 25554.5
Cabbage 19638.23 19948.48 20269.19 20600.94 20944.17 21298.96 21666.08 22045.77 22438.56 22844.94 23265.52
Peas 21629.63 22355.08 23107.04 23886.72 24695 25533.2 26401.98 27302.88 28236.89 29205.11 30209.19
Tomato 64461.02 65610.71 66799.82 68029.98 69302.41 70618.92 71980.84 73389.97 80833.13 76357.01 77918.43
Garlic 15135.68 15267.63 15402.77 15541.39 15683.49 15829.36 15979.29 16132.41 16290.17 16451.7 16617.87
Beans 5748.12 5867.46 5990.7 6118.02 6249.54 6385.44 6525.9 6671.04 6821.04 6976.08 7136.28
Potato 64287.23 65706.13 67174.52 68694.57 70267.82 71896.51 73582.46 75327.84 77134.96 79005.99 80943.24
Broccoli 535.88 570.92 607.32 645.16 684.48 725.32 767.8 811.88 857.72 905.32 954.76
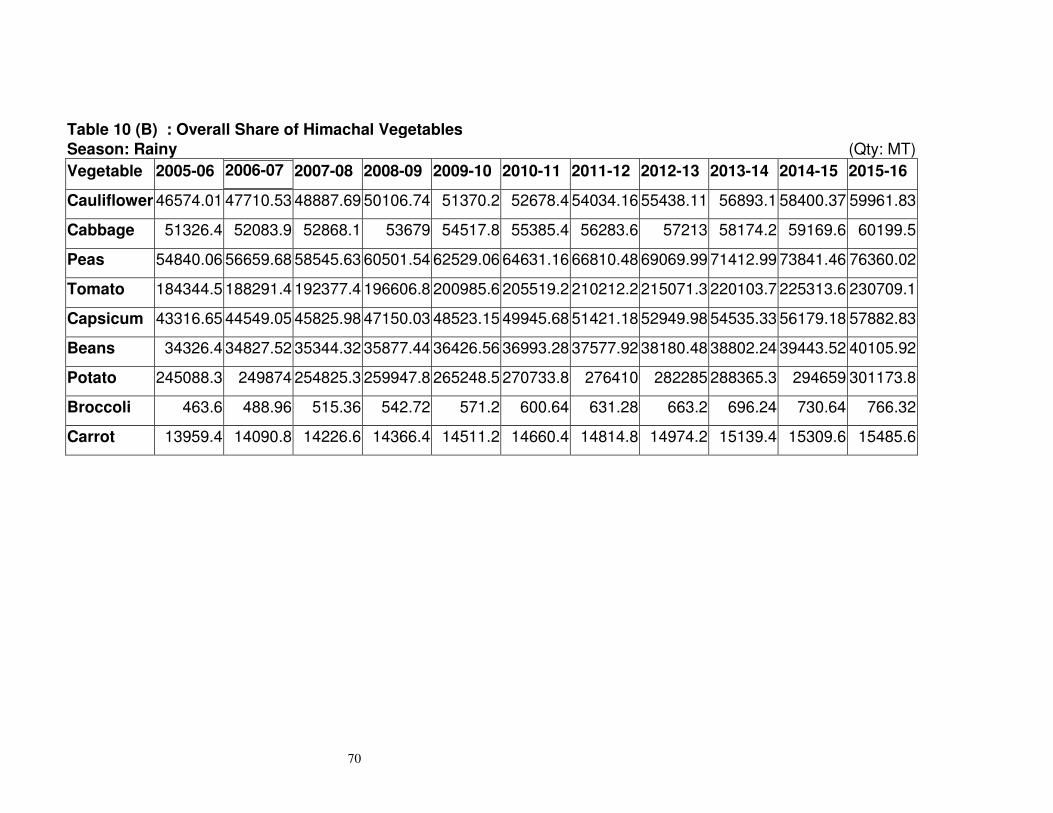
70
Table 10 (B) : Overall Share of Himachal Vegetables
Season: Rainy (Qty: MT)
Vegetable 2005-06 2006-07 2007-08 2008-09 2009-10 2010-11 2011-12 2012-13 2013-14 2014-15 2015-16
Cauliflower 46574.01 47710.53 48887.69 50106.74 51370.2 52678.4 54034.16 55438.11 56893.1 58400.37 59961.83
Cabbage 51326.4 52083.9 52868.1 53679 54517.8 55385.4 56283.6 57213 58174.2 59169.6 60199.5
Peas 54840.06 56659.68 58545.63 60501.54 62529.06 64631.16 66810.48 69069.99 71412.99 73841.46 76360.02
Tomato 184344.5 188291.4 192377.4 196606.8 200985.6 205519.2 210212.2 215071.3 220103.7 225313.6 230709.1
Capsicum 43316.65 44549.05 45825.98 47150.03 48523.15 49945.68 51421.18 52949.98 54535.33 56179.18 57882.83
Beans 34326.4 34827.52 35344.32 35877.44 36426.56 36993.28 37577.92 38180.48 38802.24 39443.52 40105.92
Potato 245088.3 249874 254825.3 259947.8 265248.5 270733.8 276410 282285 288365.3 294659 301173.8
Broccoli 463.6 488.96 515.36 542.72 571.2 600.64 631.28 663.2 696.24 730.64 766.32
Carrot 13959.4 14090.8 14226.6 14366.4 14511.2 14660.4 14814.8 14974.2 15139.4 15309.6 15485.6
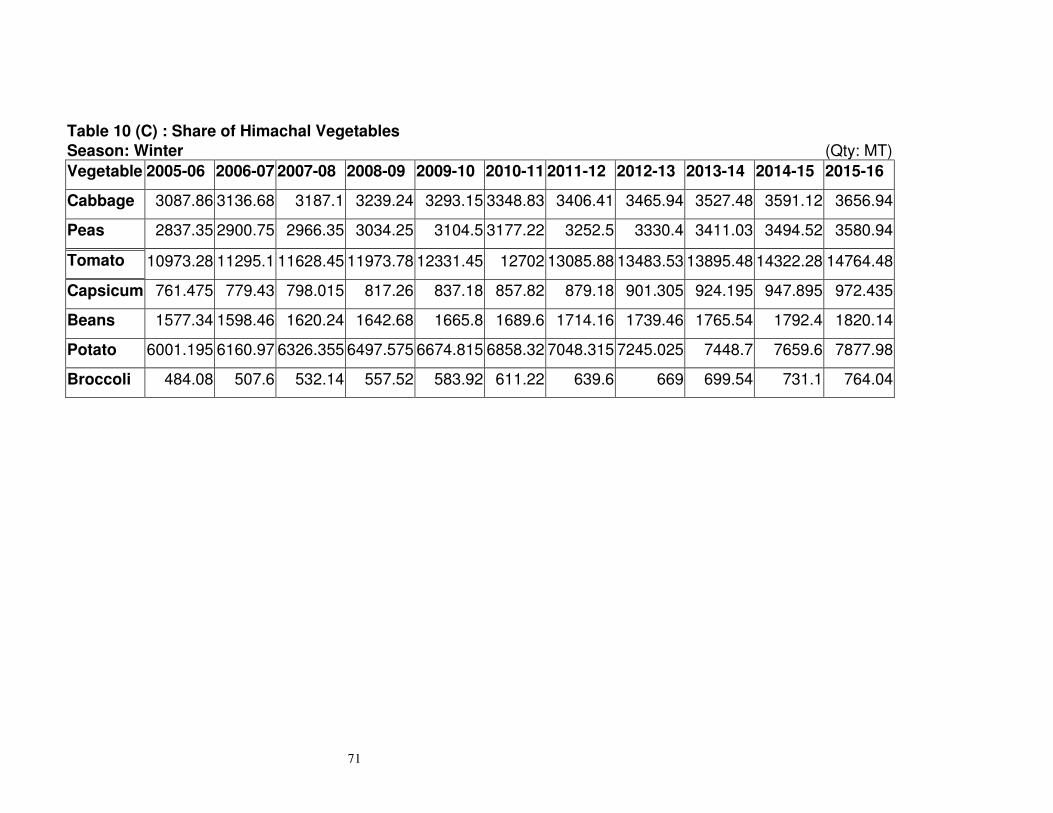
71
Table 10 (C) : Share of Himachal Vegetables
Season: Winter (Qty: MT)
Vegetable 2005-06 2006-07 2007-08 2008-09 2009-10 2010-11 2011-12 2012-13 2013-14 2014-15 2015-16
Cabbage 3087.86 3136.68 3187.1 3239.24 3293.15 3348.83 3406.41 3465.94 3527.48 3591.12 3656.94
Peas 2837.35 2900.75 2966.35 3034.25 3104.5 3177.22 3252.5 3330.4 3411.03 3494.52 3580.94
Tomato 10973.28 11295.1 11628.45 11973.78 12331.45 12702 13085.88 13483.53 13895.48 14322.28 14764.48
Capsicum 761.475 779.43 798.015 817.26 837.18 857.82 879.18 901.305 924.195 947.895 972.435
Beans 1577.34 1598.46 1620.24 1642.68 1665.8 1689.6 1714.16 1739.46 1765.54 1792.4 1820.14
Potato 6001.195 6160.97 6326.355 6497.575 6674.815 6858.32 7048.315 7245.025 7448.7 7659.6 7877.98
Broccoli 484.08 507.6 532.14 557.52 583.92 611.22 639.6 669 699.54 731.1 764.04
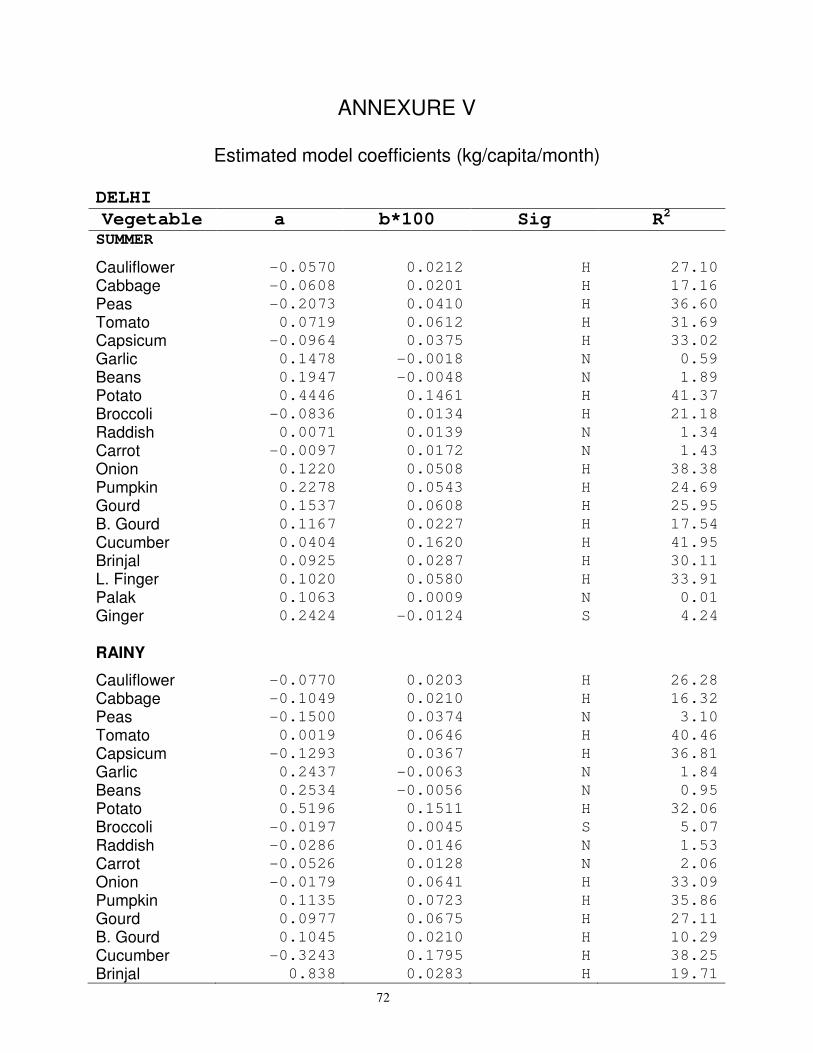
72
ANNEXURE V
Estimated model coefficients (kg/capita/month)
DELHI
Vegetable a b*100 Sig R2
SUMMER
Cauliflower -0.0570 0.0212 H 27.10
Cabbage -0.0608 0.0201 H 17.16
Peas -0.2073 0.0410 H 36.60
Tomato 0.0719 0.0612 H 31.69
Capsicum -0.0964 0.0375 H 33.02
Garlic 0.1478 -0.0018 N 0.59
Beans 0.1947 -0.0048 N 1.89
Potato 0.4446 0.1461 H 41.37
Broccoli -0.0836 0.0134 H 21.18
Raddish 0.0071 0.0139 N 1.34
Carrot -0.0097 0.0172 N 1.43
Onion 0.1220 0.0508 H 38.38
Pumpkin 0.2278 0.0543 H 24.69
Gourd 0.1537 0.0608 H 25.95
B. Gourd 0.1167 0.0227 H 17.54
Cucumber 0.0404 0.1620 H 41.95
Brinjal 0.0925 0.0287 H 30.11
L. Finger 0.1020 0.0580 H 33.91
Palak 0.1063 0.0009 N 0.01
Ginger 0.2424 -0.0124 S 4.24
RAINY
Cauliflower -0.0770 0.0203 H 26.28
Cabbage -0.1049 0.0210 H 16.32
Peas -0.1500 0.0374 N 3.10
Tomato 0.0019 0.0646 H 40.46
Capsicum -0.1293 0.0367 H 36.81
Garlic 0.2437 -0.0063 N 1.84
Beans 0.2534 -0.0056 N 0.95
Potato 0.5196 0.1511 H 32.06
Broccoli -0.0197 0.0045 S 5.07
Raddish -0.0286 0.0146 N 1.53
Carrot -0.0526 0.0128 N 2.06
Onion -0.0179 0.0641 H 33.09
Pumpkin 0.1135 0.0723 H 35.86
Gourd 0.0977 0.0675 H 27.11
B. Gourd 0.1045 0.0210 H 10.29
Cucumber -0.3243 0.1795 H 38.25
Brinjal 0.838 0.0283 H 19.71
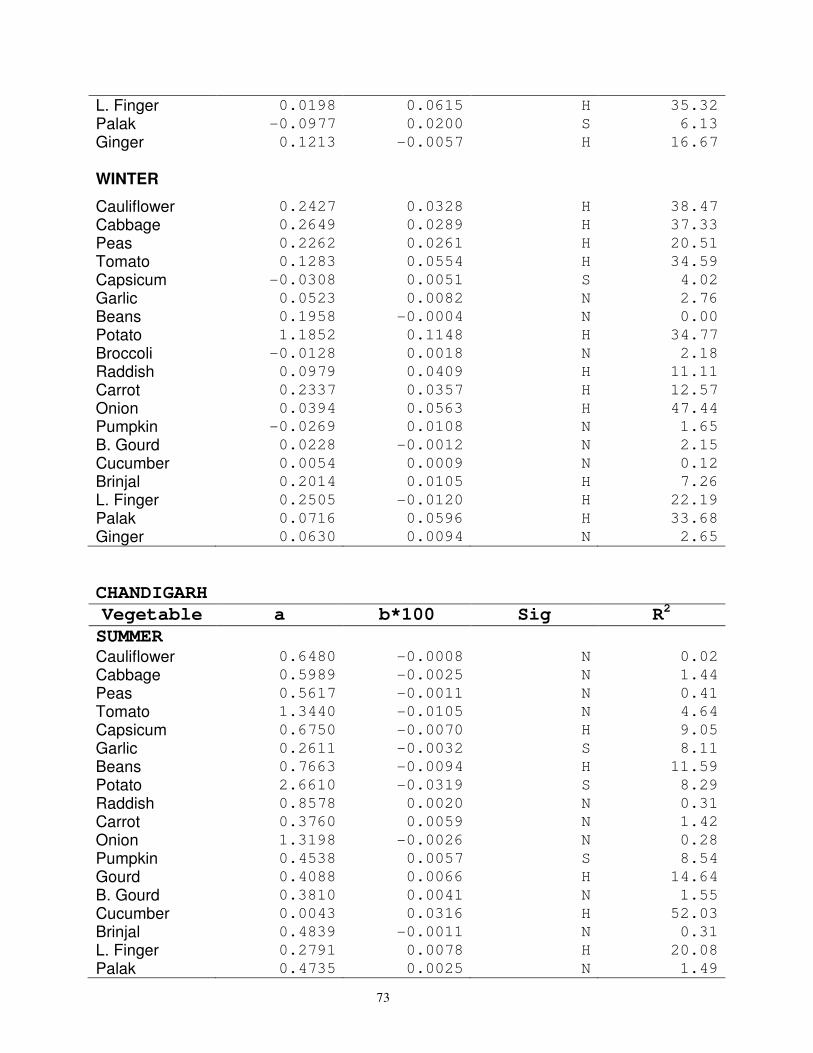
73
L. Finger 0.0198 0.0615 H 35.32
Palak -0.0977 0.0200 S 6.13
Ginger 0.1213 -0.0057 H 16.67
WINTER
Cauliflower 0.2427 0.0328 H 38.47
Cabbage 0.2649 0.0289 H 37.33
Peas 0.2262 0.0261 H 20.51
Tomato 0.1283 0.0554 H 34.59
Capsicum -0.0308 0.0051 S 4.02
Garlic 0.0523 0.0082 N 2.76
Beans 0.1958 -0.0004 N 0.00
Potato 1.1852 0.1148 H 34.77
Broccoli -0.0128 0.0018 N 2.18
Raddish 0.0979 0.0409 H 11.11
Carrot 0.2337 0.0357 H 12.57
Onion 0.0394 0.0563 H 47.44
Pumpkin -0.0269 0.0108 N 1.65
B. Gourd 0.0228 -0.0012 N 2.15
Cucumber 0.0054 0.0009 N 0.12
Brinjal 0.2014 0.0105 H 7.26
L. Finger 0.2505 -0.0120 H 22.19
Palak 0.0716 0.0596 H 33.68
Ginger 0.0630 0.0094 N 2.65
CHANDIGARH
Vegetable a b*100 Sig R2
SUMMER
Cauliflower 0.6480 -0.0008 N 0.02
Cabbage 0.5989 -0.0025 N 1.44
Peas 0.5617 -0.0011 N 0.41
Tomato 1.3440 -0.0105 N 4.64
Capsicum 0.6750 -0.0070 H 9.05
Garlic 0.2611 -0.0032 S 8.11
Beans 0.7663 -0.0094 H 11.59
Potato 2.6610 -0.0319 S 8.29
Raddish 0.8578 0.0020 N 0.31
Carrot 0.3760 0.0059 N 1.42
Onion 1.3198 -0.0026 N 0.28
Pumpkin 0.4538 0.0057 S 8.54
Gourd 0.4088 0.0066 H 14.64
B. Gourd 0.3810 0.0041 N 1.55
Cucumber 0.0043 0.0316 H 52.03
Brinjal 0.4839 -0.0011 N 0.31
L. Finger 0.2791 0.0078 H 20.08
Palak 0.4735 0.0025 N 1.49
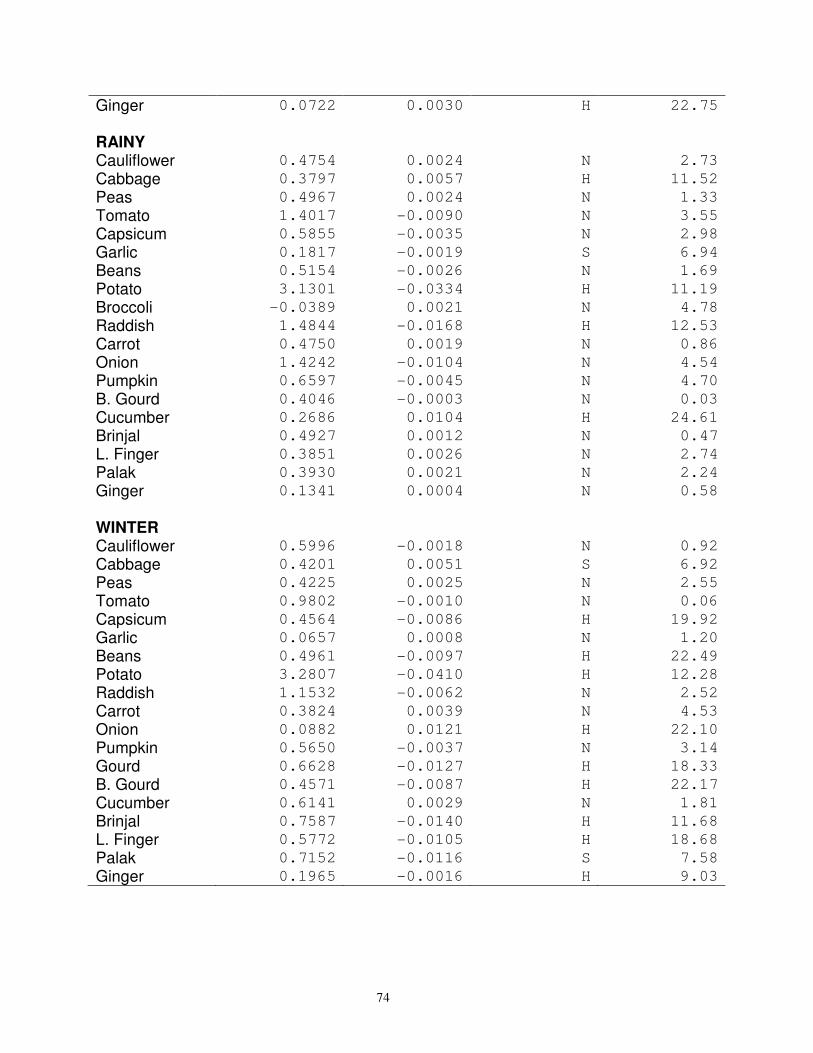
74
Ginger 0.0722 0.0030 H 22.75
RAINY
Cauliflower 0.4754 0.0024 N 2.73
Cabbage 0.3797 0.0057 H 11.52
Peas 0.4967 0.0024 N 1.33
Tomato 1.4017 -0.0090 N 3.55
Capsicum 0.5855 -0.0035 N 2.98
Garlic 0.1817 -0.0019 S 6.94
Beans 0.5154 -0.0026 N 1.69
Potato 3.1301 -0.0334 H 11.19
Broccoli -0.0389 0.0021 N 4.78
Raddish 1.4844 -0.0168 H 12.53
Carrot 0.4750 0.0019 N 0.86
Onion 1.4242 -0.0104 N 4.54
Pumpkin 0.6597 -0.0045 N 4.70
B. Gourd 0.4046 -0.0003 N 0.03
Cucumber 0.2686 0.0104 H 24.61
Brinjal 0.4927 0.0012 N 0.47
L. Finger 0.3851 0.0026 N 2.74
Palak 0.3930 0.0021 N 2.24
Ginger 0.1341 0.0004 N 0.58
WINTER
Cauliflower 0.5996 -0.0018 N 0.92
Cabbage 0.4201 0.0051 S 6.92
Peas 0.4225 0.0025 N 2.55
Tomato 0.9802 -0.0010 N 0.06
Capsicum 0.4564 -0.0086 H 19.92
Garlic 0.0657 0.0008 N 1.20
Beans 0.4961 -0.0097 H 22.49
Potato 3.2807 -0.0410 H 12.28
Raddish 1.1532 -0.0062 N 2.52
Carrot 0.3824 0.0039 N 4.53
Onion 0.0882 0.0121 H 22.10
Pumpkin 0.5650 -0.0037 N 3.14
Gourd 0.6628 -0.0127 H 18.33
B. Gourd 0.4571 -0.0087 H 22.17
Cucumber 0.6141 0.0029 N 1.81
Brinjal 0.7587 -0.0140 H 11.68
L. Finger 0.5772 -0.0105 H 18.68
Palak 0.7152 -0.0116 S 7.58
Ginger 0.1965 -0.0016 H 9.03
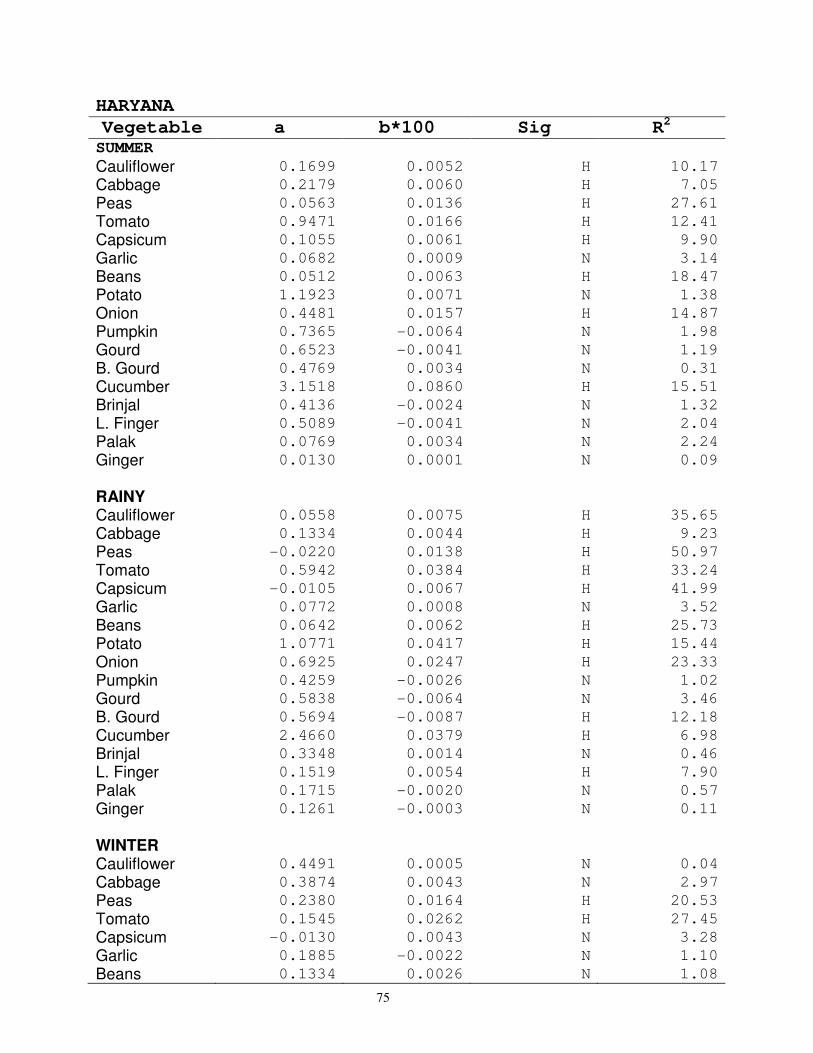
75
HARYANA
Vegetable a b*100 Sig R2
SUMMER
Cauliflower 0.1699 0.0052 H 10.17
Cabbage 0.2179 0.0060 H 7.05
Peas 0.0563 0.0136 H 27.61
Tomato 0.9471 0.0166 H 12.41
Capsicum 0.1055 0.0061 H 9.90
Garlic 0.0682 0.0009 N 3.14
Beans 0.0512 0.0063 H 18.47
Potato 1.1923 0.0071 N 1.38
Onion 0.4481 0.0157 H 14.87
Pumpkin 0.7365 -0.0064 N 1.98
Gourd 0.6523 -0.0041 N 1.19
B. Gourd 0.4769 0.0034 N 0.31
Cucumber 3.1518 0.0860 H 15.51
Brinjal 0.4136 -0.0024 N 1.32
L. Finger 0.5089 -0.0041 N 2.04
Palak 0.0769 0.0034 N 2.24
Ginger 0.0130 0.0001 N 0.09
RAINY
Cauliflower 0.0558 0.0075 H 35.65
Cabbage 0.1334 0.0044 H 9.23
Peas -0.0220 0.0138 H 50.97
Tomato 0.5942 0.0384 H 33.24
Capsicum -0.0105 0.0067 H 41.99
Garlic 0.0772 0.0008 N 3.52
Beans 0.0642 0.0062 H 25.73
Potato 1.0771 0.0417 H 15.44
Onion 0.6925 0.0247 H 23.33
Pumpkin 0.4259 -0.0026 N 1.02
Gourd 0.5838 -0.0064 N 3.46
B. Gourd 0.5694 -0.0087 H 12.18
Cucumber 2.4660 0.0379 H 6.98
Brinjal 0.3348 0.0014 N 0.46
L. Finger 0.1519 0.0054 H 7.90
Palak 0.1715 -0.0020 N 0.57
Ginger 0.1261 -0.0003 N 0.11
WINTER
Cauliflower 0.4491 0.0005 N 0.04
Cabbage 0.3874 0.0043 N 2.97
Peas 0.2380 0.0164 H 20.53
Tomato 0.1545 0.0262 H 27.45
Capsicum -0.0130 0.0043 N 3.28
Garlic 0.1885 -0.0022 N 1.10
Beans 0.1334 0.0026 N 1.08
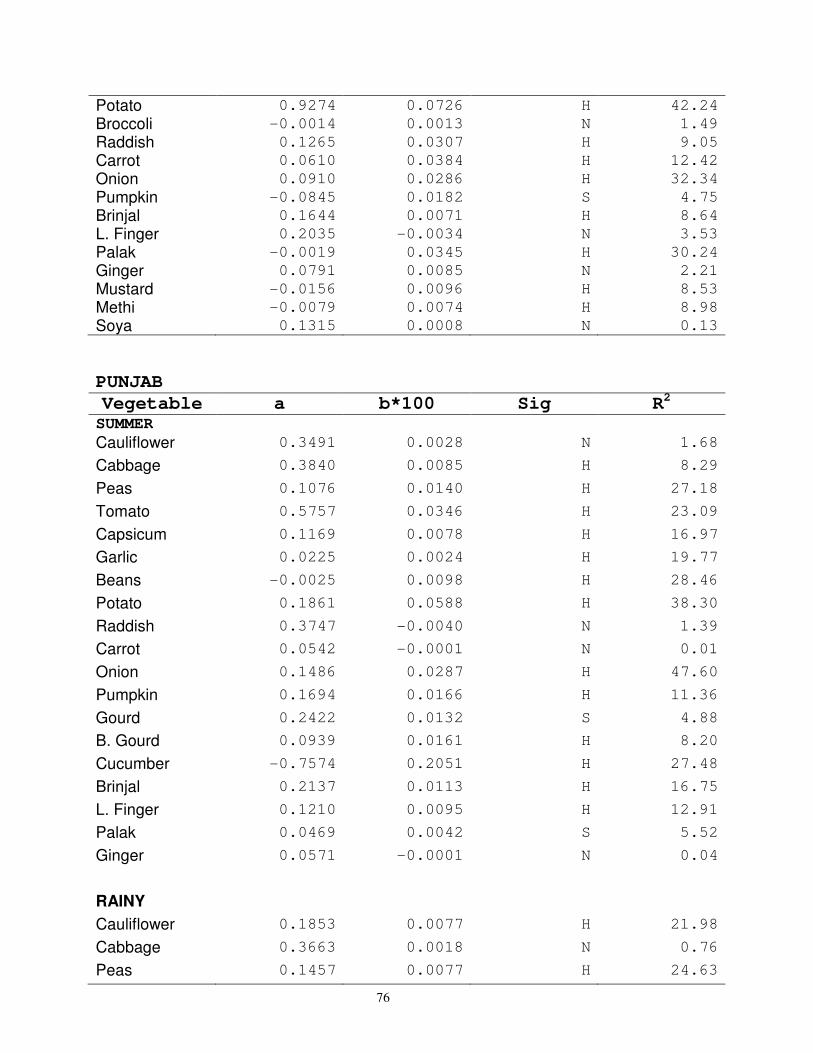
76
Potato 0.9274 0.0726 H 42.24
Broccoli -0.0014 0.0013 N 1.49
Raddish 0.1265 0.0307 H 9.05
Carrot 0.0610 0.0384 H 12.42
Onion 0.0910 0.0286 H 32.34
Pumpkin -0.0845 0.0182 S 4.75
Brinjal 0.1644 0.0071 H 8.64
L. Finger 0.2035 -0.0034 N 3.53
Palak -0.0019 0.0345 H 30.24
Ginger 0.0791 0.0085 N 2.21
Mustard -0.0156 0.0096 H 8.53
Methi -0.0079 0.0074 H 8.98
Soya 0.1315 0.0008 N 0.13
PUNJAB
Vegetable a b*100 Sig R2
SUMMER
Cauliflower 0.3491 0.0028 N 1.68
Cabbage 0.3840 0.0085 H 8.29
Peas 0.1076 0.0140 H 27.18
Tomato 0.5757 0.0346 H 23.09
Capsicum 0.1169 0.0078 H 16.97
Garlic 0.0225 0.0024 H 19.77
Beans -0.0025 0.0098 H 28.46
Potato 0.1861 0.0588 H 38.30
Raddish 0.3747 -0.0040 N 1.39
Carrot 0.0542 -0.0001 N 0.01
Onion 0.1486 0.0287 H 47.60
Pumpkin 0.1694 0.0166 H 11.36
Gourd 0.2422 0.0132 S 4.88
B. Gourd 0.0939 0.0161 H 8.20
Cucumber -0.7574 0.2051 H 27.48
Brinjal 0.2137 0.0113 H 16.75
L. Finger 0.1210 0.0095 H 12.91
Palak 0.0469 0.0042 S 5.52
Ginger 0.0571 -0.0001 N 0.04
RAINY
Cauliflower 0.1853 0.0077 H 21.98
Cabbage 0.3663 0.0018 N 0.76
Peas 0.1457 0.0077 H 24.63
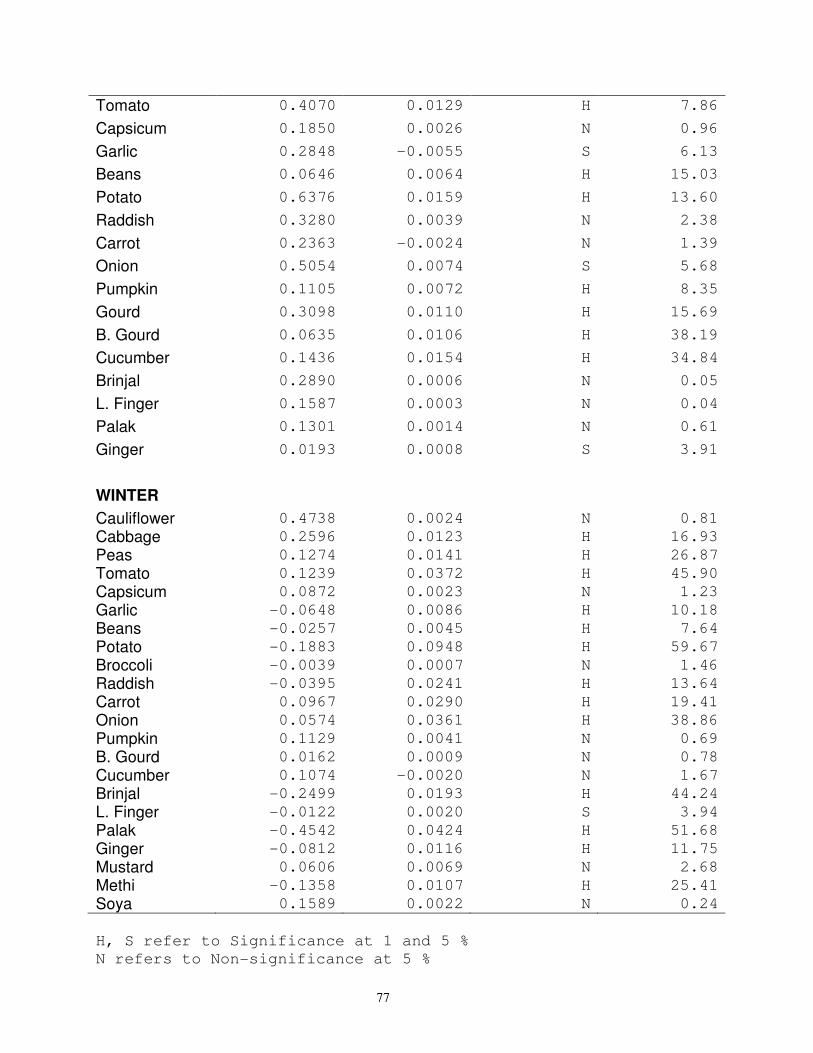
77
Tomato 0.4070 0.0129 H 7.86
Capsicum 0.1850 0.0026 N 0.96
Garlic 0.2848 -0.0055 S 6.13
Beans 0.0646 0.0064 H 15.03
Potato 0.6376 0.0159 H 13.60
Raddish 0.3280 0.0039 N 2.38
Carrot 0.2363 -0.0024 N 1.39
Onion 0.5054 0.0074 S 5.68
Pumpkin 0.1105 0.0072 H 8.35
Gourd 0.3098 0.0110 H 15.69
B. Gourd 0.0635 0.0106 H 38.19
Cucumber 0.1436 0.0154 H 34.84
Brinjal 0.2890 0.0006 N 0.05
L. Finger 0.1587 0.0003 N 0.04
Palak 0.1301 0.0014 N 0.61
Ginger 0.0193 0.0008 S 3.91
WINTER
Cauliflower 0.4738 0.0024 N 0.81
Cabbage 0.2596 0.0123 H 16.93
Peas 0.1274 0.0141 H 26.87
Tomato 0.1239 0.0372 H 45.90
Capsicum 0.0872 0.0023 N 1.23
Garlic -0.0648 0.0086 H 10.18
Beans -0.0257 0.0045 H 7.64
Potato -0.1883 0.0948 H 59.67
Broccoli -0.0039 0.0007 N 1.46
Raddish -0.0395 0.0241 H 13.64
Carrot 0.0967 0.0290 H 19.41
Onion 0.0574 0.0361 H 38.86
Pumpkin 0.1129 0.0041 N 0.69
B. Gourd 0.0162 0.0009 N 0.78
Cucumber 0.1074 -0.0020 N 1.67
Brinjal -0.2499 0.0193 H 44.24
L. Finger -0.0122 0.0020 S 3.94
Palak -0.4542 0.0424 H 51.68
Ginger -0.0812 0.0116 H 11.75
Mustard 0.0606 0.0069 N 2.68
Methi -0.1358 0.0107 H 25.41
Soya 0.1589 0.0022 N 0.24
H, S refer to Significance at 1 and 5 %
N refers to Non-significance at 5 %
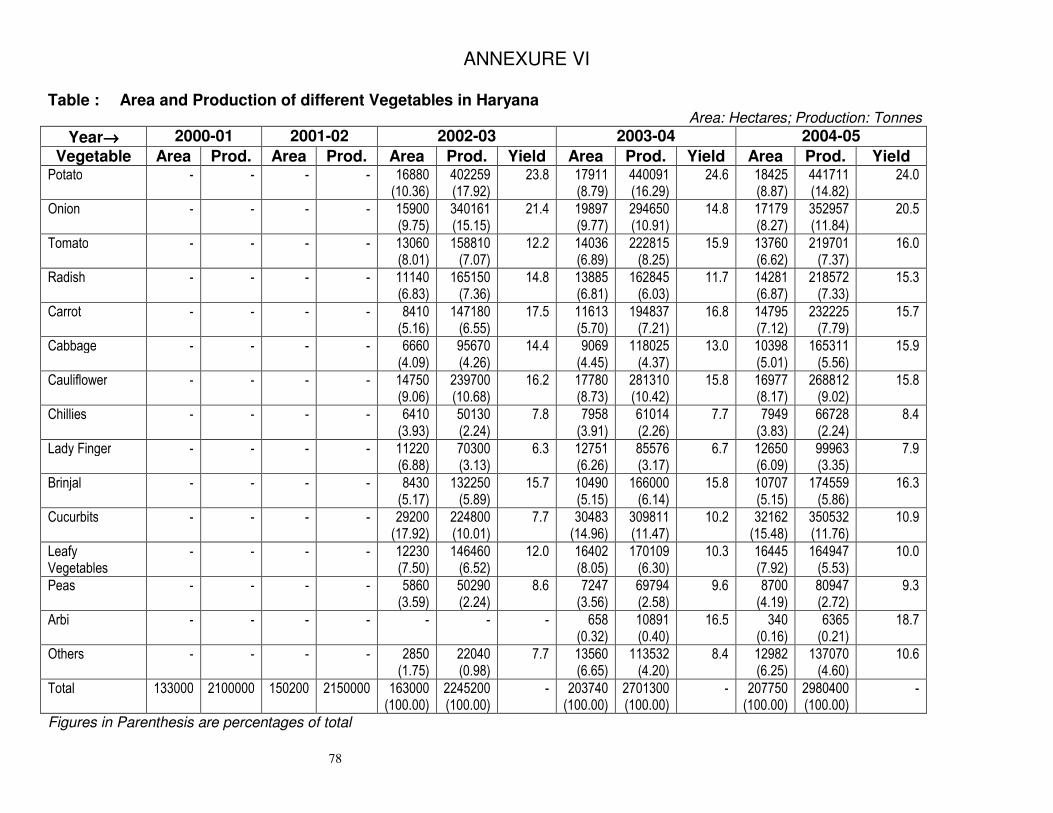
78
ANNEXURE VI
Table : Area and Production of different Vegetables in Haryana Area: Hectares; Production: Tonnes
Year→→→→ 2000-01 2001-02 2002-03 2003-04 2004-05
Vegetable Area Prod. Area Prod. Area Prod. Yield Area Prod. Yield Area Prod. Yield Potato - - - - 16880
(10.36) 402259 (17.92)
23.8 17911 (8.79)
440091 (16.29)
24.6 18425 (8.87)
441711 (14.82)
24.0
Onion - - - - 15900 (9.75)
340161 (15.15)
21.4 19897 (9.77)
294650 (10.91)
14.8 17179 (8.27)
352957 (11.84)
20.5
Tomato - - - - 13060 (8.01)
158810 (7.07)
12.2 14036 (6.89)
222815 (8.25)
15.9 13760 (6.62)
219701 (7.37)
16.0
Radish - - - - 11140 (6.83)
165150 (7.36)
14.8 13885 (6.81)
162845 (6.03)
11.7 14281 (6.87)
218572 (7.33)
15.3
Carrot - - - - 8410 (5.16)
147180 (6.55)
17.5 11613 (5.70)
194837 (7.21)
16.8 14795 (7.12)
232225 (7.79)
15.7
Cabbage - - - - 6660 (4.09)
95670 (4.26)
14.4 9069 (4.45)
118025 (4.37)
13.0 10398 (5.01)
165311 (5.56)
15.9
Cauliflower - - - - 14750 (9.06)
239700 (10.68)
16.2 17780 (8.73)
281310 (10.42)
15.8 16977 (8.17)
268812 (9.02)
15.8
Chillies - - - - 6410 (3.93)
50130 (2.24)
7.8 7958 (3.91)
61014 (2.26)
7.7 7949 (3.83)
66728 (2.24)
8.4
Lady Finger - - - - 11220 (6.88)
70300 (3.13)
6.3 12751 (6.26)
85576 (3.17)
6.7 12650 (6.09)
99963 (3.35)
7.9
Brinjal - - - - 8430 (5.17)
132250 (5.89)
15.7 10490 (5.15)
166000 (6.14)
15.8 10707 (5.15)
174559 (5.86)
16.3
Cucurbits - - - - 29200 (17.92)
224800 (10.01)
7.7 30483 (14.96)
309811 (11.47)
10.2 32162 (15.48)
350532 (11.76)
10.9
Leafy Vegetables
- - - - 12230 (7.50)
146460 (6.52)
12.0 16402 (8.05)
170109 (6.30)
10.3 16445 (7.92)
164947 (5.53)
10.0
Peas - - - - 5860 (3.59)
50290 (2.24)
8.6 7247 (3.56)
69794 (2.58)
9.6 8700 (4.19)
80947 (2.72)
9.3
Arbi - - - - - - - 658 (0.32)
10891 (0.40)
16.5 340 (0.16)
6365 (0.21)
18.7
Others - - - - 2850 (1.75)
22040 (0.98)
7.7 13560 (6.65)
113532 (4.20)
8.4 12982 (6.25)
137070 (4.60)
10.6
Total 133000 2100000 150200 2150000 163000 (100.00)
2245200 (100.00)
- 203740 (100.00)
2701300 (100.00)
- 207750 (100.00)
2980400 (100.00)
-
Figures in Parenthesis are percentages of total
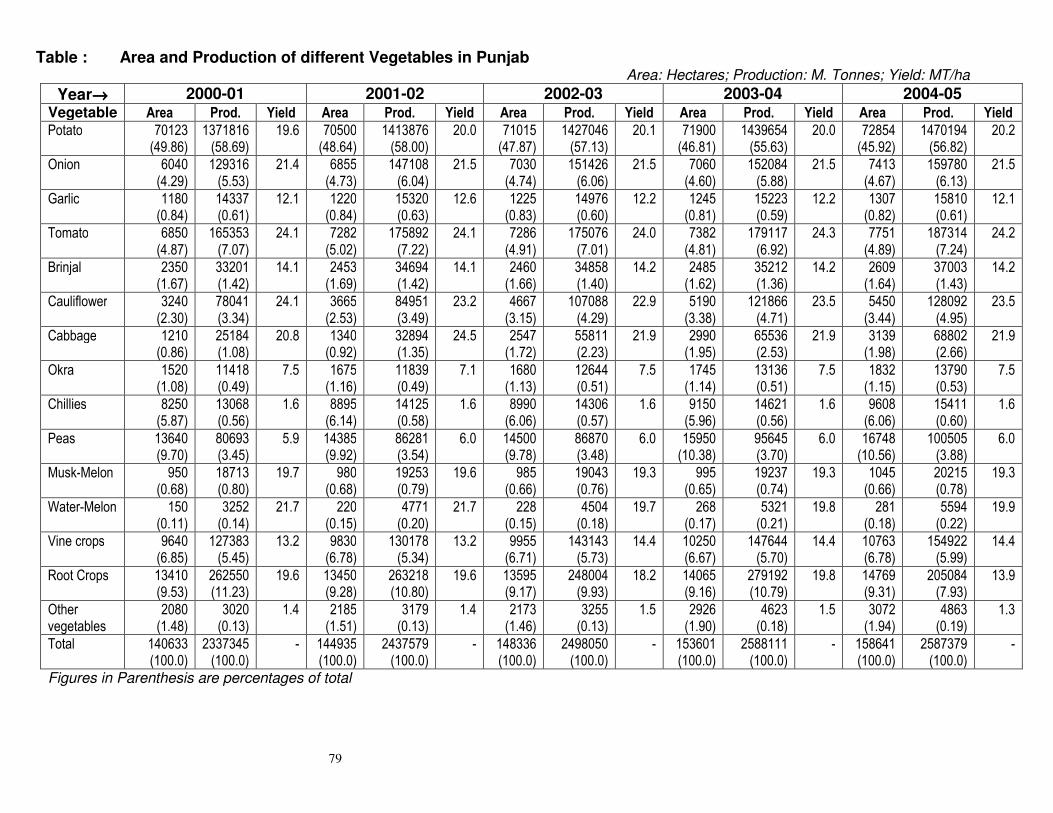
79
Table : Area and Production of different Vegetables in Punjab Area: Hectares; Production: M. Tonnes; Yield: MT/ha
Year→→→→ 2000-01 2001-02 2002-03 2003-04 2004-05 Vegetable Area Prod. Yield Area Prod. Yield Area Prod. Yield Area Prod. Yield Area Prod. Yield
Potato 70123 (49.86)
1371816 (58.69)
19.6 70500 (48.64)
1413876 (58.00)
20.0 71015 (47.87)
1427046 (57.13)
20.1 71900 (46.81)
1439654 (55.63)
20.0 72854 (45.92)
1470194 (56.82)
20.2
Onion 6040 (4.29)
129316 (5.53)
21.4 6855 (4.73)
147108 (6.04)
21.5 7030 (4.74)
151426 (6.06)
21.5 7060 (4.60)
152084 (5.88)
21.5 7413 (4.67)
159780 (6.13)
21.5
Garlic 1180 (0.84)
14337 (0.61)
12.1 1220 (0.84)
15320 (0.63)
12.6 1225 (0.83)
14976 (0.60)
12.2 1245 (0.81)
15223 (0.59)
12.2 1307 (0.82)
15810 (0.61)
12.1
Tomato 6850 (4.87)
165353 (7.07)
24.1 7282 (5.02)
175892 (7.22)
24.1 7286 (4.91)
175076 (7.01)
24.0 7382 (4.81)
179117 (6.92)
24.3 7751 (4.89)
187314 (7.24)
24.2
Brinjal 2350 (1.67)
33201 (1.42)
14.1 2453 (1.69)
34694 (1.42)
14.1 2460 (1.66)
34858 (1.40)
14.2 2485 (1.62)
35212 (1.36)
14.2 2609 (1.64)
37003 (1.43)
14.2
Cauliflower 3240 (2.30)
78041 (3.34)
24.1 3665 (2.53)
84951 (3.49)
23.2 4667 (3.15)
107088 (4.29)
22.9 5190 (3.38)
121866 (4.71)
23.5 5450 (3.44)
128092 (4.95)
23.5
Cabbage 1210 (0.86)
25184 (1.08)
20.8 1340 (0.92)
32894 (1.35)
24.5 2547 (1.72)
55811 (2.23)
21.9 2990 (1.95)
65536 (2.53)
21.9 3139 (1.98)
68802 (2.66)
21.9
Okra 1520 (1.08)
11418 (0.49)
7.5 1675 (1.16)
11839 (0.49)
7.1 1680 (1.13)
12644 (0.51)
7.5 1745 (1.14)
13136 (0.51)
7.5 1832 (1.15)
13790 (0.53)
7.5
Chillies 8250 (5.87)
13068 (0.56)
1.6 8895 (6.14)
14125 (0.58)
1.6 8990 (6.06)
14306 (0.57)
1.6 9150 (5.96)
14621 (0.56)
1.6 9608 (6.06)
15411 (0.60)
1.6
Peas 13640 (9.70)
80693 (3.45)
5.9 14385 (9.92)
86281 (3.54)
6.0 14500 (9.78)
86870 (3.48)
6.0 15950 (10.38)
95645 (3.70)
6.0 16748 (10.56)
100505 (3.88)
6.0
Musk-Melon 950 (0.68)
18713 (0.80)
19.7 980 (0.68)
19253 (0.79)
19.6 985 (0.66)
19043 (0.76)
19.3 995 (0.65)
19237 (0.74)
19.3 1045 (0.66)
20215 (0.78)
19.3
Water-Melon 150 (0.11)
3252 (0.14)
21.7 220 (0.15)
4771 (0.20)
21.7 228 (0.15)
4504 (0.18)
19.7 268 (0.17)
5321 (0.21)
19.8 281 (0.18)
5594 (0.22)
19.9
Vine crops 9640 (6.85)
127383 (5.45)
13.2 9830 (6.78)
130178 (5.34)
13.2 9955 (6.71)
143143 (5.73)
14.4 10250 (6.67)
147644 (5.70)
14.4 10763 (6.78)
154922 (5.99)
14.4
Root Crops 13410 (9.53)
262550 (11.23)
19.6 13450 (9.28)
263218 (10.80)
19.6 13595 (9.17)
248004 (9.93)
18.2 14065 (9.16)
279192 (10.79)
19.8 14769 (9.31)
205084 (7.93)
13.9
Other vegetables
2080 (1.48)
3020 (0.13)
1.4 2185 (1.51)
3179 (0.13)
1.4 2173 (1.46)
3255 (0.13)
1.5 2926 (1.90)
4623 (0.18)
1.5 3072 (1.94)
4863 (0.19)
1.3
Total 140633 (100.0)
2337345 (100.0)
- 144935 (100.0)
2437579 (100.0)
- 148336 (100.0)
2498050 (100.0)
- 153601 (100.0)
2588111 (100.0)
- 158641 (100.0)
2587379 (100.0)
-
Figures in Parenthesis are percentages of total
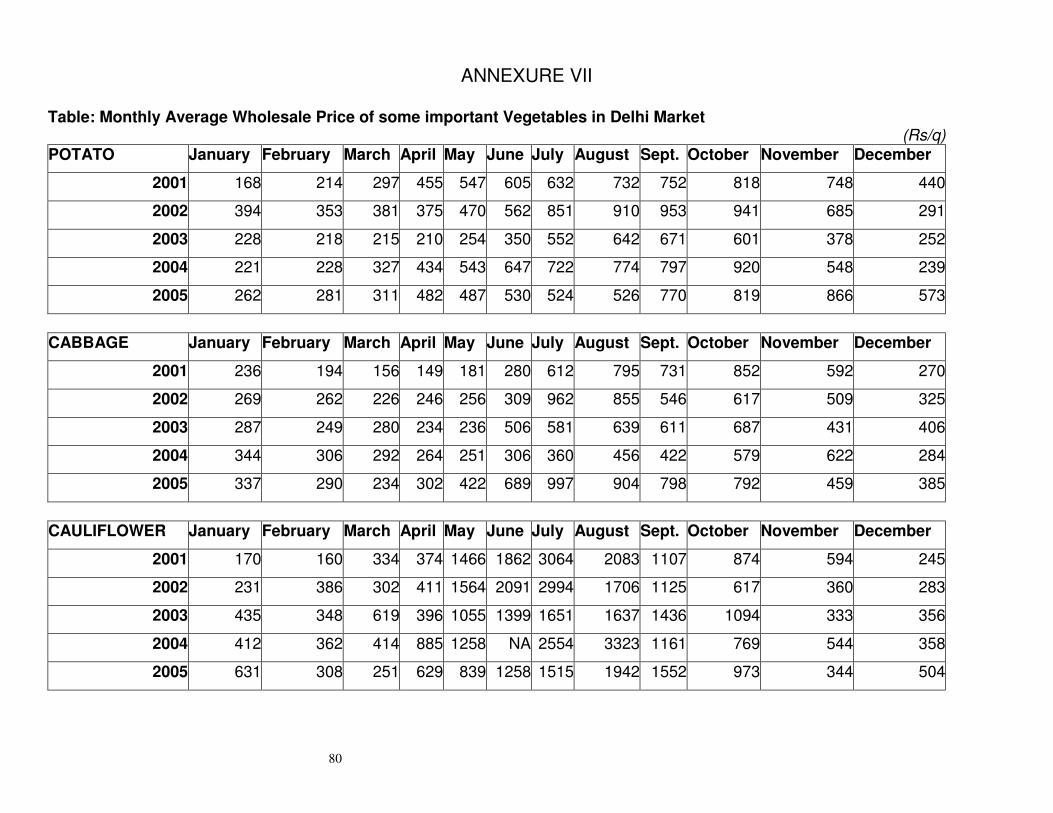
80
ANNEXURE VII Table: Monthly Average Wholesale Price of some important Vegetables in Delhi Market (Rs/q)
POTATO January February March April May June July August Sept. October November December
2001 168 214 297 455 547 605 632 732 752 818 748 440
2002 394 353 381 375 470 562 851 910 953 941 685 291
2003 228 218 215 210 254 350 552 642 671 601 378 252
2004 221 228 327 434 543 647 722 774 797 920 548 239
2005 262 281 311 482 487 530 524 526 770 819 866 573
CABBAGE January February March April May June July August Sept. October November December
2001 236 194 156 149 181 280 612 795 731 852 592 270
2002 269 262 226 246 256 309 962 855 546 617 509 325
2003 287 249 280 234 236 506 581 639 611 687 431 406
2004 344 306 292 264 251 306 360 456 422 579 622 284
2005 337 290 234 302 422 689 997 904 798 792 459 385
CAULIFLOWER January February March April May June July August Sept. October November December
2001 170 160 334 374 1466 1862 3064 2083 1107 874 594 245
2002 231 386 302 411 1564 2091 2994 1706 1125 617 360 283
2003 435 348 619 396 1055 1399 1651 1637 1436 1094 333 356
2004 412 362 414 885 1258 NA 2554 3323 1161 769 544 358
2005 631 308 251 629 839 1258 1515 1942 1552 973 344 504
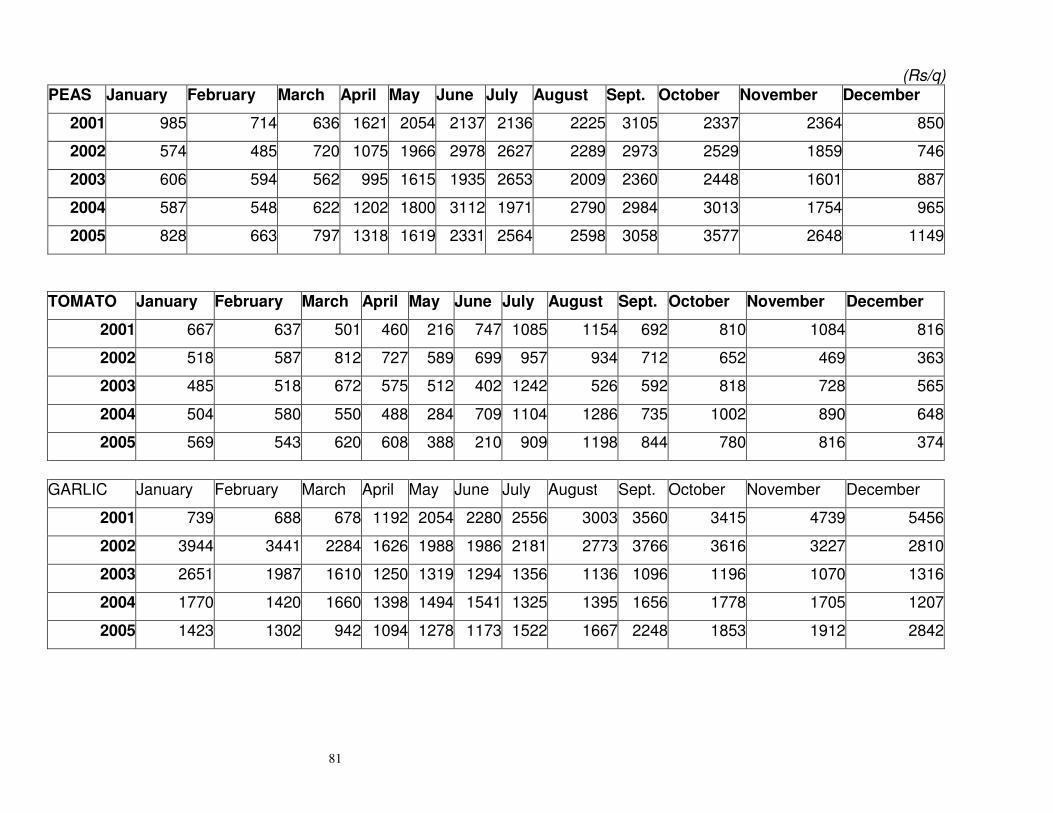
81
(Rs/q)
PEAS January February March April May June July August Sept. October November December
2001 985 714 636 1621 2054 2137 2136 2225 3105 2337 2364 850
2002 574 485 720 1075 1966 2978 2627 2289 2973 2529 1859 746
2003 606 594 562 995 1615 1935 2653 2009 2360 2448 1601 887
2004 587 548 622 1202 1800 3112 1971 2790 2984 3013 1754 965
2005 828 663 797 1318 1619 2331 2564 2598 3058 3577 2648 1149
TOMATO January February March April May June July August Sept. October November December
2001 667 637 501 460 216 747 1085 1154 692 810 1084 816
2002 518 587 812 727 589 699 957 934 712 652 469 363
2003 485 518 672 575 512 402 1242 526 592 818 728 565
2004 504 580 550 488 284 709 1104 1286 735 1002 890 648
2005 569 543 620 608 388 210 909 1198 844 780 816 374
GARLIC January February March April May June July August Sept. October November December
2001 739 688 678 1192 2054 2280 2556 3003 3560 3415 4739 5456
2002 3944 3441 2284 1626 1988 1986 2181 2773 3766 3616 3227 2810
2003 2651 1987 1610 1250 1319 1294 1356 1136 1096 1196 1070 1316
2004 1770 1420 1660 1398 1494 1541 1325 1395 1656 1778 1705 1207
2005 1423 1302 942 1094 1278 1173 1522 1667 2248 1853 1912 2842
82
BIBLIOGRAPHY Indian Horticulture Database. 2004. National Horticulture Bulletin, Ministry of
Agriculture, Govt. of India Kumar, R. 1991. Marketing of Vegetables in Solan District of Himachal Pradesh. Ph. D.
dissertation. Department of Agricultural Economics, HPKV, Palampur (Unpublished)
Lal, Harbans, D.S. Thakur and K.D. Sharma. 1997. Determinants of Market Supply of
Vegetables from Himachal Pradesh. Agricultural Marketing, 39(4): pp 35-37 Mehta, P and Chauhan, S.K. 1996. Marketed Surplus of Vegetables in Himachal
Pradesh. The Bihar Journal of Agricultural Marketing, 4(4): pp 361-368 Monthly Horticulture Bulletin. Various Issues, National Horticulture Bulletin, Ministry of
Agriculture, Govt. of India Shanmugasundaram, S. 2004, Surmountable Challenges. The Hindu Survey of Indian
Agriculture, pp 126-127 Sharma, K.D. A.S. Saini and D.S. Thakur, 1993. Marketing of Agricultural Products in
Himachal Pradesh, Agricultural Marketing, 32(2): pp 227-242 Singh, Ranveer, R.S. Rattan and J.P. Bhati. 2000. Technological Changes in Marketing
of Hill Farm Products: A Study of Himachal Pradesh. Indian Journal of Agricultural Marketing, Conf. Special, 14(3): pp 63-71
Singh, Ranveer, Tulsi Raman Sharma and Kavita Sharma. 1994. Production and
Marketing of Hill Vegetables- A Study of Himachal Pradesh. Agricultural Marketing, 37(2): pp 23-27
Related Documents