http://jtr.sagepub.com/ Journal of Travel Research http://jtr.sagepub.com/content/51/4/388 The online version of this article can be found at: DOI: 10.1177/0047287511426337 2012 51: 388 originally published online 23 December 2011 Journal of Travel Research A. George Assaf and Alexander Josiassen Identifying and Ranking the Determinants of Tourism Performance: A Global Investigation Published by: http://www.sagepublications.com On behalf of: Travel and Tourism Research Association can be found at: Journal of Travel Research Additional services and information for http://jtr.sagepub.com/cgi/alerts Email Alerts: http://jtr.sagepub.com/subscriptions Subscriptions: http://www.sagepub.com/journalsReprints.nav Reprints: http://www.sagepub.com/journalsPermissions.nav Permissions: http://jtr.sagepub.com/content/51/4/388.refs.html Citations: What is This? - Dec 23, 2011 OnlineFirst Version of Record - Feb 27, 2012 OnlineFirst Version of Record - Jun 6, 2012 Version of Record >> at Copenhagen Business School on September 22, 2014 jtr.sagepub.com Downloaded from at Copenhagen Business School on September 22, 2014 jtr.sagepub.com Downloaded from

Welcome message from author
This document is posted to help you gain knowledge. Please leave a comment to let me know what you think about it! Share it to your friends and learn new things together.
Transcript

http://jtr.sagepub.com/Journal of Travel Research
http://jtr.sagepub.com/content/51/4/388The online version of this article can be found at:
DOI: 10.1177/0047287511426337 2012 51: 388 originally published online 23 December 2011Journal of Travel Research
A. George Assaf and Alexander JosiassenIdentifying and Ranking the Determinants of Tourism Performance: A Global Investigation
Published by:
http://www.sagepublications.com
On behalf of:
Travel and Tourism Research Association
can be found at:Journal of Travel ResearchAdditional services and information for
http://jtr.sagepub.com/cgi/alertsEmail Alerts:
http://jtr.sagepub.com/subscriptionsSubscriptions:
http://www.sagepub.com/journalsReprints.navReprints:
http://www.sagepub.com/journalsPermissions.navPermissions:
http://jtr.sagepub.com/content/51/4/388.refs.htmlCitations:
What is This?
- Dec 23, 2011OnlineFirst Version of Record
- Feb 27, 2012OnlineFirst Version of Record
- Jun 6, 2012Version of Record >>
at Copenhagen Business School on September 22, 2014jtr.sagepub.comDownloaded from at Copenhagen Business School on September 22, 2014jtr.sagepub.comDownloaded from
Journal of Travel Research51(4) 388 –399© 2012 SAGE PublicationsReprints and permission: sagepub.com/journalsPermissions.navDOI: 10.1177/0047287511426337http://jtr.sagepub.com
Introduction
Tourism is considered one of the most important export industries (Yong, Keng, and Leng 1993; Shahin and Dabestani 2010) and it has been both a cause and beneficiary of the prolonged period of economic growth seen in recent decades. Given its growing economic and social importance, stakeholders are now interested in determining what drives the performance in the industry.1 Performance improve-ments can substantially contribute to the success of strategic plans for destination development. The rapid growth of the industry has gone hand in hand with increasing diversifica-tion and competition among (in particular neighboring) destinations (Ritchie and Crouch 2003; Dwyer and Kim 2003; Enright and Newton 2005; IBISWorld 2009). Consumer sophistication has also increased because of the rapid growth of the Internet and the range of tourism prod-ucts and destinations on offer. Further challenges that have resulted from the global financial crisis, such as the decrease in international travel and the widespread security and safety fears, have also pushed destinations to focus more on improving the performance of their tourism industry.
The purpose of this study is to identify the key factors or determinants that contribute to industry performance. There is a need in the literature for a study that identifies the
determinants of tourism performance and ranks their relative importance (Crouch and Ritchie 1999, 2005; Blanke and Chiesa 2009). Across most industries, developing an under-standing of the determinants behind superior performance has been an ongoing quest of managers and scholars who deal with strategy (Durand and Vargas 2003; Delmas, Russo, and Montes-Sancho 2007). In fact, it is the analysis of per-formance and its determinants that drive most studies in the strategy literature (Venkatraman and Ramanujam 1986).
So far, the focus in the tourism literature has been on ana-lyzing the competitiveness2 of the international tourism industry (Crouch and Ritchie 1999, 2005). Private organiza-tions also rank international tourism competitiveness using the tourism competitive index, or tourism satellite accounts. However, none of the existing studies test which determi-nants affect tourism performance (Fuchs, Peters, and Weiermair 2002; Wöber and Fesenmaier 2004; Cracolici,
426337 JTRXXX10.1177/0047287511426337Assaf and JosiassenJournal of Travel Research
1University of Massachusetts–Amherst, MA, USA2Department of Marketing, Copenhagen Business School, Copenhagen, Denmark
Corresponding Author:A. George Assaf, Isenberg School of Management, 90 Campus Center Way, 209 A Flint Lab, University of Massachusetts, Amherst, MA 01003 Email: [email protected]
Identifying and Ranking the Determinants of Tourism Performance: A Global Investigation
A. George Assaf1 and Alexander Josiassen2
Abstract
After a prolonged period of growth, driven, in part, by an increasing number of affluent consumers, the international tourism industry is now suffering the effects of a weaker world economy. These tougher market conditions have, in turn, led to increasing competition. As a result, countries, their tourism industries, and tourism businesses seek to improve the performance of the tourism industry and its constituents by vigorously promoting themselves to international tourists, cutting costs, and identifying synergies in their tourism endeavors. In seeking to improve the tourism industry, the determinants that affect tourism performance are of key interest to the stakeholders. A key obstacle toward improving performance is the multitude of determinants that can affect tourism performance. The literature has yet to provide concrete insights into the determinants of tourism performance and their relative importance. The present study addresses this important gap. We identify and rank the determinants of tourism performance. We also provide performance measures of international tourism destinations. The results are derived using the Data Envelopment Analysis (DEA) and bootstrap truncated regression models. The study also discusses the implications of the findings and highlights their importance to both the academic literature and the international tourism industry.
Keywords
tourism industry, performance determinants, destination ranking, DEA
at Copenhagen Business School on September 22, 2014jtr.sagepub.comDownloaded from

Assaf and Josiassen 389
Nijkamp, and Rietveld 2006). Even studies on tourism com-petitiveness (Crouch and Ritchie 1999, 2005; Assaf, Barros, and Josiassen, forthcoming) emphasize that ranking destina-tions should be based not solely on their competitive advan-tage but also on their actual tourism performance.
The present research aims to extend the literature in three ways: First, we aim to identify the determinants of tourism performance. Second, we aim to rank these deter-minants based on their degree of contribution to tourism performance. Finally, we aim to develop a global perfor-mance index that can be used to assess and rank the tourism performance of countries. Our sample involves countries from all around the world. We use a two-step estimation procedure. First, we develop the tourism performance index with the Data Envelopment Analysis (DEA) boot-strap methodology (Simar and Wilson 2007). Then, we assess how this index varies with the different determinants of tourism performance.
The remainder of the article is organized as follows: First, we present the research design and analysis. Then, we elabo-rate on the methods and the data. Third, we present the results, and finally we discuss the main findings and provide directions for future studies.
Research Design and AnalysisIdentification of the Determinants of Tourism Performance
In an initial step, we developed a list of determinants with the potential to affect tourism performance. The list was
informed by two sources: (1) literature review and (2) expert opinions from the industry. As stated above, the existing literature (academic and industry) does not provide a com-prehensive list of determinants that drive tourism perfor-mance. We were able to adapt some determinants from related literature streams such as the competitiveness litera-ture (Crouch and Ritchie 1999). The literature suggests that “starting with categories identified in the literature” (Srnka and Koeszegi 2007, p. 37) is useful in the process of catego-rizing such qualitative data. Specifically, we developed an initial classification on the basis of an interdisciplinary lit-erature review (e.g., Crouch and Ritchie 1999). The classifi-cation that was based on the academic and industry literatures yielded six broad drivers of tourism performance. Each driver includes a set of determinants that are potential sources of tourism performance.
In light of the paucity of research in the area, we followed up with in-depth interviews to support the research purpose at hand. We conducted 45-minute in-depth interviews (Kvale 1996) with seven experts in international tourism. Semistructured interview guides (Marschan-Piekkari and Welch 2004) were developed, which enabled the interview-ers to adapt to each respondent and explore respondents’ answers in detail (Patton 1990). The respondents mentioned a total of 30 determinants underlying tourism performance, which we subsequently analyzed for content. The set of determinants identified by the respondents closely over-lapped the set identified in the literature review and also led to the development of two new drivers. Overall, we ended up with eight drivers, listed in Table 1. The following section elaborates in detail each of the drivers.
Table 1. Drivers of Tourism Performance
1st Driver: Tourism and Related Infrastructure Number of hotel rooms Number of five- and four-star hotels Number of operating airlines Airport density Quality of airline services Quality of airport services
2nd Driver: Economic Conditions Unemployment rate GDP per capita Government expenditures on the tourism industry
3rd Driver: Security, Safety, and Health Crime rate Number of hospital beds Corruption index HIV/AIDS
4th Driver: Tourism Price levels Ticket prices Fuel price levels Hotel price index
5th Driver: Government Policies Visa requirements Openness of bilateral air service agreements Time required to start a business
6th Driver: Environmental Sustainability Carbon dioxide emissions (Co2) per capita Environmental performance Stringency of environmental regulation in the tourism industry
7th Driver: Labor Skills and Training Education Index of the country Level of staff training in the industry Service-mindedness of employees toward tourists
8th Driver: Natural and Cultural Resources Number of World Heritage natural attractions Protected areas Number of World Heritage cultural sites Number of international fairs and exhibitions Creative industries exports
at Copenhagen Business School on September 22, 2014jtr.sagepub.comDownloaded from

390 Journal of Travel Research 51(4)
Drivers of Tourism Performance
Thus, our classification scheme comprises eight broad driv-ers of tourism performance. Each driver is composed of several determinants that can affect tourism performance. We briefly discuss these drivers on the basis of both the relevant literature and exemplary statements from the qualitative study.
Driver 1—Tourism and related infrastructure. A number of authors have cited the infrastructure base of a country as a source of tourism attractiveness (Khadaroo and Seetanah 2007). There is also a positive link between the size and quality of tourism transportation resources (ICT, ports, roads, airport, and railroads) and the intention of a visitor to return to a certain destination (Faulkner, Oppermann, and Fredline 1999; Berli and Martín 2004). Areas with poor infra-structure frequently have low-quality tourism and might be unable to meet the demand in high seasons (Briassoulis 2002).
Most of the experts in our interviews argued that this driver is an important determinant of tourism performance as the ease of tourist movement within the country is affected by the quality of roads, railroads, ports, and airports. The literature also seems to support this argument (Prideaux 2000). In Table 1, we list the items that were identified. They reflect both the size and quality of the infrastructure.
Driver 2—Economic conditions. Factors related to the eco-nomic development and stability such as employment, and income levels have been found to be strong determinants of performance across several industries (Li 1997; Sun, Hone, and Doucouliago 2003). Tourism also seems to be sensitive to economic growth and macro-economic stability (Naude and Saayman 2005). Several experts in our interviews stressed the importance of basic economic conditions to the success of the tourism industry and its actors. Supporting this view, a number of studies have found significant differ-ences in tourism development between developed and devel-oping economies (Jenkins and Henry 1982; Tosun 2001). A strong economy can encourage more foreign investments in the industry, and it also enables more government support.
Driver 3—Security, safety and health. Research indicates that security and safety levels influence tourism demand (Harper 2001; George 2003). Studies on return visitation also indicate that tourists are likely to be deterred from traveling or return-ing to dangerous countries or regions that have security prob-lems (Alegre and Cladera 2006). For instance, when the tragic events of September 11 occurred, international tourism was greatly affected and travelers cancelled planned visits across the world due to perceptions of increased risk (Akama and Mukethe Kieti 2003). One of the experts in our interviews mentioned that “almost regardless of other promotion efforts, tourists actively avoid destinations with high crime rates.”
The ease or difficulty of access to improved health and hygiene resources can also impact tourism demand (Cossens and Gin 1994; Carter 1998). Tourists want to feel safe and comfortable when they are at a destination. This issue
became particularly important following recent scares such as SARS, bird flu, and H1N1 flu which pushed several gov-ernments to focus on the health risks associated with travel and tourism.
Driver 4—Tourism price competitiveness. It is widely accepted that the number of tourists is strongly affected by the price competitiveness of a particular destination. This issue is also widely established in the economic literature, which argues that tourism demand is relatively responsive to price factors. When selecting a destination, tourists consider the price to get to the destination and the cost of living at the origin relative to substitute destinations (Dwyer, Forsyth, and Rao 2000). The intention to return to a destination can also be affected by the prices experienced by tourists in their previous visits (Barros and Machado 2010). In our inter-views, the experts often mentioned price as an important determinant of the willingness to visit.
It is possible to argue that the determinants identified by the respondents are important indicators of price competi-tiveness. For instance, when exchange rate rises, the tourism price competitiveness falls. Fuel price, ticket price, and hotel price are also important determinants of tourism expendi-tures and can affect the tourist’s choice of a particular destination.
Driver 5—Government policies. All respondents agreed that government policy and regulation influences the tourism performance of a particular destination and that it is an essential stakeholder in terms of creating the conditions that lead to the development of a successful tourism industry. The literature seems to support the argument that govern-ment policies may drive tourism development and may pro-vide a general setting that actively encourages growth and at the same time removes unnecessary restrictions or burdens (Jenkins and Henry 1982; Holden 2003). Effective govern-ment policies would also benefit the industry in terms of attracting international investments, and facilitating the movement of tourists in and out of the country (Crouch and Ritchie 1999). We note that some studies outside the tourism literature also found a positive link between effective gov-ernment policies and industry performance (Jacobsson 1991; Das and Ghosh 2006).
Driver 6—Environmental sustainability. Most experts seem to agree that sustainable tourism development has become a strategic goal for world-class destinations. Major destina-tions are seeking preservation for future generations and exploring sustainable development strategies and techniques. The literature also seems to support the suggestion that envi-ronmentally sustainable destinations can positively affect tourism performance (Andereck et al. 2005). The interviews indicated that tourists exhibit increasing environmental con-scientiousness when shopping for tourist destinations. Gov-ernments are now seeking sustainable tourism development since it is critical to the conservation of the natural environ-ment. Sustainable tourism can also help improving the image of a particular destination (Hassan 2000).
at Copenhagen Business School on September 22, 2014jtr.sagepub.comDownloaded from

Assaf and Josiassen 391
Driver 7—Labor skills and training. It is widely recognized across many industries, including tourism, that superior labor skills is an important source of competitive advantage for business (Bird 1995). Training is also essential in deliv-ering the strategic objectives set by managers in the industry and it plays an important role in improving the knowledge, skills, and abilities of employees within the industry (Blake, Sinclair, and Soria 2006).
It became clear during our interviews that the service level that tourists perceive is an important determinant. Some tourists simply would not even consider visiting a country that they perceive as having a poor level of service mindedness. The tourism industry is a perfect context for the consideration of skills in services. Although technology has replaced labor skills in the transformation of inputs in some industries, it has not eliminated demand for higher order skills within the tourism industry (Baum 2002). Recent stud-ies have shown that tourists are more likely to return to those destinations that provide a higher level of service (Alegre and Cladera 2006).
Driver 8—Natural and cultural resources. It is also possible to argue that the success of tourism destinations is affected by natural and cultural/heritage resources to form their attractions bases (Hassan 2000; Deng, King, and Bauer 2002). The experts highlighted that some destinations “virtu-ally sell themselves.” Australia, for instance, relies heavily on the general quality of its natural assets (Huybers and Bennett 2003), which includes some World Heritage listed
natural attractions such as the Great Barrier Reef and Wet Tropics Rainforests—as well as the general scenic land-scapes and natural areas.
Recent literature on destination choice discusses that many tourists consider natural attractions as essential drivers behind the selection of a destination (Buhalis 2000). The respondents also emphasized that the volume of creative industries in a particular destination (e.g., art, crafts, design, fashion, film, music, performing arts) is becoming a major source of attraction for tourists. Figure 1 illustrates the pro-posed framework.
MethodsPerformance Estimation
We obtain performance measures in this study using the Data Envelopment Analysis (DEA) methodology (Banker, Charnes, and Cooper 1984). DEA uses linear programming to convert multiple input and output measures into a single measure of relative performance for each observation. It basically identifies a benchmark frontier, which consists of the best-performing firms (or countries in our case). If a firm is not on the frontier, its radial distance from the frontier is a measure of its inefficiency in performance. The firms with maximum performance (100% efficient) are those for which no other firms or linear combination of firms can generate at least the same amount of each output (given inputs).
Gov. expenditure
GDP per Capita
Unemployment rate
Number top hotels
Number of airlines
Airline serv. qual.
Airport serv. qual.
Hotel rooms
Airport density Tourism Performance
Economic Conditions
Infrastructure
Creative Industries
Natural Attractions
Cultural Attractions
Protected Areas
Fairs and Exhibitions
Natural and Cultural Resources
Crime rate
Corruption index
HIV/AIDSSecurity, Safety, andHealth
Ticket Prices
Fuel Prices
Hotel Prices
Tourism Price Level
Visa Requirements
Start-up Time
Air Service agreements
Government Policies
CO2 Emissions
Env. Regulations
Env. Performance
EnvironmentalSustainability
Service mindedness
Staff Training
General Education
Labour Skills and Training
Number Hotel Beds
Figure 1. The proposed framework
at Copenhagen Business School on September 22, 2014jtr.sagepub.comDownloaded from

392 Journal of Travel Research 51(4)
A DEA performance measure (δˆi) can be simply derived
by solving the following linear programming:
δˆi = max
δi, λ {δ > 0 │ δˆ
i y
i ≤
∑
n
i = 1 y
i λ; x
i ≥
∑
n
i = 1 x
i λ; ∑
n
i = 1 λ = 1; λ ≥0}, i =1….n (1)
where yi is vector of outputs, x
i is s vector of inputs, λ is
a I × 1 vector of constants. The value of δˆi obtained is the
performance score for the tourism industry of the ith country. A measure of δˆ
i=1 indicates that a tourism industry is fully
efficient (i.e., has achieved maximum performance), and in-efficient (i.e., less than maximum performance) if δˆ
i< 1. This
linear programming problem must be solved n times, once for each country in the sample. Note that the DEA model can also be estimated using either the constant returns to scale (CRS)3 or variable returns to scale (VRS) assumptions and the shape of the frontier will differ depending on the scale as-sumptions that underline the model. In this paper we mainly rely on the VRS assumption, since it has the advantage of ensuring that an inefficient firm is only compared against those firm of similar size.
Truncated Regression ModelThe next step in the analysis is to estimate the impact of the determinants on tourism performance. DEA performance measures are truncated from below at one, and thus a trun-cated regression model is more suited for the present con-text, since OLS regression could predict scores greater than 1, and as such produce biased and inconsistent param-eter estimates. The model can be simply expressed as
δˆi = z
iβ + ξ
i, (2)
where δˆi the DEA performance score, z
i is vector of
explanatory variables that are used to test our desired hypoth-eses, β is a vector of parameters, and ξ
i is random error rep-
resenting statistical noise and independent of zi.
As the performance scores generated by DEA are strongly dependent on each other in the statistical sense, using them in a second-stage regression (as identified in Equation 2) might violate the basic model assumption required by regression.
To address this problem, we use here the bootstrap procedure of Simar and Wilson (2007). We describe in Appendix A the bootstrap algorithm.
DataIn order to address our research questions, we first needed input and output data to measure tourism performance. As stated above, the advantage of the DEA method is that it allows the inclusion of multiple inputs and outputs. We dis-tinguish between three types of inputs and four types of outputs. On the inputs side, we use the number of employees working in the tourism industry, the capital investments made by governments on the tourism industry in a particular year, and the total number of accommodation establishments available in a particular country for a particular year. On the outputs side,4 we use the total number of international tour-ists, the total number of domestic tourists, the average length of stay of international tourists, and the average length of stay of domestic tourists. All these variables are well recog-nized as important and critical inputs and outputs variables for the tourism industry (Fuchs, Peters, and Weiermair 2002; Bosetti et al. 2006; Cracolici, Nijkamp, and Rietveld 2006).
To construct the database on the above inputs and outputs, we used several sources, including the World Tourism Organization, Euromonitor database, tourism satellite accounts of some countries, as well as Eurostat database. Our final sample consisted of 120 countries located in Africa, the Americas, Asia, Europe, and Oceania, for the period 2005-2008 (120 × 4 = 480 observations). We present in Table 2 the countries included in the study. Note that the inclusion of more countries was not possible because of data unavailability.
We used many sources to collect data on the different determinants that form the drivers of tourism performance identified in Table 1. These include the World Bank, World Economic Forum, United Nations Office on Drugs and Crime, World Health Organization, Booz and Company, Transparency International, International Energy Agency, International Air Transport Association, Deloitte, Euromonitor, Skytrax, Eurostat database, and Penn World Table. We pro-vide more details in Appendix B about the model specifica-tion and the units of measurement of each of the identified determinants.
Table 2. Countries Included in the Study
Switzerland, Austria, Germany, Iceland, United States, Hong Kong SAR, Canada, Singapore, Luxembourg, United Kingdom, Denmark, France, Australia, New Zealand, Spain, Finland, Sweden, United Arab Emirates, Netherlands, Cyprus, Belgium, Portugal, Norway, Greece, Japan, Malta, Ireland, Estonia, Barbados, Taiwan, Malaysia, Israel, Italy, Tunisia, Czech Republic, Qatar, Slovak Republic, Croatia, Mauritius, Hungary, Costa Rica, Korea, Rep, Thailand, Slovenia, Chile, Jordan, Bahrain, Jamaica, Mexico, Dominican Republic, Lithuania, Turkey, Latvia, Bulgaria, Panama, Uruguay, Morocco, Egypt, Brazil, Indonesia, Serbia and Montenegro, South Africa, Poland, Argentina, India, Georgia, Kuwait, Russian Federation, Guatemala, Botswana, China, Colombia, Namibia, Armenia, Azerbaijan, Romania, El Salvador, Ukraine, Sri Lanka, Tanzania, Peru, Kazakhstan, Macedonia, Gambia, Trinidad and Tobago, Philippines, Vietnam, Honduras, Nicaragua, Albania, Algeria, Zambia, Moldova, Cambodia, Ecuador, Kenya, Venezuela, Guyana, Uganda, Pakistan, Bosnia and Herzegovina, Mali, Nepal, Zimbabwe, Bolivia, Tajikistan, Paraguay, Madagascar, Burkina Faso, Malawi, Nigeria, Benin, Ethiopia, Cameroon, Mozambique, Bangladesh, Lesotho, Angola, Burundi, Chad.
at Copenhagen Business School on September 22, 2014jtr.sagepub.comDownloaded from
Assaf and Josiassen 393
Results
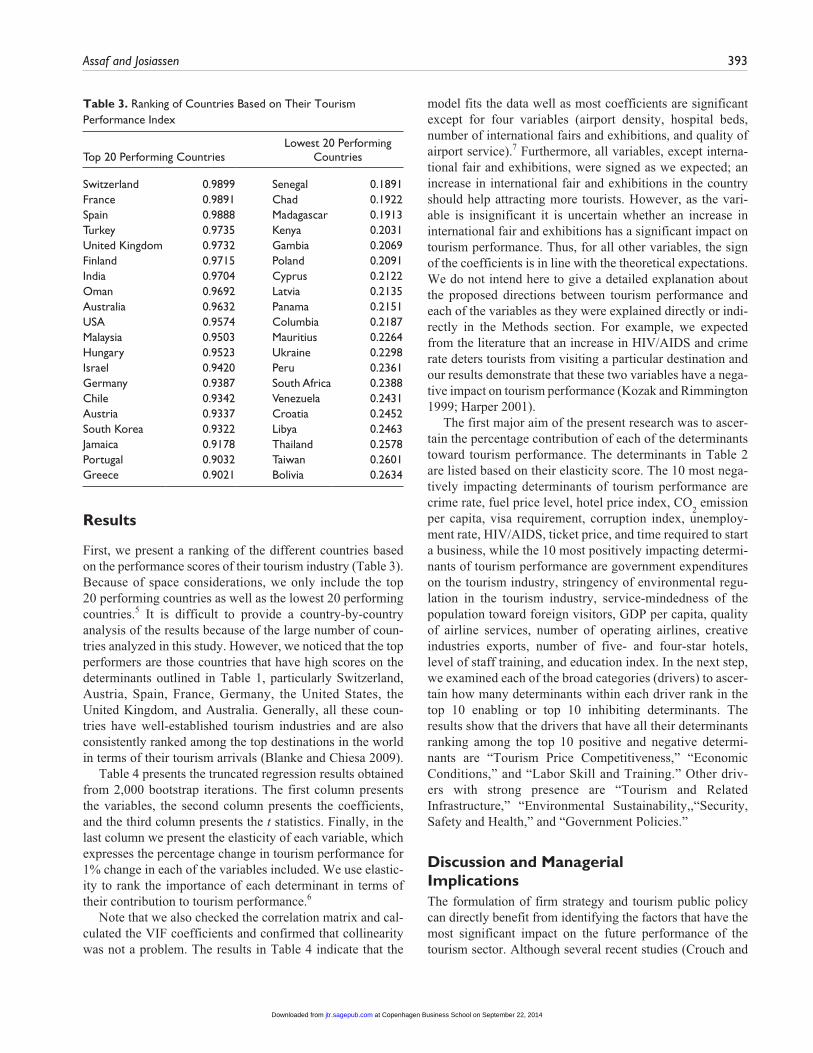
First, we present a ranking of the different countries based on the performance scores of their tourism industry (Table 3). Because of space considerations, we only include the top 20 performing countries as well as the lowest 20 performing countries.5 It is difficult to provide a country-by-country analysis of the results because of the large number of coun-tries analyzed in this study. However, we noticed that the top performers are those countries that have high scores on the determinants outlined in Table 1, particularly Switzerland, Austria, Spain, France, Germany, the United States, the United Kingdom, and Australia. Generally, all these coun-tries have well-established tourism industries and are also consistently ranked among the top destinations in the world in terms of their tourism arrivals (Blanke and Chiesa 2009).
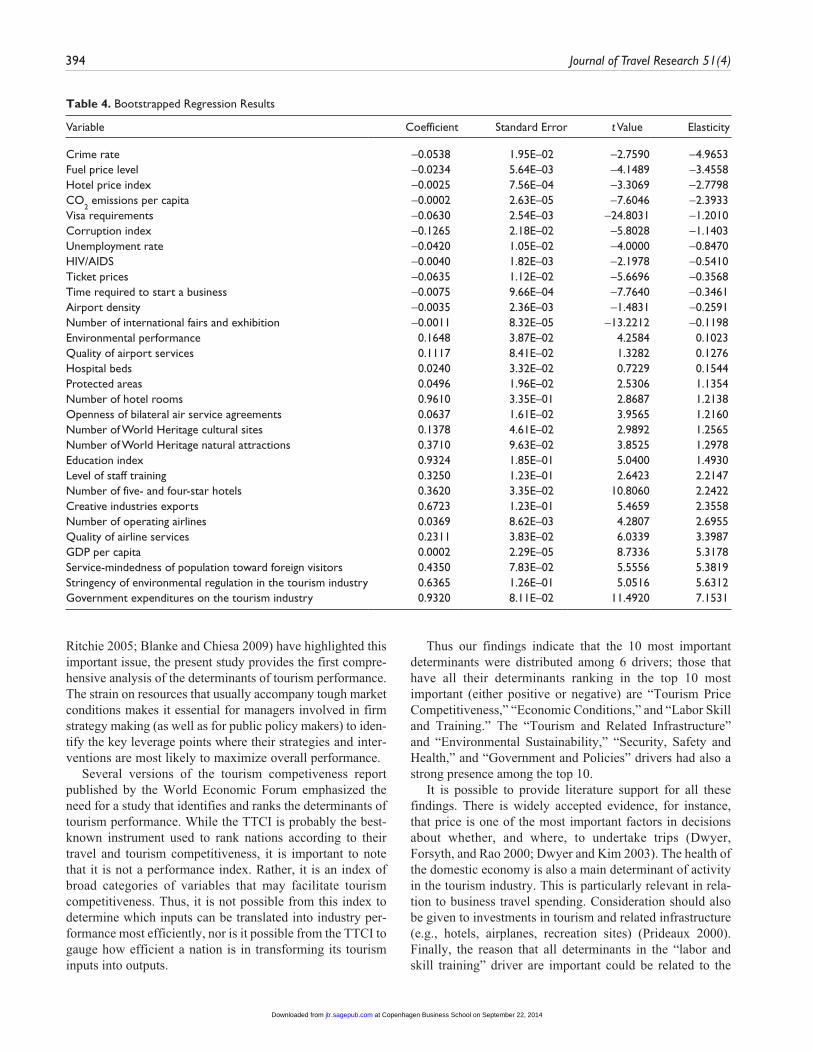
Table 4 presents the truncated regression results obtained from 2,000 bootstrap iterations. The first column presents the variables, the second column presents the coefficients, and the third column presents the t statistics. Finally, in the last column we present the elasticity of each variable, which expresses the percentage change in tourism performance for 1% change in each of the variables included. We use elastic-ity to rank the importance of each determinant in terms of their contribution to tourism performance.6
Note that we also checked the correlation matrix and cal-culated the VIF coefficients and confirmed that collinearity was not a problem. The results in Table 4 indicate that the
model fits the data well as most coefficients are significant except for four variables (airport density, hospital beds, number of international fairs and exhibitions, and quality of airport service).7 Furthermore, all variables, except interna-tional fair and exhibitions, were signed as we expected; an increase in international fair and exhibitions in the country should help attracting more tourists. However, as the vari-able is insignificant it is uncertain whether an increase in international fair and exhibitions has a significant impact on tourism performance. Thus, for all other variables, the sign of the coefficients is in line with the theoretical expectations. We do not intend here to give a detailed explanation about the proposed directions between tourism performance and each of the variables as they were explained directly or indi-rectly in the Methods section. For example, we expected from the literature that an increase in HIV/AIDS and crime rate deters tourists from visiting a particular destination and our results demonstrate that these two variables have a nega-tive impact on tourism performance (Kozak and Rimmington 1999; Harper 2001).
The first major aim of the present research was to ascer-tain the percentage contribution of each of the determinants toward tourism performance. The determinants in Table 2 are listed based on their elasticity score. The 10 most nega-tively impacting determinants of tourism performance are crime rate, fuel price level, hotel price index, CO
2 emission
per capita, visa requirement, corruption index, unemploy-ment rate, HIV/AIDS, ticket price, and time required to start a business, while the 10 most positively impacting determi-nants of tourism performance are government expenditures on the tourism industry, stringency of environmental regu-lation in the tourism industry, service-mindedness of the population toward foreign visitors, GDP per capita, quality of airline services, number of operating airlines, creative industries exports, number of five- and four-star hotels, level of staff training, and education index. In the next step, we examined each of the broad categories (drivers) to ascer-tain how many determinants within each driver rank in the top 10 enabling or top 10 inhibiting determinants. The results show that the drivers that have all their determinants ranking among the top 10 positive and negative determi-nants are “Tourism Price Competitiveness,” “Economic Conditions,” and “Labor Skill and Training.” Other driv-ers with strong presence are “Tourism and Related Infrastructure,” “Environmental Sustainability,,“Security, Safety and Health,” and “Government Policies.”
Discussion and Managerial ImplicationsThe formulation of firm strategy and tourism public policy can directly benefit from identifying the factors that have the most significant impact on the future performance of the tourism sector. Although several recent studies (Crouch and
Table 3. Ranking of Countries Based on Their Tourism Performance Index
Top 20 Performing CountriesLowest 20 Performing
Countries
Switzerland 0.9899 Senegal 0.1891France 0.9891 Chad 0.1922Spain 0.9888 Madagascar 0.1913Turkey 0.9735 Kenya 0.2031United Kingdom 0.9732 Gambia 0.2069Finland 0.9715 Poland 0.2091India 0.9704 Cyprus 0.2122Oman 0.9692 Latvia 0.2135Australia 0.9632 Panama 0.2151USA 0.9574 Columbia 0.2187Malaysia 0.9503 Mauritius 0.2264Hungary 0.9523 Ukraine 0.2298Israel 0.9420 Peru 0.2361Germany 0.9387 South Africa 0.2388Chile 0.9342 Venezuela 0.2431Austria 0.9337 Croatia 0.2452South Korea 0.9322 Libya 0.2463Jamaica 0.9178 Thailand 0.2578Portugal 0.9032 Taiwan 0.2601Greece 0.9021 Bolivia 0.2634
at Copenhagen Business School on September 22, 2014jtr.sagepub.comDownloaded from
394 Journal of Travel Research 51(4)
Ritchie 2005; Blanke and Chiesa 2009) have highlighted this important issue, the present study provides the first compre-hensive analysis of the determinants of tourism performance. The strain on resources that usually accompany tough market conditions makes it essential for managers involved in firm strategy making (as well as for public policy makers) to iden-tify the key leverage points where their strategies and inter-ventions are most likely to maximize overall performance.
Several versions of the tourism competiveness report published by the World Economic Forum emphasized the need for a study that identifies and ranks the determinants of tourism performance. While the TTCI is probably the best-known instrument used to rank nations according to their travel and tourism competitiveness, it is important to note that it is not a performance index. Rather, it is an index of broad categories of variables that may facilitate tourism competitiveness. Thus, it is not possible from this index to determine which inputs can be translated into industry per-formance most efficiently, nor is it possible from the TTCI to gauge how efficient a nation is in transforming its tourism inputs into outputs.
Thus our findings indicate that the 10 most important determinants were distributed among 6 drivers; those that have all their determinants ranking in the top 10 most important (either positive or negative) are “Tourism Price Competitiveness,” “Economic Conditions,” and “Labor Skill and Training.” The “Tourism and Related Infrastructure” and “Environmental Sustainability,” “Security, Safety and Health,” and “Government and Policies” drivers had also a strong presence among the top 10.
It is possible to provide literature support for all these findings. There is widely accepted evidence, for instance, that price is one of the most important factors in decisions about whether, and where, to undertake trips (Dwyer, Forsyth, and Rao 2000; Dwyer and Kim 2003). The health of the domestic economy is also a main determinant of activity in the tourism industry. This is particularly relevant in rela-tion to business travel spending. Consideration should also be given to investments in tourism and related infrastructure (e.g., hotels, airplanes, recreation sites) (Prideaux 2000). Finally, the reason that all determinants in the “labor and skill training” driver are important could be related to the
Table 4. Bootstrapped Regression Results
Variable Coefficient Standard Error t Value Elasticity
Crime rate −0.0538 1.95E–02 −2.7590 −4.9653Fuel price level −0.0234 5.64E–03 −4.1489 −3.4558Hotel price index −0.0025 7.56E–04 −3.3069 −2.7798CO
2 emissions per capita −0.0002 2.63E–05 −7.6046 −2.3933
Visa requirements −0.0630 2.54E–03 −24.8031 −1.2010Corruption index −0.1265 2.18E–02 −5.8028 −1.1403Unemployment rate −0.0420 1.05E–02 −4.0000 −0.8470HIV/AIDS −0.0040 1.82E–03 −2.1978 −0.5410Ticket prices −0.0635 1.12E–02 −5.6696 −0.3568Time required to start a business −0.0075 9.66E–04 −7.7640 −0.3461Airport density −0.0035 2.36E–03 −1.4831 −0.2591Number of international fairs and exhibition −0.0011 8.32E–05 −13.2212 −0.1198Environmental performance 0.1648 3.87E–02 4.2584 0.1023Quality of airport services 0.1117 8.41E–02 1.3282 0.1276Hospital beds 0.0240 3.32E–02 0.7229 0.1544Protected areas 0.0496 1.96E–02 2.5306 1.1354Number of hotel rooms 0.9610 3.35E–01 2.8687 1.2138Openness of bilateral air service agreements 0.0637 1.61E–02 3.9565 1.2160Number of World Heritage cultural sites 0.1378 4.61E–02 2.9892 1.2565Number of World Heritage natural attractions 0.3710 9.63E–02 3.8525 1.2978Education index 0.9324 1.85E–01 5.0400 1.4930Level of staff training 0.3250 1.23E–01 2.6423 2.2147Number of five- and four-star hotels 0.3620 3.35E–02 10.8060 2.2422Creative industries exports 0.6723 1.23E–01 5.4659 2.3558Number of operating airlines 0.0369 8.62E–03 4.2807 2.6955Quality of airline services 0.2311 3.83E–02 6.0339 3.3987GDP per capita 0.0002 2.29E–05 8.7336 5.3178Service-mindedness of population toward foreign visitors 0.4350 7.83E–02 5.5556 5.3819Stringency of environmental regulation in the tourism industry 0.6365 1.26E–01 5.0516 5.6312Government expenditures on the tourism industry 0.9320 8.11E–02 11.4920 7.1531
at Copenhagen Business School on September 22, 2014jtr.sagepub.comDownloaded from
Assaf and Josiassen 395
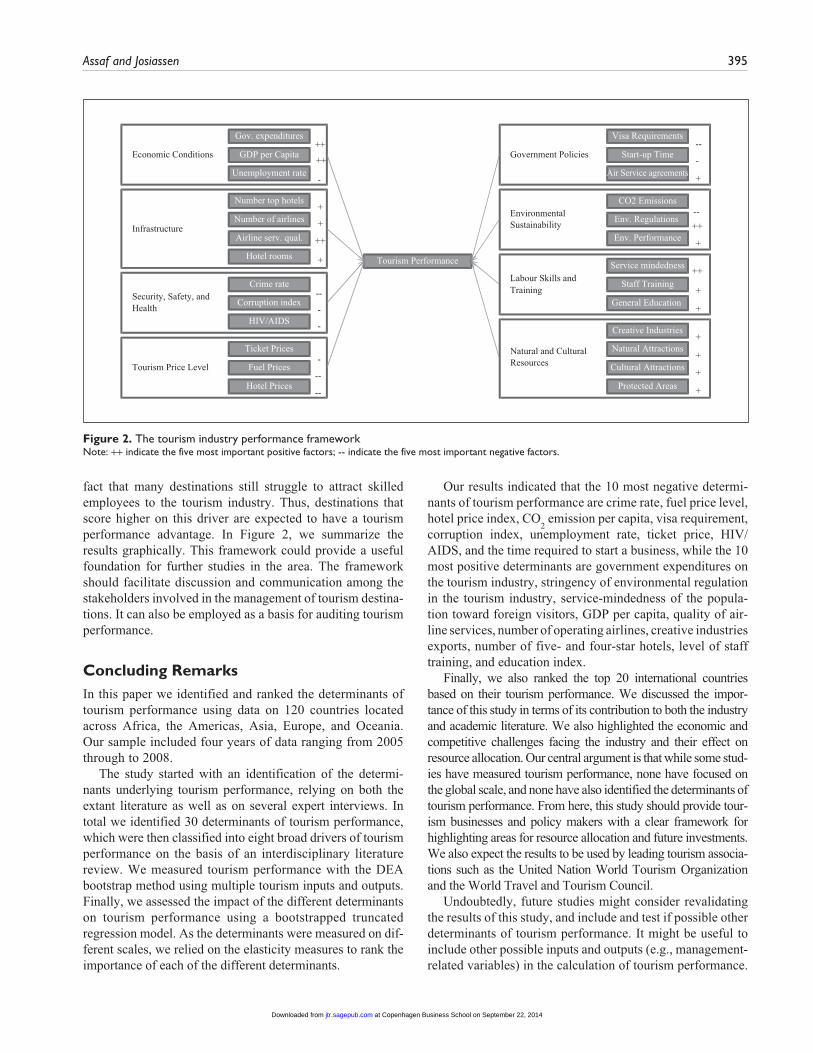
fact that many destinations still struggle to attract skilled employees to the tourism industry. Thus, destinations that score higher on this driver are expected to have a tourism performance advantage. In Figure 2, we summarize the results graphically. This framework could provide a useful foundation for further studies in the area. The framework should facilitate discussion and communication among the stakeholders involved in the management of tourism destina-tions. It can also be employed as a basis for auditing tourism performance.
Concluding RemarksIn this paper we identified and ranked the determinants of tourism performance using data on 120 countries located across Africa, the Americas, Asia, Europe, and Oceania. Our sample included four years of data ranging from 2005 through to 2008.
The study started with an identification of the determi-nants underlying tourism performance, relying on both the extant literature as well as on several expert interviews. In total we identified 30 determinants of tourism performance, which were then classified into eight broad drivers of tourism performance on the basis of an interdisciplinary literature review. We measured tourism performance with the DEA bootstrap method using multiple tourism inputs and outputs. Finally, we assessed the impact of the different determinants on tourism performance using a bootstrapped truncated regression model. As the determinants were measured on dif-ferent scales, we relied on the elasticity measures to rank the importance of each of the different determinants.
Our results indicated that the 10 most negative determi-nants of tourism performance are crime rate, fuel price level, hotel price index, CO
2 emission per capita, visa requirement,
corruption index, unemployment rate, ticket price, HIV/AIDS, and the time required to start a business, while the 10 most positive determinants are government expenditures on the tourism industry, stringency of environmental regulation in the tourism industry, service-mindedness of the popula-tion toward foreign visitors, GDP per capita, quality of air-line services, number of operating airlines, creative industries exports, number of five- and four-star hotels, level of staff training, and education index.
Finally, we also ranked the top 20 international countries based on their tourism performance. We discussed the impor-tance of this study in terms of its contribution to both the industry and academic literature. We also highlighted the economic and competitive challenges facing the industry and their effect on resource allocation. Our central argument is that while some stud-ies have measured tourism performance, none have focused on the global scale, and none have also identified the determinants of tourism performance. From here, this study should provide tour-ism businesses and policy makers with a clear framework for highlighting areas for resource allocation and future investments. We also expect the results to be used by leading tourism associa-tions such as the United Nation World Tourism Organization and the World Travel and Tourism Council.
Undoubtedly, future studies might consider revalidating the results of this study, and include and test if possible other determinants of tourism performance. It might be useful to include other possible inputs and outputs (e.g., management-related variables) in the calculation of tourism performance.
Gov. expenditures
GDP per Capita
Unemployment rate
Number top hotels
Number of airlines
Airline serv. qual.
Hotel rooms Tourism Performance
Economic Conditions
Infrastructure
Creative Industries
Natural Attractions
Cultural Attractions
Protected Areas
Natural and Cultural Resources
Crime rate
Corruption index
HIV/AIDS
Security, Safety, and Health
Ticket Prices
Fuel Prices
Hotel Prices
Tourism Price Level
Visa Requirements
Start-up Time
Air Service agreements
Government Policies
CO2 Emissions
Env. Regulations
Env. Performance
Environmental Sustainability
Service mindedness
Staff Training
General Education
Labour Skills and Training
++
++
-
+
+
++
+
--
-
-
-
--
--
--
-
+
--++
+
++
+
+
+
+
+
+
Figure 2. The tourism industry performance frameworkNote: ++ indicate the five most important positive factors; -- indicate the five most important negative factors.
at Copenhagen Business School on September 22, 2014jtr.sagepub.comDownloaded from

396 Journal of Travel Research 51(4)
This was not possible in this study because of data unavail-ability. Finally, the results might also benefit from using a more extended data set and including more countries into the analysis.
Appendix ABootstrap Procedure
Calculate the DEA performance score δˆi for the tourism
industry of the ith country, using the linear programming problem in Equation 1.
i Use the maximum likelihood method to estimate the truncated regression of δˆ
i on z
i, to provide and
estimate βˆ of β and an estimate σe of σe.ii For each country i = 1,. . .,n, repeat the next four
steps (1-4) B times to yield a set of bootstrap estimates{δˆ*
i,b, b = 1,…, B}.
1. Draw ei from the N (0, σ2
e) distribution with left truncation at (1–βˆ z
i)
2. Compute δ*
i = βˆ z
i + ξ
i3. Construct a pseudo data set (x*
i, y*
i) where x*
i =
x
i
and y*i
= yiδˆ
i / δˆ
i4. Compute a new DEA estimate δ*
i on the set of
pseudo data , (x*i, y*
i) that is,
iii. For each country, compute the bias-corrected esti-mate δˆ
i = δˆ
i – bias
i where bias
i is the bootstrap esti-
mator of bias obtained as: biasi = 1_
B ΣB
b = 1 δ*
i,b –
δˆ
i.
iv. Use the Maximum likelihood method to estimate the truncated regression of δˆ
i on z
i, providing esti-
mates (β ˆ, σˆ ) of (β,σe).
v. Repeat the next three steps (1-3) B2 times to obtain
a set of bootstrap estimates {(β ˆb*, σˆ *b, b = 1, ..., B
2)}
1. For i=1,. . .,n, ei is drawn from N (0, σˆ) with left
truncation at (1–β ˆzi)
2. For i=1,. . .,n, compute δ*
i
* = β ˆzi + ξ
i3. The maximum likelihood method is again used
to estimate the truncated regression of δ*
i
* on zi,
providing estimates (β ˆ* , σˆ* ).
Appendix BModel Specification
In line with Equation 2, the model used in the study can be specific as follows:
δˆi = ∑
36
j = 1 β
jz
ij + ξ
i ,
whereδˆ
i is the performance score of the tourism industry of the
ith country , and zij is a vector of explanatory variables that
includes the following:
zi1
= a variable that represents the number of hotel rooms in each country; z
i2= a variable that represents the number of
five- and four-star hotels in each country; zi3
= a variable that represents the number of operating airlines in each country; z
i3= a variable that represents the number airport density in
each country measured as the number of airport per million population; z
i4= variable that represents the quality of airline
services measured by the number of five- and four-star air-lines; z
i5= a variable that represents the quality of airport ser-
vices in each country measured by the number of five- and four-star airports; z
i6= a variable that represents the unem-
ployment rate in each country; zi9
= a variable that represents the GDP per capita of each country; z
i8= a variable that rep-
resents the government expenditures on the tourism industry in each country measured as a percentage of the total budget; z
i10= a variable that represents the crime rate measured as the
number of murders per capita of each country; zi11
= a vari-able that represents the number of hospitals beds in each country; z
i12= a variable that represents the corruption rate,
measured by taken the corruption index in each country; z
i13= variable that represents the HIV prevalence in each
country as a percentage of adults aged 15–49 years; zi14
= a variable that represents ticket tax and airport charges mea-sured as an index of relative cost of access to international air transport services; z
i15= a variable that represents the retail
diesel fuel prices in each country; zi16
= a variable that repre-sents the hotel price index measured as the average room rate of hotels in the country; z
i17= a variable that represents visa
requirements in each country, measured by the number of countries whose citizens are exempt from obtaining a visa or able to obtain one on arrival out of all UN countries; z
i18= a
variable that represents the Index of openness of bilateral Air Service Agreements in each country; z
i19= a variable that
represents the number of days required to start a business in each country; z
i20= a variable that represents the metric tons
of CO2 emissions per capita in each country; z
i21= a variable
that represents the environmental performance index of each country; z
i22= a variable that represents the stringency of
environmental regulation in each country, adapted from the World Economic Forum, which measures this variable by asking tourism experts in each country to rank from 1 to 7 the stringency of environmental regulation in their country; z
i23= a variable that represents the education index of each
country; zi24
= a variable that represents the level of staff training in the tourism industry for each country, adapted from the World Economic Forum, which measures this vari-able by asking tourism experts in each country to rank from 1 to 7 the degree of investment in staff training and develop-ment in their country; z
i25= a variable that represents the ser-
vice mindedness of employees toward tourists, for each country adapted from the World Economic Forum which measures this variable by asking tourism experts in each country to rank from 1 to 7 the degree of hospitality toward foreign guests in their country; z
i26= a variable that represents
(continued)
at Copenhagen Business School on September 22, 2014jtr.sagepub.comDownloaded from
Assaf and Josiassen 397
Appendix B (continued)
the number of world heritage natural attractions in each country; z
i27= a variable that represents the number of pro-
tected areas in each country; zi28
= a variable that represents the number of world heritage cultural sites in each country; z
i29= a variable that represents the number of international
fair and exhibitions in each country; zi30
= a variable that rep-resents the country’s share of total world exports of the fol-lowing creative industries products: art crafts such as carpets, celebration articles, architecture; fashion; glassware; jew-elry; music; books, newspapers, and other written materials; antiques, paintings, photography, and sculpture.
Declaration of Conflicting Interests
The author(s) declared no potential conflicts of interest with respect to the research, authorship, and/or publication of this article.
Funding
The author(s) received no financial support for the research, author-ship, and/or publication of this article.
Notes
1. By tourism performance, we mean how well the industry is maximizing its outputs from its available resources (i.e., inputs).
2. Competitiveness refers to the ability to create added value and competitive advantage from the available resources (Goodrich 1977; Pearce 1997; Ritchie and Crouch 2000). Countries might have excellent tourism competitiveness but might not be per-forming well because they are not using their resources opti-mally (Blake, Sinclair, and Soria 2006).
3. A production function is said to exhibit constant returns to scale (CRS) if a proportionate increase in inputs results in the same proportionate increase in outputs. The variable returns to scale (VRS), on the other hand, does not assume full proportionality between the inputs and outputs.
4. We used here the Fried et al. (2002) procedure to adjust our outputs for environmental differences between the countries involved. Specifically, we used three environmental variables to adjust our outputs. These were formed by dividing the coun-tries into three groups: Countries in Group 1 include those that have an index close to 5 and higher (of 7). The second group includes those countries that have achieved middle ranking on their tourism competitive index over the period of study, while the third group includes those countries that have achieved the lowest ranking on their tourism competitive index. Note: As the Fried et al. (2002) procedure is well established in the literature, we do not intend to reiterate it here.
5. The results for other countries can be obtained from the authors on request.
6. This is because elasticity is invariant to units of measurement, which is essential for the aim of this study seeing that it is not possible to rank variables using the size of coefficient, as the variables are measured on different scales.
7. We decided to leave these four variables in the estimation, as their exclusion from the model had only a minor impact on the significance of other variables.
References
Akama, J., and D. Mukethe Kieti. (2003). “Measuring Tourist Sat-isfaction with Kenya’s Wildlife Safari: A Case Study of Tsavo West National Park.” Tourism Management, 24 (1): 73-81.
Alegre, J., and M. Cladera. (2006). “Repeat Visitation in Mature Sun and Sand Holiday Destinations.” Journal of Travel Research, 44 (3): 288-97.
Andereck, K. L., K. M. Valentine, R. C. Knopf, and C. A. Vogt. (2005). “Resident Perception of Community Tourism Impacts.” Annals of Tourism Research, 32 (4): 1056-76.
Assaf, A., C. P. Barros, and A. Josiassen. (Forthcoming). “Hotel Efficiency: A Bootstrapped Metafrontier Approach.” Interna-tional Journal of Hospitality Management.
Banker, R. D., A. Charnes, and W. W. Cooper. (1984). “Some Mod-els for Estimating Technical and Scale Inefficiencies in Data Envelopment Analysis.” Management Science, 30 (9): 1078-92.
Barros, C. P., and L. P. Machado. (2010). “The Length of Stay in Tourism.” Annals of Tourism Research, 37 (3): 692-706.
Baum, T. (2002). “Skills and Training for the Hospitality Sector: A Review of Issues.” Journal of Vocational Education and Train-ing, 54 (3): 343-64.
Berli, A., and J. D. Martín. (2004). “Tourists’ Characteristics and the Perceived Image of Tourist Destinations: A Quantitative Analysis—A Case Study of Lanzarote, Spain.” Tourism Man-agement, 25 (5): 623-36.
Bird, B. (1995). “Toward a Theory of Entrepreneurial Compe-tency.” In Advances in Entrepreneurship, Firm Emergence, and Growth (pp. 52-72). Greenwich, CT: JAI.
Blake, A., M. T. Sinclair, and J. Soria. (2006). “Tourism Productiv-ity: Evidence from the United Kingdom.” Annals of Tourism Research, 33 (4): 1099-120.
Blanke J., and T. Chiesa. (2009). “The Travel and Tourism Com-petitiveness Index 2009: Measuring Sectoral Drivers in a Downturn,” In the Travel & Tourism Competitiveness Report: Managing in a Time of Turbulence.Geneva: World Economic Forum, Geneva.
Bosetti, V., M. Cassinelli, and A. Lanza. (2006). “Benchmarking in Tourism Destination, Keeping in Mind the Sustainable Para-digm,” Nota di Lavoro, Fondazione Eni Enrico Mattei.
Briassoulis, H. (2002). “Sustainable Tourism and the Question of the Commons.” Annals of Tourism Research, 29 (4): 1065-85.
Buhalis, D. (2000). “Marketing the Competitive Destination of the Future.” Tourism Management, 21 (1): 97-116.
Carter, S. (1998). “Tourists and Traveler’s Social Construction of Africa and Asia as Risky Locations.” Tourism Management, 19 (4): 349-58.
City Travel Briefing–Zurich. (2009). Euromonitor International: Travel and Tourism Reports. Chicago: Euromonitor International.
Cossens, J., and S. Gin. (1994). “Tourism and AIDS: The Perceived Risk of HIV Infection and Destination Choice.” Journal of Travel and Tourism Marketing, 3 (4): 1-20.
at Copenhagen Business School on September 22, 2014jtr.sagepub.comDownloaded from

398 Journal of Travel Research 51(4)
Cracolici, M. F., P. Nijkamp, and P. Rietveld. (2006). “Assessment of Tourist Competitiveness by Analysing Destination Effi-ciency.” Tinbergen Institute Discussion Paper, 2006.
Crouch, G. I., and J. R. Brent Ritchie. (1999). “Tourism, Competi-tiveness, and Societal Prosperity.” Journal of Business Research, 44 (3): 137-52.
Crouch, G. I., and J. R. Brent Ritchie. (2005). “Application of the Analytic Hierarchy Process to Tourism Choice and Decision Making: A Review and Illustration Applied to Destination Competitiveness.” Tourism Analysis, 10 (1): 17-25.
Das, A., and S. Ghosh. (2006). “Financial Deregulation and Efficiency: An Empirical Analysis of Indian Banks during the Post Reform Period.” Review of Financial Economics, 15 (3): 193-221.
Delmas, M., M. V. Russo, and M. J. Montes-Sancho. (2007). “Vol-untary Agreements to Improve Environmental Quality: Sym-bolic and Substantive Cooperation.” Strategic Management Journal, 31 (6): 575-601.
Deng, J., B. King, and T. Bauer. (2002). “Evaluating Natural Tour-ism Attractions.” Annals of Tourism Research, 29 (2): 422-38.
Durand, D., and V. Vargas. (2003). “Ownership, Organization, and Private Firms’ Efficient Use of Resources.” Strategic Manage-ment Journal, 24 (7): 667-75.
Dwyer, L., P. Forsyth, and P. Rao. (2000). “The Price Competitive-ness of Travel and Tourism: A Comparison of 19 Destinations.” Tourism Management, 21 (1): 9-22.
Dwyer, L., and C. Kim. (2003). “Destination Competitiveness: Determinants and Indicators.” Current Issues in Tourism, 6 (5): 369-414.
Enright, M. J., and J. Newton. (2005). “Determinants of Tourism Des-tination Competitiveness in Asia Pacific: Comprehensiveness and Universality.” Journal of Travel Research, 43 (4): 339-50.
Faulkner, B., M. Oppermann, and E. Fredline. (1999). “Destina-tion Competitiveness: An Exploratory Examination of South Australia’s Core Attractions.” Journal of Vacation Marketing, 5 (2): 125-39.
Fried, H. G. A., C. A. K. Lovell, S. S. Schmidt, and S. Yaisawarng. (2002). “Accounting for Environmental Effects and Statistical Noise in Data Envelopment Analysis.” Journal of Productivity Analysis, 17: 157-74.
Fuchs, M., M. Peters, and K. Weiermair. (2002). “Tourism Sustain-ability through Destination Benchmarking Indicator Systems: The Case of Alpine Tourism.” Journal of Tourism Recreation Research, 27: 21-33.
George, R. (2003). “Tourist’s Perceptions of Safety and Security while Visiting Cape Town.” Tourism Management, 24 (5): 575-85.
Goodrich, J. N. (1977). “A New Approach to Image Analy-sis through Multidimensional Scaling.” Journal of Travel Research, 16 (3): 3-7.
Harper, D. (2001). “Comparing Tourists’ Crime Victimization.” Annals of Tourism Research, 28 (4): 1053-6.
Hassan, S. (2000). “Determinants of Market Competitiveness in an Environmentally Sustainable Tourism Industry.” Journal of Travel Research, 38 (3): 239-45.
Holden, A. (2003). “In Need of New Environmental Ethics for Tourism?” Annals of Tourism Research, 30 (1): 94-108.
Huybers, T., and J. Bennett. (2003). “Environmental Management and the Competitiveness of Nature-Based Tourism Destina-tions.” Environmental and Resource Economics, 24 (3): 213-30.
IBISWorld. (1991). Tour Operators in the US. Report #56152, Syd-ney, Australia.
Jacobsson, S. (1991). “Government Policy and Performance of the Indian Engineering Industry.” Research Policy, 20 (1): 45-56.
Jenkins, C. L., and B. M. Henry. (1982). “Government Involve-ment in Tourism in Developing Countries.” Annals of Tourism Research, 9 (4): 499-521.
Khadaroo, J., and B. Seetanah. (2007). “Transport Infrastructure and Tourism Development.” Annals of Tourism Research, 34 (4): 1021-32.
Kozak, M., and M. Rimmington.(1999). “Measuring tourist destination competitiveness: conceptual considerations and empirical findings.” International Journal of Hospitality Management, 18(3):273-283.
Kvale, S. (1996). Interviews: An Introduction to Qualitative Research Interviewing. London: SAGE.
Li, W. (1997). “The Impact of Economic Reform on the Perfor-mance of Chinese State Enterprises, 1980–1989.” Journal of Political Economy, 105 (5): 1080-106.
Marschan-Piekkari, R., and C. Welch. (2004). Handbook of Qualita-tive Research Methods for International Business. Cheltenham, UK: Edward Elgar.
Naude, W. A., and A. Saayman. (2005). “Determinants of Tourist Arrivals in Africa: A Panel Data Regression Analysis.” Tourism Economics, 11 (3): 365-91.
Patton, M. Q. (1990). Qualitative Evaluation and Research Meth-ods. Newbury Park, CA: SAGE.
Pearce, D. G. (1997). “Competitive Destination Analysis in South-east Asia.” Journal of Travel Research, 35 (4): 16-25.
Prideaux, B. (2000). “The Role of the Transport System in Destina-tion Development.” Tourism Management, 21 (1): 53-63.
Ritchie, J. R. B., and G. I. Crouch. (2000). “The Competitive Des-tination: A Sustainability Perspective.” Tourism Management, 21 (1): 1-7.
Ritchie, J. R. B., and G. I. Crouch. (2003). The Competitive Destina-tion: A Sustainable Tourism Perspective. Wallingford, UK: CABI.
Shahin, A., and R. Dabestani. (2010). “Correlation Analysis of Ser-vice Quality Gaps in a Four-Star Hotel in Iran.” International Business Research, 12 (3): 22-35.
Simar, L., and P. W. Wilson. (2007). “Estimation and Inference in Two-Stage, Semi-Parametric Models of Production Processes.” Journal of Econometrics, 136 (1): 31-64.
Srnka, K., and S. Koeszegi. (2007). “From Words to Numbers: How to Transform Qualitative Data into Meaningful Quantita-tive Results.” Schmalenbach Business Review, 59: 29-57.
Sun, H., P. Hone, and H. Doucouliago. (2003). “Economic Open-ness and Technical Efficiency: A Case Study of Chinese Manu-facturing Industries.” Economics of Transition, 7 (3): 615-36.
at Copenhagen Business School on September 22, 2014jtr.sagepub.comDownloaded from
Assaf and Josiassen 399
Tosun, C. (2001). “Challenges of Sustainable Tourism Develop-ment in the Developing World: The Case of Turkey.” Tourism Management, 22 (3): 289-303.
Venkatraman, N., and V. Ramanujam. (1986). “Measurement of Business Performance in Strategy Research: A Comparison of Approaches.” Academy of Management Review, 11 (4): 801-14.
Wöber, K. W., and D. R. Fesenmaier. (2004). “A Multi-Criteria Approach to Destination Benchmarking: A Case Study of State Tourism Advertising Programs in the United States.” Journal of Travel and Tourism Marketing, 16 (2-3): 1-18.
Yong, Y. W., K. A. Keng, and T. L. Leng. (1993). “A Delphi Forecast for the Singapore Tourism Industry: Future Scenario and Market-ing Implications.” International Marketing Review, 20 (2): 10-29.
Bios
A. George Assaf (PhD) is an Assistant Professor at the Isenberg School of Management, University of Massachusetts-Amherst. His research interests are tourism/transport economics, marketing research and banking and finance. He has published on these topics in leading journals such as Journal of Banking and Finance, Journal of Travel Research, Tourism Management, and Journal of Retailing.
Alexander Josiassen (PhD) is an assistant professor at Copenhagen Business School. Alexander’s research interests are marketing research, and consumer/ tourist behavior locally and internationally. Alexander has published on these topics in leading international journals such as Journal of Marketing, and Tourism Management.
at Copenhagen Business School on September 22, 2014jtr.sagepub.comDownloaded from
Related Documents