NATIONAL BIODIVERSITY THREAT ASSESSMENT: RANKING MAJOR THREATS IMPACTING FIJI’S BIODIVERSITY DR MARK O’BRIEN, MS NUNIA MOKO, DR DICK WATLING, MS MELANIA SEGAIDINA, AND DR CLARE MORRISON In partnership with

Welcome message from author
This document is posted to help you gain knowledge. Please leave a comment to let me know what you think about it! Share it to your friends and learn new things together.
Transcript
NATIONAL BIODIVERSITY THREAT ASSESSMENT: RANKING MAJOR THREATS IMPACTING FIJI’S BIODIVERSITY
Dr Mark O’BrIEN, Ms NuNIa MOkO, Dr DIck WaTLING, Ms MELaNIa sEGaIDINa, aND Dr cLarE MOrrIsON
In partnership with

Photo credit: Nancy Nehring

The designation of geographical entities in this book, and the presentation of the material, do not
imply the expression of any opinion whatsoever on the part of IUCN concerning the legal status of any
country, territory, or area, or of its authorities, or concerning the delimitation of its frontiers or
boundaries.
The views expressed in this publication do not necessarily reflect those of IUCN.
Cover photo: Stuart Chape
Layout by: IUCN Oceania/Epeli Nakautoga
Published by: IUCN Oceania, Suva, Fiji.
Authors: Dr Mark O’brien, Regional Programme Coordinator
Ms Nunia Moko, Director Nature Fiji-MareqetiViti
Dr Dick Watling, Principal and Founder of Environmental Consultants Fiji Ltd.
Melania Segaidina, Conservation Officer NatureFiji-MareqetiViti
Dr Clare Morrison, Lecturer in Ecology at Griffith University
Supervisor,
coordination and
contributors:
Florence Curet, Senior Project Officer - Engagement of Non-State Actors, IUCN
Neil Cox, Manager Biodiversity Assessment Unit, IUCN
Antonin Vergez, Senior Expert for Natural Resource Economics, IUCN
Ministry of Environment
Tavenisa Luisa, Fiji Country Project Officer BIODEV2030, IUCN ORO
Copyright: © 2022 IUCN, International Union for Conservation of Nature and Natural
Resources
Reproduction of this publication for educational or other non-commercial
purposes is authorised without prior written permission from the copyright holder
provided the source is fully acknowledged.
Reproduction of this publication for resale or other commercial purposes is
prohibited without prior written permission of the copyright holder.
Recommended
citation:
O'Brien, M., Moko, N., Watling, D., Segaidina, M., & Morrison, C. (2021).
National Biodiversity Threat Assessment: Ranking Major Threat Impacting Fiji's
Biodiversity, BIODEV2030 project. Suva: IUCN.
2
ACKNOWLEDGEMENTS
This work was funded by the IUCN Program as part of the implementation of the BIODEV2030
project. The methodology and the overall study approach were conducted in agreement with
the representatives of IUCN and BIODEV2030. Florence Curet, Neil Cox, Antonin Vergez and
Tavenisa Luisa provided valuable project support and feedback. Francis Saladrau,
Conservation Officer at NatureFiji-MareqetiViti provided support for the expert consultations
and workshops and administrative support for the overall project.
We thank the biodiversity experts and other stakeholders for sharing their time, knowledge
and expertise with us. The robust data sets would not have been possible without their
contribution.
The Ministry of Environment and the Ministry of Forestry provided valuable feedback on the
results of the analyses.

3
ABBREVIATIONS AND ACRONYMS
AFD French Development Agency
AOH Area of Habitat
AZE Alliance for Zero Extinction
DPSIR Drivers-Pressure-State-Impact-Response Framework
ECAL Environment and Climate Adaptation Levy
FAC Fiji Agriculture Census
IBA Important Bird Area
IUCN-CMP International Union for the Conservation of Nature and the
Conservation Measures Partnership
IUCN International Union for the Conservation of Nature
KBA Key Biodiversity Area
NBSAP National Biodiversity Strategy and Action Plan
NFMV NatureFiji-MareqetiViti
NGO Non-Governmental Organisation
OECM Other Effective Area-Based Conservation Measures
SIDS Small Island Developing States
SOE Fiji’s State of the Environment Report (2020)
STAR Species Threat Abatement and Restoration metric
SUMA Special, Unique Marine Area
UNEP-WCMC United Nations Environment Programme World Conservation
Monitoring Centre
6NR 6th National Report to the Convention on Biological Diversity

4
EXECUTIVE SUMMARY This scientific assessment of the state of biodiversity and the different threats affecting
biodiversity at the national level in Fiji was conducted to enable the identification of key
economic sectors associated with the primary threats to Fiji’s biodiversity.
The methodological approach to this assessment consisted of three components: (1) a review
of the literature and relevant policy documents, (2) the analysis and use of the STAR metric
data and other IUCN data, and (3) expert elicitation. The original project proposal was
assessed using the terrestrial biodiversity due to the nature of the data included in Red List
of Species of the STAR analysis. As Fiji is an island nation with extensive marine biodiversity,
the literature review and the expert elicitation also considered the main threats to marine
biodiversity.
The main threats identified in the literature were invasive species, agriculture and habitat loss
for terrestrial biodiversity, all three of which are anthropogenic pressures; and overfishing and
coastal habitat modification for marine biodiversity.
The results of the original STAR analyses identified invasive species, habitat modification and
logging as the main threats to biodiversity in Fiji. The modified analysis using additional
terrestrial threatened species confirmed the threats posed by invasive species and logging
and highlighted the significant threat posed by agriculture.
The results of the expert elicitation were similar to those from the literature review and STAR
analyses for terrestrial biodiversity with the top threats including invasive species and
agriculture. Our findings suggest that these primary threats form components of the same
overarching threat – namely the loss, reduction of quality, and fragmentation of the native
forest habitat in which the majority of Fiji’s endemic biodiversity is restricted. As one of the
objectives of this project is to reverse or slow down the IUCN Red List Index for Fiji, we clearly
need to address the loss/fragmentation of native forest. The top threats to marine biodiversity
identified by the experts were biological resource use, climate change, commercial coastal
development and pollution.
The STAR scores for the original Amphibians, Bird and Mammals suggest that, in Fiji at least
the threat abatement component is at least 3 times the Restoration component. Threat
abatement should be prioritised in Fiji to reduce species extinction risk, although there remain
considerable benefits in combining threat abatement with targeted restoration projects at the
local scale – both within and adjacent to native forest areas.
5
Based on the results of this assessment, the three main threats to biodiversity in Fiji at the
national level are:
Major threat 1: Loss of forest cover and fragmentation, primarily associated with land clearing
for agriculture and various other means;
Major threat 2: invasive species – from a range of activities associated with forest loss, habitat
fragmentation and efficient modes of transport for the terrestrial and marine environment, and
Major threat 3: biological resource use – mainly relating to the marine environment.
This report concludes that the sectors associated with the greatest direct impact or effect on
Fiji’s biodiversity are Agriculture and Fisheries. Addressing the primary threats caused by
these sectors will have a significant impact on biodiversity in Fiji and is likely to modify the
downward trajectory of Fiji’s Red List Index.
6
CONTENTS ACKNOWLEDGEMENTS 2
ABBREVIATIONS AND ACRONYMS 3
EXECUTIVE SUMMARY 4
List of Figures 7
List of Tables 9
1. INTRODUCTION: BACKGROUND, PURPOSE, AND APPROACH OF THE ASSESSMENT IN FIJI 10
1.1. Purpose of the assessment 11
2. METHODOLOGY AND DATA 12
2.1. Project Framework & Definitions 12
2.1.1. Project framework 12
2.1.2. Biodiversity 13
2.1.3. Threats 13
2.2. Data Collection 14
2.2.1. Biodiversity Status & Trends Review 14
2.2.2. Biodiversity Threat Assessment – National Level 14
2.2.3. Expert elicitation workshop and questionnaire 20
3. FIJI’S BIODIVERSITY STATUS AND TRENDS 23
3.1. The scope of the assessment 23
3.2. Biodiversity status and trends - Ecosystem approach 23
3.2.1. Ecoregions and Ecosystems 23
3.2.2 Biodiversity status and trends - Species approach: Flora and Fauna 29
3.2.3 Areas of Conservation Importance 36
3.2.3.1 Key Biodiversity Areas 36
3.2.3.2 Protected Areas 39
4. BIODIVERSITY THREAT ASSESSMENT 45
4.1. National Level Assessment – Literature Review 45
4.2. National Level Assessment - STAR Metric Scores 50
4.2.1. Terrestrial Species. 50
4.2.2. Marine Species. 56
4.3. National Level Assessment - Expert-based Threat Assessment Tool (EbTAT) 62
4.3.1 – Expert assessors 62
4.3.2 – Overall national expert threat assessment 62
5. DISCUSSION AND RECOMMENDATIONS 95
6. CONCLUSION 109
7. BIBLIOGRAPHY 113
APPENDIX 1: LIST OF SPECIES 118
APPENDIX 2: EXPERTS CONTACTED AND CONSULTED 123
APPENDIX 3: QUESTIONNAIRE FOR SPECIES EXPERTS ON THE RESULTS OF FIJI'S STAR METRIC ANALYSIS 129
APPENDIX 4: STAKEHOLDERS CONSULTATION VIRTUAL WORKSHOP – NOTES AND SUMMARY OF RECOMMENDATIONS 134
7
LIST OF FIGURES Figure 1: Methodological approach (blue) and outputs (orange) of the National Biodiversity Threat Assessment for Fiji (STAR = Species Threat Abatement and Restoration metric). * Combination of STAR analysis results provided by IUCN and modified STAR analyses conducted by NFMV. 12 Figure 2: National class-wise trend in forest cover of Fiji. Source: Global Forest Resource Assessment (2015) 27 Figure 3: Key Biodiversity Areas (purple), terrestrial Important Bird Areas (orange border) and marine Important Bird Areas (blue) in Fiji (Source: Government of Fiji (2020) - Fiji Sixth National Report to CBD) 37 Figure 4: Inshore and offshore special, unique marine areas (SUMAs) (Source: Sykes et al. 2018) 38 Figure 5: Terrestrial protected areas of Fiji (Source: National Trust of Fiji) 42 Figure 6: Priority and proposed terrestrial areas and managed marine areas for Fiji. Source: National Trust of Fiji. 43 Figure 7: Location of iqoliqoli sites in Fiji including Tabu zones (No take, in red) and those in the FLMMA network. (Source: National Trust of Fiji, SOE 2020). 44 Figure 8. STAR threat abatement and STAR restoration scores summed for the 32 species of Amphibian, Bird and Mammal used in the initial analyses for this study. 51 Figure 9: Summary of key threats to amphibian, bird and mammal STAR species in Fiji. Blue bars represent the results of the STAR Threat Abatement scores, orange bars represent the results of the STAR Restoration scores. 52 Figure 10 the STARR scores for major threats – when assessing Reptiles or Terrestrial Molluscs that occur in Fiji and are on the IUCN Red List. The number on the horizontal axis is the overall STAR Threat Abatement score for the Taxonomic Group. 53 Figure 11: Summary of key threats to plants in Fiji using the STAR analysis. The number on the horizontal axis is the overall STAR Threat Abatement score for the Taxonomic Group. 55 Figure 12: Summary of key threats to Globally Threatened and Near Threatened species in Fiji. ABM = amphibian, bird and mammal species. The number on the horizontal axis is the overall STAR Threat Abatement score for the Taxonomic Group. 55 Figure 13 The contrasting proportion of endemic species and wide-ranging species in the terrestrial and marine environment in Fiji. The colours represent the number of countries that the IUCN Red list records each species to be present in. The numbers on the right-hand side of the graph are the number of Red List Globally threatened and near-threatened species in each taxonomic group in Fiji that were included in the star assessment. 57 Figure 14. Summary of key threats to Marine Taxonomic Groups in Fiji using the STAR analysis. The number on the horizontal axis is the overall STAR Threat Abatement score for the Taxonomic Group. 59 Figure 15: Range of expertise amongst the 24 Fiji species experts interviewed to review the results of the STAR analysis and the modified “country approach” on Amphibians, Mammals, Birds, Plants, Freshwater fish, Marine invertebrates and Marine vertebrates and provide feedback on the questionnaire. 62 Figure 16: Sum of key threats to Amphibian, bird and mammal species in Fiji. N = 72 statements by experts who contributed to the assessment of amphibians, birds and mammals. The number on the horizontal axis is the percentage of the total number of statements made. 63 Figure 17: sum of key threats to amphibians, birds and mammals whereby n = number of expert statements recorded for the level 2 threat to the taxon. Threats with zero (0) values have been removed from this figure. The number on the horizontal axis is the percentage of the total number of statements made (Amphibians: n=34; Birds: n=26; Mammals: n=13). 65 Figure 18: Level 2 threats to Fiji's Reptiles, plants and freshwater fish as cited by experts consulted. N= number of expert statements recorded for the level 2 threat to the taxon. Threats with zero (0) values have been removed from this figure. The number on the horizontal axis is the percentage of the total number of statements made (reptiles: n=23; plants: n=25; freshwater fish: n=32). 66 Figure 19: Level 2 threats to Fiji’s marine invertebrates and marine invertebrates at cited by experts. N= Number of expert statements recorded for the Level 2 threat to the taxonomic group. Threats with zero (0) values have been removed from this graph. 73 Figure 20. Sum of "contribution to biodiversity loss" of level 2 threats (IUCN-CMP classification) for amphibians, birds and mammals - combined. N = Number of expert statements. 79 Figure 21. Sum of "contribution to biodiversity loss" of level 2 threats (IUCN-CMP classification) for amphibians, birds and mammals. N = Number of expert statements. 80 Figure 22. Sum of "Contribution to biodiversity loss" of Level 2 threats (IUCN-CMP classification) for reptiles and plants. N = Number of expert statements. 81 Figure 23. Sum of "Contribution to biodiversity loss" of Level 2 threats (IUCN-CMP classification) for marine vertebrates and invertebrates. N = Number of expert statements. 84 Figure 24: Sum of "Contribution to biodiversity loss" of Level 2 threats (IUCN-CMP classification) for fiji’s natural terrestrial ecosystems. N = Number of expert statements (N = 113 in total) 87

8
Figure 25: Sum of "Contribution to biodiversity loss" of Level 2 threats (IUCN-CMP classification) for fiji’s marine ecosystems. N = Number of expert statements (N = 98 in total) 88 Figure 26: comparison of the threat posed by ‘forest loss’ to other threats identified by the experts for amphibians, birds, mammals, reptiles and plants. N = number of expert statements. 90 Figure 27: Projects funded by Environment and Climate Adaptation Levy (ECAL) as at 30 April 2019. Source: Ministry of Economy 2019 97 Figure 28: Agricultural sector (preliminary) list of stakeholders 111 Figure 29: Coastal fisheries sector (preliminary) list of stakeholders 112
9
LIST OF TABLES
Table 1: Target groups for expert assessments: Mammals, birds, amphibians, reptiles, freshwater fish, plants, terrestrial invertebrates, marine invertebrates and marine vertebrates. Numbers in parentheses indicate the number of experts for each taxonomic group/ecosystem that responded to the study. 21 Table 2: Ranking values for the contribution of threats towards biodiversity loss or irreversibility of the threat. 21 Table 3: List of level 2 threats on the classification level (IUCN-CMP) combined as "loss of forest" in the analysis of the expert data. 22 Table 4: Globally threatened mammals of Fiji (IUCN 2021, http://www.iucnredlist.org) 29 Table 5: Globally Threatened Birds of Fiji (BirdLife International 2021), including the Trend Status (from http://www.iucnredlist.org). Note: the globally threatened list excludes two petrels - White-necked and Black petrel and the Far eastern curlew which are considered as vagrants in Fiji or Fiji waters. 29 Table 6: Globally Threatened amphibians of Fiji (IUCN 2021, http://www.iucnredlist.org) 30 Table 7: Globally Threatened terrestrial reptiles of Fiji (IUCN 2021, http://www.iucnredlist.org) 31 Table 8: Globally Threatened terrestrial land snails of Fiji (IUCN 2021, http://www.iucnredlist.org) 32 Table 9: Globally Threatened marine fish of Fiji (IUCN 2021, http://www.iucnredlist.org) 33 Table 10: Globally Threatened plants of Fiji (IUCN 2021, http://www.iucnredlist.org) 35 Table 11: Number of special, unique marine areas (SUMAs) in each geographic region within Fiji (Source: Sykes et al. 2018) 39 Table 12: Terrestrial protected areas of Fiji (Source: National Trust of Fiji (2011) as cited in Government of Fiji (2020) – State of the Environment Report). IUCN Category Ia = Strict nature reserve, II = National Park, VI = Protected areas with sustainable use of resources. 41 Table 13. Taxonomic groups and IUCN Red List categories for species in the STAR analysis for Fiji. NT = Near Threatened, VU = Vulnerable, EN = Endangered, CR = Critically Endangered. START = STAR threat abatement score, STARR = STAR restoration score 50 Table 14. the priority threats for each Terrestrial taxonomic group, using the START analysis. Data for each group are presented separately above. ABM = Amphibians, Birds and Mammals. 55 Table 15. the priority threats for each Marine taxonomic group, using the STAR T analysis. Data for each group are presented separately above. 60 Table 16. The threat for each terrestrial taxonomic group based on expert assessments. Data for each groups are presented separately above. 67 Table 17: Comparing priority IUCN-CMP threats for each terrestrial taxonomic group using the START analysis (left), expert data (middle) and literature review (right, not-ranked) 69 Table 18: The sum of contribution of threat for each taxa, based on expert responses. Data for each group are presented separately above. 74 Table 19: Comparing priority IUCN-CMP threats for each marine taxonomic group using the START analysis (left), expert data (middle) and literature review (right, not-ranked) 76 Table 20: the sum of contribution of threat for each taxa, based on expert responses. Data for each group are presented separately above. 82 Table 21. The sum of contribution of threats for each taxa, based on expert responses. Data for each group are presented separately above. 84 Table 22: The sum of contribution of threat (IUCN-CMP) for each taxa, based on expert responses (table 20), aggregation of “loss of forest threats” and the literature 91

10
1. INTRODUCTION: BACKGROUND, PURPOSE, AND APPROACH OF THE ASSESSMENT IN FIJI
The health of the ecosystems on which we depend and on which all other species depend is
degrading today at an unprecedented rate. This situation weakens livelihoods, food security,
health and quality of life worldwide, and poses economic and financial risks. This is particularly
significant for countries and people that are heavily dependent on natural resources and
biodiversity for subsistence needs.
To try and halt this loss of biodiversity and promote more sustainable and resilient economies,
IUCN is collaborating with Expertise France and WWF-France to catalyze the BIODEV2030
initiative. Funded by the French Development Agency (AFD), the project strives to mainstream
biodiversity into key economic sectors in 16 pilot countries, among which Fiji represents
Oceania. The objectives of BIODEV2030 and its approach are well aligned with Fiji’s National
Development Plan 2017-2036 (see box 1) and the project outputs shall support its
implementation.
This two-year project shall create the conditions for a national dialogue involving stakeholders
around strategic economic sectors, relevant to the national economy and biodiversity. This
dialogue will aim to initiate and facilitate tangible voluntary national and sectoral commitments
to reduce pressures on biodiversity over the next decade. Such voluntary contributions will be
a big step towards building ambitious common goals to halt the decline in biodiversity by 2030
and restore biodiversity by 2050.
As the initial step to BIODEV 2030 implementation in Fiji, IUCN Oceania Regional Office
recruited NatureFiji-MareqetiViti to conduct the national biodiversity assessment at the
national and local levels. This assessment is consistent with Fiji’s national policies, State of
the Environment 2020, National Biodiversity Strategy and Action Plan for Fiji 2020 - 2025 and
the Sixth National Report to the Convention on Biodiversity whose aims include (i) assessing
the current state of Fiji’s environment (including biodiversity), (ii) identifying the key drivers
and pressures that affect Fiji’s state of the environment, and (iii) providing recommendations
to address key environmental challenges.
11
Source: Government of Fiji (2017).
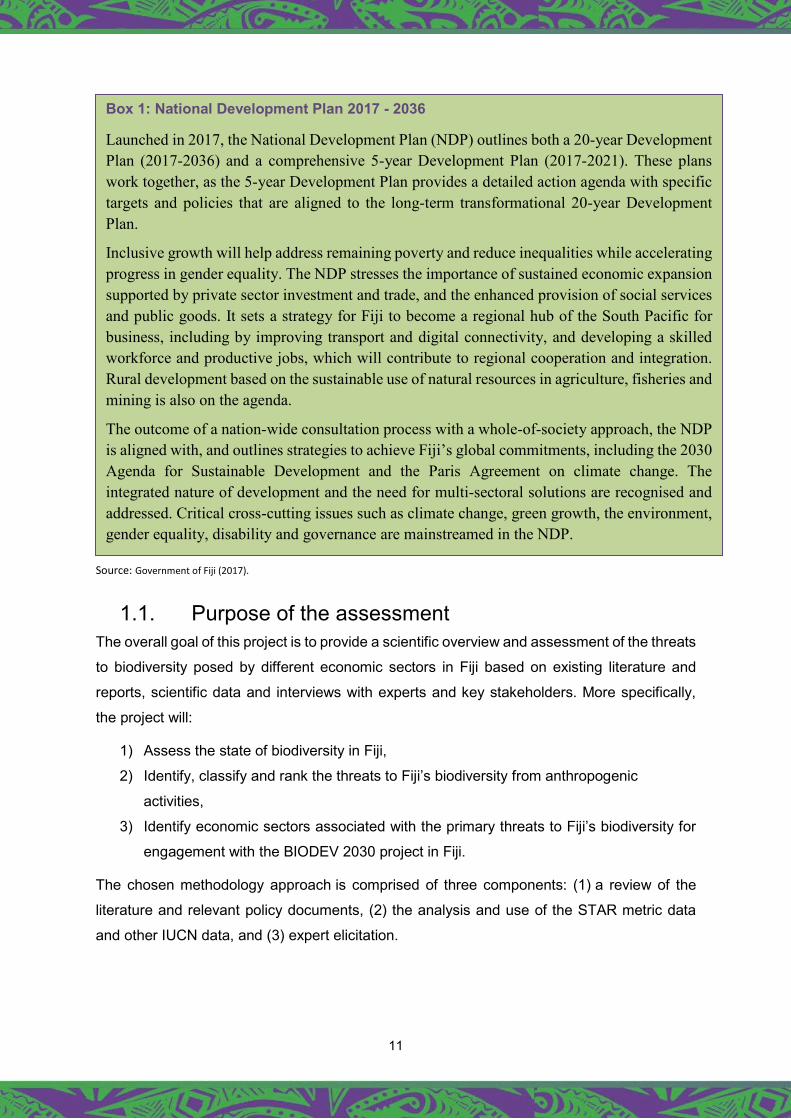
1.1. Purpose of the assessment The overall goal of this project is to provide a scientific overview and assessment of the threats
to biodiversity posed by different economic sectors in Fiji based on existing literature and
reports, scientific data and interviews with experts and key stakeholders. More specifically,
the project will:
1) Assess the state of biodiversity in Fiji,
2) Identify, classify and rank the threats to Fiji’s biodiversity from anthropogenic
activities,
3) Identify economic sectors associated with the primary threats to Fiji’s biodiversity for
engagement with the BIODEV 2030 project in Fiji.
The chosen methodology approach is comprised of three components: (1) a review of the
literature and relevant policy documents, (2) the analysis and use of the STAR metric data
and other IUCN data, and (3) expert elicitation.
Box 1: National Development Plan 2017 - 2036
Launched in 2017, the National Development Plan (NDP) outlines both a 20-year Development Plan (2017-2036) and a comprehensive 5-year Development Plan (2017-2021). These plans work together, as the 5-year Development Plan provides a detailed action agenda with specific targets and policies that are aligned to the long-term transformational 20-year Development Plan.
Inclusive growth will help address remaining poverty and reduce inequalities while accelerating progress in gender equality. The NDP stresses the importance of sustained economic expansion supported by private sector investment and trade, and the enhanced provision of social services and public goods. It sets a strategy for Fiji to become a regional hub of the South Pacific for business, including by improving transport and digital connectivity, and developing a skilled workforce and productive jobs, which will contribute to regional cooperation and integration. Rural development based on the sustainable use of natural resources in agriculture, fisheries and mining is also on the agenda.
The outcome of a nation-wide consultation process with a whole-of-society approach, the NDP is aligned with, and outlines strategies to achieve Fiji’s global commitments, including the 2030 Agenda for Sustainable Development and the Paris Agreement on climate change. The integrated nature of development and the need for multi-sectoral solutions are recognised and addressed. Critical cross-cutting issues such as climate change, green growth, the environment, gender equality, disability and governance are mainstreamed in the NDP.
12
2. METHODOLOGY AND DATA 2.1. Project Framework & Definitions
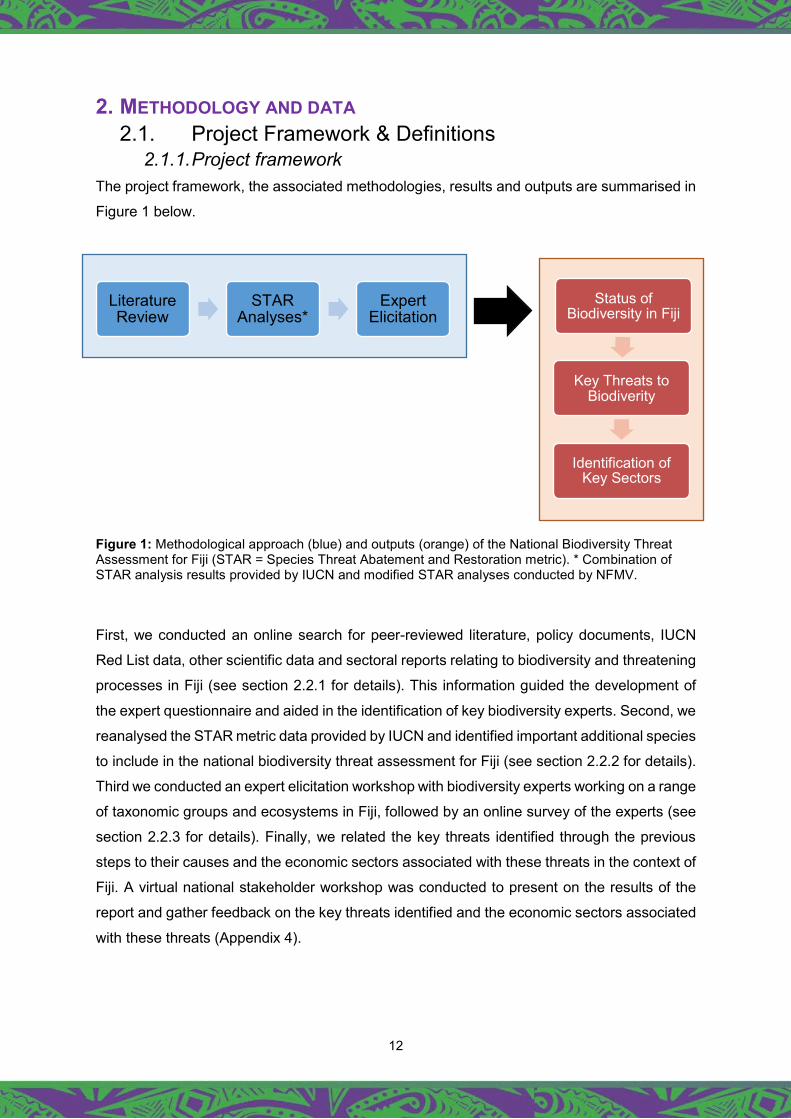
2.1.1. Project framework The project framework, the associated methodologies, results and outputs are summarised in
Figure 1 below.
Figure 1: Methodological approach (blue) and outputs (orange) of the National Biodiversity Threat Assessment for Fiji (STAR = Species Threat Abatement and Restoration metric). * Combination of STAR analysis results provided by IUCN and modified STAR analyses conducted by NFMV.
First, we conducted an online search for peer-reviewed literature, policy documents, IUCN
Red List data, other scientific data and sectoral reports relating to biodiversity and threatening
processes in Fiji (see section 2.2.1 for details). This information guided the development of
the expert questionnaire and aided in the identification of key biodiversity experts. Second, we
reanalysed the STAR metric data provided by IUCN and identified important additional species
to include in the national biodiversity threat assessment for Fiji (see section 2.2.2 for details).
Third we conducted an expert elicitation workshop with biodiversity experts working on a range
of taxonomic groups and ecosystems in Fiji, followed by an online survey of the experts (see
section 2.2.3 for details). Finally, we related the key threats identified through the previous
steps to their causes and the economic sectors associated with these threats in the context of
Fiji. A virtual national stakeholder workshop was conducted to present on the results of the
report and gather feedback on the key threats identified and the economic sectors associated
with these threats (Appendix 4).
Literature Review STAR
Analyses* Expert Elicitation
Status of Biodiversity in Fiji
Key Threats to Biodiverity
Identification of Key Sectors
13
2.1.2. Biodiversity Biodiversity is defined in Article 2 of the text of the Convention on Biological Diversity as being
“the variability among living organisms from all sources including, inter alia, terrestrial, marine
and other aquatic ecosystems and the ecological complexes of which they are part; this
includes diversity within species, between species and of ecosystems.”
Biodiversity exists at different, interrelated levels of organisation.
1) genetic diversity (or intraspecific diversity) is defined by the variability of genes within
the same species, whether between individuals or populations.
2) species diversity (or interspecific diversity) which corresponds to the diversity of living
species, the basic unit of systematics, by their number, nature and abundance.
3) ecosystem diversity which corresponds to the diversity of ecosystems present on Earth
which form the biosphere.
Due to time limitations associated with project, we have focused our assessment at the
species diversity level but include some assessment at the ecosystem level.
2.1.3. Threats There are different types of threats that may impact biodiversity: stress, direct threats, and
contributing factors (Salafsky et al. 2003, 2008). We used the International Union for the
Conservation of Nature and Conservation Measures Partnership (IUCN-CMP), Threats
Classification Scheme, Version 3.2, which focuses on a complete set of direct threats to
species or taxonomic groups, for our biodiversity threat assessment. The system is
hierarchical and has three different levels, from coarse to fine scale. Each Level 1 entry (e.g.
threat “2. Agriculture & aquaculture”) is subdivided into several Level 2 entries (e.g. threat “2.1
Annual & perennial non-woody crops”, “2.2 Wood & pulp plantations”, “2.3 Livestock farming
and ranching” and “2.4 Marine & freshwater aquaculture”). Some of these in turn are
subdivided into Level 3 entries (e.g. “2.1.1 Shifting agriculture”). The classifications are
designed to be comprehensive, consistent and exclusive for the first and second levels. The
third level is at a much finer scale. While our assessment included Level 1 and Level 2 threats,
we focused on Level 2 threats as these are the most relevant at the national and local scale
within Fiji. The Level 1 threats were used to group finer-scale threats but were generally
considered too generic for this assessment.

14
2.2. Data Collection 2.2.1. Biodiversity Status & Trends Review
The documents and data used for the review component of the national biodiversity
assessment were collected through online searches of scientific databases, government
agency websites, online data repositories, NGO and regional organisation websites, and from
local and internationally-based Fiji biodiversity experts. The documentary and data sources
were loosely divided into government documents/policies, peer-reviewed literature, reports,
and scientific data held by experts of the consultancy team and other experts.
2.2.2. Biodiversity Threat Assessment – National Level
Review of the initial amphibian, bird and mammal STAR species proposed by IUCN General STAR methods (see Mair et al. 2021 for more details)
The “Species Threat Abatement and Restoration” (STAR) metric, evaluates the potential
benefit for threatened species of actions to reduce threats and restore habitat. Like the Red
List Index, STAR is derived from existing data in the IUCN Red List. As such, STAR is
designed to explain which potential actions (threat reduction and/or habitat restoration) could
affect the Red List Index.
STAR is spatially explicit, enabling identification of threat abatement and habitat restoration
opportunities in particular places, which if implemented, could reduce species extinction risk
to levels that would exist without ongoing human impact. STAR assumes that for the great
majority of species complete alleviation of threats would reduce extinction risk through halting
decline and/or permitting sufficient recovery in population and distribution, such that the
species could be down listed to the IUCN Red List category of Least Concern.
For each species, a global STAR threat-abatement (START) score is calculated. Using
weighting ratios, this varies from zero for Least Concern species to 100 for Near Threatened,
200 for Vulnerable, 300 for Endangered and 400 for Critically Endangered. The sum of START
values across all species represents the global threat-abatement effort needed for all species
to become Least Concern.

15
START scores can be disaggregated spatially, based on the area of habitat currently available
for each species in a particular location. This shows the potential contribution of conservation
actions in that location to reducing the extinction risk for all species globally.
The extent of current and restorable Area of Habitat (AOH) for species was determined using
5 km resolution species’ AOH rasters. Species current AOH were calculated using the
European Space Agency “Climate Change Initiative” (ESA CCI) land use and cover maps from
2015, with 300 x 300 m pixel size. The ESA CCI original 37 land cover classes were
reclassified into ten major classes (forests, wetlands, arid ecosystems, natural grasslands,
shrublands, croplands, cultivated grasslands, rock and ice, and urban areas), and then
matched to the habitat classes from IUCN Red List assessments. Species’ range maps were
then overlaid with land cover and digital elevation maps to map the area of habitat within each
species’ range, constrained by the species’ elevation range (from the IUCN Red List). Species’
range maps are coded for presence and origin; the current AOH parts of species’ ranges
where the species was recorded as Extinct were excluded, and only parts of each species’
range where the species was recorded as Native, Reintroduced or Assisted Colonisation were
included.
The local START score can be further disaggregated by threat (Tt, i see equation below), based
on the known contribution of each threat to the species' risk of extinction. This quantifies how
actions that abate a specific threat at a particular location (or country) contribute to the global
abatement of extinction risk for all species.
Box 2: Examples Showing How the ‘Local’ START Score is Derived
Black-faced Shrikebill, Clytorhynchus nigrogularis, is listed as Near-threatened in the IUCN Red List. Its global STAR-T (above) is 100. It is endemic to Fiji – so the START for Fiji is also 100. Samoan Flying-fox Pteropus samoensis, is also listed as Near-threatened in the IUCN Red List. Its global START is also 100. However, it occurs in Fiji, Samoa and American Samoa. The Area of Occupied Habitat (AOH) in Fiji represents 92% of its Global AOH – and so the START score for Fiji is 92.

16
Where:
Ps,i is the current Area of Habitat (AOH) of each species (s) within location (i), expressed as a
percentage of the global species’ current AOH;
Ws is the IUCN Red List category weight of species s (NT= 1, VU = 2, EN = 3 and CR= 4);
Cs,t is the relative contribution of threat t to the extinction risk of species s calculated as the
percentage population decline from that threat at global scale (and note at site i);
Ns is the total number of species at location (i).
The STAR metric also includes a habitat restoration component to reflect the potential
benefits to species of restoring lost habitat. The STAR restoration component is calculated for
each species and is based on the area of habitat (AOH) that has been lost and is potentially
restorable. The STAR restoration score (STARR) quantifies the potential contribution that
habitat restoration activities could make to reducing species’ extinction risk. For a particular
species at a particular location (or country), the STAR restoration (STARR) score (Rt,i see
equation below) reflects the proportion that restorable habitat at the location represents of the
global area of remaining habitat for that species. Importantly, a multiplier is applied to STARR
scores to reflect the slower and lower success rate in delivering benefits to species from
restored habitat compared with conserved existing habitat.
Box 3: Derivation of START Threat Scores
The IUCN Red List records five separate threats for Black-faced Shrikebill, Agriculture & Aquaculture, Biological Resource Use, and three species under the Invasive and other problematic species. The Impact score for all five of these threats is listed as Low Impact, 5. Each threat is equal – so the START score for each of these threats, based on this species, is 25 (5 threats x 5). Note that when summing – the Invasive threat has 3 sets of 20 scores – and so Invasives scores 60 overall for this species. For Samoan Flying Fox, six IUCN CMP Level 2 threats are listed, three of these under the Agriculture & Aquaculture threat, two under Biological Resource Use, and one under climate change. The impact scores for Agriculture are 6, 6 and 5 (= 17), for Biological Resource Use are 8 and 6 (= 14), and for Climate Change is 9 – the total threat score comes to 40. The START scores for these threats are 42.5 (17*100/40), 35 (14*100/40) and 22.5 (9*100/40), respectively.
17
Where:
Hs,i is the extent of restorable AOH for species s at location i, expressed as a percentage of
the global species’ current AOH.
Mi is a multiplier appropriate to the habitat at location i to discount restoration scores. We use
a global multiplier of 0.29 based on the median rate of recovery from a global meta-analysis
assuming that restoration has been underway for ten years (the period of the post-2020
outcome goals).
The original area of habitat (original AOH) represented the extent of original ecosystem types
before human impact (i.e. the land cover before conversion to croplands, pasturelands or
urban areas). ESA CCI land use and cover maps from 1992 were used to inform back-casting
of the extent of original ecosystem types. Species range maps were then overlaid with this
back-cast land cover and with digital elevation maps to map the original area of habitat within
each species range. For the purposes of this analysis, the extent of species original AOH was
constrained to within individual species’ range maps according to the IUCN Red List; these
range maps largely reflect current range limits due to a lack of consistent information across
all species on their historical, recently extirpated range. As with current AOH, for original AOH
only parts of each species’ range where the species was recorded as Native, Reintroduced or
Assisted Colonisation according to the origin coding of the IUCN Red List assessments.
However, for original AOH, parts of species’ ranges where the species was recorded as Extinct
were included, for all species for which this information was available. Species restorable AOH
was then calculated as the difference between original and current AOH.
The STAR scores have been calculated and mapped at global scale using species’ extinction
risk categories and threat classification data downloaded for amphibians, birds and
mammals from the IUCN Red List website on 16 September 2020. A total of 5,364 species
(2,054 amphibians, 1,962 birds and 1,348 mammals) were included in the Global analysis
based on the availability of the necessary data (Mair et al 2021).
Box 4: Derivation of STARR Scores
Analysis of the data indicates that the AOH that is lost and potentially restorable for Black-faced Shrikebill represents an extra 47% of habitat over and above the area that is considered currently to be occupied. The STARR score for the Shrikebill is, therefore, 47*0.29 – or 13.5. For Samoan flying Fox – the area of AOH within Fiji that has been lost, and is potentially restorable, represents an additional 38% over and above the 91% of the total AOH of this species in Fiji. Again, the STARR score for the Flying Fox is, therefore, 38*0.29 – or 11.

18
A total of 31 amphibian, bird and mammal species (from the IUCN Red List) were selected by
IUCN for inclusion in the Fiji national biodiversity assessment based on STAR assessments.
The STAR data selected by IUCN were extracted on 16 September 2020 based on IUCN Red
List 2020-2. After reviewing these STAR species, and the Red List 2021-1, we added four
endemic species to the list (one mammal and three birds) that should have been included in
the original data analysed and removed three species (all seabird species that do not regularly
occur in Fiji) (Appendix 1). The final number of amphibians, bird and mammal species for
evaluation was 32 (see Appendix 1 for species list). As all four species added to the list are
endemic to Fiji, their AOH score is 100%. All four species have a narrow current, and former,
range. There is no evidence of range contraction for two of these species (Rotuma Myzomela
and Ogea Monarch), both of which occur across the islands to which they are restricted. We
consider some restoration potential for Natewa Silktail, and restoration potential for Fiji Flying
fox being similar to that for other Taveuni island-endemics.
Identification of other terrestrial taxa in Fiji for inclusion in the national threat assessment (non-STAR taxonomic groups) One immediate concern about the initial STAR analysis was that it was undertaken using a
small proportion of the species in country, from a small subset of taxa. Extrapolating up from
this to represent the principal threats to Fijis biodiversity as a whole seemed dangerous,
without undertaking some checks.
We were aware that, for Fiji, there is reasonably extensive coverage of other terrestrial fauna,
namely Reptiles (31 Fijian species are included on the IUCN Red List, of which 18 are Globally
Threatened or Near Threatened) and gastropods (200 Fijian species are on the Red List of
which 72 are Globally Threatened or Near Threatened). In addition, we felt that the flora of Fiji
should be represented. A total of 208 species of Magnoliopsida, 9 Pinopsida, 70 Liliopsida
and 1 Cycadopsida occur in Fiji and are on the IUCN Red List of threatened species v.2021-
1. These include 65, 4, 18 and 1 species, respectively, classed as either Globally Threatened
or Near Threatened (see Appendix 1 for additional species). Not all species within these taxa
have been assessed through the IUCN Red List – but each are well represented. These
additional species were assessed using the slightly modified methodology described briefly
below.
The STAR analysis uses Area of Habitat (AOH) and expresses the importance of each species
to Fiji’s biodiversity based on the percent of the total (global) AOH that occurs in Fiji. For many
of the reptile, mollusc and plant species, there are no readily available AOH data available.
Consequently, we used the number of countries that a species occurs in as a surrogate of
AOH to weight the impact of each species on Fiji’s biodiversity. This weight is equal to 1/(No.
of countries) expressed as a percentage.
19
Using this approach, endemic species score 100, species in two countries score 50 and
species in 10 countries score 10 and so on. That percentage is then multiplied by the IUCN
Red List score (NT = 1, VU = 2, EN = 3, CR = 4) as previously described.
This information allows us to evaluate the importance of a wider range of species of Fiji’s
national biodiversity and how they capture the key threats for the national biodiversity in
general. Note that endemic species score 100% using both methods, and that over 90% of
the reptiles, molluscs and plant species on Fiji’s Globally Threatened and Near Threatened
species lists are endemic.
Consideration of marine taxa for inclusion in the national threat assessment Fiji is a small island state (land area = 18,274 km2, EEZ = 1,356,662 km2), with a large
proportion of its biodiversity found in estuarine, coastal and marine habitats. We felt that the
omission of these species from the STAR analysis will result in a bias towards the identification
of threatening processes and sectors focused primarily on terrestrial biodiversity rather than
those most significantly impacting biodiversity at the national level. A number of the bird
species, listed in the original STAR analysis, use the coastal and/or marine environment.
However, many of the threats, as listed on the IUCN Red List, to these species are land-based
– occurring at their nesting grounds. Most of these species do not breed in Fiji, using the
coastal or marine areas during the non-breeding, or migratory times of year. The identified
threats were not, primarily, marine-based. As a result, we included all Globally Threatened
and Near Threatened marine species that are present in Fiji and are listed on the IUCN Red
List. As before, the AOH for these species was not available, so we used the inverse of the
number of countries that the species were listed as present on the IUCN Red List (as explained
in Box 5 above). As marine biodiversity is a key component of Fiji’s national biodiversity, we
compared the findings from this data with the Special Unique Marine Areas report (SUMA
report, Sykes et al. 2018), IUCN Red List data and consultations with experts to identify the
Box 5: START Scores for Species Where AOH was not Available
The Fiji Crested Iguana Brachylophus vitiensis is classed as Critically Endangered. This gives it a score of 4. It is endemic to Fiji – and so 100% of its range is in the country. Accordingly, the START score (here the global score is equal to the in Fiji score) for this species is 400. The cycad Cycas seemannii is classed as Vulnerable. As above, this gives it a score of 2. In addition to Fiji, it occurs in 3 countries - New Caledonia, Tonga and Vanuatu. So, Fiji represents 25% (1/4) of the number of countries that it occurs in. The START score for this species in Fiji is, therefore, 25*2 = 50. The threat scores were calculated using exactly the same approach as Box 3 (above).
20
main threats to marine biodiversity and the key economic sectors associated with these threats
(see sections 2.2.3, 3.2.1, 3.3, 4.3).
2.2.3. Expert elicitation workshop and questionnaire We conducted an online expert elicitation workshop on 25 June 2021 with 16 biodiversity
experts and on 29 June 2021 with six staff of the Ministry of Forestry to verify the results of
the STAR analysis, help fill the identified taxonomic and ecosystem gaps and enable a
comprehensive national evaluation of the threats to Fiji’s biodiversity. The experts included
individuals and those from key organisations involved in biodiversity conservation and
management in Fiji, including academic institutions, conservation NGOs, government
agencies and environmental consultants (see Appendix 2). They included experts with
experience working with range of taxonomic groups (e.g. amphibians, reptiles, mammals,
birds, plants, fish, corals) and in different ecosystems (terrestrial, freshwater, marine).
The workshop began with a summary of the overall project aims, the STAR approach used
and key patterns emerging from the STAR data. This overview, while potentially influencing
the expert assessments, was necessary to enable the experts to understand the nature of the
project, become familiar with the methodology and understand what was required from them
to complete their national biodiversity assessment. The project summary was then followed
by a group discussion of the data presented, key threats for different taxonomic groups and
the issue of marine species assessments. At the end of the workshop, experts were sent a
questionnaire (Appendix 3) and asked to identify and rank key threats to biodiversity within
their taxonomic and ecosystem-based areas of expertise. A further 11 individuals who could
not make the virtual session were sent video recordings of the workshop and a copy of the
questionnaire to fill out. With the exception of three experts who worked together to evaluate
the threats to bat species, all experts conducted their national biodiversity assessments
independently.
Given the COVID-19 outbreak that hit Fiji in June and the subsequent lockdown of much of
Viti Levu (mainland), we were unable to include other stakeholders (e.g. private business,
local communities, agriculture sector) during this process as these groups would require a
face-to-face approach to engagement. This is particularly important for local communities
which require extensive community consultation over a long timeframe and do not have
access to online communication platforms due to limited computing and internet capacity.
Analysis of expert data The data from experts were segregated into target groups (species or taxon, see Table 1) and
ecosystems (Table 1) to calculate the number of times a threat (Level 2) was cited by experts
for each target group and ecosystem (see Section 4.3.3.1).
21
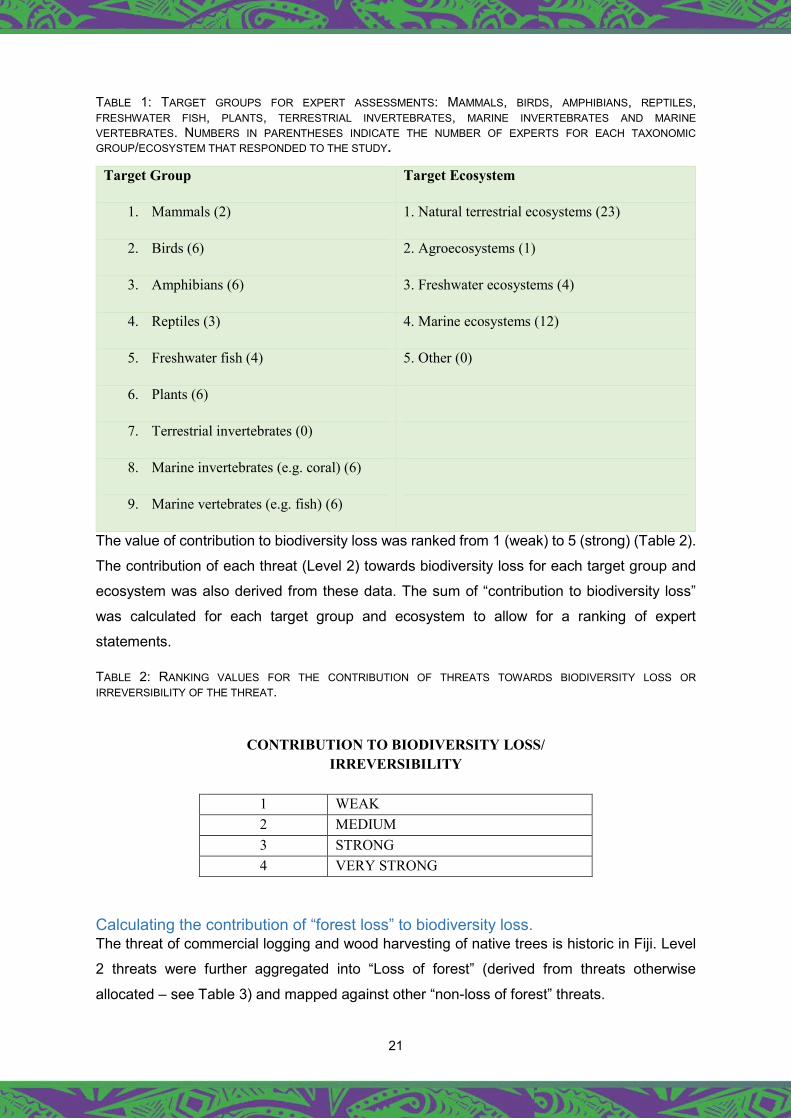
TABLE 1: TARGET GROUPS FOR EXPERT ASSESSMENTS: MAMMALS, BIRDS, AMPHIBIANS, REPTILES, FRESHWATER FISH, PLANTS, TERRESTRIAL INVERTEBRATES, MARINE INVERTEBRATES AND MARINE VERTEBRATES. NUMBERS IN PARENTHESES INDICATE THE NUMBER OF EXPERTS FOR EACH TAXONOMIC GROUP/ECOSYSTEM THAT RESPONDED TO THE STUDY.
Target Group Target Ecosystem
1. Mammals (2) 1. Natural terrestrial ecosystems (23)
2. Birds (6) 2. Agroecosystems (1)
3. Amphibians (6) 3. Freshwater ecosystems (4)
4. Reptiles (3) 4. Marine ecosystems (12)
5. Freshwater fish (4) 5. Other (0)
6. Plants (6)
7. Terrestrial invertebrates (0)
8. Marine invertebrates (e.g. coral) (6)
9. Marine vertebrates (e.g. fish) (6)
The value of contribution to biodiversity loss was ranked from 1 (weak) to 5 (strong) (Table 2).
The contribution of each threat (Level 2) towards biodiversity loss for each target group and
ecosystem was also derived from these data. The sum of “contribution to biodiversity loss”
was calculated for each target group and ecosystem to allow for a ranking of expert
statements.
TABLE 2: RANKING VALUES FOR THE CONTRIBUTION OF THREATS TOWARDS BIODIVERSITY LOSS OR IRREVERSIBILITY OF THE THREAT.
CONTRIBUTION TO BIODIVERSITY LOSS/ IRREVERSIBILITY
1 WEAK 2 MEDIUM 3 STRONG 4 VERY STRONG
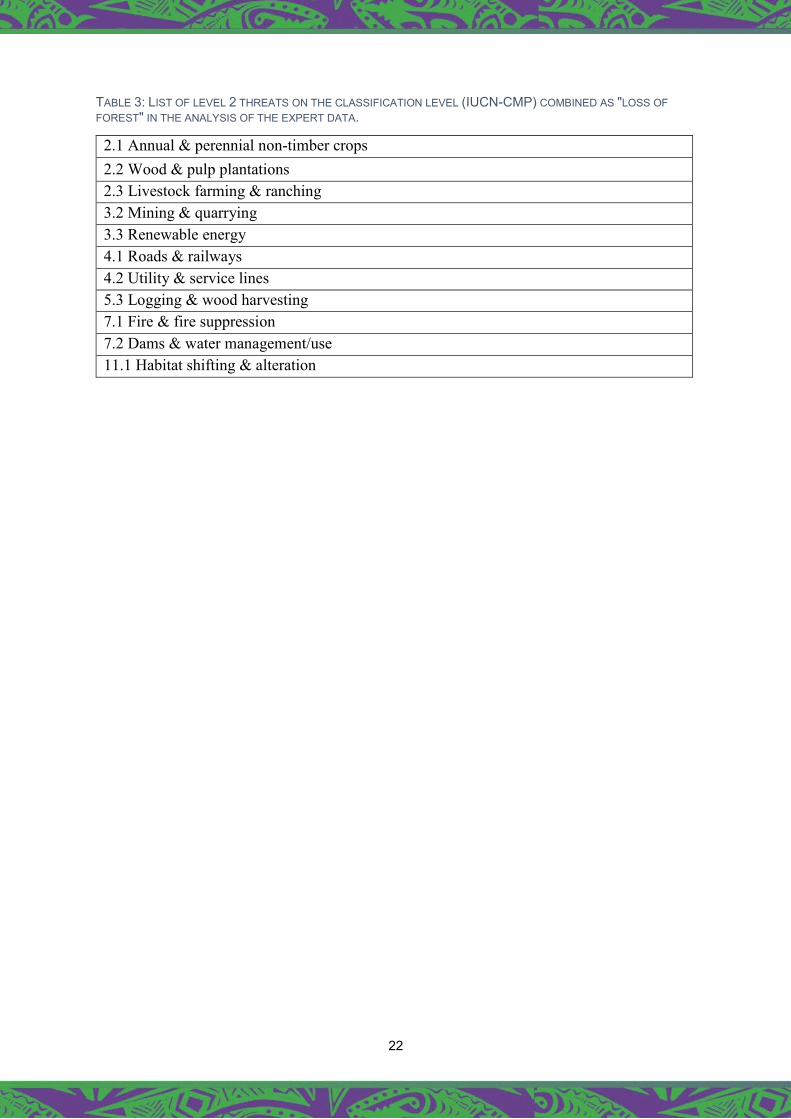
Calculating the contribution of “forest loss” to biodiversity loss. The threat of commercial logging and wood harvesting of native trees is historic in Fiji. Level
2 threats were further aggregated into “Loss of forest” (derived from threats otherwise
allocated – see Table 3) and mapped against other “non-loss of forest” threats.
22
TABLE 3: LIST OF LEVEL 2 THREATS ON THE CLASSIFICATION LEVEL (IUCN-CMP) COMBINED AS "LOSS OF FOREST" IN THE ANALYSIS OF THE EXPERT DATA.
2.1 Annual & perennial non-timber crops 2.2 Wood & pulp plantations 2.3 Livestock farming & ranching 3.2 Mining & quarrying 3.3 Renewable energy 4.1 Roads & railways 4.2 Utility & service lines 5.3 Logging & wood harvesting 7.1 Fire & fire suppression 7.2 Dams & water management/use 11.1 Habitat shifting & alteration
23
3. FIJI’S BIODIVERSITY STATUS AND TRENDS 3.1. The scope of the assessment
Fiji is an archipelago comprised of over 332 islands located in the Western Pacific Ocean
(17°42' 48.1356'' S and 178° 3'54.1188'' E). The total land area in Fiji is estimated to be 18,333
km2 and it has an EEZ of 1,356,662 km2. Only 100 of the islands are inhabited and the two
main islands, Viti Levu and Vanua Levu, whose areas are 10,429 km2 and 5556 km2,
respectively, account for 85% of the total landmass and are inhabited by 93% of the total
population of 884,887 (FBS, 2017). Around 56% (10,266.48 km2) of the land is occupied by
forests and 23% (4216.59 km2) by agriculture (SOE 2020).
Fiji has a tropical maritime climate and rainfall is highly variable and mainly orographic
precipitation under the influence of the prevailing south-east trade winds. Rainfall variability
depends on the height of the mountains, which determine the weather the windward and
leeward sides of the country experience during the wet season from November to April and
dry season from May to October (SOE 2020).
3.2. Biodiversity status and trends - Ecosystem approach 3.2.1. Ecoregions and Ecosystems
Fiji, spread over 332 islands, possesses an endemic-rich biodiversity. The country falls within
the Polynesia-Micronesia Biodiversity Hotspot, which is one of the 36 biodiversity hotspots in
the world. In this section we describe the major ecosystems present in Fiji divided into
terrestrial, freshwater and marine areas.
A. TERRESTRIAL REALM
Natural systems
Natural terrestrial habitats in Fiji can be categorised into nine vegetation classes based on
Mueller-Dombois and Fosberg’s (1998) description of the major vegetation types found in Fiji.
1) Broad-leaf lowland rain forest is found in the wet zone of the high islands of Viti Levu
and Vanua Levu and extends from near sea level to an altitude of 600 m, with a mean
annual rainfall of 2,000–3,000 mm. These forests are predominantly a mixed
assemblage of 20-30 m tall trees, largely dominated by primary Fijian species on steep
lands. The canopy matrix includes angiosperm species, such as Calophyllum vitiense
and Endospermum macrophyllum, along with Canarium vitiense, Cleistocalyx spp.,
Garcinia vitiense, Heritiera ornithocephala, Myristica castaneifolia, Palaquium hornei,
Parinari insularum, and Syzygium spp. Gymnosperms are also present in the forests,
such as Kauri (Agathis vitiense), Dacrydium elatum, and Nageia vitiensis.
24
2) Upland rain forest occurs mostly in areas above 600 m in both the wet and dry zones,
the latter toward the interior of the large islands. These areas receive a mean annual
rainfall of 2,000–3,750 mm. The physiognomy of upland rainforests differs from that of
lowland forests in being lower-statured, with crowns lower on their trunks.
Temperatures are cooler and rainfall is generally higher, differentiating the wet zone
and the intermediate zone. Thus, a wet-zone forest with more than 3750 mm annual
rainfall can be distinguished from an intermediate-zone forest with 2000 mm to 3750
mm rainfall.
3) Cloud forests are mainly enshrouded in clouds and are restricted to mountaintops
and ridges above 600 m near the coast and higher than 900 m inland with more than
9,000 mm of annual rainfall. Stunting is related to cooler temperatures, higher winds,
and lower light levels that reduce photosynthesis, along with excess moisture levels
that accelerate nutrient leaching and decrease soil aeration. At the height of about
1200 m elevation, unique trees include Ardisia brackenridgei, Dysoxylum lenticellare,
Fagraea vitiensis, and Weinmannia sp., which are found along with shrubs, such as
Pipturus argenteus, Randia vitiensis and Scaevola floribunda. At lower altitudes of 800
m, species mostly occurring in the lowland forests are found, such as Alstonia vitiensis,
Bischofia javanica, Calophyllum neo-ebudicum, Heritiera ornithocephala, Palaquium
hornei and Parinari insularum.
4) Dry forests are only known to occur in parts of the dry zone of Viti Levu and Vanua
Levu and some of the western islands and much of which have been destroyed
primarily by fire but contributed to by persistent grazing. Rainfall is very low in the dry
season but can receive similar rainfall as wet forests during the rainy season resulting
in a mean annual range of 1,750–2,250 mm.
5) Talasiga vegetation is dry-zone vegetation found in fire-degraded environments and
spreads from sea level to 1,000 m. It receives a mean annual rainfall of 1,500–2,500
mm. Talasiga (sunburnt) vegetation covers about a third of both Viti Levu and Vanua
Levu. It refers to once-forested dry lowlands, which have now been degraded by fire
and over-grazing into a mosaic of pyrophytic grasslands and savannahs. Large grass-
reedlands of Miscanthus floridulus and Pennisetum polystachyon dominate some
areas, but in areas of severe soil nutrient impoverishment, low-growing plants of the
indigenous ferns Pteridium aquilinum var. esculentum and Dicranopteris linearis form
the primary vegetation cover.
6) Freshwater wetland vegetation occurs commonly only in the wet zone of Viti Levu in
poorly drained alluvial sites along coastal flatland along the Rewa and Navua Rivers
but elsewhere there are limited areas of marsh which are today dominated by exotic
ferns, grasses, and sedges. The wetland forests include native species, such
25
asInocarpus fragifer,, Barringtonia racemosa, Fagraea berteroana, Metroxylon
vitiense and Glochidion cordatum, and invasive introduced species, such as Annona
glabra, and Psidium guajava.
7) Mangrove forests are associated with river estuaries and are found along the
coastline. The richest mangroves in Fiji occur at the mouths of major river deltas
around mud-covered stream banks in the tidal zone. There are eight mangrove species
in Fiji. Rhizophora stylosa, R. samoensis (and their hybrid R. x. selala) which form a
scrubby seaward fringe, being replaced inland by basin forests of Bruguiera
gymnorrhiza, and more landward elements of Excoecaria agallocha, Lumnitzera
littorea, Xylocarpus granatum and X. moluccensis.
8) Coastal strand vegetation changes from creepers and herbs to shrubs and trees.
These forests are dominated by pure stands of Casuarina equisetifolia or Pandanus
tectorius, which is supplanted inland by a mixed littoral forest that includes Barringtonia
asiatica, Calophyllum inophyllum, Cocos nucifera, Cordia subcordata, Hibiscus
tiliaceus, Hernandia nymphaeifolia, Terminalia catappa, Thespesia populnea, and
Tournefortia argentea. The coastal dunes of Sigakota are dominated by native
species, such as Calophyllum inophyllum, Dysoxylum mollissimum, and Syzygium
richii.
9) Small island vegetation is a combination of coastal strand vegetation, mangrove
forest, and talasiga vegetation. These islands receive a mean annual rainfall of
approximately 2,000 mm.
Agricultural systems
According to the most recent Fiji Agriculture Census (2020), 194, 768.6 ha (1947.7 km2) of
Fiji’s land is under some form of agriculture: Temporary crops or short term crops (22.8%),
fallow for one year or more (6.4%), permanent crops – no pastures (14.3%), permanent crops
with pastures (17.5%), temporary meadows and pastures (10.3%), permanent meadows and
pastures (14.0%), others (14.8%) (Ministry of Agriculture, 2020). The major area under
harvested crops is occupied by yaqona (kava), and production has been increasing due to an
increase in demand locally and internationally along with an increase in lucrative pricing (price
of 1 kg yaqona increased from $30.00 to $120.00 since 2016 although it had since fallen to
less than $80.00) (SOE 2020). The area harvested for yaqona increased over 49% between
2015 and 2016 (SOE 2020). Most recently the area harvested for yaqona was 12, 305.1 ha
(42.1% of the area harvested for temporary crops in Fiji) (Ministry of Agriculture 2020).
This is followed by those areas used to produce cassava, dalo, and copra. Sugar cane is
another nationally important crop grown in the drier areas of Viti Levu and Vanua Levu, where
the official ‘cane perimeter’ is over 110,000 ha but currently less than 50% of it is planted with
26
cane with much of it abandoned. There has been a continuous decline since 2003 in the area
being harvested for sugar cane due to the expiration/non-renewal of native land leases for
cane plantations and Fiji’s decreasing share of the global sugar market because of decreasing
international subsidies (SOE 2020). Sugarcane was not listed in the Fiji Agriculture Census
(2020) data even though it was given as an example of a “permanent crop”, hence it is not
clear if the current 194,768.6 ha of agricultural land includes or is addition to the 110,000 ha
(1,100 km2) of official “cane perimeter”.
Fiji’s farmland (194,768.6 ha) is dominated by farmers having traditional ownership (54.1%),
followed by native lease (23.7%), freehold land (13.9%), lease from state (6%), occupied land
with informal agreement (2.1%), occupied land without any legal agreement (0.2%), and
others (0.04%) (Ministry of Agriculture 2020).
Plantation Forests
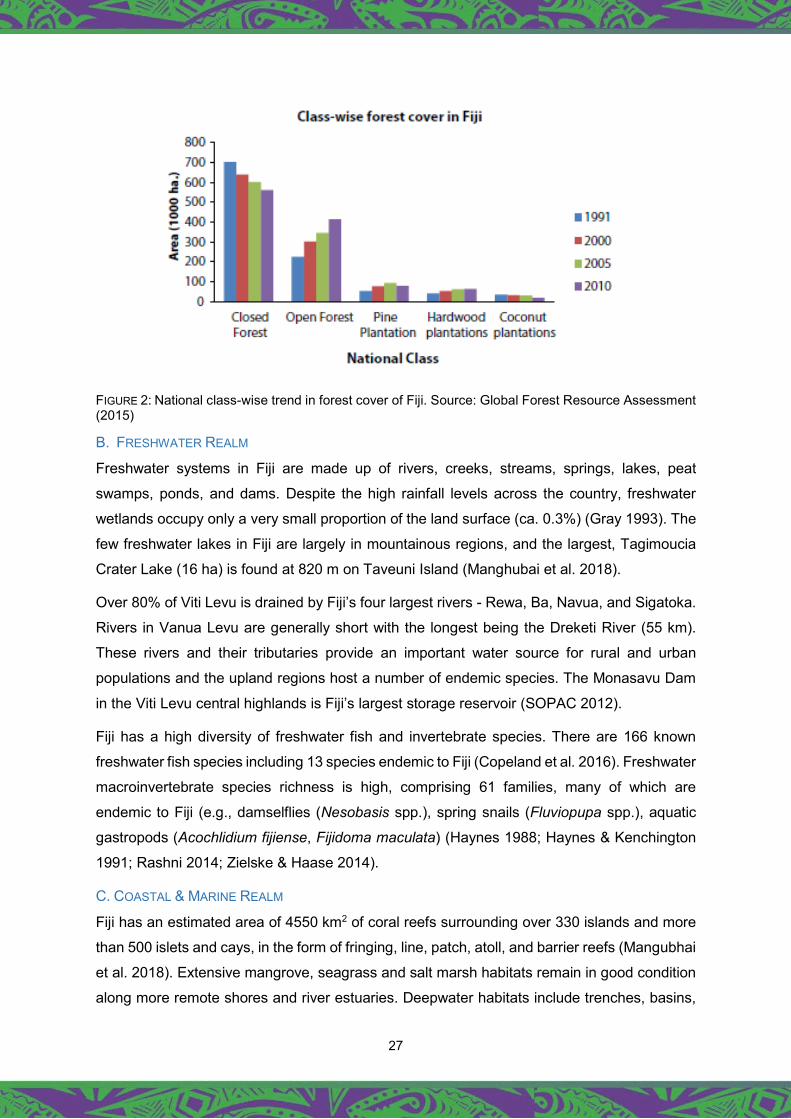
Fiji has very successfully established significant hardwood and softwood plantation sectors
which currently make up about 11% of Fiji forest cover (Figure 2, Government of Fiji 2010).
Caribbean Pine Pinus caribaea was found to grow very well on areas of anthropogenic open
reed-grasslands (Talasiga) and although exotic, were nonetheless both productive and
ecologically beneficial in halting a degrading pedological trend. Currently approximately
50,000 ha is grown by Fiji Pine and on private woodlots owned by landowners. Approximately
the same area of mahogany Swietenia macrophylla has been planted, but in contrast to the
pine, Fiji Hardwood Corporation’s 14 plantations were established through conversion of
native forest.
Fiji has no shortage of potential for reforestation of degraded forest areas and abandoned
sugar cane areas in the sloping foothills of agricultural land.
27
FIGURE 2: National class-wise trend in forest cover of Fiji. Source: Global Forest Resource Assessment (2015)
B. FRESHWATER REALM
Freshwater systems in Fiji are made up of rivers, creeks, streams, springs, lakes, peat
swamps, ponds, and dams. Despite the high rainfall levels across the country, freshwater
wetlands occupy only a very small proportion of the land surface (ca. 0.3%) (Gray 1993). The
few freshwater lakes in Fiji are largely in mountainous regions, and the largest, Tagimoucia
Crater Lake (16 ha) is found at 820 m on Taveuni Island (Manghubai et al. 2018).
Over 80% of Viti Levu is drained by Fiji’s four largest rivers - Rewa, Ba, Navua, and Sigatoka.
Rivers in Vanua Levu are generally short with the longest being the Dreketi River (55 km).
These rivers and their tributaries provide an important water source for rural and urban
populations and the upland regions host a number of endemic species. The Monasavu Dam
in the Viti Levu central highlands is Fiji’s largest storage reservoir (SOPAC 2012).
Fiji has a high diversity of freshwater fish and invertebrate species. There are 166 known
freshwater fish species including 13 species endemic to Fiji (Copeland et al. 2016). Freshwater
macroinvertebrate species richness is high, comprising 61 families, many of which are
endemic to Fiji (e.g., damselflies (Nesobasis spp.), spring snails (Fluviopupa spp.), aquatic
gastropods (Acochlidium fijiense, Fijidoma maculata) (Haynes 1988; Haynes & Kenchington
1991; Rashni 2014; Zielske & Haase 2014).
C. COASTAL & MARINE REALM
Fiji has an estimated area of 4550 km2 of coral reefs surrounding over 330 islands and more
than 500 islets and cays, in the form of fringing, line, patch, atoll, and barrier reefs (Mangubhai
et al. 2018). Extensive mangrove, seagrass and salt marsh habitats remain in good condition
along more remote shores and river estuaries. Deepwater habitats include trenches, basins,
28
canyons, seamounts, rift valleys, ridges, plateaus, spreading ridges, and hydrothermal vents
(IHO 2008).
Mangroves
Fiji has the third largest mangrove resource in the Pacific Islands after Papua New Guinea
(372,770 ha) and the Solomon Islands (64,200 ha) (Mangrove Management Committee 2013).
The Forest Resource Assessment and Conservation (2017) recorded Fiji’s mangrove cover
to be 45,940 ha from Viti Levu, Vanua Levu, and Taveuni. The assessment was updated in
2019 to 47,440 ha which covered Cicia, Gau, Lakeba, Matuku, Moala, Ovalau, Viti Levu, and
Vanua Levu (SOE 2020).
Confusion on the critical issue of the extent of Fiji’s mangrove area, as initially raised by MMC
(2013), is the most recent estimate of Fiji’s mangrove resource which raises the area to 65,243
ha (Cameron et al. (2021)). There are eight mangrove species recorded from Fiji.
Seagrass Beds
The distribution of seagrass in Fiji is poorly documented (Prasad 2010) with the 2004
estimated 16.5 km2 area of Waycott et al. (2004) considered a significant underestimate (G.
Brodie as cited in Mangubhaii et al. 2018). Fiji has five recorded species (Halophilia decipiens,
H. ovalis, Halodule uninervis, H. pinifolia, Syringodium isoetifolium) and one subspecies (H.
ovalis sp. bullosa) (Prasad 2010). Data on faunal biodiversity within seagrass meadows are
also severely lacking for Fiji.
29
3.2 .2 Biodiversity status and trends - Species approach: Flora and
Fauna
A. MAMMALS
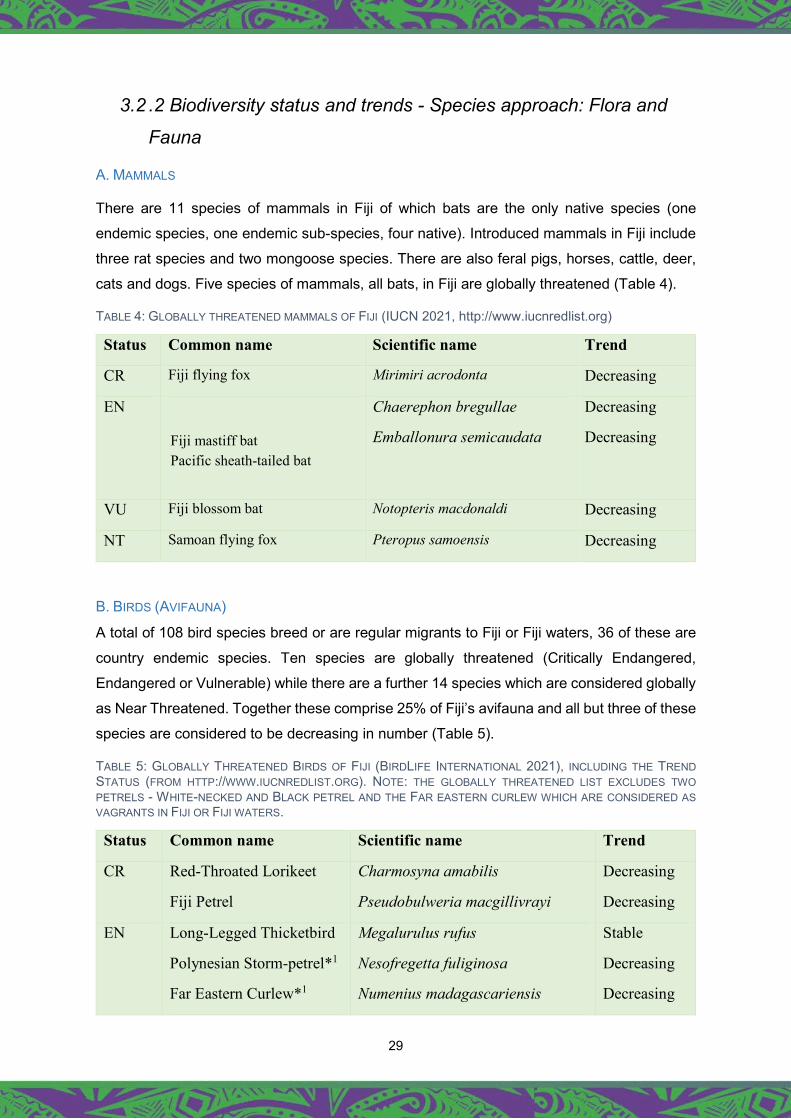
There are 11 species of mammals in Fiji of which bats are the only native species (one
endemic species, one endemic sub-species, four native). Introduced mammals in Fiji include
three rat species and two mongoose species. There are also feral pigs, horses, cattle, deer,
cats and dogs. Five species of mammals, all bats, in Fiji are globally threatened (Table 4).
TABLE 4: GLOBALLY THREATENED MAMMALS OF FIJI (IUCN 2021, http://www.iucnredlist.org)
Status Common name Scientific name Trend
CR Fiji flying fox Mirimiri acrodonta Decreasing
EN
Fiji mastiff bat Pacific sheath-tailed bat
Chaerephon bregullae
Emballonura semicaudata
Decreasing
Decreasing
VU Fiji blossom bat Notopteris macdonaldi Decreasing
NT Samoan flying fox Pteropus samoensis Decreasing
B. BIRDS (AVIFAUNA)
A total of 108 bird species breed or are regular migrants to Fiji or Fiji waters, 36 of these are
country endemic species. Ten species are globally threatened (Critically Endangered,
Endangered or Vulnerable) while there are a further 14 species which are considered globally
as Near Threatened. Together these comprise 25% of Fiji’s avifauna and all but three of these
species are considered to be decreasing in number (Table 5).
TABLE 5: GLOBALLY THREATENED BIRDS OF FIJI (BIRDLIFE INTERNATIONAL 2021), INCLUDING THE TREND STATUS (FROM HTTP://WWW.IUCNREDLIST.ORG). NOTE: THE GLOBALLY THREATENED LIST EXCLUDES TWO PETRELS - WHITE-NECKED AND BLACK PETREL AND THE FAR EASTERN CURLEW WHICH ARE CONSIDERED AS VAGRANTS IN FIJI OR FIJI WATERS.
Status Common name Scientific name Trend
CR Red-Throated Lorikeet
Fiji Petrel
Charmosyna amabilis
Pseudobulweria macgillivrayi
Decreasing
Decreasing
EN Long-Legged Thicketbird
Polynesian Storm-petrel*1
Far Eastern Curlew*1
Megalurulus rufus
Nesofregetta fuliginosa
Numenius madagascariensis
Stable
Decreasing
Decreasing

30
Phoenix Petrel*2 Pterodroma alba Decreasing
VU Shy Ground-dove
Pink-billed parrotfinch
Natewa Silktail
Rotuma Myzomela
Crimson Shining Parrot
Collared Petrel
White-necked Petrel
Black Petrel*1
Cook’s Petrel *2
Alopecoenas stairi
Erythrura kleinschmidti
Lamprolia klinesmithi
Myzomela chermesina
Prosopeia splendens
Pterodroma brevipes
Pterodroma cervicalis
Procellaria parkinsoni
Pterodroma cookii
Decreasing
Decreasing
Decreasing
Stable
Decreasing
Decreasing
Increasing
Stable
Increasing
NT Whistling Dove Chrysoena viridis Decreasing
Mottled Petrel Pterodroma inexpectata Decreasing Sooty Shearwater Ardenna grisea Decreasing Flesh-footed Shearwater*2 Ardenna carneipes Decreasing Tahiti Petrel Pseudobulweria rostrata Decreasing Bristle-thighed Curlew Numenius tahitiensis Decreasing Bar-tailed Godwit Limosa lapponica Decreasing Masked Shining Parrot Prosopeia personata Decreasing Taveuni Silktail Lamprolia victoriae Decreasing Taveuni Streaked Fantail Rhipidura rufilateralis Decreasing Kadavu Fantail Rhipidura personata Decreasing Azure-crested Flycatcher Myiagra azureocapilla Decreasing Ogea Monarch Mayrornis versicolor Stable Black-throated Shrikebill Clytorhynchus nigrogularis Decreasing
*1 – These species were not considered for the STAR analysis as they are considered to be vagrants to Fiji. *2 – these species were considered for the initial STAR analysis but were rejected as they, too, were considered to be vagrants to Fiji.
C. AMPHIBIANS
There are two endemic species of frog in Fiji - the Fiji Ground Frog (Cornufer vitianus) and the
Fiji Tree Frog (C. vitiensis). The Cane Toad (Rhinella marina) is an introduced species and
spread all across Fiji. The two-amphibian species in Fiji are both listed as globally Near
threatened (Table 6).
TABLE 6: GLOBALLY THREATENED AMPHIBIANS OF FIJI (IUCN 2021, http://www.iucnredlist.org)
Status Common name Scientific name Trend
NT Fiji ground frog Cornufer vitianus Decreasing
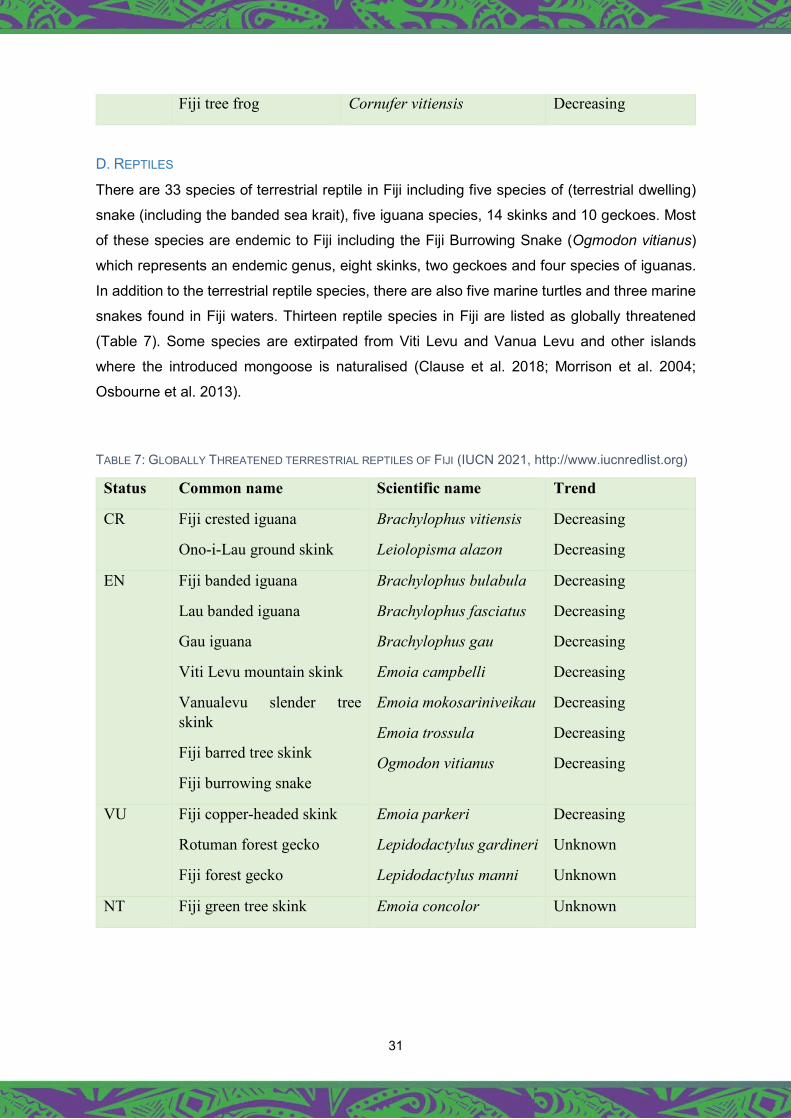
31
Fiji tree frog Cornufer vitiensis Decreasing
D. REPTILES
There are 33 species of terrestrial reptile in Fiji including five species of (terrestrial dwelling)
snake (including the banded sea krait), five iguana species, 14 skinks and 10 geckoes. Most
of these species are endemic to Fiji including the Fiji Burrowing Snake (Ogmodon vitianus)
which represents an endemic genus, eight skinks, two geckoes and four species of iguanas.
In addition to the terrestrial reptile species, there are also five marine turtles and three marine
snakes found in Fiji waters. Thirteen reptile species in Fiji are listed as globally threatened
(Table 7). Some species are extirpated from Viti Levu and Vanua Levu and other islands
where the introduced mongoose is naturalised (Clause et al. 2018; Morrison et al. 2004;
Osbourne et al. 2013).
TABLE 7: GLOBALLY THREATENED TERRESTRIAL REPTILES OF FIJI (IUCN 2021, http://www.iucnredlist.org)
Status Common name Scientific name Trend
CR Fiji crested iguana
Ono-i-Lau ground skink
Brachylophus vitiensis
Leiolopisma alazon
Decreasing
Decreasing
EN Fiji banded iguana
Lau banded iguana
Gau iguana
Viti Levu mountain skink
Vanualevu slender tree skink
Fiji barred tree skink
Fiji burrowing snake
Brachylophus bulabula
Brachylophus fasciatus
Brachylophus gau
Emoia campbelli
Emoia mokosariniveikau
Emoia trossula
Ogmodon vitianus
Decreasing
Decreasing
Decreasing
Decreasing
Decreasing
Decreasing
Decreasing
VU Fiji copper-headed skink
Rotuman forest gecko
Fiji forest gecko
Emoia parkeri
Lepidodactylus gardineri
Lepidodactylus manni
Decreasing
Unknown
Unknown
NT Fiji green tree skink Emoia concolor Unknown

32
E. TERRESTRIAL MOLLUSCS
There are over 230 molluscs (land snails) recorded from Fiji (Brodie & Barker 2011). Of these
90% are native (found in Fiji and elsewhere) and 78% are endemic to Fiji. Twenty-two species
are introduced of which four are of uncertain origin in the Pacific (Brodie & Barker 2011).
Seventy-two species are listed as globally threatened (Table 8).
TABLE 8: GLOBALLY THREATENED TERRESTRIAL LAND SNAILS OF FIJI (IUCN 2021, http://www.iucnredlist.org)
Status Scientific name Trend
CR Delos gardineri, Gonatorhaphe lauensis, Lauopa mbalavuana, Maafu thaumasius, Omphalotropis ingens, Ouagapia ratusukuni, Placostylus koroensis, Placostylus mbengensis, Priceconcha tuvuthaensis, Sinployea angularis, Sinployea navutuenis, Succinea rotumana, Thaumatodon corrugata, Thaumatodon spirrhymatum, Trochomorpha kambarae, Trochomorpha moalensis, Trochomorpha planoconus, Trochomorpha tuvuthae, Vatusila kondoi, Vatusila nayauana
Unknown for all
EN Ba humbugi, Fijiopoma liberata, Gonatorhaphe intercostata
Gonatorhaphe stricta, Macropalaina pomatiaeformis, Omphalotropis subsoluta, Ouagapia perryi, Palaina taviensis
Placostylus graeffei, Placostylus guanensis, Placostylus hoyti
Placostylus kantavuensis, Placostylus ochrostoma, Placostylus seemanni, Sinployea princei, Sinployea rotumana
Thaumatodon subdaedalea, Trochomorpha albostriata, Trochomorpha tavinniensis, Trochomorpha transarata
Majority unknown, some stable or decreasing
VU Diancta macrostoma, Fijianella calciphila, Fijianella cornucopia, Fijianella laddi, Fijiopoma diatreta, Lagivala minusculus, Lagivala vivus, Microcharopa mimula, Omphalotropis costulata, Omphalotropis longula, Omphalotropis rosea, Palaina godeffroyana, Palaina subregularis, Placostylus elobatus, Placostylus malleatus
Sinployea adposita, Sinployea godeffroyana, Sinployea inermis, Sinployea lauenis, Sinployea monstrosa, Sinployea recursa, Thaumatodon laddi, Trochomorpha abrochroa, Trochomorpha accurata, Zyzzyxdonta alata
Majority unknown, some stable or decreasing
NT Moussonia fuscula, Omphalotropis circumlineata, Omphalotropis zelriolata, Palaina martensi, Trochomorpha corallina, Trochomorpha fessonia, Trochomorpha luedersi
Unknown for all
33
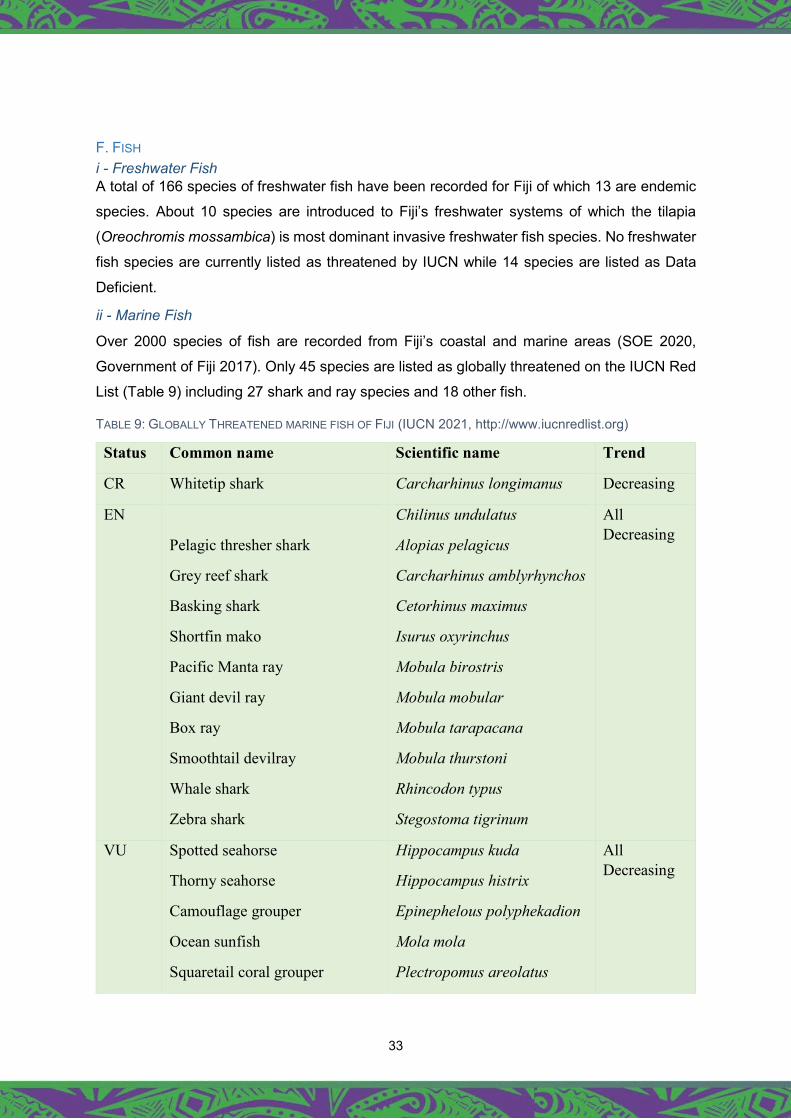
F. FISH i - Freshwater Fish A total of 166 species of freshwater fish have been recorded for Fiji of which 13 are endemic
species. About 10 species are introduced to Fiji’s freshwater systems of which the tilapia
(Oreochromis mossambica) is most dominant invasive freshwater fish species. No freshwater
fish species are currently listed as threatened by IUCN while 14 species are listed as Data
Deficient.
ii - Marine Fish
Over 2000 species of fish are recorded from Fiji’s coastal and marine areas (SOE 2020,
Government of Fiji 2017). Only 45 species are listed as globally threatened on the IUCN Red
List (Table 9) including 27 shark and ray species and 18 other fish.
TABLE 9: GLOBALLY THREATENED MARINE FISH OF FIJI (IUCN 2021, http://www.iucnredlist.org)
Status Common name Scientific name Trend
CR Whitetip shark Carcharhinus longimanus Decreasing
EN
Pelagic thresher shark
Grey reef shark
Basking shark
Shortfin mako
Pacific Manta ray
Giant devil ray
Box ray
Smoothtail devilray
Whale shark
Zebra shark
Chilinus undulatus
Alopias pelagicus
Carcharhinus amblyrhynchos
Cetorhinus maximus
Isurus oxyrinchus
Mobula birostris
Mobula mobular
Mobula tarapacana
Mobula thurstoni
Rhincodon typus
Stegostoma tigrinum
All Decreasing
VU Spotted seahorse
Thorny seahorse
Camouflage grouper
Ocean sunfish
Squaretail coral grouper
Hippocampus kuda
Hippocampus histrix
Epinephelous polyphekadion
Mola mola
Plectropomus areolatus
All Decreasing
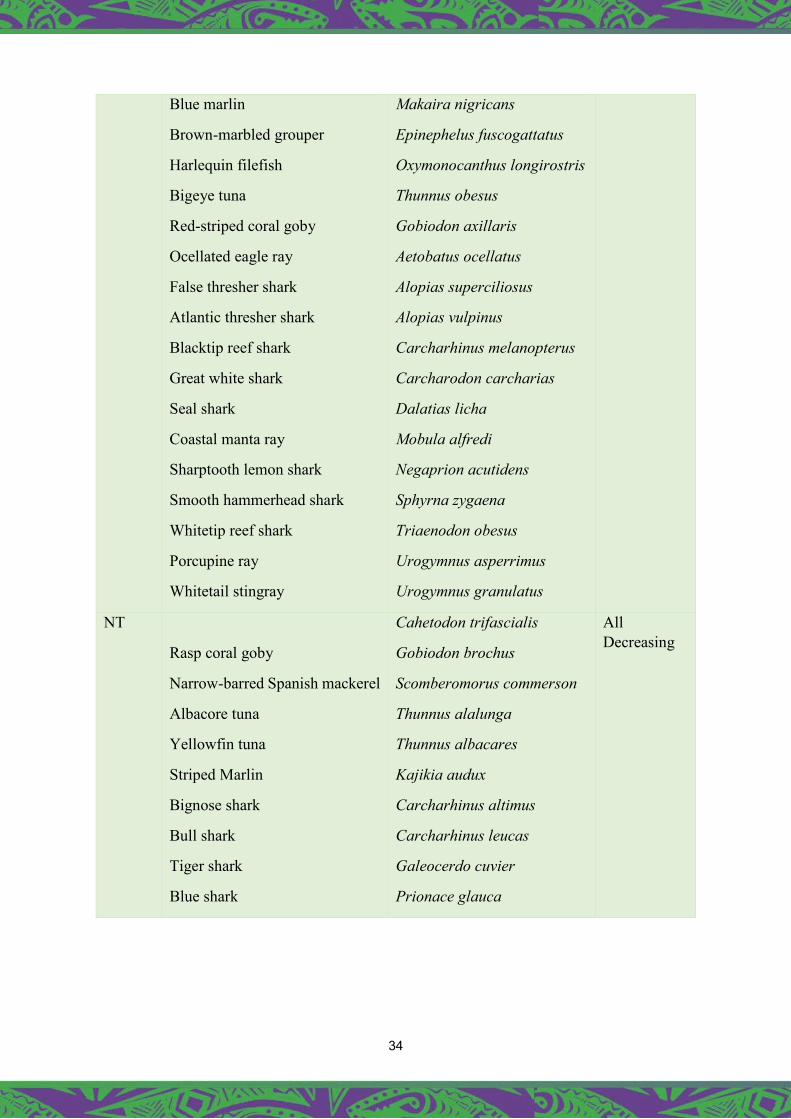
34
Blue marlin
Brown-marbled grouper
Harlequin filefish
Bigeye tuna
Red-striped coral goby
Ocellated eagle ray
False thresher shark
Atlantic thresher shark
Blacktip reef shark
Great white shark
Seal shark
Coastal manta ray
Sharptooth lemon shark
Smooth hammerhead shark
Whitetip reef shark
Porcupine ray
Whitetail stingray
Makaira nigricans
Epinephelus fuscogattatus
Oxymonocanthus longirostris
Thunnus obesus
Gobiodon axillaris
Aetobatus ocellatus
Alopias superciliosus
Alopias vulpinus
Carcharhinus melanopterus
Carcharodon carcharias
Dalatias licha
Mobula alfredi
Negaprion acutidens
Sphyrna zygaena
Triaenodon obesus
Urogymnus asperrimus
Urogymnus granulatus
NT
Rasp coral goby
Narrow-barred Spanish mackerel
Albacore tuna
Yellowfin tuna
Striped Marlin
Bignose shark
Bull shark
Tiger shark
Blue shark
Cahetodon trifascialis
Gobiodon brochus
Scomberomorus commerson
Thunnus alalunga
Thunnus albacares
Kajikia audux
Carcharhinus altimus
Carcharhinus leucas
Galeocerdo cuvier
Prionace glauca
All Decreasing
35
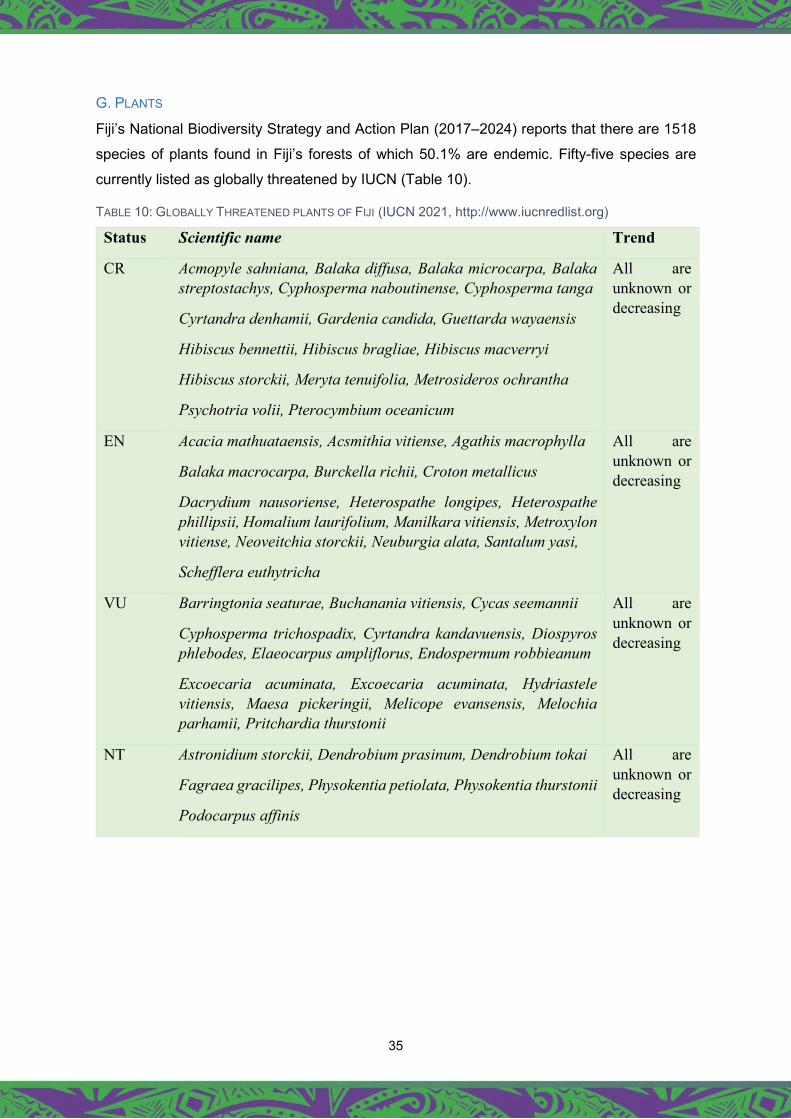
G. PLANTS
Fiji’s National Biodiversity Strategy and Action Plan (2017–2024) reports that there are 1518
species of plants found in Fiji’s forests of which 50.1% are endemic. Fifty-five species are
currently listed as globally threatened by IUCN (Table 10).
TABLE 10: GLOBALLY THREATENED PLANTS OF FIJI (IUCN 2021, http://www.iucnredlist.org)
Status Scientific name Trend
CR Acmopyle sahniana, Balaka diffusa, Balaka microcarpa, Balaka streptostachys, Cyphosperma naboutinense, Cyphosperma tanga
Cyrtandra denhamii, Gardenia candida, Guettarda wayaensis
Hibiscus bennettii, Hibiscus bragliae, Hibiscus macverryi
Hibiscus storckii, Meryta tenuifolia, Metrosideros ochrantha
Psychotria volii, Pterocymbium oceanicum
All are unknown or decreasing
EN Acacia mathuataensis, Acsmithia vitiense, Agathis macrophylla
Balaka macrocarpa, Burckella richii, Croton metallicus
Dacrydium nausoriense, Heterospathe longipes, Heterospathe phillipsii, Homalium laurifolium, Manilkara vitiensis, Metroxylon vitiense, Neoveitchia storckii, Neuburgia alata, Santalum yasi,
Schefflera euthytricha
All are unknown or decreasing
VU Barringtonia seaturae, Buchanania vitiensis, Cycas seemannii
Cyphosperma trichospadix, Cyrtandra kandavuensis, Diospyros phlebodes, Elaeocarpus ampliflorus, Endospermum robbieanum
Excoecaria acuminata, Excoecaria acuminata, Hydriastele vitiensis, Maesa pickeringii, Melicope evansensis, Melochia parhamii, Pritchardia thurstonii
All are unknown or decreasing
NT Astronidium storckii, Dendrobium prasinum, Dendrobium tokai
Fagraea gracilipes, Physokentia petiolata, Physokentia thurstonii
Podocarpus affinis
All are unknown or decreasing
36
3.2 .3 Areas of Conservation Importance
3.2.3.1 Key Biodiversity Areas
Key Biodiversity Areas (KBAs) are nationally identified sites that significantly contribute to the
global preservation of biodiversity, in terrestrial, freshwater and marine ecosystems.
Identifying KBAs is an important approach to address biodiversity conservation at the site
level, i.e. at the level of individual protected areas, concessions and KBAs. The concept was
first based on birds and has now been extended to cover a wider range of taxa and
conservation initiatives (IUCN, 2016). The identification of KBAs builds on the existing network
(IUCN, 2016), which includes among others: (i) Important Bird and Biodiversity Areas (IBBA)
and (ii) Alliance for Zero Extinction (AZE) sites.
A. TERRESTRIAL AREAS
Fiji has 14 terrestrial Important Bird Areas (IBA, Masibalavu & Dutson 2006), some of which
have legal protection where they overlap with government managed forest reserves and
nature reserves and 14 marine associated sites, making 28 in total
(http://datazone.birdlife.org/
country/fiji/ibas). It also has four Alliance for Zero Extinction sites (AZEs) of which two have
no protection while two have partial protection (SOE 2020).
There are 39 terrestrial Key Biodiversity Areas (including all IBAs, AZEs, Figure 3) in Fiji
(http://www.keybiodiversityareas.org/sites/search).

37
FIGURE 3: KEY BIODIVERSITY AREAS (PURPLE), TERRESTRIAL IMPORTANT BIRD AREAS (ORANGE BORDER) AND MARINE IMPORTANT BIRD AREAS (BLUE) IN FIJI (Source: Government of Fiji (2020) - Fiji Sixth National Report to CBD)
B. MARINE AREAS
In 2016, Fiji’s nearshore and offshore marine areas were evaluated against a set of criteria to
identify Special, Unique Marine Areas or SUMAs (see Sykes et al. 2018 for details of the
process and results). In total, 98 sites were identified by the 2016 expert workshop as Special,
Unique Marine Areas (SUMAs) (Figure 4 and Table 11). This large number of sites reflects
the variety of marine habitats within the Fiji Islands, reefs, and surrounding oceans.
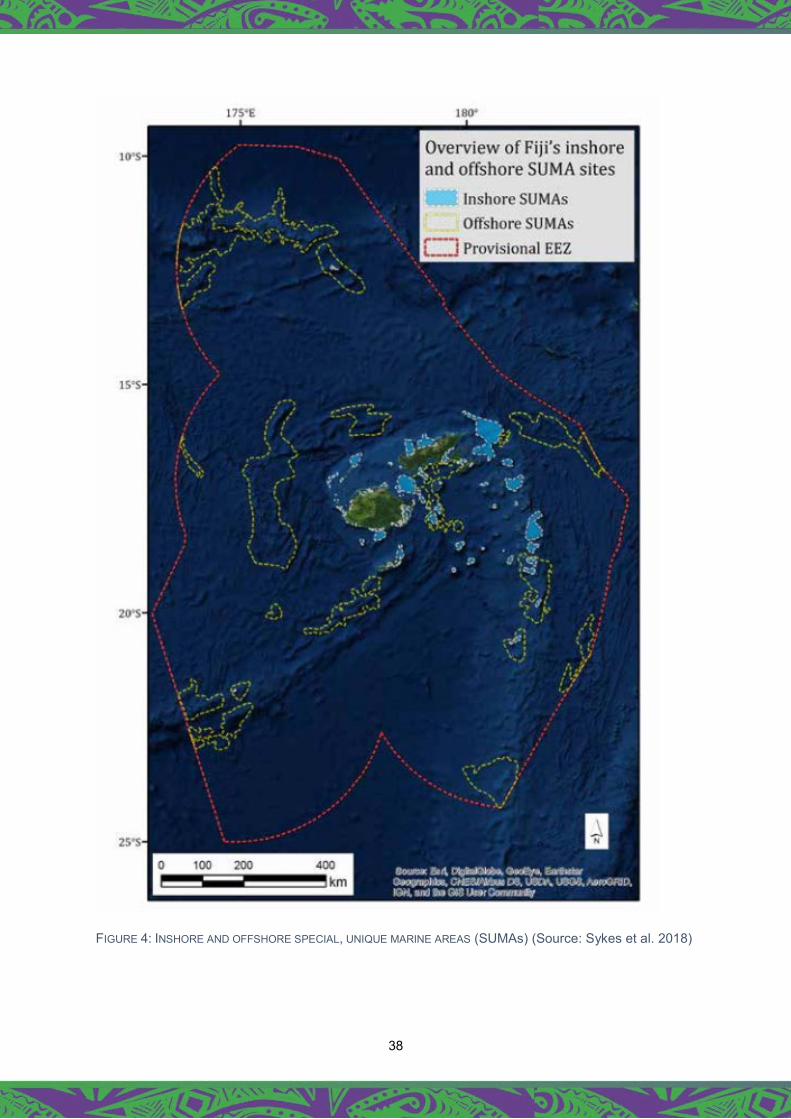
38
FIGURE 4: INSHORE AND OFFSHORE SPECIAL, UNIQUE MARINE AREAS (SUMAs) (Source: Sykes et al. 2018)
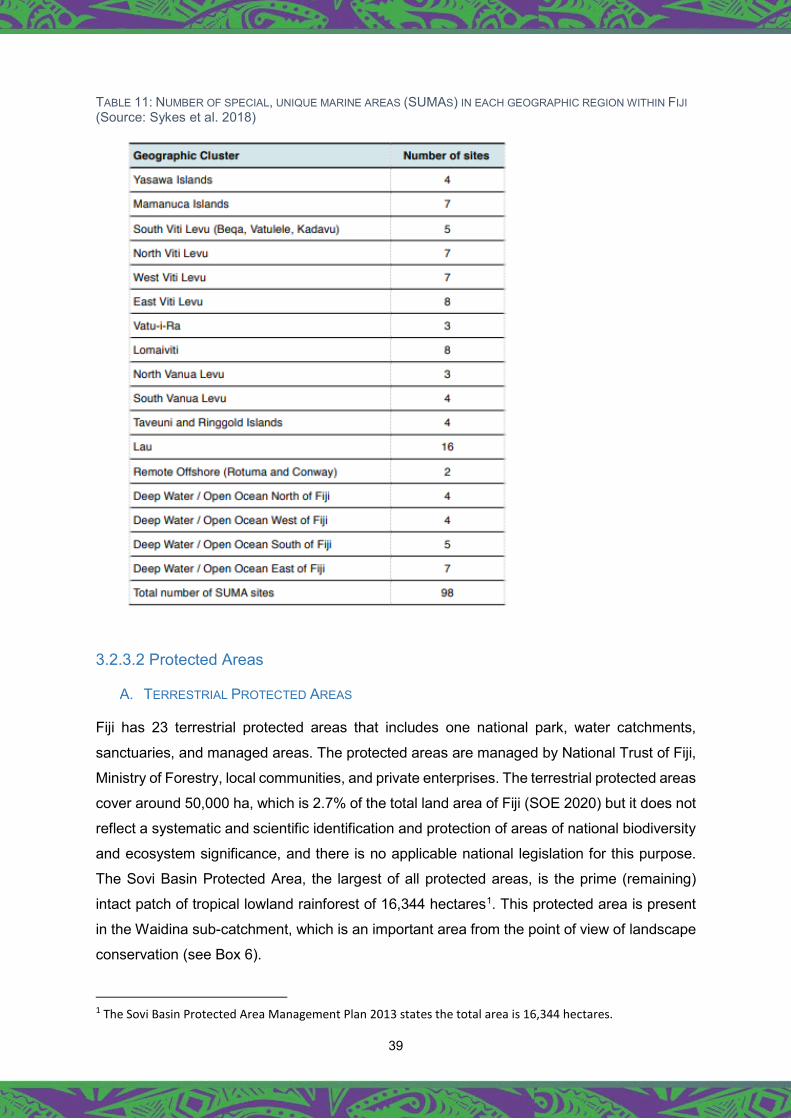
39
TABLE 11: NUMBER OF SPECIAL, UNIQUE MARINE AREAS (SUMAS) IN EACH GEOGRAPHIC REGION WITHIN FIJI (Source: Sykes et al. 2018)
3.2.3.2 Protected Areas
A. TERRESTRIAL PROTECTED AREAS
Fiji has 23 terrestrial protected areas that includes one national park, water catchments,
sanctuaries, and managed areas. The protected areas are managed by National Trust of Fiji,
Ministry of Forestry, local communities, and private enterprises. The terrestrial protected areas
cover around 50,000 ha, which is 2.7% of the total land area of Fiji (SOE 2020) but it does not
reflect a systematic and scientific identification and protection of areas of national biodiversity
and ecosystem significance, and there is no applicable national legislation for this purpose.
The Sovi Basin Protected Area, the largest of all protected areas, is the prime (remaining)
intact patch of tropical lowland rainforest of 16,344 hectares1. This protected area is present
in the Waidina sub-catchment, which is an important area from the point of view of landscape
conservation (see Box 6).
1 The Sovi Basin Protected Area Management Plan 2013 states the total area is 16,344 hectares.

40
Box 6: Sovi Basin Protected Area
The Sovi Basin, Waimaro is the largest remaining area of intact, undisturbed forest in Fiji. Covering an area of 16,344 hectares, the Sovi Basin Protected Area (SBPA) is Fiji’s largest terrestrial protected area, owned by nine landowning units (mataqali) who reside in five separate villages within the provinces of Naitasiri and Namosi on Viti Levu. In 2012 – 23 years after it was first recognised as an important conservation site - the SBPA Landowners approved a 99-year lease for the SBPA to the National Trust of Fiji (NTF) – under the facilitation of the TLTB (iTaukei Land Trust Board). The management of the SBPA is now undertaken by the NTF and the SBPA Landowners. Below is a summary of the events leading up to the legal protection of the site.
Sovi Basin was first identified as an important conservation site in 1989. In 1996, on behalf of the landowners, TLTB “accepted in-principle the concept of
environmental conservation and sustainable development of Sovi Basin”. Little progress from 1996-2004 as foreign NGOs set development agendas. SBWG (Sovi Basin Working Group) set up in 2004 comprising Provincial Councils,
TLTB, Ministry of Forestry, NTF, Ministry of Environment, University of the South Pacific (USP), Conservation International and Landowners.
In depth landowner consultations in 2004-2005 to determine landowner issues and obtain consent.
Short-term lease (20,421 hectares) – 5 years issued by TLTB (2005-2010). Community Education fund during the short-term lease – 208 awards with $43,000 allocated.
Major biodiversity surveys led by USP 2003-2006. Set up of a Trust Fund to finance the lease and the management of the Sovi Protected
Area 2005-2008. Fiji Water makes major donation to provide the Trust Fund with all the funds required. 2010-11 Final landowner consent for a 99-year lease (16,344 hectares) to the National
Trust acquired. 2011 (July) iTLTB makes a lease offer to the National Trust for Fiji which was accepted
and settled financially 2011 (August). Government of Fiji halted the processing of the lease document to enable
the excision of the Wainivadu valley for a Tailings Dam for the Namosi JV copper mine. A decade later, Namosi JV has yet to submit its EIA which is the necessary documentation for their plans and an assessment of the need for excision.

41
Some of the other key protected areas are presented in Figure 5 and Table 12 below.
TABLE 12: TERRESTRIAL PROTECTED AREAS OF FIJI (SOURCE: NATIONAL TRUST OF FIJI (2011) AS CITED IN GOVERNMENT OF FIJI (2020) – STATE OF THE ENVIRONMENT REPORT). IUCN Category Ia = Strict nature reserve, II = National Park, VI = Protected areas with sustainable use of resources.

42
FIGURE 5: TERRESTRIAL PROTECTED AREAS OF FIJI (Source: National Trust of Fiji)
The Ministry of Forestry manages several ecologically important protected areas – Tomaniivi,
Ravilevu, Wabu, Vago-Savura – under the Forest Decree provisions for Forest Reserves and
Nature Reserves2 (Figure 6).
2 The Nature Reserve provisions in the Forest Decree are not acceptable to the iTLTB for conservation and protected area purposes on native land, while the Forest Reserve legislation is for silvicultural purposes.
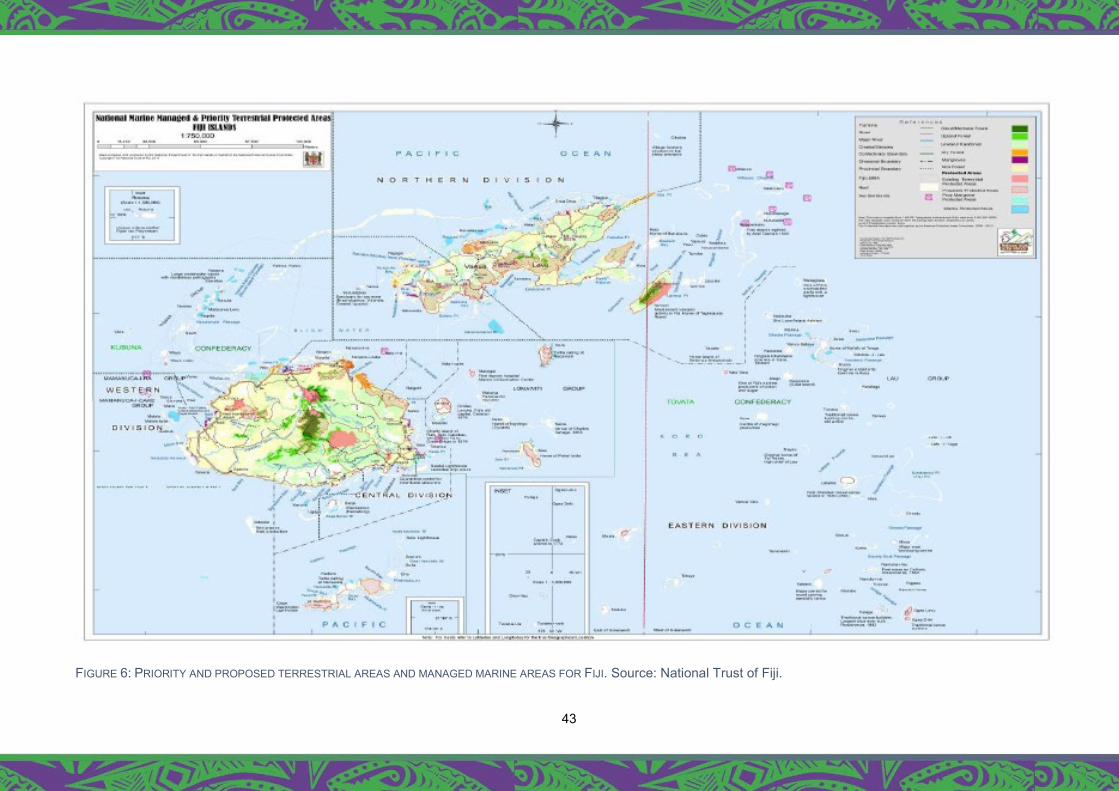
43
FIGURE 6: PRIORITY AND PROPOSED TERRESTRIAL AREAS AND MANAGED MARINE AREAS FOR FIJI. Source: National Trust of Fiji.

44
B. MARINE PROTECTED AREAS
Marine Protected Areas (MPAs), also known as Locally Managed Marine Areas (LMMAs), are
the most successful and a traditional form of conservation of marine areas and their
biodiversity. The network of LMMA in Fiji is known as Fiji’s Locally Managed Marine Areas
(FLMMA). Currently, there are 149 LMMAs governed by local communities covering 1.77
million hectares of the marine area (more than 50% of the country’s inshore marine area) (Day
et al. 2015, Figure 7).
The iTaukei communities hold ‘customary marine tenure’ over Fiji’s inshore waters and the
management of harvest and resources is through traditional knowledge. These customary
fishing rights over the areas are known as ‘qoliqoli’ and extend from the foreshore to slightly
beyond the fringing reefs. Fiji’s qoliqoli is unique in the sense that it has arguably the most
systemically recorded and demarcated customary-held marine tenure areas and the
customary rights are held on a communal basis and registered to customary groups (Sloan &
Chand 2016). While primarily established to protect the fishing areas and resources within
traditionally-owned areas for sustainable use, FLMMA sites contribute to the conservation of
marine biodiversity within Fiji.
FIGURE 7 : LOCATION OF IQOLIQOLI SITES IN FIJI INCLUDING TABU ZONES (NO TAKE, IN RED) AND THOSE IN THE FLMMA NETWORK. (Source: National Trust of Fiji, SOE 2020).
45
4. BIODIVERSITY THREAT ASSESSMENT 4.1. National Level Assessment – Literature Review
The literature review examined the threats to native biodiversity in terrestrial and marine
ecosystems in Fiji with a focus on natural systems (i.e. not agroecosystems or plantation
forests for logging). The three biggest threats reported in the literature for terrestrial species
were invasive species, agricultural practices and habitat loss, all three of which are
anthropogenic pressures. Fiji’s NBSAP (2017-2024) ranks the top 10 threats to endemic
species by threat type and also identifies the three top threats as invasive species (85 endemic
species affected, 33% of all endemic species), agriculture (81 species, 31%) and habitat loss
(24 species, 9%). The Fiji SOE (2020) cites SPREP (2016) and lists Invasive species,
Agriculture, Habitat loss, Development, Climate, Exploitation, Mining, Fire, Human
disturbance and Pollution as key threats to Fiji’s endemic and threatened species. Invasive
species were identified as the major threat to Fiji’s biodiversity.
Main threats to forests and flora The Fiji SOE (2020) identifies land use change with forests being cleared to generate revenue
from timber sales, conversion to agricultural land or extraction of fuelwood as the main threats
to Fiji’s forests and flora. More specifically, the main threats include (note: not listed as rank
order):
A) Forest conversion to root crop production and pasture – indiscriminate clearing of
forests for commercial and semi-commercial agriculture is a key cause of
deforestation. Increasing market prices for yaqona have led to rapid growth in yaqona
cultivation and expansion of agriculture into previously forested areas, including upland
areas with Taveuni being a key area. Livestock farming on Viti Levu and Vanua Levu
has resulted in the conversion of forest areas to pasture for cattle ranching and
livestock grazing within some forest areas.
B) Conventional logging – market demand for timber is a major driver of logging. Rapid
re-logging of native forests exacerbates forest degradation, particularly in the absence
of restocking or restoration/reforestation activities.
C) Mining – is a key economic sector for Fiji and has led to extensive deforestation in the
area of mine activities.
D) Extraction of forest resources – Extraction of fuelwood, subsistence timber harvesting
and extraction of other forest products is a traditional practice in Fiji. Little research has
examined the extraction practices involved and the impacts on forest biodiversity in
Fiji.
46
E) Forest fires – Fire is an integral component of traditional swidden agricultural systems
and in the dry and intermediate zone has been responsible for the conversion of much
of these areas to non-forested habitats since the arrival of Fiji’s first inhabitants. Fire
remains the most serious impediment to natural regeneration or reforestation of these
areas, while fire continues to be a serious agency of deforestation in the wet zone.
Agricultural techniques in rural communities in Fiji have changed due to market
demands and this has resulted in a switch to a more intensive management, seeing
the clearing, burning and conversion of more forested land for agriculture.
F) Invasive species - Some invasive species that have documented impacts on native
flora include rats (seed predation), goats (plant predation causing the loss of forest
cover), and invasive plants such as Pinanga coronata (Dyer et al. 2019; Dyer et al.
2018; Dyer 2017; Lenz et al. in press). Other invasive plant species include Spathodea
campanulata, Samanea saman, Gmelina arborea, Piper aduncum, Sphagneticola
trilobata, Lantana camara, Leucaena leucocephala, Merremia peltata and Mikania
micrantha, which may have varying ecological roles, particularly in Fiji’s open habitats
and its Talasiga landscape
G) De-reservation of protected areas – recent political pressure has resulted in some
forest reserves originally established under the Forestry Act being reverted to native
land ownership. It is important to note that Forest Reserves, under the Forest Decree
1992, were established for silvicultural uses (Clarke and Taylor 2008). Most were
planted up as mahogany plantations not for trial or research purposes but for
commerce - these were the reserves that were de-reserved. The Nadala-Nadarivatu
Forest Reserve was the main species trial area for Ministry of Forestry and some
remnants of these trials still survive. Forest Reserves were never intended to be
biodiversity protected areas until recently. Fiji needs to undertake a systematic and
scientific identification and protection of areas of national significance, and there is no
applicable national legislation for this purpose – which is an issue that will need to be
addressed if there are to be more terrestrial protected areas established.
Mangrove forests are primarily threatened by coastal infrastructure development (industrial
zones, residential units, tourism, sea-walls for flood protection), conversion of mangrove
forests for aquaculture and dredge disposal. Overharvesting for fuelwood for commercial and
subsistence purposes persists as a minor concern.
Fiji’s REDD + project’s study on Drivers of Deforestation and Forest Degradation identified six
direct drivers (MoF 2019): Forest conversion to agriculture; Poorly planned infrastructure
development; Conventional logging; Natural disasters; Invasive species; and Mining.
47
Main threats to fauna Terrestrial and freshwater species
The main threats to native fauna species reported in the literature are invasive or introduced
species and loss of habitat. The main drivers for habitat loss are described in the previous
section. Some of the main invasive species threats include (note: not listed in rank order):
A) Indian mongoose (Herpestes auropunctatus and H. fuscus) and feral cats – have been
reported as being responsible for the extirpation and population declines of several
ground dwelling species including iguanas, skinks, frogs and birds.
B) Cane toad (Rhinella marina) – Cane toads are a major threat to the native frog species
in terms of competition for resources. As they are toxic at all life-stages they also pose
a threat to many predatory species including raptors and snakes.
C) Rats, cats and pigs – these species pose a serious threat to sea and land birds through
direct predation of eggs, chicks or adults or nest/burrow destruction.
D) Free ranging horses, cattle and goats – these herbivores/browsers can seriously
impact native forest regeneration and restoration by selective grazing and the spread
of invasive species such as rain tree, Gmelina arborea and guava.
E) Tilapia (Oreochromis spp.) – tilapia was introduced for aquaculture but have managed
to escape (or were deliberately introduced) into natural waterways. Tilapia is believed
to consume the fingerlings of native species and severely impact populations of local
amphiodromous species.
F) Other species – include invasive birds such as the Red-vented bulbul, which
aggressively outcompete native passerines for resources and the spread of invasive
plants such as Piper aduncum prickly solanum and guava. Land snails, mealy bugs
and ants pose threats to native forest and crop species. The Green Iguana (Iguana
iguana) is another threat to Fiji’s four native iguanas and through sheer potential
numbers and size remains a huge threat to the ecological integrity of Fiji’s native flora.
In addition, other threats to freshwater ecosystems and species reported in the literature
include those that have a significant effect on surface water quality (note: not listed in rank
order):
A) Mining and gravel extraction – the mining and quarrying of minerals in Fiji is dominated by
crushed aggregate, gravel, and sand, used for construction materials, and to a lesser
extent limestone, which is used for agricultural purposes. Most regulated river extraction
is considered highly unsustainable and has significant environmental impacts. Excessive
gravel extraction through dredging leads to water turbidity and changed surface water
conditions leading to sharp declines in freshwater vertebrates and invertebrates affecting
biodiversity and food security for rural communities (Smith et al., 2018).
48
B) Riverbank erosion - sedimentation due to riverbank clearing caused by logging within
stream buffer zones or land clearing for agriculture leads to changed water conditions and
affects stream foodwebs and biodiversity.
C) Pesticide/fertilizer runoff in agricultural zones – leads to changed water conditions and
affects stream foodwebs and biodiversity.
D) Diversion of flows for water supply or hydropower generation – affect amphidromous
species that need to migrate between freshwater and saltwater habitats, and can lead to
the loss of forest habitat in impoundments.
E) Drainage and clearing for agriculture – has led to the almost complete loss of the endemic
and endangered Fiji sago palm forests once widespread in the alluvial plains of the wet
zone of Viti Levu.
Marine species and habitats The main threats to marine species in nearshore areas and coral reef systems can be divided
into those caused by anthropogenic activities, including climate change, and those posed by
natural events such as extreme weather.
The main anthropogenic threats to Fiji’s reefs and nearshore areas are (note: not listed in rank
order):
A) Overfishing – The majority of Fiji’s population lives near the coast and is highly
dependent on fisheries, particularly coastal fisheries of both vertebrate and
invertebrate species, for local economic and subsistence needs. Exploitation has
increasingly intensified for both inshore and offshore fisheries in recent years and,
coupled with decades of poor or neglected management, has resulted in many coastal
fisheries being fully exploited, especially close to urban centres. Fiji is also involved in
the aquarium trade and exports ornamental fish, hard and soft corals and live rock
(Mangubhai et al. 2018), most of which is collected from the wild.
B) Coastal habitat modification – coastal development for tourism, residential and
industrial development
C) Removal of beach rock and coral for building and infrastructure (e.g. roads) – in
addition to the loss of coral habitat from the marine ecosystem, this practice has
altered/modified the integrity of the surrounding fringing reefs affecting their ability to
minimise coastal erosion (Mimura & Nunn 1998).
D) Predator and disease outbreaks – predators such as crown of thorns starfish
(Acansther planci) and Drupella snails and diseases such as ulcerative white-spot
syndrome have a significant impact on corals.
49
E) Climate change – including sea-level rise, storm surge and coral bleaching. Fiji’s
coasts are susceptible to exposure to sea-level rise and storm surge events which will
likely worsen with future climate change. Fiji is subject to almost annual localised mild
coral bleaching. Minor bleaching was observed in 1989, 1998, 1999, 2002 and 2005
with most coral populations recovering by 2011. During the 2000 La Nina, coral
bleaching resulted in losses of 40-80% of scleractinian corals in Fiji (Mangubhai et al.
2018)
F) Sediment and nutrient runoff from human-altered water catchments (e.g. through
agriculture, forestry and mining). Along the Coral Coast of Viti Levu, nutrient levels
(nitrate and phosphate) in sea and river water exceed levels considered harmful to
coral reefs (Mosely & Aalbersberg 2003; Goundar et al. 2014). Fertilizers, herbicides
and pesticides are widely used in the agriculture industry throughout Fiji but there is
little to no regulation of their use. Wood and chemical waste from sawmills containing
copper, chromium and arsenic are another source of pollution (Mangubahi et al. 2018).
The absence of appropriate disposal facilities and management has led to many of
these hazardous chemicals making their way into coastal ecosystems (Department of
Environment 2010).
G) Improper waste disposal and pollution - Marine pollution is a long standing and growing
issue in Fiji and includes the entry of chemicals, industrial waste, sewage, nutrients,
and pesticides into the ocean. Pollution studies in Fiji generally concentrate on Suva
Harbour and the peninsula and report excessive levels of lead, copper, zinc, iron,
arsenic, organochlorine pesticides and polychlorinated biphenyls attributed to a range
of industrial and commercial activities including industrial areas, shipyards, oil storage
depots, food-processing, and urban wastewater (Chand et al. 2011; Gangaiya et al.
2001; Morrison et al. 1996; Park et al. 2013).
Natural disasters can cause mechanical or structural damage such as that caused by
hurricanes and cyclones. Reports after Cyclone Winston in February 2016 showed
damage to corals 20-30 m below the surface (Mangubhai, 2016). Recovery from some of
these disturbances can take decades depending on the frequency of the events, scale and
intensity of damage caused and compounding factors such as pollution or overfishing.
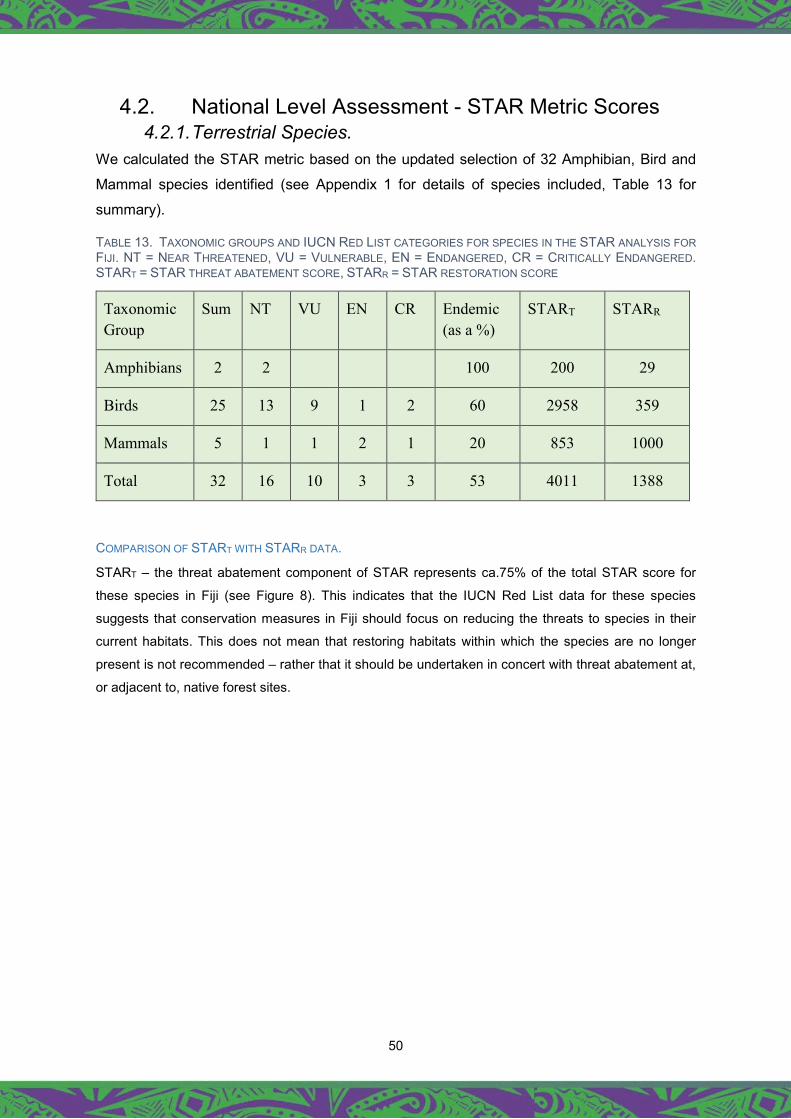
50
4.2. National Level Assessment - STAR Metric Scores 4.2.1. Terrestrial Species.
We calculated the STAR metric based on the updated selection of 32 Amphibian, Bird and
Mammal species identified (see Appendix 1 for details of species included, Table 13 for
summary).
TABLE 13. TAXONOMIC GROUPS AND IUCN RED LIST CATEGORIES FOR SPECIES IN THE STAR ANALYSIS FOR FIJI. NT = NEAR THREATENED, VU = VULNERABLE, EN = ENDANGERED, CR = CRITICALLY ENDANGERED. START = STAR THREAT ABATEMENT SCORE, STARR = STAR RESTORATION SCORE
Taxonomic Group
Sum NT VU EN CR Endemic (as a %)
START STARR
Amphibians 2 2 100 200 29
Birds 25 13 9 1 2 60 2958 359
Mammals 5 1 1 2 1 20 853 1000
Total 32 16 10 3 3 53 4011 1388
COMPARISON OF START WITH STARR DATA.
START – the threat abatement component of STAR represents ca.75% of the total STAR score for
these species in Fiji (see Figure 8). This indicates that the IUCN Red List data for these species
suggests that conservation measures in Fiji should focus on reducing the threats to species in their
current habitats. This does not mean that restoring habitats within which the species are no longer
present is not recommended – rather that it should be undertaken in concert with threat abatement at,
or adjacent to, native forest sites.
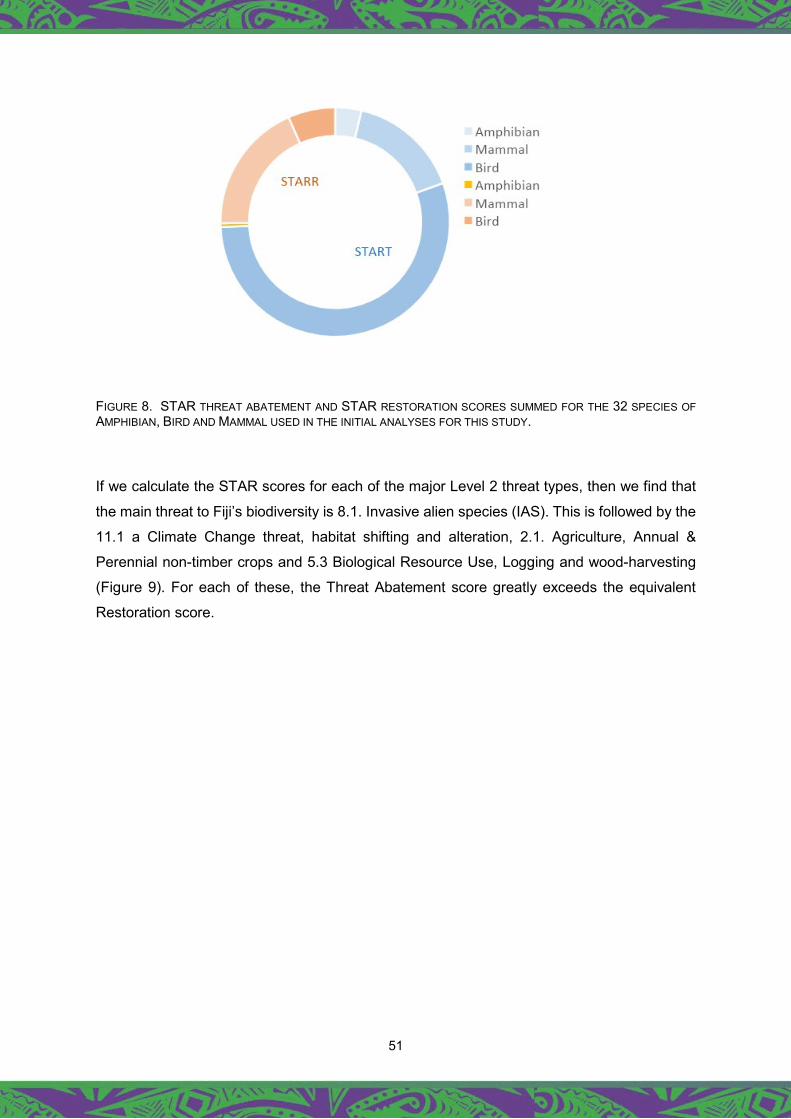
51
FIGURE 8. STAR THREAT ABATEMENT AND STAR RESTORATION SCORES SUMMED FOR THE 32 SPECIES OF AMPHIBIAN, BIRD AND MAMMAL USED IN THE INITIAL ANALYSES FOR THIS STUDY.
If we calculate the STAR scores for each of the major Level 2 threat types, then we find that
the main threat to Fiji’s biodiversity is 8.1. Invasive alien species (IAS). This is followed by the
11.1 a Climate Change threat, habitat shifting and alteration, 2.1. Agriculture, Annual &
Perennial non-timber crops and 5.3 Biological Resource Use, Logging and wood-harvesting
(Figure 9). For each of these, the Threat Abatement score greatly exceeds the equivalent
Restoration score.
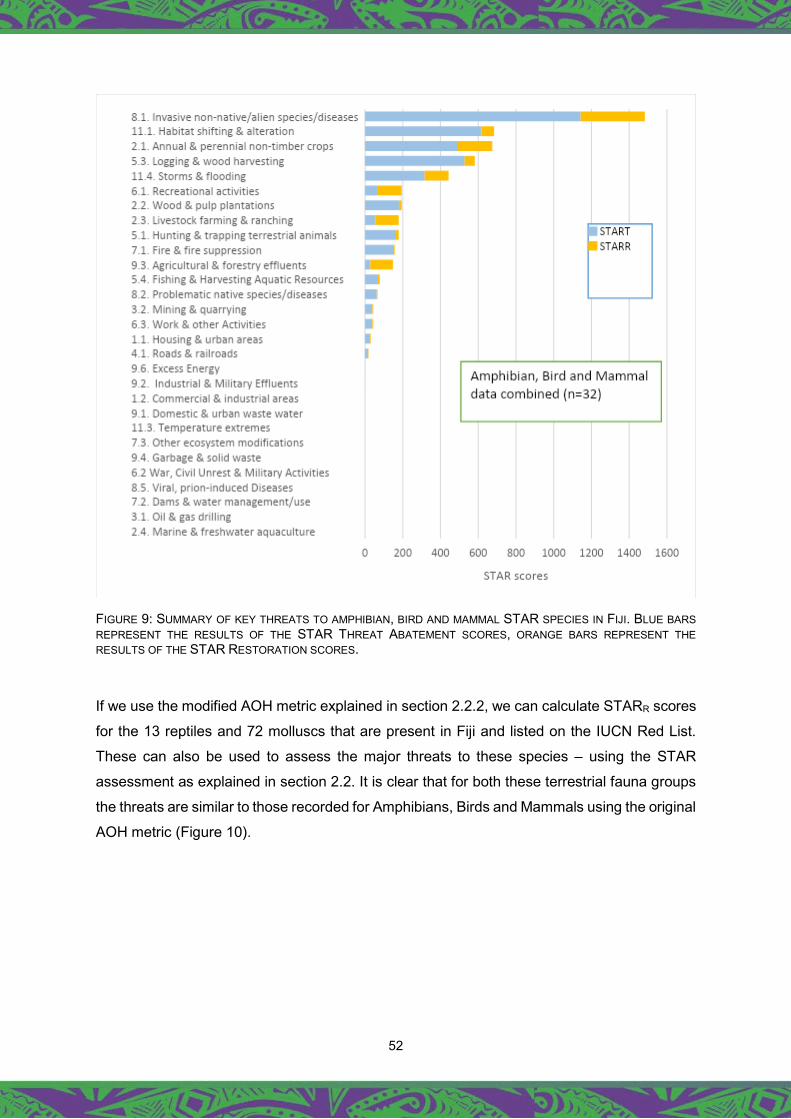
52
FIGURE 9: SUMMARY OF KEY THREATS TO AMPHIBIAN, BIRD AND MAMMAL STAR SPECIES IN FIJI. BLUE BARS REPRESENT THE RESULTS OF THE STAR THREAT ABATEMENT SCORES, ORANGE BARS REPRESENT THE RESULTS OF THE STAR RESTORATION SCORES.
If we use the modified AOH metric explained in section 2.2.2, we can calculate STARR scores
for the 13 reptiles and 72 molluscs that are present in Fiji and listed on the IUCN Red List.
These can also be used to assess the major threats to these species – using the STAR
assessment as explained in section 2.2. It is clear that for both these terrestrial fauna groups
the threats are similar to those recorded for Amphibians, Birds and Mammals using the original
AOH metric (Figure 10).
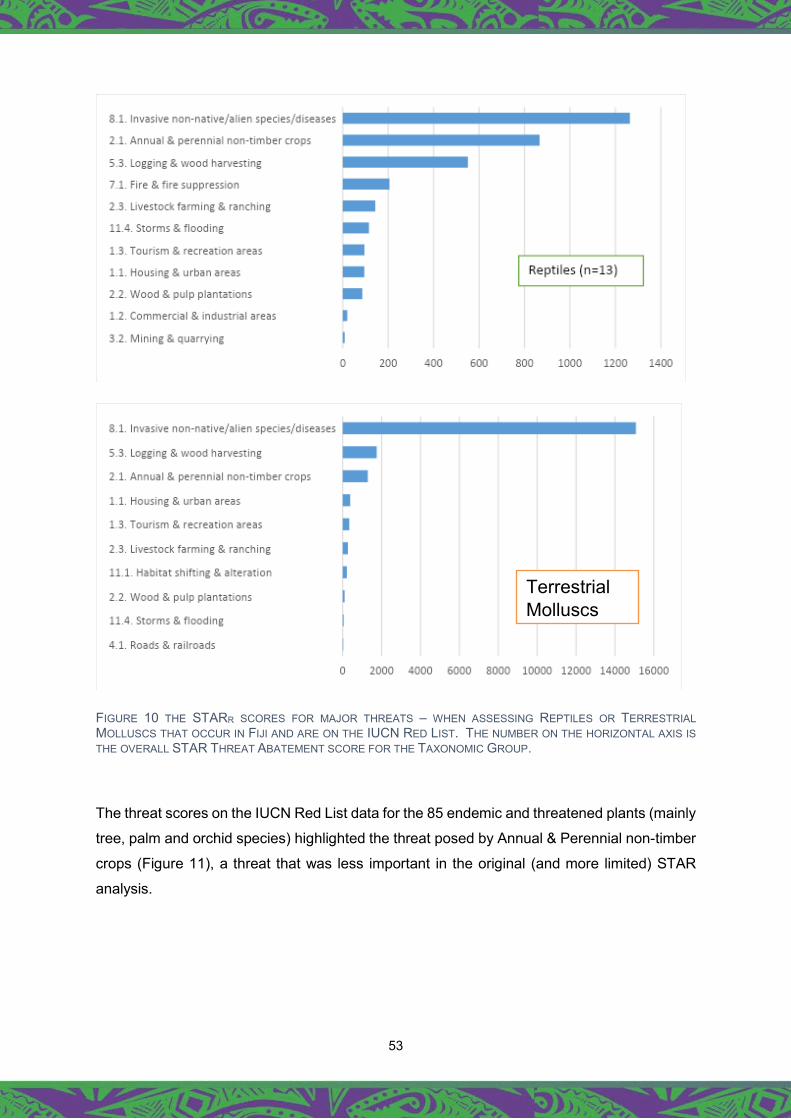
53
FIGURE 10 THE STARR SCORES FOR MAJOR THREATS – WHEN ASSESSING REPTILES OR TERRESTRIAL MOLLUSCS THAT OCCUR IN FIJI AND ARE ON THE IUCN RED LIST. THE NUMBER ON THE HORIZONTAL AXIS IS THE OVERALL STAR THREAT ABATEMENT SCORE FOR THE TAXONOMIC GROUP.
The threat scores on the IUCN Red List data for the 85 endemic and threatened plants (mainly
tree, palm and orchid species) highlighted the threat posed by Annual & Perennial non-timber
crops (Figure 11), a threat that was less important in the original (and more limited) STAR
analysis.
Terrestrial Molluscs
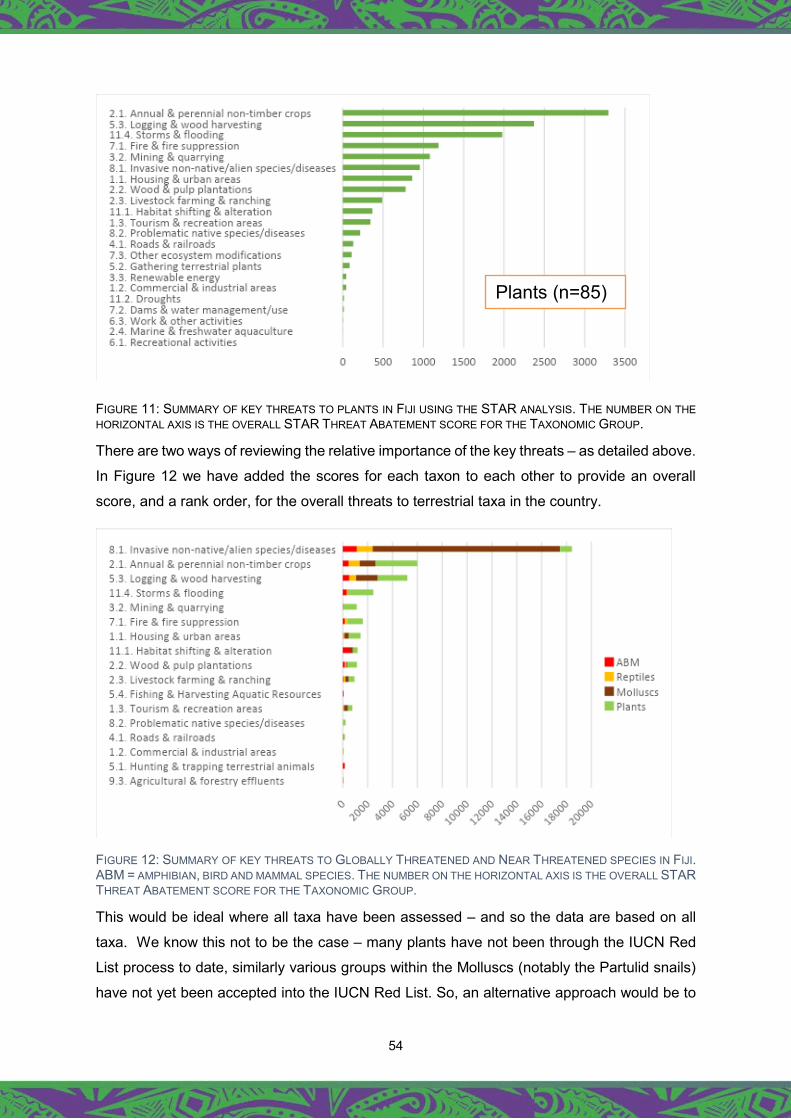
54
FIGURE 11: SUMMARY OF KEY THREATS TO PLANTS IN FIJI USING THE STAR ANALYSIS. THE NUMBER ON THE HORIZONTAL AXIS IS THE OVERALL STAR THREAT ABATEMENT SCORE FOR THE TAXONOMIC GROUP.
There are two ways of reviewing the relative importance of the key threats – as detailed above.
In Figure 12 we have added the scores for each taxon to each other to provide an overall
score, and a rank order, for the overall threats to terrestrial taxa in the country.
FIGURE 12: SUMMARY OF KEY THREATS TO GLOBALLY THREATENED AND NEAR THREATENED SPECIES IN FIJI. ABM = AMPHIBIAN, BIRD AND MAMMAL SPECIES. THE NUMBER ON THE HORIZONTAL AXIS IS THE OVERALL STAR THREAT ABATEMENT SCORE FOR THE TAXONOMIC GROUP.
This would be ideal where all taxa have been assessed – and so the data are based on all
taxa. We know this not to be the case – many plants have not been through the IUCN Red
List process to date, similarly various groups within the Molluscs (notably the Partulid snails)
have not yet been accepted into the IUCN Red List. So, an alternative approach would be to
Plants (n=85)

55
present the data highlighting the top ranked threats for each taxonomic group, as they stand,
and comparing across the taxa. This is presented in Table 14 below.
TABLE 14. THE PRIORITY THREATS FOR EACH TERRESTRIAL TAXONOMIC GROUP, USING THE START ANALYSIS. DATA FOR EACH GROUP ARE PRESENTED SEPARATELY ABOVE. ABM = AMPHIBIANS, BIRDS AND MAMMALS.
Threat classification level (IUCN-CMP) ABM
Reptiles
Molluscs
Plants
Level 1. Level 2
1. Residential and commercial development
1.1 Housing and urban areas
1.2 Commercial and industrial areas
1.3 Tourism and recreation areas
2. Agriculture & Aquaculture
2.1 Annual & perennial non-timber crops
2.2 Wood & pulp plantations
2.3 Livestock farming & ranching
2.4 Marine & freshwater aquaculture
3. Energy production & mining
3.1 Oil & gas drilling
3.2 Mining & quarrying
3.3 Renewable energy
4. Transportation & service corridors
4.1 Roads & railways
4.2 Utility & service lines
4.3 Shipping lanes
4.4 Flight paths
5. Biological resource use
5.1 Hunting & trapping terrestrial animals
5.2 Gathering terrestrial plants
5.3 Logging & wood harvesting
5.4 Fishing & harvesting aquatic resources
6. Human intrusions & disturbances
6.1 Recreational activities
6.2 War, civil unrest & military exercises
6.3 Work & other activities
7. Natural system modifications
7.1 Fire & fire suppression
7.2 Dames & water management/use
7.3 Other ecosystem modifications
8.1 Invasive non-native species/diseases
8.2 Problematic native species/diseases
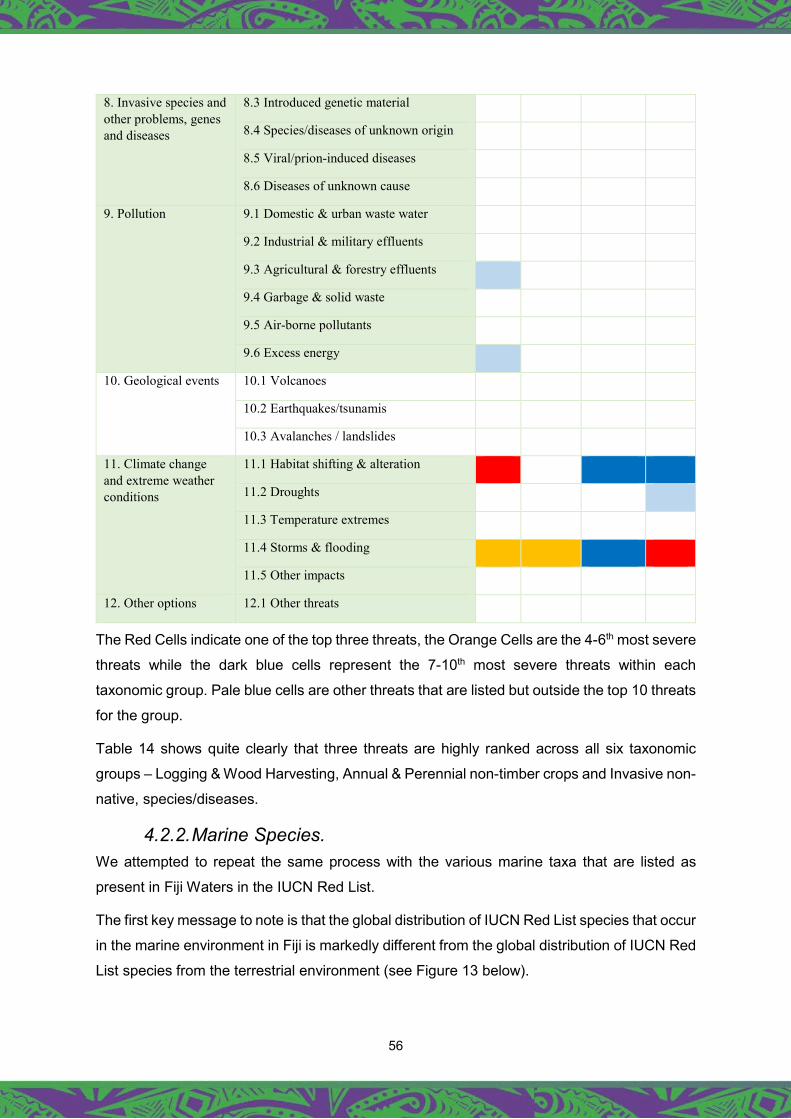
56
8. Invasive species and other problems, genes and diseases
8.3 Introduced genetic material
8.4 Species/diseases of unknown origin
8.5 Viral/prion-induced diseases
8.6 Diseases of unknown cause
9. Pollution 9.1 Domestic & urban waste water
9.2 Industrial & military effluents
9.3 Agricultural & forestry effluents
9.4 Garbage & solid waste
9.5 Air-borne pollutants
9.6 Excess energy
10. Geological events 10.1 Volcanoes
10.2 Earthquakes/tsunamis
10.3 Avalanches / landslides
11. Climate change and extreme weather conditions
11.1 Habitat shifting & alteration
11.2 Droughts
11.3 Temperature extremes
11.4 Storms & flooding
11.5 Other impacts
12. Other options 12.1 Other threats
The Red Cells indicate one of the top three threats, the Orange Cells are the 4-6th most severe
threats while the dark blue cells represent the 7-10th most severe threats within each
taxonomic group. Pale blue cells are other threats that are listed but outside the top 10 threats
for the group.
Table 14 shows quite clearly that three threats are highly ranked across all six taxonomic
groups – Logging & Wood Harvesting, Annual & Perennial non-timber crops and Invasive non-
native, species/diseases.
4.2.2. Marine Species. We attempted to repeat the same process with the various marine taxa that are listed as
present in Fiji Waters in the IUCN Red List.
The first key message to note is that the global distribution of IUCN Red List species that occur
in the marine environment in Fiji is markedly different from the global distribution of IUCN Red
List species from the terrestrial environment (see Figure 13 below).
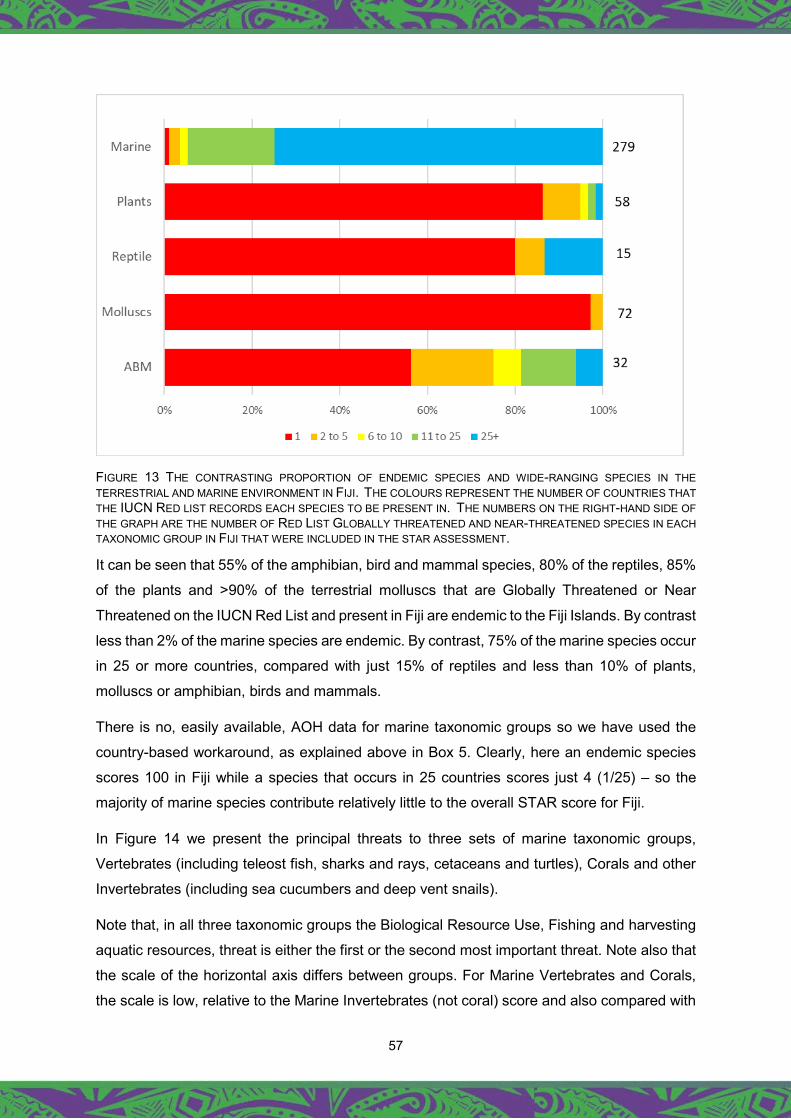
57
FIGURE 13 THE CONTRASTING PROPORTION OF ENDEMIC SPECIES AND WIDE-RANGING SPECIES IN THE TERRESTRIAL AND MARINE ENVIRONMENT IN FIJI. THE COLOURS REPRESENT THE NUMBER OF COUNTRIES THAT THE IUCN RED LIST RECORDS EACH SPECIES TO BE PRESENT IN. THE NUMBERS ON THE RIGHT-HAND SIDE OF THE GRAPH ARE THE NUMBER OF RED LIST GLOBALLY THREATENED AND NEAR-THREATENED SPECIES IN EACH TAXONOMIC GROUP IN FIJI THAT WERE INCLUDED IN THE STAR ASSESSMENT.
It can be seen that 55% of the amphibian, bird and mammal species, 80% of the reptiles, 85%
of the plants and >90% of the terrestrial molluscs that are Globally Threatened or Near
Threatened on the IUCN Red List and present in Fiji are endemic to the Fiji Islands. By contrast
less than 2% of the marine species are endemic. By contrast, 75% of the marine species occur
in 25 or more countries, compared with just 15% of reptiles and less than 10% of plants,
molluscs or amphibian, birds and mammals.
There is no, easily available, AOH data for marine taxonomic groups so we have used the
country-based workaround, as explained above in Box 5. Clearly, here an endemic species
scores 100 in Fiji while a species that occurs in 25 countries scores just 4 (1/25) – so the
majority of marine species contribute relatively little to the overall STAR score for Fiji.
In Figure 14 we present the principal threats to three sets of marine taxonomic groups,
Vertebrates (including teleost fish, sharks and rays, cetaceans and turtles), Corals and other
Invertebrates (including sea cucumbers and deep vent snails).
Note that, in all three taxonomic groups the Biological Resource Use, Fishing and harvesting
aquatic resources, threat is either the first or the second most important threat. Note also that
the scale of the horizontal axis differs between groups. For Marine Vertebrates and Corals,
the scale is low, relative to the Marine Invertebrates (not coral) score and also compared with
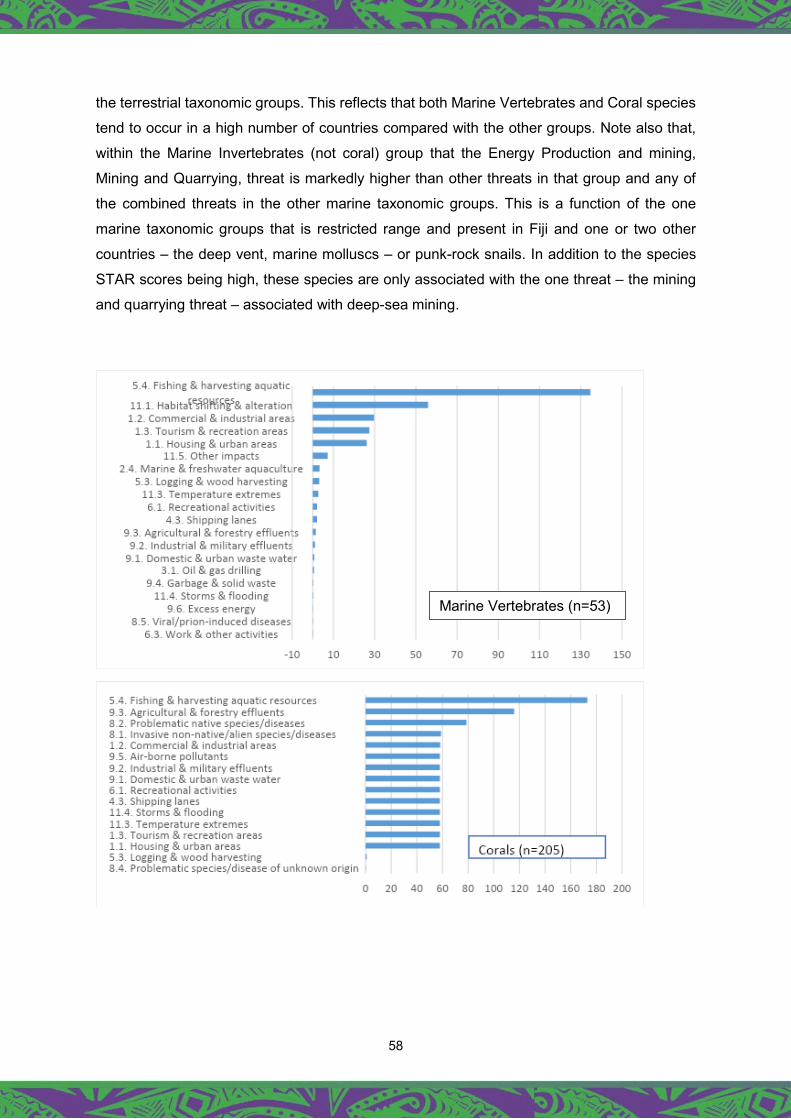
58
the terrestrial taxonomic groups. This reflects that both Marine Vertebrates and Coral species
tend to occur in a high number of countries compared with the other groups. Note also that,
within the Marine Invertebrates (not coral) group that the Energy Production and mining,
Mining and Quarrying, threat is markedly higher than other threats in that group and any of
the combined threats in the other marine taxonomic groups. This is a function of the one
marine taxonomic groups that is restricted range and present in Fiji and one or two other
countries – the deep vent, marine molluscs – or punk-rock snails. In addition to the species
STAR scores being high, these species are only associated with the one threat – the mining
and quarrying threat – associated with deep-sea mining.
Marine Vertebrates (n=53)
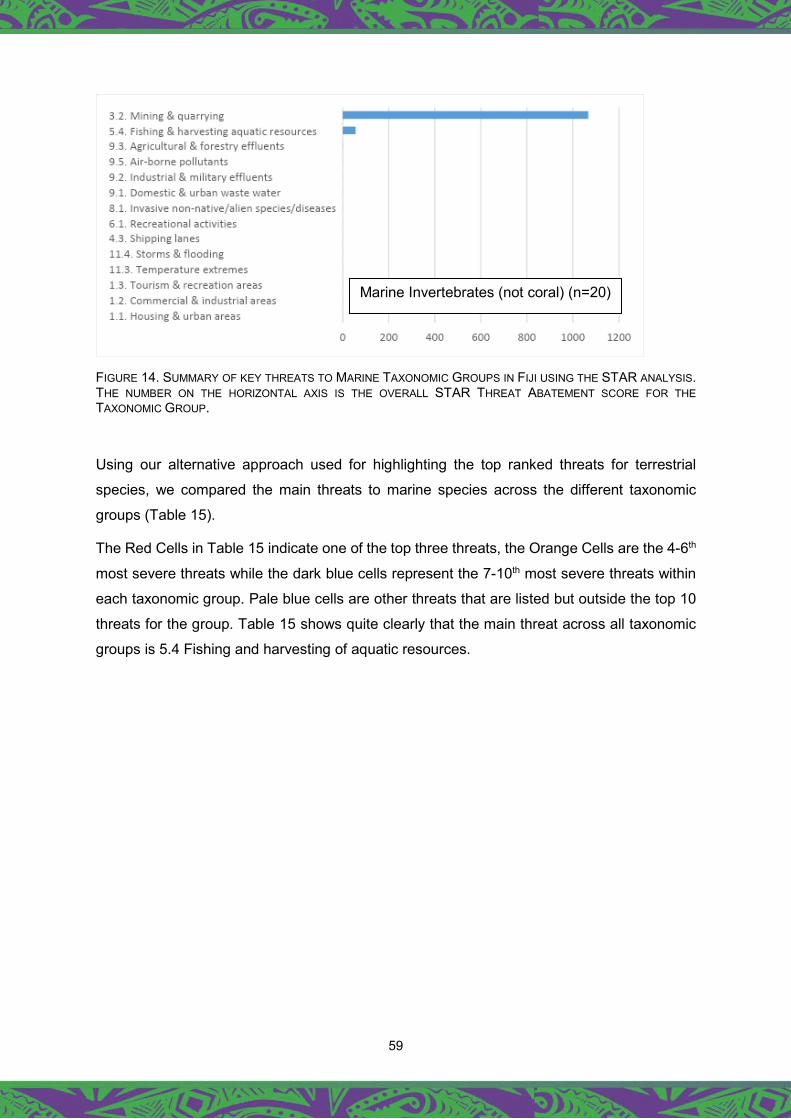
59
FIGURE 14. SUMMARY OF KEY THREATS TO MARINE TAXONOMIC GROUPS IN FIJI USING THE STAR ANALYSIS. THE NUMBER ON THE HORIZONTAL AXIS IS THE OVERALL STAR THREAT ABATEMENT SCORE FOR THE TAXONOMIC GROUP.
Using our alternative approach used for highlighting the top ranked threats for terrestrial
species, we compared the main threats to marine species across the different taxonomic
groups (Table 15).
The Red Cells in Table 15 indicate one of the top three threats, the Orange Cells are the 4-6th
most severe threats while the dark blue cells represent the 7-10th most severe threats within
each taxonomic group. Pale blue cells are other threats that are listed but outside the top 10
threats for the group. Table 15 shows quite clearly that the main threat across all taxonomic
groups is 5.4 Fishing and harvesting of aquatic resources.
Marine Invertebrates (not coral) (n=20)
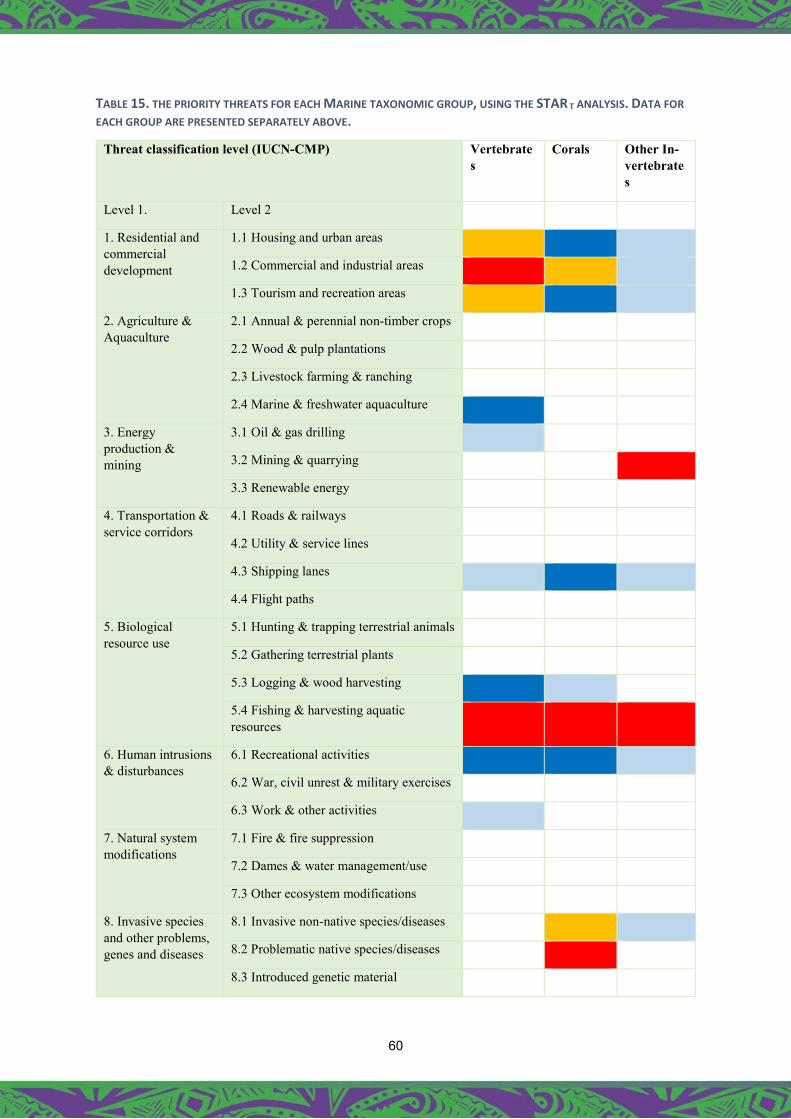
60
TABLE 15. THE PRIORITY THREATS FOR EACH MARINE TAXONOMIC GROUP, USING THE STAR T ANALYSIS. DATA FOR EACH GROUP ARE PRESENTED SEPARATELY ABOVE.
Threat classification level (IUCN-CMP) Vertebrates
Corals Other In-vertebrates
Level 1. Level 2
1. Residential and commercial development
1.1 Housing and urban areas
1.2 Commercial and industrial areas
1.3 Tourism and recreation areas
2. Agriculture & Aquaculture
2.1 Annual & perennial non-timber crops
2.2 Wood & pulp plantations
2.3 Livestock farming & ranching
2.4 Marine & freshwater aquaculture
3. Energy production & mining
3.1 Oil & gas drilling
3.2 Mining & quarrying
3.3 Renewable energy
4. Transportation & service corridors
4.1 Roads & railways
4.2 Utility & service lines
4.3 Shipping lanes
4.4 Flight paths
5. Biological resource use
5.1 Hunting & trapping terrestrial animals
5.2 Gathering terrestrial plants
5.3 Logging & wood harvesting
5.4 Fishing & harvesting aquatic resources
6. Human intrusions & disturbances
6.1 Recreational activities
6.2 War, civil unrest & military exercises
6.3 Work & other activities
7. Natural system modifications
7.1 Fire & fire suppression
7.2 Dames & water management/use
7.3 Other ecosystem modifications
8. Invasive species and other problems, genes and diseases
8.1 Invasive non-native species/diseases
8.2 Problematic native species/diseases
8.3 Introduced genetic material

61
8.4 Species/diseases of unknown origin
8.5 Viral/prion-induced diseases
8.6 Diseases of unknown cause
9. Pollution 9.1 Domestic & urban waste water
9.2 Industrial & military effluents
9.3 Agricultural & forestry effluents
9.4 Garbage & solid waste
9.5 Air-borne pollutants
9.6 Excess energy
10. Geological events
10.1 Volcanoes
10.2 Earthquakes/tsunamis
10.3 Avalanches / landslides
11. Climate change and extreme weather conditions
11.1 Habitat shifting & alteration
11.2 Droughts
11.3 Temperature extremes
11.4 Storms & flooding
11.5 Other impacts
12. Other options 12.1 Other threats
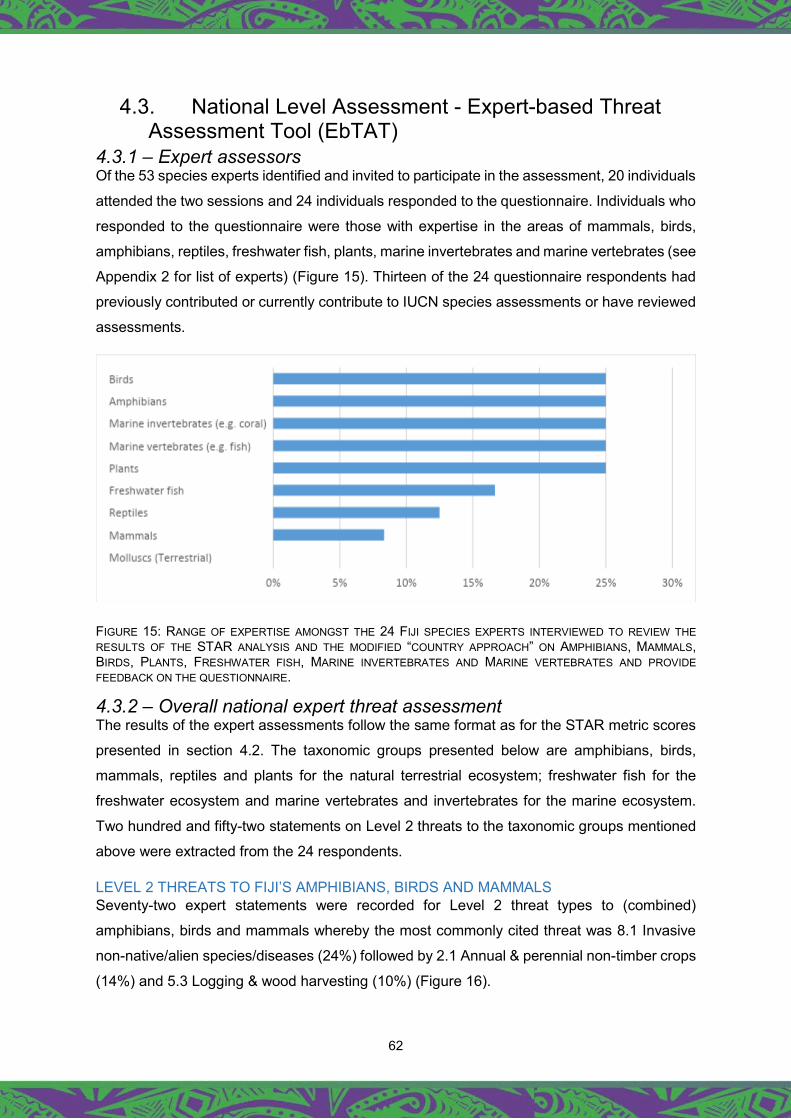
62
4.3. National Level Assessment - Expert-based Threat Assessment Tool (EbTAT)
4.3.1 – Expert assessors Of the 53 species experts identified and invited to participate in the assessment, 20 individuals
attended the two sessions and 24 individuals responded to the questionnaire. Individuals who
responded to the questionnaire were those with expertise in the areas of mammals, birds,
amphibians, reptiles, freshwater fish, plants, marine invertebrates and marine vertebrates (see
Appendix 2 for list of experts) (Figure 15). Thirteen of the 24 questionnaire respondents had
previously contributed or currently contribute to IUCN species assessments or have reviewed
assessments.
FIGURE 15: RANGE OF EXPERTISE AMONGST THE 24 FIJI SPECIES EXPERTS INTERVIEWED TO REVIEW THE RESULTS OF THE STAR ANALYSIS AND THE MODIFIED “COUNTRY APPROACH” ON AMPHIBIANS, MAMMALS, BIRDS, PLANTS, FRESHWATER FISH, MARINE INVERTEBRATES AND MARINE VERTEBRATES AND PROVIDE FEEDBACK ON THE QUESTIONNAIRE.
4.3.2 – Overall national expert threat assessment The results of the expert assessments follow the same format as for the STAR metric scores
presented in section 4.2. The taxonomic groups presented below are amphibians, birds,
mammals, reptiles and plants for the natural terrestrial ecosystem; freshwater fish for the
freshwater ecosystem and marine vertebrates and invertebrates for the marine ecosystem.
Two hundred and fifty-two statements on Level 2 threats to the taxonomic groups mentioned
above were extracted from the 24 respondents.
LEVEL 2 THREATS TO FIJI’S AMPHIBIANS, BIRDS AND MAMMALS Seventy-two expert statements were recorded for Level 2 threat types to (combined)
amphibians, birds and mammals whereby the most commonly cited threat was 8.1 Invasive
non-native/alien species/diseases (24%) followed by 2.1 Annual & perennial non-timber crops
(14%) and 5.3 Logging & wood harvesting (10%) (Figure 16).
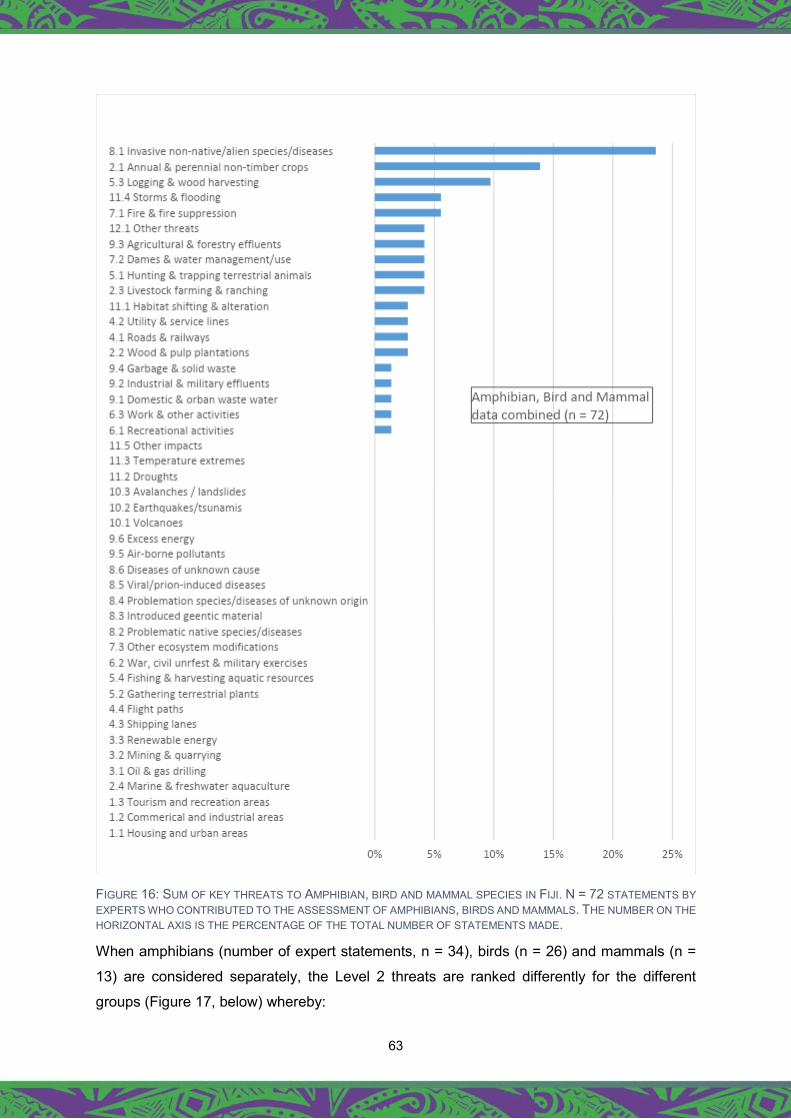
63
FIGURE 16: SUM OF KEY THREATS TO AMPHIBIAN, BIRD AND MAMMAL SPECIES IN FIJI. N = 72 STATEMENTS BY EXPERTS WHO CONTRIBUTED TO THE ASSESSMENT OF AMPHIBIANS, BIRDS AND MAMMALS. THE NUMBER ON THE HORIZONTAL AXIS IS THE PERCENTAGE OF THE TOTAL NUMBER OF STATEMENTS MADE.
When amphibians (number of expert statements, n = 34), birds (n = 26) and mammals (n =
13) are considered separately, the Level 2 threats are ranked differently for the different
groups (Figure 17, below) whereby:
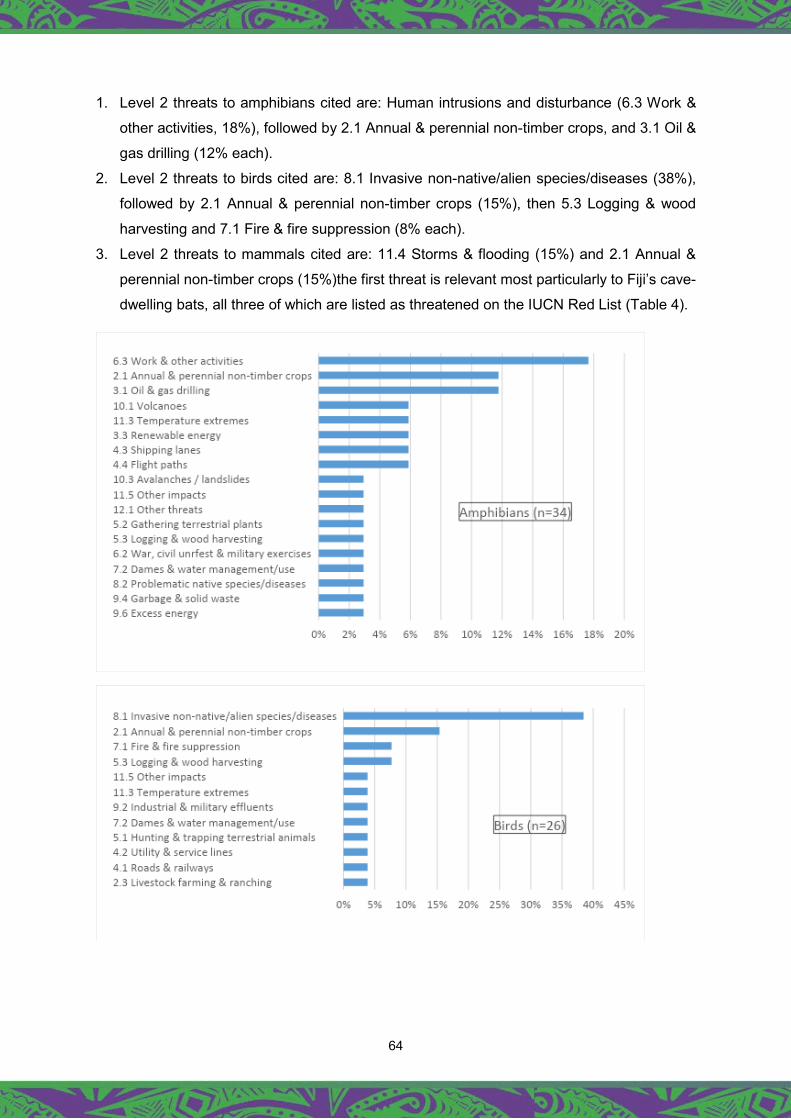
64
1. Level 2 threats to amphibians cited are: Human intrusions and disturbance (6.3 Work &
other activities, 18%), followed by 2.1 Annual & perennial non-timber crops, and 3.1 Oil &
gas drilling (12% each).
2. Level 2 threats to birds cited are: 8.1 Invasive non-native/alien species/diseases (38%),
followed by 2.1 Annual & perennial non-timber crops (15%), then 5.3 Logging & wood
harvesting and 7.1 Fire & fire suppression (8% each).
3. Level 2 threats to mammals cited are: 11.4 Storms & flooding (15%) and 2.1 Annual &
perennial non-timber crops (15%)the first threat is relevant most particularly to Fiji’s cave-
dwelling bats, all three of which are listed as threatened on the IUCN Red List (Table 4).
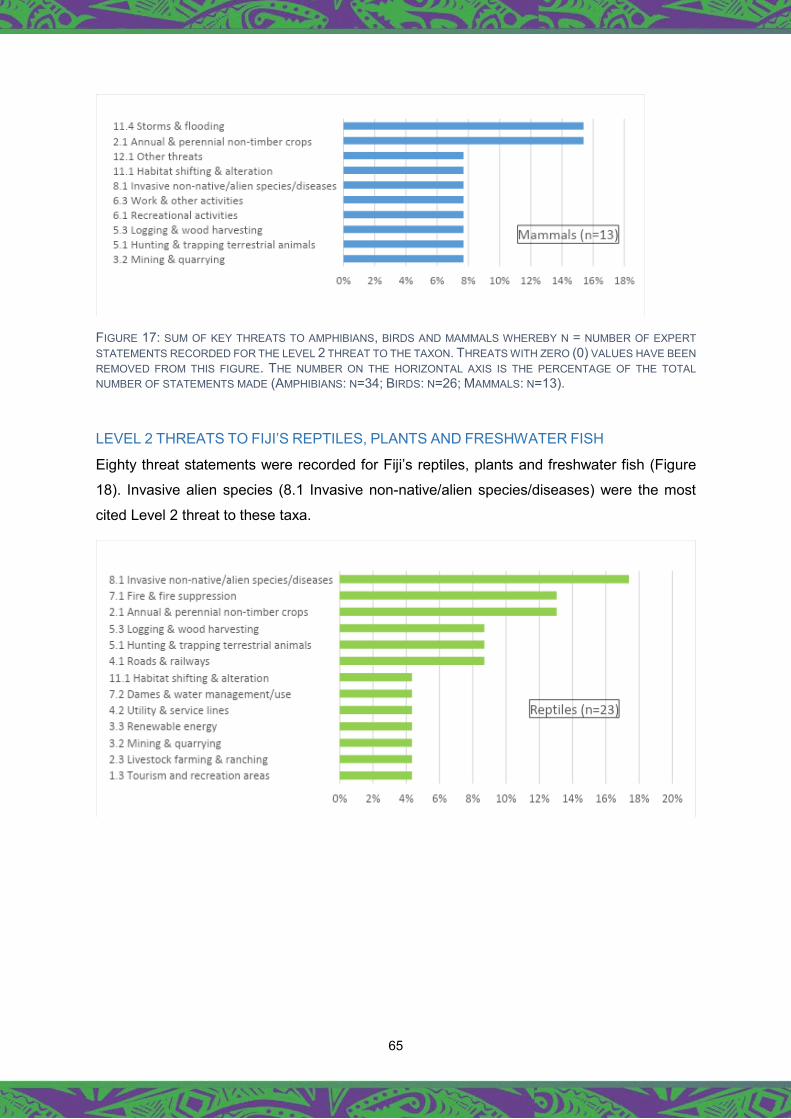
65
FIGURE 17: SUM OF KEY THREATS TO AMPHIBIANS, BIRDS AND MAMMALS WHEREBY N = NUMBER OF EXPERT STATEMENTS RECORDED FOR THE LEVEL 2 THREAT TO THE TAXON. THREATS WITH ZERO (0) VALUES HAVE BEEN REMOVED FROM THIS FIGURE. THE NUMBER ON THE HORIZONTAL AXIS IS THE PERCENTAGE OF THE TOTAL NUMBER OF STATEMENTS MADE (AMPHIBIANS: N=34; BIRDS: N=26; MAMMALS: N=13).
LEVEL 2 THREATS TO FIJI’S REPTILES, PLANTS AND FRESHWATER FISH
Eighty threat statements were recorded for Fiji’s reptiles, plants and freshwater fish (Figure
18). Invasive alien species (8.1 Invasive non-native/alien species/diseases) were the most
cited Level 2 threat to these taxa.

66
FIGURE 18: LEVEL 2 THREATS TO FIJI'S REPTILES, PLANTS AND FRESHWATER FISH AS CITED BY EXPERTS CONSULTED. N= NUMBER OF EXPERT STATEMENTS RECORDED FOR THE LEVEL 2 THREAT TO THE TAXON. THREATS WITH ZERO (0) VALUES HAVE BEEN REMOVED FROM THIS FIGURE. THE NUMBER ON THE HORIZONTAL AXIS IS THE PERCENTAGE OF THE TOTAL NUMBER OF STATEMENTS MADE (REPTILES: N=23; PLANTS: N=25; FRESHWATER FISH: N=32).
As with the comparison of threats approach across the different taxa used for the START
analysis (section 4.2), we also compared the main threats across all terrestrial taxa based on
the expert assessments (Table 16). The Red Cells indicate one of the top 3 threats, the Orange
Cells the 4-6th most severe threats while the dark blue cells represent the 7-10th most severe
threats within each taxonomic group. Pale blue cells are other threats that are listed but
outside the top 10 threats
Table 16 shows that two threats are highly ranked across all three taxonomic groups - 2.1
Annual & perennial non-timber crops and 8.1 Invasive non-native species/diseases.
In Table 17 we compare the results of the expert assessments with the START results and the
literature review. The table shows consistency between the results of the STAR metric and
the expert assessments in that 2.1 Annual & perennial non-timber crops, 5.3 Logging & wood
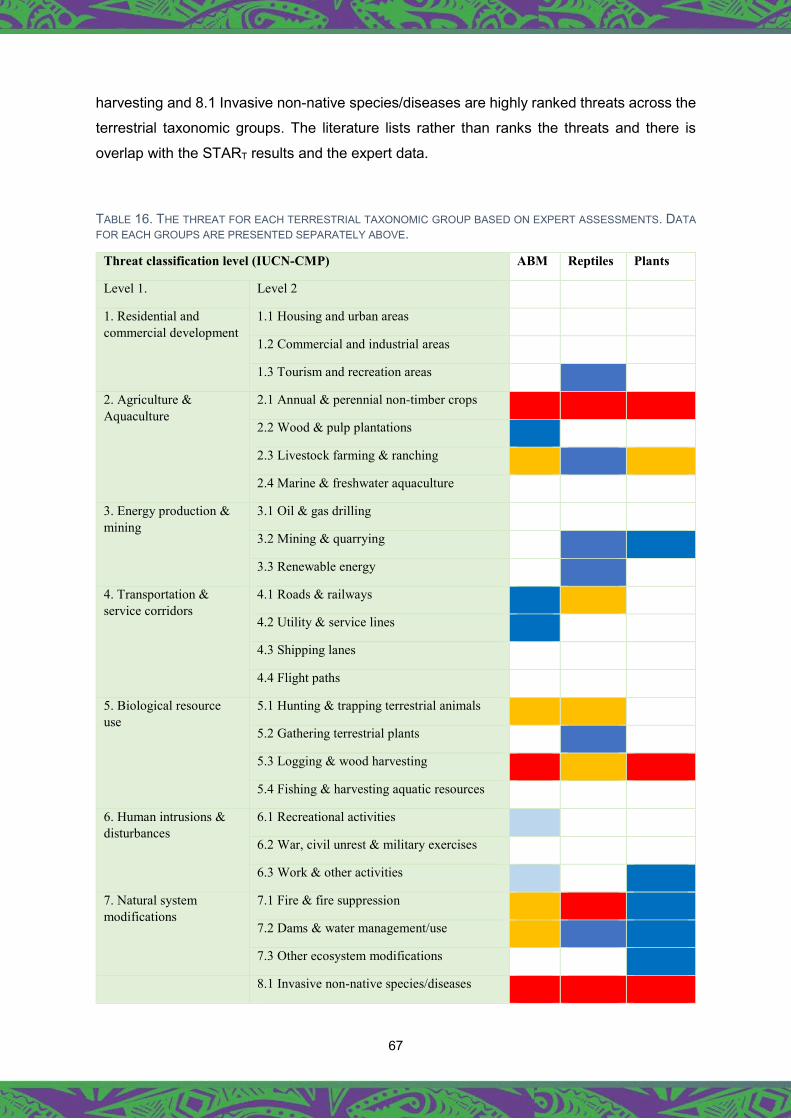
67
harvesting and 8.1 Invasive non-native species/diseases are highly ranked threats across the
terrestrial taxonomic groups. The literature lists rather than ranks the threats and there is
overlap with the START results and the expert data.
TABLE 16. THE THREAT FOR EACH TERRESTRIAL TAXONOMIC GROUP BASED ON EXPERT ASSESSMENTS. DATA FOR EACH GROUPS ARE PRESENTED SEPARATELY ABOVE.
Threat classification level (IUCN-CMP) ABM Reptiles Plants
Level 1. Level 2
1. Residential and commercial development
1.1 Housing and urban areas
1.2 Commercial and industrial areas
1.3 Tourism and recreation areas
2. Agriculture & Aquaculture
2.1 Annual & perennial non-timber crops
2.2 Wood & pulp plantations
2.3 Livestock farming & ranching
2.4 Marine & freshwater aquaculture
3. Energy production & mining
3.1 Oil & gas drilling
3.2 Mining & quarrying
3.3 Renewable energy
4. Transportation & service corridors
4.1 Roads & railways
4.2 Utility & service lines
4.3 Shipping lanes
4.4 Flight paths
5. Biological resource use
5.1 Hunting & trapping terrestrial animals
5.2 Gathering terrestrial plants
5.3 Logging & wood harvesting
5.4 Fishing & harvesting aquatic resources
6. Human intrusions & disturbances
6.1 Recreational activities
6.2 War, civil unrest & military exercises
6.3 Work & other activities
7. Natural system modifications
7.1 Fire & fire suppression
7.2 Dams & water management/use
7.3 Other ecosystem modifications
8.1 Invasive non-native species/diseases

68
8. Invasive species and other problems, genes and diseases
8.2 Problematic native species/diseases
8.3 Introduced genetic material
8.4 Species/diseases of unknown origin
8.5 Viral/prion-induced diseases
8.6 Diseases of unknown cause
9. Pollution 9.1 Domestic & urban waste water
9.2 Industrial & military effluents
9.3 Agricultural & forestry effluents
9.4 Garbage & solid waste
9.5 Air-borne pollutants
9.6 Excess energy
10. Geological events 10.1 Volcanoes
10.2 Earthquakes/tsunamis
10.3 Avalanches / landslides
11. Climate change and extreme weather conditions
11.1 Habitat shifting & alteration
11.2 Droughts
11.3 Temperature extremes
11.4 Storms & flooding
11.5 Other impacts
12. Other options 12.1 Other threats
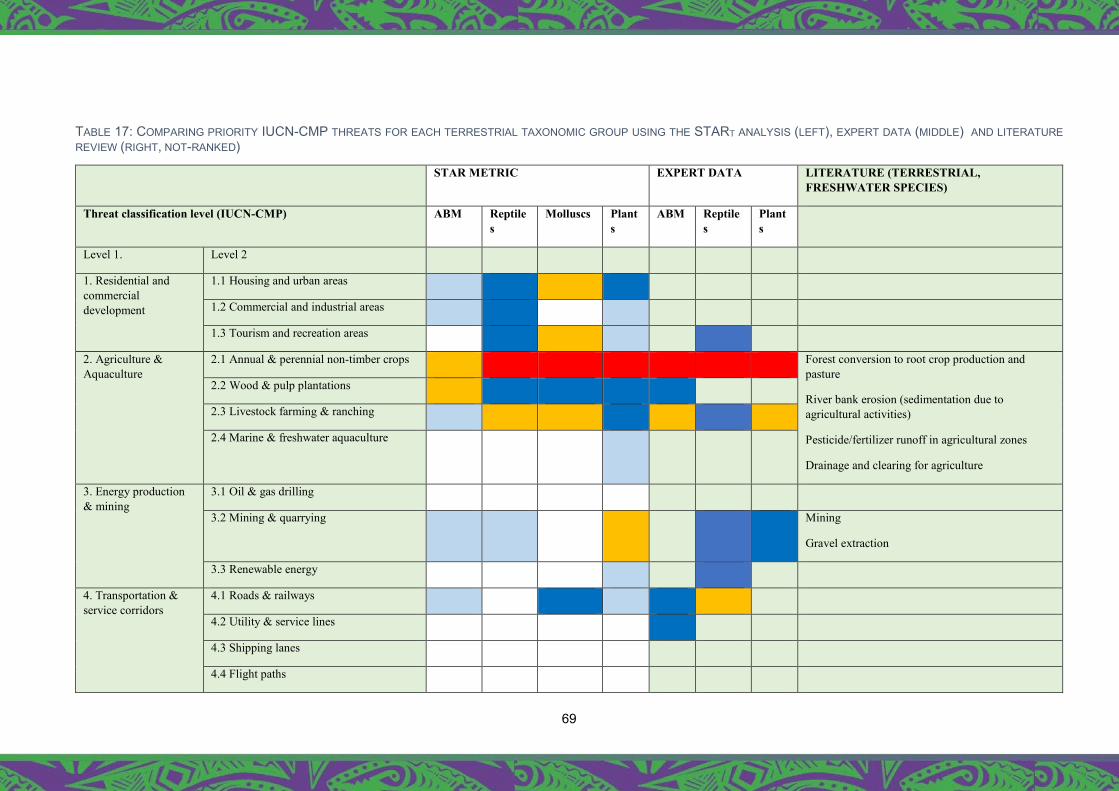
69
TABLE 17: COMPARING PRIORITY IUCN-CMP THREATS FOR EACH TERRESTRIAL TAXONOMIC GROUP USING THE START ANALYSIS (LEFT), EXPERT DATA (MIDDLE) AND LITERATURE REVIEW (RIGHT, NOT-RANKED)
STAR METRIC EXPERT DATA LITERATURE (TERRESTRIAL, FRESHWATER SPECIES)
Threat classification level (IUCN-CMP) ABM Reptiles
Molluscs Plants
ABM Reptiles
Plants
Level 1. Level 2
1. Residential and commercial development
1.1 Housing and urban areas
1.2 Commercial and industrial areas
1.3 Tourism and recreation areas
2. Agriculture & Aquaculture
2.1 Annual & perennial non-timber crops Forest conversion to root crop production and pasture
River bank erosion (sedimentation due to agricultural activities)
Pesticide/fertilizer runoff in agricultural zones
Drainage and clearing for agriculture
2.2 Wood & pulp plantations
2.3 Livestock farming & ranching
2.4 Marine & freshwater aquaculture
3. Energy production & mining
3.1 Oil & gas drilling
3.2 Mining & quarrying Mining
Gravel extraction
3.3 Renewable energy
4. Transportation & service corridors
4.1 Roads & railways
4.2 Utility & service lines
4.3 Shipping lanes
4.4 Flight paths
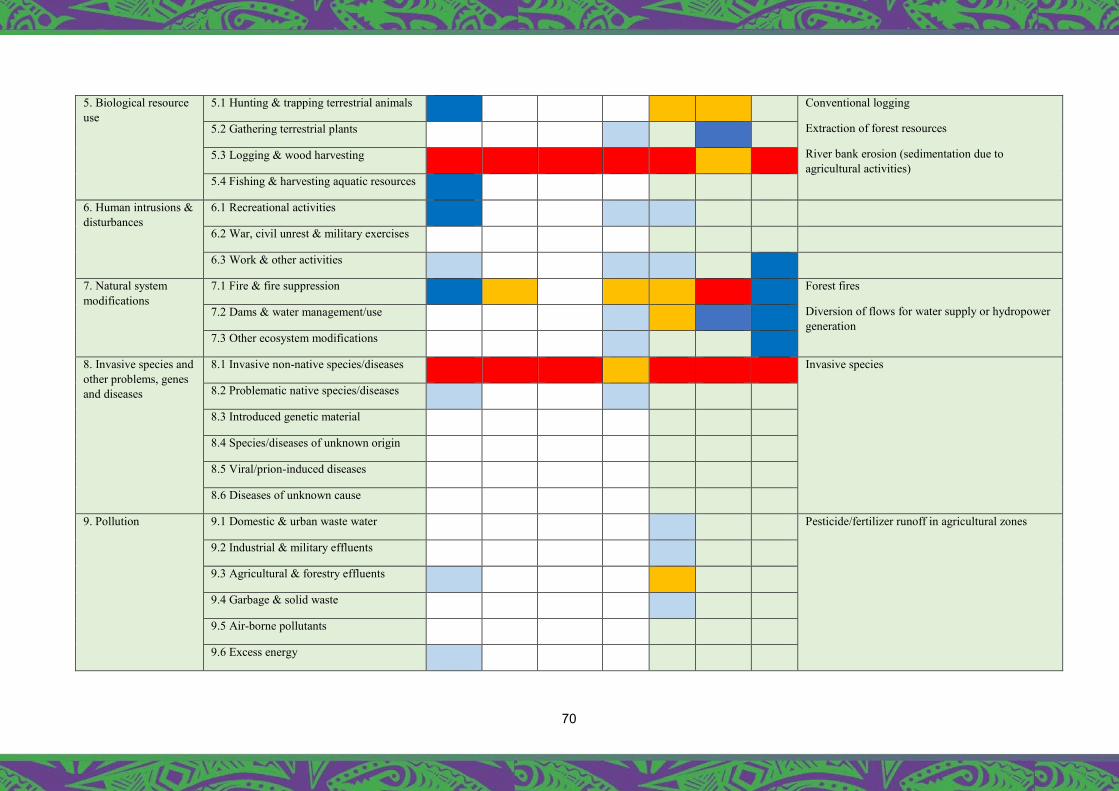
70
5. Biological resource use
5.1 Hunting & trapping terrestrial animals Conventional logging
Extraction of forest resources
River bank erosion (sedimentation due to agricultural activities)
5.2 Gathering terrestrial plants
5.3 Logging & wood harvesting
5.4 Fishing & harvesting aquatic resources
6. Human intrusions & disturbances
6.1 Recreational activities
6.2 War, civil unrest & military exercises
6.3 Work & other activities
7. Natural system modifications
7.1 Fire & fire suppression Forest fires
Diversion of flows for water supply or hydropower generation
7.2 Dams & water management/use
7.3 Other ecosystem modifications
8. Invasive species and other problems, genes and diseases
8.1 Invasive non-native species/diseases Invasive species
8.2 Problematic native species/diseases
8.3 Introduced genetic material
8.4 Species/diseases of unknown origin
8.5 Viral/prion-induced diseases
8.6 Diseases of unknown cause
9. Pollution 9.1 Domestic & urban waste water Pesticide/fertilizer runoff in agricultural zones
9.2 Industrial & military effluents
9.3 Agricultural & forestry effluents
9.4 Garbage & solid waste
9.5 Air-borne pollutants
9.6 Excess energy

71
10. Geological events 10.1 Volcanoes
10.2 Earthquakes/tsunamis
10.3 Avalanches / landslides
11. Climate change and extreme weather conditions
11.1 Habitat shifting & alteration
11.2 Droughts
11.3 Temperature extremes
11.4 Storms & flooding
11.5 Other impacts
12. Other options 12.1 Other threats Dereservation of protected areas
Poorly planned infrastructure development
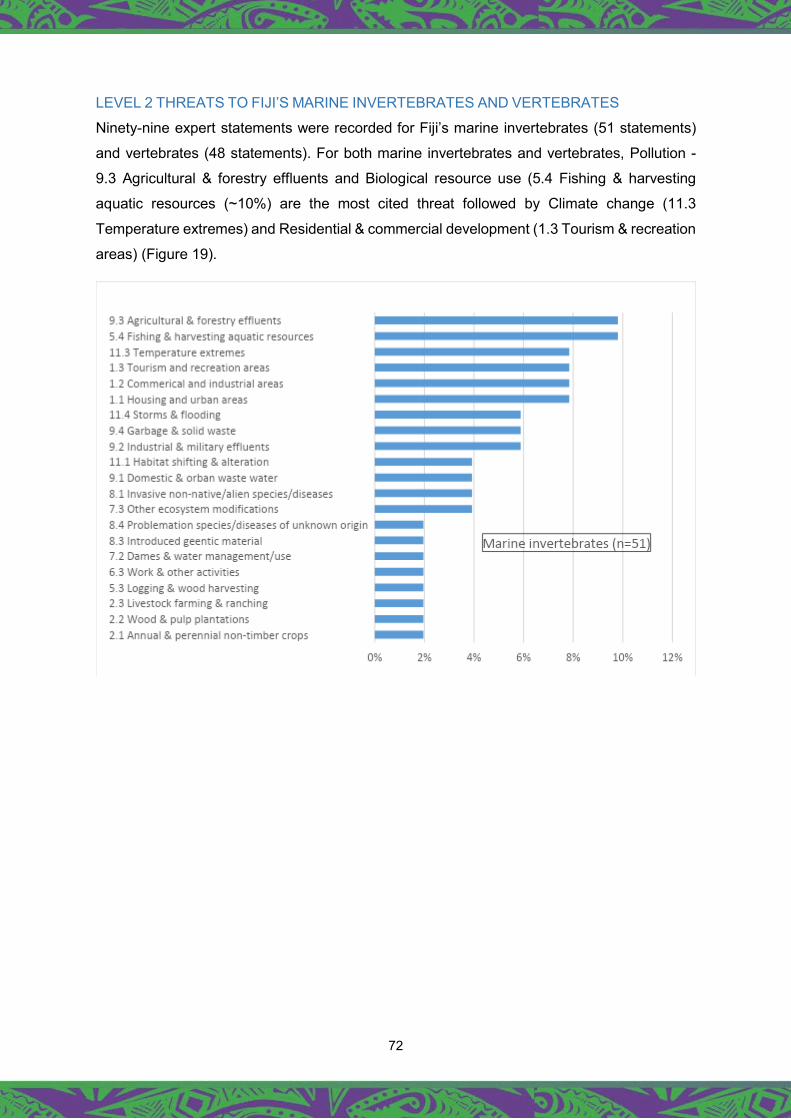
72
LEVEL 2 THREATS TO FIJI’S MARINE INVERTEBRATES AND VERTEBRATES
Ninety-nine expert statements were recorded for Fiji’s marine invertebrates (51 statements)
and vertebrates (48 statements). For both marine invertebrates and vertebrates, Pollution -
9.3 Agricultural & forestry effluents and Biological resource use (5.4 Fishing & harvesting
aquatic resources (~10%) are the most cited threat followed by Climate change (11.3
Temperature extremes) and Residential & commercial development (1.3 Tourism & recreation
areas) (Figure 19).
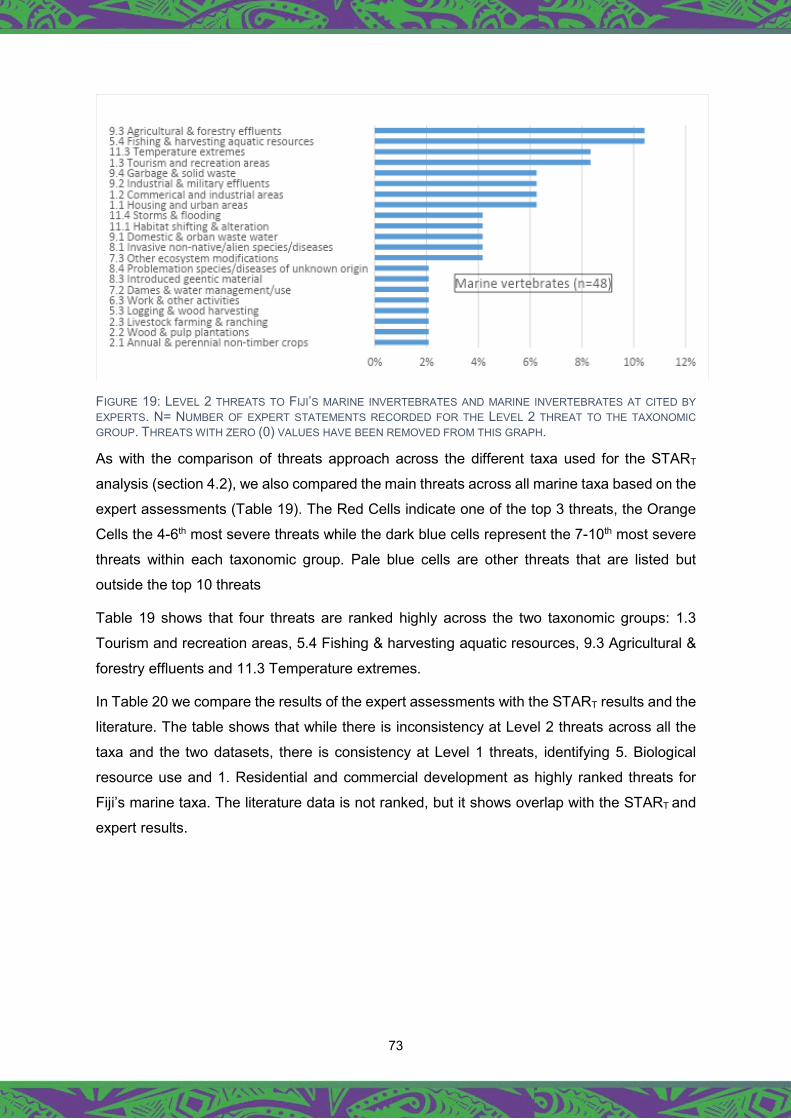
73
FIGURE 19: LEVEL 2 THREATS TO FIJI’S MARINE INVERTEBRATES AND MARINE INVERTEBRATES AT CITED BY EXPERTS. N= NUMBER OF EXPERT STATEMENTS RECORDED FOR THE LEVEL 2 THREAT TO THE TAXONOMIC GROUP. THREATS WITH ZERO (0) VALUES HAVE BEEN REMOVED FROM THIS GRAPH.
As with the comparison of threats approach across the different taxa used for the START
analysis (section 4.2), we also compared the main threats across all marine taxa based on the
expert assessments (Table 19). The Red Cells indicate one of the top 3 threats, the Orange
Cells the 4-6th most severe threats while the dark blue cells represent the 7-10th most severe
threats within each taxonomic group. Pale blue cells are other threats that are listed but
outside the top 10 threats
Table 19 shows that four threats are ranked highly across the two taxonomic groups: 1.3
Tourism and recreation areas, 5.4 Fishing & harvesting aquatic resources, 9.3 Agricultural &
forestry effluents and 11.3 Temperature extremes.
In Table 20 we compare the results of the expert assessments with the START results and the
literature. The table shows that while there is inconsistency at Level 2 threats across all the
taxa and the two datasets, there is consistency at Level 1 threats, identifying 5. Biological
resource use and 1. Residential and commercial development as highly ranked threats for
Fiji’s marine taxa. The literature data is not ranked, but it shows overlap with the START and
expert results.
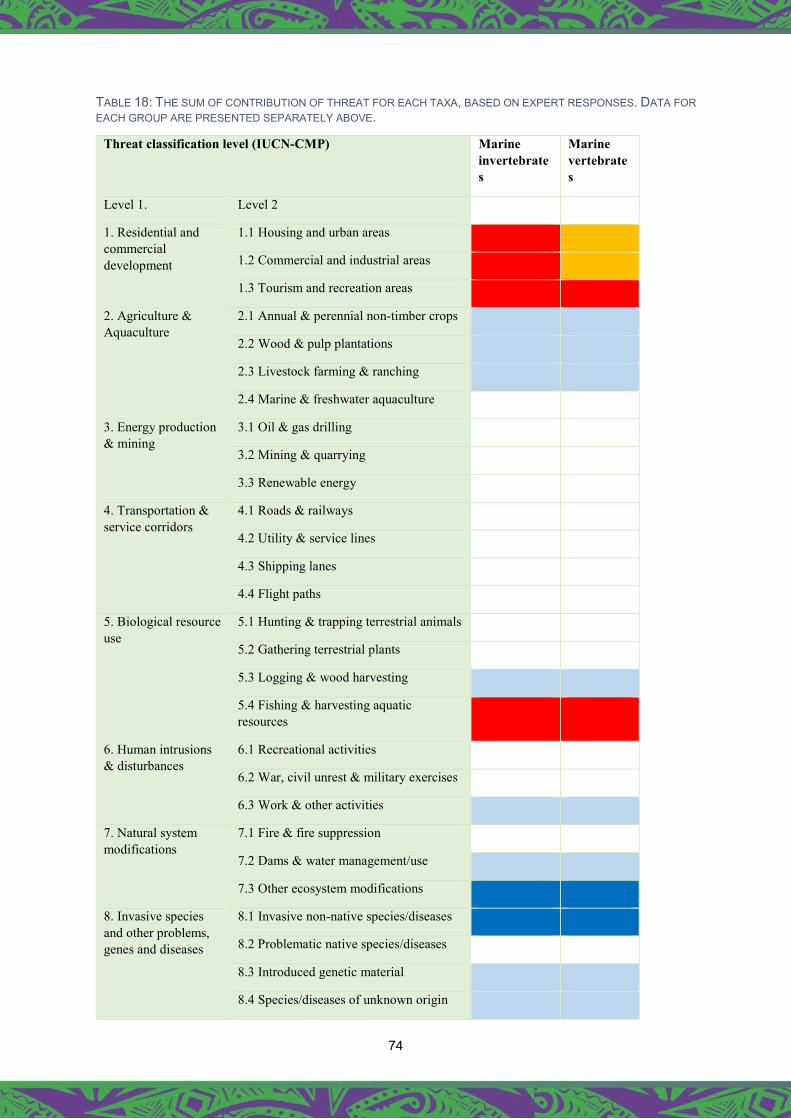
74
TABLE 18: THE SUM OF CONTRIBUTION OF THREAT FOR EACH TAXA, BASED ON EXPERT RESPONSES. DATA FOR EACH GROUP ARE PRESENTED SEPARATELY ABOVE.
Threat classification level (IUCN-CMP) Marine invertebrates
Marine vertebrates
Level 1. Level 2
1. Residential and commercial development
1.1 Housing and urban areas
1.2 Commercial and industrial areas
1.3 Tourism and recreation areas
2. Agriculture & Aquaculture
2.1 Annual & perennial non-timber crops
2.2 Wood & pulp plantations
2.3 Livestock farming & ranching
2.4 Marine & freshwater aquaculture
3. Energy production & mining
3.1 Oil & gas drilling
3.2 Mining & quarrying
3.3 Renewable energy
4. Transportation & service corridors
4.1 Roads & railways
4.2 Utility & service lines
4.3 Shipping lanes
4.4 Flight paths
5. Biological resource use
5.1 Hunting & trapping terrestrial animals
5.2 Gathering terrestrial plants
5.3 Logging & wood harvesting
5.4 Fishing & harvesting aquatic resources
6. Human intrusions & disturbances
6.1 Recreational activities
6.2 War, civil unrest & military exercises
6.3 Work & other activities
7. Natural system modifications
7.1 Fire & fire suppression
7.2 Dams & water management/use
7.3 Other ecosystem modifications
8. Invasive species and other problems, genes and diseases
8.1 Invasive non-native species/diseases
8.2 Problematic native species/diseases
8.3 Introduced genetic material
8.4 Species/diseases of unknown origin
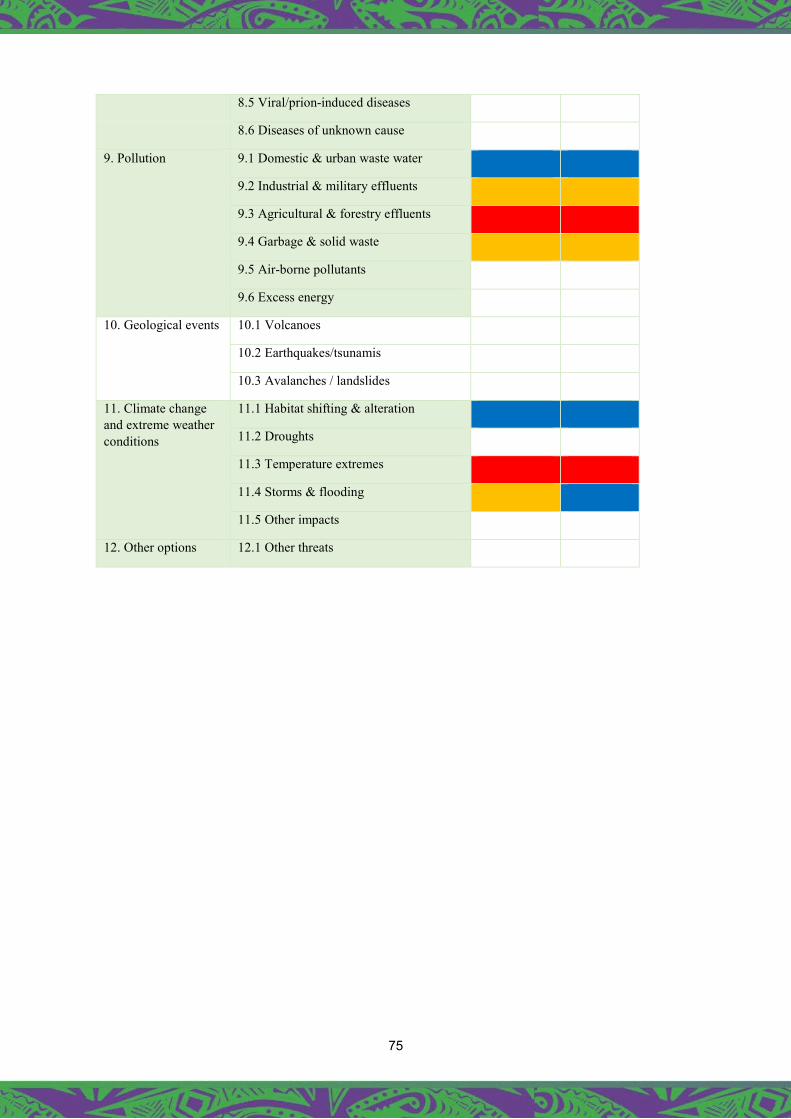
75
8.5 Viral/prion-induced diseases
8.6 Diseases of unknown cause
9. Pollution 9.1 Domestic & urban waste water
9.2 Industrial & military effluents
9.3 Agricultural & forestry effluents
9.4 Garbage & solid waste
9.5 Air-borne pollutants
9.6 Excess energy
10. Geological events 10.1 Volcanoes
10.2 Earthquakes/tsunamis
10.3 Avalanches / landslides
11. Climate change and extreme weather conditions
11.1 Habitat shifting & alteration
11.2 Droughts
11.3 Temperature extremes
11.4 Storms & flooding
11.5 Other impacts
12. Other options 12.1 Other threats
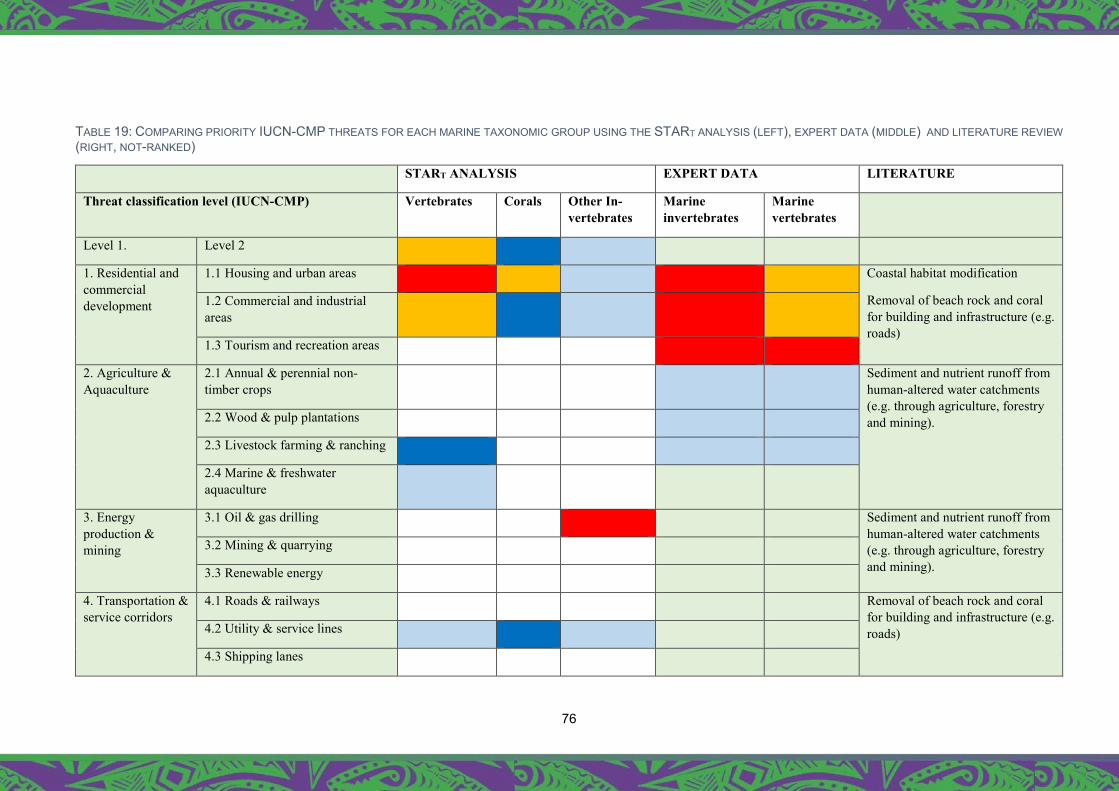
76
TABLE 19: COMPARING PRIORITY IUCN-CMP THREATS FOR EACH MARINE TAXONOMIC GROUP USING THE START ANALYSIS (LEFT), EXPERT DATA (MIDDLE) AND LITERATURE REVIEW (RIGHT, NOT-RANKED)
START ANALYSIS EXPERT DATA LITERATURE
Threat classification level (IUCN-CMP) Vertebrates Corals Other In-vertebrates
Marine invertebrates
Marine vertebrates
Level 1. Level 2
1. Residential and commercial development
1.1 Housing and urban areas Coastal habitat modification
Removal of beach rock and coral for building and infrastructure (e.g. roads)
1.2 Commercial and industrial areas
1.3 Tourism and recreation areas
2. Agriculture & Aquaculture
2.1 Annual & perennial non-timber crops
Sediment and nutrient runoff from human-altered water catchments (e.g. through agriculture, forestry and mining). 2.2 Wood & pulp plantations
2.3 Livestock farming & ranching
2.4 Marine & freshwater aquaculture
3. Energy production & mining
3.1 Oil & gas drilling Sediment and nutrient runoff from human-altered water catchments (e.g. through agriculture, forestry and mining).
3.2 Mining & quarrying
3.3 Renewable energy
4. Transportation & service corridors
4.1 Roads & railways Removal of beach rock and coral for building and infrastructure (e.g. roads) 4.2 Utility & service lines
4.3 Shipping lanes
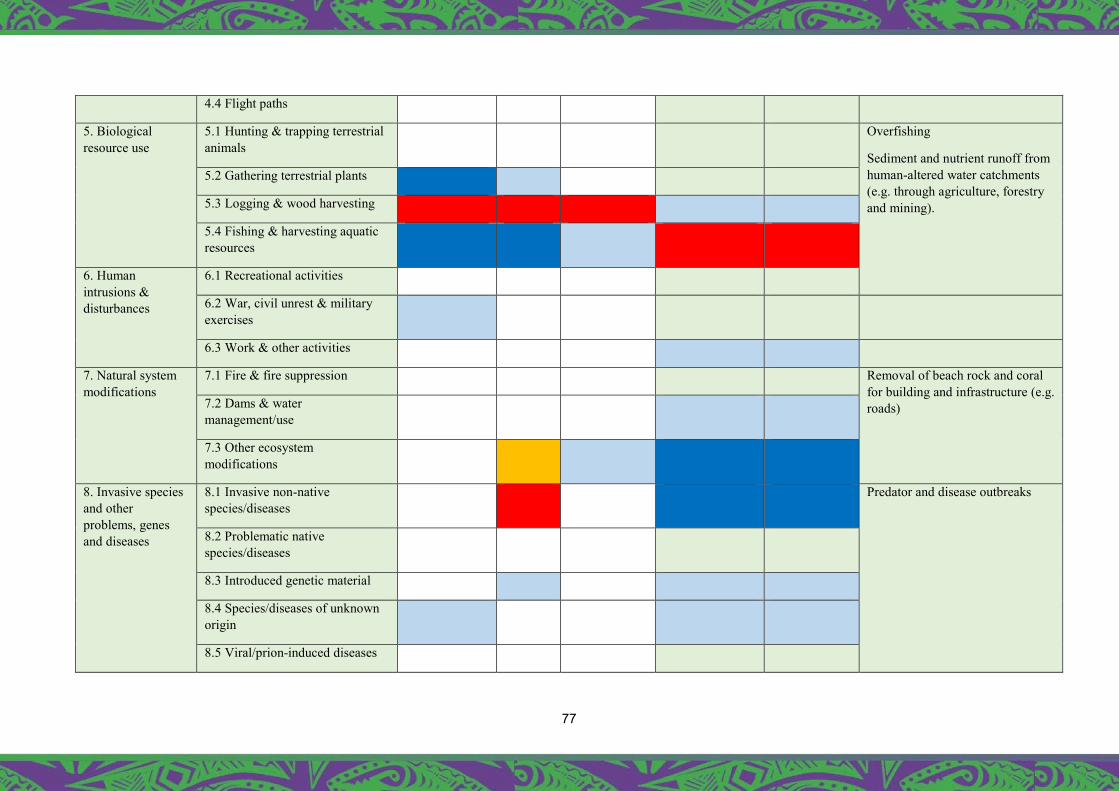
77
4.4 Flight paths
5. Biological resource use
5.1 Hunting & trapping terrestrial animals
Overfishing
Sediment and nutrient runoff from human-altered water catchments (e.g. through agriculture, forestry and mining).
5.2 Gathering terrestrial plants
5.3 Logging & wood harvesting
5.4 Fishing & harvesting aquatic resources
6. Human intrusions & disturbances
6.1 Recreational activities
6.2 War, civil unrest & military exercises
6.3 Work & other activities
7. Natural system modifications
7.1 Fire & fire suppression Removal of beach rock and coral for building and infrastructure (e.g. roads) 7.2 Dams & water
management/use
7.3 Other ecosystem modifications
8. Invasive species and other problems, genes and diseases
8.1 Invasive non-native species/diseases
Predator and disease outbreaks
8.2 Problematic native species/diseases
8.3 Introduced genetic material
8.4 Species/diseases of unknown origin
8.5 Viral/prion-induced diseases

78
8.6 Diseases of unknown cause
9. Pollution 9.1 Domestic & urban waste water Sediment and nutrient runoff from human-altered water catchments (e.g. through agriculture, forestry and mining).
Improper waste disposal and pollution
9.2 Industrial & military effluents
9.3 Agricultural & forestry effluents
9.4 Garbage & solid waste
9.5 Air-borne pollutants
9.6 Excess energy
10. Geological events
10.1 Volcanoes
10.2 Earthquakes/tsunamis
10.3 Avalanches / landslides
11. Climate change and extreme weather conditions
11.1 Habitat shifting & alteration Climate change
Natural disasters 11.2 Droughts
11.3 Temperature extremes
11.4 Storms & flooding
11.5 Other impacts
12. Other options 12.1 Other threats
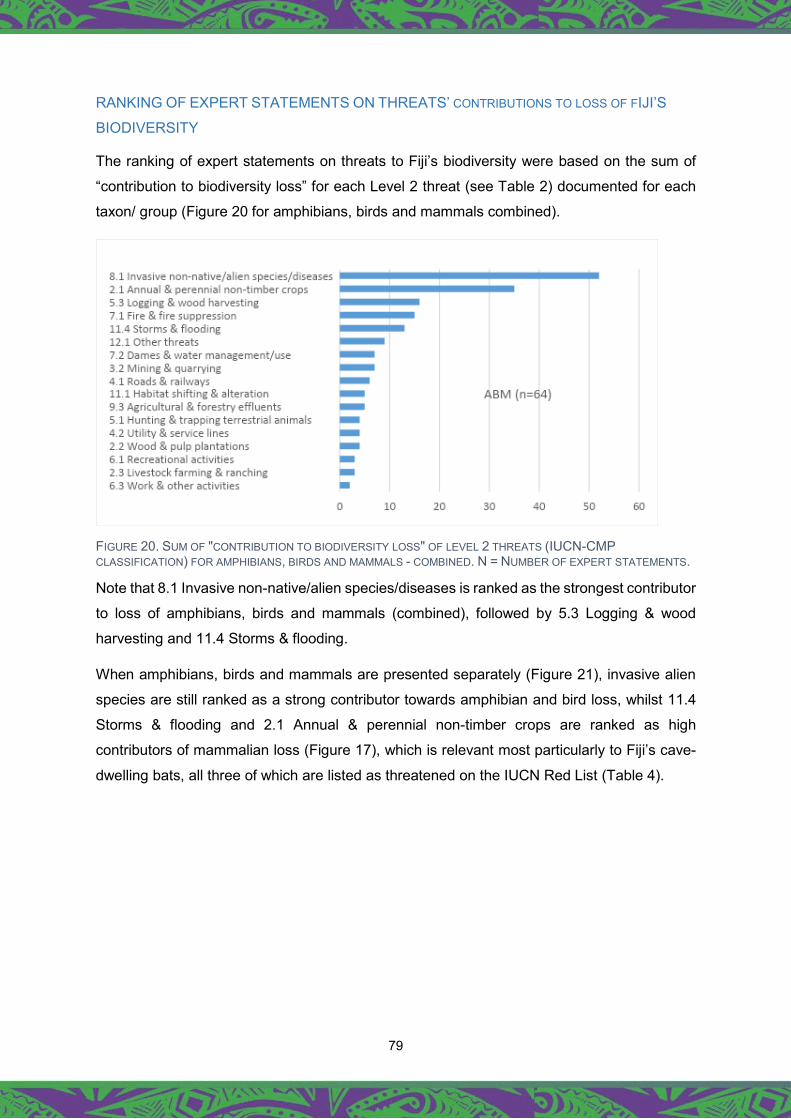
79
RANKING OF EXPERT STATEMENTS ON THREATS’ CONTRIBUTIONS TO LOSS OF FIJI’S
BIODIVERSITY
The ranking of expert statements on threats to Fiji’s biodiversity were based on the sum of
“contribution to biodiversity loss” for each Level 2 threat (see Table 2) documented for each
taxon/ group (Figure 20 for amphibians, birds and mammals combined).
FIGURE 20. SUM OF "CONTRIBUTION TO BIODIVERSITY LOSS" OF LEVEL 2 THREATS (IUCN-CMP CLASSIFICATION) FOR AMPHIBIANS, BIRDS AND MAMMALS - COMBINED. N = NUMBER OF EXPERT STATEMENTS.
Note that 8.1 Invasive non-native/alien species/diseases is ranked as the strongest contributor
to loss of amphibians, birds and mammals (combined), followed by 5.3 Logging & wood
harvesting and 11.4 Storms & flooding.
When amphibians, birds and mammals are presented separately (Figure 21), invasive alien
species are still ranked as a strong contributor towards amphibian and bird loss, whilst 11.4
Storms & flooding and 2.1 Annual & perennial non-timber crops are ranked as high
contributors of mammalian loss (Figure 17), which is relevant most particularly to Fiji’s cave-
dwelling bats, all three of which are listed as threatened on the IUCN Red List (Table 4).
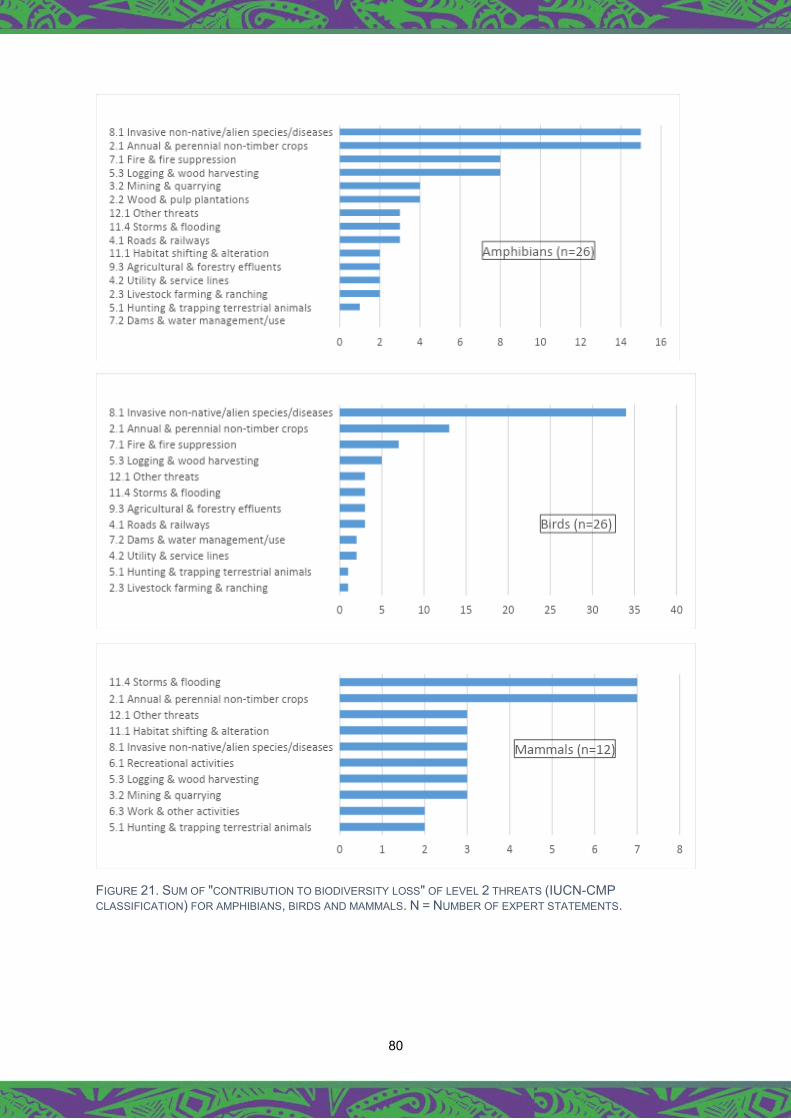
80
FIGURE 21. SUM OF "CONTRIBUTION TO BIODIVERSITY LOSS" OF LEVEL 2 THREATS (IUCN-CMP CLASSIFICATION) FOR AMPHIBIANS, BIRDS AND MAMMALS. N = NUMBER OF EXPERT STATEMENTS.

81
For reptiles and plants, 8.1 Invasive non-native/alien species/diseases is ranked as the highest
contributor to loss biodiversity followed by 7.1 Fire & fire suppression (reptiles) and 5.3
Logging & wood harvesting (plants) (Figure 22).
FIGURE 22. SUM OF "CONTRIBUTION TO BIODIVERSITY LOSS" OF LEVEL 2 THREATS (IUCN-CMP CLASSIFICATION) FOR REPTILES AND PLANTS. N = NUMBER OF EXPERT STATEMENTS.
Consistent with the STAR metric and the expert data (Table 18), Table 21 shows that 2.1
Annual & perennial non-timber crops and 8.1 Invasive non-native species/diseases are highly
ranked as threats across all the terrestrial taxonomic groups.

82
TABLE 20: THE SUM OF CONTRIBUTION OF THREAT FOR EACH TAXA, BASED ON EXPERT RESPONSES. DATA FOR EACH GROUP ARE PRESENTED SEPARATELY ABOVE.
Threat classification level (IUCN-CMP) ABM Reptiles Plants
Level 1. Level 2
1. Residential and commercial development
1.1 Housing and urban areas
1.2 Commercial and industrial areas
1.3 Tourism and recreation areas
2. Agriculture & Aquaculture
2.1 Annual & perennial non-timber crops
2.2 Wood & pulp plantations
2.3 Livestock farming & ranching
2.4 Marine & freshwater aquaculture
3. Energy production & mining
3.1 Oil & gas drilling
3.2 Mining & quarrying
3.3 Renewable energy
4. Transportation & service corridors
4.1 Roads & railways
4.2 Utility & service lines
4.3 Shipping lanes
4.4 Flight paths
5. Biological resource use
5.1 Hunting & trapping terrestrial animals
5.2 Gathering terrestrial plants
5.3 Logging & wood harvesting
5.4 Fishing & harvesting aquatic resources
6. Human intrusions & disturbances
6.1 Recreational activities
6.2 War, civil unrest & military exercises
6.3 Work & other activities
7. Natural system modifications
7.1 Fire & fire suppression
7.2 Dams & water management/use
7.3 Other ecosystem modifications
8. Invasive species and other problems, genes and diseases
8.1 Invasive non-native species/diseases
8.2 Problematic native species/diseases
8.3 Introduced genetic material
8.4 Species/diseases of unknown origin
8.5 Viral/prion-induced diseases
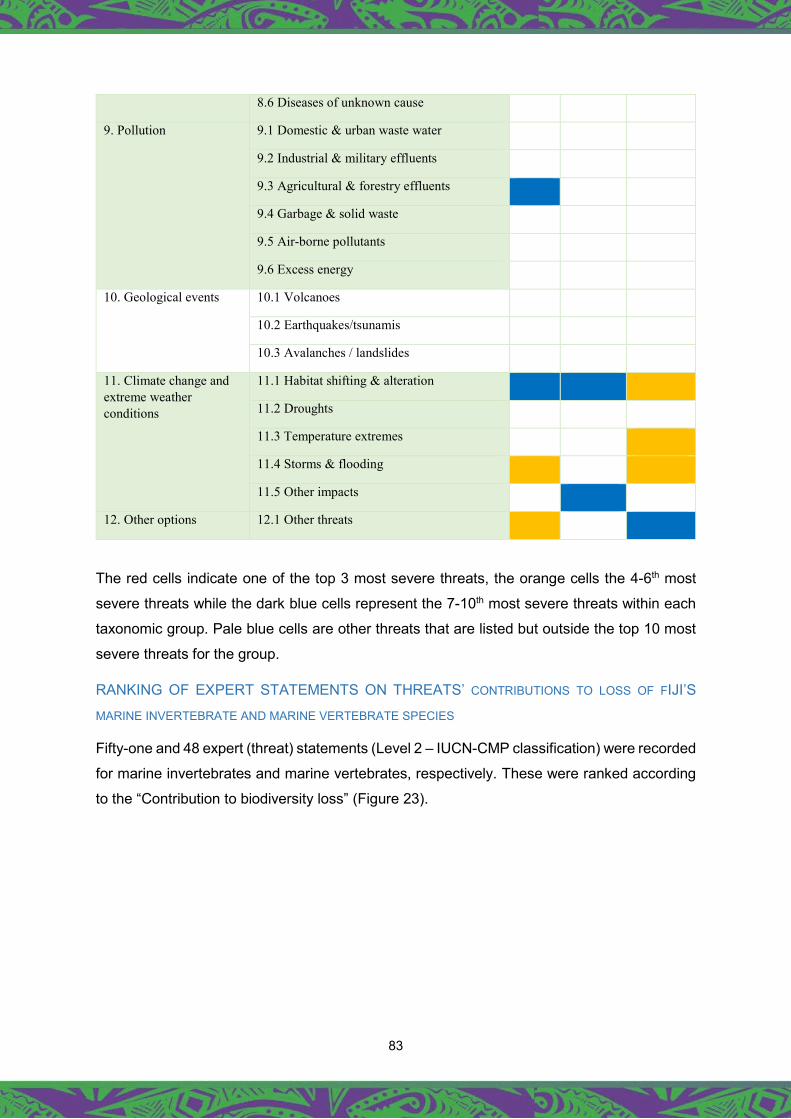
83
8.6 Diseases of unknown cause
9. Pollution 9.1 Domestic & urban waste water
9.2 Industrial & military effluents
9.3 Agricultural & forestry effluents
9.4 Garbage & solid waste
9.5 Air-borne pollutants
9.6 Excess energy
10. Geological events 10.1 Volcanoes
10.2 Earthquakes/tsunamis
10.3 Avalanches / landslides
11. Climate change and extreme weather conditions
11.1 Habitat shifting & alteration
11.2 Droughts
11.3 Temperature extremes
11.4 Storms & flooding
11.5 Other impacts
12. Other options 12.1 Other threats
The red cells indicate one of the top 3 most severe threats, the orange cells the 4-6th most
severe threats while the dark blue cells represent the 7-10th most severe threats within each
taxonomic group. Pale blue cells are other threats that are listed but outside the top 10 most
severe threats for the group.
RANKING OF EXPERT STATEMENTS ON THREATS’ CONTRIBUTIONS TO LOSS OF FIJI’S
MARINE INVERTEBRATE AND MARINE VERTEBRATE SPECIES
Fifty-one and 48 expert (threat) statements (Level 2 – IUCN-CMP classification) were recorded
for marine invertebrates and marine vertebrates, respectively. These were ranked according
to the “Contribution to biodiversity loss” (Figure 23).
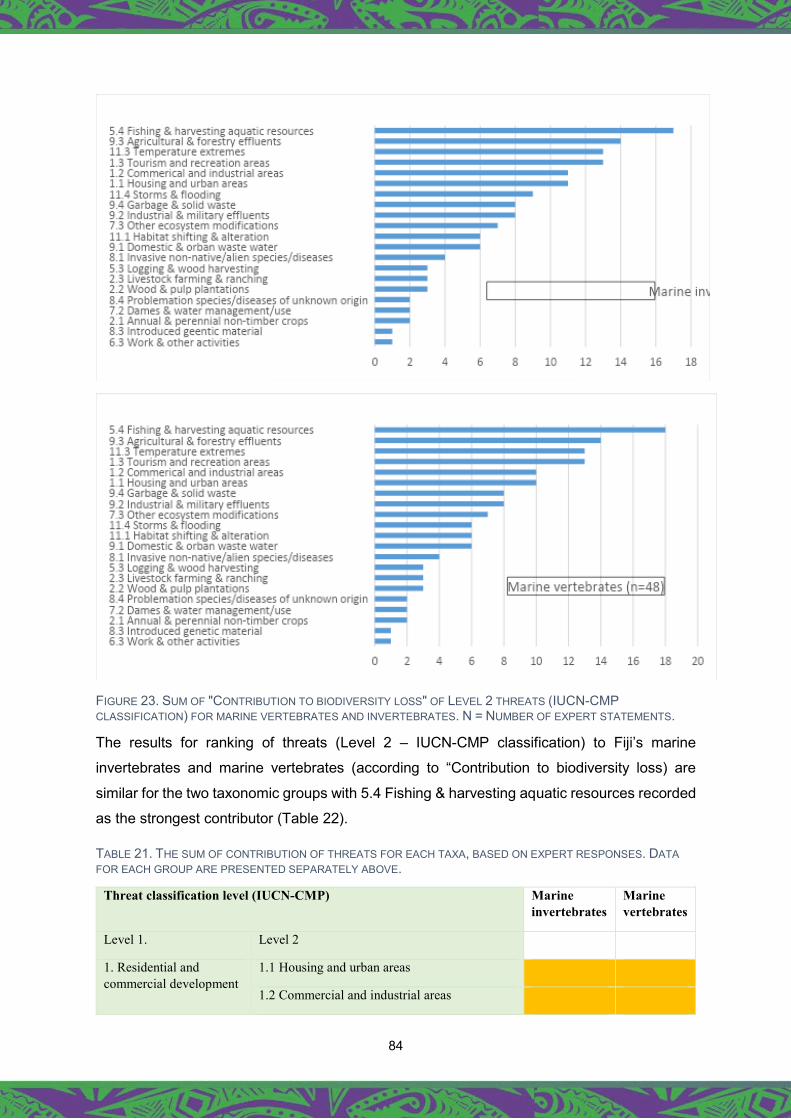
84
FIGURE 23. SUM OF "CONTRIBUTION TO BIODIVERSITY LOSS" OF LEVEL 2 THREATS (IUCN-CMP CLASSIFICATION) FOR MARINE VERTEBRATES AND INVERTEBRATES. N = NUMBER OF EXPERT STATEMENTS.
The results for ranking of threats (Level 2 – IUCN-CMP classification) to Fiji’s marine
invertebrates and marine vertebrates (according to “Contribution to biodiversity loss) are
similar for the two taxonomic groups with 5.4 Fishing & harvesting aquatic resources recorded
as the strongest contributor (Table 22).
TABLE 21. THE SUM OF CONTRIBUTION OF THREATS FOR EACH TAXA, BASED ON EXPERT RESPONSES. DATA FOR EACH GROUP ARE PRESENTED SEPARATELY ABOVE.
Threat classification level (IUCN-CMP) Marine invertebrates
Marine vertebrates
Level 1. Level 2
1. Residential and commercial development
1.1 Housing and urban areas
1.2 Commercial and industrial areas
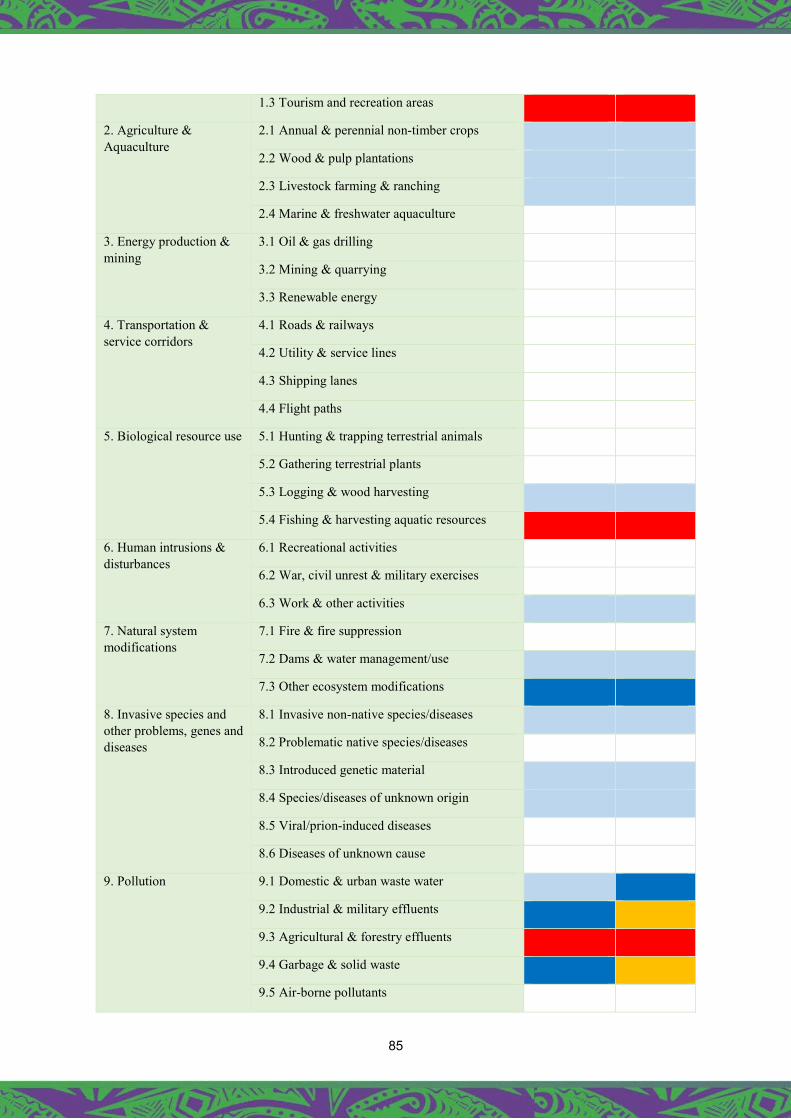
85
1.3 Tourism and recreation areas
2. Agriculture & Aquaculture
2.1 Annual & perennial non-timber crops
2.2 Wood & pulp plantations
2.3 Livestock farming & ranching
2.4 Marine & freshwater aquaculture
3. Energy production & mining
3.1 Oil & gas drilling
3.2 Mining & quarrying
3.3 Renewable energy
4. Transportation & service corridors
4.1 Roads & railways
4.2 Utility & service lines
4.3 Shipping lanes
4.4 Flight paths
5. Biological resource use 5.1 Hunting & trapping terrestrial animals
5.2 Gathering terrestrial plants
5.3 Logging & wood harvesting
5.4 Fishing & harvesting aquatic resources
6. Human intrusions & disturbances
6.1 Recreational activities
6.2 War, civil unrest & military exercises
6.3 Work & other activities
7. Natural system modifications
7.1 Fire & fire suppression
7.2 Dams & water management/use
7.3 Other ecosystem modifications
8. Invasive species and other problems, genes and diseases
8.1 Invasive non-native species/diseases
8.2 Problematic native species/diseases
8.3 Introduced genetic material
8.4 Species/diseases of unknown origin
8.5 Viral/prion-induced diseases
8.6 Diseases of unknown cause
9. Pollution 9.1 Domestic & urban waste water
9.2 Industrial & military effluents
9.3 Agricultural & forestry effluents
9.4 Garbage & solid waste
9.5 Air-borne pollutants
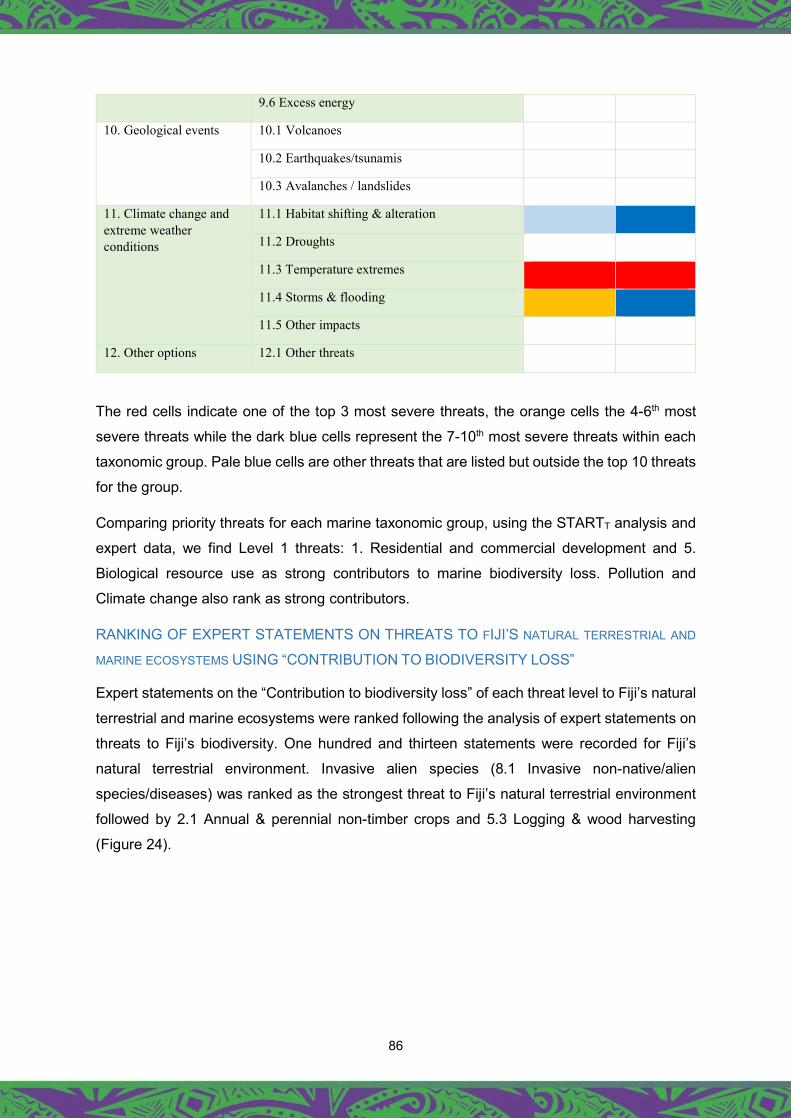
86
9.6 Excess energy
10. Geological events 10.1 Volcanoes
10.2 Earthquakes/tsunamis
10.3 Avalanches / landslides
11. Climate change and extreme weather conditions
11.1 Habitat shifting & alteration
11.2 Droughts
11.3 Temperature extremes
11.4 Storms & flooding
11.5 Other impacts
12. Other options 12.1 Other threats
The red cells indicate one of the top 3 most severe threats, the orange cells the 4-6th most
severe threats while the dark blue cells represent the 7-10th most severe threats within each
taxonomic group. Pale blue cells are other threats that are listed but outside the top 10 threats
for the group.
Comparing priority threats for each marine taxonomic group, using the STARTT analysis and
expert data, we find Level 1 threats: 1. Residential and commercial development and 5.
Biological resource use as strong contributors to marine biodiversity loss. Pollution and
Climate change also rank as strong contributors.
RANKING OF EXPERT STATEMENTS ON THREATS TO FIJI’S NATURAL TERRESTRIAL AND
MARINE ECOSYSTEMS USING “CONTRIBUTION TO BIODIVERSITY LOSS”
Expert statements on the “Contribution to biodiversity loss” of each threat level to Fiji’s natural
terrestrial and marine ecosystems were ranked following the analysis of expert statements on
threats to Fiji’s biodiversity. One hundred and thirteen statements were recorded for Fiji’s
natural terrestrial environment. Invasive alien species (8.1 Invasive non-native/alien
species/diseases) was ranked as the strongest threat to Fiji’s natural terrestrial environment
followed by 2.1 Annual & perennial non-timber crops and 5.3 Logging & wood harvesting
(Figure 24).
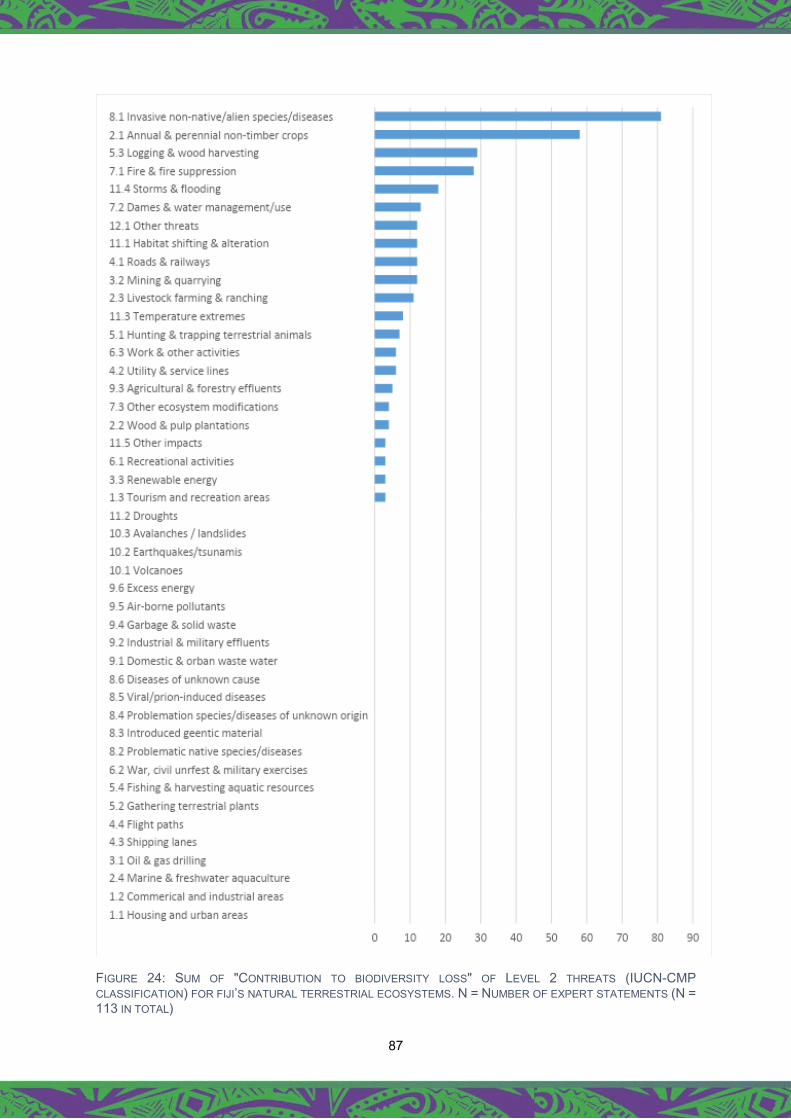
87
FIGURE 24: SUM OF "CONTRIBUTION TO BIODIVERSITY LOSS" OF LEVEL 2 THREATS (IUCN-CMP CLASSIFICATION) FOR FIJI’S NATURAL TERRESTRIAL ECOSYSTEMS. N = NUMBER OF EXPERT STATEMENTS (N = 113 IN TOTAL)

88
Ninety-eight expert statements were recorded for the sum of “contribution (of threat) to
biodiversity loss: for the marine ecosystem” where 5.4 Fishing & harvesting aquatic resources
was ranked as the strongest contributor followed by 9.3 Agricultural & forestry effluents then
11.3 Temperature extremes (Figure 25).
FIGURE 25: SUM OF "CONTRIBUTION TO BIODIVERSITY LOSS" OF LEVEL 2 THREATS (IUCN-CMP CLASSIFICATION) FOR FIJI’S MARINE ECOSYSTEMS. N = NUMBER OF EXPERT STATEMENTS (N = 98 IN TOTAL)
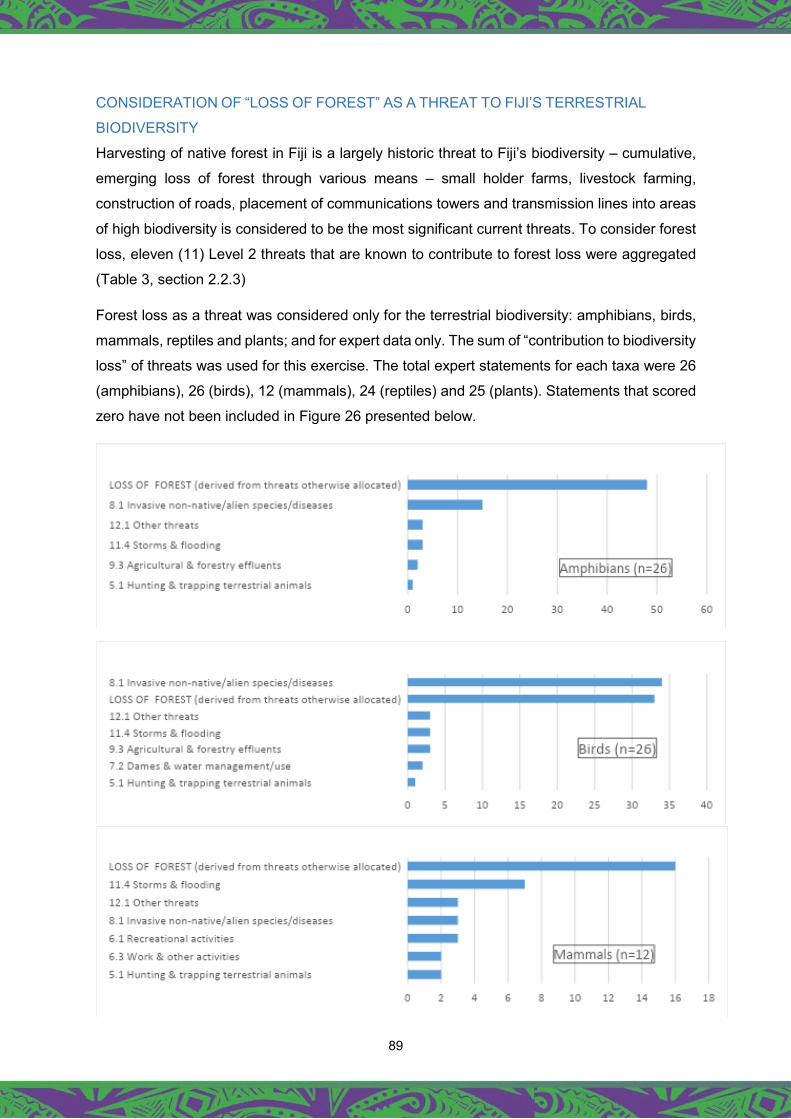
89
CONSIDERATION OF “LOSS OF FOREST” AS A THREAT TO FIJI’S TERRESTRIAL
BIODIVERSITY
Harvesting of native forest in Fiji is a largely historic threat to Fiji’s biodiversity – cumulative,
emerging loss of forest through various means – small holder farms, livestock farming,
construction of roads, placement of communications towers and transmission lines into areas
of high biodiversity is considered to be the most significant current threats. To consider forest
loss, eleven (11) Level 2 threats that are known to contribute to forest loss were aggregated
(Table 3, section 2.2.3)
Forest loss as a threat was considered only for the terrestrial biodiversity: amphibians, birds,
mammals, reptiles and plants; and for expert data only. The sum of “contribution to biodiversity
loss” of threats was used for this exercise. The total expert statements for each taxa were 26
(amphibians), 26 (birds), 12 (mammals), 24 (reptiles) and 25 (plants). Statements that scored
zero have not been included in Figure 26 presented below.
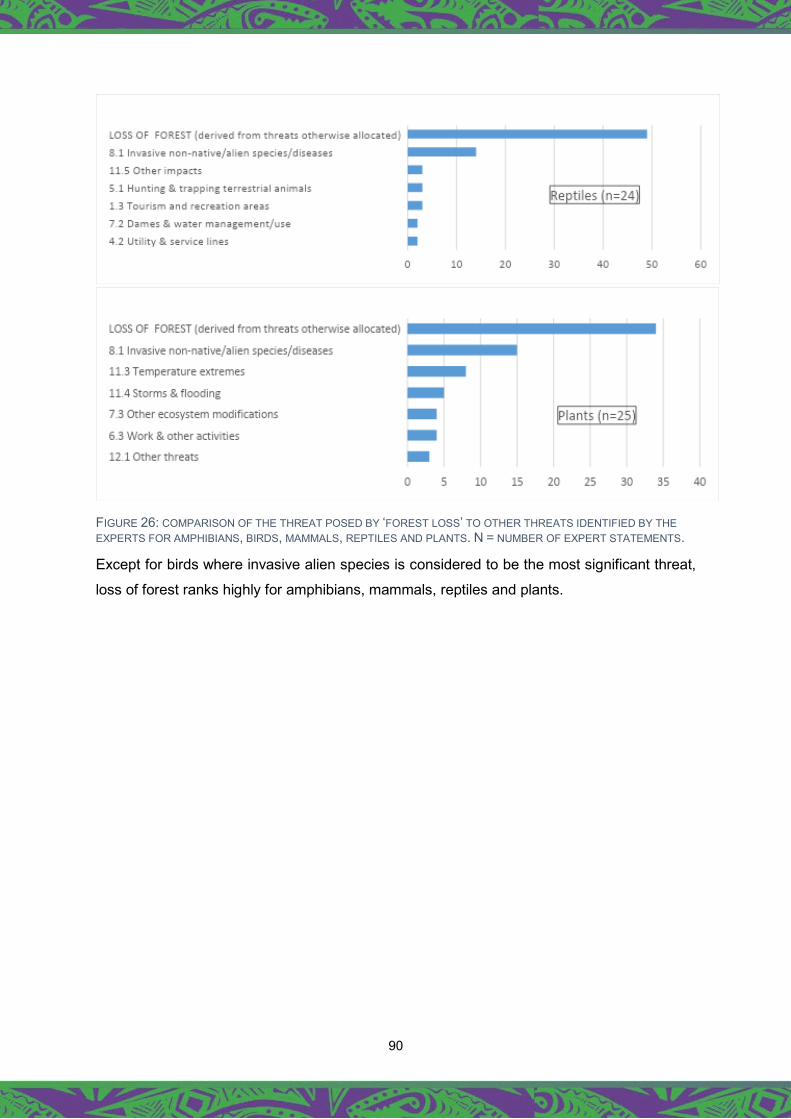
90
FIGURE 26: COMPARISON OF THE THREAT POSED BY ‘FOREST LOSS’ TO OTHER THREATS IDENTIFIED BY THE EXPERTS FOR AMPHIBIANS, BIRDS, MAMMALS, REPTILES AND PLANTS. N = NUMBER OF EXPERT STATEMENTS.
Except for birds where invasive alien species is considered to be the most significant threat,
loss of forest ranks highly for amphibians, mammals, reptiles and plants.
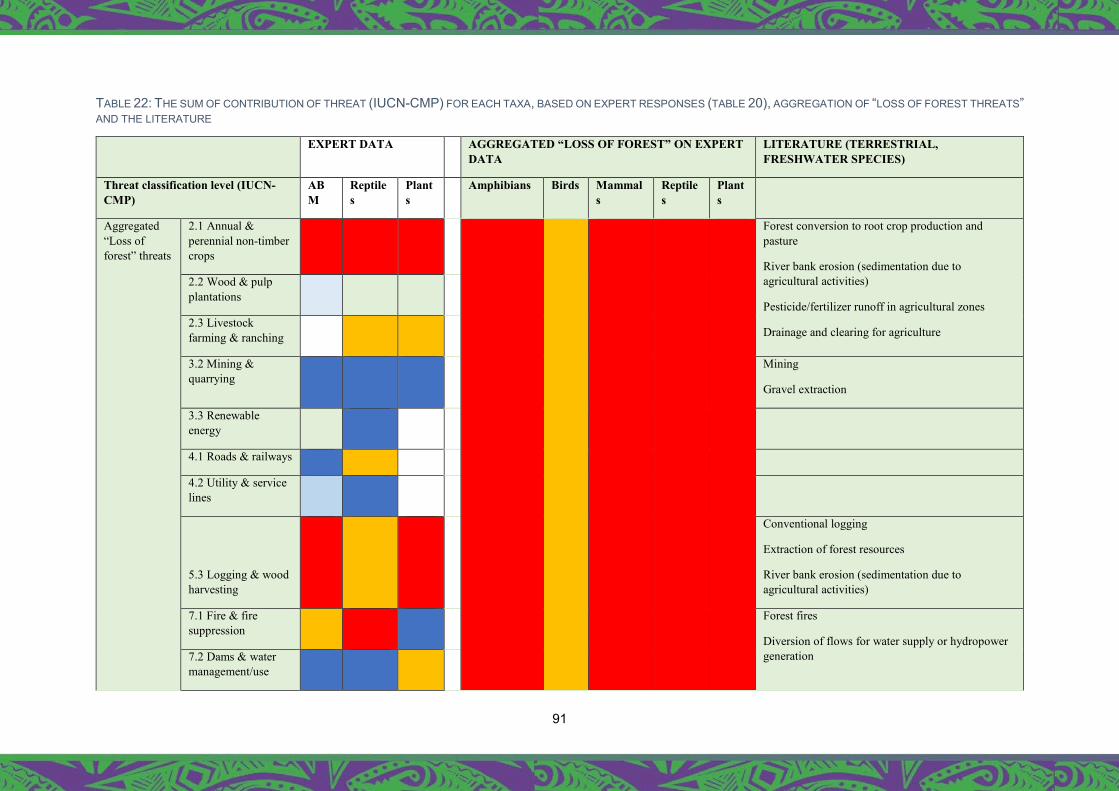
91
TABLE 22: THE SUM OF CONTRIBUTION OF THREAT (IUCN-CMP) FOR EACH TAXA, BASED ON EXPERT RESPONSES (TABLE 20), AGGREGATION OF “LOSS OF FOREST THREATS” AND THE LITERATURE
EXPERT DATA AGGREGATED “LOSS OF FOREST” ON EXPERT DATA
LITERATURE (TERRESTRIAL, FRESHWATER SPECIES)
Threat classification level (IUCN-CMP)
ABM
Reptiles
Plants
Amphibians Birds Mammals
Reptiles
Plants
Aggregated “Loss of forest” threats
2.1 Annual & perennial non-timber crops
Forest conversion to root crop production and pasture
River bank erosion (sedimentation due to agricultural activities)
Pesticide/fertilizer runoff in agricultural zones
Drainage and clearing for agriculture
2.2 Wood & pulp plantations
2.3 Livestock farming & ranching
3.2 Mining & quarrying
Mining
Gravel extraction
3.3 Renewable energy
4.1 Roads & railways
4.2 Utility & service lines
5.3 Logging & wood harvesting
Conventional logging
Extraction of forest resources
River bank erosion (sedimentation due to agricultural activities)
7.1 Fire & fire suppression
Forest fires
Diversion of flows for water supply or hydropower generation 7.2 Dams & water
management/use

92
Level 1. Level 2
1. Residential and commercial development
1.1 Housing and urban areas
1.2 Commercial and industrial areas
1.3 Tourism and recreation areas
2. Agriculture & Aquaculture
2.4 Marine & freshwater aquaculture
3. Energy production & mining
3.1 Oil & gas drilling
4. Transportation & service corridors
4.3 Shipping lanes
4.4 Flight paths
5. Biological resource use
5.1 Hunting & trapping terrestrial animals
Conventional logging
Extraction of forest resources
River bank erosion (sedimentation due to agricultural activities)
5.2 Gathering terrestrial plants
5.3 Logging & wood harvesting
5.4 Fishing & harvesting aquatic resources
6.1 Recreational activities
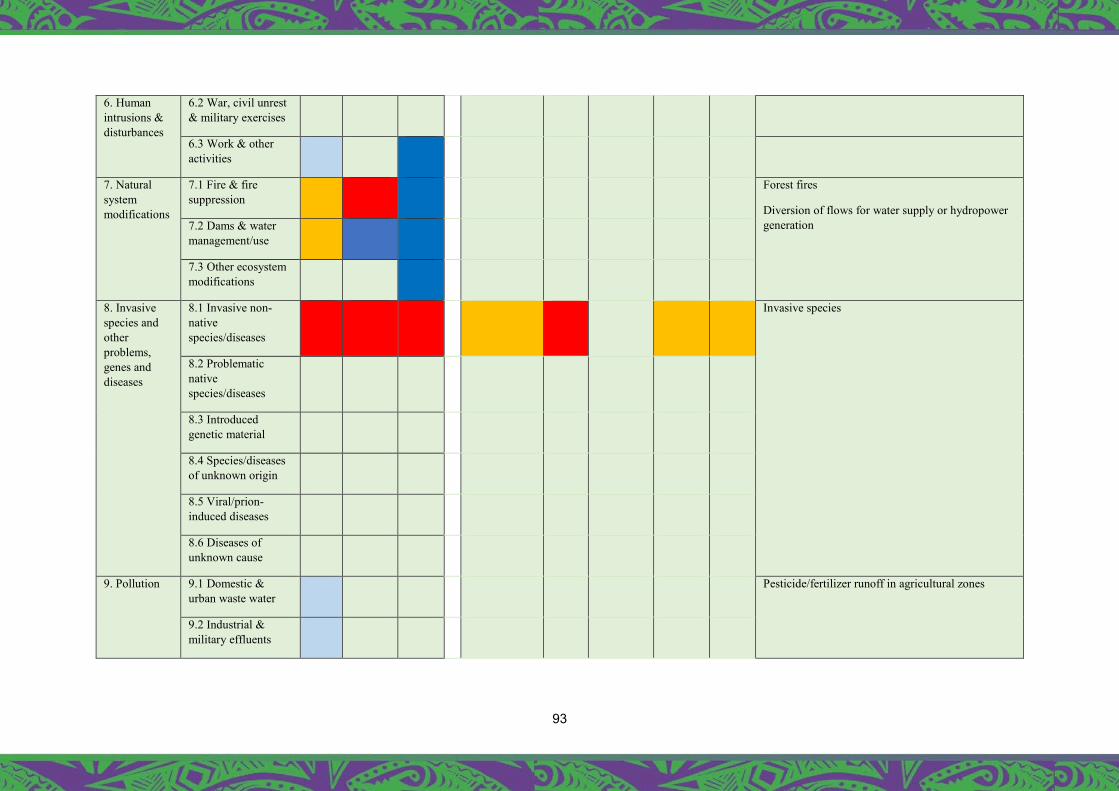
93
6. Human intrusions & disturbances
6.2 War, civil unrest & military exercises
6.3 Work & other activities
7. Natural system modifications
7.1 Fire & fire suppression
Forest fires
Diversion of flows for water supply or hydropower generation 7.2 Dams & water
management/use
7.3 Other ecosystem modifications
8. Invasive species and other problems, genes and diseases
8.1 Invasive non-native species/diseases
Invasive species
8.2 Problematic native species/diseases
8.3 Introduced genetic material
8.4 Species/diseases of unknown origin
8.5 Viral/prion-induced diseases
8.6 Diseases of unknown cause
9. Pollution 9.1 Domestic & urban waste water
Pesticide/fertilizer runoff in agricultural zones
9.2 Industrial & military effluents
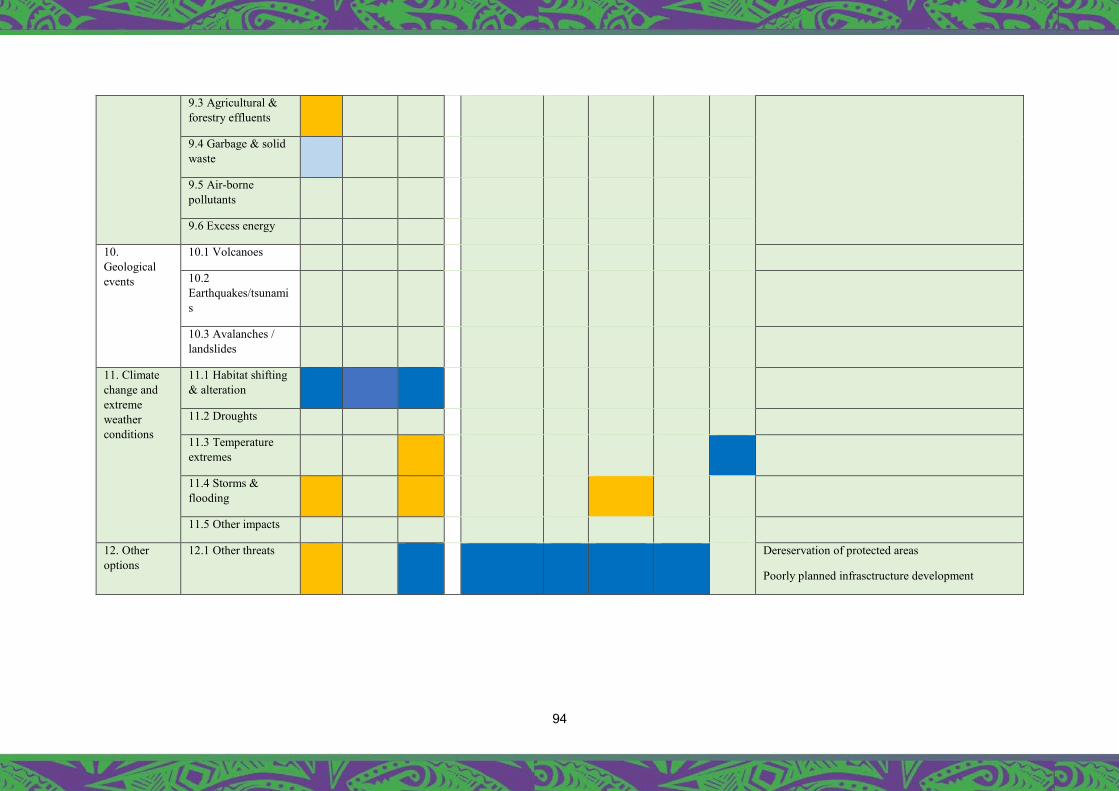
94
9.3 Agricultural & forestry effluents
9.4 Garbage & solid waste
9.5 Air-borne pollutants
9.6 Excess energy
10. Geological events
10.1 Volcanoes
10.2 Earthquakes/tsunamis
10.3 Avalanches / landslides
11. Climate change and extreme weather conditions
11.1 Habitat shifting & alteration
11.2 Droughts
11.3 Temperature extremes
11.4 Storms & flooding
11.5 Other impacts
12. Other options
12.1 Other threats Dereservation of protected areas
Poorly planned infrasctructure development
95
5. DISCUSSION AND RECOMMENDATIONS This exercise was undertaken to (1) assess the state of biodiversity in Fiji, (2) identify, classify
and rank the threats from anthropogenic activities to Fiji’s biodiversity and (3) identify the
economic sectors associated with the primary threats to Fiji’s biodiversity for engagement with
the BIODEV2030 PROJECT in Fiji.
Using a combination of 1) a review of the literature and relevant policy documents, 2) analysis
through the STAR metric and other IUCN data (national modified approach) and 3) expert
elicitation, we present the state of biodiversity in Fiji under the ecosystem and species
approach (Section 3) and our findings on the primary threats to biodiversity in Fiji (Section 4).
The results of the three methodological approaches used demonstrate that there are three
highly ranked threats across the terrestrial taxonomic groups: 2.1 Annual & perennial non-
timber crops, 5.3 Logging & wood harvesting, and 8.1 Invasive non-native species/diseases.
Our findings suggest that these primary threats form components of the same overarching
threat – namely the loss, reduction of quality, and fragmentation of the native forest habitats
in which the majority of Fiji’s endemic biodiversity is restricted. Addressing the
loss/fragmentation of native forests would be the most effective means to fulfil the objective of
this project: to reverse, or slow down the IUCN Red List Index for Fiji.
Fiji is an island nation with extensive marine ecosystems and associated species richness.
While many of these species are widespread throughout the Pacific region, resulting in
relatively low endemism and, consequently, relatively minor contributions to the IUCN Red
List Index for Fiji, they form a significant component of Fiji’s national biodiversity. As a result,
it is important that these species are included in national assessments of the major threats
facing Fiji’s biodiversity. Our results demonstrate that the key threats to Fiji’s marine
ecosystems and biodiversity are associated with 9.3 Agricultural & forestry effluents, which in
turn is a consequence of forest loss/fragmentation, as well as 5.4 Fishing & harvesting aquatic
resources.
These results were communicated to stakeholders on 17th August 2021 (Appendix 4), where
there was no objection to the results and the recommendations. These have been reflected in
the sections below.
5.1. Major Threat 1 – Loss of forest and fragmentation 5.1.1 Forest and Timber Harvesting We consider that commercial “Logging and wood-harvesting” (IUCN-CMP Threat Level 2) of
native forest is essentially an historic threat to Fiji. It is possibly a future threat, but logging is
96
not currently a significant threat as, currently, logging is targeted at plantation forests which
are of minor importance for native terrestrial biodiversity (Ministry of Forestry 2019, SOE
2020). Fiji has successfully established significant hardwood and softwood plantation sectors.
Historically, Fiji Hardwood Corporation’s 14 plantations were established through conversion
of native forest. By contrast, Caribbean Pine Pinus caribaea was found to grow very well on
areas of anthropogenic open reed-grasslands (Talasiga) and although exotic, were
nonetheless both productive and ecologically beneficial in halting a degrading pedological
trend. The SOE (2020) reports that since 2011, the majority of log production has come from
Pine plantations with limited impact on native forests.
The IUCN-CMP Level 2 threat category of “Logging and wood-harvesting” does not sufficiently
cover “loss of forest” and habitat fragmentation to reflect loss of forest through various other
means including small holder farms, livestock farming, construction of roads, transmission
lines and telecommunication sites in areas of high biodiversity which are significant current
threats. To consider “Loss of forest” as a contributor to biodiversity loss, we aggregated the
IUCN-CMP Level 2 threats (Table 3) for the expert data. Forest loss (through various means)
is ranked highly for amphibians, birds, mammals, reptiles and plants (Figure 17, Table 22).
5.1.2 Agricultural expansion for cash crops
Fiji’s SOE (2020), and the other literature reviewed, identifies but does not rank forest
conversion to root crop production and pasture (agriculture) as a threat to Fiji’s terrestrial
biodiversity. By contrast, both the STAR metric and expert data (Table 17) highly rank the
threat of 2.1 Annual & perennial non-timber crops (agriculture) to terrestrial biodiversity.
Fiji’s agriculture sector has undergone extensive research that has resulted in policies and
initiatives to support it. A review of agriculture policy papers in the Fiji 2020 Agriculture Sector
Policy Agenda states: “It is not the policy that is lacking, but the implementation of the policy.
The government’s law did not adjust to policy changes and there are existing acts in agriculture
development that are no longer relevant. In a country characterized by a mix farming system,
a combination of trade liberalization, import substitution, government intervention and private
sector intervention would work as long there is a community-based national program that is
sustainable” (Ministry of Agriculture 2014).
The mission statement of the Ministry of Agriculture’s 5-year Strategic Development Plan
[SDP] (2019 – 2023) is to create an enabling environment that accelerates sustainability,
economic opportunities, climatic viability, food and nutrition security for all Fijians. Aligned to
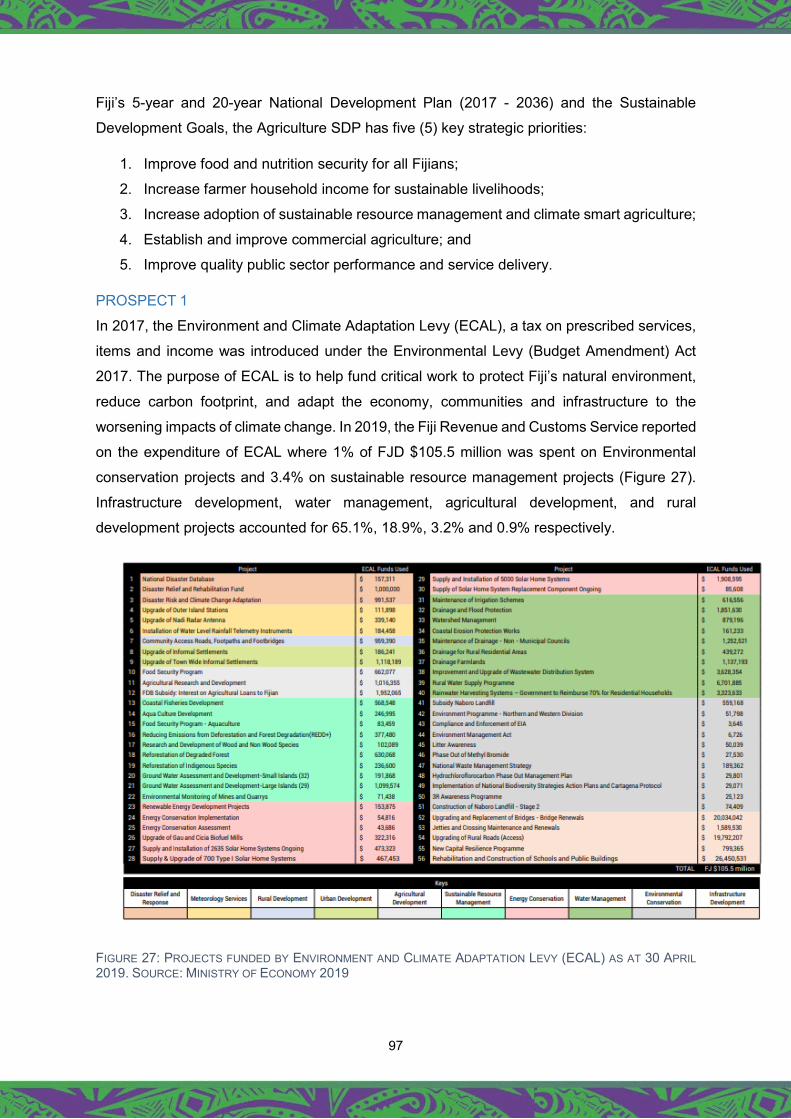
97
Fiji’s 5-year and 20-year National Development Plan (2017 - 2036) and the Sustainable
Development Goals, the Agriculture SDP has five (5) key strategic priorities:
1. Improve food and nutrition security for all Fijians;
2. Increase farmer household income for sustainable livelihoods;
3. Increase adoption of sustainable resource management and climate smart agriculture;
4. Establish and improve commercial agriculture; and
5. Improve quality public sector performance and service delivery.
PROSPECT 1
In 2017, the Environment and Climate Adaptation Levy (ECAL), a tax on prescribed services,
items and income was introduced under the Environmental Levy (Budget Amendment) Act
2017. The purpose of ECAL is to help fund critical work to protect Fiji’s natural environment,
reduce carbon footprint, and adapt the economy, communities and infrastructure to the
worsening impacts of climate change. In 2019, the Fiji Revenue and Customs Service reported
on the expenditure of ECAL where 1% of FJD $105.5 million was spent on Environmental
conservation projects and 3.4% on sustainable resource management projects (Figure 27).
Infrastructure development, water management, agricultural development, and rural
development projects accounted for 65.1%, 18.9%, 3.2% and 0.9% respectively.
FIGURE 27: PROJECTS FUNDED BY ENVIRONMENT AND CLIMATE ADAPTATION LEVY (ECAL) AS AT 30 APRIL 2019. SOURCE: MINISTRY OF ECONOMY 2019
98
RECOMMENDATION We suggest a review of the spend of ECAL to more effectively deliver benefits to communities
who manage priority areas for biodiversity on land in Fiji.
PROSPECT 2
The Fiji Agriculture Census Report (2020) reports that “temporary crops” dominate Fiji’s
agricultural landscape (76.7% of 194,768.6HA) and 54.1% of land that is farmed is of
traditional land ownership (Ministry of Agriculture 2020) – this is land that is registered in the
Native Land Trust Act [Cap 134] as “native reserve”, typically for communal use by the
landowning unit. Monitoring and evaluation is challenging for mataqali land under native
reserve as it is not bound by legal lease arrangements and subsequently not subject to
environment impact assessments. This contrasts with native land that is under lease
arrangements through either the Itaukei Lands Trust Board or government, as required by the
Fiji Environment Management Act 2005.
RECOMMENDATION
Establishing more effective monitoring of ‘native reserve’ land in order to minimise the damage
to, and promote the conservation of native forest habitats.
PROSPECT 3 The impact of small holder farms, indiscriminate expansion of yaqona (kava) farms (see Box
6), access roads, hydropower and utilities into native forest is little understood and not
sufficiently monitored or documented. It is, however, acknowledged as a significant threat to
Fiji’s terrestrial biodiversity and habitats through habitat fragmentation.
The over-riding issue is that the native forest is not valued – and so is sacrificed for other more
immediately ‘valued’ services. That lack of value runs from local communities right through to
the higher echelons of government. Decisions are made that assume that forest loss is the
most economical, least impacting and the most economic form of land use change. We need
to address how we value native forest and how to minimise the damage to native forest while,
at the same time, not disadvantage the owners of that native forest so that they are willing to
support conservation of their forests.
Fiji has committed to designating 16% of land mass as terrestrial protected areas (Government
of Fiji 2020). As the world agrees to a 30% Protected Area (including Other Effective Area-
Based Conservation Measures OECM) target by 2030, Fiji needs to radically update its
approach to contributing to this target. Currently protected terrestrial areas in Fiji account for
only 3% of Fiji’s total land mass(source?), , but even this small area is far from ‘risk free’
protected. This situation remains despite significant investments through the Global
99
Environment Facility through the Program of Protected Areas (POWPA), Global Environment
Facility – Protected Area Systems (GEF-PAS), Ridge to Reef (R2R) from 2005 to 2020.
The existing protected area policy, legislation and enforcement is insufficiently robust to
protect against loss of forest. For this we need an effective protected area network alongside
the increased valuation of native forest habitats. A network which provides risk-free protection
of Fiji’s natural heritage for:
● the benefit of future generations of Fijians;
● for its unique genetic resources of value to the international community; and,
Box 7: The Issue of Yaqona (Kava)
Yaqona (Piper methysticum) is a crop that was traditionally grown for subsistence use. Reflecting the recent increased demand for yaqona in local and overseas markets, the sector has rapidly transitioned to a more commercial industry with significant government support. Between 2015-2018, yaqona was exported to 41 countries and Fiji earned over FJ$30 million in yaqona export earnings in 2019 alone. The Government is now aiming to provide assistance to about 10,000 yaqona farmers by the end of 2022 in recognition of the significant foreign exchange earnings it brings in for the economy.
As a result of this increased commercial production, yaqona cultivation is currently seen as a significant threat to remaining native forests in Fiji. The area covered by yaqona cultivation increased at a rate of 15% per year from 2014 to 2018 (SOE, 2020) in response to the Government’s Yaqona Farming Program.
Currently, we do not know the extent that yaqona cultivation has penetrated forested areas – there are no formal statistics nor maps of the extent of yaqona cultivation in the country. In addition to the extent of the sectors, there are several other key elements that remain unknown.
How much damage does yaqona cultivation do, and is it reversible?
To what extent is yaqona cultivation dependent on other factors? There is a clear spread of yaqona cultivation along tracks built for other purposes – as such access for agricultural development but also other projects is the driver, as fuelled by significant price rises, in part from export markets. Yaqona grows best fully exposed to sunlight and as such forest destruction is complete at the site.
What contribution does the yaqona cultivated in native forested areas make to the overall industry? No data are available for this.
Can the negative connotations of native habitat destruction be used to limit these activities?
Yaqona cultivation can be a lucrative, legitimate and easily undertaken land use opportunity for rural landowners whose cash-generating opportunities are otherwise limited. Landowners will rightly consider conservation as just another land use, and as such government needs to facilitate a framework which makes conservation an acceptable alternative.
100
● the well-being and satisfaction of the native landowners
RECOMMENDATION: One of two areas where we need to focus the development efforts is through a recommitment
to effectively fund a Protected Area network in accordance with the NBSAP commitments that
the government has made to the CBD. We need to:
i. Provide increased protection for a minimum of the 16% of terrestrial land, primarily
native forest to enable Fiji to ensure the “risk-free” protection of national and global biodiversity
thereby maximising the benefits to the species that impact on the IUCN Red List index. The
suite of KBAs goes some way to further address this, together with justification, but now needs
updating.
ii. Address how to effectively deliver forest conservation as a ‘land use’ that landowners’
value more than other potential uses and developments.
Address how to deliver benefits to the landowners such that they are fully supportive of
measures needed for the effective conservation of the land whether it is full protection,
threatened species management or the reduction/ elimination of invasive species
PROSPECT 4
Through the national program on REDD+ and the 30 million trees by 2030 campaign, the
Ministry of Forestry is working with stakeholders to reforest Fiji with native trees, fruit trees
and exotic timber species (where applicable). Against these investments, we have recorded
continued forest loss in and around Fiji’s high conservation value forests (Ministry of Forestry
2019).
RECOMMENDATION:
The second area where we need to focus the development efforts is to greatly improve our
understanding of the principle threats to Fiji’s native biodiversity from the range of issues
currently identified. Much of the discussion, including the threat information on Fiji’s species
in the IUCN Red List threats category, is based more on speculation than quantitative
evidence. There is a real need to better understand the requirements of species under threat.
Immediate, high priority, concerns that need addressing are -
1. What are the current drivers of forest loss/fragmentation? The IUCN threats attempt to
identify this – but each in isolation, no one threat taken individually is causing
significant damage – it is the accumulation of these multiple threats that is of concern.
This is a development imperative, but advances in conservation are not commensurate
with the threats.
101
2. At what scale does forest fragmentation impact on various species? This will differ
between taxa but is vitally important if we are to establish effective areas for the
protection of biodiversity.
3. Are the threats from invasive species compounded by the fragmentation and ‘opening
up’ of native forest habitats?
PROSPECT 5
The IUCN Red List of threatened species and a country’s Red List Index are used in
sustainability frameworks across different business sectors (IUCN 2016). In 2011, the UNEP-
WCMC found that the Red List Categories were used in over half of the 37 standards and
certification schemes in eight sectors assessed (Juff-Bignoli 2014). Some of these sectors
include agriculture (12 standards), biotrade (2 standards), carbon (3 standards), finance (5
standards), fisheries and aquaculture (5 standards e.g. the Aquaculture Stewardship Council)
forestry (4 standards e.g. the Forest Stewardship Council), mining (2 standards, e.g. the
Responsible Jewellery Council), lending (e.g. the Asian Development Bank Safeguard) and
tourism (3 standards) (UNEP-WCMC 2011, Juff-Bignoli 2014).
RECOMMENDATION There is a need to develop a threatened species management capacity commensurate with
the need. Currently NGOs lead in funding and implementation of a small number of initiatives,
but there is a need for government, NGOs and academic institutions to identify and address
the gaps in our current knowledge to enable the country to most effectively managed its
threatened species. This in turn will enable us to update Fiji specific data on the IUCN Red
List through investment in research with academic institutions, knowledge and capacity
building, and so more effectively address the standards that sectors use in their certification
schemes
PROSPECT 6
The Red List Index is an effective metric for measuring how a country conserves its
biodiversity. We have shown that, within SIDs, this metric is weighted strongly toward the
endemic, terrestrial fauna and flora – and is not an effective measure of the nation’s marine
issues, many of the species of which are wide-ranging.
RECOMMENDATION:
Alternative ways of addressing this have been suggested, and might include -.
i. A regional Red List Index, addressed by nations in partnership, may be a more
effective way of presenting changes in the marine biodiversity.
ii. A red list for ecosystems, focused on marine ecosystems, may be a more effective
way of targeting unique marine environments at the national level.

102
iii. An index that combines the globally threatened species with a sustainable resource
use component may provide a more pragmatic approach.
Oceanic states, such as Fiji, will need to understand how best to develop a metric to address
this component considering the importance and diversity of Fiji’s marine biodiversity.
5.2. Major Threat 2 – Invasive species (from a range of activities)
The threat of invasive species in a SIDS environment is immense. The first priority is to stop
the invasive species from arriving. If the species has arrived, then an attempt to eradicate
them should be undertaken as soon as possible – the longer this is left the more expensive
the operation becomes. When invasive species have become established then there is
evidence that habitat fragmentation/disturbance increases the impact that those species can
have.
Habitat fragmentation (through access roads, agricultural expansion), improved transport
technologies and better access to some remote forests and islands of Fiji (as described above)
have contributed to the vulnerability of native fauna and flora to invasive alien species. Island
restoration and invasive species monitoring and management in Fiji have shown that
endangered species and ecosystems recover after the removal of introduced predators such
as rats, feral cats, and goats (see Box 7) but require substantial logistical and financial support.
In the last decade, two new species (the ivory cane palm Pinanga coronata and the green
iguana
Iguana iguana) have been recognised as serious invasive. The response, to date, has been
ineffective in controlling their spread, let alone addressing eradication needs (Lenz et al., in
press).

103
RECOMMENDATIONS
1. A more robust response to eradicate newly identified/ naturalised invasive species
needs to be established.
2. In addition, inter-island biosecurity, consistent post-eradication biosecurity protocols
and monitoring to keep biodiversity-rich sites free of invasive species is critical.
3. Many of the threats from invasive species are due to the loss of habitat and activities
mentioned in 5.1.
Box 8: Restoration of Monuriki Island to Safeguard Unique Species
Monuriki Island is 40 ha island off the west coast of Viti Levu. Its traditional landowners are the Mataqali Navunaivi, Yanuya Village. It is the 12th island with successful restoration (eradication of introduced mammals and predators) in Fiji. Below is a summary timeline of the activities, efforts and stakeholders associated with this achievement. 2009 - Feasibility assessment showed that rats and goats posed severe threats to the breeding of seabirds, including wedge-tailed shearwaters, and the Critically endangered Fijian Crested Iguana (Brachylophus vitiensis) 2010 - First batch of wild iguanas captured for captive breeding at Kula Eco Park (with permission from island custodians) 2011 - Eradication of feral goats and rats 2012 - Final batch of crested iguanas captured for captive breeding. 2015 - 32 offspring of captured wild iguanas (1-3 yr old) released into the wild on restored Monuriki Island. 2017 - 48 offspring of captured wild iguanas released into the wild on Monuriki. 2018 - Monitoring of shearwaters and iguana populations and invasive species; assessment of captive bred iguanas in the wild. Wild iguanas (non-captive breeding) encountered indicating successful in-situ breeding after predator and goat eradication. 2019 - Release of more captive-bred iguanas into the wild on Monuriki. This project would not have been successful without the collaboration of the following organisations and individuals: National Trust of Fiji, BirdLife International, NatureFiji-MareqetiViti, Nadroga/Navosa Provincial Council, Kula EcoPark, Fiji Department of Environment, Fiji Police Force, Biosecurity Authority of Fiji, Mamanuca Environment Society, Pacific Invasives Initiative, San Diego Zoo, Ross Wharfe, Luke Robertson, New Zealand Department of Conservation, skilled hunters, David & Lucile Packard Foundation, UK Darwin Initiative, Critical Ecosystem Partnership Fund, Aage V. Jensen Foundation, European Community and the landowners of Monuriki and Kadomo Mataqali Vuna-i-vi and Mataqali Namatua, Taukei Yanuya, and the village of Yanuya (Koro ko Yanuya).

104
5.3. Major Threat 3 – Biological resource use (mainly threat to marine)
Biological resource use was ranked highly as a threat for both the terrestrial (Table 17: “5.3
Logging and wood harvesting) and the marine species and ecosystems (Table 19). Much of
this related to near-shore subsistence or local commercial fisheries (caught to sell at local
markets) rather than large-scale commercial offshore fisheries. Within the last 12 months, Fiji’s
marine resources and achievements for sustainable resource use have been challenged by
the impacts of the COVID-19 pandemic. For example, a public campaign, the 4FJ campaign,
to establish a seasonal ban on the harvest of groupers, was initiated in 2014. This campaign
resulted in government issuing a legal ban for a 4-month period every year (Box 8). However,
as the COVID pandemic impacted on Fiji communities in 2020, the government ban was
reduced from 4 to 2 months (Fiji Sun 2020).
On the 10th of October 2020, Fiji government through the Minister of Forestry, Mr Osea
Naiqamu launched “Plant One Million Coral Initiative” with the theme “Build, Restore Fiji’s
Natural Assets for A Resilient Future” programme. The Ministry has identified areas around
the country whose coral reefs need immediate restoration and will be working closely with its
coastal communities and stakeholders as corals play a significant role in the marine
ecosystems. This is also aligned to the government commitment at the Convention on
Biological Diversity (CBD) and the Sustainable Development Goals (SDG).
RECOMMENDATIONS 1. Monitor the effectiveness of the 4FJ awareness-raising campaign as an effective
conservation measure and if appropriate expand to other taxa.
Box 9: 4FJ Campaign to revive Fiji’s Rapidly Declining Grouper Fisher Stock
Launched in 2014, the 4FJ (For Fiji) campaign was established with support from the Fiji Ministry of Fisheries to reduce fishing pressure on rapidly declining grouper fisheries in Fiji. The campaign recruited “champions” (sports figures, community leaders, church leaders) to pledge to not eat groupers during the spawning season (June – September each year). In 2018, after targeted campaigning to receive more than 15,000 public 4FJ pledges through media outreach, community visits and private sector engagements, the movement came to fruition as the Ministry of Fisheries legally banned the harvesting and sale of groupers during their peak breeding months (June through to September). The 4FJ campaign has launched the 4FJ Fish Smart – the next chapter in this campaign to build citizen commitment to observing the seasonal ban of groupers. Source: https://4fjmovement.org/inside-the-movement-launch

105
2. Continue to engage with local communities, fishermen and the Fiji Locally Managed
Marine Areas (FLMMA) network to promote sustainable coastal fisheries.
5.4. Study Limitations and Knowledge Gaps There are several limitations of this study that could lead to bias and/or confounding
arguments affecting our findings.
5.4.1. The ‘reductionist’ approach inherent in the IUCN threats listing.
Outcomes can be linked to a range of different IUCN threats – forest fragmentation/loss can
be linked to agricultural expansion, harvesting of timber, increase in pollution flow, increase in
roads/development, even spread of invasive species. The key is to identify the outcome and
determine a solution.
5.4.2. The incompleteness of the species list used for assessment. a. We attempted to get around this by expanding the suite of taxonomic groups included
in the analysis – but this required the use of a surrogate measure for AOH.
b. Even within the taxonomic groups we used there were gaps in coverage – Partulid
snail data for Fiji has not, to date, been included in the list. The plant species included are
only a fraction of all plant species in Fiji, in particular there is a bias away from the
‘relatively unknown’ cloud forest endemic plants.
d. The threat component within IUCN Red List is often not uppermost in expert’s minds
when they undertake the assessment. Every single coral, for instance, has exactly the
same suite of threats with exactly the same impact scores. Is this realistic?
e. Taxonomy changes – the bird list includes four species that were not identified as
separate species even 10 years ago. The taxonomy of corals as used in the IUCN Red
List is considered to be out-of-date and may have ‘over-lumped’ species groups –
revisions may identify that species have much more restricted ranges.
f. Some of the species in Fiji are listed as Data Deficient on the IUCN Red List, as a result
they were not included in the analyses as they did not come under a threatened category.
For example, there are 14 freshwater fish that are listed as DD. Given that these are
mainly endemic species with relatively restricted ranges, they would have contributed
useful information to the assessment.

106
5.4.3. The lack of representation of the Marine biodiversity component needs to be addressed.
1. It is clear that the marine biodiversity component is unlikely to be prioritised, at the national
level, IF the primary objective is reversal of the IUCN Red List Index for Fiji. There needs,
therefore, to be a review/assessment of how marine biodiversity are incorporated into
assessments of biodiversity at the national level within SIDS.
2. The primary marine biodiversity threat common to the range of taxa came down to
biological resource use – and so there continues to be a need to focus on sustainable
resource management (continuing the approach that has been followed for at least 3
decades in Fiji)). This indicates that progress is most likely to be achieved in partnership
with the Ministry of Fisheries. There are many positive examples where these approaches
are in place, FLMMA, 4FJ, MPAs, etc. We need to capture the success, or otherwise, of
these various initiatives – from the biodiversity perspective – and modify the processes,
as necessary.
5.4.4. Lack of accurate data on the geographic extent of threats While agriculture has been highlighted as a significant threat to Fiji’s native biodiversity, it is
difficult to assess quantitatively the extent of this threat due to a paucity of robust data on the
geographic extent and expansion of agriculture across the country including into/surrounding
formal and informal protected areas. There are no accurate GIS maps/layers publicly available
for the area of land under agriculture or the extent and location of the remaining native forest
types.
5.5. Summary of Recommendations
Major Threat 1 – Loss of forest and fragmentation 1. Prospect 1: ECAL - we suggest a review of the spend of ECAL to deliver benefits more
effectively to communities who manage priority areas for biodiversity on land in Fiji.
2. Prospect 2: Working with indigenous landowners - Establish more effective monitoring of
‘native reserve’ land in order to minimise the damage to and promote the conservation of
native forest habitats.
3. Prospect 3: Protected Areas - The two areas that we need to focus the development efforts
are:
a. A recommitment to effectively fund a Protected Area network in accordance with
the NBSAP commitments that the government has made to the CBD. We need to:
i. Provide increased protection for a minimum of the 16% of terrestrial land,
primarily native forest to enable Fiji to ensure the “risk-free” protection of
national and global biodiversity thereby maximising the benefits to the
species that impact on the IUCN Red List index. The suite of KBAs goes
107
some way to further address this, together with justification, but now needs
updating.
ii. Address how to effectively deliver forest conservation as a ‘land use’ that
landowners value more than other potential uses and developments.
b. Address how to deliver benefits to the landowners such that they are fully
supportive of measures needed for the effective conservation of the land whether
it is full protection, threatened species management or the reduction/ elimination
of invasive species
4. Prospect 4: Understanding the principle threats to Fiji’s native biodiversity - Immediate,
high priority, concerns that need addressing are –
a. What are the current drivers of forest loss/fragmentation? The IUCN threats
attempt to identify this – but each in isolation, no one threat taken individually is
causing significant damage – it is the accumulation of these multiple threats that is
of concern. This is a development imperative, but advances in conservation are
not commensurate with the threats.
b. At what scale does forest fragmentation impact on various species? This will differ
between taxa but is vitally important if we are to establish effective areas for the
protection of biodiversity.
c. Are the threats from invasive species compounded by the fragmentation and
‘opening up’ of native forest habitats?
5. Prospect 5: National capacity to update the IUCN Red List of Threatened Species - There
is a need to develop a threatened species management capacity commensurate with the
need. Currently NGOs lead in funding and implementation of a small number of initiatives,
but there is a need for government, NGOs and academic institutions to identify and
address the gaps in our current knowledge to enable the country to most effectively
managed its threatened species. This in turn will enable us to update Fiji specific data on
the IUCN Red List through investment in research with academic institutions, knowledge
and capacity building, and so more effectively address the standards that sectors use in
their certification schemes.
6. Prospect 6: The Red List Index - Alternative ways of addressing this have been suggested,
and might include -.
a. A regional Red List Index, addressed by nations in partnership, may be a more
effective way of presenting changes in the marine biodiversity.
b. A red list for ecosystems, focused on marine ecosystems, may be a more effective
way of targeting unique marine environments at the national level.

108
c. An index that combines the globally threatened species with a sustainable resource
use component may provide a more pragmatic approach.
Oceanic states, such as Fiji, will need to understand how best to develop a metric to address
this component considering the importance and diversity of Fiji’s marine biodiversity.
Major Threat 2 – Invasive species (from a range of activities) 1. A more robust response to eradicate newly identified/ naturalised invasive species
needs to be established.
2. In addition, inter-island biosecurity, consistent post-eradication biosecurity
protocols and monitoring to keep biodiversity-rich sites free of invasive species is
critical.
3. Many of the threats from invasive species are due to the loss of habitat and
activities mentioned in 5.1.1.
Major Threat 3 – Biological resource use (mainly threat to marine) 1. Monitor the effectiveness of the 4FJ awareness-raising campaign as an effective
conservation measure and if appropriate expand to other taxa.
2. Continue to engage with local communities, fishermen and the Fiji Locally Managed
Marine Areas (FLMMA) network to promote sustainable coastal fisheries.
Study Limitations and Knowledge Gaps The study had its limitations and there were knowledge gaps that were too huge to address
within the study period. These have been described in detail in Section 5.4
109
6. CONCLUSION For an oceanic country like Fiji, the protection of forest biodiversity is critical and will contribute
to sustainable agricultural and fisheries development and so ensure food security for all, thus
meeting Fiji’s national economic and social priorities.
The current threats to biodiversity have been known for a long time, but individually are small
and piece-meal. They are now getting to a stage where the cumulative impact of these threats
is exacerbated by a protected area policy and legislation that is insufficiently robust to ensure
the all-important insurance against loss of forest and that is an effective protected area
network. A network which provides risk-free protection of Fiji’s natural heritage for:
• the benefit of future generations of Fijians;
• for its unique genetic resources of value to the international community; and,
• the well-being and satisfaction of the native landowners.
How do we ensure that the native forest habitat is valued both for its ecosystem services and
its biodiversity in a way that establishes forest conservation as a viable landuse option?
The cornerstone of the Fiji Forest Policy is a form of rural landuse planning, sometimes
referred to as Permanent Forest Estates, which considers the multiple roles of the forest to
ensure sustainable forest management and shared benefits across multiple stakeholders to
maintain ecosystem services and reduce the risk of encroachment through other land use
such as agriculture and forest-removing activities.
This report concludes that the sectors associated with the greatest direct impact or effect on
Fiji’s biodiversity are Agriculture and Fisheries. Addressing the primary threats caused by
these sectors will have a significant impact on biodiversity in Fiji and is likely to modify the
downward trajectory of Fiji’s Red List Index. It is important to note that the threats are not
limited to these two economic sectors; and that there are other sectors may provide alternative
solutions to the threats that have been identified here.
6.1. Sector 1 - Agriculture Land degradation through historical agricultural activities and more recent expansion of crops
such as taro and yaqona onto marginal lands is worsening in Fiji, therefore increasing
vulnerabilities to extreme weather events (Ministry of Forestry 2019) as well as reducing the
resilience to introduced species.
The Fiji Agriculture Census 2020 (FAC2020) documents that of the 194,768.61 ha of land
farmed in Fiji, 54.1% is farmed by members of indigenous landowners or mataqali. Only 23.7%
are under a lease arrangement with indigenous landowners through the Itaukei Land Trust

110
Board; 13.9% is freehold land and 6% is leased from the state. The data for the FAC2020 was
collected before Fiji’s had its first COVID-19 case in 2020. In July 2020 the Prime Minister of
Fiji announced that 115,000 Fijians had lost their jobs or had had their hours cut as a result of
COVID-19 (Bainimarama 2020). This first wave saw many laid-off workers, particularly
indigenous Fijians, return to their traditional villages focussing on agriculture, particularly kava
as an alternative livelihood.
The Ministry of Agriculture has launched several programs to address food security and revive
the economy through agriculture in response to the economic impact of COVID-19 in Fiji
(Ministry of Agriculture 2021), but it is not clear if these activities will focus on lands under the
agricultural lease only, or if it will be extended to non-leased land (native reserve land) farmed
and managed by indigenous landowners (some of whose farms are located within Fiji’s
biodiversity rich areas).
Fiji is now experiencing its second wave community-transmissions of COVID-19, with even
more severe impacts on the economy. Loss of forest due to agricultural expansion in non-
leased or “native-reserve” land is predicted to increase.
There needs to be a focus on education and community engagement of stakeholders in the
Agriculture sector (Figure 27) – going beyond engaging only usual or traditional stakeholders,
to include those in the non-formal agriculture sector in Fiji. Education and engagement should
happen not only at ministerial level, but at all levels including the landowning communities,
commercial producers, sector representatives (e.g. Sugar Cane Growers Council, Fiji Kava
Council), the Itaukei Lands Trust Board and organisations that provide regional support (e.g.
PHAMA Plus).
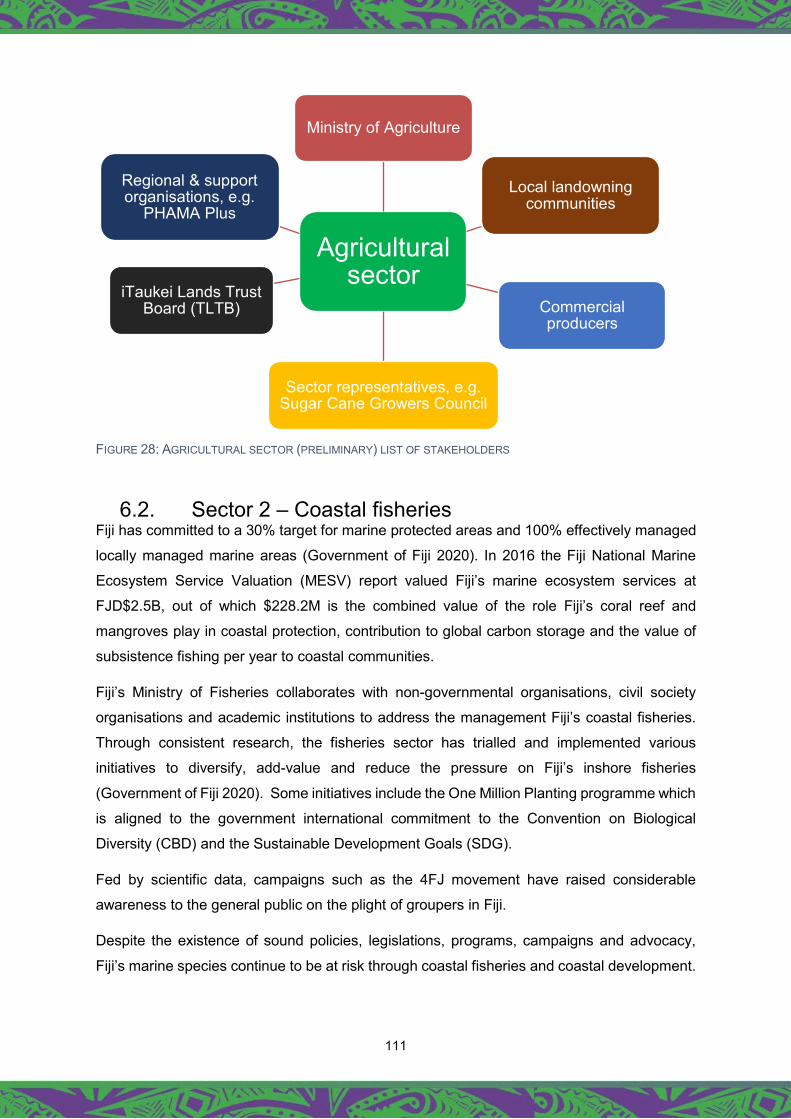
111
FIGURE 28: AGRICULTURAL SECTOR (PRELIMINARY) LIST OF STAKEHOLDERS
6.2. Sector 2 – Coastal fisheries Fiji has committed to a 30% target for marine protected areas and 100% effectively managed
locally managed marine areas (Government of Fiji 2020). In 2016 the Fiji National Marine
Ecosystem Service Valuation (MESV) report valued Fiji’s marine ecosystem services at
FJD$2.5B, out of which $228.2M is the combined value of the role Fiji’s coral reef and
mangroves play in coastal protection, contribution to global carbon storage and the value of
subsistence fishing per year to coastal communities.
Fiji’s Ministry of Fisheries collaborates with non-governmental organisations, civil society
organisations and academic institutions to address the management Fiji’s coastal fisheries.
Through consistent research, the fisheries sector has trialled and implemented various
initiatives to diversify, add-value and reduce the pressure on Fiji’s inshore fisheries
(Government of Fiji 2020). Some initiatives include the One Million Planting programme which
is aligned to the government international commitment to the Convention on Biological
Diversity (CBD) and the Sustainable Development Goals (SDG).
Fed by scientific data, campaigns such as the 4FJ movement have raised considerable
awareness to the general public on the plight of groupers in Fiji.
Despite the existence of sound policies, legislations, programs, campaigns and advocacy,
Fiji’s marine species continue to be at risk through coastal fisheries and coastal development.
Agricultural
sector
Ministry of Agriculture
Local landowning communities
Commercial producers
Sector representatives, e.g. Sugar Cane Growers Council
iTaukei Lands Trust Board (TLTB)
Regional & support organisations, e.g.
PHAMA Plus
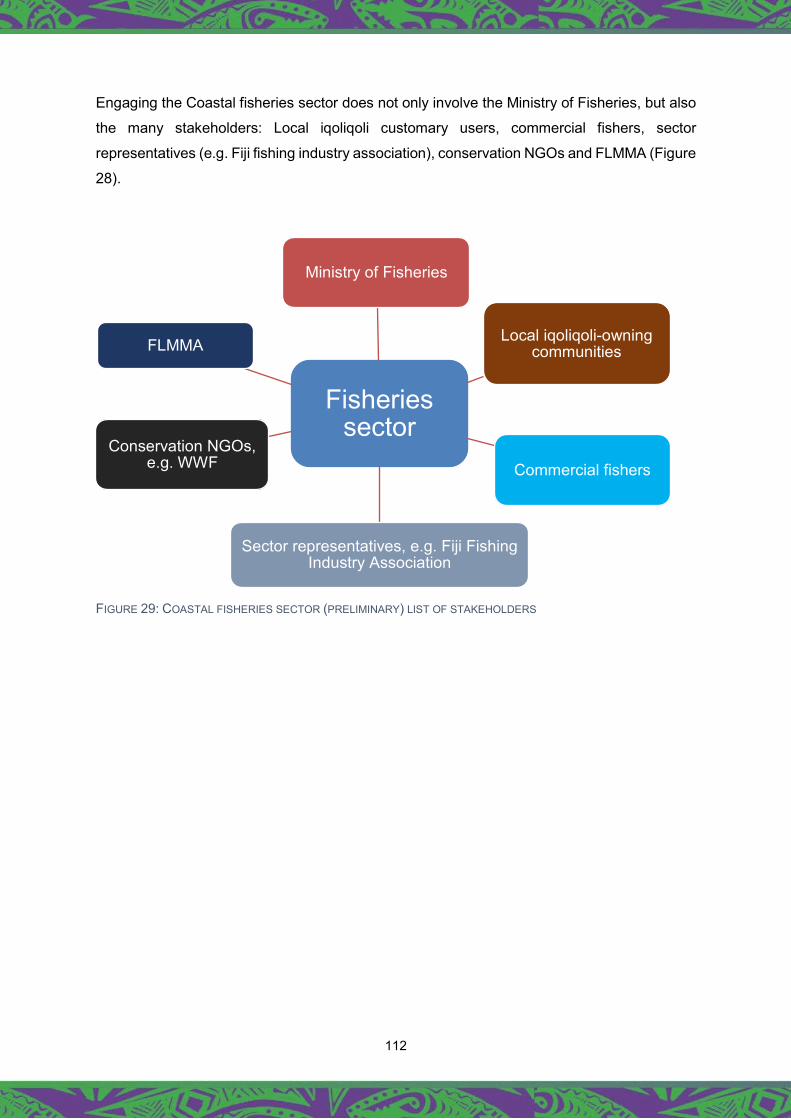
112
Engaging the Coastal fisheries sector does not only involve the Ministry of Fisheries, but also
the many stakeholders: Local iqoliqoli customary users, commercial fishers, sector
representatives (e.g. Fiji fishing industry association), conservation NGOs and FLMMA (Figure
28).
FIGURE 29: COASTAL FISHERIES SECTOR (PRELIMINARY) LIST OF STAKEHOLDERS
Fisheries
sector
Ministry of Fisheries
Local iqoliqoli-owning communities
Commercial fishers
Sector representatives, e.g. Fiji Fishing Industry Association
Conservation NGOs, e.g. WWF
FLMMA
113
7. BIBLIOGRAPHY Bainimarama, V. (2020) Hon. PM Bainimarama’s statement at the Global Leaders’ Day at
the ILO Global Summit on COVID-19 and the World of Work.(website link)
Cameron C, A Maharaj, B Kennedy, S Tuiwawa, N Goldwater, K Soapi, CE Lovelock 2021.
Landcover change in mangroves of Fiji: Implications for climate change mitigation and
adaptation in the Pacific. Environmental Challenges 2: 100018
https://doi.org/10.1016/j.envc.2020.100018
Chand, V., Prasad, S., & Prasad, R. (2011). Distribution and chemical fractionation of
arsenic in surficial sediments of the Lami coastal environment in Fiji. The South Pacific
Journal of Natural and Applied Sciences, 28(1), 78–81.
Clause, A. G., Thomas-Moko, N., Rasalato, S. and R. N. Fisher (2018) “All is not lost:
Herpetofauna “extinctions” in the Fiji Islands” Pacific Science 72(3): 321-328
Copeland, L. K. F., Boseto, D. T., & Jenkins, A. P. (2016). Freshwater ichthyofauna of the
Pacific-Asia biodiversity transect (PABITRA) gateway in Viti Levu, Fiji. Pacific
Conservation Biology, 22(3), 236–241.
Day, J. C., Laffoley, D. and Zischka, K. 2015.‘Marine protected area management’, in G. L.
Worboys, M. Lockwood, A. Kothari, S. Feary and I. Pulsford (eds) Protected Area
Governance and Management.
Dyer M.J., Keppel G., Tuiwawa M., Vido S. & H.J. Boehmer (2018): Invasive alien palm
Pinanga coronata threatens native tree ferns in an oceanic island rainforest. –
Australian Journal of Botany 66, pp. 647-656. (https://doi.org/10.1071/BT18088)
Dyer, M. J. B. (2017) Distribution of the invasive palm Pinanga coronata and its effects on
native tree ferns in the Colo-i-Suva area, Viti Levu, Fiji. The University of the South
Pacific, Faculty of Science, Technology & Environment (FSTE) & The University of
South Australia (UniSA), pp. 14
Dyer, M. J. B.; Keppel, G.; Watling, D.; Tuiwawa, M.; Vido, S. & H. J. Boehmer 2019. Using
expert knowledge and field surveys to guide management of an invasive alien palm in
a Pacific Island lowland rainforest. In: C.R. Veitch, (ed.), Island Invasives: Stepping Up
To The Challenge. Proceedings of the 14th Ecology and Management of Alien Plant
Invasions (EMAPI) World Congress 2017. Gland, Switzerland: IUCN & Dundee,
Scotland.
FBS (2017). Fiji Bureau of Statistics, National Census 2017. https://www.statsfiji.gov.fj/
114
Fiji Sun (2020). Seasonal ban on Kawakawa and Donu lifted.
https://fijisun.com.fj/2020/08/09/seasonal-ban-on-kawakawa-and-donu-lifted/.
Accessed on 23rd July 2021.
Fiji Sun (2021). Breeding season start for kawakawa and donu start.
https://fijisun.com.fj/2021/06/01/breeding-season-for-kawakawa-and-donu-starts/
Accessed on 23rd July 2021.
Gangaiya, P., Tabudravu, J., South, R., & Sotheeswaran, S. (2001). Heavy metal
contamination of the Lami coastal environment, Fiji. South Pacific Journal of Natural
Sciences, 19, 24–29.
Goundar, M. S., Morrison, R. J., & Togamana, C. (2014). Phosphorous requirements of
some selected soil types in the Fiji sugarcane belt. South Pacific Journal of Natural
and Applied Sciences, 32, 1–10.
Government of Fiji (2010). Fiji’s Fourth Report to the Fourth National Report to the United
Nations Convention on Biological Diversity 2010.
Government of Fiji (2017). 5-Year & 20-Year National Development Plan – Transforming Fiji.
Ministry of Economy, Republic of Fiji. https://www.fiji.gov.fj/getattachment/15b0ba03-
825e-47f7-bf69-094ad33004dd/5-Year-20-Year-NATIONAL-DEVELOPMENT-
PLAN.aspx
Government of Fiji (2020). Fiji Sixth National Report to CBD. Ministry of Environment, Suva,
Fiji.
Government of Fiji (2020). Fiji’s State of Environment Report 2020. Suva, Fiji.
Gray, A. J. (1993). Fiji. In D. A. Scott (Ed.), A directory of wetlands in Oceania (pp. 72–98).
Slimbridge and Kuala Lumpur: The International Waterfowl and Wetlands Research
Bureau and Asian Wetlands Bureau.
Haynes, A. (1988). A population study of the Fijian freshwater thiarid gastropod Fiji Doma
maculata (Mousson). Archiv für Hydrobiologie, 113, 27–39.
Haynes, A., & Kenchington, W. (1991). Acochlidium fijiensis sp. nov. (Gastropoda:
Opisthobranchia: Acochlidiacea) from Fiji. The Veliger, 34(2), 166–171.
IHO, 2008. Standardization of Undersea Feature Names: Guidelines Proposal form
Terminology
IUCN (2016) Guidelines for the Appropriate Use of the IUCN Red List for Business. Version
1.0 (October 2016).

115
Juffe-Bignoli, D. (2014) Biodiversity for Business: A Guide to Using Knowledge Products
Delivered through IUCN. IUCN, Gland, Switzerland.
Keppel G., Peters, S., Taoi, J., Raituku, N., and Thomas-Moko, N. (2021) “The threat by the
invasive African tulip tree, Spathodea campanulata P.Beauv., for the critically
endangered Fijian tree, Pterocymbium oceanicum A.C.Sm.; revisiting an assessment
based on expert knowledge after extensive field surveys” Pacific Conservation Biology
https://doi.org/10.1071/PC20068
Lenz M-I, Galvin S, Keppel G, Gopaul S, Kowasch M, Dyer M, Watling D, Lodhar S, Hanson
G, Erasmi S, Boehmer H, (2021). Where to invade next: inaction on biological
invasions threatens sustainability in a small island developing state of the tropical
South Pacific ? In: P.S. Low, (ed), Sustainable Development: Asia-Pacific
Perspectives. Cambridge University Press, Cambridge. ISBN 0521897173,
9780521897174Mangubhai, S. (2016). Impact of Tropical Cyclone Winston on coral
reefs in the Vatu-i-Ra seascape. Report No. 01/16. Suva: Wildlife Conservation
Society.
Mangubhai S, Sykes H, Lovell E, Brodie G, Jupiter S, Lal R, Lee S, Loganimoce EM, Morris
C, Nand Y, Qauqau I, Rashni B (2018). Fiji: Coastal and marine ecosystems. In C.
Sheppard (ed.) World Seas: An Environmental Evaluation Volume II: The Indian
Ocean to the Pacific. Elsevier.
Mimura, N., & Nunn, P. D. (1998). Trends in beach erosion and shoreline protection in rural
Fiji. Journal of Coastal Research, 14(1), 37–46.
Ministry of Agriculture (2014). Fiji 2020 Agriculture Sector Policy Agenda
Ministry of Agriculture (2021). Press releases.
https://agriculture.gov.fj/pressrelease.php?page=2 Accessed on 23rd July 2021
Ministry of Agriculture (2020). 2020 Fiji Agriculture Census. Volume 1: General Table &
Descriptive Analysis Report. Parliamentry Paper No. 59/2021. Government of Fiji.
https://www.fiji.gov.fj/getattachment/e71b8d61-ce72-48fc-bca2-
eeeff2d8739b/Environment-Climate-Adaptation-Levy.aspx (Accessed on 31 July 2021)
Ministry of Economy (2018). ECAL in Action. How Your Environment and Climate Change
Adaptation Levy is Building a Better, Stronger Fiji. Bulletin 01/2018.
Ministry of Forestry (2019). Emission Reductions Program Document (ER-PD). Forest
Carbon Partnership Facility (FCPF) Carbon Fund, World Bank.
Ministry of Fisheries (2018a). Fish Guide on the 4-Month Ban on Fishing, Sale and Export

116
of Kawakawa & Donu
https://www.fisheries.gov.fj/images/Publications/KawakawaDonuFishGuideA4_MID.pdf
. Accessed on 23rd July 2021.
Ministry of Fisheries (2018b). Public notice: 4-month ban (June thru September) on fishing,
sale and export of all species of grouper (Kawakawa) and coral trout (Donu).
https://www.fisheries.gov.fj/images/Publications/FishPosterA2_MID.pdf Accessed on
23rd July 2021.
MMC (2013). Mangrove Management Plan for Fiji 2013. – Mangrove Management
Committee – prepared by MESCAL (DRAFT), Suva. http://macbio-pacific.info/wp-
content/uploads/2017/08/Mangrove-Management-Plan-Draft-Final-_NN.pdf
Morrison, R. J., Harrison, N., & Gangaiya, P. (1996). Organochlorine contaminants in the
estuarine and coastal marine environments of the Fiji Islands. Environmental Pollution,
93(2), 159–167.
Morrison, C., Naikatini, A., Thomas, N., Rounds, I., Thaman, B. & Niukula, J. (2004).
Rediscovery of an endangered frog Platymantis vitianus, on mainland Fiji: implications
for conservation and management. Pacific Conservation Biology 10: 237-24
Mosley, L. M., & Aalbersberg, W. G. L. (2003). Nutrient levels in sea and river water along
the ‘coral coast’ of Viti Levu, Fiji. South Pacific Journal of Natural and Applied
Sciences, 21, 35–40.
Mueller-Dombois, D., & Fosberg, F. R. (1998). Vegetation of the tropical Pacific Islands. New
York: Springer.
Osborne, T., Naikatini, A., Morrison, C. & Thomas, N. (2013). The distribution of the Fiji frogs
Platymantis spp.: new records and ramifications. Pacific Conservation Biology 19: 175-
183.
Park, E.-K., Wilson, D., Choi, H.-J., Wilson, C. T., & Ueno, S. (2013). Hazardous metal
pollution in the Republic of Fiji and the need to elicit human exposure. Environmental
Health and Toxicology, 28, 1–3.
Prasad, B. (2010). Natural resource inventory report of the Fiji Islands (2010). In Volume 2:
Marine resources inventory of the Fiji Islands. Suva: University of the South Pacific.
Rashni, B. (2014). Effect of catchment forest cover on macroinvertebrate community
structure in streams of Fiji (MSc thesis). Suva: The University of the South Pacific.
Salafsky, N., D. Salzer, AJ Stattersfield, C. Hilton-Taylor, R. Neugarten, SHM Butchart, B.
Collen, N. Cox, LL Master, S. O'Connor, and D. Wilkie. (2008). A standard lexicon for
117
biodiversity conservation: Unified classifications of threats and actions. Conservation
Biology 22: 897–911.
Salafsky, N., D. Salzer, J. Ervin, T. Boucher, and W. Ostlie. (2003). Conventions for defining,
naming, measuring, combining, and mapping threats in conservation: an initial
proposal for a standard system. Conservation Measures Partnership, Washington, DC
Sloan, J. and Chand, K. (2016). An analysis of property rights in the Fijian qoliqoli. Marine
Policy: 76–81.
Smith Robert, Gary Lee, Akuila Tawake, Epeli Waqavonovono, Ken Chambers, Tevita
Bukarau, Christine Prasad, Donato Roqica, Isireli Nagata, Timaima Nainoca, Ville
Peltovuori, Priya Devi, Josefa Caniogo, Mihaela Stojkoska, Lacina Pakoun, Caroline
Ngonze and Daniel M. Franks (2018). Baseline Assessment of Development Minerals
in Fiji. United Nations Development Programme, Kadavu House, Suva, Fiji
SOPAC. (2012). Catalogue of rivers. Noumea: Secretariat of the Pacific Community.
Sykes H, Le Grand J, Davey K, Kirmani SN, Mangubhai S, Yakub N, Wendt H, Gauna M,
Fernandes L (2018) Biophysically special, unique marine areas of Fiji. MACBIO (GIZ,
IUCN, SPREP), Wildlife Conservation Society and Fiji’s Protected Area Committee
(PAC); Suva.
UNEP-WMC (2011). Review of the biodiversity requirements of standards and certification
schemes: A snapshot of current practice. Secretariat of the Convention on Biological
Diversity, Montreal, Canada. Technical Series No 63, 30 pages.
Waycott, M., McKenzie, L. J., Mellors, J. E., Ellison, J. C., Sheaves, M. T., Collier, C., et al.
(2011). Chapter 6: Vulnerability of mangroves, seagrasses and intertidal flats in the
tropical Pacific to climate change. In Bell, J. D., Johnson, J. E., & Hobday, A. J. (Eds.),
Vulnerability of tropical pacific fisheries and aquaculture to climate change (pp. 297–
368, 925 pp.). Secretariat of the Pacific Community.
Zielske, S., & Haase, M. (2014). New insights into tateid gastropods and their radiation on
Fiji based on anatomical and molecular methods (Caenogastropoda: Truncatelloidea
Zoological Journal of the Linnean Society, 172, 71–102.

118
APPENDIX 1: LIST OF SPECIES
APPENDIX 1.1 Amphibian/ Bird/ Mammal List Scientific Name Red List Category START score
Alopecoenas stairi Vulnerable 177.3
Ardenna bulleri Vulnerable 4.8
Chaerephon bregullae Endangered 14.2
Charmosyna amabilis Critically Endangered 400.0
Chrysoena viridis Near Threatened 100.0
Clytorhynchus nigrogularis Near Threatened 100.0
Cornufer vitianus** Near Threatened 100.0
Cornufer vitiensis** Near Threatened 100.0
Emballonura semicaudata* Endangered 194.7
Erythrura kleinschmidti Vulnerable 200.0
Lamprolia klinesmithi Vulnerable 200.0
Lamprolia victoriae Near Threatened 100.0
Limosa lapponica Near Threatened 0.1
Mayrornis versicolor Near Threatened 100.0
Megalurulus rufus Endangered 300.0
Mirimiri acrodonta* Critically Endangered 400.0
Myiagra azureocapilla Near Threatened 100.0
Myzomela chermesina Vulnerable 200.0
Notopteris macdonaldi* Vulnerable 152.4
Numenius tahitiensis Near Threatened 1.4
Prosopeia personata Near Threatened 100.0
Prosopeia splendens Vulnerable 200.0
Pseudobulweria macgillivrayi Critically Endangered 400.0
Pseudobulweria rostrata Near Threatened 3.2
Pterodroma brevipes Vulnerable 57.8
Pterodroma cervicalis Vulnerable 6.8
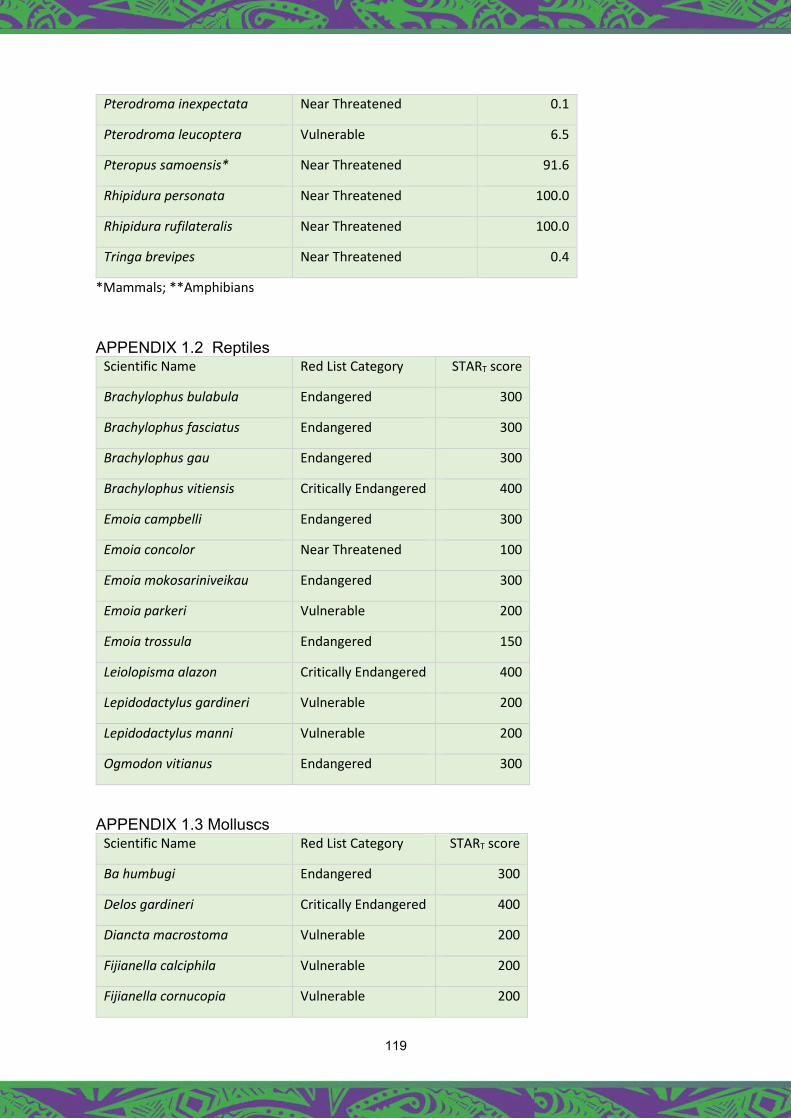
119
Pterodroma inexpectata Near Threatened 0.1
Pterodroma leucoptera Vulnerable 6.5
Pteropus samoensis* Near Threatened 91.6
Rhipidura personata Near Threatened 100.0
Rhipidura rufilateralis Near Threatened 100.0
Tringa brevipes Near Threatened 0.4
*Mammals; **Amphibians
APPENDIX 1.2 Reptiles Scientific Name Red List Category START score
Brachylophus bulabula Endangered 300
Brachylophus fasciatus Endangered 300
Brachylophus gau Endangered 300
Brachylophus vitiensis Critically Endangered 400
Emoia campbelli Endangered 300
Emoia concolor Near Threatened 100
Emoia mokosariniveikau Endangered 300
Emoia parkeri Vulnerable 200
Emoia trossula Endangered 150
Leiolopisma alazon Critically Endangered 400
Lepidodactylus gardineri Vulnerable 200
Lepidodactylus manni Vulnerable 200
Ogmodon vitianus Endangered 300
APPENDIX 1.3 Molluscs Scientific Name Red List Category START score
Ba humbugi Endangered 300
Delos gardineri Critically Endangered 400
Diancta macrostoma Vulnerable 200
Fijianella calciphila Vulnerable 200
Fijianella cornucopia Vulnerable 200

120
Fijianella laddi Vulnerable 200
Fijiopoma diatreta Vulnerable 200
Fijiopoma liberata Endangered 300
Gonatorhaphe intercostata Endangered 300
Gonatorhaphe lauensis Critically Endangered 400
Gonatorhaphe stricta Endangered 300
Lagivala minusculus Vulnerable 200
Lagivala vivus Vulnerable 200
Lauopa mbalavuana Critically Endangered 400
Maafu thaumasius Critically Endangered 400
Macropalaina pomatiaeformis Endangered 300
Microcharopa mimula Vulnerable 200
Moussonia fuscula Near Threatened 100
Omphalotropis circumlineata Near Threatened 100
Omphalotropis costulata Vulnerable 200
Omphalotropis ingens Critically Endangered 400
Omphalotropis longula Vulnerable 200
Omphalotropis rosea Vulnerable 200
Omphalotropis subsoluta Endangered 300
Omphalotropis zelriolata Near Threatened 33.33333333
Ouagapia perryi Endangered 150
Ouagapia ratusukuni Critically Endangered 400
Palaina godeffroyana Vulnerable 200
Palaina martensi Near Threatened 100
Palaina subregularis Vulnerable 200
Palaina taviensis Endangered 300
Placostylus elobatus Vulnerable 200
Placostylus graeffei Endangered 300
Placostylus guanensis Endangered 300
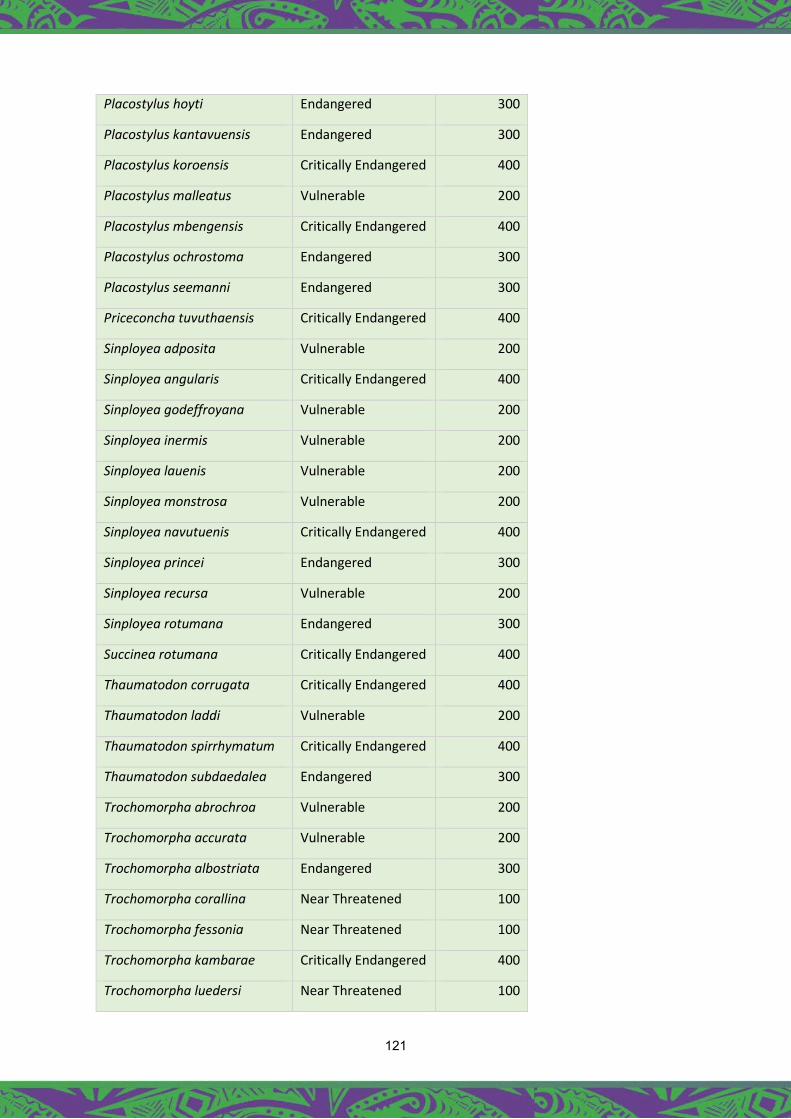
121
Placostylus hoyti Endangered 300
Placostylus kantavuensis Endangered 300
Placostylus koroensis Critically Endangered 400
Placostylus malleatus Vulnerable 200
Placostylus mbengensis Critically Endangered 400
Placostylus ochrostoma Endangered 300
Placostylus seemanni Endangered 300
Priceconcha tuvuthaensis Critically Endangered 400
Sinployea adposita Vulnerable 200
Sinployea angularis Critically Endangered 400
Sinployea godeffroyana Vulnerable 200
Sinployea inermis Vulnerable 200
Sinployea lauenis Vulnerable 200
Sinployea monstrosa Vulnerable 200
Sinployea navutuenis Critically Endangered 400
Sinployea princei Endangered 300
Sinployea recursa Vulnerable 200
Sinployea rotumana Endangered 300
Succinea rotumana Critically Endangered 400
Thaumatodon corrugata Critically Endangered 400
Thaumatodon laddi Vulnerable 200
Thaumatodon spirrhymatum Critically Endangered 400
Thaumatodon subdaedalea Endangered 300
Trochomorpha abrochroa Vulnerable 200
Trochomorpha accurata Vulnerable 200
Trochomorpha albostriata Endangered 300
Trochomorpha corallina Near Threatened 100
Trochomorpha fessonia Near Threatened 100
Trochomorpha kambarae Critically Endangered 400
Trochomorpha luedersi Near Threatened 100
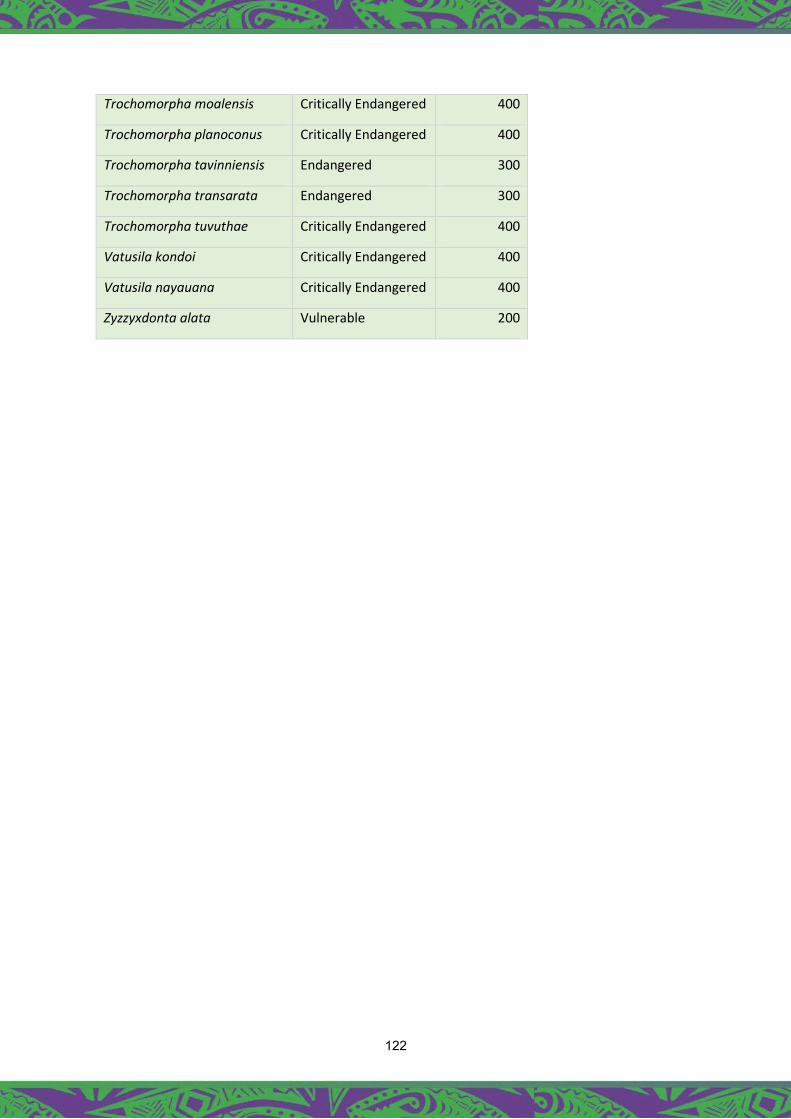
122
Trochomorpha moalensis Critically Endangered 400
Trochomorpha planoconus Critically Endangered 400
Trochomorpha tavinniensis Endangered 300
Trochomorpha transarata Endangered 300
Trochomorpha tuvuthae Critically Endangered 400
Vatusila kondoi Critically Endangered 400
Vatusila nayauana Critically Endangered 400
Zyzzyxdonta alata Vulnerable 200
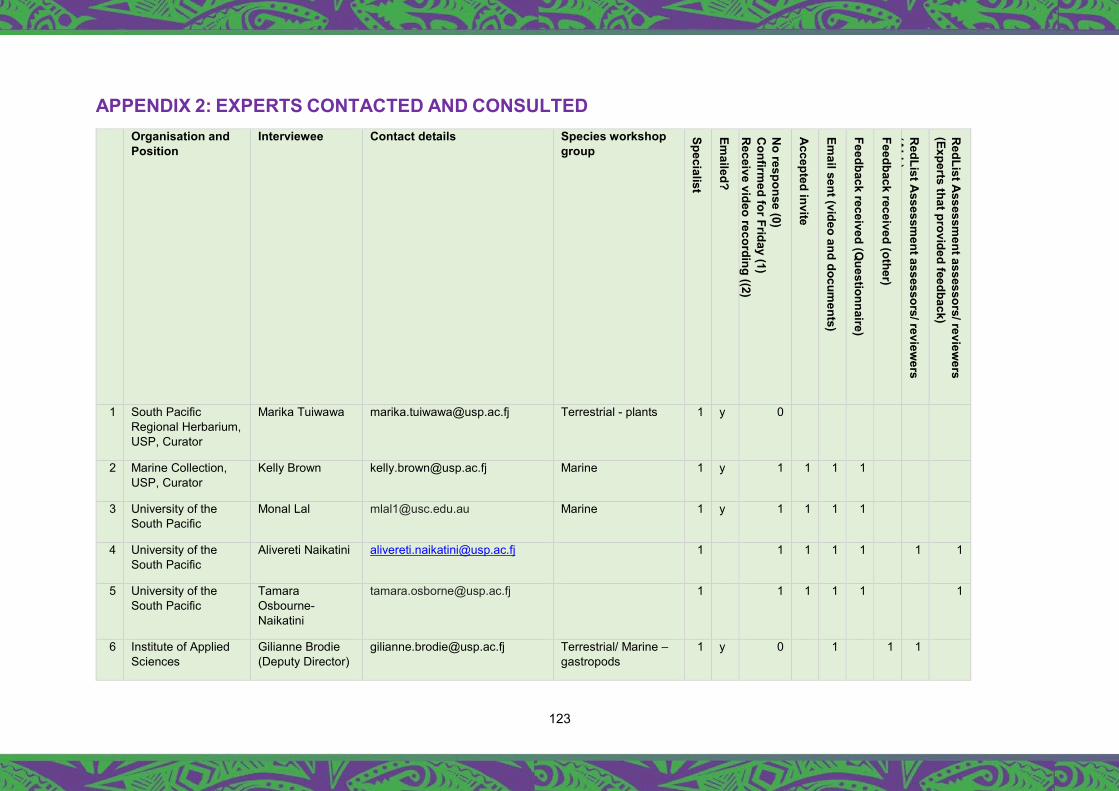
123
APPENDIX 2: EXPERTS CONTACTED AND CONSULTED Organisation and
Position Interviewee Contact details Species workshop
group
Specialist
Emailed?
No response (0)
Confirm
ed for Friday (1) R
eceive video recording ((2)
Accepted invite
Email sent (video and docum
ents)
Feedback received (Questionnaire)
Feedback received (other)
RedList A
ssessment assessors/ review
ers (A
LL)
RedList A
ssessment assessors/ review
ers (Experts that provided feedback)
1 South Pacific Regional Herbarium, USP, Curator
Marika Tuiwawa [email protected] Terrestrial - plants 1 y 0
2 Marine Collection, USP, Curator
Kelly Brown [email protected] Marine 1 y 1 1 1 1
3 University of the South Pacific
Monal Lal [email protected] Marine 1 y 1 1 1 1
4 University of the South Pacific
Alivereti Naikatini [email protected] 1 1 1 1 1 1 1
5 University of the South Pacific
Tamara Osbourne-Naikatini
[email protected] 1 1 1 1 1 1
6 Institute of Applied Sciences
Gilianne Brodie (Deputy Director)
[email protected] Terrestrial/ Marine – gastropods
1 y 0 1 1 1
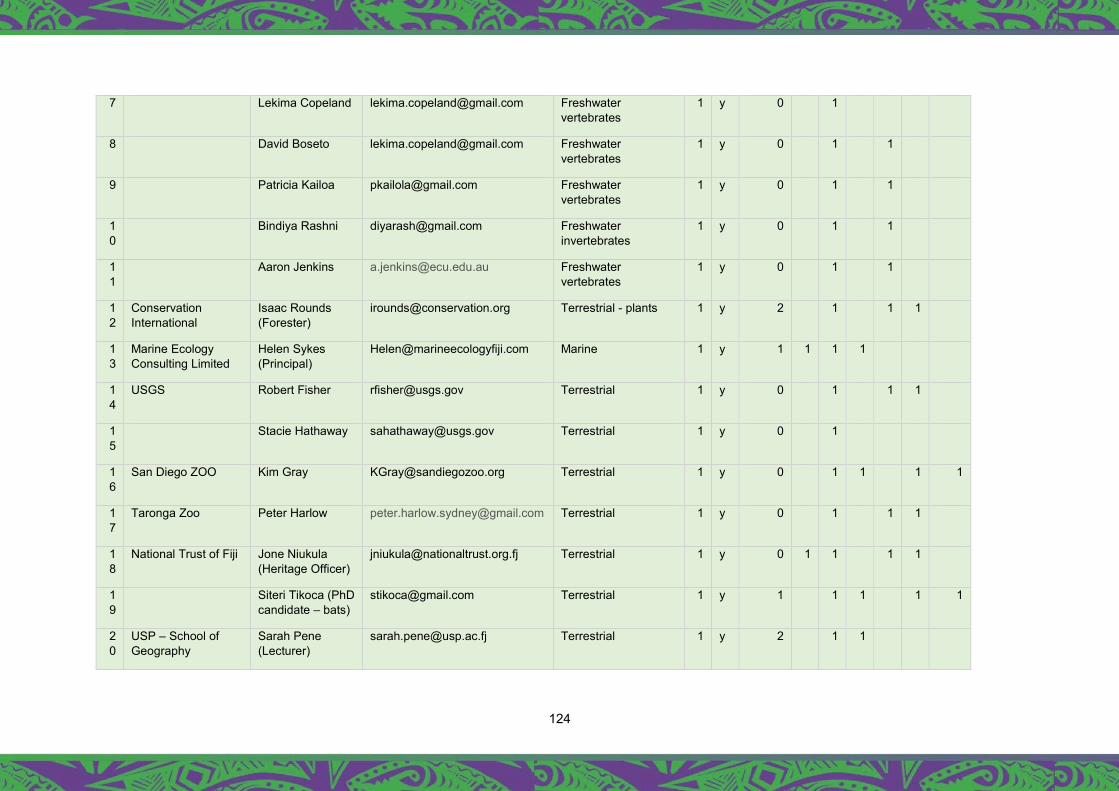
124
7 Lekima Copeland [email protected] Freshwater vertebrates
1 y 0 1
8 David Boseto [email protected] Freshwater vertebrates
1 y 0 1 1
9 Patricia Kailoa [email protected] Freshwater vertebrates
1 y 0 1 1
10
Bindiya Rashni [email protected] Freshwater invertebrates
1 y 0 1 1
11
Aaron Jenkins [email protected] Freshwater vertebrates
1 y 0 1 1
12
Conservation International
Isaac Rounds (Forester)
[email protected] Terrestrial - plants 1 y 2 1 1 1
13
Marine Ecology Consulting Limited
Helen Sykes (Principal)
[email protected] Marine 1 y 1 1 1 1
14
USGS Robert Fisher [email protected] Terrestrial 1 y 0 1 1 1
15
Stacie Hathaway [email protected] Terrestrial 1 y 0 1
16
San Diego ZOO Kim Gray [email protected] Terrestrial 1 y 0 1 1 1 1
17
Taronga Zoo Peter Harlow [email protected] Terrestrial 1 y 0 1 1 1
18
National Trust of Fiji Jone Niukula (Heritage Officer)
[email protected] Terrestrial 1 y 0 1 1 1 1
19
Siteri Tikoca (PhD candidate – bats)
[email protected] Terrestrial 1 y 1 1 1 1 1
20
USP – School of Geography
Sarah Pene (Lecturer)
[email protected] Terrestrial 1 y 2 1 1
125
21
Wildlife Conservation Society
Stacy Jupiter (Regional Director)
[email protected] Marine 1 y 2 1 1
22
University of South Australia
Gunnar Keppel [email protected] Terrestrial 1 y 1 1 1 1 1 1
23
Griffith University Clare Morrison [email protected] Terrestrial 1 y 1 1 1 1 1 1
24
ECF Dick Watling [email protected] Terrestrial 1 y 1 1 1 1 1 1
25
BirdLife International Mark O'Brien [email protected] Terrestrial 1 y 1 1 1 1 1 1
26
NatureFiji-MareqetiViti
Nunia Thomas-Moko
[email protected] Terrestrial 1 y 1 1 1 1 1 1
27
NatureFiji-MareqetiViti
Jake Taoi [email protected] Terrestrial 1 y 1 1 1 1 1
28
NatureFiji-MareqetiViti
Ana Lutua [email protected] Terrestrial 1 y 1 1 1 1 1
29
NatureFiji-MareqetiViti
Jone Raituva [email protected] Terrestrial 1 y 1 1 1 1
30
NatureFiji-MareqetiViti
Ana Nasiga [email protected] Terrestrial 1 y 1 1 1
31
NatureFiji-MareqetiViti
Melania Segaidina
[email protected] Terrestrial 1 y 1 1 1 1
32
NatureFiji-MareqetiViti
Semaema Vakaciriwaqa
[email protected] Terrestrial y 1 1 1 1 1
33
IUCN - Red List Authoriy for Bats
Dave Waldien [email protected] Terrestrial 1 y 1 1 1 1 1 1
126
34
WildLife Conservation Society
Sangeeta Manugbhai (Country Director, Fiji)
[email protected] Marine 1 y 2 1 1
35
BirdLife International Steve Cranwell (Invasive Species Program manager)
[email protected] Terrestrial/ Marine 1 y 2 1 1
36
WWF Francis Areki [email protected] Marine/ Terrestrial 1 y 1 1 1
37
IUCN Hans Wendt (Marine Program)
[email protected] Marine 1 y 1 1 1
38
FLMMA Margaret Vakalalabure (Coordinator)
[email protected] Marine 1 y 1 1
39
Ministry of Forestry
40
Conservator of Forests
Sanjana Lal (Conservator of Forests)
[email protected] Terrestrial 1 y 2 1 1
41
Executive Director Forest Operations and Extension Services
Manasa Luvunakoro
[email protected] 1 y 2 1 1
42
Director of Operations-Central/Eastern
George Vuki [email protected] 1 y 2 1 1
43
Assistant Director- Central/Eastern
Arieta Tupou arieta.tupou.govnet.gov.fj 1 y 2 1 1
44
Director Operations- North
Moape Drikalu [email protected] 1 y 2 1 1
127
45
Assistant Director North
Uraia Racule [email protected] 1 y 2 1 1
46
Director Operations- West
Maleli Nakasava [email protected] 1 y 2 1 1 1
47
Assistant Director West
1 y 2 1 1
48
Forest Resource Assessment and Conservation
Deborah Sue deb [email protected] 1 y 2 1 1
49
Director Silviculture Research and Development
Jale Tauraga [email protected] / [email protected]
1 y 2 1 1 1 1 1
50
Director Timber Utilisation Research and Product Development
Tevita Bulai [email protected] / [email protected]
1 y 2 1 1
51
Training and Education
Sailosi Kinivuwai [email protected] / [email protected]
1 y 2 1 1
52
Fiji Ministry of Fisheries
Saras Sharma [email protected] Marine 1 y
53
Extension Central Division
Nanise Tuqiri [email protected] 1
24
10
20
13
129
APPENDIX 3: QUESTIONNAIRE FOR SPECIES EXPERTS ON THE RESULTS OF FIJI'S STAR METRIC ANALYSIS
Mainstreaming biodiversity through sector-based commitments emerging from multi-stakeholder dialogue in pilot countries
Assessing the State of Biodiversity and Main Loss Drivers at National and Local Levels in Fiji
Questionnaire for experts on the results of the Fiji STAR metric analysis
Name : …………………………………………………………………………………………………………………………
Organisation and expertise : …………………………………………………………………………………………
Target group(s):
Indicate all that apply
Target ecosystems :
Indicate all that apply
Mammals Natural terrestrial ecosystems
Birds Agroecosystems
Amphibians Freshwater ecosystems
Freshwater fish Marine ecosystems
Plants Other –
Terrestrial Invertebrates
Marine invertebrates (e.g. coral)
Marine vertebrates (e.g. fish)
Table 1: Clarification of information needed for your expert evaluation of the threats to biodiversity in Fiji – guide to filling in Question 1 (in Page 2).
Threat Specific threat details
Scale of threats (Global, Regional or Local)
Contribution to biodiversity loss (Weak, medium, strong or very strong)
Irreversibility (Weak, medium, strong or very strong)
Observations
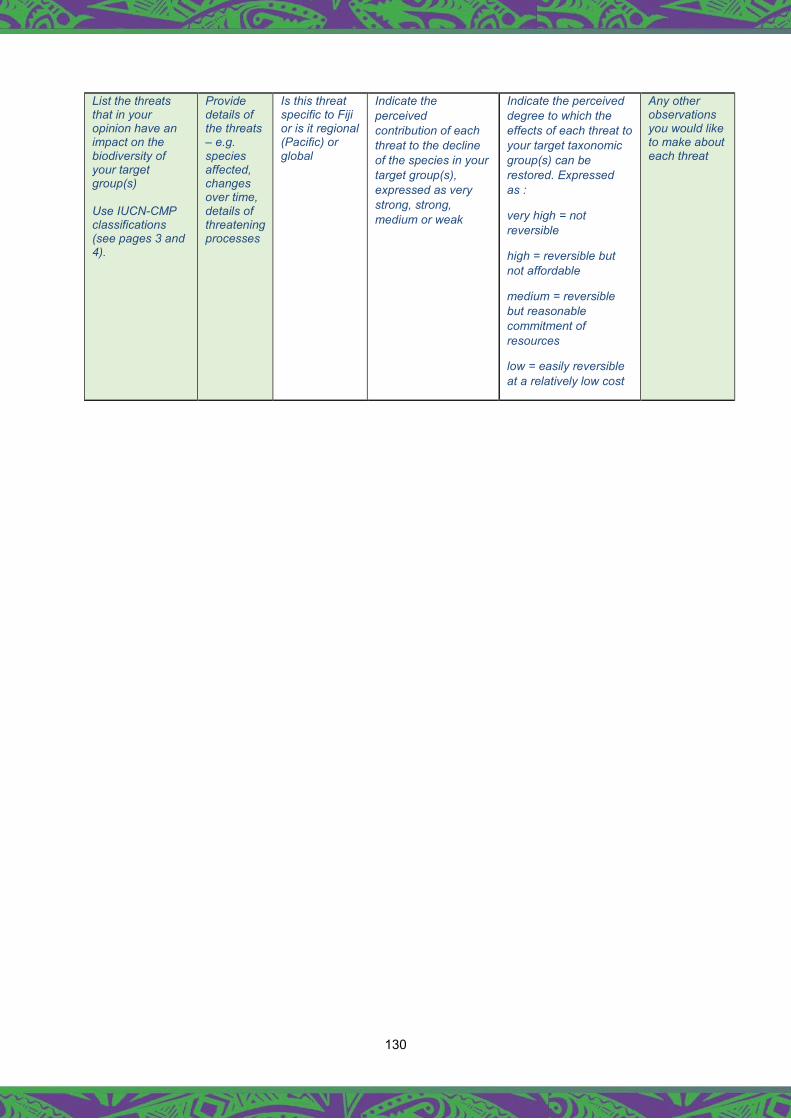
130
List the threats that in your opinion have an impact on the biodiversity of your target group(s) Use IUCN-CMP classifications (see pages 3 and 4).
Provide details of the threats – e.g. species affected, changes over time, details of threatening processes
Is this threat specific to Fiji or is it regional (Pacific) or global
Indicate the perceived contribution of each threat to the decline of the species in your target group(s), expressed as very strong, strong, medium or weak
Indicate the perceived degree to which the effects of each threat to your target taxonomic group(s) can be restored. Expressed as :
very high = not reversible
high = reversible but not affordable
medium = reversible but reasonable commitment of resources
low = easily reversible at a relatively low cost
Any other observations you would like to make about each threat
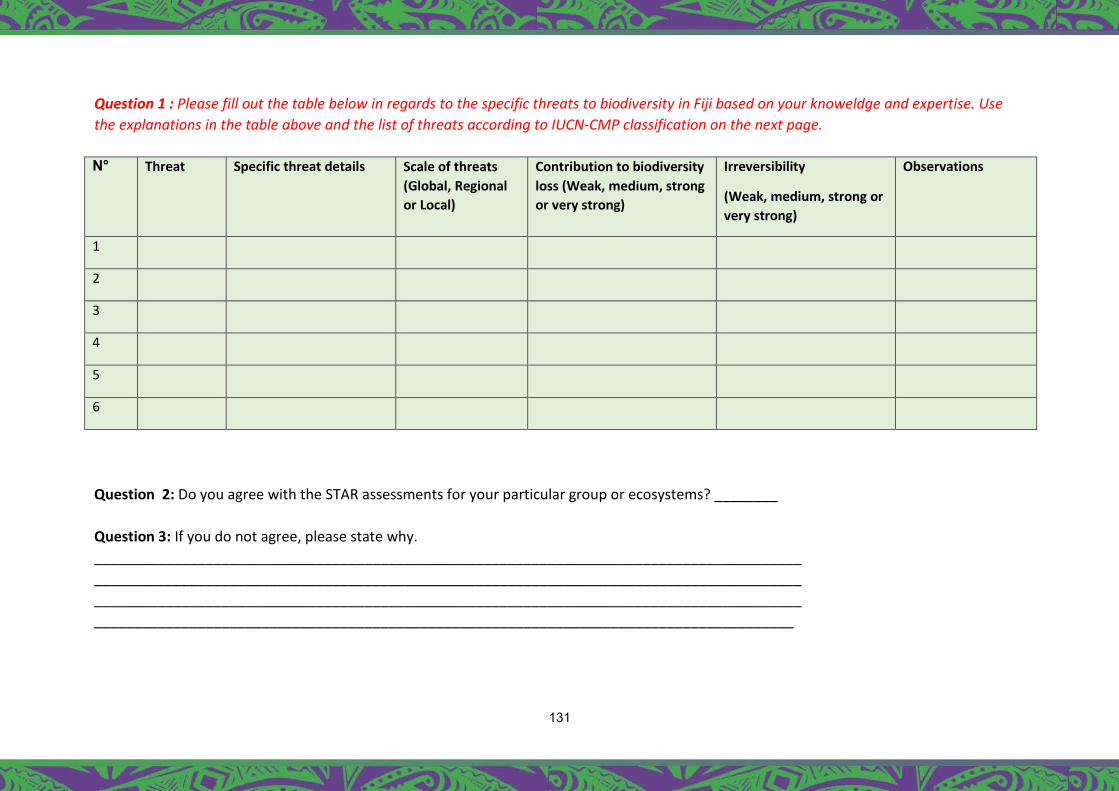
131
Question 1 : Please fill out the table below in regards to the specific threats to biodiversity in Fiji based on your knoweldge and expertise. Use the explanations in the table above and the list of threats according to IUCN-CMP classification on the next page. N° Threat Specific threat details Scale of threats
(Global, Regional or Local)
Contribution to biodiversity loss (Weak, medium, strong or very strong)
Irreversibility
(Weak, medium, strong or very strong)
Observations
1
2
3
4
5
6
Question 2: Do you agree with the STAR assessments for your particular group or ecosystems? ________ Question 3: If you do not agree, please state why. _________________________________________________________________________________________ _________________________________________________________________________________________ _________________________________________________________________________________________ ________________________________________________________________________________________
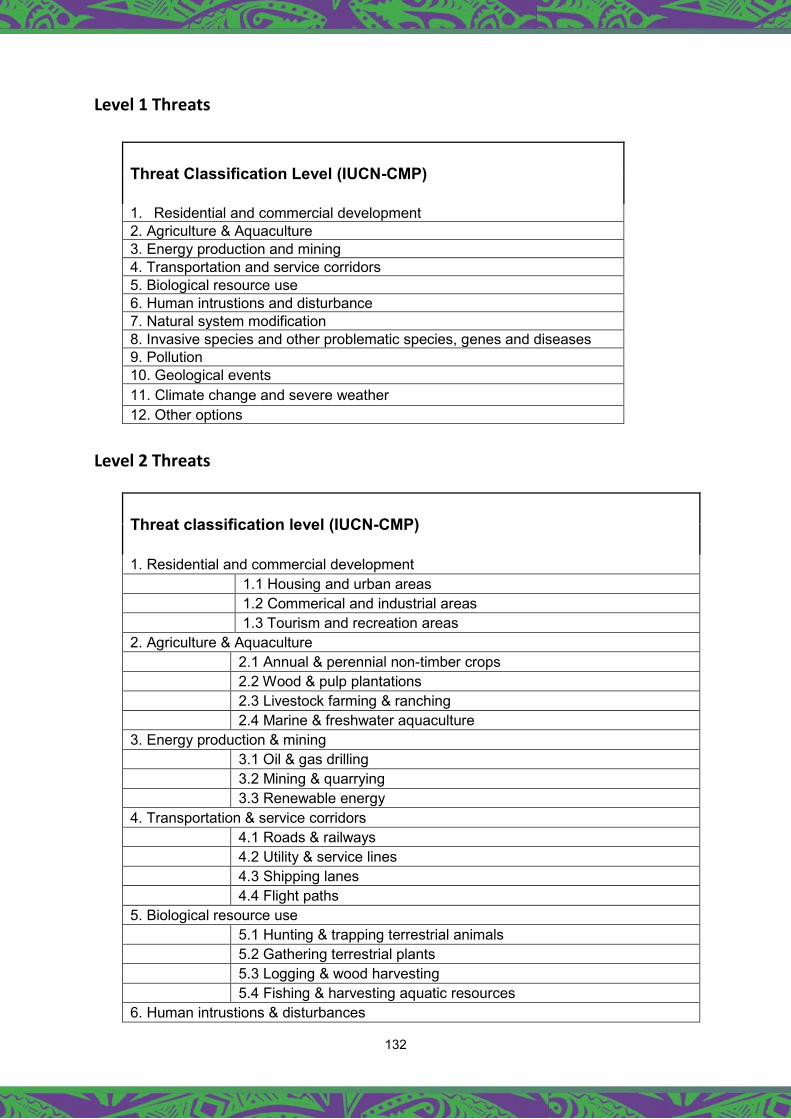
132
Level 1 Threats
Threat Classification Level (IUCN-CMP)
1. Residential and commercial development 2. Agriculture & Aquaculture 3. Energy production and mining 4. Transportation and service corridors 5. Biological resource use 6. Human intrustions and disturbance 7. Natural system modification 8. Invasive species and other problematic species, genes and diseases 9. Pollution 10. Geological events 11. Climate change and severe weather 12. Other options
Level 2 Threats
Threat classification level (IUCN-CMP)
1. Residential and commercial development 1.1 Housing and urban areas 1.2 Commerical and industrial areas 1.3 Tourism and recreation areas 2. Agriculture & Aquaculture 2.1 Annual & perennial non-timber crops 2.2 Wood & pulp plantations 2.3 Livestock farming & ranching 2.4 Marine & freshwater aquaculture 3. Energy production & mining 3.1 Oil & gas drilling 3.2 Mining & quarrying 3.3 Renewable energy 4. Transportation & service corridors 4.1 Roads & railways 4.2 Utility & service lines 4.3 Shipping lanes 4.4 Flight paths 5. Biological resource use 5.1 Hunting & trapping terrestrial animals 5.2 Gathering terrestrial plants 5.3 Logging & wood harvesting 5.4 Fishing & harvesting aquatic resources 6. Human intrustions & disturbances
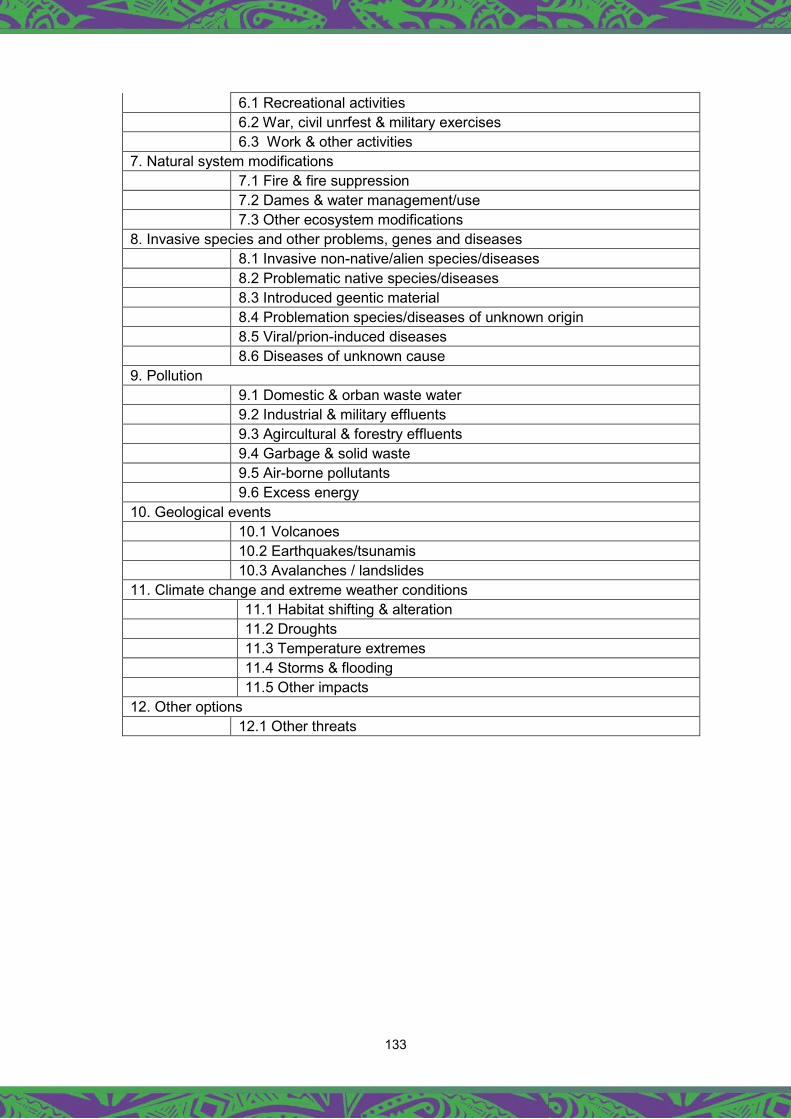
133
6.1 Recreational activities 6.2 War, civil unrfest & military exercises 6.3 Work & other activities 7. Natural system modifications 7.1 Fire & fire suppression 7.2 Dames & water management/use 7.3 Other ecosystem modifications 8. Invasive species and other problems, genes and diseases 8.1 Invasive non-native/alien species/diseases 8.2 Problematic native species/diseases 8.3 Introduced geentic material 8.4 Problemation species/diseases of unknown origin 8.5 Viral/prion-induced diseases 8.6 Diseases of unknown cause 9. Pollution 9.1 Domestic & orban waste water 9.2 Industrial & military effluents 9.3 Agircultural & forestry effluents 9.4 Garbage & solid waste 9.5 Air-borne pollutants 9.6 Excess energy 10. Geological events 10.1 Volcanoes 10.2 Earthquakes/tsunamis 10.3 Avalanches / landslides 11. Climate change and extreme weather conditions 11.1 Habitat shifting & alteration 11.2 Droughts 11.3 Temperature extremes 11.4 Storms & flooding 11.5 Other impacts 12. Other options 12.1 Other threats
134
APPENDIX 4: STAKEHOLDERS CONSULTATION VIRTUAL WORKSHOP – NOTES AND SUMMARY OF RECOMMENDATIONS
Appendix 4.1 - Group 1 Marine Feedback
Assessing Fiji’s State of Biodiversity and Main Loss Drivers– virtual workshop
“Ranking Major Threats Impacting Fiji’s Biodiversity”.
August 17th (Tuesday)
1300 – 1600 Fiji Time
Note: Please fill in key points in bullet form. Download and send this document to your session facilitator and co-
host before Session 9 begins
Session 5 – Measure Perception
BREAKOUT GROUP #: 1 (Marine)
Facilitator: Dick Watling Email: [email protected] / [email protected]
Co-host: Jake Taoi Email: [email protected]
Rapporteur: Kunal Singh Email: [email protected]
QUESTION 1: Which sector do you think has the biggest (negative) impact on Fiji's biodiversity?
● Agriculture
● Overfishing / Fisheries in offshore
● Tourism
Insert mentimeter screenshot here

135
QUESTION 2: What activity from this sector impacts biodiversity in a negative way?
● Plastic waste
● Agricultural run-offs
● Overfishing
● Scuba Night Fishing
● Land clearing
● Coastal reclamation
● oil spills
● Mangrove coastal clearing
● overlogging of our forests
● overuse of water resource
● Poorly planned tourism foreshore development
● River gravel mining
Insert mentimeter screenshot here
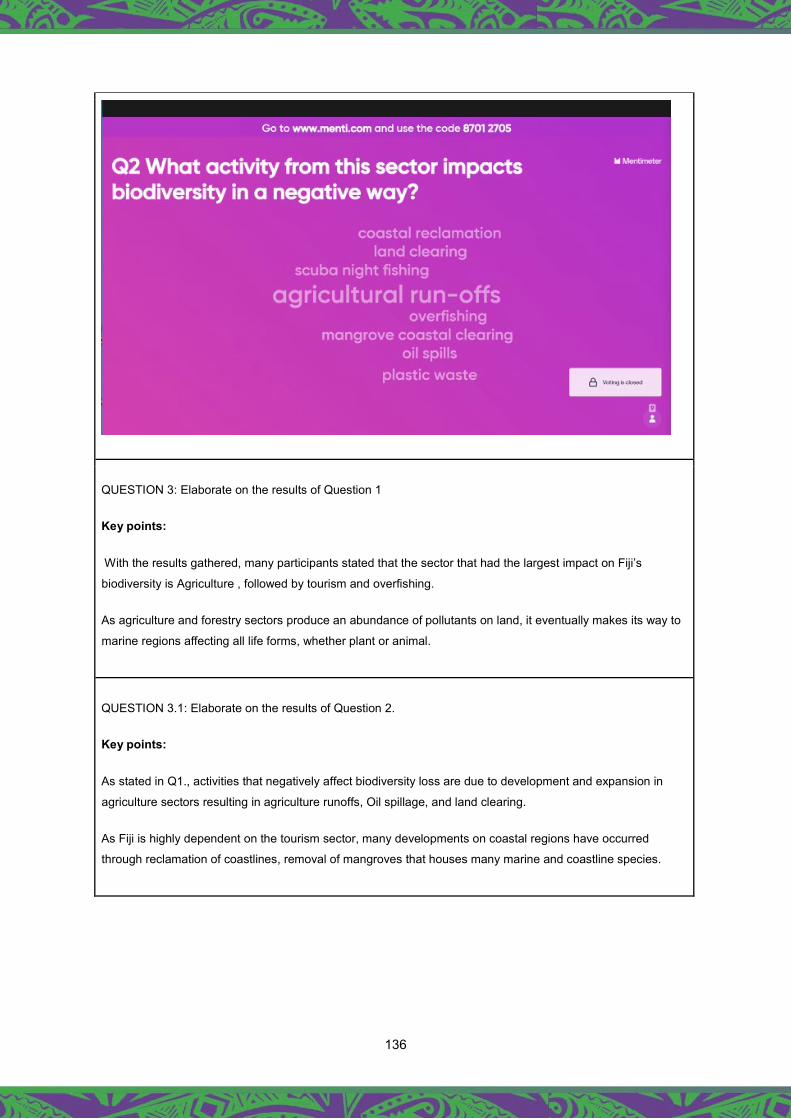
136
QUESTION 3: Elaborate on the results of Question 1
Key points:
With the results gathered, many participants stated that the sector that had the largest impact on Fiji’s
biodiversity is Agriculture , followed by tourism and overfishing.
As agriculture and forestry sectors produce an abundance of pollutants on land, it eventually makes its way to
marine regions affecting all life forms, whether plant or animal.
QUESTION 3.1: Elaborate on the results of Question 2.
Key points:
As stated in Q1., activities that negatively affect biodiversity loss are due to development and expansion in
agriculture sectors resulting in agriculture runoffs, Oil spillage, and land clearing.
As Fiji is highly dependent on the tourism sector, many developments on coastal regions have occurred
through reclamation of coastlines, removal of mangroves that houses many marine and coastline species.
137
Session 8 – Break-out discussions
BREAKOUT GROUP #: 1
Facilitator: Dick Watling Email: [email protected] / [email protected]
Co-host: Jake Taoi Email: [email protected]
Rapporteur: Kunal Singh Email: [email protected]
Threats to Biodiversity:
Q1: From the STAR report, these are the key threats to look at (list). Are there other threats that you think
should be considered? (Take into consideration the results of Session 5 and deliberations of the Q&A session)
● Over harvesting of marine species
● Native Species being threatened by large Fisheries Companies
● Invasive Alien Species
Other points discussed
● Not all invasive species are a threat to biodiversity
● Need of extensive and new updated research on invasive species
● Scientific studies of Micro-invasive species and Virus in Marine regions
● Lack of Surveillance and monitoring departments.
Look back at the results of Break-out session 5.
Now that you have had a chance to discuss the results of the report, what would you modify here? (Show
mentimeter results).
Key points discussed:
● Not all locations will have the same negative impacts on biodiversity.
● Specification on the type of sector. e.g Agriculture has many smaller sectors.
Key Recommendations made:
Comments:
138
Watling: Solomone (Mins. Agriculture) is absolutely right to remind us that the development imperative of
landowners using their land productively is key to national development but more importantly to balancing the
imbalance of rural/urban development. The key issue arising, is as Solomone pointed out, the sustainability of
the agriculture adopted. The record so far in almost every agricultural product has not been good.
Appendix 4.2 - Group 2 Forestry Feedback
Assessing Fiji’s State of Biodiversity and Main Loss Drivers– virtual workshop
“Ranking Major Threats Impacting Fiji’s Biodiversity”.
August 17th (Tuesday)
1300 – 1600 Fiji Time
Note: Please fill in key points in bullet form. Download and send this document to your session facilitator and co-
host before Session 9 begins
Session 5 – Measure Perception
BREAKOUT GROUP #: 2
Facilitator: Mark O’Brien Email: [email protected] , [email protected]
Co-host: Ana Nasiga Email: [email protected]
Rapporteur: Serena Pickering Email: [email protected]
QUESTION 1: Which sector do you think has the biggest (negative) impact on Fiji's biodiversity?
agriculture , unsustainable logging, energy, mining, logging, gravel extraction, infrastructural development, industrial sector, forestry, manufacturing
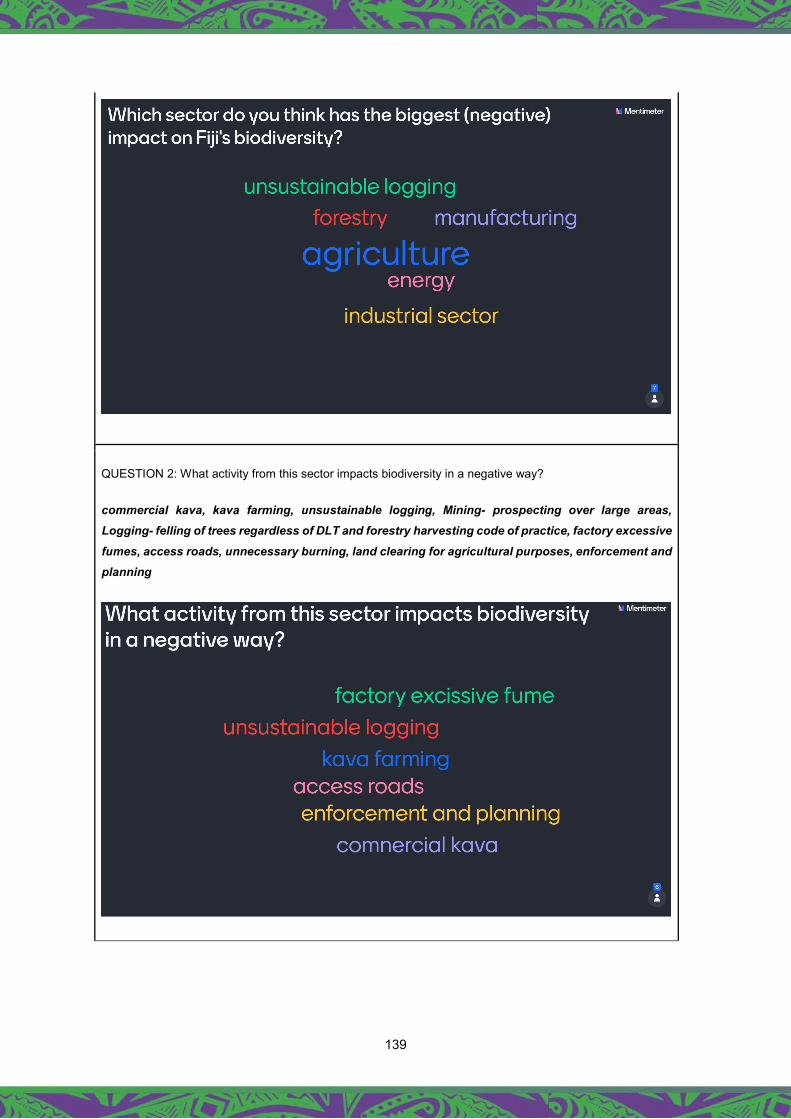
139
QUESTION 2: What activity from this sector impacts biodiversity in a negative way?
commercial kava, kava farming, unsustainable logging, Mining- prospecting over large areas, Logging- felling of trees regardless of DLT and forestry harvesting code of practice, factory excessive fumes, access roads, unnecessary burning, land clearing for agricultural purposes, enforcement and planning
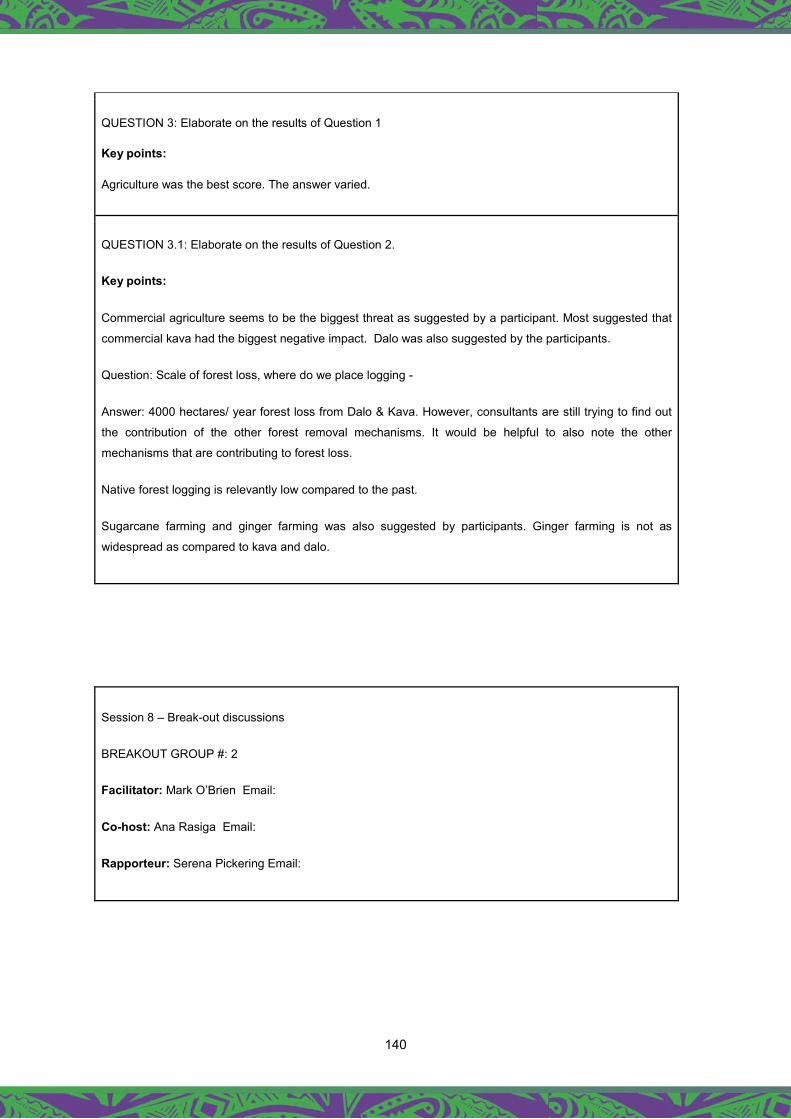
140
QUESTION 3: Elaborate on the results of Question 1
Key points:
Agriculture was the best score. The answer varied.
QUESTION 3.1: Elaborate on the results of Question 2.
Key points:
Commercial agriculture seems to be the biggest threat as suggested by a participant. Most suggested that
commercial kava had the biggest negative impact. Dalo was also suggested by the participants.
Question: Scale of forest loss, where do we place logging -
Answer: 4000 hectares/ year forest loss from Dalo & Kava. However, consultants are still trying to find out
the contribution of the other forest removal mechanisms. It would be helpful to also note the other
mechanisms that are contributing to forest loss.
Native forest logging is relevantly low compared to the past.
Sugarcane farming and ginger farming was also suggested by participants. Ginger farming is not as
widespread as compared to kava and dalo.
Session 8 – Break-out discussions
BREAKOUT GROUP #: 2
Facilitator: Mark O’Brien Email:
Co-host: Ana Rasiga Email:
Rapporteur: Serena Pickering Email:
141
Threats to Biodiversity:
Q1: From the STAR report, these are the key threats to look at (list). Are there other threats that you think
should be considered? (Take into consideration the results of Session 5 and deliberations of the Q&A
session)
List of threats to take into consideration:
- Loss of forest cover
- Invasive species
- Biological Use
Other points discussed
- COVID-19 - Urban- Rural drift (people moving back home to their villages). It is possible that Covid-
19 will open up people's mind that going back to the rural area is less stressful therefore more forest loss.
Question :How can we change people's perspective on clearing of native forest for agriculture?
Answer:
- The TLTB has developed a Landuse Master Plan for ITaukei Lands and Leases demarcating areas
that can be used for agriculture and other activities
- National campaign on sustainable land use/farming practice.
- Certification for biodiversity friendly green cover. Intivine into the markets.
- Incentivising farmers on positive land use.
- Taki Mai is doing the green certification with farmers on Ovalau and they will only buy kava from
these farmers
Question: Can we improve dalo production in a way that's more sustainable?
Answer: Dalo’s environmental footprint is not as bad as kava.
IAS
Addressing the threats of IAS seems to be really fragmented at the national level. There needs to be a more
holistic and collaborative approach to addressing the threats of IAS - especially those already present in Fiji
and preventing their spread to uninfested areas/islands.
The GEF6 IAS Project (being implemented by BAF) aims to improve the chances of the long-term survival of
terrestrial endemic and threatened species on Taveuni/Qamea Island and surrounding islets (due to Giant
Invasive Iguana presence) by building national and local capacity to prevent, detect, control and manage
Invasive Alien Species (IAS). All stakeholders are invited to collaborate through this project as we seek to
develop capacities at the national level including a national coordinating body working on IAS.
Forestry
142
The main problem is the current institutional frameworks when looking at forest cover loss. Suggested to be
something considered in the report. Food security is one of the current national drivers, forest loss is around
80% and this is mostly because of food security. What percentage can be recovered should be part of the
report?
Appendix 4.3 - Group 3 Agriculture
Assessing Fiji’s State of Biodiversity and Main Loss Drivers– virtual workshop
“Ranking Major Threats Impacting Fiji’s Biodiversity”.
August 17th (Tuesday)
1300 – 1600 Fiji Time
Note: Please fill in key points in bullet form. Download and send this document to your session facilitator and co-
host before Session 9 begins
Session 5 – Measure Perception
BREAKOUT GROUP #: 3
Facilitator: Nunia Thomas Moko Email: [email protected]
Co-host: n/a Email: n/a

143
Rapporteur: Francis Saladrau Email: [email protected]
QUESTION 1: Which sector do you think has the biggest (negative) impact on Fiji's biodiversity?
Insert mentimeter screenshot here
QUESTION 2: What activity from this sector impacts biodiversity in a negative way?
Insert mentimeter screenshot here

144
QUESTION 3: Elaborate on the results of Question 1
Key points:
Transportation and Trade/Inter-island movements- causes the invasive species to invade other islands
Agriculture-( Direct and indirect approach)- Encroachment & introducing new agricultural species. Using of
chemicals in farms affect other species such as bees and birds
Forestry- land clearing of timber for trade and logging construction
QUESTION 3.1: Elaborate on the results of Question 2.
Key points:
Encroachment- communities clearing forest for agriculture for their daily livelihood. This is due to lack of
awareness done to the communities to practice sustainable farming.
Habitat degradation- address the level of threat to biodiversity and prevent the spread of invasive alien species
to other islands

145
Session 8 – Break-out discussions
BREAKOUT GROUP #: 3
Facilitator: Nunia Thomas Moko Email: [email protected]
Co-host: n/a Email:
Rapporteur: Francis Saladrau Email: [email protected]
Threats to Biodiversity:
Q1: From the STAR report, these are the key threats to look at (list). Are there other threats that you think should be considered? (Take into consideration the results of Session 5 and deliberations of the Q&A session)
Invasive Species-have severe impacts to the forest and marine ecosystems as a whole.
Questions
Does the report also look at Pollution, human activities that influence the natural environment producing
negative, direct or indirect, effects that alter the flow of energy, the chemical and physical constitution of the
environment and abundance of the species?
This is not the 1st time we'll try to lure the agriculture sector into the conservation bandwagon. See CI's attempt
in Ra during its Tokaimalo Reforestation program and other attempts and pick out lessons.
Look back at the results of Break-out session 5.
Now that you have had a chance to discuss the results of the report, what would you modify here? (Show mentimeter results).
There is a huge challenge ahead on the engagements of the sectors and their stakeholders to address
biodiversity loss.
Need clarification around the IAS focus. The group of threats need to be recognised as drivers, especially IAS.
What can be done now? IAS – ecosystem jeopardy.
Two sectors: How do we make best use of the collaboration with Agriculture and Fisheries to address the threat
of IAS?
Transport is a sector that needs to be considered because of IAS.

146
Key points discussed:
Agriculture- what are the contributing factors that are making agriculture a major threat?
Government supporting sustainable agriculture but it entirely depends on the farmers on how they practice
sustainable farming
Relook at the land use plans and make up a national land use plans
Agricultural activity in Fiji is a market demand driven e.g Kava and TC Winston. Ginger and Dalo usually need
machinery, especially for commercial farming.
Key Recommendations made:
Consider the Transport Sector.
Look at more than 2 sectors – Do the 2 sectors adequately address the imminent threat of IAS, is this enough
to address biodiversity loss? Forest loss has been long term and ongoing. In the meantime, there is the imminent
threat of IAS across all landscapes and sectors.
Agriculture- what are the contributing factors that are making agriculture a major threat?
Appendix 4.4 – Overall Summary
Assessing Fiji’s State of Biodiversity and Main Loss Drivers– virtual workshop
“Ranking Major Threats Impacting Fiji’s Biodiversity”.
August 17th (Tuesday)
1300 – 1600 Fiji Time
Stakeholder Consultation
Session 1: Welcome Remark
Regional Director IUCN ORO – Mr Mason Smith
147
Key message
● 3 main threats to Fiji’s biodiversity at the national level: loss of forest cover due to agricultural
practices and various other means ,invasive species - associated with forest loss and habitat fragmentation
and biological resource use.
● Ensure the pilot project is implemented at the regional level.
Loss of Biodiversity
Session 2: Opening Remark of the Workshop
Permanent Secretary for Environment – Mr Joshua Wycliffe
Key messages
- Biological Diversity is an asset to Fiji. Should be treated as assets.
- Obligation does not only include the duty of protecting our biological diversity but also the heartfelt tie
we must have with biodiversity.
- BIODEV 2030 is a 2-year project that creates a national platform for strategic engagements in order
to protect/save our biological diversity
- Protecting our environment is protecting ourselves, protecting our world and all things around us.
Session 3: Objectives of the Workshop
Fiji Country Project Officer BIODEV 2030 – Ms Tavenisa Luisa
Key messages
- Provide an opportunity for your views, review of the draft report, analyze the findings and results and
assess sectors impacting Fiji’s biodiversity and provide feedback.
- Goal of the report: halt biodiversity loss by 2030 and restore biodiversity by 2050 while promoting
more sustainable and resilient economies.
- Strategy: through resource mobilisation and multi-stakeholder dialogue.
148
Session 4: Presentation on the Background of BIODEV 2030
Fiji Country Project Officer BIODEV 2030 – Ms Tavenisa Luisa
Key message
- Project has been run in 16 countries around the world. Fiji is the only country representing the
Oceania on this project
- What is learnt , will be shared on different platforms.
- Consultants have identified the threats to biodiversity and the drivers of these threats.
- This is a pilot project where it is action oriented. There might be ups and downs expected.
- Species are declining putting Fiji;s development and survival at risk. We need to act on the declining
species in Fiji.
- Hon. Prime Minister Voreqe Bainimarama has endorsed the leaders pledge on environment
protection.
- Project launched in March 2021, April recruiting of consultants, May - June development of draft
report completed.
- 2-3 sectors identified in the draft report. Report to be finalised hopefully by the end of the month.
- Report to be presented in the IUCN Conservation Congress in September.
- Project also supporting the National Biodiversity Strategy Action Plan.
Session 7: Question and Answer session
Moderator: Tavenisa Luisa
Rapporteurs:
Q1 Question: Guava trees to be a part of
the benefit in degraded land, with the
current situation we have. Are there
any other invasive species that can
provide some kind of environmental
protection?
Response: Invasive Alien Species identified in the
report are species that contribute to forest
degradation and other environmental threats.
Answered by: Nunia
149
Posed by: Isoa Korovulavula
Q2 Question: Have we considered that
degraded habitats are an accelerator
for impacts of invasive species?
Posed by: Steve Cranwell
Response: Steve is correct – and this is something
that needs to be looked at in the next phase of the
project. We have not thought about how we can
address invasive species in one single species
because of the nature of the system.
The scientific basis for which we make our
decisions on invasive alien species does not exist.
E.g. African Tulip Tree, while it is communicated as
an IAS, there has not been an ecological study to
confirm it – as this species is probably the best
species for reforestation of the degraded
grasslands in Fiji.
Answered by: Mark (Birdlife) and Dick
Q3 Question: Agriculture has been
identified as one of the main drivers,
while this is true, could we re-look at
the contributing factors that make
agriculture as a major sector in
biodiversity loss. We need to consider
the fact that we need agriculture for
food security. The Ministry is
challenged by the fact that alot of the
on-the-ground practice is
unsustainable. Need to consider that
there are 3 categories of Farmers:
Commercial farmers – where there is a
high use of fertilizers
Semi-commercial farmers
Subsistence farmers – these are the
farmers that are practicing shifting
cultivation, and clearance of forest
areas.
Response: This project provides an opportunity to
look at agriculture with the partnership of various
stakeholders. (Note figure 28 of the report) – this is
why local landowning communities are highlighted
as a key stakeholder – because of the subsistence
farming and the practice of shifting cultivation and
slash and burn.
Answered by: Nunia Thomas-Moko
Profile farmers and strategise based on the profiles.
Suggested by: Isoa Koroiwaqa

150
Posed by: Solomoni Nagaunavou
(Ministry of Agriculture)
Q4 Question: Thank you Nunia and team
for the presentation, nothing surprising
there in terms of threats to biodiversity.
You also have identified stakeholders
that we should bring on board to
address species decline. Has the team
also identified some keys activities
relating to species decline with respect
to the major threats to biodiversity
identified during the study?
Posed by: Issac Rounds
Response: It is the encroachment, particularly into
marginal land. Does the forum here have any
suggestions on specific activities that they think are
contributing to forest loss or the loss of forest
through agricultural activities?
Answered by: Nunia
Response: One of the aspects – not looking at
biodiversity per se, but at the institutional
arrangements that we have, perhaps they are not
sustainable. The point brought up by Solo is
important – take into account the land tenure
system, the lease arrangements. Overarching
legislations and systems need to be arrange in a
manner that allows for conservation to happen.
Answered by: Isoa Korovulavula
Session 9 – Feedback presentations
Group 1: Marine
Issues raised: Look at the issues in a more “marine-oriented” way rather than a “biodiversity” way. Issues
affecting the maritime rather than terrestrial areas. The issue of sustainability. This reflects that marine is not
treated in the manner the style it is designed.
Key messages (summary)
In summary, the participants concurred with the results of the study. The Marine group’s discussion did not
cover the marine sector per se, but covered issues from the terrestrial sector that affect marine. This is
perhaps a reflection of the fact that the marine sector is not well covered under the STAR analysis, and needs
to be looked at separately.
151
Group 2: Forestry
Issues raised: Major threats:
COVID 19 – driver of forest loss. Urban- Rural drift: people moving back home to their villages.
The return in investment would probably be greater than if they worked a 9-5 job.
They are returning to their villages to earn an income. For some, this may be a long-term move – because of
the improved price of Kava rather than go back to their formal employment. This is a less stressful way of
earning money for them.
Can we make “kava” positive for biodiversity?
National campaign on sustainable land use/farming practice
Institutional arrangements – need to be looked at - contradictory policies that allow for unsustainable
development and land use practices, encroachment etc.
Invasive Alien Species:
Addressing the threats of IAS seems to be really fragmented at the national level. There needs to be more
holistic and collaborative approach to addressing the threats of IAS - especially those already present in Fiji
and preventing their spread to uninfested areas/islands.
The GEF6 IAS Project (being implemented by BAF) aims to improve the chances of the long-term survival of
terrestrial endemic and threatened species on Taveuni/Qamea Island and surrounding islets (due to Giant
Invasive Iguana presence) by building national and local capacity to prevent, detect, control and manage
Invasive Alien Species (IAS). All stakeholders are invited to collaborate through this project as we seek to
develop capacities at the national level including a national coordinating body working on IAS.
Key messages (summary):
Urban-rural drift may become a long term threat as individuals move back to their villages and invest in
agricultural activities that promote the clearing of forest. This will become a significant threat to biodiversity.
The TLTB has developed a Landuse Master Plan for ITaukei Lands and Leases demarcating areas that can
be used for agriculture and other activities – need to look into how this can be engaged in the program.
We need to look at opportunities where we incentivize the farmers, but intervening at the market end
(Biodiversity-friendly “green” kava). Some of the current programs – agroforestry etc, does not work if the
farmers are not incentivized.
Institutional arrangements need to be looked at – there are contradictory policies that allow for encroachment
into forest reserves and high conservation value forests to occur.
152
Group 3: Agriculture
Issues raised: No change however there is the concern for habitats in terms of biodiversity threat by invasive
alien species in terms of the agricultural sector. Reversing invasive alien species loss in terms of biodiversity.
What makes agriculture a driver of biodiversity loss?
There is a huge challenge ahead on the engagements of the sectors and their stakeholders to address
biodiversity loss.
Need clarification around the IAS focus. The group of threats need to be recognised as drivers, especially IAS.
What can be done now? IAS – ecosystem jeopardy.
Two sectors: How do we make best use of the collaboration with Agriculture and Fisheries to address the
threat of IAS?
Transport is a sector that needs to be considered because of IAS.
Agriculture- what are the contributing factors that are making agriculture a major threat?
Government supporting sustainable agriculture but it entirely depends on the farmers on how they practice
sustainable farming
Relook at the land use plans and make up a national land use plans
Agricultural activity in Fiji is a market demand driven e.g Kava and TC Winston. Ginger and Dalo usually need
machinery, especially for commercial farming.
Key messages (summary):
Consider the Transport Sector.
Look at more than 2 sectors – Do the 2 sectors adequately address the imminent threat of IAS, is this enough
to address biodiversity loss? Forest loss has been long term and ongoing. In the meantime, there is the
imminent threat of IAS across all landscapes and sectors.
Agriculture- what are the contributing factors that are making agriculture a major threat?

Photo credit: Tanya Guillory
153
Related Documents