NATUR TUR TUR TUR TURAL AL AL AL AL R R R R RESOUR ESOUR ESOUR ESOUR ESOURCES CES CES CES CES D D D D DEP EP EP EP EPAR AR AR AR ARTMENT MENT MENT MENT MENT DECEMBER ECEMBER ECEMBER ECEMBER ECEMBER 2001 2001 2001 2001 2001 R ANGE ANGE ANGE ANGE ANGE R R R R RESOUR ESOUR ESOUR ESOUR ESOURCE CE CE CE CE M ANAGEMENT ANAGEMENT ANAGEMENT ANAGEMENT ANAGEMENT P P P P PLAN AN AN AN AN

Welcome message from author
This document is posted to help you gain knowledge. Please leave a comment to let me know what you think about it! Share it to your friends and learn new things together.
Transcript

RRRRRANGEANGEANGEANGEANGE R R R R RESOURESOURESOURESOURESOURCECECECECEMMMMMANAGEMENTANAGEMENTANAGEMENTANAGEMENTANAGEMENT P P P P PLLLLLANANANANAN
NNNNNAAAAATURTURTURTURTURALALALALAL R R R R RESOURESOURESOURESOURESOURCESCESCESCESCES D D D D DEPEPEPEPEPARARARARARTTTTTMENTMENTMENTMENTMENT
DDDDDECEMBERECEMBERECEMBERECEMBERECEMBER 2001 2001 2001 2001 2001

EEEEEASTASTASTASTAST B B B B BAAAAAYYYYY WWWWWAAAAATERSHEDTERSHEDTERSHEDTERSHEDTERSHED
RRRRRANGEANGEANGEANGEANGE R R R R RESOURESOURESOURESOURESOURCECECECECE M M M M MANAANAANAANAANAGEMENTGEMENTGEMENTGEMENTGEMENT P P P P PLLLLLANANANANAN
Prepared by
East Bay Municipal Utility DistrictWatershed and Recreation Division
500 San Pablo Dam RoadOrinda, CA 94563
Contact: Rod Tripp
With Technical Assistance from:
La Cuesta Consulting
and
Merritt Smith Consulting
December 2001
East Bay Municipal Utility District Board of DirectorsKaty Foulkes, President
Frank Mellon, Vice PresidentJohn A. Coleman Lesa McIntoshDoug Linney David Richardson
William B. Patterson

ACKNOWLEDGEMENTS
EBMUD wishes to express its appreciation for the contributions of the following individuals, EBMUD staffand members of the public who participated in the preparation of this document.
EBMUD ManagementDennis Diemer, General ManagerJohn Lampe, Director of Water and Natural ResourcesJohn Myers, Manager of Natural ResourcesStephen Abbors, Manager of Watershed and Recreation
Project ManagerRodney Tripp, Ranger Supervisor
Staff AssistanceElizabeth Hill, Ranger NaturalistPatricia Matthews, Ranger NaturalistRick Leong, Management AnalystRobert Flasher, Ranger NaturalistScott Hill, Ranger SupervisorRoger Hartwell, Supervising Fisheries/Wildlife BiologistJose Setka, Fisheries/Wildlife BiologistBert Mulchaey, Fisheries/Wildlife TechnicianJim Dunne, Water Conservation RepresentativeSusan Morrow, Senior Administrative ClerkAmy O�Connell, Administrative ClerkKaren Love, Senior Word Processing SpecialistDax Hall, InternAudrey Pellar, InternChris Hallford, InternClay Taylor, Intern
GIS/CartographyPhillip Beilin, Programmer Analyst IIBruce Rankin, Senior Programmer AnalystJeff Skahill, Programmer Analyst II
Technical AdvisorJohn Stechman, Rangeland Resources Consultant
CounselFred Etheridge, EBMUD Attorney
Design/LayoutElizabeth Hill, Ranger Naturalist
Production and PrintingEBMUD Print ShopDonald Anderson, Offset Duplicating Machine OperatorLeila Palsak, Offset Duplicating Machine Operator
Photo CreditsPatricia Matthews, Stephen Abbors, Robert Flasher, Joseph Scornaienchi, Matthew Nunes, Roy Lowenfels

RANGE RESOURCE MANAGEMENT PLAN
i
Table of Contents
Page1. INTRODUCTION ................................................................................................................. 1-1
1.1 Location of the East Bay Municipal Utility District .................................................... 1-11.2 Grazing History ........................................................................................................... 1-3
1.2.1 Early History ..................................................................................................... 1-41.2.2 The Mission Period ............................................................................................ 1-41.2.3 The Gold Rush .................................................................................................. 1-61.2.4 Introduction of Non-Native Annuals ................................................................... 1-71.2.5 EBMUD: Grazing History ................................................................................. 1-8
1.3 Goals and Objectives ..................................................................................................... 1-9 1.3.1 Fire Management Plan ...................................................................................... 1-10
1.3.2 Cultural Resources ........................................................................................... 1-111.3.3 Visual Resources ............................................................................................. 1-111.3.4 Recreation ....................................................................................................... 1-11
1.4 Program Components .................................................................................................. 1-121.4.1 The East Bay Watershed Master Plan .............................................................. 1-121.4.2 Spring and Fall Field Surveys ........................................................................... 1-121.4.3 Annual Grazing Plans ....................................................................................... 1-121.4.4 Water Quality Sampling ................................................................................... 1-131.4.5 Integrated Pest Management (IPM) ................................................................. 1-131.4.6 Geographic Information System (GIS) .............................................................. 1-131.4.7 Fire Management Plan (FMP) .......................................................................... 1-131.4.8 Management for Special Status Species ........................................................... 1-14
1.5 Organization and Use of the RRMP ............................................................................. 1-141.5.1 Section 1: Introduction .................................................................................... 1-141.5.2 Section 2: Grazing, Livestock and Water Quality ............................................. 1-141.5.3 Section 3: Grazing and Biodiversity ................................................................. 1-141.5.4 Section 4: Monitoring of Grazed Rangelands ................................................... 1-151.5.5 Section 5: Allotment Plans and Tenant Selection .............................................. 1-15
2. GRAZING AND WATER QUALITY .................................................................................... 2-12.0 Introduction ................................................................................................................... 2-12.1 Watershed Hydrologic Functions .................................................................................... 2-22.2 Soil Resources ............................................................................................................... 2-32.3 Nonpoint Source Pollution ............................................................................................. 2-5
2.3.1 Sedimentation .................................................................................................... 2-72.3.2 Nutrients ........................................................................................................... 2-82.3.3 Pathogens .......................................................................................................... 2-9

ii
RANGE RESOURCE MANAGEMENT PLANTable of Contents
Page
2.4 Impacts of Grazing Livestock .................................................................................... 2-102.4.1 Heavy Grazing ............................................................................................... 2-112.4.2 Hoof Impacts ................................................................................................. 2-122.4.3 Livestock Waste Concentration ........................................................................ 2-13
2.5 Water Quality Protection .............................................................................................. 2-142.5.1 Site Conservation Thresholds ........................................................................... 2-15
2.6 Management Measure and best Management Practices ............................................... 2- 162.7 Water Quality Control Measures .................................................................................. 2-172.8 Protection of Water Quality on EBMUD Lands ............................................................ 2-18
2.8.1 Control of NPS ............................................................................................... 2-182.8.2 Control of Pathogens and Livestock Waste Concentrate ................................... 2-202.8.3 Riparian Buffers ............................................................................................... 2-21
3. MANAGING FOR BIODIVERSITY ................................................................................... 3-13.0 Introduction ................................................................................................................... 3-13.1 Biodiversity ................................................................................................................... 3-2
3.1.1 Areas of Significant Biodiversity ......................................................................... 3-33.1.2 Riparian ............................................................................................................. 3-43.1.3 Oak Woodlands and Savanna ............................................................................ 3-43.1.4 Native Grassland ............................................................................................... 3-53.1.5 Special Status Species ....................................................................................... 3-6
3.2 Grazing and Biodiversity ................................................................................................ 3-63.3 Impacts on Rangeland Biodiversity ................................................................................. 3-8
3.3.1 Grazing Impacts and Special Status Species ....................................................... 3-93.3.2 Special Status Species ..................................................................................... 3-103.3.3 Riparian Habitat ............................................................................................... 3-123.3.4 Oak Woodland and Savanna ........................................................................... 3-133.3.5 Special Status Animal Species .......................................................................... 3-13
3.4 Managing for Biodiversity ............................................................................................ 3-163.4.1 Management Measures and Best Management Practices .................................. 3-163.4.2 Biological Monitoring ....................................................................................... 3.173.4.3 Protection of Sensitive Habitats ........................................................................ 3-183.4.4 Protection of Riparian Habitat .......................................................................... 3-183.4.5 Protection of Stock Ponds ............................................................................... 3-203.4.6 Implementation of Creek Restoration Projects .................................................. 3-203.4.7 Protection of Oak Savanna .............................................................................. 3-213.4.8 Protection of Native Grasslands ....................................................................... 3-223.4.9 Protection of Special Status Species ................................................................. 3-23
RANGE RESOURCE MANAGEMENT PLAN
iii
Table of Contents
Page
4. MONITORING OF GRAZED RANGELANDS ................................................................. 4-14.0 Introduction ................................................................................................................... 4-14.1 Range Monitoring Program Components ........................................................................ 4-1
4.1.1 Spring Field Survey ........................................................................................... 4-24.1.2 Fall Field Survey ................................................................................................ 4-5
4.2 Survey Monitoring Results: 1990-1997 ......................................................................... 4-84.3 Special Status Species and Sensitive Habits .................................................................. 4-10
4.3.1 Photo Points .................................................................................................... 4-104.4 Vulnerable and Degraded Areas ................................................................................... 4-11
4.4.1 Photo Points .................................................................................................... 4-114.4.2 Control of Noxious Weed Populations ............................................................. 4-11
4.5 Water Quality Monitoring ............................................................................................. 4-124.5.1 Cryptosporidium and Giardia ........................................................................... 4-124.5.2 Rapid Bioassessment ....................................................................................... 4-14
5. GRAZING PROGRAM COMPONENTS .......................................................................... 5-15.0 Introduction ................................................................................................................. 5-15.1 Allotment Management Plans ..................................................................................... 5-1
5.1.1 Introduction ....................................................................................................... 5-15.1.2 Site Description ................................................................................................. 5-45.1.3 Water Quality Concerns ..................................................................................... 5-45.1.4 Biodiversity Concerns ........................................................................................ 5-75.1.5 Fire Management ............................................................................................... 5-85.1.6 Improvements .................................................................................................... 5-95.1.7 Cultural Resources ............................................................................................. 5-95.1.8 Best Management Practices (BMP�s) ................................................................. 5-95.1.9 GIS and Map of Allotment ................................................................................. 5-9
5.2 Annual Grazing Plan (AGP) ......................................................................................... 5-115.3 Grazing Tenant Selection Procedures ............................................................................ 5-11
5.3.1 List of Interested Parties .................................................................................. 5-125.3.2 Advertisement of Available Parcel .................................................................... 5-125.3.3 Application Packet .......................................................................................... 5-125.3.4 Qualifications Appraisal Panel .......................................................................... 5-125.3.5 Selection of Finalists ........................................................................................ 5-125.3.6 Interview of Finalists ........................................................................................ 5-135.3.7 Final Decision .................................................................................................. 5-135.3.8 Award of Lease ............................................................................................... 5-13
iv
RANGE RESOURCE MANAGEMENT PLANTable of Contents
Page5.3.9 Appeal Process ............................................................................................... 5-14
5.4 Leases ....................................................................................................................... 5-14
APPENDICESAppendix A TablesAppendix B GlossaryAppendix C Policy CriteriaAppendix D Fire Management Plan Biological Fuel Modification TreatmentsAppendix E Range Plant ListAppendix F Field Survey SheetsAppendix G Fish and Wildlife SurveyAppendix H Photo Point MonitoringAppendix I Integrated Pest ManagementAppendix J Applicant QuestionnaireAppendix K Allotment Management Plan
� Brown Ranch� Carr� Gateway� Lone Pine� Mendonca� Moraga Horse� Nunes-Pavon� Orinda Horse� Pinole-Y� Redwood Rangers� San Pablo Ridge� Siesta Valley/Mistletoe� Simas Oursan� Tin House� Tri Cities
Appendix L Sample Grazing PlanAppendix M References

EXECUTIVE SUMMARY
v
� The purpose of the Range Plan is to describe the East Bay livestockgrazing program in accordance with the policy direction provided in theEast Bay Watershed Master Plan.
� The objective of the grazing program is to use grazing as a tool tomanage vegetation for District resource needs to support Districtwater quality, biodiversity, fire control and other managementobjectives, to retain current levels of runoff, and to generaterevenue. Development of this Range Resource Management Planhas been closely coordinated with development of the Fire ManagementPlan.
� Maintenance of adequate plant cover is essential to optimize theprimary watershed functions of capture, storage and release of highquality water.
� In general, properly managed, light to moderate seasonal grazingby cattle and horses on EBMUD land supports biodiversity,including the maintenance of plant and animal species of specialconcern and minimizes adverse impacts on water quality.
� Of approximately 28,000 acres within EBMUD boundaries, about10,000 are occupied by grazeable grassland and oak savanna, whichprovide the vast majority of livestock forage on approximately 21,000acres of lands fenced for grazing.
� Nearly 1,000 species of biota have been identified on EBMUDland, of which twenty-nine animal and 10 plant species are listed asspecial status and management priority. Six special-status species canbe adversely impacted by livestock and will require site-specificmanagement for their protection.
� Riparian and oak savanna are identified by the District as sensitivehabitats with particular and significant values to biodiversity; theriparian communities which occupy about 600 acres and includenearly 15 miles of perennial streams in grazing lease areas requirecritical evaluation relative to livestock management or exclusion.
� Differences among species and habitats will determine the optimalseasons of grazing and deferment. These factors, in combinationwith the seasonal impacts of livestock on water quality require

EXECUTIVE SUMMARY
vi
that livestock and watershed management prescriptions be made on asite-specific, field-by-field basis. These prescriptions are included hereinas Allotment Management Plans.
� The presence of livestock has been positively correlated with theprincipal nonpoint source (physical, chemical and biological)contaminants of municipal source water.
� Dislocated soil particulates and the excrement of domestic andwild animals are the main sources of rangeland water pollution.
� Research and monitoring of municipal source waters indicate thepresence of potentially hazardous protozoan pathogens, althoughno treated water or public health problems attributable to livestockon watersheds in California have been reported.
� Further reduction of sediment, nutrient and microbial contaminantsin raw waters of EBMUD can be accomplished through sourceidentification and site-specific livestock management practices,including adjustments in grazing season and stocking rate andminimizing access by livestock to open water.
� Site conservation thresholds for minimum levels of plant cover,maximum contaminant level goals for source water quality, andstandards for desirable plant communities are recommended asDistrict management objectives to protect and maintain waterquality, biodiversity and resource productivity.
� Six management measures and twenty-nine management practicesare described and recommended for implementation on EBMUDlands. For most practices, opportunities exist for cost sharing underFederal or State programs.
� Methods for monitoring range condition, forage production, forageutilization, plant biodiversity, and water quality on grazed landsare described.
� The tenant selection process, described herein, is based on anappraisal method, which prioritizes the experience, responsibility,and management practices of the livestock operator.

ACRONYMS
vii
ACRCD Alameda County Resource Conservation DistrictADWB Air Dry Weight BasisAGP Annual Grazing PlanAMP Allotment Management PlanAU Animal Unit.AUM Animal Unit Month.AWWA American Water Works Association
BMP Best Management PracticesCDFFP California Department of Forestry and Fire ProtectionCDFG California Department of Fish and GameCNPS California Native Plant Society
DBP Disinfection by-productDNA Deoxyribonucleic AcidDPC Desired Plant Community
EAWEST Environmental Associates WestEBMUD East Bay Municipal Utility DistrictEBRPD East Bay Regional Park DistrictEBWMP East Bay Watershed Master PlanEIR Environmental Impact ReportEQUIP Environmental Quality Incentive Program (USDA)
F&W Fish and WildlifeFC Fecal coliformsFMP Fire Management PlanFS Fecal streptococci
GIS Geographic Information System
HACCP Hazard Analysis of Critical Control Points
HCP Habitat Conservation Plan
IPM Integrated Pest Management
LUMP Land Use Master Plan

viii
ACRONYMS
MCL Maximum Contaminant LoadMCLG Maximum Contaminant Levels or GoalsMM Management MeasuresMMWD Marin Municipal Water DistrictMWP Metropolitan Water District (Los Angeles)
N NitrogenNPS Nonpoint Source PollutionNRC National Research CouncilNRCD Natural Resource Conservation DistrictNRCS Natural Resource Conservation Service
P Phosphorus
RCD Resource Conservation DistrictRDM Residual Dry MatterRFP Request for ProposalsRRMP Range Resource Management PlanRWQCB Regional Water Quality Control Board
SCT Site Conservation ThresholdSCS Soil Conservation ServiceSCVWD Santa Clara Valley Water DistrictSSP Special Status SpeciesSFWD San Francisco Water District
T&E Threatened and EndangeredTHM TrihalomethanesTMDL Total Maximum Daily LoadTOC Total Organic Carbon
UC University of CaliforniaUCCE University of California Cooperative ExtensionUCVMRTC University of California Veterinary Medicine
Research and Teaching CenterUSDA United States Department of AgricultureUSEPA United States Environmental Protection AgencyUSFWS United States Fish and Wildlife ServiceUSL Upper San LeandroUSLE Universal Soil Loss Equation

Section 1INTRODUCTION
1 - 1
RRRRR A N G EA N G EA N G EA N G EA N G E
RRRRRESOURCEESOURCEESOURCEESOURCEESOURCE
MMMMM ANAGEMENTANAGEMENTANAGEMENTANAGEMENTANAGEMENT
PPPPP L A NL A NL A NL A NL A N
1.0 INTRODUCTION
In 1996, the East Bay Municipal Utility District�s (EBMUD) Boardof Directors adopted the East Bay Watershed Master Plan(EBWMP) and its programmatic Environmental Impact Report.The EBWMP was a comprehensive planning effort that examinedhow to best manage EBMUD�s 28,000 acres of open spacewatershed land in the East Bay area. A key component of theEBWMP was the development and implementation of a rangemanagement program that would address grazing and rangemanagement issues. This Range Resource Management Plan(RRMP) is the result of that effort.
The purpose of this RRMP is to identify and implement rangelandmanagement goals that meet the watershed management objectivesoutlined in the EBWMP.
This document also provides a brief history of livestock grazingpractices on EBMUD lands, describes current issues related tolivestock use, and discusses plans and methods for implementingbest management practices and monitoring of vegetation, wildlife,and water quality.
1.1 Location of the East Bay Municipal Utility District
EBMUD provides drinking water to approximately 1.3 millionpeople in Alameda and Contra Costa counties. It owns and isresponsible for the management of about 28,000 acres of watersurface and largely undeveloped watershed land east of SanFrancisco Bay. Four reservoirs and their adjacent watershed basins(Briones, San Pablo, Chabot, Lafayette and Upper San Leandro),

Section 1INTRODUCTION
1 - 2
RRRRR A N G EA N G EA N G EA N G EA N G E
RRRRRESOURCEESOURCEESOURCEESOURCEESOURCE
MMMMMANAGEMENTANAGEMENTANAGEMENTANAGEMENTANAGEMENT
PPPPP L A NL A NL A NL A NL A N
Figure 1-1. Location Map of EBMUD Watershed Lands.
N
E B M U D W a t e r s h e d L a n d sM a jo r R o a d s
E B M U D U lt im a t e S e r v ic e B o u n d a r y
MAP 1. SITE MAP
.-,
.-,
.-,
.-,
.-,
.-,
.-,
.-,
.-,
.-,
.-,
.-,
OAKLAN D
HA YW AR D
RI CHM ON D
CONC OR D
ALA MED A
DA NV ILLE
PIN OLE
BER KE LEY
ORI NDA
HE RCU LE S
UN ION C I TY
DU BL IN
PITTSBUR G
LAFAY ETTE
W ALN U T C RE EK
MARTIN EZ
SAN L EAN DRO
MOR AG A
SAN RA MON
ALB AN Y
PLE ASANT H IL L
CL AYTON
EL C E RRITO
SAN PABL O
EME RY VILLE
PIEDM ON T
SU ISU N BAY
SAN PABLO BA Y
SAN F R ANC ISCO B AY
580101
San Pa bl o R es.
Cha bo t Re s.
Up pe r San L ea ndro
Re s.
Lafa yette Re s.
Brio nesRe s.580
80
4
680
680
880
580
80
101
24
6 0 6 12 Miles

Section 1INTRODUCTION
1 - 3
RRRRR A N G EA N G EA N G EA N G EA N G E
RRRRRESOURCEESOURCEESOURCEESOURCEESOURCE
MMMMM ANAGEMENTANAGEMENTANAGEMENTANAGEMENTANAGEMENT
PPPPP L A NL A NL A NL A NL A N
one non-reservoir watershed basin (Pinole Valley), comprise theDistrict�s East Bay Watershed. About 633 acres of non-watershedlands, such as those over ridgetops, are also included. (See Figure1-1)
Watershed boundaries are shared with the communities of Hercules,Pinole, Richmond, Oakland, Orinda, Moraga, Lafayette, andCastro Valley, as well as the East Bay Regional Park District andprivate landowners within both counties.
The topography is dominated by the steep East Bay hills, whichsupport a vegetation mosaic of annual grassland, mixed oakwoodland, and shrub-dominated communities. There areapproximately 10,000 grazeable acres on loamy upland range sites.The mean annual precipitation is 22 inches of rainfall, and theMediterranean climate has cool, wet winters and warm, drysummers. Detailed descriptions of the District�s natural resourcescan be found in the Natural Resource Inventories (EAWEST 1994).For land management purposes, District lands are divided into theNorth and South Watersheds. Within these watersheds, there arefourteen cattle grazing allotments and four community horse pastures.
1.2 Grazing History
Grazing has long since been a part of California�s natural historyand continues to be so today. Priorities, goals, and managementstrategies in relation to land management and the livestockindustry have taken on many different directions since 1769,when Captain Fernando Rivera first introduced some 200livestock onto California�s grasslands (Burcham 1957). It wasthis expedition that marked the beginning of California�s firstindustry, cattle ranching.
Grazing has also been an important part of EBMUD�s historyand continues to serve as an integral part in today�s managementstrategies. In order to develop management strategies for the future,a firm understanding of the past in comparison with the present isimportant.
1.2.1 Early History
Prior to cattle ranching, the rangelands of California were

Section 1INTRODUCTION
1 - 4
RRRRR A N G EA N G EA N G EA N G EA N G E
RRRRRESOURCEESOURCEESOURCEESOURCEESOURCE
MMMMMANAGEMENTANAGEMENTANAGEMENTANAGEMENTANAGEMENT
PPPPP L A NL A NL A NL A NL A N
utilized by native wildlife. These species included pronghornantelope, deer, and elk. Though they did not congregateinto large migratory herds throughout the year, such as thebison of the Great Plains, they were numerous and had animpact upon the natural landscape. Elk were believed tobe the most abundant game animal in California around1845 (Burcham 1957). Wilkes, a visitor to California in1841, reported that an average of about 3,000 elk anddeerskins were shipped from San Francisco each year.Bryant, in 1846, saw numerous herds of elk in theSacramento Valley east of Sutter�s Fort and in the lowerSan Joaquin Valley. He estimated that herds in the latterarea numbered between 1,000 to 2,000 animals (Burcham1957).
The pronghorn antelope was also very abundant and knownto congregate into large herds during the autumn/wintermonths, and scatter into small groups in the spring andsummer during the time when fawns were reared. Theywere known to occur from the San Joaquin Delta regionnorth to the vicinity of Klamath Lake. They were mostabundant in the San Joaquin Valley, where they formedherds numbering up to two or three thousand animals(Burcham 1957).
1.2.2 The Mission Period
The Spanish missions served as the start of the cattle industryin California. Establishing a cattle herd was an importantelement in the founding of every mission. Even thoughtheir primary purpose was to serve as a religious agency,the raising of cattle was fostered at all 21 missions. Duringthe mission period, livestock were not raised for monetaryreasons, but as a means of subsistence. Hides were usedfor making harnesses, clothing, ropes, shoes, etc., whiletallow went into the making of soaps, candles, and alsoserved as a lubricant. The meat was utilized for food forthe mission community, but possessed little value for saleor trade.
The Missions often extended their ranges so the boundariesof one overlapped with the boundaries of other Missionsto the north and/or south. At the height of its activity,

Section 1INTRODUCTION
1 - 5
RRRRR A N G EA N G EA N G EA N G EA N G E
RRRRRESOURCEESOURCEESOURCEESOURCEESOURCE
MMMMM ANAGEMENTANAGEMENTANAGEMENTANAGEMENTANAGEMENT
PPPPP L A NL A NL A NL A NL A N
mission-dominated land accounted for nearly one-sixth ofthe total area of California.
One mission, whose territory extended across the SanFrancisco Bay (adjacent to the current EBMUDwatershed boundary), was the Mission Dolores. ThisMission used the east shore of San Francisco Bay, whereSan Leandro, Alameda, Oakland, Berkeley and othercities now stand (Burcham 1957). The Mission Doloresused this area primarily for raising sheep before theGovernor of California ceded it to Luis Maria Peraltain 1820 (Burcham 1957).
From the late 1820�s to the early 1830�s, the mission ownedcattle herds grew and eventually they controlled largenumbers of livestock. Jedediah Smith reported that in1827, the herds of cattle had built up until they were nearlyas numerous as the buffalo on the plains of Missouri(Burcham 1957). The San Gabriel Mission is estimated tohave had between 80,000-100,000 head of cattle, besideshorses, mules, and sheep. The five missions in the vicinityof San Francisco Bay had more than 40,000 domesticatedcattle among them. By 1834 estimates of the number ofmission cattle were reported to be between 142,000 and423,000 head (Burcham 1957).
With the end of the Spanish period in 1822, laws underMexican rule soon ordered the secularization ofmissions, which was completed in 1836. Soon after,the Mexican Government began granting land to privateindividuals for ranching, which began the �RanchoPeriod.� Nearly anyone could obtain a grant for a squareleague of land (4,439 acres) with the understanding that ahouse would be built on it along with 100 head of cattle.By 1846, more than 500 ranchos existed in California withmost of them occupying former mission controlled lands.
Given the large size of the Ranchos and with California�shighly productive grasslands, cattle ranching prospered andbecame the dominant occupation of the Rancho period.Cattle ranchers would allow their animals to graze free-range, and except for periodic roundups and branding, the

Section 1INTRODUCTION
1 - 6
RRRRR A N G EA N G EA N G EA N G EA N G E
RRRRRESOURCEESOURCEESOURCEESOURCEESOURCE
MMMMMANAGEMENTANAGEMENTANAGEMENTANAGEMENTANAGEMENT
PPPPP L A NL A NL A NL A NL A N
cattle received little attention. A few vaqueros (Mexicancowboy) were needed to protect the herds from raids byIndians and to keep the cattle from straying outside theindistinct boundaries of their owner�s lands.
By the 1840�s, the cattle ranching trade in Californiawas well established throughout the coastal areasfrom San Francisco Bay southward.
1.2.3 The Gold Rush
In 1848, gold was found in the American River, whichstarted the infamous �California Gold Rush.� As aresult, a huge influx of Europeans and Americans fromthe Eastern United States came west to find theirfortune. These events also lead to major changes inthe cattle industry.
The Gold Rush created a huge demand for beef.Virtually overnight, the great �Cattle Boom� began, andwith the price of cattle skyrocketing, the attention ofthe cattle rancher was diverted from producing tallowand hides to supplying beef to miners. Eventually, thedemand for beef was so high that local ranchers couldnot keep up with the demand. As a result, large herdswere driven into California from Texas, Mexico, andother southwestern states. In addition, thousands oflivestock were brought into California from theMidwest. More than 150,000 head of cattle enteredthe state from that area during 1852 and 1853 alone(Burchum 1957).
This influx of cattle led to high stocking rates. As a result,free range grazing led to over-utilization of certain rangelandsand degradation of the landscape. Grazing too early in thespring, improper season of use and overstocking provedto be detrimental to native perennial grassland plants. Incontrast, difficult topography, insufficient water sources, andminimal herding efforts by ranchers, resulted in underutilization of other areas.
The advantage to ranchers of running large numbers oflivestock was due in part to how they were sold. Even
Section 1INTRODUCTION
1 - 7
RRRRR A N G EA N G EA N G EA N G EA N G E
RRRRRESOURCEESOURCEESOURCEESOURCEESOURCE
MMMMM ANAGEMENTANAGEMENTANAGEMENTANAGEMENTANAGEMENT
PPPPP L A NL A NL A NL A NL A N
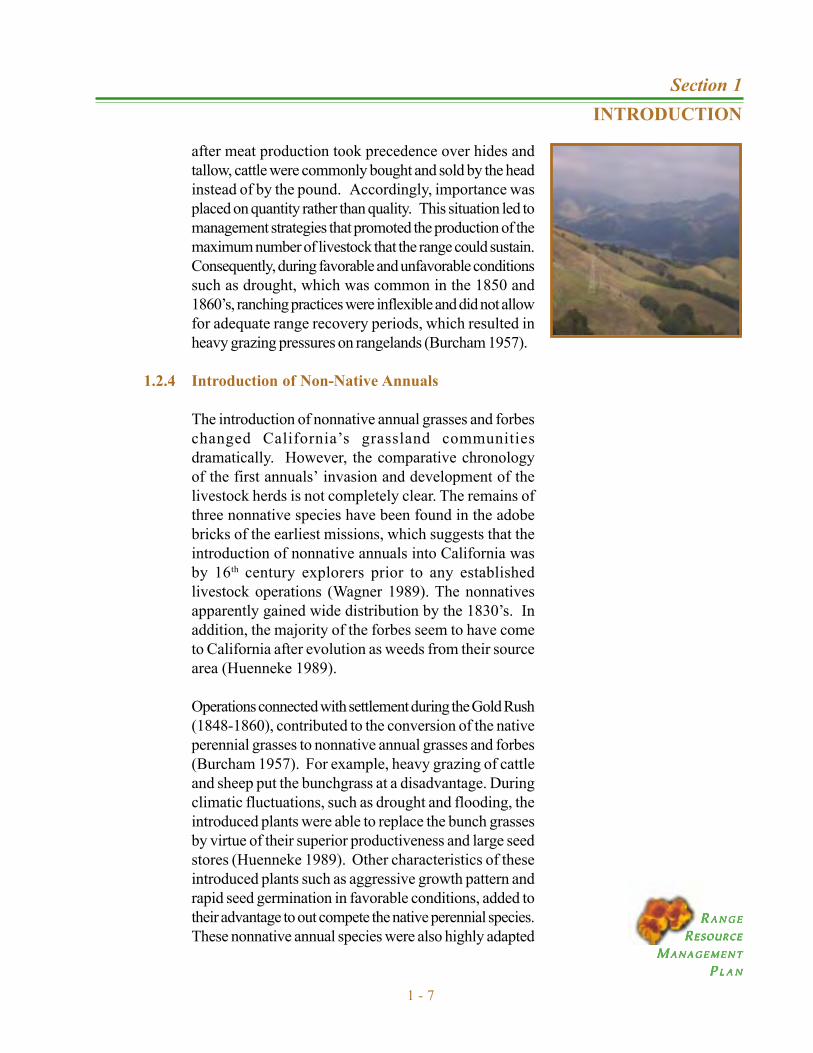
after meat production took precedence over hides andtallow, cattle were commonly bought and sold by the headinstead of by the pound. Accordingly, importance wasplaced on quantity rather than quality. This situation led tomanagement strategies that promoted the production of themaximum number of livestock that the range could sustain.Consequently, during favorable and unfavorable conditionssuch as drought, which was common in the 1850 and1860�s, ranching practices were inflexible and did not allowfor adequate range recovery periods, which resulted inheavy grazing pressures on rangelands (Burcham 1957).
1.2.4 Introduction of Non-Native Annuals
The introduction of nonnative annual grasses and forbeschanged California�s grassland communitiesdramatically. However, the comparative chronologyof the first annuals� invasion and development of thelivestock herds is not completely clear. The remains ofthree nonnative species have been found in the adobebricks of the earliest missions, which suggests that theintroduction of nonnative annuals into California wasby 16th century explorers prior to any establishedlivestock operations (Wagner 1989). The nonnativesapparently gained wide distribution by the 1830�s. Inaddition, the majority of the forbes seem to have cometo California after evolution as weeds from their sourcearea (Huenneke 1989).
Operations connected with settlement during the Gold Rush(1848-1860), contributed to the conversion of the nativeperennial grasses to nonnative annual grasses and forbes(Burcham 1957). For example, heavy grazing of cattleand sheep put the bunchgrass at a disadvantage. Duringclimatic fluctuations, such as drought and flooding, theintroduced plants were able to replace the bunch grassesby virtue of their superior productiveness and large seedstores (Huenneke 1989). Other characteristics of theseintroduced plants such as aggressive growth pattern andrapid seed germination in favorable conditions, added totheir advantage to out compete the native perennial species.These nonnative annual species were also highly adapted

Section 1INTRODUCTION
1 - 8
RRRRR A N G EA N G EA N G EA N G EA N G E
RRRRRESOURCEESOURCEESOURCEESOURCEESOURCE
MMMMMANAGEMENTANAGEMENTANAGEMENTANAGEMENTANAGEMENT
PPPPP L A NL A NL A NL A NL A N
for seed dissemination in the coats of animals, packingmaterials or as impurities in crop plants.
1.2.5 EBMUD: Grazing History
From EBMUD�s inception in the 1920�s, the primarypurpose of grazing was revenue generation and fuelreduction using year-long grazing. Under the directionof the first Land Use Master Plan (LUMP, 1970),agricultural and rangeland areas were managed formaximum economic production. Livestock productionrequirements, therefore, guided management decisionson most of EBMUD�s watershed lands.
From the 1940s to the 1980s, EBMUD determinedproper (moderate) use of annual-type grassland rangesby identifying a �patchy�, protective blanket of oldforage that remained in the fall. This vegetation averagedtwo to three inches in height, which obscured most soil,small rocks, dung, and rodent mounds when viewed froma distance of 20 feet or more.
In 1984, using the EBMUD Range Resource Plan(Vonarb), the District began using rotation grazing toprotect wildlife habitat and more effectively manageherbaceous fuel loads.
As the range program shifted away from maximizingthe economic benefit to protecting the resource andwater quality, the RDM standards were raised. By theearly 1980�s the District had adopted the SoilConversation Service recommendation of 70% cover with

Section 1INTRODUCTION
1 - 9
RRRRR A N G EA N G EA N G EA N G EA N G E
RRRRRESOURCEESOURCEESOURCEESOURCEESOURCE
MMMMM ANAGEMENTANAGEMENTANAGEMENTANAGEMENTANAGEMENT
PPPPP L A NL A NL A NL A NL A N
RDM of 400 lbs. on level, 600 lbs. on moderate, and 800lbs. on steep slopes.
In 1984 these District standards were increased to 600/800/1000 lbs., respectively. (When the EBWMP wasadopted the RDM requirements were increased by 140%to their current levels of 840/1120/1400 lbs.)
Generally, by increasing the amount of mulch (RDM), broad-leaved forbs and short grasses decrease, and are replacedby taller herbaceous vegetation.
In 1996, after a 4½-year public process, the Districtadopted the EBWMP as a replacement for the LUMP,1970. With the EBWMP, the District determined thatmanaging lands and reservoirs to protect water quality andimportant, high-quality biological resources could best beachieved by promoting biological diversity (biodiversity).The EBWMP clearly defines new management goals forlivestock grazing directed towards protecting water qualityand maintaining and enhancing biodiversity. The RangeResource Management Plan is based upon these goals.
1.3 Goals and Objectives
With the guidance of the EBWMP, the District is committed tomanaging its land and reservoirs to protect water quality, andmaintain and enhance biological resources by promotingbiodiversity. Livestock grazing will be used primarily as a toolto manage vegetation to meet goals for water quality,biodiversity, and fire protection. Through the EBWMP long-term goals listed below, the District is committed toenvironmentally responsible natural resource management:
� Protect and enhance water quality, biodiversity, and othernatural resources by defining best management practicesfor livestock grazing and rest periods.
� Define the procedures for monitoring range condition,special status species, and sensitive habitats.
� Define best management practices for livestock to manage

Section 1INTRODUCTION
1 - 10
RRRRR A N G EA N G EA N G EA N G EA N G E
RRRRRESOURCEESOURCEESOURCEESOURCEESOURCE
MMMMMANAGEMENTANAGEMENTANAGEMENTANAGEMENTANAGEMENT
PPPPP L A NL A NL A NL A NL A N
vegetation for fire control.
� Outline the format and requirements for Allotment ManagementPlans that include improvements for each allotment.
� Integrate GIS capability with rangeland management in thecreation of Allotment Management Plans.
� Retain current levels of runoff while protecting soils,biodiversity, and water quality.
1.3.1 Fire Management Plan
The EBWMP also envisioned that, after the EBWMP�sapproval in 1996, EBMUD would subsequently prepare aFire Management Plan (FMP). The goal for the FMP is toprotect human life and property, provide for public safety,and protect and enhance water quality, other naturalresources, and watershed land uses. In 2001, EBMUDapproved the FMP.
Grazing is used as a cost-effective tool for managing flashyfuels over large areas, especially near the urban interface,by reducing the intensity of fires in grassland areas.
Where fire protection is essential, livestock grazing as afuel reduction tool can be implemented strategically tominimize impacts on water quality and biodiversity. Fieldswith urban interface, high fuel hazards, and/or other firerisks will be grazed annually to minimize risks in accordancewith the goals of the Fire Management Plan. Fields not onan urban interface can be rested or banked to meet otherland management goals.
The objective is to reduce the fuel loading in tallgrassland fuels from 3 tons per acre (normal annualproduction) to ½ to ¾ ton per acre. According to theFire Management Plan adequate fire hazard reductionis achieved when dry grassland fuels are reduced tofour to six inches in height. Overall the RDM levels of900/1200/1400 relate well to fire concerns.

Section 1INTRODUCTION
1 - 11
RRRRR A N G EA N G EA N G EA N G EA N G E
RRRRRESOURCEESOURCEESOURCEESOURCEESOURCE
MMMMM ANAGEMENTANAGEMENTANAGEMENTANAGEMENTANAGEMENT
PPPPP L A NL A NL A NL A NL A N
Seasonal benefits of fire protection must outweigh potentiallonger-term negative watershed impacts on water qualityand biodiversity. When grazing is deemed detrimental, theDistrict should seek other stubble management alternativesto livestock grazing. Site-specific discussions can be foundin Section 5, Allotment Management Plans and TenantSelection. Also, See EBWMP Guidelines LG.3, LG.8,FF.7, FF.10, and FF.36 in Appendix C. The BiologicalFuel Modification Treatments section of the FMP isAppendix D.
1.3.2 Cultural Resources
The District�s watershed lands contain numerousarchaeological and historical sites as well as thepotential for others yet undiscovered. These areas arereferred to collectively as cultural resources.
Impacts from livestock activities are generally minimal,since they are confined to surface disturbances. Whenground-disturbing activities such as new pondconstruction are initiated, inspection and monitoringoccurs. For reference, new stock ponds are rarelyneeded, and are almost always located on the site of aformer pond.
1.3.3 Visual Resources
The natural features of the District�s watershed landsprovide a valuable visual resource to people who usethese lands, as well as to people who pass through themor who reside, work, or recreate on adjacent lands.
Overall, the livestock grazing management programensures that proposed activities do not substantially alterthe open space quality of the watershed lands.
1.3.4 Recreation
Recreation on East Bay watershed lands is provided atdeveloped recreation areas that are used extensively,and on the recreational trail system that is used at a fairly

Section 1INTRODUCTION
1 - 12
RRRRR A N G EA N G EA N G EA N G EA N G E
RRRRRESOURCEESOURCEESOURCEESOURCEESOURCE
MMMMMANAGEMENTANAGEMENTANAGEMENTANAGEMENTANAGEMENT
PPPPP L A NL A NL A NL A NL A N
low intensity. Grazing does not occur within any developedrecreation areas, but portions of the trail system go throughpastures. Those areas are monitored and mitigated asnecessary.
1.4 Program Components
Specific programs and tools to implement the RRMP goals andobjectives include: Spring and Fall Field Surveys, Annual GrazingPlans (AGP), Water Quality Sampling, Integrated Pest Management(IPM), Geographic Information System (GIS), the FireManagement Plan (FMP), Review by Fisheries and Wildlife staff;Management for Special Status Species (SSP), AllotmentManagement Plans (AMP) and current Endangered Species Act(ESA), the EBWMP and the EBWMP ProgrammaticEnvironmental Impact Report (EIR), and the RRMP.
1.4.1 The East Bay Watershed Master Plan (EBWMP)
General descriptions of the watershed lands, hydrology,water quality, soils, geology, vegetation, visual resources,cultural resources, and recreation facilities are welldocumented in the EBWMP. For reference, the LivestockGrazing section of the EBWMP is included as AppendixC.
1.4.2 Spring and Fall Field Surveys
Methodical and routine assessments of range condition offera basis for evaluation of rangeland health and of changesand trends over time. Residual dry matter (RDM) analysisis included in the fall survey. A detailed discussion of rangemonitoring is included in Section 4, Monitoring of GrazedRangelands.
1.4.3 Annual Grazing Plans (AGP�s)
Annual grazing plans are created for each allotment basedon the annual field surveys and seasonal weather conditions,plus additional factors such as vegetation abatement, whichaddresses fire concerns along the urban-wildland interface.

Section 1INTRODUCTION
1 - 13
RRRRR A N G EA N G EA N G EA N G EA N G E
RRRRRESOURCEESOURCEESOURCEESOURCEESOURCE
MMMMM ANAGEMENTANAGEMENTANAGEMENTANAGEMENTANAGEMENT
PPPPP L A NL A NL A NL A NL A N
Each plan determines the number of animals that theallotment can accommodate and still maintain goodrangeland health. AGPs are described in more detail inSection 5, Allotment Management Plans and TenantSelection.
1.4.4 Water Quality Sampling
Reservoirs and tributary streams are tested for contaminantson a routine basis. Nonpoint source pollution (NPS), aswell as soil particulates indicating erosion, are tracked toaid in the planning and development of land use practicesto control or minimize potential adverse impacts of livestockgrazing. A complete discussion may be found in Section4.5, Water Quality Monitoring.
1.4.5 Integrated Pest Management (IPM)
Noxious weeds are removed by the safest methodsavailable, including mechanical and spot spraying using leasttoxic herbicides that minimize effects to the environment.The District�s IPM guidelines are included in this documentas Appendix H, Integrated Pest Management Plan.
1.4.6 Geographic Information System (GIS)
Biological information, regulatory requirements, fencing, andstock water supplies are always subject to change. Therangeland management program is updated to reflect thesechanging watershed conditions by using the District�sextensive GIS database.
1.4.7 Fire Management Plan (FMP)
Grazing is used as a cost-effective method for managingflashy fuels over large areas, especially near the wildland-urban interface. The FMP identifies these watershedinterface zones where grazing is the preferred strategy toreduce fuel loads. Further discussion of this importantelement can be found in Section 5.5 of this document. FMPmanagement guidelines are included as Appendix D.

Section 1INTRODUCTION
1 - 14
RRRRR A N G EA N G EA N G EA N G EA N G E
RRRRRESOURCEESOURCEESOURCEESOURCEESOURCE
MMMMMANAGEMENTANAGEMENTANAGEMENTANAGEMENTANAGEMENT
PPPPP L A NL A NL A NL A NL A N
1.4.8 Management for Special Status Species
Management for SSP, as set forth in federal and stateregulations for threatened and endangered species, willguide the implementation of the RRMP. For example,perennial streams will be outfenced from livestock grazingand springs and seeps will be grazed seasonally, inaccordance with these regulations.
1.4.9 Consultation with EBMUD Fisheries and WildlifeStaff
EBMUD has a Fisheries and Wildlife Division for the EastBay watershed lands it owns and manages. The biologistson staff are available for consultation and comment on thebiological aspects of the various programs associated withthe RRMP.
1.5 Organization and Use of the RRMP
1.5.1 Section 1: Introduction
The RRMP will be used in conjunction with the EBWMPand the FMP, which were developed to reduce potentialmanagement conflicts. The EBWMP requires that grazingbe coordinated with these other resource managementprograms. Together, these plans define the implementationof management directives discussed within the EBWMP.
1.5.2 Section 2: Grazing, Livestock and Water Quality
Section 2 discusses the potential impacts of livestock grazingon water quality. The potential impacts and mitigationmeasures are outlined.
1.5.3 Section 3: Grazing and Biodiversity
Section 3 outlines the potential impacts to biodiversity, andthe range management strategies that will be implementedto maintain and enhance these natural resources.

Section 1INTRODUCTION
1 - 15
RRRRR A N G EA N G EA N G EA N G EA N G E
RRRRRESOURCEESOURCEESOURCEESOURCEESOURCE
MMMMM ANAGEMENTANAGEMENTANAGEMENTANAGEMENTANAGEMENT
PPPPP L A NL A NL A NL A NL A N
1.5.4 Section 4: Monitoring of Grazed Rangelands
Section 4 lists and explains the methods that will be used tomonitor range condition. These activities, data collectionand analysis calculations, will indicate whether the goalsand objectives of the range management program are beingachieved.
1.5.5 Section 5: Allotment Plans and Tenant Selection
Section 5 specifies how EBMUD�s Allotment ManagementPlans (AMPs) are developed. These plans describemanagement objectives for improved water quality,enhanced biodiversity, fire control, and healthy grasslands.They are site-specific and incorporate all the elementsdiscussed in this document, including GIS and fire and fuelsmanagement. The tenant selection process is also identified.

Section 2 GRAZING ANDWATER QUALITY
2 - 1
RRRRR A N G EA N G EA N G EA N G EA N G E
RRRRRESOURCEESOURCEESOURCEESOURCEESOURCE
MMMMM ANAGEMENTANAGEMENTANAGEMENTANAGEMENTANAGEMENT
PPPPP L A NL A NL A NL A NL A N
2.0 Introduction
More than 40 million acres of California�s 101 million acres israngeland. Classified as the most extensive land type in the state,the location of rangelands, between forested areas and major riversystems, means that almost all surface water in California passesthrough rangeland (U.C. Davis 1998).
Livestock grazing is a significant use of rangeland in California andpresents the widest array of water quality impacts (MacDonald1991). Grazing practices can also affect the quality of public drinkingwater sources (Buckhouse 1999). As outlined in the East BayWatershed Master Plan (EBWMP 1996), Guideline LG.11, theseeffects may include impacts to water quality and conflicts with otherresources such as:
� Erosion on highly erodible sites;
� Discharge of nutrients, pathogens, sediments, and othercontaminants into reservoirs and tributaries;
� Interference with vegetation recovery following prescribed fireor wildfire;
� Damage to or destruction of sensitive plant species andcommunities;
� Excessive removal of wildlife cover; and
� Damage to roads, trails, and recreation areas.
Section 2GRAZING ANDWATER QUALITY
2 - 2
RRRRR A N G EA N G EA N G EA N G EA N G E
RRRRRESOURCEESOURCEESOURCEESOURCEESOURCE
MMMMMANAGEMENTANAGEMENTANAGEMENTANAGEMENTANAGEMENT
PPPPP L A NL A NL A NL A NL A N
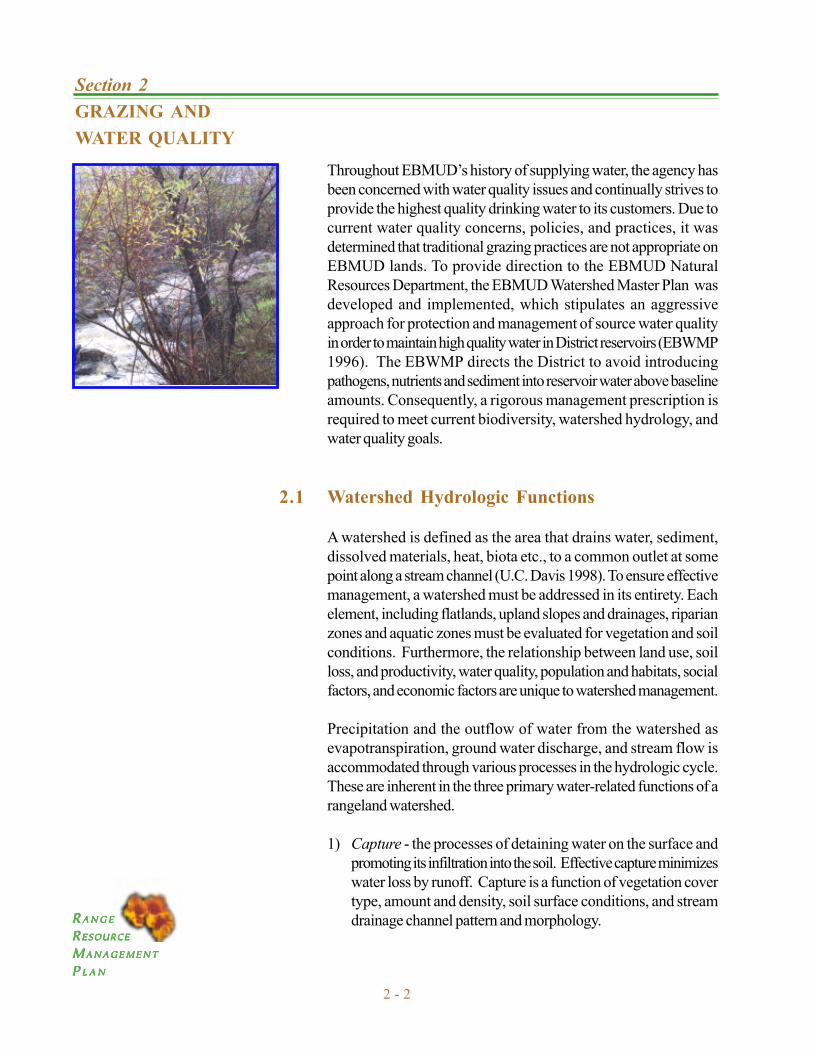
Throughout EBMUD�s history of supplying water, the agency hasbeen concerned with water quality issues and continually strives toprovide the highest quality drinking water to its customers. Due tocurrent water quality concerns, policies, and practices, it wasdetermined that traditional grazing practices are not appropriate onEBMUD lands. To provide direction to the EBMUD NaturalResources Department, the EBMUD Watershed Master Plan wasdeveloped and implemented, which stipulates an aggressiveapproach for protection and management of source water qualityin order to maintain high quality water in District reservoirs (EBWMP1996). The EBWMP directs the District to avoid introducingpathogens, nutrients and sediment into reservoir water above baselineamounts. Consequently, a rigorous management prescription isrequired to meet current biodiversity, watershed hydrology, andwater quality goals.
2.1 Watershed Hydrologic Functions
A watershed is defined as the area that drains water, sediment,dissolved materials, heat, biota etc., to a common outlet at somepoint along a stream channel (U.C. Davis 1998). To ensure effectivemanagement, a watershed must be addressed in its entirety. Eachelement, including flatlands, upland slopes and drainages, riparianzones and aquatic zones must be evaluated for vegetation and soilconditions. Furthermore, the relationship between land use, soilloss, and productivity, water quality, population and habitats, socialfactors, and economic factors are unique to watershed management.
Precipitation and the outflow of water from the watershed asevapotranspiration, ground water discharge, and stream flow isaccommodated through various processes in the hydrologic cycle.These are inherent in the three primary water-related functions of arangeland watershed.
1) Capture - the processes of detaining water on the surface andpromoting its infiltration into the soil. Effective capture minimizeswater loss by runoff. Capture is a function of vegetation covertype, amount and density, soil surface conditions, and streamdrainage channel pattern and morphology.

Section 2 GRAZING ANDWATER QUALITY
2 - 3
RRRRR A N G EA N G EA N G EA N G EA N G E
RRRRRESOURCEESOURCEESOURCEESOURCEESOURCE
MMMMM ANAGEMENTANAGEMENTANAGEMENTANAGEMENTANAGEMENT
PPPPP L A NL A NL A NL A NL A N
2) Storage - water that is retained within the soil profile atsaturation for subsequent percolation or use by plants. Theamount and density of living and dead vegetation cover whichinfluences water loss affect storage by influencingevapotranspiration. More water evaporates from bare soilsthan from those with good ground cover.
3) Beneficial release - water moving through the soil profile bypercolation in order to replenish groundwater or emerge asseeps, springs and sub-surface drainage in a safe, sustainedmanner over time. Safe non-erosive release is promoted bymaintenance of proper plant cover and concomitant soil stability.
Total yield, flow rate, and quality of runoff water are primarilyfunctions of watershed vegetation cover characteristics andmanagement practices. The primary objective of watershedmanagement is to diminish the peak and extend the duration of flowin the storm water hydrograph. High peak flows associated withrelatively short runoff or drainage periods in watersheds withinadequate plant cover and compacted or disturbed soils of lowpermeability lead to soil surface and stream bank erosion andconsequent nonpoint source (NPS) pollution of water by sedimentand other contaminants.
2.2 Soil Resources
Soils vary as to their inherent hydrology or watershed function andhave been classified by the USDA into �hydrologic groups� A - Dbased upon depth, texture and infiltration rate, which is their runoffpotential without protective vegetation (Table 2-1). Watershedfunction also varies according to �hydrologic condition�, based uponthe percent of total protective plant cover, including the combineddensity of live plants and litter and related weight of RDM.
Runoff volume, velocity, erodability and potential NPS waterpollution is greatest for soils in Hydrologic Group D in poorhydrologic condition. A soil inventory in 1994 determined that25,536 acres, or 82% of the total EBMUD watersheds is comprisedof soils rated from a moderately high to a very high erosion hazard(Groups C and D). These soils occur mainly on slopes greaterthan 30%. Protective measures such as maintenance of higher coverdensity and RDM are critical for soils in this group.

Section 2GRAZING ANDWATER QUALITY
2 - 4
RRRRR A N G EA N G EA N G EA N G EA N G E
RRRRRESOURCEESOURCEESOURCEESOURCEESOURCE
MMMMMANAGEMENTANAGEMENTANAGEMENTANAGEMENTANAGEMENT
PPPPP L A NL A NL A NL A NL A N
Table 2-1. Summary of Hydrologic Characteristics of the PrincipalHighly Erodible Soils of East Bay Municipal UtilityDistrict.1
Watershed Slope Hydrological ErosionSoil Type Percent Group HazardMillsholm Loam 50-75 D Very High
Gaviota Rocky Sandy Loam 40-75 D Very High
Los Gatos/Los Osos Complex 45-75 C High-Very High
Millsholm Silt Loam 30-75 D High-Very High
Los Osos Silty Clay Loam 7-75 C High-Very High
Alo Clay 30-50 D Moderate-Very High
Los Osos Clay Loam 50-75 C High
Los Gatos Loam 50-75 C High
Lodo Clay Loam 50-75 D High
Felton Loam 50-75 B High
Sehorn Clay 30-75 D High
Millsholm Loam 30-50 D High
Los Osos/Millsholm Complex 30-45 C High
Lodo Clay Loam 30-50 D Moderate-High
Los Gatos Clay Loam 30-50 C Moderate-High
Los Osos Clay Loam 30-50 C Moderate-High
Diablo Clay 30-50 D Moderate-High
Altamont/Fontana Complex 30-50 D Moderate-High
Gilroy Clay Loam 30-50 D Moderate-High
Tierra Loam 9-30 D Moderate-High
1 Source: EAWEST (1994b), USDA (1977); principal soil types eachoccupy >100 acres; hydrologic groups defined in Table 1;soils listed in order of decreasing % slope and erosion hazard.

Section 2 GRAZING ANDWATER QUALITY
2 - 5
RRRRR A N G EA N G EA N G EA N G EA N G E
RRRRRESOURCEESOURCEESOURCEESOURCEESOURCE
MMMMM ANAGEMENTANAGEMENTANAGEMENTANAGEMENTANAGEMENT
PPPPP L A NL A NL A NL A NL A N
2.3 Nonpoint Source Pollution
Pollution is defined as an alteration of the quality of the state watersby waste to a degree that unreasonably affects their beneficial usesor, facilities that serve their beneficial uses (U.C. Davis 1998).There are two categories of source water pollution that have beenidentified in the Clean Water Act; point and non-point. Point sourcepollution is observable, specific, and confined discharge of pollutantsinto a water body, such as feedlots, food processing plants, andagrochemical processing plants. A diffuse discharge of pollutantsthroughout the natural environment usually associated withagriculture, forestry, mining, and urban water runoff is termednonpoint source pollution. Nonpoint source pollution occurs aswater from rainfall, snowmelt, irrigation, or human activities movesover and through the ground and picks up and carries away naturaland manmade pollutants, eventually depositing them into lakes,rivers, wetlands, coastal waters, and underground sources ofdrinking water (U.C. Davis 1998).
The potential level of water pollution is a function mainly of livestock,wildlife, and human population density as well as coincidence ofanimal presence with season, intensity and amount of precipitation.On rangelands, grazing, roads, construction activities, mining,recreational activities, and natural processes may cause nonpointsource pollution. The primary contaminant constituents of concernrelated to potential nonpoint source pollution of municipal raw waterby livestock and wildlife are sediments, pathogens, nutrients, andtotal organic carbon. Table 2.2 lists each group, the pollutantconstituents and origin, related constituents and basis for concern.

Section 2GRAZING ANDWATER QUALITY
2 - 6
RRRRR A N G EA N G EA N G EA N G EA N G E
RRRRRESOURCEESOURCEESOURCEESOURCEESOURCE
MMMMMANAGEMENTANAGEMENTANAGEMENTANAGEMENTANAGEMENT
PPPPP L A NL A NL A NL A NL A N
Table 2-2.Primary Contaminant Constituents of Concern Related to Potential Nonpoint Source Pollution of Municipal Raw Water by Livestock and Wildlife.1
Contaminant Pollutant Origin, Related ConstituentsGroup Constituent and Basis for Concern
Sediments Turbidity (NTU) and Soil erosion from animal activity can(Particulates) Sediment (mg/L) harbor microbes, nutrients and toxic
chemicals; detrimental to aquaticecosystems; increase level and costof water treatment.
Nutrients Nitrates (NO3, ppm) and Originate from animal excreta;(Organics) Phosphates (PO4, ppm) p r o m o t e a l g a e g r o w t h ,
eutrophication and undesirablewater flavor and odor; algaeincrease water treatment costs; NO3a health hazard.
Total Organic Originates from constituents ofCarbon (TOC, mg/L) decomposed, dislocated/eroded
plant and animal waste; a precursorof disinfection by-products(seesection 2.3.2), health hazards andcause of undesirable taste and odorof water.
Pathogens Bacteria (MPN/100 ml) The presence of fecal streptococci(Micro- (FS) can be an indicator of waterorganisms) pollution by animals, esp. when
related to fecal coliform (FC); bothmay indicate presence of otherpathogens.
Protozoa (MPN/100 ml) Giardia and Cryptosporidium;
originate from animal excreta,particularly calves under fivemonths of age; infectious oocystsdifficult to evaluate and to controlby water treatment; potential healthhazard.
1 From the EBMUD Watershed Sanitary Survey (1995).

Section 2 GRAZING ANDWATER QUALITY
2 - 7
RRRRR A N G EA N G EA N G EA N G EA N G E
RRRRRESOURCEESOURCEESOURCEESOURCEESOURCE
MMMMM ANAGEMENTANAGEMENTANAGEMENTANAGEMENTANAGEMENT
PPPPP L A NL A NL A NL A NL A N
The means and pathways by which sediment and associated nutrientsand microbes enter water bodies on a rangeland watershed occupiedby herbivores is through plant cover reduction, soil detachment,erosion and transport by runoff of precipitation, and by animaldefecation and urination directly into open water . The potentiallevel of water pollution is, therefore, a function mainly of: (1)Domestic and wild animal population density; (2) coincidence ofanimal presence relative to the season, intensity and amount ofprecipitation; and (3) proximity and access of animals to, and timespent within, water bodies and riparian zones during drinking, feedingand loafing.
Sections 2.5 through 2.8 identify the measures taken byEBMUD to manage for and protect water quality on rangelandswithin EBMUD open space watershed property.
2.3.1 Sedimentation
The kinetic energy of a raindrop impacting the soil surfaceis the primary force responsible for initiating soil movement.Compacted and/or impermeable soils can increase thevolume and velocity of runoff, and increase natural soilerosion processes.
According to the U.S. Department of Interior (1987),watershed sediment yield is most influenced or controlledby rainfall, soil type, ground cover, land use, topography,upland erosion, runoff, and characteristics of channelhydraulics and sediment grains. When these attributes areco-related with the six factors affecting soil erosion asdetermined by the Universal Soil Loss Equation (USLE)of the USDA -rainfall, inherent soil erodibility, length ofslope, percent slope, amount of soil covered by vegetation,and erosion control practices- the managerial value of plantcover density and weight in reducing suspended sedimentin runoff is readily apparent.
Suspended sediment is widely recognized and documentedas the principal water nonpoint source pollutant related toagricultural grazing and forestry (Blackburn, et al. 1982,MacDonald 1991, Robbins, et al. 1991). It not onlyincreases costs of water treatment and diminishes waterquality and habitat for aquatic organisms (USEPA 1979),

Section 2GRAZING ANDWATER QUALITY
2 - 8
RRRRR A N G EA N G EA N G EA N G EA N G E
RRRRRESOURCEESOURCEESOURCEESOURCEESOURCE
MMMMMANAGEMENTANAGEMENTANAGEMENTANAGEMENTANAGEMENT
PPPPP L A NL A NL A NL A NL A N
but also has an affiliation and correlation with the presenceor level of pathogens, particularly Giardia,Cryptosporidium and fecal coliform (Rose 1988).Suspended sediment has also been implicated as a meansof transport for toxic chemicals (SWRCB 1994).
2.3.2 Nutrients
Although sediment is usually considered to be the largestwater quality problem from livestock grazing, nutrients mayalso be of concern (U.C. Davis 1998). Leaching of nutrientsfrom watersheds is a natural part of nutrient cycling, butcan become pollutants near streams and lakes by directdeposit or by overland transport during the rainy season orperiods of runoff. The potential for this mode ofcontamination depends on time, density and access.Therefore, nutrient problems are most critical where animalscongregate for water, feed, salt and shade (U.C. Davis1998). In addition, daily inputs from directly deposited fecesmay accumulate on the stream bottom. Any disturbance,such as peak flows, can resuspend sediment, creating highconcentrations of nutrients for a short period of time.
Three principle nutrients identified as potential pollutantsare nitrogen, in the form of nitrate, phosphorus, and totalorganic carbon (TOC). Nitrates, at high concentrations,can cause aquatic weed growth and is considered a healthproblem. Whereas, excess levels of phosphorus can leadto eutrophication, total organic carbons (TOC) originatefrom decomposed plant material and animal waste. TOCloading and aging can lead to undesirable taste, odor andcolor of raw water. It can also become a serious healthhazard when raw water treatment by chlorination results intoxic trihalomethanes (THM) as a disinfection by-product(DBP). They can all be transported on suspended sedimentinto waterways.
Nitrates and phosphates (soluble orthophosphates) and aportion of TOC originate from animal excrement and itsdecay. Decomposition by bacterial action andmineralization of dead vegetation (litter/residue) and animalremains also contributes various forms of these potentialpollutants to the soil where much of the nitrogen and

Section 2 GRAZING ANDWATER QUALITY
2 - 9
RRRRR A N G EA N G EA N G EA N G EA N G E
RRRRRESOURCEESOURCEESOURCEESOURCEESOURCE
MMMMM ANAGEMENTANAGEMENTANAGEMENTANAGEMENTANAGEMENT
PPPPP L A NL A NL A NL A NL A N
phosphorus is absorbed and utilized by plants for growth.However excess soluble organic and inorganic forms ofnitrogen (N) and phosphorus (P), and organic carbon maypotentially be carried overland in runoff or inflow to waterbodies.
2.3.3 Pathogens
Warm-blooded animals are the primary source of fecalmicrobes in the watershed environment that are of humanhealth concern (See appendix A,Table 2-3). Fecal coliform(FC) represent from 93% to 98% of total coliforms excretedby livestock and other mammalian vertebrates (Geldreich1976). However, total FC per se is not as definitive asfecal streptococcus (FS), specifically Streptococcus bovisand Streptococcus equinus, in identifying pollution of waterby livestock when humans and other animals are present inthe watershed (Geldreich 1976). Although these bacteriaare readily controlled by water treatment, elevated levelsin raw water can act as indicators of nonpoint pollution byanimals and the potential presence of other hazardousenteric microorganisms. Studies have suggested that a ratioof FC to FS of less than 0.7 is indicative of watercontamination by nonhuman warm-blooded animals(Tiedemann 1987).
FC is present in watersheds whether grazed by domesticlivestock or not due to the presence of wildlife (USEPA1979). Studies have found a positive relationship betweenthe presence of grazing livestock in a watershed and thelevel of FC in runoff waters (Binkley and Brown 1993). Inaddition, FC survived through the winter in feces andelevated FC occurs in water long after cattle are removed.Survival of bacteria in upland fecal material varies widelyfrom at least eight months in a dry climate to as much as ayear in more mesic or forested sites. FC and FS can remainviable for months in stream bottom sediments. Intensityand season of grazing can have an influence on potentialbacterial contamination of water, and elevated FC occursin water long after cattle are removed.
Both Giardia lamblia and Cryptosporidium parvum areprotozoan microbes that can cause gastrointestinal illnessin humans. They are shed in the feces of rangeland cattle,

Section 2GRAZING ANDWATER QUALITY
2 - 10
RRRRR A N G EA N G EA N G EA N G EA N G E
RRRRRESOURCEESOURCEESOURCEESOURCEESOURCE
MMMMMANAGEMENTANAGEMENTANAGEMENTANAGEMENTANAGEMENT
PPPPP L A NL A NL A NL A NL A N
and can be transmitted to water (Atwill 1996). Youngcalves up to four months of age have the highest probabilityof shedding these microbes. However, they occur innumerous host animals, including wildlife, and aretransmitted via feces to water. See Table 2-3 in AppendixA.
At relatively low levels in raw water, Giardia cysts can bereduced by treatment to acceptable levels in drinking water.Cryptosporidium oocysts, on the other hand, cannot besuccessfully removed by treatment. However, accordingto State Public Health officials the risk of healthy individualscontracting cryptosporidiosis from drinking water inCalifornia is extremely low.
Feral pigs are a potential reservoir of C. parvum andGiardia and pigs under 8 months of age from high-densitypopulations are most likely to shed C. parvum. Pigs�affinity for riparian areas poses a particular hazard ofpollution by both protozoans. Fortunately, a large majorityof cysts of Giardia and oocysts of Cryptosporidium inextensive U.S. raw water sampling in 1991 were found notto be viable.
2.4 Impacts of Grazing Livestock
The primary sources of water pollutants on grazed rangeland aresoil particulates, pathogens and nutrients. The means and pathwaysby which sediment and associated nutrients and microbes enterwater bodies on a rangeland watershed occupied by herbivores isthrough plant cover reduction, soil detachment, erosion and transportby runoff of precipitation, and by animal defecation and urinationdirectly into open water. However, these pathways from livestockactivity to impaired beneficial uses of water, are often complex anddifficult to understand because the livestock activity that causes awater quality problem may occur over a long period of time atsome distance from the point where a water quality impairment isidentified (U.C. Davis 1998).

Section 2 GRAZING ANDWATER QUALITY
2 - 11
RRRRR A N G EA N G EA N G EA N G EA N G E
RRRRRESOURCEESOURCEESOURCEESOURCEESOURCE
MMMMM ANAGEMENTANAGEMENTANAGEMENTANAGEMENTANAGEMENT
PPPPP L A NL A NL A NL A NL A N
Therefore the potential level of water pollution is a function mainlyof:
1. Domestic and wild animal population density;2. Coincidence of animal presence relative to the season, intensity
and amount of precipitation;3. Proximity and access of animals to, and time spent within, water
bodies and riparian zones during drinking, feeding and loafing.
These activities fall into three categories of potential impacts:livestock waste concentration, heavy grazing, and hoof action.
Sections 2.5 through 2.8 identify the measures taken byEBMUD to manage for and protect water quality on rangelandswithin EBMUD open space watershed property.
2.4.1 Heavy Grazing
Vegetation protects the soil from the erosive energy ofraindrops and overland flow, acts as a sediment trap andincreases infiltration rates. However, heavy grazing removesvegetation that covers the soil. As a consequence, sedimentis detached in the uplands by surface runoff and mayeventually find its way to a stream. Research indicates thatas grazing intensity is increased, the amount of herbage,litter standing crop, and cover declines (Blackburn et al1982). In addition, soil bulk density increases and soilorganic matter content and aggregate stability decreases(Heitschmidt 1990). This results in a reduction of waterinfiltration rates and an increase in sediment production [asa result of increased runoff]. A decrease in infiltration isaccompanied by an increase in overland flow, which resultsin more water available for sediment transport (Branson,et al. 1972). In addition, sediment is also detached fromstream banks by the erosive force of flowing water or thecollapse of unstable banks (U.C. Davis 1998). Based uponresearch or recommendations by U.S. Department ofInterior (1960), Packer (1961), USEPA (1979) and Wright,et al. (1982), a minimum plant cover of from 65% to 75%must be achieved to maintain soil stability and water quality.
Grazing season and stock density can potentially impactwater quality, unless overall stocking rate is light to moderate

Section 2GRAZING ANDWATER QUALITY
2 - 12
RRRRR A N G EA N G EA N G EA N G EA N G E
RRRRRESOURCEESOURCEESOURCEESOURCEESOURCE
MMMMMANAGEMENTANAGEMENTANAGEMENTANAGEMENTANAGEMENT
PPPPP L A NL A NL A NL A NL A N
and adequate plant cover is retained, particularly on fine-textured soils. Sediment production under heavy, rotationalgrazing can average nearly twice that of moderate,continuous grazing on clay and clay loam soils (Pluhar, etal. 1987). Sediment production under heavy, continuoususe of all vegetation types on silty clay can reach 180%,which is 24% greater than moderate, continuously grazedand short-duration (heavy-rotation) grazed pastures(Thurow, et al. 1986). On fine loamy soils of less than30% slope, under heavy stocking rate, rotation of grazingshowed no advantage in reducing sediment yield comparedto continuous use (Gamougoun, et al. 1984).
In a two year study involving various pasture sizes andstocking densities under rotation grazing, Warren, et al.(1986a) concluded that the pasture grazed at the higheststock density produced the lowest infiltration rates andgreatest sediment loss. Furthermore, implementation ofcell-designed, rotational grazing systems may cause asignificant increase in density and number of cattle trails,particularly near water, and under certain topographical andfencing conditions, these trails may develop on highlyerodible slopes (Walker and Heitschmidt 1986).
2.4.2 Hoof Impacts
Concentrated �hoof action� by livestock causes compactionof wet soils, whether vegetated or exposed, andmechanically disrupts dry, exposed soils, causingdisaggregation. In addition, hoof impacts can destroy streambank vegetative cover, which leads to the physicalbreakdown of stream banks (U.C. Davis 1998).Detachment by �powdering� dry mineral and organic soilsoccurs on stream banks, trails and in areas of livestockconcentration around watering, salting and feeding sites,and in confinement pens. When it rains these soils aretransported in runoff as a �pulse� of suspended sediment.
This type of erosion is a potential impact of summer-fallgrazing of livestock on California annual-type rangeland,which may lead to the impairment of water quality and thesedimentation of downstream sites during early winterrainfall. Location of concentrated livestock facilities in close

Section 2 GRAZING ANDWATER QUALITY
2 - 13
RRRRR A N G EA N G EA N G EA N G EA N G E
RRRRRESOURCEESOURCEESOURCEESOURCEESOURCE
MMMMM ANAGEMENTANAGEMENTANAGEMENTANAGEMENTANAGEMENT
PPPPP L A NL A NL A NL A NL A N
proximity to drainages and water bodies exacerbates therisk of water pollution by suspended sediment as well asby fecal nutrients and microorganisms.
2.4.3 Livestock Waste Concentration
Contributions of nutrients and pathogens to water can comefrom a variety of sources, including agriculture, stream bankerosion, fertilization of lawns and golf courses, septicsystems, domestic and urban sewage disposal, landfills,rainfall, wildlife and livestock (USDA-NRCS 1998). WithinEBMUD watersheds, these nutrients originate primarily fromlivestock and wild animals. This can lead to nutrient andpathogen pollution, especially if livestock concentrate in ornear streams. The result is undesirable water flavor andodor. The compounds resulting from such deposition canalso present a problem to human health and aquatic life.
Concern for the risk of nutrient pollution of municipal rawwaters by direct deposit of excreta into open water is high,particularly since FC is an indicator of potential pathogenpresence and may increase in runoff during grazing (U.C.Davis 1998).
Studies have documented that pathogens present in fecesof livestock can increase fecal coliform (FC) andstreptococci (FS) in streams by direct deposition (Binkleyand Brown 1993). Since FC represent from 93% to 98%of total coliforms excreted by livestock and othermammalian vertebrates, the greater the number of grazinglivestock in a watershed, the higher the level of FC in runoffwaters. FC concentrations in water tend to be higher underdeferred-rotation than continuous grazing (Skinner, et al.1984). Furthermore, research has shown that FC is highestwith heaviest grazing, intermediate under moderate grazing,and lowest with no grazing (Tiedemann 1987). However,levels of fecal coliform in stream flow appear to be moreclosely related to watershed characteristics that determinewhere livestock are likely to congregate than to stockingrates. Intensity and season of grazing can also have aninfluence on potential bacterial contamination of water.
A survey of 272 water supply utilities in the U.S. conductedby the American Water Works Association in 1991 found

Section 2GRAZING ANDWATER QUALITY
2 - 14
RRRRR A N G EA N G EA N G EA N G EA N G E
RRRRRESOURCEESOURCEESOURCEESOURCEESOURCE
MMMMMANAGEMENTANAGEMENTANAGEMENTANAGEMENTANAGEMENT
PPPPP L A NL A NL A NL A NL A N
that grazing occurred on 52% of the involved watersheds.However, there is very little scientific evidence linkinglivestock with Cryptosporidiosis in humans. Millions ofmunicipal water customers, including those of EBMUD,have been served for decades without water supply-linkedoutbreaks of Cryptosporidium in California. Nonetheless,as outlined in Section 3 2.6 & 2.8 the District is taking anaggressive, proactive approach to preventing this type ofcontamination.
2.5 Water Quality Protection
The EBMUD water quality management program focuses onactivities that will encourage control of contaminant sources.Accordingly, the East Bay Watershed Master Plan stipulates thataggressive protection and management of source water quality beimplemented to maintain high quality of water in District reservoirs.The NRCS has identified a series of BMP�s that support theprotection of both water quality and rangeland habitats. Whenapplied to water quality protection, a BMP is a practice orcombination of practices determined by the State of California tobe the most effective and practicable means of controlling pointand nonpoint pollutants at levels compatible with environmental[water] quality goals.
The East Bay Watershed Master Plan gives specific guidancethat contaminant sources �be identified and quantified beforedeveloping management and control strategies and prioritizingimplementation�. Areas grazed by livestock and of known highsoil erosion hazard and of high vulnerability as potential watercontaminant sources should receive high priority for protection,particularly in the San Pablo, Briones and San Leandro reservoirwatersheds.
A Best Management Practice (BMP)�is a practice or combination ofpractices that is determined by a stateto be the most effective means ofpreventing or reducing the amountof pollution generated by nonpointsources to a level compatible withwater quality goals.� (Federal CleanWater Act, 1977).

Section 2 GRAZING ANDWATER QUALITY
2 - 15
RRRRR A N G EA N G EA N G EA N G EA N G E
RRRRRESOURCEESOURCEESOURCEESOURCEESOURCE
MMMMM ANAGEMENTANAGEMENTANAGEMENTANAGEMENTANAGEMENT
PPPPP L A NL A NL A NL A NL A N
2.5.1 Site Conservation Thresholds
A minimum vegetative cover of 65% to 75% is required tomaintain soil stability and water quality. To ensure optimalprotection of the raw municipal water supply in Districtreservoirs objective minimal standards or �site conservationthresholds� (SCTs) for watershed grazing management havebeen adopted. These minimum standards are based on140% of the amended minimal residual dry-matter (RDM)standards developed by the USDA Soil ConservationService and are as follows:
� Gentle slopes of from 0-5% should have a minimumof 840 lbs. per acre.
� Moderate slopes of 6-35% should have a minimumof 1,120 lbs. per acre.
� Steep slopes having over 35% grade should have aminimum of 1,400 lbs. per acre.
This cover is critical on the steeper slopes to maintain soil
Figure 2-1: Basic Components of Livestock NPS Water PollutionControl Planning
RESOURCEPROGRAM
COORDINATIONMANAGEMENT
PRACTICESELECTION
MANAGEMENTPRACTICE
IMPLEMENTATION
CONTAMINANTSOURCE
LOCATION

Section 2GRAZING ANDWATER QUALITY
2 - 16
RRRRR A N G EA N G EA N G EA N G EA N G E
RRRRRESOURCEESOURCEESOURCEESOURCEESOURCE
MMMMMANAGEMENTANAGEMENTANAGEMENTANAGEMENTANAGEMENT
PPPPP L A NL A NL A NL A NL A N
stability, on gentle slopes to act as a filter for sediments, onflood plains to protect soil during winter storms, and on allslopes to promote effective capture, storage and release ofwater.
2.6 Management Measures and Best ManagementPractices
Management Measures (MM) identify goals for management andcontrol of NPS pollution and protection and enhancement ofrangeland biological resources for a state, watershed, or ranch.Linked to each Management Measure are a series of BestManagement Practices. The BMP�s support the protection of bothwater quality and rangeland habitat biodiversity goals and objectives.
BMP�s are practices applied alone or in combinations to addressspecific Management Measures. All BMP�s have been determinedby the State of California to be the most effective and practicablemeans of controlling point and nonpoint pollutants at levelscompatible with environmental [water] quality goals. The NaturalResource Conservation Service (NRCS) Best ManagementPractices are described in Table 3-1 in Appendix A. Specificdescriptions of each BMP can be accessed through the USDAweb sites at http://www.ftw.nrcs.usda.gov/nhcp_2.html for federalstandards, and at http://www.ca.nrcs.usda.gov/rts/sec4.htm forCalifornia-specific practices.
Management Measures 1, 2, and 3 (listed below) relate to NPSpollution management, measures 4, 5, and 6 relate to habitatmanagement for animal and plant species of concern, includingdomestic livestock and forage plants as components of theecosystem, and 7 and 8 refer to the protection and preservation ofsensitive cultural and visual resources.
1) Minimize delivery of sediment from grazed rangeland,pastureland and cropland to surface waters.
2) Collect solids and reduce contaminant concentrationsand runoff from confined animal facilities.
3) Protect sensitive areas on grazing lands to reduce physicaldisturbance and direct loading into water of animal wasteand sediment caused by livestock.

Section 2 GRAZING ANDWATER QUALITY
2 - 17
RRRRR A N G EA N G EA N G EA N G EA N G E
RRRRRESOURCEESOURCEESOURCEESOURCEESOURCE
MMMMM ANAGEMENTANAGEMENTANAGEMENTANAGEMENTANAGEMENT
PPPPP L A NL A NL A NL A NL A N
4) Protect and enhance riparian and aquatic habitat fornative plants, animals and fisheries, including residentand anadromous species.
5) Protect and enhance upland habitat for managementpriority plant and animal species.
6) Manage livestock and grazable rangeland in a mannerthat will protect biodiversity and maintain soil andvegetation productivity.
7) Protect and preserve sensitive cultural resources.
8) Ensure that valuable and rare visual resources areprotected from degradation.
These measures apply to all EBMUD rangelands and can beachieved by identifying and implementing the appropriatemanagement practices individually or in combination that apply tospecific potential impacts on individual allotments. The EBWMPstipulates that aggressive protection and management of sourcewater quality be implemented to maintain high water quality in Districtreservoirs. Grazing to accomplish multiple resource managementobjectives must therefore be prescribed on a site-specific, field-by-field, allotment basis. Section 5, Allotment Management Plansand Tenant Selection, describes the details required to manage eachallotment.
2.7 Water Quality Control Measures
When developing watershed management plans to control nonpointsource pollution, it is critical to ascertain if existing raw water ismeeting water quality standards by establishing an initial set of waterquality measurements. These baseline conditions allow subsequentevaluation of the effectiveness of best management practices (BMPs)through monitoring of implementation activities. Baseline pollutantlevels are established by examining all existing water analysis recordsfor the tributaries and reservoirs, as well as available water qualityinformation outside of the water utility itself.
For reference, please see Appendix A, Table 3-2 BackgroundSurface Water Quality of Comparable Grazed Rangeland

Section 2GRAZING ANDWATER QUALITY
2 - 18
RRRRR A N G EA N G EA N G EA N G EA N G E
RRRRRESOURCEESOURCEESOURCEESOURCEESOURCE
MMMMMANAGEMENTANAGEMENTANAGEMENTANAGEMENTANAGEMENT
PPPPP L A NL A NL A NL A NL A N
Watersheds of Coastal California presents a summary of data forbackground surface water quality of grazed rangeland. Also in App.A, see Table 3-3 Preliminary Baseline and Proposed MaximumContaminant Level Goals for Seven Water Quality Parameters,EBMUD Grazed Watersheds.
Total maximum daily load (TMDL) protocols are currently beingdeveloped by the EPA. When available, they will be used asminimum operating parameters for the protection of aquaticorganisms, especially fish and listed plant and animal species. SeeEBWMP Guidelines WQ.4, WQ.17, WQ.19, and WQ.20 inAppendix C.
Data for Cryptosporidium and Giardia are not widely available,since raw water assessments have been conducted only in recentyears. In an effort to gather data from an uncontrolled source,EBMUD (1998) conducted monitoring of 60 feral pigs and foundno Cryptosporidium and little Giardia in the samples.
2.8 Protection of Water Quality on EBMUD Lands
Livestock grazing, using traditional methods and grazing levels, canoften negatively impact water quality for municipal water supplies.However, under reasonable management, detrimental effects maybe controlled within acceptable levels to improve downstreambeneficial uses of water.
2.8.1 Control of NPS
On EBMUD rangelands designated for grazing under a multiple-use resources management plan, control of nonpoint source pollutionof water by sediment, nutrients and fecal contaminants will beaccomplished by implementing a light to moderate grazing program.Avoiding high stock density for longer periods of time and localizedconcentration of livestock will be a primary component of the grazingprogram. Both the Grazing Leases and Allotment ManagementPlans specify in detail grazing standards, water quality pollutioncontrol measures, and resource protection measures.
The impact of livestock on watershed is a controllable factorinfluencing NPS pollution of municipal source waters. Inflow watersfrom livestock range on EBMUD watersheds have not negatively

Section 2 GRAZING ANDWATER QUALITY
2 - 19
RRRRR A N G EA N G EA N G EA N G EA N G E
RRRRRESOURCEESOURCEESOURCEESOURCEESOURCE
MMMMM ANAGEMENTANAGEMENTANAGEMENTANAGEMENTANAGEMENT
PPPPP L A NL A NL A NL A NL A N
impacted reservoir waters. Prior to this RRMP, sampling intensityof rangeland tributaries and both baseline and maximum contaminantlevels, or goals (MCLG), had not been established as per AppendixA, Table 3-3. The American Water Works Association reportedthat 61% of State drinking water agencies use ambient water qualitycriteria for effective watershed control.
� Residual Dry Matter (RDM)
RDM refers to the amount of forage plant material remainingon the range in the fall following spring and summer grazing.RDM is composed of the mulch residue, litter or dried plantmaterial that is left standing or on the ground, from theseason�s current growth. It does not include unpalatableforbs or weeds, woody plants, new green growth or dung(Point Reyes 1990). RDM is an important constituent inprotecting soil form erosion, improving soil fertility, structureand infiltration rate, and in providing beneficial surfaceconditions for plant growth (U.C. Davis 1998).
Assessments of EBMUD�s rangelands have been madeover the past several decades through evaluations thatmeasure the capability of the land�s current abundance,diversity, and vigor of the plant community it supports. Theresults are then compared to the theoretical potential for agiven site or habitat. Range condition is rated as excellent,good, fair or poor, and trends or change in condition issubjectively and objectively estimated. Some factors thatdetermine range condition include types and numbers ofdifferent plant species, plant vigor, reproduction, age class,soil erosion, litter cover and other site factors. Estimationsof ground cover (%), residual dry matter (RDM, lb.) andspecies composition are useful and reliable techniques forevaluating range health that are used routinely on EBMUDrangelands.
� RDM Standards: Heavy, Moderate and Light
In the EBWMP EIR, The University of CaliforniaCooperative Extension provided reccomendations forRDM levels for EBMUD lands. However, EBMUDdeveloped RDM standards that exceed (2x) the U.C.standards. These standards are listed in table 2.3 for

Section 2GRAZING ANDWATER QUALITY
2 - 20
RRRRR A N G EA N G EA N G EA N G EA N G E
RRRRRESOURCEESOURCEESOURCEESOURCEESOURCE
MMMMMANAGEMENTANAGEMENTANAGEMENTANAGEMENTANAGEMENT
PPPPP L A NL A NL A NL A NL A N
comparison.
EBMUD determined that the upper threshold formoderate grazing has been reached when RDM levelsmeasure 900-1,400 lbs./ac, adjusted for slope. Lightgrazing is defined as rangelands with RDM levels greaterthan District standards, and heavy grazing as rangelandswith RDM�s below these standards. Particularconsideration must be given to controlling access bylivestock, especially females with nursing young, to openwater and associated riparian zones. Late spring and earlysummer grazing may present the least risk to watercontamination. See EBWMP Guidelines WQ.7, WQ.35,LG.7, and LG.11 in Appendix C.
Table 2-3. Heavy, Moderate and Light Grazing RDM�s. EBMUDstandards and University of California CooperativeExtensive Standards.
2.8.2 Control of Pathogens and Livestock Waste Concentration
Livestock will be managed to minimize the discharge of protozoanpathogens into the water supply above the natural background levelon EBMUD lands. This will be achieved by controlling access oflivestock to water bodies. The time livestock spend in or very nearwater has a direct influence on both the deposition and re-suspensionof microbes and thus the occurrence and extent of downstreampollution of water. Development of alternate water supplies forcattle can reduce the time animals spent in the stream from 80% to90% (Miner 1992 and Swanson 1994). Controlling access oflivestock to water bodies can mitigate this activity. Unless feces aredeposited in or immediately adjacent to a streambed, there is little
EPOLSyvaeHgnizarG
etaredoMgnizarG
thgiLgnizarG
.E.C.C.U
leveL 048-0 0811-048 +0811 004
etaredoM 0211-0 0751-0211 +0751 006
peetS 0041-0 0591-0041 +0591 008

Section 2 GRAZING ANDWATER QUALITY
2 - 21
RRRRR A N G EA N G EA N G EA N G EA N G E
RRRRRESOURCEESOURCEESOURCEESOURCEESOURCE
MMMMM ANAGEMENTANAGEMENTANAGEMENTANAGEMENTANAGEMENT
PPPPP L A NL A NL A NL A NL A N
danger of significant bacterial contamination from overland flow.For example, under simulated rainfall conditions on grass sodbacterial loads are reduced 95% only seven feet from a fecesdeposit (Swanson 1994). In soil, FC and FS survival varies withenvironmental conditions, from two or three days in the summer tomore than 20 days in winter. Doyle, et al. (1975) found no significantmovement of FC and FS populations or N and P further than 3.8meters (12.3 ft.) from source manure. Buckhouse and Gifford(1976) found that only the fecal patch and surrounding one-meterradius were subject to bacterial pollution and suggested that �unlessfeces are deposited in or adjacent to a streambed, there is littledanger of significant bacterial contamination� [of water].
2.8.3 Riparian Buffers
Use of riparian buffers, or strips of relatively undisturbedvegetation along watercourses is one of the most effectivepractices used to protect water supplies. Overall they arerated as 65% to 70% effective in protecting water quality.They act as pollutant filter strips on slopes up to about20% and can filter from 50% to 90% of the sediment,nitrogen and phosphorus and bacterial concentrations insurface runoff except in flood years. To insure protectionof terminal reservoir water quality, fenced buffer strips ofapproximately 100 feet width are being implemented in aphased priority program as a District standard.
The criteria used to develop creek protection priorities are:
1. Water quality;2. Habitat protection for endangered species; and3. Habitat protection for other listed species.
Following these guidelines, over the past several years,EBMUD has fenced out all the major tributary creeks thatfaced potenial impacts from grazing. Thus the creek riparianresources have been protected through this measure.
See EBWMP Guidelines WQ.20, WQ.25, LG.1 and LG.7in Appendix C.
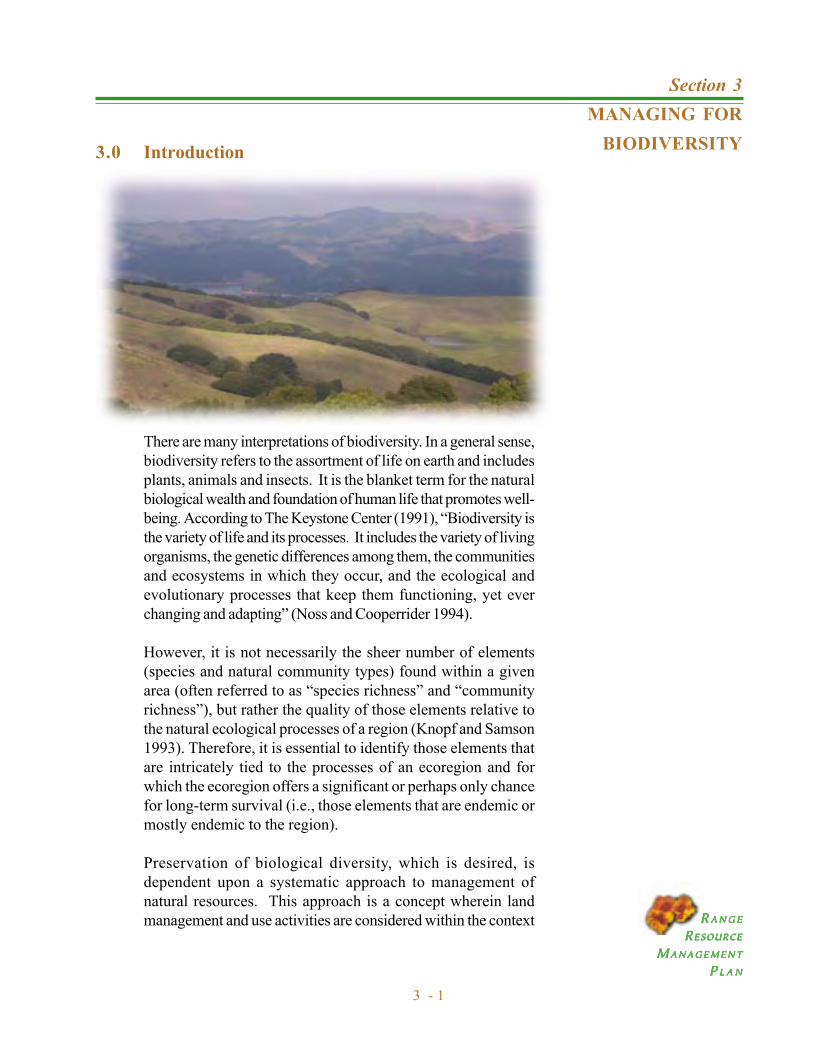
Section 3MANAGING FOR
BIODIVERSITY
3 - 1
RRRRR A N G EA N G EA N G EA N G EA N G E
RRRRRESOURCEESOURCEESOURCEESOURCEESOURCE
MMMMM ANAGEMENTANAGEMENTANAGEMENTANAGEMENTANAGEMENT
PPPPP L A NL A NL A NL A NL A N
3.0 Introduction
There are many interpretations of biodiversity. In a general sense,biodiversity refers to the assortment of life on earth and includesplants, animals and insects. It is the blanket term for the naturalbiological wealth and foundation of human life that promotes well-being. According to The Keystone Center (1991), �Biodiversity isthe variety of life and its processes. It includes the variety of livingorganisms, the genetic differences among them, the communitiesand ecosystems in which they occur, and the ecological andevolutionary processes that keep them functioning, yet everchanging and adapting� (Noss and Cooperrider 1994).
However, it is not necessarily the sheer number of elements(species and natural community types) found within a givenarea (often referred to as �species richness� and �communityrichness�), but rather the quality of those elements relative tothe natural ecological processes of a region (Knopf and Samson1993). Therefore, it is essential to identify those elements thatare intricately tied to the processes of an ecoregion and forwhich the ecoregion offers a significant or perhaps only chancefor long-term survival (i.e., those elements that are endemic ormostly endemic to the region).
Preservation of biological diversity, which is desired, isdependent upon a systematic approach to management ofnatural resources. This approach is a concept wherein landmanagement and use activities are considered within the context

Section 3MANAGING FORBIODIVERSITY
3 - 2
RRRRR A N G EA N G EA N G EA N G EA N G E
RRRRRESOURCEESOURCEESOURCEESOURCEESOURCE
MMMMMANAGEMENTANAGEMENTANAGEMENTANAGEMENTANAGEMENT
PPPPP L A NL A NL A NL A NL A N
of economic, ecological and social interactions and in which theecosystem maintains its composition, function, structure, productivityand community diversity over time (Flick and King 1995). In additionto scientific facts, community values and shared visions are separateyet important components in determining feasible, adaptablemanagement options in ecosystem management (Burnside andRasmussen 1997). Implementation of ecosystem management isspecifically directed by the EBWMP as an objective to maintainand enhance biodiversity on District Lands (EBMUD 1996).
3.1 Biodiversity
Most commonly, discussions of biodiversity consider all theorganisms that interact with each other in an extendedgeographical region. In addition, biodiversity must also addressthe ecological patterns and processes that maintain thatdiversity. Any discussion of biodiversity must be related to thedegree that disturbance regimes remain intact, the functionalintactness of remaining habitat, the presence of the full suiteof native species, and the representation of elements acrosstheir natural range of variability (Grumbine 1994).
The EBWMP (1996) defines biodiversity as �the variety andvariability among living organisms and the ecologicalcomplexes in which they occur�. An important objective of theEBWMP is to maintain and enhance biodiversity on District lands.Successful preservation of biological diversity is dependent uponan ecosystem-based management strategy that will maintain thecomposition, function, structure, productivity, and communitydiversity of natural resources over time. In general, in depauperateareas, light to moderate grazing may produce an increase in speciescomposition, and/or diversity, while heavy grazing may decreasethis richness.
Maintenance and enhancement of species diversity shouldconsider the substantial number of well-adapted and valuableexotic species that are permanent residents in addition to, andoften at the expense of, native species of flora and fauna.According to the EBWMP (1996), the ecological value and likelypermanence of certain nonnative species and habitats must berecognized and their management incorporated into biodiversity

Section 3MANAGING FOR
BIODIVERSITY
3 - 3
RRRRR A N G EA N G EA N G EA N G EA N G E
RRRRRESOURCEESOURCEESOURCEESOURCEESOURCE
MMMMM ANAGEMENTANAGEMENTANAGEMENTANAGEMENTANAGEMENT
PPPPP L A NL A NL A NL A NL A N
planning efforts.
3.1.1 Areas of Significant Biodiversity
Three locally rare habitat types, riparian with associatedwater (ponds, streams,) oak savanna, and nativegrasslands, occur within grazeable areas and are notprotected by topographic isolation. These habitats arepotentially sensitive to grazing.
Table 3-1. Areas of Significant Biodiversity and Sensitive HabitatsWithin Fenced, Grazeable Lands of EBMUD.
WATERSHEDSFEATURES NORTH SOUTH TOTAL
Area of Significant Biodiversity 1,782 1,890 3,672
Riparian Types (acres):
Herbaceous/Bare 101 31 132Mixed Woodland 185 236 421Willow 25 14 39
Oak Savanna (acres) 267 72 339 Streams (miles) Intermittent 79.4 61.1 140.5Perennial 7.6 7.2 14.8 Ponds (number) 77 37 114
Source: EBMUD (1997); unknown portions of features given are included in thearea of significant biodiversity. Fresh water marsh (36 acres) is associatedwith reservoirs or otherwise excluded; an insignificant area occurswithin grazeable land.

Section 3MANAGING FORBIODIVERSITY
3 - 4
RRRRR A N G EA N G EA N G EA N G EA N G E
RRRRRESOURCEESOURCEESOURCEESOURCEESOURCE
MMMMMANAGEMENTANAGEMENTANAGEMENTANAGEMENTANAGEMENT
PPPPP L A NL A NL A NL A NL A N
3.1.2 Riparian
Riparian woodlands occur in ribbon-like bands alongperennial and seasonal streams and rivers. Althoughthis community is comprised primarily of wetlandspecies and accounts for less than one percent ofCalifornia�s total forest acreage, it supports one of themost diverse ecological communities of plants andanimals.
The relative significance of riparian zones to animalbiodiversity is widely recognized and documented.Almost 80% of the wildlife in the West depends onhealthy riparian systems for at least part of their lifecycle. Proportionately high populations and speciesdiversity of birds, small mammals and herpetofaunalive in riparian zones as compared to uplands.
The primary determinants of stable and healthy riparianecosystems are the presence of water and maintenanceof an adequate vegetation corridor, which includes boththe herbaceous and woody canopy. The latter functionsto stabilize soil against erosion, filter sediment, anddissipate stream flow energy. The canopy also providesshade to stabilize water temperature, and supplies thebulk of living and detritus organic matter, whichsupports aquatic life.
3.1.3 Oak Woodlands and Savanna
Oak woodlands and savannas are essential habitat to awealth of organisms. The California coastal oakwoodland community (20-80% canopy) is rich inbiodiversity with more than 262 species of amphibians,birds, mammals and reptiles and hundreds of plantspecies, including forty of special-status.

Section 3MANAGING FOR
BIODIVERSITY
3 - 5
RRRRR A N G EA N G EA N G EA N G EA N G E
RRRRRESOURCEESOURCEESOURCEESOURCEESOURCE
MMMMM ANAGEMENTANAGEMENTANAGEMENTANAGEMENTANAGEMENT
PPPPP L A NL A NL A NL A NL A N
Savanna communities (0-20%) are similar to woodlandsexcept that the trees are more widely spaced and the understory is almost entirely dominated by various species ofgrasses and forbs. Basically, savanna is grassland withscattered individual trees. Climate is the most importantfactor in creating savanna. Savannas are always found inwarm or hot climate where annual rainfall is from about50.8 to 127 cm (20-50 inches) per year.
The survival of live oak (Quercus agrifolia) and valleyoak (Q. lobata) communities on EBMUD lands iscritical to diversity of plants and animals at both thespecies and community levels. The factors than caninfluence oak regeneration includes insects, disease,overgrazing (see section 3.3.4) and wildlife (eating theacorns and seedlings). Also, competition for moisture is aprimary influence on seedling mortality.
3.1.4 Native Grassland
A third area of significant biodiversity is nativegrassland, which is characterized as lands dominatedby grasses rather than large shrubs and trees. Nativeperennial grasses are important to biodiversity for manyreasons. Their deeper root structure cycles morenutrients, stabilizes more soil, and contributes moreorganic matter to soil than annual plants. Green forageis provided for wildlife and livestock in the summerand fall seasons, and the shorter dormant period forperennial grasses shortens the fire season. Native plantsalso add diversity and essential habitat structure to thelocal flora and dependent fauna. Overgrazing, drought,and introduction of European annual grasses areconsidered the primary factors that led to the conversionof native grasslands to annual exotic grasslands in the1800�s.
Remnants of native grasslands with accompanyingnative forbs exist on the EBMUD north and southwatersheds. The presence (or non-presence) of thesegrasses is dependent upon many factors, including grazing.

Section 3MANAGING FORBIODIVERSITY
3 - 6
RRRRR A N G EA N G EA N G EA N G EA N G E
RRRRRESOURCEESOURCEESOURCEESOURCEESOURCE
MMMMMANAGEMENTANAGEMENTANAGEMENTANAGEMENTANAGEMENT
PPPPP L A NL A NL A NL A NL A N
Native grasslands exist in ungrazed as well as grazed areas,which demonstrate some tolerance for livestock grazing.However, native perennial grasses are potentially susceptibleto impacts from intensive grazing regimes.
3.1.5 Special Status Species
Endangered species means a native species orsubspecies of a bird, mammal, fish, amphibian, reptile,or plant, which is in serious danger of becoming extinctthroughout all, or a significant portion, of its range due toone or more causes, including loss of habitat, change inhabitat, overexploitation, predation, competition, or disease(Fish and Game Code Section 2050-2068).
Twenty-nine animal species and ten plant species are ofspecial-status or concern on EBMUD lands (EBWMP1996, FWS 2001). Since the development of theEBWMP, Steelehead have been added to the special statusspecies list and the Canada Goose has been removed.However, the goose is still of special concern and will bemonitored as required by law.
Of the animal species, only six are potentially impacted bylivestock, primarily through the deleterious effects ofmoderate to heavy grazing on their habitats (see tables 3.4and 3.5).
The remaining twenty-three species are mostly carnivorous,insectivorous or raptorial birds. They are primarily wintermigrants that enjoy adequate ungrazed habitat, or grazedhabitat where managed livestock most likely exert eitherinsignificant or possibly benign impacts on their livelihood.
3.2 Grazing and Biodiversity
A vast majority of rangeland forages produced by EBMUDwatersheds for commercial cattle and recreational horses areprovided primarily by portions of the open grasslandcommunities that occur within fenced grazing leases of theDistrict (EBMUD 1997a). These grasslands provide significant
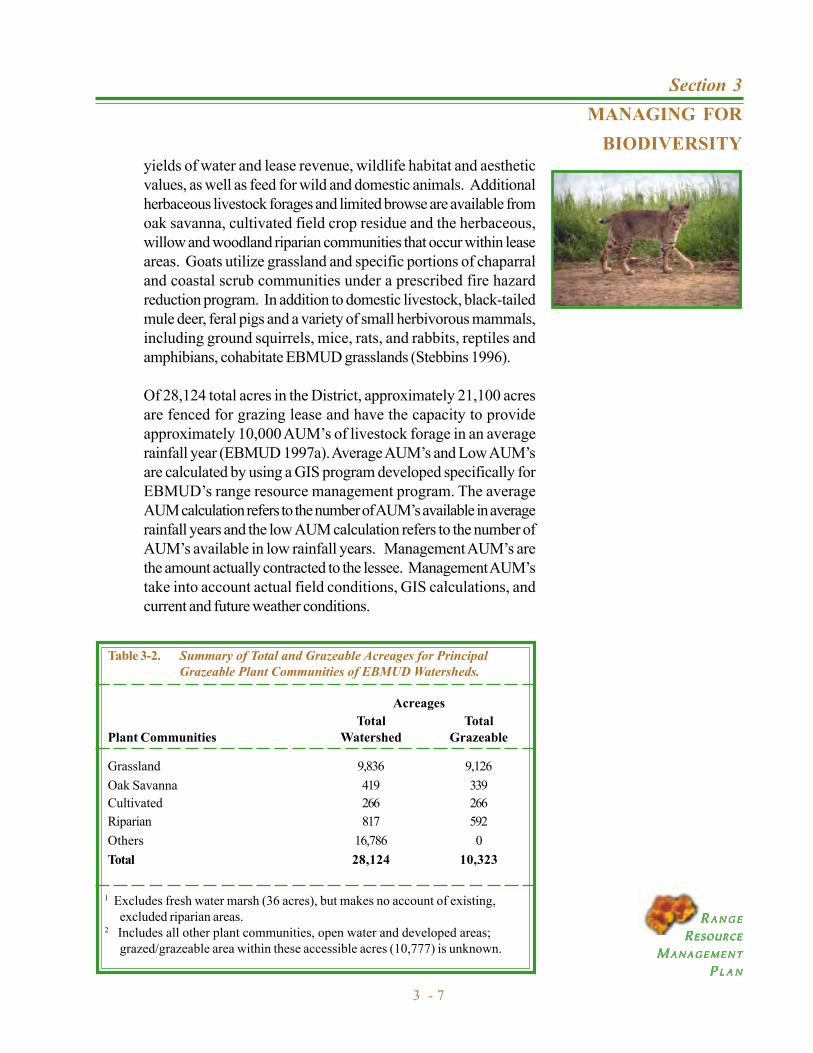
Section 3MANAGING FOR
BIODIVERSITY
3 - 7
RRRRR A N G EA N G EA N G EA N G EA N G E
RRRRRESOURCEESOURCEESOURCEESOURCEESOURCE
MMMMM ANAGEMENTANAGEMENTANAGEMENTANAGEMENTANAGEMENT
PPPPP L A NL A NL A NL A NL A N
yields of water and lease revenue, wildlife habitat and aestheticvalues, as well as feed for wild and domestic animals. Additionalherbaceous livestock forages and limited browse are available fromoak savanna, cultivated field crop residue and the herbaceous,willow and woodland riparian communities that occur within leaseareas. Goats utilize grassland and specific portions of chaparraland coastal scrub communities under a prescribed fire hazardreduction program. In addition to domestic livestock, black-tailedmule deer, feral pigs and a variety of small herbivorous mammals,including ground squirrels, mice, rats, and rabbits, reptiles andamphibians, cohabitate EBMUD grasslands (Stebbins 1996).
Of 28,124 total acres in the District, approximately 21,100 acresare fenced for grazing lease and have the capacity to provideapproximately 10,000 AUM�s of livestock forage in an averagerainfall year (EBMUD 1997a). Average AUM�s and Low AUM�sare calculated by using a GIS program developed specifically forEBMUD�s range resource management program. The averageAUM calculation refers to the number of AUM�s available in averagerainfall years and the low AUM calculation refers to the number ofAUM�s available in low rainfall years. Management AUM�s arethe amount actually contracted to the lessee. Management AUM�stake into account actual field conditions, GIS calculations, andcurrent and future weather conditions.
Table 3-2. Summary of Total and Grazeable Acreages for PrincipalGrazeable Plant Communities of EBMUD Watersheds.
AcreagesTotal Total
Plant Communities Watershed Grazeable
Grassland 9,836 9,126Oak Savanna 419 339Cultivated 266 266Riparian 817 592Others 16,786 0Total 28,124 10,323
1 Excludes fresh water marsh (36 acres), but makes no account of existing,excluded riparian areas.
2 Includes all other plant communities, open water and developed areas;grazed/grazeable area within these accessible acres (10,777) is unknown.

Section 3MANAGING FORBIODIVERSITY
3 - 8
RRRRR A N G EA N G EA N G EA N G EA N G E
RRRRRESOURCEESOURCEESOURCEESOURCEESOURCE
MMMMMANAGEMENTANAGEMENTANAGEMENTANAGEMENTANAGEMENT
PPPPP L A NL A NL A NL A NL A N
Table 3.3 presents a comparison of rangeland animals typically found on theEBMUD watersheds. Evaluation of past, present, and potential grazing impactsand stocking rates may use these kinds of information.
Table 3.3. Approximate or Median Values for Characteristics of TypicalMature Ungulate Rangeland Animals on a Year-Round Basis.
Dietary Preference % Body Head Daily RequirementAnimal Grass Forbs Browse Wt. lb. Per AU Forage, lb. Water, GalHorse 90 1 9 1,100 0.8 15.5 10-14Beef Cow 82 9 9 1,000 1 25 10-18Beef Steer 82 9 9 600 1.7 14 6-10Feral Pig 30 43 27 150 4.5 6.5 1-2Mule Deer 6 7 87 150 4.5 3.8 1-2Sheep 60 17 23 130 5 3.5 1-2Goat 39 13 48 100 6 4.2 1-2
Source: Leach and Hiehle (1957), Malecheck and Leinweber (1972), Heady (1975),Stoddart, et al. (1975), Hubbard and Hansen (1976), Olsen and Hansen(1977), Hansen, et al. (1977), Ensminger and Olentine (1978), Barrett(1978), Bryant, et al. (1979), Kasworm, et al. (1984).
Forage: Air dry weight basis; average, all sexes, activities.
NOTE: Forbs include roots, bulbs; browse includes acorns.
3.3 Impacts on Rangeland Biodiversity
It is commonly believed that heavy livestock grazing has a negativeimpact on rangeland biodiversity, while light to moderate grazingmay increase species composition, and/or diversity. These potentialnegative impacts are primarily the result of �excessive� or �over�grazing. Commercial and recreational domestic livestock impactrangeland vegetation cover and soil surface. The extent of the impactsis a function of the type of animal, the stocking rate, and period ofgrazing. Conversely, there is documentation of proper grazingpractices actually promoting species diversity in certain applications.When annual grasses and other tall-growing plants are grazed back,sunlight can reach the lower-growing ones that would haveotherwise been shaded out. In other situations, grazing benefitssome special-status plants, which reduces competition by associated,palatable plants.

Section 3MANAGING FOR
BIODIVERSITY
3 - 9
RRRRR A N G EA N G EA N G EA N G EA N G E
RRRRRESOURCEESOURCEESOURCEESOURCEESOURCE
MMMMM ANAGEMENTANAGEMENTANAGEMENTANAGEMENTANAGEMENT
PPPPP L A NL A NL A NL A NL A N
The EBWMP specifically states that continuous, year-round grazinghas the potential to degrade biological resource values by damagingwetland, riparian and other sensitive habitats, eliminating sensitiveplant species, and encouraging the spread of noxious weeds. TheEBWMP directs that the grazing program be refocused to reduceimpacts on biodiversity, and that overall livestock numbers bereduced from historical levels to enhance biodiversity on watershedlands.
A number of biologically diverse and sensitive habitats occuroutside grazeable areas and will not be subjected to livestockimpacts. Topographic isolation provides some essential refuge fromimpacts for those areas of significant biodiversity that occur withingrazing allotments. In addition, under direction of the EBWMP,sensitive riparian habitat has been outfenced from grazing, andcontinues to improve in condition and function.
3.3.1 Grazing Impacts and Special Status Species
To date, field surveys have accounted for 10 plant speciesand 29 animal species listed as Federal, State or CNPS-listed, and therefore are classified as special-status specieson EBMUD lands (Stebbins 1996, EBMUD 1996, FWS2001).
No research is available which documents the extirpationof either a plant or an animal species by grazing impacts,although anecdotal evidence exists that certain special-statusspecies are negatively affected by grazing. Examples areprovided by the highly palatable and trampling-sensitiveTrifolium longipes ssp. neurophyllum of Arizona(Ladyman 1995) and Trientalis arctica of California(CNPS 1994). And, heavy livestock grazing and browsingof riparian vegetation nesting habitat has been implicated inthe decline of two listed birds, the yellow-billed cuckoo(Coccyzus Americanus occidentalis) and the least Bell�svireo (Vireo bellii pusillus) (Thelander 1994).
Section 3.4 describes the measures EBMUD has taken toprotect special status species and sensitive habitats.
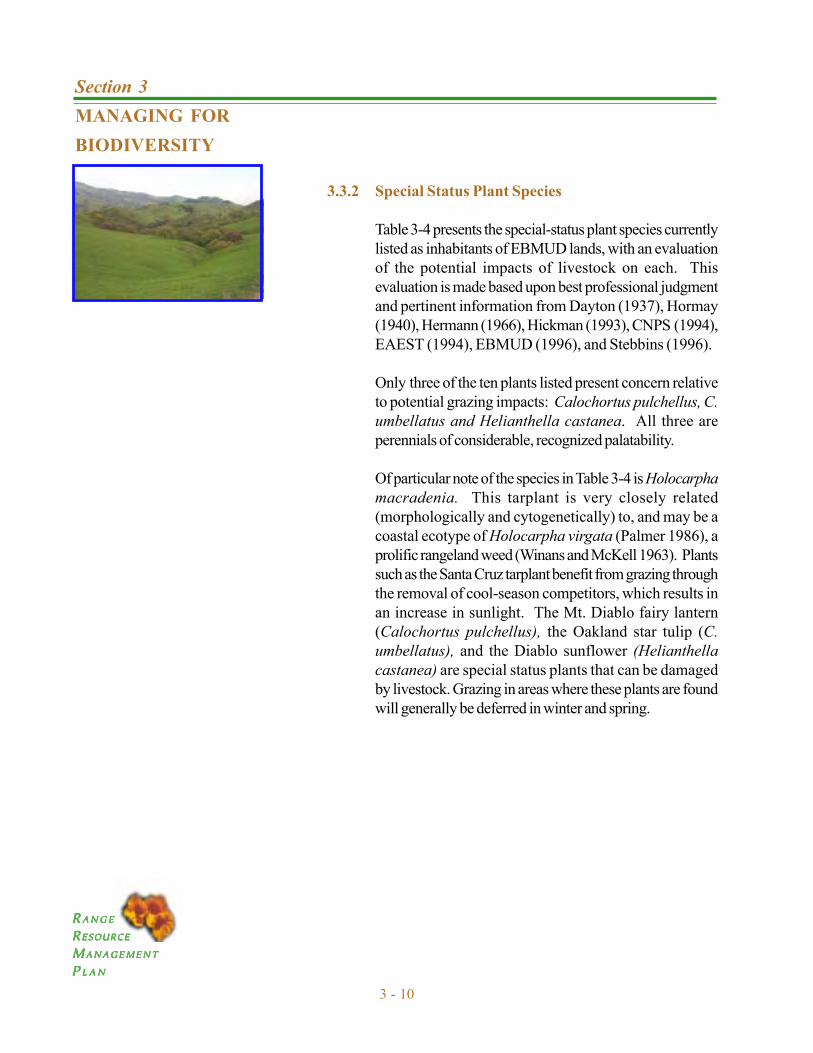
Section 3MANAGING FORBIODIVERSITY
3 - 10
RRRRR A N G EA N G EA N G EA N G EA N G E
RRRRRESOURCEESOURCEESOURCEESOURCEESOURCE
MMMMMANAGEMENTANAGEMENTANAGEMENTANAGEMENTANAGEMENT
PPPPP L A NL A NL A NL A NL A N
3.3.2 Special Status Plant Species
Table 3-4 presents the special-status plant species currentlylisted as inhabitants of EBMUD lands, with an evaluationof the potential impacts of livestock on each. Thisevaluation is made based upon best professional judgmentand pertinent information from Dayton (1937), Hormay(1940), Hermann (1966), Hickman (1993), CNPS (1994),EAEST (1994), EBMUD (1996), and Stebbins (1996).
Only three of the ten plants listed present concern relativeto potential grazing impacts: Calochortus pulchellus, C.umbellatus and Helianthella castanea. All three areperennials of considerable, recognized palatability.
Of particular note of the species in Table 3-4 is Holocarphamacradenia. This tarplant is very closely related(morphologically and cytogenetically) to, and may be acoastal ecotype of Holocarpha virgata (Palmer 1986), aprolific rangeland weed (Winans and McKell 1963). Plantssuch as the Santa Cruz tarplant benefit from grazing throughthe removal of cool-season competitors, which results inan increase in sunlight. The Mt. Diablo fairy lantern(Calochortus pulchellus), the Oakland star tulip (C.umbellatus), and the Diablo sunflower (Helianthellacastanea) are special status plants that can be damagedby livestock. Grazing in areas where these plants are foundwill generally be deferred in winter and spring.

Section 3MANAGING FOR
BIODIVERSITY
3 - 11
RRRRR A N G EA N G EA N G EA N G EA N G E
RRRRRESOURCEESOURCEESOURCEESOURCEESOURCE
MMMMM ANAGEMENTANAGEMENTANAGEMENTANAGEMENTANAGEMENT
PPPPP L A NL A NL A NL A NL A N
Table 3-4. Special-Status Plant Species of EBMUD Lands andPotential Impacts of Livestock Grazing.
SPECIES POTENTIAL FOR IMPACTS
Amsinckia lunaris LOW: Annual herb, bristly-hairy; habitat:(Bent-flowered fiddleneck) grassland; genus of limited palatability1 to cattle
and goats (10%) only in seedling stage; negligibleimpact by horses; Briones and Lafayettewatersheds; no grazing threat given by CNPS.
Arctostaphylos pallida NONE: Evergreen shrub, rigid foliage; habitat:chaparral or wooded areas; genus (Pallidmanzanita) unpalatable (0%) to cattle and horses,sparingly used by goats; communities generally inareas unsuitable or inaccessible to livestock; onepopulation, USL watershed; no grazing threat givenby CNPS.
Calochortus pulchellus MODERATE: Bulbous, glabrous herb; habitat:grassland, chaparral, woodland; genus of 20-30%
(Mt. Diablo fairy lantern) palatability, early foliage; highest use by goats, and least by horses; both species occur on rocky ridge,Calochortus umbellatus USL watershed; C. pulchellus and other species(Oakland star-tulip) threatened by grazing(CNPS); monitoring of grazing
impact and management or protection justified.
Circium andrewsii LOW: Biennial herb, cobwebby, spiny; habitat:(Franciscan thistle) upland wooded riparian; genus 0-10% palatable,
primarily to horses, cattle; one population in SanPablo watershed; grazing impact uncertain, maybe benign; no grazing threat given by CNPS.
Dirca occidentalis NONE: Deciduous shrub; habitat: shaded upland(Western leatherwood) forest and riparian; palatability unknown but
unlikely; occurs in San Pablo watershed inlocalized areas unsuitable for livestock use; nograzing threat given by CNPS.
Helianthella castanea MODERATE: Perennial herb from a tap root;(Diablo sunflower) habitat: grassland and associated woodland,
chaparral; genus of low (10%) to fair (30%)palatability for cattle and horses to good (40%) forgoats, flowers relished; widely found in Pinole,San Pablo, USL watersheds; threatened by grazing(CNPS); monitoring of grazing and management orprotection justified.

Section 3MANAGING FORBIODIVERSITY
3 - 12
RRRRR A N G EA N G EA N G EA N G EA N G E
RRRRRESOURCEESOURCEESOURCEESOURCEESOURCE
MMMMMANAGEMENTANAGEMENTANAGEMENTANAGEMENTANAGEMENT
PPPPP L A NL A NL A NL A NL A N
Table 3-4. Special-Status Plant Species of EBMUD Lands andPotential Impacts of Livestock Grazing. (Continued)
SPECIES POTENTIAL FOR IMPACTS
Holocarpha macradenia NONE: Annual herb, glandular, scented; habitat:(Santa Cruz tarplant) grassland; genus of very low palatability (<10%)
only as a seedling; one population in SatherCanyon, San Pablo watershed; could be favoredby grazing of competition; no grazing threat givenby CNPS.
Juglans californica NONE: Deciduous tree; habitat: riparian woodland;no documented palatability of genus to livestock;
var. Hindsii habitats; one population in Kaiser Creek, USL(California black walnut) watershed; no grazing threat cited by CNPS.
Monardella antonina NONE: Perennial herb; hairy, odoriferous; habitat:ssp. antonina woodland, chaparral; very lowpalatability except(San Antonio monardella) to goats; woodland, occurs outside of grazing lease
area; no grazing threat to Monardella spp. givenby CNPS.
1The relative degree to which a plant is selectively eaten under moderate
stocking rate as % by weight of current foliage.
3.3.3 Riparian Habitat
Improper livestock grazing and browsing of riparianvegetation, with the associated trampling of streambanks, can affect stream channel morphology, shapeand quality of the water column, and structure of thesoil portion of the stream bank. Heavy grazingdecreases riparian vegetation and can impair waterquality, but increases water temperature and streambottom fine sediments. This in turn decreases desirable,native aquatic organisms, particularly salmonid fishes,as well as terrestrial wildlife dependent on riparianhabitat.
Any amount of grazing, particularly at high intensity(stocking rate) for short periods when riparian soils arewet, will result in serious damage. Furthermore, exposure

Section 3MANAGING FOR
BIODIVERSITY
3 - 13
RRRRR A N G EA N G EA N G EA N G EA N G E
RRRRRESOURCEESOURCEESOURCEESOURCEESOURCE
MMMMM ANAGEMENTANAGEMENTANAGEMENTANAGEMENTANAGEMENT
PPPPP L A NL A NL A NL A NL A N
of riparian zones to summer and fall grazing during the dry,warm season will invariably result in livestock concentrationand damage where water, shade and green forage areavailable. The traditional practice of creating �riparianpastures� is not applicable to District watersheds in whichprotection of municipal reservoir source waters are ofconcern.
Section 3.4.3 describes the measures EBMUD has takento protect riparian habitat. Specific management measuresare identified in the AMP�s (appendix K) for each allotment.
3.3.4 Oak Woodland and Savanna
Although palatability of live oak and valley white oakis rated as �poor to useless� for cattle and horses,livestock eat acorns, oak foliage and seedlings, and cantrample young trees. Overgrazing by livestock canaffect oak reproduction and can cause rapid breakdownof fallen branches and leaf litter. Important to nativefauna, these potential negative impacts can provide asensitive measure for biodiversity goals in oakwoodlands and savanna.
Section 3.4.7 describes the measures EBMUD has takento protect oak woodland and savannah habitats.
3.3.5 Special Status Animal Species
Table 3-5 presents a summary of the potential impacts oflivestock on habitat alteration and management of the sixanimal species of concern. This evaluation is made basedupon information from Reiser and Bjornn (1979), Platts(1981), Jones & Stokes (1989, 1991), Kie and Loft(1990), USFWS (1990, 1991, 1994, 1996, 1997),Thelander (1994), Jennings and Hayes (1994), Stebbins(1996), EBMUD (1996, 1997), CDFG (1997).
Section 3.4.8 describes the measures EBMUD has takento protect special status animal species.

Section 3MANAGING FORBIODIVERSITY
3 - 14
RRRRR A N G EA N G EA N G EA N G EA N G E
RRRRRESOURCEESOURCEESOURCEESOURCEESOURCE
MMMMMANAGEMENTANAGEMENTANAGEMENTANAGEMENTANAGEMENT
PPPPP L A NL A NL A NL A NL A N
Table 3.5. Summary of the Potential Impacts of Livestock on Habitats of SixSpecial-Status Animal Species that occur within EBMUD Watershed Lands.
SPECIES POTENTIAL IMPACTS
NONE: Significant beneficial effect on feeding/pasturing winter habitat November-February.No apparent adverse impacts on roosting/resting wintering habitat of open water, shorelineand open, green fields since geese are benefitedby short cover while avoiding raptorial andterrestrial predators. Livestock not adisturbance factor; moderate grazing by cattleto promote young, palatable green herbaceousfoliage for migrating adult geese is desirable ongrasslands. Found and monitored by USFWSand EBMUD Fisheries and Wildlife Dept. inPinole and San Pablo watersheds.
Clemmys marmorata HIGH: Potentially significant adverse impacton nesting (burrowing) habitat within one-quarter mile of feeding habitats in perennial,slow or quiet water. Frequent livestock grazingor trampling activity on southerly slopes withheavy soils is detrimental to nesting andincubation April-September. All ages dependenton shallow water with submergent plants andinsect prey; tolerant of dense and sparse riparianplant cover. Complete exclusion or defermentof grazing of critical habitat April-November mayprovide optimal protection for aquatic andnesting habitats. Present in all Districtwatersheds.
LOW: Insignificant effects of grazing sinceprimary whipsnake habitats of steeper (>30%slope) chaparral, coastal scrub and rockoutcrops are unsuitable or little used by cattleand horses. Minor potential and possiblybenign impact on marginal upland savanna andriparian habitats of cohabitation. Nodocumented negative impact of livestock on thespecies or its habitat, although brushlandbrowsing and trampling activities of goatssuggest potential harm during period ofwhipsnake activity April-November. Found inboth north and south watersheds.
(Western Pond Turtle)
Masticophis lateralisssp. euryxanthus(Alameda whipsnake)
Branta canadensisssp. leucopareia(Aleutian Canada goose)

Section 3MANAGING FOR
BIODIVERSITY
3 - 15
RRRRR A N G EA N G EA N G EA N G EA N G E
RRRRRESOURCEESOURCEESOURCEESOURCEESOURCE
MMMMM ANAGEMENTANAGEMENTANAGEMENTANAGEMENTANAGEMENT
PPPPP L A NL A NL A NL A NL A N
SPECIES POTENTIAL IMPACTS
Oncorhynchus mykiss HIGH: Significant negative effects of heavygrazing(steelhead/rainbow trout) and browsingon stream morphology, riparian habitat and waterquality potentially resulting in inadequate streambank herbaceous and woody canopy cover, andexcessively high water temperature (>58oF),turbidity (>25NTU), stream bottom finesediments, and possibly low dissolved oxygencontent (<6.5 mg/l) for migration, spawning andrearing of young. Deteriorated habitat shouldbe protected from livestock; light grazing in thelate spring (only) may be possible with minimalimpacts on healthy stream riparian habitat underoptimal and controlled conditions. Species foundin Pinole and USL watersheds.
Phrynosoma coronatum LOW: Most likely insignificant adverse impacts;(California horned lizard) No negative impacts of livestock are suggested
by authorities.1 Inhabits primarily dry sites of
loose, sandy soils, thin or open herbaceous andshrubby plant cover less likely to be grazed.Active April-July.
MODERATE: Negetive cumulative impacts oftrampling, heavy grazing and browsing onessential breeding and sheltering habitat,including emergent aquatic plants and denseriparian herbaceous and willow cover of stockponds and pools of slow-moving streams. Partialpermanent protection from livestock or extendeddeferment of use from fall through mid-spring isdesirable for recovery of depleted stream habitatand optimal protection during the breedingperiod. Species is tolerant of light to moderategrazing which will maintain habitat for the frogand its prey base up to a mile from permanentopen water. Found in Pinole Creek watershed andSan Pablo, USL, and Chabot watersheds.
1 State CSC, but no information available from E. Loft, J. Brode
of CDFG, Sacramento.
Table 3.5. Summary of the Potential Impacts of Livestock onContinued.
Rana aurorassp. Draytonii(California red-legged frog)

Section 3MANAGING FORBIODIVERSITY
3 - 16
RRRRR A N G EA N G EA N G EA N G EA N G E
RRRRRESOURCEESOURCEESOURCEESOURCEESOURCE
MMMMMANAGEMENTANAGEMENTANAGEMENTANAGEMENTANAGEMENT
PPPPP L A NL A NL A NL A NL A N
3.4 Managing for Biodiversity
Livestock grazing and rangeland practices that pertain to waterquality protection also apply to habitat protection, maintenance andenhancement of biological resources. This relationship is particularlytrue for riparian and aquatic habitats when livestock access isexcluded by establishing buffer zones, and by the development ofalternate upland stock water supplies. Prescribed grazing, exclusionof livestock use, and fencing provide control of location and timingof livestock impacts, and are commonly used to protect and enhanceplant and animal diversity. In addition to these practices, theestablishment of proper stocking rates and judicious monitoringform the basis for biological resource management on grazedwatershed lands.
The EBWMP identifies high-priority sites for habitat restorationbased primarily on water quality protection and the value ofrestored habitats as important wildlife use areas and corridors.It also directs that habitat for threatened and endangered speciesbe enhanced as financially feasible. Prior to implementationof specific protection measures the life history, habitatrequirements, potential impact of livestock, and specificlocation of a management priority species must be thoroughlyinvestigated. See EBWMP Guidelines BIO.8, BIO.9, BIO.21,Bio.22, LG.1, LG.6, and Tables 2-5 and 2-6 in Section 2.
3.4.1 Management Measures and Best ManagementPractices
Management measures identify goals to control NPSpollution and protect rangeland biological resources.Linked to each Management Measure are a series of BestManagement Practices (BMP). The BMP�s support theprotection of both water quality and rangeland habitatbiodiversity goals. A complete list of BMP�s are in AppedixA.
BMP�s are practices applied alone or in combinations toaddress specific Management Measures. All BMP�s havebeen determined by the State of California to be the mosteffective and feasible means of controlling point and nonpoint

Section 3MANAGING FOR
BIODIVERSITY
3 - 17
RRRRR A N G EA N G EA N G EA N G EA N G E
RRRRRESOURCEESOURCEESOURCEESOURCEESOURCE
MMMMM ANAGEMENTANAGEMENTANAGEMENTANAGEMENTANAGEMENT
PPPPP L A NL A NL A NL A NL A N
pollutants at levels compatible with environmental waterquality goals.
Measures 1, 2, and 3 (listed in section 2.5) relate to NPSpollution management, measures 4, 5, and 6 relate to habitatmanagement for animal and plant species of concern,including domestic livestock and forage plants ascomponents of the ecosystem, and 7 and 8 refer to theprotection and preservation of sensitive cultural and visualresources.
The measures apply to all EBMUD rangelands and canbe achieved by identifying and implementing theappropriate BMP�s individually or in combination thatapply to specific potential impacts on individualallotments.
3.4.2 Biological Monitoring
A biological survey program has been established tomonitor and track both flora and fauna on EBMUDlands. The program�s main goal is to provide a scientificbasis for arriving at land management decisionsincluding grazing levels that may affect the District�splant communities and wildlife.
Nearly 300 species of vertebrate animals and 684species of flora have been identified as present orexpected on EBMUD watersheds. Ten plant speciesand twenty-nine animal species are Federal, State orCNPS-listed and are thereby stipulated as special-statusspecies. These and numerous locally rare, indicator andkeystone species are referred to as �management priorityspecies�. In some situations, light to moderate grazing ofterrestrial grassland habitats can favor plant diversity andmay not have significant negative impacts on diversity ofassociated vertebrate wildlife.
Identification of areas of significant biodiversity is directedin the EBWMP. These areas are surveyed and mappedand the data is stored in a GIS. The GIS includes key

Section 3MANAGING FORBIODIVERSITY
3 - 18
RRRRR A N G EA N G EA N G EA N G EA N G E
RRRRRESOURCEESOURCEESOURCEESOURCEESOURCE
MMMMMANAGEMENTANAGEMENTANAGEMENTANAGEMENTANAGEMENT
PPPPP L A NL A NL A NL A NL A N
habitats of high biological value, special-status plants andanimals and is used as an aid in the protection andmanagement of these areas.
3.4.3 Protection of Sensitive Habitats
In general, light to moderate grazing of grassland, oakwoodland and savanna habitats can potentially promoteplant and associated vertebrate wildlife diversity.Preservation of good vegetative cover is achieved byusing light to moderate grazing or by resting pastures. Incertain situations, water quality goals rather than promotionof species diversity dictate the grazing regime. For example,if a higher vegetation coverage is required on slopes toprevent increased erosion, but reduced vegetation on thesame site would promote perenial grasses, water qualitygoals will prevail.
Direction for the Identification, protection and managementof these areas is contained in the EBWMP water qualitygoals section. See EBWMP Guidelines LG.1, LG.6, andLG.11.
3.4.4 Protection of Riparian Habitat
For high quality aquatic habitat and productivity,livestock management must provide for maintenanceof streamside (or pond) canopy and bank vegetation toavoid an unacceptable increase of water temperatureand to provide food and cover for wildlife.
Complete protection of riparian/aquatic habitat is mostcompatible with fisheries habitat maintenance andenhancement. To protect stream reaches, EBMUD out-fences the riparian habitat along streams and creeks.Fencing from 80 to 100 feet from the centerline of a creek,creates a �buffer zone� to moderate temperatures, providesfood for aquatic invertebrates and reduces siltation andelevated nutrient loads. In the fall, vegetation will beadequate to provide for sediment filtering.
Fencing is complete along Oursan Creek, which flows into

Section 3MANAGING FOR
BIODIVERSITY
3 - 19
RRRRR A N G EA N G EA N G EA N G EA N G E
RRRRRESOURCEESOURCEESOURCEESOURCEESOURCE
MMMMM ANAGEMENTANAGEMENTANAGEMENTANAGEMENTANAGEMENT
PPPPP L A NL A NL A NL A NL A N
Chabot Reservoir
Outfenced Riparian AreasSouth Watershed
StreamsOutfenced Riparian AreasEBMUD Watershed BoundaryReservoir
N
0.5 0 0.5 1 Miles
#
San LeandroCreek
#
Moraga Creek
#
Buckhorn Creek
#
KaiserCreek
#
San LeandroCreek
#
Kings CanyonCreek
#
Upper San Leandro
Reservoir

Section 3MANAGING FORBIODIVERSITY
3 - 20
RRRRR A N G EA N G EA N G EA N G EA N G E
RRRRRESOURCEESOURCEESOURCEESOURCEESOURCE
MMMMMANAGEMENTANAGEMENTANAGEMENTANAGEMENTANAGEMENT
PPPPP L A NL A NL A NL A NL A N
San Pablo Reservoir, and Kaiser and Buckhorn Creeksthat are tributary to USL Reservoir. To protect red-leggedfrog, western pond turtle, and steelhead trout habitat, thelower reaches of Pinole and Simas Creek, with theirassociated ponds and wetlands, have also been outfenced.
See Outfenced Riparian Area Map on page 3-19.See EBWMP Guideline LG.1 in Appendix C.
3.4.5 Protection of Stock Ponds
Stock ponds, which were created in the early 20thcentury by ranchers, promote better distribution offoraging cattle, takes �pressure� off natural riparianwater sources, and with grazing, have created valuablesupplemental and replacement habitat for special statusspecies and other wildlife. Efforts toward environmentalprotection must be planned and implemented inaccordance with water quality and biodiversity goals.The management measures will be applied to nativehabitats as well as artificial enhancements such as stockponds.
3.4.6 Implementation of Creek Restoration Projects
Since 1993 the District has integrated its restorationefforts with an interpretive education program thatinvolves students from local schools. Classes growplants from seed and then plant their seedlings orcuttings in restoration sites on the watershed previouslyidentified by EBMUD staff as creeks with disturbedand/or impacted riparian areas. Participants whovolunteer in the late spring or summer, mulch and weedaround plantingS along the creeks.
Creeks within the terminal reservoir basins take priority forrestoration over those outside these basins. Restoration isachieved by using low-impact, bio-engineered methods.Willows, alders and cottonwoods are planted in the creekbeds, and valley oaks, live oaks and buckeyes are plantedon the creek banks. To control erosion, the banks arestabilized using willow wattles, mulching, and willowbundles. Electric fencing is installed around restored sites
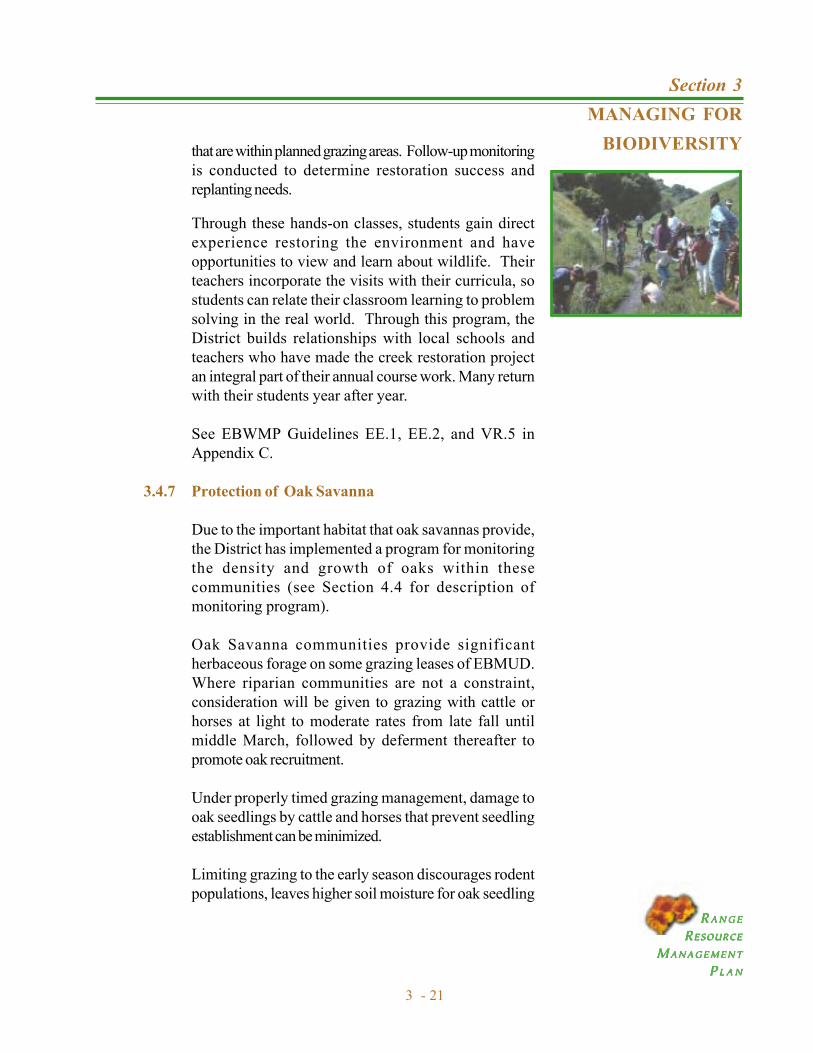
Section 3MANAGING FOR
BIODIVERSITY
3 - 21
RRRRR A N G EA N G EA N G EA N G EA N G E
RRRRRESOURCEESOURCEESOURCEESOURCEESOURCE
MMMMM ANAGEMENTANAGEMENTANAGEMENTANAGEMENTANAGEMENT
PPPPP L A NL A NL A NL A NL A N
that are within planned grazing areas. Follow-up monitoringis conducted to determine restoration success andreplanting needs.
Through these hands-on classes, students gain directexperience restoring the environment and haveopportunities to view and learn about wildlife. Theirteachers incorporate the visits with their curricula, sostudents can relate their classroom learning to problemsolving in the real world. Through this program, theDistrict builds relationships with local schools andteachers who have made the creek restoration projectan integral part of their annual course work. Many returnwith their students year after year.
See EBWMP Guidelines EE.1, EE.2, and VR.5 inAppendix C.
3.4.7 Protection of Oak Savanna
Due to the important habitat that oak savannas provide,the District has implemented a program for monitoringthe density and growth of oaks within thesecommunities (see Section 4.4 for description ofmonitoring program).
Oak Savanna communities provide significantherbaceous forage on some grazing leases of EBMUD.Where riparian communities are not a constraint,consideration will be given to grazing with cattle orhorses at light to moderate rates from late fall untilmiddle March, followed by deferment thereafter topromote oak recruitment.
Under properly timed grazing management, damage tooak seedlings by cattle and horses that prevent seedlingestablishment can be minimized.
Limiting grazing to the early season discourages rodentpopulations, leaves higher soil moisture for oak seedling

Section 3MANAGING FORBIODIVERSITY
3 - 22
RRRRR A N G EA N G EA N G EA N G EA N G E
RRRRRESOURCEESOURCEESOURCEESOURCEESOURCE
MMMMMANAGEMENTANAGEMENTANAGEMENTANAGEMENTANAGEMENT
PPPPP L A NL A NL A NL A NL A N
growth, and avoids potential selective browsing of seedlingsafter forages are mature in late spring (U.C. Davis 1996).
Total exclusion of livestock from savanna is generally notwarranted unless there is insufficient recruitment of oakseedlings to maintain the habitat. In order to evaluate theprogress of seedling recruitment a long-term monitoringprogram has been established. See Section 4, Monitoringof Grazed Rangelands.
With light to moderate stocking, little or no feeding bycattle occurs under canopies of evergreen (live oak)trees where the herbs are of low palatability to livestock.
See EBWMP Guidelines EE.1, EE.2, and VR.5 inAppendix C.
See EBWMP Guidelines BIO.5 and BIO.8 in AppendixC.
3.4.8 Protection of Native Grasslands
The goal of this plan is to maintain or enhance thecurrent native grasslands for their ecological value. Grazingrotation systems and burning may provide some promisefor enhancing native populations, and experiments withmanagement practices will be encouraged and closelymonitored for success or failure. In light of the currentknowledge, heavy grazing of native grasslands should beavoided, and closely monitored light to moderate grazingwith periodic rest is recommended because it may enhancenative perennial grass vigor.
Grazing will also be used to retain current levels ofrunoff by maintaining grassland communities, which providegreater runoff than scrublands or forests. Site ConservationThreshold RDM Levels of 900 lbs./acres, 1,200 lbs./acre,and 1,400 lbs./acre RDM and 70% total cover density willbe followed to ensure adequate protection of watershedsand water quality on grazed lands.
A second important objective of the RRMP is the

Section 3MANAGING FOR
BIODIVERSITY
3 - 23
RRRRR A N G EA N G EA N G EA N G EA N G E
RRRRRESOURCEESOURCEESOURCEESOURCEESOURCE
MMMMM ANAGEMENTANAGEMENTANAGEMENTANAGEMENTANAGEMENT
PPPPP L A NL A NL A NL A NL A N
maintenance and enhancement of the grassland habitatmosaic. Studies indicate that light to moderate grazing ofterrestrial grassland habitats favors plant diversity and maynot have significant negative impacts on diversity ofassociated vertebrate wildlife. In addition, managedlivestock grazing can be an effective tool for maintaininggrasslands in addition to inhibiting brush encroachment,particularly coyote brush. This management strategysupports biodiversity and fire hazard mitigation.
See EBWMP Guidelines LG.1, LG.6, and LG.7 inAppendix C.
3.4.9 Protection of Special Status Species
For protection and enhancement of riparian and aquatichabitats of the red-legged frog, steelhead trout and westernpond turtle, EBMUD identifies critical stream reaches andoutfences them from grazing.
Vernal pool fairy shrimp (Branchinecta lynchii) and thered-legged frog (Rana aurora draytonii), both listedspecies, continue to thrive in ponded waters of historicallygrazed grasslands of Central California (Jones & Stokes1989; USFWS 1994, 1996).
High winter migratory populations of Canada geese,including the Aleutian, occur on moderately grazed pondswithin the EBMUD watershed (USFWS 1997). The

Section 4MONITORING OF GRAZED
RANGELANDS
4 - 1
RRRRR A N G EA N G EA N G EA N G EA N G E
RRRRRESOURCEESOURCEESOURCEESOURCEESOURCE
MMMMM ANAGEMENTANAGEMENTANAGEMENTANAGEMENTANAGEMENT
PPPPP L A NL A NL A NL A NL A N
4.0 Introduction
The management goals and objectives for EBMUD rangelands areto promote and ensure healthy and sustainable ecosystems throughthe enhancement and maintenance of biodiversity and water quality.The EBWMP (Guideline LG. 6 in Section 3) requires year roundmonitoring efforts conducted to assess the success of the RRMP.This continuous program improvement, or �adaptive management�ensures the continued success of the RRMP.
Data collected from these monitoring efforts serve as estimates ofthe conditions at the time the data was collected. It is from this datathat recommendations and management strategies are developedand adopted to accomplish program goals. As conditions change,so do management strategies regarding efforts to minimize potentialgrazing impacts on EBMUD watersheds.
4.1 Range Monitoring Program Components
The District has been monitoring many of the grazing allotments forseveral decades. Presently there are twenty locations at whichmeasurements of forage productivity, utilization, and range conditionare recorded annually. Each monitoring location consists of a grazingexclosure and a 100-foot line transect permanently marked withsteel posts or concrete monuments.
The sites were selected to represent the typical range site andutilization for a specific area or allotment. As part of the RRMP,existing site locations are periodically reviewed to confirm that they

Section 4MONITORING OF GRAZEDRANGELANDS
4 - 2
RRRRR A N G EA N G EA N G EA N G EA N G E
RRRRRESOURCEESOURCEESOURCEESOURCEESOURCE
MMMMMANAGEMENTANAGEMENTANAGEMENTANAGEMENTANAGEMENT
PPPPP L A NL A NL A NL A NL A N
accurately represent the allotment. Sites are relocated as necessary.
4.1.1 Spring Field Survey
Transects are sampled for range condition and forageproduction, in late April or early May, to determine thepeak standing spring crop. In addition, plant biodiversityhas been sampled since 1998, and is described in furtherdetail in Section 5.4. Photo plots of each transect andexclosure are taken, and an equipment list is included inAppendix F.
� Range Condition
The Range Condition procedure is one of several usedto determine the general condition of rangelands andlivestock carrying capacity for each allotment. Eachallotment is sampled and ranked based upon foragequality as it relates to livestock consumption.
Using the Spring Field Survey Sheet (Appendix F),plant species are recorded at one-foot intervals on theline transect according to the line-point range monitoringtechnique. At each point, the rod descendsperpendicular to the land surface, and the first plant ittouches is recorded as the �hit� for that point. If noplant is touched, the hit is recorded as �soil�.
Plant species are ranked for palatability to livestockaccording to forage class as desirable, less desirableand undesirable. The data are tallied and a rangecondition rating is calculated on the basis of the followingformula (modified from USDA Soil ConservationService 1962):
Range Condition = (% Desirable species) + [100 � (1/2)(% Less Desirable Species)]
+ [100 � (2) (% Undesirable Species)] + (Total % Cover)4
This calculation incorporates both the total plant coverand the relative plant cover of the different species by

Section 4MONITORING OF GRAZED
RANGELANDS
4 - 3
RRRRR A N G EA N G EA N G EA N G EA N G E
RRRRRESOURCEESOURCEESOURCEESOURCEESOURCE
MMMMM ANAGEMENTANAGEMENTANAGEMENTANAGEMENTANAGEMENT
PPPPP L A NL A NL A NL A NL A N
forage class. The results are categorized and recordedaccording to the following Range Condition Classes(modified from USDA Soil Conservation Service1962):
Excellent 90-100%Good 80-89%Fair 60-79%Poor 40-59%
� Forage Production
Forage production is measured in the late spring todetermine how much feed is available. In addition tothe Range Condition ranking procedure, the results ofthis monitoring procedure help determine the annualcarrying capacity for each allotment.
At peak standing crop, forage production is measuredinside the grazing exclosure. Three representativesamples are located and collected, using the 0.96 squarefoot circular quadrant. Unpalatable forage is notincluded in the sample, and disturbed areas such asgopher mounds are avoided. The sample should includeall forage that is rooted inside the quadrant, and foragethat is not rooted inside the quadrant should beseparated out from the sample. Forage is clipped tothe 1cm level and stored in a paper bag for severaldays or oven dried until the moisture has evaporatedto achieve air-dry weight basis (ADWB). Then thesamples are weighed and the measurements in gramsare converted to lb./acre using the following conversionfactor: 1 g/0.96 sq. ft = 100 lb./acre. Measurementsare recorded on the Spring Field Survey Sheet andnotes of grazing utilization, erosion, and waterimprovements for the allotment are made.
Grazing exclosures are relocated in the fall to grazedareas in preparation for new Spring Field Surveysampling. Moving the exclosures provides productiondata that is representitive of a grazed rangeland.

Section 4MONITORING OF GRAZEDRANGELANDS
4 - 4
RRRRR A N G EA N G EA N G EA N G EA N G E
RRRRRESOURCEESOURCEESOURCEESOURCEESOURCE
MMMMMANAGEMENTANAGEMENTANAGEMENTANAGEMENTANAGEMENT
PPPPP L A NL A NL A NL A NL A N
� Plant Biodiversity Monitoring
Of the many tools that measure biodiversity, EBMUDuses the Shannon-Weaver index, which combinesinformation on both the number of taxa present in acollection and the abundance distribution among thosetaxonomic groups. This index number is calculatedusing the Belt Transect Method.
The Belt Transect is an estimate of relative cover takenover a 3-foot wide strip along the length of the 100-foot line transect (approximately 300 sq. ft. area). Alist of all plant species within the belt transect arerecorded. A trained botanist or range manager thenestimates absolute cover of each species present.(Note: The sum of the absolute cover estimates for allspecies can exceed 100%, which allows for overlap ofspecies.) Relative cover is calculated by dividing theabsolute cover for each species by the sum total of theabsolute cover of all species.
The Belt Transect Method is a comprehensive methodthat provides data for species and their approximaterepresentation in the plant community at the transectsite. It includes species that have been missed by theline-point method. Field survey sheets are included inAppendix F.
The formula for the Shannon-Weaver Index (H�) is asfollows:
SH� = -Σ pi log pi
i-1Where:
H� = Index value used to serve as a measure forbiodiversity.
- = Inverse function of ∑ (sum), H� needs to bea positive value so valueis changed from (-) to (+) value.
∑ = Sum of components occurring to the right ofthe symbol.
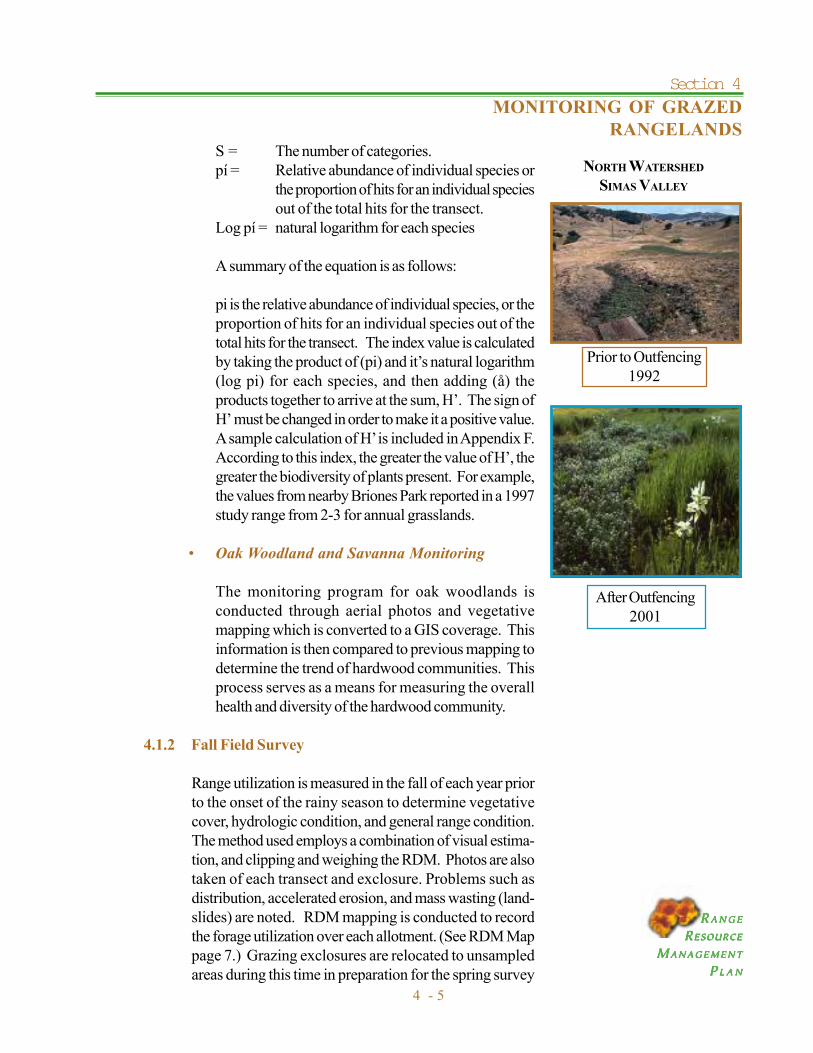
Section 4MONITORING OF GRAZED
RANGELANDS
4 - 5
RRRRR A N G EA N G EA N G EA N G EA N G E
RRRRRESOURCEESOURCEESOURCEESOURCEESOURCE
MMMMM ANAGEMENTANAGEMENTANAGEMENTANAGEMENTANAGEMENT
PPPPP L A NL A NL A NL A NL A N
S = The number of categories.pí = Relative abundance of individual species or
the proportion of hits for an individual speciesout of the total hits for the transect.
Log pí = natural logarithm for each species
A summary of the equation is as follows:
pi is the relative abundance of individual species, or theproportion of hits for an individual species out of thetotal hits for the transect. The index value is calculatedby taking the product of (pi) and it�s natural logarithm(log pi) for each species, and then adding (å) theproducts together to arrive at the sum, H�. The sign ofH� must be changed in order to make it a positive value.A sample calculation of H� is included in Appendix F.According to this index, the greater the value of H�, thegreater the biodiversity of plants present. For example,the values from nearby Briones Park reported in a 1997study range from 2-3 for annual grasslands.
� Oak Woodland and Savanna Monitoring
The monitoring program for oak woodlands isconducted through aerial photos and vegetativemapping which is converted to a GIS coverage. Thisinformation is then compared to previous mapping todetermine the trend of hardwood communities. Thisprocess serves as a means for measuring the overallhealth and diversity of the hardwood community.
4.1.2 Fall Field Survey
Range utilization is measured in the fall of each year priorto the onset of the rainy season to determine vegetativecover, hydrologic condition, and general range condition.The method used employs a combination of visual estima-tion, and clipping and weighing the RDM. Photos are alsotaken of each transect and exclosure. Problems such asdistribution, accelerated erosion, and mass wasting (land-slides) are noted. RDM mapping is conducted to recordthe forage utilization over each allotment. (See RDM Mappage 7.) Grazing exclosures are relocated to unsampledareas during this time in preparation for the spring survey
NORTH WATERSHED
SIMAS VALLEY
After Outfencing2001
Prior to Outfencing1992
Section 4MONITORING OF GRAZEDRANGELANDS
4 - 6
RRRRR A N G EA N G EA N G EA N G EA N G E
RRRRRESOURCEESOURCEESOURCEESOURCEESOURCE
MMMMMANAGEMENTANAGEMENTANAGEMENTANAGEMENTANAGEMENT
PPPPP L A NL A NL A NL A NL A N
samples. Survey sheets and an equipment list are includedin Appendix F.
� Range Utilization
Measuring and estimating range utilization provides anoverview of the range health of each allotment. It isalso plays an important role in the development of eachAnnual Grazing Plan (AGP) by providing valuable dataand information to allow for modification, change andadjustments if necessary. If problem areas areidentified, corrective measures are incorporated intothe next plan.
The procedures for range utilization monitoring are asfollows:
1. To measure specific forage use, a circular 0.96sq. ft. quadrant is randomly thrown ten times within50 feet of the transect. Any forage the quadrantlands on, whether rooted inside the quadrant ornot, is included in the sample. Mustards andthistles are excluded from the clippings, and donot count as RDM.
2. The field crew estimates the weights of the firsttwo samples before they are clipped to the 1 cmheight and weighed on-site using a Pesola scale.The next eight samples are measured using visualestimation. The information is recorded on theFall Field Survey Sheet and an average RDM levelis calculated for each site. The measurements aretaken when the forage is not wet since the ADWBis used. If new growth has started, green forage isnot included in the sample.
3. A visual survey of each allotment is completed andnotes of grazing distribution, erosion, waterconditions, and degraded areas are made.
4. If the transect results are below site conservationthresholds as outlined in Section 2.1.2, RDMmapping of the entire allotment will be conducted.Otherwise mapping will occur every other year asdescribed in the following section.

Section 4MONITORING OF GRAZED
RANGELANDS
4 - 7
RRRRR A N G EA N G EA N G EA N G EA N G E
RRRRRESOURCEESOURCEESOURCEESOURCEESOURCE
MMMMM ANAGEMENTANAGEMENTANAGEMENTANAGEMENTANAGEMENT
PPPPP L A NL A NL A NL A NL A N
Watershed and Rec reation DivisionSeptember 2001
EBMUD Boundary
Carr A llotment
Streams
RDM Levels: 1999
H
L
M
RDM MappingCarr Allotment
Fall Survey
N
1000 0 1000 2000 3000 Feet
1000 0 1000 2000 Feet
N

Section 4MONITORING OF GRAZEDRANGELANDS
4 - 8
RRRRR A N G EA N G EA N G EA N G EA N G E
RRRRRESOURCEESOURCEESOURCEESOURCEESOURCE
MMMMMANAGEMENTANAGEMENTANAGEMENTANAGEMENTANAGEMENT
PPPPP L A NL A NL A NL A NL A N
Table 4-1: RDM Utilization Ratings
Utilization RDM Levels Rating
< 5 % slope 5 � 35 % slope > 35 % slope
< 840 RDM < 1120 slope <1400 slope Heavy
840 � 1200 RDM 1120 - 1600 slope 1400 � 2000 slope Moderate
> 1200 RDM > 1600 slope >2000 slope Light
� RDM Mapping and Analysis
Bi-annually, RDM mapping will be conducted to recordthe survey of heavy forage utilization over eachallotment.This process requires visual estimation ofRDM levels and delineating the area on a field map.The maps are then converted into GIS layers.Utilization is determined relative to the District�s RDMstandards for the three slope classes: 0-5% slope (flat),6-35% slope (moderate), and > 35 % slope (steep).Each slope class has a range of RDM Levelscorresponding to Light, Moderate, and Heavy Grazing(see Table 4.1). Light utilization applies to areas whereRDM is above the standards, Moderate utilizationapplies to areas that meet the standards, and Heavyutilization applies to areas that are below the standards.
4.2 Survey Monitoring Results: 1990-1997
Table 4.2 presents a summary of monitoring results from 1990-1997. The sample is comprised of a range of grazing years from thedrought period of the early 1990�s to heavier rainfall years later in the de-cade. Two sets of data are shown for Productivity, RDM, and RangeCondition; the median (top number) represents a normal grazing year on anallotment; and, the bottom number represents the range of the sample foreach allotment. Although the median value for each allotment meetsEBMUD�s RDM standards for that time period, the low values of the rangeindicate years when overgrazing occurred on the allotment. As a conse-quence, on allotments such as Rifle Range, the allotment was vacated forseveral years until the new grazing guidelines were established in theEBWMP.

Section 4MONITORING OF GRAZED
RANGELANDS
4 - 9
RRRRR A N G EA N G EA N G EA N G EA N G E
RRRRRESOURCEESOURCEESOURCEESOURCEESOURCE
MMMMM ANAGEMENTANAGEMENTANAGEMENTANAGEMENTANAGEMENT
PPPPP L A NL A NL A NL A NL A N
Table 4-2: Summary of Historical Records for Grazing Allotments. Figuresgive the median and the range for the years 1990-1997. Complete data wasnot collected for all years at all sites. Range condition ratings are: Excellent= 90�100, Good = 80-89, Fair = 60-79, Poor = 40-59.
Allotment Soil Type Range Site Productivity Productivity RDM RDM median (lb./acre)
range (lb./acre)
median (lb./acre)
range (lb./acre)
AirstripMillsholm Silt Loam Loamy 3700 1700-6000 1800 400-4000 Good 67-87
BadenGilroy Clay Loam Loamy 4900 3000-6700 1200 460-2400 Fair 63-82
Bar XSandy Loam Loamy 4100 3200-6300 1000 300-4300 Fair 67-77
Boy ScoutMillsholm Loam
Shallow Fine Loamy 5300 2200-5700 1800 1800 Excellent 92-98
Carr Home Ranch
Los Osos Clay Loam
Fine Loamy 3500 2700-4900 590 30-960 Fair 58-78
Carr: Rocky Ridge Clay Loam
Fine Loamy 4900 2900-9400 1200 1000-2400 Fair 61-86
Gateway Diablo Clay Clayey 3600 3000-4400 1800 1100-2800 Fair 70-85
HooverMillsholm Silt Loam Loamy 3700 3200-5200 1100 270-3400 Good 72-81
Mike RanchMillsholm Loam
Shallow Fine Loamy 2700 1700-3600 1600 500-2500 Fair 69-77
Moraga Horse Clay Loam Fine Loamy 3200 2900-4100 2200 1100-3200 Excellent 82-90Nunes: Wire Ranch Clay Loam Fine Loamy 3400 2700-3900 2200 1350-2750 Good 59-95Orinda Horse
Gilroy Clay Loam Loamy 4300 3300-5200 900 320-3600 Excellent 88-93
OursanLos Osos Clay Loam Clayey 3400 3000-4700 1800 1300-2800 Excellent 81-97
Pinole YMillsholm Loam
Shallow Fine Loamy 3800 2200-7100 1500 950-2000 Good 76-98
Redwood Rangers
Los Osos Silt Loam Loamy 2800 2800-3500 1000 400-2200 Fair 61-78
Rifle RangeLos Osos Silt Loam Loamy 3100 1000-6000 800 400-1470 Fair 65-84
Sanders Rocky Ridge
Los Gatos Complex Fine Loamy 3900 3100-9500 2600 700-3300 Fair 71-77
SatherLos Osos Clay Loam Clayey 3600 2500-4400 900 700-2800 Good 75-86
Siesta Valley Diablo Clay Clayey 3000 2600-4300 1100 700-2400 Good 74-86
Tri- Cities Sehorn Clay Clayey 3200 2100-4200 1400 750-3200 Good 74-95
Range
Condition

Section 4MONITORING OF GRAZEDRANGELANDS
4 - 10
RRRRR A N G EA N G EA N G EA N G EA N G E
RRRRRESOURCEESOURCEESOURCEESOURCEESOURCE
MMMMMANAGEMENTANAGEMENTANAGEMENTANAGEMENTANAGEMENT
PPPPP L A NL A NL A NL A NL A N
Furthermore, each transect represents a sample of the rangeutilization of a typical area within the allotment. Some areas willbe more heavily grazed relative to the transect site and otherareas more lightly grazed. Annual monitoring includes a visualinspection of the allotment during the spring and fall field surveys,and RDM mapping is conducted in alternate years to delineateareas of heavy, moderate and light utilization.
4.3 Special Status Species and Sensitive Habitats
Special status species and sensitive habitats are identified for eachallotment in the Annual Grazing Plan (AGP). Protection for andmanagement of federally threatened and endangered (T&E) speciesand sensitive habitats will be reflected in each AGP. The Fisheriesand Wildlife (F&W) Division of EBMUD will monitor all T&Especies and sensitive habitats (see section 1.4.9). Prior to �ground-disturbing� and/or construction activities taking place, EBMUD F&W will assess the area for the presence of special status speciesand/or sensitive habitat. If special status species or sensitive habitatsexist in the surrounding area, an on-site survey will be conducted toassess whether or not the activity will have any potential adverseeffects.
Special status species and sensitive habitats that are not listed asrare, threatened, or endangered will also be monitored by EBMUD.For example, oak savannas and riparian zones are important centersof biodiversity and will therefore be monitored using rapidbioassessment (see sections 4.1 and 4.5.2). Relative changes inoak savanna habitat will be monitored by tracking changes in thevegetation coverages. Regular monitoring of ponds and streamsfor habitat quality, species composition, and wildlife presence willoccur on a sample of the grazing allotments. Included in AppendixF are samples of field survey sheets for Watershed Ponds andPools, Pool Quality Index, and Woody Species Regeneration.
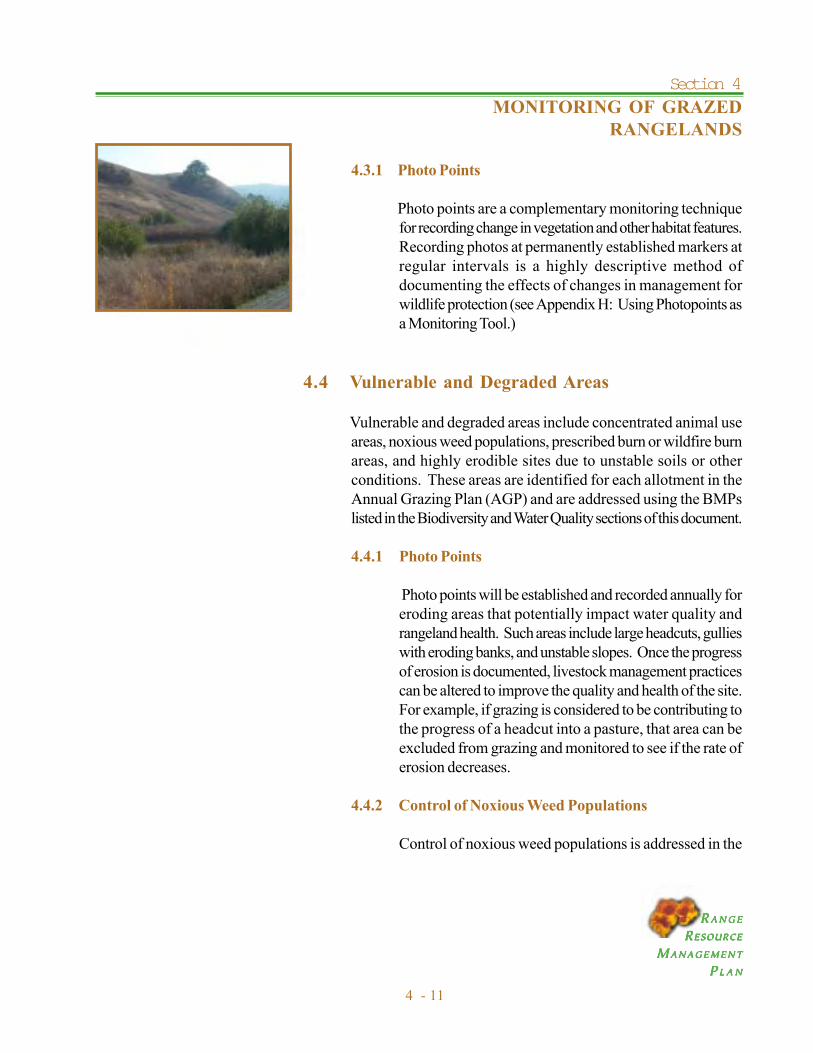
Section 4MONITORING OF GRAZED
RANGELANDS
4 - 11
RRRRR A N G EA N G EA N G EA N G EA N G E
RRRRRESOURCEESOURCEESOURCEESOURCEESOURCE
MMMMM ANAGEMENTANAGEMENTANAGEMENTANAGEMENTANAGEMENT
PPPPP L A NL A NL A NL A NL A N
4.3.1 Photo Points
Photo points are a complementary monitoring techniquefor recording change in vegetation and other habitat features.Recording photos at permanently established markers atregular intervals is a highly descriptive method ofdocumenting the effects of changes in management forwildlife protection (see Appendix H: Using Photopoints asa Monitoring Tool.)
4.4 Vulnerable and Degraded Areas
Vulnerable and degraded areas include concentrated animal useareas, noxious weed populations, prescribed burn or wildfire burnareas, and highly erodible sites due to unstable soils or otherconditions. These areas are identified for each allotment in theAnnual Grazing Plan (AGP) and are addressed using the BMPslisted in the Biodiversity and Water Quality sections of this document.
4.4.1 Photo Points
Photo points will be established and recorded annually foreroding areas that potentially impact water quality andrangeland health. Such areas include large headcuts, gullieswith eroding banks, and unstable slopes. Once the progressof erosion is documented, livestock management practicescan be altered to improve the quality and health of the site.For example, if grazing is considered to be contributing tothe progress of a headcut into a pasture, that area can beexcluded from grazing and monitored to see if the rate oferosion decreases.
4.4.2 Control of Noxious Weed Populations
Control of noxious weed populations is addressed in the

Section 4MONITORING OF GRAZEDRANGELANDS
4 - 12
RRRRR A N G EA N G EA N G EA N G EA N G E
RRRRRESOURCEESOURCEESOURCEESOURCEESOURCE
MMMMMANAGEMENTANAGEMENTANAGEMENTANAGEMENTANAGEMENT
PPPPP L A NL A NL A NL A NL A N
Integrated Pest Management Plan (Appendix I). Theprocess for controlling a noxious weed involves the followingsteps:
1. Identify the extent of the problem through field mapping,2. Develop a plan of action to address the spread of the
population that is consistent with management objectivesfor the impacted area,
3. Implement the plan,4. Monitor for effectiveness of control actions, and5. Modify plan as necessary to achieve maximum
effectiveness.
An example of noxious weed control is Goat Grass(Aegilops triuncialis) on the Nunes allotment. Goat grassis an invasive and unpalatable European annual grass thatis listed on the California State Noxious Weed � B List,which requires landowners to control its spread.
EBMUD identified the problem in the early 1990�s andmapped the population extent in 1993. Permanent linetransects were established at the site to monitor changes inpopulation, and a burning program was implemented tolimit the spread and to eradicate the population. Burnswere conducted in the summers of 1993, 1996, and 1997,and effective reduction in the population was indicatedthrough annual spring monitoring of the transects (Bartolome1999). A fall burn in 1997 was also conducted in additionto the summer burn to experiment with the effects ofseasonal differences in burning. Although the percent coverof goat grass has been reduced, the geographical extent ofthe population has spread despite an increase in the burningarea each year.
4.5 Water Quality Monitoring
The Water Systems Inspection Division routinely monitors reservoirsin compliance with all regulatory requirements. Drinking waterreservoirs are tested biweekly and/or monthly for an extensive rangeof physical, chemical, and biological contaminants, including themicroorganisms Giardia and Cryptosporidium.
Rapid bioassessment is conducted on perennial streams to determine
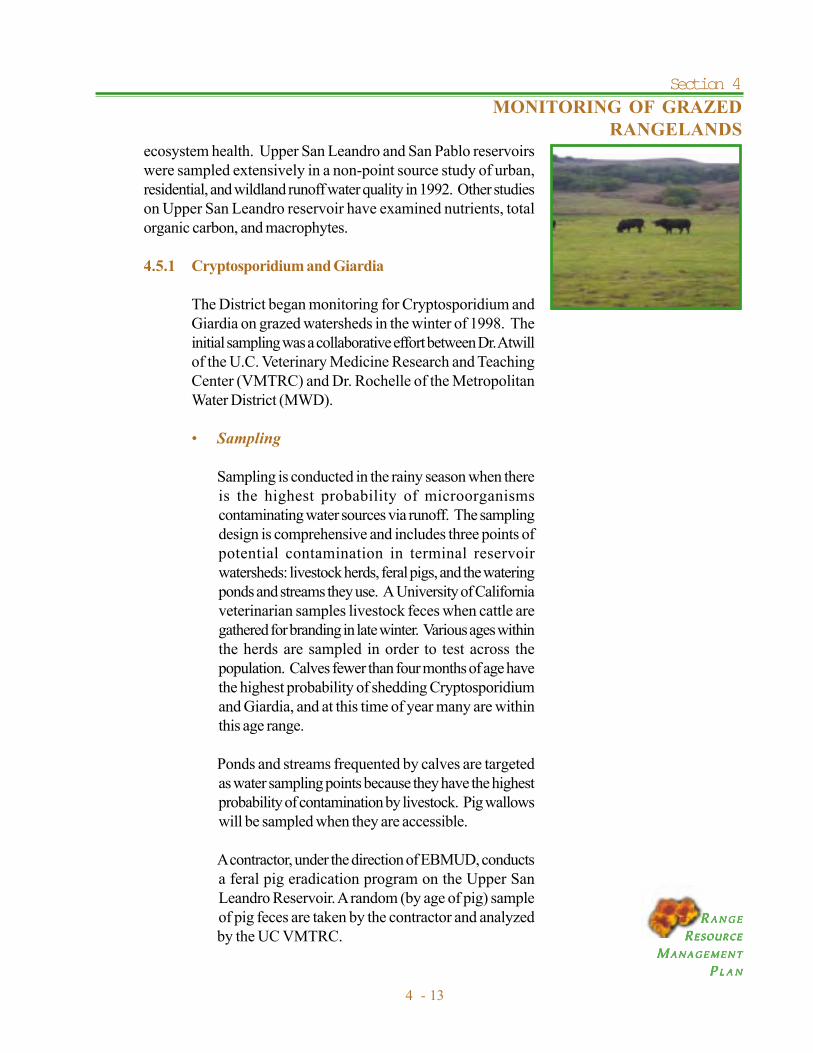
Section 4MONITORING OF GRAZED
RANGELANDS
4 - 13
RRRRR A N G EA N G EA N G EA N G EA N G E
RRRRRESOURCEESOURCEESOURCEESOURCEESOURCE
MMMMM ANAGEMENTANAGEMENTANAGEMENTANAGEMENTANAGEMENT
PPPPP L A NL A NL A NL A NL A N
ecosystem health. Upper San Leandro and San Pablo reservoirswere sampled extensively in a non-point source study of urban,residential, and wildland runoff water quality in 1992. Other studieson Upper San Leandro reservoir have examined nutrients, totalorganic carbon, and macrophytes.
4.5.1 Cryptosporidium and Giardia
The District began monitoring for Cryptosporidium andGiardia on grazed watersheds in the winter of 1998. Theinitial sampling was a collaborative effort between Dr. Atwillof the U.C. Veterinary Medicine Research and TeachingCenter (VMTRC) and Dr. Rochelle of the MetropolitanWater District (MWD).
� Sampling
Sampling is conducted in the rainy season when thereis the highest probability of microorganismscontaminating water sources via runoff. The samplingdesign is comprehensive and includes three points ofpotential contamination in terminal reservoirwatersheds: livestock herds, feral pigs, and the wateringponds and streams they use. A University of Californiaveterinarian samples livestock feces when cattle aregathered for branding in late winter. Various ages withinthe herds are sampled in order to test across thepopulation. Calves fewer than four months of age havethe highest probability of shedding Cryptosporidiumand Giardia, and at this time of year many are withinthis age range.
Ponds and streams frequented by calves are targetedas water sampling points because they have the highestprobability of contamination by livestock. Pig wallowswill be sampled when they are accessible.
A contractor, under the direction of EBMUD, conductsa feral pig eradication program on the Upper SanLeandro Reservoir. A random (by age of pig) sampleof pig feces are taken by the contractor and analyzedby the UC VMTRC.

Section 4MONITORING OF GRAZEDRANGELANDS
4 - 14
RRRRR A N G EA N G EA N G EA N G EA N G E
RRRRRESOURCEESOURCEESOURCEESOURCEESOURCE
MMMMMANAGEMENTANAGEMENTANAGEMENTANAGEMENTANAGEMENT
PPPPP L A NL A NL A NL A NL A N
� Methods
Due to high turbidity and pathogen concentration in thesewater bodies, grab samples of one to five liters are obtainedand tested. Two samples from each location are taken andprocessed to a small pellet by the Laboratory ServicesDivision. The sample is then sent to MWD for pathogenanalysis. The MWD lab uses DNA sequencing technologyto identify different strains of Cryptosporidium and Giardiathat are associated with specific hosts. For example, ifCryptosporidium is identified in water samples, it is thenpossible to identify the pathogen source from a livestockherd or pig population on the watershed.
Livestock herds, ponds and streams on terminal reservoirwatershed lands will be sampled for Cryptosporidium andGiardia on an annual basis as time and funds allow. At aminimum, samples will be collected every third year.
4.5.2 Rapid Bioassessment
In accordance with the EBWMP, managing for water qualitymeans managing for biodiversity. A technique supportedby the Regional Water Quality Control Board (RWQCB),the EPA, and the CDFG, for monitoring the health of acreek is known as rapid bioassessment, which provides adirect assessment of ecosystem health. The EPA and theRWQCB, to prioritize water quality problems and todocument recovery following rehabilitation, currently usethis monitoring technique. Biological communities oforganisms such as fish and insects are identified andquantified, from which the condition or health of the creekcan be extrapolated. This technique is conducted on creeksby the EBMUD Fisheries and Wildlife staff when overallhealth of these areas are in question due to impacts madeby surrounding activities (i.e. land improvements, grazing).Rapid Bioassessment is often used prior to man-inducedactivities to provide baseline data so that overall healthand the corresponding biodiversity can be monitored overtime.
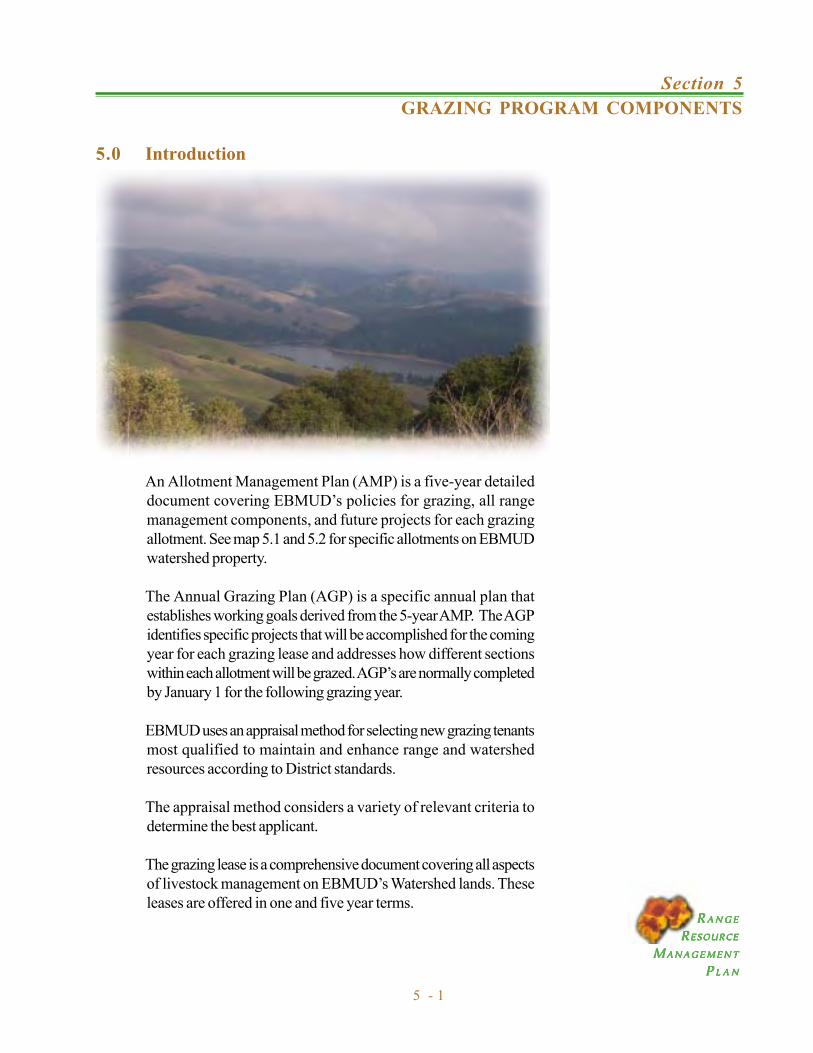
Section 5GRAZING PROGRAM COMPONENTS
5 - 1
RRRRR A N G EA N G EA N G EA N G EA N G E
RRRRRESOURCEESOURCEESOURCEESOURCEESOURCE
MMMMMANAGEMENTANAGEMENTANAGEMENTANAGEMENTANAGEMENT
PPPPP L A NL A NL A NL A NL A N
5.0 Introduction
An Allotment Management Plan (AMP) is a five-year detaileddocument covering EBMUD�s policies for grazing, all rangemanagement components, and future projects for each grazingallotment. See map 5.1 and 5.2 for specific allotments on EBMUDwatershed property.
The Annual Grazing Plan (AGP) is a specific annual plan thatestablishes working goals derived from the 5-year AMP. The AGPidentifies specific projects that will be accomplished for the comingyear for each grazing lease and addresses how different sectionswithin each allotment will be grazed. AGP�s are normally completedby January 1 for the following grazing year.
EBMUD uses an appraisal method for selecting new grazing tenantsmost qualified to maintain and enhance range and watershedresources according to District standards.
The appraisal method considers a variety of relevant criteria todetermine the best applicant.
The grazing lease is a comprehensive document covering all aspectsof livestock management on EBMUD�s Watershed lands. Theseleases are offered in one and five year terms.

Section 5GRAZING PROGRAM COMPONENTS
5 - 2
RRRRR A N G EA N G EA N G EA N G EA N G E
RRRRRESOURCEESOURCEESOURCEESOURCEESOURCE
MMMMMANAGEMENTANAGEMENTANAGEMENTANAGEMENTANAGEMENT
PPPPP L A NL A NL A NL A NL A N
Figure 5.1 - South Watershed Grazing Allotments
#
Upper S an Leandro res.
#
C habot Res.
1 0 1 2 Mi les
N
SOU TH W ATERS HED G ra zing A llotm ents
TO T AL A UMs = 3420
Allotme ntsBro w n Ranch: 834 AUMCarr: 600 AUMLon e P ine: 100 AUMMend onca: 1200 AUMMoraga Horse: 235 AUMRed w oo d Rang ers: 451 AUMUng razed

Section 5GRAZING PROGRAM COMPONENTS
5 - 3
RRRRR A N G EA N G EA N G EA N G EA N G E
RRRRRESOURCEESOURCEESOURCEESOURCEESOURCE
MMMMMANAGEMENTANAGEMENTANAGEMENTANAGEMENTANAGEMENT
PPPPP L A NL A NL A NL A NL A N
Figure 5.2 - North Watershed Grazing Allotments
S a n P
ab
l o R e s .
Br i
on
es
Re s .
OR INDA
Allo tmen tsGateway: 90 AU MNunes-Pavon: 2100 A UMOrinda H orse : 398 AUM
San Pablo R idge : 720 AU MSiesta Va l ley: 300 AUMSim as Sobran te : 1960 AU MTin H ouse /P inole Y: 875 AU MTr i-cities: 269 AUMagr ic u ltureungrazed
TOTA L A UM s = 6 71 2
NOR TH W A TER SHE D G ra zing A l lo tm e nts
1 0 1 2 Mi les
N

Section 5GRAZING PROGRAM COMPONENTS
5 - 4
RRRRR A N G EA N G EA N G EA N G EA N G E
RRRRRESOURCEESOURCEESOURCEESOURCEESOURCE
MMMMMANAGEMENTANAGEMENTANAGEMENTANAGEMENTANAGEMENT
PPPPP L A NL A NL A NL A NL A N
5.1 Allotment Management Plans
Key components of each AMP include: (1) Introduction, includingthe District�s 8 management measures, (2) Site Description,(3) Water Quality Concerns, (4) Biodiversity Concerns, (5) Fireand Fuels Management, and (6) Improvements (7) CulturalResources, (8) NRCS Best Management Practices, (9) Maps ofthe Allotment.
Locations of the allotments are shown in Figures 5-1 and 5-2. Asummary and copy of each AMP may be found in Appendix K.
5.1.1 Introduction
The Introduction of each AMP describes the functionalityof the AMP under the direction of EBMUD�s WatershedMaster Plan (WMP) and the Range Resource Master Plan(RRMP). Outlined within this section of the document areEBMUD�s Management Measures as they appear in theRRMP. These management measures act as goals thatdirect management decisions for the control of Non-pointsource (NPS) pollution and protection of Districtrangelands and biological resources.
5.1.2 Site Description
Each allotment is unique in the biotic (living) and abiotic(non-living) resources that it contains. Consideration ofthese unique resources, as they pertain to each allotment,will be made in order to make accurate and soundmanagement decisions. A listing of site characteristics isincluded within each AMP for this purpose. Listed belowis a description as they appear in the AMP.
Location: Watershed, boundaries, andlandmarks for allotment.
Topography and Terrain, aspect, slope and area.AcreageVegetation Types: Primary vegetation communities.Soil Types: Primary soil series and erosion
hazard ratings.Forage Estimated productivity by range site
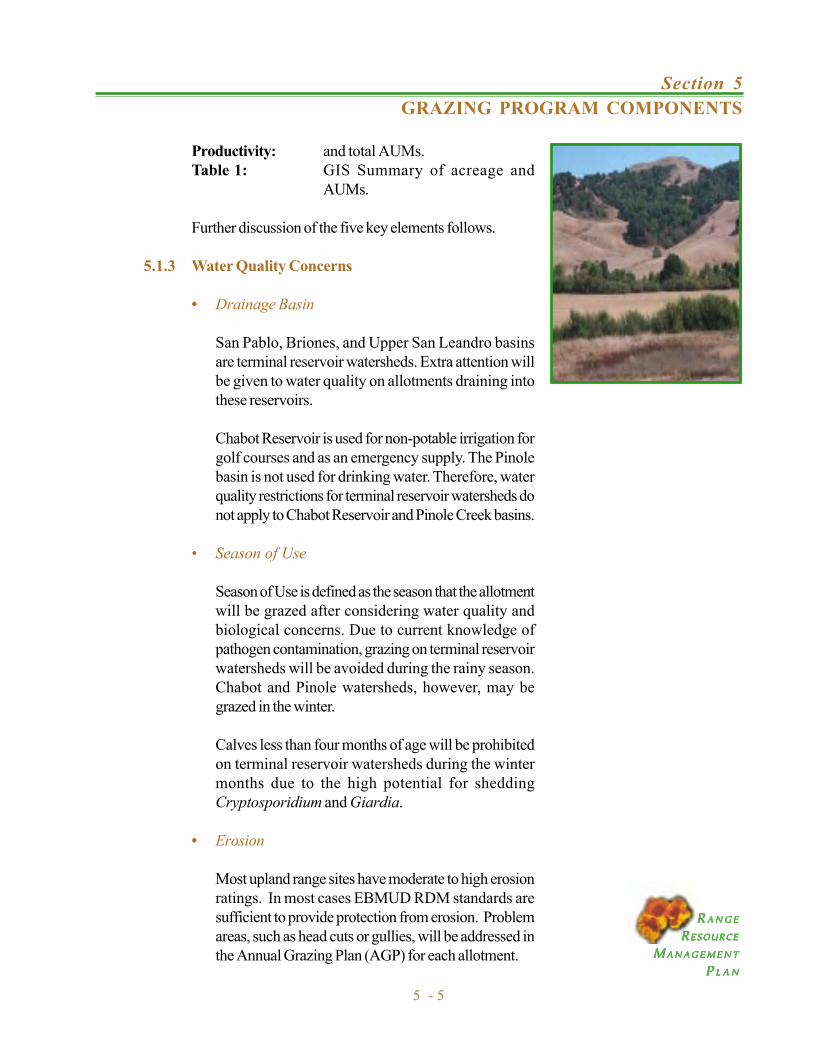
Section 5GRAZING PROGRAM COMPONENTS
5 - 5
RRRRR A N G EA N G EA N G EA N G EA N G E
RRRRRESOURCEESOURCEESOURCEESOURCEESOURCE
MMMMMANAGEMENTANAGEMENTANAGEMENTANAGEMENTANAGEMENT
PPPPP L A NL A NL A NL A NL A N
Productivity: and total AUMs.Table 1: GIS Summary of acreage and
AUMs.
Further discussion of the five key elements follows.
5.1.3 Water Quality Concerns
� Drainage Basin
San Pablo, Briones, and Upper San Leandro basinsare terminal reservoir watersheds. Extra attention willbe given to water quality on allotments draining intothese reservoirs.
Chabot Reservoir is used for non-potable irrigation forgolf courses and as an emergency supply. The Pinolebasin is not used for drinking water. Therefore, waterquality restrictions for terminal reservoir watersheds donot apply to Chabot Reservoir and Pinole Creek basins.
� Season of Use
Season of Use is defined as the season that the allotmentwill be grazed after considering water quality andbiological concerns. Due to current knowledge ofpathogen contamination, grazing on terminal reservoirwatersheds will be avoided during the rainy season.Chabot and Pinole watersheds, however, may begrazed in the winter.
Calves less than four months of age will be prohibitedon terminal reservoir watersheds during the wintermonths due to the high potential for sheddingCryptosporidium and Giardia.
� Erosion
Most upland range sites have moderate to high erosionratings. In most cases EBMUD RDM standards aresufficient to provide protection from erosion. Problemareas, such as head cuts or gullies, will be addressed inthe Annual Grazing Plan (AGP) for each allotment.
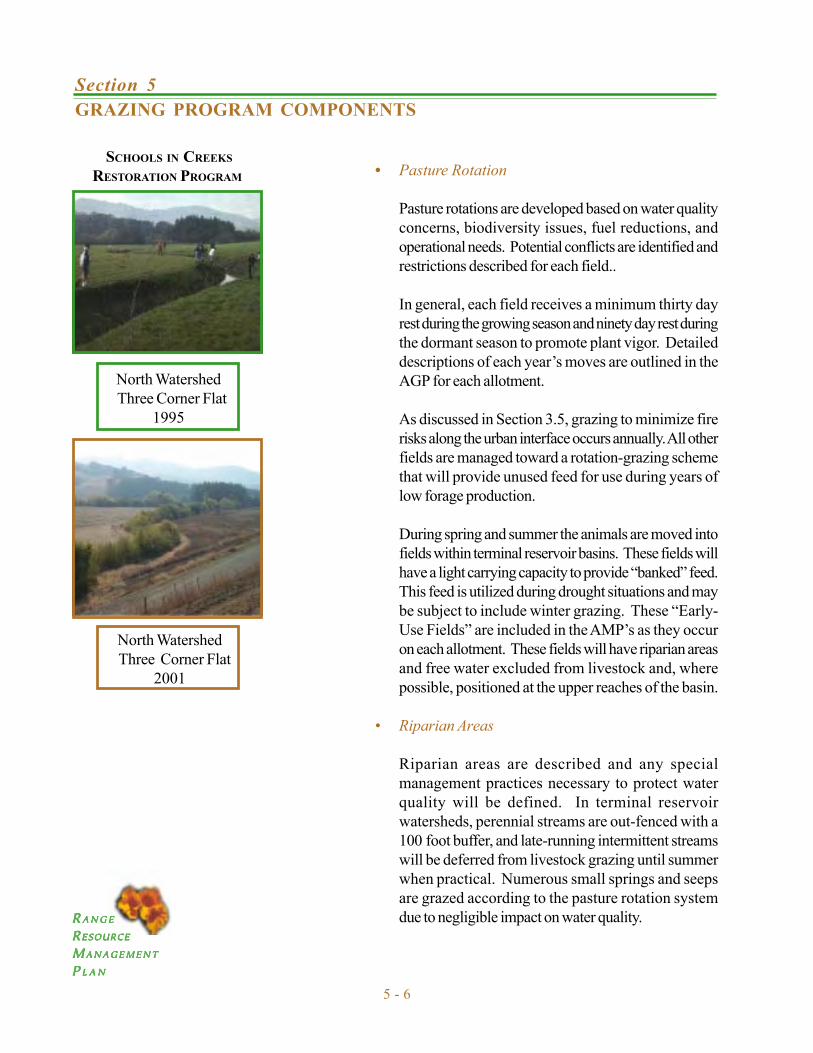
Section 5GRAZING PROGRAM COMPONENTS
5 - 6
RRRRR A N G EA N G EA N G EA N G EA N G E
RRRRRESOURCEESOURCEESOURCEESOURCEESOURCE
MMMMMANAGEMENTANAGEMENTANAGEMENTANAGEMENTANAGEMENT
PPPPP L A NL A NL A NL A NL A N
� Pasture Rotation
Pasture rotations are developed based on water qualityconcerns, biodiversity issues, fuel reductions, andoperational needs. Potential conflicts are identified andrestrictions described for each field..
In general, each field receives a minimum thirty dayrest during the growing season and ninety day rest duringthe dormant season to promote plant vigor. Detaileddescriptions of each year�s moves are outlined in theAGP for each allotment.
As discussed in Section 3.5, grazing to minimize firerisks along the urban interface occurs annually. All otherfields are managed toward a rotation-grazing schemethat will provide unused feed for use during years oflow forage production.
During spring and summer the animals are moved intofields within terminal reservoir basins. These fields willhave a light carrying capacity to provide �banked� feed.This feed is utilized during drought situations and maybe subject to include winter grazing. These �Early-Use Fields� are included in the AMP�s as they occuron each allotment. These fields will have riparian areasand free water excluded from livestock and, wherepossible, positioned at the upper reaches of the basin.
� Riparian Areas
Riparian areas are described and any specialmanagement practices necessary to protect waterquality will be defined. In terminal reservoirwatersheds, perennial streams are out-fenced with a100 foot buffer, and late-running intermittent streamswill be deferred from livestock grazing until summerwhen practical. Numerous small springs and seepsare grazed according to the pasture rotation systemdue to negligible impact on water quality.
North WatershedThree Corner Flat
1995
SCHOOLS IN CREEKS
RESTORATION PROGRAM
North WatershedThree Corner Flat
2001

Section 5GRAZING PROGRAM COMPONENTS
5 - 7
RRRRR A N G EA N G EA N G EA N G EA N G E
RRRRRESOURCEESOURCEESOURCEESOURCEESOURCE
MMMMMANAGEMENTANAGEMENTANAGEMENTANAGEMENTANAGEMENT
PPPPP L A NL A NL A NL A NL A N
Protection measures for pond maintenance andconstruction include biological surveys by EBMUDF&W staff and erosion control, plus seeding andmulching the site with native grasses.
� Water Sources
Table 2 within the AMP in Section 5 lists the numberand types of water developments by field. Waterdistribution problems are noted.
5.1.4 Biodiversity Concerns
� Special Status Species and Sensitive Habitat
The identification of special status species has beenrecorded on EBMUD watershed property. Topreserve and protect these species, necessaryprecautions will be taken and EBMUD F&W Biologistsconsulted when developing management strategies inthe Annual Grazing Plans (AGP�s). Within each AGP,management measures and Best Management Practices(BMP�s) will be listed for the protection of thesesensitive plant and animal species and their habitats.
� Areas of Significant Biodiversity
Potential impacts to biodiversity will be addressed ineach AGP. If monitoring data indicates that grazing ishaving an impact on biodiversity, management practiceswill be amended accordingly.
Riparian areas will not be grazed as specified in theEBWMP, Guidelines WQ 20, WQ.35, and LG 1. Oaksavannas will be deferred from grazing during thesummer and early fall months to encourage seedlingrecruitment. Native grasslands will be grazed accordingto water quality and special status species restrictionsprovided there are sufficient rest periods to enhanceperennial plant vigor.

Section 5GRAZING PROGRAM COMPONENTS
5 - 8
RRRRR A N G EA N G EA N G EA N G EA N G E
RRRRRESOURCEESOURCEESOURCEESOURCEESOURCE
MMMMMANAGEMENTANAGEMENTANAGEMENTANAGEMENTANAGEMENT
PPPPP L A NL A NL A NL A NL A N
� Noxious Weed Management
Significant noxious weed populations are identified, andmanagement plans are included in the AGP inaccordance with EBMUD�s IPM plan. Responsibilityfor monitoring and control are defined in the AGP.
5.1.5 Fire Management
The goal of the Fire Management Plan (FMP) is to maintainthe current vegetation mosaic through periodic grazing.The FMP, approved by EBMUD in 2001, recommendsmaintaining the vegetation mosaic that has existed since1997, which is adequate to provide sufficient fire protectionon District lands. The vegetation mosaic is partially the resultof historic grazing levels and stocking rates.
Areas of priority grazing in each allotment are identified tomeet the goals of the FMP as well as the RRMP. Theseareas of distinct recommendations represent priorities withrespect to fuel reduction.
There are five classifications of priorities for fuel reduction:
(1) Essential - Grassland fuels in interface areas thatrequire grazing or an alternative treatment such asdisking, mowing, or strategically located roadtreatments.
(2) Preferred - Grasslands adjacent to interface areas,which are designed to support fire protection benefitsof essential areas.
(3) Current - Current represents a �neutral� firerecommendation in terms of grazing or not grazing. Iffuel loading is significant, however, increased grazingwill be necessary to maintain reasonable loads.
(4) Agricultural - tilled or grazed late in the season.
(5) Non-Grazing � Areas identified by the EBMUD

Section 5GRAZING PROGRAM COMPONENTS
Fisheries and Wildlife staff to be protected due to theexistence of special status species and sensitivehabitat.
5.1.6 Improvements
Range improvements such as water developments, fencing,or erosion control are identified and prioritized accordingto water quality and biodiversity goals. A schedule forcompletion is included.
5.1.7 Cultural Resources
Culturally sensitive sites will be identified prior to thecommencement of any new ground-disturbing activities.These activities may include new pond construction or springdevelopment, or the rare instance where heavy equipmentis used to clear vegetation prior to new fence construction.Records and site searches will be conducted before grounddisturbance, and monitoring will take place for the durationof the project.
5.1.8 Best Management Practices (BMP�s)
Best Management Practices are approved for the state ofCalifornia by the Natural Resources Conservation Service(NRCS) and are recommended as standards for the designof measures used to treat impacts that affect our naturalresources. Standards that are applicable to each allotmentare listed in this section. A complete listing of all standardsrecommended for California by the NRCS can be obtainedat the following website: sec4.htm
5.1.9 GIS and Map of Allotme
The EBMUD GIS has been update the data used in an Acoverage�s are used to mapecological, and biological ch
Included with each AMP is
http://www.ca.usda.gov/rts/
5 - 9
RRRRR A N G EA N G EA N G EA N G EA N G E
RRRRRESOURCEESOURCEESOURCEESOURCEESOURCE
MMMMMANAGEMENTANAGEMENTANAGEMENTANAGEMENTANAGEMENT
PPPPP L A NL A NL A NL A NL A N
nt
designed to store, analyze andMP. ArcInfo (GIS Software) and catalogue the physical,aracteristics of the land.
a map of the allotment. The

Section 5GRAZING PROGRAM COMPONENTS
5 - 10
RRRRR A N G EA N G EA N G EA N G EA N G E
RRRRRESOURCEESOURCEESOURCEESOURCEESOURCE
MMMMMANAGEMENTANAGEMENTANAGEMENTANAGEMENTANAGEMENT
PPPPP L A NL A NL A NL A NL A N
maps serve as a visual tool for communicating importantinformation about the allotment to the public, ranchers andDistrict personnel. These site maps describe physicalcharacteristics such as fences, roads, culturally sensitiveareas, water developments, pastures and theircorresponding numbers, streams, lakes, and project areas.
� AUM Calculation
The GIS is used to calculate forage production for eachpasture in AUM�s. Acreages for two plant communitiesonly, grassland and oak savanna, are used for thecalculation. Forage production of grasses for range sites(see Table 5-1) are based on the soil type mapped bythe Contra Costa County Soil Survey. The RDMrequirements for the three slope classes are subtractedfrom the forage production figures, and the availableAUMs are calculated for each pasture. Favorable,normal, and unfavorable rainfall amounts are used togive a range of estimates for AUMs. An AUM is equalto 800 lb. of forage. The AUMs leased for managementpurposes are less than the available GIS AUMs to allowfor inefficiencies in livestock distribution.
Table 5-1. Grassland Range Sites, Normal Productivity, andEstimated Proper Stocking Rate for EBMUD Lands
Range Site Total Yield1 Available Forage Stocking Rate (lb./acre) (lb./acre) (AUM/acre)2
Clayey 4500 3300 4.1Fine Loamy 3000 1800 2.25Loamy 2000 800 1Shallow Fine Loamy 1800 600 0.75Shallow Loamy 1800 600 0.75Gravelly Loam 1500 600 0.75Shallow Coarse Loamy 1400 200 0.25Sandy 700 0 0
1 Figures in use by the NRCS in Alameda and Contra Costa Counties(USDA Soil Conservation Service 1981)2 An AUM = 800 lb. forage, air-dry weight basis (ADWB).

Section 5GRAZING PROGRAM COMPONENTS
5 - 11
RRRRR A N G EA N G EA N G EA N G EA N G E
RRRRRESOURCEESOURCEESOURCEESOURCEESOURCE
MMMMMANAGEMENTANAGEMENTANAGEMENTANAGEMENTANAGEMENT
PPPPP L A NL A NL A NL A NL A N
5.2 Annual Grazing Plan (AGP)
The AGP is an annual plan that is developed from the 5-year AMP.The AGP establishes working goals for both EBMUD and thelessee. EBMUD works with the lessee to discuss the prior year�soutcome and set priorities and expectations for the coming year.AGP�s are normally completed by January 1 for the following grazingyear. Some key elements of the AGP are as follows:
� Endangered species� Fire and fuels� Noxious weeds� Pasture rotation� Restoration projects� Grazing schedule� Long-term maintenance� Projects and improvements
5.3 Grazing Tenant Selection Procedures
Grazing parcels may become available when an old lease isterminated and reopened or when new property is acquired anddeemed suitable for grazing.
EBMUD uses an appraisal method for selecting new grazing tenants.The appraisal method considers a variety of relevant criteria todetermine the best applicant. This allows EBMUD to lease totenants most qualified to maintain and enhance range and watershedresources according to EBMUD standards.
The common alternative to the appraisal method is the economicbid system. Although bidding systems are financially beneficial,they may not promote proper range management. A bidding systemcan force potential lessees to bid beyond their economic means,causing the awarded lessee to overcome the financial loss by takingeconomic short cuts and using improper range practices, includingoverstocking. For existing tenants, the insecurity of a system thatopens the lease for bid every five years results in uncertainty anddeferred maintenance. There is little incentive for tenant participationin long-term range management programs or improvements.
The following procedure will be used in the selection of tenants fornew or vacant grazing parcels:
Section 5GRAZING PROGRAM COMPONENTS
5 - 12
RRRRR A N G EA N G EA N G EA N G EA N G E
RRRRRESOURCEESOURCEESOURCEESOURCEESOURCE
MMMMMANAGEMENTANAGEMENTANAGEMENTANAGEMENTANAGEMENT
PPPPP L A NL A NL A NL A NL A N
5.3.1 List of Interested Parties
The Watershed and Recreation Division will maintain anongoing list of all people interested in acquiring an EBMUDgrazing lease.
5.3 .2 Advertisement of Available Parcel
When a grazing parcel becomes available it will beadvertised in local newspapers and trade journals. Theadvertisement will also be posted conspicuously on theavailable property and on the nearest public road.
5.3 .3 Application Packet
The Watershed and Recreation Division will send anapplication packet to all interested parties. The packet willconsist of:
� The Request for Proposal (RFP)� A copy of the master-grazing lease.� A description of the parcel(s) to be leased including
the gross acres and AUMs.� Dates when the vacant parcel(s) will be shown.
5.3 .4 Qualifications Appraisal Panel
The Watershed and Recreation Division will convene aqualification appraisal panel. This panel will consist of tworepresentatives from EBMUD and two representatives fromoutside agencies. All panel members will have recentexperience in development or administration of a rangemanagement program.
5.3 .5 Selection of Finalists
The panel will review and rate each completed RFP. Eachquestion will be evaluated on a point scale. Each vacantparcel will be considered independently. The applicantswith the three highest scores will be selected as finalists(see �Guidelines for Review of Prospective TenantQuestionnaires,� Section 5.5, and �ApplicantQuestionnaire,� Appendix F).

Section 5GRAZING PROGRAM COMPONENTS
5 - 13
RRRRR A N G EA N G EA N G EA N G EA N G E
RRRRRESOURCEESOURCEESOURCEESOURCEESOURCE
MMMMMANAGEMENTANAGEMENTANAGEMENTANAGEMENTANAGEMENT
PPPPP L A NL A NL A NL A NL A N
5.3.6 Interview of Finalists
Finalists will be interviewed at their current cattle operation.The operation will be evaluated on the basis of best rangemanagement practices. This will give the panel anopportunity to ask additional questions if necessary (seeSection 5.6 �Guidelines for Review of Grazing LeaseFinalists,� and Appendix J, Applicant Questionnaire).
5.3 .7 Final Decision
Each panel member will independently rank each candidateand a composite list will be compiled from these rankings.In the event of a tie, the Manager of Watershed andRecreation, after consultation with the panel members, willcast the deciding vote.
5.3 .8 Award of Lease
After approval by EBMUD Board of Directors, the numberone ranked candidate will be awarded the lease. Allunsuccessful candidates will be notified in writing. Anexplanation of the Panel�s decision will be provided uponrequest.
Lease award will be based on the following criteria:
a. Completeness and accuracy of the RFP (falsificationon any accounts will be ground for disqualification).
b. Financial stability.
c. Adjacency of other range parcels.
d. Experience with integrated pest managementtechniques.
e. Ability to respond quickly to problems andemergencies.
f. Any other related experience that will guarantee theconservation of the range resource.

Section 5GRAZING PROGRAM COMPONENTS
5 - 14
RRRRR A N G EA N G EA N G EA N G EA N G E
RRRRRESOURCEESOURCEESOURCEESOURCEESOURCE
MMMMMANAGEMENTANAGEMENTANAGEMENTANAGEMENTANAGEMENT
PPPPP L A NL A NL A NL A NL A N
5.3.9 Appeal Process
In the event that an applicant feels the selection was unfairor the selection process was improperly carried out, thefollowing procedure will apply:
a. Applicant will appeal to the Manager of NaturalResources in writing.
b. The Manager of Natural Resources will arrange ameeting of EBMUD Council, Manager of Watershedand Recreation and the complainant.
c. At this meeting, the complainant will have theopportunity to explain why he/she feels that the awardprocess was unfair or improper.
5.4 Leases
The grazing lease is a comprehensive document covering all aspectsof livestock management on EBMUD�s Watershed lands. Theseleases are offered in one and five year terms. Some key elementsare as follows:
� Rent, including how AUM�s are calculated.� Grazing capacity� Livestock distribution� RDM� AGP format
Related Documents