Random mutagenesis by error-prone Pol I plasmid replication in Escherichia coli David L. Alexander, Joshua Lilly, Jaime Hernandez, Jillian Romsdahl, Christopher J. Troll, and Manel Camps Microbiology and Environmental Toxicology Dept., University of California at Santa Cruz. Summary Directed evolution is an approach that mimics natural evolution in the laboratory with the goal of modifying existing enzymatic activities or of generating new ones. The identification of mutants with desired properties involves the generation of genetic diversity coupled with a functional selection or screen. Genetic diversity can be generated using PCR or using in vivo methods such as chemical mutagenesis or error-prone replication of the desired sequence in a mutator strain. In vivo mutagenesis methods facilitate iterative selection because they do not require cloning, but generally produce a low mutation density with mutations not restricted to specific genes or areas within a gene. For this reason, this approach is typically used to generate new biochemical properties when large numbers of mutants can be screened or selected. Here we describe protocols for an advanced in vivo mutagenesis method that is based on error-prone replication of a ColE1 plasmid bearing the gene of interest. Compared to other in vivo mutagenesis methods, this plasmid-targeted approach allows increased mutation loads and facilitates iterative selection approaches. We also describe the mutation spectrum for this mutagenesis methodology in detail and, using cycle 3 GFP as a target for mutagenesis, we illustrate the phenotypic diversity that can be generated using our method. In sum, error-prone Pol I replication is a mutagenesis method that is ideally suited for the evolution of new biochemical activities when a functional selection is available. Keywords mutagenesis; pol I; directed evolution; genetic adaptation; mutation spectrum; GFP; Okazaki fragment 1. Introduction Directed evolution is a widely used method for optimization of existing biological activities or for the creation of new ones (1,2). This approach involves two basic steps: (a) generation of genetic diversity; and (b) identification of mutants with desired properties. Following mutagenesis, individual clones are screened or libraries are put through functional selection to obtain individual mutants with the desired properties. Corresponding author: Manel Camps, [email protected]. NIH Public Access Author Manuscript Methods Mol Biol. Author manuscript; available in PMC 2014 July 28. Published in final edited form as: Methods Mol Biol. 2014 ; 1179: 31–44. doi:10.1007/978-1-4939-1053-3_3. NIH-PA Author Manuscript NIH-PA Author Manuscript NIH-PA Author Manuscript

Welcome message from author
This document is posted to help you gain knowledge. Please leave a comment to let me know what you think about it! Share it to your friends and learn new things together.
Transcript
Random mutagenesis by error-prone Pol I plasmid replication inEscherichia coli
David L. Alexander, Joshua Lilly, Jaime Hernandez, Jillian Romsdahl, Christopher J. Troll,and Manel CampsMicrobiology and Environmental Toxicology Dept., University of California at Santa Cruz.
Summary
Directed evolution is an approach that mimics natural evolution in the laboratory with the goal of
modifying existing enzymatic activities or of generating new ones. The identification of mutants
with desired properties involves the generation of genetic diversity coupled with a functional
selection or screen. Genetic diversity can be generated using PCR or using in vivo methods such as
chemical mutagenesis or error-prone replication of the desired sequence in a mutator strain. In
vivo mutagenesis methods facilitate iterative selection because they do not require cloning, but
generally produce a low mutation density with mutations not restricted to specific genes or areas
within a gene. For this reason, this approach is typically used to generate new biochemical
properties when large numbers of mutants can be screened or selected. Here we describe protocols
for an advanced in vivo mutagenesis method that is based on error-prone replication of a ColE1
plasmid bearing the gene of interest. Compared to other in vivo mutagenesis methods, this
plasmid-targeted approach allows increased mutation loads and facilitates iterative selection
approaches. We also describe the mutation spectrum for this mutagenesis methodology in detail
and, using cycle 3 GFP as a target for mutagenesis, we illustrate the phenotypic diversity that can
be generated using our method. In sum, error-prone Pol I replication is a mutagenesis method that
is ideally suited for the evolution of new biochemical activities when a functional selection is
available.
Keywords
mutagenesis; pol I; directed evolution; genetic adaptation; mutation spectrum; GFP; Okazakifragment
1. Introduction
Directed evolution is a widely used method for optimization of existing biological activities
or for the creation of new ones (1,2). This approach involves two basic steps: (a) generation
of genetic diversity; and (b) identification of mutants with desired properties. Following
mutagenesis, individual clones are screened or libraries are put through functional selection
to obtain individual mutants with the desired properties.
Corresponding author: Manel Camps, [email protected].
NIH Public AccessAuthor ManuscriptMethods Mol Biol. Author manuscript; available in PMC 2014 July 28.
Published in final edited form as:Methods Mol Biol. 2014 ; 1179: 31–44. doi:10.1007/978-1-4939-1053-3_3.
NIH
-PA
Author M
anuscriptN
IH-P
A A
uthor Manuscript
NIH
-PA
Author M
anuscript
Approaches based on screening try to maximize the frequency of active mutants with the
desired properties by incorporating elements of rational design (1,3), and by optimizing the
mutation spectrum to ensure a balanced representation of mutations and a minimal presence
of inactivating mutations. These mutant libraries typically involve random oligonucleotide
mutagenesis, thus allowing tight control of the target sites, type and frequency of mutations.
By contrast, experimental approaches that include functional selections aim at maximizing
sequence space exploration. This requires balancing a high mutation density (2-5 mutations/
clone) with the preservation of a significant fraction of active mutants. The high mutation
density is required to overcome restrictions on available evolutionary trajectories caused by
sign epistasis, i.e. the presence of mutations whose effects are neutral, positive or negative
depending on the sequence context (4). This need to balance genetic diversity with the need
to preserve catalytic activity has been addressed by two main approaches: (a) by sequential
evolution, i.e. by enriching the library for functional mutants at intermediate steps (although
this can create significant bottlenecks) (5); and (b) by shuffling related sequences, orthologs
or paralogs of the gene of interest (this creates hybrid sequences enriched for activity
relative to their level of amino acid divergence) (6,7). Despite these efforts, the most
advantageous mutants can be missed following functional selections in liquid culture due to
the phenomenon known as clonal interference, where mutants with modest contributions to
fitness compete against each other, preventing the emergence of more infrequent mutants
with higher impact on fitness (8). Biases introduced by clonal interference are increasingly
being addressed by deep sequencing of libraries at different stages of selection (9).
Compared to in vitro methods, in vivo mutagenesis approaches are optimal for sequential
evolution strategies, as they do not require cloning, thereby greatly facilitating iteration.
These methods use mutator strains, i.e. strains that are deficient in one or more mechanisms
of replication fidelity (10), or use exposure to mutagens. The genomic instability associated
with these non-targeted methods limits the mutation rate (which needs to be tolerated by the
host), producing libraries with low mutation densities (~1 point mutation/2-5 kb). In vivo
mutagenesis methods are better suited for functional selection strategies, which can identify
rare clones from large mutant libraries, because of the limited efficiency for mutagenesis of
these methods. In addition, in vivo mutagenesis is not targeted, so mutations outside of the
target gene can lead to changes in gene expression. Mutations in regulatory elements such as
the promoter of the target gene or the plasmid origin of replication can in turn interfere with
selections aimed at optimizing activity through modulation of catalysis. While detrimental in
the context of activity, optimization strategies modulating expression can facilitate the
evolution of new biochemical activities by enhancing promiscuous activities often present in
target enzymes (11,12). Thus, in vivo mutagenesis is ideally suited for the evolution of new
biochemical activities when a functional selection is available.
Here we present a mutagenesis system that has several advantages over other in vivo
mutagenesis approaches. Our method is based on replication of a ColE1 plasmid bearing the
gene of interest by an error-prone DNA polymerase I (Pol I). Pol I is a polymerase
specialized in ColE1 plasmid replication, although it also plays a role in processing Okazaki
primers during lagging-strand synthesis, and in small-gap filling during DNA repair.
Therefore, error-prone Pol I replication limits mutagenesis to ColE1 plasmid sequence,
Alexander et al. Page 2
Methods Mol Biol. Author manuscript; available in PMC 2014 July 28.
NIH
-PA
Author M
anuscriptN
IH-P
A A
uthor Manuscript
NIH
-PA
Author M
anuscript
largely sparing the genome (which is replicated by a different polymerase, Pol III) and
allowing a higher mutation load in the target of interest (13).
The error-prone DNA polymerase I that we use (low fidelity-Pol I or “LF-Pol I”), bears
three mutations, namely I1709N (in motif A), A759R (in motif B) and D424A (in the
proofreading domain) (14,15). LF-Pol I is expressed in an Escherichia coli strain, JS200,
which has a temperature-sensitive allele of Pol I (polA12) (16) so that LF-Pol I becomes the
predominant Pol I activity at 37 °C. Replication of the ColE1 plasmid-borne target sequence
in polA12 cells under restrictive conditions results in the generation of a random mutant
library. Our system also produces mutations in wild-type strains of E. coli but at a 3 to 5-
fold lower mutation frequency (data not shown). Mutagenesis is more efficient in saturated
cultures as compared with exponential cultures (14). LF-Pol I mutagenesis is not continuous
in culture: mutation rates decrease substantially after the initial culture grown under
restrictive conditions reaches saturation; this is true even if this culture is diluted and then
subsequently expanded. Therefore, obtaining high mutation densities (> 1 mutation/kb)
requires multiple iterative rounds of mutagenesis, plasmid recovery and transformation (13).
The likely explanation for this phenomenon is that the establishment of multicopy plasmids
following transformation requires more cycles of replication than subsequent plasmid
maintenance.
This approach is, to our knowledge, the most efficient method of in vivo mutagenesis
available, with the added advantage of easy iteration, a relatively balanced spectrum, and
very few insertions/deletions. Compared to in vitro mutagenesis methods, the main
disadvantages of this approach are lack of ability to restrict mutagenesis to a target gene
(with the consequent concern about mutations modulating expression rather than activity) or
to a specific area within a target gene, and a partial dependence on polA host strains. Error-
prone Pol I replication is ideally suited for the evolution of new biochemical activities when
coupled with functional selections such as the evolution of extended-spectrum β-lactamase
mutants (14) or of two medium-chain-length terminal alkane hydroxylases (17) because this
capitalizes on the methods’ ability to generate libraries with high complexity and different
levels of expression, which is known to favor the evolution of new biological activities.
Here we describe methods for LF-Pol I mutagenesis of a target plasmid bearing a gene
sequence of interest. The methods discussed here include protocols for competent cell
preparation, for transformation of the target plasmid, for iterative mutagenesis, and for
characterization of the resulting libraries. In subheading 3.7 of this chapter we also provide
detailed data on the mutation spectrum generated by our method.
2. Materials
2.1 Cells
1. E. coli JS200 strains (recA718 polA12 (ts) uvrA155 trpE65 lon-11 sulA): JS200-
WT, i.e. JS200 cells expressing wild type (wt) Pol I; and JS200-EP, i.e. JS200
expressing error prone (EP) Pol I. The JS200-EP and JS200-WT strains, as well as
the LF Pol I-bearing plasmid, its map and sequence are available by request
through the Addgene plasmid repository (http://www.addgene.org/).
Alexander et al. Page 3
Methods Mol Biol. Author manuscript; available in PMC 2014 July 28.
NIH
-PA
Author M
anuscriptN
IH-P
A A
uthor Manuscript
NIH
-PA
Author M
anuscript
2. Readout strain, JS200-WT or (for complementation) a strain lacking the specific
activity that is being evolved such as Top10 (Invitrogen, Grand Island, NY, USA).
2.2 Media
1. LB Agar and LB broth were purchased from Fisher Scientific (Fair Lawn, NJ,
USA) and prepared according to vendor specifications.
2. Mutagenesis experiments in liquid culture were carried out in 2XYT rich media
containing 0.016g/ml Bacto Tryptone, 0.01g/ml Bacto Yeast Extract and 0.005g/ml
NaCl suspended in deionionized water.
2.3 Antibiotics
Antibiotics were purchased from Sigma-Aldrich (Saint Louis, MO, USA)
1. Tetracycline: prepared as a concentrated stock in 50% ethanol to allow dilution to a
final concentration 12.5 μg/ml.
2. Chloramphenicol: prepared as a concentrated stock in 100% ethanol to allow
dilution to a final concentration 35 μg/ml.
3. Carbenicillin: prepared as a concentrated stock in water to allow dilution to a final
concentration 100 μg/ml.
2.4 Plasmids
1. Pol I Plasmid, i.e. pHSG576 plasmid bearing the sequence of the LF-Pol I gene.
This plasmid, which carries a pSC101 (Pol I- independent, ColE1-compatible)
origin of replication with chloramphenicol as a resistance marker (18), provides the
error prone polymerase activity.
2. Examples of ColE1 plasmids into which the target gene may be cloned include the
pUC, pBR, pLitmus (New England Biolobs, Ipswich, MA, USA) and Topo vectors
(Clontech, Mountain View, CA, USA).
2.5 Plasmid Purification Kits
1. To mini-prep plasmid DNA we used a NucleoSpin Plasmid Purification Kit,
Machery-Nagel, Duren, Germany.
2. To purify restriction digests we used a Gel and PCR Clean-up Kit, Machery-Nagel,
Duren, Germany.
2.6 Electroporation Equipment
1. For plasmid electroporation, we used the Electroporator 2510 (Eppendorf, New
York, NY, USA).
2. 2mm Gap Cuvettes used for electroporation were purchased from Molecular
Bioproducts (Santa Clara, CA, USA).
Alexander et al. Page 4
Methods Mol Biol. Author manuscript; available in PMC 2014 July 28.
NIH
-PA
Author M
anuscriptN
IH-P
A A
uthor Manuscript
NIH
-PA
Author M
anuscript
2.7 Restriction Enzymes
1. The restriction enzymes we used to linearize the plasmids were purchased from
New England Biolabs (Ipswich, MA, USA.)
2.8 Flow Cytometrey
1. The cytometer used for library characterization was a BD Influx Cytmometer, BD
Biosciences (San Jose, CA, USA).
2. 8X BioSure Sheath Solution, purchased from BioSure (Grass Valley, CA, USA)
and diluted to 1X in sterile DI water was used to run samples through the
cytometer.
3. Methods
3.1 Preparation of electrocompetent JS200 cells (for a protocol to make chemicallycompetent cells, see Note 1)
1. Pick a single E. coli JS200 colony transformed with the Pol I plasmid into a flask
containing 8 ml of LB plus antibiotic. These colonies are grown on LB plates with
appropriate antibiotic selection (for pHSG576, 30 μg/ml chloramphenicol). The
culture is grown shaking at 200 rpm overnight at 30 °C (see Note 2).
2. The next morning, expand the culture by adding the 8 ml overnight culture into a
flask containing 400 ml LB with the same antibiotic concentration. Allow this
culture to grow at 30 °C while shaking at 200 rpm to an OD600 of 0.5-0.7 (ca. 3-4
h).
3. Initiate a glycerol wash by first chilling cells on ice for 20 minutes. Cells are then
pelleted by centrifugation (e.g. in an Eppendorf 5810R, 20 minutes at 3220 rcf at 4
°C). Remove supernatant, then re-suspend cells in cold 10% (w/v) glycerol solution
using a sterile serological pipette.
4. Transfer re-suspended cell solution to a 50 ml conical tube and bring to a final
volume of 45 ml in cold 10% (w/v) glycerol. Pellet cells by centrifugation, remove
supernatant and re-suspend cells in cold 10% (w/v) glycerol. Repeat this step twice
so that cells are washed a total of three times in a fresh exchange of 10% (w/v)
glycerol solution to remove all traces of salts. Cells and wash solution need to be
kept on wet ice or at 4 °C throughout this process.
5. After final wash, re-suspend the cell pellet in ~2ml of 10% (w/v) glycerol
(approximately twice the pellet volume). Aliquot in volumes for single
experimental use to minimize freeze and thaw. Quick-freeze aliquots in dry ice, and
store at −80 °C.
1An alternative here is to prepare chemically competent cells as follows. E. coli JS200 cells are grown as described in 3.1 but washedwith a buffered CaCl2 solution: 60 mM CaCl2, 15% glycerol, 10 mM Hepes (4-(2-hydroxyethyl)-1-piperazineethanesulfonic acid). Asper the preparation of electrocompetent cells, cultures are grown to log phase, chilled in wet ice, pelleted by centrifugation and washedinto the CaCl2 solution. Three washes are used to concentrate cells. Pelleted cells are re-suspended into approximately twice the pelletvolume of cold CaCl2 solution and aliquots are quick frozen on dry ice prior to storage at −80 °C.2E. coli JS200 parental cells are tetracycline resistant. The pHSG576 plasmid is maintained in JS200 cells with chloramphenicolselection.
Alexander et al. Page 5
Methods Mol Biol. Author manuscript; available in PMC 2014 July 28.
NIH
-PA
Author M
anuscriptN
IH-P
A A
uthor Manuscript
NIH
-PA
Author M
anuscript
6. Cells should be thawed slowly on wet ice for electro-transformation.
3.2 Direct Plating Mutagenesis (for alternative liquid mutagenesis protocol, see Note 3)
1. Make E. coli JS200 EP and WT strains electrocompetent, using the protocol
outlined above (permissive conditions, i.e. 30 °C and exponential growth).
2. Transform target plasmid of choice by electroporation into 40 μl of
electrocompetent E. coli JS200 WT or EP cells. We use an Eppendorf 2510
electroporator and 2mm gap cuvettes (Molecular Bioproducts) at 1800 V (see
Notes 4 and 5).
3. Recover cells in 1 ml of LB broth for 40 min at 37 °C with shaking at 200 rpm.
4. Plate cells at a “near lawn” concentration on LB-agar plates containing
chloramphenicol and the antibiotic selecting for the target plasmid. Plates need to
be pre-warmed to 37 °C and maintained at this restrictive temperature during
plating (see Notes 6 and 7).
5. Incubate plates under restrictive conditions, i.e. 37 °C, overnight.
3.3 Plasmid Recovery
1. Collect colonies from LB-agar plates by washing with 2 ml LB broth. Add 1 ml
first, spread with a sterile glass rod and collect wash into appropriate size tube.
Repeat with another 1 ml of LB broth (see Note 8).
2. Isolate plasmid DNA from the wash (mini-prep) (eg. using Machery-Nagel
NucleoSpin DNA purification kit) to obtain the genetic library (see Note 9).
3.4 Readout/Iteration
1. To make sure both plasmids are present and there is no additional plasmid
contamination, digest your isolated plasmid DNA with a restriction enzyme(s) that
3An alternative here is to undertake the mutagenesis in liquid cultures (“liquid mutagenesis”). E. coli JS200 cells are transformed withtarget plasmids as outlined above. The transformants are then recovered for 1 h shaking at 30 °C in 1 ml of LB broth. After therecovery period, cells are plated at 30 °C on LB agar containing 100 μg/ml carbenicillin. Single colonies are then picked and allowedto grow in 4 ml of LB broth at permissive temperature (30 °C) shaking overnight. For mutagenesis, the overnight cultures are dilutedto a factor of 1:103- 1:105 in 4 ml pre-warmed (37 °C) 2XYT media. Cells are grown, shaking at 200 rpm, for 1 to 3 days to reachsaturation or hypersaturation. Plasmids are then isolated using a DNA miniprep kit and sequenced.4pGFPuv, a plasmid encoding GFP and available from Clontech (http://www.clontech.com/) is routinely transformed as a control formutagenesis (see Note 10).5An alternative here is transformation of chemically competent cells. Chemically competent E. coli JS200 cells are thawed on wet iceand 100 μl of cells are mixed with up to 1 μg (no more than 10 μl) of the isolated plasmid library. Cells and plasmid are incubated onwet ice for 10 min, then heat-shocked at 42 °C for 2 min. Cells are recovered at 37 °C in 1 ml of LB with shaking at 200 rpm and thenplated at a near lawn density on LB plates containing chloramphenicol and the antibiotic selecting for the target plasmid.Transformation of chemically competent E. coli JS200 cells is less efficient than electroporation, but this is balanced by the greateramount of DNA that can be used in the transformation, the simplicity of the procedure, and the consistency of the results.6A near lawn concentration is defined as distinct, but uncountable colonies (> 1000 colonies per 100 mm petri dish).7The dilution of cells plated following transformation is empirically determined for each preparation of electro-competent cells.Generally 50 μl of cells from the 1 ml culture where cells are allowed to recover following transformation will yield a near lawn.8Plate washing is transferring the bacterial colonies from the LB plate to LB broth by adding to a small volume (1 ml) of LB broth and“scrubbing” them off the plate with a sterile apparatus, such as a glass or metal plate spreader. Avoid collecting any visible amounts ofagar.9The wash collected from the LB plate may be too dense to mini-prep in its entirety. If this is the case, mini-prep the maximumamount recommended by the manufacturer of your mini-prep kit (typically, this involves diluting your wash to an OD600 of 1.0 andusing ~3 ml of the diluted culture for the mini-prep).
Alexander et al. Page 6
Methods Mol Biol. Author manuscript; available in PMC 2014 July 28.
NIH
-PA
Author M
anuscriptN
IH-P
A A
uthor Manuscript
NIH
-PA
Author M
anuscript
linearizes both the target plasmid and the pHSG plasmid. Run this digest on an
agarose gel and stain to visualize the two bands of appropriate size.
2. To eliminate the Pol plasmid, digest your mini-prep with a restriction enzyme that
linearizes the Pol plasmid but does not cut the target plasmid (see Note 10).
3. Clean up the restriction digest using a DNA purification column (eg. Macherey-
Nagel Gel and PCR clean-up kit) to remove salts that interfere with subsequent
retransformation in the iterative plasmid mutagenesis.
4. For iterative mutagenesis, re-transform the restricted target plasmid library
preparation into fresh E. coli JS200 EP cells and carry out subsequent rounds of
mutagenesis. It is estimated that mutations will accumulate at a rate of 0.56
mutations /kbp/cycle.
5. Re-transform the isolated restriction digested plasmid library into the readout strain
to characterize the mutant phenotypes (see Note 11).
3.5 Sequencing for mutation frequency and mutant genotype
1. The library is characterized following iterative library generation by direct
sequencing of the plasmid-borne target gene in individual colonies. To separate
individual plasmids prior to sequencing, the plasmid library needs to be
transformed into a readout strain or other bacterial strain not expressing the LF-Pol
(see Note 12).
2. Cultures are plated at a density of ~100 colonies per 100 mm LB-agar dish and
allowed to grow to 1 mm in diameter.
3. Individual colonies are picked and subjected to rolling circle amplification (RCA)
(19). The product of RCA then serves as a template for single primer extension and
dye terminator sequencing of the target gene and regulatory regions of the target
plasmid (see Note 13).
4. Individual mutants coming out of a functional selection are similarly sequenced. In
this case the plasmid DNA is purified prior to sequencing so that mutant plasmids
are available for testing. Testing involves retransformation of the sequenced
plasmid into naïve readout cells for preliminary phenotypic characterization.
Phenotypes need to be confirmed after re-cloning the candidate mutations into a
fresh plasmid, as the observed phenotype for a given plasmid could be caused by
mutations outside the sequenced area.
10This control can be omitted unless the presence of the EP plasmid interferes with the readout.11Quantification of GFP mutagenesis can be carried out in the E. coli JS200 strain expressing wild-type Pol I or in Top10 or similarE. coli strains supportive of ColE1 plasmid replication. Following one round of LF-Pol mutagenesis, transformation of the recoveredpGFPuv library into a readout strain produces ~10% of colonies with visibly decreased fluorescence on solid plates (under UV light).12In the absence of a selection, given that the ColE1 target plasmid is present in multiple copies, mutagenesis in E. coli JS200-EPcells would be expected to produce mixed sequences. Retransformation of the library separates individual plasmids, producing amajority of unambiguous sequences, and thus facilitates the characterization of the library.13Mutations in the plasmid origin of replication (ori) can alter the overall plasmid copy number in individual cells. Rolling circleamplification minimizes the effect of plasmid copy number variation because it uses random hexamers and Phi29 DNA polymerase toproduce single stranded, linear concatenated copies of the circular sequence (19).
Alexander et al. Page 7
Methods Mol Biol. Author manuscript; available in PMC 2014 July 28.
NIH
-PA
Author M
anuscriptN
IH-P
A A
uthor Manuscript
NIH
-PA
Author M
anuscript
3.6 Example application
To characterize our mutagenesis system, we put the plasmid pGFPuv, which bears the
“cycle 3” variant of GFP as a reporter (20), through four rounds of mutagenesis as described
above. We then characterized the resulting library by transforming the recovered plasmid
population into Top10 cells (Invitrogen). Fig. 1 shows the diversity of fluorescence
intensities obtained, both for individual colonies on an LB agar plate (panel a) and for
individual cells in suspension (panel b). For reference, panel b also shows the flow
cytometry distribution of fluorescence intensity for the parental pGFPuv plasmid and for
untransformed cells. Note that the fraction of library clones with increased fluorescence is
comparable to the fraction exhibiting decreased fluorescence relative to the parental control.
Given that for protein-coding sequences gain-of-function mutations generally represent only
a small fraction of the total (0.5-1%, compared to 30-50% for loss-of function) (5), the high
representation of mutants that are brighter than the wild-type in our library is almost
certainly attributable to mutations modulating expression.
3.7 Mutation spectrum
Pol I is a specialized polymerase involved in ColE1 plasmid replication. Pol I initiates
ColE1 plasmid replication by extending an RNA primer transcribed from the plasmid ori
sequence. This extension (corresponding to nascent leading-strand) continues until the
replication complex with Pol III is loaded, a process generally known as “polymerase
switch” (reviewed in (21)). Pol III is a dimeric enzyme containing two core subassemblies
(one for each strand) that performs coupled, high-speed replication of the two strands at the
replication fork (reviewed in (22)).
We identified an area of 100-150 bp sequence immediately upstream of the polymerase
switch that appears to be replicated by Pol I exclusively, providing the mutation spectrum
for LF-Pol I in the leading strand in vivo (23) (see Notes 14,15). This mutation spectrum,
which is shown in Fig. 2, exhibited a dramatic frequency imbalance between complementary
pairs, which allowed us to designate the most frequent mutations of the pair (A→G, C→T,
A→T, T→G and G→T) as indicators of leading-strand synthesis and the least frequent
(T→C, G→A, T→A, A→C and C→A) as indicators of lagging-strand synthesis. This
analysis showed that beyond the switch (170-250 nt downstream of plasmid replication
initiation) Pol I continues but with no apparent strand preference. Double-stranded
replication balances out differences in mutation frequency between complementary pairs
(23), which explains the remarkably balanced spectrum of LF-Pol I mutagenesis (24) (see
Notes 16, 17).
When we look at how libraries are generated (solid plate vs. growth in suspension; see
Section 3.2 and Note 3) we see differences in mutation spectrum depending on the protocol
14The source of our mutations is in all likelihood LF-Pol I. This conclusion is based on the high frequency of LF Pol I mutagenesis,which is 3-4 orders of magnitude above spontaneous mutation levels, and on the fact that the observed mutation frequency in vivocorrelates with the fidelity of Pol I in vitro (15).15The spectrum of LF-Pol I mutations we see in vivo has in all likelihood been modulated by proofreading mechanisms, notably bymismatch repair (MMR). MMR should not interfere with the overall distribution of mutations, which is the basis for our mutationfootprint, but would be expected to have a major impact on the mutation spectrum, selectively suppressing certain base pairsubstitutions (transitions, especially T→C mutations).
Alexander et al. Page 8
Methods Mol Biol. Author manuscript; available in PMC 2014 July 28.
NIH
-PA
Author M
anuscriptN
IH-P
A A
uthor Manuscript
NIH
-PA
Author M
anuscript
used: solid libraries show more C→T mutations (60%, compared to 40% in liquid media),
whereas libraries generated in liquid culture show more A→G (30% in liquid media
compared to 20% in solid media) and A→T mutations (20% in liquid media compared to
10% in solid media) (23). In both cases, insertion/deletion mutations are very rare (<1% of
total mutations). Fig. 3 summarizes the nucleotide substitution spectrum for double-stranded
error-prone Pol I replication for both types of libraries. Both libraries exhibit a well-
balanced mutation spectrum. Liquid libraries show the most even distribution of nucleotide
substitutions of the two, comparable to that of Mutazyme II in standard error-prone PCR
protocols, while mutations generated in colonies show a moderate predominance of G and C
substitutions.
Acknowledgments
This work was supported by K08 award CA116429-01A1 of the NCI to MC, and by R01 award ES019625-01 ofNIEHS to MC. The authors would like to thank Dr. Roel Schaaper for helpful input on the mutagenic footprint ofLF-Pol I.
References
1. Dalby PA. Strategy and success for the directed evolution of enzymes. Current opinion in structuralbiology. 2011; 21:473–480. [PubMed: 21684150]
2. Yuan L, Kurek I, English J, Keenan R. Laboratory-directed protein evolution. Microbiology andmolecular biology reviews : MMBR. 2005; 69:373–392. [PubMed: 16148303]
3. Lutz S. Beyond directed evolution--semi-rational protein engineering and design. Current opinion inbiotechnology. 2010; 21:734–743. [PubMed: 20869867]
4. Weinreich DM, Watson RA, Chao L. Perspective: Sign epistasis and genetic constraint onevolutionary trajectories. Evolution; international journal of organic evolution. 2005; 59:1165–1174.
5. Bloom JD, Arnold FH. In the light of directed evolution: pathways of adaptive protein evolution.Proceedings of the National Academy of Sciences of the United States of America. 2009; 106(Suppl1):9995–10000. [PubMed: 19528653]
6. Kagami O, Kikuchi M, Harayama S. Single-stranded DNA family shuffling. Methods Enzymol.2004; 388:11–21. [PubMed: 15289057]
7. Zhao H, Zha W. In vitro ‘sexual’ evolution through the PCR-based staggered extension process(StEP). Nat Protoc. 2006; 1:1865–1871. [PubMed: 17487170]
8. Kao KC, Sherlock G. Molecular characterization of clonal interference during adaptive evolution inasexual populations of Saccharomyces cerevisiae. Nature genetics. 2008; 40:1499–1504. [PubMed:19029899]
9. Araya CL, Fowler DM. Deep mutational scanning: assessing protein function on a massive scale.Trends in biotechnology. 2011; 29:435–442. [PubMed: 21561674]
16Double-stranded plasmid replication by LF-Pol I compensates for the frequency bias exhibited by LF-Pol I between complementarypairs. For example, A→G is made 20 times more frequently than T→C by the polymerase, but lagging-strand replication produces 20times more T→C than A→G on the complementary strand, producing a balanced spectrum between complementary pairs. Double-stranded replication of plasmid by Pol I likely explains the balanced mutation spectrum reported for LF-Pol I mutagenesis relative to avariety of other mutagenesis methods (24). Note, however, that balanced nucleotide spectrum, while generally desirable, does notsolve biases inherent to the genetic code, such as the fact that single nucleotide substitutions only produce a subset of all possibleamino-acid substitutions and that these mutations tend to be conservative (for a fuller discussion see (25)).17We found two areas that are predominantly replicated by Pol I on the lagging strand: areas where the RNA fragment priminglagging-strand synthesis is processed by the 5′→3′ exonuclease activity of Pol I (26), and an area associated with replicationreplication (23). These areas are small (approximately 20 and 150 nucleotides, respectively) and therefore comprise a fraction of thetotal mutations, but have a dramatic effect on the local mutation spectrum, producing a spectrum that is the complementary to thatshown in Fig. 2.
Alexander et al. Page 9
Methods Mol Biol. Author manuscript; available in PMC 2014 July 28.
NIH
-PA
Author M
anuscriptN
IH-P
A A
uthor Manuscript
NIH
-PA
Author M
anuscript
10. Nguyen AW, Daugherty PS. Production of randomly mutated plasmid libraries using mutatorstrains. Methods Mol Biol. 2003; 231:39–44. [PubMed: 12824600]
11. Khersonsky O, Tawfik DS. Enzyme promiscuity: a mechanistic and evolutionary perspective.Annual review of biochemistry. 2010; 79:471–505.
12. Soskine M, Tawfik DS. Mutational effects and the evolution of new protein functions. Naturereviews. Genetics. 2010; 11:572–582.
13. Troll C, Alexander D, Allen J, Marquette J, Camps M. Mutagenesis and functional selectionprotocols for directed evolution of proteins in E. coli. Journal of visualized experiments : JoVE.2011
14. Camps M, Naukkarinen J, Johnson BP, Loeb LA. Targeted gene evolution in Escherichia coliusing a highly error-prone DNA polymerase I. Proceedings of the National Academy of Sciencesof the United States of America. 2003; 100:9727–9732. [PubMed: 12909725]
15. Shinkai A, Loeb LA. In vivo mutagenesis by Escherichia coli DNA polymerase I. Ile(709) in motifA functions in base selection. The Journal of biological chemistry. 2001; 276:46759–46764.[PubMed: 11602576]
16. Uyemura D, Lehman IR. Biochemical characterization of mutant forms of DNA polymerase I fromEscherichia coli. I. The polA12 mutation. The Journal of biological chemistry. 1976; 251:4078–4084. [PubMed: 6470]
17. Koch DJ, Chen MM, van Beilen JB, Arnold FH. In vivo evolution of butane oxidation by terminalalkane hydroxylases AlkB and CYP153A6. Appl Environ Microbiol. 2009; 75:337–344.[PubMed: 19011057]
18. Shinkai A, Patel PH, Loeb LA. The conserved active site motif A of Escherichia coli DNApolymerase I is highly mutable. The Journal of biological chemistry. 2001; 276:18836–18842.[PubMed: 11278911]
19. Johne R, Muller H, Rector A, van Ranst M, Stevens H. Rolling-circle amplification of viral DNAgenomes using phi29 polymerase. Trends in microbiology. 2009; 17:205–211. [PubMed:19375325]
20. Miura H, Inoko H, Inoue I, Tanaka M, Sato M, Ohtsuka M. Simple cloning strategy using GFPuvgene as positive/negative indicator. Analytical biochemistry. 2011; 416:237–239. [PubMed:21601558]
21. Camps M. Modulation of ColE1-like plasmid replication for recombinant gene expression. Recentpatents on DNA & gene sequences. 2010; 4:58–73. [PubMed: 20218961]
22. McHenry CS. DNA replicases from a bacterial perspective. Annual review of biochemistry. 2011;80:403–436.
23. Troll CJ, Yoder J, Alexander D, Hernández J, Loh Y, Camps M. Mutagenic footprint of low-fidelity Pol I replication in E. coli reveals an extensive interplay between Pol I and Pol III duringColE1 plasmid replication. Current Genetics. Nov 2.2013 epub ahead of time.
24. Wong TS, Roccatano D, Zacharias M, Schwaneberg U. A statistical analysis of randommutagenesis methods used for directed protein evolution. Journal of molecular biology. 2006;355:858–871. [PubMed: 16325201]
25. Wong TS, Zhurina D, Schwaneberg U. The diversity challenge in directed protein evolution.Combinatorial chemistry & high throughput screening. 2006; 9:271–288. [PubMed: 16724918]
26. Allen JM, Simcha DM, Ericson NG, Alexander DL, Marquette JT, Van Biber BP, Troll CJ,Karchin R, Bielas JH, Loeb LA, et al. Roles of DNA polymerase I in leading and lagging-strandreplication defined by a high-resolution mutation footprint of ColE1 plasmid replication. NucleicAcids Res. 2011; 39:7020–7033. [PubMed: 21622658]
Alexander et al. Page 10
Methods Mol Biol. Author manuscript; available in PMC 2014 July 28.
NIH
-PA
Author M
anuscriptN
IH-P
A A
uthor Manuscript
NIH
-PA
Author M
anuscript
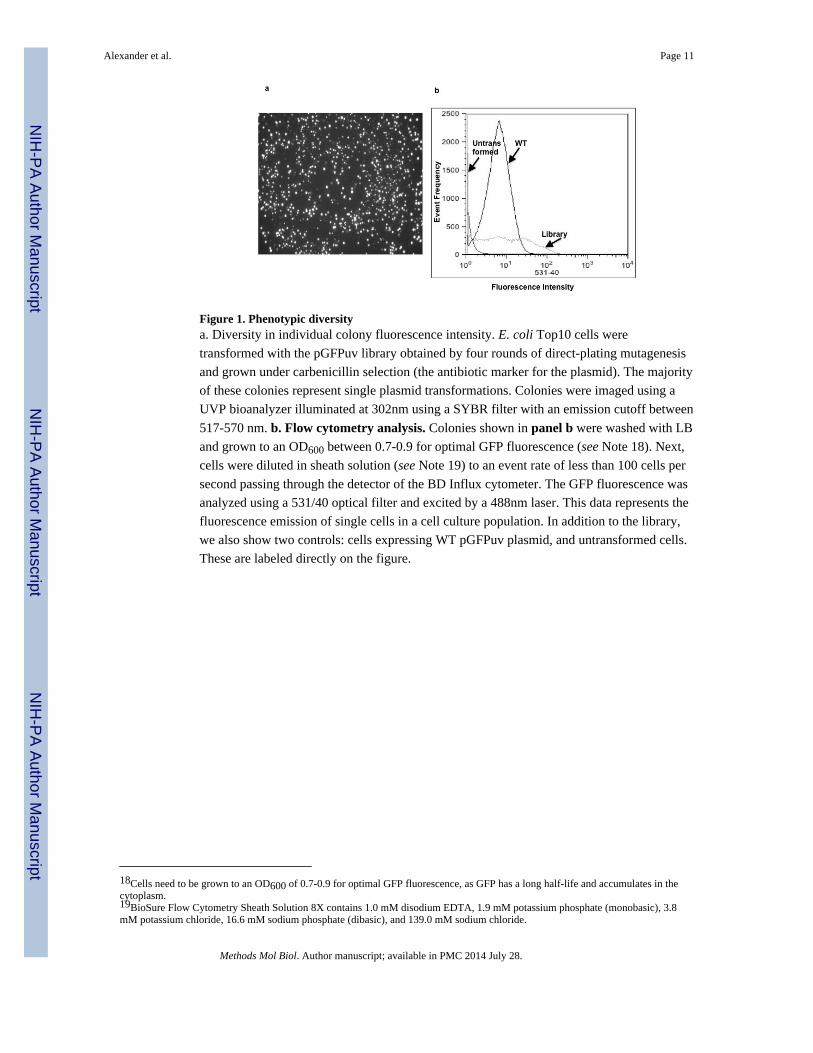
Figure 1. Phenotypic diversitya. Diversity in individual colony fluorescence intensity. E. coli Top10 cells were
transformed with the pGFPuv library obtained by four rounds of direct-plating mutagenesis
and grown under carbenicillin selection (the antibiotic marker for the plasmid). The majority
of these colonies represent single plasmid transformations. Colonies were imaged using a
UVP bioanalyzer illuminated at 302nm using a SYBR filter with an emission cutoff between
517-570 nm. b. Flow cytometry analysis. Colonies shown in panel b were washed with LB
and grown to an OD600 between 0.7-0.9 for optimal GFP fluorescence (see Note 18). Next,
cells were diluted in sheath solution (see Note 19) to an event rate of less than 100 cells per
second passing through the detector of the BD Influx cytometer. The GFP fluorescence was
analyzed using a 531/40 optical filter and excited by a 488nm laser. This data represents the
fluorescence emission of single cells in a cell culture population. In addition to the library,
we also show two controls: cells expressing WT pGFPuv plasmid, and untransformed cells.
These are labeled directly on the figure.
18Cells need to be grown to an OD600 of 0.7-0.9 for optimal GFP fluorescence, as GFP has a long half-life and accumulates in thecytoplasm.19BioSure Flow Cytometry Sheath Solution 8X contains 1.0 mM disodium EDTA, 1.9 mM potassium phosphate (monobasic), 3.8mM potassium chloride, 16.6 mM sodium phosphate (dibasic), and 139.0 mM sodium chloride.
Alexander et al. Page 11
Methods Mol Biol. Author manuscript; available in PMC 2014 July 28.
NIH
-PA
Author M
anuscriptN
IH-P
A A
uthor Manuscript
NIH
-PA
Author M
anuscript
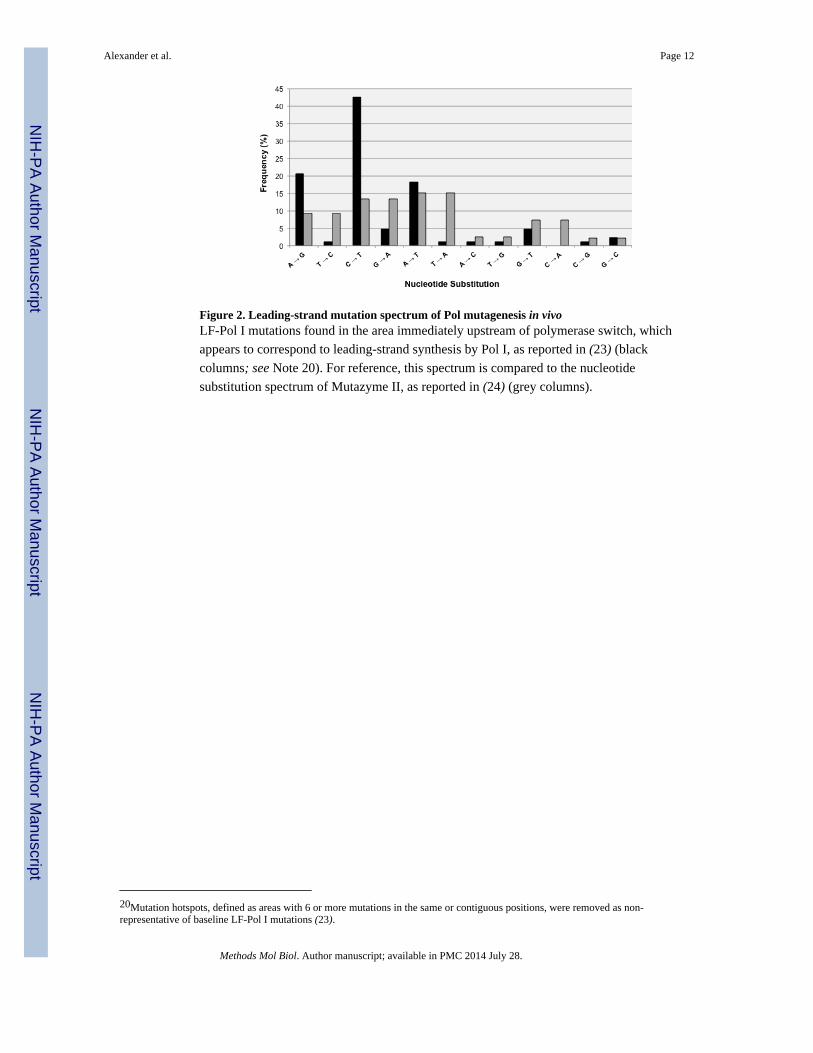
Figure 2. Leading-strand mutation spectrum of Pol mutagenesis in vivoLF-Pol I mutations found in the area immediately upstream of polymerase switch, which
appears to correspond to leading-strand synthesis by Pol I, as reported in (23) (black
columns; see Note 20). For reference, this spectrum is compared to the nucleotide
substitution spectrum of Mutazyme II, as reported in (24) (grey columns).
20Mutation hotspots, defined as areas with 6 or more mutations in the same or contiguous positions, were removed as non-representative of baseline LF-Pol I mutations (23).
Alexander et al. Page 12
Methods Mol Biol. Author manuscript; available in PMC 2014 July 28.
NIH
-PA
Author M
anuscriptN
IH-P
A A
uthor Manuscript
NIH
-PA
Author M
anuscript
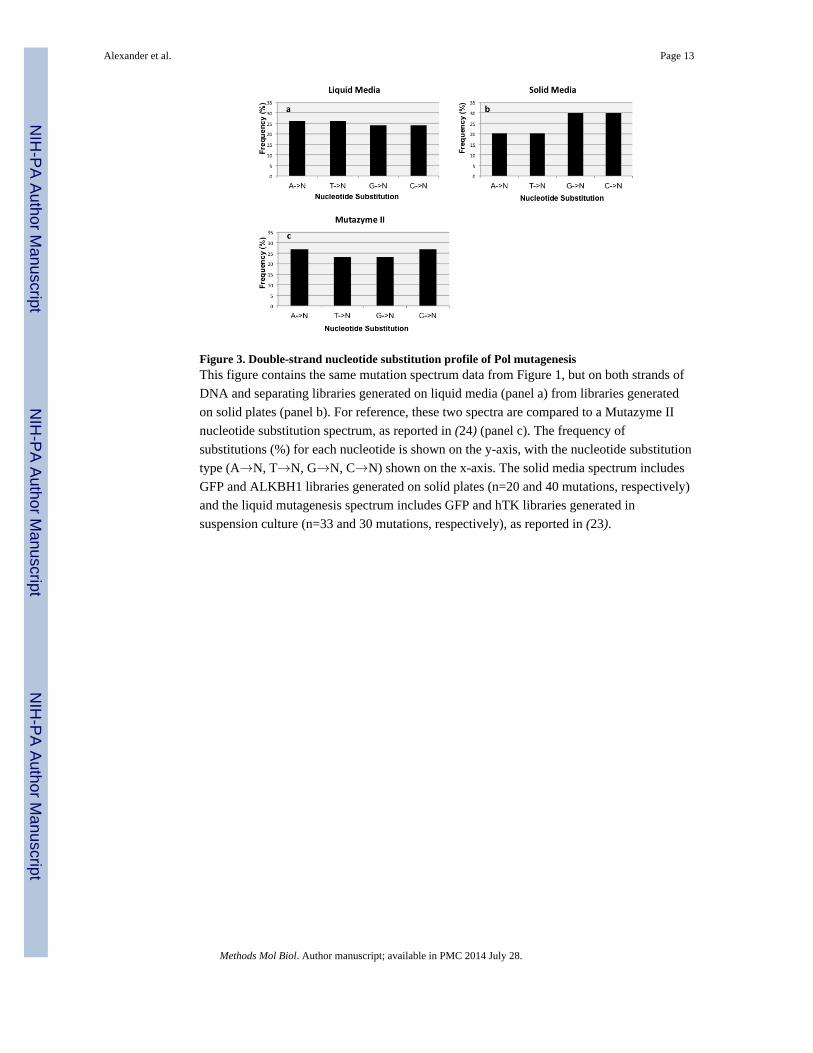
Figure 3. Double-strand nucleotide substitution profile of Pol mutagenesisThis figure contains the same mutation spectrum data from Figure 1, but on both strands of
DNA and separating libraries generated on liquid media (panel a) from libraries generated
on solid plates (panel b). For reference, these two spectra are compared to a Mutazyme II
nucleotide substitution spectrum, as reported in (24) (panel c). The frequency of
substitutions (%) for each nucleotide is shown on the y-axis, with the nucleotide substitution
type (A→N, T→N, G→N, C→N) shown on the x-axis. The solid media spectrum includes
GFP and ALKBH1 libraries generated on solid plates (n=20 and 40 mutations, respectively)
and the liquid mutagenesis spectrum includes GFP and hTK libraries generated in
suspension culture (n=33 and 30 mutations, respectively), as reported in (23).
Alexander et al. Page 13
Methods Mol Biol. Author manuscript; available in PMC 2014 July 28.
NIH
-PA
Author M
anuscriptN
IH-P
A A
uthor Manuscript
NIH
-PA
Author M
anuscript
Related Documents


