Dublin Institute of Technology ARROW@DIT Articles Radiation and Environmental Science Centre 2009-01-01 Raman spectroscopy: a potential platform for the rapid measurement of carbon nanotube-induced cytotoxicity Peter Knief Dublin Institute of Technology Colin Clarke Dublin Institute of Technology, [email protected] Eva Herzog Dublin Institute of Technology, [email protected] Maria Davoren Dublin Institute of Technology, [email protected] Fiona M. Lyng Dublin Institute of Technology, [email protected] See next page for additional authors Follow this and additional works at: hp://arrow.dit.ie/radart Part of the Pharmacology, Toxicology and Environmental Health Commons is Article is brought to you for free and open access by the Radiation and Environmental Science Centre at ARROW@DIT. It has been accepted for inclusion in Articles by an authorized administrator of ARROW@DIT. For more information, please contact [email protected], [email protected]. is work is licensed under a Creative Commons Aribution- Noncommercial-Share Alike 3.0 License Recommended Citation Knief, Peter et al (2009) Raman spectroscopy: a potential platform for the rapid measurement of carbon nanotube-induced cytotoxicity. Analyst, Vol. 134, no. 6, pp.1182-1191. DOI: 10.1039/b821393c

Welcome message from author
This document is posted to help you gain knowledge. Please leave a comment to let me know what you think about it! Share it to your friends and learn new things together.
Transcript

Dublin Institute of TechnologyARROW@DIT
Articles Radiation and Environmental Science Centre
2009-01-01
Raman spectroscopy: a potential platform for therapid measurement of carbon nanotube-inducedcytotoxicityPeter KniefDublin Institute of Technology
Colin ClarkeDublin Institute of Technology, [email protected]
Eva HerzogDublin Institute of Technology, [email protected]
Maria DavorenDublin Institute of Technology, [email protected]
Fiona M. LyngDublin Institute of Technology, [email protected]
See next page for additional authors
Follow this and additional works at: http://arrow.dit.ie/radart
Part of the Pharmacology, Toxicology and Environmental Health Commons
This Article is brought to you for free and open access by the Radiation andEnvironmental Science Centre at ARROW@DIT. It has been accepted forinclusion in Articles by an authorized administrator of ARROW@DIT. Formore information, please contact [email protected],[email protected].
This work is licensed under a Creative Commons Attribution-Noncommercial-Share Alike 3.0 License
Recommended CitationKnief, Peter et al (2009) Raman spectroscopy: a potential platform for the rapid measurement of carbon nanotube-inducedcytotoxicity. Analyst, Vol. 134, no. 6, pp.1182-1191. DOI: 10.1039/b821393c

AuthorsPeter Knief, Colin Clarke, Eva Herzog, Maria Davoren, Fiona M. Lyng, Aidan Meade, and Hugh J. Byrne
This article is available at ARROW@DIT: http://arrow.dit.ie/radart/11

CREATED USING THE RSC ARTICLE TEMPLATE (VER. 3.1) - SEE WWW.RSC.ORG/ELECTRONICFILES FOR DETAILS
ARTICLE TYPE www.rsc.org/xxxxxx | XXXXXXXX
This journal is © The Royal Society of Chemistry [year] Journal Name, [year], [vol], 00–00 | 1
Raman spectroscopy – a potential platform for the rapid measurement
of carbon nanotube-induced cytotoxicity
Peter Knief*1, Colin Clarke
2, Eva Herzog
2, Maria Davoren
2, Fiona M. Lyng
2, Aidan D. Meade
1, and Hugh
J. Byrne3
Received (in XXX, XXX) Xth XXXXXXXXX 200X, Accepted Xth XXXXXXXXX 200X 5
First published on the web Xth XXXXXXXXX 200X
DOI: 10.1039/b000000x
In this study the suitability of Raman spectroscopy for the determination of carbon nanotube
mediated toxicity on human alveolar carcinoma epithelial cells (A549) is explored. The exposure
of this cell line represents the primary pathway of exposure in humans, that of inhalation. Peak 10
ratio analysis demonstrates a dose dependent response which correlates to previous toxicological
studies. Principal component analysis is employed to further classify cellular response as a
function of dose and to examine differences between spectra as a function of exposed
concentration. To further illustrate the potential of Raman spectroscopy in this field, Partial Least
Squares (PLS) regression and genetic algorithm feature selection have been utilised to demonstrate 15
that clonogenic end points, and therefore toxic response, can be potentially predicted from spectra
of cells exposed to un-determined doses, removing the need for costly and time consuming
biochemical assays. This preliminary study demonstrates the potential of Raman spectroscopy as a
probe of cytotoxicity to nanoparticle exposure.
∗ Author to whom correspondence should be addressed. 1 School of Physics/Focas Research Institute, Dublin Institute of Technology, Kevin Street, Dublin 2 Radiation and Environmental Science Centre, Focas Research Institute, Dublin Institute of Technology, Kevin Street, Dublin 8
3 Focas Research Institute, Dublin Institute of Technology, Kevin Street, Dublin 8
2 | Journal Name, [year], [vol], 00–00 This journal is © The Royal Society of Chemistry [year]
Introduction
Nanomaterials are considered to be a new class of materials with
unusual characteristics, not only due to the chemistry of the
materials themselves, but because their dimensions result in new
physical characteristics that have a significant impact on their 5
chemical properties1. In addition, chemical modifications can
change the optical, magnetic or electric properties of these
materials. Thus nanomaterials are a new class of materials that
can be employed in wide ranging applications in nano- science,
medicine and engineering. 10
Carbon nanotubes, in both their multi- and single-walled
forms, have attracted significant attention since their emergence
in 19912. They are one dimensional macro molecules of rolled
graphene sheets, either single or multi walled, with diameter of
the order of nanometers and a length up to several centimetres. It 15
is anticipated that their huge potential will see them in mass
production in the near future3. Given the likely widespread
applications of these materials, concerns exist regarding potential
toxic responses and an evaluation of their biological effects is
required. Various studies have already been published reporting 20
toxicological or inflammatory responses in animal models4-6. On
a cellular level, some in vitro studies have shown less dramatic
effects in terms of viability and proliferative capacity7 although
chemical modification or functionalisation of the nanotubes can
increase the toxic response8. The diversity of the reports of the 25
extent and mechanism of the toxic response however clearly
demonstrates the need for more systematic investigations.
Recent studies have shown that common colorimetric assays
interact with single walled carbon nanotubes (SWCNT)
themselves, compromising their overall suitability in 30
toxicological assays9, 10. The cell culture medium itself is altered
by the interaction with SWCNTs11, challenging conventional
cytology in general. Clonogenic studies have been demonstrated
to be a potentially more appropriate toxicological assay and it has
been demonstrated that colony-size rather than colony number is 35
a more powerful measurement of cellular toxicity post exposure
to SWCNTs12. The implications are that the toxic response is
possibly one of reduced proliferative capacity of the cells due to
medium depletion rather than a reduced viability due to direct
interaction with the cells12. Such an indirect toxicological 40
response has more recently been demonstrated13. While the
clonogenic assay yields a reliable assessment of the toxic
response to SWCNT exposure in vitro, the endpoints of colony
size and number are time consuming, phenomenological and
limited in their potential to elucidate underlying biochemical 45
mechanisms. Therefore alternative assaying techniques are
desirable for the rapid evaluation of cellular toxicity post
exposure to carbon nanotubes.
Raman spectroscopy is a very versatile analytical tool, known
for its strengths in the physical and chemical characterisation of 50
materials and systems. This technique has previously been
employed for the analysis of interactions of SWCNT’s with bio-
molecules as well as the effect of external toxins as agents for
induced cell damage14, 15. The modality potentially offers
analytical and diagnostic information at a high sub-cellular spatial 55
resolution. It derives additional benefit from the minimal need for
processing of biological materials. It has already been shown to
be a viable tool for disease diagnosis16 as well as for the detection
of alterations on a cellular level caused by external influences17.
The Raman spectrum of a cell also contains chemical information 60
regarding its constituents, providing a complete biochemical
fingerprint of the cell, and ultimately exhibiting signatures that
are indicative of cell state, e.g. proliferating, apoptotic, necrotic,
etc.18. While changes to individual or combinations of spectral
features may give clear indications of cellular response, the 65
complex biochemical changes are often manifest as multivariate
changes to the overall the spectral response. Multivariate analysis
of spectroscopic data delivers an appropriate means to analyse
multiple dependent and independent singular features occurring
in vibrational spectra of biological materials, delivering a detailed 70
view of the overall response19, 20, allowing classification of, for
example, tissue pathologies and quantification of response to
external stimuli with the additional option of modelling the
spectral features for prediction of a biological result.
In this study, Raman spectroscopy is employed as a probe of 75
the toxic response of cellular systems to SWCNT exposure in
vitro. A human lung cell line was chosen for experimental
purposes, as it represents the potential scenario of inhalation, one
of the first steps in the route of exposure. In order to allow a
realistic relationship between the experimental data presented 80
here and that in vivo, the SWCNT samples were minimally
processed to mimic inhalation of airborne SWCNT dust particles.
SWCNT dispersion was carried out in an identical fashion to that
employed in previous cytotoxicity studies9-11 and cell growth and
exposure conditions were identical to those employed in previous 85
clonogenic studies12. Dose dependent responses are examined in
terms of peak ratios utilised in previous toxicity studies as well as
principal component analysis. Finally, the suitability of genetic
algorithm optimised Partial Least Squares (PLS) regression as a
quantitative model to predict clonogenic endpoints is assessed. 90
Coupled with such a predictive model, spectroscopic analysis is
demonstrated to be a potentially powerful analytical technique
avoiding time consuming and expensive biochemical assays.
Experimental Procedures
Cell culture 95
Quartz slides (24.5mm x 24.5mm, UQG Optics Ltd.) were coated
for 24 h at 4°C with a sterile solution of 2% gelatine (Type-B
from bovine skin) in deionised water (dH2O) solution. Such
substrates have previously been shown to be optimal for cell
growth and subsequent spectral analysis17. Cells of the human 100
alveolar carcinoma epithelial line A549 (ATCC, CCL-185), were
cultivated in Dulbecco’s modified minimum essential medium
(DMEM, Cambrex). All media were supplemented with 10%
foetal bovine serum (FBS) and 45 IU ml-1 penicillin and 45 µg
ml-1 streptomycin and cells were maintained at 37oC in a 5% CO2 105
humidified incubator. The cells were allowed to attach to the
quartz substrates at a concentration of approximately 2 × 10⁶ cells
per slide for 24h. After the 24h incubation period, the unattached
cells were rinsed off with PBS. An ultrasonic tip (Ultra sonic
This journal is © The Royal Society of Chemistry [year] Journal Name, [year], [vol], 00–00 | 3
processor VCX-750 watt) operating at 40% was employed to
disperse the SWCNTs in four exposure suspensions of single wall
carbon nanotubes (0 mg/l (Control), 1.56mg/l, 6.25mg/l, 25.0
mg/l, 100mg/l) in supplemented medium. HiPco Carbon
Nanotubes (Carbon Nanotubes Inc.) were employed for the study 5
for consistency with previous studies9-12. The tip was operated at
a medium level of output for a total time of 30s carried out in 10s
sequential steps to minimise sample heating. The cells were then
exposed to 3 ml of each of the different SWCNT suspensions for
96 hours. After the exposure period the slides were rinsed with 10
PBS and fixed in 4% formalin in PBS solution for 10 minutes,
rinsed once again in dH2O, and finally stored in dH2O at 4°C
prior to conducting the measurements. Three independent sets of
cells were exposed at each concentration and all measurements
were repeated for each exposure batch. 15
Spectroscopy
Raman Spectroscopy was carried out with an Instruments S.A.
(Horiba Jobin-Yvon) Labram 1B Raman confocal microscope
using 514.5 nm laser excitation with a grating of 1800 l/mm,
providing a spectral dispersion of about 1 cm-1 per pixel. Spectra 20
were recorded using a water immersion lens (Olympus Lum-Plan
FL 100x) from substrates immersed in water in a climatic
chamber to prevent desiccation of the samples. The immersion
reservoir was constructed by inserting a quartz window into the
bottom of a Petri dish filled with dH2O. The x100 water 25
immersion objective gave a spot size approximately 1µm at the
sample.
All recordings were performed as an average of three
individual measurements of one point to reduce the influence of
spectral noise. The system was previously calibrated to the 30
spectral line of crystalline silicon, at 520.7 cm-1 at a constant
room temperature of 21°C. The measurement range was set to an
interval of ~250-1750 cm-1 in order to detect spectra within the
fingerprint region of the cell samples17 and the characteristic
SWCNT features 14. Before spectral acquisition, the dark current 35
of the system and the system intensity response (using the NIST
fluorescent intensity standard SRM 2243), were recorded in
triplicate. After a series of spectral measurements on a particular
slide, the spectral background of the substrate was acquired. The
laser power was set to 23 mW at the sample and the acquisition 40
time was set to 90s which delivered reasonable spectra.
In total, approximately 75 spectra (25 per sample in triplicate)
were recorded from the nuclear portion of multiple cells at each
concentration. Principal component analysis (PCA- see
following section for details) was employed to identify outlier 45
spectra21. Cells across the whole area of the sample slide were
chosen for measurement in an attempt to ensure a true
representation of the sample. This technique was designed to
limit variability that might occur due to the spatial position of the
laser focal spot within the nuclear portion of cells, and biological 50
variability that could occur between samples of the cell line. It
was noted however, that even after repeated washing with PBS,
some single wall carbon nanotube aggregates could be visibly
observed attached to the cells, although no SWCNTs were
observed inside the cells themselves9. All measurements reported 55
here were taken away from regions where large aggregates were
visible.
Data analysis 60
In total 321 valid spectra were acquired for the 5 distinct
concentrations (Table 1) with a spectral range from 248 to 1751
cm-1. The raw spectra were imported into Matlab 7.3 (Mathworks
CA, USA) for pre-processing and analysis. Every spectrum was
corrected for system intensity response, according to the 65
guidelines of NIST (SRM 2243) 22. Prior to the subtraction of the
underlying quartz signature, each spectrum was normalised to the
characteristic underlying quartz peak at 486 cm-1 23, without the
application of any filtering. Finally the spectra were cropped to a
spectral window of 599-1700 cm-1 to isolate the fingerprint 70
region. In order to minimise the electronic noise associated with
the CCD detector, the spectra were smoothed using the Savitzky
Golay algorithm 24 with a 15 point window and a polynomial
order of 3 for further analysis.
Table 1: Sample numbers after recording the measurements and outlier 75
removal
Recorded Replicates Validated Replicates Sample
Concentration I II III I II III
0.0 mg/l 25 25 25 22 21 20
1.56 mg/l 25 25 25 19 21 23
6.25 mg/l 25 25 25 22 20 21
25.0 mg/l 25 25 25 22 24 21
100.0 mg/l 25 25 25 21 23 21
Principal component analysis
Principal component analysis (PCA) is a method of multivariate
statistical analysis broadly used with datasets of multiple 80
dimensions. It allows the reduction of the number of variables in
a multidimensional dataset while retaining most of the variation
within the dataset. The principal components (PCs) obtained are
not correlated to each other and are also called eigenvectors or
loadings. The lack of correlation means that the PCs represent 85
valuable different ‘dimensions’ of the data. The order of the PCs
describes their relative importance for the dataset. PC1 describes
the highest amount of variation, PC2 the second greatest and so
on. The variance of the PC is sometimes called the eigenvalue or
scores of the PC. When PCA is successfully applied, the 90
eigenvalues of the PCs are progressively lower and ideally the
variation in the data set can be described sufficiently by a few
PCs whose eigenvalues are most significant. The actual number
of PCs that feeds into further analysis is dependent on the
variance covered by the eigenvalue of a PC, visualized by e.g. a 95
Scree plot, and the threshold one applies, in order to give a
satisfactory representation of the original dataset, explaining most
of the variance within25, 26. As the scores of a sample in PCs are
orthogonal to each other and uncorrelated they represent
coordinates along the dimensions of the PCs in e.g. a three 100
dimensional space for 3PCs, used to access possible separation of
certain groups within samples. Analysing the loadings of a PC
can give information about the variable based source for the
variance in a PC. Variables of the loadings within the PC with
positive value indicate a positive contribution to the nature and 105
dimension of the PC whereas negative values show an inverse
relation to the PC, not giving a positive contribution to the
variance covered by the PC and therefore not contributing to the
dimension of the PC.
4 | Journal Name, [year], [vol], 00–00 This journal is © The Royal Society of Chemistry [year]
In this study the datasets for all exposure concentrations were
pre-processed as described previously, arranged conforming to
the required SAISIR structure (SAISIR (2008)(c). Package of
function for chemometrics in the MATLAB (Registered)
environment. Dominique Bertrand coordinator. Unité de 5
Sensométrie et de Chimiométrie 27) and then fed into PCA
analysis using Matlab 7.3 (Mathworks CA, USA) with the
accompanying statistics toolbox. In a second PCA analysis the
spectra were doubly derivatized, a common technique in dealing
with spectral data to further reduce the baselines and 10
backgrounds28, and also subjected to PCA using Matlab.
Partial least squares modelling
First described by Wold in 1960, partial least squares (PLS) is a
popular and well known tool in the field of chemometrics29-31.
The aim of PLS is the construction of a model to describe the 15
response variables (i.e. analyte concentration) in terms of the
observed variables (spectra) from a set of training data. The least
squares model is given by:
= +Y XB E Equation 1 20
where Y n m= × are the dependant variables (i.e. concentration),
X n p= × are the independent variables (i.e. Raman spectra),
B p m= × matrix of regression parameters for each component
in Y and E are the matrix of residuals (differences between 25
measured and predicted variables). PLS decomposition is similar
to that of principal component analysis (PCA). PCA produces
factors based on variance solely within the X matrix whereas PLS
considers both the X and Y matrices ensuring the factors correlate
the X matrix to the concentration. PLS differs from similar 30
techniques such as multiple linear regression (MLR) and
principal component regression (PCR) in that the X and Y
variables are decomposed simultaneously maximizing the
covariance between both matrices and allowing direct correlation
between the spectra and target concentrations30. In addition to the 35
scores and loading matrix, a series of weight vectors are
calculated which enhance the variables with high correlation to
the targets. The initial weight vector is calculated as follows:
( )1/=
T Tw X y X y Equation 2 40
The initial scores vector is calculated as:
1 1=t Xw Equation 3
45
and the loadings:
( )1 1 1 1/=
T Tp X t t t Equation 4
The regression parameters are calculated as follows: 50
( )1 1 1ˆ /=
T Tb y t t t Equation 5
The residual matrix is calculated as:
55
1 1 1= −
TE X t p Equation 6
The algorithm continues for each factor used, taking E1instead of
the weight matrix to calculate the second set of weights. When
presented with an unknown spectrum, y is determined using W 60
and P to compute scores for the unknown spectrum along with
the regression parameters allowing the concentration of y to be
determined from equation 1. PLS calibration models were
constructed in this work using the SIMPLS algorithm with root
mean squared error of cross validation (RMSECV) as the fitness 65
value. Leave one out cross validation was used to select the
number of latent variables (LVs) to retain. To construct the PLS-
models the Eigenvector toolbox 3.5 for MATLAB was used.
Feature selection using genetic algorithms
Calibration models are known to be greatly improved through the 70
application of efficient feature selection methods, increasing the
predictive ability and reducing model complexity. One such
method is the adaptive search technique known as the genetic
algorithm (GA). Here a GA based variable selection procedure is
used to reduce the original spectra to a subset of wavenumbers to 75
correlate Raman spectra to response. The first generation for
evaluation is a random population consisting of a number of
individuals or “chromosomes”, each containing a subset of the
original variables. Each chromosome is composed of a vector of
1s and 0s, corresponding to the wavenumbers in the X matrix, (1 80
if selected and 0 if not) where each wave number is termed a
“gene”. The performance of models resulting from each
chromosome is determined by means of a fitness function (here
the root mean square error of cross validation is used). Once each
generation is evaluated a new set of chromosomes is produced by 85
retaining and “crossing” the fittest individuals from the previous
generation. “Mutations” are also produced which force the
evaluation of new combinations avoiding saturation with similar
sets of events and can further lower the number of variables and
fitness values. The process continues until the difference in mean 90
fitness level between successive generations is below a certain
threshold the GA is terminated to avoid over-training and avoid
over fitting risk in the PLS model32-34. Feature selection in this
work was achieved using GA optimisation (with the genpls
MATLAB toolbox by Ledardi) over 100 runs requiring 95
approximately 60mins (see table 1 for GA settings).
Each calibration model was evaluated using root mean
squared error of cross validation (RMSECV) and root mean
squared error of calibration (RMSEC) performed on the
calibration set. The root mean squared error of prediction 100
(RMSEP) of the independent testing is also calculated. The root
mean squared error is calculated for each dataset as follows:
( )2
1
/=
= −∑n
act pred
i
RMSE y y n Equation 7
105
In this study PLS regression enhanced through GA feature
selection is used to construct a calibration model to predict the
end points of clonogenic studies directly from dose dependant
Raman spectra. In order to ensure over fitting is avoided the data
is split into two sets, a calibration and testing set. Firstly the 110
optimum number of latent variables is chosen with cross
validation and the model constructed using the calibration set.
The test set is unseen during the training phases and is used as an
independent test set validation of the constructed model.
115
Results and Discussion

This journal is © The Royal Society of Chemistry [year] Journal Name, [year], [vol], 00–00 | 5
Preliminary Spectral Evaluation
The Raman spectrum of a SWCNT sample (suspended in water at
concentrations similar to those used during this study) exhibits
characteristic radial breathing modes (RBM) in the region of
200cm-1 35 (Figure 1). These features describe the synchronous 5
oscillation of the atoms of the nanotube in the radial direction and
can be used to define structural characteristics of SWCNTs such
as their diameter, metallicity, and helicity36. The so-called
“disorder-included” D band appears at 1330-1390 cm-1 and is
reputedly an indicator for disorder in the graphene sheet. The 10
tangential mode, or G-Band, appears at 1583-1605cm-1
originating from tangential oscillations of the carbon atoms in the
nanotubes36-38.
Spectra of A549 cells Figure 2 (A) show classic features
within the amide I band area of 1656-1690 cm-1, consisting of 15
~80% of CO stretching~, ~10% CN stretching~ and ~10% NH
bending vibration modes, indicating protein based α-helix,
random coil and β-sheet structures. In the amide III area at about
1238 cm-1 β-sheet and random coil structures are indicated by
~30% CN stretching and ~30% NH bending vibrations, as well as 20
~10% CO stretching and ~10% O=C-N bending vibrations.
Vibrational features of amino acids and amino acid hydro halides
appear in the area of 1485 - 1660 cm-1 (NH deformation
vibrations and α-form C=O stretching of polypeptides).
Characteristic signals of lipid related groups appear at 965 cm-1 25
(CN asymmetric stretching vibrations), 1170 cm-1 (weak CO-O-C
symmetric stretching) and 1451 cm-1 (CH2 scissoring and CH3
bending vibrations)18, 39-41. As the samples were rinsed before
fixing as described in the cell culture section above, it is assumed
that all features are cellular in origin. In Figure 2 (B), an average 30
spectrum of a high concentration exposure cellular sample
(25mg/l) is shown. Strong contributions of the G-Line & D-Line
features of SWCNTs as well as common cellular spectral features
are clearly visible, although the SWCNTs were washed off
thoroughly and were not visible microscopically. In a previous 35
study, in samples prepared under identical conditions, no
SWCNTs could be observed internalised in the cells and so it is
assumed that small bundles or ropes adhere to the cell surface9.
The strongest peak of the typical SWCNT spectrum, the G-line at
about 1585 cm-1 36, overlaps strongly with the amide I region of 40
the cellular spectra (1637,1656-1690 cm-1)39, 42. This makes it
difficult to utilise this band for analysis of cellular response to the
SWCNT exposure without deconvolution.
45
Figure 1. Raman Spectrum of SWCNT with characteristic features
(RBM’S at ~180-300 cm-1, D-Line at ~1350 cm-1, G-line at~1585 cm-1)
Figure 2. Raman Spectra of A549 exposed Cells (25 mg/l SWCNT) (a) 50
and A549 control cells (b), smoothed with Savitzky Golay Filter order 3,
15 points.
After background removal, the region of 1502-1700 cm-1, was
extracted and fitted with a mixture of Gaussian/Lorenzian band
functions to extract the relative contributions of the SWCNT G-55
line and the cellular amide I band. Figure 3 shows the intensity
of the SWCNT G-line as a function of exposure dose in terms of
concentration (mg/l). Although the Raman intensity is
approximately linear as a function of dose up to ~30mg/l, the
maximum dose of 100mg/l shows significant deviation from this. 60
This apparent saturation of the response may be a result of over
dosage, the nanotubes not being effectively dispersed throughout
the sample, and/or an effect of the increased optical density of the
residual carbon nanotubes which are resonant at the Raman
wavelength, limiting penetration of the light into the sample and 65
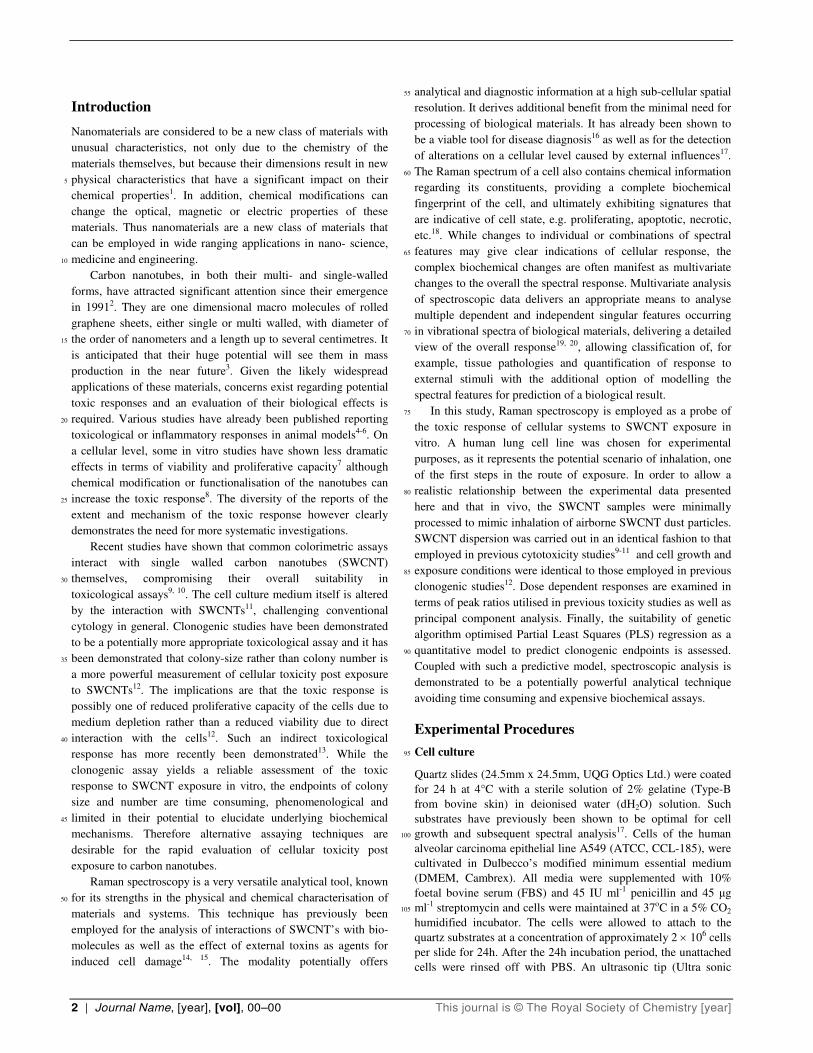
absorption of the light scattered by the sample. Figure 4 shows
the intensity of the amide I Raman band as a function of SWCNT
dosage. The intensity is seen to be only weakly dependent on
dosage, indicating that the reduced intensity of the SWCNT G-
line has origin primarily in saturation of dosage rather than 70
optical effects, although the slight reduction at large doses points
towards some optical effects. Such a saturation of dosage
resulting in large aggregates of nanotubes adhered to the cells has
indeed been seen in other studies9.
75
Figure 3. Intensity of G-Line at ~1585cm-1 versus concentration
6 | Journal Name, [year], [vol], 00–00 This journal is © The Royal Society of Chemistry [year]
Figure 4. Intensity of amide I at 1656cm-1 versus concentration
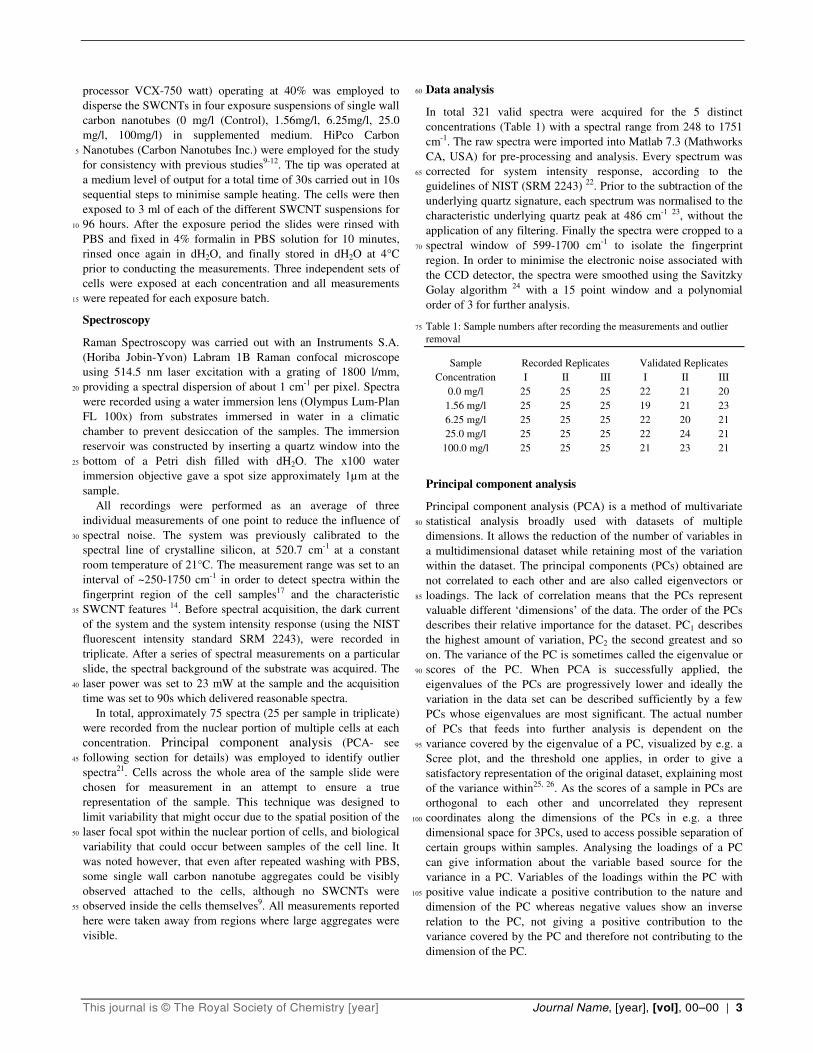
A direct visual comparison of the cellular Raman spectra
demonstrates clearly that several individual peaks are altered as a
result of exposure (Figure 5). Examination of the spectra reveals 5
changes to the 1030-1060 cm-1 lipid related bands caused by C-
O-P stretching~ and CO-O-C sym. stretching ~vibrations18, 40, 41,
an observation which correlates well with the recent work of
Davoren et al.9 which, using Transmission Electron Microscopy
(TEM), demonstrated an increase of surfactant storing lamellar 10
bodies in A549 cells after exposure to SWCNTs, which supports
the assumption of a change in the overall lipid content in the
exposed cells. It should be noted that although the nucleus is
primarily targeted, the spot of ~2-3mm diameter will pick up
some of the neighbouring and overlaying cytoplasm. Changes to 15
the RNA ribose C-O vibration at 930-960cm-1 and 1295-1304 cm-
1, as well as changes to the adenine and guanine activity at ~1345
cm-1 39, 42, 43 are also observed. It is possible, however, that the D-
line of the SWCNTs may be masking the response in this latter
region, but changes to the cellular spectra are clearly visible after 20
deconvolution of the amide III band area, far from the spectral
features of the SWCNTs, with its different conformations at
approximately 1238, 1258, 1271 cm-1 by a combined Gaussian
and Lorenzian fit, known as a pseudo-Voigt function44, 45 to
approximate the Voigt profile, with a total of nine individual 25
centred peaks, identified from the second derivative of the
unfitted region15.
Figure 5. Detailed magnification of Raman Spectra of the A549 Cells at
different concentrations smoothed with Savitzky Golay Filter order 3, 15 30
points.
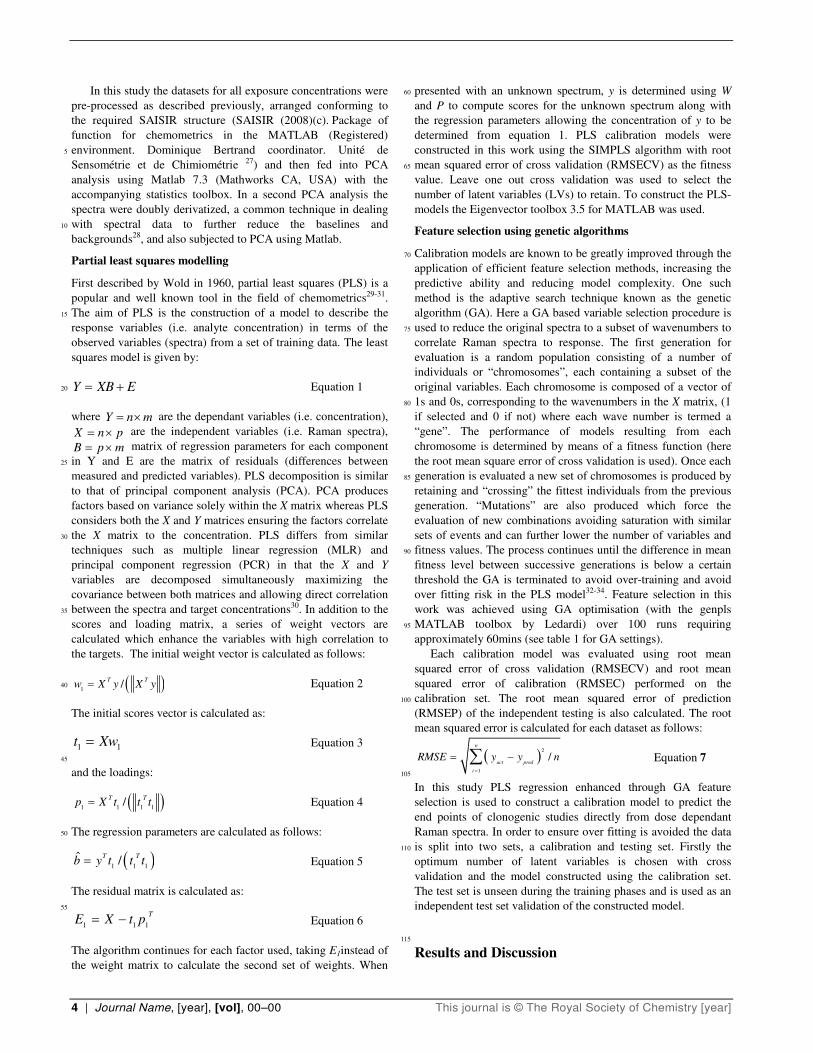
Although difficult to precisely assign the many overlapping
bands, the use of the ratio of Raman peak heights for CH2
deformation modes at ~1302cm-1, DNA bases guanine, adenine
and thymine at 1287and 1338cm-1 versus the amide III band at 35
1238cm-1 have previously been used for estimation of cellular
toxicity15. Figure 6, 7 and 8 show the dose dependent response
of these peak ratios. The three ratios exhibit an general trend of
an overall increase with an increase of dose with the exception of
the largest exposure dose of 100mg/ml which has been shown to 40
have a saturated spectral/exposure response (Figure 3). All
spectral features, with the exception of the 1338cm-1 band are far
from any SWCNT bands, and the fact that the 1338cm-1 band
exhibits the same trends indicates that there is minimal
interference from the underlying tail of the SWCNT D-line. 45
Figure 9 shows an approximately linear relationship between the
ratio of 1338 cm-1/ amide III as a function of G-line intensity
which should more accurately represent the actual SWCNT dose.
The ratios of bands previously identified as cytotoxic markers
clearly show a dose dependent response. This dose dependence 50
correlates well with that previously observed for colony size in
clonogenic assays on the same samples12. The dose dependent
response of the colony size endpoint of the clonogenic study is
plotted in (Figure 10). A monotonic decrease in colony size with
increasing dose up to ~30mg/l is observed with a saturated 55
response at higher doses. This toxic response has been attributed
to a reduced proliferative capacity as a result of medium
depletion caused by adsorption of components of the cell growth
medium to the SWCNTs12. Figure 11 demonstrates a clear
correlation of the dose dependent 1287cm-1/amide III peak ratio 60
with toxic response as determined by the colony size endpoint of
reference12.
Figure 6. Peak ratio of 1287 cm-1 / amide III versus concentration 65

This journal is © The Royal Society of Chemistry [year] Journal Name, [year], [vol], 00–00 | 7
Figure 7. Peak ratio of 1302cm-1 / amide III versus concentration
Figure 8. Peak ratio of 1338cm-1 / amide III versus concentration 5
Figure 9. Peak ratio1338cm-1 / amide III / G-Line
Figure 10. Dose dependent colony size of A549 cells derived by 10
clonogenic assays (Herzog et al. ToxLett. 2007)
Figure 11. Correlation of the 1287cm-1/ amide III peak ratio with colony
size endpoint.
The results clearly indicate that dose dependent spectral markers 15
can be identified in the Raman spectra of cellular samples
exposed to SWCNTs. However, the intrinsic influences of
inhomogenity of the spatial dispersion of SWCNTs in e.g. cell
culture medium11, 46 and the SWCNT residues adhering to the
cells, as well as the complex changes to the spectral response of 20
the cells, demand more elaborate data analysis methods, moving
from the univariate approaches described above to the analysis of
the spectral data by multivariate analysis. Principle component
analysis will thus be employed as a more powerful classification
tool, potentially elucidating a more detailed signature of the 25
cellular response.
Multivariate Analysis
The loadings from the PCA of the un-derivatized data (Figure 12) are used to monitor the spectral features according to their
contribution to the variance in the dataset. The highest variance, 30
describing 68.2 % of the overall variance, is represented by PC1
which is dominated by the strong features of the control variable,
SWCNTs, as expected. The largest variances related to biological
response due to exposure with SWCNTs, are expressed by PC2
and PC3 although they represent only a further 25% variance. 35
Within the first five components, compared to the control cell
spectrum (Figure 2), component three shows the most similar
features, indicating a defined response at ~1030, ~1300,~1450
cm-1 implying a change of spectral variance due to activity in
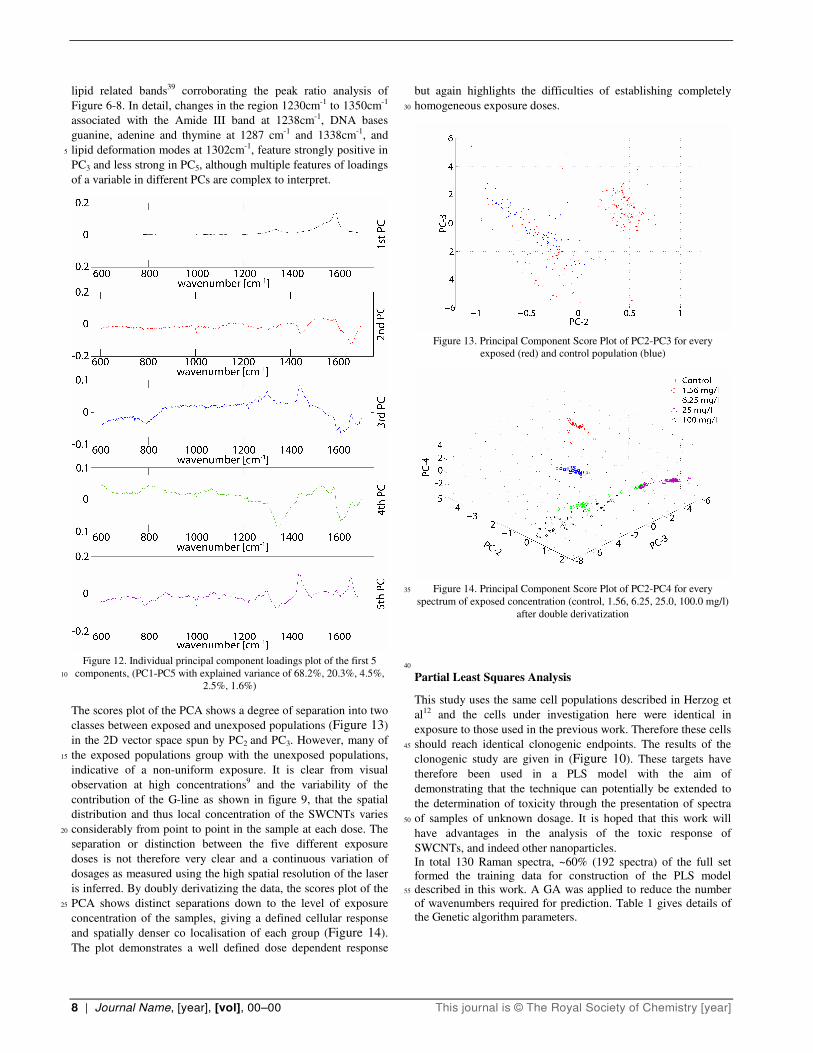
8 | Journal Name, [year], [vol], 00–00 This journal is © The Royal Society of Chemistry [year]
lipid related bands39 corroborating the peak ratio analysis of
Figure 6-8. In detail, changes in the region 1230cm-1 to 1350cm-1
associated with the Amide III band at 1238cm-1, DNA bases
guanine, adenine and thymine at 1287 cm-1 and 1338cm-1, and
lipid deformation modes at 1302cm-1, feature strongly positive in 5
PC3 and less strong in PC5, although multiple features of loadings
of a variable in different PCs are complex to interpret.
Figure 12. Individual principal component loadings plot of the first 5
components, (PC1-PC5 with explained variance of 68.2%, 20.3%, 4.5%, 10
2.5%, 1.6%)
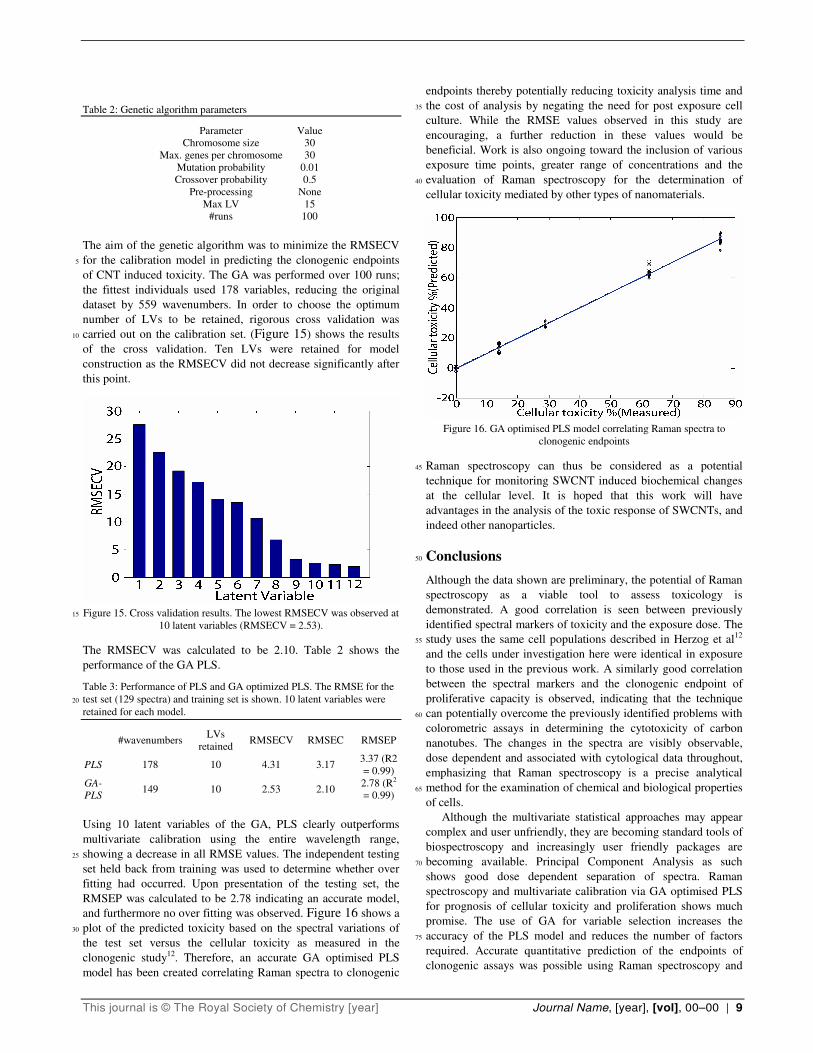
The scores plot of the PCA shows a degree of separation into two
classes between exposed and unexposed populations (Figure 13)
in the 2D vector space spun by PC2 and PC3. However, many of
the exposed populations group with the unexposed populations, 15
indicative of a non-uniform exposure. It is clear from visual
observation at high concentrations9 and the variability of the
contribution of the G-line as shown in figure 9, that the spatial
distribution and thus local concentration of the SWCNTs varies
considerably from point to point in the sample at each dose. The 20
separation or distinction between the five different exposure
doses is not therefore very clear and a continuous variation of
dosages as measured using the high spatial resolution of the laser
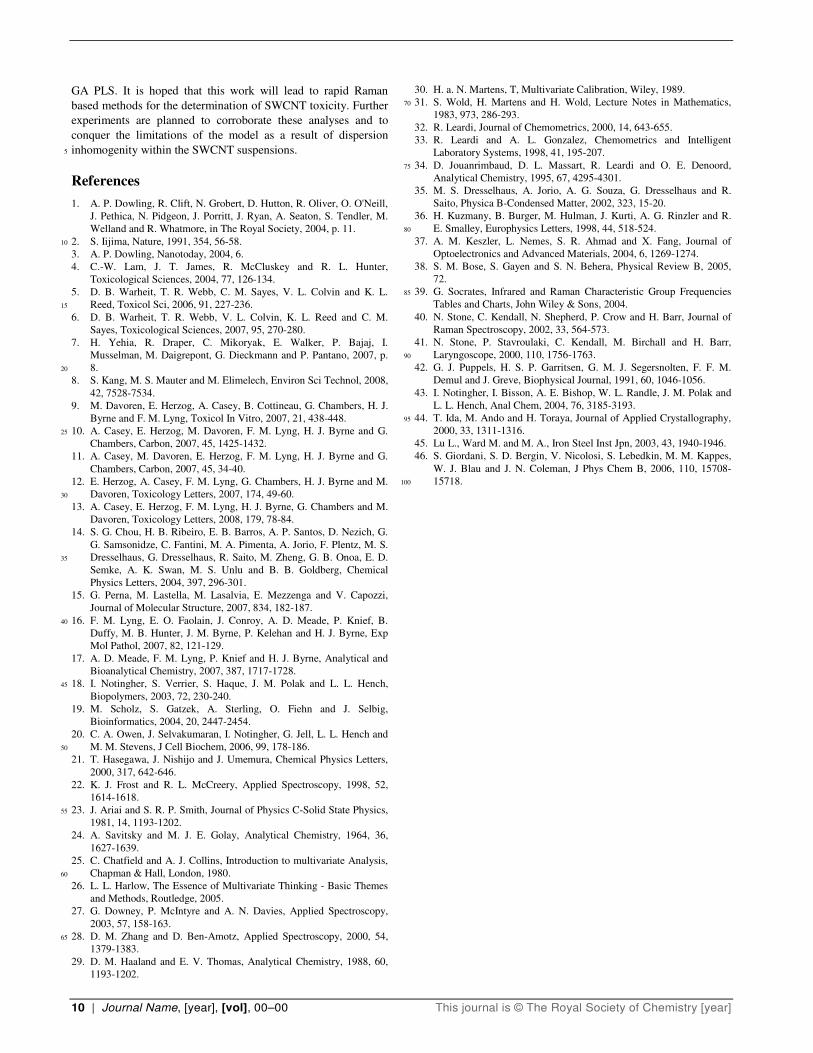
is inferred. By doubly derivatizing the data, the scores plot of the
PCA shows distinct separations down to the level of exposure 25
concentration of the samples, giving a defined cellular response
and spatially denser co localisation of each group (Figure 14).
The plot demonstrates a well defined dose dependent response
but again highlights the difficulties of establishing completely
homogeneous exposure doses. 30
Figure 13. Principal Component Score Plot of PC2-PC3 for every
exposed (red) and control population (blue)
Figure 14. Principal Component Score Plot of PC2-PC4 for every 35
spectrum of exposed concentration (control, 1.56, 6.25, 25.0, 100.0 mg/l)
after double derivatization
40
Partial Least Squares Analysis
This study uses the same cell populations described in Herzog et
al12 and the cells under investigation here were identical in
exposure to those used in the previous work. Therefore these cells
should reach identical clonogenic endpoints. The results of the 45
clonogenic study are given in (Figure 10). These targets have
therefore been used in a PLS model with the aim of
demonstrating that the technique can potentially be extended to
the determination of toxicity through the presentation of spectra
of samples of unknown dosage. It is hoped that this work will 50
have advantages in the analysis of the toxic response of
SWCNTs, and indeed other nanoparticles.
In total 130 Raman spectra, ~60% (192 spectra) of the full set
formed the training data for construction of the PLS model
described in this work. A GA was applied to reduce the number 55
of wavenumbers required for prediction. Table 1 gives details of
the Genetic algorithm parameters.
This journal is © The Royal Society of Chemistry [year] Journal Name, [year], [vol], 00–00 | 9
Table 2: Genetic algorithm parameters
Parameter Value
Chromosome size 30
Max. genes per chromosome 30
Mutation probability 0.01
Crossover probability 0.5
Pre-processing None
Max LV 15
#runs 100
The aim of the genetic algorithm was to minimize the RMSECV
for the calibration model in predicting the clonogenic endpoints 5
of CNT induced toxicity. The GA was performed over 100 runs;
the fittest individuals used 178 variables, reducing the original
dataset by 559 wavenumbers. In order to choose the optimum
number of LVs to be retained, rigorous cross validation was
carried out on the calibration set. (Figure 15) shows the results 10
of the cross validation. Ten LVs were retained for model
construction as the RMSECV did not decrease significantly after
this point.
Figure 15. Cross validation results. The lowest RMSECV was observed at 15
10 latent variables (RMSECV = 2.53).
The RMSECV was calculated to be 2.10. Table 2 shows the
performance of the GA PLS.
Table 3: Performance of PLS and GA optimized PLS. The RMSE for the
test set (129 spectra) and training set is shown. 10 latent variables were 20
retained for each model.
#wavenumbers LVs
retained RMSECV RMSEC RMSEP
PLS 178 10 4.31 3.17 3.37 (R2
= 0.99)
GA-
PLS 149 10 2.53 2.10
2.78 (R2
= 0.99)
Using 10 latent variables of the GA, PLS clearly outperforms
multivariate calibration using the entire wavelength range,
showing a decrease in all RMSE values. The independent testing 25
set held back from training was used to determine whether over
fitting had occurred. Upon presentation of the testing set, the
RMSEP was calculated to be 2.78 indicating an accurate model,
and furthermore no over fitting was observed. Figure 16 shows a
plot of the predicted toxicity based on the spectral variations of 30
the test set versus the cellular toxicity as measured in the
clonogenic study12. Therefore, an accurate GA optimised PLS
model has been created correlating Raman spectra to clonogenic
endpoints thereby potentially reducing toxicity analysis time and
the cost of analysis by negating the need for post exposure cell 35
culture. While the RMSE values observed in this study are
encouraging, a further reduction in these values would be
beneficial. Work is also ongoing toward the inclusion of various
exposure time points, greater range of concentrations and the
evaluation of Raman spectroscopy for the determination of 40
cellular toxicity mediated by other types of nanomaterials.
Figure 16. GA optimised PLS model correlating Raman spectra to
clonogenic endpoints
Raman spectroscopy can thus be considered as a potential 45
technique for monitoring SWCNT induced biochemical changes
at the cellular level. It is hoped that this work will have
advantages in the analysis of the toxic response of SWCNTs, and
indeed other nanoparticles.
Conclusions 50
Although the data shown are preliminary, the potential of Raman
spectroscopy as a viable tool to assess toxicology is
demonstrated. A good correlation is seen between previously
identified spectral markers of toxicity and the exposure dose. The
study uses the same cell populations described in Herzog et al12 55
and the cells under investigation here were identical in exposure
to those used in the previous work. A similarly good correlation
between the spectral markers and the clonogenic endpoint of
proliferative capacity is observed, indicating that the technique
can potentially overcome the previously identified problems with 60
colorometric assays in determining the cytotoxicity of carbon
nanotubes. The changes in the spectra are visibly observable,
dose dependent and associated with cytological data throughout,
emphasizing that Raman spectroscopy is a precise analytical
method for the examination of chemical and biological properties 65
of cells.
Although the multivariate statistical approaches may appear
complex and user unfriendly, they are becoming standard tools of
biospectroscopy and increasingly user friendly packages are
becoming available. Principal Component Analysis as such 70
shows good dose dependent separation of spectra. Raman
spectroscopy and multivariate calibration via GA optimised PLS
for prognosis of cellular toxicity and proliferation shows much
promise. The use of GA for variable selection increases the
accuracy of the PLS model and reduces the number of factors 75
required. Accurate quantitative prediction of the endpoints of
clonogenic assays was possible using Raman spectroscopy and
10 | Journal Name, [year], [vol], 00–00 This journal is © The Royal Society of Chemistry [year]
GA PLS. It is hoped that this work will lead to rapid Raman
based methods for the determination of SWCNT toxicity. Further
experiments are planned to corroborate these analyses and to
conquer the limitations of the model as a result of dispersion
inhomogenity within the SWCNT suspensions. 5
References
1. A. P. Dowling, R. Clift, N. Grobert, D. Hutton, R. Oliver, O. O'Neill,
J. Pethica, N. Pidgeon, J. Porritt, J. Ryan, A. Seaton, S. Tendler, M.
Welland and R. Whatmore, in The Royal Society, 2004, p. 11.
2. S. Iijima, Nature, 1991, 354, 56-58. 10
3. A. P. Dowling, Nanotoday, 2004, 6.
4. C.-W. Lam, J. T. James, R. McCluskey and R. L. Hunter,
Toxicological Sciences, 2004, 77, 126-134.
5. D. B. Warheit, T. R. Webb, C. M. Sayes, V. L. Colvin and K. L.
Reed, Toxicol Sci, 2006, 91, 227-236. 15
6. D. B. Warheit, T. R. Webb, V. L. Colvin, K. L. Reed and C. M.
Sayes, Toxicological Sciences, 2007, 95, 270-280.
7. H. Yehia, R. Draper, C. Mikoryak, E. Walker, P. Bajaj, I.
Musselman, M. Daigrepont, G. Dieckmann and P. Pantano, 2007, p.
8. 20
8. S. Kang, M. S. Mauter and M. Elimelech, Environ Sci Technol, 2008,
42, 7528-7534.
9. M. Davoren, E. Herzog, A. Casey, B. Cottineau, G. Chambers, H. J.
Byrne and F. M. Lyng, Toxicol In Vitro, 2007, 21, 438-448.
10. A. Casey, E. Herzog, M. Davoren, F. M. Lyng, H. J. Byrne and G. 25
Chambers, Carbon, 2007, 45, 1425-1432.
11. A. Casey, M. Davoren, E. Herzog, F. M. Lyng, H. J. Byrne and G.
Chambers, Carbon, 2007, 45, 34-40.
12. E. Herzog, A. Casey, F. M. Lyng, G. Chambers, H. J. Byrne and M.
Davoren, Toxicology Letters, 2007, 174, 49-60. 30
13. A. Casey, E. Herzog, F. M. Lyng, H. J. Byrne, G. Chambers and M.
Davoren, Toxicology Letters, 2008, 179, 78-84.
14. S. G. Chou, H. B. Ribeiro, E. B. Barros, A. P. Santos, D. Nezich, G.
G. Samsonidze, C. Fantini, M. A. Pimenta, A. Jorio, F. Plentz, M. S.
Dresselhaus, G. Dresselhaus, R. Saito, M. Zheng, G. B. Onoa, E. D. 35
Semke, A. K. Swan, M. S. Unlu and B. B. Goldberg, Chemical
Physics Letters, 2004, 397, 296-301.
15. G. Perna, M. Lastella, M. Lasalvia, E. Mezzenga and V. Capozzi,
Journal of Molecular Structure, 2007, 834, 182-187.
16. F. M. Lyng, E. O. Faolain, J. Conroy, A. D. Meade, P. Knief, B. 40
Duffy, M. B. Hunter, J. M. Byrne, P. Kelehan and H. J. Byrne, Exp
Mol Pathol, 2007, 82, 121-129.
17. A. D. Meade, F. M. Lyng, P. Knief and H. J. Byrne, Analytical and
Bioanalytical Chemistry, 2007, 387, 1717-1728.
18. I. Notingher, S. Verrier, S. Haque, J. M. Polak and L. L. Hench, 45
Biopolymers, 2003, 72, 230-240.
19. M. Scholz, S. Gatzek, A. Sterling, O. Fiehn and J. Selbig,
Bioinformatics, 2004, 20, 2447-2454.
20. C. A. Owen, J. Selvakumaran, I. Notingher, G. Jell, L. L. Hench and
M. M. Stevens, J Cell Biochem, 2006, 99, 178-186. 50
21. T. Hasegawa, J. Nishijo and J. Umemura, Chemical Physics Letters,
2000, 317, 642-646.
22. K. J. Frost and R. L. McCreery, Applied Spectroscopy, 1998, 52,
1614-1618.
23. J. Ariai and S. R. P. Smith, Journal of Physics C-Solid State Physics, 55
1981, 14, 1193-1202.
24. A. Savitsky and M. J. E. Golay, Analytical Chemistry, 1964, 36,
1627-1639.
25. C. Chatfield and A. J. Collins, Introduction to multivariate Analysis,
Chapman & Hall, London, 1980. 60
26. L. L. Harlow, The Essence of Multivariate Thinking - Basic Themes
and Methods, Routledge, 2005.
27. G. Downey, P. McIntyre and A. N. Davies, Applied Spectroscopy,
2003, 57, 158-163.
28. D. M. Zhang and D. Ben-Amotz, Applied Spectroscopy, 2000, 54, 65
1379-1383.
29. D. M. Haaland and E. V. Thomas, Analytical Chemistry, 1988, 60,
1193-1202.
30. H. a. N. Martens, T, Multivariate Calibration, Wiley, 1989.
31. S. Wold, H. Martens and H. Wold, Lecture Notes in Mathematics, 70
1983, 973, 286-293.
32. R. Leardi, Journal of Chemometrics, 2000, 14, 643-655.
33. R. Leardi and A. L. Gonzalez, Chemometrics and Intelligent
Laboratory Systems, 1998, 41, 195-207.
34. D. Jouanrimbaud, D. L. Massart, R. Leardi and O. E. Denoord, 75
Analytical Chemistry, 1995, 67, 4295-4301.
35. M. S. Dresselhaus, A. Jorio, A. G. Souza, G. Dresselhaus and R.
Saito, Physica B-Condensed Matter, 2002, 323, 15-20.
36. H. Kuzmany, B. Burger, M. Hulman, J. Kurti, A. G. Rinzler and R.
E. Smalley, Europhysics Letters, 1998, 44, 518-524. 80
37. A. M. Keszler, L. Nemes, S. R. Ahmad and X. Fang, Journal of
Optoelectronics and Advanced Materials, 2004, 6, 1269-1274.
38. S. M. Bose, S. Gayen and S. N. Behera, Physical Review B, 2005,
72.
39. G. Socrates, Infrared and Raman Characteristic Group Frequencies 85
Tables and Charts, John Wiley & Sons, 2004.
40. N. Stone, C. Kendall, N. Shepherd, P. Crow and H. Barr, Journal of
Raman Spectroscopy, 2002, 33, 564-573.
41. N. Stone, P. Stavroulaki, C. Kendall, M. Birchall and H. Barr,
Laryngoscope, 2000, 110, 1756-1763. 90
42. G. J. Puppels, H. S. P. Garritsen, G. M. J. Segersnolten, F. F. M.
Demul and J. Greve, Biophysical Journal, 1991, 60, 1046-1056.
43. I. Notingher, I. Bisson, A. E. Bishop, W. L. Randle, J. M. Polak and
L. L. Hench, Anal Chem, 2004, 76, 3185-3193.
44. T. Ida, M. Ando and H. Toraya, Journal of Applied Crystallography, 95
2000, 33, 1311-1316.
45. Lu L., Ward M. and M. A., Iron Steel Inst Jpn, 2003, 43, 1940-1946.
46. S. Giordani, S. D. Bergin, V. Nicolosi, S. Lebedkin, M. M. Kappes,
W. J. Blau and J. N. Coleman, J Phys Chem B, 2006, 110, 15708-
15718. 100
Related Documents


