Bladder Cancer Raman Molecular Imaging: A Novel Spectroscopic Technique for Diagnosis of Bladder Cancer in Urine Specimens Amos Shapiro a, *, Ofer. N. Gofrit a , Galina Pizov b , Jeffrey Kirk Cohen c , John Maier d a Department of Urology, Hadassah Hebrew University Medical Center, Jerusalem, Israel b Department of Pathology, Hadassah Hebrew University Medical Center, Jerusalem, Israel c Department of Urology, Western Pennsylvania Prostate Cancer Foundation, Pittsburgh, PA, USA d Application Science Department, ChemImage Corporation, Pittsburgh, PA, USA EUROPEAN UROLOGY 59 (2011) 106–112 available at www.sciencedirect.com journal homepage: www.europeanurology.com Article info Article history: Accepted October 13, 2010 Published online ahead of print on October 28, 2010 Keywords: Raman spectroscopy Bladder cells Cancer Abstract Background: Raman molecular imaging (RMI) is an optical technology that com- bines the molecular chemical analysis of Raman spectroscopy with high-definition digital microscopic visualization. This approach permits visualization of the physi- cal architecture and molecular environment of cells in the urine. The Raman spectrum of a cell is a complex product of its chemical bonds. Objective: In this work, we studied the possibility of using the Raman spectrum of epithelial cells in voided urine for diagnosing urothelial carcinoma (UC). Design, setting, and participants: Raman signals were obtained from UC tissue, then from UC touch preps obtained from surgical specimens and studied using the FALCON microscope (ChemImage, Pittsburgh, PA, USA), with a Â100 collection objec- tive and green laser illumination (532 nm). Then, urine samples were obtained from 340 patients, including 116 patients without UC, 92 patients with low-grade tumors, and 132 patients with high-grade tumors. Spectra were obtained from an average of five cells per slide. Measurements: Raman spectroscopy of cells from bladder cancer (BCa) tissues and patients. Results and limitations: The Raman spectra from UC tissue demonstrate a distinct peak at a 1584 cm 1 wave shift not present in benign tissues. The height of this peak correlated with the tumor’s grade. The signal obtained from epithelial cells correctly diagnosed BCa with sensitivity of 92% (100% of the high-grade tumors), specificity of 91%, and a positive predictive value of 94% and a negative predictive value of 88%. The signal correctly assigned a tumor’s grade in 73.9% of the low- grade tumors and 98.5% of the high-grade tumors. RMI for diagnosis of BCa is limited by the need for specialized equipment and training of laboratory personnel. Conclusions: RMI has the potential to become a powerful diagnostic tool that allows noninvasive, accurate diagnosis of UC. # 2010 European Association of Urology. Published by Elsevier B.V. All rights reserved. * Corresponding author. Department of Urology, Hadassah Hebrew University Medical Center, PO Box 12000, Jerusalem 91120, Israel. Tel. +972 2 6776874; Fax: +972 2 6430929. E-mail address: [email protected] (A. Shapiro). 0302-2838/$ – see back matter # 2010 European Association of Urology. Published by Elsevier B.V. All rights reserved. doi:10.1016/j.eururo.2010.10.027

Welcome message from author
This document is posted to help you gain knowledge. Please leave a comment to let me know what you think about it! Share it to your friends and learn new things together.
Transcript
Bladder Cancer
Raman Molecular Imaging: A Novel Spectroscopic Technique
for Diagnosis of Bladder Cancer in Urine Specimens
Amos Shapiro a,*, Ofer. N. Gofrit a, Galina Pizov b, Jeffrey Kirk Cohen c, John Maier d
a Department of Urology, Hadassah Hebrew University Medical Center, Jerusalem, Israelb Department of Pathology, Hadassah Hebrew University Medical Center, Jerusalem, Israelc Department of Urology, Western Pennsylvania Prostate Cancer Foundation, Pittsburgh, PA, USAd Application Science Department, ChemImage Corporation, Pittsburgh, PA, USA
E U R O P E A N U R O L O G Y 5 9 ( 2 0 1 1 ) 1 0 6 – 1 1 2
avai lable at www.sciencedirect .com
journal homepage: www.europeanurology.com
Article info
Article history:Accepted October 13, 2010Published online ahead ofprint on October 28, 2010
Keywords:
Raman spectroscopy
Bladder cells
Cancer
Abstract
Background: Raman molecular imaging (RMI) is an optical technology that com-
bines the molecular chemical analysis of Raman spectroscopy with high-definition
digital microscopic visualization. This approach permits visualization of the physi-
cal architecture and molecular environment of cells in the urine. The Raman
spectrum of a cell is a complex product of its chemical bonds.
Objective: In this work, we studied the possibility of using the Raman spectrum of
epithelial cells in voided urine for diagnosing urothelial carcinoma (UC).
Design, setting, and participants: Raman signals were obtained from UC tissue,
then from UC touch preps obtained from surgical specimens and studied using the
FALCON microscope (ChemImage, Pittsburgh, PA, USA), with a �100 collection objec-
tive and green laser illumination (532 nm). Then, urine samples were obtained
from 340 patients, including 116 patients without UC, 92 patients with low-grade
tumors, and 132 patients with high-grade tumors. Spectra were obtained from
an average of five cells per slide.
Measurements: Raman spectroscopy of cells from bladder cancer (BCa) tissues and
patients.
Results and limitations: The Raman spectra from UC tissue demonstrate a distinct
peak at a 1584 cm�1 wave shift not present in benign tissues. The height of this
peak correlated with the tumor’s grade. The signal obtained from epithelial cells
correctly diagnosed BCa with sensitivity of 92% (100% of the high-grade tumors),
specificity of 91%, and a positive predictive value of 94% and a negative predictive
value of 88%. The signal correctly assigned a tumor’s grade in 73.9% of the low-
grade tumors and 98.5% of the high-grade tumors. RMI for diagnosis of BCa is
limited by the need for specialized equipment and training of laboratory personnel.
Conclusions: RMI has the potential to become a powerful diagnostic tool that
allows noninvasive, accurate diagnosis of UC.
soc
r. D9
@cc
# 2010 European As
* Corresponding authoPO Box 12000, JerusalemE-mail address: amossh
0302-2838/$ – see back matter # 2010 European Association of Urology. Publis
iation of Urology. Published by Elsevier B.V. All rights reserved.
epartment of Urology, Hadassah Hebrew University Medical Center,1120, Israel. Tel. +972 2 6776874; Fax: +972 2 6430929..huji.ac.il (A. Shapiro).
hed by Elsevier B.V. All rights reserved. doi:10.1016/j.eururo.2010.10.027
E U R O P E A N U R O L O G Y 5 9 ( 2 0 1 1 ) 1 0 6 – 1 1 2 107
1. Introduction
Noninvasive diagnosis of bladder cancer (BCa) is a continual
challenge. Various characteristics of malignant cells found
in the urine have been used for this purpose. The only
clinical method used today—urinary cytology—is charac-
terized by high specificity but low sensitivity, especially in
low-grade tumors [1]. During the past two decades,
multiple urine-based tests have been studied [2,3], but
none is recommended in the current guidelines for
diagnosis and treatment of BCa [4].
Raman spectroscopy, technique historically applied in
analytical chemistry for the evaluation of chemical com-
pounds, is based on excitation of vibrational modes in the
chemical bonds that hold molecules together, illuminating a
sample with laser light. Because Raman signals originate
from the vibration of bonds within molecules, Raman
spectroscopy provides a measure of biologically important
molecular groups. In a molecularly complex system such as
a cell, Raman spectroscopic measurements carry informa-
tion about the mixture of chemicals present in the system.
Variations in the relative compositions of different molecu-
lar species lead to changes in the measured Raman
spectrum of such a complex system. Near-infrared absorp-
tion spectroscopy is an alternative spectroscopy technique
that derives molecular specificity from molecular vibrations
and has been applied to tissue samples [5]. Previous authors
have shown that it is possible to discriminate between
tumor and nontumor bladder tissue using Raman spectros-
copy [6,7].
In this work, we studied the possibility of using the Raman
spectrum of epithelial cells in voided urine for diagnosing
BCa with the FALCON Raman microscope (ChemImage,
Pittsburgh, PA, USA) [8]. We demonstrate a correlation
between the Raman spectrum measured from individual
epithelial cells and diagnoses of BCa made independently.
[()TD$FIG]
Fig. 1 – Schematic diagram of the ChemImage FALCON microscope instrumentLC TF = liquid crystal tunable filter; CCD = charge-coupled device.
2. Methods
The study was performed under institutional review board approval
from Allegheny General Hospital in Pittsburgh, Pennsylvania, USA, and
Hadassah University Hospitals, Jerusalem, Israel. Tissues for the study
were obtained from cystectomy specimens (containing malignant tissue
only) and from open prostatectomy surgery for benign disease
(urothelium of the bladder neck removed routinely during this type
of surgery). Pathologic staging was performed according to the TNM
system, and grading was done according to the 1998 World Health
Organization/International Society of Urological Pathology system.
Initially, Raman signals were obtained from urothelial carcinoma (UC)
tissue, then from UC touch preps obtained from surgical specimens, and
finally from voided urinary cells.
Paraffin blocks of these tissues were cut into 5-mm sections and
placed on aluminum slides. The preparations were deparaffinized
according to the following protocol: The sections were warmed to just
above the melting point of paraffin, and then immersed in xylene to
dissolve the paraffin. The slides were then immersed in a second change
of xylene followed by two changes in 100% alcohol and 95% and 80%
alcohol, respectively. Raman spectra were obtained from epithelial cells
using the FALCON microscope, with a �100 collection objective using
green laser illumination (532 nm) [8]. Fig. 1 provides a schematic
diagram of the instrumentation used in this investigation.
To compare the Raman signal obtained from tissue to cells, a touch
prep of UC was obtained from surgical specimens. The rest of the sample
was frozen, sectioned (5-mm thickness), and placed on aluminum slides,
with analysis as described above. Routine hematoxylin and eosin–stained
tissue was obtained from the rest of the sample.
Cellular analysis was performed on 50 ml of urine collected in the
operating room in a sterile fashion from patients with and without UC of
the bladder. The urine was spun at 3000 rpm for 5 min. The supernatant
was discarded, and the pellet was resuspended in 50 ml of distilled
water, and then centrifuged again at 3000 rpm for 5 min, after which the
supernatant was discarded. Filter preparation to remove excess white
blood cells and residue of lysed red blood cells was made in cases of high
turbidity. Filtration was performed using a filter with 20-micron pores to
capture the epithelial cells and allow other constituents to be washed off.
The filter with the epithelial cells was then washed to resuspend the
ation used for Raman molecular imaging in this investigation.
[()TD$FIG]
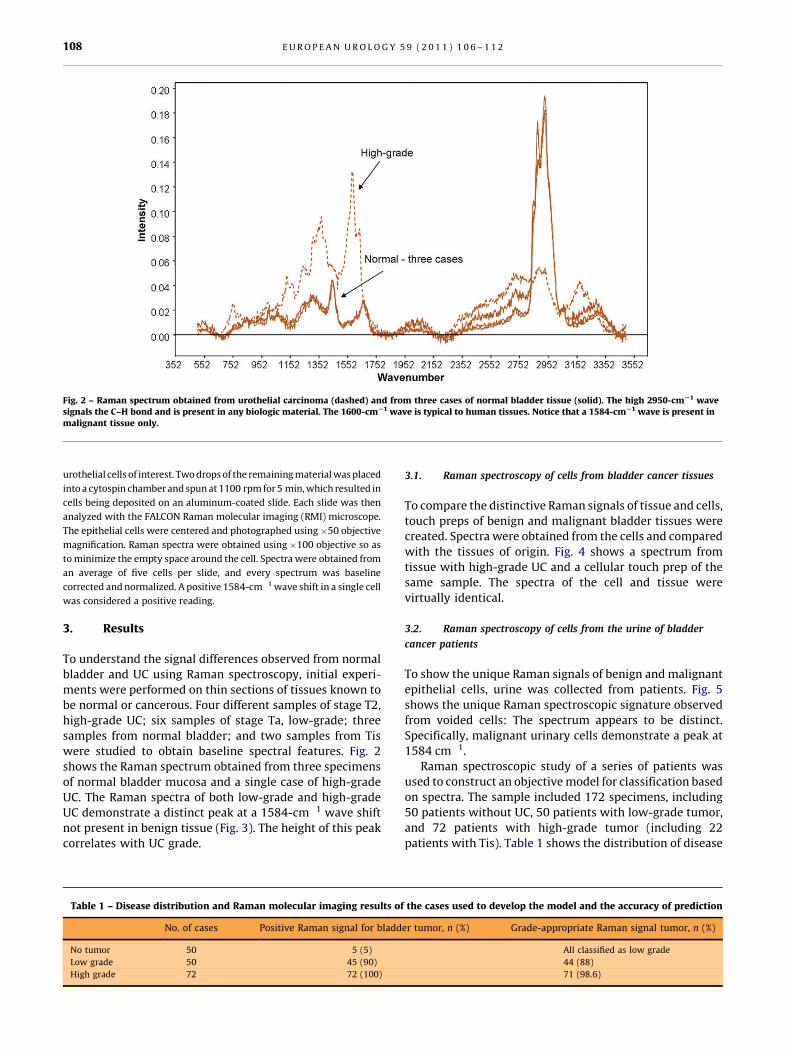
Fig. 2 – Raman spectrum obtained from urothelial carcinoma (dashed) and from three cases of normal bladder tissue (solid). The high 2950-cmS1 wavesignals the C–H bond and is present in any biologic material. The 1600-cmS1 wave is typical to human tissues. Notice that a 1584-cmS1 wave is present inmalignant tissue only.
E U R O P E A N U R O L O G Y 5 9 ( 2 0 1 1 ) 1 0 6 – 1 1 2108
urothelial cells of interest. Two drops of the remaining material was placed
into a cytospin chamber and spun at 1100 rpm for 5 min, which resulted in
cells being deposited on an aluminum-coated slide. Each slide was then
analyzed with the FALCON Raman molecular imaging (RMI) microscope.
The epithelial cells were centered and photographed using�50 objective
magnification. Raman spectra were obtained using�100 objective so as
to minimize the empty space around the cell. Spectra were obtained from
an average of five cells per slide, and every spectrum was baseline
corrected and normalized. A positive 1584-cm�1 wave shift in a single cell
was considered a positive reading.
3. Results
To understand the signal differences observed from normal
bladder and UC using Raman spectroscopy, initial experi-
ments were performed on thin sections of tissues known to
be normal or cancerous. Four different samples of stage T2,
high-grade UC; six samples of stage Ta, low-grade; three
samples from normal bladder; and two samples from Tis
were studied to obtain baseline spectral features. Fig. 2
shows the Raman spectrum obtained from three specimens
of normal bladder mucosa and a single case of high-grade
UC. The Raman spectra of both low-grade and high-grade
UC demonstrate a distinct peak at a 1584-cm�1 wave shift
not present in benign tissue (Fig. 3). The height of this peak
correlates with UC grade.
Table 1 – Disease distribution and Raman molecular imaging results of
No. of cases Positive Raman signal for bladd
No tumor 50 5 (5)
Low grade 50 45 (90)
High grade 72 72 (100)
3.1. Raman spectroscopy of cells from bladder cancer tissues
To compare the distinctive Raman signals of tissue and cells,
touch preps of benign and malignant bladder tissues were
created. Spectra were obtained from the cells and compared
with the tissues of origin. Fig. 4 shows a spectrum from
tissue with high-grade UC and a cellular touch prep of the
same sample. The spectra of the cell and tissue were
virtually identical.
3.2. Raman spectroscopy of cells from the urine of bladder
cancer patients
To show the unique Raman signals of benign and malignant
epithelial cells, urine was collected from patients. Fig. 5
shows the unique Raman spectroscopic signature observed
from voided cells: The spectrum appears to be distinct.
Specifically, malignant urinary cells demonstrate a peak at
1584 cm�1.
Raman spectroscopic study of a series of patients was
used to construct an objective model for classification based
on spectra. The sample included 172 specimens, including
50 patients without UC, 50 patients with low-grade tumor,
and 72 patients with high-grade tumor (including 22
patients with Tis). Table 1 shows the distribution of disease
the cases used to develop the model and the accuracy of prediction
er tumor, n (%) Grade-appropriate Raman signal tumor, n (%)
All classified as low grade
44 (88)
71 (98.6)
[()TD$FIG]
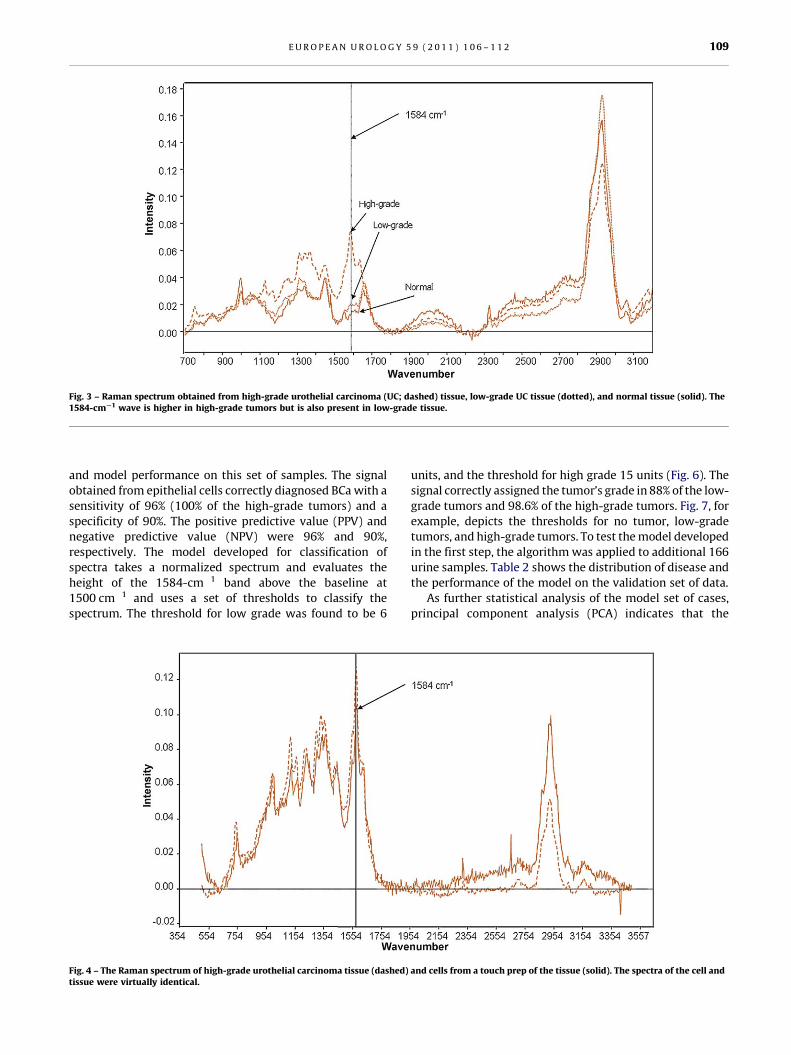
Fig. 3 – Raman spectrum obtained from high-grade urothelial carcinoma (UC; dashed) tissue, low-grade UC tissue (dotted), and normal tissue (solid). The1584-cmS1 wave is higher in high-grade tumors but is also present in low-grade tissue.
E U R O P E A N U R O L O G Y 5 9 ( 2 0 1 1 ) 1 0 6 – 1 1 2 109
and model performance on this set of samples. The signal
obtained from epithelial cells correctly diagnosed BCa with a
sensitivity of 96% (100% of the high-grade tumors) and a
specificity of 90%. The positive predictive value (PPV) and
negative predictive value (NPV) were 96% and 90%,
respectively. The model developed for classification of
spectra takes a normalized spectrum and evaluates the
height of the 1584-cm�1 band above the baseline at
1500 cm�1 and uses a set of thresholds to classify the
spectrum. The threshold for low grade was found to be 6
[()TD$FIG]
Fig. 4 – The Raman spectrum of high-grade urothelial carcinoma tissue (dashed)tissue were virtually identical.
units, and the threshold for high grade 15 units (Fig. 6). The
signal correctly assigned the tumor’s grade in 88% of the low-
grade tumors and 98.6% of the high-grade tumors. Fig. 7, for
example, depicts the thresholds for no tumor, low-grade
tumors, and high-grade tumors. To test the model developed
in the first step, the algorithm was applied to additional 166
urine samples. Table 2 shows the distribution of disease and
the performance of the model on the validation set of data.
As further statistical analysis of the model set of cases,
principal component analysis (PCA) indicates that the
and cells from a touch prep of the tissue (solid). The spectra of the cell and
[()TD$FIG]
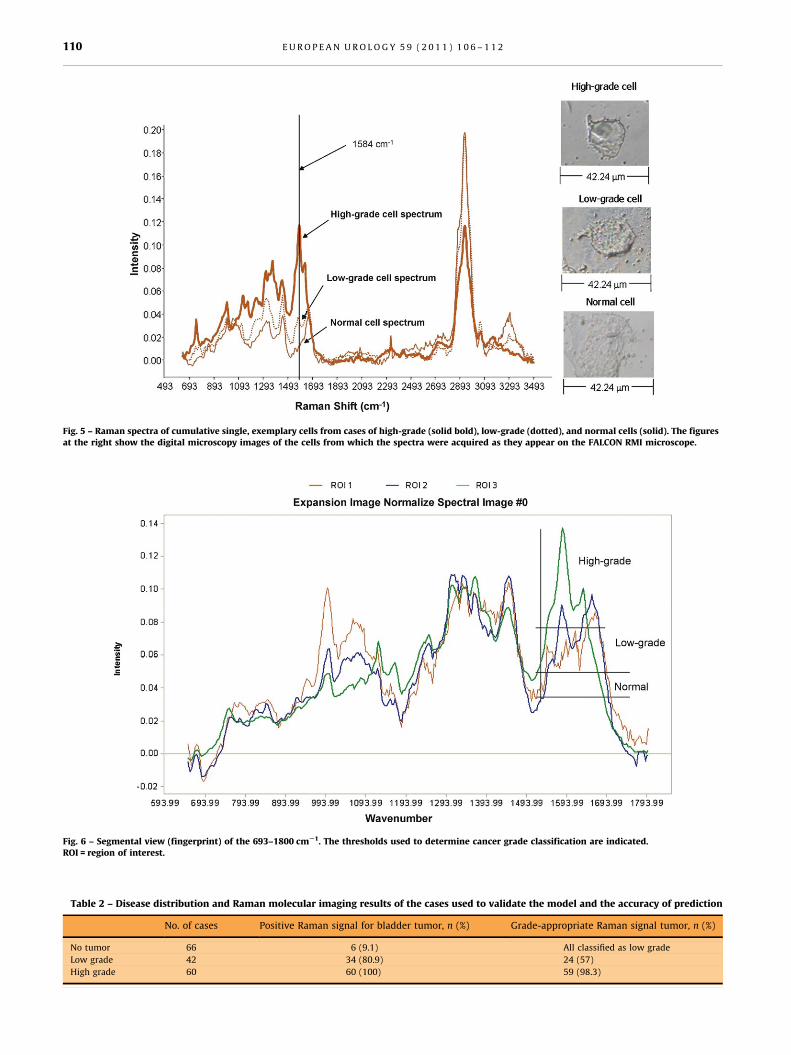
Fig. 5 – Raman spectra of cumulative single, exemplary cells from cases of high-grade (solid bold), low-grade (dotted), and normal cells (solid). The figuresat the right show the digital microscopy images of the cells from which the spectra were acquired as they appear on the FALCON RMI microscope.
[()TD$FIG]
Fig. 6 – Segmental view (fingerprint) of the 693–1800 cmS1. The thresholds used to determine cancer grade classification are indicated.ROI = region of interest.
Table 2 – Disease distribution and Raman molecular imaging results of the cases used to validate the model and the accuracy of prediction
No. of cases Positive Raman signal for bladder tumor, n (%) Grade-appropriate Raman signal tumor, n (%)
No tumor 66 6 (9.1) All classified as low grade
Low grade 42 34 (80.9) 24 (57)
High grade 60 60 (100) 59 (98.3)
E U R O P E A N U R O L O G Y 5 9 ( 2 0 1 1 ) 1 0 6 – 1 1 2110
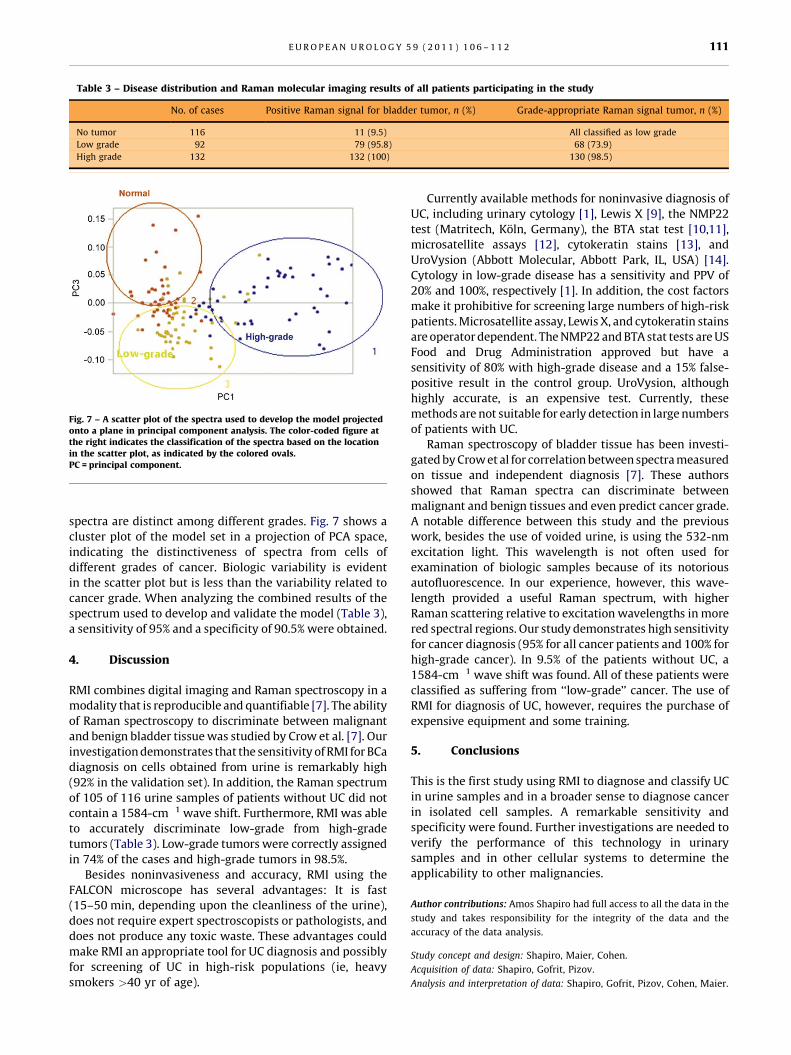
Table 3 – Disease distribution and Raman molecular imaging results of all patients participating in the study
No. of cases Positive Raman signal for bladder tumor, n (%) Grade-appropriate Raman signal tumor, n (%)
No tumor 116 11 (9.5) All classified as low grade
Low grade 92 79 (95.8) 68 (73.9)
High grade 132 132 (100) 130 (98.5)
[()TD$FIG]
Fig. 7 – A scatter plot of the spectra used to develop the model projectedonto a plane in principal component analysis. The color-coded figure atthe right indicates the classification of the spectra based on the locationin the scatter plot, as indicated by the colored ovals.PC = principal component.
E U R O P E A N U R O L O G Y 5 9 ( 2 0 1 1 ) 1 0 6 – 1 1 2 111
spectra are distinct among different grades. Fig. 7 shows a
cluster plot of the model set in a projection of PCA space,
indicating the distinctiveness of spectra from cells of
different grades of cancer. Biologic variability is evident
in the scatter plot but is less than the variability related to
cancer grade. When analyzing the combined results of the
spectrum used to develop and validate the model (Table 3),
a sensitivity of 95% and a specificity of 90.5% were obtained.
4. Discussion
RMI combines digital imaging and Raman spectroscopy in a
modality that is reproducible and quantifiable [7]. The ability
of Raman spectroscopy to discriminate between malignant
and benign bladder tissue was studied by Crow et al. [7]. Our
investigation demonstrates that the sensitivity of RMI for BCa
diagnosis on cells obtained from urine is remarkably high
(92% in the validation set). In addition, the Raman spectrum
of 105 of 116 urine samples of patients without UC did not
contain a 1584-cm�1 wave shift. Furthermore, RMI was able
to accurately discriminate low-grade from high-grade
tumors (Table 3). Low-grade tumors were correctly assigned
in 74% of the cases and high-grade tumors in 98.5%.
Besides noninvasiveness and accuracy, RMI using the
FALCON microscope has several advantages: It is fast
(15–50 min, depending upon the cleanliness of the urine),
does not require expert spectroscopists or pathologists, and
does not produce any toxic waste. These advantages could
make RMI an appropriate tool for UC diagnosis and possibly
for screening of UC in high-risk populations (ie, heavy
smokers >40 yr of age).
Currently available methods for noninvasive diagnosis of
UC, including urinary cytology [1], Lewis X [9], the NMP22
test (Matritech, Koln, Germany), the BTA stat test [10,11],
microsatellite assays [12], cytokeratin stains [13], and
UroVysion (Abbott Molecular, Abbott Park, IL, USA) [14].
Cytology in low-grade disease has a sensitivity and PPV of
20% and 100%, respectively [1]. In addition, the cost factors
make it prohibitive for screening large numbers of high-risk
patients. Microsatellite assay, Lewis X, and cytokeratin stains
are operator dependent. The NMP22 and BTA stat tests are US
Food and Drug Administration approved but have a
sensitivity of 80% with high-grade disease and a 15% false-
positive result in the control group. UroVysion, although
highly accurate, is an expensive test. Currently, these
methods are not suitable for early detection in large numbers
of patients with UC.
Raman spectroscopy of bladder tissue has been investi-
gated by Crow et al for correlation between spectra measured
on tissue and independent diagnosis [7]. These authors
showed that Raman spectra can discriminate between
malignant and benign tissues and even predict cancer grade.
A notable difference between this study and the previous
work, besides the use of voided urine, is using the 532-nm
excitation light. This wavelength is not often used for
examination of biologic samples because of its notorious
autofluorescence. In our experience, however, this wave-
length provided a useful Raman spectrum, with higher
Raman scattering relative to excitation wavelengths in more
red spectral regions. Our study demonstrates high sensitivity
for cancer diagnosis (95% for all cancer patients and 100% for
high-grade cancer). In 9.5% of the patients without UC, a
1584-cm�1 wave shift was found. All of these patients were
classified as suffering from ‘‘low-grade’’ cancer. The use of
RMI for diagnosis of UC, however, requires the purchase of
expensive equipment and some training.
5. Conclusions
This is the first study using RMI to diagnose and classify UC
in urine samples and in a broader sense to diagnose cancer
in isolated cell samples. A remarkable sensitivity and
specificity were found. Further investigations are needed to
verify the performance of this technology in urinary
samples and in other cellular systems to determine the
applicability to other malignancies.
Author contributions: Amos Shapiro had full access to all the data in the
study and takes responsibility for the integrity of the data and the
accuracy of the data analysis.
Study concept and design: Shapiro, Maier, Cohen.
Acquisition of data: Shapiro, Gofrit, Pizov.
Analysis and interpretation of data: Shapiro, Gofrit, Pizov, Cohen, Maier.
E U R O P E A N U R O L O G Y 5 9 ( 2 0 1 1 ) 1 0 6 – 1 1 2112
Drafting of the manuscript: Shapiro, Gofrit, Pizov, Cohen, Maier.
Critical revision of the manuscript for important intellectual content:
Shapiro, Gofrit, Pizov, Cohen, Maier.
Statistical analysis: Shapiro, Gofrit, Cohen, Maier.
Obtaining funding: None.
Administrative, technical, or material support: Shapiro, Gofrit, Pizov, Cohen,
Maier.
Supervision: Shapiro, Cohen.
Other (specify): None.
Financial disclosures: I certify that all conflicts of interest, including
specific financial interests and relationships and affiliations relevant to the
subject matter or materials discussed in the manuscript (eg, employment/
affiliation, grants or funding, consultancies, honoraria, stock ownership or
options, expert testimony, royalties, or patents filed, received, or pending),
are the following: Dr. Maier is an employee of and Dr. Cohen is a board
member of ChemImage.
Funding/Support and role of the sponsor: This study was sponsored in
part by the Western Pennsylvania Prostate Cancer Foundation, which
was involved with preparation of this manuscript.
References
[1] Koss GL, Dietch D, Ramanathan R, Sherman AB. Diagnostic value of
cytology of voided urine. Acta Cytol 1985;29:810–6.
[2] Van Tilborg AA, Bangma CH, Zwarthoff EC. Bladder cancer bio-
markers and their role in surveillance and screening. Int J Urol
2009;16:23–30.
[3] Vrooman OPJ, Witjes JA. Urinary markers in bladder cancer. Eur Urol
2008;53:909–16.
[4] Babjuk MW, Oosterlink W, Sylvester R, Kaasinen E, Bohle A, Palou J.
Guidelines on TaT1 (non-muscle invasive) bladder cancer. Arnhem,
The Netherlands: European Association of Urology; 2009.
[5] Kidder LH, Kalazinsky VF, Luke J, Levin IW, Lewis EN. Visualization
of silicone gel in human breast tissue using a new infrared imaging
spectroscopy. Nat Med 1997;3:235–7.
[6] de Jong BW, Bakker Schut TC, Wolffenbuttel KP, Nijman JM, Kok DJ,
Puppels GJ. Identification of bladder wall layers by Raman spec-
troscopy. J Urol 2002;168:1771–8.
[7] Crow P, Barrass B, Kendall C, et al. The use of Raman spectroscopy to
differentiate between different prostatic adenocarcinoma cell lines.
Br J Cancer 2005;92:2166–70.
[8] Morris H, Hoyt CC, Miller P, Treado PJ. Liquid crystal tunable filter
Raman chemical imaging. Appl Spect 1996;50:805–11.
[9] Pode D, Golijanin D, Sherman Y, Lebensart P, Shapiro A. Immuno-
staining of Lewis X in cells from voided urine, cytopathology and
ultrasound for noninvasive detection of bladder tumors. J Urol
1998;159:389–92.
[10] Theodoros GAM, Constantinos GAC, Constantinos CPHD. Compara-
tive evaluation of the diagnostic performance of BTA stat test,
NMP22 and urinary bladder cancer antigen for primary and recur-
rent bladder tumors. J Urol 2001;166:470–5.
[11] Friderich MG, Hellstern A, Hautmann SH, et al. Clinical use of
urinary markers for the detection and prognosis of bladder carci-
noma: a comparison of immunocytology with monoclonal anti-
bodies against Lewis X and 486p3/12 with BTA STAT and NMP22
tests. J Urol 2002;168:470–4.
[12] Sourvinos G, Kazanis I, Delakas D, Cranidis A, Spandidos DA. Genetic
detection of bladder cancer by microsatellite analysis of p16, RB1
and p53 tumor suppressor genes. J Urol 2001;165:249–52.
[13] Golijanin D, Shapiro A, Pode D. Immunostaining of cytokeratin-20
in cells from voided urine for detection of bladder cancer. J Urol
2000;164:1922–5.
[14] Gofrit ON, Zorn KC, Silvestre J, et al. The predictive value of multi-
targeted fluorescent in-situ hybridization in patients with history
of bladder cancer. Urol Oncol 2008;26:246–9.
Related Documents