Raman Characterization and Chemical Imaging of Biocolloidal Self-Assemblies, Drug Delivery Systems, and Pulmonary Inhalation Aerosols: A Review Heidi M. Mansour 1 and Anthony J. Hickey 1 1 University of North Carolina at Chapel Hill, School of Pharmacy, Division of Molecular Pharmaceutics, Campus Box #7360, 1311 Kerr Hall, Dispersed Systems Laboratory, Chapel Hill, NC 27599-7360 ABSTRACT This review presents an introduction to Raman scattering and describes the various Raman spectroscopy, Raman mi- croscopy, and chemical imaging techniques that have dem- onstrated utility in biocolloidal self-assemblies, pharmaceutical drug delivery systems, and pulmonary research applications. Recent Raman applications to pharmaceutical aerosols in the context of pulmonary inhalation aerosol delivery are dis- cussed. The “molecular fingerprint” insight that Raman ap- plications provide includes molecular structure, drug-carrier/ excipient interactions, intramolecular and intermolecular bonding, surface structure, surface and interfacial interac- tions, and the functional groups involved therein. The mo- lecular, surface, and interfacial properties that Raman characterization can provide are particularly important in respirable pharmaceutical powders, as these particles possess a higher surface-area-to-volume ratio; hence, understanding the nature of these solid surfaces can enable their manipu- lation and tailoring for functionality at the nanometer level for targeted pulmonary delivery and deposition. Moreover, Raman mapping of aerosols at the micro- and nanometer level of resolution is achievable with new, sophisticated, commercially available Raman microspectroscopy techni- ques. This noninvasive, highly versatile analytical and im- aging technique exhibits vast potential for in vitro and in vivo molecular investigations of pulmonary aerosol delivery, lung deposition, and pulmonary cellular drug uptake and disposi- tion in unfixed living pulmonary cells. KEYWORDS: Spectroscopy, microscopy, imaging, molec- ular, interfacial, lung, mappingR INTRODUCTION—THE RAMAN EFFECT Elastic scattering of photons (Rayleigh scattering) from in- coming light occurs with the same frequency (energy) and hence wavelength as the incident photons, as depicted in Figure 1a. The Raman effect was discovered by the Indian physicist Sir Chandrasekhara Venkata Raman, who was awarded the Nobel Prize in Physics in 1930 for his seminal discoveries on the “molecular diffraction of light” in liquids and the “diffusion of gases.” 1-3 The Raman effect is the pro- cess whereby inelastic scatter of outgoing photons occurs, which is typically a small fraction of scattered photons at a different and higher optical frequency from the incident pho- tonic frequency. Raman shift in wave numbers (cm –1 ) is de- fined as the difference between the incident light, λ incident , and the Raman scattering of photons, λ scattered . In other words, the vibrational energy of the scattering molecule is the en- ergy difference between the incident and Raman-scattered photons. A typical Raman spectrum consists of a plot of the scattered light as a function of the energy difference. Figure 1 illustrates the scattering effects that give rise to the Raman effect, which occurs when the incident photon interacts with the electric dipole of the molecule, pertubating the molecule’ s electrical field. This is a quantum mechanical phenomenon, whereby the scattering can be described as a vibrational en- ergy change resulting from an excitation to a lower energy state rather than a real electronic transition. The scattered photon will have a longer wavelength (lower energy) than the incoming photon (exciting photon), resulting in a Stokes Raman scattering, as depicted in Figure 1b. The Stokes- shifted Raman spectrum (Figure 1b) is stronger than the anti-Stokes-shifted spectrum (Figure 1c), and both contain the same frequency information. The ratio of both spectra can provide information on temperature. Vibrational energy and bond-stretching frequency are de- termined by several molecular properties, including atom types, atomic mass, molecular geometry, hydrogen bonding, and bond order (single bond vs double bond vs triple bond). It is important to recognize that Raman scattering measures molecular polarizability (the extent to which an electronic cloud can be distorted), as molecular vibrations can affect po- larizability, providing useful information on molecular dipoles. Hence, both intramolecular and intermolecular vibrations are Received: November 30, 2006; Final Revision Received: June 9, 2007; Accepted: June 11, 2007; Published: November 30, 2007 AAPS PharmSciTech 2007; 8 (4) Article 99 (http://www.aapspharmscitech.org). E1 Corresponding Author: Heidi M. Mansour, University of North Carolina at Chapel Hill, School of Pharmacy, Division of Molecular Pharmaceutics, Campus Box #7360, 311 Pharmacy Lane, 1311 Kerr Hall, Dispersed Systems Laboratory, Chapel Hill, NC 27599-7360. Tel: (919) 966- 0484; Fax: (919) 966-0197; E-mail: [email protected]

Welcome message from author
This document is posted to help you gain knowledge. Please leave a comment to let me know what you think about it! Share it to your friends and learn new things together.
Transcript
Raman Characterization and Chemical Imaging of BiocolloidalSelf-Assemblies, Drug Delivery Systems, and PulmonaryInhalation Aerosols: A ReviewSubmitted: November 30, 2006; Accepted: June 11, 2007; Published: November 30, 2007
Heidi M. Mansour1 and Anthony J. Hickey1
1University of North Carolina at Chapel Hill, School of Pharmacy, Division of Molecular Pharmaceutics, Campus Box#7360, 1311 Kerr Hall, Dispersed Systems Laboratory, Chapel Hill, NC 27599-7360
ABSTRACT
This review presents an introduction to Raman scatteringand describes the various Raman spectroscopy, Raman mi-croscopy, and chemical imaging techniques that have dem-onstrated utility in biocolloidal self-assemblies, pharmaceuticaldrug delivery systems, and pulmonary research applications.Recent Raman applications to pharmaceutical aerosols inthe context of pulmonary inhalation aerosol delivery are dis-cussed. The “molecular fingerprint” insight that Raman ap-plications provide includes molecular structure, drug-carrier/excipient interactions, intramolecular and intermolecularbonding, surface structure, surface and interfacial interac-tions, and the functional groups involved therein. The mo-lecular, surface, and interfacial properties that Ramancharacterization can provide are particularly important inrespirable pharmaceutical powders, as these particles possessa higher surface-area-to-volume ratio; hence, understandingthe nature of these solid surfaces can enable their manipu-lation and tailoring for functionality at the nanometer levelfor targeted pulmonary delivery and deposition. Moreover,Raman mapping of aerosols at the micro- and nanometerlevel of resolution is achievable with new, sophisticated,commercially available Raman microspectroscopy techni-ques. This noninvasive, highly versatile analytical and im-aging technique exhibits vast potential for in vitro and in vivomolecular investigations of pulmonary aerosol delivery, lungdeposition, and pulmonary cellular drug uptake and disposi-tion in unfixed living pulmonary cells.
KEYWORDS: Spectroscopy, microscopy, imaging, molec-ular, interfacial, lung, mappingR
INTRODUCTION—THE RAMAN EFFECT
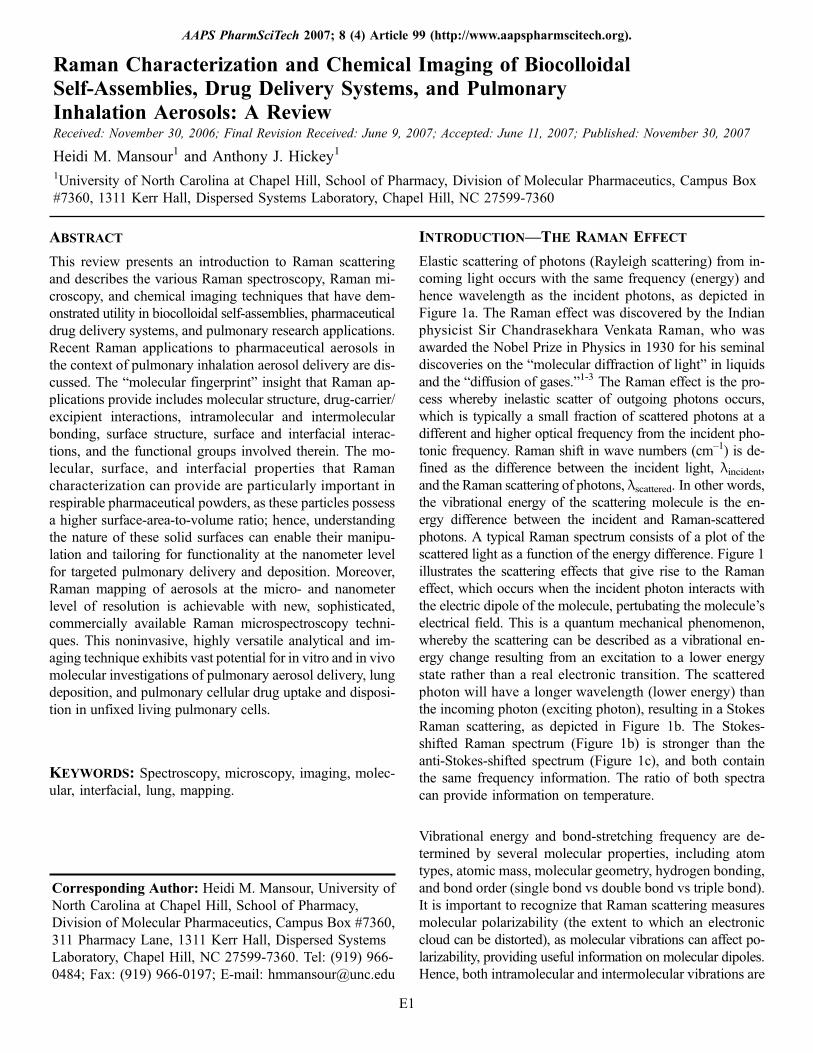
Elastic scattering of photons (Rayleigh scattering) from in-coming light occurs with the same frequency (energy) andhence wavelength as the incident photons, as depicted inFigure 1a. The Raman effect was discovered by the Indianphysicist Sir Chandrasekhara Venkata Raman, who wasawarded the Nobel Prize in Physics in 1930 for his seminaldiscoveries on the “molecular diffraction of light” in liquidsand the “diffusion of gases.”1-3 The Raman effect is the pro-cess whereby inelastic scatter of outgoing photons occurs,which is typically a small fraction of scattered photons at adifferent and higher optical frequency from the incident pho-tonic frequency. Raman shift in wave numbers (cm–1) is de-fined as the difference between the incident light, λincident,and the Raman scattering of photons, λscattered. In other words,the vibrational energy of the scattering molecule is the en-ergy difference between the incident and Raman-scatteredphotons. A typical Raman spectrum consists of a plot of thescattered light as a function of the energy difference. Figure 1illustrates the scattering effects that give rise to the Ramaneffect, which occurs when the incident photon interacts withthe electric dipole of the molecule, pertubating the molecule’selectrical field. This is a quantum mechanical phenomenon,whereby the scattering can be described as a vibrational en-ergy change resulting from an excitation to a lower energystate rather than a real electronic transition. The scatteredphoton will have a longer wavelength (lower energy) thanthe incoming photon (exciting photon), resulting in a StokesRaman scattering, as depicted in Figure 1b. The Stokes-shifted Raman spectrum (Figure 1b) is stronger than theanti-Stokes-shifted spectrum (Figure 1c), and both containthe same frequency information. The ratio of both spectracan provide information on temperature.
Vibrational energy and bond-stretching frequency are de-termined by several molecular properties, including atomtypes, atomic mass, molecular geometry, hydrogen bonding,and bond order (single bond vs double bond vs triple bond).It is important to recognize that Raman scattering measuresmolecular polarizability (the extent to which an electroniccloud can be distorted), as molecular vibrations can affect po-larizability, providing useful information on molecular dipoles.Hence, both intramolecular and intermolecular vibrations are
Received: November 30, 2006; Final Revision Received: June 9, 2007; Accepted: June 11, 2007; Published: November 30, 2007
AAPS PharmSciTech 2007; 8 (4) Article 99 (http://www.aapspharmscitech.org).
E1
Corresponding Author: Heidi M. Mansour, University ofNorth Carolina at Chapel Hill, School of Pharmacy,Division of Molecular Pharmaceutics, Campus Box #7360,311 Pharmacy Lane, 1311 Kerr Hall, Dispersed SystemsLaboratory, Chapel Hill, NC 27599-7360. Tel: (919) 966-0484; Fax: (919) 966-0197; E-mail: [email protected]
Raman-active. The Raman-active vibration selection rule statesthat there must be a change in polarizability accompanyinga vibration. In other words, strong Raman scattering occurswith a larger change in polarizability of distributed electronclouds, as found in a carbon-carbon double bond where theπ-electron cloud is easily distorted because bond stretchingand/or bending causes a significant change in the electroncloud density and induced-dipole moment. Hence, aroma-ticity is associated with strong symmetric vibration and astrong Raman band. Strong Raman scatters have symmetricalvibrations and include phenyl moieties and other aromaticmoieties,4 sulfide bonds, and carbon-carbon single and dou-ble bonds, which are all common structural characteristicsof many pharmaceutical molecules. In contrast, the O-H bondis inherently highly polar because of the uneven distributionof the electron cloud favoring the oxygen atom; hence, polar-izability is low and so is the Raman scattering. This is due tothe fact that a highly polar moiety, such as the O-H bond,has a weak vibration and low Raman band, which is idealfor aqueous systems.
It is noted that infrared (IR) spectroscopy is also commonlyused in molecular characterization of pharmaceutical mate-
rials, as it is complementary to Raman spectroscopy; how-ever, sample preparation is required. Another benefit ofRaman is that there tends to be less spectral overlap withcommon pharmaceutical excipients.5 Additionally, phar-maceutical drug product containers (eg, glass and plastic)absorb mid-IR light due mainly to C-H vibrations, so non-invasive drug product identification and on-line process (insitu) monitoring is not possible with IR, as it is with Ramanspectroscopy (to be discussed below).6 Unlike Raman spec-troscopy (symmetric vibration), IR requires a dipole momentchange (ie, asymmetric vibration). Accordingly, weak Ramanscatters tend to be strong IR absorbers and include bondvibrations present in polar moieties, such as carbonyl andhydrogen-bonded hydroxyl groups, since they display asym-metric (IR) rather than symmetric (Raman) vibrations. Thevarious types of Raman spectroscopy and their applicationsare summarized in Table 1.
Several excellent reviews7-9 discuss in detail the Raman ef-fect, the various types of Raman spectroscopy, Raman bandfrequencies,10,11 and the many applications of Raman spec-troscopy in chemistry, biology, material science, and medi-cine. Raman spectroscopy can provide important informationon molecular composition, structure, conformation, the de-gree of order and/or disorder, phases and phase transitions,
Figure 1. Principles of Raman scattering: (A) Rayleigh scattering;(B) Stokes Raman scattering; and (C) anti-Stokes Ramanscattering.
Table 1. Types of Raman Systems and Their Applications in theCharacterization and Analysis of Pharmaceutical, Biocolloidal,and Aerosol Systems
Type of Laser ScanningRaman Analytical Application
Fourier transform Ramanspectroscopy
Common method used inprocess, quality, and quantitycontrol applications inpharmaceutical systems
Raman microspectroscopy Chemical imaging and mapping
UV resonance Ramanspectroscopy
Polypeptide and biopolymersecondary structure andconformational transitions
Surface-enhanced Ramanspectroscopy
Colloidal dispersions, molecularself-assemblies, inclusioncomplexes, nanoparticles,surfaces, and monolayers;chemical sensing biochemicalanalysis; rheology and gelationof hydrogels; interfacialmolecular interactions
Resonance-enhancedRaman spectroscopy
Specific analysis of a materialexisting within a complex ormixture of materials
Red-excitation dispersiveRaman spectroscopy
Respirable pharmaceuticalpowders for pulmonaryinhalation aerosol delivery
Linear Raman spectroscopy Aqueous aerosols
AAPS PharmSciTech 2007; 8 (4) Article 99 (http://www.aapspharmscitech.org).
E2
inter- and intramolecular interactions, hydrogen bonding, poly-morphs, hydrates, anhydrates, molecular conformation, andpolymer chain conformation. The purpose of this review is tohighlight the main types of Raman spectroscopy and Ramanmicroscopy (chemical imaging) techniques that have beensuccessfully employed in the pharmaceutical sciences, withan emphasis on biocolloidal self-assemblies, nonaerosol drugdelivery systems, and pulmonary inhalation aerosols. Addi-tionally, this review will describe in detail the reports of Ra-man applications in pulmonary medicine and pharmaceuticalinhalation aerosols demonstrating the potential for routineapplication of this powerful analytical and imaging techniquein the molecular and surface characterization of inhalationaerosol delivery systems.
TYPES OF RAMAN SPECTROSCOPY
Fourier Transform Raman Spectroscopy
Fourier transform Raman (FT-Raman), the Raman methodcommonly used in pharmaceutical systems, prevents fluores-cent background by using a longer wavelength in the near-IRregion (typically 1064 nm).12 Its success in routine phar-maceutical analysis can be attributed to its specificity (molec-ular fingerprint), reliability, efficiency, and cost-effectivenessas a quantitative method compared with high-pressure liquidchromatography, which always requires sample pretreatmentand the use of solvents. Furthermore, it is a nondestructiveand noninvasive biochemical analytical method.
Resonance-Enhanced Raman Spectroscopy
Resonance-enhanced Raman spectroscopy (RERS) occursif the wavelength of the incoming exciting laser is near orwithin the electronic energy spectrum of the sample molec-ule, causing a resonance enhancement in the intensity of mo-lecular vibrations. This is in contrast to conventional Ramanspectroscopy, where, according to scattering theory, the wave-length of the incoming exciting laser is far below the firstelectronic transitions. This Raman method13 has also beenused extensively in pharmaceutical systems. Accuracy, preci-sion, and enhanced sensitivity are all advantages in RERS.
Surface-Enhanced Raman Spectroscopy
In an effort to overcome the inherently weak Raman signalsin conventional Raman methods and the ever-present prob-lem of fluorescence of many API materials, surface-enhancedRaman spectroscopy (SERS) provides stronger Raman sig-nals by taking advantage of electromagnetic enhancementand charge-transfer states. SERS14 is quite useful in the studyof biocolloidal dispersions (Figure 2), biomonomolecularlayers (monolayers/nanolayers) of materials and their surfa-ces, including biomimetic models, biopolymers, inclusion
complexes, living cells, nanoparticles, and pharmaceuticalmaterials. Unique applications of SERS include colloidaldispersions, molecular self-assemblies, DNA/RNA mono-nucleotides,15 oligonucleotides, nanoparticles, surfaces, mono-layers, chemical sensing, biochemical analysis, biomedicaldiagnostics,16 rheology and gelation of hydrogels,17 biopol-ymer surface orientation, membrane transport processes,18
colloidal nanostructures,19 bacterial cells, single living celluptake of nanoparticles,20 and interfacial molecular interac-tions. Surface-enhanced hyper-Raman scattering incorporates2-photon excitation with SERS, enabling the investigationof nanoparticles with single biological cells.21
RAMAN CHEMICAL IMAGING OF BIOCOLLOIDAL
SELF-ASSEMBLIES AND NONAEROSOL
PHARMACEUTICAL DELIVERY SYSTEMS
In general pharmaceutical analysis, Raman spectroscopy22 isa real-time, noncontact, and noninvasive analytical techniquein the chemical analysis, characterization, and quantificationof various structures, metastable phases, molecular interac-tions, and reactivity in pharmaceutical solid dosage formsand powders5,8,9,12,23-26 with minimal sample preparation.
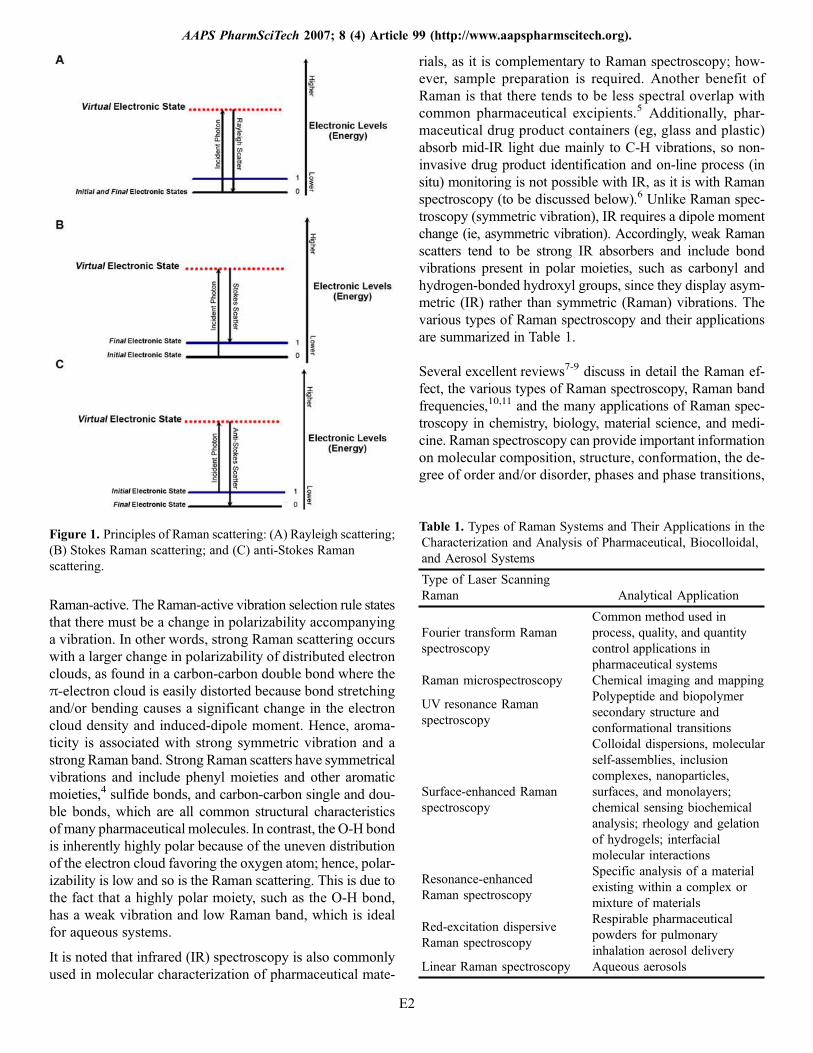
Figure 2. Aqueous dispersions of biocolloidal self-assembliesstudied by Raman spectroscopy: (A) phospholipid monomolecularlayers (nanolayers) at the air-water interface; (B) micelles;(C) liposomes; (C) DNA; and (E) helical protein.
AAPS PharmSciTech 2007; 8 (4) Article 99 (http://www.aapspharmscitech.org).
E3
Raman chemical imaging (Figure 3) using Raman micro-scopy provides nondestructive, noninvasive molecular imag-ing capability without the use of fluorescent dyes or externalmarkers. These advantages have vastly expanded Raman ca-pabilities to biomacromolecular self-assemblies (eg, nucleicacid complexes and viruses),27,28 shown in Figure 2, andbiological media (eg, cell-based assays), with considerableapplication to in vitro and in vivo pharmaceutical scienceresearch.24,29 Incorporating an optical microscope and motor-ized stage into the Raman instrument for spectroscopic chem-ical imaging by obtaining spectra for a defined 2-dimensionalarea with a resolution down to 1 μm12 has further expandedRaman spectroscopy’s utility in various structural and mo-lecular investigations. These direct and quantitative Ramanchemical imaging (Figure 3) and mapping (Figure 4) inves-tigations include biomaterial nanotubes (providing a spatialresolution of ~25 nm),30 drug-polymer-controlled drug deliv-ery systems,31,32 solid-state polymorphic transformations,33-37
and drug disposition research.24,38-42 The combination ofscanning electron microscopy (SEM) and Raman spectro-scopy has been applied in single-crystal hydration studies ofcarbamazepine, in the absence and presence of excipients,where it was demonstrated that defect structures were ofgreater importance in the initiation of the hydration processthan the crystal face.43
Unlabeled and unfixed single living cells and organelles canbe molecularly examined rapidly, noninvasively, and non-destructively by Raman chemical imaging. This novel tech-nique has great potential in medical applications (ex vivoand in vivo),44 tissue engineering, and drug discovery byvirtue of its noninvasive, nondestructive, and rapid molecu-lar fingerprinting of the effects of pharmaceuticals on single
living cells at various stages of the cell cycle, with detailednanometer spatial resolution.45 Raman chemical imaging hasbeen used in cell biology,46,47 dipalmitoylphosphatidylcho-line (DPPC)/cholesterol vesicle bilayer phase behavior,48 dif-ferential tissue histopathology and chemical compositionvariation for cancer detection and degree of cancer progres-sion in different tissue types,47,49-53 and identification of anddifferentiation between multidrug-resistant cancer cells.54
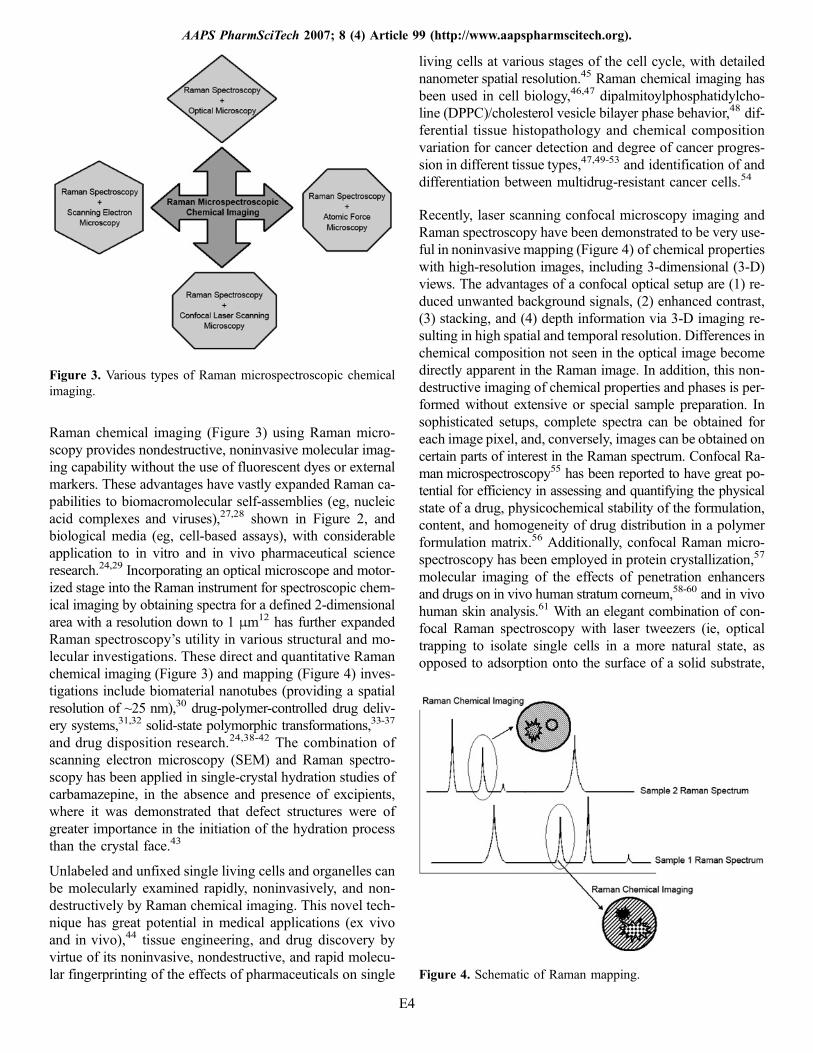
Recently, laser scanning confocal microscopy imaging andRaman spectroscopy have been demonstrated to be very use-ful in noninvasive mapping (Figure 4) of chemical propertieswith high-resolution images, including 3-dimensional (3-D)views. The advantages of a confocal optical setup are (1) re-duced unwanted background signals, (2) enhanced contrast,(3) stacking, and (4) depth information via 3-D imaging re-sulting in high spatial and temporal resolution. Differences inchemical composition not seen in the optical image becomedirectly apparent in the Raman image. In addition, this non-destructive imaging of chemical properties and phases is per-formed without extensive or special sample preparation. Insophisticated setups, complete spectra can be obtained foreach image pixel, and, conversely, images can be obtained oncertain parts of interest in the Raman spectrum. Confocal Ra-man microspectroscopy55 has been reported to have great po-tential for efficiency in assessing and quantifying the physicalstate of a drug, physicochemical stability of the formulation,content, and homogeneity of drug distribution in a polymerformulation matrix.56 Additionally, confocal Raman micro-spectroscopy has been employed in protein crystallization,57
molecular imaging of the effects of penetration enhancersand drugs on in vivo human stratum corneum,58-60 and in vivohuman skin analysis.61 With an elegant combination of con-focal Raman spectroscopy with laser tweezers (ie, opticaltrapping to isolate single cells in a more natural state, asopposed to adsorption onto the surface of a solid substrate,
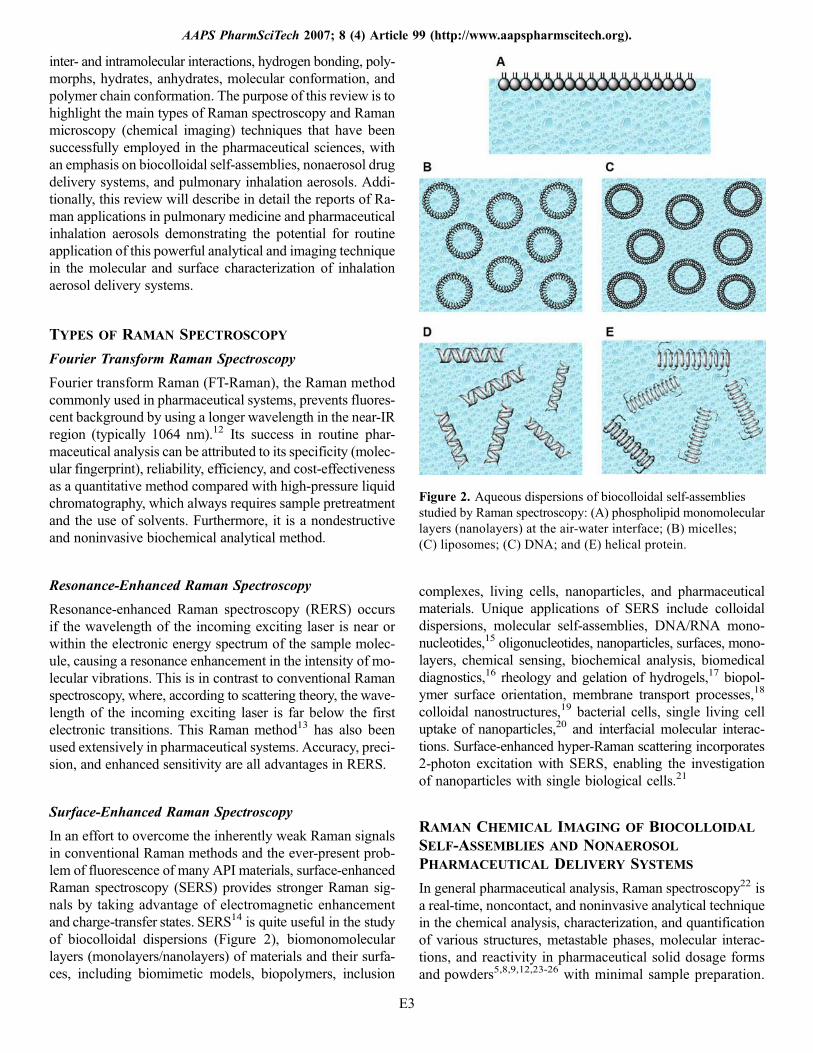
Figure 3. Various types of Raman microspectroscopic chemicalimaging.
Figure 4. Schematic of Raman mapping.
AAPS PharmSciTech 2007; 8 (4) Article 99 (http://www.aapspharmscitech.org).
E4
which is known to disturb the natural state), rapid identifi-cation of single live cells (bacterial cells and fungal spores)and organelles can be accomplished from every angle.62-64
Additionally, efforts are being made in expanding laser tweezerconfocal Raman molecular application to single live cell can-cer screening with a 98.3% cancer detection sensitivity basedon intrinsic characteristic biomolecular differences (as op-posed to physical attributes, eg, surface phenotype) in singlelive transformed lymphocytes and normal human lympho-cytes.65 Laser tweezer Raman spectroscopy has been used ininvestigating the activation of individual T cells66 and thedynamic real-time effects of alcohol on a single living redblood cell.67
Raman microscopy 3-D profiling has been performed withatomic force microscopy (AFM) phase imaging with con-focal Raman microscopy to successfully identify and ana-lyze, at the nanometer level, the distribution of amorphousregions on the surface of semicrystalline solid pharmaceut-ical excipients.68 It was shown that Raman spectroscopycan complement AFM and can provide micrometer-levelinformation (with lateral spatial resolution on the order of1-2 μm)69 on the depth of the surface amorphous domains,particularly as it applies to semicrystalline particles, in addi-tion to characterizing bonding interactions and quantifyingamorphicity/degree of crystallinity content. In addition, con-focal Raman microimaging of pharmaceutical coatings in con-junction with AFM analysis has been reported in identifyingthe chemical composition of small areas of the coating.70
Disadvantages of classical Raman spectroscopy, in the con-text of pharmaceutical applications, are fluorescence in thesample interfering with Raman scatter detectability and theinherently weak Raman scattering process, resulting in lowsensitivity and the need for sensitive detectors and intenselaser excitation sources.23 SERS16,23,71 overcomes these lim-itations by providing high sensitivity and hence is a powerfulanalytical technique for biocolloidal systems, antibiotic drugadsorption,72 precise drug detection and quantification in bod-ily fluids,73 and antiretroviral74,75 and antitubercle bacillusdrug76 molecular conformational investigations. Using a com-bination of micro-Raman and SERS, the recognition processof drugs with large biomolecules (eg, albumin) through theuse of colloidal nanoparticles was reported through investiga-tion of the binding properties of the drugs with albumin.77
Surface-enhanced Raman microscopy has been successfullyused in imaging of live cells,78 including individual humanlymphocyte cells.79 SERS-confocal microscopy has been usedin chemical imaging of cellular proteins, including enzymes,cellular proteins, and receptors in single cells.80 Surface-enhanced micro-Raman spectroscopy in model diagnosticsystems incorporating microfluidics81 showed potentially pro-mising application in pharmaceutical research and clinicalchemistry. Bacterial discrimination82 via SEM-SERS, andviral detection in immunoassays83 and DNA nanoimaging84
via SERS-AFM, have been recently reported. A novel chemi-cal nanoimaging technique combines SERS with AFM(tapping mode) to provide highly detailed spectra and high-resolution chemical imaging of biological materials, includ-ing bacterial cells and DNA bases.85
RAMAN APPLICATIONS IN PULMONARY SYSTEMS
AND PHARMACEUTICAL INHALATION AEROSOLS
Atmospheric polluting particulate matter, consisting of poly-aromatic hydrocarbons and particulate soot, and its relation-ship to pulmonary diseases (ie, pneumonia, asthma, chronicobstructive pulmonary disease, and lung cancer), global cli-mate change, and oceanic warming have been the subject ofintense research for many decades. This is especially truein recent years, when “molecular fingerprint” characteriza-tion tools, such as Raman chemical imaging and mapping(Figures 3 and 4, respectively), have revealed demonstratedutility in atmospheric aerosol and bioaerosol research. Muchattention has been given to bioaerosols and their relationshipto various types of pulmonary allergic and infectious diseases.Additionally, the topic of infectious bioaerosols is gainingparticular attention in the context of biodefense and globalpublic health. Based on the successes of Raman spectroscopyin atmospheric and bioaerosol research, Raman applicationsfor the respiratory system and pharmaceutical inhalation ae-rosols are being increasingly reported. As will be revealed inthe following discussion, Raman spectroscopy has great pro-mise for vast and powerful application in therapeutic inhala-tion aerosols, pulmonary histopathology, pulmonary infectiousdiseases, pulmonary immunology, lung surfactant biophysicsand interfacial phenomena, and respiratory molecular biology.
Raman Spectroscopy in Atmospheric Aerosols andAerosol Particulate Reactions
Raman spectroscopy has been traditionally employed in in-vestigating and characterizing single aerosol particles,86,87
atmospheric aerosol particles,88 and microparticle multicom-ponent aerosols.89 Raman spectroscopy has been applied tosuccessful in situ measurement of the chemical compositionsof monodisperse and polydisperse aerosols in the micrometersize range with a low signal-to-noise ratio.90 In situ chemicalanalysis of ambient uncharged atmospheric aerosol particleswith diameters 9 1 μm was captured using an electrodynamicbalance and levitated while Raman spectroscopy with a charge-coupled device (CCD) detector was successfully employed toidentify chemical substances in the aerosol particles.91 Ramanchemical imaging using SEM and confocal laser scanning mi-croscopy (CLSM) has also been used in the mapping of fineparticulate atmospheric aerosols,92,93 mass and heat transfereffects on evaporating aerosol droplets,94,95 aerosol waterdroplet growth,96,97 single aerosol droplet physical and chem-ical dynamics,98 gas-aerosol chemical reactions involving
AAPS PharmSciTech 2007; 8 (4) Article 99 (http://www.aapspharmscitech.org).
E5
water vapor and greenhouse gases,99-103 aerosol chemical re-actions in the synthesis of polymeric microspheres,104 and in-terfacial hydrogen bonding in water aerosols.105 As seen withnonaerosol systems, enhanced Raman scattering signal wasobserved in aerosol chemicals analyzed by resonance Ramanspectroscopy.106 Raman microspectroscopy (Figure 3) hasenabled the imaging and molecular fingerprinting (Figure 4)of hydrocarbon-water mixing during multicomponent aerosolparticle formation.107
Raman Investigations of Bioaerosols
Raman characterization of bioaerosols, such as pollen, vi-ruses, and bacteria, that are regularly inhaled and can causeand exacerbate pulmonary diseases has been reported.108-110
Aerosolized aqueous suspensions of bioaerosols containingEscherichia coli, Pseudomonas aeruginosa, and Salmonellatyphimurium have been examined using SERS.111 Infectiousbioaerosolized pathogens acquired by the pulmonary routehave been the subject of much interest in global public healthand biodefense. Bioaerosols consisting of aerosolized nano-colloidal suspensions of pollen,112E coli,112Bacillus anthracis(anthrax),113Francisella tularensis (tularemia),113 and Bacillussubtilis (anthrax spores)114 have been successfully detectedat low levels and molecularly characterized by Raman chem-ical imaging and SERS.
Raman Studies of the Respiratory System
As mentioned previously, antimicrobial drugs used in thetreatment of the pulmonary infection tuberculosis have beeninvestigated using SERS.76 Additionally, the various partsof the pulmonary system have been investigated using Ra-man spectroscopy. The interfacial properties and molecularinteractions (ie, electrostatic, hydrophobic, hydrogen bond-ing, and van der Waals) of human lung surfactant modelscontaining DPPC, and/or palmitoyloleoylphosphatidylglycerol(POPG), with synthetic cationic hydrophobic heteropolypep-tide surfactant derivatives of human surfactant protein SP-Bwere deciphered by quantitative Raman interaction parame-ters reported by Vincent et al.115 Additionally, they foundusing model human lung surfactant systems of DPPC mixedwith DPPG (dipalmitoylphosphatidylglycerol) that specificlipid-heteropolypeptide interactions result in a dynamic bi-layer microdomain heterogeneity116 that is necessary for thenormal mechanics of pulmonary respiration.
Various types of immortal and mortal pulmonary cell lineshave been employed in many in vitro models of pulmonarytransport and absorption studies of pulmonary aerosol andparticulate uptake.117
In an effort to apply powerful spectroscopic and chemicalimaging techniques in the study and molecular character-
ization of the pulmonary system at the cellular and sub-cellular levels, in very recent years, Raman spectroscopy hasjust begun to demonstrate its unique and vast utility in non-invasive and nondestructive in vitro and in vivo pulmonarycell and subcellular applications. The molecular structure ofcellular components of single lung fibroblast cells (withoutlabeling) under stress followed by apoptosis has been ex-amined by Raman mapping.118 In an unlabeled single cellundergoing apoptosis, it was demonstrated that the Ramanband intensity of the nucleic acids present in the nucleusand cytoplasm decreased as the number of cell surface blis-ters (having higher nucleic acid content) increased, whichwas indicative of nucleus degradation.118 It was reportedby Kaminaka et al119,120 that Raman spectroscopy of humanlung tissue (normal and cancerous) demonstrated that 2 strongvibrational bands at 1666 and 1448 cm–1, representing col-lagen, increased in lung tissues upon lung cancer progres-sion (as noted in other cancerous tissue systems) and hencecan be used as a Raman marker in diagnosis.
The molecular composition and histological evaluation ofnormal human bronchial tissue was characterized in situ byRaman mapping, as reported by Koljenovic et al,121 whosought to have a biochemical and molecular understandingof lung cancer. They found that the spectra of bronchialmucus, which has relatively high quantities of triolein, weredominated by strong lipid signals, and strong collagen andglycosaminoglycan signals were associated with cartilage.Relatively lower lipid and higher DNA signals were asso-ciated with the basal side of the bronchial epithelium.
It was shown that formalin, which preserves normal andmalignant human bronchial tissues, does significantly andadversely affect the Raman spectra of these tissues throughthe introduction of artifacts; and hence, when using fixedtissue, thorough rinsing in phosphate-buffered saline mayassist in obtaining more meaningful Raman spectra.122,123
The authors found that formalin fixation did not affect themajor Raman signals for lipids and proteins, but the Ramanintensities did decrease upon formalin fixation compared withfresh unfixed human bronchial tissue. This decrease was sug-gested to be associated with the effect of formalin on thebronchial lipid self-assembly. In tumor tissue, the same trendwas reported, particularly for the porphyrin (hemoglobin fromthe blood) and water Raman bands, as it related to the state ofhydration of the lung tissue samples. For Raman lung tissuestudies for molecular characterization of normal and lungcancer states, the authors recommended using fresh tissuerather than formalin-fixed tissue or in vivo Raman analysis.
In one study using Raman spectroscopy on fresh (unfixedand never frozen) lung tissue using normal and malig-nant lung tissue it was found that the normalized Ramanphospholipid band intensities decreased and the amide Iand amide III vibrational bands increased in lung cancer
AAPS PharmSciTech 2007; 8 (4) Article 99 (http://www.aapspharmscitech.org).
E6
development123,124 as the protein content increased andprotein conformational changes occurred, accompanied byincreased nucleic acid content. The authors suggest that thiscan be attributed to the very unique organ structure of thelungs: compared with other organs, the lungs are less dense,with relatively small amounts of protein, and the densityincreases as the protein content increases (ie, amide I band)during disease progression.
Raman Investigations of PharmaceuticalInhalation Aerosols
Raman spectroscopy and chemical imaging is beginning tofind increasing application in the molecular characteriza-tion of pharmaceutical aerosols125-127 for pulmonary deliv-
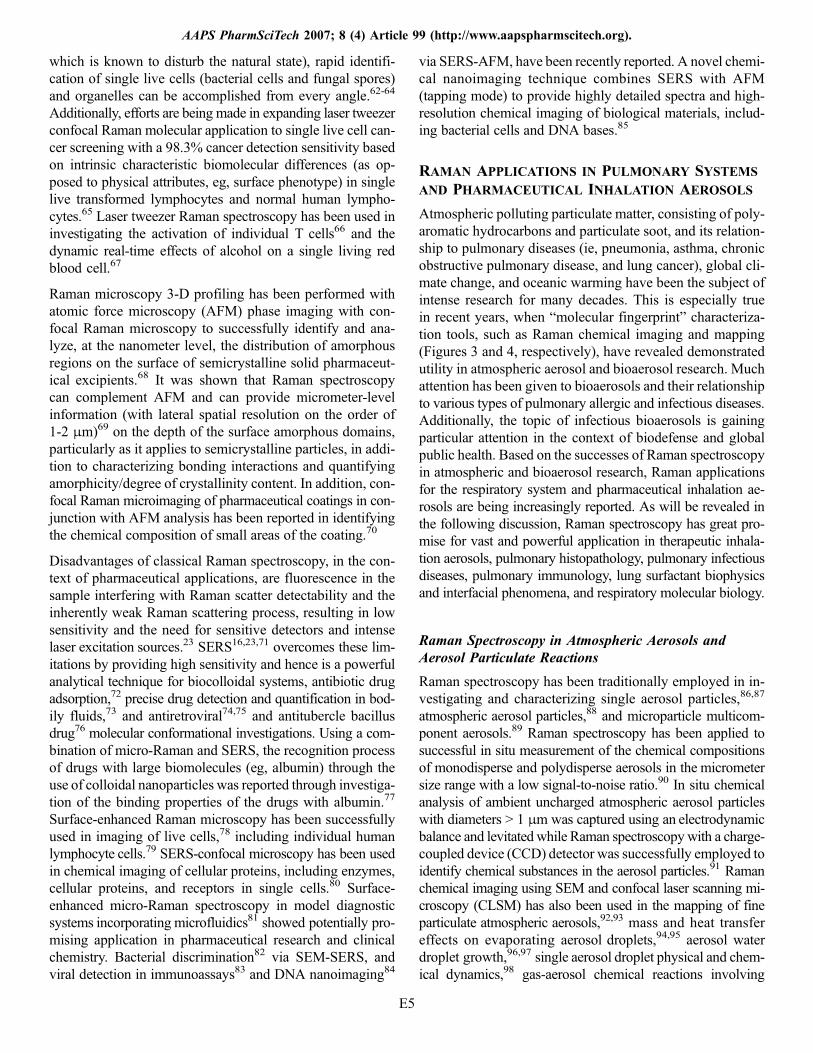
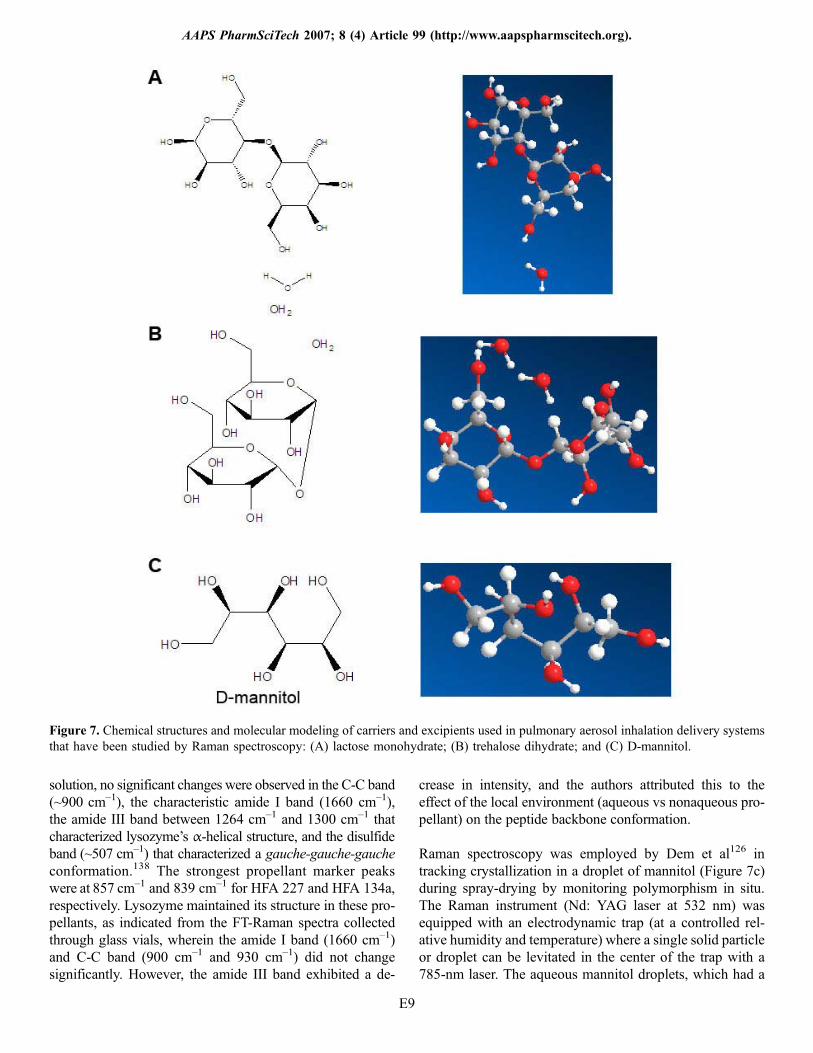
ery, and in particular, dry powder inhalation aerosol deliverysystems.117,128,129 Depicted in Figures 5 and 6, respec-tively, are the chemical structures (ChemDraw Ultra 10.0,ChemOffice 2006, Cambridgesoft, Cambridge, MA) andmolecular modeling (Chem 3DPro 10.0, ChemOffice 2006,Cambridgesoft) of the pulmonary drugs that have been char-acterized by Raman spectroscopy. Similarly, Figure 7 showsthe chemical structures and molecular modeling of pulmonaryinhalation aerosol carriers and excipients. The crystallinity,polymorphism, and amorphicity of α-lactose monohydrate(Figure 7a), the only US Food and Drug Administration–approved carrier for use in dry powder pharmaceutical ae-rosols, have been analyzed and distinguished using Ramanspectroscopy.130-133 The molecular nature of salbutamol (al-buterol) sulfate134 (Figure 5a) and salts crystallized from
Figure 5. Chemical structures and molecular modeling of various pulmonary β-agonist and anticholinergic drugs that have beenstudied by Raman spectroscopy: (A) albuterol sulfate (short-acting β-agonist); (B) ipratropium bromide monohydrate (anticholinergic);and (C) salmeterol xinafoate (long-acting β2-agonist).
AAPS PharmSciTech 2007; 8 (4) Article 99 (http://www.aapspharmscitech.org).
E7
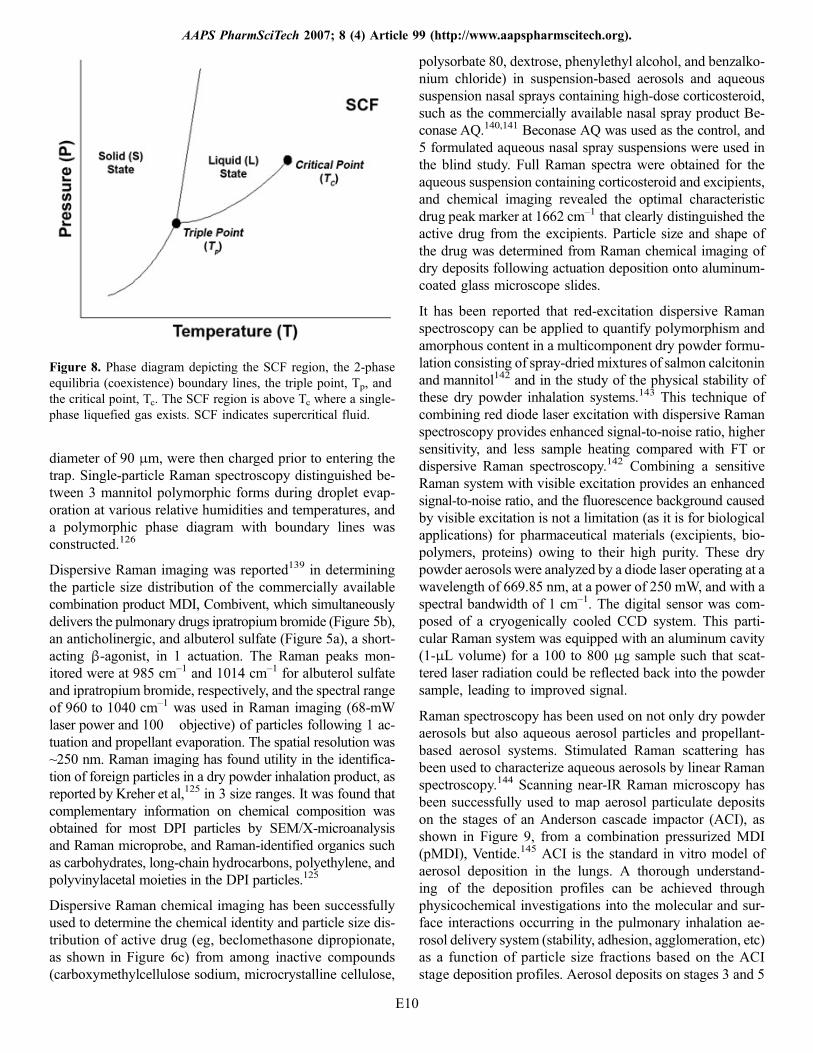
salbutamol base135 has been examined using Raman spec-troscopy. Particle engineering techniques such as supercriticalfluid (SCF) technology, solution-enhanced dispersion withsupercritical fluids (SEDS), supercritical fluid extraction ofemulsions, and spray-drying are used often in intelligentlydesigning respirable dry powder particles, as described indetail by Hickey and Mansour.117Figure 8 illustrates the gen-eral phase diagram of an SCF, which is liquefied gas existingas a single phase above its critical point, Tc, and possessingdesirable properties of both its liquid (L) state and its gaseous(G) state.117 It was reported136 that SEDS-produced lysozymeretained biological activity as a respirable solid particle whileexhibiting minor changes in its FT-Raman spectra.
Lysozyme has often been used as a robust model protein inbiotherapeutic drug delivery, including dry powder inhala-
tion aerosols for dry powder inhalers (DPIs) and aerosolpropellant systems for metered-dose inhalers (MDIs). Quinnet al137,138 investigated the biomolecular structural confor-mational stability of lysozyme (predominantly α-helical con-formation) and deoxyribonuclease I (predominantly β-sheetconformation) in the hydrofluoroalkane (HFA) propellants(7.5% wt/wt) tetrafluoroethane (HFA 134a) and heptafluor-opropane (HFA 227) at 25-C, using FT-Raman consistingof an Nd3+:YAG laser at 1064 nm with a laser power of500 mW for solids and 800 mW for suspensions. Followingactuation, both proteins maintained enzymatic activity at85% and 90% for DNase I in HFA 227 and HFA 134a, re-spectively, and at 94% and 91% for lysozyme in HFA 227and HFA 134a, respectively.137 FT-Raman provided mo-lecular information related to secondary structure. For lyso-zyme structural stability in the solid state and as an aqueous
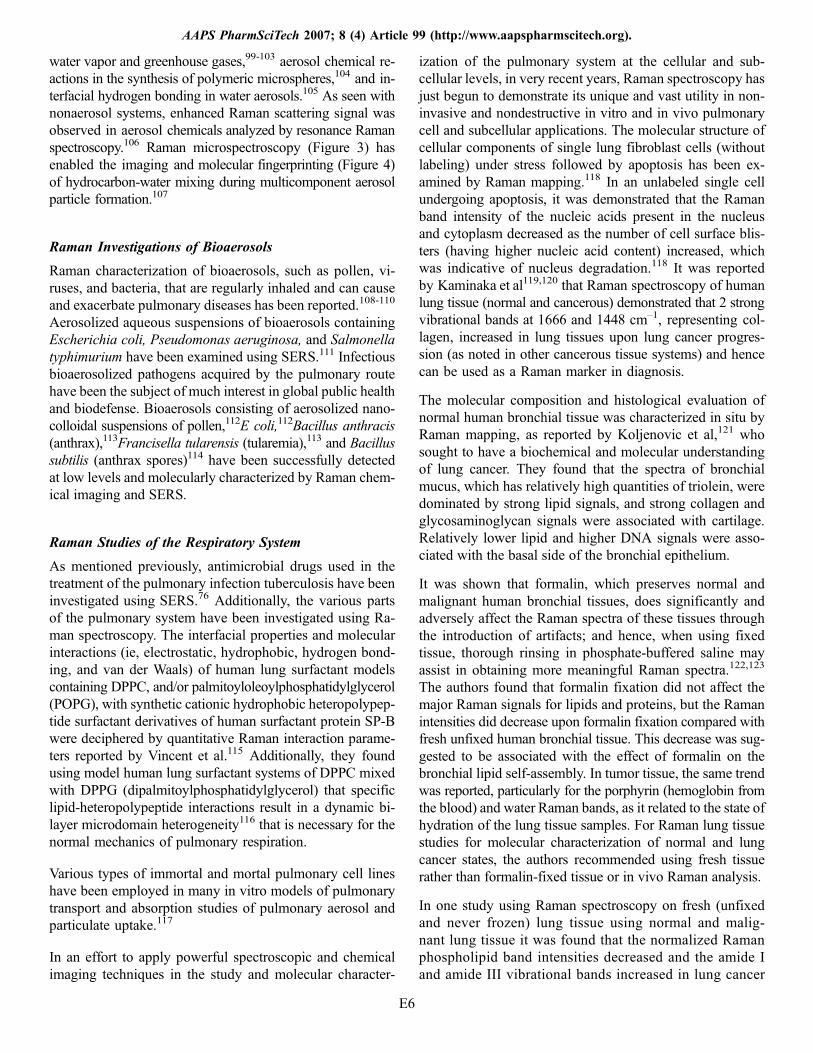
Figure 6. Chemical structures and molecular modeling of various pulmonary corticosteroid drugs that have been studied by Ramanspectroscopy: (A) fluticasone propionate; (B) budesonide; and (C) beclomethasone dipropionate.
AAPS PharmSciTech 2007; 8 (4) Article 99 (http://www.aapspharmscitech.org).
E8
solution, no significant changes were observed in the C-C band(~900 cm–1), the characteristic amide I band (1660 cm–1),the amide III band between 1264 cm–1 and 1300 cm–1 thatcharacterized lysozyme’s α-helical structure, and the disulfideband (~507 cm–1) that characterized a gauche-gauche-gaucheconformation.138 The strongest propellant marker peakswere at 857 cm–1 and 839 cm–1 for HFA 227 and HFA 134a,respectively. Lysozyme maintained its structure in these pro-pellants, as indicated from the FT-Raman spectra collectedthrough glass vials, wherein the amide I band (1660 cm–1)and C-C band (900 cm–1 and 930 cm–1) did not changesignificantly. However, the amide III band exhibited a de-
crease in intensity, and the authors attributed this to theeffect of the local environment (aqueous vs nonaqueous pro-pellant) on the peptide backbone conformation.
Raman spectroscopy was employed by Dem et al126 intracking crystallization in a droplet of mannitol (Figure 7c)during spray-drying by monitoring polymorphism in situ.The Raman instrument (Nd: YAG laser at 532 nm) wasequipped with an electrodynamic trap (at a controlled rel-ative humidity and temperature) where a single solid particleor droplet can be levitated in the center of the trap with a785-nm laser. The aqueous mannitol droplets, which had a
Figure 7. Chemical structures and molecular modeling of carriers and excipients used in pulmonary aerosol inhalation delivery systemsthat have been studied by Raman spectroscopy: (A) lactose monohydrate; (B) trehalose dihydrate; and (C) D-mannitol.
AAPS PharmSciTech 2007; 8 (4) Article 99 (http://www.aapspharmscitech.org).
E9
diameter of 90 μm, were then charged prior to entering thetrap. Single-particle Raman spectroscopy distinguished be-tween 3 mannitol polymorphic forms during droplet evap-oration at various relative humidities and temperatures, anda polymorphic phase diagram with boundary lines wasconstructed.126
Dispersive Raman imaging was reported139 in determiningthe particle size distribution of the commercially availablecombination product MDI, Combivent, which simultaneouslydelivers the pulmonary drugs ipratropium bromide (Figure 5b),an anticholinergic, and albuterol sulfate (Figure 5a), a short-acting β-agonist, in 1 actuation. The Raman peaks mon-itored were at 985 cm–1 and 1014 cm–1 for albuterol sulfateand ipratropium bromide, respectively, and the spectral rangeof 960 to 1040 cm–1 was used in Raman imaging (68-mWlaser power and 100� objective) of particles following 1 ac-tuation and propellant evaporation. The spatial resolution was~250 nm. Raman imaging has found utility in the identifica-tion of foreign particles in a dry powder inhalation product, asreported by Kreher et al,125 in 3 size ranges. It was found thatcomplementary information on chemical composition wasobtained for most DPI particles by SEM/X-microanalysisand Raman microprobe, and Raman-identified organics suchas carbohydrates, long-chain hydrocarbons, polyethylene, andpolyvinylacetal moieties in the DPI particles.125
Dispersive Raman chemical imaging has been successfullyused to determine the chemical identity and particle size dis-tribution of active drug (eg, beclomethasone dipropionate,as shown in Figure 6c) from among inactive compounds(carboxymethylcellulose sodium, microcrystalline cellulose,
polysorbate 80, dextrose, phenylethyl alcohol, and benzalko-nium chloride) in suspension-based aerosols and aqueoussuspension nasal sprays containing high-dose corticosteroid,such as the commercially available nasal spray product Be-conase AQ.140,141 Beconase AQ was used as the control, and5 formulated aqueous nasal spray suspensions were used inthe blind study. Full Raman spectra were obtained for theaqueous suspension containing corticosteroid and excipients,and chemical imaging revealed the optimal characteristicdrug peak marker at 1662 cm–1 that clearly distinguished theactive drug from the excipients. Particle size and shape ofthe drug was determined from Raman chemical imaging ofdry deposits following actuation deposition onto aluminum-coated glass microscope slides.
It has been reported that red-excitation dispersive Ramanspectroscopy can be applied to quantify polymorphism andamorphous content in a multicomponent dry powder formu-lation consisting of spray-dried mixtures of salmon calcitoninand mannitol142 and in the study of the physical stability ofthese dry powder inhalation systems.143 This technique ofcombining red diode laser excitation with dispersive Ramanspectroscopy provides enhanced signal-to-noise ratio, highersensitivity, and less sample heating compared with FT ordispersive Raman spectroscopy.142 Combining a sensitiveRaman system with visible excitation provides an enhancedsignal-to-noise ratio, and the fluorescence background causedby visible excitation is not a limitation (as it is for biologicalapplications) for pharmaceutical materials (excipients, bio-polymers, proteins) owing to their high purity. These drypowder aerosols were analyzed by a diode laser operating at awavelength of 669.85 nm, at a power of 250 mW, and with aspectral bandwidth of 1 cm–1. The digital sensor was com-posed of a cryogenically cooled CCD system. This parti-cular Raman system was equipped with an aluminum cavity(1-μL volume) for a 100 to 800 μg sample such that scat-tered laser radiation could be reflected back into the powdersample, leading to improved signal.
Raman spectroscopy has been used on not only dry powderaerosols but also aqueous aerosol particles and propellant-based aerosol systems. Stimulated Raman scattering hasbeen used to characterize aqueous aerosols by linear Ramanspectroscopy.144 Scanning near-IR Raman microscopy hasbeen successfully used to map aerosol particulate depositson the stages of an Anderson cascade impactor (ACI), asshown in Figure 9, from a combination pressurized MDI(pMDI), Ventide.145 ACI is the standard in vitro model ofaerosol deposition in the lungs. A thorough understand-ing of the deposition profiles can be achieved throughphysicochemical investigations into the molecular and sur-face interactions occurring in the pulmonary inhalation ae-rosol delivery system (stability, adhesion, agglomeration, etc)as a function of particle size fractions based on the ACIstage deposition profiles. Aerosol deposits on stages 3 and 5
Figure 8. Phase diagram depicting the SCF region, the 2-phaseequilibria (coexistence) boundary lines, the triple point, Tp, andthe critical point, Tc. The SCF region is above Tc where a single-phase liquefied gas exists. SCF indicates supercritical fluid.
AAPS PharmSciTech 2007; 8 (4) Article 99 (http://www.aapspharmscitech.org).
E10
following a single Ventide pMDI actuation were used in Ramanmapping. The Raman system used a high-performance near-IR 785-nm laser, and 10 mW of total laser energy was di-rected to the sample for a 30-second time scan from 1338 cm–1
to 1829 cm–1. Raman maps were 100 � 100 μm in area,where Raman bands at 1610 cm–1 and 1662 cm–1 representedsalbutamol and budesonide dipropionate, respectively. Itwas reported that these Raman bands for the drugs exhibitedminimal interference from the pMDI excipients. Good cor-relation was reported between the Raman maps of the ACIplate stages and chemical analysis of the stages. Ramanmapping of the stages confirmed that no new molecularbond formation (indicative of chemical degradation) in the2 drugs occurred, based on the absence of new peaks anddrug peak shifts. The authors reported that even thougholeic acid may be present as a thin film on the stages, itcould not be detected by Raman spectroscopy, presumablybecause of its low concentration, which was lower than thelimit of detection.
In addition to Raman chemical imaging of combinationMDIproducts containing an anticholinergic and a short-actingβ-agonist, combination inhaled products containing a long-acting β2-agonist and a corticosteroid have been investi-gated. Seretide MDI is a commercially available combinationMDI product delivering fluticasone propionate (Figure 6a), acorticosteroid, and salmeterol xinafoate (Figure 5c), a long-acting selective β2-agonist, in the treatment of asthma. Asthmais a complex disease state that exhibits both bronchoconstric-tion and airway inflammation.146 A long-standing interest in
pulmonary inhalation aerosol delivery in the treatment ofasthma is the clinical observation that combination prod-ucts are more efficacious than separate administration of the2 component drugs. Perhaps this may be a result of simul-taneous codeposition of both drugs on a cell via a singleinhaler in a single actuation in the same inspiratory breath.Moreover, codeposition may enhance synergistic drug effects.In an effort to gain insight into this, Theophilus et al147 in-vestigated the deposition per actuation from the commercial-ly available combination and single MDI products Seretide(50 μg fluticasone propionate and 25 μg salmeterol), Se-revent (25 μg salmeterol), and Flixotide (50 μg fluticasonepropionate). Being an in vitro size model of the central air-ways, Plate 4 of the ACI, having a size range of 2.1 to 3.3 μm,was analyzed by Raman spectroscopy following MDI actua-tion at a flow rate of 28.3 L/min. The Raman microscopesetup consisted of a 100� objective lens, a confocal holeset at 65 μm, and a cooled CCD detector connected to a785-nm diode laser operating at 500 mW of laser power,which provided spatial resolution of ~3.2 μm. Raman chem-ical imaging was done on a 128� 128 μm area. The authorsshowed from their Raman chemical images that the combi-nation inhalation product delivered from a single device hadsignificantly greater codeposition of both drugs, which sug-gested that the particles in the combination MDI are asso-ciated until the particles are deposited.147 It was acknowledgedthat while the ACI is an in vitro model of pulmonary depo-sition, the differences observed in vitro would be expectedto be much greater in vivo.147 Propellant evaporation is arapid, dynamic, and complex interfacial process where the
Figure 9. Schematic of Raman mapping of pharmaceutical inhalation aerosols. USP indicates US Pharmacopeia.
AAPS PharmSciTech 2007; 8 (4) Article 99 (http://www.aapspharmscitech.org).
E11
drug interaction with the propellant can have significant ef-fects on final particle characteristics, including particle size,morphology, and deposition behavior. This particularly per-tains to 2-drug MDI systems where coassociation betweenthe 2 drugs can favorably occur within an aerosol propellantsystem, as has been previously reported148 with salmeteroland fluticasone, and was demonstrated by Raman chemicalimaging of codeposition.147
As we have recently reported, a comprehensive set of ana-lytical techniques, including bulk and surface characteriza-tion methods, are necessary in the molecular characterizationof microparticulate and nanoparticulate systems designed forpulmonary dry powder aerosol inhalation delivery.117,128,129
The information on the molecular, surface, and interfacialproperties that Raman characterization can provide is par-ticularly important in applications related to respirable phar-maceutical powders, where understanding the molecularnature of these solid surfaces can enable their manipulationand tailoring for functionality at the nanometer level for tar-geted pulmonary delivery and deposition. Raman spectroscopyand chemical imaging are powerful analytical techniques, asdetailed in this review, as they provide valuable molecularinsight into a variety of biocolloidal self-assemblies and drugdelivery systems, including inhalation aerosol drug deliverysystems. Future Raman spectroscopy and chemical imaginginvestigations on pharmaceutical aerosols, particularly drypowder aerosol inhalation delivery systems, should examinethe effects of temperature and relative humidity on hygro-scopic particulate growth and in vitro aerosol performance,which are then correlated with phase transformations and invitro deposition. Additionally, in vitro and in vivo Ramanchemical imaging of microparticulate and nanoparticulateinteractions with various living pulmonary epithelial celltypes and pulmonary immune cells will provide valuable andneeded biophysical insight into particulate uptake by livingpulmonary cells and transport in the lungs. Moreover, Ramanimaging in pulmonary medicine will enable a novel com-bination of molecular insight and noninvasive imaging ca-pability that can molecularly characterize infected pulmonarycells, cancerous pulmonary cells, pulmonary disease states,and cellular delivery and disposition following pulmonaryinhalation aerosol delivery.
CONCLUSIONS
As presented in this review, Raman mapping of aerosols atthe micro- and nanometer level of resolution and correlationwith in vitro aerosol lung deposition is now achievable withnew, sophisticated, commercially available Raman micro-spectroscopy techniques. As has been demonstrated here,Raman chemical imaging has unique, noninvasive, and ver-satile applications in systems of pharmaceutical interest, andhence has vast potential for application in pulmonary inha-
lation aerosol research. Unique and important applicationpotentials for Raman chemical imaging include aerosol de-position molecular profiling in the lungs and in specific in-dividual pulmonary cells, and nondestructive chemicalimaging of pulmonary aerosol inhalation delivery of bio-colloidal self-assemblies and biotherapeutics, both in vitroand in vivo.
ACKNOWLEDGMENTS
Heidi M. Mansour gratefully acknowledges the generous fi-nancial support from the Pharmaceutical Manufacturers andResearchers of America Foundation for a Postdoctoral Fellow-ship Award in Pharmaceutics. Pfizer, Inc and DMV-FonterraExcipients are thanked for their generous financial support.
REFERENCES
1. Raman CV. Anisotropy of molecules. Nature. 1922;109:75Y76.
2. Raman CV, Krishnan KS. A new type of secondary radiation. Nature.1928;121:501Y502.
3. Singh RCV. Raman and the discovery of the Raman effect. PhysPerspect. 2002;4:399Y420.
4. Tudor AM, Melia CD, Binns JS, Hendra PJ, Church S, Davies MC.The application of Fourier-transform Raman spectroscopy to the analysisof pharmaceuticals and biomaterials. J Pharm Biomed Anal.1990;8:717Y720.
5. Newman AW, Bryn SR. Solid-state analysis of the activepharmaceutical ingredient in drug products. Drug Discov Today.2003;8:898Y905.
6. McCreery RL, Horn AJ, Spencer J, Jefferson E. Noninvasiveidentification of materials inside USP vials with Raman spectroscopyand a Raman spectral library. J Pharm Sci. 1998;87:1Y8.
7. Lyon LA, Keating CD, Fox AP, et al. Raman spectroscopy. AnalChem. 1998;70:341Y361.
8. Wartewig S, Neubert RH. Pharmaceutical applications of mid-IR andRaman spectroscopy. Adv Drug Deliv Rev. 2005;57:1144Y1170.
9. Fini G. Applications of Raman spectroscopy to pharmacy. J RamanSpectrosc. 2004;35:335Y337.
10. Dollish FR, Fateley WG, Bentley FF. Characteristic RamanFrequencies of Organic Compounds. NewYork, NY: Wiley-Interscience;1974.
11. Lin-Vien D, Colthup NB, Fateley WG, Grasselli JG. The Handbookof Infrared and Raman Characteristic Frequencies of Organic Molecules.Oxford, UK: Elsevier Science & Technology Books; 1991.
12. Bugay D. Characterization of the solid-state: spectroscopic techniques.Adv Drug Deliv Rev. 2001;48:43Y65.
13. Vickers TJ, Mann CK, Zhu J, Chong CK. Quantitative resonanceRaman spectroscopy. Appl Spectrosc Rev. 1991;26:341Y375.
14. Tian ZQ. Surface-enhanced Raman spectroscopy: advancements andapplications. J Raman Spectrosc. 2005;36:466Y470.
15. Bell SEJ, Sirimuthu NMS. Surface-enhanced Raman spectroscopy(SERS) for sub-micromolar detection of DNA/RNA mononucleotides.J Am Cancer Soc. 2006;128:15580Y15581.
16. Vo-Dinh T, Yan F, Wabuyele MB. Surface-enhanced Ramanscattering for biomedical diagnostics and molecular imaging. Top ApplPhys. 2006;103:409Y426.
AAPS PharmSciTech 2007; 8 (4) Article 99 (http://www.aapspharmscitech.org).
E12
17. Miljanic S, Frkanec L, Biljan T, Meic Z, Zinic M. Surface-enhancedRaman scattering on molecular self-assembly in nanoparticle-hydrogelcomposite. Langmuir. 2006;22:9079Y9081.
18. Wood E, Sutton C, Beezer AE, Creighton JA, Davis AF, MitchellJC. Surface enhanced Raman scattering (SERS) study of membranetransport processes. Int J Pharm. 1997;154:115Y118.
19. Aroca RF, Alvarez-Puebla RA, Pieczonka N, Sanchez-Cortez S,Garcia-Ramos JV. Surface-enhanced Raman scattering on colloidalnanostructures. Adv Colloid Interface Sci. 2005;116:45Y61.
20. Kneipp J, Kneipp H, McLaughlin M, Brown D, Kneipp K. In vivomolecular probing of cellular compartments with gold nanoparticlesand nanoaggregates. Nano Lett. 2006;6:2225Y2231.
21. Kneipp J, Kneipp H, Kneipp K. Two-photon vibrationalspectroscopy for biosciences based on surface-enhanced hyper-Ramanscattering. Proc Natl Acad Sci USA. 2006;103:17149Y17153.
22. USP. G11209 Raman Spectrophotometry USP 29-NF 24 The UnitedStates Pharmacopoeia and The National Formulary: The OfficialCompendia of Standards. Rockville, MD: US PharmacopeialConvention; 2006:2983Y2988.
23. Pinzaru SC, Pavel I, Leopold N, Kiefer W. Identification andcharacterization of pharmaceuticals using Raman and surface-enhancedRaman scattering. J Raman Spectrosc. 2004;35:338Y346.
24. Huong PV. Drug analysis by Raman and micro-Raman spectroscopy.J Pharm Biomed Anal. 1986;4:811Y823.
25. Vankeirsbilck T, Vercauteren A, Baeyens W, et al. Applications ofRaman spectroscopy in pharmaceutical analysis. TrAC. 2002;21:869Y877.
26. Strachan CJ, Rades T, Gordon KC, Rantanen J. Raman spectroscopyfor quantitative analysis of pharmaceutical solids. J Pharm Pharmacol.2007;59:179Y192.
27. Benevides JM, Overman SA, Thomas GJ. Raman, polarized Ramanand ultraviolet resonance Raman spectroscopy of nucleic acids and theircomplexes. J Raman Spectrosc. 2005;36:279Y299.
28. Lambert PJ, Whitman AG, Dyson OF, Akula SM. Ramanspectroscopy: the gateway into tomorrow’s virology. Virol J. 2006;3:51.
29. Ling J. Raman imaging microscopy—a potential cost-effective toolfor drug development. Am Pharm Rev. 2005;8:44Y49.
30. Hartschuh A, Sanchez EJ, Xie XS, Novotny L. High-resolutionnear-field Raman microscopy of single-walled carbon nanotubes.Phys Rev Lett. 2003;90:095503.
31. Li L. AbuBaker O, Shao ZJ. Characterization of poly(ethyleneoxide) as a drug carrier in hot-melt extrusion. Drug Dev Ind Pharm.2006;32:991Y1002.
32. Bell SEJD, Andrew C, Fido LA, et al. Characterization of siliconeelastomer vaginal rings containing HIV microbicide TMC120 by Ramanspectroscopy. J Pharm Pharmacol. 2007;59:203Y207.
33. Randall CS, Dinenno BK, Schultz RK, Dayter L, Konieczny M,Wunder SL. Solid-state transformation of a leukotriene antagonist. Int JPharm. 1995;120:235Y245.
34. Chan KLA, Fleming OS, Kazarian SG, Vassou D, Chryssikos GD,Gionis V. Polymorphism and devitrification of nifedipine undercontrolled humidity: a combined FT-Raman, IR and Raman microscopicinvestigation. J Raman Spectrosc. 2004;35:353Y359.
35. Cao X, Sun C, Thamann TJ. A study of sulfamerazine single crystalsusing atomic force microscopy, transmission light microscopy, andRaman spectroscopy. J Pharm Sci. 2005;94:1881Y1892.
36. Stoica C, Verwer P, Meekes H, Vlieg E, van Hoof PJCM, KaspersenFM. Epitaxial 2D nucleation of the stable polymorphic form of the
steroid 7αMNa on the metastable form: implications for Ostwald’s ruleof stages. Int J Pharm. 2006;309:16Y24.
37. Kojima T, Onoue S, Murase N, Katoh F, Mano T, Matsuda Y.Crystalline form information from multiwell plate salt screening by useof Raman microscopy. Pharm Res. 2006;23:806Y812.
38. Sasic S. Raman mapping of low-content API pharmaceuticalformulations, I: mapping of alprazolam in alprazolam/Xanax tablets.Pharm Res. 2007;24:58Y65.
39. Henson MJ, Zhang L. Drug characterization in low dosagepharmaceutical tablets using Raman microscopic mapping. ApplSpectrosc. 2006;60:1247Y1255.
40. Ling J, Weitman SD, Miller MA, Moore RV, Bovik AC. DirectRaman imaging techniques for study of the subcellular distribution of adrug. Appl Opt. 2002;41:6006Y6017.
41. Kang E, Wang H, Kwon IK, Robinson J, Park K, Cheng J-X.In situ visualization of paclitaxel distribution and release bycoherent anti-stokes Raman scattering microscopy. Anal Chem.2006;78:8036Y8043.
42. Sasic S, Clark DA, Mitchell JC, Snowden MJ. Raman line mappingas a fast method for analyzing pharmaceutical bead formulations.Analyst. 2005;130:1530Y1536.
43. Tian F, Sandler N, Gordon KC, et al. Visualizing the conversionof carbamazepine in aqueous suspension with and without thepresence of excipients: a single crystal study using SEM and Ramanmicroscopy. Eur J Pharm Biopharm. 2006;64:326Y335.
44. Choo-Smith LP, Edwards HG, Endtz HP, et al. Medical applicationsof Raman spectroscopy: from proof of principle to clinical implementation.Biopolymers. 2002;67:1Y9.
45. Notingher I, Hench LL. Raman microspectroscopy: a noninvasivetool for studies of individual living cells in vitro. Expert Rev MedDevices. 2006;3:215Y234.
46. Cheng J-X, Jia K, Eheng G, Xie XS. Laser-scanning coherentanti-Stokes Raman scattering microscopy and application to cell biology.Biophys J. 2002;83:502Y509.
47. Taleb A, Diamond J, McGarvey JJ, Beattie JR, Toland C, HamiltonPW. Raman microscopy for the chemometric analysis of tumor cells.J Phys Chem B. 2006;110:19625Y19631.
48. de Lange MJL, Bonn M, Müller M. Direct measurement of phasecoexistence in DPPC/cholesterol vesicles using Raman spectroscopy.Chem Phys Lipids. 2007;146:76Y84.
49. Schaeberle MD, Morris HR, Turner JF, Treado PJ. Raman chemicalimaging spectroscopy. Anal Chem. 1999;71:175AY181A.
50. Bakker Schut TC, Witjes MJH, Sterenborg HJCM, et al. In vivodetection of dysplastic tissue by Raman spectroscopy. Anal Chem.2000;72:6010Y6018.
51. Chowdary MVP, Kumar KK, Kurien J, Mathew S, Krishna CM.Discrimination of normal, benign, and malignant breast tissues byRaman spectroscopy. Biopolymers. 2006;83:556Y569.
52. Yu C, Gestl E, Eckert K, Allara D, Irudayaraj J. Characterization ofhuman breast epithelial cells by confocal Raman microspectroscopy.Cancer Detect Prev. 2006;30:515Y522.
53. Haka AS, Shafer-Peltier KE, Fitzmaurice M, Crowe J, Dasari RR,Feld MS. Diagnosing breast cancer by using Raman spectroscopy.Proc Natl Acad Sci USA. 2005;102:12371Y12376.
54. Krishna CM, Kegelaerl G, Rubin S, Kartha VB, Manfait M,Sockalingum GD. Combined Fourier transform infrared and Ramanspectroscopic identification approach for identification of multidrugresistance phenotype in cancer cell lines. Biopolymers. 2006;82:462Y470.
AAPS PharmSciTech 2007; 8 (4) Article 99 (http://www.aapspharmscitech.org).
E13
55. Brenan CJH, Hunter IW. Confocal image properties of a confocalscanning laser visible-light FT-Raman microscope. Appl Spectrosc.1995;49:971Y976.
56. Breitenbach J, Schrof W, Neumann J. Confocal Raman-spectroscopy:analytical approach to solid dispersions and mapping of drugs. PharmRes. 1999;16:1109Y1113.
57. Noda K, Sato H, Watanabe S, Yokoyama S, Tashiro H. Efficientcharacterization for protein crystals using confocal Raman spectroscopy.Appl Spectrosc. 2007;61:11Y18.
58. Caspers PJ, Williams AC, Carter EA, et al. Monitoring thepenetration enhancer dimethyl sulfoxide in human stratum corneumin vivo by confocal Raman spectroscopy. Pharm Res. 2002;19:1577Y1580.
59. Zhang G, Moore DJ, Sloan KB, Flach CR, Mendelsohn R. Imagingthe prodrug-to-drug transformation of a 5-fluorouracil derivative in skinby confocal Raman microscopy. J Invest Dermatol.2007;127:1205Y1209.
60. Xiao C, Moore DJ, Rerek ME, Flach CR, Mendelsohn R. Feasibilityof tracking phospholipid permeation into skin using infrared and Ramanmicroscopic imaging. J Invest Dermatol. 2005;124:622Y632.
61. Caspers PJ, Lucassen GW, Puppels GJ. Combined in vivo confocalRaman spectroscopy and confocal microscopy of human skin. BiophysJ. 2003;85:572Y580.
62. Xie C, Mace J, Dinno MA, et al. Identification of single bacterialcells in aqueous solution using confocal laser tweezers Ramanspectroscopy. Anal Chem. 2005;77:4390Y4397.
63. Chan JW, Esposito AP, Talley CE, Hollars CW, Lane SM, Huser T.Reagentless identification of single bacterial spores in aqueous solutionby confocal laser tweezers Raman spectroscopy. Anal Chem.2004;76:599Y603.
64. Xie CG, Chen D, Li YQ. Raman sorting and identification of singleliving micro-organisms with optical tweezers. Opt Lett.2005;30:1800Y1802.
65. Chan JW, Taylor DS, Zwerdling T, Lane SM, Ihara K, Huser T.Micro-Raman spectroscopy detects individual neoplastic and normalhematopoietic cells. Biophys J. 2005;90:648Y656.
66. Mannie MD, McConnell TJ, Xie C, Li YQ. Activation-dependentphases of T cells distinguished by use of optical tweezers and nearinfrared Raman spectroscopy. J Immunol Methods. 2005;297:53Y60.
67. Deng JL, Wei Q, Zhang MH, Wang YZ, Li YQ. Study of theeffect of alcohol on single human red blood cells using near-infraredlaser tweezers Raman spectroscopy. J Raman Spectrosc. 2005;36:257Y261.
68. Ward S, Perkins M, Zhang JX, et al. Identifying and mapping surfaceamorphous domains. Pharm Res. 2005;22:1195Y1202.
69. Clarke FC, Jamieson MJ, Clark DA, Hammond SV, Jee RD, MoffatAC. Chemical image fusion. The synergy of FT-NIR and Ramanmapping microscopy to enable a more complete visualization ofpharmaceutical formulations. Anal Chem. 2001;73:2213Y2220.
70. Ringqvist A, Taylor L, Ekelund K, Ragnarsson G, Engstrom S,Axelsson A. Atomic force microscopy analysis and confocal Ramanmicroimaging of coated pellets. Int J Pharm. 2003;267:35Y47.
71. Vo-Dinh T, Yan F, Wabuyele MB. Surface-enhanced Ramanscattering for medical diagnostics and biological imaging. J RamanSpectrosc. 2005;36:640Y647.
72. Howes BD, Scatragli S, Marzocchi MP, Smulevich G.Surface-enhanced resonance Raman spectroscopy of rifamycinson silver nanoparticles: insight into their adsorption mechanisms.J Raman Spectrosc. 2006;37:900Y909.
73. Farquharson S, Shende C, Inscore FE, Maksymiuk P, Gift A.Analysis of 5-fluorouracil in saliva using surface-enhanced Ramanspectroscopy. J Raman Spectrosc. 2005;36:208Y212.
74. Rivas L, Sanchez-Cortes S, Garcia-Ramos JV. Raman structuralstudy of thymine and its 2 '-deoxy-ribosyl derivatives in solid state,aqueous solution and when adsorbed on silver nanoparticles. Phys ChemChem Phys. 2002;4:1943Y1948.
75. Rivas L, Sanchez-Cortes S, Garcia-Ramos JV. Conformational studyof AZT in aqueous solution and adsorbed on a silver surface by meansof Raman spectroscopy. J Raman Spectrosc. 2002;33:6Y9.
76. Wang Y, Li YS, Wu J, Zhang ZX, An DQ. Surface-enhanced Ramanspectra of some anti-tubercle bacillus drugs. Spectrochim Acta [A].2000;56:2637Y2644.
77. Fabriciova G, Sanchez-Cortes S, Garcia-Ramos JV, Miskovsky P.Joint application of micro-Raman and surface-enhanced Ramanspectroscopy to the interaction study of the antitumoral anthraquinonedrugs danthron and quinizarin with albumins. J Raman Spectrosc.2004;35:384Y389.
78. Lee S, Kim S, Choo J, et al. Biological imaging of HEK293 cellsexpressing PLC1 using surface-enhanced Raman microscopy. AnalChem. 2007;79:916Y922.
79. Eliasson C, Engelbrektsson J, Loren A, Abrahamsson J,Abrahamsson K, Josefson M. Multivariate methodology for surfaceenhanced Raman chemical imaging of lymphocytes. Chemometr IntellLab Sys. 2006;81:13Y20.
80. Nithipatikom K, McCoy MJ, Hawi SR, Nakamoto K, Adar F,Campbell WB. Characterization and application of Raman labels forconfocal Raman microspectroscopic detection of cellular proteins insingle cells. Anal Biochem. 2003;322:198Y207.
81. Strehle KR, Cialla D, Rosch P, Henkel T, Kohler M, Popp J. Areproducible surface-enhanced Raman spectroscopy approach. OnlineSERS measurements in a segmented microfluidic system. Anal Chem.2007;79:1542Y1547.
82. Jarvis RM, Brooker A, Goodacre R. Surface-enhanced Ramanspectroscopy for bacterial discrimination utilizing a scanning electronmicroscope with a Raman spectroscopy interface. Anal Chem.2004;76:5198Y5202.
83. Driskell JD, Kwarta KM, Lipert RJ, Porter MD, Neill JD, RidpathJF. Low-level detection of viral pathogens by a surface-enhanced Ramanscattering based immunoassay. Anal Chem. 2005;77:6147Y6154.
84. Deckert V, Zeisel D, Zenobi R, Vo-Dinh T. Near-fieldsurface-enhanced Raman imaging of dye-labeled DNA with 100-nmresolution. Anal Chem. 1998;70:2646Y2650.
85. Rasmussen A, Deckert V. Surface- and tip-enhanced Ramanscattering of DNA components. J Raman Spectrosc. 2006;37:311Y317.
86. Schweiger G. Raman scattering on single aerosol particles and onflowing aerosols: a review. J Aerosol Sci. 1990;21:483Y509.
87. Reid JP, Meresman H, Mitchem L, Symes R. Spectroscopic studiesof the size and composition of single aerosol droplets. Int Rev PhysChem. 2007;26:139Y192.
88. Rosen H, Novakov T. Raman-scattering and characterization ofatmospheric aerosol particles. Nature. 1977;266:708Y710.
89. Buehler MF, Allen TM, Davis EJ. Microparticle Ramanspectroscopy of multicomponent aerosols. J Colloid Interface Sci.1991;146:79Y89.
90. Stowers M, Friedlander S. Chemical characterization of flowingpolydisperse aerosols by Raman spectroscopy. Aerosol Sci Technol.2002;36:48Y61.
AAPS PharmSciTech 2007; 8 (4) Article 99 (http://www.aapspharmscitech.org).
E14
91. Vehring R, Aardahl C, Schweiger G, Davis E. The characterization offine particles originating from an uncharged aerosol: size dependence anddetection limits for Raman analysis. J Aerosol Sci. 1998;29:1045Y1061.
92. Nelson MP, Zugates CT, Treado PJ, Casuccio GS, Exline DL,Schlaegle SF. Combining Raman chemical imaging and scanningelectron microscopy to characterize ambient fine particulate matter.Aerosol Sci Technol. 2001;34:108Y117.
93. Batonneau Y, Sobanska S, Laureyns J, Bremard C. Confocalmicroprobe Raman imaging of urban tropospheric aerosol particles.Environ Sci Technol. 2006;40:1300Y1306.
94. Hopkins RJ, Reid JP. A comparative study of the mass and heattransfer dynamics of evaporating ethanol/water, methanol/water, and1-propanol/water aerosol droplets. J Phys Chem B. 2006;110:3239Y3249.
95. Hopkins RJ, Reid JP. Evaporation of ethanol/water droplets:examining the temporal evolution of droplet size, composition andtemperature. J Phys Chem A. 2005;109:7923Y7931.
96. Mitchem L, Hopkins RJ, Buajarern J, Ward AD, Reid JP.Comparative measurements of aerosol droplet growth. Chem Phys Lett.2006;432:362Y366.
97. Mitchem L, Buajarern J, Hopkins RJ, et al. Spectroscopy of growingand evaporating water droplets: exploring the variation in equilibriumdroplet size with relative humidity. J Phys Chem A. 2006;110:8116Y8125.
98. Reid JP, Mitchem L. Laser probing of single-aerosol dropletdynamics. Annu Rev Phys Chem. 2006;57:245Y271.
99. Buehler MF, Davis EJ. A study of gas aerosol chemical reactions bymicrodroplet Raman spectroscopy—the bromine/1-octadecene reaction.Colloids Surf A. 1993;79:137Y149.
100. Rassat SD, Davis EJ. Chemical reaction of sulfur dioxide with acalcium oxide aerosol particle. J Aerosol Sci. 1992;23:165Y180.
101. Chen B, Laucks M, Davis E. Carbon dioxide uptake by hydratedlime aerosol particles. Aerosol Sci Technol. 2004;38:588Y597.
102. Tang IN, Fung KH. Characterization of inorganic salt particles byRaman spectroscopy. J Aerosol Sci. 1989;20:609Y617.
103. Davis EJ, Rassat SD, Foss W. Measurement of aerosol/gas reactionrates by microparticle Raman spectroscopy. J Aerosol Sci.1992;23:429Y432.
104. Davis EJ, Aardahl CL, Widmann JF. Raman studies of aerosolchemical reactions. J Dispersion Sci Technol. 1998;19:293Y309.
105. Zhang JX, Aiello D, Aker PM. Hydrogen-bonding at the aerosolinterface. J Phys Chem A. 1995;99:721Y730.
106. Fung KH, Tang IN. Aerosol particle analysis by resonance Ramanspectroscopy. J Aerosol Sci. 1992;23:301Y307.
107. Mitchem L, Buajarern J, Ward AD, Reid JP. A strategy forcharacterizing the mixing state of immiscible aerosol components andthe formation of multiphase aerosol particles through coagulation.J Phys Chem B. 2006;110:13700Y13703.
108. Spurny KR. On the chemical detection of bioaerosols. J AerosolSci. 1994;25:1533Y1547.
109. Laucks ML, Roll G, Schweiger G, Davis EJ. Physical and chemical(Raman) characterization of bioaerosols—pollen. J Aerosol Sci.2000;31:307Y319.
110. Pan YL, Boutou V, Bottiger J, Zhang S, Wolf JP, Chang R. A puffof air sorts bioaerosols for pathogen identification. Aerosol Sci Technol.2004;38:598Y602.
111. Sengupta A, Laucks ML, Dildine N, Drapala E, Davis EJ.Bioaerosol characterization by surface-enhanced Raman spectroscopy(SERS). J Aerosol Sci. 2005;36:651Y664.
112. Sengupta A, Brar N, Davis EJ. Bioaerosol detection andcharacterization by surface-enhanced Raman spectroscopy. J ColloidInterface Sci. 2007;309:36Y43.
113. Kalasinsky KS, Hadfield T, Shea AA, et al. Raman chemicalimaging spectroscopy reagentless detection and identification ofpathogens: signature development and evaluation. Anal Chem.2007;79:2658Y2673.
114. Zhang XY, Young MA, Lyandres O, Van Duyne RP. Rapiddetection of an anthrax biomarker by surface-enhanced Ramanspectroscopy. J Am Cancer Soc. 2005;127:4484Y4489.
115. Vincent J, Revak S, Cochrane C, Levin I. Raman spectroscopicstudies of model human pulmonary surfactant systems: phospholipidinteractions with peptide paradigms for the surfactant protein SP-B.Biochemistry. 1991;30:8395Y8401.
116. Vincent JS, Revak SD, Cochrane CD, Levin IW. Interactions ofmodel human pulmonary surfactants with a mixed phospholipidbilayer assembly—Raman spectroscopic studies. Biochemistry.1993;32:8228Y8238.
117. Hickey AJ, Mansour HM. Formulation challenges of powders forthe delivery of small molecular weight molecules as aerosols. In:Rathbone MJ, Hadgraft J, Roberts MS, Lane M, eds. Modified-ReleaseDrug Delivery Technology. 2nd ed. New York, NY: Informa Healthcare;In press.
118. Krafft C, Knetschke T, Funk RHW, Salzer R. Studies onstress-induced changes at the subcellular level by Ramanmicrospectroscopic mapping. Anal Chem. 2006;78:4424Y4429.
119. Kaminaka S, Yamazaki H, Ito T, Kohda E, Hamaguchi HO.Near-infrared Raman spectroscopy of human lung tissues: possibilityof molecular-level cancer diagnosis. J Raman Spectrosc. 2001;32:139Y141.
120. Kaminaka S, Ito T, Yamazaki H, Kohda E, Hamaguchi H.Near-infrared multichannel Raman spectroscopy toward real-time invivo cancer diagnosis. J Raman Spectrosc. 2002;33:498Y502.
121. Koljenovic S, Schut TCB, van Meerbeeck JP, et al. Ramanmicrospectroscopic mapping studies of human bronchial tissue.J Biomed Opt. 2004;9:1187Y1197.
122. Huang Z, McWilliams A, Lam S, et al. Effect of formalin fixationon the near-infrared Raman spectroscopy of normal and canceroushuman bronchial tissues. Int J Oncol. 2003;23:649Y655.
123. Huang Z, McWilliams A, Lui H, McLean DI, Lam S, Zeng HS.Near-infrared Raman spectroscopy for optical diagnosis of lung cancer.Int J Cancer. 2003;107:1047Y1052.
124. Min YK, Yamamoto T, Kohda E, Ito T, Hamaguchi H. 1064 nmnear-infrared multichannel Raman spectroscopy of fresh human lungtissues. J Raman Spectrosc. 2005;36:73Y76.
125. Kreher C, Bootz W, Niemann M, Scaffidi L, Spallek MW.Foreign particle characterization in inhalation drug products: a criticalcomparison of methods and techniques. In: Dalby RN, Byron PR,Suman JD, Peart J, Farr SJ, eds. Respiratory Drug Delivery IX.Palm Springs, CA: Davis Healthcare International Publishing;2004:373Y376.
126. Dem C, Egen M, Krueger M, Popp J. Understanding the spray drydesign process through single droplet investigations. In: Dalby RN,Byron PR, Suman JD, Peart J, Farr SJ, eds. Respiratory Drug DeliveryX. Boca Raton, FL: Davis Healthcare International Publishing;2006:257Y266.
127. Niemann M, Fusser M, Scaffidi L. A critical comparison: particlecounting with light obscuration and automated Raman microscopy. In:Dalby RN, Byron PR, Suman JD, Peart J, Farr SJ, eds. Respiratory
AAPS PharmSciTech 2007; 8 (4) Article 99 (http://www.aapspharmscitech.org).
E15
Drug Delivery X. Boca Raton, FL: Davis Healthcare InternationalPublishing; 2006:529Y532.
128. Hickey AJ, Mansour HM, Telko MJ, et al. Physical characterizationof component particles included in dry powder inhalers, I: strategyreview and static characteristics. J Pharm Sci. 2007;96:1282Y1301.
129. Hickey AJ, Mansour HM, Telko MJ, et al. Physical characterizationof component particles included in dry powder inhalers, II: dynamiccharacteristics. J Pharm Sci. 2007;96:1302Y1319.
130. Ticehurst MD, York P, Rowe RC, Dwivedi SK. Characterisation ofthe surface properties of α-lactose monohydrate with inverse gaschromatography, used to detect batch variation. Int J Pharm.1996;141:93Y99.
131. Murphy BM, Prescott SW, Larson I. Measurement of lactosecrystallinity using Raman spectroscopy. J Pharm Biomed Anal.2005;38:186Y190.
132. Niemela P, Paallysaho M, Harjunen P, et al. Quantitative analysisof amorphous content of lactose using CCD-Raman spectroscopy.J Pharm Biomed Anal. 2005;37:907Y911.
133. Kirk JH, Dann SE, Blatchford CG. Lactose: a definitive guide topolymorph determination. Int J Pharm. 2007;334:103Y114.
134. Ticehurst MD, Rowe RC, York P. Determination of the surfaceproperties of two batches of salbutamol sulphate by inverse gaschromatography. Int J Pharm. 1994;111:241Y249.
135. Brown AB, York P, Williams AC, Edwards HGM, Worthington H.Solid-state characterization of salbutamol salts using FT-Raman andSSNMR spectroscopy. J Pharm Pharmacol. 1993;45:1135.
136. Moshashaée S, Bisrat M, Forbes RT, Quinn ÉA, Nyqvist H, York P.Supercritical fluid processing of proteins: lysozyme precipitation fromaqueous solution. J Pharm Pharmacol. 2003;55:185Y192.
137. Quinn EA, Forbes RT, Williams AC, Oliver MJ, McKenzie L,Purewal TS. A Raman spectroscopic study of the compatibility ofproteins with hydrofluoroalkane propellants. In: Dalby RN, Byron PR,Suman JD, Peart J, Farr SJ, eds. Respiratory Drug Delivery VII.Tarpon Springs, FL: Davis Healthcare International Publishing;2000:581Y584.
138. Quinn EA, Forbes RT, Williams AC, Oliver MJ, McKenzie L,Purewal TS. Protein conformational stability in the hydrofluoroalkane
propellants tetrafluoroethane and heptafluoropropane analysed byFourier transform Raman spectroscopy. Int J Pharm. 1999;186:31Y41.
139. Guo C, Doub WH. Use of Raman imaging for determination of theparticle size distribution (PSD) of active pharmaceutical ingredients(APIs) in metered dose inhalers. In: Dalby RN, Byron PR, Suman JD,Peart J, Farr SJ, eds. Respiratory Drug Delivery X. Boca Raton, FL:Davis Healthcare International Publishing; 2006:617Y620.
140. Waligorski A, Doub WH, Adams WP, et al. Raman chemicalimaging for drugs and excipients in aqueous suspension nasal sprayformulations. In: Dalby RN, Byron PR, Suman JD, Pert J, Farr SJ, eds.Respiratory Drug Delivery X. 541Y544.
141. Doub WH, Adams WP, Spencer JA, Buhse LF, Nelson MP, TreadoPJ. Raman chemical imaging for ingredient-specific particle sizecharacterization of aqueous suspension nasal spray formulations: aprogress report. Pharm Res. 2007;24:934Y945.
142. Vehring R. Red-excitation dispersive Raman spectroscopy is asuitable technique for solid-state analysis of respirable pharmaceuticalpowders. Appl Spectrosc. 2005;59:286Y292.
143. Chan H, Clark AR, Feeley J, et al. Physical stability of salmoncalcitonin spray-dried powders for inhalation. J Pharm Sci. 2004;93:792Y804.
144. Vehring R. Linear Raman spectroscopy on aqueous aerosols:influence of nonlinear effects on detection limits. J Aerosol Sci.1998;29:65Y79.
145. Steele DF, Young PM, Price R, Smith T, Edge S, Lewis D. Thepotential use of Raman mapping to investigate in vitro deposition ofcombination pressurized metered-dose inhalers. AAPS J. 2004;6:E32.
146. Hickey AJ. Inhalation Aerosols: The Physiological Basis forTherapy. New York, NY: Informa Healthcare; 2007.
147. Theophilus A, Moore A, Prime D, Rossomanno S, Whitcher B,Chrystyn H. Co-deposition of salmeterol and fluticasone propionate by acombination inhaler. Int J Pharm. 2006;313:14Y22.
148. Michael Y, Snowden MJ, Chowdhry BZ, Ashurst IC,Davies-Cutting CJ, Riley T. Characterisation of the aggregationbehaviour in a salmeterol and fluticasone propionate inhalationaerosol system. Int J Pharm. 2001;221:165Y174.
AAPS PharmSciTech 2007; 8 (4) Article 99 (http://www.aapspharmscitech.org).
E16
Related Documents