COMPANY COMPANY PROFILE PROFILE 1

Welcome message from author
This document is posted to help you gain knowledge. Please leave a comment to let me know what you think about it! Share it to your friends and learn new things together.
Transcript

COMPANYCOMPANYPROFILEPROFILE
1

INTRODUCTION
Shivalik Agro Poly Products Limited (SAPL) was established in 1976 as a pioneering venture in India for the manufacture of polyethylene wide width film for use in agriculture, agricultural/industrial storage covers & irrigation - water management. The plant is capable of making polyethylene film/ sheets up to 12 meters wide width and in thickness range from 100 Micron to 2000 Micron. The company’s works is located at Parwanoo (H.P) 30 Kms from Chandigarh city on the Chandigarh – Shimla national highway on 2.5 acres of land with well organized infrastructure and manufacturing facilities. The company has a good standing in the polyethylene film market and is well known for its enterprising work in the use of plastics in agriculture and water management. The company has been members of ASSOCHAM and PHD chamber of commerce and Industries since long. The company has an annual installed capacity to process 5100 M.T. of polyethylene granules and 400 M.T. of polyurethane systems. The company diversified and entered into a manufacturing agreement, in the year 2004 with Reckitt Benckiser (India) Ltd. to operate and manage their activities setup at the works of the company at plot no. 1, sector 3, industrial Area, Parwanoo to manufacture Dettol antiseptic and skin care range of bathing soaps under this unit.
SAPL Accreditions
SAPL is an ISO 9001-2008 accredited Company SAPL hold BIS Manufacturing License for manufacture of LDEP Films SAPL got its financial rating done from CRISIL
2

HISTORY
SHIVATHENE LINOPACK (SLP) - A UNIT OF SHIVALIK AGRO POLY PRODUCTS- PU DIVISION
Shivathene Linopack (A Unit of Shivalik Agro Poly Products Ltd.) manufactures polyols and PU systems for polyurethane industries at its works, located at Parwanoo (H.P) and has an installed capacity of 600 M.T. per annum.
Polyurethanes are very versatile and their nature varies depending upon the additives contained in the polyol part of polyurethane system. Shivathene Linopack, is engaged in manufacturing of polyols /polyurethanes systems for Rigid Polyurethane Foam, Cold Cure Foam, Integral Skin Foam, Coating, Cable Jointing Compounds, Potting & Encapsulation Compounds for Electrical and Electronic components, Elastomers and Polymer Concrete.
This unit with an aim to diversify entered into a manufacturing agreement in the year 2003 with M/s Reckitt Benckiser (India) Ltd. to operate and manage their activities setup at the works of the company at Plot No. 1-A, Sector 3, Industrial Area, Parwanoo to manufacture household liquid cleaners such as Harpic, Colin, Teepol, and Lizol.
3

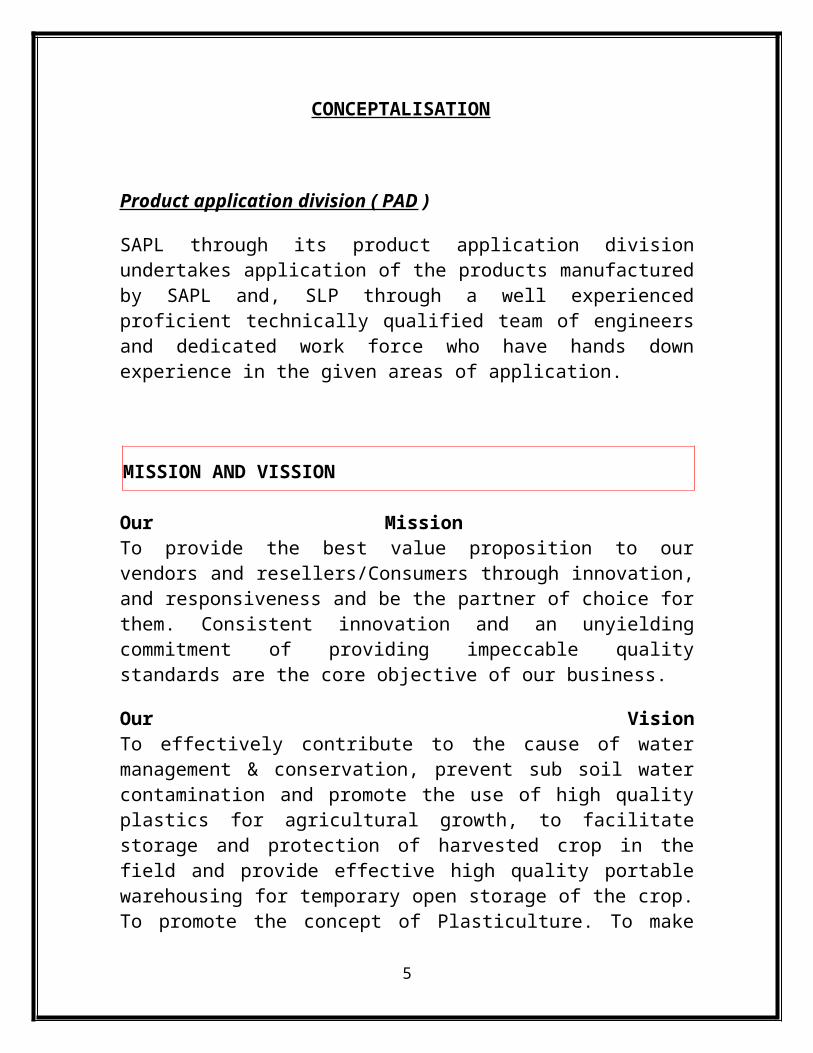
CONCEPTALISATION
Product application division ( PAD )
SAPL through its product application division undertakes application of the products manufactured by SAPL and, SLP through a well experienced proficient technically qualified team of engineers and dedicated work force who have hands down experience in the given areas of application.
MISSION AND VISSION
Our Mission To provide the best value proposition to our vendors and resellers/Consumers through innovation, and responsiveness and be the partner of choice for them. Consistent innovation and an unyielding commitment of providing impeccable quality standards are the core objective of our business.
Our VisionTo effectively contribute to the cause of water management & conservation, prevent sub soil water contamination and promote the use of high quality plastics for agricultural growth, to facilitate storage and protection of harvested crop in the field and provide effective high quality portable warehousing for temporary open storage of the crop. To promote the concept of Plasticulture. To make Shivathene Group the most innovative supplier of quality products, focused on highest value creation for its customers.
4
QUALITY POLICY
Excellence in Quality, across all aspects from Raw Material to Final Product , including Packing is our basis to manufacture.
We are committed to QUALITY, ON-TIME DELIVERY and COST-EFFECTIVENESS, and will:
Provide products and services which meet or exceed customer needs and expectations: o Manufacture products which meet customer specifications.o Strive to meet customer’s target values.o Monitor customer satisfaction.
Deliver on-time. o Ship on the date required by the customer. o Monitor on-time delivery performance.
5

MANAGEMENT
Board of Directors
1. Mr. Pankaj K. Mahajan, Chairman & Managing Director 2. Mrs. Alka Mahajan, Vice Chairperson 3. Dr. G.D. Tyagi, Executive Director (Technical & operations)4. Mr. Sanjay Gupta 5. Mr.Tushar Dasgupta 6. Mr. M. S. Raghav 7. Ms. Priyanka Mahajan 8. Mr. Hoshiar Singh 9. Mr. Naresh Arora 10.Nominee - Punjab State Civil Supplies Corp. Ltd. (PUNSUP)11.Mr. Vikas Pratap, IAS 12.Finance Controller & Company Secretary13.Mr. B.L.Jain 14.Chief General Manager15.Mr. Ashok Mittal 16.Advisor Corporate17.Mr. R.C.Gupta
PE COVERS FOR FUMIGATION OF FOODGRAINS
Polyethylene covers, for fumigation of bulk food grains are manufactured by the company since 1978. These covers are extensively used for fumigation of food grains stored in the open or in godowns.
6

CAP COVERS FOR FUMIGATION OF FOODGRAINS
PE covers are fabricated from heavy duty PE film processed from PE granules, are chemically inert.
PE covers are having high degree of retention of fumigants. PE covers are UV stabilized which increases the shelf life of covers. PE cover is having single seam at the side and the seam is thermally
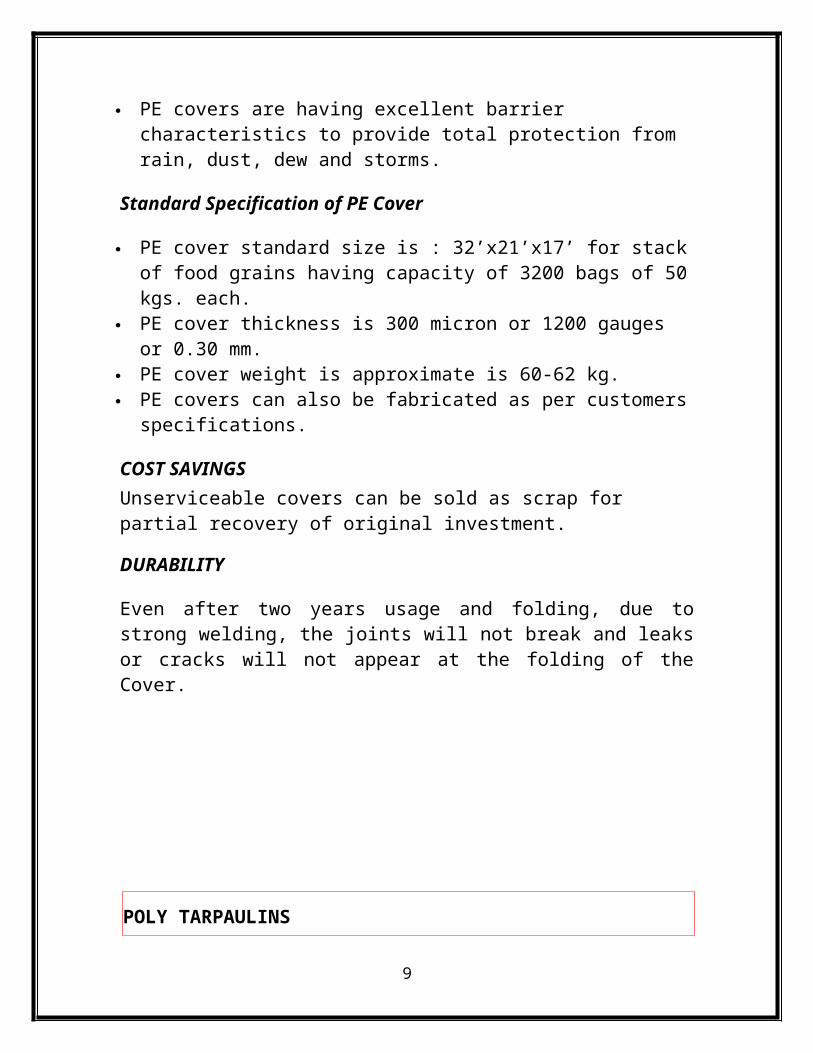
welded to provide added strength. PE films remain unaffected in temperatures ranging from -2°C to + 50°C. PE covers are having excellent barrier characteristics to provide total
protection from rain, dust, dew and storms.
Standard Specification of PE Cover
PE cover standard size is : 32’x21’x17’ for stack of food grains having capacity of 3200 bags of 50 kgs. each.
PE cover thickness is 300 micron or 1200 gauges or 0.30 mm. PE cover weight is approximate is 60-62 kg. PE covers can also be fabricated as per customers specifications.
COST SAVINGSUnserviceable covers can be sold as scrap for partial recovery of original investment.
DURABILITY
Even after two years usage and folding, due to strong welding, the joints will not break and leaks or cracks will not appear at the folding of the Cover.
7

POLY TARPAULINS
Black Tarpaulins are manufactured out of PE Granules of size 30’x40’ having thickness of 300 micron+/-20% and having weight of around 30-34 kgs. These are meant for outside storage of food grains, particularly for paddy.
U.V.STABILIZED POLYETHYLENE FILM FOR GREEN HOUSES & TUNNELS
PE film used for green houses and tunnels is having two to three years life.
PE is available up to 12 meters width and thickness range from 100 microns to 250 microns.
Colour-transparent or translucent-The colour of green house film is considered based on the percentage of required sun light.
PE green house film is having excellent tensile strength and elongation.
CONVERSION TABLE (Thickness V/s Area)(Density-0.93 g/cc)
Approx. Area Coverage Per Kg. of PE Film
Thickness in
Microns MM Gauge Sq. Mtrs. Sq. Ft.100 0.10 400 10.75 115.67150 0.15 600 7.17 77.15200 0.20 800 5.38 57.89
8
PE SHRINK WRAP FILM
The concept of shrink wrapping consumer products is prevalent in most of the technologically advanced countries. The process achieved remarkable success as a technique for functional applications such as bundling, tray packing and pallet-load utilization. Today it is one of the most accepted packaging system for a wide range of consumer and industrial products.
Shrink wrap film is available in thickness ranging from 25 Microns to 250 microns in different width as per individual customer requirements. It is available in the form of lay flat tubing and also single ply wide width film.
Areas of application
Cosmetics & pharmaceuticals Paper products & stationery Items Soaps and detergents Food products Engineering goods
CO – EXTRUDED MULTILAYER (THREE LAYER) PE FILMS
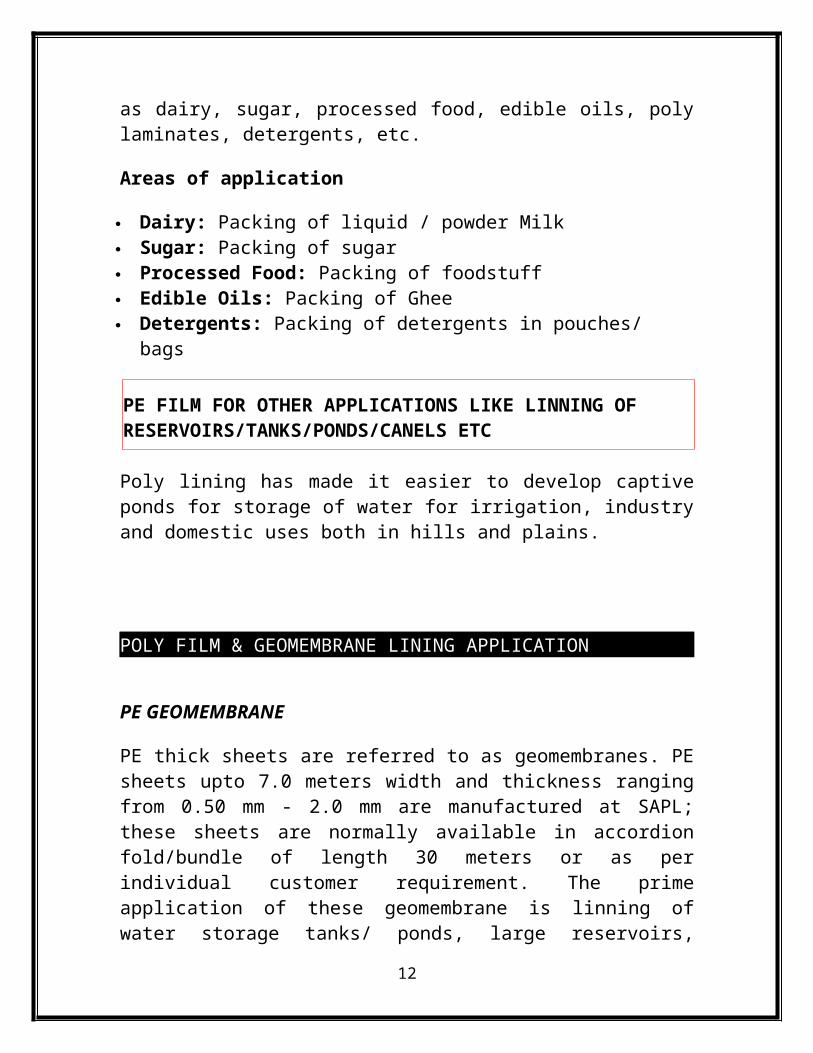
The film meets growing demand in the flexible packaging segment of the market. The multilayer film finds extensive application in industries such as dairy, sugar, processed food, edible oils, poly laminates, detergents, etc.
Areas of application
Dairy: Packing of liquid / powder Milk Sugar: Packing of sugar Processed Food: Packing of foodstuff Edible Oils: Packing of Ghee Detergents: Packing of detergents in pouches/ bags
9

PE FILM FOR OTHER APPLICATIONS LIKE LINNING OF RESERVOIRS/TANKS/PONDS/CANELS ETC
Poly lining has made it easier to develop captive ponds for storage of water for irrigation, industry and domestic uses both in hills and plains.
POLY FILM & GEOMEMBRANE LINING APPLICATION
PE GEOMEMBRANE
PE thick sheets are referred to as geomembranes. PE sheets upto 7.0 meters width and thickness ranging from 0.50 mm - 2.0 mm are manufactured at SAPL; these sheets are normally available in accordion fold/bundle of length 30 meters or as per individual customer requirement. The prime application of these geomembrane is linning of water storage tanks/ ponds, large reservoirs, effluent tanks, fish farming ponds landfills, ash dike, etc.
POLYOLS AND P.U. SYSTEMS
Polyols and P.U. systems manufactured and marketed by Shivathene Linopack (A Unit of SAPL) find extensive application in the following areas.
Rigid foam: Hot and cold Insulation Integral skin: Automobile and furniture Coating/Paints: Water proofing for buildings and anticorrosive for
metallic and non metallic surfaces Polymer concrete: Industrial floorings Potting and encapsulation compound: Electronic and electrical
components Grouting: grouting of machines Sealants: Civil application for expansion and contraction joints
10

PRODUCTS
Thermo Plastic SHIVAPRIME* C5 CRYSTALEX* (TDS) SHIVAPRIME* C5 (TDS)
ABOUT US
Shivalik Prismo India Private Ltd. (SPIPL) was incorporated in the year 1999 and established to manufacture and promote the use of hot applied Thermoplastic Road Marking materials of the highest quality for the Indian subcontinent.
SPIPL has in the past couple of years established itself as India’s leading manufacturer and supplier of Thermoplastic Road Marking material with supplies being made to the large number of prestigious projects and customers. The company has supplied Thermoplastic Road Marking Material to over 90 NHAI Projects.
The company is a 50:50 joint venture between Prismo Ltd., U.K and Shivalik Agro Poly Products Ltd. (SAPL), India.
SPIPL brought the combined expertise of both these companies while offering the world class quality products in the thermoplastic road markings sector. SPIPL is committed to quality, safety, environment protection and value for money.
The Company aim to offer complete solutions to the consumer’s need in thermoplastic products and allied services with 100% customer satisfaction.
11
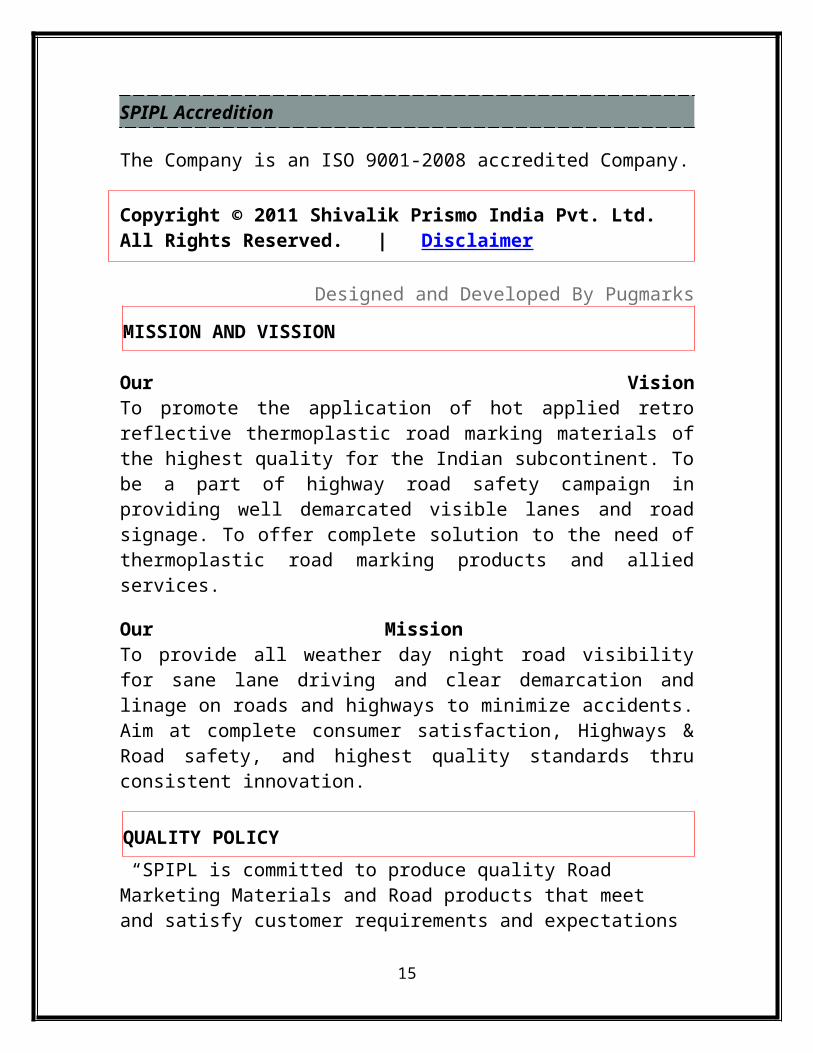
SPIPL Accredition
The Company is an ISO 9001-2008 accredited Company.
Copyright © 2011 Shivalik Prismo India Pvt. Ltd. All Rights Reserved. | Disclaimer
Designed and Developed By Pugmarks
MISSION AND VISSION
Our VisionTo promote the application of hot applied retro reflective thermoplastic road marking materials of the highest quality for the Indian subcontinent. To be a part of highway road safety campaign in providing well demarcated visible lanes and road signage. To offer complete solution to the need of thermoplastic road marking products and allied services.
Our Mission To provide all weather day night road visibility for sane lane driving and clear demarcation and linage on roads and highways to minimize accidents. Aim at complete consumer satisfaction, Highways & Road safety, and highest quality standards thru consistent innovation.
QUALITY POLICY
“SPIPL is committed to produce quality Road Marketing Materials and Road products that meet and satisfy customer requirements and expectations at minimum cost by efficient utilization of its technological, human and material resources. Our means to continually improve are by enhancing product quality, minimizing material wastage and providing a framework from establishing and reviewing quality object.
12

BOARD OF DIRECTORS (INDIA BASED)
1. Mr. Pankaj K. Mahajan 2. Dr. G.D. Tyagi
THERMO PLASTIC ROAD MARKINGS
YELLOW TPR MARKING
GRADE: MORTH & BSo Reflective thermoplastic marking material is recommended for
use with the thermoplastic screed application prams, motorised marking machines etc. These products of reflective screed are ideal for high output marking on highways.
o SPECIFICATION AS PER BS: 3262 with White Reflective (Crystallex) and Yellow Reflective (Crystallex)
o SPECIFICATION AS PER MORTH: 803.4 with White Reflective (Crystallex) and Yellow Reflective (Crystallex)
SHIVAPRIME* C5
INTRODUCTIONSHIVAPRIME C5 is a specially formulated, single component air dying road marking clear primer used on RCC or cemented Roads. The road marking material can be easily applied on the primed surface.
OTHER AREAS OF APPLICATIONSHIVAPRIME can be also find a wide range of application on concrete, asbestos, bricks, tiles, parapets, RCC, drainage pipes, FRP surface, stone slabs, Pyrex slab. The product has good adhesion properties for various surface like Bituminous & Concrete roads.
13

CRYSTALEX* - TECHNICAL DATA SHEET
INTRODUTIONCRYSTALLEX is a specially formulated, hot applied fast drying thermoplastic road marking materials. It has thickness control, skid resistance and long life than conventional road marking materials.
AREAS OF APPLICATIONCRYSTALEX can be applied on all type of surfaces likes Bitumen, RCC/Cemented roads with Shiva prime.
COLOURS AVAILABLE White and Yellow
PROPERTIES (AS PER MORTH SPECIFICATIONS)
Colour White YellowBinder contents (% min) 18 18Glass Beads (% min) 30 30Titanium (% min) 10 -Yellow Pigment - As requiredDrying time (minutes) 5-10 5-10Luminance at 45deg. Angle (% min) 65 45Skid resistance (% mim) 45 45Coverage (Kg. /me, at 2.5mm thickness) 5 5
RECOMMENDED COVERAGE:5 Kg per sq. meter for 2.5 mm thickness on smooth surface.
METHOD OF APPLICATION
PROCESS CONDITIONS
Road Temperature: Ambient Safe Healing Temperature: 160 – 200°C Optimum Heating Temperature: 180°C (+ /- 10°C)
14
OBJECTIVES OBJECTIVES OF OF
STUDYSTUDY
15

OBJECTIVES OF STUDY
Working capital is necessary to run day to day business activities. There is
hardly any company which does not require working capital. It is also
helpful in knowing the capabilities of company and company is running well
or not. The objective of the study is as follow:
To know the daily operations of the company.
To find out the liquidity ratio, activity ratio, profitability ratio
and long term solvency ratio.
To assess the cash management of shivalik agro poly product
private limited.
To know that how the company fulfill its monetary requirement
on the time of shortage.
How to utilize Working Capital in the company in order to
maximize the performance of the company?
To know how resources can be efficiently utilized.
16

SCOPESCOPEANDAND
RATIONALERATIONALEOF OF THETHE
STUDYSTUDY
17

SCOPE AND RATIONALE OF THE STUDY
Working capital is the difference between current assets and current
liabilities. In the present study the working capital management has been
analyzed using ratios.
The working capital management is studied in respect of:
Cash management
Receivables management
Inventory management
Liquidity ratio
Activity ratio
Profitability ratio
Solvency ratio
These ratios help to analyze how well the working capital is being
managed over the period.
18

INTRODUCTIONINTRODUCTIONOF THEOF THE
“WORKING CAPITAL“WORKING CAPITALMANAGEMENT”MANAGEMENT”
19

WORKING CAPITAL MANAGEMENT
Working Capital management is the management of assets that are current in
nature. Current assets, by accounting definition are the assets normally
converted into cash in a period of one year. Hence working capital
management can be considered as the management of cash, market securities
receivables, inventories and current liabilities.
CONCEPTS OF WORKING CAPITAL
There are two concepts of working capital:
Gross Working Capital
Net Working Capital
1. GROSS WORKING CAPITAL
Gross working capital refers to the firm’s investment in current asset.
Thus, it is the capital invested in total current assets of the enterprise.
These two aspects will help in remaining away from the two danger
points of excessive or inadequate investment in current assets.
2. NET WORKING CAPITAL
Net working capital is the excess of current assets over current
liabilities.Net working capital may be positive or negative. Positive
working capital refers to the situation where current assets exceed
current liabilities and negative working capital refers to the situation
current liabilities exceed current assets.
NET WORKING CAPITAL = CURRENT ASSETS–CURRENT
LIABILITIES
20

CONSTITUENTS OF CURRENT ASSETS
1. Cash in hand and bank balances
2. Bills Receivables
3. Sundry Debtors(less provision for bad debts)
4. Short-term loans and advances
5. Inventories of stocks, as:
a) Raw materials
b) Work-in-process
c) Stores and spares
d) Finished goods
6. Temporary Investments of surplus funds
7. Prepaid Expenses
8. Accrued Incomes
CONSTITUENTS OF CURRENT LIABILITIES
1. Bills Payable
2. Sundry Creditors or Accounts Payable
3. Accrued or Outstanding Expenses
4. Short-term loans, advances and deposits
5. Dividends Payable
6. Bank Overdraft
7. Provision for Taxation, if it does not amount to appropriation of
profits
KINDS OF WORKING CAPITAL
21
Permanent or Fixed Working Capital
Temporary or Variable Working Capital
1. PERMANENT OR FIXED WORKING CAPITAL
Permanent or Fixed Working Capital is the minimum level of
current assets. It is permanent in the same way as the firm’s fixed
assets are. It can be further classified as:
o Regular working capital to ensure circulation of current
assets from cash to inventories, from inventories to
receivables and from receivables to cash and so on.
o Reserve working capital is the excess amount over the
requirement for regular working capital which may be
provided for contingencies that may arise at unstated periods
such as strikes, rise in prices etc.
2. TEMPORARY OR VARIABLE WORKING CAPITAL
Temporary or Variable Working Capital is the amount of working
capital which is required to meet the seasonal demands and some
special exigencies. It can be further classified as:
o Seasonal working capital is the capital required to meet
the seasonal needs of the enterprise.
o Special working capital is that part of working capital
which is required to meet special exigencies such as
launching of extensive marketing campaigns for conducting
research etc.
22
IMPORTANCE OF ADEQUATE WORKING CAPITAL
Management of working capital is very much important for the success of
the business. It has been emphasized that a business should maintain a
sound working capital position and also that there should not be an excessive
level of investment in the working capital components. The main advantages
of maintaining adequate amount of working capital are as follows:-
SOLVENCY OF THE BUSINESS
Adequate working capital helps in maintaining solvency of the
business by providing uninterrupted flow of production.
GOODWILL
Sufficient working capital enables a business concern to make prompt
payments and hence helps in creating and maintaining goodwill.
REGULAR SUPPLY OF RAW MATERIALS
Sufficient working capital ensures regular supply of raw materials and
continuous production.
REGULAR PAYMENT OF SALARIES,WAGES AND OTHER
DAY-TO-DAY COMMITMENTS
A company which has ample working capital can make regular
payment of salaries, wages and other day-to-day commitments which
raises the morale of its employees, increases their efficiency, reduces
wastages and costs and enhances production and profits.
23

EXCESS OR INADEQUATE WORKING CAPITAL
The firm should maintain a sound working capital position. It should
have adequate working capital to run its business operations. Both
excessive as well as inadequate working capital positions are
dangerous from firm’s point of view.
DISADVANTAGES OF EXCESSIVE WORKING CAPITAL
Excessive working capital means idle funds which earn no profits for
the business and hence the business cannot earn a proper rate of
return on its investment.
It may result into overall inefficiency in the organization.
DISADVANTAGES OF INADEQUATE WORKING CAPITAL
It cannot buy its requirements in bulk and cannot avail discounts.
The firm cannot pay day-to-day expenses of its operations and it
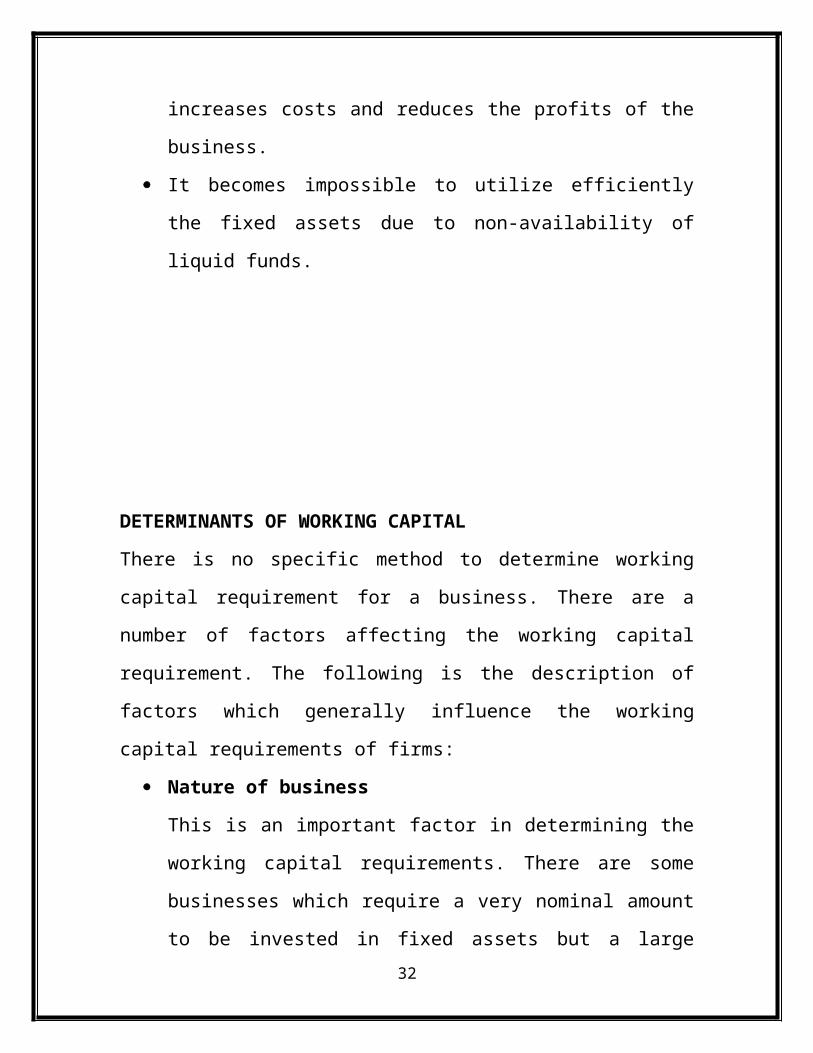
creates inefficiencies, increases costs and reduces the profits of the
business.
It becomes impossible to utilize efficiently the fixed assets due to non-
availability of liquid funds.
DETERMINANTS OF WORKING CAPITAL
24

There is no specific method to determine working capital requirement for a
business. There are a number of factors affecting the working capital
requirement. The following is the description of factors which generally
influence the working capital requirements of firms:
Nature of business
This is an important factor in determining the working capital
requirements. There are some businesses which require a very
nominal amount to be invested in fixed assets but a large chunk of the
total investment is in the form of working capital.
Size of business
The working capital requirements of a concern are directly influenced
by the size of its business which may be measured in terms of scale of
operations.
Manufacturing Process
Manufacturing cycle comprises of the purchase and use of raw
material and the production of finished goods. Longer the
manufacturing cycle, larger will be firm’s working capital
requirements.
Credit Policy
The credit policy of a firm affects the working capital by influencing
the level of debtors. A concern that purchases its requirements on
credit and sells its products or services on cash requires lesser amount
of working capital.
25

Availability of Credit
The terms on which a company is able to manage its credit also
affects the working capital requirement. If a company in a position to
get credit on liberal terms and in a short span of time then it will be in
a position to work with less amount of working capital.
Seasonal Variations
In certain industries raw material is not available throughout the year.
They have to buy raw materials in bulk during the season to ensure an
interrupted flow and process them during the entire year.
Price level changes
Changes in the price level affect the working capital requirements.
Generally, the rising prices will require the firm to maintain higher
amount of working capital. Same levels of current assets will need
increased investment when prices are increasing.
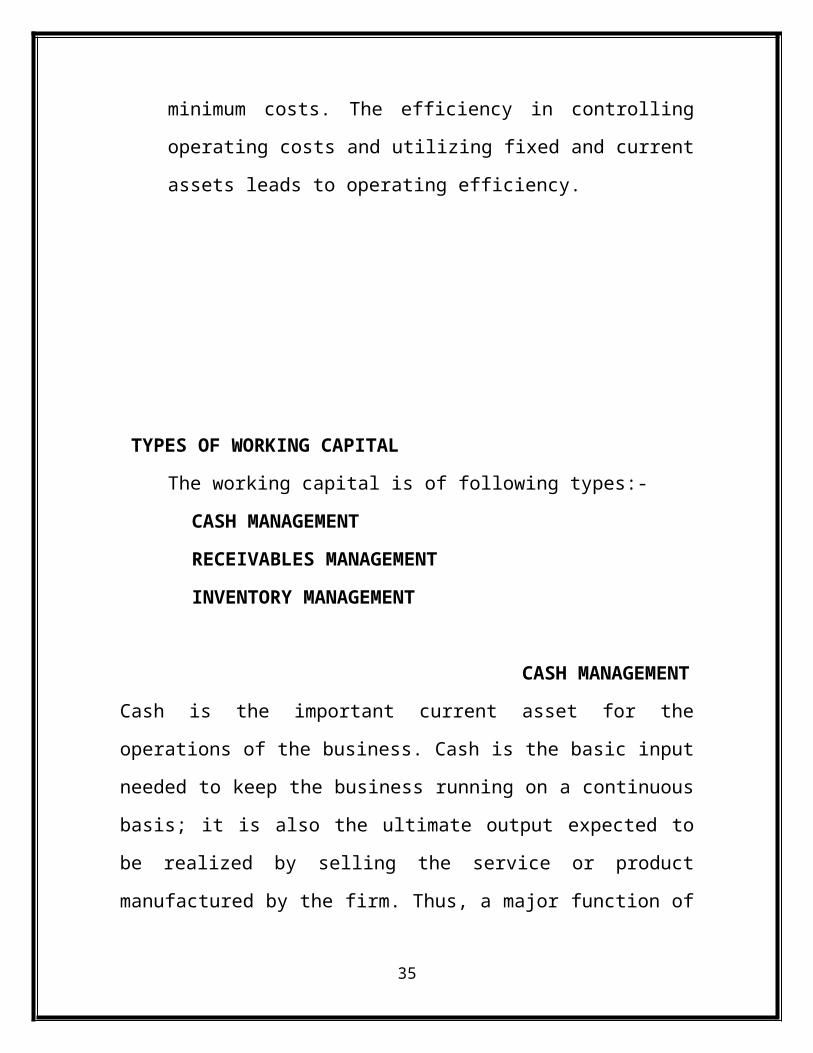
Operating Efficiency
The operating efficiency of the firm relates to the optimum utilization
of all its resources at minimum costs. The efficiency in controlling
operating costs and utilizing fixed and current assets leads to
operating efficiency.
TYPES OF WORKING CAPITAL
The working capital is of following types:-
26

CASH MANAGEMENT
RECEIVABLES MANAGEMENT
INVENTORY MANAGEMENT
CASH MANAGEMENT
Cash is the important current asset for the operations of the business. Cash is
the basic input needed to keep the business running on a continuous basis; it
is also the ultimate output expected to be realized by selling the service or
product manufactured by the firm. Thus, a major function of the financial
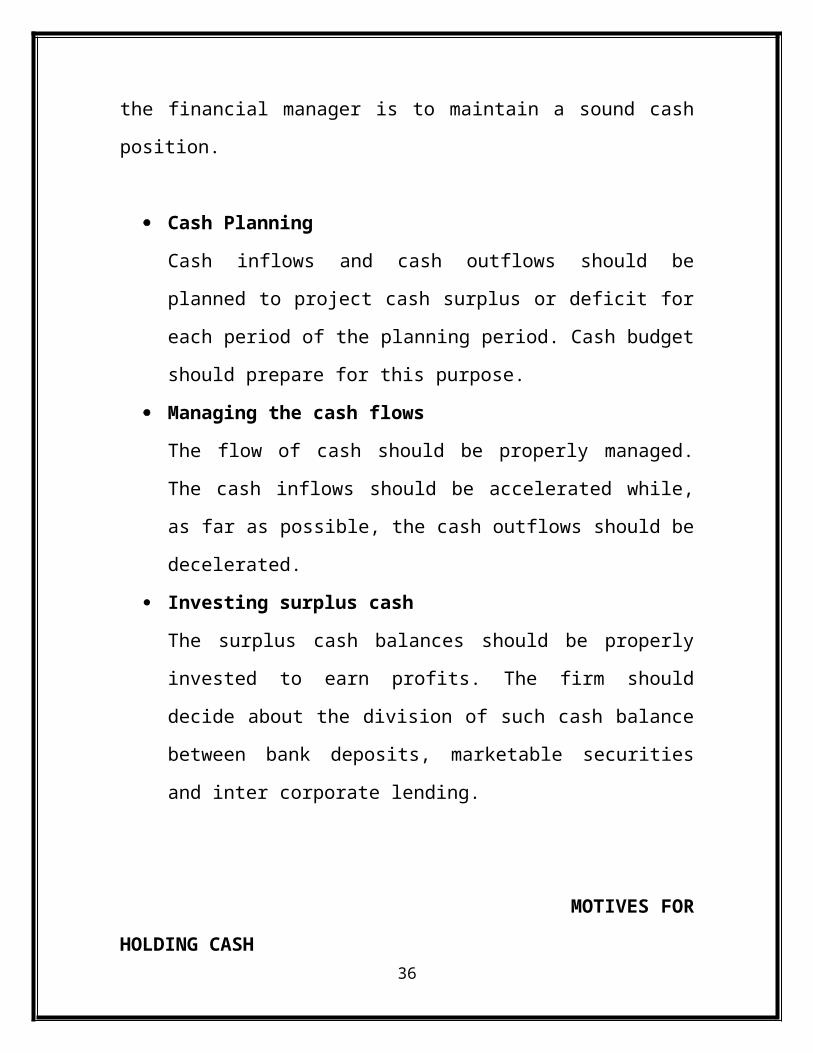
manager is to maintain a sound cash position.
Cash Planning
Cash inflows and cash outflows should be planned to project cash
surplus or deficit for each period of the planning period. Cash budget
should prepare for this purpose.
Managing the cash flows
The flow of cash should be properly managed. The cash inflows
should be accelerated while, as far as possible, the cash outflows
should be decelerated.
Investing surplus cash
The surplus cash balances should be properly invested to earn profits.
The firm should decide about the division of such cash balance
between bank deposits, marketable securities and inter corporate
lending.
MOTIVES FOR HOLDING CASH
27

There are four primary motives for maintaining cash balances:
Transaction motive
Speculative motive
Compensating motive
Transaction motive
The transaction motive requires a firm to hold cash to conduct its
business in the ordinary course. The need to hold cash would not arise
if there were perfect synchronization between cash receipts and cash
payments, i.e. enough cash is received when the payment has to be
made.
Speculative motive
The speculative motive relates to holding of cash for investing in
profitable opportunities as and when they arise. Such opportunities do
not come in a regular manner. Such opportunities can be availed of if
a firm has cash balance with it.
Compensation motive
Another motive to hold cash balances is to compensate banks for
providing certain services and loans. Banks provide a variety of
services to business firms, such as clearances of cheques, supply of
credit information, transfer of funds, etc. To be compensated for their
services indirectly in this form, they require the clients to always keep
a bank balance sufficient to earn a return equal to the cost of services.
28

MANAGING CASH FLOWS
The following methods of cash management will help in better cash
management:-
Prompt payment by customers
In order to accelerate cash inflows, the collections from customers
should be prompt. This will be possible by prompt billing. The
customers should be promptly informed about the amount payable and
the time by which it should be paid.
Quick conversion of payment into cash
Cash inflows can be accelerated by improving the cash collecting
process. Once the customer writes a cheque in favor of the concern
the collection can be quickened by its collection. There is a time gap
between the cheque sent by the customer and the amount collected
against it.
Decentralized collections
A big firm operating over wide geographical area can accelerate
collections by using the system of decentralized collections. A number
of collecting centers are opened in different areas instead of collecting
receipts at one place. This system saves mailing and processing time
and thus, reduces the financial requirements.
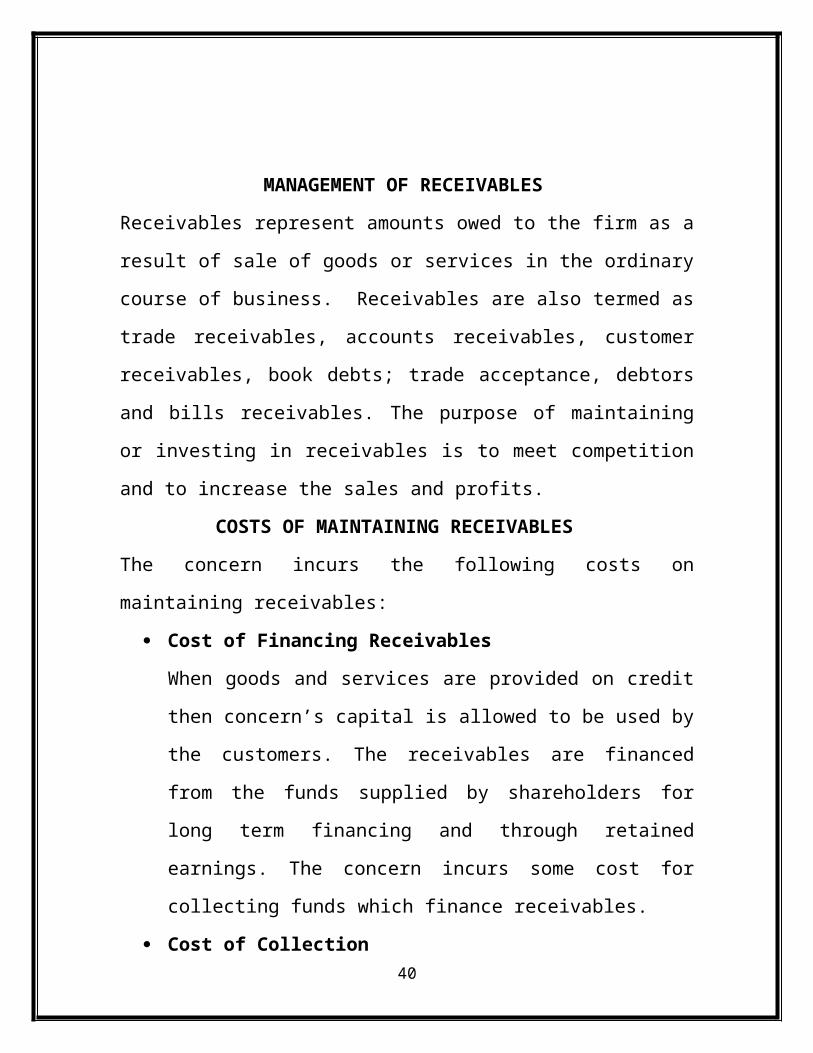
MANAGEMENT OF RECEIVABLES
29
Receivables represent amounts owed to the firm as a result of sale of goods
or services in the ordinary course of business. Receivables are also termed
as trade receivables, accounts receivables, customer receivables, book debts;
trade acceptance, debtors and bills receivables. The purpose of maintaining
or investing in receivables is to meet competition and to increase the sales
and profits.
COSTS OF MAINTAINING RECEIVABLES
The concern incurs the following costs on maintaining receivables:
Cost of Financing Receivables
When goods and services are provided on credit then concern’s capital
is allowed to be used by the customers. The receivables are financed
from the funds supplied by shareholders for long term financing and
through retained earnings. The concern incurs some cost for collecting
funds which finance receivables.
Cost of Collection
A proper collection of receivables is essential for receivables
management. The customers who do not pay the money during a
stipulated credit period are sent reminders for early paymentsAll these
costs are known as collection costs which a concern is generally
required to incur.
Bad Debts
Some customers may fail to pay the amounts due towards them. The
amounts which the customers fail to pay are known as bad debts.
Though a concern may be able to reduce bad debts through efficient
collection machinery but one cannot altogether rule out this cost.
30
FACTORS INFLUENCING THE SIZE OF RECEIVABLES
Size of Credit Sales
The volume of credit sales increases or decreases the size of
receivables. If a concern sells only on cash basis, then there will be no
receivables. The higher the part of credit sales out of total sales, then
receivables will be more and vice versa.
Credit Policies
A firm with conservative credit policy will have a low size of
receivables while a firm with liberal credit policy will have a high size
of receivables.
Relation with Profits
The credit policy is followed with a view to increase sales. When
sales increase beyond a certain level the additional costs incurred are
less than the increase in revenues. The increase in profits will be
followed by an increase in the size of receivables or vice versa.
Credit Collection Efforts
The customers should be sent periodical reminders if they fail to pay
in time. On the other hand, if adequate attention is not paid towards
credit collection then the concern can land itself in a serious financial
problem. Efficient credit collection machinery will reduce the size of
receivables.
31
MANAGEMENT OF INVENTORY
Inventories constitute the most significant part of current assets of a large
majority of companies in India. On an average, inventories are
approximately 60 per cent of current assets in public limited companies in
India. A firm neglecting the management of inventories will be jeopardizing
its long run profitability and may fail ultimately. It is possible for a company
to reduce its levels of inventories to a considerable degree. The reduction in
“excessive” inventories carries a favorable impact on a company’s
profitability.
NATURE OF INVENTORY
Inventories are stock of the product a company is manufacturing for sale and
components that make up the product. The various forms in which
inventories exist in a manufacturing company are:
Raw Material
Raw Materials are those basic inputs that are converts into finished
product through the manufacturing process. Raw Materials inventories
are those units, which have been purchased and stored for future
productions.
Work in progress
Work in progress inventories are semi-manufactured products. They
represent products that need more work before they become finished
products for sale.
32

Finished goods
These are completely manufactured products which are ready for sale.
Stocks of raw materials and work in progress facilitate production
while stock of finished goods is required for smooth marketing
operations.
Consumables
These are the materials which are needed to smooth the process of
production. These materials do not directly enter production but they
act as catalysts. These may be classified according to their
consumption and critically.
PURPOSE OF HOLDING INVENTORY
A firm also needs to maintain inventories to reduce ordering costs and avail
quantity discounts. There are three main purposes or motives of holding
inventories:
Transactions motive
It emphasizes the need to maintain inventories to facilitate smooth
production and sales operations.
Precautionary motive
It necessitates holding of inventories to guard against the risk of
unpredictable changes in demand and supply force and other factors.
Speculative motive
33

It influences the decision to increase or reduce inventory levels to take
advantage of price fluctuations.
OBJECTIVES OF INVENTORY MANAGEMENT
The main objectives of inventory management are operational and financial.
The operational objectives mean that the materials and spares should be
available in sufficient quantity so that work is not disrupted for want of
inventory. The financial objective means that investments in inventories
should not remain idle and minimum working capital should be locked in it.
The following are the objectives of inventory management:
To ensure continuous supply of raw materials, spares and finished
goods so that production should not suffer at any time and the
customers demand should also be met.
To minimize losses through deterioration, pilferage, wastages and
damages.
To keep material cost under control so that they contribute in reducing
cost of production and overall costs.
INVENTORY MANAGEMENT TECHNIQUES
34
Effective inventory management requires an effective control system for the
inventories. In managing inventories, the firm’s objective should be in
consonance with the shareholder wealth maximization principle. To achieve
this, the firm should determine the optimum level inventory. This increases
the level of investment and makes the firm unprofitable.
To manage inventories efficiency, answers should be sought to the following
two questions:
How much should be ordered?
When should it be ordered?
The first question, how much to order, relates to the problem of determining
economic order quantity (EOQ) and is answered with an analysis of costs of
maintaining certain level of inventories.
The second question, when to order, arises because of uncertainty and is a
problem of determining the re-order point.
ECONOMIC ORDER QUANTITY
One of the major inventory management problems to be resolved is
how much inventory should be added when inventory is replenished.
If the firm is buying raw materials, it has to decide lots in which it has
to be purchased on each replenish.
Determining an optimum inventory level involves two types of costs:
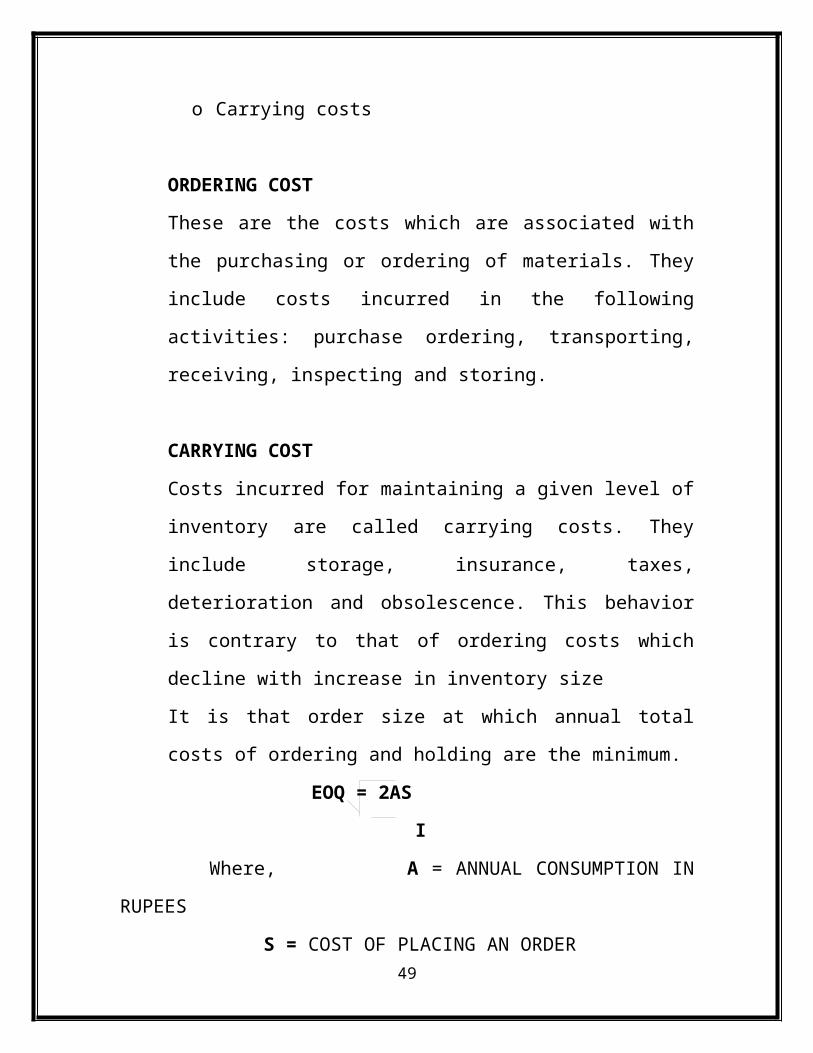
o Ordering costs
o Carrying costs
ORDERING COST
35
These are the costs which are associated with the purchasing or
ordering of materials. They include costs incurred in the following
activities: purchase ordering, transporting, receiving, inspecting and
storing.
CARRYING COST
Costs incurred for maintaining a given level of inventory are called
carrying costs. They include storage, insurance, taxes, deterioration
and obsolescence. This behavior is contrary to that of ordering costs
which decline with increase in inventory size
It is that order size at which annual total costs of ordering and holding
are the minimum.
EOQ = 2AS
I
Where, A = ANNUAL CONSUMPTION IN RUPEES
S = COST OF PLACING AN ORDER
I = INVENTORY CARRYING COSTS OF ONE UNIT
RE-ORDER POINT
The problem, how much to order, is solved by determining the
economic order quantity, yet the answer should be sought to the
second problem, when to order. To determine the re-order point under
certainty, we should know:
(a) Lead time
(b) Average usage
(c) Economic order quantity
36

That is:
Re-order point= Lead Time* Average usage
SAFETY STOCK
It is difficult to predict usage and lead time accurately. The demand
for material may fluctuate from day to day or from week to week.
Similarly, the actual delivery time may be different from the normal
lead time. If the actual usage increases or the delivery of inventory is
delayed, the firm can face a problem of stock-out which can prove to
be costly for the firm.
ABC ANALYSIS
Large numbers of firm have to maintain several types of inventories.
It is not desirable to keep the same degree of control on all of the
items. This analytical approach is called ABC analysis and tends to
measure the significance of each item of inventories in terms of its
value.
Combine items on the basis of their relative value to form three
categories A, B and C.
The data in the following table illustrate the ABC analysis.
CLASS NO. OF
ITEMS (%)
VALUE OF
ITEMS (%)
A 10 70
B 20 20
C 70 10
37

RESEARCHRESEARCH METHODOLOGYMETHODOLOGY
38

RESEARCH METHODOLGY
RESEARCH
Research comprises defining and redefining problems, formulating
hypothesis or suggested solutions, collecting, organizing and evaluating
data, making deductions and reaching conclusions and at last carefully
testing the conclusions to determine whether they fit the formulating
hypothesis.
RESEARCH METHODOLOGY
Research methodology is a way to systematically solve the problems. It is a
way of studying how research is done scientifically. It consists of various
steps that are generally adopted by the researcher in studying his research
problems along with the logic behind them.
RESEARCH DESIGN
Research design is a framework or the blue print for conducting the research
project. Research design is the arrangement of conditions for collection and
analysis of data in a manner that aims to combine relevance to the research
purpose with economy in procedure. It includes an outline of what the
researcher will do from writing the hypothesis and its operational
implications to the final analysis of data.
TYPES OF RESEARCH DESIGN
39
Exploratory research design
Descriptive research design
Experimental research design
EXPLORATORY RESEARCH DESIGN
It is also termed as formulate research design. The main purpose of the study
is to formulate a problem for more precise investigation.
DESCRIPTIVE RESEARCH DESIGN
In descriptive research design, those studies are taken which are concerned
with describing the characteristics of a particular individual or a group.
EXPERIMENTAL RESEARCH DESIGN
In this casual relationships between the variables are tested. It is also known
as hypothesis testing research design.
SAMPLE DESIGN
Sample design is a technique or the procedure which the researcher would
adopt in selecting items for the sample. So, he selects small portion of the
universe, which is its true representative. This group known is sample and
this process is called Sampling.
Sample designs are basically of two types:
40
Non – Probability Sampling
Probability Sampling
NON- PROBABILITY SAMPLING
In this items for the sample are selected deliberately by the researcher, by
using his own judgment. In this every item of universe does not have equal
chances of inclusion in the sample.
It can be of following type:
Convenience Sampling
Judgment Sampling
Quota Sampling
PROBABILITY SAMPLING
It is also known as Random Sampling or Chance Sampling. In this, each
population element has equal chance of selection.
It can be of following type:
Random Sampling
Stratified Sampling
Cluster Sampling
Multi stage Sampling
41

METHODS OF DATA COLLECTION
It is of two types:-
Primary Data
Secondary Data
PRIMARY DATA
Primary data are those data, which is originally collected. It is of following
type’s questionnaire, interview, observation etc.
SECONDARY DATA
Secondary data are those data which are collected and which has been
passed through statistical research.
In this project, secondary data has been collected from following sources:-
Annual Reports
Books
Internet
Other material and report published by company
42
STUDYSTUDYOFOF
“RATIO ANALYSIS”“RATIO ANALYSIS”
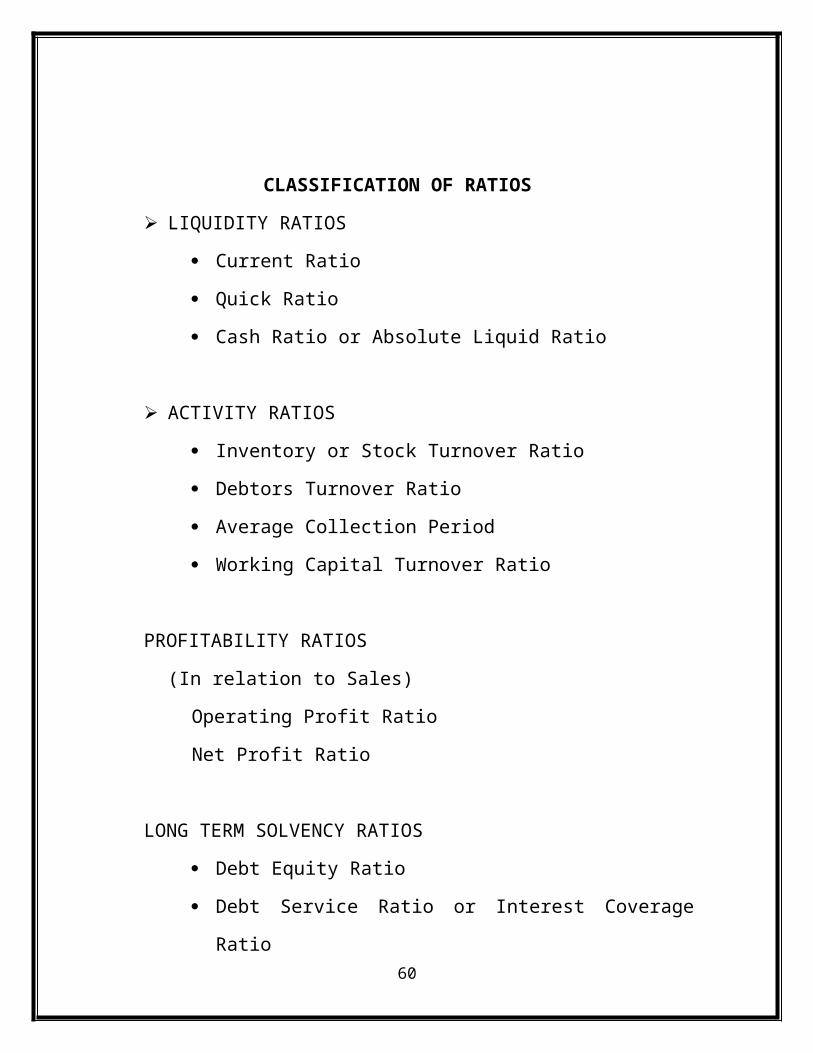
CLASSIFICATION OF RATIOS
LIQUIDITY RATIOS
43

Current Ratio
Quick Ratio
Cash Ratio or Absolute Liquid Ratio
ACTIVITY RATIOS
Inventory or Stock Turnover Ratio
Debtors Turnover Ratio
Average Collection Period
Working Capital Turnover Ratio
PROFITABILITY RATIOS
(In relation to Sales)
Operating Profit Ratio
Net Profit Ratio
LONG TERM SOLVENCY RATIOS
Debt Equity Ratio
Debt Service Ratio or Interest Coverage Ratio
LIQUIDITY RATIOS
Liquidity refers to the ability to meet its current obligation as and
when these become due. The short term obligations are met by
releasing amounts from current, floating or circulating assets.
CURRENT RATIO
Current ratio may be defined as the relationship between current
assets and current liabilities. This ratio, also known as working capital
44
ratio, is a measure of general liquidity and is most widely used to
make the analysis of a short-term financial position or liquidity firm.
IDEAL RATIO = 2:1
CURRENT RATIO = CURRENT ASSESTS / CURRENT
LIABILITIES
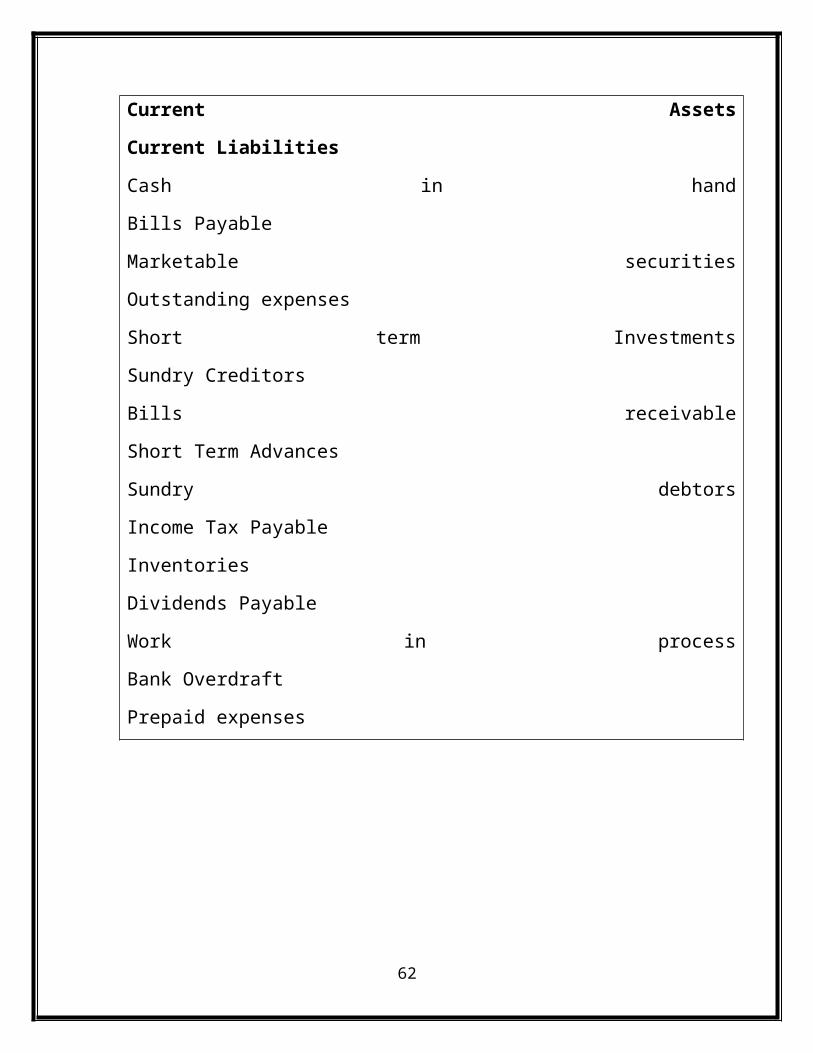
COMPONENTS OF CURRENT RATIO
Current Assets Current Liabilities
Cash in hand Bills Payable
Marketable securities Outstanding expenses
Short term Investments Sundry Creditors
Bills receivable Short Term Advances
Sundry debtors Income Tax Payable
Inventories Dividends Payable
Work in process Bank Overdraft
Prepaid expenses
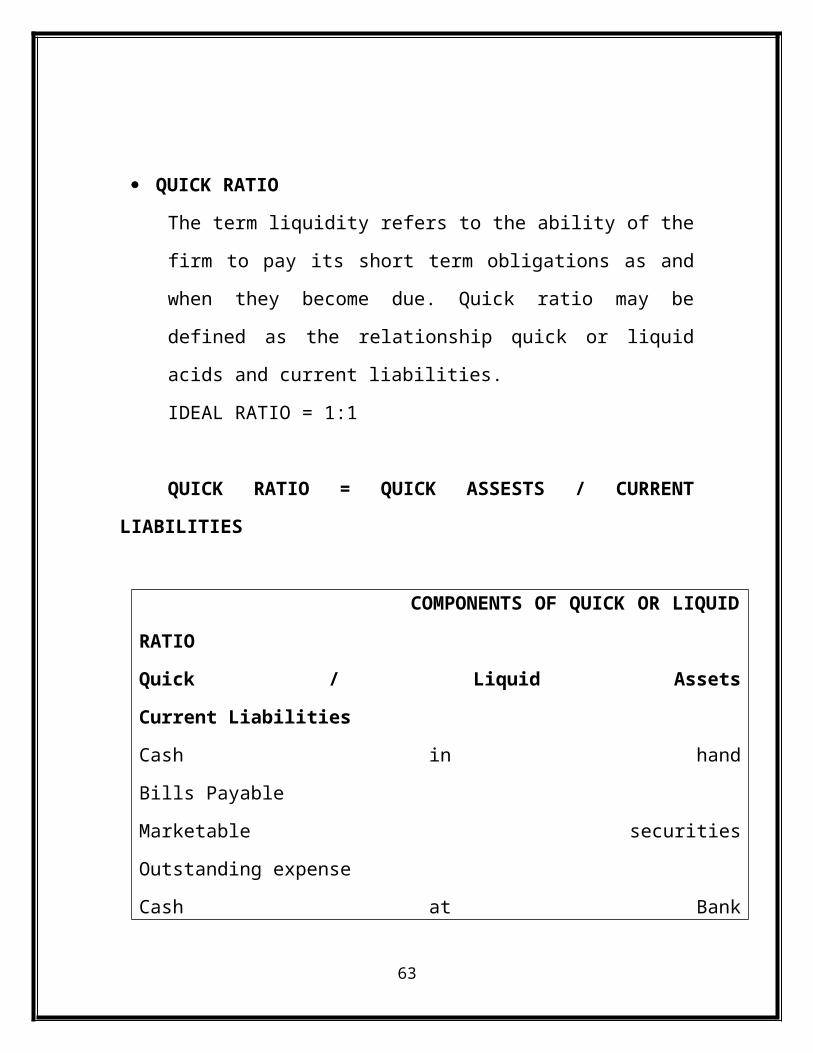
QUICK RATIO
45

The term liquidity refers to the ability of the firm to pay its short term
obligations as and when they become due. Quick ratio may be defined
as the relationship quick or liquid acids and current liabilities.
IDEAL RATIO = 1:1
QUICK RATIO = QUICK ASSESTS / CURRENT LIABILITIES
COMPONENTS OF QUICK OR LIQUID RATIO
Quick / Liquid Assets Current Liabilities
Cash in hand Bills Payable
Marketable securities Outstanding expense
Cash at Bank Sundry Creditors
Bills Receivables Short Term Advances
Sundry Debtors Income Tax Payable
Temporary Investments Dividends Payable
Bank Overdraft
ABSOLUTE LIQUID RATIO OR CASH RATIO
Absolute liquid assets include cash in hand and cash at bank and
marketable securities or temporary investments. The acceptable norm
for this ratio is 50% or 0.5: 1 or 1:2.
CASH RATIO = CASH AND BANK / CURRENT LIABILITIES
ACTIVITY RATIO
46
Activity ratios measure the efficiency or effectiveness with which a
firm manages it resources or assets. Theses ratios are also called
turnover ratios because they indicate the speed with which assets are
converted into sales.
For example: inventory turnover ratio indicates the rate at which the
funds invested in inventories are converted into sale. Depending upon
the purpose, a number of turnover ratios are calculated.
INVENTORY TURNOVER RATIO OR STOCK TURNOVER
RATIO
Inventory turnover ratio indicates whether inventory has been
efficiently used or not. Turnover ratio indicates the number of times
the stock has been turned over during the period and evaluates the
efficiency with which a firm is able to manage its inventory.
INVENTORY TURNOVER RATIO = NET SALES / INVENTORY
DEBTORS TURNOVER RATIO
Debtors turnover ratio indicates the velocity of debt collection of firm.
In simple words, it indicates the number of times average debtors
(receivables) are turned over during a year.
DEBTORS TURNOVER RATIO = TOTAL SALES / DEBTORS
47

AVERAGE COLLECTION PERIOD
The average collection period represents the average number of days
for which a firm has to wait before its receivables are converted into
cash.
AVERAGE COLLECTION PERIOD = NUMBER OF WORKING
DAYS/ DEBTORS TURNOVER RATIO
WORKING CAPITAL TURNOVER RATIO
Working capital of a concern is directly related to sales. The current
assets like debtors, bills receivables, cash, stock etc. change with the
increase or decrease in sales.
Working capital = Current Assets – Current Liabilities
It indicates the velocity of the utilization of net working capital. This
ratio indicates the number of times the working capital is turned over in
the course of a year. This ratio measures the efficiency with which the
working capital is being used by a firm.
WORKING CAPITAL TURNOVER RATIO = SALES/NET
WORKING CAPITAL
48
PROFITABILITY RATIO
Profits to the management are the test of the efficiency and a
measurement of a control; to owners, a measure of worth of their
investment; to the creditors, the margin of safety; to employees, and a
source of fringe benefits; to government a measure of tax paying
capacity and the basis of the legislative action etc.
OPERATING PROFIT RATIO
This ratio is calculated by dividing operating profit by sales.
OPERATING PROFIT RATIO = OPERATING PROFIT X 100
SALES
Operating profit = Net profit + Non operating expenses- Non operating
income
NET PROFIT RATIO
It establishes the relationship between net profits (after interest) and
sales, sand indicates the efficiency of the management in
manufacturing, selling, administrative and other activities of the firm.
This ratio is the overall measure of firm’s profitability.
NET PROFIT RATIO = NET PROFIT AFTER TEX X 100
NET SALES
LONG TERM SOLVENCY RATIOS
49

The term solvency refers to the ability of a concern to meet its long
term obligations. It indicates a firm’s ability to meet the fixed interest
and costs and repayment schedules associated with its long-term
borrowings.
DEBT EQUITY RATIO
Debt equity ratio also known as External – Internal Equity Ratio is
calculated to measure the relative claims of outsiders and the owners
(i.e. shareholders) against the firm’s assets.
DEBT EQUITY RATIO = OUTSIDER’S FUND/SHAREHOLDER’S FUND
INTEREST COVERAGE RATIO
Net income to debt service ratio or simply debt service ratio is used to
test the debt servicing capacity of a firm. The ratio is also known as
Interest Coverage Ratio or Fixed Charges Cover ratio or Time Interest
Earned.
INTEREST COVERAGE RATIO = NET PROFIT BEFORE INTEREST AND TEXES
FIXED INTEREST CHARGES FIXED INTEREST CHARGES
50

DATA ANALYSISDATA ANALYSISANDAND
INTERPRETATIONSINTERPRETATIONS
LIQUIDITY RATIOS
CURRENT RATIO = CURRENT ASSETS/CURRENT LIABILTIES
51

YEAR 2008-2009 2009-2010 2010-2011
Current Assets 5,06,58,00,000 6,15,47,80,000 6,25,89,40,000
Current
Liabilities
2,54,56,80,000 2,99,40,1,0,000 3,29,79,60,000
Current Ratio 1.99 2.06 1.89
2008-2009 2009-2010 2010-20110
0.5
1
1.5
2
2.5
Current Ratio
INTERPRETATION
IDEAL CURRENT RATIO IS 2:1.
The current ratio has increased from 1.99 to 2.06 between the year
2008-2009 and 2009-2010. But it decreased to 1.89 in the year 2010-
2011.
QUICK RATIO = QUICK ASSETS/CURRENT LIABILITIES
YEAR 2008-2009 2009-2010 2010-2011
52
Quick Assets 3,09,59,87,000 2,82,41,89,000 3,08,46,70,000
Current
Liabilities
2,54,56,80,000 2,99,40,10,000 3,29,79,60,000
Quick Ratio 1.22 0.94 0.93
2008-2009 2009-2010 2010-20110
0.2
0.4
0.6
0.8
1
1.2
1.4
Quick Ratio
INTERPRETATION
THE IDEAL QUICK RATIO IS 1:1.
The quick ratio has decreased from 1.22 to 0.94 between the year
2008-2009 and 2009-2010. But it decreased to 0.93 in the year 2010-
2011.
CASH RATIO = CASH AND BANK/CURRENT LIABILITIES
YEAR 2008-2009 2009-2010 2010-2011
53

Cash 59,08,80,000 82,19,10,00 83,93,87,000
Current
Liabilities
2,54,56,80,000 2,99,40,10,000 3,29,79,60,000
Cash Ratio 0.23 0.27 0.25
2008-2009 2009-2010 2010-20110
0.05
0.1
0.15
0.2
0.25
0.3
Cash Ratio
INTERPRETATION
The cash ratio has first increased from 0.23 to 0.27 between the
year b2008-2009 and 2009-2010. But it decreased to 0.25 in the
year 2010-2011.
ACTIVITY RATIOS
INVENTORY TURNOVER RATIO = NET SALES /
INVENTORY
54

YEAR 2008-2009 2009-2010 2010-2011
Net Sales 9,45,96,94,000 9,61,89,60,000 9,91,85,70,000
Inventory 2,09,63,80,000 3,37,73,80,000 3,60,11,80,000
Inventory
Turnover Ratio
4.51 2.85 2.75
2008-2009 2009-2010 2010-20110
0.51
1.52
2.53
3.54
4.55
Inventory Turnover Ratio
INTERPRETATION
The inventory turnover ratio has decreased from 4.51 to 2.85
between the year 2008-2009 and 2009-2010. But it decreased to
2.75 in the year 2010-2011.
DEBTORS TURNOVER RATIO = SALES/DEBTORS
YEAR2008-2009
2009-2010 2010-2011
55
Sales 9,45,96,94,000 9,61,89,60,000 9,91,85,70,000
Debtors 2,47,65,40,000 3,01,23,65,000 3,00,12,96,000
Debtors
Turnover Ratio
3.82 3.19 3.30
2008-2009 2009-2010 2010-20110
0.51
1.52
2.53
3.54
Debtors Turnover Ratio
INTERPRETATION
The debtor turnover ratio has decreased from 3.82 to 3.19 between
the year 2008-2009 and 2009-2010. But it increased to 3.30 in the
year 2010-2011.
WORKING CAPITAL TURNOVER RATIO = SALES /
NET WORKING CAPITAL
YEAR 2008-2009 2009-2010 2010-2011
Sales 9,45,96,94,000 9,61,89,60,000 9,91,85,70,000
Net Working 3,29,87,60,000 2,87,69,83,000 3,13,29,76,000
56

Capital
Working Capital
Turnover Ratio
2.87 3.34 3.17
2008-2009 2009-2010 2010-2011
0
0.5
1
1.5
2
2.5
3
3.5
Working Capital Turnover Ratio
INTERPRETATION
The working capital turnover ratio has increased from 2.87 to
3.34 between the year 2008-2009 and 2009-2010. But it
decreased to 3.17 in the year 2010-2011.
NET PROFIT RATIO = NET PROFIT AFTER TAX X 100
NET SALES
YEAR 2008-2009 2009-2010 2010-2011
57
Net Profit After
Tax
87,56,45,000 98,45,91,000 1,06,55,30,000
Net Sales 9,45,96,94,000 9,61,89,60,000 9,91,85,70,000
Net Profit Ratio 9.26 10.24 10.74
2008-2009 2009-2010 2010-20110
2
4
6
8
10
12
Net Profit Ratio
INTERPRETATION
The net profit ratio has increased from 9.26 to 10.24 in the year
2008-2009 and 2009-2010.Then it increased to 10.74 in the year
2010-2011.
LONG TERM SOLVENCY RATIOS
DEBT EQUITY RATIO = OUTSIDER’S
FUNDS/SHAREHOLDER’S FUNDS
58
YEAR 2008-2009 2009-2010 2010-2011
Outsider’s funds 1,15,87,75,000 1,95,34,21,000 2,35,39,40,000
Shareholder’s
funds
6,95,30,18,00
0
7,65,32,09,
000
9,58,27,60,0
00
Debt Equity Ratio 0.17 0.26 0.25
2008-2009 2009-2010 2010-20110
0.05
0.1
0.15
0.2
0.25
0.3
Debt Equity Ratio
INTERPRETATION
The debt equity ratio has increased from 0.17 to 0.26 in the year
2008-2009 and 2009-2010. But it decreased to 0.25 in the year
2010-2011.
59
CONCLUSION CONCLUSION
CONCLUSION
After studying the various ratios it is concluded that. The current ratio has
decreased over the period. This means the company will not be able to meet
60

its current liabilities. However, the cash position of the company is quiet
favorable as it has not decreased to much extent.
The inventory management system is not efficient as the amount of
inventory is not properly utilized to generate sales. The debtor management
system has been declining in the efficiency as revealed, by the decreasing
debtor turnover ratio and average collection period.
There is a high dependence on external debt which brings in inflexibility in
company’s operation. But still the company is in a stronger position because
profits have increased with sales.
61
LIMITATIONSLIMITATIONSOF THEOF THESTUDYSTUDY
LIMITATIONS
Although every effort has been made to collect the relevant information
through the sources available, still some relevant information could not be
gathered.
62
The time duration could not provide ample opportunity to study every
detail of management in the company.
There are restrictions not to visit some specific areas.
The concerned executives were having very busy schedule.
As some figures have not been disclosed by the company on account
of confidential report.
Estimates are based upon predictions.
63

SUGGESTIONSSUGGESTIONSANDAND
RECOMMENDATIONSRECOMMENDATIONS
SUGGESTIONS AND RECOMMENDATIONS
1. It is necessary to prepare the cash budget and try to achieve the actual
target and budgeted figures.
64

2. Companies should control, review and improve their discount policy
so as to improve company’s image.
3. More attention should be paid to customer’s complaints and efforts
should be made to remove them.
4. Some special planning on appointment of dealers should be there to
avoid the complications.
5. Funds should be available in smooth and steady flow so that
construction at the site is not affected and proper balance is
maintained if more than one site is going on in the same time.
6. Terms and conditions with the suppliers should be decided in advance
in order to get rid of the future problems.
7. Stock should be verified more frequently to avoid differences between
book figures and actual figures.
8. Every department should be made cost conscious to increase
profitability.
65

BIBLIOGRAPHYBIBLIOGRAPHY
BIBLIOGRAPHY
Books Pandey, I.M., “Financial Management”, Ed. 2007, Vikas Publishing
House Private Ltd., New Delhi.
66

Gupta, Shashi K., “Management Accounting”, Ed. 2007, Kalyani Publishers, New Delhi.
Kothari, C.R., “Research Methodology”, Ed. 2007, New Age International (P) Limited, Publishers, New Delhi.
Manual Annual reports
Websiteswww.shivathin .com.in
67
Related Documents