RAM Energy Resources, Inc. March 12, 2009 Fourth Quarter 2008 Earnings Conference Call

RAM Energy Resources, Inc. March 12, 2009 Fourth Quarter 2008 Earnings Conference Call.
Jan 01, 2016
Welcome message from author
This document is posted to help you gain knowledge. Please leave a comment to let me know what you think about it! Share it to your friends and learn new things together.
Transcript

RAM Energy Resources, Inc.
March 12, 2009
Fourth Quarter 2008
Earnings Conference Call

2
Disclosure StatementThis document contains forward-looking statements within the meaning of Section 27A
of the Securities Act of 1933, as amended, and Section 21E of the Securities Exchange Act of 1934, as amended. All statements, other than statements of historical fact, including, without limitation, statements that address estimates of RAM’s proved reserves of oil, gas and natural gas liquids, its derivative positions, the impact of derivatives, exploration activities, capital spending, borrowing availability, financial position, business strategy, management’s objectives, future operations, and industry conditions, are forward-looking statements. Although RAM believes that the expectations reflected in such forward-looking statements are reasonable, RAM can give no assurance that such expectations will prove to be correct. Important factors that could cause actual results to differ materially from RAM’s expectations (“Cautionary Statements”) include, without limitation, the actual quantities of RAM’s oil and natural gas reserves, future production levels, future prices and demand for oil and natural gas, the results of RAM’s future exploration and development activities, future operating, development costs and future acquisitions, the effect of existing and future laws and governmental regulations (including those pertaining to the environment), the continued availability of capital and financing, and the political and economic climate of the United States as well as risk factors listed from time to time in our reports and documents filed with the SEC. All subsequent written and oral forward-looking statements attributable to RAM, or persons acting on RAM’s behalf, are expressly qualified in their entirety by the Cautionary Statements.

3
North Texas Gas
15%
Company OverviewCompany Overview• Areas of Operation
- Five Key Areas = 87%- 38% Mature Oil
= Rig working/planned
Area of focus in preliminary
2009 capital budget
23%
10%
15%
12%
Gas 27%

4
2008 Highlights
• Production rose 80% to 2.6 million barrel equivalents (BOE) of oil and natural gas vs. 1.4 million BOE in 2007.
• Oil and gas sales rose 123% to $182.7 million driven by higher production and higher average prices.
• EBITDA rose to $103.6 MM compared to $42.4 MM in 2007.
• Free cash flow from operations was $77.1 million, or $1.09 per share, vs. $25.4 million, or $0.62 per share in 2007.

5
2008 Highlights
• Outstanding debt was reduced by $85.0 million during the year to $250.7 million at year end compared to $335.7 million at year-end 2007.
• Availability at December 31, 2008 under our revolving credit facility was $37.9 million.
• Total cash expenses per BOE decreased four percent for the year.

6
Fourth Quarter 2008 Highlights
• Record fourth quarter 2008 production rose 50% to 653 MBOE.
- Average daily production in fourth quarter 2008 was 7,097 BOE vs. fourth quarter 2007 level of 4,739 BOE.
• EBITDA in fourth quarter rose to $16.2 MM vs. $14.1 MM in 2007 quarter
• The average realized price of oil, NGLs and natural gas decreased in fourth quarter 2008 vs. fourth quarter 2007.
- Oil down 35% to $57.56/Bbl vs. $88.74/Bbl.
- NGL down 56% to 26.32 vs. $59.37/Mcf
- Natural gas down 20% to $5.05/Mcf vs. $6.35/Mcf

7
Fourth Quarter 2008 Highlights
• The increase in production was mitigated by the decline in hydrocarbon prices resulting in a seven percent decrease in oil and natural gas sales to $27.4 MM compared to $29.4 MM in 2007.
- Fourth quarter realized derivative gain of $4.1 MM added to revenue in 2008
• RAM recognized non-cash impairment of $179.6 MM after tax to reflect impact of lower hydrocarbon prices prevailing at year-end 2008.
• Blended interest rate on borrowing substantially lower at 6.1% vs. 10.7% in year ago quarter.
• Total cash expenses per BOE declined 11% compared to those in last year’s quarter.

8
1.31.4
2.6
0.0
0.5
1.0
1.5
2.0
2.5
3.0
2006 2007 2008
Mill
ion
s B
OE
RAM Three Year Production GrowthRAM Three Year Production Growth

9
Production Volumes by Major Fields
Production by Areas
Year Ended December 31, 2008
Mature MatureOil Fields* Natural Gas Fields
Three Months Ended December 31, 2008South Texas
Barnett Shale Appalachia Various Various Total
Aggregate Net Production Oil (MBbls) 10 3 1 262 17 293 NGLs (MBbls) 29 41 - 21 17 108 Natural Gas (MMcf) 588 258 32 455 184 1,517 MBoe 137 87 6 358 65 653
Three Months Ended December 31, 2007Aggregate Net Production Oil (MBbls) 3 1 - 205 17 226 NGLs (MBbls) 8 30 - 20 6 64 Natural Gas (MMcf) 199 147 - 287 246 879 MBoe 44 55 - 273 64 436
Change in MBoe 93 32 6 85 1 217 Percentage Change in MBoe 211.4% 58.2% 0.0% 31.1% 1.6% 49.8%
Developing Fields

10
Drilling Success Rate Remains High
(2) Excluding wells in progress
(1) Gross wells drilled - RAM prior to Acquisition of Ascent
99% 93%
(1)Total Wells Drilled
1987- 2008
Producers
Dry Holes
Drilling or Completing
Total
Success Ratio
82 677
49
7
90 733
(2)
1
7
2008(1)

11
Oil Gas NGL PercentMBBL MMcf MBBL MBOE of total
Reserve Category
Proved Developed producing 8,339 44,555 2,399 18,163 50%
Developed non-producing 896 15,162 311 3,734 10%
Undeveloped 5,261 42,794 1,905 14,299 40%
Total Proved 14,496 102,511 4,615 36,196 100%
Estimates of Proved Reserves
1) Estimate of RAM proved reserves at 12/31/08
____________

12
• Consistent with RAM’s historical strategy, non-acquisition capital expenditures in 2009 remain within cash flow
• Aim is to offset production decline while keeping flexibility in uncertain and volatile hydrocarbon price environment
• Focus spending on lower risk development projects with high internal rate of return and quick payback:
- Mature oil fields of Electra/Burkburnett, N.E. Fitts and Allen
- South Texas – continue successful development of La Copita and West Lissie areas
• Other strategic projects positioning for 2010
- Seismic
- Osage Concession
RAM Preliminary 2009 Capital RAM Preliminary 2009 Capital Expenditure PlanExpenditure Plan

13
RAM Preliminary 2009 Capital RAM Preliminary 2009 Capital Expenditure PlanExpenditure Plan
• Assumptions (1)
- Year-end 2008 oil, gas and NGL strip prices of $53/Bbl, $6/Mcf and $34/Bbl respectively
- Implied gains of $16 - $18 MM from derivative positions in place at 12/31/08
- Asset sales of $5 - $10 MM
- Interest expense of $17 - $18 MM
• Targets
- Production flat with 2008 level
- EBITDA of $60 - $65 MM
- CAPEX program $40 - $45 MM
- Voluntary debt repayment $8 - $12 MM
• Immediately accretive
1) Assumes existing realizations and derivatives in force at 12/31/08 remain intact for 2009 year

14
per day Price per day Price per day Price per day PriceCollars
2009 1,371 $59.46 1,371 $81.92 10,501 $7.14 10,501 $11.31
Year per day Price Per day Price2009 800 $75.00 - -
Year per day Price per day Price2009 1,501 $68.35 5,000 $7.00
Secondary Floors Secondary Floors
Bare FloorsBare Floors
Crude Oil (Bbls) Natural Gas (Mmbtu)Floors Ceilings Floors Ceilings
Derivative Positions
• For calendar year 2009 RAM has total of 1,048,500 barrels of oil or 2,873 barrels per day of production hedged at an average floor price of $64.11
• RAM also has a total of 4.6 BCF or 12,570 MCF per day of its natural gas production hedged at an average floor price of $7.12 per MCF for 2009

15
EBITDA & Free Cash Flow Per Share
Non-GAAP Financial Measures
EBITDA, a non-GAAP measure, is determined by adding the following to net income (loss): interest expense, income taxes, depreciation,
amortization, accretion, share based compensation, impairment charges and unrealized gains or losses on derivative or MTM settlement
transactions. Free cash flow is also a non-GAAP measure representing EBITDA after adjustments for the cash portion of interest and income
taxes. Adjusted net income is a non-GAAP measure which excludes the income tax affected impact of unrealized derivative gains or losses ,
MTM settlements transactions and impairment charges on GAAP income. These non-GAAP measures are presented because management
believes it is a useful adjunct to cash provided by operating activities under accounting principles generally accepted in the United States
(GAAP). These non-GAAP measures are widely accepted as financial indicators of an oil and gas company’s ability to generate cash which is
used to internally fund exploration and development activities and fund debt service costs. These non-GAAP measures are not a measure of
financial performance under GAAP and should not be considered as an alternative to cash provided (used) by operating, investing, or financing
activities as an indicator of cash flows, or as a measure of liquidity.
$000s, except per share amounts Qtr Ended Qtr Ended YTD YTD12/31/2008 12/31/2007 12/31/2008 12/31/2007
EBITDA:Net income (loss) (160,175)$ (6,342)$ (138,072)$ (1,250)$ Plus: Interest expense 5,006$ 8,175$ 24,182$ 20,757$ Plus: Amortization and depreciation & accretion 14,578$ 7,749$ 48,965$ 19,652$ Plus: Share-based compensation 482$ 287$ 2,563$ 989$ Plus: Income tax provision (benefit) (94,580)$ (3,747)$ (96,389)$ (7,852)$ Plus: Impairment charges 282,465$ -$ 282,465$ -$ Plus: Settlement charge 6,432$ -$ 13,184$ -$ Less: Unrealized (gain) loss on derivatives (38,022)$ 7,980$ (33,257)$ 10,056$
EBITDA 16,186$ 14,102$ 103,641$ 42,352$
Less:
Cash paid for interest 4,819$ 2,213$ 25,813$ 16,936$ Cash paid for income tax 302$ -$ 682$ 18$
Free cash flow 11,065$ 11,889$ 77,146$ 25,398$
Weighted average shares outstanding - basic 77,024 47,067 70,629 41,240 Weighted average shares outstanding - diluted 77,051 47,204 70,711 41,328
Cash flow per share - basic 0.14$ 0.25$ 1.09$ 0.62$ Cash flow per share - diluted 0.14$ 0.25$ 1.09$ 0.61$
Adjusted net income (loss):Net income (loss) (160,175)$ (6,342)$ (138,072)$ (1,250)$
Plus: Tax effected impairment charge 179,919 - 179,919 -$
Plus: Tax effected settlement charge 4,097 - 8,398 -
Plus: Tax effected unrealized (gain)loss on derivatives (24,218) 5,083 (21,183) 6,405
Adjusted net income (loss) (377)$ (1,259)$ 29,062$ 5,155$
Weighted average shares outstanding - basic 77,024 47,067 70,629 41,240 Weighted average shares outstanding - diluted 77,024 47,067 70,711 41,328
Adjusted net income (loss) per share - basic (0.00)$ (0.03)$ 0.41$ 0.13$ Adjusted net income (loss) per share - diluted (0.00)$ (0.03)$ 0.41$ 0.12$

16
Total DebtTotal Debt
$250.7
$131.8 $131.7 $132.2 $131.9 $147.8 $147.7
$335.7$351.7
$273.5$246.7
$-
$50.0
$100.0
$150.0
$200.0
$250.0
$300.0
$350.0
$400.0
2Q06 3Q06 4Q06 1Q07 2Q07 3Q07 4Q07 1Q08 2Q08 3Q08 4Q08
To
tal
Deb
t (M
M)
(1) Ascent acquisition closed November 29, 2007(2) At 12/31/08
(1)
• Total debt continues to decline compared to year ago levels• RAM borrowing base under existing facilities is $288 MM
Revolver; $137 MM outstanding (2)
- Term; $113 MM outstanding (2)

17
$5,778
$3,906 $3,837 $3,838 $3,990$4,754
$8,162
$6,197
$5,006
$8,175
$4,817
10.6%10.9% 10.8% 10.8%
10.4% 10.2%10.7%
8.2%
6.8%
6.9%
6.1%
$-
$2,000
$4,000
$6,000
$8,000
$10,000
2Q06 3Q06 4Q06 1Q07 2Q07 3Q07 4Q07 1Q08 2Q08 3Q08 4Q08
0.0%
2.0%
4.0%
6.0%
8.0%
10.0%
12.0%
Interest Expense Blended Interest Rate
Interest Expense ModeratesInterest Expense Moderates
(1) Ascent acquisition closed November 29, 2007
(1)
• LIBOR based blended interest rate has continued to decline for RAM in concert with recent reduction in Fed Funds Rate

18
$37.9$31.9
$21.1$15.9
$14.5
$37.3
$20.8 $19.3
$46.2 $47.9
$37.9
$16.0$18.0
$10.1
$-
$10.0
$20.0
$30.0
$40.0
$50.0
$60.0
2Q06 3Q06 4Q06 1Q07 2Q07 3Q07 4Q07 1Q08 2Q08 3Q08 4Q08
Liq
uid
ity
($
in
mil
lio
ns
)
Ample LiquidityAmple Liquidity
(1) Ascent acquisition closed November 29, 2007(2) Margin call deposits for derivative obligations designated in red(3) Litigation escrow restricted cash designated in yellow(4) RAM borrowing base under existing credit facilities is $288 MM; $250 MM outstanding at 12/31/08(5) Cash and cash equivalents at 12/31/08 equal $0.2 MM
(1)
(2)
(2)
• Liquidity remains ample at $37.9 MM at December 31, 2008- Revolving facility matures in three years- Term facility matures in four years
(3)

19
• Target – sustain value while focusing on opportunity
• Large inventory of low risk opportunities capable of rapid returns
• Stable cash flow base supported by substantial inventory of projects in “mature fields”
• High degree of operating control and held by production properties; absence of significant term lease issues
• Proven value creation through both acquisitions and drillbit
• Management’s substantial ownership of RAM stock supports alignment with shareholder interest
Summary of Investment Considerations

21
Company Overview Company Overview Reserves / Production Reserves / Production(1)(1)
1) Using RAM proved reserves at 12/31/08
2) Production mix as of December 2008
South
Texas
23%
Mature Oil
Fields
49%
Mature Gas
Fields
21%
Barnett
Shale
7%
Percent of Total Reserves by Area / Field(1)Production by Area / Field(2)
South
Texas
27%
Mature Oil
Fields
38%
Mature Gas
Fields
29%
Barnett
Shale
6%

22
Hydrocarbon Mix of Reserves (1)
40%
47%
13%
oil
natural gas
NGL's
Production Mix (1)
40%
14%
46%
Bbls
MCF
NGL
Company Overview Company Overview Reserves / Production Reserves / Production(1)(1)
(1) Using RAM proved reserves at 12/31/08
• Oil and liquids rich reserve base• 67% of production is based on price of oil
23
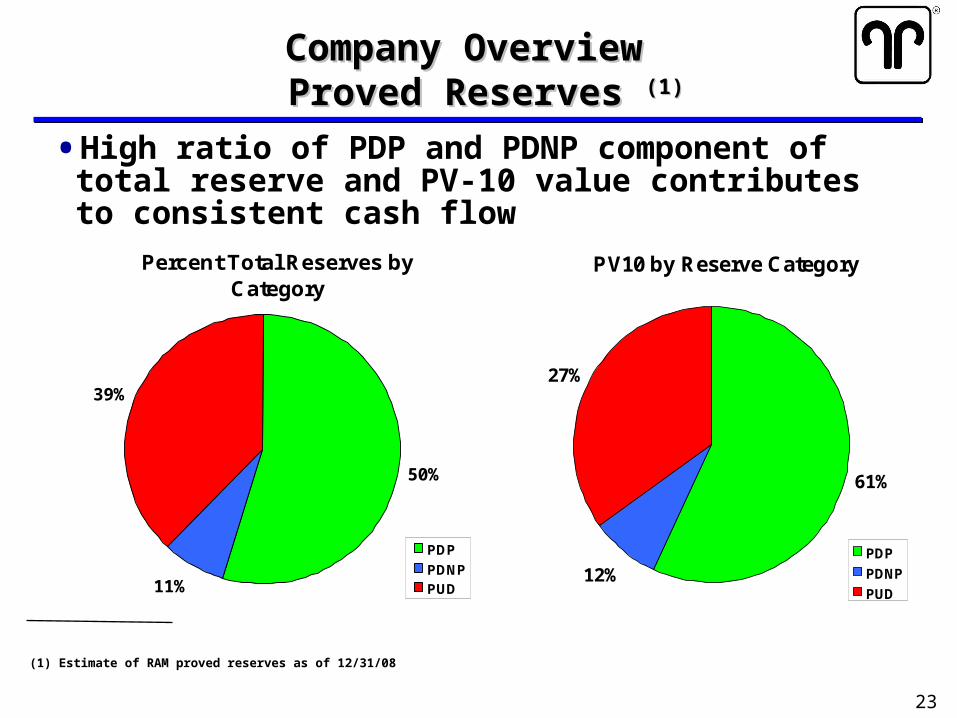
Company Overview Company Overview Proved Reserves Proved Reserves (1)(1)
PV10 by Reserve Category
12%
61%
27%
PDP
PDNP
PUD
(1) Estimate of RAM proved reserves as of 12/31/08
Percent Total Reserves by Category
11%
50%
39%
PDP
PDNPPUD
• High ratio of PDP and PDNP component of total reserve and PV-10 value contributes to consistent cash flow

24
Mature Oil Fields - North Texas Electra / Burkburnett
• 2009 CAPEX: $ 8 million plus
• 48 wells planned
• PUD Inventory over 100 locations
Two year drilling inventory at 2008 planned activity level
Multiple year inventory of non-PUD well locations

25
1
10
100
0 12 24 36Months
Daily
(Bop
de)
Price Case ► One Two ThreeOil price ($/Bbl)(1) $40.00 $50.00 $60.00Gas price ($/Mcf)(1) $5.00 $7.00 $9.00
ROR (%) 55 80 100Payout (yrs) 2.2 1.7 1.4PV10 (M$) 260 360 470EUR (MBOE) 20 20 20CAPEX (M$) 170 170 170F&D ($/BOE) 8.00 8.00 8.00
Locations 100+
Mature Oil Fields – North Texas
Electra / Burkburnett - Type well EconomicsWichita / Wilbarger counties Texas
(1) Assumed flat pricing for life of production
26
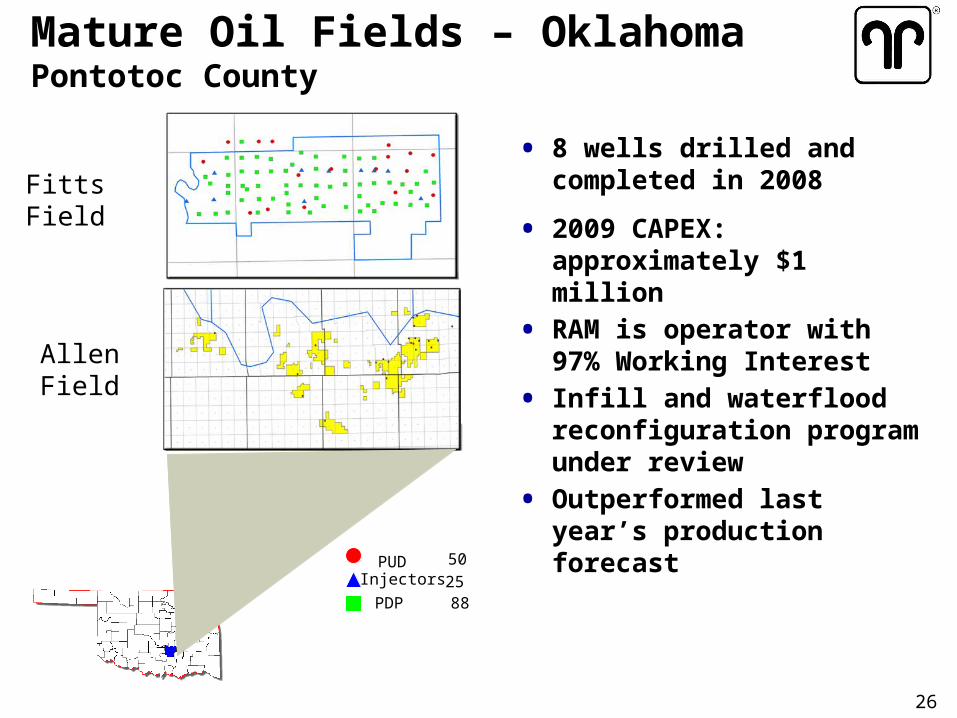
• 8 wells drilled and completed in 2008
• 2009 CAPEX: approximately $1 million
• RAM is operator with 97% Working Interest
• Infill and waterflood reconfiguration program under review
• Outperformed last year’s production forecast
PUDInjectors
PDP
50
25 88
Allen Field
Fitts Field
Mature Oil Fields – OklahomaPontotoc County

27
Mature Oil Fields – OkMature Oil Fields – Ok Type well economics Type well economicsNENE Fitts and Allen FieldsFitts and Allen FieldsMcAlester and Hunton FormationsMcAlester and Hunton Formations
1
10
100
0 12 24 36
Months
Dai
ly (B
opde
)
(1) Assumed flat pricing for life of production
100% Working InterestPrice Case ► One Two ThreeOil price ($/Bbl)(1) $40.00 $50.00 $60.00Gas price ($/Mcf)(1) $5.00 $7.00 $9.00
ROR (%) 100 100 100ROI 3.8 5 6.2Payout (yrs) 1.1 0.8 0.7PV10 (M$) 761 1,113 1,486EUR (MBOE) 50 50 50CAPEX (M$) 400 400 400

28
• 6 wells spud during 2008
• Inventory of 27 PUD, 13 Probable, and 31 Possible locations
• Six wells completed in La Copita (Vicksburg formation), combined average initial daily flow rate over 3.0 Mmcf/d (2 – 5 MM/D range)
• Field revitalization development project (9,800’ Wilcox)• Wiese #1, testing Gas• Thomas Trust #1, testing Gas• Potential for 15 more locations
• RAM is operator with 100% Working Interest in most wells
PUD -
Probable -
Possible -
27
13
31
South Texas (1)
Vicksburg Wilcox
_______________(1) Data as of February 2009

29
100
1,000
10,000
0 12 24 36Months
Da
ily
(M
cfd
e)
La Copita Field, TexasVicksburgh FormationType well Economics
Price Case ► One Two ThreeOil price($/Bbl)(1) $40.00 $50.00 $60.00Gas price ($/MCF)(1) $5.00 $7.00 $9.00
ROR (%) 25 67 100Payout (yrs) 1.8 2.7 3.6PV10 (M$) 821 2,376 3,935EUR (BCFe) 1.7 1.7 1.7CAPEX (M$) 2,750 2,750 2,750F&D ($/MCFe) 1.62 1.62 1.62
Locations 25+
(1) Assumed flat pricing for life of production

RAM Energy Resources, Inc.
TM
Related Documents


