Rakon Limited Interim Report September 2020

Welcome message from author
This document is posted to help you gain knowledge. Please leave a comment to let me know what you think about it! Share it to your friends and learn new things together.
Transcript
Rakon Limited Interim Report September 2020

1
1
Table of Contents
Unaudited Consolidated Interim Statement of Comprehensive Income ..................................................... 2
Unaudited Consolidated Interim Statement of Changes in Equity .............................................................. 3
Unaudited Consolidated Interim Balance Sheet .......................................................................................... 4
Unaudited Consolidated Interim Statement of Cash Flows ......................................................................... 5
Notes to the Unaudited Consolidated Interim Financial Statements .......................................................... 7
Directory ..................................................................................................................................................... 13

2
2
Unaudited Consolidated Interim Statement of Comprehensive Income
For the period ended 30 September 2020
The accompanying notes form an integral part of these financial statements.
Unaudited six Unaudited six Audited yearmonths ended months ended ended30 September 30 September 31 March
2020 2019 2020
Note $000s $000s $000sContinuing operations
Revenue 5 59,534 56,912 118,980
Cost of sales (32,431) (30,652) (66,947)
Gross profit 27,103 26,260 52,033
Other operating income 90 8 28
Other gains/(losses) – net 7 2,287 29 (438)
Operating expenses 6 (24,459) (25,099) (48,081)
Operating profit 5,021 1,198 3,542
Finance income 11 8 8
Finance costs (418) (532) (1,063)
Share of net profits of associate 9 996 753 797
Profit before income tax 5,610 1,427 3,284
Income tax (expense)/credit (969) (85) 696
Net profit for the period attributable to equity holders of the Company 4,641 1,342 3,980
Other comprehensive income
Items that may be reclassified subsequently to profit or loss
Increase/(decrease) in fair value cash flow hedges 7,874 (3,465) (7,247)
Cost of hedging (27) 173 570
(Decrease)/increase in fair value currency translation differences (3,219) 2,547 4,140
Income tax (expense)/credit relating to components of other comprehensive income (2,204) 970 2,029
Item that will not be reclassified subsequently to profit or loss
Changes in fair value of equity investments at fair value through other comprehensive income – Thinxtra
206 133 (1,632)
Other comprehensive income/(losses) for the period, net of tax 2,630 358 (2,140)
Total comprehensive income for the period attributable to equity holders of the Company 7,271 1,700 1,840
Earnings per share attributable to the equity holders of the Company from continuing operations Cents Cents CentsBasic earnings per share 2.0 0.6 1.8
Diluted earnings per share 2.0 0.6 1.8
3
Unaudited Consolidated Interim Statement of Changes in Equity
For the period ended 30 September 2020
The accompanying notes form an integral part of these financial statements.
Share capitalRetained earnings Other reserves Total equity
$000s $000s $000s $000sBalance at 31 March 2019 181,024 (69,855) (21,153) 90,016
Net profit after tax for the half year ended 30 September 2019 - 1,342 - 1,342
Currency translation differences - - 2,547 2,547 Cash flow hedges, net of tax - - (2,322) (2,322)Changes in fair value of equity investments at fair value through other comprehensive income – Thinxtra - - 133 133
Total comprehensive income for the half year - 1,342 358 1,700 Balance at 30 September 2019 181,024 (68,513) (20,795) 91,716
Net profit after tax for the half year ended 31 March 2020 - 2,638 - 2,638 Currency translation differences - - 1,593 1,593 Cash flow hedges, net of tax - - (2,326) (2,326)Changes in fair value of equity investments at fair value through other comprehensive income – Thinxtra - - (1,765) (1,765)
Total comprehensive income for the half year - 2,638 (2,498) 140 Balance at 31 March 2020 181,024 (65,875) (23,293) 91,856
Net profit after tax for the half year ended 30 September 2020 - 4,641 - 4,641 Currency translation differences - - (3,219) (3,219)Cash flow hedges, net of tax - - 5,643 5,643 Changes in fair value of equity investments at fair value through other comprehensive income – Thinxtra - - 206 206
Total comprehensive income for the half year - 4,641 2,630 7,271 Balance at 30 September 2020 181,024 (61,234) (20,663) 99,127

3
3
Unaudited Consolidated Interim Statement of Changes in Equity
For the period ended 30 September 2020
The accompanying notes form an integral part of these financial statements.
Share capitalRetained earnings Other reserves Total equity
$000s $000s $000s $000sBalance at 31 March 2019 181,024 (69,855) (21,153) 90,016
Net profit after tax for the half year ended 30 September 2019 - 1,342 - 1,342
Currency translation differences - - 2,547 2,547 Cash flow hedges, net of tax - - (2,322) (2,322)Changes in fair value of equity investments at fair value through other comprehensive income – Thinxtra - - 133 133
Total comprehensive income for the half year - 1,342 358 1,700 Balance at 30 September 2019 181,024 (68,513) (20,795) 91,716
Net profit after tax for the half year ended 31 March 2020 - 2,638 - 2,638 Currency translation differences - - 1,593 1,593 Cash flow hedges, net of tax - - (2,326) (2,326)Changes in fair value of equity investments at fair value through other comprehensive income – Thinxtra - - (1,765) (1,765)
Total comprehensive income for the half year - 2,638 (2,498) 140 Balance at 31 March 2020 181,024 (65,875) (23,293) 91,856
Net profit after tax for the half year ended 30 September 2020 - 4,641 - 4,641 Currency translation differences - - (3,219) (3,219)Cash flow hedges, net of tax - - 5,643 5,643 Changes in fair value of equity investments at fair value through other comprehensive income – Thinxtra - - 206 206
Total comprehensive income for the half year - 4,641 2,630 7,271 Balance at 30 September 2020 181,024 (61,234) (20,663) 99,127

4
4
Unaudited Consolidated Interim Balance Sheet
As at 30 September 2020
The accompanying notes form an integral part of these financial statements.
Unaudited six Unaudited six Audited yearmonths ended months ended ended30 September 30 September 31 March
2020 2019 2020Note $000s $000s $000s
AssetsCurrent assets
Cash and cash equivalents 9,964 5,350 5,086Trade and other receivables 36,113 35,531 42,379Inventories 41,765 44,796 37,624Derivative financial instruments 765 58 27Financial asset at fair value through profit and loss 83 19 2Current income tax asset 299 726 889Total current assets 88,989 86,480 86,007
Non-current assetsProperty, plant and equipment 18,093 19,528 18,924Intangible assets 8,317 8,701 9,003Investment in associate 9 12,211 11,356 11,714Right-of-use assets 8,174 8,917 9,730Trade and other receivables 2,880 2,186 2,702Financial asset at fair value through other comprehensive income – Thinxtra 8 3,124 4,682 2,918
Derivative financial instruments 300 75 -Deferred tax asset 6,929 7,324 9,246Total non-current assets 60,028 62,769 64,237
Total assets 149,017 149,249 150,244Liabilities
Current liabilitiesBank overdraft 10 5,800 12,704 12,848Borrowings 10 6,673 280 145Lease liabilities 2,489 2,530 2,741Trade and other payables 25,038 25,357 22,252Provisions 810 257 714Derivative financial instruments 298 3,381 5,040Deferred consideration on acquisition – Rakon India - 1,938 -
Deferred income – government wage subsidy - - 2,000Total current liabilities 41,108 46,447 45,740
Non-current liabilitiesBorrowings 10 324 - -Lease liabilities 5,382 6,151 6,704Provisions 2,838 3,415 2,918Derivative financial instruments 51 1,318 2,840Deferred tax liabilities 187 202 186Total non-current liabilities 8,782 11,086 12,648
Total liabilities 49,890 57,533 58,388Net assets 99,127 91,716 91,856Equity
Share capital 181,024 181,024 181,024Other reserves (20,663) (20,795) (23,293)Accumulated losses (61,234) (68,513) (65,875)
Total equity 99,127 91,716 91,856
5
5
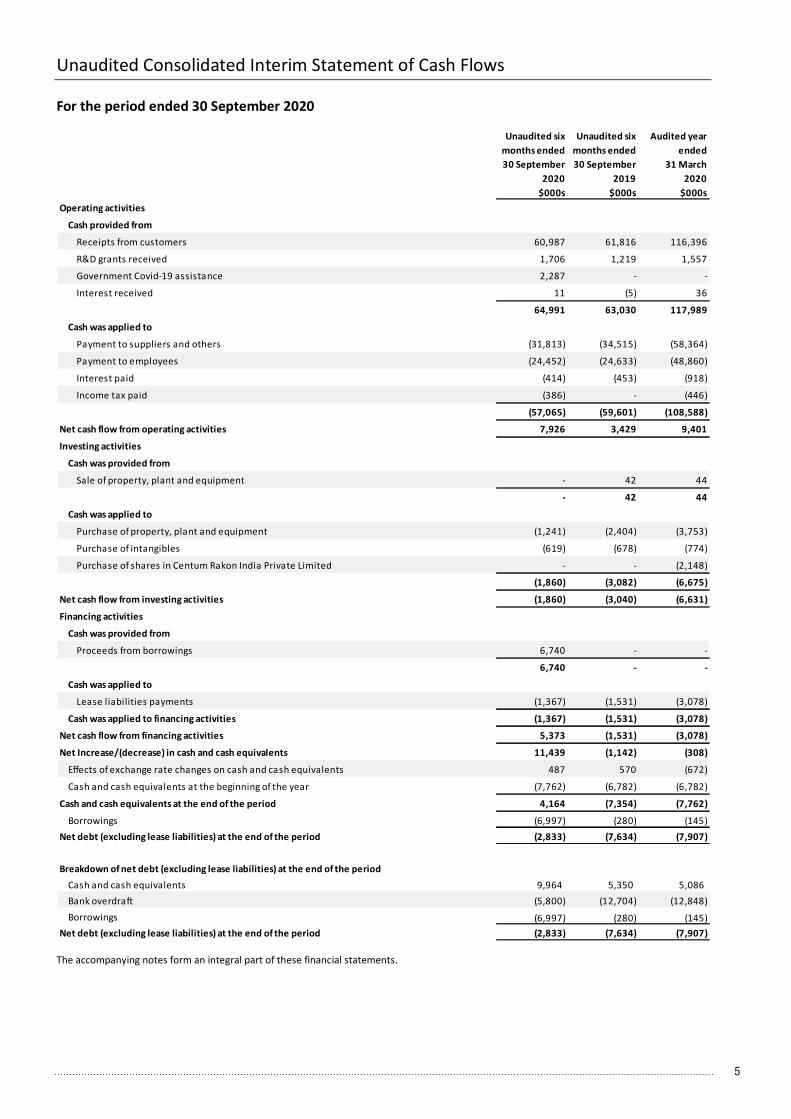
Unaudited Consolidated Interim Statement of Cash Flows
For the period ended 30 September 2020
The accompanying notes form an integral part of these financial statements.
Unaudited six Unaudited six Audited yearmonths ended months ended ended30 September 30 September 31 March
2020 2019 2020$000s $000s $000s
Operating activities
Cash provided from
Receipts from customers 60,987 61,816 116,396
R&D grants received 1,706 1,219 1,557
Government Covid-19 assistance 2,287 - -
Interest received 11 (5) 36
64,991 63,030 117,989
Cash was applied to
Payment to suppliers and others (31,813) (34,515) (58,364)
Payment to employees (24,452) (24,633) (48,860)
Interest paid (414) (453) (918)
Income tax paid (386) - (446)
(57,065) (59,601) (108,588)
Net cash flow from operating activities 7,926 3,429 9,401
Investing activities
Cash was provided from
Sale of property, plant and equipment - 42 44
- 42 44
Cash was applied to
Purchase of property, plant and equipment (1,241) (2,404) (3,753)
Purchase of intangibles (619) (678) (774)
Purchase of shares in Centum Rakon India Private Limited - - (2,148)
(1,860) (3,082) (6,675)
Net cash flow from investing activities (1,860) (3,040) (6,631)
Financing activities
Cash was provided from
Proceeds from borrowings 6,740 - -
6,740 - -
Cash was applied to
Lease liabilities payments (1,367) (1,531) (3,078)
Cash was applied to financing activities (1,367) (1,531) (3,078)
Net cash flow from financing activities 5,373 (1,531) (3,078)
Net Increase/(decrease) in cash and cash equivalents 11,439 (1,142) (308)
Effects of exchange rate changes on cash and cash equivalents 487 570 (672)
Cash and cash equivalents at the beginning of the year (7,762) (6,782) (6,782)
Cash and cash equivalents at the end of the period 4,164 (7,354) (7,762)
Borrowings (6,997) (280) (145)Net debt (excluding lease liabilities) at the end of the period (2,833) (7,634) (7,907)
Breakdown of net debt (excluding lease liabilities) at the end of the periodCash and cash equivalents 9,964 5,350 5,086 Bank overdraft (5,800) (12,704) (12,848)Borrowings (6,997) (280) (145)
Net debt (excluding lease liabilities) at the end of the period (2,833) (7,634) (7,907)
6
6
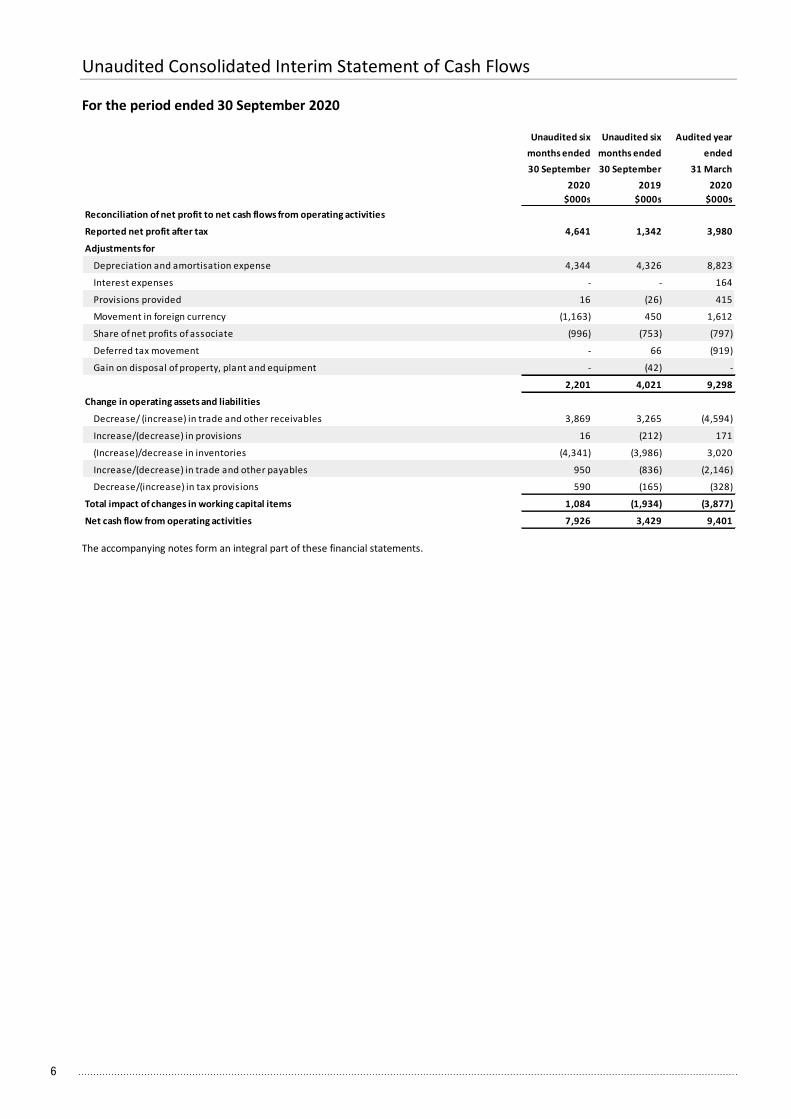
Unaudited Consolidated Interim Statement of Cash Flows
For the period ended 30 September 2020
The accompanying notes form an integral part of these financial statements.
Unaudited six Unaudited six Audited yearmonths ended months ended ended30 September 30 September 31 March
2020 2019 2020$000s $000s $000s
Reconciliation of net profit to net cash flows from operating activities
Reported net profit after tax 4,641 1,342 3,980
Adjustments for
Depreciation and amortisation expense 4,344 4,326 8,823
Interest expenses - - 164
Provisions provided 16 (26) 415
Movement in foreign currency (1,163) 450 1,612
Share of net profits of associate (996) (753) (797)
Deferred tax movement - 66 (919)
Gain on disposal of property, plant and equipment - (42) -
2,201 4,021 9,298
Change in operating assets and liabilities
Decrease/ (increase) in trade and other receivables 3,869 3,265 (4,594)
Increase/(decrease) in provisions 16 (212) 171
(Increase)/decrease in inventories (4,341) (3,986) 3,020
Increase/(decrease) in trade and other payables 950 (836) (2,146)
Decrease/(increase) in tax provisions 590 (165) (328)
Total impact of changes in working capital items 1,084 (1,934) (3,877)
Net cash flow from operating activities 7,926 3,429 9,401
7
7
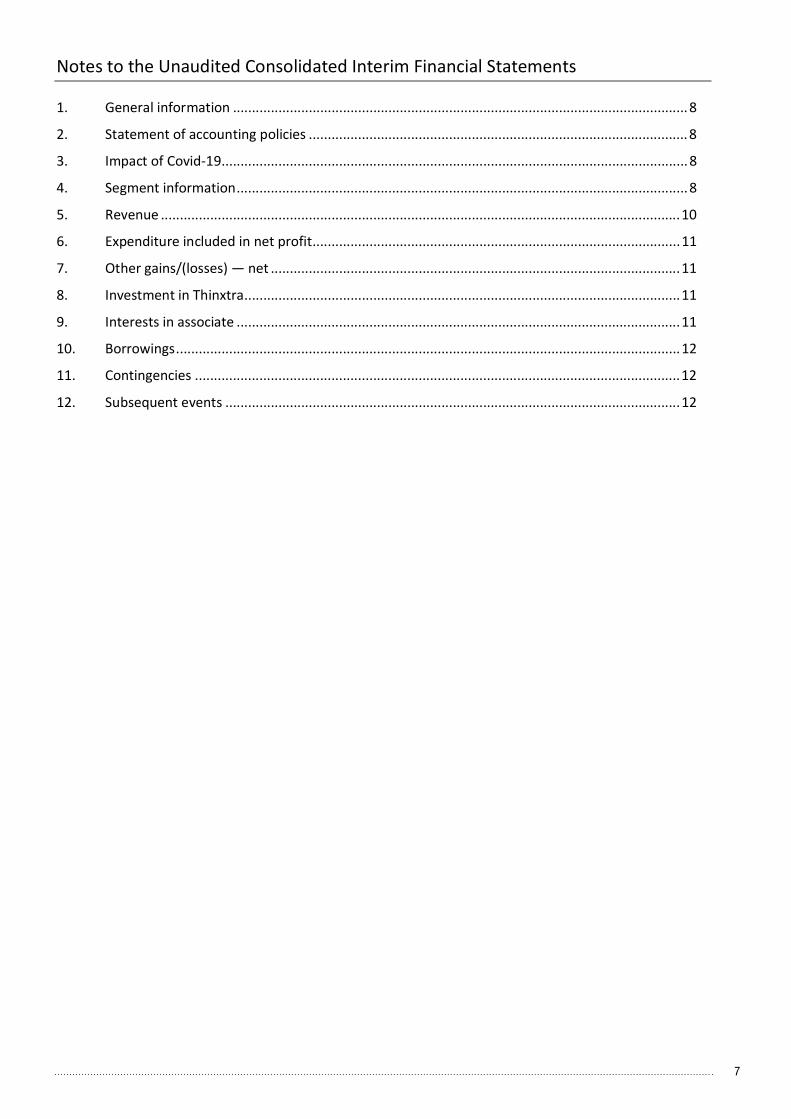
Notes to the Unaudited Consolidated Interim Financial Statements
1. General information ........................................................................................................................ 8
2. Statement of accounting policies .................................................................................................... 8
3. Impact of Covid-19 ........................................................................................................................... 8
4. Segment information ....................................................................................................................... 8
5. Revenue ......................................................................................................................................... 10
6. Expenditure included in net profit ................................................................................................. 11
7. Other gains/(losses) — net ............................................................................................................ 11
8. Investment in Thinxtra ................................................................................................................... 11
9. Interests in associate ..................................................................................................................... 11
10. Borrowings ..................................................................................................................................... 12
11. Contingencies ................................................................................................................................ 12
12. Subsequent events ........................................................................................................................ 12
8 8
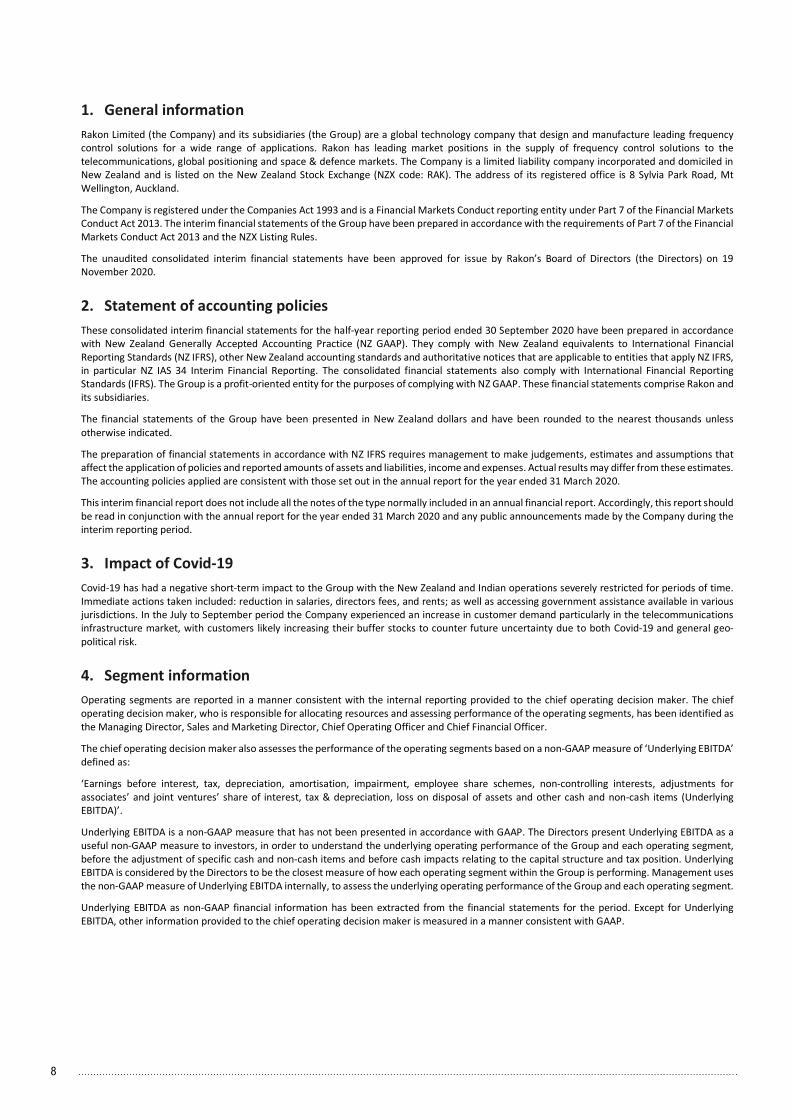
1. General information Rakon Limited (the Company) and its subsidiaries (the Group) are a global technology company that design and manufacture leading frequency control solutions for a wide range of applications. Rakon has leading market positions in the supply of frequency control solutions to the telecommunications, global positioning and space & defence markets. The Company is a limited liability company incorporated and domiciled in New Zealand and is listed on the New Zealand Stock Exchange (NZX code: RAK). The address of its registered office is 8 Sylvia Park Road, Mt Wellington, Auckland.
The Company is registered under the Companies Act 1993 and is a Financial Markets Conduct reporting entity under Part 7 of the Financial Markets Conduct Act 2013. The interim financial statements of the Group have been prepared in accordance with the requirements of Part 7 of the Financial Markets Conduct Act 2013 and the NZX Listing Rules.
The unaudited consolidated interim financial statements have been approved for issue by Rakon’s Board of Directors (the Directors) on 19 November 2020.
2. Statement of accounting policies These consolidated interim financial statements for the half-year reporting period ended 30 September 2020 have been prepared in accordance with New Zealand Generally Accepted Accounting Practice (NZ GAAP). They comply with New Zealand equivalents to International Financial Reporting Standards (NZ IFRS), other New Zealand accounting standards and authoritative notices that are applicable to entities that apply NZ IFRS, in particular NZ IAS 34 Interim Financial Reporting. The consolidated financial statements also comply with International Financial Reporting Standards (IFRS). The Group is a profit-oriented entity for the purposes of complying with NZ GAAP. These financial statements comprise Rakon and its subsidiaries.
The financial statements of the Group have been presented in New Zealand dollars and have been rounded to the nearest thousands unless otherwise indicated.
The preparation of financial statements in accordance with NZ IFRS requires management to make judgements, estimates and assumptions that affect the application of policies and reported amounts of assets and liabilities, income and expenses. Actual results may differ from these estimates. The accounting policies applied are consistent with those set out in the annual report for the year ended 31 March 2020.
This interim financial report does not include all the notes of the type normally included in an annual financial report. Accordingly, this report should be read in conjunction with the annual report for the year ended 31 March 2020 and any public announcements made by the Company during the interim reporting period.
3. Impact of Covid-19 Covid-19 has had a negative short-term impact to the Group with the New Zealand and Indian operations severely restricted for periods of time. Immediate actions taken included: reduction in salaries, directors fees, and rents; as well as accessing government assistance available in various jurisdictions. In the July to September period the Company experienced an increase in customer demand particularly in the telecommunications infrastructure market, with customers likely increasing their buffer stocks to counter future uncertainty due to both Covid-19 and general geo-political risk.
4. Segment information Operating segments are reported in a manner consistent with the internal reporting provided to the chief operating decision maker. The chief operating decision maker, who is responsible for allocating resources and assessing performance of the operating segments, has been identified as the Managing Director, Sales and Marketing Director, Chief Operating Officer and Chief Financial Officer.
The chief operating decision maker also assesses the performance of the operating segments based on a non-GAAP measure of ‘Underlying EBITDA’ defined as:
‘Earnings before interest, tax, depreciation, amortisation, impairment, employee share schemes, non-controlling interests, adjustments for associates’ and joint ventures’ share of interest, tax & depreciation, loss on disposal of assets and other cash and non-cash items (Underlying EBITDA)’.
Underlying EBITDA is a non-GAAP measure that has not been presented in accordance with GAAP. The Directors present Underlying EBITDA as a useful non-GAAP measure to investors, in order to understand the underlying operating performance of the Group and each operating segment, before the adjustment of specific cash and non-cash items and before cash impacts relating to the capital structure and tax position. Underlying EBITDA is considered by the Directors to be the closest measure of how each operating segment within the Group is performing. Management uses the non-GAAP measure of Underlying EBITDA internally, to assess the underlying operating performance of the Group and each operating segment.
Underlying EBITDA as non-GAAP financial information has been extracted from the financial statements for the period. Except for Underlying EBITDA, other information provided to the chief operating decision maker is measured in a manner consistent with GAAP.
9
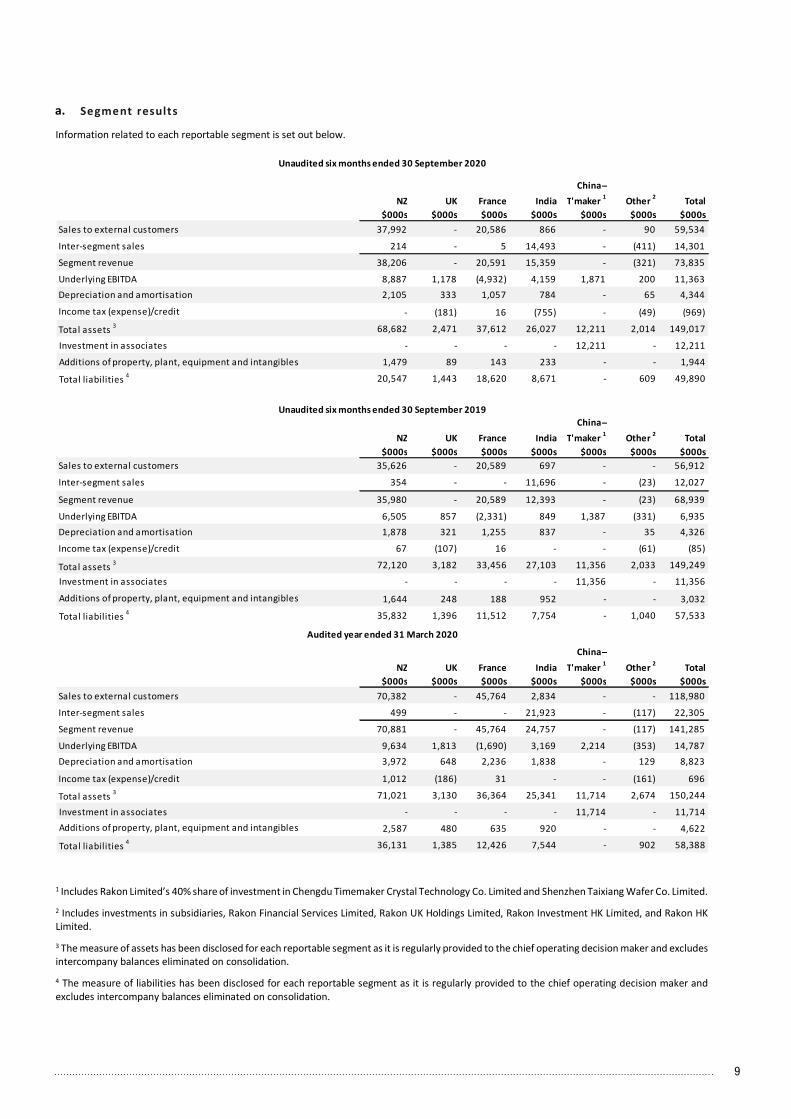
Segment results
Information related to each reportable segment is set out below.
1 Includes Rakon Limited’s 40% share of investment in Chengdu Timemaker Crystal Technology Co. Limited and Shenzhen Taixiang Wafer Co. Limited.
2 Includes investments in subsidiaries, Rakon Financial Services Limited, Rakon UK Holdings Limited, Rakon Investment HK Limited, and Rakon HK Limited.
3 The measure of assets has been disclosed for each reportable segment as it is regularly provided to the chief operating decision maker and excludes intercompany balances eliminated on consolidation.
4 The measure of liabilities has been disclosed for each reportable segment as it is regularly provided to the chief operating decision maker and excludes intercompany balances eliminated on consolidation.
NZ UK France IndiaChina ̶
T'maker 1 Other 2 Total$000s $000s $000s $000s $000s $000s $000s
Sales to external customers 37,992 - 20,586 866 - 90 59,534
Inter-segment sales 214 - 5 14,493 - (411) 14,301
Segment revenue 38,206 - 20,591 15,359 - (321) 73,835
Underlying EBITDA 8,887 1,178 (4,932) 4,159 1,871 200 11,363Depreciation and amortisation 2,105 333 1,057 784 - 65 4,344
Income tax (expense)/credit - (181) 16 (755) - (49) (969)
Total assets 3 68,682 2,471 37,612 26,027 12,211 2,014 149,017
Investment in associates - - - - 12,211 - 12,211
Additions of property, plant, equipment and intangibles 1,479 89 143 233 - - 1,944
Total liabilities 4 20,547 1,443 18,620 8,671 - 609 49,890
Unaudited six months ended 30 September 2020
NZ UK France IndiaChina ̶
T'maker 1 Other 2 Total$000s $000s $000s $000s $000s $000s $000s
Sales to external customers 35,626 - 20,589 697 - - 56,912
Inter-segment sales 354 - - 11,696 - (23) 12,027
Segment revenue 35,980 - 20,589 12,393 - (23) 68,939
Underlying EBITDA 6,505 857 (2,331) 849 1,387 (331) 6,935Depreciation and amortisation 1,878 321 1,255 837 - 35 4,326
Income tax (expense)/credit 67 (107) 16 - - (61) (85)
Total assets 3 72,120 3,182 33,456 27,103 11,356 2,033 149,249
Investment in associates - - - - 11,356 - 11,356
Additions of property, plant, equipment and intangibles 1,644 248 188 952 - - 3,032
Total liabilities 4 35,832 1,396 11,512 7,754 - 1,040 57,533
Unaudited six months ended 30 September 2019
NZ UK France India China ̶
T'maker 1 Other 2 Total$000s $000s $000s $000s $000s $000s $000s
Sales to external customers 70,382 - 45,764 2,834 - - 118,980
Inter-segment sales 499 - - 21,923 - (117) 22,305
Segment revenue 70,881 - 45,764 24,757 - (117) 141,285
Underlying EBITDA 9,634 1,813 (1,690) 3,169 2,214 (353) 14,787Depreciation and amortisation 3,972 648 2,236 1,838 - 129 8,823
Income tax (expense)/credit 1,012 (186) 31 - - (161) 696
Total assets 3 71,021 3,130 36,364 25,341 11,714 2,674 150,244
Investment in associates - - - - 11,714 - 11,714Additions of property, plant, equipment and intangibles 2,587 480 635 920 - - 4,622
Total liabilities 4 36,131 1,385 12,426 7,544 - 902 58,388
Audited year ended 31 March 2020
9 9
Segment results
Information related to each reportable segment is set out below.
1 Includes Rakon Limited’s 40% share of investment in Chengdu Timemaker Crystal Technology Co. Limited and Shenzhen Taixiang Wafer Co. Limited.
2 Includes investments in subsidiaries, Rakon Financial Services Limited, Rakon UK Holdings Limited, Rakon Investment HK Limited, and Rakon HK Limited.
3 The measure of assets has been disclosed for each reportable segment as it is regularly provided to the chief operating decision maker and excludes intercompany balances eliminated on consolidation.
4 The measure of liabilities has been disclosed for each reportable segment as it is regularly provided to the chief operating decision maker and excludes intercompany balances eliminated on consolidation.
NZ UK France IndiaChina ̶
T'maker 1 Other 2 Total$000s $000s $000s $000s $000s $000s $000s
Sales to external customers 37,992 - 20,586 866 - 90 59,534
Inter-segment sales 214 - 5 14,493 - (411) 14,301
Segment revenue 38,206 - 20,591 15,359 - (321) 73,835
Underlying EBITDA 8,887 1,178 (4,932) 4,159 1,871 200 11,363Depreciation and amortisation 2,105 333 1,057 784 - 65 4,344
Income tax (expense)/credit - (181) 16 (755) - (49) (969)
Total assets 3 68,682 2,471 37,612 26,027 12,211 2,014 149,017
Investment in associates - - - - 12,211 - 12,211
Additions of property, plant, equipment and intangibles 1,479 89 143 233 - - 1,944
Total liabilities 4 20,547 1,443 18,620 8,671 - 609 49,890
Unaudited six months ended 30 September 2020
NZ UK France IndiaChina ̶
T'maker 1 Other 2 Total$000s $000s $000s $000s $000s $000s $000s
Sales to external customers 35,626 - 20,589 697 - - 56,912
Inter-segment sales 354 - - 11,696 - (23) 12,027
Segment revenue 35,980 - 20,589 12,393 - (23) 68,939
Underlying EBITDA 6,505 857 (2,331) 849 1,387 (331) 6,935Depreciation and amortisation 1,878 321 1,255 837 - 35 4,326
Income tax (expense)/credit 67 (107) 16 - - (61) (85)
Total assets 3 72,120 3,182 33,456 27,103 11,356 2,033 149,249
Investment in associates - - - - 11,356 - 11,356
Additions of property, plant, equipment and intangibles 1,644 248 188 952 - - 3,032
Total liabilities 4 35,832 1,396 11,512 7,754 - 1,040 57,533
Unaudited six months ended 30 September 2019
NZ UK France India China ̶
T'maker 1 Other 2 Total$000s $000s $000s $000s $000s $000s $000s
Sales to external customers 70,382 - 45,764 2,834 - - 118,980
Inter-segment sales 499 - - 21,923 - (117) 22,305
Segment revenue 70,881 - 45,764 24,757 - (117) 141,285
Underlying EBITDA 9,634 1,813 (1,690) 3,169 2,214 (353) 14,787Depreciation and amortisation 3,972 648 2,236 1,838 - 129 8,823
Income tax (expense)/credit 1,012 (186) 31 - - (161) 696
Total assets 3 71,021 3,130 36,364 25,341 11,714 2,674 150,244
Investment in associates - - - - 11,714 - 11,714Additions of property, plant, equipment and intangibles 2,587 480 635 920 - - 4,622
Total liabilities 4 36,131 1,385 12,426 7,544 - 902 58,388
Audited year ended 31 March 2020
a.

10 10
Reconciliat ion of Under lying EBITDA to net profit for the per iod
5. Revenue The Group predominately operates in one segment, its primary business being the design, manufacture, marketing and the sale of frequency control solutions. There is one main revenue stream, which is the sale of manufactured finished products.
Market segment
The Group’s products are used in the telecommunications, global positioning and space & defence markets.
Geographical segment
The Group’s trading revenue is derived in the following regions. Revenue is allocated based on the country in which the customer is located.
Unaudited six Unaudited six Audited yearmonths ended months ended ended30 September 30 September 31 March
2020 2019 2020Continuing operations $000s $000s $000sUnderlying EBITDA 11,363 6,935 14,787
Depreciation and amortisation (4,344) (4,326) (8,823)
Finance costs – net (407) (525) (1,055)
Adjustment for associates and joint venture share of interest, tax and depreciation (875) (649) (1,447)
Other non-cash items (127) (8) (178)
Profit before income tax 5,610 1,427 3,284
Income tax (expense)/credit (969) (85) 696
Net profit for the period 4,641 1,342 3,980
Unaudited six Unaudited six Audited year
months ended months ended ended
30 September 30 September 31 March
2020 2019 2020
$000s $000s $000sTelecommunications 38,375 32,176 65,167
Global Positioning 5,997 9,698 18,915
Space and Defence 11,414 12,258 28,230
Other 3,748 2,780 6,668
Total revenue by market segment 59,534 56,912 118,980
Unaudited six Unaudited six Audited year
months ended months ended ended
30 September 30 September 31 March
2020 2019 2020
$000s $000s $000sAsia 34,061 30,470 60,474
North America 12,403 12,546 26,959
Europe 11,863 12,509 29,073
Others 1,207 1,387 2,474
Total revenue by region 59,534 56,912 118,980
b.

11 11
6. Expenditure included in net profit Additional information in respect of expenses included in the Unaudited Consolidated Interim Statement of Comprehensive Income is as follows.
Operating expenses by function
7. Other gains/(losses) — net
1Includes realised and unrealised gains/(losses) arising from accounts receivable and accounts payable.
2The eligible New Zealand wage subsidy, UK government funded furlough and French government assistance.
8. Investment in Thinxtra Thinxtra Pty Limited (Thinxtra) is an 'Internet of Things' (IoT) business that started in 2016. Thinxtra's focus is on establishing an IoT network in Australia, New Zealand and Hong Kong and providing products, services and solutions enabling connectivity of devices to the network. Thinxtra’s business model is based on subscription for access to the network, platform solutions and the sale of IoT products. Further information is available at www.thinxtra.com.
Rakon was one of the founding members of Thinxtra in 2016, and has a 6.9% ownership interest at 30 September 2020 (September 2019: 17.8%) Rakon had decided not to participate in additional capital raisings which resulted in Rakon’s ownership interest diluting.
The previous valuation of retained investment in Thinxtra used for the 31 March 2020 financial statements was based on information available to June 2020. The Directors reviewed new information and observations available since June 2020 and concluded that the valuation of A$2.9m or A$3.64 per share as at 31 March 2020 is still appropriate.
9. Interests in associate Associates are entities over which the Group has significant influence but not control, generally accompanying a shareholding of between 20% and 50% of the voting rights. Investments in associates are accounted for using the equity method of accounting and are initially recognised at cost.
Breakdown of interest in associate
Unaudited six Unaudited six Audited yearmonths ended months ended ended30 September 30 September 31 March
2020 2019 2020$000s $000s $000s
Selling and marketing costs 4,432 5,214 9,585
Research and development 6,645 6,312 13,888
General and administration 13,382 13,573 24,608
Total operating expenses 24,459 25,099 48,081
Unaudited six Unaudited six Audited yearmonths ended months ended ended30 September 30 September 31 March
2020 2019 2020$000s $000s $000s
(Loss)/gain on disposal of property, plant, equipment and intangibles (24) 34 33
Government Covid-19 assistance2 2,287 - -
Foreign exchange gains/(losses) – net
Foreign exchange contracts and hedges 676 448 (29)
Revaluation of foreign denominated monetary assets and liabilities 1 (652) (453) (442)
Total foreign exchange gains/(losses) – net 24 (5) (471)Other gains/(losses) – net 2,287 29 (438)
Unaudited six Unaudited six Audited yearmonths ended months ended ended30 September 30 September 31 March
2020 2019 2020Chengdu Timemaker Crystal Technology Co. Ltd Associate China 40% 40% 40%
Shenzhen Taixiang Wafer Co. Ltd Associate China 40% 40% 40%
Name of entity
% of ownership interest
Country of incorporation
Nature of relationship

12 12
The Group has a 40% interest in two related companies: Chengdu Timemaker Crystal Technology Co. Limited and Shenzhen Taixiang Wafer Co. Limited, which provide products and services to the frequency control products industry.
10. Borrowings The Group is reliant on its bank facilities and equity as the principal sources of capital management.
ASB
At 30 September 2020 a $7.7m combined trade facility and a $3.3m overdraft facility were in place.
On 26 May 2020 the facilities with ASB were extended and the Company agreed to reduce the combined trade facility as follows:
Up to 29 June 2020: $13.2m
From 30 June 2020 to 30 September 2020: $11.2m
From 1 October 2020 to 31 December 2020: $7.7m
From 1 January 2021: $5.7m
During the period the Company operated within its facility limits and was in compliance with all required financial covenants. The facility limits are currently being reviewed with ASB.
Borrowings balance
The bank borrowings include a €3.5m French government backed loan that was made available to Rakon France for an initial term of 12 months with an option to extend for up to a further five years at the end of the first 12 months. This loan has certain restrictions that limits it to be used for working capital/treasury support for the French business only. Interest is payable at zero percent for the initial 12 months along with a guarantee fee of 0.25%. There are no covenants on the loan and no additional security is required.
11. Contingencies There are no new material contingent liabilities.
12. Subsequent events There were no subsequent events post 30 September 2020.
Unaudited six Unaudited six Audited year Unaudited six Unaudited six Audited yearmonths ended months ended ended months ended months ended ended30 September 30 September 31 March 30 September 30 September 31 March
2020 2019 2020 2020 2019 2020$000s $000s $000s $000s $000s $000s
Chengdu Timemaker Crystal Technology Co. Ltd 11,768 10,917 11,259
Shenzhen Taixiang Wafer Co. Ltd 443 439 455
Total Timemaker Group 12,211 11,356 11,714 996 753 797
Name of entity
Net investment Equity accounted profits
Unaudited six Unaudited six Audited yearmonths ended months ended ended30 September 30 September 31 March
2020 2019 2020$000s $000s $000s
Current
Other borrowings 450 280 145
Bank overdrafts 5,800 12,704 12,848
Bank borrowings 6,223 - -
Current borrowings 12,473 12,984 12,993
Non-current
Other borrowings 324 - -
Non-current borrowings 324 - -
a.
b.
13 12
The Group has a 40% interest in two related companies: Chengdu Timemaker Crystal Technology Co. Limited and Shenzhen Taixiang Wafer Co. Limited, which provide products and services to the frequency control products industry.
10. Borrowings The Group is reliant on its bank facilities and equity as the principal sources of capital management.
ASB
At 30 September 2020 a $7.7m combined trade facility and a $3.3m overdraft facility were in place.
On 26 May 2020 the facilities with ASB were extended and the Company agreed to reduce the combined trade facility as follows:
Up to 29 June 2020: $13.2m
From 30 June 2020 to 30 September 2020: $11.2m
From 1 October 2020 to 31 December 2020: $7.7m
From 1 January 2021: $5.7m
During the period the Company operated within its facility limits and was in compliance with all required financial covenants. The facility limits are currently being reviewed with ASB.
Borrowings balance
The bank borrowings include a €3.5m French government backed loan that was made available to Rakon France for an initial term of 12 months with an option to extend for up to a further five years at the end of the first 12 months. This loan has certain restrictions that limits it to be used for working capital/treasury support for the French business only. Interest is payable at zero percent for the initial 12 months along with a guarantee fee of 0.25%. There are no covenants on the loan and no additional security is required.
11. Contingencies There are no new material contingent liabilities.
12. Subsequent events There were no subsequent events post 30 September 2020.
Unaudited six Unaudited six Audited year Unaudited six Unaudited six Audited yearmonths ended months ended ended months ended months ended ended30 September 30 September 31 March 30 September 30 September 31 March
2020 2019 2020 2020 2019 2020$000s $000s $000s $000s $000s $000s
Chengdu Timemaker Crystal Technology Co. Ltd 11,768 10,917 11,259
Shenzhen Taixiang Wafer Co. Ltd 443 439 455
Total Timemaker Group 12,211 11,356 11,714 996 753 797
Name of entity
Net investment Equity accounted profits
Unaudited six Unaudited six Audited yearmonths ended months ended ended30 September 30 September 31 March
2020 2019 2020$000s $000s $000s
Current
Other borrowings 450 280 145
Bank overdrafts 5,800 12,704 12,848
Bank borrowings 6,223 - -
Current borrowings 12,473 12,984 12,993
Non-current
Other borrowings 324 - -
Non-current borrowings 324 - -
13
Directory
Registered Office
Rakon Limited 8 Sylvia Park Road Mt Wellington Auckland 1060 Telephone: +64 9 573 5554 Facsimile: +64 9 573 5559 Website: www.rakon.com
Mailing Address
Rakon Limited Private Bag 99943 Newmarket Auckland 1149
Directors
Bruce Irvine Keith Oliver Brent Robinson Yin Tang Tseng Lorraine Witten Keith Watson
Principal Lawyers
Bell Gully PO Box 4199 Shortland Street Auckland 1140
Auditors
PricewaterhouseCoopers Private Bag 92162 Auckland 1142
Share Registrar
Computershare Investor Services Limited Private Bag 92119 Victoria Street West Auckland 1142 Managing Your Shareholding Online: To change your address, update your payment instructions and to view your investment portfolio, including transactions, please visit: www.investorcentre.com/nz General enquiries can be directed to: [email protected] Telephone: +64 9 488 8777 Facsimile: +64 9 488 8787
Bankers
ASB Bank PO Box 35 Shortland Street Auckland 1140

www.rakon.com
Related Documents