www.rajar.co.uk In today’s connected world, radio has transformed into a truly anytime, anywhere, anyhow experience. The MIDAS Survey is designed to provide context and insight into how when and where radio content is being consumed in this liberated environment. With the increasing penetration of connected devices such as tablets and smartphones, MIDAS shows how listeners are embracing the multi-platform and multi-device offering, as well as how radio-on- demand is contributing to listening behaviour. It also reveals the activities they are doing whilst listening, where they are listening, and who they are listening with. MIDAS Summer 2018 MIDAS Measurement of Internet Delivered Audio Services RAJAR Midas Audio Survey 1

Welcome message from author
This document is posted to help you gain knowledge. Please leave a comment to let me know what you think about it! Share it to your friends and learn new things together.
Transcript

www.rajar.co.uk
In today’s connected world, radio has transformed into a truly anytime, anywhere, anyhow
experience.
The MIDAS Survey is designed to provide context and insight into how when and where radio
content is being consumed in this liberated environment.
With the increasing penetration of connected devices such as tablets and smartphones, MIDAS shows
how listeners are embracing the multi-platform and multi-device offering, as well as how radio-on-
demand is contributing to listening behaviour. It also reveals the activities they are doing whilst
listening, where they are listening, and who they are listening with.
MIDAS Summer 2018
MIDAS Measurement of Internet Delivered Audio Services
RAJAR Midas Audio Survey
1

www.rajar.co.uk
RAJAR Midas Audio Survey
AUDIO TYPES include Any Listen Again/Catch-up radioOn-Demand Music Services (e.g. Spotify, Apple Music,) Podcasts (music and speech based)Live RadioDigital Tracks (e.g. mp3,wmv,aac Music and Non Music)CDsCassette tapes/ Vinyl recordsDVD/Video/Subscription TVOnline Video / Audio clips (e.g. on YouTube/ Facebook)Any TV Viewing (Inc. Live, Catch-up and On-demand) Video games (consoles/ mobiles)Other
DEVICES includeAM/FM Radio DAB Digital RadioDigital Media Player (e.g. iPod, Amazon Firestick, ChromecastHome games console (e.g. Sony Playstation, Nintendo Wii, Xbox)Any TV setDesktop / Laptop computerMobile Phone Portable games console (e.g. Nintendo DS, Sony PSP)Record player / decks (vinyl)Tablet (Kindle HD / iPad / Nexus)Wi-Fi/ Internet Radio Set Voice Activated Speakers
ACTIVITIES
ShoppingOnline purchasing SocialisingCommunicating Using the Internet (browsing) Household chores Eating/Drinking/cookingSports/exercise/hobbies Relaxing/nothing in particular working/studying Driving / travellingGaming Washing/DressingSocial MediaAny other internet useOther
LOCATION OF LISTENING
At HomeCar/van/lorry/ At work/elsewhere Public Transport/ walking
WHO WITH On my ownPartner/spouseChildren (under 16) Family member (s)FriendsColleaguesOther people you knowOther people you don’t know
SUB AUDIO TYPES BBC/Other Radio Music-based Listen again BBC/Other Radio Speech-based Listen againSpotify/Google Play/Amazon Prime/ Apple Music/Soundcloud/DeezerBBC/Other Radio/ Other music podcast BBC/Other Radio/ Other speech podcast Online Video clips – Music/Non Music
• Facebook • Vimeo • YouTube• Other
2
MIDAS Summer 2018

www.rajar.co.uk
LIVE RADIO
‘Live Radio’ listening hours are
dominated by traditional AM/FM and
DAB Radio sets. (AM/FM Share = 42%
DAB = 40%). Listening to radio via a
Desktop/Laptop = 5% share,
Smartphone 4% and Any TV 4%.
Voice activated speakers = 2%
Tablets = 1%
APPS
Radio Apps are popular amongst radio
listeners – 29 million or 53% of the UK
population have downloaded a Radio App,
including 4.9 million (61%) of 15-24 year
olds and 6.0 million (67%) of 25-34 year
olds. On average App users have 2 Radio
Apps stored on their Device.
LISTEN AGAIN
4.5 million adults use the ‘listen again’ or ‘catch up’ radio
Share of ‘catch up radio’ via Device; Smartphones 41%
Desktop/Laptop 30%, and Tablets 17%.
73% of all ‘listen again’ hours are listened to in Home.
78% of Listen Again/Catch Up Radio hours are listened to
alone.
PODCASTING
6.4 million adults or 12% of the adult
population use a Podcast in an average
week.
Almost two thirds of podcasting hours are
listened to via a Smartphone (65%).
Podcasting hours are mainly consumed
whilst Working/Studying (30% share)
Driving/Travelling (25% share).
2 10
3
74
7 3
Listen Again
On Demand Music
Podcasts
Live Radio
Digital Tracks
CD's
Cassettes/Vinyl
SHARE OF AUDIO % (excluding visual)
3
RAJAR Midas Audio Survey
MIDAS Summer 2018

www.rajar.co.uk
4
8
12
12
24
24
24
30
33
90
91
0 10 20 30 40 50 60 70 80 90 100
Cassette tapes / vinyl records
Total Catch Up/Listen Again
Total Podcast
Video Games
On Demand Music Services
Digital Music Tracks
Total CD's
DVD/Video/Subscription TV
Online Video/ Audio clips
Live Radio
Any TV
4
AUDIO REACH %
RAJAR Midas Audio Survey
MIDAS Summer 2018

www.rajar.co.uk 5
AUDIO SHARE% (exc visual) BY AGE GROUP
RAJAR Midas Audio Survey
15 - 24 25-34
17
1
3
9
17
62
1 34
10
34
48
MIDAS Summer 2018

www.rajar.co.uk 6
RAJAR Midas Audio Survey
AUDIO SHARE% (exc visual) BY AGE GROUP
35-54 55+0
43
3
8
7
75
1 2 34
2
88
MIDAS Summer 2018

www.rajar.co.uk 7
10
5
7
92
15
28
6
10
23
15
93
27
25
3
6
39
17
87
31
20
4
3
54
12
83
30
18
3
0 10 20 30 40 50 60 70 80 90 100
Total Listen Again/Catch up radio
On Demand music services (e.g. Spotify/ Apple Music)
Total Podcasts
Live Radio
Total Digital Tracks
Total CDs
Cassette tapes/vinyl records
15-24 25-34 35-54 55+
AUDIO REACH% BY AGE GROUPMIDAS Summer 2018

www.rajar.co.uk
AGE/SEX % LISTENER PROFILES
8
RAJAR Midas Audio Survey
LISTEN AGAIN
6
13
39
43
56
44
Age Gender
15-24 25-34 35-54 55+ Male Female
14
25
41
20
55
45
Age Gender
PODCASTING
33
27
31
8
54
46
Age Gender
ON DEMAND MUSIC
SERVICES
MIDAS Summer 2018

www.rajar.co.uk 9
RAJAR Midas Audio Survey
DEVICE SHARE EXCLUDING VISUAL%Laptop/Desktop Tablet
Smartphone Voice Activated Speakers
MIDAS Summer 2018

www.rajar.co.uk
REACH%
LIVE RADIO VIA DEVICE
10
0.3
2.0
2.4
3.5
4.0
9.8
11.1
11.6
49.3
57.5
0 10 20 30 40 50 60 70
Other Device
Digital music player
Tablet
Wifi Radio
Voice Activated Speaker
Desktop/Laptop computer
TV
Smartphone
DAB Digital Radio
AM/FM Radio
4240
3 5 46
AM/FM Radio DAB RadioAny TV Desktop/LaptopSmartphone Other
RAJAR Midas Audio Survey
SHARE%
*Other, includes wifi radio, tablet and voice activated speakers
MIDAS Summer 2018

www.rajar.co.uk
LIVE RADIO by ACTIVITY
11
1.2
1.4
1.4
6
6.7
7
9.4
18.6
23.1
29.0
31.5
33.5
57.2
0 20 40 60 80
Gaming
Shopping
Social Media
Sports/Hobbies
Communicating
Socialising
Any other internet use
Washing/Dressing
Working/ studying
Eating/ drinking/ cooking
Household Chores
Relaxing/ nothing particular
Driving/ travelling
RAJAR Midas Audio Survey
SHARE%
REACH%
MIDAS Summer 2018
www.rajar.co.uk 12
RAJAR Midas Audio Survey
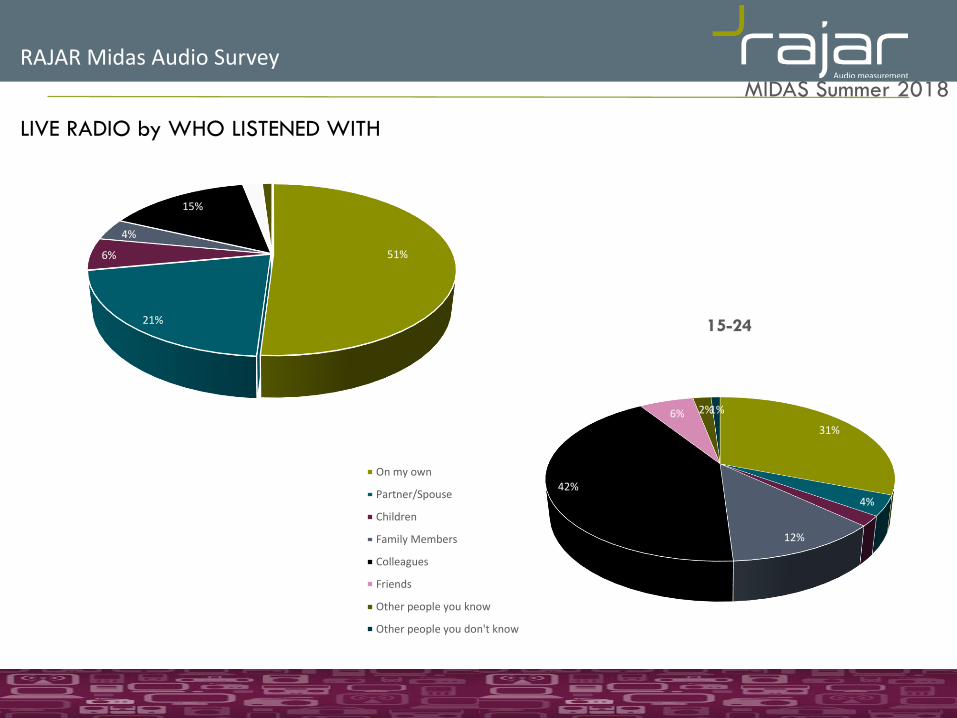
LIVE RADIO by WHO LISTENED WITH
31%
4%
12%
42%
6% 2%1%
15-24
On my own
Partner/Spouse
Children
Family Members
Colleagues
Friends
Other people you know
Other people you don't know
51%
21%
6%
4%
15%
2% 1%0%
MIDAS Summer 2018
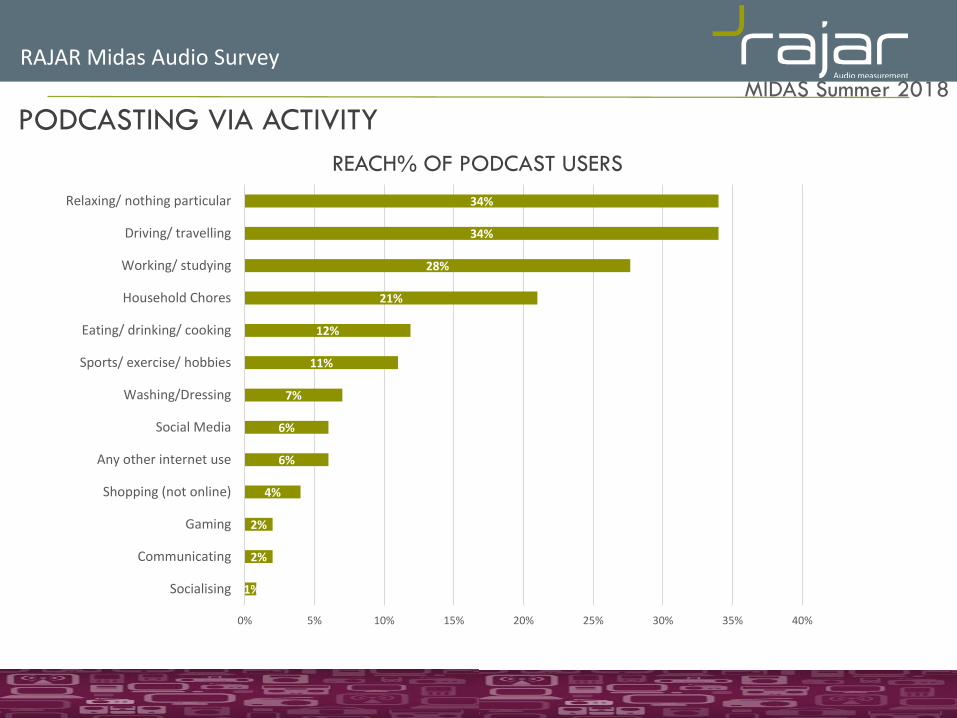
www.rajar.co.uk
REACH% OF PODCAST USERS
PODCASTING VIA ACTIVITY
13
RAJAR Midas Audio Survey
1%
2%
2%
4%
6%
6%
7%
11%
12%
21%
28%
34%
34%
0% 5% 10% 15% 20% 25% 30% 35% 40%
Socialising
Communicating
Gaming
Shopping (not online)
Any other internet use
Social Media
Washing/Dressing
Sports/ exercise/ hobbies
Eating/ drinking/ cooking
Household Chores
Working/ studying
Driving/ travelling
Relaxing/ nothing particular
MIDAS Summer 2018

www.rajar.co.uk
PODCASTING
14
RAJAR Midas Audio Survey
SHARE%
LOCATION
10%
18%
5%
65%
1%
Digital Music Player Desktop/Laptop computer Tablet
Smartphone Voice Activated Speaker
DEVICE48
14
22
14
2
At Home
Car/ Van/ Lorry
Work/ Place of study
Public Transport/ walking
Elsewhere
MIDAS Summer 2018

www.rajar.co.uk
PODCASTING
15
RAJAR Midas Audio Survey
MIDAS Summer 2018
90
41 1 1
On my own
Partner/ spouse
Children (under 16)
Family member(s)
Colleagues
Friends
Other people you know
Other people you don't know
www.rajar.co.uk
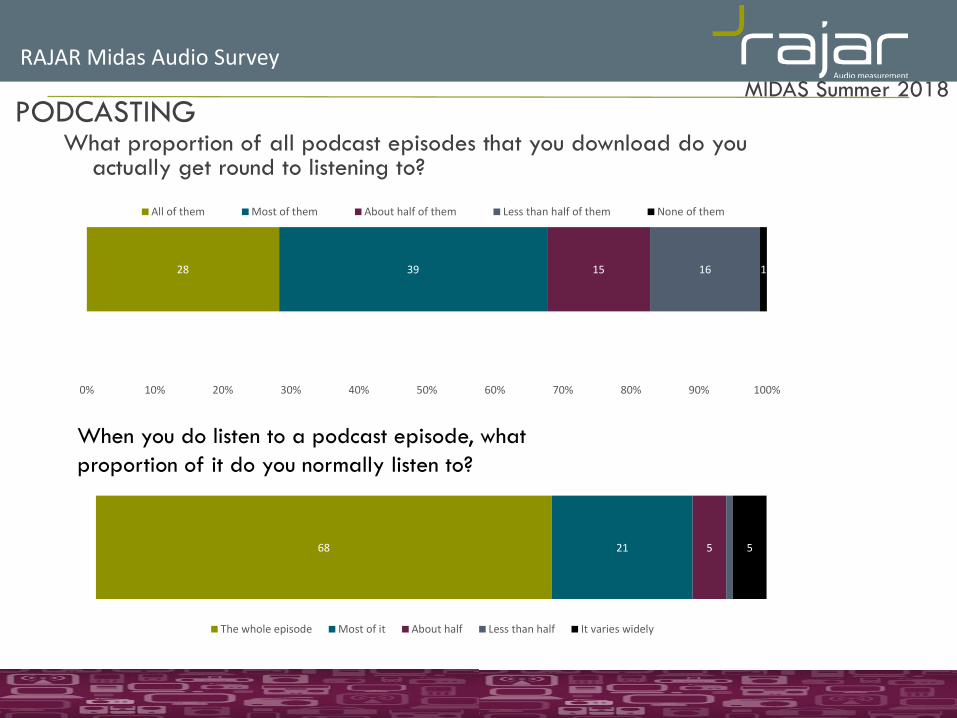
What proportion of all podcast episodes that you download do you actually get round to listening to?
16
RAJAR Midas Audio Survey
MIDAS Summer 2018
28 39 15 16 1
0% 10% 20% 30% 40% 50% 60% 70% 80% 90% 100%
All of them Most of them About half of them Less than half of them None of them
PODCASTING
68 21 5 5
The whole episode Most of it About half Less than half It varies widely
When you do listen to a podcast episode, what
proportion of it do you normally listen to?
www.rajar.co.uk
0.0
5.0
10.0
15.0
20.0
25.0
30.0
35.0
OMS Listen Again Podcasting Live Radio
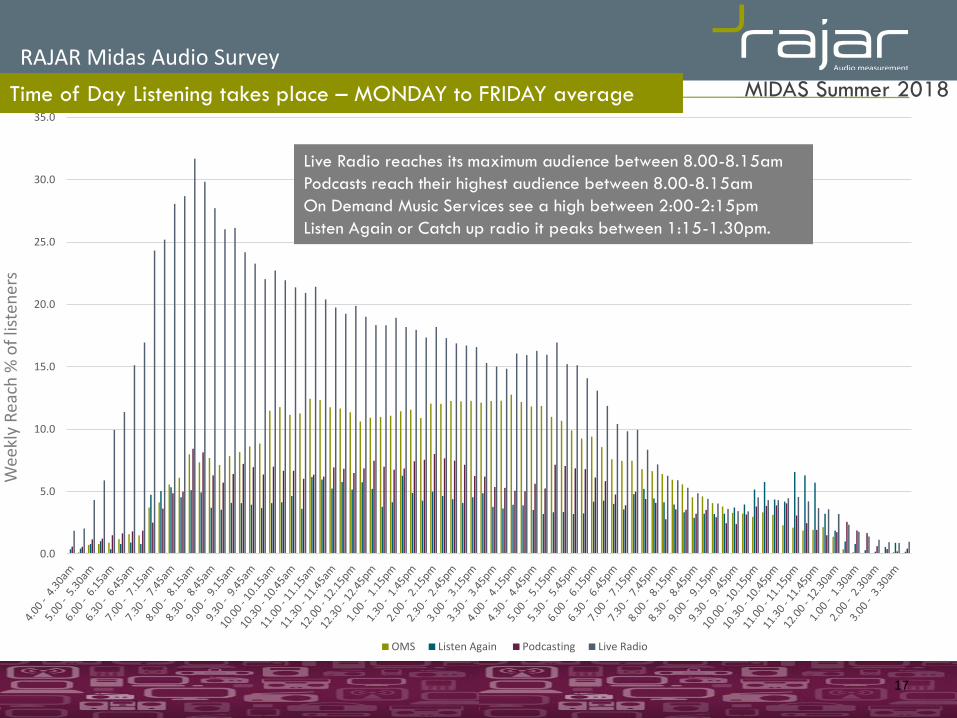
Time of Day Listening takes place – MONDAY to FRIDAY average
RAJAR Midas Audio Survey
17
Live Radio reaches its maximum audience between 8.00-8.15am
Podcasts reach their highest audience between 8.00-8.15am
On Demand Music Services see a high between 2:00-2:15pm
Listen Again or Catch up radio it peaks between 1:15-1.30pm.
Wee
kly
Rea
ch %
of
liste
ner
s
MIDAS Summer 2018

www.rajar.co.uk
MIDAS Measurement of Internet Delivered Audio Services
Sample comprised of 2181 re-contacted respondents from the main RAJAR Survey
Fieldwork was conducted during May 2018
Data Tables available for Audio Excluding Visual by Age Demographic on request.
For Publication Enquiries contact;
Lyndsay Ferrigan
RAJAR Communications Manager
Email: [email protected]
Telephone Number: 02073950636
For more information:
Any use of information in this presentation must
quote the source RAJAR/IpsosMori
18
MIDAS Summer 2018
Related Documents