1 ISAS Working Paper No. 66 – Date: 15 June 2009 469A Bukit Timah Road #07-01, Tower Block, Singapore 259770 Tel: 6516 6179 / 6516 4239 Fax: 6776 7505 / 6314 5447 Email: [email protected] Website: www.isas.nus.edu.sg Outward Foreign Direct Investment from India: Trends, Determinants and Implications 1 Ramkishen S. Rajan 2 1 This paper substantially builds upon Chapter 7 in R. S. Rajan (2009), Monetary, Trade and Investment Issues in India, Oxford University Press, forthcoming 2009 (see Hattari and Rajan, 2009c). 2 Ramkishen S. Rajan is a Visiting Senior Research Fellow at the Institute of South Asian Studies, an autonomous research institute at the National University of Singapore, and an Associate Professor at George Mason University, Virginia, United States. He can be contacted at [email protected] or [email protected]. Abstract While India has become an attractive destination for foreign capital, the country is also becoming a significant source of outflows. Many Indian enterprises view outward investments as an important dimension of their corporate strategies. The paper presents some data on the magnitude and composition of Indian outward foreign direct investment (FDI). It will also discuss the rationale for and the empirical determinants of overseas acquisitions by Indian companies. It will conclude with a broader discussion of the impact of the global rise of Indian companies on the Indian economy. 1. Introduction While FDI inflows into India remain below potential, they have increased markedly over the years (Figure 1). Despite this spurt of FDI into India, it does not seem to have been an especially large source of net external financing and reserve accumulation in India compared to portfolio or debt flows, at least until the fiscal year 2005-06. Indeed, India’s FDI inflows, as seen in the balance of payments account, are somewhat modest at a time when India is increasingly viewed as an attractive destination for foreign direct investors (Table 1). Part of the reason for this apparent paradox is that the balance of payments data is in net figures, that is, inflows minus outflows. While India continues to maintain controls on most types of capital outflows for prudential reasons (Mohan, 2008, Prasad, 2009 and Sy, 2007), it has been steadily liberalising overseas investments by Indian companies. Accordingly, while net FDI inflows have risen steadily in India since the initiation of reforms in 1991, gross outflows since 2000 have largely kept pace with gross FDI inflows (Table 2 and Figure 2). In other words, while India has become a far more attractive destination for FDI, the country is also becoming a significant source of outflows as many Indian enterprises view outward investments as an important dimension of their corporate strategies.

Rajan (2009) Outward Foreign Direct Investment From India
Oct 24, 2014
Welcome message from author
This document is posted to help you gain knowledge. Please leave a comment to let me know what you think about it! Share it to your friends and learn new things together.
Transcript

1
ISAS Working Paper No. 66 – Date: 15 June 2009 469A Bukit Timah Road #07-01, Tower Block, Singapore 259770 Tel: 6516 6179 / 6516 4239 Fax: 6776 7505 / 6314 5447 Email: [email protected] Website: www.isas.nus.edu.sg
Outward Foreign Direct Investment from India: Trends, Determinants and Implications1
Ramkishen S. Rajan
2
1 This paper substantially builds upon Chapter 7 in R. S. Rajan (2009), Monetary, Trade and Investment
Issues in India, Oxford University Press, forthcoming 2009 (see Hattari and Rajan, 2009c). 2 Ramkishen S. Rajan is a Visiting Senior Research Fellow at the Institute of South Asian Studies, an
autonomous research institute at the National University of Singapore, and an Associate Professor at George Mason University, Virginia, United States. He can be contacted at [email protected] or [email protected].
Abstract While India has become an attractive destination for foreign capital, the country is also becoming a significant source of outflows. Many Indian enterprises view outward investments as an important dimension of their corporate strategies. The paper presents some data on the magnitude and composition of Indian outward foreign direct investment (FDI). It will also discuss the rationale for and the empirical determinants of overseas acquisitions by Indian companies. It will conclude with a broader discussion of the impact of the global rise of Indian companies on the Indian economy.
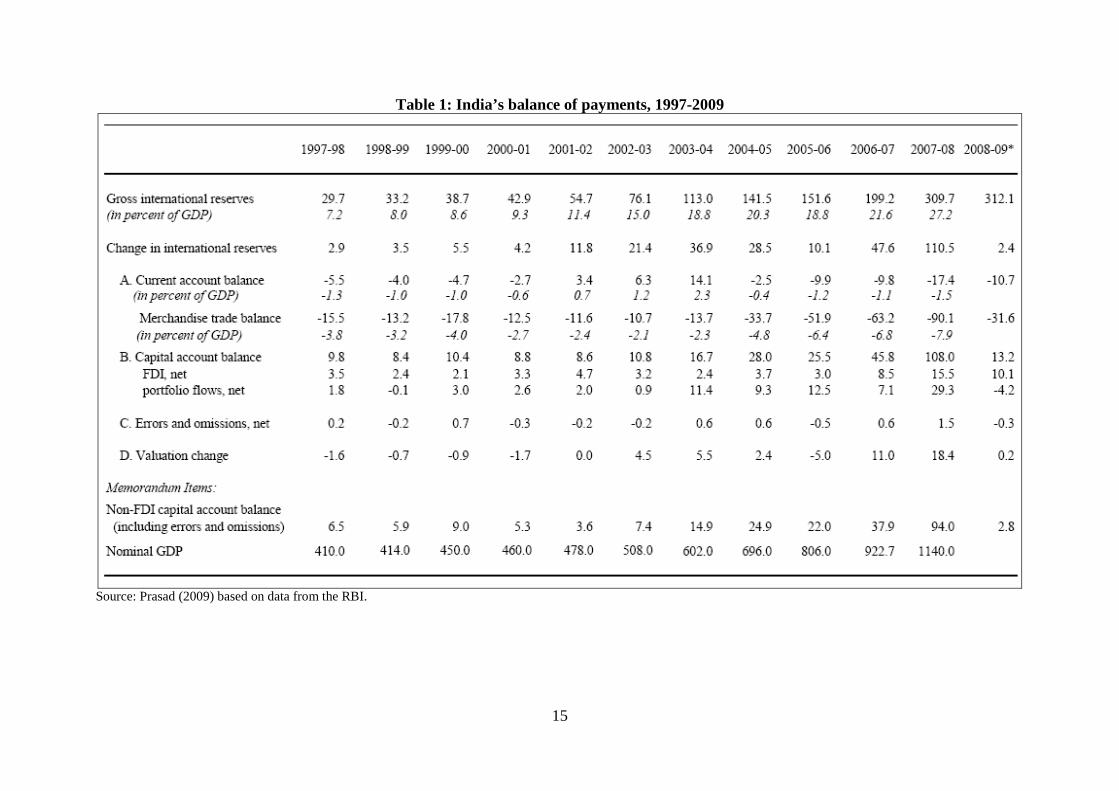
1. Introduction While FDI inflows into India remain below potential, they have increased markedly over the years (Figure 1). Despite this spurt of FDI into India, it does not seem to have been an especially large source of net external financing and reserve accumulation in India compared to portfolio or debt flows, at least until the fiscal year 2005-06. Indeed, India’s FDI inflows, as seen in the balance of payments account, are somewhat modest at a time when India is increasingly viewed as an attractive destination for foreign direct investors (Table 1). Part of the reason for this apparent paradox is that the balance of payments data is in net figures, that is, inflows minus outflows. While India continues to maintain controls on most types of capital outflows for prudential reasons (Mohan, 2008, Prasad, 2009 and Sy, 2007), it has been steadily liberalising overseas investments by Indian companies. Accordingly, while net FDI inflows have risen steadily in India since the initiation of reforms in 1991, gross outflows since 2000 have largely kept pace with gross FDI inflows (Table 2 and Figure 2). In other words, while India has become a far more attractive destination for FDI, the country is also becoming a significant source of outflows as many Indian enterprises view outward investments as an important dimension of their corporate strategies.

2
The phenomenon of FDI flows from developing economies, particularly those arising from multinational corporations (MNCs) from India and China, has generated significant interest in policymaking circles, academia and the popular press in recent times. Of the top 100 MNCs from developing economies that have the potential to become global players, 65 are from mainland China and India (BCG, 2006).3
In view of the fact that capital outflows from India on a structural basis have been largely – though not solely – in the form of FDI, that is the focus of attention of this paper.
Given this and a similar trend among major Indian players, it is clear that outward investments by these Asian giants are set to rise further. While China Inc.’s internationalisation thrust has hitherto been more top-down, India Inc.’s approach has been more decentralised and calibrated, a reflection of their differing political systems and the overall development strategies of the two countries. Many Indian companies have been involved in outward ventures for far longer than their Chinese counterparts and have, over time, developed the requisite knowledge and acumen to deal with the complex issues relating to the managing of cross-border alliances. However, as India’s trade and FDI barriers have been gradually dismantled post 1991, the policies governing outward FDI (OFDI) from India have undergone significant liberalisation.
4 However, going forward, as India continues down its hitherto cautious and gradual but definite path towards greater capital account liberalisation (Mohan, 2008 and Prasad, 2009), one would expect to see increased gross capital outflows by Indian residents aiming to benefit from international diversification. Indian households already hold significant financial wealth and this wealth is expected to rise in view of favourable demographics (and the large working-age population).5
3 Twenty-one Indian companies and 44 Chinese companies are among the top 100 such multinationals. 4 We say structural basis, as India experienced a rapid outflow of portfolio and debt capital in 2008-09
following the global financial crisis. However, this was predominantly a reversal of foreign capital as opposed to outflows by Indian residents per se.
5 As a Deutschebank report (2005) has noted: The young structure of the Indian population means that a huge cohort will enter the working-years phase in the next decade or so…[T]his should bring about a sizeable increase in household savings. Taking the past five years as a point of reference, household savings could pick up to at least 30 percent of GDP by 2020 from the current level of 22.6 percent. Thus far, investments made by households have characteristically been conservative and poorly diversified. Of the household domestic savings in 2002, roughly 54 percent of the total went into physical assets, while the balance was invested in financial instruments. The lion’s share of the latter was accounted for by bank deposits, followed at a distance by government bonds. Investment in equities, either through direct ownership or via mutual fund purchases, was muted. However, recent trends indicate growing ownership – albeit at a gradual pace – of mutual funds by households, suggesting their willingness to venture into other asset classes that offer higher expected returns in the future. Given India’s relatively young population, a lower risk-aversion leading to increasing demand for non-traditional investment products is to be expected. Adding to that are a rising income level for this population group, and a defined-contribution pension reform in the making and the scope for expansion in investment services appears to be large going forward (p.11).
Accordingly, one might quite reasonably expect India to grow considerably as a source of capital to the United States and the rest of world over the medium and longer terms. Keeping the above caveat in mind, the remainder of this paper is organised as follows. Section 2 outlines some important FDI data definitions and caveats that are often overlooked. Section 3 highlights broad trends in OFDI from India. Section 4 discusses some rationale for OFDI from India in recent times. Section 5 complements the discussion by estimating a gravity model using annual bilateral data of OFDI for the period 2000 to 2005. Section 6 concludes the paper with a discussion of the impact of the global rise of Indian MNCs on the Indian economy more broadly.

3
2. Definitions and Data Caveats on FDI One is often confronted with a host of problems when analysing FDI data, especially in the case of developing economies. According to the International Monetary Fund (IMF) Balance of Payments Manual (5th Edition, 1993):
FDI refers to an investment made to acquire lasting interest in enterprises operating outside of the economy of the investor. Further, in cases of FDI, the investor’s purpose is to gain an effective voice in the management of the enterprise. The foreign entity or group of associated entities that makes the investment is termed the ‘direct investor’. The unincorporated or incorporated enterprise – a branch or subsidiary, respectively, in which direct investment is made – is referred to as a ‘direct investment enterprise’.6
At an operational level, FDI commonly has three broad characteristics. First, it refers to a source of external financing rather than net physical investment or real activity per se.
7 A priori it is unclear whether FDI overestimates or underestimates actual real economic activity as this requires a consideration of the impact of FDI on existing domestic investment, extent of technology transfer, employment creation, and the like. Second, as a matter of convention, FDI involves a 10-percent threshold value of ownership – so an acquisition of 9.9 percent is considered portfolio flows while anything over that is considered FDI.8
6 See
Third, FDI consists of both the initial transaction that creates (or liquidates) investments and subsequent transactions between the direct investor and the direct investment enterprises aimed at maintaining, expanding or reducing investments. More specifically, FDI is defined as consisting of three broad aspects, viz. new foreign equity flows (which are the foreign investor’s purchases of shares in an enterprise in a foreign country), intra-company debt transactions (which refer to short-term or long-term borrowing and lending of funds including debt securities and trade credits between the parent company and its affiliates) and reinvested earnings (which comprises the investor’s share of earnings not distributed as dividends by affiliates or remitted to the home country, but rather reinvested in the host country). Table 3 offers an indication of the various components of OFDI from India. New equity flows could either be in the form of mergers and acquisitions (M&A) of existing local enterprises or Greenfield investments (that is, establishment of new production facilities). While countries are increasingly following this definition of FDI, one of the data concerns is that an increasing share of FDI is in the form of M&A, and much of the data – which is compiled by commercial sources – does not necessarily adhere to the United Nations Conference on Trade and Development (UNCTAD)-IMF definition. More to the point, cross-border M&A data, as computed by Bloomberg, Capital IQ, Dealogic, Thomson Financial and others, does not follow the 10-percent equity threshold and, in fact, may not even be foreign capital in a balance of payments sense as it does not take into consideration the flow of funds (that is, funds may be primarily sources from the host country). Similarly, when looking at M&A between two countries, the source of funds may largely be from a third country, implying a lack of correspondence between FDI flows and M&A transactions.
http://www.unctad.org/Templates/Page.asp?intItemID=3146&lang=1 7 The impact of FDI on net capital flows is also uncertain, as greater FDI inflows could encourage portfolio
and bank flows, while, simultaneously, M&A inflows could lead to the previous local owners choosing to invest some of their returns overseas, leading to capital outflows.
8 Thus, is FDI, especially in the form of M&A necessarily so much more stable than portfolio flows?

4
Another important issue in examining OFDI data pertains to the country of origin. Low, Ramstetter and Yeung (1996) point out that there are two possible ways to account for OFDI. The first is by the “country of capital source” and the second is “by country of ownership” (pp. 2-3). The latter takes into consideration investments which are funnelled through offshore centres, as “it makes little sense to attribute such investments to the tax havens themselves” (Low, et al., 1996, p. 3). For instance, the British Virgin Islands has consistently been the second largest source of FDI into mainland China, surpassed only by Hong Kong, with the Cayman Islands and Western Samoa also among the top 10 in 2006.9 Similarly, investments from other sources may have been re-routed to India via Mauritius which has consistently been the top source of FDI to India, as much of the FDI to and from India and the rest of world has been routed via Mauritius which has low corporate tax and has signed a liberal Double Taxation Agreement with India. In this regard, the M&A data that is available is usually not distorted by these tax issues as the commercial entities tend to focus on ultimate ownership as opposed to flow of funds which may be routed via a shell company in a low-tax third country.10
Keeping the preceding caveats in mind, in what follows I make use of a combination of sources and definitions in order to get a complete picture of FDI inflows to and outflows from India. However, I mainly use the balance of payments data here (particularly in the empirical Section 5) because it is more reliable and easily available in a timely manner, though I also supplement it with other data where necessary.
11 Overall, in order to get a more complete understanding of outward investments by Indian corporates, I use multiple data sources, including UNCTAD, the Economist Intelligence Unit, official Indian government data (Ministry of Commerce and Industry, and the Reserve Bank of India [RBI]), and survey data. In addition, as a few private companies have been tracking M&A transactions globally (including Bloomberg and Thomson Financial), we draw on their data as well as on other secondary sources.12
9
3. What does the data tells us about Indian OFDI? Although Indian corporates have been investing overseas for decades, there has been a marked jump in such investments since the 1990s. As noted earlier, India’s outward push can be divided into the pre-1990 period and the post-liberalisation period. Pradhan (2008) rationalises the initial OFDI push by Indian firms as follows:
In pre-1990s period, there [were] mainly two push factors that led to Indian firms’ entry into foreign markets. They [were a] stagnant domestic market and policy restrictions on large firms’ growth. Large private-owned Indian firms that were desperate to grow found themselves in disadvantageous situation created by Indian policy regime like Monopolies and Restrictive Trade Practices Act, Foreign Exchange Regulation Act, licensing regulation and reservation policies for public-owned and small scale sector. Slow growing domestic market further added to the drive of these Indian firms to seek new markets in developing and developed countries (p.15).
http://www.uschina.org/info/forecast/2007/foreign-investment.html#table4. 10 Data on OFDI based on ownership are not easily available and are usually not timely. 11 See UNCTAD (2005), and Hattari and Rajan (2008a and 2009b) for discussion of FDI data, definitions and
limitations. 12 See Hattari and Rajan (2009b) for a more systematic analysis of M&A data definitions and trends.

5
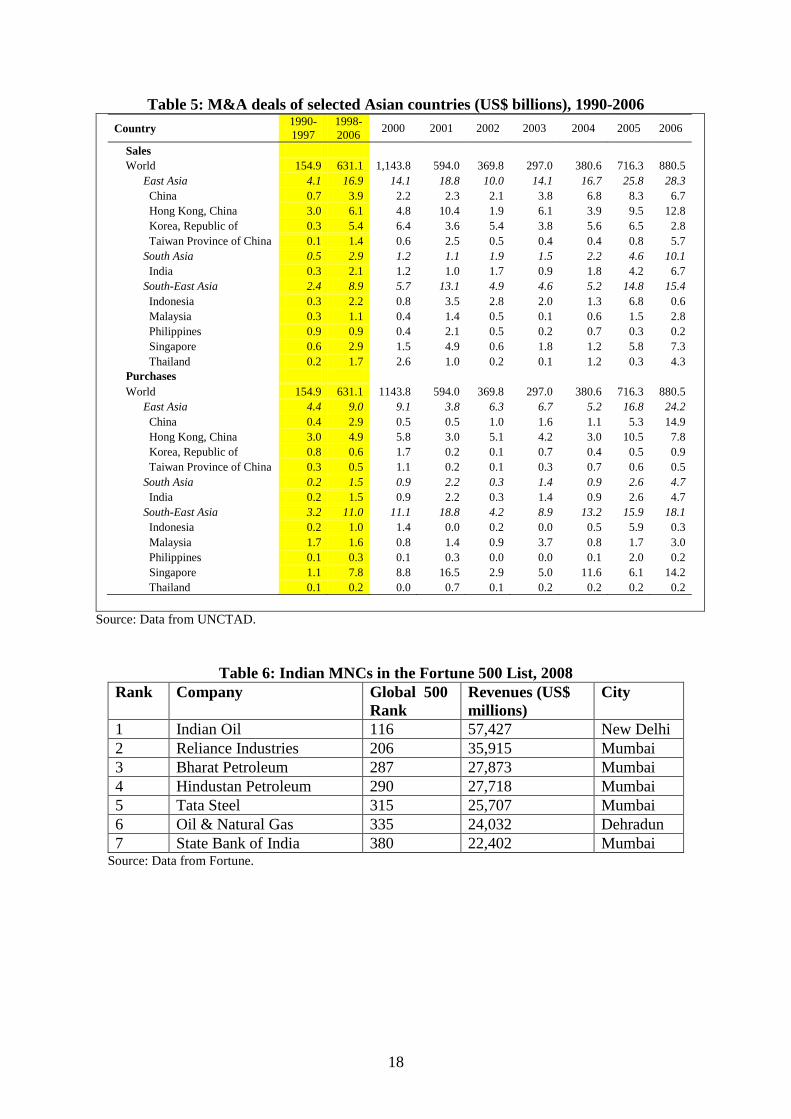
However, since the 1990s and particularly post-2000, India has been undergoing a second wave of OFDI. While the bulk of India’s OFDI in the first wave was concentrated in developing countries in Africa and Asia, contemporary OFDI flows from Indian firms have been directed more towards developed countries (Pradhan, 2005 and 2007, and Figure 3). As Table 4a makes apparent, between 2001 and 2005, the United States, Russia, Sudan, Australia, the United Kingdom and Singapore stand out as favoured destinations for Indian companies. The most recent data for April-December 2008 shows a broadly similar concentration of Indian OFDI in the United States and the United Kingdom (about one quarter of all Indian OFDI). Interestingly, a little over half of OFDI from India have been channelled to small countries such as Singapore, the Netherlands and Mauritius in particular (as well as the British Virgin Islands, which is not shown in Table 4b). As discussed above, the bulk of these investments are ultimately destined for third countries. In addition, firms sometimes use their overseas subsidiaries to finance new purchases. For instance, Tata Steel financed the Corus acquisition (see Section 4.1 below) partly via a debt arranged by a consortium of banks at Tata Steel United Kingdom as well as in the form of bridge finance by its subsidiary Tata Steel Asia Singapore. To this end, we need to examine M&A data which, as noted, is usually based on ownership as opposed to flow of funds. In fact, the focus of the second wave of Indian OFDI appears to have shifted to overseas acquisitions globally as a mode of foreign market entry and inorganic growth for Indian companies as opposed to Greenfield investments. Cross-border M&A sales and purchases involving developing Asia grew almost eight-fold from around US$7 billion in 1990 to US$54 billion in 2006 (Table 5). As is evident, apart from China and Hong Kong which dominate deals in Asia (some of which are round-tripping) as well as Singapore (which is a regional financial centre), India, Taiwan and Korea are major acquirers of overseas investments. The data also reveals a jump in India’s purchases in 2006 onwards (Figure 4). Figure 5 provides a geographical distribution of the number of Indian M&A overseas during the period 1995-2006. As can be seen, Indian acquisitions have been divided fairly uniformly across Europe (particularly the United Kingdom), North America (the United States) and Asia.13
While India may be best known in the United States and elsewhere for its software companies and the “new economy”, the second wave of OFDI has actually been quite broad-based and has included a number of manufacturing firms (Figures 6a and 6b). The manufacturing sector in India has had to face many obstacles over the years. Much ink has already been spilt on how bad the infrastructure in India is, as well as on the bureaucratic red tape and corruption that exists, (see Rajan, 2009, Chapter 6). However, these obstacles notwithstanding, once the process of relaxation of controls began in 1991, Indian industry started galloping forward and has not looked back since. The years of surviving under heavy bureaucratic controls and severely restrictive business conditions (the so-called “License Raj”) have made many Indian businesses especially versatile and the introduction of foreign competition in India since the early 1990s has only helped to enhance the robustness of Indian industry. After a period of consolidation and the strengthening of balance sheets, the
While the data between FDI and M&A is not directly comparable for all the reasons discussed previously, it is instructive to note that a much greater share of Indian M&A activity is targetted at Europe and North America (largely the United States), suggesting that some of the flows to the business and financial centres from India are ultimately destined there.
13 Indian companies have invested in 75 projects in various sectors in the United Kingdom during 2007-08,
making India the second largest investor in the United Kingdom.

6
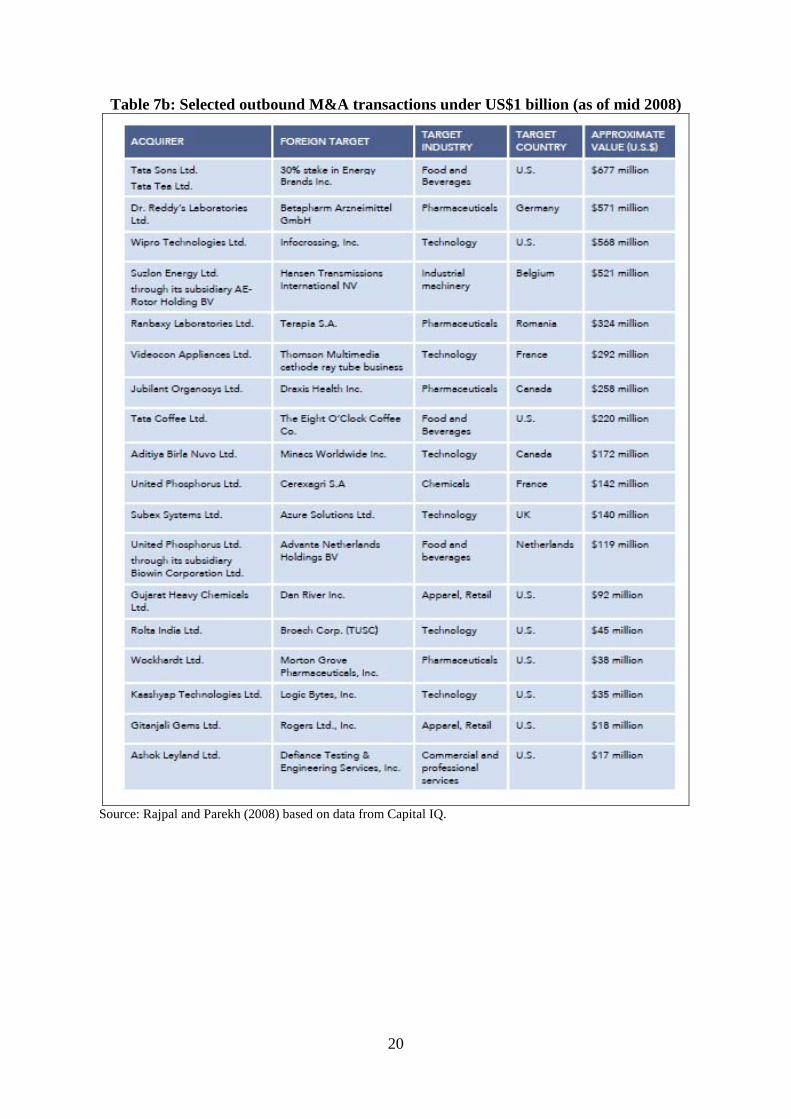
Indian manufacturing sector has been growing at a very healthy rate in the last half decade (see Rajan, 2009, Chapter 6). This has given rise to a new confidence among Indian corporates and, with rapid growth and ample cash, many of them have been making overseas acquisitions quite aggressively, especially since 2004. The spurt in India Inc.’s overseas acquisitions has propelled many Indian companies into the list of Fortune 500 companies on the basis of their global revenues (Table 6). Four of these companies are in the oil and gas industry, two in manufacturing and one in financial services. Tables 7a and 7b summarise some of the top mega and mid-sized deals by Indian corporates. While Indian conglomerates have been involved in mega deals, many medium-sized enterprises have also been undertaking overseas acquisitions in the so-called “mid-market”. 4. Motives behind India’s OFDI: Qualitative Discussion As noted, while Indian companies used to invest overseas even before 1991, when India was relatively closed, over 80 percent of Indian OFDI was concentrated in other developing countries and was Greenfield in nature (Pradhan, 2008). Since 1991, however, as India’s trade and FDI barriers have been gradually dismantled, the policies governing OFDI from India have undergone significant liberalisation. As noted by Kumar (2008):
The Guidelines for Indian Joint Ventures and Wholly Owned Subsidiaries Abroad, as amended in October 1992, May 1999 and July 2002, provided for automatic approval of OFDI proposals up to a certain limit. This limit was expanded progressively from US$2 million in 1992 to US$100 million in July 2002. In January 2004 the limit was removed altogether and Indian enterprises are now permitted to invest abroad up to 100 percent of their net worth on an automatic basis.
In the last few years, the RBI has adopted a number of overseas investment norms for outward FDI, including raising the overseas investment limit from 300 percent of the net worth to 400 percent of the Indian company under the Automatic Route. Indian companies have been allowed to invest in energy and natural resources sectors (oil, gas, coal and mineral ores) in excess of the current limits with the prior approval of the RBI. In addition, listed Indian companies have been permitted to undertake portfolio investment abroad up to 50 percent of the net worth. What have the strategic drivers behind the internationalisation thrust of Indian corporates been in recent times? The motivations for overseas acquisitions are, in fact, multidimensional in nature, and they include: a) Resource-seeking: This refers to a desire to ensure that a stable and secure supply of
resources is available to fuel the country’s energy-intensive growth. This has been the primary motivation behind overseas acquisitions by Oil & Natural Gas’s and Gas Authority of India Ltd’s oil-related equity abroad, the overseas acquisitions by India’s Suzlon Energy Limited, the world’s fifth largest wind turbine manufacturer, and Hindalco’s acquisition of copper mines in Australia and the Atlanta-based Novelis, making it the world’s largest aluminium rolling company.14
14 For a summary of Indian overseas resource acquisitions, see
http://www.thehindubusinessline.com/cgi-bin/bl.pl?subclass=348. Indian and Chinese oil firms have also begun collaborating on overseas resource acquisitions to reduce head-to-head competition.
7
b) Technology and Research & Development (R&D)-seeking: This refers to an aspiration by Indian companies to buy technology, processes, management know-how and marketing and distribution networks. This is particularly important for Indian pharmaceutical companies that are looking to expand their R&D base. Table 8 highlights some of the main acquisitions by Indian pharmaceutical companies in Europe.
c) Brand name and expanding product mixes: Realising that the margins to be made are
in branding, Indian companies are attempting to acquire firms that have established and prestigious brands, for example, Tata Motors’ purchase of Jaguar and Ford.
d) Market-seeking: Indian companies are attempting to consolidate existing markets
and/or seek out new ones. Such market-seeking investments will grow in importance as Indian companies are beginning to face intense foreign competition at home and are looking to expand overseas market shares. This is partly the motivation behind the State Bank of India’s forays into Mauritius, Indonesia, and Kenya as the Indian banking sector is steadily being deregulated in response to both domestic and international competition. And, the desire to gain access to large developed-economy markets is likely to result in increasing investment activity by Indian firms to finance further and larger acquisitions abroad. This is particularly important for the nontradables sectors such as hospitality industries (for example, Tata group hotels) and education (for example, NIIT). Many software companies have been establishing facilities in developing countries like the United States (“reverse outsourcing”) in order to acquire domain knowledge of clients and seek out new business opportunities. Similarly, India’s pharmaceutical companies have been attempting to seek new unregulated markets for their generic drugs, while also looking to acquire facilities that already have regulatory clearance in regulated markets such as the United States and Western Europe.
e) Risk diversification-seeking: Many Indian software companies such as Infosys and
Wipro are setting up “disaster recovery” centres’ overseas (in China and the Philippines, for instance) in case of systems failures. Generally speaking, it is obvious that many Indian firms are attempting to globalise their businesses and sources of revenues as a means of reducing dependence on the Indian market and the domestic business cycle.
f) Efficiency-seeking: As trade barriers decline, firms are undertaking industrial
restructuring by creating regional production networks. Indian information-technology (IT) companies like Tata Consultancy Services (TCS) and Infosys are establishing major global sourcing bases in China. Similarly, Tata Motors’ acquisition of Daewoo Heavy Vehicles of Korea in 2005 has led to a regional production networking strategy whereby small and medium-sized vehicles are manufactured in Indian plants and sold through Daewoo outlets and brands, while, simultaneously, heavy trucks built at the Daewoo plant are sold by Tata outlets in India and other countries under the Tata brand name (Kumar, 2006).
4.1 A Note on the Tata Conglomerate The Tata group, the most respected corporate house in India, with interests in almost all areas of commerce, including consumer goods, chemicals, energy, services, engineering, materials
8
and IT systems and communications, has been aggressively involved in the acquisition game by leveraging the group’s assets so as to extend its global footprint. In the past few years alone, they have bought a number of companies worldwide, in addition to some notable acquisitions within India. One of their first big-ticket acquisitions was in February 2000, when Tata Tea acquired the United Kingdom-based tea company Tetley for US$407 million, becoming the world’s second largest tea company. Since then, there has been a slew of other acquisitions (see Table 9). There have been two particularly high-profile acquisitions by the Tata group. First, Tata Steel bought Corus, a much larger Anglo-Dutch steel-maker for US$12 billion. This is the largest ever acquisition by an Indian company to date, making Tata Steel the world’s fifth largest steel producer and has propelled Tata Steel into the Forbes 500 list of largest companies. Another member of the group, Tata motors, purchased the Jaguar and Land Rover brands from Ford for around US$2.3 billion. The financial crisis of 2008-09 has not stopped Tata’s overseas forays, with TCS purchasing Citigroup Global Services for US$505 million in October 2008.15
5. Empirical Determinants of OFDI from India
Overall, the Tata group owns and operates about 100 companies worldwide.
16
ijttjijtijjititijt XDISTGDPGDPFDI νλµβββββ +++++++= 43210 )ln()ln()ln()ln(
Having outlined the broad rationale for and trends in India’s outward investments, this section attempts to empirically pin down the determinants of such outflows by estimating a gravity model. The aim here is to develop a relatively parsimonious model which includes commonly-used determinants as well as to focus on specific bilateral variables. To this end, we choose a gravity-type framework which argues that market size and distance are important determinants in the choice of location of direct investment’s source countries. The model has been used in a host of papers with some variations (see Hattari and Rajan, 2008a and b, and references cited within). The basic gravity model is augmented with a selection of explainatory variables based on the discussion in Section 4 of this paper. The basic specification of our estimated model is outlined below:
(1) where: ijtFDI is the real FDI flow from source country (i) to host country (j) in time (t); itGDP and jtGDP are real GDPs in US$ for the source country (i) and the host country (j) in time (t);
ijDIST is the geographical distance between the host and source countries; ijtX is a sector of explainatory variables influencing FDI outflows; iη denotes the unobservable type of source country effects; tλ denotes unobservable time effects (we use year dummies); and ijtν is a nuisance term. The basic set of explainatory variables used are: bilateral real exchange rate of the source country with respect to the host country; R&D expenditure as a percentage of GDP in the host country, energy production in the host country, ratio of market capitalisation to GDP in the host country, and the ratio of total trade to GDP in the host country. The explanatory variables are interacted with an India dummy as the source country to examine if the motives for India’s FDI outflows differ from those from the rest of the world.17
15 This also illustrates the complexities of characterizing such transactions – while CGSL was owned by
Citigroup it is based in India. 16 This section draws heavily on Hattari and Rajan (2009c). 17 The empirical methodology is discussed in Hattari and Rajan (2008 a and b).

9
The coefficients of the real GDP of the source and destination countries ought to both be positive as they proxy for masses which are important in gravity models.18
The sample is based on a panel of annual data on 57 source countries and 57 host countries between 2000 and 2005 (Annex 1).
A destination country that has a large market tends to attract more FDI. The sign of the source country size is ambiguous a priori. While large real GDP indicates greater aggregate income and, therefore, higher ability to invest abroad, small real GDP implies limited market size and consequent desire by companies to expand their wings overseas to gain market share. The change in the real exchange rate should have a negative sign as a real exchange rate depreciation of the host country (that is, fall in the index) should raise FDI flows from the source country (due to the wealth effects). The sign on stock market capitalisation ratio to GDP in the host country is expected to be positive, signifying both higher levels of financial development and stronger/more attractive companies. The sign of the ratio of the R&D expenditure to GDP in the host country depends on the source country’s competitive advantage, but one would expect this to be positive, that is, technology and R&D-seeking investments. The sign for energy production in the host country should be positive, that is, resource-seeking investments. The sign for trade openess should also be positive, as a country that has a high level of trade openness is more likely to accept and receive FDI, especially export-oriented FDI.
19
Next, we interact the host country-specific variables with a dummy variable for India. The result is shown in Regression 2 of Table 10. As is apparent, the basic gravity model variables (that is, sizes and distance) remain highly robust across this specification. Beyond this there are three notable findings. First, the real exchange rate appears economically and statistically significant – a rise in the host country’s real exchange rate vis-à-vis the Indian Rupee reduces OFDI from India (that is, wealth effects). Second, there is some, albeit weak, evidence that Indian OFDI tends to be relatively more market-seeking and somewhat less R&D-seeking
The results are shown in Table 10. Referring to Regression 1, we find that the distance variable is statistically and economically significant. Greater distance between the host and source country tends to lower FDI flows (elasticity of 0.55). Despite all the hype about the “death of distance” and the “world being flat, cross-border economic transactions remain hampered by physical distance which may be proxying transaction costs, time zone differences and/or information gaps (Hattari and Rajan, 2008a and b, and 2009a). As expected, larger countries experience more FDI inflows, with the elasticity of size of the host country’s GDP being 0.24. Larger source country GDP also leads to greater FDI outflows. With regard to the explainatory variables, the result on bilateral real exchange rate is inconclusive but this is not altogether surprising, as noted previously. Source countries tend to directly invest in host countries with higher R&D spending (as a share of GDP). Countries are also more likely to directly invest in natural resource abundant host countries. Countries are also more likely to directly invest in host countries where stock market capitalisation is higher (or, more generally, a country that is more financially developed).
18 In physics, the law of gravity states that the force of gravity between two objects is proportional to the
product of the masses of the two objects divided by the square of the distance between them. Most gravity models in bilateral trade and FDI have replaced the force of gravity with the value of bilateral trade or direct investments and the masses with the source and destination countries’ GDP.
19 The sources and definitions of data are available in Hattari and Rajan (2008a, b and c).

10
than OFDI from other countries in the sample. Third, Indian firms appear to be as resource-seeking as their counterparts from other countries.20
While the first wave of Indian OFDI pre-liberalisation was made by a handful of firms and concentrated largely on Asian and African developing countries, the second wave of Indian OFDI post-liberalisation, especially since 2000, has been to developed countries primarily in the form of M&A as opposed to Greenfield establishments with participation by many Indian firms. While the ongoing global financial and economic crisis may slow the pace of India’s overseas forays, Indian businesses, which have steadily strengthened their balance sheets are relatively better placed than their counterparts from other countries as they are relatively more cash-rich and will be able to benefit from the sharp decline in asset prices worldwide. For instance, the proposed US$29 billion acquisition by India’s Bharti Airtel for a 49 percent stake in Mobile Telephone Networks of South Africa will be amongst the largest deals in 2009 if it eventuates, and the largest by an Indian company, surpassing the Tata-Corus deal.
6. Summary and Implications of the Rise of India’s MNCs Recently, OFDI by Indian MNCs have been aimed at accessing high-growth markets, buying brand names, acquiring technology, processes, management know-how and marketing and distribution networks, and consolidating existing markets as well as seeking new ones. Building scale to enhance global competitiveness has been the mantra followed by many Indian firms. Their outward push has been facilitated by policy reforms; the Indian government has taken a much more positive attitude towards this internationalised trend and liberalised foreign exchange policies, foreign ownership ceilings, access to international capital markets, and other rules and regulations – all with the aim of promoting outward investments.
21
While the success rates of these cross-border deals remains to be seen, does this phenomenon of OFDI from India have broader implications for the rest of India? From a macroeconomic perspective, some have argued that OFDI from a developing economy such as India should not be actively promoted as it reduces the net external financing for domestic investment and thus for domestic GDP. This concern takes on added significance during a period of acute global risk aversion and sharp capital withdrawals from India and other emerging economies. However, such an analysis misses the other economic benefits of outward acquisitions. An Indian company that invests overseas may help generate positive linkages to the rest of the economy both by using Indian factors of production (management, construction, IT, etc.) while also bringing back to India new technologies, brand names, export markets and the like. All of this should have positive spillovers on India’s GDP.
22
20 Kumar (2008) examines Indian OFDI using data based on Indian investments overseas and using a more
limited ownership-based firm-level data set (Research and Information System for Developing Countries database on Outward Investments of Indian Enterprises). He finds that firm size “exerts a positive but a non-linear effect” and that “enterprises that are already engaged in exporting are more likely to be outward investors”.
21 See Kumar, Mohapatra and Chandrasekhar (2009) for selected case-studies of India’s overseas acquisitions. 22 Exactly how India’s OFDI impact the country’s output and employment is an under-researched subject.
Similarly, more OFDI by Indian corporates could encourage greater levels of foreign investments into India, too, as there is greater awareness and appreciation of India’s potential and inherent strengths. In addition, insofar as Indian firms overseas repatriate part of their profits or dividends back to the home country, India’s gross national product (which is more relevant to national income)

11
will rise, even if its GDP does not.23
At an even broader level, the Chinese have clearly used their outward investments in developing economies to enhance their foreign policy objectives (as outlined by Kurlantzick, 2008). They have been able to wield this “soft power” very effectively as the investments have generally been driven by state-owned enterprises. As against this, with the exceptions of the energy sector, India’s OFDI has been driven largely by private initiative, with little coordination with the government.
In India’s case, in April to December 2007, these factor incomes from OFDI were about US$337 million or roughly 0.4 percent of total capital inflows during that period (RBI, 2008).
24
- “India’s rise as a manufacturing giant” in the British Broadcasting Corporation on 13 February 2007.
As noted by Pal (2008) regarding Chinese and Indian OFDI to Africa:
Chinese policies are more coordinated and the state plays a much more proactive role in OFDI. In fact, in their quest for secure supplies of energy and raw materials, Chinese economic policies are complemented by parallel and sustained Chinese diplomatic efforts in the African countries. These, coupled with the fact that China has become quite generous in giving aid and ODA to Africa, indicate that China has managed to formulate a long-term and more comprehensive policy about OFDI in Africa. On the other hand, Indian initiatives to gain confidence of the African governments are largely driven by private companies themselves (p. 9).
Indeed, in some sense, India’s first wave of liberalisation, which was aimed more at “assisting partners from the South”, and enhancing South-South cooperation and the Non-Aligned movement, was arguably more obviously aimed at using its soft power in the conventional sense. In contrast, FDI in the post-liberalisation period is, as noted, targetted at buying existing firms in developed countries for various strategic and competitiveness considerations. However, India’s OFDI has certainly boosted India’s image abroad – as a country of dynamic, highly educated, top-class managers, scientists and engineers. While the Indian press has been quick to cheer-lead India’s Inc.’s overseas forays, they certainly have not gone unnoticed by the world. As just a few examples of this:
- “India takes on the world” in Time Magazine on 20 November 2006. - “Corporate India is finding confidence to go global” in Financial Times on 4 October
2006. - “India’s mini multinationals make waves in Western markets” in the International
Herald Tribune on 2 September 2005. - “India Inc goes global” in the Asia Times on 25 November 2005. In addition, India’s OFDI by the Tata group of companies and other conglomerates in the manufacturing sector has led to a growing awareness that the Indian growth story is much more broad-based and not just limited to services. High profile acquisitions of iconic global brand names in developed countries (Corus Steel, Jaguar and Land Rover by Tata) have no doubt also helped raise the global image of India Inc. as well as of India itself more 23 Thus, in the case of the United States, its factor income balance has generally been positive despite the
country being a persistent net debtor. 24 While Indian private sector firms are most active in overseas purchases, Indian public sector banks and oil
companies have also been active in overseas acquisitions.

12
broadly.25
www.ibef.org
In addition, many Indian conglomerates are also undertaking – through their own initiatives – social/charitable programmes in some developing countries in Africa to further enhance their image, with positive spillovers to India’s image overseas as well. The creation of the public-private partnership called the India Brand Equity Foundation ( ) is clearly aimed at fortifying India Inc.’s positive global image and, in the process, helping to project and enhance India’s soft power as well.
oooOOOoo References Accenture (2005). “China Spreads its Wings – Chinese Companies go Global,” Accenture. Accenture (2006). “India Goes Global: How Cross-border Acquisitions are Powering Growth,” Accenture. Banga, R. (2007). “Explaining Asian Outward FDI,” presentation at UNCTAD-India ARTNeT Consultative Meeting on Trade and Investment Policy Coordination, 16 –17 July 2007, Bangkok. Boston, Consulting Group (BCG) (2006). The New Global Challengers: How 100 Companies from Rapidly Developing Economies are Changing the World, The Boston Consulting Group, May. Deutsche Bank (2005). “India Rising: A Medium-term Perspective,” 19 May. Government of India (GOI) (2006). “Foreign Direct Investment Policy,” Ministry of Commerce and Industry, Department of Industrial Policy and Promotion. Government of India (GOI) (2007). “FDI Statistics,” Ministry of Commerce & Industry, Department of Industrial Policy and Promotion. Gupta, S. (2007). “Mergers and Acquisitions in First Quarter 2007-08,” Assocham Eco Pulse, July. Hattari, R. and R. S. Rajan (2008a). “Trends and Drivers of Bilateral FDI Flows in Developing Asia,” Working Paper No.11/2007, Hong Kong Institute for Monetary Research (HKIMR). Hattari, R. and R. S. Rajan (2008b). “Sources and Determinants of FDI Flows to Developing Asia: The Importance of Time Zone,” Discussion Paper, Asian Development Bank Institute (ADBI), Tokyo. Hattari, R. and R. S Rajan (2009a). “What Explains Intra-Asian FDI Flows: Do distance and Trade Matter?” Economic Bulletin, 29, pp.122-128.
25 Conversely, episodes like the Satyam Computers’ scandal tarnish India Inc.’s global image and raise
important questions about the quality of corporate governance.

13
Hattari, R. and R. S. Rajan (2009b). “Determinants of Cross-border M&A Activities in Developing Asia: The Role of Financial Variables,” mimeo, April. Hattari, R. And R. S. Rajan (2009c). “What Drives India’s Outward Investments?,” in R.S. Rajan, Monetary, Trade and Investment Issues in India, Oxford University Press, forthcoming, chapter 7. Kurlantzick, J. (2008). “China’s Expanding Global Influence,” testimony before the U.S.-China Economic and Security Review Commission, 18 March. Kumar, N. (2006). “Regional Economic Integration, Foreign Direct Investment, and Efficiency-Seeking Industrial Restructuring in Asia: The Case of India,” Discussion Paper No. 123, Research and Information System for Developing Countries, Delhi. Kumar, N. (2008). “Emerging MNCs: Trends, Patterns, and Determinants of Outward FDI by Indian Enterprises,” in R. S. Rajan, R. Kumar and N. Virgill (eds.), New Dimensions of Economic Globalization: Surge of Outward FDI from Asia, World Scientific Press. Kumar, N., P. K. Mohapatra and S. Chandrasekar (2009). The Emergence of India’s Global Powerhouses, Harvard University Press. Low, L., E. D. Ramstetter and H. W. C. Yeung (1996). “Accounting for Outward Direct Investment from Hong Kong and Singapore: Who Controls What?” Working Paper No. 5858, NBER. Macquarie Research Economics (2008). “India Desperate for Foreign Capital,” Macro Mantra, 1 October. Milelli, C. (2006). “International Expansion by Indian Firms: What of European Market Entry?” Maison des Sciences de l’Homme, Paris, September. Mohan, R. (2008). “Capital Flows to India,” in Financial Globalization and Emerging Market Capital Flows, Bank for International Settlements, December. pp. 243-263. Pal, P. (2008). “Surge in Indian Outbound FDI to Africa: An Emerging Pattern in Globalization?” mimeo. Pradhan, J. P. (2005). “Outward Foreign Direct Investment from India: Recent Trends and Patterns,” Gujarat Institute of Development Research, India. Pradhan, J. P. (2007). “Growth of Indian Multinationals in the World Economy: Implications for Development,” Working Paper No. 2007/04. Institute for Studies in Industrial Development, New Delhi, India. Pradhan, J. P. (2008). “Indian Direct Investment in Developing Countries: Emerging Trends and Development Impacts,” MPRA Paper No. 12323, University Library of Munich, Germany.
14
Prasad, E. (2009). “Some New Perspectives on India’s Approach to Capital Account Liberalization,” Brookings India Policy Forum, forthcoming. Rajan, R. S. (2009). Monetary, Trade and Investment Issues in India, Oxford University Press, forthcoming. Rajan, R. S., R. Kumar and N. Virgill (2008). New Dimensions of Economic Globalization: Surge of Outward FDI from Asia, World Scientific Press. Rajpal, D. and S. Parekh (2008). “India Looks Outward: Cross-Border M&A by Indian Corporations – Canadian Considerations,” Stikeman, October. Reserve Bank of India (RBI) (2008). Monthly Bulletin, April. Mumbai. Reserve Bank of India (RBI) (2008). Monthly Bulletin, various issues, Mumbai. Sauvant, K.P. (2005), “New Sources of FDI: The BRICs,” The Journal of World Investment and Trade, 6, pp. 639-711. Sy, A. N. R. (2007). “Capital Account Convertibility and Risk Management in India,” Working Paper No WP/07/251, IMF. UNCTAD (2005). FDI Statistics: Data Compilation and Policy Issues,” www.unctad.org/en/docs/c2em18d2_en.pdf UNCTAD (2006). World Investment Report 2006, UN: New York and Geneva.
15
Table 1: India’s balance of payments, 1997-2009
Source: Prasad (2009) based on data from the RBI.

16
Table 2: Capital inflows to and inflows from India, 1995-2008
Source: Prasad (2009) based on data from the RBI.

17
Table 3: India’s outward FDI: Actual outflows (US$ millions), 2003-2008 Periods (April-March)
Equity Loans Total
2003-04 1234.25 260.93 1495.18 2004-05 1365.59 402.79 1768.38 2005-06 3858.46 1008.10 4869.561 2006-07 11599.01 1281.07 12880.08 2007-082 14200 3200 17400
Note: 1) Includes Guarantee invoked. 2) Estimated. Source: Data from the RBI.
Table 4a: Direction of India’s outward FDI (percent share):
countries receiving at least five percent, 1996-2005
Source: Banga (2007) based on data from the RBI.
Table 4b: Direction of India’s outward FDI (percent share) countries receiving at least five percent, April to December 2008
Source: Data from the RBI.
Country 1996-2001 2001-2005 Australia 0.1 6.7 British Virgin Islands 10.3 2.3 Hong Kong 5.9 1.9 Mauritius 8.2 7.7 Russia 23.2 16.2 Singapore 2.0 5.0 Sudan 0.0 15.2 United Kingdom 5.4 5.5 United States 20.4 11.7
Country April-December 2008 Mauritius 10.4 Netherlands 20.6 Singapore 18.9 United Kingdom 14.5 United States 13.2
18
Table 5: M&A deals of selected Asian countries (US$ billions), 1990-2006
Country 1990-1997
1998-2006 2000 2001 2002 2003 2004 2005 2006
Sales World 154.9 631.1 1,143.8 594.0 369.8 297.0 380.6 716.3 880.5 East Asia 4.1 16.9 14.1 18.8 10.0 14.1 16.7 25.8 28.3 China 0.7 3.9 2.2 2.3 2.1 3.8 6.8 8.3 6.7 Hong Kong, China 3.0 6.1 4.8 10.4 1.9 6.1 3.9 9.5 12.8 Korea, Republic of 0.3 5.4 6.4 3.6 5.4 3.8 5.6 6.5 2.8 Taiwan Province of China 0.1 1.4 0.6 2.5 0.5 0.4 0.4 0.8 5.7 South Asia 0.5 2.9 1.2 1.1 1.9 1.5 2.2 4.6 10.1 India 0.3 2.1 1.2 1.0 1.7 0.9 1.8 4.2 6.7 South-East Asia 2.4 8.9 5.7 13.1 4.9 4.6 5.2 14.8 15.4 Indonesia 0.3 2.2 0.8 3.5 2.8 2.0 1.3 6.8 0.6 Malaysia 0.3 1.1 0.4 1.4 0.5 0.1 0.6 1.5 2.8 Philippines 0.9 0.9 0.4 2.1 0.5 0.2 0.7 0.3 0.2 Singapore 0.6 2.9 1.5 4.9 0.6 1.8 1.2 5.8 7.3 Thailand 0.2 1.7 2.6 1.0 0.2 0.1 1.2 0.3 4.3 Purchases World 154.9 631.1 1143.8 594.0 369.8 297.0 380.6 716.3 880.5 East Asia 4.4 9.0 9.1 3.8 6.3 6.7 5.2 16.8 24.2 China 0.4 2.9 0.5 0.5 1.0 1.6 1.1 5.3 14.9 Hong Kong, China 3.0 4.9 5.8 3.0 5.1 4.2 3.0 10.5 7.8 Korea, Republic of 0.8 0.6 1.7 0.2 0.1 0.7 0.4 0.5 0.9 Taiwan Province of China 0.3 0.5 1.1 0.2 0.1 0.3 0.7 0.6 0.5 South Asia 0.2 1.5 0.9 2.2 0.3 1.4 0.9 2.6 4.7 India 0.2 1.5 0.9 2.2 0.3 1.4 0.9 2.6 4.7 South-East Asia 3.2 11.0 11.1 18.8 4.2 8.9 13.2 15.9 18.1 Indonesia 0.2 1.0 1.4 0.0 0.2 0.0 0.5 5.9 0.3 Malaysia 1.7 1.6 0.8 1.4 0.9 3.7 0.8 1.7 3.0 Philippines 0.1 0.3 0.1 0.3 0.0 0.0 0.1 2.0 0.2 Singapore 1.1 7.8 8.8 16.5 2.9 5.0 11.6 6.1 14.2 Thailand 0.1 0.2 0.0 0.7 0.1 0.2 0.2 0.2 0.2
Source: Data from UNCTAD.
Table 6: Indian MNCs in the Fortune 500 List, 2008 Rank Company Global 500
Rank Revenues (US$ millions)
City
1 Indian Oil 116 57,427 New Delhi 2 Reliance Industries 206 35,915 Mumbai 3 Bharat Petroleum 287 27,873 Mumbai 4 Hindustan Petroleum 290 27,718 Mumbai 5 Tata Steel 315 25,707 Mumbai 6 Oil & Natural Gas 335 24,032 Dehradun 7 State Bank of India 380 22,402 Mumbai
Source: Data from Fortune.

19
Table 7a: Selected outbound M&A transactions of over US$1 billion (as of mid 2008)
Source: Rajpal and Parekh (2008) based on data from Capital IQ.
20
Table 7b: Selected outbound M&A transactions under US$1 billion (as of mid 2008)
Source: Rajpal and Parekh (2008) based on data from Capital IQ.

21
Table 8: Acquisitions of European pharmaceutical companies by Indian firms
Source: Milelli (2006) based on data from Thomson Financial.

22
Table 9: Tata’s overseas acquisitions as of June 2008
Tata company Acquired company Country Stake acquired
Value Year
Indian Hotels Campton Place Hotel US $58 million April 2007
Starwood group (W Hotel)
Australia 100 per cent (wholly-owned)
$29 million December 2005
The Pierre US $9 million Lease of property
July 2005
Tata Autocomp Systems
Wündsch Weidinger Germany Euro7 million September 2005
Tata Chemicals General Chemical
Industrial Products US 100 per
cent stake January
2008
Brunner Mond UK 63.5 per cent
Rs508 crore December 2005
36.5 per cent
Rs290 crore
March 2006
Indo Maroc Phosphore SA (IMACID)
Morocco Equal partner
$38 million (Rs166 crore)
March 2005
Tata Coffee Eight O' Clock Coffee
Company US 100 per
cent (wholly-owned)
$220 million (Rs1015 crore)
June 2006
Tata
Communications (formerly VSNL)
China Enterprise Communications Limited (CEC)
China 50 per cent equity interest
June 2008
Transtel Telecoms (TT)
South Africa
$33 million April 2007
Teleglobe International US July 2005 Tyco Global Network US November
2004
Gemplex US July 2003
Tata Consultancy Services
Comicrom Chile November 2005
Pearl Group UK Structured deal
October 2005
Financial Network Services
Australia October 2005
Tata Industries Indigene
Pharmaceuticals Inc
US 30 per cent
Not disclosed July 2005
Tata Interactive Tertia Edusoft Gmbh Germany 90 per
cent Not disclosed January
2006
Tertia Edusoft AG Switzerland 90.38 per cent
Tata Motors Jaguar and Land Rover
brands UK $2.3 billion
(approximately) March 2008
Hispano Carrocera Spain 21 per Euro12 million February

23
Tata company Acquired company Country Stake acquired
Value Year
Tata Motors (cont’d)
Daewoo Commercial Vehicle Company
Korea 100 per cent (wholly-owned)
KRW120 billion ($102 million, Rs465 crore)
March 2004
Tata Power PT Kaltim Prima Coal and
PT Arutmin Indonesia Indonesia 30 per
cent equity stake
June 2007
Tata Steel Millenium Steel Thailand 67.11 per
cent $167 million (Baht6.5 billion)
April 2006
NatSteel Asia Singapore 100 per cent (wholly-owned)
S$468.10 million
February 2005
Corus UK 100 per cent
January 2007
Tata Tea and
Tata Sons Tetley group UK 100 per
cent (wholly-owned)
GBP271 million
February 2000
Tata Tea
through Tata Tea (GB)
Joekels Tea Packers South Africa
Africa 33.3 per cent
GBP0.91 million
September 2006
Tata Tea
through Tata Tea (GB)
JEMCA Czech Republic
Assets: intangible and tangible
GBP11.60 million
May 2006
Tata Tea
through Tata Tea (GB)
Good Earth Corporation & FMali Herb Inc
US 100 per cent (wholly-owned)
$31 million
October 2005
Tata Tea
through Tetley group
Vitax and Flosana trademarks
Poland April 2007
Tata Tech INCAT International UK August
2005
Telco
Construction Equipment Company (Telcon)
Hughes Telecom (India) Spain 79 per cent
March 2008
Comoplesa Lebrero SA Spain 60 per cent
March 2008
TRF York Transport Equipment
(Asia) Singapore 51 per
cent stake October
2007
Source: http://www.tata.com/htm/Group_MnA_CompanyWise.htm

24
Table 10: Gravity equation 1/ 2/ 3/ Dependent variable: Ln of bilateral real M&A deals
Regression type Two-stage Tobit
Two-stage Tobit
Source countries All All Ln(real GDP i) 0.238*** 0.239*** (0.051) (0.051) Ln(real GDP j) 0.571** 0.550** (0.258) (0.259) Ln distance -0.553*** -0.550*** (0.051) (0.052) Ln real exchange rate of source w.r.t. host -0.017 -0.013 (0.015) (0.015) Ratio of Research and Development Expenditure to GDP in j 0.105*** 0.107*** (0.032) (0.032) Ln of energy production in j 0.271*** 0.270*** (0.025) (0.026) Ratio of market capitalization of stock exchange to GDP in j 0.011*** 0.011*** (0.001) (0.001) Trade openness in j 0.001 0.001 (0.001) (0.001) India dummy -15.880** (7.212) Ln(real GDP j) * India dummy 2.002* (1.034) Ln real exchange rate of source w.r.t. host * India dummy -0.263*** (0.102) Ratio of Research and Development Expenditure to GDP in j * India dummy -0.399*
(0.237) Ln of energy production in j * India dummy -0.001 (0.175) Ratio of market capitalization of stock exchange to GDP in j * India dummy 0.009
(0.006) Trade openness in j * India dummy -0.007 (0.006) Obs. 4,677 4,677 Adj. R2 0.63 0.64
Notes: 1/ Robust standard error in parentheses. 2/ * significant at 10 percent; ** significant at 5 percent; *** significant at 1 percent. 3/ Year dummies, host/source country dummies, inverse Mills’ ratio, and constant are not shown. Source: Hattari and Rajan (2009c).

25
Annex 1: Sample countries Australia Italy Switzerland Ecuador Pakistan Sri Lanka
Austria Japan
United Kingdom Egypt Peru Taiwan
Belgium Korea United States Greece Philippines Thailand
Canada Mexico Argentina Hong Kong Poland Turkey
Denmark Netherlands Brazil India Romania Ukraine
Finland
New Zealand
Bulgaria
Indonesia
Russia
Venezuela
France Norway Chile Iran Saudi Arabia Vietnam
Germany Portugal China Israel Singapore Hungary
Spain
Colombia
Malaysia
Slovakia
Ireland Sweden Czech Republic Nigeria South Africa
Source: Hattari and Rajan (2009c).

26
Figure 1: Approved and actual OFDI projects, 1996-2007
Source: Pal (2008) based on data from the Indian Ministry of Finance.
Figure 2: India’s FDI inflows and outflows, 2001-2008 (of US$ billions)
Source: Macquarie Research (October 1, 2008) based on the RBI data.

27
Figure 3: Indian FDI in developed region, 1961-2007 (US$ million)
Source: Pradhan (2008) based on the RBI published reports of Indian investment centre and unpublished firm- level information from Ministry of Commerce.

28
Figure 4: Number of India’s cross-border M&A, 2003-2009
Source: The Economist (May 28, 2009) based on data from Dealogic.

29
Figure 5: Destination Share of India’s overseas M&As, 1995-2006 (Average)
Source: Accenture (2006) based on data from Thomson Financial.

30
Figure 6a: Sectoral Share of India’s overseas M&As, 1995-2006 (Average)
Source: Accenture (2006) based on data from Thomson Financial.
Figure 6b: Number of India’s overseas M&As, 1995-2006
Source: Accenture (2006) based on data from Thomson Financial.
Related Documents