1 Paper SAS641-2017 Raising the Bar: The Pending Section 508 Refresh and the ODS HTML5 Destination Glen R Walker, SAS Institute Inc. ABSTRACT The U.S. Access Board will soon “refresh” the Section 508 accessibility standards. The new requirements are based on the Web Content Accessibility Guidelines (WCAG) 2.0 and include a total of 38 testable success criteria – 16 more than the current requirements. Is your organization ready? Don’t worry…the fourth maintenance release for SAS® 9.4 ODS HTML5 destination has you covered. This paper describes the new accessibility features in the ODS HTML5 destination, explains how to use them, and shows you how to test your output for compliance with the new Section 508 standards. INTRODUCTION On January 18, 2017, the U.S. Access Board published a final rule updating accessibility requirements for information and communication technology (ICT) covered by Section 508 of the Rehabilitation Act. This update is called the “508 Refresh”. One of the main goals of the refresh was to incorporate the Web Content Accessibility Guidelines (WCAG) 2.0, Level AA. There’s an extensive discussion comparing Section 508 and WCAG 2.0 in last year’s SAS Global Forum paper, “A Guide to Section 508 Compliance Using SAS® 9.4 Output Delivery System (ODS)” in the Proceedings of the SAS Global Forum 2016 Conference. This year’s paper discusses features in the fourth maintenance release for SAS® 9.4 that help you make your reports accessible. As a refresher, consider if you generate output or reports for a large audience of users. Maybe you work for a government agency that is serving a local or regional population. Or you might work for an educational institution that posts reports for students. Or maybe you work for a large multi-national corporation. If your user-base is broad, then the user ability levels are probably broad too. Some users might have perfect vision. But others might have difficulty seeing small fonts or discerning between different colors. Still others might have mobility issues and can't use a mouse to navigate a report. Whatever the issue, what they all have in common is the need for equal access to your output. In the United States, almost 1 out of every 5 people have a disability (57 million people). Worldwide, it is about 1 out of 7 people. One billion people. Chances are good that someone that accesses your report will have some form of disability. Whatever your requirements might be (whether your output contains tables, graphs, or links), the HTML5 destination in the fourth maintenance release for SAS® 9.4 Output Delivery System (ODS) offers a tremendous number of built-in accessibility features that can help to increase the accessibility of your output. You have great information. Don't hide it from any of your users. Don't isolate any of your users by preventing access to your reports. By taking advantage of the following ODS features and by keeping in mind some basic accessibility requirements, you can generate output that is accessible to all. ASSISTIVE TECHNOLOGY When talking about accessibility, you often hear about assistive technology. What is assistive technology? As the name implies, it is technology that assists a person in gaining access to something. But the technology doesn’t have to be high tech. Think about the cupboard that’s above your refrigerator. How do you get access it? Unless you’re very tall, you probably need a chair or small step stool. The chair is assisting you in getting to the cupboard. It is assistive. Assistive technology and accessibility are often associated with visual impairments but there are other types of impairments with their own assistive technology devices. A hearing impaired person might need closed captioning or

Welcome message from author
This document is posted to help you gain knowledge. Please leave a comment to let me know what you think about it! Share it to your friends and learn new things together.
Transcript
1
Paper SAS641-2017
Raising the Bar: The Pending Section 508 Refresh
and the ODS HTML5 Destination
Glen R Walker, SAS Institute Inc.
ABSTRACT
The U.S. Access Board will soon “refresh” the Section 508 accessibility standards. The new requirements are based on the Web Content Accessibility Guidelines (WCAG) 2.0 and include a total of 38 testable success criteria – 16 more than the current requirements. Is your organization ready? Don’t worry…the fourth maintenance release for SAS® 9.4 ODS HTML5 destination has you covered. This paper describes the new accessibility features in the ODS HTML5 destination, explains how to use them, and shows you how to test your output for compliance with the new Section 508 standards.
INTRODUCTION On January 18, 2017, the U.S. Access Board published a final rule updating accessibility requirements for information and communication technology (ICT) covered by Section 508 of the Rehabilitation Act. This update is called the “508 Refresh”. One of the main goals of the refresh was to incorporate the Web Content Accessibility Guidelines (WCAG) 2.0, Level AA. There’s an extensive discussion comparing Section 508 and WCAG 2.0 in last year’s SAS Global Forum paper, “A Guide to Section 508 Compliance Using SAS® 9.4 Output Delivery System (ODS)” in the Proceedings of the SAS Global Forum 2016 Conference.
This year’s paper discusses features in the fourth maintenance release for SAS® 9.4 that help you make your reports accessible. As a refresher, consider if you generate output or reports for a large audience of users. Maybe you work for a government agency that is serving a local or regional population. Or you might work for an educational institution that posts reports for students. Or maybe you work for a large multi-national corporation.
If your user-base is broad, then the user ability levels are probably broad too. Some users might have perfect vision. But others might have difficulty seeing small fonts or discerning between different colors. Still others might have mobility issues and can't use a mouse to navigate a report. Whatever the issue, what they all have in common is the need for equal access to your output. In the United States, almost 1 out of every 5 people have a disability (57 million people). Worldwide, it is about 1 out of 7 people. One billion people. Chances are good that someone that accesses your report will have some form of disability.
Whatever your requirements might be (whether your output contains tables, graphs, or links), the HTML5 destination in the fourth maintenance release for SAS® 9.4 Output Delivery System (ODS) offers a tremendous number of built-in accessibility features that can help to increase the accessibility of your output. You have great information. Don't hide it from any of your users. Don't isolate any of your users by preventing access to your reports. By taking advantage of the following ODS features and by keeping in mind some basic accessibility requirements, you can generate output that is accessible to all.
ASSISTIVE TECHNOLOGY
When talking about accessibility, you often hear about assistive technology. What is assistive technology? As the name implies, it is technology that assists a person in gaining access to something. But the technology doesn’t have to be high tech. Think about the cupboard that’s above your refrigerator. How do you get access it? Unless you’re very tall, you probably need a chair or small step stool. The chair is assisting you in getting to the cupboard. It is assistive.
Assistive technology and accessibility are often associated with visual impairments but there are other types of impairments with their own assistive technology devices. A hearing impaired person might need closed captioning or
2
a sign language interpreter. A mobility impaired person might not be able to use a mouse and requires a keyboard or a sip and puff device or perhaps voice recognition software.
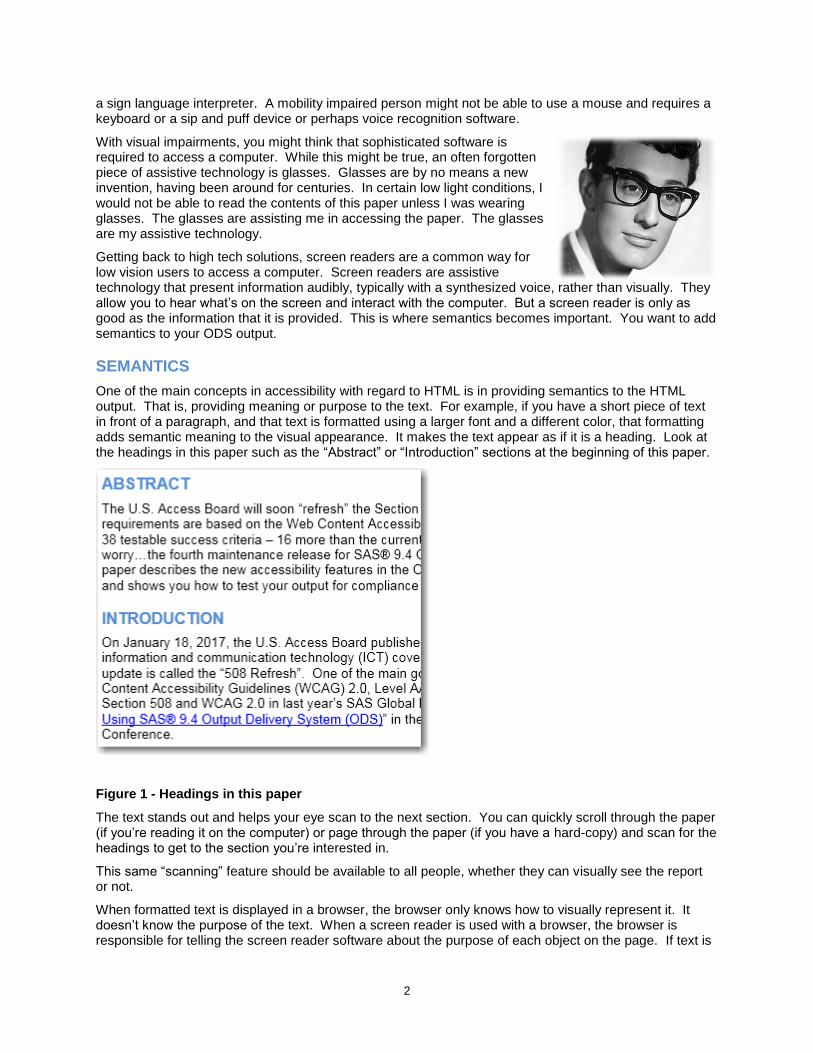
With visual impairments, you might think that sophisticated software is required to access a computer. While this might be true, an often forgotten piece of assistive technology is glasses. Glasses are by no means a new invention, having been around for centuries. In certain low light conditions, I would not be able to read the contents of this paper unless I was wearing glasses. The glasses are assisting me in accessing the paper. The glasses are my assistive technology.
Getting back to high tech solutions, screen readers are a common way for low vision users to access a computer. Screen readers are assistive technology that present information audibly, typically with a synthesized voice, rather than visually. They allow you to hear what’s on the screen and interact with the computer. But a screen reader is only as good as the information that it is provided. This is where semantics becomes important. You want to add semantics to your ODS output.
SEMANTICS
One of the main concepts in accessibility with regard to HTML is in providing semantics to the HTML output. That is, providing meaning or purpose to the text. For example, if you have a short piece of text in front of a paragraph, and that text is formatted using a larger font and a different color, that formatting adds semantic meaning to the visual appearance. It makes the text appear as if it is a heading. Look at the headings in this paper such as the “Abstract” or “Introduction” sections at the beginning of this paper.
Figure 1 - Headings in this paper
The text stands out and helps your eye scan to the next section. You can quickly scroll through the paper (if you’re reading it on the computer) or page through the paper (if you have a hard-copy) and scan for the headings to get to the section you’re interested in.
This same “scanning” feature should be available to all people, whether they can visually see the report or not.
When formatted text is displayed in a browser, the browser only knows how to visually represent it. It doesn’t know the purpose of the text. When a screen reader is used with a browser, the browser is responsible for telling the screen reader software about the purpose of each object on the page. If text is
3
marked up properly in HTML5, additional meaning can be conveyed about the text from the browser to the screen reader.
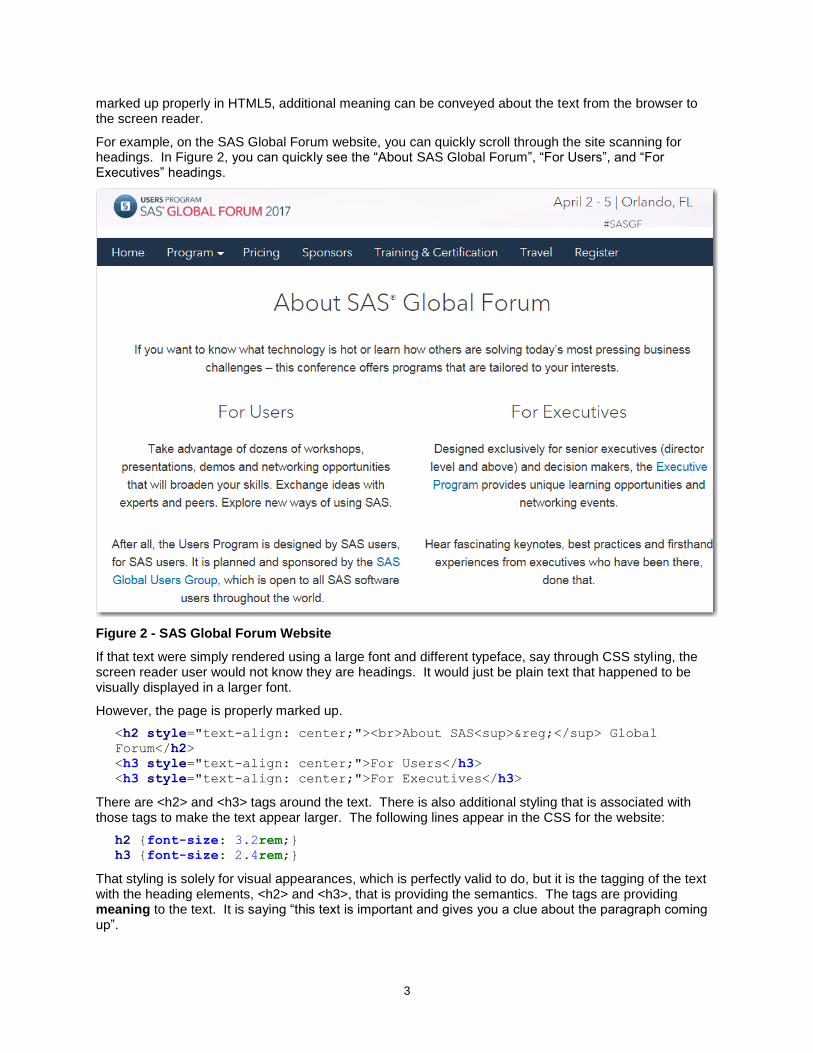
For example, on the SAS Global Forum website, you can quickly scroll through the site scanning for headings. In Figure 2, you can quickly see the “About SAS Global Forum”, “For Users”, and “For Executives” headings.
Figure 2 - SAS Global Forum Website
If that text were simply rendered using a large font and different typeface, say through CSS styling, the screen reader user would not know they are headings. It would just be plain text that happened to be visually displayed in a larger font.
However, the page is properly marked up.
<h2 style="text-align: center;"><br>About SAS<sup>®</sup> Global
Forum</h2>
<h3 style="text-align: center;">For Users</h3>
<h3 style="text-align: center;">For Executives</h3>
There are <h2> and <h3> tags around the text. There is also additional styling that is associated with those tags to make the text appear larger. The following lines appear in the CSS for the website:
h2 {font-size: 3.2rem;}
h3 {font-size: 2.4rem;}
That styling is solely for visual appearances, which is perfectly valid to do, but it is the tagging of the text with the heading elements, <h2> and <h3>, that is providing the semantics. The tags are providing meaning to the text. It is saying “this text is important and gives you a clue about the paragraph coming up”.

4
When generating HTML output using the HTML5 destination in ODS, you should generate that same type of semantic information.
HTML5 DESTINATION
ODS supports many output destinations and it might be confusing which one you should choose to generate the most accessible output.
If you have a mandate that your organization must produce accessible PDF, then read my paper from this year’s (2017) SAS Global Forum, “Tag, You’re It! Creating Accessible (Tagged) PDF with the Fourth Maintenance Release for SAS® 9.4 Output Delivery System (ODS)”. There’s a new preproduction option to aid in generating accessible PDF files, but PDF files can only go so far technology-wise.
If your organization has a directive to generate accessible output, without the output destination being mandated, then the HTML5 destination is the best solution.
The default HTML destination in SAS 9.4 is HTML4. In October 2014, the World Wide Web Consortium (W3C) updated the HTML language to version 5 (HTML5) and included numerous accessibility features. The HTML5 ODS destination uses many of these new features. All of the examples in this paper use HTML5 specifically so that it is clear which destination is being used. You can specify the HTML5 destination directly with this example.
ods html5 file='test.html';
or you can update your SAS Registry to use HTML5 and then specify the HTML destination:
ods html file='test.html';
SAS REGISTRY
The SAS Registry is opened through the menu Solutions > Accessories > Registry Editor, or by submitting the REGEDIT command.
Figure 3 - Menu Path to SAS Registry Editor
The path to the HTML destination is: SAS_REGISTRY > ODS. Double click or press Enter on the “Default HTML Version” key and change the value to “HTML5”.

5
Figure 4 - SAS Registry Editor
For batch processing, you can change the registry using PROC REGISTRY:
proc registry import='mystuff.txt'; run;
where ‘mystuff.txt’ contains:
[ODS]
"Default HTML Version"="HTML5"
TITLE= OPTION
Another feature that will be used in all the examples is the TITLE= option on the ODS statement. The TITLE= option was added in earlier versions, not specifically for accessibility, but accessibility can certainly take advantage of the addition.
ods html5 file='test.html' (title=' My really important report');
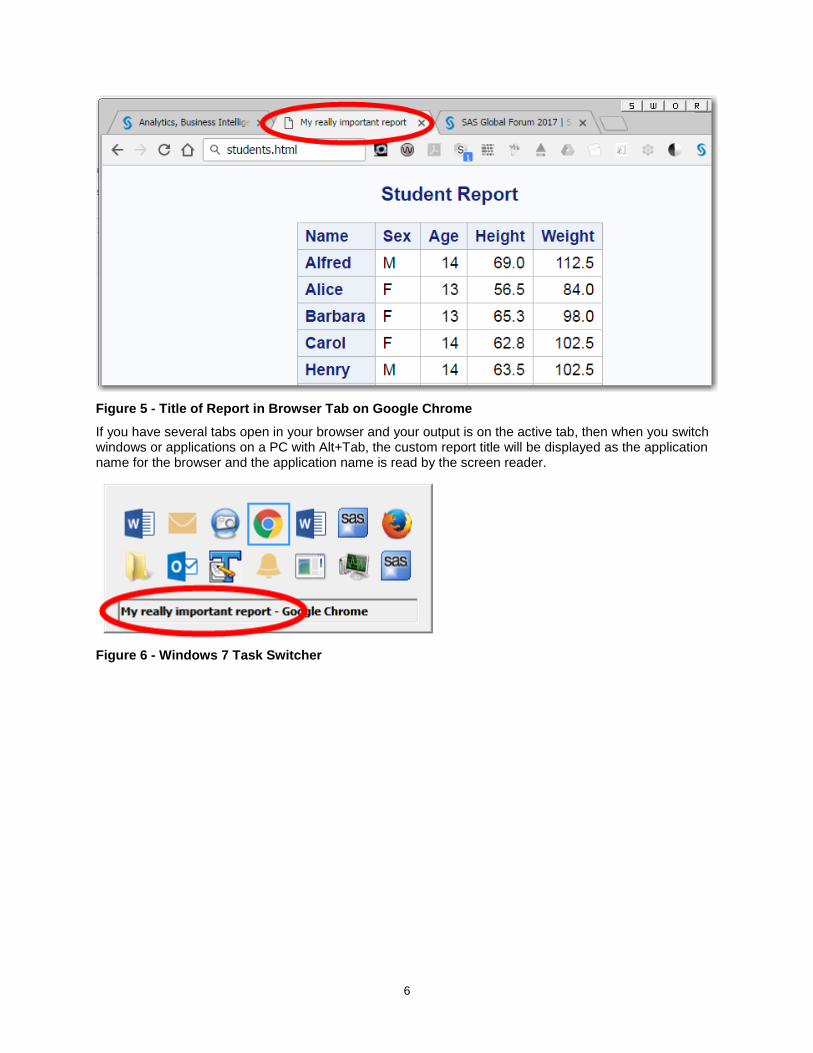
When specified, the text from the TITLE= will generate a <title> html tag, which is the page title. Having a page title helps users determine the contents of a page without having to read the whole page. The title is displayed on the tab in the browser and is also read by screen readers when the page is loaded. The default page title is "SAS Output". Figure 5 shows a custom page title.
6
Figure 5 - Title of Report in Browser Tab on Google Chrome
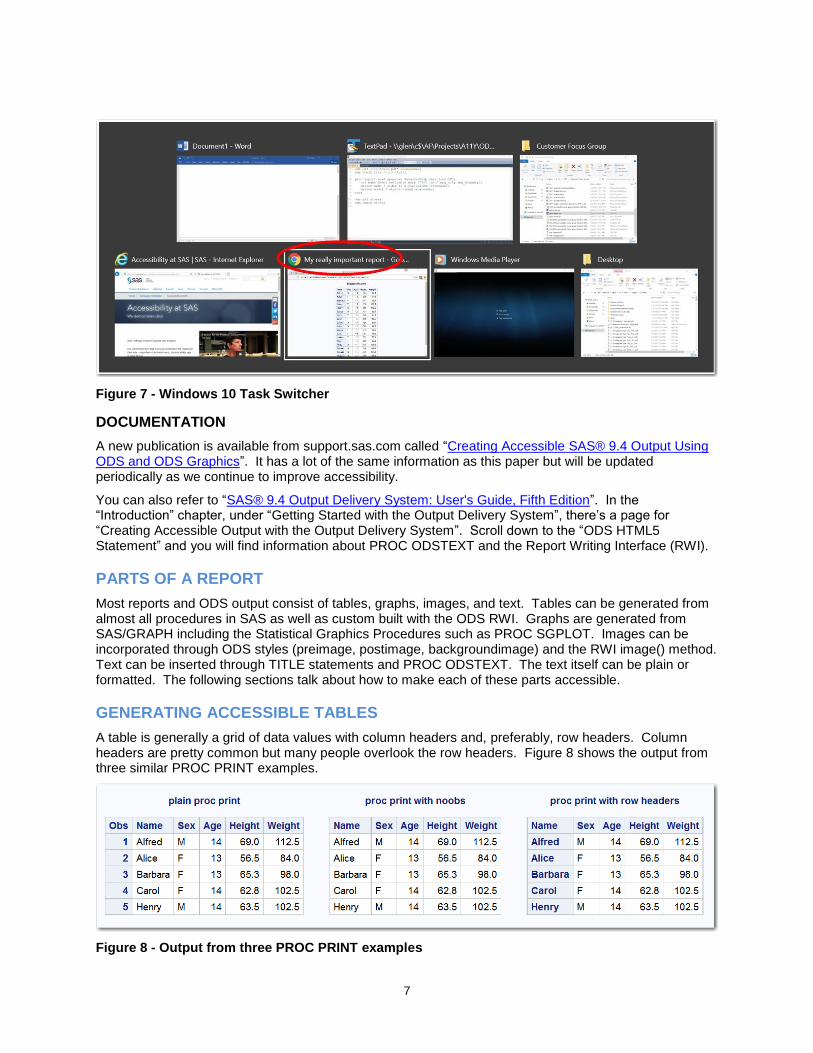
If you have several tabs open in your browser and your output is on the active tab, then when you switch windows or applications on a PC with Alt+Tab, the custom report title will be displayed as the application name for the browser and the application name is read by the screen reader.
Figure 6 - Windows 7 Task Switcher
7
Figure 7 - Windows 10 Task Switcher
DOCUMENTATION
A new publication is available from support.sas.com called “Creating Accessible SAS® 9.4 Output Using ODS and ODS Graphics”. It has a lot of the same information as this paper but will be updated periodically as we continue to improve accessibility.
You can also refer to “SAS® 9.4 Output Delivery System: User's Guide, Fifth Edition”. In the “Introduction” chapter, under “Getting Started with the Output Delivery System”, there’s a page for “Creating Accessible Output with the Output Delivery System”. Scroll down to the “ODS HTML5 Statement” and you will find information about PROC ODSTEXT and the Report Writing Interface (RWI).
PARTS OF A REPORT
Most reports and ODS output consist of tables, graphs, images, and text. Tables can be generated from almost all procedures in SAS as well as custom built with the ODS RWI. Graphs are generated from SAS/GRAPH including the Statistical Graphics Procedures such as PROC SGPLOT. Images can be incorporated through ODS styles (preimage, postimage, backgroundimage) and the RWI image() method. Text can be inserted through TITLE statements and PROC ODSTEXT. The text itself can be plain or formatted. The following sections talk about how to make each of these parts accessible.
GENERATING ACCESSIBLE TABLES
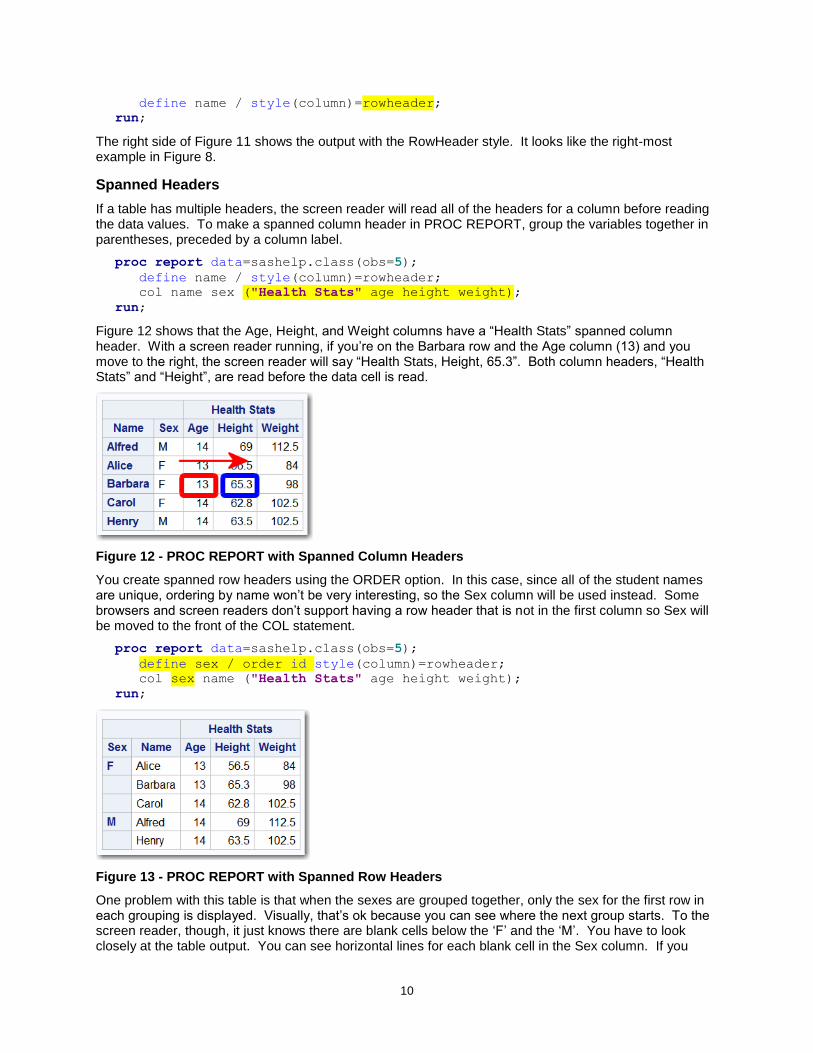
A table is generally a grid of data values with column headers and, preferably, row headers. Column headers are pretty common but many people overlook the row headers. Figure 8 shows the output from three similar PROC PRINT examples.
Figure 8 - Output from three PROC PRINT examples

8
The first example is PROC PRINT without any options (except for OBS=5 to limit the output for this paper).
proc print data=sashelp.class(obs=5); run;
By default, you get a column for observation numbers. If you look closely, the OBS column has a light blue background and bold text, the same as the column headers. The observation numbers are row headers. Unless you need to refer to rows in the table by observation number, it is recommended to turn off the observation numbers. This aids in accessibility as will be explained later. Turning off the observations column is done with the NOOBS option, shown below. The middle table in Figure 8 shows the NOOBS output.
proc print data=sashelp.class(obs=5) noobs; run;
Without the OBS column the table looks a little cleaner. But a bigger benefit of not having an OBS column is for screen reader users. A screen reader user can navigate through a table as if it is a spreadsheet, using the arrow keys to move around. As you move around, you hear the data in that cell. However, hearing the data by itself is somewhat useless unless you know the context. That’s where the row and column headings come in. If you move left or right, you are changing columns so the screen reader will read the column header and then the data value. For example, “Sex M”, “Age 14”, and so on. If you move up or down, you are changing rows so the screen reader will read the row header (if it exists) and then the data value. This is where having an OBS column can be confusing for screen reader users.
When you visually look at the first table, it looks like it has 5 rows. Henry is the 5th and last observation. However, the table is formatted in HTML and one of the rows is the column headers. The actual HTML table has 6 rows. The browser doesn’t know that the table is displaying a SAS data set. It just knows to render the <table> element and that there are six <tr> elements for the six rows in the table. The first row contains all the column headers and the remaining five rows contain the data. The browser tells the screen reader that there are six rows.
When a screen reader user navigates to the table, the screen reader says “table with six columns and six rows”. (Six columns because there are five variables in the data set plus the OBS column.) If your screen reader “focus” were on the Barbara row, in the Age column, and then you moved up one row to the Alice row, you would hear the row header read first (from OBS column), followed by the data value (13), and then the physical row number of the table itself (3, because it is the third <tr> element in the table). The screen reader says: “2, 13, row 3”.
Figure 9 - Screen Reader Focus Moving Up One Row
That can be confusing and disorienting. The data value, 13, is ok, but hearing “2” and then “row 3” is confusing. The observation numbers don’t match up with the physical table row numbers. They’re off by one. If you don’t have a need for observation numbers, then turn them off with the NOOBS option. If observation numbers are required, then perhaps you can put them in a column that comes later in the table so that they’re not row headers. That might require creating a temporary column with the observation numbers.
However, turning off the observation numbers now leaves the table without row headers. If you navigate left and right in the table with a screen reader, you will be ok, but navigating up and down won’t have any context. Using the same example above, instead of hearing “2, 13, row 3”, you now hear “13, row 3”. We

9
know we’re in the Age column because we navigated to it previously. But as we’re moving up or down the column all we hear is the age value. Who does the age apply to? Without any row headers, you don’t hear any context to the values. That’s fixed in the third table in Figure 8, “proc print with row headers”.
proc print data=sashelp.class(obs=5); id name; run;
The ID statement specifies which variable(s) to use as the row headers. When you specify ID, you don’t have to specify NOOBS because the ID variable will replace the OBS column. Now if we navigate up one row, the screen reader will say “Alice, 13, row 3”. We now know that the age of 13 is associated with Alice.
Figure 10 - Screen Reader Focus Moving Up One Row with Row Headers
Looking at Figure 8 again, comparing the three tables, there is not much visual difference between them, but for a screen reader user, the differences are significant.
GENERATING ACCESSIBLE TABLES WITH PROC REPORT
If you are generating a table using a different PROC, check the PROC syntax to see if there’s a way to specify column headers and row headers. Sometimes the syntax might not be obvious. Let’s look at PROC REPORT.
Figure 11 - Output from two PROC REPORTs
The first PROC REPORT is without any options (except for OBS=5 to limit the output for this paper) and looks exactly like the second PROC PRINT example in Figure 8.
proc report data=sashelp.class(obs=5); run;
But as you saw before, not having row headers is very confusing for the screen reader user. PROC REPORT doesn’t have an ID statement like PROC PRINT does but it does let you style the output. There is a list of style elements in “SAS® 9.4 Output Delivery System: User's Guide, Fifth Edition”, in the “General ODS Style Elements” section. Scroll the document down past the table examples and you’ll see the RowHeader style element. There’s also a Header style element but that’s for styling the column headers. Using the RowHeader style element, you can visually style a column to appear like a row header and the generated HTML will have the proper tags to make them real row headers.
proc report data=sashelp.class(obs=5);
10
define name / style(column)=rowheader;
run;
The right side of Figure 11 shows the output with the RowHeader style. It looks like the right-most example in Figure 8.
Spanned Headers
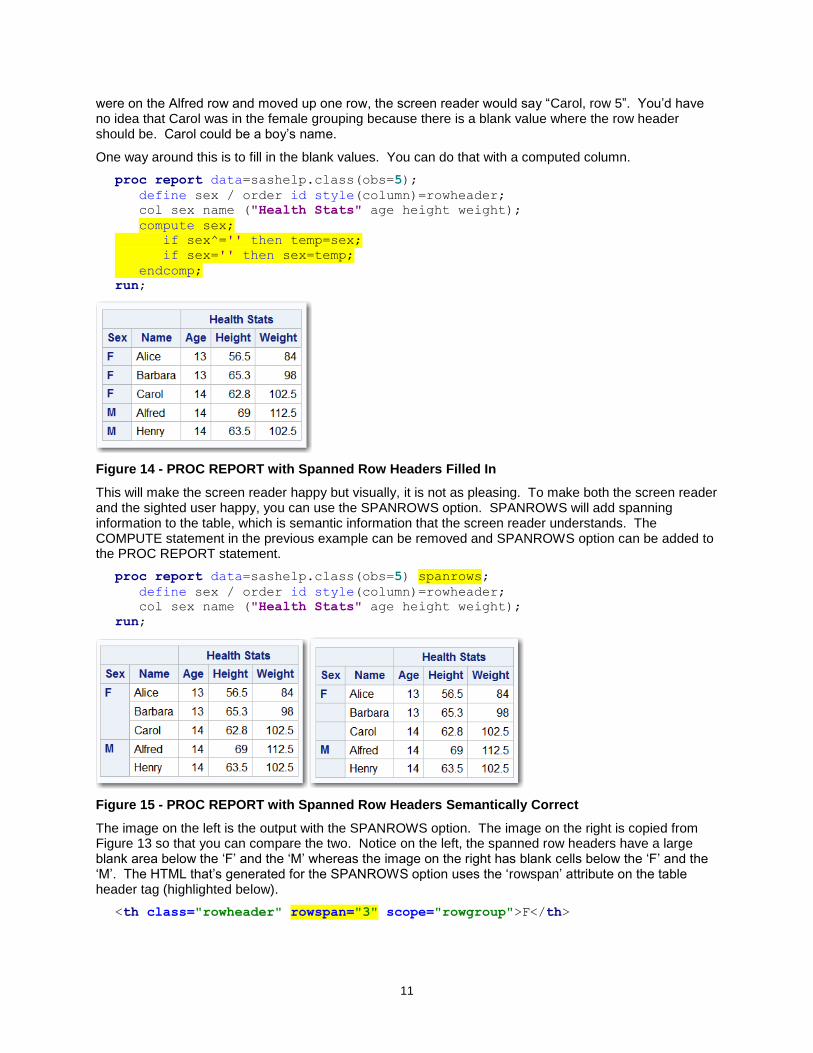
If a table has multiple headers, the screen reader will read all of the headers for a column before reading the data values. To make a spanned column header in PROC REPORT, group the variables together in parentheses, preceded by a column label.
proc report data=sashelp.class(obs=5);
define name / style(column)=rowheader;
col name sex ("Health Stats" age height weight);
run;
Figure 12 shows that the Age, Height, and Weight columns have a “Health Stats” spanned column header. With a screen reader running, if you’re on the Barbara row and the Age column (13) and you move to the right, the screen reader will say “Health Stats, Height, 65.3”. Both column headers, “Health Stats” and “Height”, are read before the data cell is read.
Figure 12 - PROC REPORT with Spanned Column Headers
You create spanned row headers using the ORDER option. In this case, since all of the student names are unique, ordering by name won’t be very interesting, so the Sex column will be used instead. Some browsers and screen readers don’t support having a row header that is not in the first column so Sex will be moved to the front of the COL statement.
proc report data=sashelp.class(obs=5);
define sex / order id style(column)=rowheader;
col sex name ("Health Stats" age height weight);
run;
Figure 13 - PROC REPORT with Spanned Row Headers
One problem with this table is that when the sexes are grouped together, only the sex for the first row in each grouping is displayed. Visually, that’s ok because you can see where the next group starts. To the screen reader, though, it just knows there are blank cells below the ‘F’ and the ‘M’. You have to look closely at the table output. You can see horizontal lines for each blank cell in the Sex column. If you
11
were on the Alfred row and moved up one row, the screen reader would say “Carol, row 5”. You’d have no idea that Carol was in the female grouping because there is a blank value where the row header should be. Carol could be a boy’s name.
One way around this is to fill in the blank values. You can do that with a computed column.
proc report data=sashelp.class(obs=5);
define sex / order id style(column)=rowheader;
col sex name ("Health Stats" age height weight);
compute sex;
if sex^='' then temp=sex;
if sex='' then sex=temp;
endcomp;
run;
Figure 14 - PROC REPORT with Spanned Row Headers Filled In
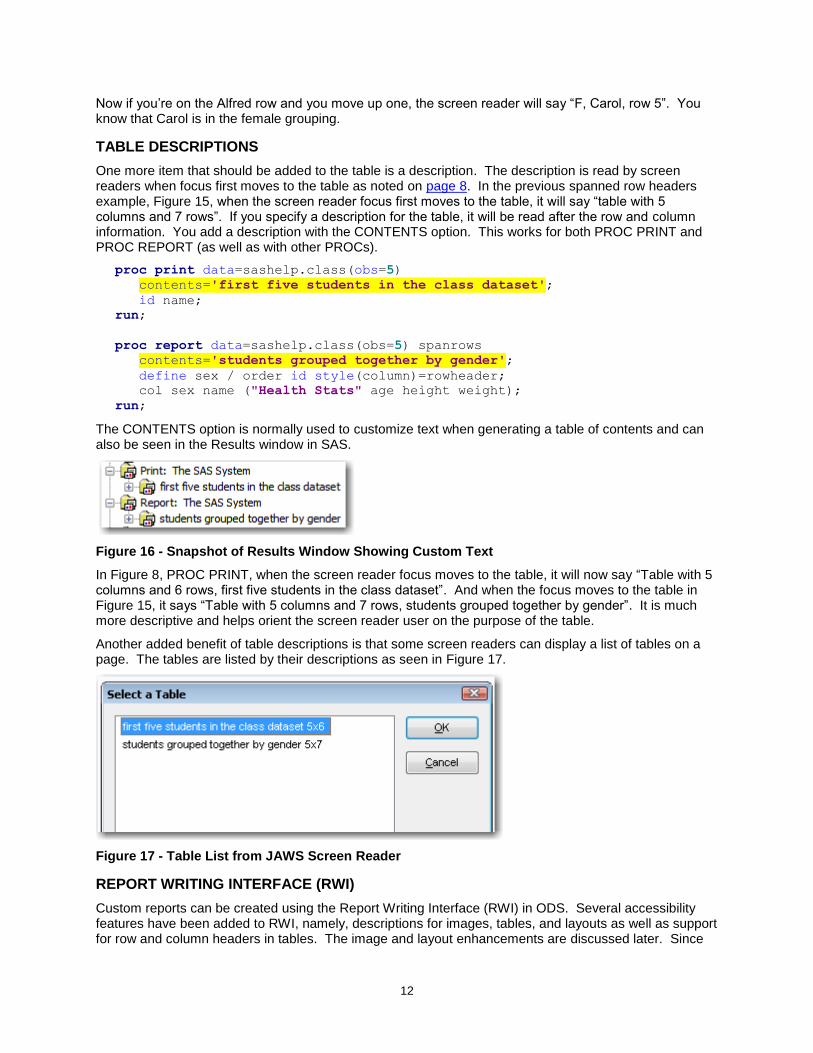
This will make the screen reader happy but visually, it is not as pleasing. To make both the screen reader and the sighted user happy, you can use the SPANROWS option. SPANROWS will add spanning information to the table, which is semantic information that the screen reader understands. The COMPUTE statement in the previous example can be removed and SPANROWS option can be added to the PROC REPORT statement.
proc report data=sashelp.class(obs=5) spanrows;
define sex / order id style(column)=rowheader;
col sex name ("Health Stats" age height weight);
run;
Figure 15 - PROC REPORT with Spanned Row Headers Semantically Correct
The image on the left is the output with the SPANROWS option. The image on the right is copied from Figure 13 so that you can compare the two. Notice on the left, the spanned row headers have a large blank area below the ‘F’ and the ‘M’ whereas the image on the right has blank cells below the ‘F’ and the ‘M’. The HTML that’s generated for the SPANROWS option uses the ‘rowspan’ attribute on the table header tag (highlighted below).
<th class="rowheader" rowspan="3" scope="rowgroup">F</th>
12
Now if you’re on the Alfred row and you move up one, the screen reader will say “F, Carol, row 5”. You know that Carol is in the female grouping.
TABLE DESCRIPTIONS
One more item that should be added to the table is a description. The description is read by screen readers when focus first moves to the table as noted on page 8. In the previous spanned row headers example, Figure 15, when the screen reader focus first moves to the table, it will say “table with 5 columns and 7 rows”. If you specify a description for the table, it will be read after the row and column information. You add a description with the CONTENTS option. This works for both PROC PRINT and PROC REPORT (as well as with other PROCs).
proc print data=sashelp.class(obs=5)
contents='first five students in the class dataset';
id name;
run;
proc report data=sashelp.class(obs=5) spanrows
contents='students grouped together by gender';
define sex / order id style(column)=rowheader;
col sex name ("Health Stats" age height weight);
run;
The CONTENTS option is normally used to customize text when generating a table of contents and can also be seen in the Results window in SAS.
Figure 16 - Snapshot of Results Window Showing Custom Text
In Figure 8, PROC PRINT, when the screen reader focus moves to the table, it will now say “Table with 5 columns and 6 rows, first five students in the class dataset”. And when the focus moves to the table in Figure 15, it says “Table with 5 columns and 7 rows, students grouped together by gender”. It is much more descriptive and helps orient the screen reader user on the purpose of the table.
Another added benefit of table descriptions is that some screen readers can display a list of tables on a page. The tables are listed by their descriptions as seen in Figure 17.
Figure 17 - Table List from JAWS Screen Reader
REPORT WRITING INTERFACE (RWI)
Custom reports can be created using the Report Writing Interface (RWI) in ODS. Several accessibility features have been added to RWI, namely, descriptions for images, tables, and layouts as well as support for row and column headers in tables. The image and layout enhancements are discussed later. Since
13
this section is talking about accessible tables, we’ll only address the table enhancements in RWI here. There are a variety of SAS Global Forum papers that talk about how to use RWI so that aspect of RWI will not be addressed here.
A complete code example follows the next three sections.
Table Description
As mentioned in the previous section, the CONTENTS= option on PROC PRINT and PROC REPORT adds a description to the table. This same description can be added in RWI using the new DESCRIPTION parameter on the TABLE_START() method.
table_start(description: 'students grouped together by gender');
As with the CONTENTS= option, visually you won’t see the description but it is read by a screen reader.
Column Headers
Column headers can be added two different ways. Both ways generate the same HTML output so that you can choose either method.
1. head_start() method
2. row_start(type:’H’) method
Column headers are contained in a <thead> tag in the generated HTML. Having the headers in a <thead> doesn’t affect the appearance of the table when viewed in a browser, but if a table is printed and it spans across multiple pages, the column headers are repeated at the top of every page. Any headers not contained in the <thead> are not repeated.
Row Headers
Row headers are specified using the STYLE_ELEM parameter on the FORMAT_CELL() method. This is similar to how row headers are specified in PROC REPORT, which uses the RowHeader style.
format_cell(data: name, style_elem:'RowHeader');
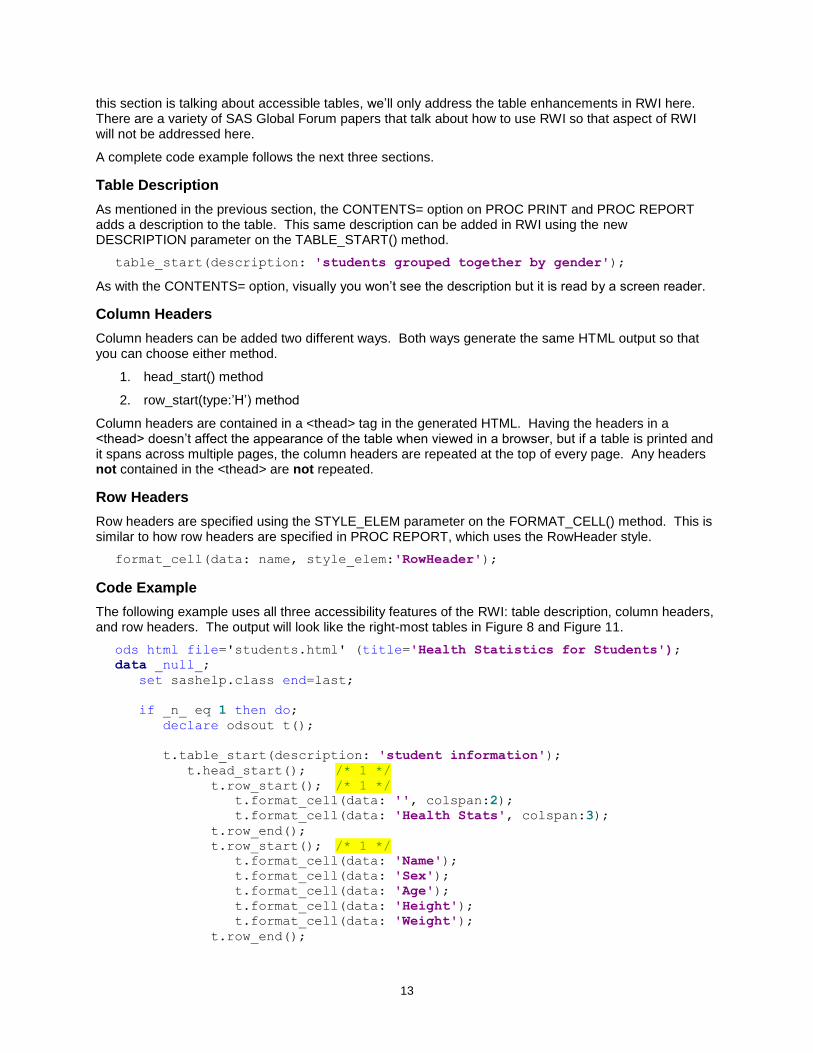
Code Example
The following example uses all three accessibility features of the RWI: table description, column headers, and row headers. The output will look like the right-most tables in Figure 8 and Figure 11.
ods html file='students.html' (title='Health Statistics for Students');
data _null_;
set sashelp.class end=last;
if _n_ eq 1 then do;
declare odsout t();
t.table_start(description: 'student information');
t.head_start(); /* 1 */
t.row_start(); /* 1 */
t.format_cell(data: '', colspan:2);
t.format_cell(data: 'Health Stats', colspan:3);
t.row_end();
t.row_start(); /* 1 */
t.format_cell(data: 'Name');
t.format_cell(data: 'Sex');
t.format_cell(data: 'Age');
t.format_cell(data: 'Height');
t.format_cell(data: 'Weight');
t.row_end();
14
t.head_end(); /* 1 */
end;
t.row_start();
t.format_cell(data: name,style_elem:'RowHeader'); /* 2 */
t.format_cell(data: sex);
t.format_cell(data: age);
t.format_cell(data: height);
t.format_cell(data: weight);
t.row_end();
if last then
t.table_end();
run;
ods pdf close;
The comment for /* 1 */ is on the HEAD_START() method call. Instead of using HEAD_START(), you can add a type:’H’ to the ROW_START() following it and then remove the HEAD_START() and HEAD_END(), as mentioned previously.
t.row_start(type:’H’);
The comment for /* 2 */ shows how row headers are created.
INACCESSIBLE TABLES
Improvements to HTML5 output are a continuing process. Some procedures haven’t been updated yet. In the conclusion of this paper, there is a request that you contact SAS if there are PROCs that you use often that don’t produce accessible output. One example is PROC MEANS.
proc means data=sashelp.class; run;
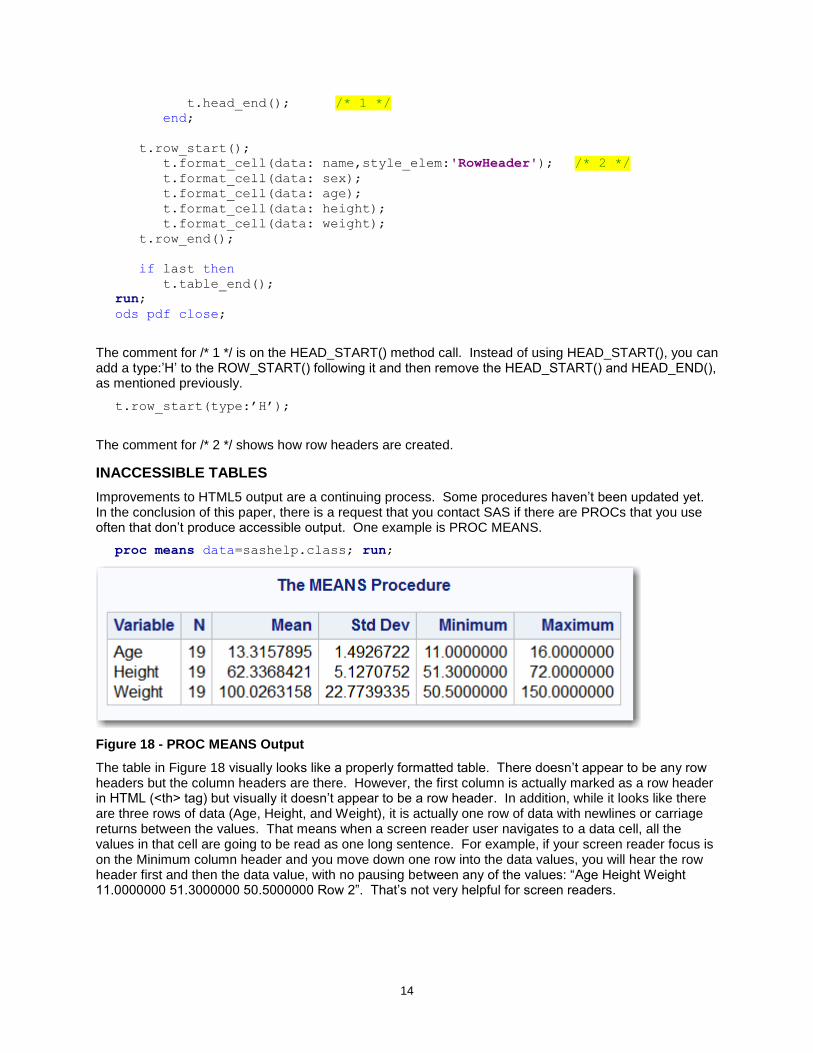
Figure 18 - PROC MEANS Output
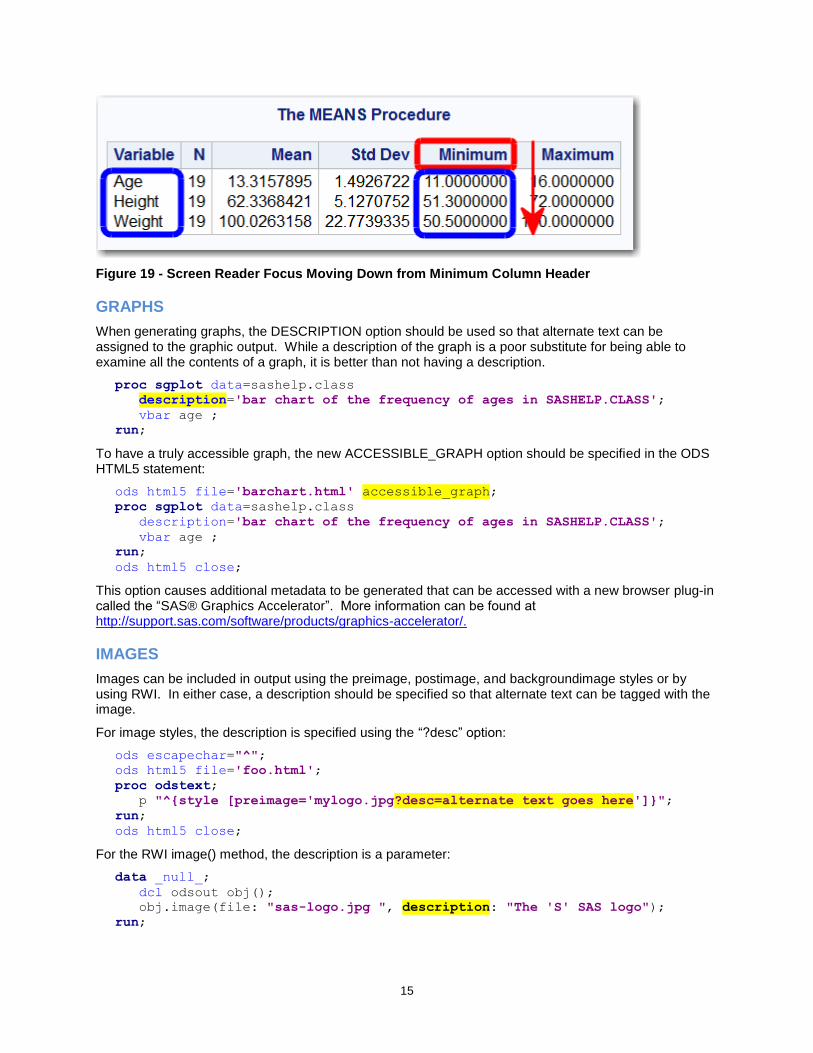
The table in Figure 18 visually looks like a properly formatted table. There doesn’t appear to be any row headers but the column headers are there. However, the first column is actually marked as a row header in HTML (<th> tag) but visually it doesn’t appear to be a row header. In addition, while it looks like there are three rows of data (Age, Height, and Weight), it is actually one row of data with newlines or carriage returns between the values. That means when a screen reader user navigates to a data cell, all the values in that cell are going to be read as one long sentence. For example, if your screen reader focus is on the Minimum column header and you move down one row into the data values, you will hear the row header first and then the data value, with no pausing between any of the values: “Age Height Weight 11.0000000 51.3000000 50.5000000 Row 2”. That’s not very helpful for screen readers.
15
Figure 19 - Screen Reader Focus Moving Down from Minimum Column Header
GRAPHS
When generating graphs, the DESCRIPTION option should be used so that alternate text can be assigned to the graphic output. While a description of the graph is a poor substitute for being able to examine all the contents of a graph, it is better than not having a description.
proc sgplot data=sashelp.class
description='bar chart of the frequency of ages in SASHELP.CLASS';
vbar age ;
run;
To have a truly accessible graph, the new ACCESSIBLE_GRAPH option should be specified in the ODS HTML5 statement:
ods html5 file='barchart.html' accessible_graph;
proc sgplot data=sashelp.class
description='bar chart of the frequency of ages in SASHELP.CLASS';
vbar age ;
run;
ods html5 close;
This option causes additional metadata to be generated that can be accessed with a new browser plug-in called the “SAS® Graphics Accelerator”. More information can be found at http://support.sas.com/software/products/graphics-accelerator/.
IMAGES
Images can be included in output using the preimage, postimage, and backgroundimage styles or by using RWI. In either case, a description should be specified so that alternate text can be tagged with the image.
For image styles, the description is specified using the “?desc” option:
ods escapechar="^";
ods html5 file='foo.html';
proc odstext;
p "^{style [preimage='mylogo.jpg?desc=alternate text goes here']}";
run;
ods html5 close;
For the RWI image() method, the description is a parameter:
data _null_;
dcl odsout obj();
obj.image(file: "sas-logo.jpg ", description: "The 'S' SAS logo");
run;
16
TEXT
A new heading statement, ‘H’, has been added to PROC ODSTEXT. The heading statement will generate a real HTML heading using the tags <h1>, <h2>, <h3>, and so on. In the “Semantics” section of this paper, the importance of real headings was discussed. Rather than inserting text that is styled to look like a heading such as with a larger font, the text should be tagged as a real heading using the ‘H’ statement in PROC ODSTEXT.
proc odstext contents='';
h1 'Main title of my report';
p '(insert more info about the report using the P statement)';
p '(blah blah blah)';
run;
proc odstext contents='';
h2 "Students in Mr Smith's class";
run;
proc print data=sashelp.class contents='Mr Smith'; run;
In the Table Descriptions section, it was suggested that the CONTENTS option be specified in PROC statements, such as PROC PRINT, so that a table can be tagged with a description. For PROC ODSTEXT, the CONTENTS option is used with an empty string so that the PROC ODSTEXT output is not included in the generated table of contents.
In last year’s SAS Global Forum paper, “A Guide to Section 508 Compliance Using SAS® 9.4 Output Delivery System (ODS)”, on page 4, there is an example of adding headings to a report using the P statement of PROC ODSTEXT. That example could now use the new H statement.
Old Example:
proc odstext contents='';
p "<h1>North and South American Countries by population</h1>";
p "<h2><a href='#myreport1'>Small populations</a></h2>";
p "<h2><a href='#myreport2'>Medium populations</a></h2>";
p "<h2><a href='#myreport3'>Large populations</a></h2>";
p "<h2><a href='#myreport4'>Huge populations</a></h2>";
run;
New Example:
proc odstext contents='';
h1 "North and South American Countries by population";
h2 "<a href='#myreport1'>Small populations</a>";
h2 "<a href='#myreport2'>Medium populations</a>";
h2 "<a href='#myreport3'>Large populations</a>";
h2 "<a href='#myreport4'>Huge populations</a>";
run;
The H statement in PROC ODSTEXT works when generating PDF output too.
ODS LAYOUT
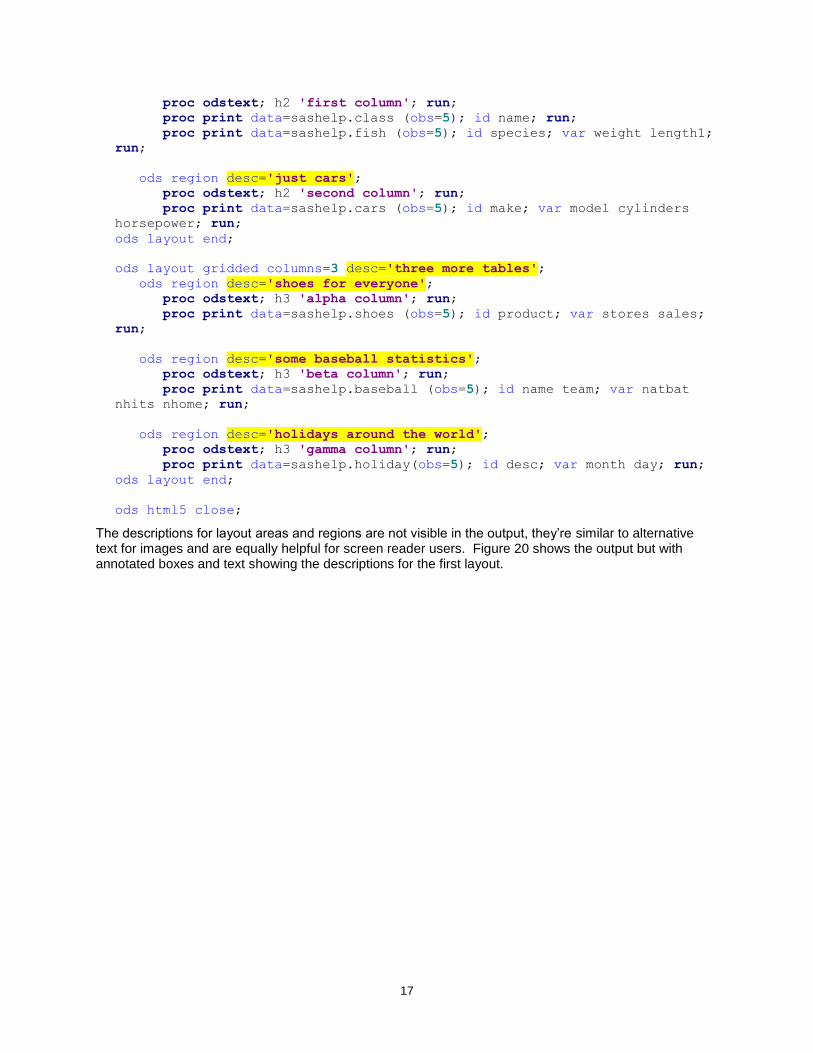
When creating gridded layouts with ODS, each layout area and each region within a layout should have a description. A screen reader user can navigate to regions using a special shortcut key. When focus moves to a region, the description is read. The following example shows the syntax for the description. A real example should have more helpful text.
ods html5 file='foo.html';
ods layout gridded columns=2 desc='some info about this area';
ods region desc='students and fish';
17
proc odstext; h2 'first column'; run;
proc print data=sashelp.class (obs=5); id name; run;
proc print data=sashelp.fish (obs=5); id species; var weight length1;
run;
ods region desc='just cars';
proc odstext; h2 'second column'; run;
proc print data=sashelp.cars (obs=5); id make; var model cylinders
horsepower; run;
ods layout end;
ods layout gridded columns=3 desc='three more tables';
ods region desc='shoes for everyone';
proc odstext; h3 'alpha column'; run;
proc print data=sashelp.shoes (obs=5); id product; var stores sales;
run;
ods region desc='some baseball statistics';
proc odstext; h3 'beta column'; run;
proc print data=sashelp.baseball (obs=5); id name team; var natbat
nhits nhome; run;
ods region desc='holidays around the world';
proc odstext; h3 'gamma column'; run;
proc print data=sashelp.holiday(obs=5); id desc; var month day; run;
ods layout end;
ods html5 close;
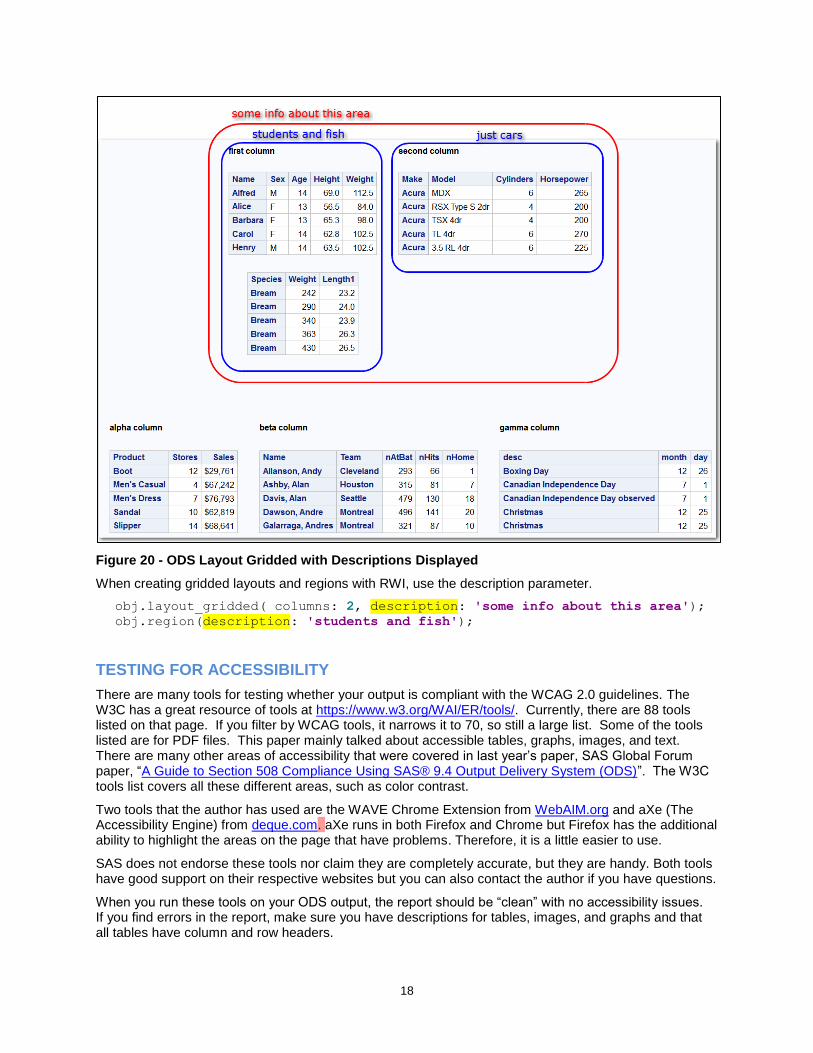
The descriptions for layout areas and regions are not visible in the output, they’re similar to alternative text for images and are equally helpful for screen reader users. Figure 20 shows the output but with annotated boxes and text showing the descriptions for the first layout.
18
Figure 20 - ODS Layout Gridded with Descriptions Displayed
When creating gridded layouts and regions with RWI, use the description parameter.
obj.layout_gridded( columns: 2, description: 'some info about this area');
obj.region(description: 'students and fish');
TESTING FOR ACCESSIBILITY
There are many tools for testing whether your output is compliant with the WCAG 2.0 guidelines. The W3C has a great resource of tools at https://www.w3.org/WAI/ER/tools/. Currently, there are 88 tools listed on that page. If you filter by WCAG tools, it narrows it to 70, so still a large list. Some of the tools listed are for PDF files. This paper mainly talked about accessible tables, graphs, images, and text. There are many other areas of accessibility that were covered in last year’s paper, SAS Global Forum paper, “A Guide to Section 508 Compliance Using SAS® 9.4 Output Delivery System (ODS)”. The W3C tools list covers all these different areas, such as color contrast.
Two tools that the author has used are the WAVE Chrome Extension from WebAIM.org and aXe (The Accessibility Engine) from deque.com. aXe runs in both Firefox and Chrome but Firefox has the additional ability to highlight the areas on the page that have problems. Therefore, it is a little easier to use.
SAS does not endorse these tools nor claim they are completely accurate, but they are handy. Both tools have good support on their respective websites but you can also contact the author if you have questions.
When you run these tools on your ODS output, the report should be “clean” with no accessibility issues. If you find errors in the report, make sure you have descriptions for tables, images, and graphs and that all tables have column and row headers.
19
If you are using the H statement in PROC ODSTEXT to create headings, then it’s helpful to use a tool that parses your headings and creates an outline. Just search for “html5 outlining tool”.
CONCLUSION
It is now possible to create ODS HTML5 output that fully conforms to WCAG 2.0 Level AA. By doing so, you create a great user experience for screen reader users. The ODS development team would like to continue to make progress on accessibility features and wants your input regarding the necessary features required by your site to make accessible HTML5 content. Send us feedback on procedures and techniques that you use that aren’t generating accessible output.
Try your production SAS jobs using the fourth maintenance release for SAS® 9.4. You can request this release from the following site: http://support.sas.com/software/maintenance/index.html.
Once you have installed the release, try the various features from this paper then examine the generated HTML using the tools mentioned earlier. Work with your accessibility coordinators to verify the files. If there are PROCs that you use often that don’t seem to be generating correct output, send us feedback. SAS has hundreds of procedures and we want to prioritize the ones we work on to make them accessible. Having your feedback regarding the PROCs that are important to you will help.
Feedback can be sent to [email protected] or you can contact tech support (support.sas.com).
REFERENCES
“About the Update of the Section 508 Standards and Section 255 Guidelines for Information and Communication Technology”. United States Access Board. Available https://www.access-board.gov/guidelines-and-standards/communications-and-it/about-the-ict-refresh/overview-of-the-final-rule. Accessed on February 22, 2017.
U.S. Census Bureau. Available https://www.census.gov/newsroom/releases/archives/miscellaneous/cb12-134.html. Accessed on February 22, 2017.
The World Bank. Available http://www.worldbank.org/en/topic/disability/overview. Accessed on February 22, 2017.
ACKNOWLEDGMENTS
Special thanks to the ODS team for being patient with my questions and working to improve the accessibility of ODS: Woody Middleton, David Kelley, Dan O'Connor, and Bari Lawhorn.
RECOMMENDED READING
O’Connor, Daniel. 2017. “A Guru’s Guide: Producing section 508 compliant custom reports with ODS.” Proceedings of the SAS Global Forum 2017 Conference. Cary, NC: SAS Institute Inc. Available http://support.sas.com/resources/papers/proceedings17/SAS557-2017.pdf.
Walker, Glen. 2016. “A Guide to Section 508 Compliance Using SAS® 9.4 Output Delivery System (ODS).” Proceedings of the SAS Global Forum 2016 Conference. Cary, NC: SAS Institute Inc. Available http://support.sas.com/resources/papers/proceedings16/SAS5280-2016.pdf.
Walker, Glen. 2017. “Tag, You’re It! Creating Accessible (Tagged) PDF with the Fourth Maintenance Release for SAS® 9.4 Output Delivery System (ODS).” Proceedings of the SAS Global Forum 2017 Conference. Cary, NC: SAS Institute Inc. Available http://support.sas.com/resources/papers/proceedings17/SAS483-2017.pdf.
SAS Institute Inc. 2017. “Creating Accessible SAS® 9.4 Output Using ODS and ODS Graphics.” Cary, NC: SAS Institute Inc. Available http://documentation.sas.com/?docsetId=odsacoutput&docsetVersion=9.4&docsetTarget=titlepage.htm.
20
CONTACT INFORMATION
Your comments and questions are valued and encouraged. Contact the author:
Glen R Walker 100 SAS Campus Drive Cary, NC 27513 SAS Institute Inc. [email protected] www.sas.com/accessibility
SAS and all other SAS Institute Inc. product or service names are registered trademarks or trademarks of SAS Institute Inc. in the USA and other countries. ® indicates USA registration.
Other brand and product names are trademarks of their respective companies.
Related Documents