Springer Climate Rais Akhtar Cosimo Palagiano Editors Climate Change and Air Pollution The Impact on Human Health in Developed and Developing Countries

Welcome message from author
This document is posted to help you gain knowledge. Please leave a comment to let me know what you think about it! Share it to your friends and learn new things together.
Transcript
Springer Climate
Rais AkhtarCosimo Palagiano Editors
Climate Change and Air PollutionThe Impact on Human Health in Developed and Developing Countries

Springer Climate
Series editor
John Dodson, Menai, Australia

Springer Climate is an interdisciplinary book series dedicated on all climate
research. This includes climatology, climate change impacts, climate change
management, climate change policy, regional climate, climate monitoring and
modeling, palaeoclimatology etc. The series hosts high quality research mono-
graphs and edited volumes on Climate, and is crucial reading material for
Researchers and students in the field, but also policy makers, and industries dealing
with climatic issues. Springer Climate books are all peer-reviewed by specialists
(see Editorial Advisory board). If you wish to submit a book project to this series,
please contact your Publisher ([email protected]).
More information about this series at http://www.springer.com/series/11741
Rais Akhtar • Cosimo Palagiano
Editors
Climate Change and AirPollution
The Impact on Human Health in Developedand Developing Countries
EditorsRais AkhtarInternational Institute of HealthManagement and Research(IIHMR)
New Delhi, India
Cosimo PalagianoDipartimento Di Scienze Documentarie,Linguistico-Filologiche e Geografiche
Sapienza University of RomeRome, Italy
ISSN 2352-0698 ISSN 2352-0701 (electronic)Springer ClimateISBN 978-3-319-61345-1 ISBN 978-3-319-61346-8 (eBook)DOI 10.1007/978-3-319-61346-8
Library of Congress Control Number: 2017952378
© Springer International Publishing AG 2018This work is subject to copyright. All rights are reserved by the Publisher, whether the whole or part ofthe material is concerned, specifically the rights of translation, reprinting, reuse of illustrations,recitation, broadcasting, reproduction on microfilms or in any other physical way, and transmissionor information storage and retrieval, electronic adaptation, computer software, or by similar ordissimilar methodology now known or hereafter developed.The use of general descriptive names, registered names, trademarks, service marks, etc. in thispublication does not imply, even in the absence of a specific statement, that such names are exemptfrom the relevant protective laws and regulations and therefore free for general use.The publisher, the authors and the editors are safe to assume that the advice and information in thisbook are believed to be true and accurate at the date of publication. Neither the publisher nor theauthors or the editors give a warranty, express or implied, with respect to the material containedherein or for any errors or omissions that may have been made. The publisher remains neutral withregard to jurisdictional claims in published maps and institutional affiliations.
Printed on acid-free paper
This Springer imprint is published by Springer NatureThe registered company is Springer International Publishing AGThe registered company address is: Gewerbestrasse 11, 6330 Cham, Switzerland
Foreword
Of all the effects which climate change is likely to induce, perhaps none is more
complex, insidious, and capable of inflicting direct damage on people’s health than
increasing levels of air pollution. It is important to remember that even in the
absence of climate change, air pollution is an increasingly serious health concern.
This is particularly true in urban areas. Although developed regions such as
California have seen decades of progress in decreasing air pollution through
mechanisms such as catalytic converters on automobiles and stricter restrictions
on emissions of particulate pollutants from sources such as diesel engines, the Los
Angeles region still exceeded the federal health standard for ozone during 85 days
in 2016. The current air pollution problems in developing megacities such as
Beijing, Delhi, and Mexico City remain more somber. However, to focus only on
large cities provides an incomplete picture of the problem at hand. According to
data from the World Health Organization, the Iranian city of Zabol, with a popu-
lation of less than 150,000 people, has the world’s worst concentrations of PM 2.5
pollution due to dust generated by the desiccation of surrounding wetlands. Taken
together, it has been estimated that globally air pollution contributes to some seven
million premature deaths each year.
How anticipated climatic changes over the twenty-first century will effect air
pollution is clearly of critical concern. However, it is a problem of great complexity
with much local and regional variation. In some instances, warmer temperatures
may attenuate local pollution by weakening atmospheric inversions. However, in
the case of many large cities such as Los Angeles, higher temperatures promote
increased rates of photochemical smog production. Decreased humidity may lessen
atmospheric mixing. In semiarid regions, the increasing subsidence associated with
stationary high pressure systems both decreases the potential of vertical dispersion
of atmospheric pollutants and promotes landscape desiccation and the production of
PM through fires and dust. There will be no simple global predictor for the influence
of climate change on air pollution, nor one simple solution. One important and
hopeful fact to bear in mind though is that as many of the sources of local air
v
pollution, such as fossil fuels, are also drivers of climate change, efforts to decrease
air pollutants will often contribute to decreasing climate change and vice versa.
With these challenges in mind, this volume is particularly timely and welcome.
With chapters that span in geographic coverage from Europe to Africa and Asia and
from Australia to North America and the Caribbean, the book provides a broad
coverage of many different environmental and climatic settings. The range of cities,
rural areas, and developed versus developing socioeconomic settings that are
considered by the various authors is impressive as are the types of pollutants and
health effects – including emissions from wildfires. In terms of science, the
complex nature of climate change and its likely impacts on air pollution require
just this type of broad analysis to begin appreciating its variability and the multi-
faceted challenges of mitigation. However, it is important to remember that the
solutions for decreasing the toll of climate change and associated changes in air
pollution will not be enacted by scientists but by policy makers. In this regard, it is
good to see both explicit treatments of important policy initiatives such as the Paris
Climate Agreement and the fact that considerations of policy and regulatory issues
are woven into many of the chapters. The threats to human health posed by climate
change and air pollution over the twenty-first century are daunting. However,
seeing a large group of researchers from different countries and disciplines come
together to produce this important compendium on the problem as it now stands and
what we might anticipate in the future gives hope. It is by such international team
efforts, from large-scale political agreements, such as the Paris Agreement, to
focused research products, such as this book, that this problem can be tackled.
Los Angeles, California, USA Glen M. MacDonald
vi Foreword
Acknowledgment
In the process of writing, editing, and preparing this book, there have been many
people who have encouraged, helped, and supported us with their skills, thoughtful
evaluation of chapters, and constructive criticisms.
First of all, we are indebted to all the contributors of chapters from both
developed and developing countries for providing the scholarly and innovative
scientific piece of research to make this book a reality. We are also thankful to the
reviewers who carefully and timely reviewed the manuscripts.
We are also grateful to Prof. Glen McDonald of the University of California, Los
Angeles, for writing the foreword, which adds greatly to the book with his thought-
ful insights.
Rais Akhtar thanks his family, wife, Dr. Nilofar Izhar; daughter, Dr. Shirin Rais;
and son-in-law, Dr. Wasim Ahmad, who encouraged and sustained him in devel-
oping the structure of the book and editing tasks, and he is deeply grateful for their
support and indulgence.
Cosimo Palagiano thanks his family, his daughters, Paola and Francesca
Romana, who morally sustained him in the work; he also thanks Daniele Priori
for the maps’ retouch and Gianfredi Pietrantoni, who controlled the final editing of
his chapter.
Finally and most essentially, we are deeply obliged to Springer and the entire
publishing team, without whose patience, immense competence, and support, this
book would not have come to fruition. We specially thank Dr. Robert K. Doe whose
energizing leadership ensured that this book would indeed translate to reality.
We are also thankful to Ms. Anjana Bhargavan and Mr. Krishna Pandurangan
for their constant guidance and cooperation during the preparation and review
process of the manuscript. We are also grateful to Professor A.R. Kidwai for his
useful suggestions.
Aligarh, India Rais Akhtar
Rome, Italy Cosimo Palagiano
vii
Contents
Part I Introductory
1 Climate Change and Air Pollution: An Introduction . . . . . . . . . . . 3
Rais Akhtar and Cosimo Palagiano
2 Air Quality in Changing Climate: Implications
for Health Impacts . . . . . . . . . . . . . . . . . . . . . . . . . . . . . . . . . . . . . 9
Sourangsu Chowdhury and Sagnik Dey
3 International Conferences on Sustainable Development
and Climate from Rio de Janeiro to Paris . . . . . . . . . . . . . . . . . . . . 25
Giovanni De Santis and Claudia Bortone
4 COP21 in Paris: Politics of Climate Change . . . . . . . . . . . . . . . . . . 41
Rais Akhtar
Part II Case Studies: Developed Countries/Regions
5 Climate Change Impacts on Air Pollution
in Northern Europe . . . . . . . . . . . . . . . . . . . . . . . . . . . . . . . . . . . . 49
Ruth M. Doherty and Fiona M. O’Connor
6 The Impact of Climate Change and Air Pollution
in the Southern European Countries . . . . . . . . . . . . . . . . . . . . . . . . 69
Cosimo Palagiano and Rossella Belluso
7 Canada: Climate Change, Air Pollution and Health . . . . . . . . . . . . 89
Stefania Bertazzon and Fox Underwood
8 Climate Change, Forest Fires, and Health in California . . . . . . . . . 99
Ricardo Cisneros, Don Schweizer, Leland (Lee) Tarnay, Kathleen
Navarro, David Veloz, and C. Trent Procter
ix
9 Air Pollution and Climate Change in Australia:
A Triple Burden . . . . . . . . . . . . . . . . . . . . . . . . . . . . . . . . . . . . . . . 131
Colin D. Butler and James Whelan
10 Epidemiological Consequences of Climate Change
(with Special Reference to Malaria in Russia) . . . . . . . . . . . . . . . . . 151
Svetlana M. Malkhazova, Natalia V. Shartova,
and Varvara A. Mironova
11 Climate Change and Projections of Temperature-Related
Mortality . . . . . . . . . . . . . . . . . . . . . . . . . . . . . . . . . . . . . . . . . . . . . 165
Dmitry Shaposhnikov and Boris Revich
12 Climate Change and Air Quality in Southeastern China:
Hong Kong Study . . . . . . . . . . . . . . . . . . . . . . . . . . . . . . . . . . . . . . 181
Yun Fat Lam
Part III Case Studies: Developing Countries/Regions
13 Trends and Seasonal Variations of Climate, Air Quality,
and Mortality in Three Major Cities in Taiwan . . . . . . . . . . . . . . . 199
Mei-Hui Li
14 Climate Change and Urban Air Pollution Health Impacts
in Indonesia . . . . . . . . . . . . . . . . . . . . . . . . . . . . . . . . . . . . . . . . . . 215
Budi Haryanto
15 Climate Change and Air Pollution in Malaysia . . . . . . . . . . . . . . . . 241
Nasrin Aghamohammadi and Marzuki Isahak
16 Climate Change, Air Pollution, and Human Health
in Bangkok . . . . . . . . . . . . . . . . . . . . . . . . . . . . . . . . . . . . . . . . . . . 255
Uma Langkulsen and Desire Rwodzi
17 Climate Change, Air Pollution and Human Health
in Delhi, India . . . . . . . . . . . . . . . . . . . . . . . . . . . . . . . . . . . . . . . . . 273
Hem H. Dholakia and Amit Garg
18 Climate Change and Air Pollution in Mumbai . . . . . . . . . . . . . . . . 289
S. Siva Raju and Khushboo Ahire
19 Climate Change and Air Pollution in East Asia: Taking
Transboundary Air Pollution into Account . . . . . . . . . . . . . . . . . . . 309
Ken Yamashita and Yasushi Honda
20 Climate Change, Air Pollution and Health in South Africa . . . . . . 327
Eugene Cairncross, Aqiel Dalvie, Rico Euripidou, James Irlam,
and Rajen Nithiseelan Naidoo
x Contents
21 The Impact of Climate Change and Air Pollution
on the Caribbean . . . . . . . . . . . . . . . . . . . . . . . . . . . . . . . . . . . . . . 349
Muge Akpinar-Elci and Olaniyi Olayinka
22 Compounding Factors: Air Pollution and Climate Variability
in Mexico City . . . . . . . . . . . . . . . . . . . . . . . . . . . . . . . . . . . . . . . . . 361
Marıa Eugenia Ibarraran, Ivan Islas, and Jose Abraham Ortınez
23 Air Pollution, Climate Change, and Human Health in Brazil . . . . . 375
Julia Alves Menezes, Carina Margonari, Rhavena Barbosa Santos,
and Ulisses Confalonieri
24 Climate Change, Air Pollution, and Infectious Diseases:
A New Epidemiological Scenario in Argentina . . . . . . . . . . . . . . . . 405
Daniel Oscar Lipp
Part IV Conclusion
25 Summary and Conclusion . . . . . . . . . . . . . . . . . . . . . . . . . . . . . . . . 421
Rais Akhtar and Cosimo Palagiano
Index . . . . . . . . . . . . . . . . . . . . . . . . . . . . . . . . . . . . . . . . . . . . . . . . . . . 427
Contents xi
About the Editors
Rais Akhtar is presently adjunct professor of the
International Institute of Health Management Research,
New Delhi. Formerly, he was national fellow and emer-
itus scientist (CSIR) at CSRD, Jawaharlal Nehru Uni-
versity, New Delhi, and visiting professor at the Dept.
of Geology, AMU, Aligarh. He has taught at Jawaharlal
Nehru University, New Delhi; the University of Zam-
bia, Lusaka; and the University of Kashmir, Srinagar.
He is recipient of a number of international fellowships
including Leverhulme fellowship (University of Liver-
pool), Henry Chapman fellowship (University of
London), visiting fellowship (University of Sussex), Royal Society fellowship
(University of Oxford) and visiting professorship (University of Paris 10). He
was lead author (1999–2007) on the Intergovernmental Panel Climate Change,
which is the joint winner of the Nobel Peace Prize for 2007. He is a recipient of
Nobel Memento. Professor Akhtar has to his credit 94 research papers and 17 books
published from India, the United Kingdom, the United States, Germany and the
Netherlands. His latest book is entitled Climate Change and Human Health Sce-nario in South and Southeast Asia, published in 2016 by Springer. Professor Rais
Akhtar is member of the Expert Group on Climate Change and Human Health of the
Ministry of Health and Family Welfare, Govt. of India.
xiii
Cosimo Cosimo is emeritus professor in geography
at the Department of Documentary, Linguistic-
Philological and Geographical Sciences, Sapienza
University of Rome; co-chair of the Joint IGU/ICA
Commission on Toponymy; and corresponding
member of the Accademia Nazionale dei Lincei, the
Accademia dell’Arcadia and the Istituto di Studi
Romani. His main research interests are medical geog-
raphy, geography of nutrition, history of cartography
and toponymy. He was director of the Institute of
Geography of Faculty of Letters and Philosophy and
of both the Department of Territorial and Urban Planning and the Department of
Geography of Sapienza University of Rome. For many years he has been in
the Steering Committee of the Societ�a Geografica Italiana and of the IGU
Commission on Health and Environment. He has been member of the scientific
board of the journals Geography, Environment, Sustainability and Espacio yTiempo. He is director of the journal Geografia.
xiv About the Editors

Part I
Introductory
Chapter 1
Climate Change and Air Pollution: AnIntroduction
Rais Akhtar and Cosimo Palagiano
Abstract Concern about air pollution has been known for thousands of years.
Complaints about its effects on human health and the built environment were first
voiced by the citizens of ancient Athens and Rome. Urban air quality, however,
worsened during the Industrial Revolution, as the widespread use of coal in
factories in Britain, Germany, the United States and other nations ushered in an
“age of smoke” (Mosley, 2014). As urban areas developed, pollution sources, such
as chimneys and industrial processes, were concentrated, leading to visible and
damaging pollution dominated by smoke. This introductory chapter discusses about
the impact of climate change on the level air pollution, and at same time highlights
that Weather and climate play important roles in determining patterns of air quality
over multiple scales in time and space, owing to the fact that emissions, transport,
dilution, chemical transformation, and eventual deposition of air pollutants all can
be influenced by meteorological variables such as temperature, humidity, wind
speed and direction, and mixing height.The chapter quoted empirical studies on air
pollution and impact on human health in both from developed and developing
countries.
Keywords CO2 emissions • Ecosystems • Kolkata • Donald Trump • BRICS •
Forest fires
According to Joseph Alcamo and Jørgen E. Olesen (2012), first of all we have to
define the gap between common perception of what we mean by “climate” and its
more scientific definition. In practice, climatologists in the first part of the twentieth
century decided to use and the need for invariance in the conditions from one period
to another. This led to the definition of 30-year climate norms, which started with
R. Akhtar (*)
International Institute of Health Management and Research (IIHMR), New Delhi, India
e-mail: [email protected]
C. Palagiano
Dipartimento Di Scienze Documentarie, Linguistico-Filologiche e Geografiche, Sapienza
University of Rome, Rome, Italy
e-mail: [email protected]
© Springer International Publishing AG 2018
R. Akhtar, C. Palagiano (eds.), Climate Change and Air Pollution,Springer Climate, DOI 10.1007/978-3-319-61346-8_1
3
the period covering 1901–1930. The latest climate norm is the period from 1961 to
1990. This period is also sometimes called the “climate normal period”. With
changing climates, one can question the applicability of 30-year periods in defining
climate. Air pollution is considered the world’s worst environmental risk. Though
poor air quality and climate change are very different phenomena, both are closely
related. The main sources of CO2 emissions – the extraction and burning of fossil
fuels – are not only key drivers of climate change but also major sources of air
pollutants. Furthermore, many air pollutants that are harmful to human health and
ecosystems also contribute to climate change. Thus, initiating actions to reduce the
pollution from fossil fuel burning will go a long way in improving air quality and
addressing climate change (Bell et al. 2007). This line of argument has been further
elaborated by Jacob and Winner who emphasized that “air quality is strongly
dependent on weather and is therefore sensitive to climate change”. Recent studies
have provided estimates of this climate effect through correlations of air quality
with meteorological variables perturbation analyses in chemical transport models
(CTMs) and CTM simulations driven by the general circulation model (GCM)
simulation of the twenty-first-century climate change (Jacob and Winner 2009).
Evidence from modelling studies suggests that climate is likely to increase con-
centration of ozone, one of the leading urban air pollutants responsible for respira-
tory problems (Kris and McGregor 2008).
Having said that, it should have been stressed that “weather and climate play
important roles in determining patterns of air quality over multiple scales in time
and space, owing to the fact that emissions, transport, dilution, chemical transfor-
mation, and eventual deposition of air pollutants all can be influenced by meteoro-
logical variables such as temperature, humidity, wind speed and direction, and
mixing height. There is growing recognition that development of optimal control
strategies for key pollutants like ozone and fine particles now requires assessment
of potential future climate conditions and their influence on the attainment of air
quality objectives. In addition, other air contaminants of relevance to human health,
including smoke from wildfires and airborne pollens and moulds, may be
influenced by climate change” (Kinney 2008). In the study by Kinney, the focus
was on the ways in which human health-relevant measures of air quality, including
ozone, particulate matter, and aeroallergens, may be influenced by climate vari-
ability and change.
It is true. The major effect of the greenhouse effect is the sudden alternation of
weather. The variability is a characteristic of the Mediterranean climate, but, during
the last decades, such variability is more marked. Rainfall intensity and alternating
high and low temperatures have strong impact on respiratory diseases, like influ-
enza and pneumonia, which are very dangerous to the elder population. In the
developed countries, the old people comprise the majority of the affected popula-
tion. Today there is an increase in admission cost to hospitals than in the past. In
addition the weather instability increases the number and the dangerousness of
viruses and parasites responsible for various diseases.
Focusing on the impacts of climate change on air pollution, particularly ozone
pollution, the Intergovernmental Panel on Climate Change (IPCC) has also clearly
4 R. Akhtar and C. Palagiano
stressed that “pollen, smoke and ozone levels likely to increase in warming world,
affecting health of residents in major cities. Rising temperatures will worsen air
quality through a combination of more ozone in cities, bigger wild fires and worse
pollen outbreaks, according to a major UN climate report. It is formed by the
reaction with sunlight (photochemical reaction) of pollutants such as nitrogen
oxides (NO2)” (Wynn 2014). Frequent forest fires in certain regions in Australia
and in the state of California are examples of such events. The World Meteorolog-
ical Organization (WMO) has now certified that 2016 was the warmest year.
With reference to human health implications, air pollution is currently the
leading environmental cause of premature deaths. The findings of the World Health
Organization (WHO) contend that air pollution is the world’s biggest environmen-
tal health risk, killing 7 million people in 2012 (in comparison to 4 million deaths
due to malaria and 3.1 million deaths of children under 5 due to malnutrition).
Deteriorating air quality will mostly affect the elderly, children, people with
chronic illness, and expectant mothers. Another report suggests that more than
5.5 million people die prematurely each year due to air pollution, with over half of
those deaths occurring in China and India (Indian Express, Feb.13, 2016). Scientists
have urged that in the face of future climate change, stronger emission controls are
enforced to avoid worsening air pollution and the associated exacerbation of health
problems, especially in more populated regions including megalopolises of the
world encompassing both developing and developed countries. The American
Lung Association’s “State of the Air” report indicates that 166 million Americans
are living in an environment with unhealthy ozone or particle pollution which
induces health risks (Milman 2016, American Lung Association 2016). Another
research highlights that “while the number of unhealthy polluted days has dropped
in the past year, more than half of US population lives in areas with potentially
dangerous air pollution, and about six out of 10 of the top cities for air pollution in
the USA are located in the state of California” (McHugh 2016). Brazil, Russia,
India, China, and South Africa (BRICS) have been drawing special attention due to
the pollution emissions released into the atmosphere by their increasing number of
industries and their exaggerated consumption of products (Cherni 2002).
In China alone, 1.2 million people die every year due to pollution. The estimated
cost of environmental degradation in China is 9% of its gross domestic product
(GDP), while it is 5.7% of its GDP for India (Zang 2015).
Another study by the researchers at the University of British Columbia in
Canada revealed that about 1.4 million people in the South Asian nation and
1.6 million in its northern neighbour died of illnesses related to air pollution in
2013. The Indian and Chinese fatalities accounted for 55% of such deaths world-
wide, the study said (Bhattacharya 2016).
This scenario has also been substantiated by the recently published State of GlobalAir 2017 report. The report asserts that 92% of the world’s population lives in areas
with unhealthy air, and China and India together were responsible for over half of the
total global attributable deaths. The study estimates that globally 2.7–3.4 million
preterm births may be associated with PM2.5 exposure and South Asia is the worst
hit, accounting for 1.6 million preterm births (Health Effects Institute 2017).
1 Climate Change and Air Pollution: An Introduction 5
Referring to Africa, John Vidal asserts that air pollution is more deadly than
malnutrition or dirty water. Vidal further elaborates that:
“Africa’s air pollution is causing more premature deaths than unsafe water or childhood
malnutrition, and could develop into a health and climate crisis reminiscent of those seen in
China and India. Governments in African countries are failing to address the links between
air pollution and global warming. While most major environmental hazards have been
improving with development gains and industrialisation, outdoor (or ‘ambient particulate’)air pollution from traffic, power generation and industries is increasing rapidly, especially
in fast-developing countries such as Egypt, South Africa, Ethiopia and Nigeria” (Vidal
2016).
At the Paris Climate Conference in 2015, world leaders were urged to cut air
pollution to save lives in poor countries. During the Paris climate summit, the
World Health Organization said that tackling air pollution and global warming in
tandem will reduce mortality in developing countries. However, even developed
countries like Australia and California (USA) are not safe when rising temperature
caused forest fires. A study published in the journal Environmental Health Per-spectives in 2012 calculated that exposure to smoke from wildfires was already
responsible for 339,000 premature deaths annually (Johnston 2012). Health impacts
of wildfire occurrences have also been predicted in another review paper published
in the Environmental Health Perspectives. The authors of the paper assert that
wildfires are likely to increase in many parts of the world due to changes in
temperature and precipitation patterns from global climate change. Wildfire
smoke contains numerous hazardous air pollutants, and many studies have
documented population health effects from this exposure (Reid et al. 2016). The
air we breathe outdoors could be harming more people than ever, a new study
suggests. Globally, more than 3 million people die prematurely each year from
prolonged exposure to air pollution, according to the World Health Organization.
By 2050, it could be 6.6 million premature deaths every year worldwide, a new
study predicts. Chronic exposure to air pollution particles contributes to the risk of
developing cardiovascular and respiratory diseases as well as lung cancer, WHO
said. “The total number of deaths due to HIV and malaria is 2.8 million per year”,
said Jos Lelieveld, a professor at the Max Planck Institute for Chemistry in
Germany and lead author of the study. “That’s half a million less than the number
of people who die from air pollution globally” (Ansari 2015). Residential energy
emissions or domestic air pollution from fuels used for cooking and heating,
especially in India and China, had the largest impact on deaths worldwide. In
another 10 years, Delhi will record the world’s largest number of premature deaths
due to air pollution among all mega cities in the world. By 2025, nearly 32,000
people in Delhi will die solely due to inhaling polluted air. However, it will be
another Indian city, Kolkata, that will record the highest number of such deaths by
2050 and Delhi will record the world’s largest number of premature deaths due to
air pollution (Sinha 2015).
The problems of climate change are not well considered by some people and
governments. For example, US President Donald Trump does not believe in the
damages caused by climate change to the environment and sadly reduced the
6 R. Akhtar and C. Palagiano
Environmental Protection Agency’s current funding by more than 31%. President
Trump announced on June 1, 2017, that he is withdrawing the United States from
the landmark Paris climate agreement, an extraordinary move that puzzled
America’s allies and placed great hindrance in the global effort to address the
warming planet.
References
Alcamo, Joseph and Olesen, Jorgen (2012) Life in Europe Under Climate Change,
Wiley-Blackwell
American Lung Association (2016) State of the Air, 2016. www.lung.org
Ansari A (2015) Study: more than six million could die early from air pollution every year. CNN
news, September 16
Bell ML, Goldberg R, Hogrefe C, Kinney PL, Knowlton K, Lynn B, Rosenthal J, Rosenzweig C,
Patz JA (2007) Climate change, ambient ozone, and health in 50 US cities. Clim Chang
82:61–76
Bhattacharya S (2016) India and China have most deaths from pollution. Wall Street J, February
2016
Cherni JA (2002) Economic growth versus the environment: the politics of wealth, health and air
pollution. Palgrave
Health Effects Institute (2017) First annual state of global air report, February 14, Boston
Jacob DJ, Winner DA (2009) Effect of climate change on air quality. Atmos Environ 43:51–63
Johnston FH (2012) Estimated global mortality attributable to smoke from landscape fires.
Environ Health Perspect 120:695–701
Kinney PL (2008) Climate change, air quality and human health. Am J Pre Med 35(5):459–446
Kris KL, McGregor G (2008) Climate change, tropospheric ozone and particulate matter, and
health impacts. Environ Health Perspect 116(11):1449–1456
McHugh J (2016) US air pollution. Worst cities for clean air are in California: report says, April
20. www.ibtimes.com/us-air-pollution-worst-cities-clean-air-are-california-report-says-23
Milman O (2016) More than half US population lives amid dangerous air pollution, report warns.
The Guardian, April 20
Reid CE et al (2016) Critical review of health impacts of wildfires smoke exposure. Environ
Health Perspect 124(9):1334–1343
Sinha K (2015) Delhi will record world’s largest number of premature deaths due to air pollution.
Times of India, September 17
Vidal J (2016) Air pollution more deadly in Africa than malnutrition or dirty water, study warns.
The Guardian, London, October 20
Wynn G (2014) Climate change will hike air pollution deaths says UN study. Climate Home,
March 28
Zang Q (2015) How much is pollution is costing China’s economy? Asia, DW.com, May 18
1 Climate Change and Air Pollution: An Introduction 7

Rais Akhtar is presently adjunct professor of the International
Institute of Health Management Research, New Delhi.
Cosimo Palagiano is emeritus professor in geography at the
Department of Documentary, Linguistic-Philological and Geo-
graphical Sciences, Sapienza University of Rome.
8 R. Akhtar and C. Palagiano
Chapter 2
Air Quality in Changing Climate: Implicationsfor Health Impacts
Sourangsu Chowdhury and Sagnik Dey
Abstract Poor air quality is a leading risk factor for global disease. Two major
pollutants – fine particulate matter (PM2.5) and surface ozone – are also linked to
climate change. A unified framework to quantify the morbidity and mortality
burden from air pollution exposure was developed in Global Burden of Disease
Study. 1500 and 2200 premature deaths from ozone and ambient PM2.5 exposure
can be attributed to past climate change (from pre-industrial era to present day).
For the future, air pollution exposure can be quantified by four Representative
Concentration Pathways (RCPs) emission scenarios in a modelling framework. In
addition to the role of climate change in modulating air quality in future, the
changes in socio-economic and demographic condition of the future population
are also expected to determine the burden due to air pollution. These may be
quantified using the demographic and socioeconomic drivers used in formulating
the Shared Socio-economic Pathways (SSP) scenarios. Combining the SSP and
RCP scenarios in a scenario matrix framework would lead to the estimate of
premature mortality burden for the future within an uncertainty range that can
drive the policymakers to exercise adequate mitigation measures, which are
expected to facilitate a healthier and climate secure society in future.
Keywords PM2.5 exposure • Ozone exposure • Changing climate • Premature
mortality burden • RCP scenarios • SSP scenarios
Air Quality, Exposure and Health Impacts
Chronic exposure to PM2.5 and ozone leads to cardiovascular and cardiopulmonary
diseases and lung cancer and eventually premature death of millions of people
worldwide (Cesaroni et al. 2014; Krewski et al. 2009; Pope et al. 2002; Chen et al.
2008). Some studies have depicted evidence of premature mortality due to diseases
like neurological disorders and diabetes from exposure to ambient PM2.5 (Gouveia
S. Chowdhury (*) • S. Dey
Centre for Atmospheric Sciences, Indian Institute of Technology Delhi, Hauz Khas,
New Delhi, India
e-mail: [email protected]; [email protected]
© Springer International Publishing AG 2018
R. Akhtar, C. Palagiano (eds.), Climate Change and Air Pollution,Springer Climate, DOI 10.1007/978-3-319-61346-8_2
9
and Fletcher 2000; Bell et al. 2004). Though the problem is fast growing in the
developing world (West et al. 2016), health impacts of air pollution have been
documented in the developed countries even at very low air pollution exposure (Shi
et al. 2015). PM2.5 is emitted from various natural and anthropogenic sources and its
spatio-temporal variation is modulated by meteorology and topography. Global
burden of disease (GBD) effort (Lim et al. 2012; Murray 2015) establishes a unified
framework to quantify the morbidity and mortality burden of air pollution globally.
Studies showing evidence of mortality and morbidity due to diseases like chronic
obstructive pulmonary diseases (COPD), ischemic heart diseases (IHD), stroke,
lung cancer, diabetes and acute lower respiratory infection from PM2.5 exposure are
mostly limited to the developed countries. To address this issue, an integrated
exposure-response (IER) function (Burnett et al. 2014) was developed for risk
estimation by incorporating exposure spanning across ambient air pollution, house-
hold air pollution, passive smoking and active smoking (Burnett et al. 2014). This
risk function enabled comparative assessment of the burden of diseases from air
pollution across the world (Arnold 2014).
Exposure to ozone primarily affects the lungs causing short-term changes in lung
function and escalates respiratory syndromes (Bell et al. 2004, 2005). Chronic long-
term exposure to ozone may result in permanent impairment of the lungs, damage
of the tissues lining the airways and development of pulmonary fibrosis (Lin et al.
2008; Jerrett et al. 2009; Li et al. 2016). Tropospheric ozone exposure not only
results in impairment of human health but also damages vegetation with substantial
reduction in crop yield and crop quality (Morgan et al. 2006; Avnery et al. 2011). In
India wheat production is impacted the most due to exposure to ozone with an
estimated loss of 3.5 � 0.8 million tons followed by rice and other cereals (Ghude
et al. 2014). On national scale, the yield loss due to ozone exposure is about 9.2% of
the cereals required every year under the provisions of the recently implemented
National Food Security Bill (2013) by the Government of India. Climate change
can further exacerbate the current situation as it has been projected that ozone
exposure will increase in the future (Horowitz 2006). This may lead to food
shortage, which in turn can cause malnourishment impacting the health indirectly.
A study by Jerrett et al. (2009) followed up 448,850 subjects as a part of the
American Cancer Society Cancer Prevention Study II for 18 years and found that
the relative risk (which may be defined as the ratio of probability of an event
occurring in an exposed group to the probability of an event occurring in compar-
ison with nonexposed group) of death from exposure to ground-level ozone due to
respiratory causes with a 10 ppb increase in ozone concentration was 1.040 (95% CI
1.010–1.067). A global study (Anenberg et al. 2010) estimated that about 0.7 � 0.3
million premature death/year can be attributed globally to ozone exposure. Another
estimate (Silva et al. 2013) used ACCIMIP model simulations to determine expo-
sure to ozone, the mortality attributed to exposure to ozone for past climate change
(1850 to present day) was estimated to be around 1500 (�20,000 – 27,000) deaths/
year. An India-based study (Ghude et al. 2016) has used a chemical transport model
to estimate the exposure, and the resulting premature death due to chronic obstruc-
tive pulmonary diseases was estimated to be ~12,000 using the 2011 census data for
10 S. Chowdhury and S. Dey
the exposed population. Premature mortality (Mort) is generally estimated as a
function of exposed population (Pop), relative risk (RR) and the background
mortality (BM) rate (Anenberg et al. 2010; Murray 2015; Chowdhury and Dey
2016; Silva et al. 2016) and can be expressed as in Eq. 2.1. RR can be estimated as a
function of exposure to pollutants (Pope et al. 2002; Burnett et al. 2014).
Mort ¼ Pop� BM � RR� 1
RRð2:1Þ
Climate Change and Air Pollution
Since the Industrial Revolution, human activities have released huge amounts of
carbon dioxide and other greenhouse gases (GHG) into the atmosphere, primarily
from fossil fuel burning, to meet the energy demand of the growing population and
industrial needs. Other activities like agricultural waste and solid fuel burning also
contribute to climate-warming pollutants. Black carbon aerosol that is mostly
emitted from incomplete combustion of fossil fuel, biofuel and biomass warms
the atmosphere, which in turn influences the global and regional wind patterns,
humidity and precipitation. Black carbon is also a major component of ambient
PM2.5. Therefore, reducing black carbon has co-benefits to limit climate change and
avert premature mortality burden. Changing meteorology under warming climate is
expected to play an important role in modulating PM2.5 by controlling its dispersion
and life cycle due to changes in boundary layer depth, wind circulation pattern,
precipitation frequency, relative humidity and temperature. Globally the climate is
expected to become more stagnant in the future with weaker global circulation and
decreasing frequency of mid-latitude cyclones (Daniel and Winner 2009). With
increasing stagnation, the pollutants are expected to get piled near the surface
thereby increasing the relative exposure. Increased humidity in the future can
tend to influence local air quality at individual scale by diminishing ambient
bio-aerosols (pollens, grains, spores and other aero-allergens) as they tend to
clump together and become less respirable. Changes in precipitation pattern may
also affect the aerosol scavenging. Wind speed and precipitation are projected to
increase over India (Christensen et al. 2007; Menon et al. 2013) in the future under
the warming climate. Although not much information is available about the
projected mixing layer depth over India, it is expected that increasing temperature
and wind speed will contribute towards expanding the mixing layer depth. It is
implied that these projected meteorological factors in the future will contribute to
escalated washout and ventilation. Thus we may expect that meteorology will
partially help in reducing PM2.5 exposure irrespective of the projected exposure
strength in future.
Ozone is a secondary air pollutant formed in the atmosphere by photochemical
processes in the presence of precursors like oxides of nitrogen (NOx) and volatile
2 Air Quality in Changing Climate: Implications for Health Impacts 11
organic compounds (VOC) which are mostly emitted by mobile vehicular sources
(cars, trucks, etc.), industrial sources and natural sources like lightening, forest and
grassland fires. In urban areas, power plants, industries, chemical solvents and
vehicular emissions are the primary sources of the ozone precursors. In presence
of sunlight, these precursors undergo chemical transformation to form ozone. The
chemistry of ozone formation is temperature dependent and occurs in multiple
number of steps. Methane (emitted primarily due to fossil fuel use, biomass
burning, livestock farming, landfills and waste) which is one of the major compo-
nents responsible for global warming is also one of the major components of VOC,
but in urban settings, the non-methane volatile organic compounds (NMVOC)
emitted generally outpace methane as the major component of VOC responsible
for ozone formation. West et al. (2006) shows that reducing global anthropogenic
methane emissions by 20% will avert around 30,000 premature deaths in 2030, and
the cost-effectiveness of methane reduction is expected to be around $420,000 per
avoided mortality (West et al. 2006). Thus it can be argued that mitigating methane
emission can help to improve air quality globally bringing multiple benefits for air
quality, climate, public health, agriculture and energy. With temperature projected
to increase globally in the future (Daniel and Winner 2009), the ozone concentra-
tion is expected to escalate (Kinney 2008).
From Pre-industrial Era to Present Day
Since the pre-industrial era, human activities led to degradation of air quality across
the globe. Measurements at various sites across the northern hemisphere indicate
that surface ozone has increased by about fourfolds from 1860s to 2000s (Marenco
et al. 1998). The change of surface concentration and exposure to PM2.5 and ozone
from the pre-industrial period to present can be attributed to multiple factors (Fang
et al. 2013) – (a) changes in direct emissions of their constituents and precursors,
(b) climate change induced changes in surface emissions, (c) the influence of
increasing CH4 concentration on tropospheric chemistry and (d) changes and
transition in demographical features. Fang et al. 2013 have reported that global
population-weighted PM2.5 and O3 have increased by about 8� 0.16 μg/m3 and
30� 0.16 ppb, respectively, from the period 1860 to 2000 utilizing the Geophysical
Fluid Dynamics Laboratory Atmospheric Model, version 3. Another study by Silva
et al. (2013) used Atmospheric Chemistry and Climate Model Intercomparison
Project (ACCMIP) group of models to conclude that global population-weighted
PM2.5 and ozone exposure increased by about 7.3 μg/m3 and 26.5 ppb, respectively.
Global mean concentrations of PM2.5 and ozone in 1850 were estimated to be
11.4 μg/m3 and 28 ppb, respectively, while the corresponding values in 2000
changed to 18.6 μg/m3 and 54.5 ppb, respectively. Over the Indian landmass,
mean concentrations of PM2.5 and ozone increased from 14.3 μg/m3 and
33.2 ppb, respectively, in 1850 to 22 μg/m3 and 61.9 ppb, respectively, in 2000.
The exposure over India and South Asia is generally underestimated by the global
12 S. Chowdhury and S. Dey
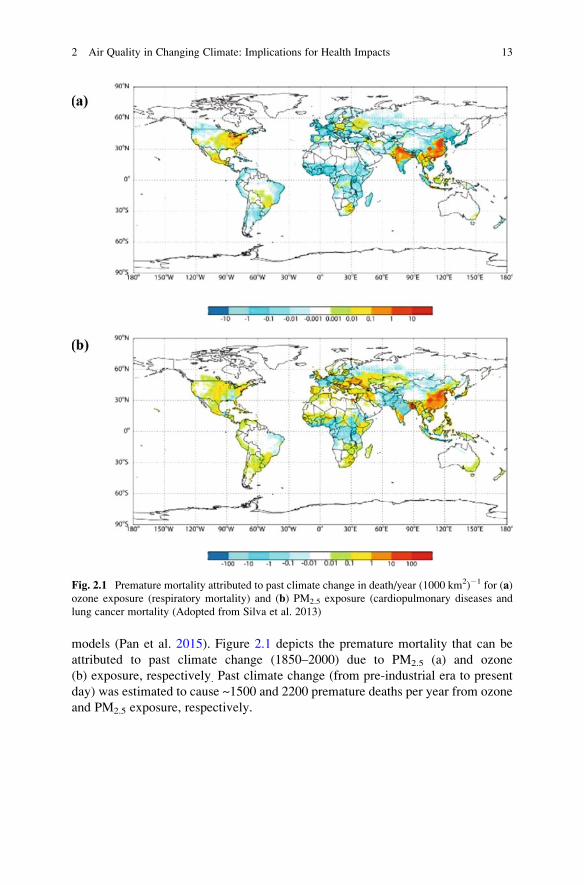
models (Pan et al. 2015). Figure 2.1 depicts the premature mortality that can be
attributed to past climate change (1850–2000) due to PM2.5 (a) and ozone
(b) exposure, respectively. Past climate change (from pre-industrial era to present
day) was estimated to cause ~1500 and 2200 premature deaths per year from ozone
and PM2.5 exposure, respectively.
Fig. 2.1 Premature mortality attributed to past climate change in death/year (1000 km2)�1 for (a)ozone exposure (respiratory mortality) and (b) PM2.5 exposure (cardiopulmonary diseases and
lung cancer mortality (Adopted from Silva et al. 2013)
2 Air Quality in Changing Climate: Implications for Health Impacts 13
Future Projections
Future air quality will be influenced by changes in emission and meteorology in
warming climate. Changes in anthropogenic emissions are expected to dominate in
the near future (Kirtman et al. 2013) and depend on various socio-economic factors
such as demographic transition, economic growth, energy demand, technological
choices, land use changes and implementation of policies regarding climate and air
quality. Following a meeting on 8th September, 2008, a global initiative was taken
for climate modelling under the fifth phase of the Coupled Climate Model
Intercomparison Project (CMIP5) to enhance the earlier activities by incorporating
20 climate modelling groups from around the world (Taylor et al. 2012). These
model simulations were targeted to focus on major gaps in understanding past and
future climate changes described by Moss et al. (2010). The RCPs (summarized in
Table 2.1) unlike the Special Report on Emission Scenarios (SRES) used for the
earlier CMIP3 simulations include policy interventions and are built based on a
range of projections of future socio-economic factors. These scenarios assume that
certain policy actions will be taken to achieve certain emission targets. The labels of
the four RCPs (RCP2.6, RCP4.5, RCP6 and RCP8.5) indicate a rough estimate of
the radiative forcing at the end of the twenty-first century. Apart from the CMIP5
models, various chemical transport models (CTMs) like GEOS-Chem, WRF Chem
and CMAQmodels can also be utilized to estimate the concentration of the criterion
pollutants. The CMIP5 and CTMmodel simulations for the projected concentration
of various PM2.5 components (viz. dust, black carbon, primary organic aerosols,
secondary organic aerosols, sea salt and sulphate), VOC and NOx in the future
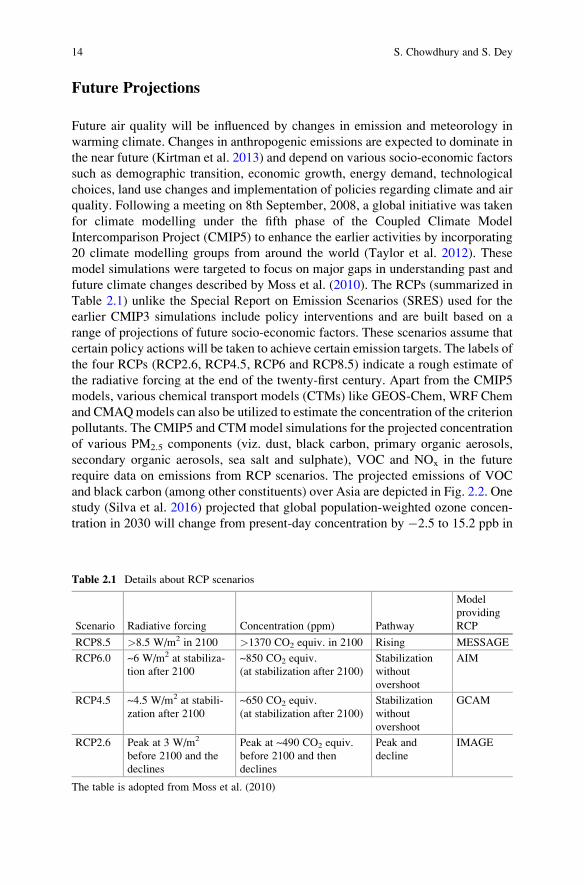
require data on emissions from RCP scenarios. The projected emissions of VOC
and black carbon (among other constituents) over Asia are depicted in Fig. 2.2. One
study (Silva et al. 2016) projected that global population-weighted ozone concen-
tration in 2030 will change from present-day concentration by �2.5 to 15.2 ppb in
Table 2.1 Details about RCP scenarios
Scenario Radiative forcing Concentration (ppm) Pathway
Model
providing
RCP
RCP8.5 >8.5 W/m2 in 2100 >1370 CO2 equiv. in 2100 Rising MESSAGE
RCP6.0 ~6 W/m2 at stabiliza-
tion after 2100
~850 CO2 equiv.
(at stabilization after 2100)
Stabilization
without
overshoot
AIM
RCP4.5 ~4.5 W/m2 at stabili-
zation after 2100
~650 CO2 equiv.
(at stabilization after 2100)
Stabilization
without
overshoot
GCAM
RCP2.6 Peak at 3 W/m2
before 2100 and the
declines
Peak at ~490 CO2 equiv.
before 2100 and then
declines
Peak and
decline
IMAGE
The table is adopted from Moss et al. (2010)
14 S. Chowdhury and S. Dey
2030 across all the RCP scenarios using data from 14 ACCMIP models, while the
change is projected to range from �11.7 to 13.6 ppb in 2100. They project an
overall decrease of global population-weighted PM2.5 exposure by 2100 ranging
from �0.4 to �5.7 μg/m3 across six ACCMIP models for all the RCP scenarios.
Projected Exposure to Ground-Level Ozone and AmbientPM2.5
Very few studies have attempted to estimate the future exposure to ozone and
PM2.5. A recently published study (Madaniyazi et al. 2015) recognized the urgency
to project premature mortality due to exposure to air pollutants in developing
countries to facilitate implementation of policies. They also suggested that multi-
model ensembles should be used to project the exposure to the air pollutants and
Fig. 2.2 Shows the emission of VOC (a) and black carbon (b) in future over Asia as projected bythe RCP scenarios. These emissions go into the CMIP5 model simulations to determine the
concentration of the pollutants in future decades. The figures are generated from the RCP scenario
database hosted by IIASA
2 Air Quality in Changing Climate: Implications for Health Impacts 15
related excess premature mortality to better quantify the related uncertainty.
Another study (Selin et al. 2009) used GEOS-Chem model to simulate future
PM2.5 exposure. Global ozone exposure is expected to increase by 6.1 ppb at the
end of 2050, whereas the increase is expected to be about 24.4 ppb over India. They
estimated that around 812,000 excess premature deaths per year can be attributed to
exposure to ozone in 2050 as compared to 2000 due to changes in emission and
climate. Recently, Silva et al. (2016) used an ensemble of ACCMIP models and
projected global mortality burden due to ozone exposure to increase markedly from
382,000 (121,000–728,000) in 2000 to between 1.09 and 2.36 million deaths/year
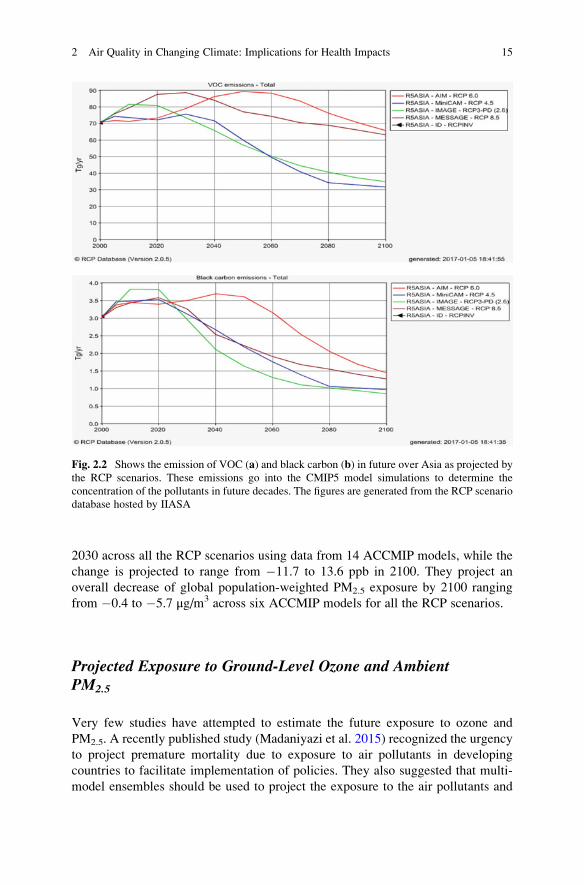
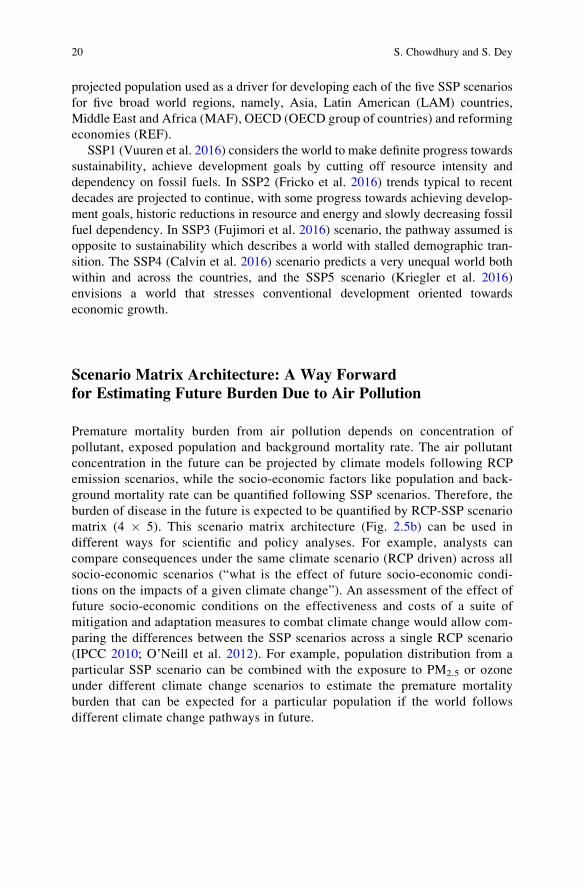
across all four RCPs in 2100. Figure 2.3 shows the projected premature mortality
for three future decades. This study also identifies that change in premature ozone-
related respiratory mortality/year in India in 2100 with respect to 2000 is projected
to range from �230,000 to 292,000 across all the RCP scenarios.
The most unsettled issue regarding projection of aerosol concentration and
PM2.5 in future is whether PM2.5 is expected to decrease or increase in future.
Allen et al. (2016) projected that aerosol concentration is expected to increase in
future, whereas Silva et al. (2016) projected that PM2.5 exposure is expected to
decrease relative to present-day exposure by the end of the century. Tagaris et al.
(2009) used CMAQ modelling system to estimate 4000 premature mortality/year
from PM2.5 exposure in the USA due to climate change by the end of 2050. Tainio
Fig. 2.3 Future ozone respiratory mortality for all RCP scenarios in 2030, 2050 and 2100,
showing the multi-model average in each grid cell, for future air pollutant concentrations relative
to 2000 concentrations (Adopted from Silva et al. 2016)
16 S. Chowdhury and S. Dey
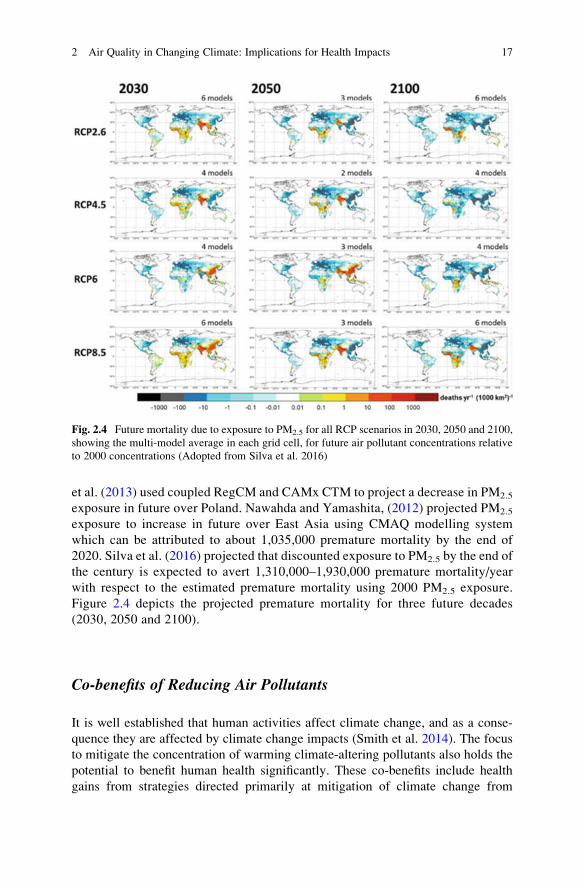
et al. (2013) used coupled RegCM and CAMx CTM to project a decrease in PM2.5
exposure in future over Poland. Nawahda and Yamashita, (2012) projected PM2.5
exposure to increase in future over East Asia using CMAQ modelling system
which can be attributed to about 1,035,000 premature mortality by the end of
2020. Silva et al. (2016) projected that discounted exposure to PM2.5 by the end of
the century is expected to avert 1,310,000–1,930,000 premature mortality/year
with respect to the estimated premature mortality using 2000 PM2.5 exposure.
Figure 2.4 depicts the projected premature mortality for three future decades
(2030, 2050 and 2100).
Co-benefits of Reducing Air Pollutants
It is well established that human activities affect climate change, and as a conse-
quence they are affected by climate change impacts (Smith et al. 2014). The focus
to mitigate the concentration of warming climate-altering pollutants also holds the
potential to benefit human health significantly. These co-benefits include health
gains from strategies directed primarily at mitigation of climate change from
Fig. 2.4 Future mortality due to exposure to PM2.5 for all RCP scenarios in 2030, 2050 and 2100,
showing the multi-model average in each grid cell, for future air pollutant concentrations relative
to 2000 concentrations (Adopted from Silva et al. 2016)
2 Air Quality in Changing Climate: Implications for Health Impacts 17
policies implicated for health benefits (Haines et al. 2007; Smith and Balakrishnan
2009). In a nutshell, co-benefits are positive impacts on human health that arise
from interventions to reduce the emission of climate-altering air pollutants.
Co-benefits can be achieved in many ways (Smith et al. (2014) and references
therein). For example, the reduction of co-pollutants from household solid fuel
combustion will result in reduced exposure to air pollutants that are associated with
diseases like chronic and acute respiratory illnesses, lung cancer, low birth weights
and still births and tuberculosis. On the other hand, controlling household combus-
tion of solid fuels will reduce emission of black carbon, CH4, CO and other climate-
altering air pollutants. Reduction in CH4 and CO emission will also restrict the
formation of tropospheric ozone. Cutting down the emission of health damaging
co-pollutant from industries will reduce outdoor exposure to ambient air pollution
and hence has the potential to avert large premature mortality. The benefits for
climate include reduction in emission of climate-altering air pollutants like black
carbon, CO and CH4. Increased energy efficiency will reduce fuel demands and
hence reduce emissions of climate-altering air pollutants. Health benefits of
increased urban green space include reduced temperature and heat island effect,
physiological benefits and better self-perceived health status. It also helps in
partially reducing atmospheric CO2 via carbon sequestration in plant tissues and
soil. Increased urban greeneries will also facilitate deposition of climate-altering air
pollutants emitted from various vehicular and industrial sources.
Few studies quantify the health and climate benefits of reducing climate-altering
air pollutants. A study in India found that the benefits of hypothetically reducing
solid fuel combustion in households by introducing clean cook stoves would help to
avert about 2 million premature death and 55 million DALYs over the period of
10 years and reduction of 0.5–1 billion tons of CO2 equivalent (Wilkinson et al.
2009). A study (Markandya et al. 2009) assessed the changes in emission of PM2.5
and subsequent effects on human health that could result from climate change
mitigation aimed to halve the GHG emission by 2050 from the electricity genera-
tion sector of India, China and European Union. In all these three regions, changes
in modes of production of electricity to reduce CO2 emission were associated with
reduction in PM2.5-related premature mortality.
Socio-economic Projection for Vulnerability Assessment
Certain group of population is more vulnerable and susceptible to air pollution than
the others, like children, people with pre-existing heart and lung diseases, people
with diabetes, outdoor workers and aged people (Balbus and Malina 2009; Makri
and Stilianakis 2008). Socio-economic factors also influence the susceptibility
towards air pollution exposure in terms of disproportionate exposure, coping
capacities and access to health care (Makri and Stilianakis 2008). The most
vulnerable population are the homeless with six times more odds to be morbid or
die due to lungs or respiratory infections, asthma and cardiovascular and pulmonary
diseases.
18 S. Chowdhury and S. Dey
To assess the relationships between socio-economic development in response to
climate change, the Integrated Assessment Modelling (IAM) and the Impacts,
Adaptation and Vulnerability (IAV) group launched a set of scenarios that describe
the future in terms of social and economic mitigation and adaptation challenges
known as the Shared Socio-economic Pathways (SSP) (O’Neill et al. 2012; Ebiet al. 2014). This set of scenarios provides projections by age, sex and six levels of
education for all the countries. The five SSP scenarios are a green growth strategy
(SSP1), a middle of the road development pattern (SSP2), a fragmentation between
the regions (SSP3), an increase in inequality across and within regions (SSP4) and a
fossil fuel-based economic development (SSP5). To encompass a wide range of
possible development pathways, the SSP are defined in terms of socio-economic
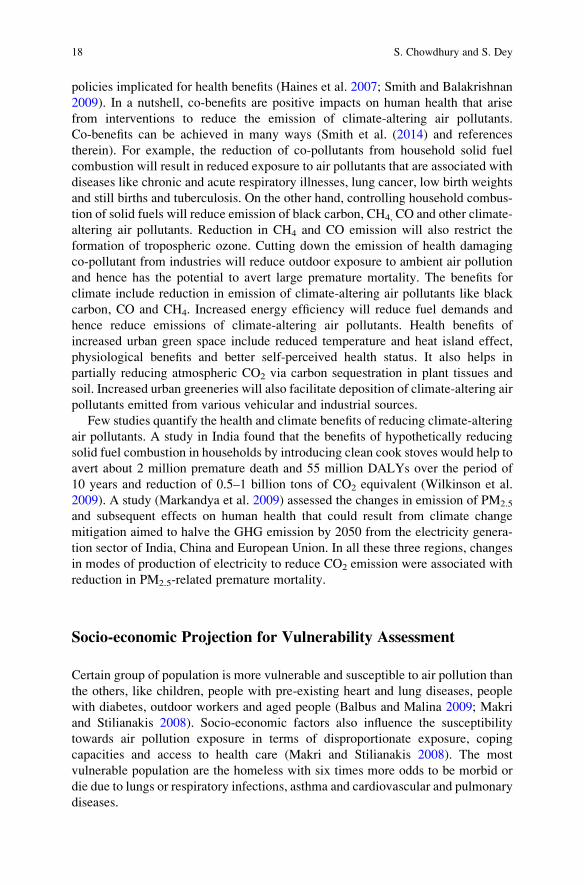
challenges to mitigation and to adaptation (Fig. 2.5a). Figure 2.6 shows the
Fig. 2.5 (Left) The scenario space spanned by the SSP scenarios and (right) the scenario matrix
architecture (Both figures are adapted from IPCC 2010)
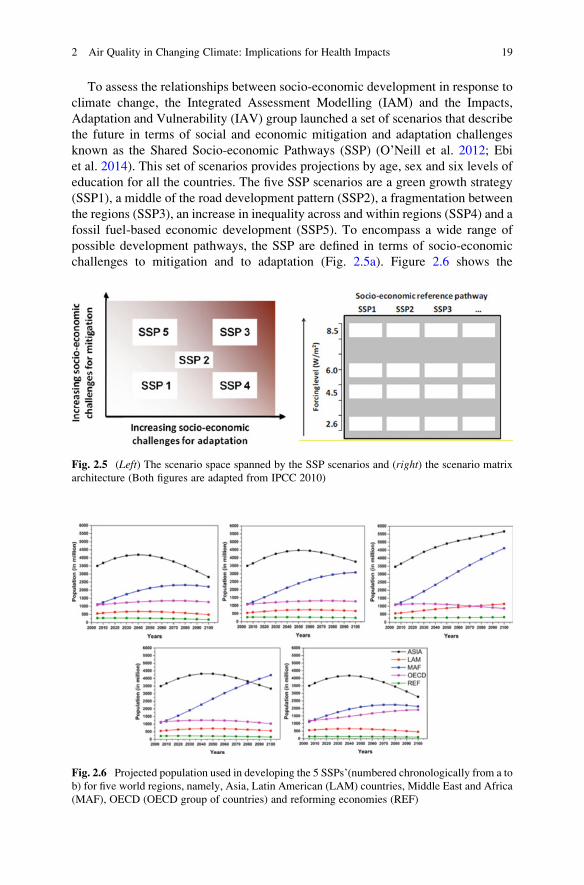
Fig. 2.6 Projected population used in developing the 5 SSPs’(numbered chronologically from a to
b) for five world regions, namely, Asia, Latin American (LAM) countries, Middle East and Africa
(MAF), OECD (OECD group of countries) and reforming economies (REF)
2 Air Quality in Changing Climate: Implications for Health Impacts 19
projected population used as a driver for developing each of the five SSP scenarios
for five broad world regions, namely, Asia, Latin American (LAM) countries,
Middle East and Africa (MAF), OECD (OECD group of countries) and reforming
economies (REF).
SSP1 (Vuuren et al. 2016) considers the world to make definite progress towards
sustainability, achieve development goals by cutting off resource intensity and
dependency on fossil fuels. In SSP2 (Fricko et al. 2016) trends typical to recent
decades are projected to continue, with some progress towards achieving develop-
ment goals, historic reductions in resource and energy and slowly decreasing fossil
fuel dependency. In SSP3 (Fujimori et al. 2016) scenario, the pathway assumed is
opposite to sustainability which describes a world with stalled demographic tran-
sition. The SSP4 (Calvin et al. 2016) scenario predicts a very unequal world both
within and across the countries, and the SSP5 scenario (Kriegler et al. 2016)
envisions a world that stresses conventional development oriented towards
economic growth.
Scenario Matrix Architecture: A Way Forwardfor Estimating Future Burden Due to Air Pollution
Premature mortality burden from air pollution depends on concentration of
pollutant, exposed population and background mortality rate. The air pollutant
concentration in the future can be projected by climate models following RCP
emission scenarios, while the socio-economic factors like population and back-
ground mortality rate can be quantified following SSP scenarios. Therefore, the
burden of disease in the future is expected to be quantified by RCP-SSP scenario
matrix (4 � 5). This scenario matrix architecture (Fig. 2.5b) can be used in
different ways for scientific and policy analyses. For example, analysts can
compare consequences under the same climate scenario (RCP driven) across all
socio-economic scenarios (“what is the effect of future socio-economic condi-
tions on the impacts of a given climate change”). An assessment of the effect of
future socio-economic conditions on the effectiveness and costs of a suite of
mitigation and adaptation measures to combat climate change would allow com-
paring the differences between the SSP scenarios across a single RCP scenario
(IPCC 2010; O’Neill et al. 2012). For example, population distribution from a
particular SSP scenario can be combined with the exposure to PM2.5 or ozone
under different climate change scenarios to estimate the premature mortality
burden that can be expected for a particular population if the world follows
different climate change pathways in future.
20 S. Chowdhury and S. Dey
Concluding Remarks
Despite continuous efforts to restrict various sources of pollutants by the government,
air pollution remains as one of the major environmental hazards in India (Dey and Di
Girolamo 2011). GBD study shows large premature mortality from air pollution
exposure in India. However, burden estimates at regional level needs to be adjusted
for the local condition. Our recent study (Chowdhury and Dey 2016) estimated about
800,000 premature adult deaths per year by adjusting for the heterogeneity in back-
ground mortality rate as a function of socio-economic development represented in
terms of gross domestic product. Following example will clarify the importance of
local adjustment. Delhi has the highest ambient PM2.5 exposure in India, but at the
same time, its GDP is also one of the highest in the country. If the baselinemortality of
Delhi is not adjusted and instead a single India-specific value is considered, the
premature mortality burden of Delhi is overestimated. Similarly, the burden would
have been underestimated in regions that are less developed and have higher back-
ground mortality than all-India average. Therefore, identification of vulnerable
regions based on prematuremortality burden and prioritization ofmitigationmeasures
in these regions should be facilitated by such analysis.
The exposure to PM2.5 and ozone has been increasing over India in the last
decade (Saraf and Beig 2004; Dey and Di Girolamo 2011; Dey et al. 2012) resulting
in increasing number of the population being pitched at risk of dying prematurely.
What intrigues the policymakers is whether exposure to air pollution will continue
to increase in the future. To project future premature mortality from air pollution
exposure for India or any other country, the scenario matrix framework will be
useful, because it will enable to isolate the relative roles of meteorological, demo-
graphic and epidemiological changes on the projected burden. Such strategic
knowledge will provide the government adequate information to formulate policy
to mitigate air pollution and develop climate change resilient society.
Acknowledgement Financial support from the Department of Science and Technology, Govern-
ment of India, through a research grant (DST/CCP/NET-2/PR-36/2012(G)) under the first phase of
the network program of “climate change and human health” is acknowledged.
References
Allen RJ, Landuyt W, Rumbold ST (2016) An increase in aerosol burden and radiative effects in a
warmer world. Nat Clim Change 6:269–274. doi:10.1038/NCLIMATE2827
Anenberg SC, Horowitz LW, Tong DQ, West JJ (2010) An estimate of the global burden of
anthropogenic ozone and fine particulate matter on premature human mortality using atmo-
spheric modeling. Environ Health Perspect 118:1189–1195. doi:10.1289/ehp.0901220
Arnold C (2014) News|science selections disease burdens associated with PM 2.5 exposure how a
new model provided global estimates. Environ Health Perspect 13:981277
Avnery S, Mauzerall DL, Liu J, Horowitz LW (2011) Global crop yield reductions due to surface
ozone exposure: 1. Year 2000 crop production losses and economic damage “and” Global crop
yield reductions due to surface ozone exposure: 2. Year 2030 potential crop production losses
2 Air Quality in Changing Climate: Implications for Health Impacts 21
and economic damage under. Atmos Environ 45:2297–2309. doi:10.1016/j.atmosenv.2012.12.
045
Balbus John M, Malina Catherine M (2009) Identifying vulnerable subpopulations for climate
change health effects in the United States. J Occup Environ Med 51:33–37. doi:10.1097/JOM.
0b013e318193e12e
Bell ML, Samet JM, Dominici F (2004) Time-series studies of particulate matter. Annu Rev Public
Health 25:247–280. doi:10.1146/annurev.publhealth.25.102802.124329
Bell ML, Dominici F, Samet JM (2005) A meta-analysis of time-series studies of ozone and
mortality with comparison to the National Morbidity, mortality, and air pollution study.
Epidemiology 16:436–445. doi:10.1001/jama.292.19.2372.Ozone
Burnett RT, Arden Pope C, Ezzati M et al (2014) An integrated risk function for estimating the
global burden of disease attributable to ambient fine particulate matter exposure. Environ
Health Perspect 122:397–403. doi:10.1289/ehp.1307049
Calvin K, Bond-lamberty B, Clarke L et al (2016) The SSP4: A world of deepening inequality.
Glob Environ Chang. doi:10.1016/j.gloenvcha.2016.06.010
Chen H, Goldberg MS, Villeneuve PJ (2008) A systematic review of the relation between long-
term exposure to ambient air pollution and chronic diseases. Rev Environ Health 23:243–297.
doi:10.1515/reveh.2008.23.4.24
Chowdhury S, Dey S (2016) Cause-specific premature death from ambient PM2.5 exposure in
India: estimate adjusted for baseline mortality. Environ Int 91:283–290. doi:10.1016/j.envint.
2016.03.004
Christensen JH, Hewitson B, Busuioc A, et al (2007) Regional climate projections. In: Climate
change 2007: the physical science basis. Contribution of Working Group I to the Fourth
Assessment Report of the Intergovernmental Panel on Climate Change
Daniel JJ, Winner DA (2009) Effect of climate change on air quality. Atmos Environ 43:51–63.
10.1016/j.atmosenv.2008.09.051
Dey S, Di Girolamo L (2011) A decade of change in aerosol properties over the Indian subcon-
tinent. Geophys Res Lett 38:1–5. doi:10.1029/2011GL048153
Dey S, Di Girolamo L, van Donkelaar A et al (2012) Variability of outdoor fine particulate
(PM2.5) concentration in the Indian subcontinent: a remote sensing approach. Remote Sens
Environ 127:153–161. doi:10.1016/j.rse.2012.08.021
Ebi KL, Hallegatte S, Kram T, et al (2014) A new scenario framework for climate change research:
background, process, and future directions. pp 363–372. doi:10.1007/s10584-013-0912-3
Fang Y, Naik V, Horowitz LW, Mauzerall DL (2013) Air pollution and associated human
mortality: the role of air pollutant emissions, climate change and methane concentration
increases from the preindustrial period to present. Atmos Chem Phys 13:1377–1394. doi:10.
5194/acp-13-1377-2013
Fricko O, Havlik P, Rogelj J et al (2016) The marker quantification of the Shared Socioeconomic
Pathway 2: a middle-of-the-road scenario for the 21st century. Glob Environ Chang.
doi:10.1016/j.gloenvcha.2016.06.004
Fujimori S, Hasegawa T, Masui T et al (2016) SSP3: AIM implementation of shared socioeco-
nomic pathways. Glob Environ Chang. doi:10.1016/j.gloenvcha.2016.06.009
Ghude SD, Jena C, Chate DM et al (2014) Reductions in India’s crop yield due to ozone. GeophysRes Lett 41:5685–5691. doi:10.1002/2014GL060930
Ghude SD, Chate DM, Jena C et al (2016) Premature mortality in India due to PM 2.5 and ozone
exposure. Geophys Res Lett 43:4650–4658. doi:10.1002/2016GL068949
Gouveia N, Fletcher T (2000) Time series analysis of air pollution and mortality: effects by cause,
age and socioeconomic status. J Epidemiol Community Health 54:750–755. doi:10.1136/jech.
54.10.750
Haines A, Smith KR, Anderson D et al (2007) Policies for accelerating access to clean energy,
improving health, advancing development, and mitigating climate change. Lancet
370:1264–1281. doi:10.1016/S0140-6736(07)61257-4
22 S. Chowdhury and S. Dey
Horowitz LW (2006) Past, present and future concentrations of tropospheric ozone and aerosols:
methodology, ozone evaluation, and sensitivity to aerosol wet removal. J Geophys Res Atmos.
doi:10.1029/2005JD006937
IPCC (2010) IPCC workshop on socio-economic scenarios. IPCC Work Socio-Economic Scenar
Victor’s Residenz-Hotel, Berlin, Ger 1-3 November 2010, pp 1–61
Jerrett M, Burnett RT, Pope CA, et al (2009) Long-term ozone exposure and mortality. N Engl J
Med 360:1085–1095. doi:10.1056/NEJMoa0803894
Kinney PL (2008) Climate change, air quality, and human health. Am J Prev Med 35:459–467.
doi:10.1016/j.amepre.2008.08.025
Kirtman B, Power SB, Adedoyin J, et al (2013) Near-term climate change: projections and
predictability
Kriegler E, Bauer N, Popp A, et al (2016) Fossil-fueled development (SSP5): an energy and
resource intensive scenario for the 21st century. doi:10.1016/j.gloenvcha.2016.05.015
Li C, Balluz LS, Vaidyanathan A et al (2016) Long-term exposure to ozone and life expectancy in
the United States, 2002 to 2008. Medicine (Baltimore) 95:e2474. doi:10.1097/MD.
0000000000002474
Lim SS, Vos T, Flaxman AD, et al (2012) A comparative risk assessment of burden of disease and
injury attributable to 67 risk factors and risk factor clusters in 21 regions, 1990-2010: a
systematic analysis for the global burden of disease study 2010. Lancet 380:2224–2260.
doi:10.1016/S0140-6736(12)61766-8
Lin S, Liu X, Le LH, Hwang SA (2008) Chronic exposure to ambient ozone and asthma hospital
admissions among children. Environ Health Perspect 116:1725–1730. doi:10.1289/ehp.11184
Madaniyazi L, Guo Y, Yu W, Tong S (2015) Projecting future air pollution-related mortality
under a changing climate: progress, uncertainties and research needs. Environ Int 75:21–32.
doi: 10.1016/j.envint.2014.10.018
Makri A, Stilianakis NI (2008) Vulnerability to air pollution health effects. Int J Hyg Environ
Health 211:326–336. doi:10.1016/j.ijheh.2007.06.005
Marenco A, Gouget H, Nedelec P et al (1998) Evidence of a long-term increase in tropospheric
ozone from Pic du Midi data series: consequences: positive radiative forcing. J Geophys Res
Atmos 99:16617–16632
Markandya A, Armstrong BG, Hales S et al (2009) Public health benefits of strategies to reduce
greenhouse-gas emissions: low-carbon electricity generation. Lancet 374:2006–2015. doi:10.
1016/S0140-6736(09)61715-3
Menon A, Lvermann A, Schewe J, Lehmann JFK (2013) Consistent increase in Indian monsoon
rainfall and its variability Geoscientific across CMIP-5 models. Dynam Earth Syst:287–300.
doi:10.5194/esd-4-287-2013
Morgan PB, Mies TA, Bollero GA et al (2006) Season-long elevation of ozone concentration to
projected 2050 levels under fully open-air conditions substantially decreases the growth and
production of soybean. New Phytol 170:333–343. doi:10.1111/j.1469-8137.2006.01679.x
Moss RHRH, Edmonds JAJA, Hibbard KAKA et al (2010) The next generation of scenarios for
climate change research and assessment. Nature 463:747–756. doi:10.1038/nature08823
Murray C (2015) Global, regional and national comparative risk assessment of 76 behavioural,
environmental, occupational and metabolic risks or clusters of risks in 188 countries 1990–
2013: a systematic analysis for the GBD Background. Lancet 6736:1–27. doi:10.1016/S0140-
6736(15)00128-2
Nawahda A, Yamashita K (2012) Evaluation of premature mortality caused by exposure to PM 2.5
and ozone in East Asia:2000, 2005, 2020, pp 3445–3459. doi:10.1007/s11270-012-1123-7
O’Neill BC, Carter TR, Ebi KL, et al (2012) Workshop on the nature and use of new socioeco-
nomic pathways for climate change research core writing team acknowledgments. Meet Rep
Work Nat Use New Socioecon Pathways Clim Chang Res:1–37
Pan X, Chin M, Gautam R et al (2015) A multi-model evaluation of aerosols over South Asia:
common problems and possible causes. Atmos Chem Phys 15:5903–5928. doi:10.5194/acp-
15-5903-2015
2 Air Quality in Changing Climate: Implications for Health Impacts 23
Pope A, Burnett RT, Thun MJ, et al (2002) Lung cancer, cardiopulmonary mortality, and long-
term exposure to fine particulate air pollution
Saraf N, Beig G (2004) Long-term trends in tropospheric ozone over the Indian tropical region.
Geophys Res Lett 31:1–5. doi:10.1029/2003GL018516
Selin NE, Wu S, Nam KM et al (2009) Global health and economic impacts of future ozone
pollution. Environ Res Lett 4:44014. doi:10.1088/1748-9326/4/4/044014
Shi L, Zanobetti A, Kloog I, et al (2015) Low-concentration PM and mortality: estimating acute
and chronic effects in a population-based study. Environ Health Perspect:46–52. doi:10.1289/
ehp.1409111
Silva RA, West JJ, Zhang Y et al (2013) Global premature mortality due to anthropogenic outdoor
air pollution and the contribution of past climate change. Environ Res Lett 8:34005. doi:10.
1088/1748-9326/8/3/034005
Silva RA, West JJ, Lamarque JF et al (2016) The effect of future ambient air pollution on human
premature mortality to 2100 using output from the ACCMIP model ensemble. Atmos Chem
Phys 16:9847–9862. doi:10.5194/acp-16-9847-2016
Smith KR, Balakrishnan K (2009) Mitigating climate, meeting MDGs, and moderating chronic
disease: the health co-benefits landscape. “Commonwealth Health Ministers” Update
Smith KR, Woodward A, Al E (2014) Human health: impacts, adaptation, and co-benefits. In:
Field CB, Barros VR, Dokken DJ (eds) Climate change: 2014 impacts, adaptation, and
vulnerability. Part A: global and sectoral aspects. Contribution of working group II to the
fifth assessment report of the intergovernmental panel on climate change, pp 709–756
Tagaris E, Liao K, Delucia AJ, Deck L (2009) Potential impact of climate change on air pollution-
related human health effects. Environ Sci Technol:4979–4988
Tainio M, Juda-rezler K, Reizer M, et al (2013) Future climate and adverse health effects caused
by fine particulate matter air pollution: case study for Poland, pp 705–715. doi:10.1007/
s10113-012-0366-6
Taylor KE, Stouffer RJ, Meehl GA (2012) An overview of CMIP5 and the experiment design. Bull
Am Meteorol Soc 93:485–498. doi:10.1175/BAMS-D-11-00094.1
Van Vuuren DP, Stehfest E, Gernaat DEHJ, et al (2016) Energy, land-use and greenhouse gas
emissions trajectories under a green growth paradigm. Glob Environ Chang:1–14. doi:10.1016/
j.gloenvcha.2016.05.008
West JJ, Cohen A, Dentener F et al (2016) What we breathe impacts our health: improving
understanding of the link between air pollution and health. Environ Sci Technol 50:4895–
4904. doi:10.1021/acs.est.5b03827
West JJ, Fiore AM, Horowitz LW, Mauzerall DL (2006) Global health benefits of mitigating
ozone pollution with methane emission controls. Proc Natl Acad Sci U S A 103:3988–3993.
doi:10.1073/pnas.0600201103
Wilkinson P, Smith KR, Davies M et al (2009) Public health benefits of strategies to reduce
greenhouse-gas emissions: household energy. Lancet 374:1917–1929. doi:10.1016/S0140-
6736(09)61713
Sourangsu Chowdhury received his MSc degree in atmospheric sciences from the University of
Calcutta in 2012. He is a doctoral candidate at the Centre for Atmospheric Sciences, IIT Delhi. His
primary research interest is to quantify the impact of particulate matter on human health with a
focus on India.
Sagnik Dey is an associate professor at the Centre for Atmospheric Sciences, IIT Delhi. His
research interest is to understand air quality, climate change and human health connection. He is a
science team member of the NASA MAIA mission. He has published more than 60 peer-reviewed
articles with an h-index of 22.
24 S. Chowdhury and S. Dey
Chapter 3
International Conferences on SustainableDevelopment and Climate from Rio de Janeiroto Paris
Giovanni De Santis and Claudia Bortone
Abstract To cope with the problems caused by global warming whose effects
began to be felt in the second half of the twentieth century, 21 summits have been
held in order to identify the causes and the measures to be taken for a sustainable
solution to the problem. This article reviews the results obtained in the various
summits, highlighting both their positive and negative aspects and emphasizing the
close relationships between climatic and territorial conditions. This approach is
inevitable given the disastrous consequences that would result if the current trend of
climate change were to escape human control, at least for that part of it caused by
human activities.
We examine the current state of affairs by studying the causes that led to such a
situation, the seriousness of which the major powers seem unable to accept nor find
acceptable solutions that would reduce the dangers. A decisive role has been played
by increased pollution in its many forms (agriculture, industry, domestic heating,
traffic, etc.) caused by the use of fossil fuels that have led to an impressive increase
in greenhouse gas emissions, with inevitable repercussions on the increase in the
global temperature of the planet. Numerous global conferences have been held with
the explicit aim of setting up the necessary safeguards, whose results to date have
not, unfortunately, led to final decisions but to mere declarations of willingness to
resolve the issue. All this has had and has an immediate feedback in further health-
related issues, due to an increase in diseases closely related to environmental
pollution, as well as the growing desertification of many areas resulting in a reduced
quality of life.
Keywords Climate change • Global warming • Desertification • Greenhouse
gases • The Conference of the Parties (COP) • Diseases
G. De Santis (*) • C. Bortone
University of Perugia, Perugia, Italy
e-mail: [email protected]; [email protected]
© Springer International Publishing AG 2018
R. Akhtar, C. Palagiano (eds.), Climate Change and Air Pollution,Springer Climate, DOI 10.1007/978-3-319-61346-8_3
25
The Reality of Global Warming: Causes and Consequences
Global warming and many of the phenomena observed in recent decades didn’t occur forhundreds, sometimes thousands, of years. The atmosphere and the oceans are heated, the
stock of snow and glaciers has decreased, the sea level has risen and the level of greenhouse
gases has increased. The human influence on climate is obvious. This is evidenced by the
increased concentration of greenhouse gases and radiation in the atmosphere, by the
increased heating and more intense climate variability. (. . .) It is highly probable that the
influence of man has been the dominant cause of global warming since the middle of the
last century. (. . .) The constants emissions greenhouse gas will result in a further increase in
temperature and changes in all conditions of weather. Limiting climate change will require
a substantial and sustained reduction of greenhouse gas emission1.
These observations have led to a growing awareness (even if this is not the case
for all countries) of the need to adopt structural measures for regulating pollutant
emissions that were causing rises in temperature and, subsequently, climate change.
This increase is connected to the so-called greenhouse effect, a natural phenomenon
which regulates the ability of the atmosphere to deal with the energy from the sun,
by means of a translucent membrane that ‘traps’ the sun’s rays. Specifically,
sunlight passes through the layer formed of greenhouse gases that envelops the
entire planet and heats it; at the same time, however, part of the heat imprisoned can
then be dispersed into the atmosphere, thus obtaining the climate balance which
regulates life on Earth.
Fundamental components of this phenomenon are the greenhouse gases such as
water vapour, carbon dioxide (CO2), methane (CH4), nitrous oxide (N2O) and
ozone (O3), which regulate the Earth’s temperature, just like a greenhouse. The
effect becomes irreversible with the continuous increase of greenhouse gases in the
atmosphere that tend to thicken the layer, preventing the required heat loss, which
then has a negative impact on human activity. It is well established that humans
have a growing influence on Earth’s climate and on temperature with the use of
fossil fuels, which add huge amounts of greenhouse gases to those naturally present
in the atmosphere, leading to continual global warming. One need only mention
carbon dioxide, a greenhouse gas produced primarily by human activity and
responsible for 63% of global warming. Its concentration in the atmosphere exceeds
40% of the level recorded at the beginning of the industrial age. To that must be
added other greenhouse gases that, even if in smaller amounts, have the power to
generate large amounts of heat, so much so that, for example, methane is respon-
sible for 19% of man-made global warming and nitric oxide for 6%.
The main causes, then, of rising temperatures lie in the burning of fossil fuels
and deforestation, since the destruction of vegetation, which helps regulate the
climate by absorbing carbon dioxide from the atmosphere, puts the trapped CO2
back into the atmosphere. No less damaging is the development of livestock
breeding which produces large amounts of methane and the increasing use of
1As strongly denounced by the Intergovernmental Panel on Climate Change (IPCC) in the
Summary for Policy Makers of the fifth report, published in October 2013.
26 G. De Santis and C. Bortone
nitrogen fertilizers in agriculture which produce emissions of nitric oxide. Another
negative factor can be found in the use of chlorofluorocarbons (CFCs), now banned,
and the use of hydrofluorocarbons (HFCs)2, which are being gradually eliminated.
What is certain is that the current global average temperature is 0.85 �C higher
compared to the end of the nineteenth century and each of the past three decades,
since the first surveys, in 1850, have been hotter than its predecessor.
Global climate experts believe that human activities are almost certainly the
main cause of the rising temperatures observed since the second half of the
twentieth century. An increase of 2 �C above the pre-industrial era temperature is
considered by scientists as the threshold beyond which there is a real risk of
dangerous and potentially catastrophic environmental changes occurring globally.
For this reason, after lengthy discussions, the international community has accepted
the necessity of keeping global warming below 2 �C.Before the industrial revolution, human beings released very little gas into the
atmosphere; but today factors such as population growth, resulting in more demand
for food, the use of fossil fuels and deforestation are, little by little, changing the
level of greenhouse gases in the air and causing an excess in quality and quantity of
substances that are not compatible with the protection of the planet. The result is the
alteration of the delicate climatic balance which regulates the global temperature of
the Earth. Climate change, already underway with devastating effects, will have
significant implications for human health and the integrity of the environment, by
strongly influencing agriculture, the availability of water, biodiversity, energy and
the economy. There is an urgent need to at least interrupt this process and then
drastically reduce emissions. If the planet continues to overheat, the first result
would be an increase in sea levels, resulting from the thawing of terrestrial glaciers
and ice caps, in part already taking place, leading to the submersion of coastal areas
and settlements. No less important is the drying out and desertification of many
temperate areas, with a loss of biodiversity of flora and fauna, and with the invasion
of species of plants and animals typical of tropical areas, in addition to the increased
frequency of extreme events caused by the collision of cold and warm currents.
At a health level, this could mean the onset of diseases now relegated to the
southern hemisphere; it seems, in fact, that climate change could encourage the
spread of tropical diseases like malaria and dengue fever, as the mosquitoes that
carry the disease shift northward, where the temperature is on the rise. In addition,
the increase in temperature favours the biological pollution of water, leasing to the
proliferation of invasive plant and animal organisms.
2Refrigerant gases.
3 International Conferences on Sustainable Development and Climate from. . . 27
The Need for Action at the Global Level
From November 30 to December 12, 2015, there were held in Paris the 21st session
of the Conference of the Parties (COP) arising from the United Nations Framework
Convention on Climate Change (UNFCCC) and the 11th session of the Conference
of the Parties (CMP11) on the activation of the Kyoto Protocol. After long and
exhausting negotiations, a new universal and legally binding agreement was
reached on climate change, given the urgency of initiating actions to limit global
warming. To this end, various governments pledged to keep the global average
temperature increase below 2 �C compared to pre-industrial levels, through national
plans of action aimed at reducing their emissions, and to communicate their
achievements and results every 5 years. However, in order to reduce significant
disparities, the EU and countries with advanced development (CAD) will continue
to provide funding for developing countries (DC) to reduce their emissions and to
become more resilient to the effects of climate change.
On the basis of this agreement by which 195 countries are committed to reducing
polluting emissions from the next September, October 14, 2016, can be considered
a decisive date for the health of the planet. In fact, in the conference at Kigali in
Rwanda, the UN member country subscribers to the 1987 Montreal Protocol on
phasing out of CFC emissions endorsed the ban on production and use of HFCs,
which are equally responsible for the greenhouse effect. The elimination of HFCs
will be divided in to three stages: the first involving industrialized countries, who by
2019 will have to achieve a 10% reduction in the emission of these gases; the
second will affect China, countries of South America and developing countries
(DC), whose reduction will start from 2024, while the third will be India, Pakistan,
Iran, Iraq and the Gulf countries from 2028 because their economies need longer
timescales. The importance of this agreement lies mainly in the fact that HFCs have
become the third element responsible for the greenhouse effect, after carbon
dioxide and methane, so much so that it is estimated that this accord will mean a
reduction of global warming of 0.5 �C by the end of the century.
If we return to our examination of the various conferences relating to measures
for climate change reduction, it was only in 1979, when the first World Climate
Conference was held in Geneva, that the issue was recognized as urgent, as a result
of the many criticisms and appeals from the scientific world on the changes that
might have long-term effects both on humans and the environment. The Conference
ended with a statement addressed to all world leaders ‘to foresee and prevent
potential man-made changes in climate that might be adverse to the well-being of
humanity’. The Conference also set up the World Climate Program (WCP) under
the direct responsibility of the World Meteorological Organization (WMO), the
United Nations Environment Program (UNEP) and the International Council of
Scientific Unions (ICSU). From the late 1980s, there followed numerous intergov-
ernmental conferences on climate change (Villach, 1985; Toronto, 1988; Ottawa,
1989; Tata, 1989, The Hague, 1989; Noordwiik, 1989; Cairo, 1989; Bergen, 1990;
28 G. De Santis and C. Bortone
and the second World Climate Conference (November 1990, Geneva)), but no
binding decisions were arrived at that could be accepted by all the states.
Meanwhile, in 1990, the Intergovernmental Panel on Climate Change (IPCC),
set up by UNEP and WMO, published its first report on climate and on the serious
transformations taking place, while the UN General Assembly approved the
conducting of negotiations for the draft of an international treaty. Despite the
constant meetings, often unnecessary, and the continuous interjections by scientists
and ecologists, it was only in June 1992 that talks began at a global level, with the
World Conference on Environment and Development in Rio de Janeiro.3 At this
meeting, the member countries of the United Nations signed several documents
committing them to sustainable development, including the United Nations Frame-
work Convention on Climate Change (UNFCCC). By signing this agreement,
governments undertook the adoption of programmes and measures aimed at the
prevention, control and mitigation of the effects of human activity on the planet. In
particular, the objective of the Convention is to (art. 2) ‘stabilize greenhouse gas
concentrations in the atmosphere at a level that would prevent dangerous anthro-
pogenic interference with the climate system’. It also established a body called the
3It should be mentioned that on this occasion was held the fist meeting of the United Nations
Conference on Environment and Development (UNCED), better known as Agenda 21, which is
the programme of action by the international community (states, governments, NGOs, private
sector) in the area of environment and development for the twenty-first century. It is a complex
document which starts from the premise that human societies cannot continue to increase the
economic gap between countries and between the classes of the population within them, increasing
poverty, hunger, disease and illiteracy and causing the continuing deterioration of the ecosystems
that are responsible for the maintenance of life on the planet. The Agenda 21 document is divided
into four thematic sections that are detailed in the respective chapters: (1) social and economic
areas: poverty, health, environment, demographics, production, etc. (2) Conservation and man-
agement of resources: atmosphere, forests, deserts, mountains, water, chemicals, waste, etc.
(3) Strengthening the role of the most significant groups: women, youth, NGOs, ethnic groups,
farmers, trade unions. (4) Methods of implementation: finances and institutions. To achieve these
objectives, after the Rio Conference, several initiatives and projects were launched, and various
governments outlined plans for the sustainable development of their countries, based on the
specific existent conditions and environmental and social issues. Concerning the status of imple-
mentation of the commitments of Agenda 21 at a global level the UN Conference, ‘Rio + 10’ washeld in August 2002 in Johannesburg (South Africa), on sustainable development, whose resolu-
tions were signed by the governments of 183 countries. Among these documents is the ‘UnitedNations Framework Convention on Climate Change’, which commits governments to promote,
through coordination with all the actors of the territory, an action plan for improving the quality of
life and social and economic development in harmony with the environment. It was also hoped that
all countries would undertake the consultative process with their populations and seek consensus
on a Local Agenda 21 by 1996: ‘Every local authority has to open a dialogue with its citizens, withassociations and with private companies and adopt a Local Agenda 21. Through consultation and
consensus building, local authorities can learn from the local community and businesses and can
acquire the information necessary for the formulation of the best strategies. The consultation
process can raise the awareness of families on issues of sustainable development. The programs,
policies and laws passed by the local administration could be evaluated and amended on the basis
of the new plans thus adopted. These strategies could also be used to support the proposals and to
access local, regional, national and international funding’ (article 28 of Agenda 21).
3 International Conferences on Sustainable Development and Climate from. . . 29
‘Conference of the Parties (COP)’, which was entrusted with the crucial task of
implementing the general commitments contained in the Convention itself. This led
to the calling of numerous conferences listed below:
Rio de Janeiro, Brazil 1992 followed by:
COP-1, Berlin Mandate 1995
COP-2, Geneva, Switzerland 1996
COP-3, the Kyoto Protocol on Climate Change 1997
COP-4, Buenos Aires, Argentina 1998
COP-5, Bonn, Germany 1999
COP-6, The Hague, Netherlands 2000
COP-6 bis, Bonn, Germany 2001
COP-7, Marrakesh, Morocco 2001
World Summit on Sustainable Development (WSSD), Johannesburg, South Africa
2002
COP-9, Milan, Italy 2003
COP-10, Buenos Aires, Argentina 2004
COP-11, Montreal, Canada 2005
COP-12, Nairobi, Kenya 2006
COP-13, Bali, Indonesia 2007
COP-14, Poznan, Poland 2008
COP-15, Copenhagen, Denmark 2009
COP-16, Cancun, Mexico 2010
COP-17, Durban, South Africa 2011
COP-18, Doha, Qatar 2012
COP-19, Warsaw, Poland 2013
COP-20, Lima, Peru 2014
COP-21, Paris, France 2015
As the present study was being drafted, the latest Conference (COP-22) opened
in Marrakesh on October 8, 2016, with the clear intention to give full and formal
launching of the Treaty of Paris, since the resolutions subscribed therein were
approved by the governments of more than 100 countries whose share of pollution
exceeds 70% of the greenhouse gases released into the atmosphere. Finally, the
election on November 8, 2016, of US President Donald Trump threatens to under-
mine the decisions so painstakingly reached, according to a statement withdrawing
America’s adhesion to the agreements made.
30 G. De Santis and C. Bortone
Various Summits and the Measures to Be Takenfor a Sustainable Solution to the Problem
Since 1990, the Intergovernmental Panel on Climate Change (IPCC), set up in 1988
by the UN and consisting of two bodies, the World Meteorological Organization
(WMO) and the United Nations Environment Program (UNEP), has highlighted the
risk of global warming due to increased greenhouse gas emissions and their effect
on climate, mainly caused by the use of fossil fuels. Officially, from this point
onwards, governments and transnational organizations began to take into account
the innumerable problems and the serious damage that global warming could create
for territories and societies. This is a valid issue of concern for mankind and brings
with it the need, worldwide, to issue new guidelines on environmental protection,
whose objectives and priorities should reflect local conditions and the degree of
development of each individual state. This desire for immediate and consistent
action in single situations is the common thread that unites, despite numerous
differences, the 21 conferences that have taken place from 1992 to 2015.
In fact, it must be stressed that although numerous alarms have arrived from the
entire scientific world, not all conferences have led to concrete results; many of
these summits led to no decisions whatsoever and even brought out the hostility of
some countries, including major world powers, often lined up on opposite sides.
The only, disastrous, result has been the aggravation of climatic conditions, because
of the power dynamics of the various countries who have demanded different
intervention policies and specifications for each area, in order to avoid the appli-
cation of consistent regulations, which often proved inadequate. Leaving aside the
meetings whose results were purely formal, we will attempt to give a brief history
of those which obtained positive results, indicating the choices made and agree-
ments reached.
Having said that, we must start with the ‘Earth Summit’, the United Nations
Framework Convention on Climate Change, held in Rio de Janeiro, in 1992. The
moral substrate of the agreement is governments finally becoming aware of climate
change and of the influence of human activities on such change, as well as the desire
to protect the climate system of the planet, although full scientific certainty has not
yet been reached on the causes and effects of the phenomenon.
However, the summit was unable to impart a value or a legally binding com-
mitment to the agreement nor the need to set a mandatory limit on emissions by
individual states. Nevertheless, its importance should not be underestimated
because the countries involved were obliged to provide regular reports on policies
chosen for implementing reduction measures and promoting adaptation to climate
change. This obligation led to the subsequent Conferences of the Parties (COP) of
Berlin (1995) and Geneva (1996), the results of which, though not formally binding,
have the merit of encouraging more accurate and specific research, with which to
identify the most appropriate action for each state as indicated by the Berlin
Mandate. Since the effects of climate change were becoming increasingly evident,
3 International Conferences on Sustainable Development and Climate from. . . 31
during the Geneva Summit, a regulatory plan was developed to be tested and
officially approved at COP-3.
This meeting was held in Kyoto in 1997, and the important ‘Kyoto Protocol on
Climate Change’4 was signed, in which, for the first time, 38 countries, including
both industrialized and developing nations, formally pledged to reduce emissions of
six types of greenhouse gases. The agreement, taking into account the social,
economic and environmental conditions of the signatory states, carefully measured
reduction measures, to 5.2% of the emissions of 1990, the year of the first IPCC
report, to be implemented in 2008–2012. These agreements were also analysed in
the COP-4 in Buenos Aires in 1998, while at the conference in Bonn in 1999,
guidelines were drawn up to outline the relations and communications between
member states to further the study of flexible mechanisms, such as the Joint
Implementation5 and the Clean Development Mechanism (CDM)6, in addition to
identifying the capacity building of individual states. However, the general interests
of the various governments are not always identical, as demonstrated by the
conflicts characterized the COP-6 (2000) of The Hague, marked by clashes between
the USA and the EU, so that in 2001, the political and financial problems left
unresolved at COP-6 bis in Bonn had to be addressed anew, just 4 months after the
withdrawal of the USA from the ranks of the signatory countries of the Kyoto
Protocol.
Five years after the Kyoto Protocol on Climate Change, the conditions for its
implementation had to be decided, and during the COP-7 (2001), the ‘Marrakesh
Accords’ were signed, to guarantee compliance with the agreed stipulations and the
reporting of each firmatory’s activities. The ‘Marrakesh Ministerial Declaration’was also signed for the World Summit on Sustainable Development scheduled for
2002 in Johannesburg, with the intent of determining progress 10 years after the
Earth Summit, whose importance was reaffirmed also during the COP-8 (2002,
4The Protocol commits the industrialized countries and those with economies in transition (Eastern
European countries) to reduce (5 % in the period 2008–2012) GHG emissions capable of altering
the natural greenhouse effect. Greenhouse gases covered by the Protocol are carbon dioxide,
methane, nitrous oxide, hydrofluorocarbons, perfluorocarbons and sulphur hexafluoride. Unfortu-
nately, not all states have acceded to the Protocol: the USA, responsible for 30 % of the total
emissions from developed countries, signed but then refused to ratify the Treaty. For newly
industrialized countries, the Protocol does not provide for any reduction target. China, India and
other developing countries have been exempted from obligations because they are not considered
among the ‘historical’major emitters of greenhouse gases (i.e. those that remain in the atmosphere
for about a century and which are the cause of climate change). The non-member countries are
responsible for 40 % of global emissions of greenhouse gases.5Joint Implementation (JI): If two industrialised countries that have signed a commitment to do so
produce a plan to reduce greenhouse gas emissions, the investing country is accredited the
emission rights of the host country. The investing country may then produce a larger quantity of
greenhouse gases, which will be equivalent to the reduction obtained in the host country.6Unlike JI projects, in the Clean Development Mechanism (CDM) projects, partners are develop-
ing countries that have not signed PSA reduction commitments. In this case, therefore, emissions
rights are not transferred but created. The investing country may emit greater amounts of
greenhouse gases without the host country having to reduce its total emissions.
32 G. De Santis and C. Bortone
New Delhi). In Milan (COP-9) in 2003, the Special Fund on Climate Change and
the Fund for Less Developed Countries were set up, and the rules and methods for
including agroforestry activities in the CDM outlined, objectives that were resumed
at Buenos Aires (COP-10, 2004) and broadened to include issues such as develop-
ment and technology transfer and sustainable use of territory, as well as in addition
to identifying the specific needs of individual countries.
The Summit in Montreal (COP-11, 2005) had an important part to play, since
7 years after the Kyoto Protocol on Climate Change, the countries that had
approved the protocol committed themselves to determining specific tasks to be
implemented after the 2012 deadline. This consideration for the future was also a
point of discussion at COP-12 (Nairobi, 2006) which included the ‘workprogramme on impacts, vulnerability and adaptation’ and the ‘Nairobi Framework’,aimed at providing additional support for developing countries, and also the
‘Compliance Committee of the Kyoto Protocol on Climate Change’, which made
it fully operational. COP-13 (Bali, 2007) was of fundamental importance for
climate balance, with the ‘Bali Road Map’, namely, an international long-term
agreement for combating climate change that would involve the entire world
political system, entrusting the control and organization to a specific working
group, to ensure a long-term cooperative action (AWG-LCA); these actions were
further expanded at the COP-14 (Poznan, 2008).
At the Copenhagen Conference (COP-15, 2009), there were strong political
tensions; interventions in favour of the poorest countries to allow them to reach
the technological levels needed for the use of renewable energy sources were met
by the choice to limit the increase in global warming to no more than 2 �C.Despite the worsening global climate conditions and related issues affecting
many areas of the planet, at the Cancun Conference (COP-16, 2010), it was
decided to limit the amount of thermal reduction no longer at 2 �C but at least
1.5 �C. The role that technological development could play in achieving the
required objectives was barely recognized by the establishment of the Adaptation
Committee and the Technological Mechanism, which included within it the
Technology Executive Committee (TEC) and the Climate Technology Centre
and Network (CTCN).
Given the need to implement the commitments of the Kyoto Protocol
(2013–2020), in 2011, the Durban COP-17 set up the ‘Ad Hoc Working Group
on the Durban Platform for Enhanced Action’ (ADP), with the task of ‘developing aprotocol with the force of law, according to the Convention, applicable to all
parties’, which was then modified during COP-18 (Doha 2012) and COP-19
(Warsaw 2013) so as to close the gap between pre-2020 commitments and the
scares results already obtained. At COP-20 in Lima (2014) discussion focused on
the results of the fifth assessment report presented by the IPCC, which indicated the
increased reliability of scientific evidence regarding climate change and its cause-
and-effect dynamics, since the early 1990s. It was considered necessary, also, to
implement the sanctions mechanism introduced at the Conference in Warsaw
(2013), on financial compensation to be paid by countries who caused damage
related to climate change. Discussion was also held on awareness and education
3 International Conferences on Sustainable Development and Climate from. . . 33
about gender difference and of a different approach than that of the INDC7,
combining top-down and bottom-up, in other words integrating the decisions
taken by the COP with the voluntary choices of individual governments and
keeping in mind the transparency of any action.
We then arrive at the Conference in Paris that also hosted the 11th session of the
meeting of the Parties to the Kyoto Protocol of 1997, with the commitment, after
nearly 20 years, of reaching a legally binding global agreement that transcended
any political tension and/or financial claim. With the Paris accord, countries agreed
to reduce greenhouse gas emissions ‘as soon as possible’ and according to voluntaryparameters. However, despite this commitment, the salvation of the planet remains
uncertain, since the agreement will come into force only after it has been ratified by
at least 55 states, responsible for 55% of total CO2 emissions (with respect to 1990),
caused mainly by the USA (19%), China (11.9%), Japan (9.4%), Germany (3.9%),
India (3.4%), Africa (3.2%), South America (2.7%), Canada (1.8%), Italy (1.8%),
the UK (2.5%) and Oceania (1.3%).
In conclusion, it is clear that these numerous conferences have only partially
changed the current state of affairs. In 25 years of work, the 22 conferences
(including Marrakesh in October 2016) achieved very little, paradoxically given
the seriousness of the problems to be faced. Successes such as the signing of the
Kyoto Protocol were made possible only through compromises with minimal and
unsatisfactory end results. Certainly there is no denying that some COP have made
concrete policy choices, such as the Warsaw COP-19, which helped increase
awareness that without specific, competent organs, no change could be contem-
plated. Also, mention can be made of the setting up of commissions and special
bodies such as the Adaptation Committee and the Technology Mechanism, inside
which, at COP-16, were formed the Technology Executive Committee (TEC) and
the Climate Technology Centre and Network (CTCN).
Agreements, such as the ‘Nairobi Framework’, aimed at providing additional
support to developing countries (COP-12), or the ‘Bali Road Map’ of COP-13,called on all the world’s political powers to implement rapid action on climate
change. Unfortunately, it is clear that every effort made to limit or reduce the effects
of climate change has disappeared under the constant pressing political and eco-
nomic influence exerted by the individual states involved. Even the COP-21 in
Paris, despite the good intentions of actually beginning the battle against climate
change, was a race against time to reach the key conditions for the implementation
of the treaty, which was approved and signed in the COP-22 (Marrakesh). However,
this could prove to be ineffective owing to the anti-ecological stance adopted by the
new US presidency in the field of environmental protection. It is clear, therefore,
that it is necessary to discuss and define a new framework of environmental
protection that could lead to a state of affairs very different from the present one.
7Intended Nationally Determined Contributions (INDC): contributions to the global reduction of
greenhouse gases that the nations intended to give on a voluntary basis by means of ‘clear andtransparent plans’.
34 G. De Santis and C. Bortone
Effects and Repercussions on Health
Climate change has already today radical effects on human health and will have
even more in the future, because of its great influence on various factors such as
food, water, cleanliness, health care and the control of infectious diseases, resulting
in increased mortality and morbidity, especially among the elderly and the poor.
While the most serious risks are expected in cities in the middle and high latitudes,
warmer winters will probably reduce cold-related deaths in some countries. In
contrast, heat waves will tend to affect our cardiovascular and respiratory system,
due to periods of extreme heat suddenly becoming more frequent and close
together, or even real weather inversions, which can prevent the dispersion of
pollutants. These, added to emissions caused by fires, radically worsen air quality
in many cities. The quality of water resources will also be at risk as their quantity is
reduced, as already happens in many countries where clean drinking water is
becoming more and more depleted, undermining the quality of life of the natives,
but above all, further weakening the already poor health-care systems in the most
disadvantaged areas. It will become imperative to take action against the increasing
concentrations of bacteria and other microorganisms responsible for many of the
new outbreaks of disease in Africa, India and Southeast Asia, where the scarcity of
clean water forces people to use other sources of low quality, often at risk, such as
polluted rivers. The result is a massive increase in diseases such as dysentery,
cholera, blindness and infectious diseases generally, which can reach epidemic
proportions following a further deterioration in climatic conditions. Heat waves,
floods, cyclones and droughts, in fact, cause death and disease, the migration of
entire populations, epidemics and serious psychological problems, and while sci-
entists remain uncertain about how climate change will affect the frequency of
tornadoes and hurricanes, they have no doubts when foreseeing that some regions
will be victim of floods and droughts.
Coastal flooding is also on the increase, due to rising water levels, with serious
damage to the already disadvantaged local economies. The increase in phenomena
connected to climate change has substantial and multiple consequences for human
health, both directly and indirectly, which can arise both in the short and long term.
It has been estimated that around 150,000 deaths occurred worldwide in 2000,
according to a recent study by the World Health Organization, and by 2040 the
figure could reach around 250,000 deaths a year.
Among the major risks that threaten health are extreme weather events, as
mentioned above, and deaths due to heat waves, and floods are expected to increase.
In fact, different types of extreme weather events affect different regions: for
example, heat waves are a problem especially in Southern Europe and the Medi-
terranean but also, to a lesser extent, in other regions. Suffice it to say that,
according to estimates, the heat wave of 2003 caused more than 70,000 deaths in
12 European countries, especially among the older members of the population who
3 International Conferences on Sustainable Development and Climate from. . . 35
were more vulnerable to disease. It is predicted that by 2050, heat waves will cause
more than 120,000 deaths per year in the EU, generating costs of 150 million euro if
appropriate measures to cope with the situation are not taken. These estimates are
higher not only because of rising temperatures and the increased frequency of heat
waves but also because of the changes taking place in European demographics: in
fact, currently about 20% of EU citizens are over 65, and it is estimated that by
2050, they will number about 30% of the total population. High temperatures, often
associated with air pollution, can cause respiratory problems and cardiovascular
diseases, especially among children and the elderly, and lead to premature deaths.
These climate changes also affect communicable diseases, because changes in
the local microclimate can result in the spread of insects that act as vectors, and
temperature changes facilitate or inhibit the proliferation of bacterial or parasitic
species. There are many ways in which communicable diseases can spread, and
these are usually divided into four simple categories:
Water-borne diseases are those of faecal-oral transmission, like cholera or
various forms of diarrhoea. Cholera is still endemic in some countries, notably in
Bangladesh and other poor countries, and is also showing changes in its distribu-
tion, since the increase in temperature of the sea and inland waters encourage the
proliferation of the cholera bacteria. Water-based diseases are those in which a
parasite lives part of its life cycle in the water, as in the case of schistosomiasis.
There are signs that this disease is also spreading outside its traditionally endemic
areas, for example, in some areas of China, and this is a grave cause of concern,
since the parasite is carcinogenic and causes tumours in the bladder and liver.
According to the traditional classification, water-washed diseases are those in
which the causative agents are routinely eliminated if elementary rules of hygiene
are followed; examples include scabies and trachoma. Here the crucial problem is
the availability of water for washing, and therefore the desertification of large areas
of the planet is a major cause for concern. Finally, water-related diseases are those
where the carrier, and not the parasite itself, has a cycle involving water. The most
obvious example is malaria, carried by anopheles mosquito and linked to the
presence of stagnant water. Malaria is perhaps the transmissible disease most
studied in relation to climate change, and there is evidence of its spreading outside
the areas where it is endemic. It is important to note that the change of distribution
of communicable diseases as a result of climate change is not a phenomenon that
involves only the low-income countries, although these will be the most affected.
The risk will also affect economically evolved countries, so much so that we are
nowadays witnessing the emergence of infectious diseases in Europe which are not
related only to migration but also to changes of climate or the interaction between
these two phenomena. This problem of interaction is of particular concern and
preoccupation to epidemiologists, because the concomitant and partially linked
phenomena of mass migrations and climate change can together have important
and unpredictable effects.
36 G. De Santis and C. Bortone
Every inhabitant of the planet should have access to sufficient quantities of good
quality water, uncontaminated and not stagnant. We know that this is not the case.
By 2025, nearly half of the world’s population will be faced with extreme water
shortages, and drinking water quality is declining in many parts of the world. Fifty
percent of wetlands have been lost, with their flora and fauna, while at the same
time, 70% of available water reserves are used for irrigation. There is no denying
that there is also a strong component of social inequality, not only for the obvious
fact that those without access to water of good quality are poor but also because the
rich are responsible for colossal waste such as the irrigation of golf courses in very
dry areas such as Kuwait or Qatar. Apart from diseases directly related to scarce
good quality water, drought is itself the cause of various diseases. In large areas of
China where drought is becoming an acute problem, respiratory diseases are rife.
This is due to the fact that in cities particle pollution is on the increase, while in rural
areas, dust storms are more frequent and disastrous because of soil erosion. There
are also indirect risks, mainly due to the deterioration and contamination of the
environment, such as pollutants from industrial processes or waste water and
sewage, which carried by floods could lead to the contamination of drinking
water and agricultural land or even reach and contaminate rivers, lakes and seas
and enter the food chain. The same applies to the forest fires caused by high
temperatures and drought (or often set alight intentionally), which damage property
and increase air pollution.
Finally, the expected changes in the distribution of vector-borne diseases will
also have important consequences for human health. The higher temperatures,
milder winters and wetter summers are colonizing large areas where insects, vectors
of disease, survive and multiply, allowing the proliferation of diseases like Lyme
disease, dengue fever or malaria in new regions whose natural habitat was not
previously conducive to their development and to their transmission. Seasonal
variations, in which some seasons seem to start earlier and last longer, may have
negative consequences for human health, especially for people suffering from
allergies, which are on the rise globally, with the possible risk of asthma attacks
brought on by the combined exposure to different allergens at the same time. All
this might also lead to an increased pressure on health facilities, intensifying
financial commitment in rich countries, while the situation in developing countries
would become even more untenable.
The risks associated with climate change are also long term: changes in temper-
ature and precipitation will probably affect the food production capacity of terri-
tories now exploited by agriculture. Their general massive reduction, combined
with the problem of unequal distribution of resources, would not only exacerbate
the problem of malnutrition but also trigger other consequences, such as mass
migratory movements, political instability as well as an increase in food prices at
a global scale. Climate change is a factor to consider when it comes to food security
and access to food, something that can aggravate existing social and economic
problems. Finally, while the health services of the developed countries are
3 International Conferences on Sustainable Development and Climate from. . . 37
generally more predisposed to face the inevitable consequences of climate change,
those more economically disadvantaged could suffer huge setbacks, because indi-
vidual events such as floods, droughts, long-lasting heat waves or a drastic reduc-
tion of food resources will continue to exert increasing pressure on health services
in affected areas.
Acknowledgements The present study is the result of the joint work of the two authors; in the
drafting of the text, De Santis dealt with §§ 1, 2 and 4 and Bortone § 3. We would like to thank
Prof. Mike George Riddell for valuable advice regarding the drafting of the text in English.
References
AA.VV (2013) Processi naturali e intervento umano. II Mulino, Bologna, p 357
Akhtar R (ed) (2016) Climate change and human health. Scenario in South and Southeast Asia.
Springer, Cham, p 290
Bargagli A. e Michelozzi M.P. (2011), Clima e salute. Come contrastare i rischi immediati e a
lungo termine delle ondate di calore, Roma, II Pensiero Scientifico Editore, 160.
Chelazzi G (2013) L’impronta originale. Storia naturale della colpa ecologica. Einaudi, Milano
Contarini E (2010) Qualcuno ha parlato di clima? Milano, Discanti, p 144
Dominguez Bascon P. et Munoz Peres A. (1998), Clima e salute in Andalusia. Studio
dell’incidenza dell’onda di calore del luglio 1995 sulla base dei ricoveri al pronto soccorso,C. Palagiano, G. De Santis e D. Castagnoli (a cura di), Metodi di raccolta dati e percezione
della salute, “Atti del Sesto Seminario Internazionale di Geografia medica (Roma, 4–6
dicembre 1997)”, Perugia, Edizioni Rux, 391–404.
Flannery T (2015) Una speranza nell’aria. I cambiamenti climatici e la sfida che siamo chiamati ad
affrontare. Corbaccio Editore, Milano, p 240
Gelbspan R (1998) Clima Rovente. Baldini & Castoldi, Milano, p 307
Giddens A (2015) La politica del cambiamento climatico. II Saggiatore, Milano, p 287
Kandel R (1999) L’incertezza del clima. Einaudi, Milano, p 145
Lanza A (2000) II cambiamento climatico. II Mulino, Bologna, p 128
Lanza A (2006) Lo sviluppo sostenibile. II Mulino, Bologna, p 121
Lehner B, D€oll P et al (2006) Estimating the impact of global change on flood and drought risks in
Europe: a continental, integrated assessment. Clim Chang 75(3):272–299
Navarra A, Pinchera A (2002) II clima. Laterza, Roma-Bari, p XIV–229
Provenzale A. (a cura di) (2013), II mutamento climatico. Processi naturali e intervento umano,
Bologna, II Mulino, 357
Raisanen J, Hansson U et al (2004) European climate in the late 21st century: regional simulations
with two driving global models and two forcing scenarios. Clim Dyn 22:242–248
Ruddiman W. (2015), L’aratro, la peste, il petrolio. L’impatto umano sul clima, Universit�aBocconi Milano, pp 246
Smith L.C. (2011), 2050. II futuro del nuovo nord, Milano, Einaudi, pp 381
Von Weizsacker E.U., Lovins A.B. e Lovins H.L. (2009), Fattore 4. Come ridurre l’impatto
ambientale moltiplicando per quattro l’efficienza della produzione, Milano, Edizioni
Ambiente, 2009, pp. 337
Wigley T (2005) The climate change commitment. Science 307(5716):1766–1769
Wandel J (2006) Adaptation, adaptive capacity and vulnerability. Glob Environ Chang 16
(3):282–292
www.eea.europa.eu/it/.../cambiamento-climatico-e-salute-umana
38 G. De Santis and C. Bortone
Giovanni De Santis is a professor of human geography and geography, environment and health at
the University of Perugia (Italy). Giovanni’s scientific studies has developed through the analysis
of various geographic aspects, highlighting in particular the existing relationship between man and
environment, such as the following:
– The population and demographic dynamics
– Localization of inhabited areas
– Issues related to medical geography in particular
– The distinctive features and certain environmental reflections from tourism and circulation in
general
– Some specific aspects of agricultural, historical and cartographic geography
– The problems and the implications related to environment sustainability
Giovanni is a member of the committee of the Commission on Health and Environment of the
IGU-UGI.
Claudia Bortone holds two master’s degrees: one in philosophy and a second in civil economics
at the University of Perugia. She is a scientific associate to geography magazines in the production
of scientific papers. With excellent knowledge of the English language, she has enriched her
education with university activities of tutoring and teaching collaboration.
3 International Conferences on Sustainable Development and Climate from. . . 39
Chapter 4
COP21 in Paris: Politics of Climate Change
Rais Akhtar
Abstract An attempt has been made to discuss various dimensions of Paris
Climate Agreement, its likely impact on the levels of global warming, and various
voices in favour of and against the climate deal, and the US withdrawal from the
Paris Agreement under President Donald Trump. Since USA backed out from the
Paris Agreement, China and India are bound to re-visit their commitments on
emissions, and the future of our planetary world looks bleak.
Keywords COP21 • Temperature increase • Air pollution • India • Renewable
energy • Donald Trump
Introduction
The Paris Climate Agreement emerged successful with a narrow escape from
disaster as it ran into overtime. As differences persist between the USA and
emerging economies, the President Barack Obama used his authority to save
American interests. The most important push to this climate deal was not the
perception and understanding of climate change impact among participating coun-
tries, but a phone call from President Barack Obama to Chinese and Brazilian
presidents and the Indian Prime Minister on the last day, i.e., 11 of December, of the
conference, which led to the signing of this “historic” agreement. Had President
Obama been so powerful politically and internationally, the Copenhagen Summit in
2009 would have been successful. There is further scope for research as to what
pressure tactics as well as assurances were extended by the USA to emerging
economies of China and India.
R. Akhtar (*)
International Institute of Health Management and Research (IIHMR), New Delhi, India
e-mail: [email protected]
© Springer International Publishing AG 2018
R. Akhtar, C. Palagiano (eds.), Climate Change and Air Pollution,Springer Climate, DOI 10.1007/978-3-319-61346-8_4
41
Paris Climate Agreement
The Paris Climate Agreement, when 197 countries committed to keeping the global
temperature rise “well below” the limit of 2 �C above preindustrial levels, came into
force on 4 November 2016. By June 2017, 151 of 197 countries ratified the
Agreement. The Paris Climate Agreement has just forced everyone to quickly
switch to natural gas or nuclear in the power generation sector for the next
10–15 years. Because of that the price of natural gas would become high when
demand is high that will have a positive influence on the renewable energy sector.
Personally, I am crossing my fingers to believe that there will be some technological
breakthrough in the energy production in our near future (combination of fuel cell
and solar—use solar to generate hydrogen or thermo-exchange members that can
capture waste heat under low-temperature difference). The policy that the world is
currentlyworking on is just to slow down the climate change and hope to avoid extreme
climate or nonreversible devastating disaster in our planetary system (Lam 2016).
Politics of Climate Change
As for India, the newspaper headlines concerning Paris climate conferences varied
from “Creators of climate change must cut emissions” to “Nations whose rise was
powered by fossil fuels must bear more burden” attributed to the Prime Minister of
India. At the same time, a group of developing nations comprising India, China, and
others stated the global climate deal must produce a clear climate finance road map
and ensure that the rich nations bear a heavier burden. Contrary to this, the Paris
Climate Agreement reveals that the “Least developed countries and Small Island
Developing States have special circumstances” that are eligible for provision of
support. It is evident that both China and India are not eligible for any adaptation
and mitigation support. The Guardian reported on 13 December: “When US
officials realised Paul Oquist, Nicaragua’s delegate, planned to deliver a fiery
speech denouncing the deal, Secretary of State John Kerry and Raul Castro, the
Cuban leader, telephoned Managua to make sure that Oquist spoke after the
agreement was adopted, when it would in effect be too late”. Thus the US involve-
ment in the shaping and architecture of the Paris climate deal was significant. Nigel
Purvis has rightly called the White House’s COP21 goals: less climate idealism,
more political realism. The International Business Times remarked that COP21
Paris climate talks have failed by letting the rich off the hook. The Guardian
reported on 12 December 2015 that James Hansen, an Adjunct Professor at Colum-
bia University and known as the father of climate change awareness, calls Paris
talks “a fraud.” Of course the idea of financial support to a certain category of
nations, particularly the least developing and island nations cannot be ignored. In
this connection Stephen Dinan of the Washington Times,—Sunday, 29 November
2015, quoted Ugandan Foreign Minister Sam Kutesa who was explicit earlier this
year when asked what it would take for developing countries to sign up for the
42 R. Akhtar
emerging US-led climate deal: “Money.” Thus the issues of equity and common but
differentiated responsibilities (CBDR) were laid to rest with this agreement. Why
were the USA and other developed countries eager to conclude a climate deal?
Baseless arguments have been made by developed countries that developing coun-
tries including India and China will be the worst sufferer from climate change
impacts. In a recent example of pressurizing India to accept developed countries’analysis that India may be hotter by 8�C and lose $200 billion per year (Hindustan
Times, 16 July 2015), forgetting the devastation caused by European heat waves
that killed 70,000 Europeans in 2003. In the ten global ranking of heat wave
mortality, European heat wave mortality was at the top, followed by Russian heat
wave, and US heat wave mortally figured at third, fourth, seventh, eighth and ninth
positions. India’s heat wave mortality in 2003 was placed at number six. In one of
my papers, I argued that not only India and China but even developed countries—
the USA, the UK and other nations of Europe—are vulnerable to climate change.
Katrina (2005), Sandy (2012) and Harvey (2017) hurricanes had devastated the
USA, while flooding in Europe and forest fires in Australia and recently in California
are examples that show that Western countries are even more vulnerable. The last
week of December 2015 had been a great disaster for England and southern USA as
flooding devastated these regions. The huge blizzard which pounded the eastern
coast of eastern Virginia (USA) during the fourth week of January 2016 has broken
all records. WMO confirms 2016 as the hottest year on record, about 1.1 �C above
preindustrial era.
In my view the developed countries, particularly the USA were adamant to
conclude the Paris Climate Agreement in their favour, as the Americans and other
developed nations realized that they are more vulnerable to climate change impacts.
Indian Context
Regarding the use of coal for energy, the reality is that each and every country uses
its own resource for power generation. Australia, Germany, and India possess rich
coal reserves. Therefore, these and other countries with rich coal reserves use it
mostly for its power generation. As the meeting of COP21 in Paris concluded in a
climate agreement, in my opinion India failed to take the stand based on the Kyoto
Protocol that states “common but differentiated responsibilities”, clearly meaning
that the West must first reduce their emissions substantially. In one of the papers
published in 2010 from Brussels, I have clearly stated the association between
country’s GDP and CO2 emissions (Akhtar 2010). Thus, high emissions are a must
for development for developing countries. In Paris P.M. Modi has rightly asserted
that “Climate change is a major global challenge. But it is not of our making”
(Hindustan Times, 1st December, 2015) and “Nations whose rise was powered by
fossil fuels must bear more burden industrialized countries” (Hindustan Times, 1st
December, 2015). At the earlier meeting of the G8+5 in Heiligendamm in July
2007, the former Indian Prime Minister also indicated that we are determined to see
4 COP21 in Paris: Politics of Climate Change 43
that India’s per capita emissions never exceed the per capita emissions of the
industrialized countries.
During US Election 2016
Since India has taken a logical stand on emission reduction, and in the USA, the
congress has rejected Obama’s efforts to reduce GHG emissions, it seems unlikely
that a Paris climate treaty will be approved by the Republican-dominated congress.
Both Donald Trump and Ted Cruz, candidates for Republican nomination for
Presidential elections in the USA, are against the Paris Climate Agreement. “I
don’t believe in climate change,” Trump said flatly, while Ted Cruz doesn’t believein man-made climate change or Science behind it (quoted from The Atlantic,
9 December 2015). It seems the likely that if the Republicans wins the US Presiden-
tial election, the USAmight pull out of the Paris Climate Agreement as they did when
the Kyoto Protocol accord was signed. However, “President Obama’s special envoyfor climate change has warned Republican presidential hopefuls, including Donald
Trump and Ted Cruz that any attempt to scrap the Paris Climate Agreement would
lead to a “diplomatic black eye” for the US” (The Guardian, 16 February 2016).
Donald Trump: President of the USA
After election victory, Donald Trump met Al Gore who shared the 2007 Nobel
Peace Prize with the IPCC; later he met with William Happer, a Princeton professor
of physics who has been a prominent voice in questioning whether we should be
concerned about human-caused climate change. It should be noted that in the 2015
senate testimony, Happer argued that the “benefits that more [carbon dioxide]
brings from increased agricultural yields and modest warming far outweigh any
harm”. “While not denying outright that increasing atmospheric carbon dioxide
levels will warm the planet, he also stated that a doubling of atmospheric carbon
dioxide would only cause between 0.5 and 1.5 degrees Celsius of planetary
warming (Mooney 2016). The most recent assessment of the United Nations’Intergovernmental Panel on Climate Change puts the figure much higher, at
between 1.5 degrees and 4.5 degrees C”. Scott Pruitt, the Oklahoma attorney
general who has been a longtime adversary of the Environmental Protection
Agency (EPA), has been named as the head of this agency and a close friend to
the fossil fuel industry. Pruitt wrote that the debate on climate change is “far from
settled”, adding: “Scientists continue to disagree about the degree and extent of
global warming and its connection to the actions of mankind” (Sidahmed 2016).
Rex Tillerson who was the CEO of Exxon, a company that funded climate change
denial for years, has been nominated Secretary of State. Worried Obama, just 2 days
before Donald Trump took over the presidency, transferred $500 m to the Green
Climate Fund in an attempt to protect the Paris climate deal (Slezak 2017).
44 R. Akhtar
In the historical Indian context, Paul Baran in his book The Political Economy ofGrowth (1957, New York) states that the colonial drain was a mercantilist
concept—India’s loss of economic resource and their transfer to Britain was a
consequence of her political subordination. The coming of the British rule in India
had broken up pre-existing self-sufficient agricultural communities and forced a
shift to the production of export crops, which distorted the internal economy (Baran
1957). The resources from African and South Asian colonies were used to develop
industrial base of Liverpool and Manchester. Baran also suggests that about 10% of
India’s gross national product was transferred to Britain each year in the early
decades of the twentieth century. In light of the above, India failed to assert the
Kyoto Protocol principle of “common but differentiated responsibility” between
developed and developing nations, for gaining access to green technology and
finance for both adaptation and mitigation.
The Paris Climate Agreement entered into force on 4 November 2016, 30 days
after the date on which at least 55 parties to the convention accounting in total for at
least an estimated 55% of the total global greenhouse gas emissions deposited their
instruments of ratification, acceptance, approval or accession with the depositary.
Conclusion
On the first day of Trump’s presidency, and shortly after inauguration on 20th
January, 2017, the White House website was scrubbed of most climate change
references. Instead, highlighted at the top of the issue list is the “America First
Energy Plan,” which talks about the need to roll back former president Barack
Obama’s far-reaching climate regulations, known as the Climate Action Plan.
Trump had also appointed several most prominent climate change deniers, includ-
ing Secretary of State in his team.
After about five months, President Trump announced on 1st June 2017 that he is
withdrawing the United States from the landmark Paris climate agreement, an
extraordinary move that puzzled America’s allies and placed great hindrance in
the global effort to address the warming planet. US joins only Syria and Nicaragua
on climate accord ‘no’ list However, China, European Union, and. India have
vowed to support Paris climate agreement, despite Trump’s decision to withdraw
from this landmark accord.
Nevertheless, future seems not encouraging and the Paris Climate Agreement
may be dead following the decision by Donald Trump to withdraw from the Paris
climate treaty. An Australian politician has said that though Australia has ratified
the Paris Climate Agreement, “US withdrawal means Paris is cactus.” As opined by
Sneed, among numerous pledges made during Trump election campaign, include
“cancelling” American involvement in the Paris climate accord, reviving the coal
industry and rolling back federal environmental regulations. If Trump follows
through, scientists say it could have a profound long-term effect on the planet”
(Sneed 2017). Since USA backed out from the Paris Climate Agreement, China and
4 COP21 in Paris: Politics of Climate Change 45
India are bound to re-visit their commitments on emissions, and the future of our
planetary world looks bleak. Reffering to the US policy on climate change under
Donald Trump and the hurricane Harvey that devastated Texas in late August,
2017, Mark Lynas has justly noted “ we all have a duty to confront denial and speak
out. If we fail, the Harveys, Katrinas and Sandys of the future will be even worse
than the storms we experience today. And in future, as now, each subsequent
climate disaster will just be “news”. Surely we can do better than that” (Lynas
2017) Because of such grim scenario Stephen Hawking “has warned that Donald
Trump’s decision to withdraw from the Paris Climate Agreement on climate change
could “push the Earth over the brink” and lead to a point where global warming is
“irreversible” (The Independent 2017).
References
Akhtar R (2010) CO2 emission reduction and the emerging socio-economic development in
developing country: a case study of India. In: Dapper MJ, Swinne D, Ozer P (eds) Developing
countries facing global warming: a post-Kyoto assessment. Royal Academy of Overseas
Sciences, Brussels, pp 15–26
Baran PA (1957) The political economy of growth. Monthly Review Press, New York
Lam N (2016) Personal correspondence
Lynas M(2017) Now we have a moral duty to talk about climate change, CNN, August 31
Mooney C (2016) Trump meets with Princeton physicist who says global warming is good for us,
Washington Post, January, 13, www.washingtonpost.com
Sidahmed M (2016) Climate change denial in the Trump cabinet: where do his nominees stand?
The Guardian, London, December 15. https://www.theguardian.com › Environment › Climate
change scepticism
Slezak M (2017) Barack Obama transfers $500m to Green Climate Fund in attempt to protect Paris
deal, The Guardian, London, January 18
Sneed A (2017) Trump day 1: global warming’s fate, Scientific American, Climate, January 20
The Independent (2017) Stephen Hawking has warned that Donald Trump’s decision to withdraw
from the Paris Agreement on climate change could “push the Earth over the brink” and lead to a
point where global warming is “irreversible”, July 4
Rais Akhtar is presently adjunct professor of the International
Institute of Health Management Research, New Delhi.
46 R. Akhtar
Part II
Case Studies: Developed Countries/Regions
47
Chapter 5
Climate Change Impacts on Air Pollutionin Northern Europe
Ruth M. Doherty and Fiona M. O’Connor
Abstract The impacts of climate change on air pollution are discussed in the
context of Northern Europe. Europe as a whole benefits from a wealth of data
and statistics from the European Environment Agency and the European Monitor-
ing and Evaluation Programme that also considers long-range transboundary air
pollution and its own EU air quality standards. In this region projected future air
quality levels are determined not only by climate change impacts affecting the
regional to local-scale air pollution but also by climate drivers and phenomena that
change hemispheric background pollution levels. This chapter reviews the impacts
on air pollution in Northern Europe associated with projections of greenhouse gas
emissions and emissions of pollutant primary species and precursors for the future,
produced for the Intergovernmental Panel for Climate Change (IPCC). Studies
relating these air pollution impacts to future changes in air pollution-related mor-
tality and morbidity for Europe are also presented.
Keywords Air pollution • Climate change impacts • Ozone • Particulate matter •
Human health • Northern Europe
Introduction: Health Effects and EU Air Pollution Levelsin the 2000s
The European Environment Agency (EEA), who provides independent information
on the environment to inform policy and decision-making across the EU, states that
the three air pollutants that most significantly affect human health are particulate
matter (PM), nitrogen dioxide (NO2) and ground-level ozone (O3) (EEA 2016). PM
R.M. Doherty (*)
School of GeoSciences, University of Edinburgh, Scotland, UK
e-mail: [email protected]
F.M. O’ConnorMet Office, Hadley Centre, Exeter, UK
e-mail: [email protected]
© Springer International Publishing AG 2018
R. Akhtar, C. Palagiano (eds.), Climate Change and Air Pollution,Springer Climate, DOI 10.1007/978-3-319-61346-8_5
49
exposure, both short term (acute) and long term (chronic), is associated with
all-cause and, in particular, cardiovascular and respiratory disease and mortality
(WHO 2013a, b). PM has been measured for the last decade or so in Europe mainly
as PM10 (PM10 (diameter <10 μm), often referred to as coarse PM) and more
recently PM2.5 (particle diameter <2.5 μm) often referred to as fine PM (e.g. in the
UK, PM2.5 measurements at regular monitoring sites have been available typically
from the late 2000s). The health effects are thoughts to be greater for the smaller size
particles due to their ability to penetrate more deeply into the thoracic and respiratory
systems. Short-term exposure to O3 is also associated with cardiovascular and
respiratory mortality. The evidence base for long-term effects due to O3 exposure
is increasing, but this evidence is mainly from North American studies (COMEAP
2015). For NO2 there has been much debate about whether effects are caused by NO2
itself or by co-pollutants emitted by the same sources, notably traffic (COMEAP
2015). However, evidence now suggests independent effects of short-term exposure
to NO2 – associated with respiratory and cardiovascular outcomes – whilst for long-
term exposure, a causal relationship is suggested (WHO 2013a; US EPA 2015).
The European Union (EU) has developed an extensive legislation establishing
health-based standards and objectives for these and other air pollutants (http://ec.
europa.eu/environment/air/quality/standards.htm). There are legally binding and
target values for annual average PM2.5, 24 h and annual average PM10, NO2, and
a target value for maximum daily 8-h mean O3. For 24-h mean PM10 and NO2
35 and 18 exceedances respectively are allowed per year under these limit values.
For O3, the target values require no more than 25 exceedances averaged over
3 years.
However, despite substantial emission controls that have improved air quality
for some pollutants, the percentage of the EU population exposed to air pollutant
concentrations higher than the EU limit or target values (as given above) is between
8 and 30% (EEA 2015, Table ES.1). There are several underlying reasons:
(a) O3 and some components of PM2.5 are secondary pollutants, i.e. they are
formed in the atmosphere from primary precursor emissions. Hence, besides
precursor emissions, there are meteorological and transport factors as well as
chemical transformation and deposition processes that determine their ambient
concentrations.
(b) In addition, O3 and some PM components are relatively long lived such that
long-range transport of O3 or PM pollution from outside the EU contributes
significantly to regional EU levels (EEA 2015).
(c) For PM a further complication is the natural components due to dust; sea salt
that cannot be regulated contributes to both PM2.5 and PM10 levels (although
more of these emissions are in the larger size fractions).
(d) O3 chemistry is non-linear, and titration of O3 by NO occurs when NOx levels
are high. This has led to increases in O3 concentrations in the highly urbanised
areas in the EU, including Belgium, Germany, the Netherlands and the UK
(Bach et al. 2014; EEA 2015).
A key question is how will air pollution levels change further in Northern Europe
under future emission policies and as a result of climate change? The following
50 R.M. Doherty and F.M. O’Connor
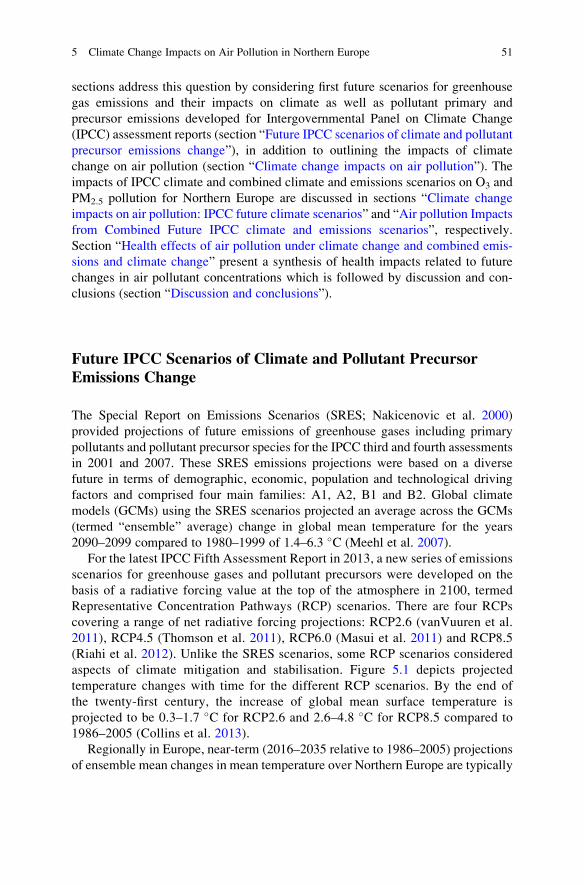
sections address this question by considering first future scenarios for greenhouse
gas emissions and their impacts on climate as well as pollutant primary and
precursor emissions developed for Intergovernmental Panel on Climate Change
(IPCC) assessment reports (section “Future IPCC scenarios of climate and pollutant
precursor emissions change”), in addition to outlining the impacts of climate
change on air pollution (section “Climate change impacts on air pollution”). The
impacts of IPCC climate and combined climate and emissions scenarios on O3 and
PM2.5 pollution for Northern Europe are discussed in sections “Climate change
impacts on air pollution: IPCC future climate scenarios” and “Air pollution Impacts
from Combined Future IPCC climate and emissions scenarios”, respectively.
Section “Health effects of air pollution under climate change and combined emis-
sions and climate change” present a synthesis of health impacts related to future
changes in air pollutant concentrations which is followed by discussion and con-
clusions (section “Discussion and conclusions”).
Future IPCC Scenarios of Climate and Pollutant PrecursorEmissions Change
The Special Report on Emissions Scenarios (SRES; Nakicenovic et al. 2000)
provided projections of future emissions of greenhouse gases including primary
pollutants and pollutant precursor species for the IPCC third and fourth assessments
in 2001 and 2007. These SRES emissions projections were based on a diverse
future in terms of demographic, economic, population and technological driving
factors and comprised four main families: A1, A2, B1 and B2. Global climate
models (GCMs) using the SRES scenarios projected an average across the GCMs
(termed “ensemble” average) change in global mean temperature for the years
2090–2099 compared to 1980–1999 of 1.4–6.3 �C (Meehl et al. 2007).
For the latest IPCC Fifth Assessment Report in 2013, a new series of emissions
scenarios for greenhouse gases and pollutant precursors were developed on the
basis of a radiative forcing value at the top of the atmosphere in 2100, termed
Representative Concentration Pathways (RCP) scenarios. There are four RCPs
covering a range of net radiative forcing projections: RCP2.6 (vanVuuren et al.
2011), RCP4.5 (Thomson et al. 2011), RCP6.0 (Masui et al. 2011) and RCP8.5
(Riahi et al. 2012). Unlike the SRES scenarios, some RCP scenarios considered
aspects of climate mitigation and stabilisation. Figure 5.1 depicts projected
temperature changes with time for the different RCP scenarios. By the end of
the twenty-first century, the increase of global mean surface temperature is
projected to be 0.3–1.7 �C for RCP2.6 and 2.6–4.8 �C for RCP8.5 compared to
1986–2005 (Collins et al. 2013).
Regionally in Europe, near-term (2016–2035 relative to 1986–2005) projections
of ensemble mean changes in mean temperature over Northern Europe are typically
5 Climate Change Impacts on Air Pollution in Northern Europe 51
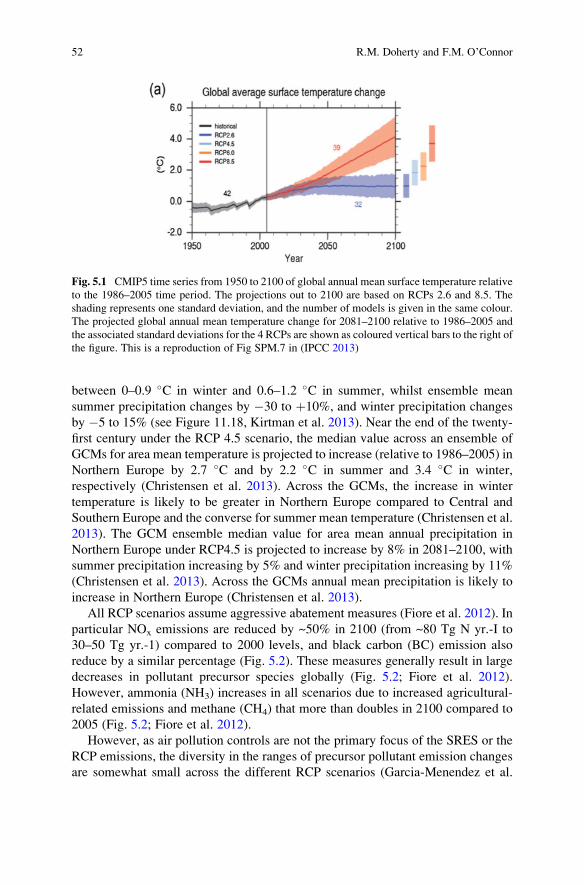
between 0–0.9 �C in winter and 0.6–1.2 �C in summer, whilst ensemble mean
summer precipitation changes by �30 to þ10%, and winter precipitation changes
by �5 to 15% (see Figure 11.18, Kirtman et al. 2013). Near the end of the twenty-
first century under the RCP 4.5 scenario, the median value across an ensemble of
GCMs for area mean temperature is projected to increase (relative to 1986–2005) in
Northern Europe by 2.7 �C and by 2.2 �C in summer and 3.4 �C in winter,
respectively (Christensen et al. 2013). Across the GCMs, the increase in winter
temperature is likely to be greater in Northern Europe compared to Central and
Southern Europe and the converse for summer mean temperature (Christensen et al.
2013). The GCM ensemble median value for area mean annual precipitation in
Northern Europe under RCP4.5 is projected to increase by 8% in 2081–2100, with
summer precipitation increasing by 5% and winter precipitation increasing by 11%
(Christensen et al. 2013). Across the GCMs annual mean precipitation is likely to
increase in Northern Europe (Christensen et al. 2013).
All RCP scenarios assume aggressive abatement measures (Fiore et al. 2012). In
particular NOx emissions are reduced by ~50% in 2100 (from ~80 Tg N yr.-I to
30–50 Tg yr.-1) compared to 2000 levels, and black carbon (BC) emission also
reduce by a similar percentage (Fig. 5.2). These measures generally result in large
decreases in pollutant precursor species globally (Fig. 5.2; Fiore et al. 2012).
However, ammonia (NH3) increases in all scenarios due to increased agricultural-
related emissions and methane (CH4) that more than doubles in 2100 compared to
2005 (Fig. 5.2; Fiore et al. 2012).
However, as air pollution controls are not the primary focus of the SRES or the
RCP emissions, the diversity in the ranges of precursor pollutant emission changes
are somewhat small across the different RCP scenarios (Garcia-Menendez et al.
Fig. 5.1 CMIP5 time series from 1950 to 2100 of global annual mean surface temperature relative
to the 1986–2005 time period. The projections out to 2100 are based on RCPs 2.6 and 8.5. The
shading represents one standard deviation, and the number of models is given in the same colour.
The projected global annual mean temperature change for 2081–2100 relative to 1986–2005 and
the associated standard deviations for the 4 RCPs are shown as coloured vertical bars to the right of
the figure. This is a reproduction of Fig SPM.7 in (IPCC 2013)
52 R.M. Doherty and F.M. O’Connor
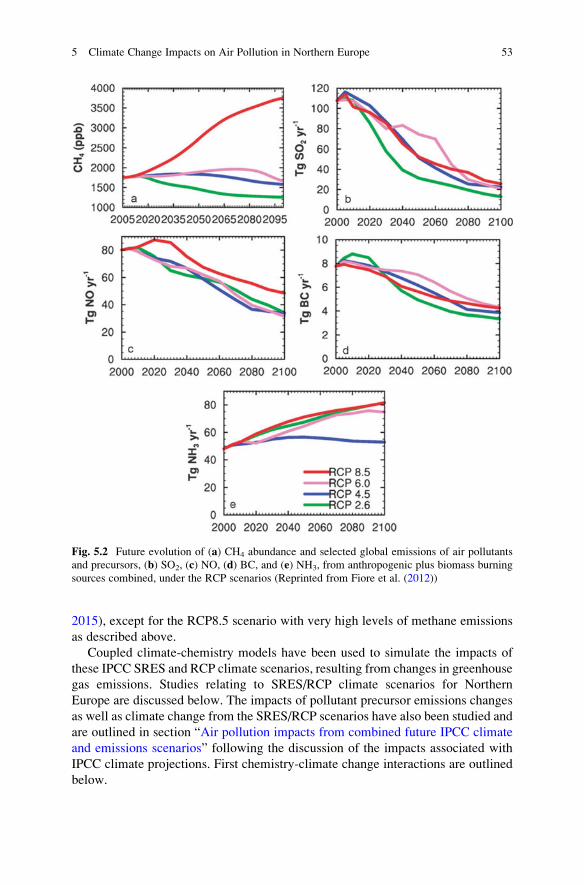
2015), except for the RCP8.5 scenario with very high levels of methane emissions
as described above.
Coupled climate-chemistry models have been used to simulate the impacts of
these IPCC SRES and RCP climate scenarios, resulting from changes in greenhouse
gas emissions. Studies relating to SRES/RCP climate scenarios for Northern
Europe are discussed below. The impacts of pollutant precursor emissions changes
as well as climate change from the SRES/RCP scenarios have also been studied and
are outlined in section “Air pollution impacts from combined future IPCC climate
and emissions scenarios” following the discussion of the impacts associated with
IPCC climate projections. First chemistry-climate change interactions are outlined
below.
Fig. 5.2 Future evolution of (a) CH4 abundance and selected global emissions of air pollutants
and precursors, (b) SO2, (c) NO, (d) BC, and (e) NH3, from anthropogenic plus biomass burning
sources combined, under the RCP scenarios (Reprinted from Fiore et al. (2012))
5 Climate Change Impacts on Air Pollution in Northern Europe 53
Climate Change Impacts on Air Pollution
Changes in mean temperature affect chemical reaction rates that influence produc-
tion and loss rates of gaseous pollutants and hence affect local and regional
pollution levels. Notably, higher temperatures increase the decomposition rate of
peroxyacetyl nitrate (PAN), a reservoir species for nitrogen oxides
(NOx¼NOþNO2), reducing NO2 or O3 production following long-range transport
but increasing local NO2 and O3 levels (Jacob and Winner 2009; Doherty et al.
2013). PM pollution is also impacted by temperature. However since PM comprises
many different components, the overall impact is difficult to discern (Dawson et al.
2013; Garcia-Menendez et al. 2015). For example, higher temperatures enhance
chemical reaction rates that lead to increased oxidation of sulphur dioxide (SO2),
which can condense to form sulphate aerosol – a major component of PM. Higher
temperatures can reduce the partitioning of nitrate into the aerosol phase and hence
reduce nitrate aerosol levels – another major component of PM in Northern Europe
(e.g. in the UK; Yin and Harrison 2008; Harrison et al. 2012) and also some organic
aerosol species (Fiore et al. 2012). Change in temperature also influences natural
emissions of O3 and PM precursors, e.g. wildfire emissions, emissions of isoprene –
a biogenic volatile organic compound (VOC) – and emissions of methane from
wetlands (O’Connor et al. 2010). One study focusing on agricultural areas in
Europe also suggested that natural emissions of NOx from soils increased slightly
with higher temperature (Forkel and Knoche 2006). Regional O3 and PM levels in
Northern Europe can be impacted by transport of these emissions from elsewhere.
For example, large parts areas in Northern Europe were impacts by PM pollution
from forest fires in Spain and Portugal during the 2003 heatwave in Europe (Hodzic
et al. 2007).
Changes in mean precipitation amount as well as frequency impact wet deposi-
tion that removes pollutants and in particular PM from the atmosphere. PM levels
decrease in areas where increased precipitation frequency is simulated and vice
versa (Fang et al. 2011; Penrod et al. 2014; Allen et al. 2016). Cloud amount also
influences the magnitude of incoming solar radiation and hence photolysis rates that
influence gaseous pollutants. Several studies for Europe link increased summer O3
concentrations to enhanced NO2 photolysis rates in turn caused by reduced cloud
amount (Meleux et al. 2007; Katragkou et al. 2011). Depending on the spatial extent
of the changes in rainfall regional and local PM pollution may be influenced by
climate-induced changes in precipitation.
Besides changes in mean temperature and precipitation, changes in other mean
climate variables notably humidity and boundary layer mixing height also impact
on air pollution levels (see Table 1; Fiore et al. 2012). Higher humidities occur
under climate change as the warmer atmosphere hold more moisture, lead to greater
O3 destruction in low NOx regions and hence can impact regional O3 levels
transported across the oceans into Northern Europe (Colette et al. 2015). Changes
in the height of the boundary layer as well as wind speed exert a major control on
the mixing and dispersion of local pollution. However, the impacts of climate
54 R.M. Doherty and F.M. O’Connor
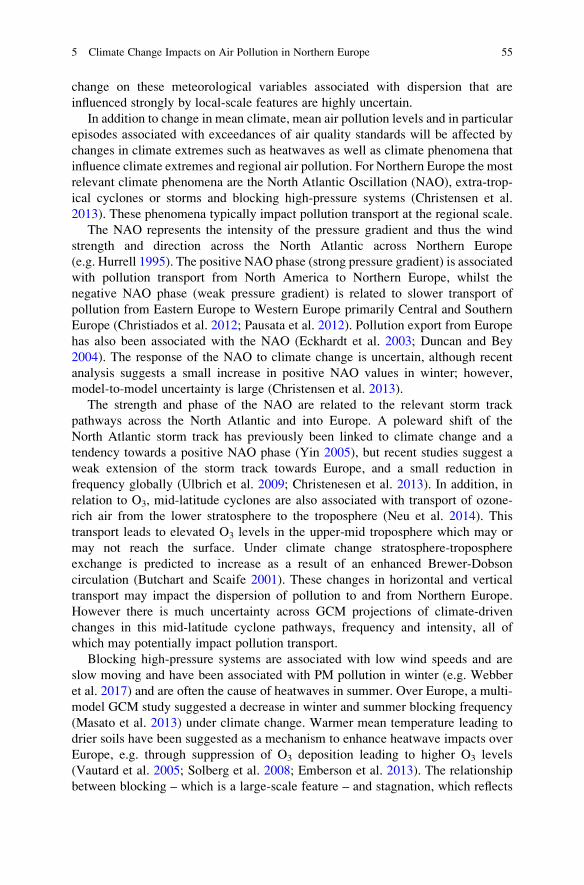
change on these meteorological variables associated with dispersion that are
influenced strongly by local-scale features are highly uncertain.
In addition to change in mean climate, mean air pollution levels and in particular
episodes associated with exceedances of air quality standards will be affected by
changes in climate extremes such as heatwaves as well as climate phenomena that
influence climate extremes and regional air pollution. For Northern Europe the most
relevant climate phenomena are the North Atlantic Oscillation (NAO), extra-trop-
ical cyclones or storms and blocking high-pressure systems (Christensen et al.
2013). These phenomena typically impact pollution transport at the regional scale.
The NAO represents the intensity of the pressure gradient and thus the wind
strength and direction across the North Atlantic across Northern Europe
(e.g. Hurrell 1995). The positive NAO phase (strong pressure gradient) is associated
with pollution transport from North America to Northern Europe, whilst the
negative NAO phase (weak pressure gradient) is related to slower transport of
pollution from Eastern Europe to Western Europe primarily Central and Southern
Europe (Christiados et al. 2012; Pausata et al. 2012). Pollution export from Europe
has also been associated with the NAO (Eckhardt et al. 2003; Duncan and Bey
2004). The response of the NAO to climate change is uncertain, although recent
analysis suggests a small increase in positive NAO values in winter; however,
model-to-model uncertainty is large (Christensen et al. 2013).
The strength and phase of the NAO are related to the relevant storm track
pathways across the North Atlantic and into Europe. A poleward shift of the
North Atlantic storm track has previously been linked to climate change and a
tendency towards a positive NAO phase (Yin 2005), but recent studies suggest a
weak extension of the storm track towards Europe, and a small reduction in
frequency globally (Ulbrich et al. 2009; Christenesen et al. 2013). In addition, in
relation to O3, mid-latitude cyclones are also associated with transport of ozone-
rich air from the lower stratosphere to the troposphere (Neu et al. 2014). This
transport leads to elevated O3 levels in the upper-mid troposphere which may or
may not reach the surface. Under climate change stratosphere-troposphere
exchange is predicted to increase as a result of an enhanced Brewer-Dobson
circulation (Butchart and Scaife 2001). These changes in horizontal and vertical
transport may impact the dispersion of pollution to and from Northern Europe.
However there is much uncertainty across GCM projections of climate-driven
changes in this mid-latitude cyclone pathways, frequency and intensity, all of
which may potentially impact pollution transport.
Blocking high-pressure systems are associated with low wind speeds and are
slow moving and have been associated with PM pollution in winter (e.g. Webber
et al. 2017) and are often the cause of heatwaves in summer. Over Europe, a multi-
model GCM study suggested a decrease in winter and summer blocking frequency
(Masato et al. 2013) under climate change. Warmer mean temperature leading to
drier soils have been suggested as a mechanism to enhance heatwave impacts over
Europe, e.g. through suppression of O3 deposition leading to higher O3 levels
(Vautard et al. 2005; Solberg et al. 2008; Emberson et al. 2013). The relationship
between blocking – which is a large-scale feature – and stagnation, which reflects
5 Climate Change Impacts on Air Pollution in Northern Europe 55
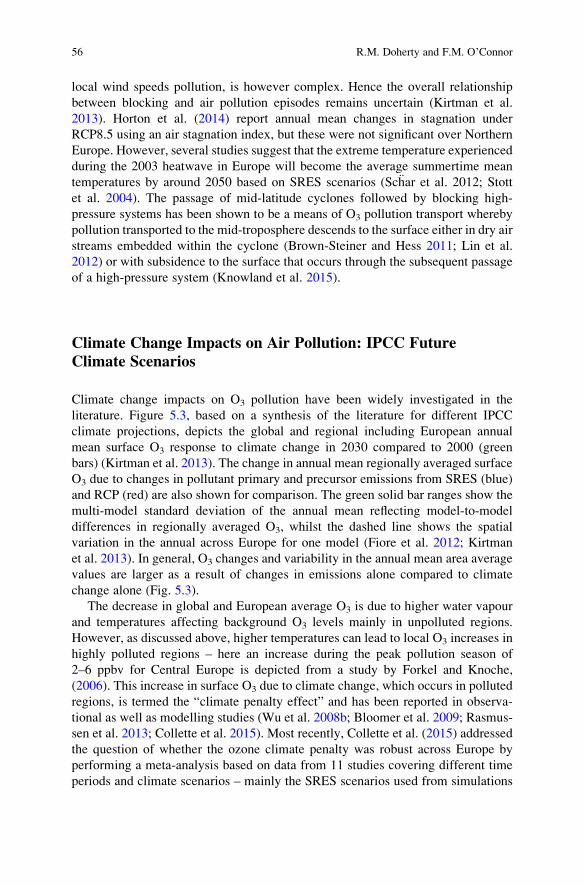
local wind speeds pollution, is however complex. Hence the overall relationship
between blocking and air pollution episodes remains uncertain (Kirtman et al.
2013). Horton et al. (2014) report annual mean changes in stagnation under
RCP8.5 using an air stagnation index, but these were not significant over Northern
Europe. However, several studies suggest that the extreme temperature experienced
during the 2003 heatwave in Europe will become the average summertime mean
temperatures by around 2050 based on SRES scenarios (Schar et al. 2012; Stott
et al. 2004). The passage of mid-latitude cyclones followed by blocking high-
pressure systems has been shown to be a means of O3 pollution transport whereby
pollution transported to the mid-troposphere descends to the surface either in dry air
streams embedded within the cyclone (Brown-Steiner and Hess 2011; Lin et al.
2012) or with subsidence to the surface that occurs through the subsequent passage
of a high-pressure system (Knowland et al. 2015).
Climate Change Impacts on Air Pollution: IPCC FutureClimate Scenarios
Climate change impacts on O3 pollution have been widely investigated in the
literature. Figure 5.3, based on a synthesis of the literature for different IPCC
climate projections, depicts the global and regional including European annual
mean surface O3 response to climate change in 2030 compared to 2000 (green
bars) (Kirtman et al. 2013). The change in annual mean regionally averaged surface
O3 due to changes in pollutant primary and precursor emissions from SRES (blue)
and RCP (red) are also shown for comparison. The green solid bar ranges show the
multi-model standard deviation of the annual mean reflecting model-to-model
differences in regionally averaged O3, whilst the dashed line shows the spatial
variation in the annual across Europe for one model (Fiore et al. 2012; Kirtman
et al. 2013). In general, O3 changes and variability in the annual mean area average
values are larger as a result of changes in emissions alone compared to climate
change alone (Fig. 5.3).
The decrease in global and European average O3 is due to higher water vapour
and temperatures affecting background O3 levels mainly in unpolluted regions.
However, as discussed above, higher temperatures can lead to local O3 increases in
highly polluted regions – here an increase during the peak pollution season of
2–6 ppbv for Central Europe is depicted from a study by Forkel and Knoche,
(2006). This increase in surface O3 due to climate change, which occurs in polluted
regions, is termed the “climate penalty effect” and has been reported in observa-
tional as well as modelling studies (Wu et al. 2008b; Bloomer et al. 2009; Rasmus-
sen et al. 2013; Collette et al. 2015). Most recently, Collette et al. (2015) addressed
the question of whether the ozone climate penalty was robust across Europe by
performing a meta-analysis based on data from 11 studies covering different time
periods and climate scenarios – mainly the SRES scenarios used from simulations
56 R.M. Doherty and F.M. O’Connor
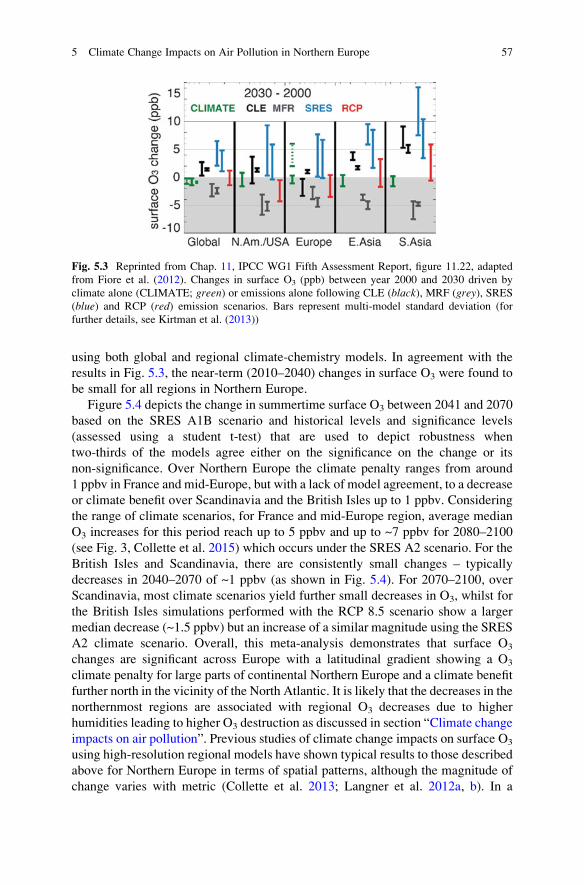
using both global and regional climate-chemistry models. In agreement with the
results in Fig. 5.3, the near-term (2010–2040) changes in surface O3 were found to
be small for all regions in Northern Europe.
Figure 5.4 depicts the change in summertime surface O3 between 2041 and 2070
based on the SRES A1B scenario and historical levels and significance levels
(assessed using a student t-test) that are used to depict robustness when
two-thirds of the models agree either on the significance on the change or its
non-significance. Over Northern Europe the climate penalty ranges from around
1 ppbv in France and mid-Europe, but with a lack of model agreement, to a decrease
or climate benefit over Scandinavia and the British Isles up to 1 ppbv. Considering
the range of climate scenarios, for France and mid-Europe region, average median
O3 increases for this period reach up to 5 ppbv and up to ~7 ppbv for 2080–2100
(see Fig. 3, Collette et al. 2015) which occurs under the SRES A2 scenario. For the
British Isles and Scandinavia, there are consistently small changes – typically
decreases in 2040–2070 of ~1 ppbv (as shown in Fig. 5.4). For 2070–2100, over
Scandinavia, most climate scenarios yield further small decreases in O3, whilst for
the British Isles simulations performed with the RCP 8.5 scenario show a larger
median decrease (~1.5 ppbv) but an increase of a similar magnitude using the SRES
A2 climate scenario. Overall, this meta-analysis demonstrates that surface O3
changes are significant across Europe with a latitudinal gradient showing a O3
climate penalty for large parts of continental Northern Europe and a climate benefit
further north in the vicinity of the North Atlantic. It is likely that the decreases in the
northernmost regions are associated with regional O3 decreases due to higher
humidities leading to higher O3 destruction as discussed in section “Climate change
impacts on air pollution”. Previous studies of climate change impacts on surface O3
using high-resolution regional models have shown typical results to those described
above for Northern Europe in terms of spatial patterns, although the magnitude of
change varies with metric (Collette et al. 2013; Langner et al. 2012a, b). In a
Fig. 5.3 Reprinted from Chap. 11, IPCC WG1 Fifth Assessment Report, figure 11.22, adapted
from Fiore et al. (2012). Changes in surface O3 (ppb) between year 2000 and 2030 driven by
climate alone (CLIMATE; green) or emissions alone following CLE (black), MRF (grey), SRES(blue) and RCP (red) emission scenarios. Bars represent multi-model standard deviation (for
further details, see Kirtman et al. (2013))
5 Climate Change Impacts on Air Pollution in Northern Europe 57
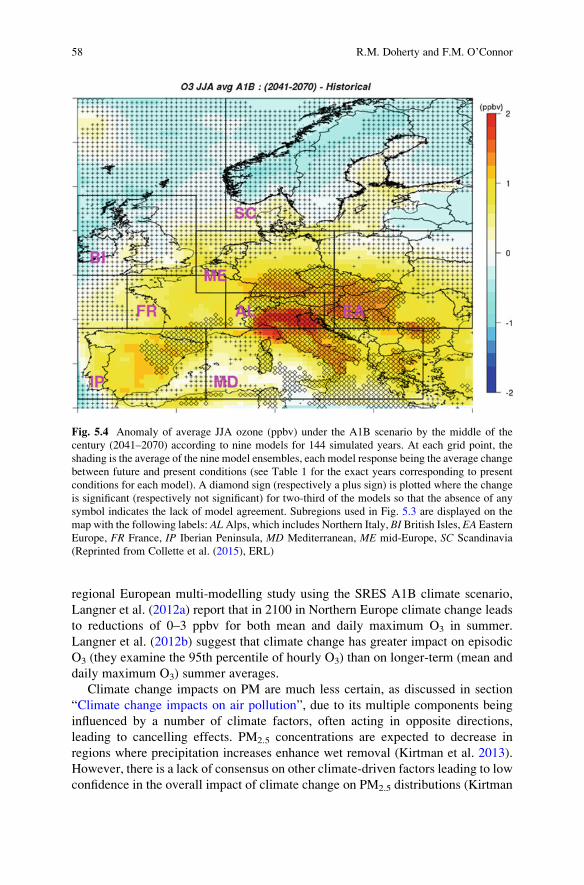
regional European multi-modelling study using the SRES A1B climate scenario,
Langner et al. (2012a) report that in 2100 in Northern Europe climate change leads
to reductions of 0–3 ppbv for both mean and daily maximum O3 in summer.
Langner et al. (2012b) suggest that climate change has greater impact on episodic
O3 (they examine the 95th percentile of hourly O3) than on longer-term (mean and
daily maximum O3) summer averages.
Climate change impacts on PM are much less certain, as discussed in section
“Climate change impacts on air pollution”, due to its multiple components being
influenced by a number of climate factors, often acting in opposite directions,
leading to cancelling effects. PM2.5 concentrations are expected to decrease in
regions where precipitation increases enhance wet removal (Kirtman et al. 2013).
However, there is a lack of consensus on other climate-driven factors leading to low
confidence in the overall impact of climate change on PM2.5 distributions (Kirtman
Fig. 5.4 Anomaly of average JJA ozone (ppbv) under the A1B scenario by the middle of the
century (2041–2070) according to nine models for 144 simulated years. At each grid point, the
shading is the average of the nine model ensembles, each model response being the average change
between future and present conditions (see Table 1 for the exact years corresponding to present
conditions for each model). A diamond sign (respectively a plus sign) is plotted where the change
is significant (respectively not significant) for two-third of the models so that the absence of any
symbol indicates the lack of model agreement. Subregions used in Fig. 5.3 are displayed on the
map with the following labels: ALAlps, which includes Northern Italy, BI British Isles, EA Eastern
Europe, FR France, IP Iberian Peninsula, MD Mediterranean, ME mid-Europe, SC Scandinavia
(Reprinted from Collette et al. (2015), ERL)
58 R.M. Doherty and F.M. O’Connor
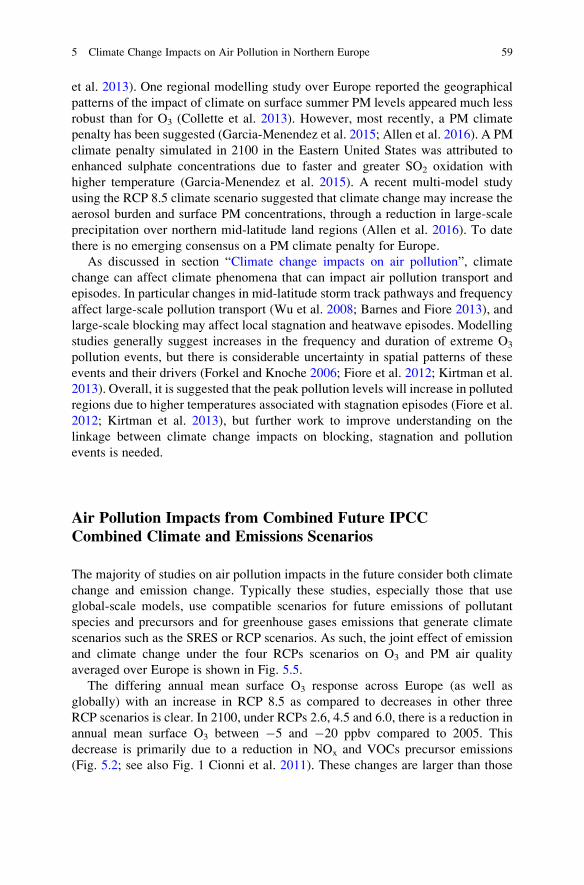
et al. 2013). One regional modelling study over Europe reported the geographical
patterns of the impact of climate on surface summer PM levels appeared much less
robust than for O3 (Collette et al. 2013). However, most recently, a PM climate
penalty has been suggested (Garcia-Menendez et al. 2015; Allen et al. 2016). A PM
climate penalty simulated in 2100 in the Eastern United States was attributed to
enhanced sulphate concentrations due to faster and greater SO2 oxidation with
higher temperature (Garcia-Menendez et al. 2015). A recent multi-model study
using the RCP 8.5 climate scenario suggested that climate change may increase the
aerosol burden and surface PM concentrations, through a reduction in large-scale
precipitation over northern mid-latitude land regions (Allen et al. 2016). To date
there is no emerging consensus on a PM climate penalty for Europe.
As discussed in section “Climate change impacts on air pollution”, climate
change can affect climate phenomena that can impact air pollution transport and
episodes. In particular changes in mid-latitude storm track pathways and frequency
affect large-scale pollution transport (Wu et al. 2008; Barnes and Fiore 2013), and
large-scale blocking may affect local stagnation and heatwave episodes. Modelling
studies generally suggest increases in the frequency and duration of extreme O3
pollution events, but there is considerable uncertainty in spatial patterns of these
events and their drivers (Forkel and Knoche 2006; Fiore et al. 2012; Kirtman et al.
2013). Overall, it is suggested that the peak pollution levels will increase in polluted
regions due to higher temperatures associated with stagnation episodes (Fiore et al.
2012; Kirtman et al. 2013), but further work to improve understanding on the
linkage between climate change impacts on blocking, stagnation and pollution
events is needed.
Air Pollution Impacts from Combined Future IPCCCombined Climate and Emissions Scenarios
The majority of studies on air pollution impacts in the future consider both climate
change and emission change. Typically these studies, especially those that use
global-scale models, use compatible scenarios for future emissions of pollutant
species and precursors and for greenhouse gases emissions that generate climate
scenarios such as the SRES or RCP scenarios. As such, the joint effect of emission
and climate change under the four RCPs scenarios on O3 and PM air quality
averaged over Europe is shown in Fig. 5.5.
The differing annual mean surface O3 response across Europe (as well as
globally) with an increase in RCP 8.5 as compared to decreases in other three
RCP scenarios is clear. In 2100, under RCPs 2.6, 4.5 and 6.0, there is a reduction in
annual mean surface O3 between �5 and �20 ppbv compared to 2005. This
decrease is primarily due to a reduction in NOx and VOCs precursor emissions
(Fig. 5.2; see also Fig. 1 Cionni et al. 2011). These changes are larger than those
5 Climate Change Impacts on Air Pollution in Northern Europe 59
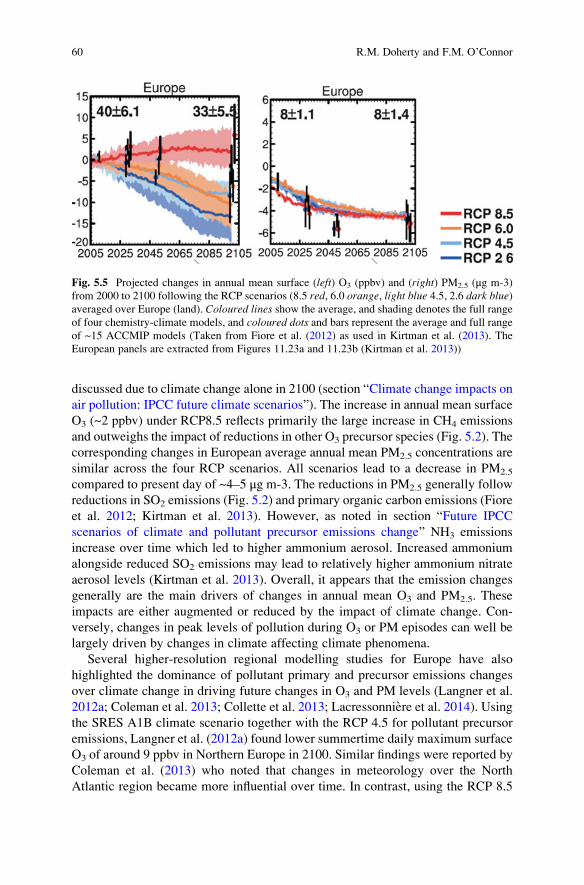
discussed due to climate change alone in 2100 (section “Climate change impacts on
air pollution: IPCC future climate scenarios”). The increase in annual mean surface
O3 (~2 ppbv) under RCP8.5 reflects primarily the large increase in CH4 emissions
and outweighs the impact of reductions in other O3 precursor species (Fig. 5.2). The
corresponding changes in European average annual mean PM2.5 concentrations are
similar across the four RCP scenarios. All scenarios lead to a decrease in PM2.5
compared to present day of ~4–5 μg m-3. The reductions in PM2.5 generally follow
reductions in SO2 emissions (Fig. 5.2) and primary organic carbon emissions (Fiore
et al. 2012; Kirtman et al. 2013). However, as noted in section “Future IPCC
scenarios of climate and pollutant precursor emissions change” NH3 emissions
increase over time which led to higher ammonium aerosol. Increased ammonium
alongside reduced SO2 emissions may lead to relatively higher ammonium nitrate
aerosol levels (Kirtman et al. 2013). Overall, it appears that the emission changes
generally are the main drivers of changes in annual mean O3 and PM2.5. These
impacts are either augmented or reduced by the impact of climate change. Con-
versely, changes in peak levels of pollution during O3 or PM episodes can well be
largely driven by changes in climate affecting climate phenomena.
Several higher-resolution regional modelling studies for Europe have also
highlighted the dominance of pollutant primary and precursor emissions changes
over climate change in driving future changes in O3 and PM levels (Langner et al.
2012a; Coleman et al. 2013; Collette et al. 2013; Lacressonniere et al. 2014). Using
the SRES A1B climate scenario together with the RCP 4.5 for pollutant precursor
emissions, Langner et al. (2012a) found lower summertime daily maximum surface
O3 of around 9 ppbv in Northern Europe in 2100. Similar findings were reported by
Coleman et al. (2013) who noted that changes in meteorology over the North
Atlantic region became more influential over time. In contrast, using the RCP 8.5
Fig. 5.5 Projected changes in annual mean surface (left) O3 (ppbv) and (right) PM2.5 (μg m-3)
from 2000 to 2100 following the RCP scenarios (8.5 red, 6.0 orange, light blue 4.5, 2.6 dark blue)averaged over Europe (land). Coloured lines show the average, and shading denotes the full range
of four chemistry-climate models, and coloured dots and bars represent the average and full rangeof ~15 ACCMIP models (Taken from Fiore et al. (2012) as used in Kirtman et al. (2013). The
European panels are extracted from Figures 11.23a and 11.23b (Kirtman et al. 2013))
60 R.M. Doherty and F.M. O’Connor
scenario, Lacressonniere et al. (2014) reported increased surface O3 over NW
Europe in both the 2030s and 2050s due to the large and unique CH4 emissions
increase under this scenario. As discussed in section “Climate change impacts on
air pollution”, natural emissions of pollutant precursors may be impacted by
climate change. Hence climate-driven increases in natural NOx emissions from
lightning and soils have the potential to offset anthropogenic NOx emission reduc-
tions (Kim et al. 2015).
Health Effects of Air Pollution Under Climate Changeand Combined Emissions and Climate Change
A very limited number of studies have linked climate change impacts on air
pollution to changes in human health; most of these studies have been global
studies (Fang et al. 2013, Silva et al. 2016) or for the USA (e.g. Knowlton et al.
2004; Bell et al. 2007; Tagaris et al. 2009; Post et al. 2012; Garcia-Menendez et al.
2015). These studies have been focussing on chronic or long-term exposure.
One study by Fang et al. (2013) examined global PM2.5 and O3 mortality
associated with climate change under the SRESA1B climate scenario. They
found that PM2.5 levels increased in 2081–2100 relative to 1981–2000 over most
major emission regions due to reduced precipitation – in agreement with Allen et al.
(2016) (see section “Climate change impacts on air pollution: IPCC future climate
scenarios”)-, except in parts of Northern Europe where PM2.5 levels decreased
(Fang et al. 2013). Across Europe annual premature mortality associated with
chronic exposure to PM2.5 increased by ~1% with an additional 3300 deaths
(95% confidence interval, CI, of 2200–4400). Years of life lost (YLL) increasing
by 1% and by approximately 17,000 (95% CI, 11,000–22,000) years. For O3, again,
a mixed response was found with increases in continental Northern Europe and
decreases in Scandinavia (Fig. 2, Fang et al. 2013) in agreement with previous
studies (see section “Climate change impacts on air pollution: IPCC future climate
scenarios”). This led to an overall increase in annual premature mortality due to
respiratory disease from chronic O3 exposure across Europe of 0.6% with an
additional annual 300 deaths (95% CI, 100–500), with YLL increasing by 0.5%
or 5800 years lost (95% CI, 3000–8600). This study assumed a constant population.
A regional European modelling study using the SRES A2 climate scenario also
estimated annual premature mortalities due to exposure to ozone in the 2030s and
2050s. O3-related mortality and morbidity increased over most of Europe but
decrease over the northernmost Nordic and Baltic countries, with the largest change
being a 34% increase over Belgium (Orru et al. 2013). This study highlighted the
results described above that the effects of climate change on ozone concentrations
could differentially influence mortality and morbidity across Europe (Orru et al.
2013).
5 Climate Change Impacts on Air Pollution in Northern Europe 61
The health impacts of combined emissions of precursor pollutants change and
climate change under the four RCP scenarios have recently been investigated by
Silva et al. (2016). These authors additionally considered future population pro-
jections and changes in baseline mortality rates over time. Premature PM2.5 mor-
tality for Europe was reduced by 137,000–176,000 annual deaths across the RCP
scenarios in the 2030s compared to the 2000s. Corresponding annual avoided
mortalities for Europe were 187,000–200,000 deaths for the 2050s and
103,000–112,000 deaths for the 2100s, respectively. As discussed in section “Air
Pollution impacts from combined current and future IPCC climate and emissions
scenarios.” These decreases were driven by reductions in primary and precursor
emissions in the future (Fig. 5.2). O3-related respiratory premature mortality for
Europe also decreased with �880 to �8,870 annual avoided deaths in 2030 and
�440 to �9760 annual avoided deaths in 2050. The lower limits were associated
with the RCP8.5 scenario whereby increasing CH4 emissions offset the impacts of
reductions in other O3 precursor species emissions. In 2100, under RCP8.5 prema-
ture mortality increases by 2,390 annual deaths, whilst premature mortalities are
reduced by �24,900 to �44,600 annually for the other three RCP scenarios.
Overall, the changes in emissions and population, rather than climate change, are
the main drivers of change in PM2.5 and O3 pollution-related health effects.
Discussion and Conclusions
The impacts of climate change on air pollution have been summarised and
discussed in relation to climate and emission scenarios produced for recent IPCC
assessments. There is much literature outlining the effects of climate change on
surface O3 air pollution, and a number of studies focus on Europe. The effects of
climate change on surface PM pollution are less well documented, in part due to the
complexity and uncertainties in quantifying the combined effect of climate change
on PM arising from the net change in its different PM components, but new studies
are emerging. Northern Europe is influenced by several climate phenomena in
relation to pollution transport (and photochemistry) that may in turn be influenced
by climate change: the NAO, mid-latitude cyclones and blocking high-pressure
systems that can be associated with heatwaves in summer. These changes in climate
affect background pollution as well as regional/local pollution episodes in Northern
Europe.
Numerous studies have examined the impacts of climate change based on IPCC
climate scenarios. Over Europe the robustness of a climate penalty has been
discussed. Surface O3 concentrations are generally projected to increase under
climate change in continental Northern Europe (a climate penalty) but decrease
(a climate benefit) further north over the British Isles and Scandinavia. This leads to
a latitudinal gradient in the surface O3 response and consequent health impacts due
to climate change across Northern Europe and shown in both global and regional
modelling studies. For PM, climate penalties and benefits have also been suggested
to occur across Northern Europe. Further studies in this region are needed to
62 R.M. Doherty and F.M. O’Connor
understand (a) the local precipitation response to climate change levels and (b) -
temperature-driven changes in precursor oxidant gases and their partitioning and
their respective influences on surface PM levels and thereby on PM-related mor-
tality and morbidity. There is much uncertainty and few studies on the impacts of
climate change on air pollution episodes.
When projections of primary and precursor pollutant species are considered in
combination with changes in climate, generally the impacts of emission changes
outweigh those due to climate change when considering annual and summertime
mean air pollution levels.
Overall, a key uncertainty is the range of projected changes in surface O3 and
PM across different models when driven by the same climate scenarios. Health
impacts, in relation to chronic exposure to PM and O3, are also uncertain in several
aspects. In particular, there are uncertainties in risk estimates associated with
different health outcomes for O3 and PM exposure, and how these risk estimates
are modified due to temperature or multi-pollutants. In addition, daily baseline
mortality and morbidity rates may not remain constant in the future.
In terms of linkages between climate change and air quality policies, the latest
RCP scenarios highlight the potential for climate and air pollution control policy
scenarios to act in tandem, whereby reductions in methane and black carbon have
benefits for air quality as well as climate change (UNEP 2011; Shindell et al. 2012).
References
Allen RJ, Landuyt W, Rumbold ST (2016) An increase in aerosol burden and radiative effects in a
warmer world. Nat Clim Change 6:269–274. doi:10.1038/nclimate2827
Bach H, Brandt J, Christensen JH, Ellermann T, Geels C, Hertel O, Massling A, Nielsen HØ,
Nielsen O-K, Nordstrøm C, Nøjgaard JK, Skov H, Chatterton T, Hayes E, Laxen D, Irwin J,
Longhurst J, Pelsy F, Zamparutti T (2014) Services to assess the reasons for non-compliance of
ozone target value set by directive 2008/50/EC and potential for air quality improvements in
relation to ozone pollution: final report. ECORYS, Rotterdam
Barnes EA, Fiore AM (2013) Surface ozone variability and the jet position: implications for
projecting future air quality. Geophys Res Lett 40:2839–2844. doi:10.1002/grl.50411
Bell ML, Goldberg R, Hogrefe C, Kinney P, Knowlton K, Lynn B, Rosenthal J, Rosenzweig C,
Patz J (2007) Climate change, ambient ozone, and health in 50 US cities. Clim Chang 82
(1–2):61–76. doi:10.1007/s10584-006-9166-7
Bloomer BJ, Stehr JW, Piety CA, Salawitch RJ, Dickerson RR (2009) Observed relationships of
ozone air pollution with temperature and emissions. Geophys Res Lett 36:L09803. doi:10.
1029/2009GL037308
Brown-Steiner B, Hess P (2011) Asian influence on surface ozone in the United States: a ...
chemistry, seasonality, and transport mechanisms. J Geophys Res 116:D17309. doi:10.1029/
2011JD015846. 1
Butchart N, Scaife AA (2001) Removal of chlorofluorocarbons by increased mass exchange
between the stratosphere and troposphere in a changing climate. Nature 410:799–802.
doi:10.1038/35071047
Christensen JH, Krishna Kumar K, Aldrian E, An S-I, Cavalcanti IFA, de Castro M, Dong W,
Goswami P, Hall A, Kanyanga JK, Kitoh A, Kossin J, Lau N-C, Renwick J, Stephenson DB,
Xie S-P, Zhou T (2013) Climate phenomena and their relevance for future regional climate
5 Climate Change Impacts on Air Pollution in Northern Europe 63
change. In: Stocker TF, Qin D, Plattner G-K, Tignor M, Allen SK, Boschung J, Nauels A,
Xia Y, Bex V, Midgley PM (eds) Climate change 2013: the physical science basis, Contribu-
tion of Working Group I to the Fifth Assessment Report of the Intergovernmental Panel on
Climate Change. Cambridge University Press, Cambridge, UK, pp 1217–1308. doi:10.1017/
CBO9781107415324.028
Christoudias T, Pozzer A, Lelieveld J (2012) Influence of the North Atlantic Oscillation on air
pollution transport. Atmos Chem Phys 12:869–877. doi:10.5194/acp-12-869-2012
Cionni I, Eyring V, Lamarque JF, Randel WJ, Stevenson DS, Wu F, Bodeker GE, Shepherd TG,
Shindell DT, Waugh DW (2011) Ozone database in support of CMIP5 simulations: results and
corresponding radiative forcing. Atmos Chem Phys 11:11267–11292. doi:10.5194/acp-11-
11267-2011
Coleman L, Martin D, Varghese S, Jennings SG, O’Dowd CD (2013) Assessment of changing
meteorology and emissions on air quality using a regional climate model: impact on ozone.
Atmos Environ 69:198–210
Colette A, Bessagnet B, Vautard R, Szopa S, Rao S, Schucht S, Klimont Z, Menut L, Clain G,
Meleux F, Curci G, Rouıl L (2013) European atmosphere in 2050, a regional air quality and
climate perspective under CMIP5 scenarios. Atmos Chem Physics 13:7451–7471. doi:10.
5194/acp-13-7451-2013
Colette A, Andersson C, Baklanov A, Bessagnet B, Brandt J, Christensen JH, Doherty R,
Engardt M, Geels C, Giannakopoulos C, Hedegaard G, Katragkou E, Langner J, Lei H,
Manders A, Melas D, Meleux F, Rouıl L, Sofiev M, Soares J, Stevenson DS, Tombrou-
Tzella M, Varotsos KV, Young P (2015) On the robustness of the ozone climate penalty in
Europe. Environ Res Lett 10:084015. doi:10.1088/1748–9326/10/8/084015
Collins M, Knutti R, Arblaster J, Dufresne J-L, Fichefet T, Friedlingstein P, Gao X, Gutowski WJ,
Johns T, Krinner G, Shongwe M, Tebaldi C, Weaver AJ, Wehner M: Long-term climate
change: projections, commitments and irreversibility. In: Climate Change 2013: the physical
science basis. Contribution of Working Group I to the Fifth Assessment Report of the
Intergovernmental Panel on Climate Change [Stocker TF, Qin D, Plattner G-K, Tignor M,
Allen SK, Boschung J, Nauels A, Xia Y, Bex V, Midgley PM (eds) Cambridge University
Press, Cambridge/New York 2013
COMEAP (2015) Quantification of mortality and hospital admissions associated with ground-
level ozone, UK Department of Health Committee on the Medical Effects of Air Pollution.
ISBN 978-0-85951-776-8, https://www.gov.uk/government/collections/comeap-reports.
Dawson JP, Bloomer BJ, Winner DA, Weaver CP (2013) Understanding the meteorological
drivers of U.S. particulate matter concentrations in a changing climate. Bull Am Meteorol
Soc 95(4):521–532
Doherty RM,Wild O, Shindell DT, Zeng G, MacKenzie IA, Collins WJ, Fiore AM, Stevenson DS,
Dentener FJ, Schultz MG, Hess P, Derwent RG, Keating TJ (2013) Impacts of climate change
on surface ozone and intercontinental ozone pollution: a multi-model study. J Geophys Res
Atmos 118. doi:10.1002/jgrd.50266
Duncan BN, Bey I (2004) A modeling study of the export pathways of pollution from Europe:
seasonal and interannual variations (1987–1997). J Geophys Res-Atmos 109:D08301. doi:10.
1029/2003JD004079
Eckhardt S, Stohl A, Beirle S, Spichtinger N, James P, Forster C, Junker C, Wagner T, Platt U,
Jennings SG (2003) The North Atlantic Oscillation controls air pollution transport to the
Arctic. Atmos Chem Phys 3:1769–1778. doi:10.5194/acp-3-1769-2003
EEA (2015) Air quality in Europe – 2015 report. EEA Report No 5/2015., European Environment
Agency. ISBN: 978–92–9213-701-4. http://www.eea.europa.eu/publications/air-quality-in-
europe-2015
Emberson LD, Kitwiroon N, Beevers S, Büker P, Cinderby S (2013) Scorched Earth: how will
changes in the strength of the vegetation sink to ozone deposition affect human health and
ecosystems? Atmos Chem Phys 13:6741–6755. doi:10.5194/acp-13-6741-2013
64 R.M. Doherty and F.M. O’Connor
Fang Y, Fiore AM, Horowitz LW, Gnanadesikan A, Held I, Chen G, Vecchi G, Levy H (2011) The
impacts of changing transport and precipitation on pollutant distributions in a future climate. J
Geophys Res 116(D18):D18303. doi:10.1029/2011jd015642
Fang Y, Mauzerall DJ, Liu J, Fiore AM, Horowitz (2013) Impacts of 21st century climate change
on global air pollution-related premature mortality. Clim Chang 121:239–253. doi:10.1007/
s10584-013-0847-8
Fiore AM, Naik V, Spracklen DV, Steiner A, Unger N, Prather M et al (2012) Global air quality
and climate. Chem Soc Rev 41:6663–6683
Forkel R, Knoche R (2006) Regional climate change and its impact on photooxidant concentra-
tions in southern Germany: simulations with a coupled regional climate-chemistry model. J
Geophys Res 111:D12302
Garcia-Menendez F, Saari RK, Monier E, Selin NE (2015) U.S. air quality and health benefits from
avoided climate change under greenhouse gas mitigation. Environ Sci Technol 49
(13):7580–7588. doi:10.1021/acs.est.5b01324
Harrison RM, Dall’Osto M, Beddows DCS, Thorpe AJ, Bloss WJ, Allan JD, Coe H, Dorsey JR,
Gallagher M, Martin C, Whitehead J, Williams PI, Jones RL, Langridge JM, Benton AK, Ball
SM, Langford B, Hewitt CN, Davison B, Martin D, Petersson KF, Henshaw SJ, White IR,
Shallcross DE, Barlow JF, Dunbar T, Davies F, Nemitz E, Phillips GJ, Helfter C, Di Marco CF,
Smith S (2012) Atmospheric chemistry and physics in the atmosphere of a developed megacity
(London): an overview of the REPARTEE experiment and its conclusions. Atmos Chem Phys
12:3065–3114. doi:10.5194/acp-12-3065-2012
Hodzic A, Madronich S, Bohn B, Massie S, Menut L, Wiedinmyer C (2007) Wildfire particulate
matter in Europe during summer 2003: meso-scale modeling of smoke emissions, transport and
radiative effect. Atmos Chem Phys 7:4043–4064
Horton DE, Skinner CB, Singh D, Diffenbaugh NS (2014) Occurrence and persistence of future
atmospheric stagnation events. Nat Clim Chang 4:698–703. doi:10.1038/NCLIMATE2272
Hurrell JW (1995) Decadal trends in the North Atlantic Oscillation and relationships to regional
temperature and precipitation. Science 269:676–679
IPCC (2013) In: Stocker TF et al (eds) Climate change 2013: the physical science basis, contri-
bution of Working Group I to the Fifth Assessment Report of the Intergovernmental Panel on
Climate Change. Cambridge University Press, Cambridge
Jacob DJ, Winner DA (2009) Effect of climate change on air quality. Atmos Environ 43:51–63
Katragkou E, Zanis P, Kioutsioukis I, Tegoulias I, Melas D, Krüger BC, Coppola E (2011) Future
climate change impacts on summer surface ozone from regional climate-air quality simulations
over Europe. J Geophys Res. 116(D22307) doi:10.1029/2011JD015899.
Kim MJ, Park RJ, Ho CH, Woo JH, Choi KC, Song CK, Lee JB (2015) Future ozone and oxidants
change under the RCP scenarios. Atmos Environ 101:103–115
Kirtman B, Power SB et al (2013) Near-term climate change: projections and predictability. In:
Stocker TF et al (eds) Climate change 2013: the physical science basis. Contribution of
Working Group I to the Fifth Assessment Report of the Intergovernmental Panel on Climate
Change. Cambridge University Press, Cambridge, UK
Knowland KE, Doherty RM, Hodges KI (2015) The effects of springtime mid-latitude storms on
trace gas composition determined from the MACC reanalysis. Atmos Chem Phys
15:3605–3628. doi:10.5194/acp-15-3605-2015
Knowlton K, Rosenthal JE, Hogrefe C, Lynn B, Gaffin S, Goldberg R, Rosenzweig C, Civerolo K,
Ku JY, Kinney PL (2004) Assessing ozone-related health impacts under a changing climate.
Environ Health Perspect 112:1557–1563
Lacressonniere G, Peuch VH, Vautard R, Arteta J, Deque M, Joly M, Josse B, Marcal V, Saint-
Martin D (2014) European air quality in the 2030s and 2050s: impacts of global and regional
emission trends and of climate change. Atmos Environ 92:348–358
Langner J, Engardt M, Andersson C (2012a) European summer surface ozone 1990-2100. Atmos
Chem Physics 12:10097–10105
5 Climate Change Impacts on Air Pollution in Northern Europe 65
Langner J, Engardt M, Baklanov A, Christensen JH, Gauss M, Geels C, Hedegaard GB,
Nuterman R, Simpson D, Soares J, Sofiev M, Wind P, Zakey A (2012b) A multi-model
study of impacts of climate change on surface ozone in Europe. Atmos Chem Phys
12:10423–10440
Lin M et al (2012) Transport of Asian ozone pollution into surface air over the western United
States in spring. J Geophys Res 117:D00V07. doi:10.1029/2011JD016961
Masato G, Hoskins BJ, Woollings TJ (2013) Winter and summer northern hemisphere blocking in
CMIP5 models. J Clim 26:7044–7059. doi: http://dx.doi.org/10.1175/JCLI-D-12-00466.1
Masui T et al (2011) An emission pathway for stabilization at 6 Wm-2 radiative forcing. Clim
Chang 109:59–76
Meehl GA, Stocker TF, Collins WD, Friedlingstein P, Gaye AT, Gregory JM, Kitoh A, Knutti R,
Murphy JM, Noda A, Raper SCB, Watterson IG, Weaver AJ, Zhao Z-C (2007) Global climate
projections. In: Climate Change 2007: the physical science basis. Contribution of Working
Group I to the Fourth Assessment Report of the Intergovernmental Panel on Climate Change
[Solomon S, Qin D, Manning M, Chen Z, Marquis M, Averyt KB, Tignor M, Miller HL (eds)
Cambridge University Press, Cambridge/New York
Meleux F, Solmon F, Giorgi F (2007) Increase in summer European ozone amounts due to climate
change. Atmos Environ 41(35):7577–7587. doi:10.1016/j.atmosenv.2007.05.048
Nakicenovic N et al (2000) Special report on emission scenarios (SRES) report of Working Group
III of the Intergovernmental Panel on change. Cambridge University Press, Cambridge, UK
Neu JL, Flury T, Manney GL, Santee ML, Livesey NJ, Worden J (2014) Tropospheric ozone
variations governed by changes in stratospheric circulation. Nat Geosci 7:340–344. doi:10.
1038/ngeo2138
O’Connor FM et al (2010) Possible role of wetlands, permafrost, and methane hydrates in the
methane cycle under future climate change: a review. Rev Geophys 48:RG4005. doi:10.1029/
2010RG000326
Orru H, Andersson C, Ebi KL, Langner J, Astrom C, Forsberg B (2013) Impact of climate change
on ozone-related mortality and morbidity in Europe. Eur Respir J 41:285–294. doi:10.1183/
09031936.00210411
Pausata FSR, Pozzoli L, Vignati E, Dentener FJ (2012) North Atlantic Oscillation and tropospheric
ozone variability in Europe: model analysis and measurements intercomparison. Atmos Chem
Phys 12:6357–6376. doi:10.5194/acp-12-6357-2012
Penrod A, Zhang Y, Wang K, Wu SY, Leung L (2014) Impacts of future climate and emission
changes on US air quality. Atmos Environ 89:533–547
Post ES et al (2012) Variation in estimated ozone-related health impacts of climate change due to
modeling choices and assumptions. Environ Health Perspect 120(11):1559–1564
Rasmussen D, Hu J, Mahmud A, Kleeman MJ (2013) The ozone-climate penalty: past, present,
and future. Environ Sci Technol 47:14258–14266
Riahi K, Dentener F, Gielen D, Grubler A, Jewell J, Klimont Z, Krey V, McCollum D, Pachauri S,
Rao S, van Ruijven B, van Vuuren DP, Wilson C (2012) Energy pathways for sustainable
development. In: Schar C, Vidale PL, Lüthi D, Frei C, Haberli C, Liniger MA, Appenzeller C
(eds) Global energy assessment: toward a sustainable future. The role of increasing tempera-
ture variability in European summer heatwaves. Nature 427:332–336
Shindell D, Kuylenstierna JCI, Vignati E, van Dingenen R, Amann M, Klimont Z et al (2012)
Simultaneously mitigating near-term climate change and improving human health and food
security. Science 335:183–189. doi:10.1126/science.1210026
Silva RA, West JJ, Lamarque J-F, Shindell DT, Collins WJ, Dalsoren S, Faluvegi G, Folberth G,
Horowitz LW, Nagashima T, Naik V, Rumbold ST, Sudo K, Takemura T, Bergmann D,
Cameron-Smith P, Cionni I, Doherty RM, Eyring V, Josse B, MacKenzie IA, Plummer DS,
Righi M, Stevenson DS, Strode S, Szopa S, Zeng G (2016) The effect of future ambient air
pollution on human premature mortality to 2100 using output from the ACCMIP model
ensemble. Atmos Chem Phys 16:9847–9862. doi:10.5194/acp-16-9847-2016
Solberg S, Hov O, Sovde A, Isaksen ISA, Coddeville P, De Backer H, Forster C, Orsolini Y, Uhse
K (2008) European surface ozone in the extreme summer 2003. J Geophys Res 113(D07307),
doi:10.1029/2007JD009098.
66 R.M. Doherty and F.M. O’Connor
Stott PA, Stone DA, Allen MR (2004) Human contribution to the European heatwave of 2003.
Nature 432:610–614
Tagaris E, Liao K-J, DeLucia AJ, Deck L, Amar P, Russell AG (2009) Potential impact of climate
change on air pollution-related human health effects. Environ Sci Technol 43(13):4979–4988.
doi:10.1021/es803650w
Thomson AM et al (2011) RCP4.5: a pathway for stabilization of radiative forcing by 2100. Clim
Chang 109:77–94
Ulbrich U, Leckebusch GC, Pinto JG (2009) Extra-tropical cyclones in the present and future
climate: a review. Theor Appl Climatol 96:117–131
UNEP/WMO (2011) UNEP/WMO integrated assessment of black carbon and tropospheric ozone.
http://www.unep.org/dewa/Portals/67/pdf/BlackCarbon_report.pdf
US EPA (2015) Integrated science assessment for oxides of nitrogen – health criteria (Second
External Review Draft) United States Environmental Protection Agency. http://cfpub.epa.gov/
ncea/isa/recordisplay.cfm?deid¼288043
Vautard R, Honore C, Beekmann M, Rouil L (2005) Simulation of ozone during the august 2003
heat wave and emission control scenarios. Atmos Environ 39:2957–2967
van Vuuren DP et al (2011) RCP2.6: exploring the possibility to keep global mean temperature
increase below 2 degrees C. Clim Chang 109:95–116
Webber CP, Dacre HF, Collins WJ, Masato G. (2017) The dynamical impact of Rossby wave
breaking upon UK PM10 concentration. Atmos Chem Phys 17:867–881. doi:10.5194/acp-17-
867-2017
WHO (2013a) Review of evidence on health aspects of air pollution – REVIHAAP project:
technical report. World Health Organisation, Copenhagen. 2013
WHO (2013b) Health risks of air pollution in Europe –HRAPIE project. New emerging risks to
health from air pollution – results from the survey of experts. World Health Organization,
Regional Office for Europe, Copenhagen
Wu S, Mickley LJ, Leibensperger EM, Jacob DJ, Rind D, Streets DG (2008) Effects of 2000-2050
global change on ozone air quality in the United States. J Geophys Res 113. doi:10.1029/
2007JD008917
Yin JH (2005) A consistent poleward shift of the storm tracks in simulations of 21st century
climate. Geophys Res Lett 32:4
Yin J, Harrison RM (2008) Pragmatic mass closure study for PM1.0, PM2.5 and PM10 at roadside,
urban background and rural sites. Atmos Environ 42:980–988
Ruth M. Doherty is a professor of atmospheric sciences at the University of Edinburgh, UK. She
has 20 years’ experience in modelling air pollution and climate at global, regional and urban
scales, linked to health effects, and authored over 65 papers. She is a member of the UNECE Task
Force on Hemispheric Transport of Air Pollution and leads their climate change research
programme.
Fiona M. O’Connor is a climate scientist working on atmospheric chemistry, with a particular
interest in methane, chemistry-climate interactions, air quality and climate system feedbacks.
Fiona’s work aims to gain a better understanding of the sources and sinks of atmospheric methane,
the interannual variability of methane emissions and atmospheric concentrations and the potential
feedbacks in the climate system which may affect future concentrations of atmospheric methane.
She is also interested in modelling and understanding the role of short-lived atmospheric trace
gases, such as ozone and methane, in climate change. A key aspect of her work is developing and
running the UK Chemistry and Aerosol (UKCA) model on a global scale and on a decadal-to-
centennial timescale. She is also working towards implementing UKCA in a regional climate
model, so that the interactions between climate and air quality on a more regional scale can be
explored.
5 Climate Change Impacts on Air Pollution in Northern Europe 67
Chapter 6
The Impact of Climate Change and AirPollution in the Southern European Countries
Cosimo Palagiano and Rossella Belluso
Abstract The extension of Europe from the North to the South, i.e., from
Knivskjellodden in Magerøya Island in Norway at 71� 110 0800 N and the Isola
delle Correnti in Sicily at 36�3804400N, is of 35�, with a difference in latitude of
about 35�. We pass from the Arctic Ocean to the Mediterranean, with a significant
difference in temperature and rainfall. In addition the population density varies
from 15.5 inhabitants per sq.km to about 196 inhabitants per sq.km, about 13 times
more. The climate parameters and the distribution of population have considerable
importance in air pollution and in its variation.
In the Southern European countries, which we consider in this chapter, the car
traffic and the solar irradiation have a great impact on the pollution, together with
the industrial pollution.
Keywords Europe • Air pollution • Ambient • EU Ambient Quality Directive •
Human health • Urban quality of life
Introduction
In this chapter, we consider the climate change and air pollution of the Southern
European countries. The European countries which belong to the European Union
are 28, including the United Kingdom, before the referendum on Brexit. The
chapter will take in consideration only the major Mediterranean countries, such
as Portugal, Spain, France, Italy, and Greece.
First of all, we should consider the most evident effects of the climate change all
over Europe, summing up in the Table 6.1. According to Alcamo and Olesen (2012,
p. 209), the Mediterranean region is one of the most vulnerable areas of Europe
C. Palagiano (*)
Dipartimento Di Scienze Documentarie, Linguistico-Filologiche e Geografiche,
Sapienza University of Rome, Rome, Italy
e-mail: [email protected]
R. Belluso
Sapienza University of Rome, Rome, Italy
e-mail: [email protected]
© Springer International Publishing AG 2018
R. Akhtar, C. Palagiano (eds.), Climate Change and Air Pollution,Springer Climate, DOI 10.1007/978-3-319-61346-8_6
69
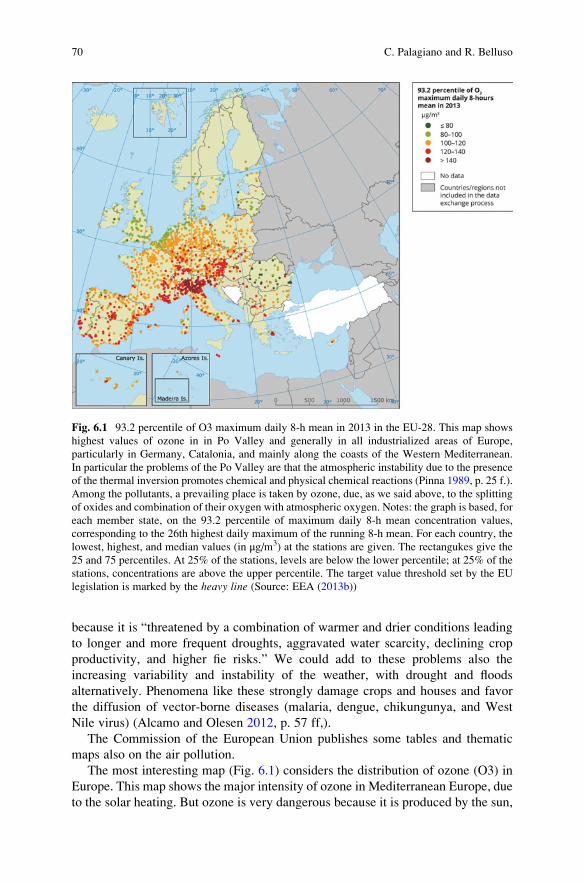
because it is “threatened by a combination of warmer and drier conditions leading
to longer and more frequent droughts, aggravated water scarcity, declining crop
productivity, and higher fie risks.” We could add to these problems also the
increasing variability and instability of the weather, with drought and floods
alternatively. Phenomena like these strongly damage crops and houses and favor
the diffusion of vector-borne diseases (malaria, dengue, chikungunya, and West
Nile virus) (Alcamo and Olesen 2012, p. 57 ff,).
The Commission of the European Union publishes some tables and thematic
maps also on the air pollution.
The most interesting map (Fig. 6.1) considers the distribution of ozone (O3) in
Europe. This map shows the major intensity of ozone in Mediterranean Europe, due
to the solar heating. But ozone is very dangerous because it is produced by the sun,
Fig. 6.1 93.2 percentile of O3 maximum daily 8-h mean in 2013 in the EU-28. This map shows
highest values of ozone in in Po Valley and generally in all industrialized areas of Europe,
particularly in Germany, Catalonia, and mainly along the coasts of the Western Mediterranean.
In particular the problems of the Po Valley are that the atmospheric instability due to the presence
of the thermal inversion promotes chemical and physical chemical reactions (Pinna 1989, p. 25 f.).
Among the pollutants, a prevailing place is taken by ozone, due, as we said above, to the splitting
of oxides and combination of their oxygen with atmospheric oxygen. Notes: the graph is based, for
each member state, on the 93.2 percentile of maximum daily 8-h mean concentration values,
corresponding to the 26th highest daily maximum of the running 8-h mean. For each country, the
lowest, highest, and median values (in μg/m3) at the stations are given. The rectangukes give the
25 and 75 percentiles. At 25% of the stations, levels are below the lower percentile; at 25% of the
stations, concentrations are above the upper percentile. The target value threshold set by the EU
legislation is marked by the heavy line (Source: EEA (2013b))
70 C. Palagiano and R. Belluso
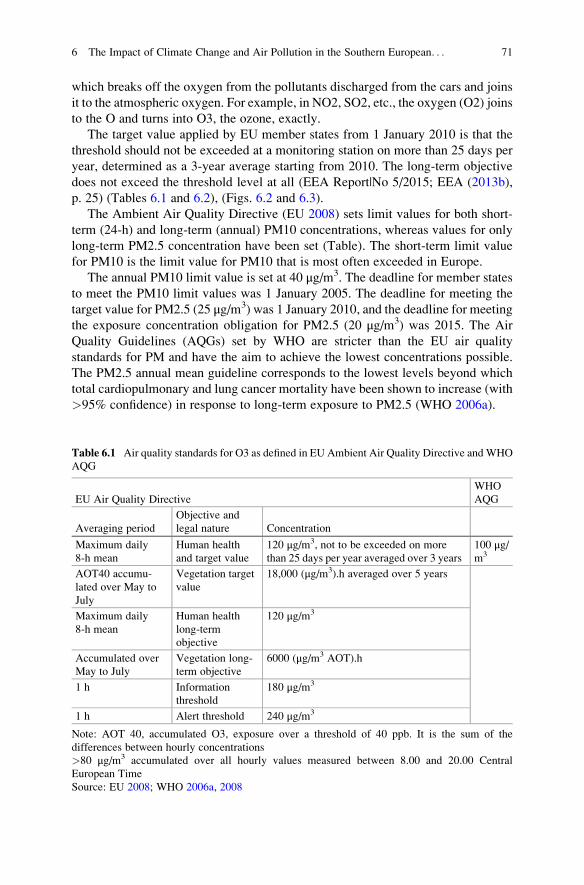
which breaks off the oxygen from the pollutants discharged from the cars and joins
it to the atmospheric oxygen. For example, in NO2, SO2, etc., the oxygen (O2) joins
to the O and turns into O3, the ozone, exactly.
The target value applied by EU member states from 1 January 2010 is that the
threshold should not be exceeded at a monitoring station on more than 25 days per
year, determined as a 3-year average starting from 2010. The long-term objective
does not exceed the threshold level at all (EEA Report|No 5/2015; EEA (2013b),
p. 25) (Tables 6.1 and 6.2), (Figs. 6.2 and 6.3).
The Ambient Air Quality Directive (EU 2008) sets limit values for both short-
term (24-h) and long-term (annual) PM10 concentrations, whereas values for only
long-term PM2.5 concentration have been set (Table). The short-term limit value
for PM10 is the limit value for PM10 that is most often exceeded in Europe.
The annual PM10 limit value is set at 40 μg/m3. The deadline for member states
to meet the PM10 limit values was 1 January 2005. The deadline for meeting the
target value for PM2.5 (25 μg/m3) was 1 January 2010, and the deadline for meeting
the exposure concentration obligation for PM2.5 (20 μg/m3) was 2015. The Air
Quality Guidelines (AQGs) set by WHO are stricter than the EU air quality
standards for PM and have the aim to achieve the lowest concentrations possible.
The PM2.5 annual mean guideline corresponds to the lowest levels beyond which
total cardiopulmonary and lung cancer mortality have been shown to increase (with
>95% confidence) in response to long-term exposure to PM2.5 (WHO 2006a).
Table 6.1 Air quality standards for O3 as defined in EU Ambient Air Quality Directive andWHO
AQG
EU Air Quality Directive
WHO
AQG
Averaging period
Objective and
legal nature Concentration
Maximum daily
8-h mean
Human health
and target value
120 μg/m3, not to be exceeded on more
than 25 days per year averaged over 3 years
100 μg/m3
AOT40 accumu-
lated over May to
July
Vegetation target
value
18,000 (μg/m3).h averaged over 5 years
Maximum daily
8-h mean
Human health
long-term
objective
120 μg/m3
Accumulated over
May to July
Vegetation long-
term objective
6000 (μg/m3 AOT).h
1 h Information
threshold
180 μg/m3
1 h Alert threshold 240 μg/m3
Note: AOT 40, accumulated O3, exposure over a threshold of 40 ppb. It is the sum of the
differences between hourly concentrations
>80 μg/m3 accumulated over all hourly values measured between 8.00 and 20.00 Central
European Time
Source: EU 2008; WHO 2006a, 2008
6 The Impact of Climate Change and Air Pollution in the Southern European. . . 71
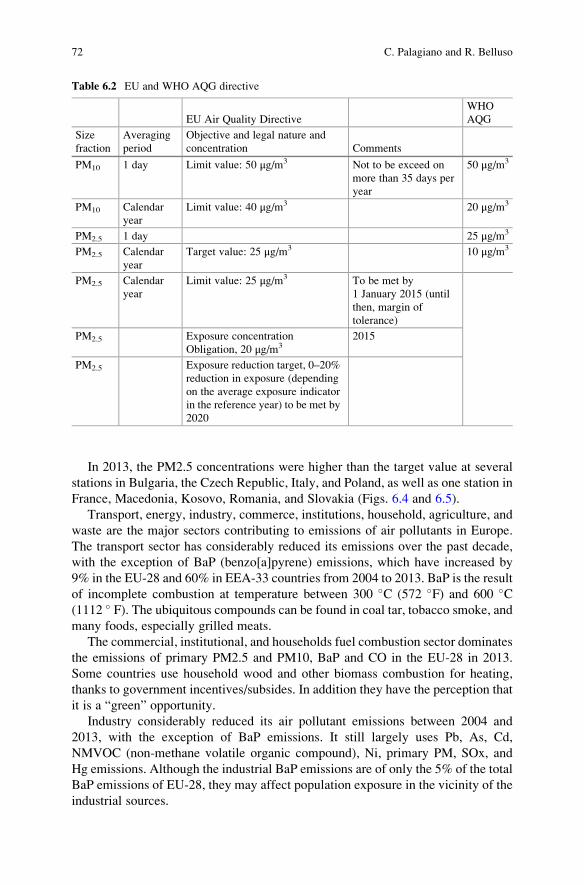
In 2013, the PM2.5 concentrations were higher than the target value at several
stations in Bulgaria, the Czech Republic, Italy, and Poland, as well as one station in
France, Macedonia, Kosovo, Romania, and Slovakia (Figs. 6.4 and 6.5).
Transport, energy, industry, commerce, institutions, household, agriculture, and
waste are the major sectors contributing to emissions of air pollutants in Europe.
The transport sector has considerably reduced its emissions over the past decade,
with the exception of BaP (benzo[a]pyrene) emissions, which have increased by
9% in the EU-28 and 60% in EEA-33 countries from 2004 to 2013. BaP is the result
of incomplete combustion at temperature between 300 �C (572 �F) and 600 �C(1112 � F). The ubiquitous compounds can be found in coal tar, tobacco smoke, and
many foods, especially grilled meats.
The commercial, institutional, and households fuel combustion sector dominates
the emissions of primary PM2.5 and PM10, BaP and CO in the EU-28 in 2013.
Some countries use household wood and other biomass combustion for heating,
thanks to government incentives/subsides. In addition they have the perception that
it is a “green” opportunity.
Industry considerably reduced its air pollutant emissions between 2004 and
2013, with the exception of BaP emissions. It still largely uses Pb, As, Cd,
NMVOC (non-methane volatile organic compound), Ni, primary PM, SOx, and
Hg emissions. Although the industrial BaP emissions are of only the 5% of the total
BaP emissions of EU-28, they may affect population exposure in the vicinity of the
industrial sources.
Table 6.2 EU and WHO AQG directive
EU Air Quality Directive
WHO
AQG
Size
fraction
Averaging
period
Objective and legal nature and
concentration Comments
PM10 1 day Limit value: 50 μg/m3 Not to be exceed on
more than 35 days per
year
50 μg/m3
PM10 Calendar
year
Limit value: 40 μg/m3 20 μg/m3
PM2.5 1 day 25 μg/m3
PM2.5 Calendar
year
Target value: 25 μg/m3 10 μg/m3
PM2.5 Calendar
year
Limit value: 25 μg/m3 To be met by
1 January 2015 (until
then, margin of
tolerance)
PM2.5 Exposure concentration
Obligation, 20 μg/m32015
PM2.5 Exposure reduction target, 0–20%
reduction in exposure (depending
on the average exposure indicator
in the reference year) to be met by
2020
72 C. Palagiano and R. Belluso
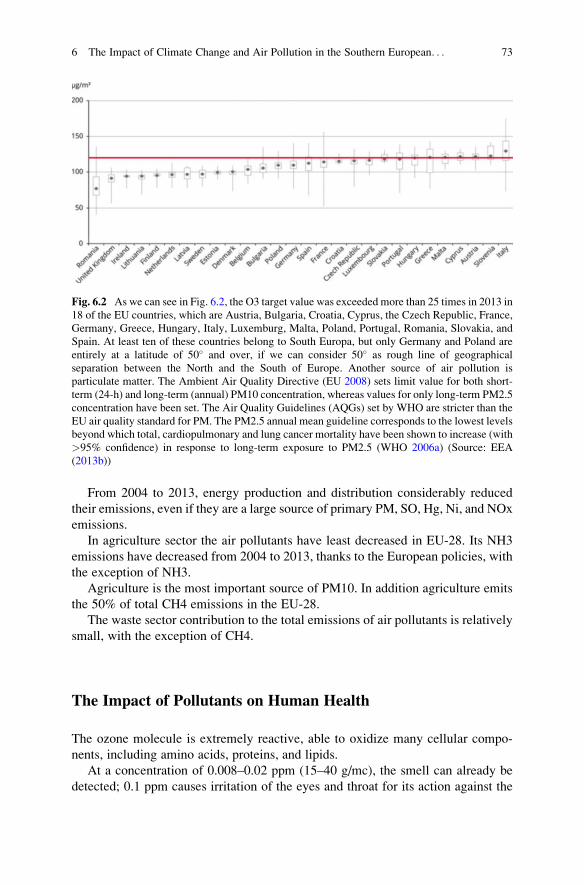
From 2004 to 2013, energy production and distribution considerably reduced
their emissions, even if they are a large source of primary PM, SO, Hg, Ni, and NOx
emissions.
In agriculture sector the air pollutants have least decreased in EU-28. Its NH3
emissions have decreased from 2004 to 2013, thanks to the European policies, with
the exception of NH3.
Agriculture is the most important source of PM10. In addition agriculture emits
the 50% of total CH4 emissions in the EU-28.
The waste sector contribution to the total emissions of air pollutants is relatively
small, with the exception of CH4.
The Impact of Pollutants on Human Health
The ozone molecule is extremely reactive, able to oxidize many cellular compo-
nents, including amino acids, proteins, and lipids.
At a concentration of 0.008–0.02 ppm (15–40 g/mc), the smell can already be
detected; 0.1 ppm causes irritation of the eyes and throat for its action against the
Fig. 6.2 As we can see in Fig. 6.2, the O3 target value was exceeded more than 25 times in 2013 in
18 of the EU countries, which are Austria, Bulgaria, Croatia, Cyprus, the Czech Republic, France,
Germany, Greece, Hungary, Italy, Luxemburg, Malta, Poland, Portugal, Romania, Slovakia, and
Spain. At least ten of these countries belong to South Europa, but only Germany and Poland are
entirely at a latitude of 50� and over, if we can consider 50� as rough line of geographical
separation between the North and the South of Europe. Another source of air pollution is
particulate matter. The Ambient Air Quality Directive (EU 2008) sets limit value for both short-
term (24-h) and long-term (annual) PM10 concentration, whereas values for only long-term PM2.5
concentration have been set. The Air Quality Guidelines (AQGs) set by WHO are stricter than the
EU air quality standard for PM. The PM2.5 annual mean guideline corresponds to the lowest levels
beyond which total, cardiopulmonary and lung cancer mortality have been shown to increase (with
>95% confidence) in response to long-term exposure to PM2.5 (WHO 2006a) (Source: EEA
(2013b))
6 The Impact of Climate Change and Air Pollution in the Southern European. . . 73
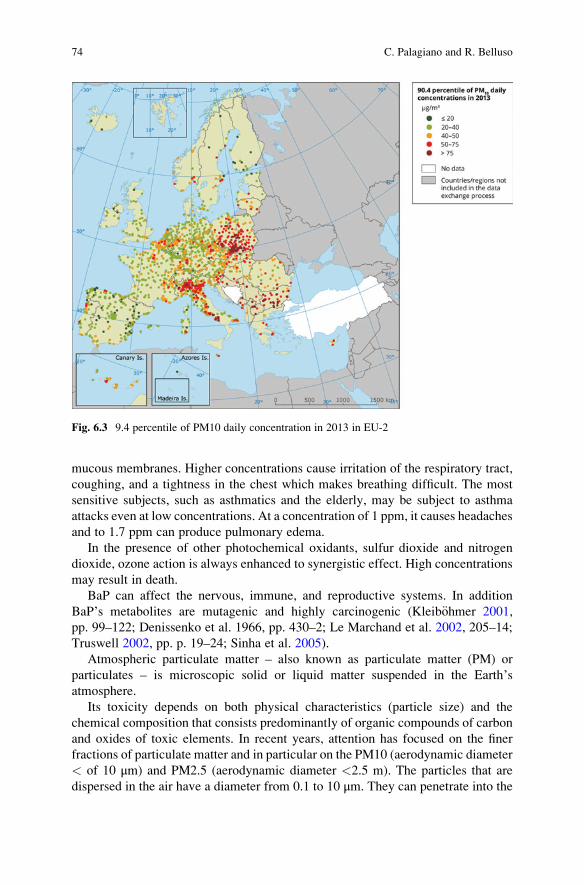
mucous membranes. Higher concentrations cause irritation of the respiratory tract,
coughing, and a tightness in the chest which makes breathing difficult. The most
sensitive subjects, such as asthmatics and the elderly, may be subject to asthma
attacks even at low concentrations. At a concentration of 1 ppm, it causes headaches
and to 1.7 ppm can produce pulmonary edema.
In the presence of other photochemical oxidants, sulfur dioxide and nitrogen
dioxide, ozone action is always enhanced to synergistic effect. High concentrations
may result in death.
BaP can affect the nervous, immune, and reproductive systems. In addition
BaP’s metabolites are mutagenic and highly carcinogenic (Kleib€ohmer 2001,
pp. 99–122; Denissenko et al. 1966, pp. 430–2; Le Marchand et al. 2002, 205–14;
Truswell 2002, pp. p. 19–24; Sinha et al. 2005).
Atmospheric particulate matter – also known as particulate matter (PM) or
particulates – is microscopic solid or liquid matter suspended in the Earth’satmosphere.
Its toxicity depends on both physical characteristics (particle size) and the
chemical composition that consists predominantly of organic compounds of carbon
and oxides of toxic elements. In recent years, attention has focused on the finer
fractions of particulate matter and in particular on the PM10 (aerodynamic diameter
< of 10 μm) and PM2.5 (aerodynamic diameter <2.5 m). The particles that are
dispersed in the air have a diameter from 0.1 to 10 μm. They can penetrate into the
Fig. 6.3 9.4 percentile of PM10 daily concentration in 2013 in EU-2
74 C. Palagiano and R. Belluso
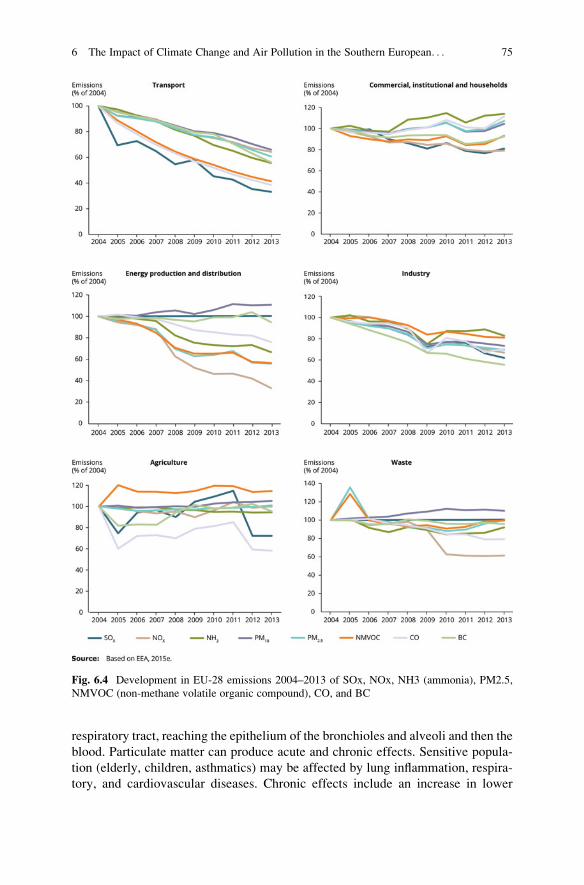
respiratory tract, reaching the epithelium of the bronchioles and alveoli and then the
blood. Particulate matter can produce acute and chronic effects. Sensitive popula-
tion (elderly, children, asthmatics) may be affected by lung inflammation, respira-
tory, and cardiovascular diseases. Chronic effects include an increase in lower
Fig. 6.4 Development in EU-28 emissions 2004–2013 of SOx, NOx, NH3 (ammonia), PM2.5,
NMVOC (non-methane volatile organic compound), CO, and BC
6 The Impact of Climate Change and Air Pollution in the Southern European. . . 75
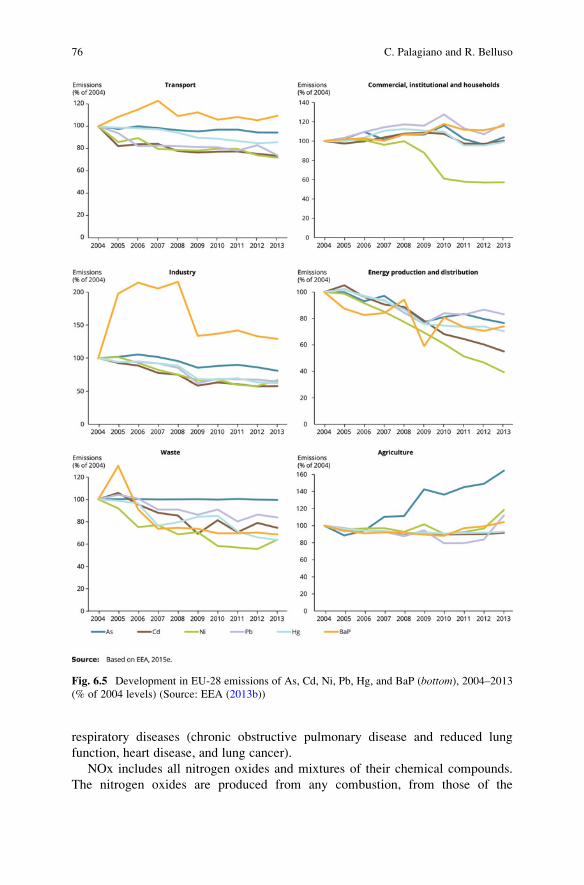
respiratory diseases (chronic obstructive pulmonary disease and reduced lung
function, heart disease, and lung cancer).
NOx includes all nitrogen oxides and mixtures of their chemical compounds.
The nitrogen oxides are produced from any combustion, from those of the
Fig. 6.5 Development in EU-28 emissions of As, Cd, Ni, Pb, Hg, and BaP (bottom), 2004–2013(% of 2004 levels) (Source: EEA (2013b))
76 C. Palagiano and R. Belluso
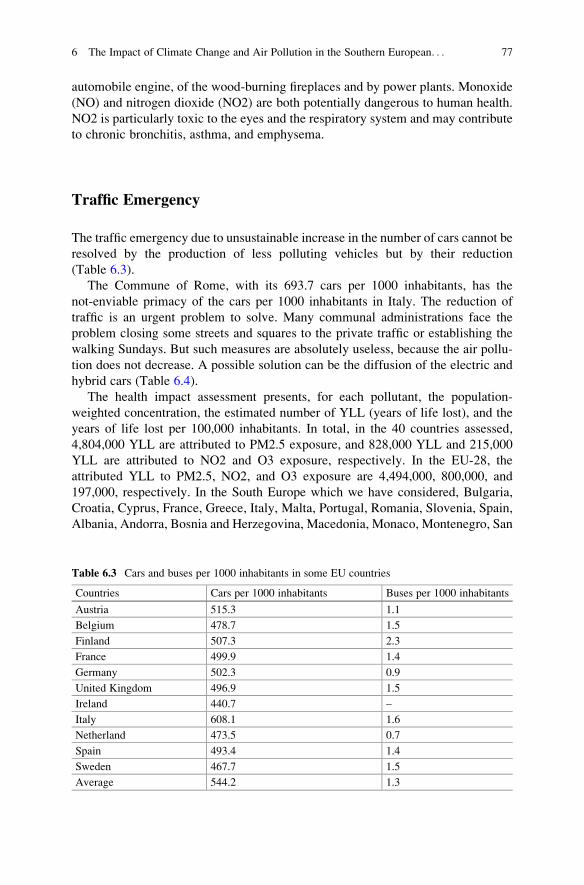
automobile engine, of the wood-burning fireplaces and by power plants. Monoxide
(NO) and nitrogen dioxide (NO2) are both potentially dangerous to human health.
NO2 is particularly toxic to the eyes and the respiratory system and may contribute
to chronic bronchitis, asthma, and emphysema.
Traffic Emergency
The traffic emergency due to unsustainable increase in the number of cars cannot be
resolved by the production of less polluting vehicles but by their reduction
(Table 6.3).
The Commune of Rome, with its 693.7 cars per 1000 inhabitants, has the
not-enviable primacy of the cars per 1000 inhabitants in Italy. The reduction of
traffic is an urgent problem to solve. Many communal administrations face the
problem closing some streets and squares to the private traffic or establishing the
walking Sundays. But such measures are absolutely useless, because the air pollu-
tion does not decrease. A possible solution can be the diffusion of the electric and
hybrid cars (Table 6.4).
The health impact assessment presents, for each pollutant, the population-
weighted concentration, the estimated number of YLL (years of life lost), and the
years of life lost per 100,000 inhabitants. In total, in the 40 countries assessed,
4,804,000 YLL are attributed to PM2.5 exposure, and 828,000 YLL and 215,000
YLL are attributed to NO2 and O3 exposure, respectively. In the EU-28, the
attributed YLL to PM2.5, NO2, and O3 exposure are 4,494,000, 800,000, and
197,000, respectively. In the South Europe which we have considered, Bulgaria,
Croatia, Cyprus, France, Greece, Italy, Malta, Portugal, Romania, Slovenia, Spain,
Albania, Andorra, Bosnia and Herzegovina, Macedonia, Monaco, Montenegro, San
Table 6.3 Cars and buses per 1000 inhabitants in some EU countries
Countries Cars per 1000 inhabitants Buses per 1000 inhabitants
Austria 515.3 1.1
Belgium 478.7 1.5
Finland 507.3 2.3
France 499.9 1.4
Germany 502.3 0.9
United Kingdom 496.9 1.5
Ireland 440.7 –
Italy 608.1 1.6
Netherland 473.5 0.7
Spain 493.4 1.4
Sweden 467.7 1.5
Average 544.2 1.3
6 The Impact of Climate Change and Air Pollution in the Southern European. . . 77
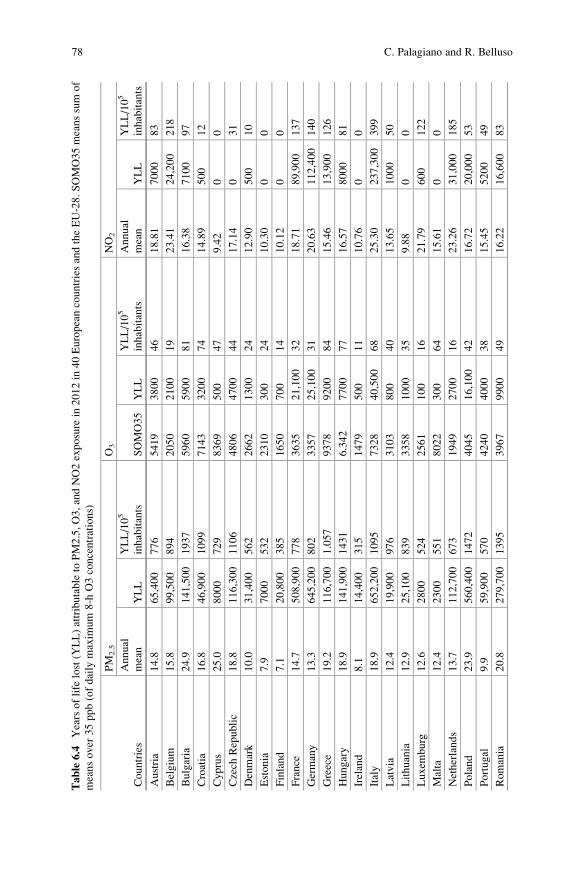
Table6.4
Yearsoflife
lost(Y
LL)attributableto
PM2.5,O3,andNO2exposure
in2012in
40EuropeancountriesandtheEU-28.SOMO35meanssum
of
meansover
35ppb(ofdaily
maxim
um
8-h
O3concentrations)
Countries
PM
2.5
O3
NO2
Annual
mean
YLL
YLL/105
inhabitants
SOMO35
YLL
YLL/105
inhabitants
Annual
mean
YLL
YLL/105
inhabitants
Austria
14.8
65,400
776
5419
3800
46
18.81
7000
83
Belgium
15.8
99,500
894
2050
2100
19
23.41
24,200
218
Bulgaria
24.9
141,500
1937
5960
5900
81
16.38
7100
97
Croatia
16.8
46,900
1099
7143
3200
74
14.89
500
12
Cyprus
25.0
8000
729
8369
500
47
9.42
00
Czech
Republic
18.8
116,300
1106
4806
4700
44
17.14
031
Denmark
10.0
31,400
562
2662
1300
24
12.90
500
10
Estonia
7.9
7000
532
2310
300
24
10.30
00
Finland
7.1
20,800
385
1650
700
14
10.12
00
France
14.7
508,900
778
3635
21,100
32
18.71
89,900
137
Germany
13.3
645,200
802
3357
25,100
31
20.63
112,400
140
Greece
19.2
116,700
1.057
9378
9200
84
15.46
13,900
126
Hungary
18.9
141,900
1431
6.342
7700
77
16.57
8000
81
Ireland
8.1
14,400
315
1479
500
11
10.76
00
Italy
18.9
652,200
1095
7328
40,500
68
25.30
237,300
399
Latvia
12.4
19,900
976
3103
800
40
13.65
1000
50
Lithuania
12.9
25,100
839
3358
1000
35
9.88
00
Luxem
burg
12.6
2800
524
2561
100
16
21.79
600
122
Malta
12.4
2300
551
8022
300
64
15.61
00
Netherlands
13.7
112,700
673
1949
2700
16
23.26
31,000
185
Poland
23.9
560,400
1472
4045
16,100
42
16.72
20,000
53
Portugal
9.9
59,900
570
4240
4000
38
15.45
5200
49
Romania
20.8
279,700
1395
3967
9900
49
16.22
16,600
83
78 C. Palagiano and R. Belluso
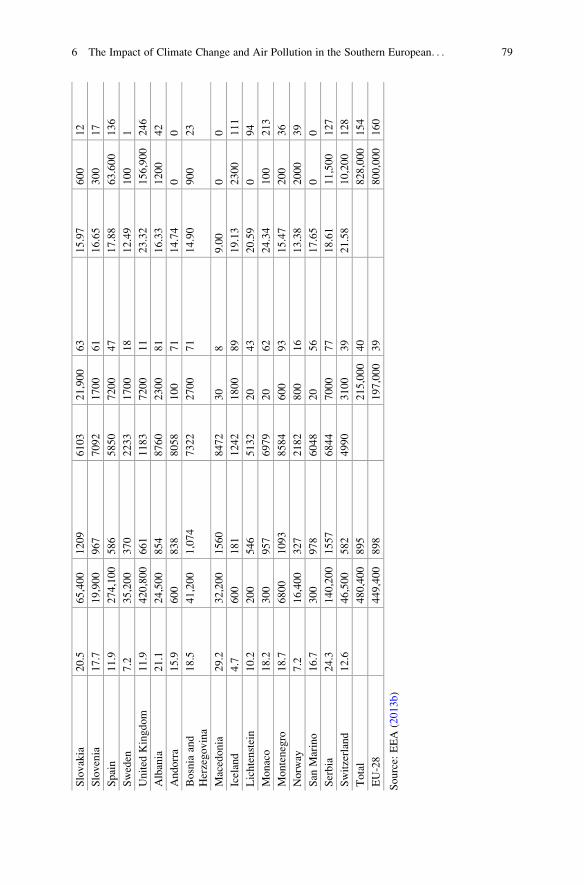
Slovakia
20.5
65,400
1209
6103
21,900
63
15.97
600
12
Slovenia
17.7
19,900
967
7092
1700
61
16.65
300
17
Spain
11.9
274,100
586
5850
7200
47
17.88
63.600
136
Sweden
7.2
35,200
370
2233
1700
18
12.49
100
1
United
Kingdom
11.9
420,800
661
1183
7200
11
23.32
156,900
246
Albania
21.1
24,500
854
8760
2300
81
16.33
1200
42
Andorra
15.9
600
838
8058
100
71
14.74
00
Bosnia
and
Herzegovina
18.5
41,200
1,074
7322
2700
71
14.90
900
23
Macedonia
29.2
32,200
1560
8472
30
89.00
00
Iceland
4.7
600
181
1242
1800
89
19.13
2300
111
Lichtenstein
10.2
200
546
5132
20
43
20.59
094
Monaco
18.2
300
957
6979
20
62
24.34
100
213
Montenegro
18.7
6800
1093
8584
600
93
15.47
200
36
Norw
ay7.2
16,400
327
2182
800
16
13.38
2000
39
San
Marino
16.7
300
978
6048
20
56
17.65
00
Serbia
24.3
140,200
1557
6844
7000
77
18.61
11,500
127
Switzerland
12.6
46,500
582
4990
3100
39
21.58
10,200
128
Total
480,400
895
215,000
40
828,000
154
EU-28
449,400
898
197,000
39
800,000
160
Source:
EEA(2013b)
6 The Impact of Climate Change and Air Pollution in the Southern European. . . 79
Marino, and Serbia registered 19,695, 1011, and 1826 YLL/100,000 inhabitants for
impact of PM2.5, O3, and NO2, respectively (Table 6.5).
Premature deaths occur when a person dies before the standard age expectancy
of a country and gender. These deaths can be preventable if their cause can be
eliminated. Years of life lost (YLL) is determined by an estimated average years
that a person would have lived if he (she) had not died prematurely.
The South European countries have charged in total of 214,480 premature deaths
attributable to PM2.5, 7328 to O3, and 29,737 to NO2 exposure, respectively, that is
of 53.22, 45.73, and 41.30 in percent of the values of EU-28, respectively. It
depends on the total population of the South European countries. The South
European countries have a total population of about 237,771,436 inhabitants,
which is about the 28.57% of the total European population. But the South EU-28
population of 227,287,593 inhabitants is of 44.56% of the total EU-28 population.
The highest numbers of YLL from PM2.5 are observed in the countries with the
largest populations (France and Italy), but if we consider YLL per 100,000 inhab-
itants, we can observe the largest impacts in the central and eastern European
countries, which have also the highest concentrations.
Regarding O3, the countries with the largest impacts are Italy, Spain, and
France. The highest rate of YLL per 100,000 inhabitants is presented by the
countries in the Western Balkans and Italy.
The largest health impact attributable to NO2 exposure is in the hot-spot regions,
as Italy (Po Valley).
The Benefits
The benefits can be real if the EU countries slow down the use of polluting fuels and
initiate a serious program of nonpolluting fuels, such as solar, wind, etc., energy in
all economic and domestic sectors. The photovoltaic system is increasing in
Europe. We hope that this will be prevailing in the immediate future. According
to Alcamo and Olesen (2012), p. 253, “Wind energy is one of the fastest growing
energy technologies in the world, with Europe leading the world with 69 percent of
total capacity: Wind energy now satisfies about 5% of the EU’s total electricity
demand. . .It accounts for over 5% of electricity usage in five countries (Germany,
Ireland, Portugal, Spain, and Denmark). . . In terms of total capacity, the leaders in
the EU are Germany with over 22,000 MW and Spain with more than 15,000 MW
installed capacity.”
The photovoltaic technology is growing at a tremendous rate: total installed
capacity of photovoltaic panels in the EU was 1542ı1 MW at peak performance, led
by Germany (1103), Spain (341), and Italy (50) (Enery.eu – Europe’s energy portal:www.energy.eu/#renewable).
The capacity of thermal solar collectors in the EU is 14,289 MW led by Germany
(2301), Austria (1987), and France (812).
80 C. Palagiano and R. Belluso
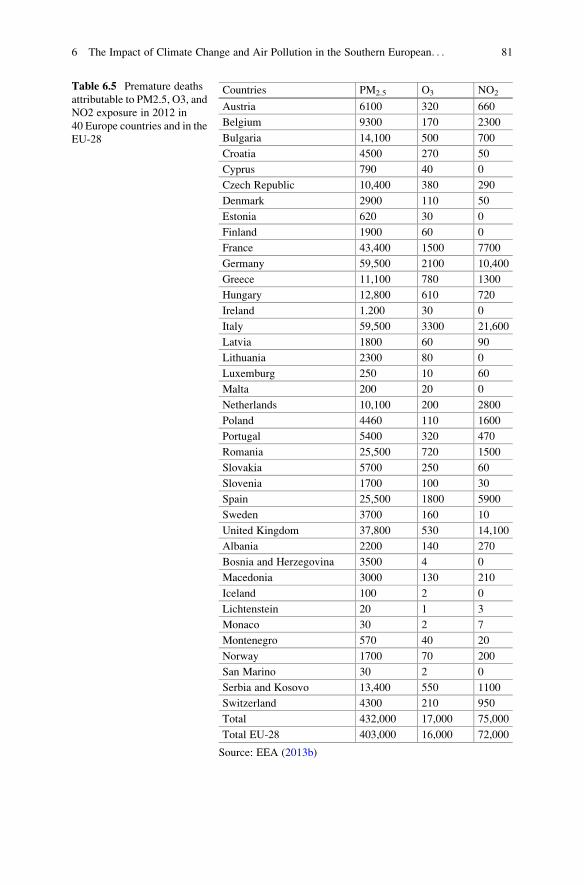
Table 6.5 Premature deaths
attributable to PM2.5, O3, and
NO2 exposure in 2012 in
40 Europe countries and in the
EU-28
Countries PM2.5 O3 NO2
Austria 6100 320 660
Belgium 9300 170 2300
Bulgaria 14,100 500 700
Croatia 4500 270 50
Cyprus 790 40 0
Czech Republic 10,400 380 290
Denmark 2900 110 50
Estonia 620 30 0
Finland 1900 60 0
France 43,400 1500 7700
Germany 59,500 2100 10,400
Greece 11,100 780 1300
Hungary 12,800 610 720
Ireland 1.200 30 0
Italy 59,500 3300 21,600
Latvia 1800 60 90
Lithuania 2300 80 0
Luxemburg 250 10 60
Malta 200 20 0
Netherlands 10,100 200 2800
Poland 4460 110 1600
Portugal 5400 320 470
Romania 25,500 720 1500
Slovakia 5700 250 60
Slovenia 1700 100 30
Spain 25,500 1800 5900
Sweden 3700 160 10
United Kingdom 37,800 530 14,100
Albania 2200 140 270
Bosnia and Herzegovina 3500 4 0
Macedonia 3000 130 210
Iceland 100 2 0
Lichtenstein 20 1 3
Monaco 30 2 7
Montenegro 570 40 20
Norway 1700 70 200
San Marino 30 2 0
Serbia and Kosovo 13,400 550 1100
Switzerland 4300 210 950
Total 432,000 17,000 75,000
Total EU-28 403,000 16,000 72,000
Source: EEA (2013b)
6 The Impact of Climate Change and Air Pollution in the Southern European. . . 81
By 2030, the potential annual production of “environmental compatible” bio-
mass could be 40 MtOE from the waste and forest residues and municipal waste.
This amount to 15–16% of Europe’s projected primary energy production in 2030
(Alcamo and Olesen 2012, p. 259).
The contribution of hydroelectric facilities to overall electricity production is
substantial, providing 17% of global electricity and 17.9% of electricity in the EU.
Renewable energies are not limited to wind, sun of falling water, but also include
the heat of the earth and the movement of oceans. The sources can make a
contribution to reducing CO2 emissions, but their long-term potential for producing
electricity is not as great as for other renewable sources (Alcamo and Olesen 2012,
pp. 254–261).
Conclusive Remarks
According to the last data of the EEA (European Environment Agency), 467,000
deaths occur in UE yearly (2012–2014) from air pollution (particulate, ozone,
nitrogen dioxide, benzo(a)pyrene, and sulfur dioxide). Despite the air quality in
Europe is improving, air pollution remains the biggest risk environmental factor for
human health and lowers the quality of life. The goal is to reduce the smog and
water pollution effects on 50% of the population by 2030. In Italy there are 63,630
victims of the particulate, 21,040 of nitrogen dioxide, and 3380 for ozone. Alarming
also German data, der United Kingdom and France. Among the top places for
victims of smog, there are also Poland and Spain. Looking for a sustainable
mobility is possible. Smog deteriorates the quality of life especially in big cities,
affecting 60% of population.
The introduction of gas methane cars or electrical partly or entirely could
mitigate the emission of harmful gases. However, the responsibility is not only
collective but also individual.
References
Ainsworth EA, Yendrek CR, Sitch, Collins W, Emberson LD (2012) The effects of tropospheric
ozone on net primary productivity and implication or climate change. Annu Rev Plant Biol
63:637–661
Alcamo J, Olesen JE (2012) Life in Europe under climate change. Wiley-Blackwell, Chichester
Bach H, Brandt J, Christensen JH, Ellermann T, Geels C, Hertel O, Massling A, Nielsen HØ,
Nielsen O-K, Nordstrøm C, Nøjgaard JK, Skov H, Chatterton T, Hayes E, Laxen D, Irwin J,
Longhurst J, Pelsy F, Zamparutti T (2014) Services to assess the reasons for non-compliance of
ozone target value set by directive 2008/50/EC and potential for air quality improvements in
relation to ozone pollution: final report. ECORYS, Rotterdam
82 C. Palagiano and R. Belluso
Dahl A, Gharibi A, Swietlicki E, Gudmundsson A, Bohgard M, Ljungman A, Blomqvist G,
Gustafsson M (2006) Traffic-generated emissions of ultrafine particles from pavement–tire
interface. Atmos Environ 40(7):1314–1323
De Vries W, Hetteling J-P, Posch M (eds) (2015) Critical loads and dynamic risk assessments:
nitrogen, acidity and metals in terrestrial an aquatic ecosystem, Environmental Pollution
Series, vol 25. Springer, Dordrecht
Denissenko MF, Pao A, Tang M, Pfeifer GP (1996) Preferential formation of benzo[a]pyrene
adducts at lung cancer mutational hotspots in P53. Science 274(5286):430–432
Grice S, Stedman J, Kent A, Hobson M, Norris J, Abbott J, Cooke S (2009) Recent trends and
projections of primary NO2 emissions in Europe. Atmos Environ 43(13):2154–2167
Harmens H, Mills G (eds) (2012) Ozone pollution: impacts on carbon sequestration in
Europe. ICPVegetation Programme Coordination Centre, Centre for Ecology and Hydrology,
Bangor
Heroux ME, Anderson HR, Atkinson R, Brunekreef B, Cohen A, Forastiere F, Hurley F,
Katsouyanni K, Krewski D, Krzyzanowski M, Künzli N, Mills I, Querol X, Ostro B, Walton
H (2015) Quantifying the health impacts of ambient air pollutants: recommendations of a
WHO/Europe project. Int J Public Health 60:619–627
Holland MR, Jones HH, Berdowski J, Bleeker A, Visschedijk AJH (2001) Economic evaluation of
air quality targets for PAHs. AEAT/ENV/R0593, AEA Technology Environment, Culham
Science Centre, Abingdon. http://ec.europa.eu/environment/enveco/air/pdf/pah_report.pdf
Karlsson PE (2005) Economic assessment of the negative impacts of ozone on the crop yield
and forest production. A case study of the estate Ostads Sateri in Southwestern Sweden. Ambio
34(1):32–40
Kleib€ohmer W (2001) Polycyclic aromatic hydrocarbon (PAH) metabolites, environmental anal-
ysis (volume 3 of Handbook of Analytical Separations). Elsevier
Kumar P, Pirjola L, Ketzel M, Harrison RM (2013) Nanoparticle emissions from 11 non-vehicle
exhaust sources – a review. Atmos Environ 67:252–277
Lave LB, Seskin EP (1973) An analysis of the association between U.S. mortality and air
pollution. J Am Stat Assoc 68(342):286. doi:10.1080/01621459.1973.10482421
Le Marchand L, Hankin JH, Pierce LM et al (2002) Well-done red meat, metabolic phenotypes and
colorectal cancer in Hawaii. Mutat Res 506–507:205–214. doi:10.1016/s0027-5107(02)00167-7
Lim SS, Vos T, Flaxman AD, Danaei G, Shibuya K, Adair-Rohani H et al (2012) A comparative
risk assessment of burden of disease and injury attributable to 67 risk factors and risk factor
clusters in 21 regions, 1990–2010: a systematic analysis for the Global Burden of Disease
Study 2010. Lancet 380(9859):2224–2260
Mills G, Harmens H (eds) (2011) Ozone pollution: a hidden threat to food security. ICP Vegetation
Programme Coordination Centre, Centre for Ecology and Hydrology, Bangor
Pieralice E, Triolo IL, Earth O (2011) Prove tecniche di emissioni. Gli effetti sanitari del PM
10 sulla salute e le scelte modali nelle citt�a italiane. Roma, Isfort, Competenze e risorse per la
mobilit�aPinna M (1989) Inquinamento atmosferico in Italia. Note climatico-ecologiche. In: Palagiano
C. (ed) 1989Geografia della salute in Italia. F. Angeli, Milano
Pope CA 3rd, Dockery DW (2006) Health effects of fine particulate air pollution: lines that
connect. J Air Waste Manage Assoc 56:709–742
Pufelete M, Battershill J, Boobis A, Fielder R (2004) Approaches to carcinogenic risk assessment
for polycyclic aromatic hydrocarbons: a UK perspective. Regul Toxicol Pharmacol 40
(1):54–66
Querol X, Alastuey A, Pandolfi M, Reche C, Perez N, Minguillon MC, Moreno T, Viana M,
Escudero M, Orio A, Pallares M, Reina F (2014) 2001–2012 trends on air quality in Spain. Sci
Total Environ 490:957–969
6 The Impact of Climate Change and Air Pollution in the Southern European. . . 83
Rexeis M, Hausberger S (2009) Trend of vehicle emission levels until 2020 – prognosis based
on current vehicle measurements and future emission legislation. Atmos Environ 43
(31):4689–4698
Seinfeld J, Spyros P (1998) Atmospheric chemistry and physics: from air pollution to climate
change, 2nd edn. Wiley, Hoboken, p 97
Sinha R, Kulldorff MJ, Gunter M, Strickland P, Rothman N (n.d.) Dietary benzo[a]pyrene intake
and risk of colorectal adenoma. DOI: 10.1158/1055–9965.EPI-04-0854 Published August
2005
Slootweg J, Maximilian P, Hettelingh J (eds) (2010) Progress in the modelling of critical
thresholds and dynamic modelling, including impacts on vegetation in Europe, CCE status
report 2010. Coordination Centre for Effects, Bilthoven
Truswell, AS (2002) Meat consumption and cancer of the large bowel. Eur J Clin Nutr 56 (Suppl 1).
doi:10.1038/sj.ejcn.1601349. PMID 11965518
Institutional Publications
EC (2005) Communication from the Commission to the Council and the European Parliament,
thematic strategy on air pollution. European Commission, Brussels. COM(2005) 0446 final
21.9.2005. http://eurlex.europa.eu/LexUriServ/LexUriServ.do?uri¼CELEX:52005DC0446:
EN:NOT
EC (2013a) Commission staff working document accompanying the communication on a revised
EU strategy on air pollution proposal for a revision of directive 2001/81/EC on national
emission ceilings for certain atmospheric pollutants. Proposal for a legislative instrument on
control of emissions from medium combustion plants – impact assessment, SWD (2013)
531, European Commission, Brussels. http://ec.europa.eu/environment/archives/air/pdf/
Impact_assessment_en.pdf
EC (2013b) The clean air package. European Commission, Brussels. http://ec.europa.eu/environ-
ment/air/clean_air_policy.htm
EEA (2010) The European environment state and outlook 2010. European Environment Agency
EEA (2012b) NATURA 2000, version 2012 rev. 10. https://sdi.eea.europa.eu/internal-catalogue/srv/eng/search?uuid¼c773f1a8–16ed-4f7a-91aa-f7475105f805
EEA (2012a) Particulate matter from natural sources and related reporting under the EU air quality
directive in 2008 and 2009, EEA technical report No 10/2012. European Environment Agency
EEA (2013a) Environment and human health, joint EEA-JRC report, EEA report no 5/2013.
European Environment Agency
EEA (2013b) Air quality in Europe – 2015 report
EEA (n.d.) Report no 9/2013. European Environment Agency
EEA (2013c) The impact of international shipping on European air quality and climate forcing,
EEA technical report no 4/2013. European Environment Agency
EEA (2014a) Past and future exposure of European freshwater and terrestrial habitats to acidifying
and eutrophying air pollutants, EEA technical report no 11/2014. European Environment
Agency
EEA (2014b) Air quality in Europe – 2014 report, EEA report no 5/2014. European Environment
Agency
EEA (2014c) Focusing on environmental pressures from long-distance transport. TERM 2014:
transport indicators tracking progress towards environmental targets in Europe, EEA report no
7/2014. European Environment Agency
84 C. Palagiano and R. Belluso
EEA (2015a) Air quality e-reporting database. http:/ www.eea.europa.eu/data-and-maps/data/
aqereporting
EEA (2015b) Exposure of ecosystems to acidification, eutrophication and ozone (Indicator CSI
005). European Environment Agency
EEA (2015c) European Union emission inventory report 1990–2013 under the UNECE conven-
tion on Long-range Transboundary Air Pollution (LRTAP), EEA technical report no 8/2015.
European Environment Agency
EEA (2015d) Exceedance of air quality limit values in urban areas (Indicator CSI 004). European
Environment Agency
EEA (2015e) National emissions reported to the convention on Long-range Transboundary Air
Pollution (LRTAP Convention). http://www.eea.europa.eu/dataand-maps/data/data-viewers/
air-emissions-viewerlrtap
ETC/ACC (2009) Traffic and air quality contribution of traffic to urban air quality in European
cities, Hak, C., Larssen, S., Randall, S., Guerreiro, C., Denby, B. and Horalek, J., ETC/ACC
Technical Paper 2009/12
ETC/ACC (2010) Status and trends of NO2 ambient concentrations in Europe, Guerreiro, C.,
Horalek, J., de Leeuw, F., Hak, C., Nagl, C., Kurfürst, P. and Ostatnicka, J, ETC/ACC
Technical Paper 19/2010.ETC/ACM, 2011, Evaluation of current limit and targetvalues as
set in the EU Air Quality Directive, de Leeuw, F.and Ruyssenaars, P., ETC/ACM Technical
Paper 2011/3
ETC/ACM (2015a) European air quality maps of PM and ozone for 2012 and their uncertainty,
Horalek, J., de Smet, P., Kurfürst, P., de Leeuw, F. and Benesova, N., ETC/ACMTechnical
Paper 2014/4
ETC/ACM (2015b) Mapping ambient concentrations of benzo(a)pyrene in Europe – population
exposure and health effects for 2012, Guerreiro, C., Horalek, J., de Leeuw, F. and Couvidat, F.,
ETC/ACM Technical Paper 2014/6
EU (1992) Council Directive 92/43/EEC of 21 May 1992 on the conservation of natural habitats
and of wild fauna and flora (OJ L 206, 22.7.1992, p. 7–50). http://eur-lex.europa.eu/legal-
content/EN/ TXT/?uri¼CELEX:31992L0043
EU (2001) Directive 2001/81/EC of the European Parliament and of the council of 23 October 2001
on national emission ceilings for certain atmospheric pollutants (OJ L 309, 27.11.2001,
p. 22–30). http://eurlex. europa.eu/LexUriServ/LexUriServ.do?uri¼OJ:L:2001: 309:0022:0030:
EN:PDF
EU (2002) Decision No 1600/2002/EC of the European parliament and of the council of 22 July
2002 laying down the Sixth Community Environment Action Programme (OJ L 242, 10.9.2002,
p. 1–15). http://eur-lex.europa.eu/LexUriServ/LexUriServ. do?uri¼CELEX:32002D1600:EN:
NOT
EU (2004) Directive 2004/107/EC of the European Parliament and of the council of 15 December
2004 relating to arsenic, cadmium, mercury, nickel and polycyclic aromatic hydrocarbons in
ambient air (OJ L 23, 26.1.2005, p. 3–16). http://eur-lex.europa.eu/LexUriServ/LexUriServ.
do?uri¼OJ:L:2005:023:0003:0016:EN:PDF
EU (2008) Directive 2008/50/EC of the European Parliament and of the council of 21 May 2008
on ambient air quality and cleaner air for Europe (OJ L 152, 11.6.2008, p. 1–44). http://eur-lex.
europa.eu/ LexUriServ/LexUriServ.do?uri¼OJ:L:2008:152:0001:0044:EN:PDF
EU (2009) Directive 2009/30/EC of the European Parliament and of the council of 23 April 2009
amending Directive 98/70/EC as regards the specification of petrol, diesel and gas-oil and
introducing a mechanism to monitor and reduce greenhouse gas emissions and amending
Council Directive 1999/32/EC as regards the specification of fuel used by inland waterway
vessels and repealing Directive 93/12/EEC (OJ L 140, 5.6.2009, p. 88–113). http://eur-lex.
europa.eu/LexUriServ/LexUriServ.do?uri¼OJ:L:2009:140:0088:0113: EN:PDF
6 The Impact of Climate Change and Air Pollution in the Southern European. . . 85
EU (2013) Decision No 1386/2013/EU of the European Parliament and of the Council of
20 November 2013 on a General Union Environment Action Programme to 2020 ‘Livingwell, within the limits of our planet, OJ L 354, 20.12.2013, p. 171–200. http://eur-lex.europa.
eu/legal-content/EN/TXT/PDF/?uri¼CELEX:32013D1386& from¼EN
IARC (2012) Chemical agents and related occupations – volume 100 F – a review of human
carcinogens. International Agency for Research on Cancer (IARC) Monographs on the Eval-
uation of Carcinogenic Risks to Humans, Vol. 100F. http://monographs.iarc.fr/
ENG/Monographs/vol100F/mono100F.pdf
IARC (2013) Outdoor air pollution a leading environmental cause of cancer deaths. Press Release
No 221. http:// www.iarc.fr/en/media-centre/iarcnews/pdf/pr221_E. pdf
OECD/IEA (2013) Nordic energy technology perspectives: pathways to a carbon neutral energy
future. Organisation for Economic Co-operation and Development/International Energy
Agency, Paris
UN (2012) World population prospects: the 2010 revision. United Nations, Department of
Economic and Social Affairs, Population Division, New York
UNECE (1979) Convention on long-range transboundary air pollution. United Nations Economic
Commission for Europe, Geneva. http://live.unece.org/fileadmin/DAM/env/lrtap/full%20text/
1979.CLRTAP.e.pdf
UNECE (2011) Manual on methodologies and criteria for modelling and mapping critical loads &
levels and air pollution effects, risks and trends – chapter 3: mapping critical levels for
vegetation. United Nations Economic Commission for Europe, Geneva. http://icpvegetation.
ceh.ac.uk/manuals/mapping_manual.html
WHO (2000) Air quality guidelines for Europe. World Health Organization, Regional Office for
Europe, Copenhagen. http://www.euro.who.int/__data/assets/ pdf_file/0005/74732/E71922.
WHO (2005) Effects of air pollution on children’s health and development – a review of the
evidence. World Health Organization, Regional Office for Europe, Copenhagen
WHO (2006a) Air quality guidelines. Global update 2005. Particulate matter, ozone, nitrogen
dioxide and sulphur dioxide. World Health Organization, Regional Office for Europe,
Copenhagen
WHO (2006b) Health risks of particulate matter from long-range transboundary air pollution.
World Health Organization, Regional Office for Europe, Copenhagen
WHO (2008) Health risks of ozone from long-range transboundary air pollution. World Health
Organization, Regional Office for Europe, Copenhagen
WHO (2010) WHO guidelines for indoor air quality: selected pollutants. World Health Organi-
zation, Regional Office for Europe, Copenhagen
WHO (2013a) Review of evidence on health aspects of air pollution – REVIHAAP project,
technical report. World Health Organization, Regional Office for Europe, Copenhagen
WHO (2013b) European health for all database [online database]. WHO Regional Office for
Europe, Copenhagen. http://data.euro.who.int/hfadb/
WHO (2013c) Health risks of air pollution in Europe – HRAPIE project. New emerging risks to
health from air pollution – results from the survey of experts. World Health Organization,
Regional Office for Europe, Copenhagen
WHO (2014a) Burden of disease from ambient air pollution for 2012 – summary of results. World
Health Organization, Geneva. http://www.who.int/phe/health_topics/ outdoor air/databases/
AAP_BoD_results_March2014.pdf
WHO (2014b) Ambient (outdoor) air quality and health, fact sheet no 313, updated March 2014.
World Health Organization. http://www.who.int/mediacentre/ factsheets/fs313/en/
WHO (2004) Health risks of particulate matter from long-range transboundary air pollution.
World Health Organization, Regional Office for Europe, Copenhagen
86 C. Palagiano and R. Belluso
Cosimo Palagiano is emeritus professor in geography at the
Department of Documentary, Linguistic-Philological and Geo-
graphical Sciences, Sapienza University of Rome.
Rossella Belluso holds a master’s degree in geography and a PhD in economic geography at
Sapienza University of Rome, Department of European, American and Intercultural Studies. Her
research interests are mainly addressed to the study of wine-and-food folk traditions and cultures,
to international migrations to Italy (she is member of the relevant PRIN 2008 project) and to
climate change. She is member of the multidisciplinary project sponsored by the Italian Ministry
for Cultural Heritage in cooperation with the Societ�a Geografica Italiana. She is member, since
2008 to present, of the international project Education for Rural People, sponsored by the FAO of
the UN, as well as of the FAO World Food Day project. She has published about 70 articles,
20 reviews and more than 20 notes on major Italian and international geographical magazines.
6 The Impact of Climate Change and Air Pollution in the Southern European. . . 87
Chapter 7
Canada: Climate Change, Air Pollutionand Health
Stefania Bertazzon and Fox Underwood
Abstract Canada is a very large country with a very sparse population. As one of
the highest-latitude countries in the northern hemisphere, it is exposed to extreme
effects of climate change. Many of these effects have an impact on air quality.
Canada is also one of the world’s largest economies, with its wealth tightly linked to
natural resource extraction. This resource dependency has led to a remarkable
awareness of the potentially negative consequences of a resource-based economy
on the environment, climate change, and air quality and, hence, to a tension
between economic development and environmental protection. Canada has the
ability to invest significantly in the monitoring and modelling of air quality. In
translating this knowledge to the medical community and the general public, health
risks related to air pollution could be mitigated and better health could be promoted.
However, monitoring efforts should focus far more on the spatial dimension, in
addition to the temporal one, owing to the great expanse of Canada’s geography.
Keywords Geography • North • Spatial variability • Climate change • Air
modelling • Health
An Overview of Canada and Its Geography
Canada is the second largest country in the world, with a land surface of almost
9 million square kilometres and a population of 36 million (Statistics Canada
2017a). For comparison, Canada is almost as large as Europe, albeit with a
population approximately one-twentieth the size. Most of Canada lies north of the
49� parallel, and most people live in the ten provinces, which lie approximately
between the 49� and the 60� parallel. Approximately 80% of the Canadian popu-
lation has been classified as living in urban areas (Statistics Canada 2011). The
remaining 20% of the population live in rural and remote areas. As medical services
are clustered in a few large urban areas, health care is generally accessible to only
urban and near-urban populations and is fairly inaccessible to rural and remote
S. Bertazzon (*) • F. Underwood
Department of Geography, University of Calgary, Calgary, AB, Canada
e-mail: [email protected]
© Springer International Publishing AG 2018
R. Akhtar, C. Palagiano (eds.), Climate Change and Air Pollution,Springer Climate, DOI 10.1007/978-3-319-61346-8_7
89
populations. Northern residents (i.e. those living above the 60� parallel), in partic-
ular, may only be able to drive on certain ice roads, provided the weather is cold: in
warmer temperatures, ice roads may be unusable or unsafe (Natural Resources
Canada 2014). Consequently, to travel long distances for care, air travel may be the
only option and only if residents can afford it.
While primary industry is necessarily co-located with natural resources,
manufacturing and related industries are typically located on the eastern sides of
urban areas in North America (Bailie and Beckstead 2010). Combined with
prevailing west and north winds throughout the country, the pattern of polluting
facilities being located on the eastern sides of urban areas tends to have positive
effects on urban air, as most residential areas lie upwind from noxious emissions.
Unsurprisingly, rural residents and residents of minor urban centres do not neces-
sarily benefit from this locational advantage. Further, indigenous communities are
often located in rural areas and reserves and, likewise, may experience greater
exposure to industrial pollution related to primary sector activities.
Typical Canadian cities feature sprawling suburbs characterized by single-
family dwellings and low population density and a tendency to expand into
surrounding towns and villages. These pervasive urban dynamics are known as
urban sprawling, a dynamic and growing phenomenon in many North American
metropolitan and urban centres. Urban sprawling is associated with a variety of
environmental issues, ranging from the consumption of rural and natural areas, to
biodiversity reduction, to the need for extensive utility lines such as electricity and
gas. Most notably, this spatial pattern leads to increasingly low population density
and relative scarcity of services in newer communities, where residents are subject
to long daily commutes that predominantly take place in private vehicles carrying
only a single occupant. As a result, commuting and residential traffic tends to be
heavy and aggravated by heavy commercial traffic, which is also present in urban
areas. Further, because of the country’s northern location, traffic can be slow and
difficult during the long winter season, when heavy snow and wind often result in
treacherous road conditions and frequent minor accidents and, therefore, increased
traffic-related air pollution. Traffic is among the main sources of air pollution in
Canadian cities.
Canada’s economy is largely based on the resource sector, where, over the last
few decades, the oil and gas sectors have gained prominence with intense exploi-
tation of oil deposits and oil sands, particularly in the northern portion of the
province of Alberta. Exploration and extractive activities tend to be associated
with high levels of air and water pollution, especially as surface deposits are
depleted and extraction inevitably occurs at greater depths. Pollution associated
with resource activities, particularly oil extraction, tends to more directly affect
rural and remote populations, as well as minor urban centres and indigenous
communities.
90 S. Bertazzon and F. Underwood
Geography and the Spatial Turn in the Health Sciences
With its vast territory and large variability in resources, climate, and population
distribution, Canada is truly a place where space matters. Indeed, due to its need to
manage expansive land parcels, Canada is the country where the first geographic
information system, Canada geographic information system (CGIS), was realized
by Roger Tomlinson in the 1960s (Tomlinson 1968). Yet, even in a country of this
size, researchers do not always think spatially. Goodchild and Janelle (2004) have
argued that a spatial turn, begun perhaps a decade ago in the social sciences, is now
invoking a similar turn in the health sciences as well (Richardson et al. 2013). Yet,
“People die each year because no one bothers to properly analyse disease and death
data for unusual localised concentrations” (Openshaw 1997). Indeed, “spatial is
special” (Anselin 1989): environmental exposures, residential location, economic
activities, and transportation routes occur in space, at different scales, and with
peculiar regional and local characteristics. They interact with each other, as well as
with climate change, mass migration, and population genetics.
Canadian health research is generally aware of the spatial dimension of health
and health care when it comes to health service research, distance, and geographic
accessibility. Back in 2002, a report commissioned by the Canadian government
noted that “Canadians want and expect to have access to health care services when
and where they need them” and that “concerns also exist about timely access toexisting services, particularly in rural and remote areas” (Romanow 2002). Spatial
epidemiology is another field where the use of spatial reasoning and methods has
become a routine. Paradoxically, when it comes to air pollution and climate, many
researchers seem to forget all about space, spatial thinking, and spatial methods. Air
pollution is measured with painstaking frequency and regularity over time—but
only at sparse and irregular locations in space. Disregarding space when measuring
air quality is just the tip of the iceberg: we tend to be unaware of the variability of
air pollution over space even though we are aware of the variability of weather
conditions within our cities.
Climate Change and Effects of Air Pollution and Health
Due to its high latitude and large land area, Canada is exposed to severe impacts of
climate change. For example, changes in winter cyclonic patterns in recent years
have been associated with dichotomous patterns, with mild winters in Western
Canada in contrast to harsh seasons and abundant precipitation in Eastern Canada.
These patterns in turn affect air circulation at the continental as well as urban scale,
impacting air and pollution transport.
Moreover, it is becoming accepted that climate change is associated with greater
variability and greater exposure to severe atmospheric events. These events do not
necessarily have direct impacts on air quality, but their indirect impacts in terms of
7 Canada: Climate Change, Air Pollution and Health 91
cost and human health are very significant. Owing to its northern location, Canada
has been experiencing increasing severe atmospheric events in the spring, with
more sudden and faster snowmelt, and in the fall, with early-season blizzards. In
both Atlantic and Pacific coastal regions, these events have been accompanied by
remnants of tropical storms. The most recent examples are the floods of autumn
2016 in southern British Columbia on the Pacific coast, which occurred almost
simultaneously with devastating floods in Atlantic Canada, particularly in Nova
Scotia and Newfoundland and Labrador, and is associated with the end tail of
Hurricane Matthew after the hurricane’s devastating effects on Haiti and parts of
the United States.
The city of Calgary, in southern Alberta, had not experienced severe flooding
until the summer of 2005, when century-long record-breaking river levels occurred
due to unusually high rainfall. While relatively minor damage was experienced by
large numbers of homes in many parts of the city (e.g. flooding of basements and
lower floors), severe damage was experienced in some of the oldest residential
communities, which are located near major riverbeds. Calgarians may have hoped
that the 2005 floods were an isolated event, but the city experienced much worse
flooding in the summer of 2013. The meteorological event originated in the uphill
Rocky Mountain regions, where the winter had been characterized by heavy
snowfall, which remained on the ground into the summer. With warming temper-
atures in the month of June, heavy rainfall in the mountains triggered the movement
of large masses of snow that began to slide into the rivers, resulting in devastating
floods in downstream communities, namely, Canmore, High River, and Calgary.
This flood was named Canada’s most costly natural disaster, costing between 5 and
6 billion dollars in damages (Milrad et al. 2015).
Factors that contributed to the flood included higher than normal snowfalls in the
mountains, excess amount of precipitation during the early spring in the Bow and
Elbow River watershed, and a wet spring that left soils saturated with no room to
absorb additional precipitation (Eccles et al. 2017). At its peak discharge rate, the
Bow River was flowing at an estimated 1700 m3/s (Milrad et al. 2015). Several
inner-city communities in Calgary were evacuated, resulting in displacement of
over 100,000 people throughout the region. Recent studies (Eccles et al. 2017)
suggest that the floods of 2005 and 2013 were also associated with contamination of
rural drinking water, which is supplied from private water wells. Among the
consequences of the floods was a drastic loss in market value of some of the oldest
and more attractive residential communities. Calgary was founded a century ago at
the intersection of the Bow and Elbow rivers. At the time, with the limited local
knowledge of a recently settled land, the location was considered safe.
Early-season blizzards bring abundant snow precipitation over short periods,
accompanied by strong winds as early as October and, recently, even in September.
Some of the impacts of these events are not substantially different from normal
winter events, such as reduced visibility and treacherous driving and walking
conditions. However, early-season blizzards are worsened by the unpreparedness
of the general population; for example, snow tires have not yet been mounted on
vehicles, while pedestrians walk wearing lighter, less sturdy shoes. This leads to
92 S. Bertazzon and F. Underwood
increased probability of traffic accidents and falls and injuries. More severe and
emblematic consequences occur when these events occur before the early season,
such as the event that hit Calgary on September 10, 2014 when the trees still had full
foliage. According to the City of Calgary (2014), about half of all trees were
damaged, with more severe damage to the larger and more mature trees of older
communities.
Aside from the impact of tree loss on urban air quality, one of the major
consequences of this September storm was the damage to aerial electricity lines
caused by falling branches, which left some 30,000 families, particularly in older
communities, without electricity. Canadians rely heavily on electricity: while
residential heating is typically fuelled by natural gas, some components of furnaces
and thermostats require electricity. Cooking depends on electricity too, as the vast
majority of cooking stoves are electric. The lack of electricity therefore sparked an
emergency in the cold conditions, with residents lighting wood-burning stoves and
fireplaces. Wood fires are considered a major source of particulate matter air
pollution in the region.
Forest fires are natural events in the mountain regions and the boreal forest of
Canada. However, forest fires frequently result from so-called prescribed burns:
burns that are mandated under forest management programmes to control pests.
Climate change may be associated with increased frequency of forest fires, both of
natural and man-made origin, with man-made fires being associated with greater
occurrence of pests (e.g. the pine beetle). Forest fires release large quantities of
smoke into the air, leading to severe loss of visibility and lower air quality. For
example, in the summer of 2015, smoke drifting from fires in Washington State
caused more than ten times the annual average of fine particulate matter (PM2.5) in
the air throughout southern Alberta, blotting the sky with grey clouds and leading
health authorities to issue alerts and air quality advisories. The following year, a
devastating forest fire burned for over a month in the summer of 2016 in Fort
McMurray (northern Alberta), spreading over 590,000 hectares of forest and
destroying approximately 2400 homes. This forest fire became the costliest disaster
in Canadian history, surpassing the 2013 Calgary floods of only 3 years before. The
causes of the fire have not been determined, nor has a connection with climate
change been positively established. In contrast, El Ni~no has been considered as a
probable contributing factor to a mild and dry fall and winter and to an even more
unusually warm spring season.
The Canadian northern climate is characterized by long winters, with relatively
short spring and summer seasons, which are the prime blooming seasons. Yet the
changing climate in recent years, along with increasing climate variability, has seen
shorter springs and more rapid transitions to summer. For instance, the ragweed
season has increased by 1 month in parts of Canada (Ziska et al. 2011). Changes in
the seasons may also bring about new changes, with unpredictable impacts on
allergy and asthma sufferers.
7 Canada: Climate Change, Air Pollution and Health 93
Air Quality Monitoring
As a wealthy country, Canada can rely on financial resources and an established
infrastructure that enables timely and accurate air quality monitoring. This infra-
structure is important for monitoring present air quality conditions and may become
increasingly important as the climate continues to change, leading to less predict-
able patterns and levels of air pollution. There are several agencies managing air
quality monitoring at various levels (e.g. federal, provincial, and local). As an
example, the Calgary Region Airshed Zone (2017) manages a network of passive
and continuous air quality monitoring stations, providing monthly and hourly data
on a suite of common air pollutants such as particulate matter (PM2.5), ozone (O3),
and volatile organic compounds (VOCs). Environment Canada issues hourly Air
Quality Health Index (AQHI) updates. The index, a composite of pollutants that are
known to be noxious for human health, can be accessed easily and readily alongside
the weather forecast (Environment Canada 2010).
The AQHI is issued hourly for each of the three continuous monitoring stations
in Calgary. While the AQHI is clearly a useful indicator, it may not be truly
representative of local air quality and associated health risk, due to the complexity
of Canada’s geography and the great geographic spread of its population. Consider,again, the city of Calgary alone. In 2016, the city of Calgary had a population of
1,239,220 over a land area of 825 km2 (Statistics Canada 2017b)—a far greater area
than three monitoring stations can hope to represent in their sensor readings.
Calgary has expanded over a relatively flat prairie where space was once abundant.
Over the years, its expansion model has been increasingly characterized as urban
sprawl, dominated by single-family dwellings. This urban dynamic pattern has
resulted in a very low population density: 1329 persons per square kilometre.
This residential pattern in turn results in long commuting journeys: in 2006, more
than 75% of commuters in the metropolitan area commuted by personal vehicle,
over 60% of them carrying only a single occupant (Bailie and Beckstead 2010). In
2011, the average commute time was 25 min, which is above the national average
(Statistics Canada 2016). In 2006, Calgary had the second largest average commute
distance in Canada (after Toronto) and the greatest 5-year increment among the
largest Canadian cities (Bailie and Beckstead 2010). Of the total greenhouse
emissions in 2006, 70% was attributed to buildings, 27% to transportation, and
3% to waste (Bailie and Beckstead 2010). The land use pattern is also relatively
segregated, with distinct residential, commercial, and industrial zones. In this
complex urban landscape, air pollution is affected by localized emission patterns.
Conversely, population health risk is affected by the emission pattern, as well as by
the residential pattern.
The AQHI is issued frequently, but at a very coarse spatial resolution. The AQHI
is calculated based on the values of three air pollutants: particulate matter (PM2.5),
ozone (O3), and nitrogen dioxide (NO2). Of these three pollutants, PM and O3 are
considered regional pollutants; that is, their variation over space is relatively
moderate and their value is fairly constant regionally. Conversely, NO2 tends to
94 S. Bertazzon and F. Underwood
display large variations over space as a function of industrial emissions, residential
emissions (heating in the winter), and traffic-related emissions (motorized vehi-
cles). Further, air pollution levels are affected by meteorological factors, which
include primarily wind, along with temperature, humidity, and air pressure. Nota-
bly, regional air pollutants, such as PM and O3, exhibit lesser spatial variation, but
they still exhibit a spatial pattern, especially in complex urban environments with
localized emissions, and their dynamics may be aggravated by wind and other
meteorological variables.
Empirical research is based on recorded land use variables, such as traffic
volumes, residential heating, population density, and wind speed and direction.
Therefore, analytical models are flexible and can serve as tools to estimate and
predict changes in air pollution in the presence of climate change (Bertazzon et al.
2015). Such models can help to address what-if questions to simulate climate
change scenarios and estimate the resulting variations in air pollution. Perhaps
the most important component of empirical work is the knowledge translation
(i.e. communicating results to local, community stakeholders and to health practi-
tioners) in an effective framework in order to mitigate the impact of air pollution on
human health. Owing to its relative development and wealth, and relatively low
pollution, Canada is in a strong position to lead the way in promoting extensive
spatial monitoring and modelling of air pollution.
Walking and Breathing
Canada is a relatively young country, with few major cities dating back a few
centuries, while many, such as Calgary, have been around for just over a century.
Compared with the oldest cities of Europe, Asia, and North Africa, Canada’s citieshave had a much shorter history and experienced their major development during
the automobile era. This urban pattern, related to the urban sprawl discussed earlier,
has led to largely car-dependent urban environments, where it is often difficult to
carry out daily activities without the aid of a private vehicle.
Obesity has been linked to a lack of balance between calorie intake (nutrition)
and calorie consumption (exercise). In recent years, health researchers and pro-
fessionals, along with city managers, politicians, and urban planners, have come to
promote more walking, cycling, and public transit use in daily activities, as opposed
to solely driving in private vehicles. However, in this effort to promote walking, it
has been observed that walking may be problematic in North American cities, given
that they were designed for driving. Indeed, walking may be extremely unsafe
where there are no sidewalks, where pedestrians are forced to cross high-traffic
roads without proper pedestrian crossings, where lighting is poor (especially in the
winter), or in neighbourhoods where crime rates are high. Moreover, distance plays
an important role, as people can comfortably walk over a certain threshold, but
having to cover large distances would require so much time and effort as to impact
work or other routine activities. Finally, walking is also seen as providing a certain
7 Canada: Climate Change, Air Pollution and Health 95
experience; therefore, some neighbourhoods and roads provide a better experience
than others do. Walking along a street with shop windows, trees, benches, well-
maintained buildings and well-maintained yards provides a positive experience,
whereas walking along a path that requires frequent busy-road crossings, rundown
neighbourhoods and narrow or bumpy or uneven sidewalks provides a less positive
walking experience. All these elements have come to form the concept of
walkability, and walkability indices have been defined to rank neighbourhoods in
North American cities based on their geographical accessibility and distance from
amenities. That is, the walkscore of a neighbourhood increases with the sum of
amenities that can be reached by walking or that are located within a walking
distance of that neighbourhood.
We shall argue that when we walk outdoors, we breathe ambient air. Walking in
an urban environment exposes us to varying levels of air pollution, yet air quality is
rarely considered a dimension of walkability. Nonetheless, variations in pollution
levels within urban environments can be large. Consider the vast urban and
metropolitan area of Calgary where, in addition to the wide spatial extension,
elevation ranges by 300 metres from highest to the lowest elevation, and winds
can be strong and can vary in direction within a day, thereby quickly moving air
masses. Moreover, most pollution sources are localized, notably over the industrial
park, the airport, the railway yard, and along the railway and major roads. In winter,
more traffic occurs on local roads, as people tend to walk less and drive more, while
residential zones exhibit higher pollution levels due to residential heating. Accord-
ingly, several traffic-related pollutants exhibit a spatial pattern with pollutant
concentration declining rapidly as distance from roads increases; therefore, walking
within a few hundred metres of a major road leads to higher pollution exposure than
if we were to walk further away from the road. Truly, where we walk can make a
difference in the quality of the air we breathe.
As climate changes and tends to become warmer overall, Canadian cities will
become naturally more walkable, as the ambient air will be more pleasant and the
danger of ice and treacherous sidewalks will decrease. We can expect weather
patterns to change over a range of scales, including local circulation over urban and
metropolitan areas. We can expect greater variability that can make it harder to
choose where to walk and breathe less polluted air. A spatial analytical approach to
the study of air quality and walkability can only benefit our understanding of urban
air pollution, reducing our exposure to noxious pollutants, for the benefit of our
health.
Conclusion
This chapter has presented an overview of Canada’s geographic position related to
climate change and air pollution. In northern territories, residents are far from
health care, while pollution from Canada’s strong primary industry affects more
rural, remote, and indigenous residents than those living in urban areas. Conversely,
96 S. Bertazzon and F. Underwood
within urban areas, sprawling development has lowered walkability and given
strong incentive for people to drive, often in single-occupancy vehicles, giving
rise to greater air pollution from traffic in large cities. At the same time, Canada’slong winters have led to higher pollution from residential heating. With changes to
spring and summer, ragweed season may now be longer in parts of Canada. Finally,
more severe weather has begun to appear in the form of serious fires, floods, and
snowstorms.
Climate change exposes Canada to major changes and therefore major risks.
Many of these risks involve increased air pollution and greater harm to our health.
However, as a wealthy country concerned with the effects of air quality on human
health, Canada could potentially put the proper infrastructure and research in
place—with a strong emphasis on expanding air monitoring over space—to under-
stand these effects and mitigate their impact on human health, as its climate
changes. Written by geographers, this chapter was centred on a geographic per-
spective to air quality, because air quality varies over space, and often scientists are
entirely engrossed with temporal variability.
References
Anselin L (1989) What is special about spatial data? Alternative perspectives on spatial data
analysis. Presented at the Spatial Statistics: Past, Present, and Future Symposium, Institute of
Mathematical Geography, Syracuse University. Retrieved from https://deepblue.lib.umich.
edu/handle/2027.42/58237
Bailie A, Beckstead C (2010) Canada’s coolest cities. Retrieved 13 Mar 2017, from http://www.
pembina.org/pub/2021
Bertazzon S, Johnson M, Eccles K, Kaplan G (2015) Accounting for spatial effects in land use
regression for urban air pollution modelling. Spat Spatio-temporal Epidemiol 14-15:9–21
Calgary Region Airshed Zone (2017) What we monitor. Retrieved 13 Mar 2017, from http://craz.
ca/monitoring/what-we-monitor/
City of Calgary (2014, Oct 16) Recovering from “Snowtember” 2014. Retrieved 13 Mar 2017,
from http://www.calgary.ca/CSPS/Parks/Pages/Tree-recovery-and-restoration.aspx
Eccles KM, Checkley S, Sjogren D, Barkema HW, Bertazzon S (2017) Lessons learned from the
2013 Calgary flood: assessing risk of drinking water well contamination. Appl Geogr
80:78–85. https://doi.org/10.1016/j.apgeog.2017.02.005
Environment Canada (2010, Jan 7) Environment and climate change Canada – air – National Air
Pollution Surveillance Program (NAPS) – Home. Retrieved 13 Mar 2017, from http://www.ec.
gc.ca/rnspa-naps/
Goodchild, M. F., Janelle, D. G. (2004) Spatially integrated social science. Oxford University
Press
Milrad SM, Gyakum JR, Atallah EH (2015) A meteorological analysis of the 2013 Alberta flood:
antecedent large-scale flow pattern and synoptic–dynamic characteristics. Mon Weather Rev
143(7):2817–2841. https://doi.org/10.1175/MWR-D-14-00236.1
Natural Resources Canada (2014 June 17) Canada in a changing climate: sector perspectives on
impacts and adaptation. Retrieved 13 Mar 2017, from http://www.nrcan.gc.ca/environment/
resources/publications/impacts-adaptation/reports/assessments/2014/16309
Openshaw, S (1997) GIS in health and crime analysis. Retrieved 13 Mar 2017, from http://www.
geog.leeds.ac.uk/presentations/97-2/sld025.htm
7 Canada: Climate Change, Air Pollution and Health 97
Richardson DB, Volkow ND, Kwan M-P, Kaplan RM, Goodchild MF, Croyle RT (2013) Spatial
turn in health research. Science 339(6126):1390–1392. https://doi.org/10.1126/science.
1232257
Romanow, R (2002, Jul 1) Building on values: the future of health care in Canada: CP32-85/
2002E-IN – Government of Canada Publications. Retrieved 13 Mar 2017, from http://www.
publications.gc.ca/site/eng/237274/publication.html
Statistics Canada (2011 Feb 4) Population, urban and rural, by province and territory (Canada).
Retrieved 13 Mar 2017, from http://www.statcan.gc.ca/tables-tableaux/sum-som/l01/cst01/
demo62a-eng.htm
Statistics Canada (2016 Sep 15) Commuting to work. Retrieved 13 Mar 2017, from https://
www12.statcan.gc.ca/nhs-enm/2011/as-sa/99-012-x/99-012-x2011003_1-eng.cfm
Statistics Canada (2017a Feb 8) Focus on geography series, 2016 census – census subdivision of
Calgary, CY (Alberta). Retrieved 13 Mar 2017, from https://www12.statcan.gc.ca/census-
recensement/2016/as-sa/fogs-spg/Facts-csd-eng.cfm?LANG¼Eng&GK¼CSD&
GC¼4806016
Statistics Canada (2017b Feb 8) The daily—population size and growth in Canada: key results
from the 2016 Census. Retrieved 13 Mar 2017, from http://www.statcan.gc.ca/daily-quotidien/
170208/dq170208a-eng.htm?HPA¼1
Tomlinson, R. (1968) A geographic information system for regional planning. Department of
Forestry and Rural Development, Government of Canada. Retrieved from https://
gisandscience.files.wordpress.com/2012/08/1-a-gis-for-regional-planning_ed.pdf
Ziska, L., Knowlton, K., Rogers, C., Dalan, D., Tierney, N., Elder, M. A., . . . Frenz, D. (2011).Recent warming by latitude associated with increased length of ragweed pollen season in
central North America. Proc Natl Acad Sci, 108(10), 4248–4251. https://doi.org/10.1073/pnas.
1014107108
Stefania Bertazzon A health geographer, Stefania Bertazzon has worked extensively on spatial
modelling of air pollution. She authored over 60 peer-reviewed publications, many on quantitative
modelling, air pollution, and public health. She actively engages with health researchers, hospitals,
public health officers; she is a member of the Calgary Region Airshed Zone PM-O3 management
committee. Her research was featured in major Canadian media.
Fox Underwood is a geographic research analyst working in a supporting role in the areas of air
pollution and digestive disease epidemiology. She prepares maps and geographic variables to
study digestive diseases; in particular, the inflammatory bowel diseases of Crohn’s disease and
ulcerative colitis. She has also carried out data collection for two substantial air pollution
monitoring campaigns in Calgary.
98 S. Bertazzon and F. Underwood
Chapter 8
Climate Change, Forest Fires, and Healthin California
Ricardo Cisneros, Don Schweizer, Leland (Lee) Tarnay, Kathleen Navarro,
David Veloz, and C. Trent Procter
Abstract Wildland fire is an important component to ecological health in Califor-
nia forests. Wildland fire smoke is a risk factor to human health. Exposure to smoke
from fire cannot be eliminated, but managed fire in a fire-prone ecosystem for forest
health and resiliency allows exposure to be mitigated while promoting other
ecosystem services that benefit people. The California Sierra Nevada is a paragon
of land management policy in a fire-prone natural system. Past fire suppression has
led to extreme fuel loading where extreme fire events are much more likely,
particularly with climate change increasing the length of fire season and the
probability of extreme weather. We use the California Sierra Nevada to showcase
the clash of increased development and urbanization, past land management policy,
future scenarios including climate change, and the intertwining of ecological health
and human health. Fire suppression to avoid smoke impact has proven to be an
unreliable way to decrease smoke-related health impacts. Instead ecological bene-
ficial fires should be employed, and their management should be based on smoke
impacts at monitors, making air monitoring the foundation of fire management
actions giving greater flexibility for managing fires. Tolerance of smoke impacts
from restoration fire that is best for forest health and resiliency, as well as for human
health, is paramount and preferred over the political expediency of reducing smoke
impacts today that ignores that we are mortgaging these impacts to future
generations.
Keywords Wildland fire smoke • Climate change • Public health • Air quality •
Policy • Ecological health
R. Cisneros (*) • D. Veloz
Health Science Research Institute, University of California, Merced, CA 95340, USA
e-mail: [email protected]
D. Schweizer
Health Science Research Institute, University of California, Merced, CA 95340, USA
USDA Forest Service, Pacific Southwest Region, Vallejo, CA 94592, USA
L. (Lee) Tarnay • K. Navarro • C.T. Procter
USDA Forest Service, Pacific Southwest Region, Vallejo, CA 94592, USA
© Springer International Publishing AG 2018
R. Akhtar, C. Palagiano (eds.), Climate Change and Air Pollution,Springer Climate, DOI 10.1007/978-3-319-61346-8_8
99
Introduction
In this chapter, we discuss forest fires in California ecosystems and the subsequent
human health impacts via smoke exposure and the implications of climate change
and past suppression policy. Projections under likely climate change scenarios
demonstrate that the area burned from wildfires and the length of the wildfire
season will continue to increase in the western United States and in many other
parts of the world. Wildfires emit many air pollutants of concern for public health.
Wildland fire is an important component to ecological health in California Forests.
Large tracts of this land have been set aside for ecological protection and are
adjacent to areas of high population living in poor air quality such as the Central
Valley. Much of the attention is given to the Sierra Nevada (see Fig. 8.1) which
covers about 25% of California’ land area and supplies more than 60% of the
developed water. Approximately 63% of the Sierra Nevada are federally protected
public lands including nine national forests, three national parks, and two national
monuments containing 20 designated wilderness areas. The intersection of this fire-
prone ecosystem and large amounts of anthropogenic emissions creates a unique
setting to understand natural process function and ecological health, the implica-
tions of climate change to that system, and the consequences to human health from
forest management in an already anthropogenically polluted environment.
Intact functioning ecosystems are essential to defend against climate change
(Martin and Watson 2016, p. 123), but one-tenth of global wilderness has been lost
in the past two decades (Watson et al. 2016, pp. 2–3). Fire is a natural process
integral to California Forests and shrub lands, including the Sierra Nevada, deter-
mining vegetation distribution and structure (Kilgore 1981, pp. 58–89; Swetnam
1993, pp. 887–888; Swetnam 2009, pp. 133–140). Smoke is an inevitable conse-
quence. Native American tribes have a long history attributing fire and smoke to
successful landscape management including active and widespread use of fire to
increase desired results (Levy 2005, p. 305). As C.H. Merriam chief of the US
Division of Biologic Survey wrote in 1898 of smoke and visibility in the Sierra
Nevada (Cermak 2005, p. 17):
Few see more than the immediate foreground and a haze of smoke which even the strongest
glass is unable to penetrate.
Numerous other accounts attest to much more smoke being encountered during
European settlement of the Sierra Nevada. Wildland fire smoke in California in the
late nineteenth century was said to “choke up the atmosphere” and with any
increase “. . .our farmers will be able to cure bacon and ham without the aid of a
smokehouse” but “Nobody seemed to care; it was all public land, and what is
everybody’s business is nobody’s business” (Cermak 2005, pp. 15–17). There was a
largely indifferent attitude to wildland fire and smoke among the mountain resi-
dents during European settlement of the Sierra Nevada with a general belief that it
was an essential process (Cermak 2005, pp. 9–18).
100 R. Cisneros et al.
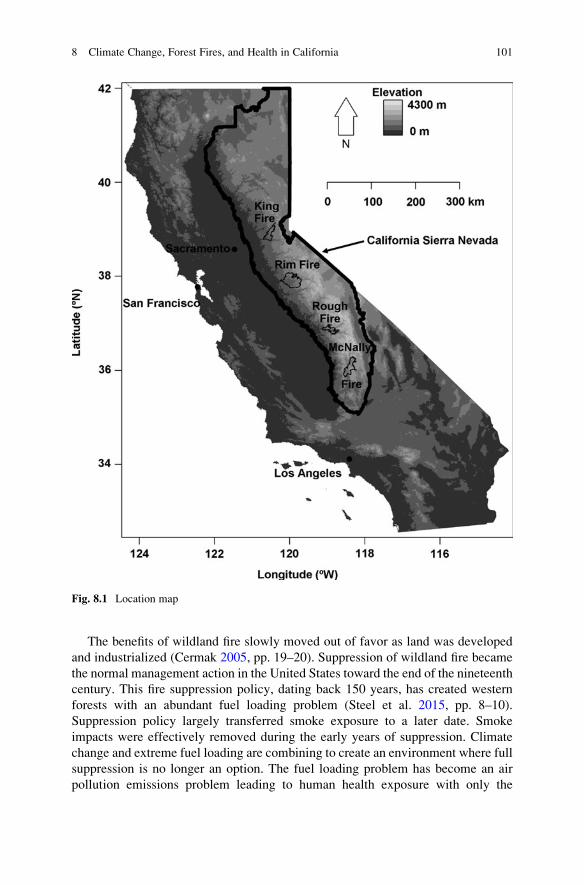
The benefits of wildland fire slowly moved out of favor as land was developed
and industrialized (Cermak 2005, pp. 19–20). Suppression of wildland fire became
the normal management action in the United States toward the end of the nineteenth
century. This fire suppression policy, dating back 150 years, has created western
forests with an abundant fuel loading problem (Steel et al. 2015, pp. 8–10).
Suppression policy largely transferred smoke exposure to a later date. Smoke
impacts were effectively removed during the early years of suppression. Climate
change and extreme fuel loading are combining to create an environment where full
suppression is no longer an option. The fuel loading problem has become an air
pollution emissions problem leading to human health exposure with only the
Fig. 8.1 Location map
8 Climate Change, Forest Fires, and Health in California 101
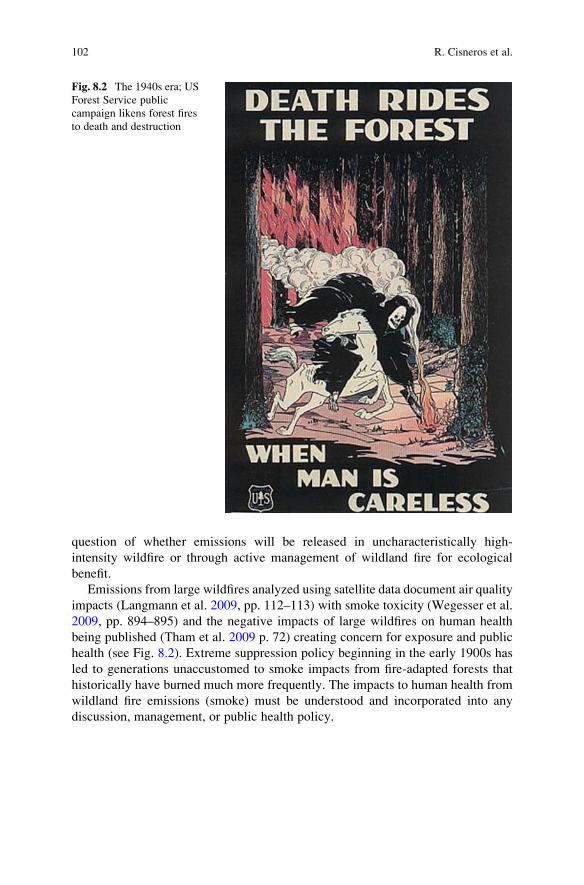
question of whether emissions will be released in uncharacteristically high-
intensity wildfire or through active management of wildland fire for ecological
benefit.
Emissions from large wildfires analyzed using satellite data document air quality
impacts (Langmann et al. 2009, pp. 112–113) with smoke toxicity (Wegesser et al.
2009, pp. 894–895) and the negative impacts of large wildfires on human health
being published (Tham et al. 2009 p. 72) creating concern for exposure and public
health (see Fig. 8.2). Extreme suppression policy beginning in the early 1900s has
led to generations unaccustomed to smoke impacts from fire-adapted forests that
historically have burned much more frequently. The impacts to human health from
wildland fire emissions (smoke) must be understood and incorporated into any
discussion, management, or public health policy.
Fig. 8.2 The 1940s era; US
Forest Service public
campaign likens forest fires
to death and destruction
102 R. Cisneros et al.
Climate Change and Forest Fires in Californiaor in the Western United States
In California, increased fuels and a changing climate are creating a post-
suppression era where large high-intensity destructive wildfires (megafires) are
becoming more common (see Table 8.1). Wildland fire in California and through-
out much of the American west is expected to increase in activity in the post-
suppression era with increased large fire frequency, longer duration fire, and a
longer fire season (Westerling et al. 2006, p. 940; Flannigan et al. 2013, p. 847). The
frequency of wildfires is projected to increase in many parts of the western United
States due to alterations of temperature and precipitation patterns related to climate
change that lead to increases in spring and summer temperatures and earlier spring
snowmelt (Westerling et al. 2006, p. 940). The increased wildfire activity in
California involves both climate and land management practices (Westerling
et al. 2006, p. 943). Land management practices are discussed below in the forest
fire policy section.
California is one of the most biologically and climatically diverse locations in
the world. The highest air pollutant emissions from forest fires in the United States,
including prescribed fire, occur in the Pacific coastal states which includes Cali-
fornia (Liu 2004, p. 3489). Lenihan et al. (2008, p. 215) studied the response of
vegetation distribution, ecosystem productivity, and fire to climate change scenar-
ios for California. In terms of fire, the findings indicated that the area burned in
California would increase (9–15%) compared to historical period (1961–1990)
under all three scenarios. Under the more productive less dry and cooler scenario,
annual biomass consumption by fire was 18% greater than historical norm. The
warmer and drier scenarios predicted that biomass consumption would be initially
greater, than below or at historical norm by 2100.
Westerling and Bryant (2008, p. 231) modeled wildfire risks for California under
four climatic change scenarios. The model exhibited divergent findings in terms of
fire regimes. One of the findings suggested that increases in temperature would
promote greater fire frequency in wetter forested areas via increased temperatures
on fuel flammability. Another predicted that reduced moisture availability due to
lower precipitation and higher temperatures would lead to reduced fire risks in some
locations where fuel flammability may be less important than the availability of fine
fuels. Property damages were also modeled. The largest damages were predicted to
occur in the wildland/urban interfaces in Southern California, the Bay Area, and the
Sierra foothills northeast of Sacramento.
Westerling et al. (2011, p. 459) examined climate change and growth scenarios
of wildfire in California. The majority of the modeled scenarios predicted signifi-
cant increases in large burned area and wildfire occurrence to occur by 2050 with
substantial increases expected by 2085. The increases were attributed to the effects
of projected temperature increase on evapotranspiration compounded by reduced
precipitation. Under the different scenarios, the area of wildfire is expected to
increase throughout the mountain forested areas of Northern California. In the
8 Climate Change, Forest Fires, and Health in California 103
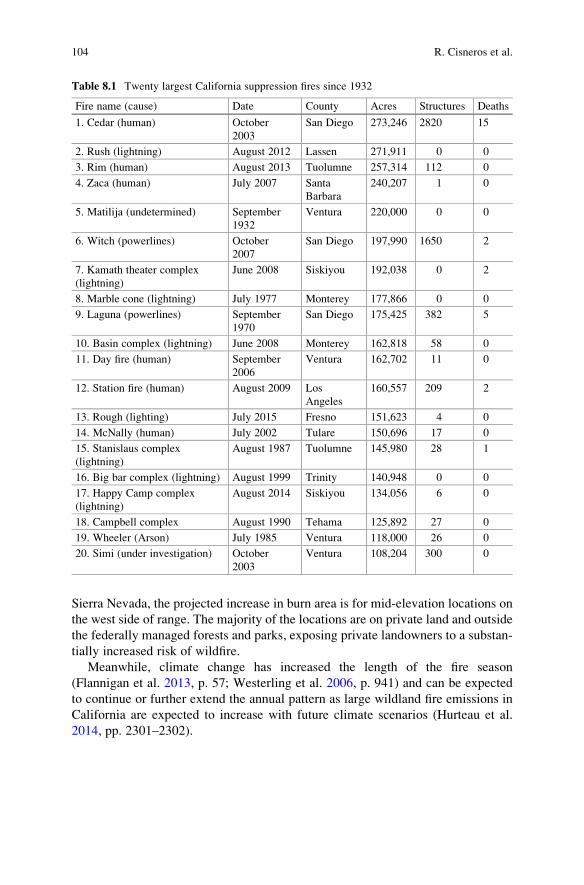
Sierra Nevada, the projected increase in burn area is for mid-elevation locations on
the west side of range. The majority of the locations are on private land and outside
the federally managed forests and parks, exposing private landowners to a substan-
tially increased risk of wildfire.
Meanwhile, climate change has increased the length of the fire season
(Flannigan et al. 2013, p. 57; Westerling et al. 2006, p. 941) and can be expected
to continue or further extend the annual pattern as large wildland fire emissions in
California are expected to increase with future climate scenarios (Hurteau et al.
2014, pp. 2301–2302).
Table 8.1 Twenty largest California suppression fires since 1932
Fire name (cause) Date County Acres Structures Deaths
1. Cedar (human) October
2003
San Diego 273,246 2820 15
2. Rush (lightning) August 2012 Lassen 271,911 0 0
3. Rim (human) August 2013 Tuolumne 257,314 112 0
4. Zaca (human) July 2007 Santa
Barbara
240,207 1 0
5. Matilija (undetermined) September
1932
Ventura 220,000 0 0
6. Witch (powerlines) October
2007
San Diego 197,990 1650 2
7. Kamath theater complex
(lightning)
June 2008 Siskiyou 192,038 0 2
8. Marble cone (lightning) July 1977 Monterey 177,866 0 0
9. Laguna (powerlines) September
1970
San Diego 175,425 382 5
10. Basin complex (lightning) June 2008 Monterey 162,818 58 0
11. Day fire (human) September
2006
Ventura 162,702 11 0
12. Station fire (human) August 2009 Los
Angeles
160,557 209 2
13. Rough (lighting) July 2015 Fresno 151,623 4 0
14. McNally (human) July 2002 Tulare 150,696 17 0
15. Stanislaus complex
(lightning)
August 1987 Tuolumne 145,980 28 1
16. Big bar complex (lightning) August 1999 Trinity 140,948 0 0
17. Happy Camp complex
(lightning)
August 2014 Siskiyou 134,056 6 0
18. Campbell complex August 1990 Tehama 125,892 27 0
19. Wheeler (Arson) July 1985 Ventura 118,000 26 0
20. Simi (under investigation) October
2003
Ventura 108,204 300 0
104 R. Cisneros et al.
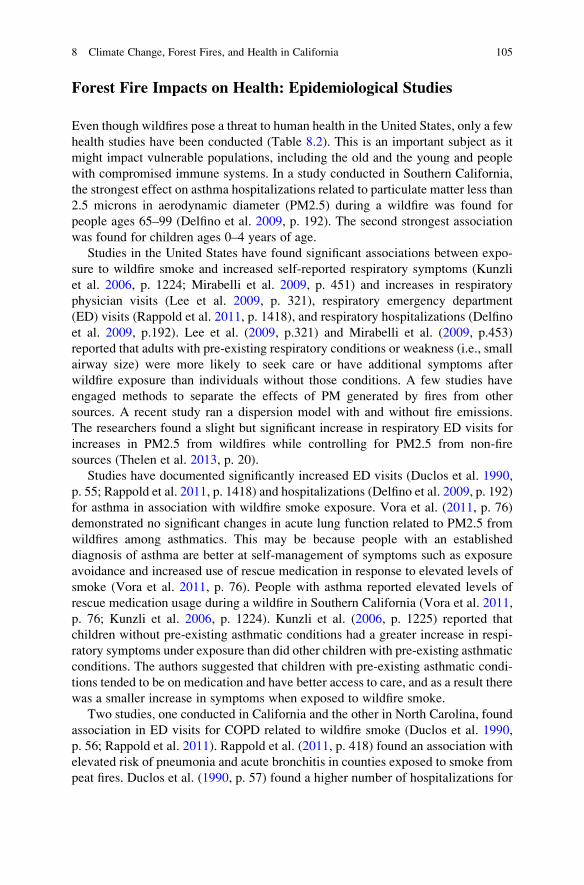
Forest Fire Impacts on Health: Epidemiological Studies
Even though wildfires pose a threat to human health in the United States, only a few
health studies have been conducted (Table 8.2). This is an important subject as it
might impact vulnerable populations, including the old and the young and people
with compromised immune systems. In a study conducted in Southern California,
the strongest effect on asthma hospitalizations related to particulate matter less than
2.5 microns in aerodynamic diameter (PM2.5) during a wildfire was found for
people ages 65–99 (Delfino et al. 2009, p. 192). The second strongest association
was found for children ages 0–4 years of age.
Studies in the United States have found significant associations between expo-
sure to wildfire smoke and increased self-reported respiratory symptoms (Kunzli
et al. 2006, p. 1224; Mirabelli et al. 2009, p. 451) and increases in respiratory
physician visits (Lee et al. 2009, p. 321), respiratory emergency department
(ED) visits (Rappold et al. 2011, p. 1418), and respiratory hospitalizations (Delfino
et al. 2009, p.192). Lee et al. (2009, p.321) and Mirabelli et al. (2009, p.453)
reported that adults with pre-existing respiratory conditions or weakness (i.e., small
airway size) were more likely to seek care or have additional symptoms after
wildfire exposure than individuals without those conditions. A few studies have
engaged methods to separate the effects of PM generated by fires from other
sources. A recent study ran a dispersion model with and without fire emissions.
The researchers found a slight but significant increase in respiratory ED visits for
increases in PM2.5 from wildfires while controlling for PM2.5 from non-fire
sources (Thelen et al. 2013, p. 20).
Studies have documented significantly increased ED visits (Duclos et al. 1990,
p. 55; Rappold et al. 2011, p. 1418) and hospitalizations (Delfino et al. 2009, p. 192)
for asthma in association with wildfire smoke exposure. Vora et al. (2011, p. 76)
demonstrated no significant changes in acute lung function related to PM2.5 from
wildfires among asthmatics. This may be because people with an established
diagnosis of asthma are better at self-management of symptoms such as exposure
avoidance and increased use of rescue medication in response to elevated levels of
smoke (Vora et al. 2011, p. 76). People with asthma reported elevated levels of
rescue medication usage during a wildfire in Southern California (Vora et al. 2011,
p. 76; Kunzli et al. 2006, p. 1224). Kunzli et al. (2006, p. 1225) reported that
children without pre-existing asthmatic conditions had a greater increase in respi-
ratory symptoms under exposure than did other children with pre-existing asthmatic
conditions. The authors suggested that children with pre-existing asthmatic condi-
tions tended to be on medication and have better access to care, and as a result there
was a smaller increase in symptoms when exposed to wildfire smoke.
Two studies, one conducted in California and the other in North Carolina, found
association in ED visits for COPD related to wildfire smoke (Duclos et al. 1990,
p. 56; Rappold et al. 2011). Rappold et al. (2011, p. 418) found an association with
elevated risk of pneumonia and acute bronchitis in counties exposed to smoke from
peat fires. Duclos et al. (1990, p. 57) found a higher number of hospitalizations for
8 Climate Change, Forest Fires, and Health in California 105
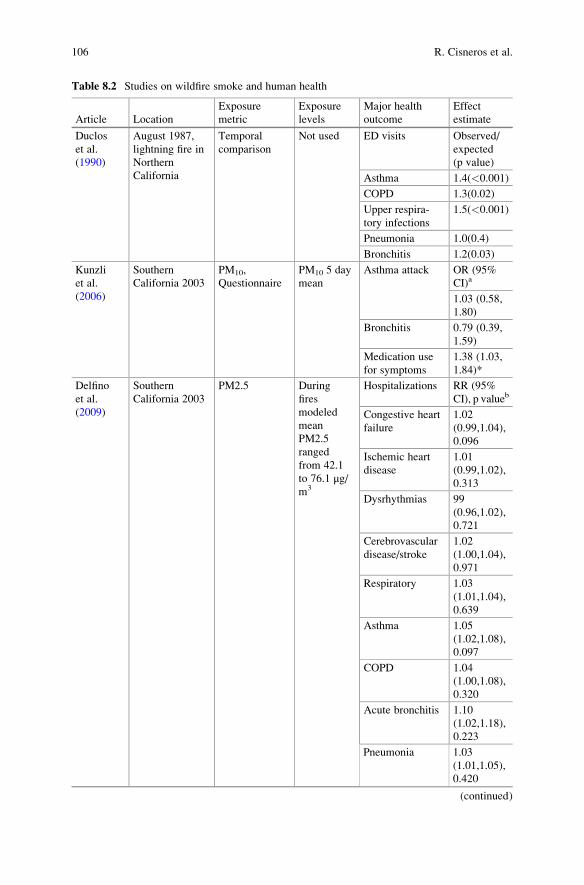
Table 8.2 Studies on wildfire smoke and human health
Article Location
Exposure
metric
Exposure
levels
Major health
outcome
Effect
estimate
Duclos
et al.
(1990)
August 1987,
lightning fire in
Northern
California
Temporal
comparison
Not used ED visits Observed/
expected
(p value)
Asthma 1.4(<0.001)
COPD 1.3(0.02)
Upper respira-
tory infections
1.5(<0.001)
Pneumonia 1.0(0.4)
Bronchitis 1.2(0.03)
Kunzli
et al.
(2006)
Southern
California 2003
PM10,
Questionnaire
PM10 5 day
mean
Asthma attack OR (95%
CI)a
1.03 (0.58,
1.80)
Bronchitis 0.79 (0.39,
1.59)
Medication use
for symptoms
1.38 (1.03,
1.84)*
Delfino
et al.
(2009)
Southern
California 2003
PM2.5 During
fires
modeled
mean
PM2.5
ranged
from 42.1
to 76.1 μg/m3
Hospitalizations RR (95%
CI), p valueb
Congestive heart
failure
1.02
(0.99,1.04),
0.096
Ischemic heart
disease
1.01
(0.99,1.02),
0.313
Dysrhythmias 99
(0.96,1.02),
0.721
Cerebrovascular
disease/stroke
1.02
(1.00,1.04),
0.971
Respiratory 1.03
(1.01,1.04),
0.639
Asthma 1.05
(1.02,1.08),
0.097
COPD 1.04
(1.00,1.08),
0.320
Acute bronchitis 1.10
(1.02,1.18),
0.223
Pneumonia 1.03
(1.01,1.05),
0.420
(continued)
106 R. Cisneros et al.
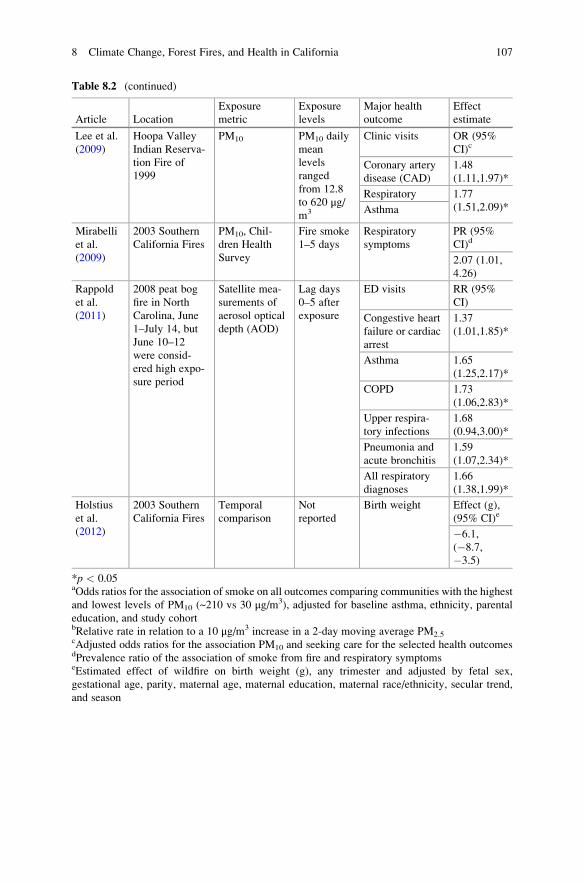
Table 8.2 (continued)
Article Location
Exposure
metric
Exposure
levels
Major health
outcome
Effect
estimate
Lee et al.
(2009)
Hoopa Valley
Indian Reserva-
tion Fire of
1999
PM10 PM10 daily
mean
levels
ranged
from 12.8
to 620 μg/m3
Clinic visits OR (95%
CI)c
Coronary artery
disease (CAD)
1.48
(1.11,1.97)*
Respiratory 1.77
(1.51,2.09)*Asthma
Mirabelli
et al.
(2009)
2003 Southern
California Fires
PM10, Chil-
dren Health
Survey
Fire smoke
1–5 days
Respiratory
symptoms
PR (95%
CI)d
2.07 (1.01,
4.26)
Rappold
et al.
(2011)
2008 peat bog
fire in North
Carolina, June
1–July 14, but
June 10–12
were consid-
ered high expo-
sure period
Satellite mea-
surements of
aerosol optical
depth (AOD)
Lag days
0–5 after
exposure
ED visits RR (95%
CI)
Congestive heart
failure or cardiac
arrest
1.37
(1.01,1.85)*
Asthma 1.65
(1.25,2.17)*
COPD 1.73
(1.06,2.83)*
Upper respira-
tory infections
1.68
(0.94,3.00)*
Pneumonia and
acute bronchitis
1.59
(1.07,2.34)*
All respiratory
diagnoses
1.66
(1.38,1.99)*
Holstius
et al.
(2012)
2003 Southern
California Fires
Temporal
comparison
Not
reported
Birth weight Effect (g),
(95% CI)e
�6.1,
(�8.7,
�3.5)
*p < 0.05aOdds ratios for the association of smoke on all outcomes comparing communities with the highest
and lowest levels of PM10 (~210 vs 30 μg/m3), adjusted for baseline asthma, ethnicity, parental
education, and study cohortbRelative rate in relation to a 10 μg/m3 increase in a 2-day moving average PM2.5cAdjusted odds ratios for the association PM10 and seeking care for the selected health outcomesdPrevalence ratio of the association of smoke from fire and respiratory symptomseEstimated effect of wildfire on birth weight (g), any trimester and adjusted by fetal sex,
gestational age, parity, maternal age, maternal education, maternal race/ethnicity, secular trend,
and season
8 Climate Change, Forest Fires, and Health in California 107
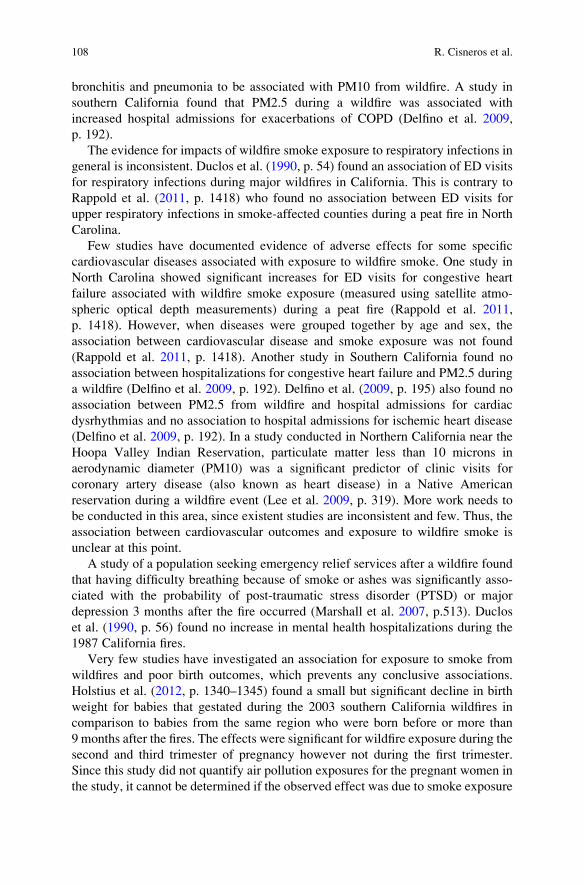
bronchitis and pneumonia to be associated with PM10 from wildfire. A study in
southern California found that PM2.5 during a wildfire was associated with
increased hospital admissions for exacerbations of COPD (Delfino et al. 2009,
p. 192).
The evidence for impacts of wildfire smoke exposure to respiratory infections in
general is inconsistent. Duclos et al. (1990, p. 54) found an association of ED visits
for respiratory infections during major wildfires in California. This is contrary to
Rappold et al. (2011, p. 1418) who found no association between ED visits for
upper respiratory infections in smoke-affected counties during a peat fire in North
Carolina.
Few studies have documented evidence of adverse effects for some specific
cardiovascular diseases associated with exposure to wildfire smoke. One study in
North Carolina showed significant increases for ED visits for congestive heart
failure associated with wildfire smoke exposure (measured using satellite atmo-
spheric optical depth measurements) during a peat fire (Rappold et al. 2011,
p. 1418). However, when diseases were grouped together by age and sex, the
association between cardiovascular disease and smoke exposure was not found
(Rappold et al. 2011, p. 1418). Another study in Southern California found no
association between hospitalizations for congestive heart failure and PM2.5 during
a wildfire (Delfino et al. 2009, p. 192). Delfino et al. (2009, p. 195) also found no
association between PM2.5 from wildfire and hospital admissions for cardiac
dysrhythmias and no association to hospital admissions for ischemic heart disease
(Delfino et al. 2009, p. 192). In a study conducted in Northern California near the
Hoopa Valley Indian Reservation, particulate matter less than 10 microns in
aerodynamic diameter (PM10) was a significant predictor of clinic visits for
coronary artery disease (also known as heart disease) in a Native American
reservation during a wildfire event (Lee et al. 2009, p. 319). More work needs to
be conducted in this area, since existent studies are inconsistent and few. Thus, the
association between cardiovascular outcomes and exposure to wildfire smoke is
unclear at this point.
A study of a population seeking emergency relief services after a wildfire found
that having difficulty breathing because of smoke or ashes was significantly asso-
ciated with the probability of post-traumatic stress disorder (PTSD) or major
depression 3 months after the fire occurred (Marshall et al. 2007, p.513). Duclos
et al. (1990, p. 56) found no increase in mental health hospitalizations during the
1987 California fires.
Very few studies have investigated an association for exposure to smoke from
wildfires and poor birth outcomes, which prevents any conclusive associations.
Holstius et al. (2012, p. 1340–1345) found a small but significant decline in birth
weight for babies that gestated during the 2003 southern California wildfires in
comparison to babies from the same region who were born before or more than
9 months after the fires. The effects were significant for wildfire exposure during the
second and third trimester of pregnancy however not during the first trimester.
Since this study did not quantify air pollution exposures for the pregnant women in
the study, it cannot be determined if the observed effect was due to smoke exposure
108 R. Cisneros et al.
to smoke from wildfires or the stress of living in an area that was experiencing a
wildfire.
More epidemiological research that examines the health effects of forest fires is
needed. Typical studies have only looked at short-term fire incidents, thus lack
statistical power. Studies conducted for longer periods of time are required to
confirm the inconsistencies and determine groups that are most affected by
smoke. Additionally, the health impacts and relative risk from prescribed, managed,
and wildfire (megafire) smoke must be understood for forest management to
effectively produce the best health outcomes.
Forest Fire Policy and Its Impacts on the Currentand Future Conditions
Fires have been widespread and frequent over a long period of history shaping the
present environment (Scott 2000, pp. 335–336). Wildland fire was largely seen as
an integral way to manage forested land throughout much of the west by Native
American tribes (Anderson 1999, pp. 106–108, 1996, pp. 415–418). Euro-
American settlers first moving west saw the importance of continuing these prac-
tices (van Wagtendonk 2007, p. 4). Losses of life in large wildfires such as the
Peshtigo Fire (1871) in Wisconsin and the Santiago Canyon Fire (1889) in Cali-
fornia began to instill the philosophy of suppression into fire management that
would be important to the foundation of American firefighting policy.
Current wildland fire management and policy is a product of the 1910 fire season
where 78 people died and over 8 million hectares burned and modern suppression
policy originated (Silcox 1910, p. 637). This fire season also known as the “Big
Burn” or “Big Blowup” was only 5 years after the US Forest Service (USFS) was
established. USFS policy to put all fires out as quickly as possible was questioned
even during these early years. Although light burning similar to Native American
practices was used by settlers and some argued for the necessity of it being a part of
sound forest policy (Koch 1935, pp. 103–104), overwhelmingly, questioning of the
policy was not over burning but how to use modern techniques and management to
fully suppress wildland fire (Greeley 1920, pp. 38–39). Reliance on private lumber
companies and lack of USFS coordination was seen as a major obstacle to forest
protection and health through suppression (Allen 1910, pp. 642–643). Cooperation
was seen as what failed in the now almost exclusive held perspective of policy
makers that full suppression was the only way to protect forested lands. The Weeks
Act (1911) designated the USFS as the agency for federal cooperation in fire
suppression and was strengthened by the Clarke-McNary Act of 1924 (Southard
2011, pp. 18–20), while the Protection of Timber Owned by the United States from
Fire, Disease, or Insect Ravages (16 USC 594) was the National Park Service (NPS)
equivalent.
8 Climate Change, Forest Fires, and Health in California 109
By the mid-1930s, the policy to contain and control all fires by 10 a.m. had been
adopted by the USFS, and full suppression was largely in place. In this era, wildland
fire was seen as an evil that could be stopped with enough money, sound tactics, and
advances in science and technology. This policy was solidified during and imme-
diately after World War II when all fire was considered evil (Figure) and the public
perception of complete suppression began despite the essential need of fire in the
forest (Kauffman 2004, p. 879).
The use of wildland fire began to gather interest in the 1960s as fire management
cost increased, and research began to demonstrate benefits (Kilgore 1973,
pp. 498–508; Parsons and DeBenedetti 1979, pp. 29–32). In 1963, the “Leopold
Report” argued that western parks should be maintained as nearly as possible to the
condition when the first Euro-American settlers arrived (Leopold et al. 1963,
pp. 18–21) and began to inspire policy makers to include fire management. The
Wilderness Act (1964) allowed for the natural process of fire to occur and started a
move to include ecologically beneficial and prescribed fire to move from fully
controlled to some form of management.
The large land management organizations (typically federal, state, and tribal
governments and agencies) are diverse in their missions and goals to safe and
effectively manage fire at a landscape level. This creates an immediate and funda-
mental hurdle to a simplified one-size-fits-all policy where easy solutions for one
agency are contradictory to other agencies legislative authority. The United States
Forest Service (USFS) and National Park Service (NPS) frequently are located
adjacent to one another spatially, but have different mandates and mission goals.
The NPS, a part of the U.S. Department of Interior, is fundamentally a conservation
agency with an obligation to allow natural processes to function while the USFS, a
part of the U.S. Department of Agriculture, is required to incorporate sustainable
harvest over much of the land they manage. Timber harvest and other anthropo-
genic uses are authorized in the USFS, while the NPS is required to preserve the
ecological integrity of the land area they manage by eliminating to the greatest
extent possible anthropogenic impacts.
The need for greater agency cooperation began to enter policy after the 1988
Yellowstone fires. The 1995 “Federal Wildland Fire Management Policy & Pro-
gram Review” reflected the need to integrate fire into landscape-level management.
Extensive fires in 2000 led to the “Management the Impact of Wildfires on
Communities and the Environment: A Report to the President in Response to the
Wildfires of 2000” to reduce risk in the Wildland Urban Interface (WUI).
The “Review and Update of the 1995 Federal Wildland Fire Management
Policy” (2001) forms the basis of current wildland fire policy with the “Interagency
Strategy for the Implementation of Federal Wildland Fire Management Policy”
(2003) detailing the implementation.
The “Guidance for Implementation of Federal Wildland Fire Policy” (2009) is
currently the primary policy direction. Current policy includes a “single cohesive
federal fire policy” that directs agencies to consider long-term benefits of fire in
relation to risks with the number one guiding principle being firefighter and public
safety. The second guiding principle is the essential role of wildland fire as an
110 R. Cisneros et al.
ecological process needs to be incorporated into the planning process. Further
guiding principles include requiring risk management to include the cost of either
allowing or suppressing fire and the inclusion of consideration of public health and
environmental quality into the decision process. All guidance is to be underpinned
with fire management plans based on the “best available science.”
Science-based fire management plans in the political environment faced by
policy makers can be conflicting. While air quality is a rather modern concern,
fire has long been understood to perform many beneficial ecosystem functions
(Kilgore 1981, pp. 58–59) including helping to maximize carbon sequestration in
fire-prone areas (Hurteau et al. 2008, p. 496). Recurring wildland fire additionally
limits fire spread and substantially reduces fire progression under extreme weather
conditions (Parks et al. 2015, pp. 1485–1486) and may provide an avenue to control
emissions and the subsequent health impacts. However, past fire management
policy dominated by anthropogenic factors has primarily been intended to prevent
or contain wildland fire with the consequence of reducing ecological integrity in
fire-adapted ecosystems (Dellasala et al. 2004, pp. 977–978).
Future policy will likely continue to be based almost exclusively around anthro-
pogenic concerns unless the entrenched disincentives of current policy are over-
come and proactive use of managed fires is supported (North et al. 2015, p. 1280).
Without understanding the impacts from wildland fire smoke under a typical fire
regime, it is easy to understand how suppressing all emissions for public health
would appear to be sound policy. Unfortunately, this is a short-term solution where
future emissions are essentially ignored and priority is given to restricting wildland
fire emissions as much as possible with the assumption that future fire will not
occur. Sound policy requires differences between these competing scenarios be
quantified.
Fire suppression limited smoke when widespread air quality monitoring began
and provided some of the first regulatory data. This time of low emissions coupled
with an increase in fuel loading has created a backlog of fuels and wildland fire
emissions with limited historic monitoring context. Suppression limited wildland
fire emissions during the initial stages of systematic widespread air quality moni-
toring likely has led to inappropriate baseline estimates of air quality exposure to
areas in and adjacent to the fire-adapted ecosystem of the Sierra Nevada. Smoke
impacts were historically much more frequent throughout the Sierra Nevada with a
more active fire regime before Euro-American settlement (van de Water and
Safford 2011, pp. 29–35), but the cooler slower burning wildland fire needed to
sustain the Sierra Nevada ecosystem mosaic potentially made the spatial extent of
these historic wildland fire smoke events smaller.
The potential for air quality regulations to limit fire management options has
long been recognized as an impediment to the use of ecologically beneficial fire
(Sneeuwjagt et al. 2013, pp. 18–20). Smoke will likely be a greater concern with
increased fire use and acceptability of smoke levels declines (Shindler and Toman
2003, p. 11). Numerous overarching policy considerations have been offered in the
public, research, and policy sectors to help ameliorate the coming together of fire
and air policy. Often air quality concerns center around current regulation with
8 Climate Change, Forest Fires, and Health in California 111
wonderfully written regulatory language that has little to no practical field appli-
cability. Fire management needs a clear path to implementation where air quality
impacts are well defined by regulators and provide a quantifiable way to manage
smoke for the best health outcomes in both the short and long term.
Fire as an ecological process necessary in the Sierra Nevada has become better
studied and understood in the twentieth century. Fire has been widely accepted as
an important ecosystem component (Beaty and Taylor 2008, pp. 716–717; Collins
et al. 2007, pp. 553–557; Kilgore 1973, p. 497; Miller et al. 2012a, pp. 10–16;
Pausas and Keeley 2009, p. 593), while smoke research has largely focused on air
quality and impacts to public health (Adetona et al. 2016, pp. 101–102). As
population increases in California and more people move into the wildland urban
interface (WUI), wildland fire policy and air regulatory policy will likely continue
to conflict (Jacobson et al. 2001, p. 934).
Policy and the public may not be ready to adapt. While fire science is pointing to
increased fire, a disconnection in the science and policy exists (Ayres et al. 2016,
p. 80) with a smoke averse public and limited research on relative risk of wildland
fire management actions (Gaither et al. 2015, p. 1418; Smith et al. 2016,
pp. 137–138). Ecologically beneficial fire, or fire the size, intensity, extent, and
effects historically experienced in the ecosystem, will be limited by public willing-
ness to breathe smoke that may in part be rectified by understanding the health
implications of smoke emissions and exposure under prescribed, managed, and full
suppression scenarios.
Wildland fire burns have the ability to limit subsequent fire spread and lead to
self-regulating landscapes (Parks et al. 2015, p. 1489). Suppression may very well
be an unsustainable policy for landscape-level land management. Additionally, fire
suppression policy may have created an unrealistic expectation of smoke-free air in
areas which historically have seen abundant fire (van de Water and Safford 2011,
pp. 32–33) and smoke. While minimal research has been conducted on risk
management coupling human and natural fire-prone forest systems similar to
other natural hazards (Spies et al. 2014, p. 10), smoke is almost completely ignored.
Policy decisions have a profound effect on human and ecological health. Federal
land managers throughout the United States have multiple acts and policies that
regulate their actions. Policies allowing natural processes that emit regulated
pollutants can seemingly be in contradiction with public health. In the Sierra
Nevada of California, the essential ecosystem process of wildland fire in areas set
aside for conservation is one such process that is in apparent conflict with air
regulations.
112 R. Cisneros et al.
Forest Fire Greenhouse Gas Emissions and Its FutureImpacts on Climate Change
Approximately half of forest biomass is comprised of carbon (C), which is basically
created out of thin air in a thermodynamically unfavorable process driven by the
energy from the sun and catalyzed by the photosynthetic machinery in green leaves
of plants. When that biomass is burned, that process is reversed, and the constituent
carbon in biomass rapidly recombines with oxygen in a very thermodynamically
favorable process that produces three main greenhouse gases (GHGs): carbon
dioxide (CO2), methane (CH3), and nitrous oxide (N2O). At the same time, this
combustion process also produces many so-called “criteria” pollutants, like fine
particulate matter, (PM2.5) which affect human health.
However, direct flaming and smoldering of biomass from fires is only one
pathway for biomass to be converted to GHGs. In fire-prone ecosystems and at
the large scale, the photosynthetic production of biomass is opposed through
biomass decomposition by both combustion and respiration of that biomass back
to CO2 by plants and microbes in the ecosystem. At the landscape scale, the net
balance between respiration/combustion and photosynthesis, called net ecosystem
productivity (NEP), determines whether a given area will absorb GHGs from the
atmosphere as biomass or lose biomass, emitting GHGs back to the atmosphere.
Potter (2010, pp. 373–383) used remotely sensed data on biomass, combined
with the statewide GHG emissions inventory created by the California Air
Resources Board to model statewide accumulation of biomass across all natural
ecosystems. He estimated that all CA ecosystems, under favorably high precipita-
tion, accrue a maximum of between 14 and 24 million metric tonnes carbon
equivalent (MMTCE), offsetting a significant fraction of annual fossil fuel emis-
sions from the rest of California’s emissions inventory (about 120 MMTCE). By
contrast, under drier conditions, all ecosystems in CA showed a net loss of about
15 MMTCE. He notes that forests have been reliably sources, not sinks, for GHGs
under the warmer than normal conditions in the analysis period.
These modeled, remotely sensed results generally agree with inventory-based
methods that have quantified changes in stocks over time. Gonzalez et al. (2015,
pp. 68–77) used inventory-based techniques to show that over the 2001–2010
period, California landscapes have lost a net 29� 10 million metric tonnes
(Tg) of live C from biomass to the atmosphere and to the pool of dead biomass.
Most of which will slowly convert to GHGs in subsequent years. If all of that C
were immediately converted only to CO2 gas instantaneously (with no other more
potent GHGs like CH3 and N2O produced), these losses would equate to 106� 37
million metric tonnes of CO2 (MMTCO2) or an average of ~11 MMTCO2 per year
over the 10 year analysis period, which generally agrees with the Potter (2010)
ranges described above.
Wildfires account for a large proportion of these losses. Gonzalez et al. (2015,
pp. 68–77) estimate that about half of all the live, aboveground C lost from
California landscapes between 2001 and 2010 was due to wildfires. Some fraction
8 Climate Change, Forest Fires, and Health in California 113
of these losses manifest as direct emissions of GHGs due to combustion, but some
proportion remains on the landscape as dead material, decaying and releasing the
constituent C as GHGs at a slower rate (Battles et al. 2014, pp. 44–53).
Remotely sensed methods corroborate these stock-based loss observations,
showing distinct areas of mortality in the years following large fires, especially
for the footprint of large, high severity fires like the recent Rim (2013), King
(2014), and Rough (2015) fires (Potter 2016, pp. 1–7). This is because more intense
and severe fires cause more tree mortality, with greater post-fire GHG emissions
due to decay of the remaining dead material (North and Hurteau 2011,
pp. 1115–1120). Fire severity and the associated mortality have been increasing
significantly over the same (1987–2010) period (Miller et al. 2012b, pp. 184–203),
at least partly due to a warming climate. Modeling projections show that if current
trends in climate and fire severity continue, losses of C and associated wildfire
emissions will also continue and possibly accelerate through the coming century
(Hurteau et al. 2014, pp. 2298–2304; North and Hurteau 2011, pp. 1115–1120).
Climate, however, is only one of the drivers behind recent C losses from CA
forests; the other one is related to the structure and drought resistance of CA forests
brought about by aggressive fire suppression policies. Studies that have compared
forest structure between measurements performed in 1911 to recent Forest Inven-
tory Analysis (FIA) data show a doubling of canopy cover and density in mixed
conifer vegetation types and a tripling of that canopy cover in lower elevation
ponderosa pine forests (Stephens et al. 2015, pp. 1–16). Furthermore, that extra
biomass manifests as smaller diameter trees that are not only themselves more
vulnerable to fire but make the largest trees that hold the most above ground C in
forest stands more vulnerable to being killed and subsequently lost to the atmo-
sphere due to high severity fire (Lutz et al. 2012, p. e36131). The extra load of leaf
area also creates additional strain on soil water resources, which in times of drought
has been shown to significantly increase forest mortality (Potter 2016, pp. 1–7; van
Mantgem et al. 2009, pp. 521–524).
At the large scale, this densification and ingrowth allowed by fire suppression
has destabilized CA forest carbon stocks, homogenizing their structure in a way that
makes them more vulnerable to large-scale, high severity fire, just as these ecosys-
tems face unprecedented warming and drought (Collins et al. 2015, p 1174; Earles
et al. 2014, pp. 732–740). While that ingrowth has temporarily created a larger
carbon stock, it’s also setting the stage for a large-scale reversal of that stock back
into GHGs during drought periods, the beginning of which may be currently
manifesting in the southern Sierra Nevada (Asner et al. 2016, pp. E249–E255;
Hurteau and Brooks 2011, pp. 139–146; Potter 2016, pp. 1–7; Wiechmann et al.
2015, pp. 709–719). Research has shown that restoring low-moderate severity fire
to a landscape not only confers resistance to high severity fire and a reduction in
emissions (Wiedinmyer and Hurteau 2010, pp. 1926–1932), but it also reduces
vulnerability to drought (van Mantgem et al. 2016, pp. 13–25). Modeling at the
larger scale and into future climate scenarios has shown that under even the worst-
case scenarios, large-scale application of low-moderate severity fire has the poten-
tial to reduce fire emissions by nearly half (Hurteau et al. 2014, pp. 2298–2304).
114 R. Cisneros et al.
Ultimately, Sierra Nevada forests will likely continue to lose carbon back to the
atmosphere—forests are simply too dense given the available water and the likely
warming that will occur. The size of the carbon stock that remains, and magnitude
of the air pollution and GHG emissions that result from this reversal, will depend on
the pace and scale at which land managers can restore fire and drought-resistant
forest structure.
Air Quality Impacts of Forest Fires
Air pollutants from a wildland fire are dependent on fuels, can be complex near the
flame front, and interact with anthropogenic sources (Alves et al. 2010,
pp. 3027–3031; Hosseini et al. 2013, p. 9418; Statheropoulos and Karma 2007,
pp. 433–436). Smoke emission can be more toxic than urban emission during large
high-intensity fires (Wegesser et al. 2009, p. 897), but there is limited understanding
of the causal factors of smoke composition including fuels, fire size and intensity,
and chemicals introduced when agricultural areas and houses burn. The same fire
can produce large variability in smoke composition even at the same monitoring
site (Wigder et al. 2013, p. 28). The variability of plume chemistry during transport
along with varying dispersal conditions makes understanding individual plume
toxicity challenging. It is then difficult to determine the net effects of forest fires
on human health (Fowler 2003, p. 41). Wildfire smoke contains many air pollutants
of concern for public health, such as carbon monoxide (CO), nitrogen dioxide
(NO2), ozone (O3), particulate matter (PM), polycyclic aromatic hydrocarbons
(PAHs), other hydrocarbons, volatile organic compounds (VOCs), and free radicals
(Naeher et al. 2007, pp. 69–70). PM emitted from fires is most elevated compared to
background levels (Naeher et al. 2007, p. 74) and is one of the best ways to assess
smoke exposure (Naeher et al. 2007, p. 74; Vedal and Dutton 2006, p. 30). Thus,
this section will focus on PM2.5 to consider wildland fire smoke exposure.
Particulate matter less than 2.5 microns in diameter (PM2.5) is a large portion of
emissions from wildland fire (Clinton et al. 2006, p. 3692) and is easily transported
over long distance (Bein et al. 2008, pp. 13–17; Dokas et al. 2007, p. 77) having a
large impact on air quality (Fowler 2003, pp. 42–43; Langmann et al. 2009,
pp. 112–113). Particulate matter is the most frequently studied pollutant when
studying wildland fire smoke impacts in part because it can be ten times higher
than non-fire background concentrations (Liu et al. 2015, pp. 128–129) and it is also
a great tracer for smoke. Smoke transport can easily be detected by remote sensing
(Hoff and Christopher 2009, p. 652). Quantifying ground-level concentrations of
PM2.5 using remote sensing is difficult (Toth et al. 2014, pp. 6049–6056; Yao and
Henderson 2013, p. 330). Remote sensing and modeling can improve remote
sensing estimates of ground-level PM2.5 (Li et al. 2015, p. 4494; Reid et al.
2015, p. 3892; Yao et al. 2013, p. 1142). Remote sensing can be used to indicate
exceedances from the normal of ground-level PM2.5 concentrations due to smoke
8 Climate Change, Forest Fires, and Health in California 115
in the Sierra Nevada, but ground-based monitors are necessary for accurate quan-
tification (Preisler et al. 2015, p. 349).
Megafires
The occurrence of large wildfires (megafires) has been increasing in California (see
Fig. 8.3). Thirteen of the 20 largest California wildfires in recorded history (2015 as
the last year) have occurred since 2002 (Table 8.1). Smoke from these wildfires
often causes the largest air quality impacts of the year in the towns and cities closer
and downwind of the fire. This is particularly true for the more rural areas further
away from the major anthropogenic emission sources and typically better air
quality. We present some examples below.
McNally (human related), 2002
• The smoke impacts occurred in mountain communities in the eastern side of the
Sierra Nevada and downwind of the fire for about 30 days. Kernville, the site
closest to the fire, was the most impacted.
• Daily PM10 concentrations more than tripled over the average at some of the
impacted locations.
• The California daily PM10 standard (50 ug/m3) was exceeded 164 times during
the fire and only six times before the fire at several monitor locations that were
impacted by the event.
• The Federal daily PM10 standard (150 ug/m3) was exceeded four times during
the fire.
• For 4 days, PM10 hourly concentrations surpassed the 300 ug/m3 levels reaching
a maximum of 600 ug/m3 (see Fig. 8.4).
Rim Fire (human related), 2013
• Daily 24-h average PM2.5 concentrations measured by the 22 air monitors
ranged from <12 (background) to 450 μg m�3.
• Locations closer and downwind of the fire experienced the highest PM2.5
impacts. The Rim Fire Camp, Tuolumne City, and Groveland sites were located
closest to the fire.
• The Rim Fire Camp monitoring site reported the highest mean and maximum
24-h. average PM2.5 concentration (450 μg m�3). Tuolumne City and
Groveland had elevated mean 24-h average PM2.5 concentrations, 230 μg m�3
and 200 μg m�3, respectively (see Fig. 8.5).
• PM2.5 24 h mean concentrations increase tenfold from typical background
concentrations at some of the monitoring stations.
116 R. Cisneros et al.
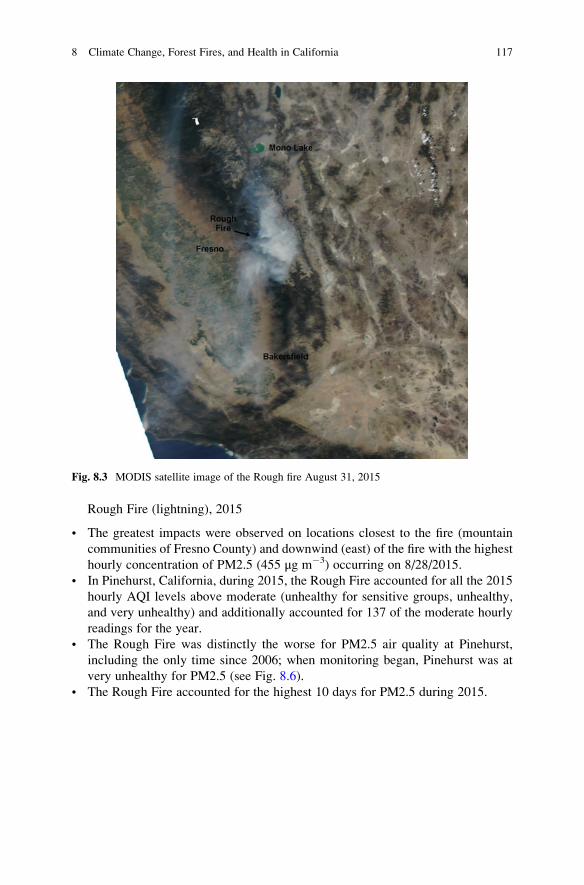
Rough Fire (lightning), 2015
• The greatest impacts were observed on locations closest to the fire (mountain
communities of Fresno County) and downwind (east) of the fire with the highest
hourly concentration of PM2.5 (455 μg m�3) occurring on 8/28/2015.
• In Pinehurst, California, during 2015, the Rough Fire accounted for all the 2015
hourly AQI levels above moderate (unhealthy for sensitive groups, unhealthy,
and very unhealthy) and additionally accounted for 137 of the moderate hourly
readings for the year.
• The Rough Fire was distinctly the worse for PM2.5 air quality at Pinehurst,
including the only time since 2006; when monitoring began, Pinehurst was at
very unhealthy for PM2.5 (see Fig. 8.6).
• The Rough Fire accounted for the highest 10 days for PM2.5 during 2015.
Fig. 8.3 MODIS satellite image of the Rough fire August 31, 2015
8 Climate Change, Forest Fires, and Health in California 117
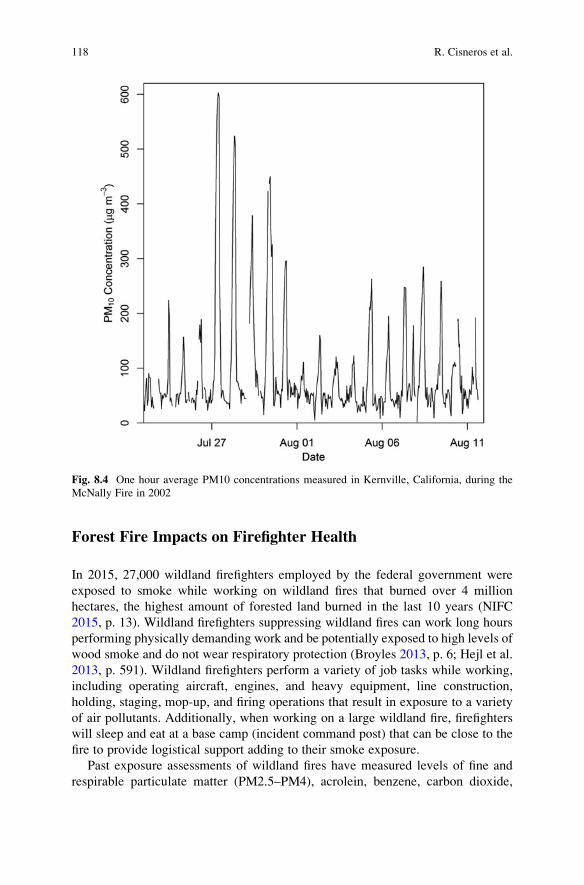
Forest Fire Impacts on Firefighter Health
In 2015, 27,000 wildland firefighters employed by the federal government were
exposed to smoke while working on wildland fires that burned over 4 million
hectares, the highest amount of forested land burned in the last 10 years (NIFC
2015, p. 13). Wildland firefighters suppressing wildland fires can work long hours
performing physically demanding work and be potentially exposed to high levels of
wood smoke and do not wear respiratory protection (Broyles 2013, p. 6; Hejl et al.
2013, p. 591). Wildland firefighters perform a variety of job tasks while working,
including operating aircraft, engines, and heavy equipment, line construction,
holding, staging, mop-up, and firing operations that result in exposure to a variety
of air pollutants. Additionally, when working on a large wildland fire, firefighters
will sleep and eat at a base camp (incident command post) that can be close to the
fire to provide logistical support adding to their smoke exposure.
Past exposure assessments of wildland fires have measured levels of fine and
respirable particulate matter (PM2.5–PM4), acrolein, benzene, carbon dioxide,
Fig. 8.4 One hour average PM10 concentrations measured in Kernville, California, during the
McNally Fire in 2002
118 R. Cisneros et al.
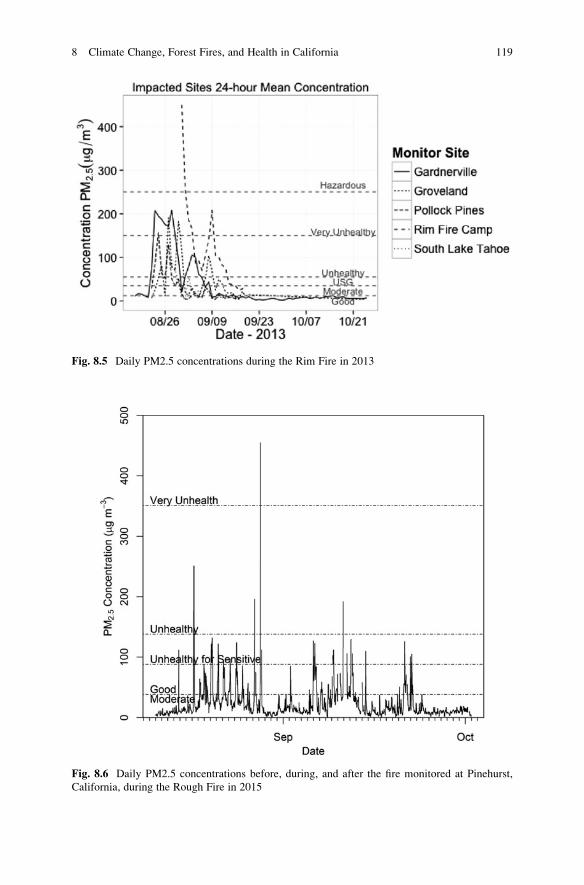
Fig. 8.5 Daily PM2.5 concentrations during the Rim Fire in 2013
Fig. 8.6 Daily PM2.5 concentrations before, during, and after the fire monitored at Pinehurst,
California, during the Rough Fire in 2015
8 Climate Change, Forest Fires, and Health in California 119
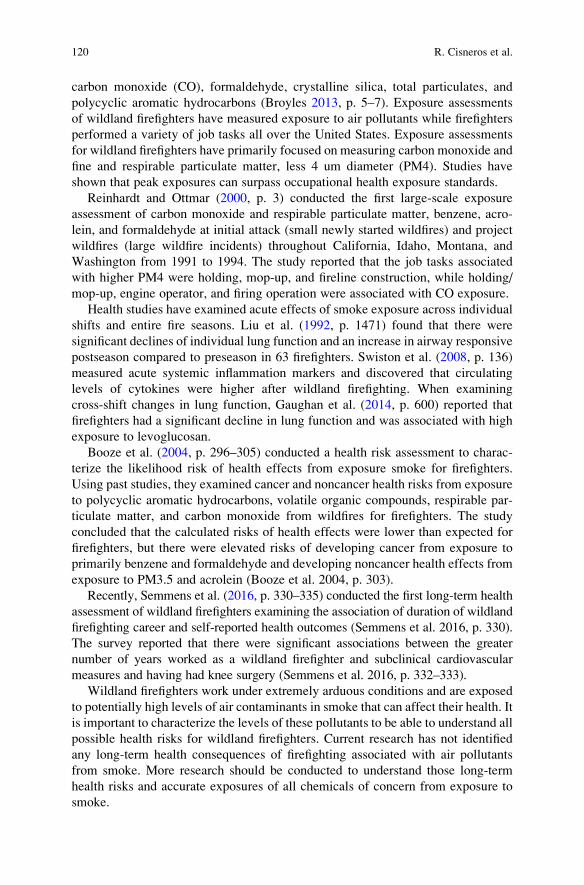
carbon monoxide (CO), formaldehyde, crystalline silica, total particulates, and
polycyclic aromatic hydrocarbons (Broyles 2013, p. 5–7). Exposure assessments
of wildland firefighters have measured exposure to air pollutants while firefighters
performed a variety of job tasks all over the United States. Exposure assessments
for wildland firefighters have primarily focused on measuring carbon monoxide and
fine and respirable particulate matter, less 4 um diameter (PM4). Studies have
shown that peak exposures can surpass occupational health exposure standards.
Reinhardt and Ottmar (2000, p. 3) conducted the first large-scale exposure
assessment of carbon monoxide and respirable particulate matter, benzene, acro-
lein, and formaldehyde at initial attack (small newly started wildfires) and project
wildfires (large wildfire incidents) throughout California, Idaho, Montana, and
Washington from 1991 to 1994. The study reported that the job tasks associated
with higher PM4 were holding, mop-up, and fireline construction, while holding/
mop-up, engine operator, and firing operation were associated with CO exposure.
Health studies have examined acute effects of smoke exposure across individual
shifts and entire fire seasons. Liu et al. (1992, p. 1471) found that there were
significant declines of individual lung function and an increase in airway responsive
postseason compared to preseason in 63 firefighters. Swiston et al. (2008, p. 136)
measured acute systemic inflammation markers and discovered that circulating
levels of cytokines were higher after wildland firefighting. When examining
cross-shift changes in lung function, Gaughan et al. (2014, p. 600) reported that
firefighters had a significant decline in lung function and was associated with high
exposure to levoglucosan.
Booze et al. (2004, p. 296–305) conducted a health risk assessment to charac-
terize the likelihood risk of health effects from exposure smoke for firefighters.
Using past studies, they examined cancer and noncancer health risks from exposure
to polycyclic aromatic hydrocarbons, volatile organic compounds, respirable par-
ticulate matter, and carbon monoxide from wildfires for firefighters. The study
concluded that the calculated risks of health effects were lower than expected for
firefighters, but there were elevated risks of developing cancer from exposure to
primarily benzene and formaldehyde and developing noncancer health effects from
exposure to PM3.5 and acrolein (Booze et al. 2004, p. 303).
Recently, Semmens et al. (2016, p. 330–335) conducted the first long-term health
assessment of wildland firefighters examining the association of duration of wildland
firefighting career and self-reported health outcomes (Semmens et al. 2016, p. 330).
The survey reported that there were significant associations between the greater
number of years worked as a wildland firefighter and subclinical cardiovascular
measures and having had knee surgery (Semmens et al. 2016, p. 332–333).
Wildland firefighters work under extremely arduous conditions and are exposed
to potentially high levels of air contaminants in smoke that can affect their health. It
is important to characterize the levels of these pollutants to be able to understand all
possible health risks for wildland firefighters. Current research has not identified
any long-term health consequences of firefighting associated with air pollutants
from smoke. More research should be conducted to understand those long-term
health risks and accurate exposures of all chemicals of concern from exposure to
smoke.
120 R. Cisneros et al.
Proposed Policy and Management Strategies to Dealwith Air Quality Impacts in California
Until today, there have not been mitigation policies adopted in California. Federal
Land Management Agencies (LMAs) in the United States have been adjusting
policies after recognizing that past suppression policies are an important factor in
catastrophic fires. In California, to reintroduce fire back to the forests, the National
Park Service implemented prescribed burning (PB) around 1960 and the US Forest
Service in the 1990s. The National Park Service and US Forest Service are the
biggest federal LMAs with the most land to manage in California. It is now clear
that the small-scale PB (<200 ha) will not lead to the landscape restoration sought
by these agencies (Schweizer and Cisneros 2014, p. 266). Thus, the current thought
is to establish a wider use of landscape-level fire, or managed fire (MF), that could
burn larger areas and maximize beneficial fire effects on resources, at the same time
reducing costs and increasing fire safety. MF are smaller than megafires and
naturally ignited (lightning), and they burn with less intensity and have positive
benefits since it is allowed to burn under favorable conditions. However, concerns
with smoke exposure, economic interests, and airshed capacity (the air in the area is
already heavily polluted by human activities) issues raised by air regulators hin-
dered full implementation of MF. Fire emissions from MF are considered anthro-
pogenic, even though they are from a natural process, making them a regulated
activity under the jurisdiction of air regulatory agencies. Thus, provide conflicted
policy directions where coordination with air regulators has been difficult and
public opinion is heavily weighted leading to poor support for implementation of
MF. In a polluted airshed with short-term air quality goals, there are no incentives
for air regulators to accept additional emissions form fires. More emissions create
disincentives including possible human health impacts and nuisance complaints. In
summary mitigation policies, such the use of ecological beneficial landscape fires
like MF, have not been fully adopted in California.
Forest and air management policy are often in conflict with regard to forest fires
which in turn impacts public health. This is readily apparent in fire-prone ecosys-
tems where smoke is routinely present. Fire has been a major natural mechanism in
the Sierra Nevada Mountains of California providing evolutionary pressure which
has shaped this ecosystem. As population has boomed throughout California, more
people are living in and immediately adjacent to this fire-adapted ecosystem
creating a conflict not only between the immediate destruction of life and property
from wildland fire but additionally subjecting larger populations to the exposure of
wildland fire smoke. Wildland fire smoke may be the most reviled nondestructive
by-product of any natural process. Smelling smoke in the air immediately makes
many people deem they are experiencing hazardous air quality even when smoke
impacts are undetectable in background ambient concentrations.
8 Climate Change, Forest Fires, and Health in California 121
Public expectation of a smoke-free environment has been instilled by suppres-
sion policy, deferring emissions to be release a later day. Thus, reliance of sup-
pression fires in a fire-prone area is not effective in protecting human health at the
population level (Schweizer and Cisneros 2016, p. 1). Consideration needs to be
given to future negative health outcomes created by megafires which expose more
people to extremely high levels of air pollutants. Radical change is required. One
intriguing option is for beneficial wildland fire smoke to be treated as natural
background and exempted from regulations (Schweizer and Cisneros 2016, p. 1).
The use of managed wildfires has the potential to restore and maintain fire-
adapted ecosystems of the Sierra Nevada, and their use should be expanded
particularly in remote areas to mitigate the negative consequences of suppression
(Meyer 2015). While ecological benefits from fire are well established, smoke
impacts are more difficult to quantify. Fuel loading, fire size, and distance from
the fire are important to understanding impacts (Moeltner et al. 2013). Controlling
fire size and intensity through increased use of ecologically beneficial fire may
prove to be an effective tool in smoke management and reduce firefighter smoke
exposure. There is potential for wildland fires of the size and intensity historically
seen in the Sierra Nevada to be managed while adhering to federal health standards.
Increased wildland fire has also provided data suggesting that timing and dispersal
can be used to mitigate some of the health impacts (Tian et al. 2008). Modeling of
smoke plume dispersal and movement has improved to provide better estimates of
forest fire exposure (Yao and Henderson 2013). Further understanding of the spatial
extent of smoke and public exposure levels under various fire size and intensity
scenarios would help inform wildland fire policy about the role of ecologically
beneficial fire. It is likely the best long-term air quality is inextricably linked to
ecosystem health in California (Schweizer and Cisneros 2016, p. 3).
Managing air quality using the current PM2.5 national ambient air quality
standards (NAAQS) at the most impacted areas, which happen to be mountain
remote communities, will provide an opportunity to increase burning in many
forests while continuing to protect public health (Schweizer and Cisneros 2014,
p. 265–278; Schweizer et al. 2017, p. 345–356). Ecologically beneficial fire should
be encouraged for the best possible air quality outcome in a fire-prone ecosystem
within the allowable federal health standards.
Schweizer et al. (2017 p. 345–356) analyzed smoke impacts of the different
types (PB, MF, and megafires) of fires on a single site’s PM2.5 levels in California
over multiple years (2006–2015). The study found that the area could include
beneficial landscape fire or MF at levels at or above the largest size (8000 ha–
20,000 acres) of MF and remain below the current NAAQS thresholds for PM2.5.
These ecologically beneficial fires helped sustain this fire-adapted forest and
reduced fuels with the subsequent benefits to public health via lower air pollution
levels (by limiting intensity and spread of suppression fire). In contrast, the Rough
Fire (2015) increased air quality impacts to PM2.5 to very unhealthy levels and led
to an exceedance of the annual NAAQS 24 h. Using the NAAQS when considering
air quality impacts from smoke can give land and air managers a metric for broader
122 R. Cisneros et al.
understanding especially when assessing ecologically beneficial fires (Schweizer
et al. 2017, p. 345–356). The current practice of suppression to avoid smoke impact
has proven to be an unreliable way to decrease smoke-related health impacts.
Management of fires should be based on smoke impacts at monitors, making air
monitoring the foundation of fire management actions giving greater flexibility for
managing fires. Managed fires should be considered a natural event and exempted
from current state and federal regulations.
Conclusion
Wildland fire smoke impacts will depend heavily on level of emissions, transport,
and receptor distance from the fire. The economic impacts to health can be
substantial when urban areas are impacted by large high-intensity fires instead of
smaller fires (Rittmaster et al. 2006, p. 874–875). Megafires can result in increased
asthma emergency room visits and hospital admissions and significant economic
cost (Jones et al. 2016, p. 181). Protecting public health from smoke is directly
dependent on controlling fire emissions. Controlling timing and quantity is essen-
tial. Timing and dispersal can be used to mitigate some of the health impacts of
increased wildland fire (Tian et al. 2008, p. 2771). Complete suppression does not
work. It is apparent after over 100 years of suppression in the United States that at
best full suppression is a delaying tactic (Busenberg 2004, p. 148; Calkin et al.
2015, p. 1, 10; Stephens et al. 2016, p. 12–13) that can be better said to mortgage
smoke exposure to subsequent generations. Climate change is only exacerbating
suppression impacts by increasing season length and overall size and intensity.
Forest resiliency to climate change is dependent on forest health from natural
process. The natural process of fire needs widespread reintroduction to assuage
long-term air quality and public health in fire-prone areas.
High concentrations of PM2.5 will be found with any fire, but reducing the
spatial extent can limit exposure to populations of concern. While few associations
between wildfire emissions and mortality have been observed, associations with
subclinical effects have been established (Youssouf et al. 2014, p. 11773), but
major and minor health outcomes due to wildland fire smoke need to be better
identified (Kochi et al. 2010, p. 803).
Regional forecasting using remote sensing may eventual lead to the best under-
standing of fire activity impacts to human health by identifying which fires are most
likely to impact a given location (Price et al. 2012, p. 1). Linking landscape ecology
and epidemiological perspectives is important to reintroduction of ecologically
beneficial fire into the modern world. For example, in Australia, it was noted that
daily asthma presentation increase may be avoided while allowing some fire by
using an airshed threshold for particulate matter (Bowman and Johnston 2005,
pp. 9–80). The NAAQS as a metric where public health impacts from regional
fires are used to estimate impacts from the number and size of fires over a given
8 Climate Change, Forest Fires, and Health in California 123
season may provide a way to reintroduce measured landscape-level ecologically
beneficial fire in the Sierra Nevada. Regulating to present NAAQS (i.e., 3-year
average concentrations for PM2.5) in the areas where the ecologically beneficial
fires typically burn would provide an opportunity to increase burning in many
forests while still protecting public health.
Tolerance of routine emissions from wildland fire smoke both from the public
and managers is needed and must take into consideration that suppression is only
deferring the risk to the future with greater impacts to more people. Public aware-
ness of the complexity of wildland fire decisions based on air quality is necessary to
provide the public support needed to allow landscape-level reintroduction of fire.
Suppression of fire only mortgages the health of future generations (Schweizer and
Cisneros 2016, p. 3). Understanding smoke impacts and public health advisories to
protect exposure during any event is necessary and should be increased to under-
stand impacts across the landscape.
References
Adetona O, Reinhardt TE, Domitrovich J, Broyles G, Adetona AM, Kleinman MT, Ottmar RD,
Naeher LP (2016) Review of the health effects of wildland fire smoke on wildland firefighters
and the public. Inhal Toxicol 28:95–139
Allen E (1910) What protective cooperation did. Am For 16:641–643
Alves CA, Goncalves C, Pio CA, Mirante F, Caseiro A, Tarelho L, Freitas MC, Viegas DX (2010)
Smoke emissions from biomass burning in a Mediterranean shrubland. Atmos Environ
44:3024–3033
Anderson MK (1996) The ethnobotany of Deergrass, Muhlenbergia Rigens (Poaceae): its uses and
fire management by California Indian tribes. Econ Bot 4:409–422
Anderson MK (1999) The fire, pruning, and coppice management of temperate ecosystems for
basketry material by California Indian tribes. Hum Ecol 27:79–113
Asner GP, Brodrick PG, Anderson CB, Vaughn N, Knapp DE, Martin RE (2016) Progressive
forest canopy water loss during the 2012–2015 California drought. Proc Natl Acad Sci 113(2):
E249–E255
Ayres A, Degolia A, Fienup M, Kim Y, Sainz J, Urbisci L, Viana D, Wesolowski G, Plantinga AJ,
Tague C (2016) Social science/natural science perspectives on wildfire and climate change.
Geogr Compass 10:67–86
Battles JJ, Cousins SJM, Sanders JE (2014) Carbon dynamics and greenhouse emissions of
standing dead trees in California mixed conifer forests. California Energy Commission,
Berkeley, pp 44–53
Beaty RM, Taylor AH (2008) Fire history and the structure and dynamics of a mixed conifer forest
landscape in the northern Sierra Nevada, Lake Tahoe Basin, California, USA. For Ecol Manag
255:707–719
Bein KJ, Zhao Y, Johnston MV, Wexler AS (2008) Interactions between boreal wildfire and urban
emissions. J Geophys Res Atmos 113:1–17
Booze TF, Reinhardt TE, Quiring SJ, Ottmar RD (2004) A screening-level assessment of the
health risks of chronic smoke exposure for wildland firefighters. J Occup Environ Hyg 1
(5):296–305
Bowman DMJS, Johnston FH (2005) Wildfire smoke, fire management and human health.
EcoHealth 2:76–80
124 R. Cisneros et al.
Broyles G (2013) Wildland firefighter smoke exposure, United States Department of Agriculture,
Forest Service, National Technology and Development Program, 1351 1803 5100 Fire Man-
agement, 26 pages
Busenberg G (2004) Wildfire management in the United States: the evolution of a policy failure.
Rev Policy Res 21(2):145–156
Calkin DE, ThompsonMP, Finney MA (2015) Negative consequences of positive feedbacks in US
wildfire management. For Ecosyst 2(9):1–10
Cermak RW (2005) Fire in the forest a history of forest fire control on the National Forests in
California, 1898–1956. United States Department of Agriculture Forest Service, Pacific South-
west Region, R5-FR-003, 443 pages.
Clinton NE, Gong P, Scott K (2006) Quantification of pollutants emitted from very large wildland
fires in Southern California, USA. Atmos Environ 40:3686–3695
Collins BM, Kelly M, van Wagtendonk JW, Stephens SL (2007) Spatial patterns of large natural
fires in Sierra Nevada wilderness areas. Landsc Ecol 22:545–557
Collins BM, Lydersen JM, Everett RG, Fry DL, Stephens SL (2015) Novel characterization of
landscape-level variability in historical vegetation structure. Ecol Appl 25(5):1174
Delfino RJ, Brummel S, Wu J, Stern H, Ostro B, Lipsett M, Winer A, Street DH, Zhang L, Tjoa T,
Gillen DL (2009) The relationship of respiratory and cardiovascular hospital admissions to the
southern California wildfires of 2003. Occup Environ Med 66:189–197
Dellasala DA, Williams JE, Williams CD, Franklin JF (2004) Beyond smoke and mirrors: a
synthesis of fire policy and science. Conserv Biol 18:976–986
Dokas I, Statheropoulos M, Karma S (2007) Integration of field chemical data in initial risk
assessment of forest fire smoke. Sci Total Environ 376:72–85
Duclos P, Sanderson LM, Lipsett M (1990) The 1987 forest fire disaster in California: assessment
of emergency room visits. Arch Environ Health 45:53–58
Earles M, North MP, Hurteau MD (2014) Wildfire and drought dynamics destabilize carbon stores
of fire-suppressed forests. Ecol Appl 24(4):732–740
Flannigan M, Cantin AS, de Groot WJ, Wotton M, Newbery A, Gowman LM (2013) Global
wildland fire season severity in the 21st century. For Ecol Manag 294:54–61
Fowler CT (2003) Human health impacts of forest fires in the southern United States: a literature
review. J Ecol Anthropol 7:39–63
Gaither CJ, Goodrick S, Murphy BE, Poudyal N (2015) An exploratory spatial analysis of social
vulnerability and smoke plume dispersion in the U.S. south. Forests 6:1397–1421
Gaughan DM, Piacitelli CA, Chen BT, Law BF, Virji MA, Edwards NT, Enright PL, Schwegler-
Berry DE, Leonard SS, Wagner GR (2014) Exposures and cross-shift lung function declines in
wildland firefighters. J Occup Environ Hyg 11(9):591–603
Gonzalez P, Battles JJ, Collins BM, Robards T, Saah DS (2015) Aboveground live carbon stock
changes of California wildland ecosystems, 2001–2010. For Ecol Manag 348:68–77
Greeley WB (1920) “Piute Forestry” or the fallacy of light burning. Timberman 21:38–39
Hejl AM, Adetona O, Diaz-Sanchez D, Carter JD, Commodore AA, Rathbun SL, Naeher LP
(2013) Inflammatory effects of woodsmoke exposure among wildland firefighters working at
prescribed burns at the Savannah River site, SC. J Occup Environ Hyg 10(4):173–180
Hoff RM, Christopher SA (2009) Remote sensing of particulate pollution from space: have we
reached the promised land? J Air Waste Manag Assoc 59:645–675
Holstius DM, Reid CE, Jesdale BM, Morello-Frosch R (2012) Birth weight following pregnancy
during the 2003 southern California wildfires. Environ Health Perspect 120:1340–1345
Hosseini S, Urbanski SP, Dixit P, Qi L, Burling IR, Yokelson RJ, Johnson TJ, Shrivastava M, Jung
HS, Weise DR, Miller JW, Cocker DR III (2013) Laboratory characterization of PM emissions
from combustion of wildland biomass fuels. J Geophys Res Atmos 118:9914–9929
Hurteau MD, Brooks ML (2011) Short- and long-term effects of fire on carbon in US dry
temperate forest systems. Bioscience 61(2):139–146
Hurteau MD, Koch GW, Hungate BA (2008) Carbon protection and fire risk reduction: toward a
full accounting of forest carbon offsets. Front Ecol Environ 6:493–498
8 Climate Change, Forest Fires, and Health in California 125
Hurteau MD, Westerling AL, Wiedinmyer C, Bryant BP (2014) Projected effects of climate and
development on California wildfire emissions through 2100. Environ Sci Technol
48:2298–2304
Jacobson SK, Monroe MC, Marynowski S (2001) Fire at the wildland interface: the influence of
experience and mass media on public knowledge, attitudes, and behavioral intentions. Wildlife
Society Bulletin 29:929–937
Jones BA, Thacher JA, Chermak JM, Berrens RP (2016) Wildfire smoke health costs: a methods
case study for a southwest US ‘mega-fire’. J Environ Econ Policy 5:181–199
Kauffman J (2004) Death rides the Forest: perceptions of fire, land use, and ecological restoration
of western forests. Conserv Biol 18:878–882
Kilgore B (1973) The ecological role of fire in Sierran conifer forests. Its application to National
Park management. Quat Res 3:496–513
Kilgore B (1981) Fire in ecosystem distribution and structure: western forests and scrublands. In:
Mooney HA, Bonnicksen TM, Christensen NL (tech. cord.), Proceedings of the conference:
fire regimes and ecosystem properties, USDA Forest Service General Technical Report
WO-GTR-26, 58–89.
Koch E (1935) The passing of the Lolo Trail. J For 33:98–104
Kochi I, Donovan GH, Champ PA, Loomis JB (2010) The economic cost of adverse health effects
from wildfire-smoke exposure: a review. Int J Wildland Fire 19:803–817
Kunzli N, Avol E, Wu J, Gauderman WJ, Rappaport E, Millstein J, Bennion J, McConnell R,
Gilliland FD, Berhane K, Luhrmann F, Winer A, Peters JM (2006) Health effects of the 2003
Southern California wildfires on children. Am J Respir Crit Care Med 174:1221–1228
Langmann B, Duncan B, Textor C, Trentmann J, van der Werf G (2009) Vegetation fire emissions
and their impact on air pollution. Atmos Environ 43:107–116
Lee TS, Falter K, Meyer P, Mott J, Gwynn C (2009) Risk factors associated with clinic visits
during the 1999 forest fires near the Hoopa Valley Indian Reservation, California, USA. Int J
Environ Health Res 19(5):315–327
Lenihan JM, Bachelet D, Neilson RP, Drapek R (2008) Response of vegetation distribution,
ecosystem productivity, and fire to climate change scenarios for California. Clim Chang
87:215–230
Leopold AS, Cain SA, Cottam CM, Gabrielson IN, Kimball TL (1963) Wildlife management in
the National Parks, revisiting Leopold: resource stewardship in the National Parks A Report of
the National Park System Advisory Board Science Committee, 2012, 3–21
Levy S (2005) Rekindling native fires. Bioscience 55:303–308
Li X, Song W, Lian L, Wei X (2015) Forest fire smoke detection using back-propagation neural
network based on MODIS data. Remote Sens 7:4473–4498
Liu YQ (2004) Variability of wildland fire emissions across the contiguous United States. Atmos
Environ 38:3489–3499
Liu D, Tager IB, Balmes JR, Harrison RJ (1992) The effect of smoke inhalation on lung function
and airway responsiveness in wildland fire fighters. Am Rev Respir Dis 146(6):1469–1473
Liu JC, Pereira G, Uhl SA, Bravo MA, Bell ML (2015) A systemic review of the physical health
impacts from non-occupational exposure to wildfire smoke. Environ Res 136:120–132
Lutz JA, Larson AJ, Swanson ME, Freund JA (2012) Ecological importance of large-diameter
trees in a temperate mixed-conifer Forest. PLoS One 7(5):e36131
van Mantgem P, Caprio AC, Stephenson NL, Das AJ (2016) Does prescribed fire promote
resistance to drought in low elevation forests of the Sierra Nevada, California, USA? Fire
Ecol 12(1):13–25
Marshall GN, Schell TL, Elliott MN, Rayburn NR, Jaycox LH (2007) Psychiatric disorders among
adults seeking emergency disaster assistance after a wildland-urban interface fire. Psychiatr
Serv 58:509–514
Martin TG,Watson EM (2016) Intact ecosystems provide best defence against climate change. Nat
Clim Chang 6:122–124
126 R. Cisneros et al.
Meyer MD (2015) Forest fire severity patterns of resource objective wildfire in the southern Sierra
Nevada. J For 113:49–56
Miller JD, Collins BM, Lutz JA, Stephens SL, van Wagtendonk JW, Yasuda DA (2012a)
Differences in wildfires among ecoregions and land management agencies in the Sierra Nevada
region, California, USA. Ecosphere 3:1–20
Miller JD, Skinner CN, Safford HD, Knapp EE, Ramirez CM (2012b) Trends and causes of
severity, size, and number of fires in northwestern California, USA. Ecol Appl 22(1):184–203
Mirabelli MC, Kunli N, Avol E, Gilliland FD, Gauderman JW, McConnel R, Peters JM (2009)
Respiratory symptoms following wildfire smoke exposure: airway size as a susceptibility
factor. Epidemiology 20:451–459
Moeltner K, Kim MK, Zhu E, Yang W (2013) Wildfire smoke and health impacts: a closer look a
fire attributes and their marginal effects. J Environ Econ Manag 66:476–496
Naeher LP, Brauer M, Lipsett M, Zelikoff JT, Simpson CD, Koenig JQ, Smith KR (2007)
Woodsmoke health effects: a review. Inhal Toxicol 19:67–106
NIFC (2015) National Interagency Coordinator Center-Wildland Fire Summary and Statistics
Annual Report 2015
North M, Hurteau M (2011) High-severity wildfire effects on carbon stocks and emissions in fuels
treated and untreated forest. For Ecol Manag 261:1115–1120
North MP, Stephens SL, Collins BM, Agee JK, Aplet G, Franklin JF, Fule PZ (2015) Reform
forest fire management. Science 349:1280–1281
Parks SA, Holsinger LM, Miller C, Nelson CR (2015) Wildland fires as a self-regulating mech-
anism: the role of previous burns and weather in limiting fire progression. Ecol Appl
25:1478–1492
Parsons DJ, DeBennedetti SH (1979) Impact of fire suppression on a mixed-conifer forest. For
Ecol Manag 2:21–33
Pausas JG, Keeley JE (2009) A burning story: the role of fire in the history of life. Bioscience
59:593–601
Potter C (2010) The carbon budget of California. Environ Sci Pol 13(5):373–383
Potter C (2016) Landsat image analysis of tree mortality in the southern Sierra Nevada region of
California during the 2013–2015 drought. J Earth Sci Clim Chang 7(342):1–7
Preisler HK, Schweizer D, Cisneros R, Procter T, Ruminski M, Tarnay L (2015) A statistical
model for determining impact of wildland fires on Particulate Matter (PM2.5) in Central
California aided by satellite imagery of smoke. Environ Pollut 205:340–349
Price OF, Williamson GJ, Henderson SB, Johnston F, Bowman DMJS (2012) The relationship
between particulate pollution levels in Australian cities, meteorology, and landscape fire
activity detected from MODIS hotspots., (2012). PLoS One 7:1–10
Rappold AG, Stone SL, Cascio WE, Neas LM, Kilaru VJ, Carraway MS, Szykman JJ, Isling A,
Cleve WE, Meredith JT, Vaughan-Batten H, Deyneka L, Devlin RB (2011) Peat bog wildfire
smoke exposure in rural North Carolina is associated with cardiopulmonary emergency
department visits assessed through syndromic surveillance. Environ Health Perspect
119:1415–1420
Reid CE, Jerrett M, Petersen ML, Pfister GG, Morefield PE, Tager IB, Raffuse SM, Balmes JR
(2015) Spatiotemporal prediction of fine particulate matter during the 2008 northern California
wildfires using machine learning. Environ Sci Technol 49:3887–3896
Reinhardt TE, Ottmar RD (2000) Smoke exposure at Western wildfires U.S. Department of
Agriculture, Forest Service, Pacific Northwest Research Station, Research Paper PNW-RP-525
Rittmaster R, Adamowicz WL, Amiro B, Pelletier RT (2006) Economic analysis of health effects
from forest fires. Can J For Res 36:868–877
Schweizer D, Cisneros R (2014) Wildland fire management and air quality in the southern Sierra
Nevada: Using the Lion Fire as a case study with a multi-year perspective on PM2.5 impacts
and fire policy. J Environ Manag 144:265–278
8 Climate Change, Forest Fires, and Health in California 127
Schweizer D, Cisneros R (2016) Forest fire policy: change conventional thinking of smoke
management to prioritize long-term air quality and public health. Air Qual Atmos Health.
doi:10.1007/s11869-016-0405-4
Schweizer D, Cisneros R, Traina S, Ghezzhei T, Shaw G (2016) Using National Ambient Air
Quality Standards for fine particulate matter to assess regional wildland fire smoke and air
quality management, J Environ Manag, submitted
Schweizer D, Cisneros R, Traina S, Ghezzehei TA, Shaw G (2017) Using national ambient air
quality standards for fine particulate matter to assess regional wildland fire smoke and air
quality management. J Environ Manag 201:345–356
Scott AC (2000) The pre-quaternary history of fire. Palaeogeogr Palaeoclimatol Palaeoecol
164:297–345
Semmens EO, Domitrovich J, Conway K, Noonan CW (2016) A cross-sectional survey of
occupational history as a wildland firefighter and health. Am J Ind Med 59:330–335
Shindler B, Toman E (2003) Fuel reduction strategies in forest communities: a longitudinal
analysis of public support, J For, September, 8–15.
Silcox FA (1910) How the fires were fought. American Forestry 16:631–639
Smith AMS, Kolden CA, Paveglio TB, Cochrane MA, Bowman DMJS, Moritz MA, Kliskey AD,
Alessa L, Hudak AT, Hoffman CM, Lutz JA, Queen LP, Goetz SJ, Higuera PE, Boschetti L,
Flannigan M, Yedinak KM, Watts AC, Strand EK, van Wagtendonk JW, Anderson JW, Stocks
BJ, Abatzoglou JT (2016) The science of firescapes: achieving fire resilient communities.
Bioscience 66:130–146
Sneeuwjagt RJ, Kline TS, Stephens SL (2013) Opportunities for improved fire use and manage-
ment in California: lessons from Western Australia. Fire Ecol 9:14–25
Southard L (2011) The history of cooperative forest fire control and the weeks act. For Hist Today,
Spring/Fall, 17–20
Spies TA, White EM, Kline JD, Fischer AP, Ager A, Bailey J, Bolte J, Koch J, Platt E, Olsen CS,
Jacobs D, Shindler B, Steen-Adams MM, Hammer R (2014) Examining fire-prone forest
landscapes as coupled human and natural systems. Ecol Soc 19:1–14
Statheropoulos M, Karma S (2007) Complexity and origin of the smoke components as measured
near the flame-front of a real forest fire incident: a case study. J Anal Appl Pyrolysis
78:430–437
Steel Z, Safford H, Viers J (2015) The fire frequency-severity relationship and the legacy of fire
suppression in California forests. Ecosphere 6:1–23
Stephens SL, Lydersen JM, Collins BM, Fry DL, Meyer MD (2015) Historical and current
landscape-scale ponderosa pine and mixed conifer forest structure in the southern Sierra
Nevada. Ecosphere 6(5):1–16
Stephens SL, Collins BM, Biber E, Fule PZ (2016) U.S. federal fire and forest policy: emphasizing
resilience in dry forests. Ecosphere 7(11):1–19
Swetnam T (1993) Fire history and climate change in Giant sequoia groves. Science 262:885–889
Swetnam T (2009) Multi-millennial fire history of the Giant Forest, sequoia National Park,
California, USA. Fire Ecol 5:120–150
Swiston J, Davidson W, Attridge S, Li G, Brauer M, van Eeden S (2008) Wood smoke exposure
induces a pulmonary and systemic inflammatory response in firefighters. Eur Respir J 32
(1):129–138
Tham R, Erbas B, Akram M, Dennekamp M, Abramson MJ (2009) The impact of smoke on
respiratory hospital outcomes during the 2002–2003 bushfire season, Victoria, Australia.
Respirology 14:69–75
Thelen B, French NH, Koziol BW, Billmire M, Owen RC, Johnson J, Gingsberg M, Loboda T, Wu
S (2013) Modeling acute respiratory illness during the 2007 San Diego wildland fires using a
coupled emissions-transport system and generalized additive modeling. Environ Health 12:94
Tian D, Wang Y, Bergin M, Hu Y, Liu Y, Russell AG (2008) Air quality impacts from prescribed
forest fires under different management practices. Environ Sci Technol 42:2767–2772
128 R. Cisneros et al.
Toth TD, Zhang J, Campbell JR, Hyer EJ, Reid JS, Shi Y, Westphal DL (2014) Impact of data
quality and surface-to-column representativeness on the PM2.5/satellite AOD relationship for
the contiguous United States. Atmos Chem Phys 14:6049–6062
Van de Water KM, Safford HD (2011) A summary of fire frequency estimates for California
vegetation before Euro-American settlement. Fire Ecol 7:26–58
Van Mantgem PJ, Stepheson NL, Byrne JC, Daniels LD, Franklin JF, Fule PZ, Harmon ME,
Larson AJ, Smith JM, Taylor AH, Veblen (2009) Widespread increase of tree mortality rates in
the western United States. Science 323:521–524
Vedal S, Dutton SJ (2006) Wildfire air pollution and daily mortality in a large urban area. Environ
Res 102:29–35
Vora C, Renvall MJ, Chao P, Ferguson P, Ramsdell JW (2011) 2007 San Diego wildfires and
asthmatics. J Asthma 48:75–78
van Wagtendonk JW (2007) The history and evolution of wildland fire use. Fire Ecol 2:3–17
Watson JEM, Shanahan DF, DiMarco M, Allan J, Laurance WF, Sanderson EW, Mackey B,
Venter O (2016) Catastrophic declines in wilderness areas undermine global environment
targets. Curr Biol 26:1–6
Wegesser TC, Pinkerton KE, Last JA (2009) California wildfires of 2008: coarse and fine
particulate matter toxicity. Environ Health Perspect 117:893–897
Westerling AL, Bryant BP (2008) Climate change and wildfire in California. Clim Chang
87:231–249
Westerling AL, Hidalgo HG, Cayan DR, Swetnam TW (2006) Warming and earlier spring
increase western US forest wildfire activity. Science 313:940–943
Westerling AL, Bryant BP, Preisler HK, Holmes TP, Hidalgo HG, Das T, Shrestha SR (2011)
Climate change and growth scenarios for California wildfire. Clim Chang 109:445–463
Wiechmann ML, Hurteau MD, North MP, Koch GW, Jerabkova L (2015) The carbon balance of
reducing wildfire risk and restoring process: an analysis of 10-year post-treatment carbon
dynamics in a mixed-conifer forest. Clim Chang 132(4):709–719
Wiedinmyer C, Hurteau MD (2010) Prescribed fire as a means of reducing forest carbon emissions
in the western United States. Environ Sci Technol 44(6):1926–1932
Wigder NL, Jaffe DA, Saketa FA (2013) Ozone and particulate matter enhancements from
regional wildfires observed at Mount Bachelor during 2004–2011. Atmos Environ 75:24–31
Yao J, Henderson SB (2013) An empirical model to estimate daily forest fire smoke exposure over
a large geographic area using air quality, meteorological, and remote sensing data. J Expo Sci
Environ Epidemiol 24:328–335
Yao J, Brauer M, Henderson SB (2013) Evaluation of a wildfire smoke forecasting system as a tool
for public health protection. Environ Health Perspect 121:1142–1147
Youssouf H, Liousse C, Roblou L, Assamoi EM, Salonen RO, Maesano C, Banerjee S, Annesi-
Maesano I (2014) Non-accidental health impacts of wildfire smoke. Int J Environ Res Public
Health 11:11772–11804
Potter C (2010) The carbon budget of California. Environ Science & Policy 13 (5): 373-383
Ricardo Cisneros, PhD, MPH, is an assistant professor of environmental public health at the
University of California, Merced. He received a PhD in environmental systems in 2008. He also
completed an MPH and BS in environmental health. As an environmental scientist with special-
ization in environmental health and exposure science, he conducts research that recognizes the
interdependence of ecological and human health with special interests in air pollution research and
exposure assessment.
Donald Schweizer, PhD, is an air resource specialist with the US Forest Service. His research
with the University of California, Merced, emphasizes understanding the benefits of forest health
and the role of natural environmental system function in protecting human health. His concentra-
tion is on wildland fire smoke and fire management policy in the wilderness and other protected
lands of the Sierra Nevada of California.
8 Climate Change, Forest Fires, and Health in California 129
Leland (Lee) Tarnay, PhD, is an ecologist working across agencies out of the US Forest Service
Region 5 Remote Sensing Lab. Lee received his BS from the University of California, Davis, in
biological sciences (1995) and his PhD from the University of Nevada, Reno (2001). His core
expertise is in wildland fire smoke and emission monitoring, modelling and management.
Kathleen Navarro, PhD, MPH, recently completed her PhD in environmental health sciences at
the University of California, Berkeley, School of Public Health, where she completed her MPH
degree in 2011. Her dissertation combined traditional exposure assessment methods with new
approaches to evaluate exposures in ambient community and occupational settings to air contam-
inants commonly emitted from wildland fires and found in the ambient environment. She holds a
BS in environmental toxicology from University of California, Davis.
David Veloz received his BS in management from the University of California, Merced, in 2013.
He is currently a PhD student at the University of California, Merced, and is motivated by the
desire to understand environmental justice issues created by air pollution in the California Central
Valley. His primary focus is to understand the public’s perception on air pollution and analyse
local air quality trends.
C. Trent Procter, BS, is an air quality program manager with the US Forest Service in the Pacific
Southwest Region. He completed his BS in natural resources management from the California
Polytechnic State University, San Luis Obispo, in 1978. He has over 25 years of experience
working for the Forest Service in Air Resources Management.
130 R. Cisneros et al.
Chapter 9
Air Pollution and Climate Change in Australia:A Triple Burden
Colin D. Butler and James Whelan
Abstract This chapter mainly focuses on air pollution, with less stress on the
health problems of climate change, which, conceptually, is also a form of air
pollution, due to the changing composition of atmospheric trace gases. Air quality
in Australia is comparatively good, by global standards, due to its large area, low
population, and widespread development. However, there are areas of Australia
which have significant health problems from dirty air, particularly in association
with coal-burning power stations, from the combustion of wood for heating during
winter and from vehicles in the large cities. Australia is also a major exporter of
greenhouse gases, both as fossil fuels (coal and gas), and of beef and sheep. Much
can be done to reduce this triple burden of impaired air quality, domestic climate
change and exported climate change, but this requires major changes to conscious-
ness in Australia, and greater willingness to oppose vested interests which profit
from ageing paradigms of progress which discount health and environmental costs.
The falling cost of renewable energy, especially, gives hope that such challenges
will be increasingly successful, but additional solutions are needed to reduce the
burning of wood for heat.
Keywords Air pollution • Australia • Coal mines • Climate change • Social
licence • Health
Introduction: Air Pollution and Health in Australia
When the British, in 1788, began their drawn-out process of invading and occupy-
ing the southern continent now called Australia, the indigenous people they
displaced from most areas had a long and rich tradition of astronomical knowledge
C.D. Butler (*)
University of Canberra, Canberra, Australia
Australian National University, Canberra, Australia
e-mail: [email protected]
J. Whelan
Environmental Justice Australia, Callaghan, Australia
© Springer International Publishing AG 2018
R. Akhtar, C. Palagiano (eds.), Climate Change and Air Pollution,Springer Climate, DOI 10.1007/978-3-319-61346-8_9
131
(Fuller et al. 2014). This tradition must have been helped, perhaps even inspired, by
the brilliance of the heavens, whose glory was little impeded by significant light on
the ground. However, a degree of particulate air pollution in Australia before
colonisation is likely to have been frequent, due to the widespread indigenous
practice of deliberately lighting fires to manage their landscape, a process today
called ‘firestick farming’ (Gammage 2011; Jones 2012).
These traditional burning practices may have reduced the megafires which have
occurred more recently in Australia (Attiwill and Adams 2013) and which have
well-documented adverse health effects (Johnston et al. 2011). Today, the brilliance
and inspiration of the night sky are invisible to many people globally, but the stars
seen from rural Australia, on the whole, are countless and comparatively bright. Air
pollution, on a continental scale in Australia, is minor, compared to Asia, due to the
continent’s vast size, small population and the overwhelming reliance on electricity
and gas for cooking. However, there are areas of Australia which have significant
health problems from dirty air, particularly in association with coal-burning power
stations, from the combustion of wood for heating during winter and from vehicular
emissions in large cities. The adverse health and financial impacts of air pollution in
Australia are significant and can and should be reduced.
When one of the authors of this chapter commenced medical school, in 1980
(in a city then notorious for industrial air pollution, by Australian standards), he was
told that the adverse health effects of air pollution were trivial. This was
misinformed, even then. London, for centuries, has been called the ‘big smoke’(Brimblecombe 2011). Major smog events in the heavily industrialised but narrow
(temperature inversion layer-susceptible) Meuse Valley, Belgium (1930); the steel
town of Donora, Pennsylvania (1948) (also in a valley); and coal fire-dependent
London (1952) had each been recognised as causing much mortality and morbidity.
In London, up to 4000 extra deaths occurred in a few days (Nemery et al. 2001).
While these three spectacular increases in mortality were quickly recognised, the
chronic health effects of air pollution have proven much harder to comprehend.
Almost everyone in air-polluted London in the 1940s was exposed to air pollution,
as in New Delhi today. Without a control population, relatively unexposed to air
pollution, chronic diseases contributed to by regularly breathing even heavily
polluted air may be regarded as ‘normal’ (Berridge and Taylor 2005).
Recognition of the harm of air pollution, including its interaction with smoking,
was also long suppressed for political reasons (Snyder 1994; Berridge 2007).
Smoke, dust, smogs, inhaled irritants and fumes have long been seen as necessary
companions of development and, in some cases, of basic heating, cooking and
transport. Relatedly, the adverse health effects of these exposures have been
downplayed, ignored and in some places suppressed.
In the last decade, however, recognition of the harm from visible forms of air
pollution has improved. In 2014 the World Health Organization (WHO) (2016)
announced that about seven million people worldwide die prematurely from air
pollution, about one in eight of total deaths, and more than double earlier estimates.
Furthermore, affordable alternatives for many processes which cause air pollution
are now emerging; this is likely to be a powerful contributor to lifting the taboo on
132 C.D. Butler and J. Whelan
the health harm of air pollution and to reducing the ‘social licence’ of polluters(Connor et al. 2009).
A Hierarchy of Air Pollutants
Considerable effort has been expended trying to identify the ‘worst’ contributors tohealth among the scores of candidate air pollution components. The pollution
episodes in the Meuse Valley and Donora were primarily a brew of industrial
toxins, including particulate matter (PM) of varying sizes, sulphur dioxide (SO2),
carbon monoxide and hydrofluoric acid. In the Belgian example, 30 different sub-
stances, released by 27 factories, were identified (Nemery et al. 2001). However, no
single worst cause was proven (or scapegoated); then and perhaps still, it may be
more realistic (and less reductionist) to consider that the health effects of air
pollution accrued from a combination of exposures, whose concentration
(in those cases, as is still sometimes true today) was greatly magnified by unusual
weather conditions. In Donora, a zinc smelter was especially criticised, but, again,
causation was eventually determined to be multifactorial, worsened (as in the
Meuse Valley) by unfavourable weather and topography (Snyder 1994).
But this does not mean that all components of air pollution are either equally
toxic or even that some are benign. Particulate matter is a complex mixture of solid
and liquid particles, suspended in air as a result of the burning of coal, gasoline,
diesel fuels and biomass such as wood (Sierra-Vargas and Teran 2012). The finest
particulate matter, less than 1 micrometre (μm) in diameter (PM1), has been
especially implicated in cardiovascular disease, as these particles are sufficiently
tiny to not only penetrate deep into the respiratory tract but cross into the blood-
stream in the alveoli, where gas exchange occurs (Martinelli et al. 2013). Larger
particulate matter (PM10) has been identified as a cause of lung cancer (Raaschou-
Nielsen et al. 2013) while ozone, carbon monoxide, nitrogen dioxide and sulphur
dioxide all worsen asthma (Ierodiakonou et al. 2016). Diesel exhausts are much
more harmful than car exhausts, containing 10–100 times the mass of particulate
matter from cars, much of which has adsorbed (adherent) organic compounds
derived from heavy carbon (Ristovski et al. 2012). In addition, some forms of air
pollution bear heavy metals, including lead, which has been conclusively shown to
impair childhood learning, above very low thresholds of exposure (McMichael
et al. 1988).
In some (or many) cases, it is likely that synergisms occur between the various
components of polluted air. Thresholds of exposure clearly exist, beyond which
additional exposure is disproportionately harmful. Further complicating the chal-
lenge to identify the most toxic elements of air pollution is the varying suscepti-
bility of populations. Even exposure to asbestos does not guarantee pathology
(Terra-Filho et al. 2015).
A holy grail for researchers could be to determine the effects of lifelong
population exposure to the various elements and combinations of air pollution,
9 Air Pollution and Climate Change in Australia: A Triple Burden 133
e.g. x years of exposure to a certain level of PM10, y years of exposure to ozone and
z years of exposure to sulphur dioxide (average and peak). Added to this difficulty
would be an estimate of the harm, acute and chronic, from numerous combinations
of pollutants. But such levels of understanding are likely to take decades to evolve
and may not be worth the effort. Meanwhile it is prudent to reduce exposure as
much as is economically and socially possible, at the same time enhancing the
resistance of exposed populations, through means such as reduced tobacco smoking
and better nutrition.
Indoor and Outdoor Air Pollution
Although the burden of disease of air pollution, including in the global burden of
disease studies (Lim et al. 2012), has long been divided into indoor (domestic or
household) and outdoor (ambient) sources, this dichotomy has been recently been
convincingly challenged. There are several reasons for this revision, particularly
that solid cooking fuel such as straw, dung and wood, used indoors, with inadequate
ventilation, is often sufficiently polluting and widespread to appreciably affect
widespread ambient air pollution levels (Smith et al. 2014).
The Triple Burden of Air Pollution in and from Australia
The most recent estimates of the burden of disease of air pollution in Australia is
low, compared to nations such as China and India (Lim et al. 2012), even on a per
capita basis. However, it is far from trivial, as several case studies will illustrate.
Air pollution in Australia (and some other countries) has a triple burden. Other
than tobacco, which is not further discussed in this chapter, the main forms of air
pollution in Australia occur via the inhalation of airborne pollutants including
particulate matter from coal dust, coal smoke and gaseous products of coal burning
such as sulphur dioxide. Also important are combustion products of biomass
burning including of wood (especially particulates); industrial emissions from
manufacturing; refineries and chemical production; motor vehicle exhausts, includ-
ing diesel fumes; and pollen. These cause direct and sometimes prolonged harm,
especially to vulnerable groups, particularly people with pre-existing disease and
the elderly. Health conditions known to be contributed to by air pollution include
respiratory diseases (e.g. asthma, chronic bronchitis and lung cancer), some car-
diovascular diseases (e.g. heart attacks and strokes), some infectious diseases and
some forms of cancer, including lung cancer and, possibly, leukaemia and others
(Colagiuri et al. 2012; Filippini et al. 2015).
The prolific per capita combustion of fossil fuels (mainly for transport and
electricity generation) and the ingestion of meat and meat products in Australia
(especially from sheep and cattle, each of which produces the greenhouse gas
134 C.D. Butler and J. Whelan
methane) mean Australians make a disproportionate contribution to human-made
climate change, which in turn is having increasingly profound adverse health
effects (Butler et al. 2016). The effects of climate change are inexorably growing
and will be far higher in the future (Butler and Harley 2010).
Climate change is a form of air pollution for several reasons. Disguising this
recognition, the main greenhouse gases (carbon dioxide (CO2), methane and
nitrous oxide) are completely invisible and odourless at atmospheric concentra-
tions. CO2 is essential for plant life and harmless to humans when inhaled, even at
levels far higher than 400 parts per million and its present level, an increase of 45%
from the pre-industrial period. Further, the harm that greenhouse gases impose on
human health is different to other forms of air pollution.
However, by altering the heat-trapping characteristics of the global atmosphere,
greenhouse gases contribute to extreme weather events, sea level rise, altered
dynamics of some infectious diseases and other events with adverse health conse-
quences. Some extreme weather events, such as drought, can contribute to migra-
tion and conflict, where significant other precursors for conflict exist (Bowles et al.
2015; Schleussner et al. 2016). A leaked copy of the fifth Intergovernmental Panel
on Climate Change (IPCC) assessment was reported as warning of hundreds of
millions people being displaced by 2100 (McCoy et al. 2014). Of interest, and
consistent with the increasingly recognised way in which authorities have long
downplayed the risk of air pollution, this warning was changed in the final report to
the much less disturbing, unquantified statement ‘climate change is projected to
increase displacement of people (medium evidence, high agreement)’ (IPCC 2014).
Recognising the potential health harm from greenhouse gas accumulation, the
US Environmental Protection Agency (2009) identified the main greenhouse gases
as air pollutants. Time will tell if this strong position survives the administration of
US President Trump (Mathiesen 2016).
The third way air pollution from Australia harms health is via its exports of fossil
fuels and of digastric (ruminant) sheep and cattle, which also make important
contributions to climate change (McMichael et al. 2007). Australians thus not
only make substantial contributions to climate change and its harm to health from
their culture but also profit from it. It is a disturbing paradox but plausible that the
burden of disease from climate change, due to these exports of greenhouse gases,
will continue to rise, even as the burden of disease from other forms of air pollution
in Australia continues to fall.
Australian Case Studies of Air Pollution
Air pollution in Australia may have a comparatively low burden of disease by
global standards, but there is increasing recognition that it imposes heavy economic
and social costs, including a national health bill of up to A$24.3B each year
(National Environment Protection Council 2014). Recent studies point to coal
9 Air Pollution and Climate Change in Australia: A Triple Burden 135
mining and coal-fired power generation as major contributors to these large and
growing costs.
Reducing air pollution concentrations has a significant health benefit. A study in
the USA found that a reduction of 10 micrograms per cubic metre (μ/m3) in the
concentration of fine particulate matter (PM2.5) explained as much as 15% of the
overall increase in life expectancy in the study areas which occurred between the
late 1970s and the early 2000s (Pope et al. 2009). This improvement followed
determined efforts in the USA to improve air quality. Similarly, legislation in
Australia has resulted in cleaner air but probably from a less polluted starting
point. In lieu of comparable national-scale studies, we discuss several categories
and case studies. Collectively, these examples illustrate that the health effects of air
pollution in Australia are far from trivial and can and should be reduced.
Industry
Australia has been free of dramatic episodes of mortality from industrial air
pollution, similar to the Meuse Valley and Donora. Pockets of industrialised air
pollution exist, some of it little contaminated by pollution from traffic or domestic
sources, due to small populations and isolation. Examples include Port Pirie, South
Australia (the world’s third largest lead-zinc smelter); Broken Hill, New South
Wales (NSW); and Mount Isa, Queensland. Contamination of surfaces with dust
containing lead and other heavy metals in these towns is still problematic, with
exposures in children likely to reduce school performance (Taylor et al. 2013,
2014). In fact, the studies which conclusively showed that lead exposure reduced
children’s abilities (with, presumably, lifelong consequences) were undertaken at
Port Pirie (McMichael et al. 1988). Despite attempts to reduce lead pollution in
these smelting towns, problems persist. While levels are lower than at their peak, in
some places they may again be worsening (Taylor et al. 2014).
Other sources of industrial air pollution include cement works, steel mills and
coal-burning thermal power stations. In response to long-standing concerns about
the health effects of air pollution near heavy industry, a cross-sectional study was
conducted in the two steel-making cities in NSW (Newcastle and Wollongong)
using data from 1993 to 1994. It found a dose-response relationship between PM10
levels and chest colds in primary school children but no relationship with SO2
exposure (Lewis et al. 1998). Each of these cities is large enough to also experience
significant traffic pollution, and in fact control groups in these studies were still
exposed to a significant level of PM10, of about 15 μg/m3. The authors commented
that the results they found provided evidence of health effects at lower levels of
outdoor air pollution in the Australian setting than was then expected. Note
however, even in 2016, that the ‘standard’ level for PM10 exposure in Australia
is 50 μg/m3 averaged over 24 h and 25 μg/m3 averaged over 1 year (NSW
Environment Protection Authority and Office of Environment and Heritage 2016).
136 C.D. Butler and J. Whelan
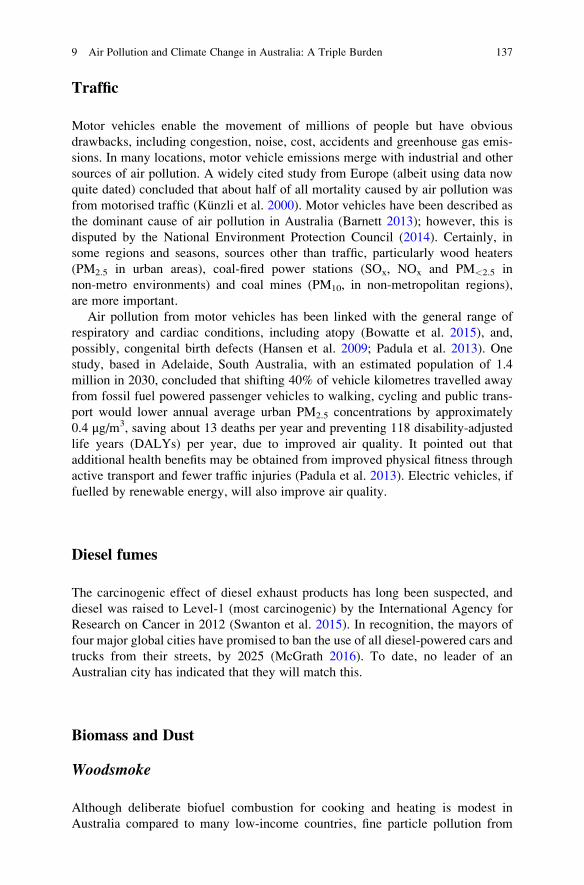
Traffic
Motor vehicles enable the movement of millions of people but have obvious
drawbacks, including congestion, noise, cost, accidents and greenhouse gas emis-
sions. In many locations, motor vehicle emissions merge with industrial and other
sources of air pollution. A widely cited study from Europe (albeit using data now
quite dated) concluded that about half of all mortality caused by air pollution was
from motorised traffic (Künzli et al. 2000). Motor vehicles have been described as
the dominant cause of air pollution in Australia (Barnett 2013); however, this is
disputed by the National Environment Protection Council (2014). Certainly, in
some regions and seasons, sources other than traffic, particularly wood heaters
(PM2.5 in urban areas), coal-fired power stations (SOx, NOx and PM<2.5 in
non-metro environments) and coal mines (PM10, in non-metropolitan regions),
are more important.
Air pollution from motor vehicles has been linked with the general range of
respiratory and cardiac conditions, including atopy (Bowatte et al. 2015), and,
possibly, congenital birth defects (Hansen et al. 2009; Padula et al. 2013). One
study, based in Adelaide, South Australia, with an estimated population of 1.4
million in 2030, concluded that shifting 40% of vehicle kilometres travelled away
from fossil fuel powered passenger vehicles to walking, cycling and public trans-
port would lower annual average urban PM2.5 concentrations by approximately
0.4 μg/m3, saving about 13 deaths per year and preventing 118 disability-adjusted
life years (DALYs) per year, due to improved air quality. It pointed out that
additional health benefits may be obtained from improved physical fitness through
active transport and fewer traffic injuries (Padula et al. 2013). Electric vehicles, if
fuelled by renewable energy, will also improve air quality.
Diesel fumes
The carcinogenic effect of diesel exhaust products has long been suspected, and
diesel was raised to Level-1 (most carcinogenic) by the International Agency for
Research on Cancer in 2012 (Swanton et al. 2015). In recognition, the mayors of
four major global cities have promised to ban the use of all diesel-powered cars and
trucks from their streets, by 2025 (McGrath 2016). To date, no leader of an
Australian city has indicated that they will match this.
Biomass and Dust
Woodsmoke
Although deliberate biofuel combustion for cooking and heating is modest in
Australia compared to many low-income countries, fine particle pollution from
9 Air Pollution and Climate Change in Australia: A Triple Burden 137
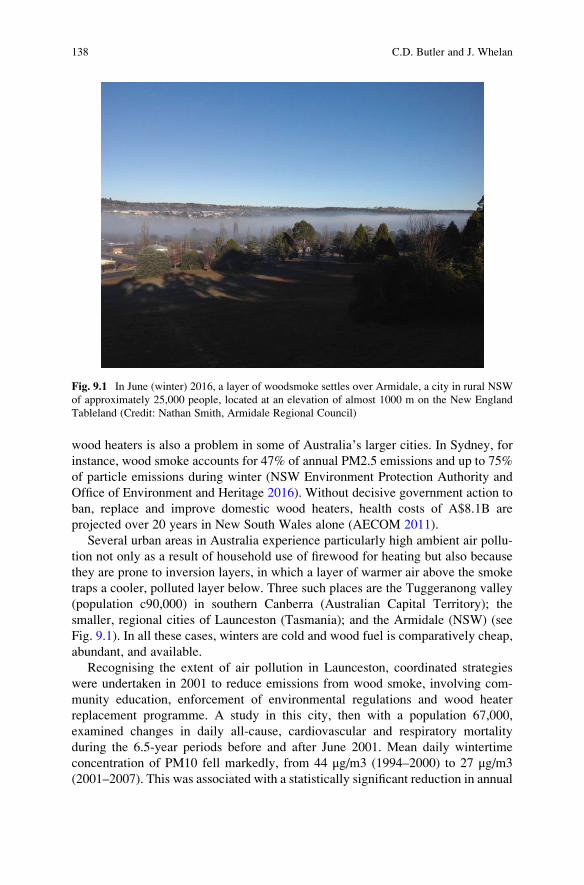
wood heaters is also a problem in some of Australia’s larger cities. In Sydney, for
instance, wood smoke accounts for 47% of annual PM2.5 emissions and up to 75%
of particle emissions during winter (NSW Environment Protection Authority and
Office of Environment and Heritage 2016). Without decisive government action to
ban, replace and improve domestic wood heaters, health costs of A$8.1B are
projected over 20 years in New South Wales alone (AECOM 2011).
Several urban areas in Australia experience particularly high ambient air pollu-
tion not only as a result of household use of firewood for heating but also because
they are prone to inversion layers, in which a layer of warmer air above the smoke
traps a cooler, polluted layer below. Three such places are the Tuggeranong valley
(population c90,000) in southern Canberra (Australian Capital Territory); the
smaller, regional cities of Launceston (Tasmania); and the Armidale (NSW) (see
Fig. 9.1). In all these cases, winters are cold and wood fuel is comparatively cheap,
abundant, and available.
Recognising the extent of air pollution in Launceston, coordinated strategies
were undertaken in 2001 to reduce emissions from wood smoke, involving com-
munity education, enforcement of environmental regulations and wood heater
replacement programme. A study in this city, then with a population 67,000,
examined changes in daily all-cause, cardiovascular and respiratory mortality
during the 6.5-year periods before and after June 2001. Mean daily wintertime
concentration of PM10 fell markedly, from 44 μg/m3 (1994–2000) to 27 μg/m3
(2001–2007). This was associated with a statistically significant reduction in annual
Fig. 9.1 In June (winter) 2016, a layer of woodsmoke settles over Armidale, a city in rural NSW
of approximately 25,000 people, located at an elevation of almost 1000 m on the New England
Tableland (Credit: Nathan Smith, Armidale Regional Council)
138 C.D. Butler and J. Whelan
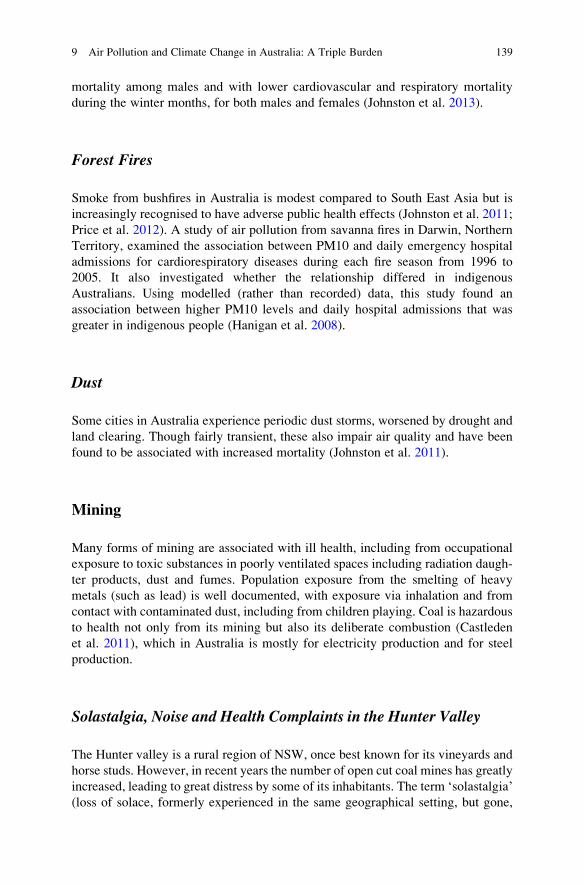
mortality among males and with lower cardiovascular and respiratory mortality
during the winter months, for both males and females (Johnston et al. 2013).
Forest Fires
Smoke from bushfires in Australia is modest compared to South East Asia but is
increasingly recognised to have adverse public health effects (Johnston et al. 2011;
Price et al. 2012). A study of air pollution from savanna fires in Darwin, Northern
Territory, examined the association between PM10 and daily emergency hospital
admissions for cardiorespiratory diseases during each fire season from 1996 to
2005. It also investigated whether the relationship differed in indigenous
Australians. Using modelled (rather than recorded) data, this study found an
association between higher PM10 levels and daily hospital admissions that was
greater in indigenous people (Hanigan et al. 2008).
Dust
Some cities in Australia experience periodic dust storms, worsened by drought and
land clearing. Though fairly transient, these also impair air quality and have been
found to be associated with increased mortality (Johnston et al. 2011).
Mining
Many forms of mining are associated with ill health, including from occupational
exposure to toxic substances in poorly ventilated spaces including radiation daugh-
ter products, dust and fumes. Population exposure from the smelting of heavy
metals (such as lead) is well documented, with exposure via inhalation and from
contact with contaminated dust, including from children playing. Coal is hazardous
to health not only from its mining but also its deliberate combustion (Castleden
et al. 2011), which in Australia is mostly for electricity production and for steel
production.
Solastalgia, Noise and Health Complaints in the Hunter Valley
The Hunter valley is a rural region of NSW, once best known for its vineyards and
horse studs. However, in recent years the number of open cut coal mines has greatly
increased, leading to great distress by some of its inhabitants. The term ‘solastalgia’(loss of solace, formerly experienced in the same geographical setting, but gone,
9 Air Pollution and Climate Change in Australia: A Triple Burden 139
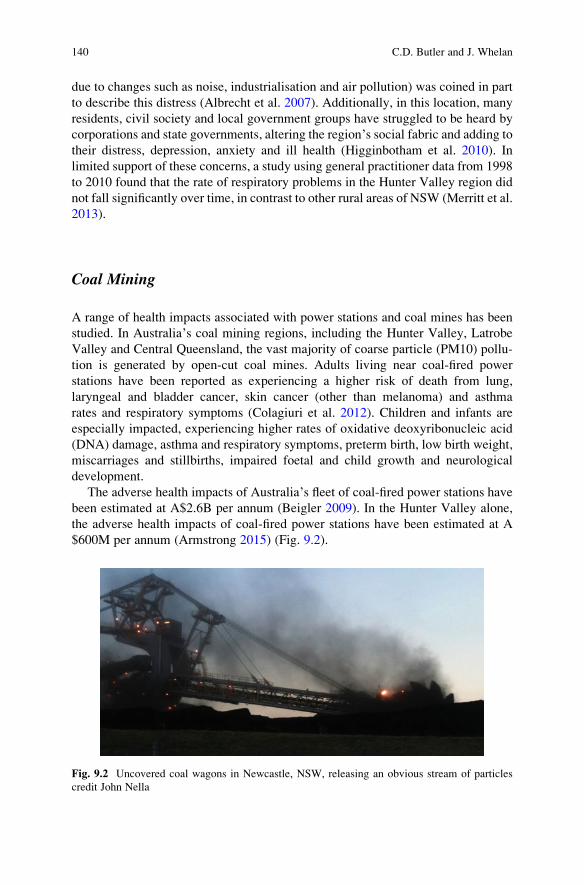
due to changes such as noise, industrialisation and air pollution) was coined in part
to describe this distress (Albrecht et al. 2007). Additionally, in this location, many
residents, civil society and local government groups have struggled to be heard by
corporations and state governments, altering the region’s social fabric and adding totheir distress, depression, anxiety and ill health (Higginbotham et al. 2010). In
limited support of these concerns, a study using general practitioner data from 1998
to 2010 found that the rate of respiratory problems in the Hunter Valley region did
not fall significantly over time, in contrast to other rural areas of NSW (Merritt et al.
2013).
Coal Mining
A range of health impacts associated with power stations and coal mines has been
studied. In Australia’s coal mining regions, including the Hunter Valley, Latrobe
Valley and Central Queensland, the vast majority of coarse particle (PM10) pollu-
tion is generated by open-cut coal mines. Adults living near coal-fired power
stations have been reported as experiencing a higher risk of death from lung,
laryngeal and bladder cancer, skin cancer (other than melanoma) and asthma
rates and respiratory symptoms (Colagiuri et al. 2012). Children and infants are
especially impacted, experiencing higher rates of oxidative deoxyribonucleic acid
(DNA) damage, asthma and respiratory symptoms, preterm birth, low birth weight,
miscarriages and stillbirths, impaired foetal and child growth and neurological
development.
The adverse health impacts of Australia’s fleet of coal-fired power stations havebeen estimated at A$2.6B per annum (Beigler 2009). In the Hunter Valley alone,
the adverse health impacts of coal-fired power stations have been estimated at A
$600M per annum (Armstrong 2015) (Fig. 9.2).
Fig. 9.2 Uncovered coal wagons in Newcastle, NSW, releasing an obvious stream of particles
credit John Nella
140 C.D. Butler and J. Whelan
The Morwell Coal Mine Fire
In early 2014, a fire burned for 45 days in the Hazelwood open-cut coal mine in the
industrialised Latrobe Valley of Victoria started by an adjacent bushfire. This
triggered one of the worst short-term episodes of air pollution in Australian history.
Several communities were affected by smoke, particularly the township of
Morwell, with a population of about 15,000, located less than a kilometre from
the fire. The concentration of smoke contaminants was regularly monitored in
several locations, by the Environment Protection Authority of Victoria, including
in South Morwell (Reisen et al. 2016). The level of PM2.5 briefly peaked at over
700 μg/m3, 32 times the reporting standard of 25 μg/m3 averaged over 24 h (Fisher
et al. 2015). Despite this, no one was compulsorily evacuated from Morwell nor
even strongly advised to leave. Limited monitoring of the affected population is
now being undertaken (Fisher et al. 2015). A Victorian Government inquiry into the
mine fire concluded that there was a high probability that air pollution contributed
to an increase in mortality during the fire and that the fire harmed the health of many
in this community.
Black Lung in Australian Miners
Pneumoconiosis (‘black lung’) is a well-known occupational hazard for coal
miners, occurring from overexposure to coal dust, first described in the seventeenth
century. In Australia, however, which requires compulsory participation by miners
in X-ray screening programs, no cases were reported for over 30 years, until
recently (Cohen 2016). This was though due to better dust control in mines, a
study from 2002 reported that, in 6.9% of measurements, dust exposure in
33 longwall coalmines in NSW exceeded the Australian National Standard
(Castleden et al. 2011). A more recent audit of underground coal mines in Queens-
land found that an increasing number of workers are exposed to harmful concen-
trations of respirable dust, well above regulatory limits (Commissioner for Mine
Safety and Health 2015). The reappearance of pneumoconiosis is thus perhaps not
surprising, but what was surprising was that precautionary X-rays in miners were
misread over a long period, thus contributing to complacency (Cohen 2016).
Air Pollution, Urban Forests and Pollens
Increasing the number of trees in urban areas has long been suggested as a means to
reduce air pollution and lower the heat island effect (Benjamin et al. 1996). Trees
reduce the quantity of particulate matter, by making available a large surface area of
bark and leaves (especially of evergreens or in spring to autumn) on which gases
9 Air Pollution and Climate Change in Australia: A Triple Burden 141
and particles can be deposited. They can also help decompose some air pollutants,
including ozone, by releasing gases (Grote et al. 2016).
However, some trees have a significant ‘ozone-forming potential’ (Grote et al.
2016), with some species reported to have up to four orders of magnitude more
capacity to release photochemically reactive hydrocarbons than others (Benjamin
et al. 1996). Eucalyptus trees, which are well known for producing a blue haze in
some settings (hence the ‘Blue Mountains’, near Sydney, NSW), may have a
significant effect in Australian settings on air pollution, by their release of hydro-
carbons that may contribute to smog, but the net effect of this appears understudied.
An increased urban forest, planted to improve air quality, might also elevate the risk
of urban bushfires.
Some tree species also have significant quantities of wind-dispersed pollen,
allergens, which can cause severe distress in vulnerable people, including asthma
and possibly mood changes. For example, there are credible claims that exposure to
allergens is a factor underpinning the long observed rise in suicides in spring
(Kõlves et al. 2015). Grass pollens, however, may be more problematic than from
trees, including in thunderstorm asthma (D’Amato et al. 2007). A study in Darwin
found an association between Poaceae grass pollen and the sale of antihistamine
medication (Johnston et al. 2009).
Climate Change and Health in Australia
The health effects of climate change in Australia include primary (direct, compar-
atively obvious) effects such as from climate change-exacerbated heatwaves,
droughts, fires and floods; secondary (less obvious, indirect) including changes in
allergens and atopic diseases and infectious diseases and rising food prices and
impaired nutrition; and tertiary (highly indirect, catastrophic), including regional
war and mass migration (Butler and Harley 2010).
Primary Health Effects
Already, extreme events, contributed to by climate change, are increasing in
Australia. Although the death toll of rural suicide from droughts in Australia has
recently declined (probably due to better intervention) (Hanigan et al. 2012), this
improvement may not last; living with chronic depression due to loss of livelihood
and other trauma (e.g. being forced to shoot suffering stock) is still likely to be high,
as is the health toll from exposure to floods and, sometimes, resultant displacement.
Prolonged, extreme heat in Australia is also documented to cause excessive deaths
and morbidity, particularly in vulnerable sub-groups (Nitschke et al. 2011).
142 C.D. Butler and J. Whelan
Secondary Health Effects
As this chapter was being finalised, the population of the Victorian state capital,
Melbourne, experienced the worst episode of ‘thunderstorm asthma’ to ever occur
in Australia. This caused the premature death of at least eight people, most or all of
whom were comparatively young (Calligeros et al. 2016). Thousands were
hospitalised and overwhelmed emergency services, including by generating ambu-
lance calls every 4.5 s. This was contributed to by a wet spring, humidity and a hot
day in late spring (Calligeros et al. 2016). It is plausible that climate change may
make such episodes more frequent. The major source of the allergens involved in
this appears to be rye grass, rather than tree pollen.
The pattern of some infectious diseases in Australia, including Ross River virus
and dengue fever, is also likely to be subtly altered by climate change (Williams
et al. 2016). There are many other examples, such as melioidosis and leptospirosis
(Currie 2001). However, an increase in mortality from altered infectious diseases
epidemiology is unlikely to be marked.
Tertiary Health Effects
Australia is a very wealthy country, though the distribution of health and other
forms of security is increasingly unequal. The most dire health effects of climate
change are likely to be long avoided in Australia; however, the country is already
subtly affected by conflict in the Middle East, Afghanistan and parts of sub-Saharan
Africa. Some of this turmoil (which also has led to the current global refugee crisis)
can be attributed to climate change, interacting with social factors, including
poverty, poor governance, discrimination and limits to growth (Bowles et al.
2015; Butler 2016; Schleussner et al. 2016).
The Australian government, with wide public support, has practised human
rights abuses of asylum seekers for well over a decade (Newman et al. 2013). A
possible explanation for this behaviour is fear, rather than overt cruelty. That is,
most Australians may support a strong ‘fend’ (deterrence) signal to asylum seekers
because they wish to prevent additional refugees seeking protection in Australia, a
rich country widely perceived as underpopulated. Unfortunately, however,
Australia, by cutting its foreign aid, and by aggressively exporting products that
contribute to climate change, is continually seeding conditions likely to increase
refugee numbers, including in countries in its region. As sea level rise and other
manifestations of climate change worsen in poor, ‘developing’ countries in South
Asia (Singh et al. 2016) and the Pacific, the number of people seeking refuge in
Australia is likely to climb steeply.
9 Air Pollution and Climate Change in Australia: A Triple Burden 143
Towards Solutions
Industry and Weak Legislation
In Australia, state and national air pollution laws provide few opportunities for
impacted communities to seek a legal remedy. National air pollution standards are
determined by Australia’s nine1 environment ministers, meeting as the National
Environment Protection Council, yet are governed by state and territory laws. The
Council’s decision-making has been described as taking a ‘lowest common denom-
inator’ approach, resulting in standards that reflect the position of the state or
territory least inclined to regulate polluters. But even these low standards are not
always met; each jurisdiction adopts a different approach, drawing from a regula-
tory toolbox that includes consent conditions for major polluters, environmental
pollution licences, pollution monitoring, auditing, annual reports and various com-
pliance mechanisms. In sharp contrast, in the USA, the US Environment Protection
Authority has the power to impose sanctions on states that fail to comply with air
pollution standards, which are set centrally.
In Australia, prosecutions for breaching licences or causing environmental harm
from air pollution are infrequent, fall far short of the real costs of the harm caused
and are generally inadequate to compel companies to invest in pollution control.
Consequently, air pollution-impacted communities in Australia look to the regula-
tory systems in other countries for models that may be effective here.
Community Action and Organising
Air pollution consistently ranks highly among environmental concerns, particularly
in communities that experience elevated levels of pollution due to specific local or
regional sources. The weak legal and regulatory framework for air pollution control
in Australia described above, coupled with increasing air pollution levels, leads
citizens to initiate and participate in various forms of community action.
The starting point for many people is a desire to know as much as possible about
what they’re breathing. Residents in polluted communities assert their ‘right toknow’ by phoning pollution hotlines, approaching polluters directly and accessing
government websites and reports for monitoring data. Although state and territory
governments conduct air pollution monitoring in many locations, few provide ready
access to the data they collect, and there are significant ‘black spots’: regions thatexperience high levels of pollution but where governments permit and tolerate self-
monitoring by industry but with no public access to these data. In the vast coalfields
of Central Queensland, for instance, there is no government or independent
1Six state, two territorial and one federal.
144 C.D. Butler and J. Whelan
monitoring for more than a million square kilometres, and community members
have no legal right to access industry monitoring data. The power generators in the
Latrobe Valley have, for years, monitored local pollution, free of any obligation to
share their results.
In response to this suppression of information, community members have
sometimes turned to citizen science. In the Hunter Valley, North West New
South Wales and South East Queensland, community members have documented
an increase in air pollution concentrations as coal train pass, confirming their long-
held concerns.
Community members value and participate actively in dialogue with industry
and regulators. In the Hunter Valley and other industrialised regions, there are
community consultative committees for most major polluting facilities. These
‘CCCs’ create a forum for community members to air concerns, seek information
and articulate their expectations. Alas, in the authors’ experience, they to date rarelyachieve tangible pollution reduction outcomes. Information flow is primarily
one-way, that is, neither industry nor government is very responsive.
The right to know, access to reliable data and dialogue are important but not
substitute for demonstrable pollution control and reduction. Too frequently, gov-
ernment regulators are seen to be ‘captured’ by polluting industries and unwilling toexercise their full statutory powers to protect polluted communities. When ‘polite’mechanisms fail, as they often do, citizens need to reply on a more ‘activist’ suite oftools that include media commentary, parliamentary politics, legal action and
protest.
Conclusion: Low-Hanging Fruit: Immediate Co-benefitsfor Health and Climate Change
Enough is known about the sources and impacts of air pollution to enable the
development of air pollution control plans for our major cities and other polluted
regions. Pollution hotspots including the Newcastle, Gladstone, coalfields of New
South Wales and Queensland and Hunter and Latrobe Valleys should have action
plans that incorporate ‘best practice’ air pollution reduction strategies that have
worked elsewhere, monitoring and evaluating arrangements to facilitate adaptive
management and active community involvement.
The catalogue of ‘no regrets’ pollution control action that have worked in other
countries includes introducing strict emission standards for power stations and
motor vehicles, implementing a rapid and just transition from coal-fired power
generation to renewable energy, banning new wood heaters and replacing existing
ones, covering and washing coal trains, enclosing coal stockpiles and facilitating
the uptake of electric vehicles.
Polluters and regulators need to be much more transparent and more account-
able. This requires a change in political will and almost certainly necessitates a
9 Air Pollution and Climate Change in Australia: A Triple Burden 145
strong national approach to air poll. Leaving states to adopt diverse approaches to
air pollution, management and regulation has failed to curb air pollution in
Australia. The health benefits of controlling air pollution in Australia warrant a
much stronger approach. There also needs to be a much greater appreciation of the
health and economic costs of air pollution and climate change. It is enormously
misleading to claim that coal-fired electricity is ‘cheap’. Coal mining, coal com-
bustion and coal export cause significant health costs, in the past, present and future.
Furthermore, the price of alternatives such as wind and solar continues to fall.
Reducing emissions from the burning of wood and the combustion of vehicular fuel
is more challenging, but much can also be accomplished in these spheres too,
including electric vehicles, public transport and, in the foreseeable future, domestic
production and consumption of solar energy, incorporating batteries.
References
AECOM (2011) Wood smoke control measures: cost benefit analysis Prepared for the NSW
Environment Protection Authority, Sydney. http://www.epa.nsw.gov.au/resources/air/
WoodsmokeControlReport.pdf
Albrecht G, Sartore G-M, Connor L et al (2007) Solastalgia: the distress caused by environmental
change. Australas Psychiatry 15(1):S95–S98
Armstrong F (2015) Coal and health in the Hunter: lessons from one valley for the world, Climate
and Health Alliance caha.org.au/wp-content/.../Climate-and-Health-Alliance_Report_Layout_
PRINTv2.pdf. 16 Dec 2016
Attiwill PM, Adams MA (2013) Mega-fires, inquiries and politics in the eucalypt forests of
Victoria, south-eastern Australia. For Ecol Manag 294:45–53
Barnett AG (2013) Time for action on air pollution. Med J Aust. https://www.mja.com.au/careers/
199/199/time-action-air-pollution
Beigler T (2009) The hidden costs of electricity: externalities of power generation in Australia,
report for Australian Academy of Technological Sciences and Engineering, Parkville, avail-
able at http://www.atse.org.au/Documents/Publications/Reports/Energy/ATSE%20Hidden%
20Costs%20Electricity%202009.pdf
Benjamin MT, Sudol M, Bloch L et al (1996) Low-emitting urban forests: a taxonomic method-
ology for assigning isoprene and monoterpene emission rates. Atmos Environ 30
(9):1437–1452
Berridge V (2007) Medicine and the public: the 1962 report of the Royal College of Physicians and
the new public health. Bull Hist Med 81(1):286–311
Berridge V, Taylor S (2005) The big smoke: fifty years after the 1952 London Smog. Centre for
History in Public Health London School of Hygiene & Tropical Medicine, London, p 42
Bowatte G, Lodge C, Lowe AJ et al (2015) The influence of childhood traffic-related air pollution
exposure on asthma, allergy and sensitization: a systematic review and a meta-analysis of birth
cohort studies. Allergy 70(3):245–256
Bowles DC, Butler CD, Morisetti N (2015) Climate change, conflict, and health. J R Soc Med 108
(10):390–395
Brimblecombe P (2011) The big smoke: a history of air pollution in London since Medieval Times
(Routledge Revival Edition). Routledge, Abingdon
Butler CD (2016) Planetary overload, limits to growth and health. Curr Environ Health Rep 3
(4):360–369
146 C.D. Butler and J. Whelan
Butler CD, Harley D (2010) Primary, secondary and tertiary effects of the eco-climate crisis: the
medical response. Postgrad Med J 86:230–234
Butler CD, Hales S, Beggs PJ et al (2016) From Paris towards 1.5 degrees C. In: Butler CD
(ed) Climate change and global health. CABI, Wallingford, pp 293–305
Calligeros M, Dow A, Donelly B (2016) Thunderstorm asthma: three people critical, 8500 treated
in Melbourne hospitals. The Age. http://www.theage.com.au/victoria/thunderstorm-asthma-
three-people-critical-8500-treated-in-melbournehospitals-20161124-gswkdb.html. Accessed
22 July 2017
Castleden WM, Shearman D, Crisp G et al (2011) The mining and burning of coal: effects on
health and the environment. Med J Aust 195(6):333–335
Cohen RA (2016) Resurgent coal mine dust lung disease: wave of the future or a relic of the past?
Occup Environ Med 73:715–716
Colagiuri R, Cochrane J, Girgis S (2012) Health and social harms of coal mining in local
communities. Report for Beyond Zero Emissions (Australia). https://sydney.edu.au/medi
cine/.../PDF_Mining_Report_FINAL_October_2012.pdf. Accessed 22 July 2017
Commissioner for Mine Safety and Health, Q. G (2015) Queensland mines inspectorate annual
performance report 2014–15
Connor L, Freeman S, Higginbotham N (2009) Not just a calamine: shifting grounds of community
opposition to coal mining in Southeastern Australia. Ethnos 74(4):490–513
Currie BJ (2001) Environmental change, global warming and infectious diseases in Northern
Australia. Environ Health 1(4):35–44
D’Amato G, Liccardi G, Frenguelli G (2007) Thunderstorm-asthma and pollen allergy. Allergy 62
(1):11–16
Environmental Protection Agency (2009). Greenhouse gases threaten public health and the environ-
ment. https://yosemite.epa.gov/opa/admpress.nsf/0/08D11A451131BCA585257685005BF252.
Accessed 23rd Nov 2016
Filippini T, Heck JE, Malagoli C et al (2015) A review and meta-analysis of outdoor air pollution
and risk of childhood leukemia. J Environ Sci Health C 33(1):36–66
Fisher G, Torre P, Marshall A (2015) Hazelwood open-cut coal mine fire. Air Qual Clim Chang 49(1)
Fuller RS, Trudgett M, Norris RP et al (2014) Star maps and travelling to ceremonies: the Euahlayi
people and their use of the night sky. J Astron Hist Herit 17(2):149–160
Gammage B (2011) The biggest estate on earth: how aborigines made Australia. Sydney, Allen
and Unwin
Grote R, Samson R, Alonso R et al (2016) Functional traits of urban trees: air pollution mitigation
potential. Front Ecol Environ 14(10):543–550
Hanigan IC, Johnston FH, Morgan GG (2008) Vegetation fire smoke, indigenous status and cardio
respiratory hospital admissions in Darwin, Australia, 1996–2005: a time-series study. Environ
Health 7:42
Hanigan IC, Butler CD, Kokic PN et al (2012) Suicide and drought in new South Wales, Australia,
1970–2007. Proc Natl Acad Sci USA 109(35):13950–13955
Hansen CA, Barnett AG, Jalaludin BB et al (2009) Ambient air pollution and birth defects in
Brisbane, Australia. PLoS One 4(4):e5408
Higginbotham N, Freeman S, Connor L et al (2010) Environmental injustice and air pollution in
coal affected communities, Hunter Valley, Australia. Health Place 16(2):259–266
Ierodiakonou D, Zanobetti A, Coull BA et al (2016) Ambient air pollution, lung function, and
airway responsiveness in asthmatic children. J Allergy Clin Immunol 137(2):390–399
IPCC (2014) Summary for policymakers. Climate change 2013: the physical science basis:
working group I contribution to the fifth assessment report of the intergovernmental panel on
climate change. In: Stocker TF, Qin D, Plattner GK et al. (eds). Cambridge University Press,
Cambridge, pp 3–32
Johnston F, Hanigan I, Bowman D (2009) Pollen loads and allergic rhinitis in Darwin, Australia: a
potential health outcome of the grass-fire cycle. EcoHealth 6(1):99–108
9 Air Pollution and Climate Change in Australia: A Triple Burden 147
Johnston F, Hanigan I, Henderson S et al (2011) Extreme air pollution events from bushfires and
dust storms and their association with mortality in Sydney, Australia 1994–2007. Environ Res
111:811–816
Johnston FH, Hanigan IC, Henderson SB et al (2013) Evaluation of interventions to reduce air
pollution from biomass smoke on mortality in Launceston, Australia: retrospective analysis of
daily mortality, 1994–2007. BMJ 346:e8446
Jones R (2012) Fire-stick farming. Fire Ecol 8(3):3–8. [Reprinted from Australian Natural History
16(17): 224-228 (1969)].
Kõlves K, Barker E, De Leo D (2015) Allergies and suicidal behaviors: a systematic literature
review. Allergy Asthma Proc 36(6):433–438
Künzli N, Kaiser R, Medina S et al (2000) Public-health impact of outdoor and traffic-related air
pollution: a European assessment. Lancet 356(9232):795–801
Lewis PR, Hensley MJ, Wlodarczyk J et al (1998) Outdoor air pollution and children’s respiratorysymptoms in the steel cities of New South Wales. Med J Aust 169:459–463
Lim SS, Vos T, Flaxman AD et al (2012) A comparative risk assessment of burden of disease and
injury attributable to 67 risk factors and risk factor clusters in 21 regions, 1990–2013: a
systematic analysis for the Global Burden of Disease Study 2010. Lancet 380
(9859):2224–2260
Martinelli N, Olivieri O, Girelli D (2013) Air particulate matter and cardiovascular disease: a
narrative review. Eur J Intern Med 24(4):295–302
Mathiesen K (2016) Polar opposites in US election. Nat Clim Chang 6(11):979–981
McCoy D, Montgomery H, Arulkumaran S et al (2014) Climate change and human survival. BMJ
348:g2351. doi:2310.1136/bmj.g2351
McGrath M (2016) Four major cities move to ban diesel vehicles by 2025. BBC news. http://www.
bbc.com/news/science-environment-38170794
McMichael AJ, Baghurst PA, Wigg NR et al (1988) Port Pirie cohort study: environmental
exposure to lead and children’s abilities at the age of four years. N Engl J Med 319(8):468–475
McMichael AJ, Powles J, Butler CD et al (2007) Food, livestock production, energy, climate
change and health. Lancet 370:1253–1263
Merritt TD, Cretikos MA, Smith W et al (2013) The health of Hunter Valley communities in
proximity to coal mining and power generation, general practice data, 1998–2010. N S W
Public Health Bull 24(2):57–64
National Environment Protection Council (2014) Draft variation to the National Environment
Protection (Ambient Air Quality) measure: impact statement. https://www.environment.gov.
au/protection/nepc/nepms/ambient-air-quality/variation-2014/impact-statement. Accessed 16
Dec 2016
Nemery B, Hoet PHM, Nemmar A (2001) The Meuse Valley fog of 1930: an air pollution disaster.
Lancet 357(9257):704–708
Newman L, Proctor N, Dudley M (2013) Seeking asylum in Australia: immigration detention,
human rights and mental health care. Australas Psychiatry 21(4):315–320
Nitschke M, Tucker GR, Hansen AL et al (2011) Impact of two recent extreme heat episodes on
morbidity and mortality in Adelaide, South Australia: a case-series analysis. Environ Health 10
(1):42
NSW Environment Protection Authority and Office of Environment and Heritage (2016). Clean air
for NSW http://www.epa.nsw.gov.au/air/clean-air-nsw.htm
Padula AM, Tager IB, Carmichael SL et al (2013) Ambient air pollution and traffic exposures and
congenital heart defects in the San Joaquin valley of California. Paediatr Perinat Epidemiol 27
(4):329–339
Pope CA, Ezzati M, Dockery DW (2009) Fine-particulate air pollution and life expectancy in the
United States. N Engl J Med 360:376–386
Price OF, Williamson GJ, Henderson SB et al (2012) The relationship between particulate
pollution levels in Australian cities, meteorology, and landscape fire activity detected from
MODIS hotspots. PLoS One 7(10):e47327
148 C.D. Butler and J. Whelan
Raaschou-Nielsen O, Andersen ZJ, Beelen R et al (2013) Air pollution and lung cancer incidence
in 17 European cohorts: prospective analyses from the European Study of Cohorts for Air
Pollution Effects (ESCAPE). Lancet Oncol 14(9):813–822
Reisen F, Fisher G, Torre P et al (2016) Analysis of air quality during the Hazelwood mine fire.
CSIRO, Canberra. CSIRO (hazelwoodhealthstudy.org.au)
Ristovski ZD, Miljevic B, Surawski NC et al (2012) Respiratory health effects of diesel particulate
matter. Respirology 17(2):201–212
Schleussner C-F, Donges JF, Donner RV et al (2016) Armed-conflict risks enhanced by climate-
related disasters in ethnically fractionalized countries. Proc Natl Acad Sci 113(33):9216–9221
Sierra-Vargas MP, Teran LM (2012) Air pollution: impact and prevention. Respirology 17
(7):1031–1038
Singh M, Rao M, B. C.D. (2016) Climate change, health and future well-being in South Asia. In:
Akhtar R (ed) Climate change and human health scenario in south and Southeast Asia.
Springer, The Netherlands, pp 11–27
Smith KR, Bruce N, Balakrishnan K et al (2014) Millions dead: how do we know and what does it
mean? Methods used in the comparative risk assessment of household air pollution. Annu Rev
Public Health 35(1):185–206
Snyder LP (1994) “The death-dealing smog over Donora, Pennsylvania”: industrial air pollution,
public health policy, and the politics of expertise, 1948–1949. Environ Hist Rev 18(1):117–139
Swanton C, Boffetta P, Peston R et al (2015) Environmental emissions, public health and lung
cancer risk. Ann Oncol 27:211–212
Taylor MP, Camenzuli D, Kristensen LJ et al (2013) Environmental lead exposure risks associated
with children’s outdoor playgrounds. Environ Pollut 178:447–454
Taylor MP, Mould SA, Kristensen LJ et al (2014) Environmental arsenic, cadmium and lead dust
emissions from metal mine operations: implications for environmental management, monitor-
ing and human health. Environ Res 135:296–303
Terra-Filho M, Bagatin E, Nery LE et al (2015) Screening of miners and millers at decreasing
levels of asbestos exposure: comparison of chest radiography and thin-section computed
tomography. PLoS One 10(3):e0118585
Williams CR, Mincham G, Faddy H et al (2016) Projections of increased and decreased dengue
incidence under climate change. Epidemiol Infect 144(14):3091–3100
World Health Organization (2016) 7 million premature deaths annually linked to air pollution.
http://www.who.int/mediacentre/news/releases/2014/air-pollution/en/. Accessed 23 Nov 2016
Colin D. Butler is an adjunct professor of public health at the University of Canberra, Australia,
and co-founder of the NGO BODHI Australia. He is founding co-chair of Health Earth and lead
author for the section on health in the forthcoming flagship Global Environmental Outlook report
of the United Nations Environment Programme, called Healthy Planet, Healthy People.
Dr. James Whelan is a researcher and community organiser with Environmental Justice Austra-
lia. James has been a non-government advocate on air quality issues since the mid-1990s. He
represented environment groups in the development of the National Environment Protection
Measures for Ambient Air Quality and the National Pollutant Inventory and has been a member
of several advisory groups overseeing air quality management strategies and regulations.
9 Air Pollution and Climate Change in Australia: A Triple Burden 149
Chapter 10
Epidemiological Consequences of ClimateChange (with Special Reference to Malariain Russia)
Svetlana M. Malkhazova, Natalia V. Shartova, and Varvara A. Mironova
Abstract Climatic conditions play a major role among natural factors determining
human’s existence. The factor of climate change is considered among other known
risk factors to population health. In particular, climate leads to the changes in
borders and structure of the areas of infectious and parasitic illnesses. The most
serious climate changes are expected in mid- to high latitudes, especially in cities,
where anthropogenic activity and air pollution cause exacerbating effect. Within
the framework of this study, we try to elaborate a prognostic model of epidemio-
logical conditions of the vivax malaria for the territory of the European part of
Russia and Western Siberia. Forecasting was based on the results of climate
modeling CMIP3 project under the “A2” IPCC scenario. As a result of forecasting,
it is revealed that in the future (2046–2065), favorability of climatic conditions for
malaria transmission will increase. The most remarkable changes are expected in
the areas situated near southern limits of the considered territories.
Keywords Climate change • Malaria • Modeling • Prognosis • Epidemiological
consequences • Russia
Introduction
Nowadays, climate change is considered along with other risk factors jeopardizing
public health – environment pollution (including air and water pollution due to the
presence in these body pollutants reducing air and water quality enough to threaten
the health of people, soil pollution, residential solid waste, etc.), decrease of soil
S.M. Malkhazova (*) • V.A. Mironova
Department of Biogeography, Faculty of Geography, Lomonosov Moscow State University,
Moscow, Russia
e-mail: [email protected]; [email protected]
N.V. Shartova
Department of Landscape Geochemistry and Soil Geography, Faculty of Geography,
Lomonosov Moscow State University, Moscow, Russia
e-mail: [email protected]
© Springer International Publishing AG 2018
R. Akhtar, C. Palagiano (eds.), Climate Change and Air Pollution,Springer Climate, DOI 10.1007/978-3-319-61346-8_10
151
fertility, food shortage in low-income countries, deterioration in drinking water
quality, etc.
Over the last few decades, the warmest years on record have been registered. The
increase in global temperatures of the earth and the northern and the southern
hemispheres in relation to the period 1891–1900 reached 1.08, 1.30, and 0.87 �С,respectively, in 2015, exceeding the level of 1 �С for the first time (Rosgidromet/
RAN 2015). The most serious climate changes are expected in mid- to high
latitudes, especially in cities, where anthropogenic activity and environment con-
tamination (including air pollution) cause exacerbating effect. As a result, the
increase of migration flows is possible due to an influx of people to areas with
more favorable climate conditions. Overpopulation and excessive urbanization and
insufficient public medical care may result in the resurgence of some infectious
diseases and epidemic outbreaks (Malkhazova 2006).
Climate Change and Infectious Diseases
Since ancient times, it has been well known that climatic conditions play a major
role among natural factors in determining human existence. It is widely acknowl-
edged that rapid climate change is one of the most pressing environmental issues of
the twenty-first century (Atlas of health and climate 2012) and that it may have a
considerable effect on human health (Epstein 1999; Zell 2004; Recent globalchanges of the natural environment 2006; Filho et al. 2016; Wu et al. 2016; etc.).
This impact may manifest itself in different ways. It may contribute to increased
frequency and intensity of heat waves, growing number of floods and droughts,
changes in distribution patterns of vector-borne diseases, and increased risk of
disasters and malnutrition (Haines et al. 2006; Malkhazova 2006).
Infectious diseases represent a major concern because of their dependence on
environmental conditions that interact with the biological agents of diseases.
Alterations in climate variables (temperature, precipitation, wind, sunshine, length
of the seasons, etc.) may affect survival, reproduction, or distribution of disease
pathogens, hosts, and vectors. Their health effects tend to manifest as shifts in the
geographic and seasonal patterns of human infectious diseases as well as changes in
the frequency and severity of outbreaks. Whereas climate limits the geographical
range of infectious diseases, weather affects the timing and intensity of outbreaks,
especially those associated with weather extremes, such as flooding and droughts.
Thus global climate change will most likely influence transmission trends of
infectious disease, although the exact direction and extent of this influence remain
uncertain (Zell 2004; Wu et al. 2016).
For example, the health effects of flooding may include an increased risk of
symptoms associated with diarrhea and accelerating incidence of cholera, crypto-
sporidium infection, and other waterborne diseases (MacKenzie et al. 1994; Epstein
1999; Ahern et al. 2005; Wu et al. 2016; Aparicio-Effen et al. 2016). Unusual
rainfall may cause an increase in fecal pathogens as heavy rain may stir up
152 S.M. Malkhazova et al.
sediments in water leading to the accumulation of fecal microorganisms (Jofre et al.
2010). Floods can also facilitate transmission of some natural waterborne fecal
diseases. Thus increased cases of leptospirosis and campylobacter enteritis have
been reported after flooding in the Czech Republic (Zitek and Benes 2005). There
have also been reports of flood-associated outbreaks of leptospirosis in Central and
South America, South Asia, and Europe (Ahern et al. 2005; Wu et al. 2016).
Globally, waterborne epidemics have shown an upward trend from 1980 through
2006, which coincides with the increased number of floods (Brown and Murray
2013).
On the other hand, concentration of effluent waterborne pathogens may be
caused by droughts or low rainfall as waterbodies become shallow (Semenza and
Menne 2009). Diarrheal diseases are also often associated with droughts and
consequently a lack of safe fresh water in low-income countries, refugee camps,
etc. There is strong evidence that climate changes influence outbreaks of Vibrio-related infections (e.g., human infections associated with recreational bathing and
foodborne infections) worldwide, especially in the North Atlantic, which often
coincide with heat waves (Vezzulli et al. 2016).
In addition to direct impact, climate change may exert indirect influence on some
contagious diseases. For example, the 2014 Ebola outbreak in Western Africa is
believed to be connected not only with socioeconomic conditions of affected
countries but also with some alterations in the environment due to global changes.
Some studies (Harris et al. 2016) suggest that climate variability forced fruit bats,
which are believed to be the main natural reservoir of the Ebola virus to migrate
long distances and reside near human settlements. Extreme weather events also
force farmers who practice mostly subsistence farming to abandon their habitual
places and venture deeper into the forests to search for land and new livelihoods.
This brings them closer to infected animals and thus at higher risk of infection.
The most serious health impacts of climate change worldwide seem to occur
from vector-borne infectious diseases. The greatest concern is that global climate
change will result in an expansion of such diseases throughout temperate areas
(Epstein 1999). Within the past decades, an increase in tick-borne and mosquito-
borne disease outbreaks has been reported in different areas of the world including
the mid-latitudes. This process is often connected with a warming climate
(Malkhazova and Shartova 2014; Andersen and Davis 2016).
It is important to note that factors that influence transmission of vector-borne
diseases are complex, so it is difficult to clearly determine the contribution of each
factor. Climate is only one of many interacting determinants of vector-borne
disease, but its role seems to be critical for their spread. It is obvious that ecology,
development, survival, and behavior of mosquitoes and other arthropods are depen-
dent on climatic conditions. The same factors play an important role in the life cycle
of the pathogens that are transmitted by them. The development time of infectious
agents such as Plasmodium or arboviruses is strongly determined by temperature
and humidity. Moreover, these agents are tied to their vectors and depend on their
life span and the conditions of their habitats. The influence of precipitation may be
illustrated by diseases that are transmitted by vectors that have aquatic
10 Epidemiological Consequences of Climate Change. . . 153
developmental stages (such as mosquitoes). Diseases transmitted by vectors with-
out such stages such as ticks or sandflies are also influenced by humidity. Climate
and weather conditions may also exert a range of indirect effects on environmental
and human systems. The complex interplay of all these factors accounts for the
overall effect of climate on the prevalence of vector-borne diseases (Reiter 2001;
Campbell-Lendrum et al. 2015). Meanwhile, the nature and extent of interaction
with non-climate factors vary markedly by diseases and by location.
The alterations in natural ranges of vector-borne diseases are often connected
with the spread to new territories of some vectors that may get involved in the
transmission of dangerous infections. Currently one of the most challenging issues
is the rapid expansion of two Aedes mosquito species, A. albopictus and A. aegypti,which are responsible for the transmission of yellow fever, chikungunya fever, and
dengue. It was well proved that A. albopictus induced an outbreak of chikungunya
fever in Italy in 2007 (Liumbruno et al. 2008). Some prognoses suggest that the land
area with environmental conditions suitable for both species’ populations is
expected to increase (Rochlin et al. 2013; Kraemer et al. 2015).
The greatest effect of climate change on transmission of vector-borne diseases is
likely to be observed at the extremes of the range of temperatures at which
transmission occurs. Extreme temperatures near the limit of physiological tolerance
for the pathogen prevent its survival and impending transmission of disease.
Furthermore, when a vector lives in an environment of low mean temperature,
even a small increase in temperature may result in more intensive development of
the parasite (Githeko et al. 2000; Patz et al. 2003). That is why the most prominent
changes in the spread of vector-borne diseases are expected to occur near the
margins of their geographical ranges. There is evidence of northward expansion
of geographical ranges of hosts and vectors resulting in the emergence of some
diseases in new areas. This process may be mutual when the increase in the range of
a reservoir host leads to rising occurrence of the parasite. A study in Canada showed
the expansion of the white-footed mouse which is known to be the most competent
reservoir for Borrelia burgdorferi (the agent of Lyme disease), after changes in
winter duration and winter average maximum temperature. As a result, the ticks
rapidly increased so that the encounter rate between vectors and hosts increased as
well. This provides enhanced conditions for the emergence and maintenance of the
B. burgdorferi transmission cycle (Roy-Dufresne et al. 2013).
The review of possible effects of climate warming on the health of the popula-
tion of Russia (Danilov-Danilian 2003) shows that permanent occurrence of such
mosquito-dependent diseases such as West Nile fever (WNF), dengue hemorrhagic
fever, or yellow fever is probable beyond the tropical zone. It is believed that the
agents of these diseases become more active because of recent climate warming as
the higher temperature hastens the reproduction of insects. This is confirmed to a
degree by the spread of WNF in Russia. Since 1999, WNF cases have been recorded
every year in several Russian regions, and in 2013, the disease was registered in
16 constituent territories of the Russian Federation (Medico-geographical Atlas ofRussia “Natural Focal Diseases” 2015; Adisheva et al. 2016). Cases of Crimean-
Congo hemorrhagic fever in the southern regions of Russia have also increased
154 S.M. Malkhazova et al.
since the end of the 1990s due to warm winters with favorable conditions for ticks
wintering in soil. Unlike previous epidemics, current outbreaks have a longer
seasonal interval that is probably related to climate change and warmer winters
when the ticks survive and the virus remains in their organisms for a longer time
(Medico-geographical Atlas of Russia “Natural Focal Diseases” 2015).
Several reliable models using climate variables as drivers to predict the current
and future distribution of vectors of infections such as Lyme disease, TBE,
Crimean-Congo fever, dengue, and malaria clearly showed dependence on climatic
characteristics (Kislov et al. 2008; Estrada-Pe~na et al. 2012; Caminade et al. 2014;
Malkhazova and Shartova 2014; Messina et al. 2015; Nazareth et al. 2016). The
results of these and other similar studies demonstrate that climate changes may
often play a trigger role in the alterations of geographical ranges of vector-borne
diseases.
Malaria is among the vector-borne diseases most sensitive to climate change.
The global changes and their effect on malaria’s geographical range have drawn theattention of many researchers (Martens et al. 1995; Githeko et al. 2000;
Caminade et al. 2014; Ojeh and Aworinde 2016). Different models describing
relationship between climate and disease distribution on global, regional, and
local levels have been developed (Craig et al. 1999; Rogers and Randolph 2000;
Lieshouta et al. 2004; Kislov et al. 2008; Parham and Michael 2010; Arab et al.
2014; Malkhazova and Shartova 2014).
In the pre-elimination era, malaria was endemic in most of Europe, including
Russia. In the middle of the twentieth century, all species of malaria were elimi-
nated, and vivax malaria was the last to disappear. Since then, short-lived episodes
of autochthonous transmission following importation of P. vivax have been
documented in a number of European countries, with Russia being the most
affected. From 1997 to 2010, more than 500 autochthonous cases were recorded
in European Russia. During the last quarter of the twentieth century, the favorability
of weather conditions considerably improved, and receptivity of areas to malaria
increased due to a more favorable combination of temperatures during summers.
Since 2010, the malaria situation in Russia has improved, mostly due to the
dramatic decrease in importation of the infection from Central Asian countries.
However, the problem of possible reintroduction of vivax malaria in Russia is still
addressed by sanitary authorities and scholars (Mironova and Beljaev 2011).
Prognosis of the Effect of Climate Change on Vivax MalariaDistribution in Russia
Considering the international experience, the present study attempts to develop a
prognostic model of the epidemiology of vivax malaria within the territory of the
European territory of Russia (ETR) and Western Siberia (WS) in the twenty-first
10 Epidemiological Consequences of Climate Change. . . 155
century. Forecasting is based on climate modeling data within the framework of the
CMIP3 (Coupled Model Intercomparison Project, phase 3).
The Method of Prognosis of Vivax Malaria Potential SpreadUsing Climate Modeling Data
The spread of malaria is determined by different biological and socioeconomic
factors. Nevertheless, the primary factor limiting the potential geographical range
of vivax malaria and its specific epidemiological features is ambient temperature
(Bruce-Chwatt 1980; Lysenko and Kondrashin 1999). Thus, this model is based
primarily on the analysis of temperature characteristics.
The agent of vivax malaria (Plasmodium vivax) was taken as an object of this
research because it has the lowest temperature threshold for its development in a
mosquito compared to the agents of other forms of malaria and is therefore of
greatest importance for Russia.
The prognostic model was based on a postulate that there are necessary pre-
conditions for malaria transmission both within ETR and WS. Anopheles mosqui-
toes are present in the bulk of the territories studied. P. vivax cases may be imported
from endemic areas. The aim of the modeling was to evaluate the feasibility of
vivax malaria transmission under present and forecast climatic conditions and its
possible variations.
The formal territorial approach (Malkhazova and Shartova 2014) is applied to
the study. The analyzed territorial unit (ATU) is a square of the degree grid on the
map. The climatic data (daily average air temperatures) for ETR and WS were
reanalyzed and linked to the nodes of the grid cells of 2 � 2� of latitude and
longitude (Fig. 10.1).
The data on daily average air temperature were obtained for the following time
series:
– Observed values for 1961–1989 interpolated for a grid cell. The period from
1961 through 1989 is characterized by modern climate and corresponds to the
least time interval of 30 years that is necessary for the evaluation of climate and
related changes of biotic components.
– Prognostic values for 2046–2065 on degree grid squares were derived from the
results of climate modeling upon calendar-day basis for every year of this period.
To create a prognostic model (using expert evaluation) of the epidemiological
features of malaria infection (Lysenko and Kondrashin 1999; Beljaev 2002; WHO
2010), the following parameters characterizing the malaria situation were selected:
– The period of effective temperatures – a period of a year when daily average air
temperatures are permanently above +16 �C; otherwise, the development of a
parasite is impossible. The term “permanently above” means that there are no
156 S.M. Malkhazova et al.
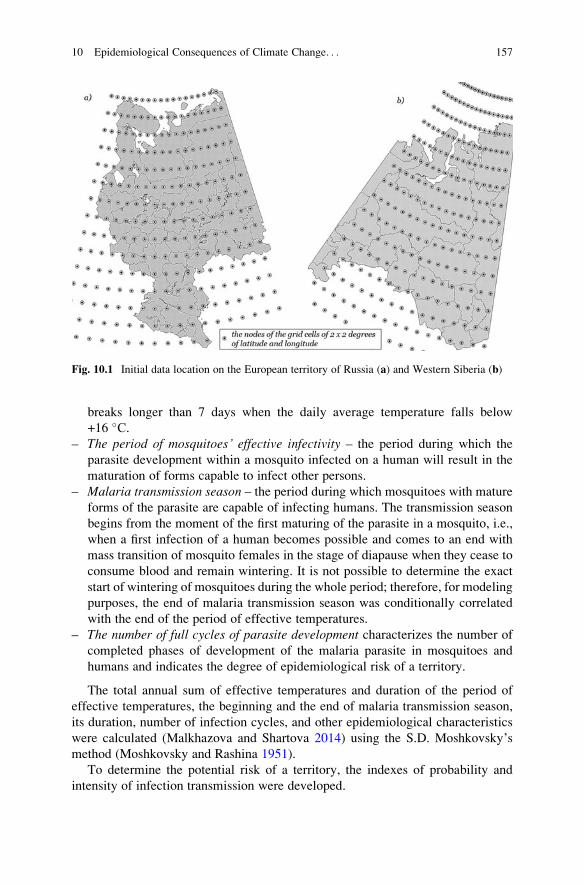
breaks longer than 7 days when the daily average temperature falls below
+16 �С.– The period of mosquitoes’ effective infectivity – the period during which the
parasite development within a mosquito infected on a human will result in the
maturation of forms capable to infect other persons.
– Malaria transmission season – the period during which mosquitoes with mature
forms of the parasite are capable of infecting humans. The transmission season
begins from the moment of the first maturing of the parasite in a mosquito, i.e.,
when a first infection of a human becomes possible and comes to an end with
mass transition of mosquito females in the stage of diapause when they cease to
consume blood and remain wintering. It is not possible to determine the exact
start of wintering of mosquitoes during the whole period; therefore, for modeling
purposes, the end of malaria transmission season was conditionally correlated
with the end of the period of effective temperatures.
– The number of full cycles of parasite development characterizes the number of
completed phases of development of the malaria parasite in mosquitoes and
humans and indicates the degree of epidemiological risk of a territory.
The total annual sum of effective temperatures and duration of the period of
effective temperatures, the beginning and the end of malaria transmission season,
its duration, number of infection cycles, and other epidemiological characteristics
were calculated (Malkhazova and Shartova 2014) using the S.D. Moshkovsky’smethod (Moshkovsky and Rashina 1951).
To determine the potential risk of a territory, the indexes of probability and
intensity of infection transmission were developed.
Fig. 10.1 Initial data location on the European territory of Russia (a) and Western Siberia (b)
10 Epidemiological Consequences of Climate Change. . . 157
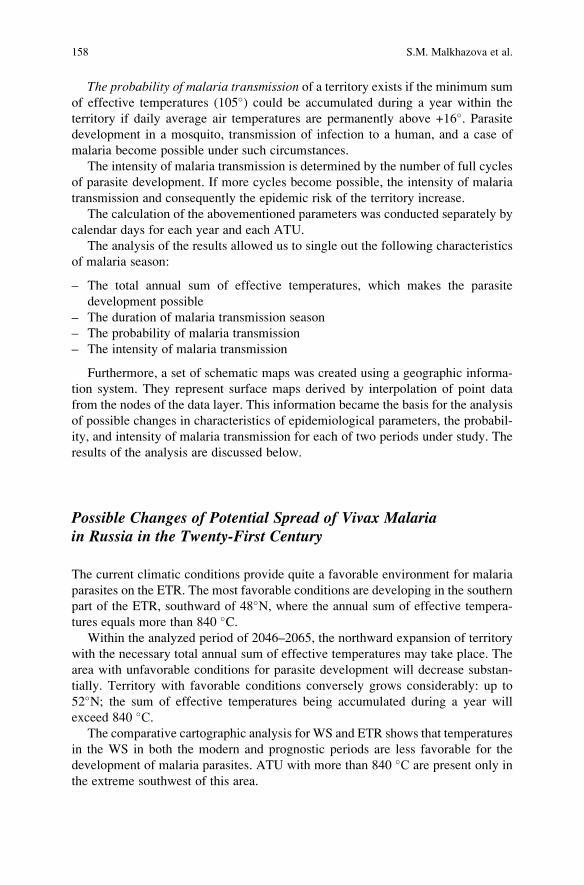
The probability of malaria transmission of a territory exists if the minimum sum
of effective temperatures (105�) could be accumulated during a year within the
territory if daily average air temperatures are permanently above +16�. Parasitedevelopment in a mosquito, transmission of infection to a human, and a case of
malaria become possible under such circumstances.
The intensity of malaria transmission is determined by the number of full cycles
of parasite development. If more cycles become possible, the intensity of malaria
transmission and consequently the epidemic risk of the territory increase.
The calculation of the abovementioned parameters was conducted separately by
calendar days for each year and each ATU.
The analysis of the results allowed us to single out the following characteristics
of malaria season:
– The total annual sum of effective temperatures, which makes the parasite
development possible
– The duration of malaria transmission season
– The probability of malaria transmission
– The intensity of malaria transmission
Furthermore, a set of schematic maps was created using a geographic informa-
tion system. They represent surface maps derived by interpolation of point data
from the nodes of the data layer. This information became the basis for the analysis
of possible changes in characteristics of epidemiological parameters, the probabil-
ity, and intensity of malaria transmission for each of two periods under study. The
results of the analysis are discussed below.
Possible Changes of Potential Spread of Vivax Malariain Russia in the Twenty-First Century
The current climatic conditions provide quite a favorable environment for malaria
parasites on the ETR. The most favorable conditions are developing in the southern
part of the ETR, southward of 48�N, where the annual sum of effective tempera-
tures equals more than 840 �C.Within the analyzed period of 2046–2065, the northward expansion of territory
with the necessary total annual sum of effective temperatures may take place. The
area with unfavorable conditions for parasite development will decrease substan-
tially. Territory with favorable conditions conversely grows considerably: up to
52�N; the sum of effective temperatures being accumulated during a year will
exceed 840 �С.The comparative cartographic analysis for WS and ETR shows that temperatures
in the WS in both the modern and prognostic periods are less favorable for the
development of malaria parasites. ATU with more than 840 �С are present only in
the extreme southwest of this area.
158 S.M. Malkhazova et al.
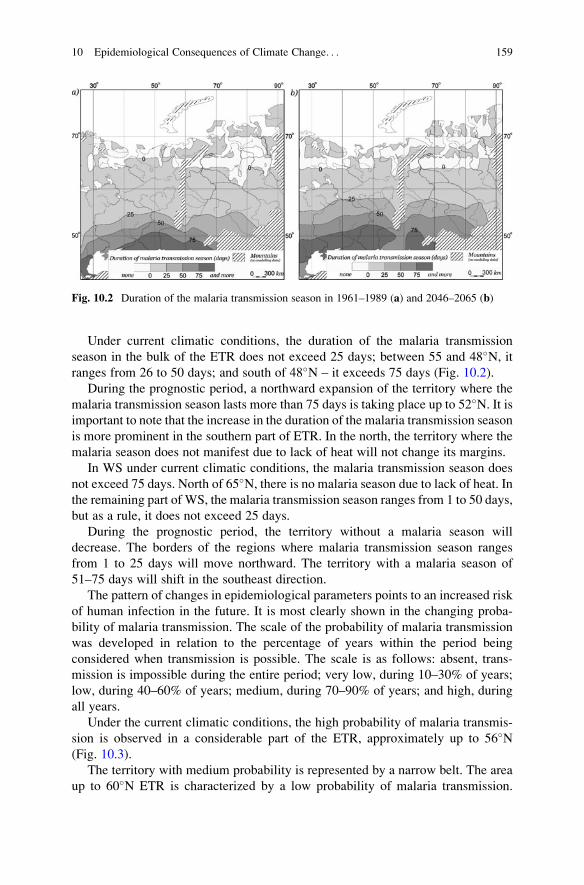
Under current climatic conditions, the duration of the malaria transmission
season in the bulk of the ETR does not exceed 25 days; between 55 and 48�N, itranges from 26 to 50 days; and south of 48�N – it exceeds 75 days (Fig. 10.2).
During the prognostic period, a northward expansion of the territory where the
malaria transmission season lasts more than 75 days is taking place up to 52�N. It isimportant to note that the increase in the duration of the malaria transmission season
is more prominent in the southern part of ETR. In the north, the territory where the
malaria season does not manifest due to lack of heat will not change its margins.
In WS under current climatic conditions, the malaria transmission season does
not exceed 75 days. North of 65�N, there is no malaria season due to lack of heat. In
the remaining part of WS, the malaria transmission season ranges from 1 to 50 days,
but as a rule, it does not exceed 25 days.
During the prognostic period, the territory without a malaria season will
decrease. The borders of the regions where malaria transmission season ranges
from 1 to 25 days will move northward. The territory with a malaria season of
51–75 days will shift in the southeast direction.
The pattern of changes in epidemiological parameters points to an increased risk
of human infection in the future. It is most clearly shown in the changing proba-
bility of malaria transmission. The scale of the probability of malaria transmission
was developed in relation to the percentage of years within the period being
considered when transmission is possible. The scale is as follows: absent, trans-
mission is impossible during the entire period; very low, during 10–30% of years;
low, during 40–60% of years; medium, during 70–90% of years; and high, during
all years.
Under the current climatic conditions, the high probability of malaria transmis-
sion is observed in a considerable part of the ETR, approximately up to 56�N(Fig. 10.3).
The territory with medium probability is represented by a narrow belt. The area
up to 60�N ETR is characterized by a low probability of malaria transmission.
Fig. 10.2 Duration of the malaria transmission season in 1961–1989 (a) and 2046–2065 (b)
10 Epidemiological Consequences of Climate Change. . . 159
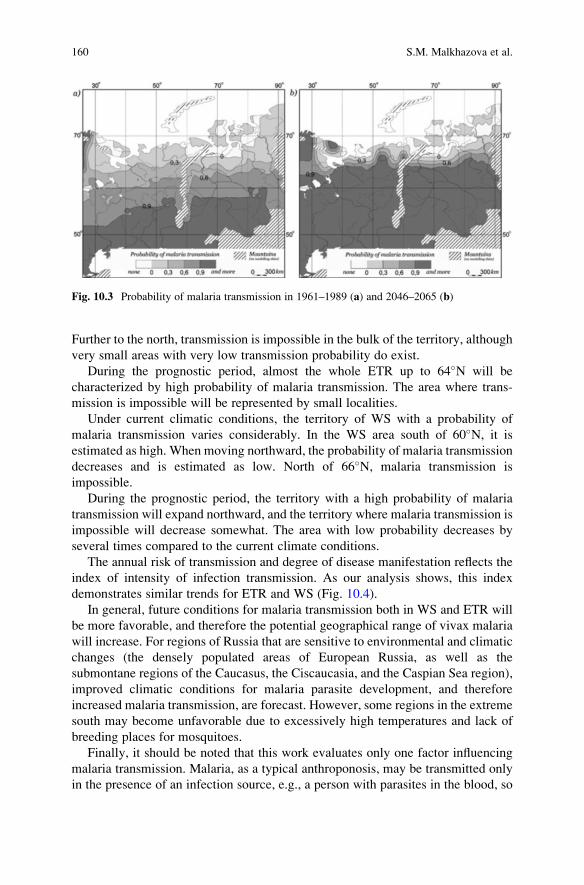
Further to the north, transmission is impossible in the bulk of the territory, although
very small areas with very low transmission probability do exist.
During the prognostic period, almost the whole ETR up to 64�N will be
characterized by high probability of malaria transmission. The area where trans-
mission is impossible will be represented by small localities.
Under current climatic conditions, the territory of WS with a probability of
malaria transmission varies considerably. In the WS area south of 60�N, it isestimated as high. When moving northward, the probability of malaria transmission
decreases and is estimated as low. North of 66�N, malaria transmission is
impossible.
During the prognostic period, the territory with a high probability of malaria
transmission will expand northward, and the territory where malaria transmission is
impossible will decrease somewhat. The area with low probability decreases by
several times compared to the current climate conditions.
The annual risk of transmission and degree of disease manifestation reflects the
index of intensity of infection transmission. As our analysis shows, this index
demonstrates similar trends for ETR and WS (Fig. 10.4).
In general, future conditions for malaria transmission both in WS and ETR will
be more favorable, and therefore the potential geographical range of vivax malaria
will increase. For regions of Russia that are sensitive to environmental and climatic
changes (the densely populated areas of European Russia, as well as the
submontane regions of the Caucasus, the Ciscaucasia, and the Caspian Sea region),
improved climatic conditions for malaria parasite development, and therefore
increased malaria transmission, are forecast. However, some regions in the extreme
south may become unfavorable due to excessively high temperatures and lack of
breeding places for mosquitoes.
Finally, it should be noted that this work evaluates only one factor influencing
malaria transmission. Malaria, as a typical anthroponosis, may be transmitted only
in the presence of an infection source, e.g., a person with parasites in the blood, so
Fig. 10.3 Probability of malaria transmission in 1961–1989 (a) and 2046–2065 (b)
160 S.M. Malkhazova et al.
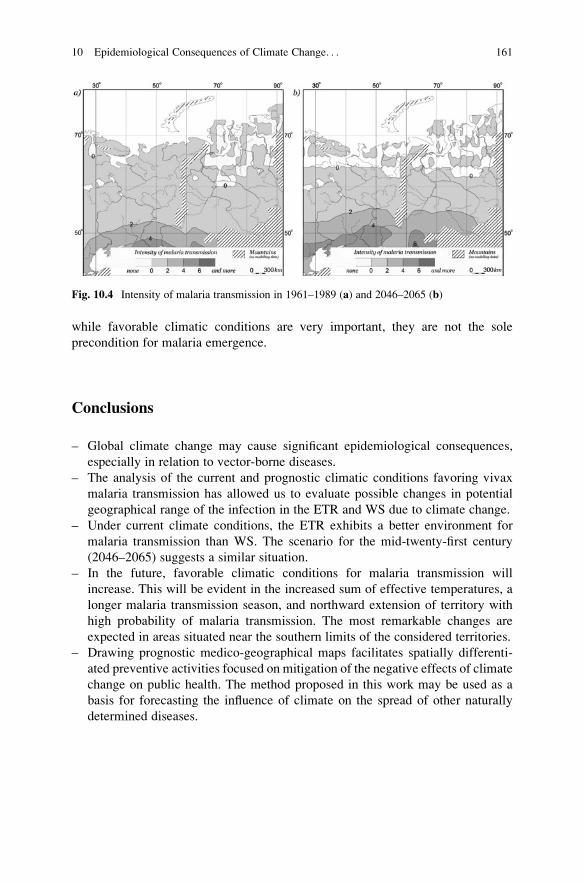
while favorable climatic conditions are very important, they are not the sole
precondition for malaria emergence.
Conclusions
– Global climate change may cause significant epidemiological consequences,
especially in relation to vector-borne diseases.
– The analysis of the current and prognostic climatic conditions favoring vivax
malaria transmission has allowed us to evaluate possible changes in potential
geographical range of the infection in the ETR and WS due to climate change.
– Under current climate conditions, the ETR exhibits a better environment for
malaria transmission than WS. The scenario for the mid-twenty-first century
(2046–2065) suggests a similar situation.
– In the future, favorable climatic conditions for malaria transmission will
increase. This will be evident in the increased sum of effective temperatures, a
longer malaria transmission season, and northward extension of territory with
high probability of malaria transmission. The most remarkable changes are
expected in areas situated near the southern limits of the considered territories.
– Drawing prognostic medico-geographical maps facilitates spatially differenti-
ated preventive activities focused on mitigation of the negative effects of climate
change on public health. The method proposed in this work may be used as a
basis for forecasting the influence of climate on the spread of other naturally
determined diseases.
Fig. 10.4 Intensity of malaria transmission in 1961–1989 (a) and 2046–2065 (b)
10 Epidemiological Consequences of Climate Change. . . 161
References
AdishevaОS, Malkhazova SM, Orlov DS (2016) Distribution of West Nile Fever in Russia//MSU
Vestnik. Series 5. Geography 4:48–55
Ahern M, Kovats RS, Wilkinson P, Few R, Matthies F (2005) Global health impacts of floods:
epidemiologic evidence. Epidemiol Rev 27:36–46
Andersen LK, Davis MDP (2016) Climate change and the epidemiology of selected tick-borne and
mosquito-borne diseases: update from the International Society of Dermatology Climate
Change Task Force. Int J Dermatol. Epub ahead of print
Aparicio-Effen M, Arana I, Aparicio J, Ramallo C, Bernal N, Ocampo M, Nagy GJ (2016) Climate
change and health vulnerability in Bolivian Chaco ecosystems. Climate Change and Health,
Springer International Publishing, Cham, pp 231–259
Arab A, Jackson MC, Kongoli C (2014) Modelling the effects of weather and climate on malaria
distributions in West Africa. Malar J 13:12
Atlas of Health and Climate (2012) Geneva, WHO/WMO, p 26
Beljaev AE (2002) Determinants of malaria in the Middle East and North Africa. In: The
contextual determinants of Malaria. RFF Press, Washington, DC, pp 137–166
Brown L, Murray V (2013) Examining the relationship between infectious diseases and flooding in
Europe. Disaster Health 1(2):1–11
Bruce-Chwatt LJ (1980) Essential malariology. William Heinemann Medical Books Ltd., London.
354 pp
Caminade C, Kovats S, Rocklov J, Tompkins AM, Morse AP, Colon-Gonzalez FJ, Stenlund H,
Martens P, Lloyd SJ (2014) Impact of climate change on global malaria distribution. Proc Natl
Acad Sci USA 111(9):3286–3291
Campbell-Lendrum D, Manga L, Bagayoko M, Sommerfeld J (2015) Climate change and vector-
borne diseases: what are the implications for public health research and policy? Phil Trans R
Soc B: Biol Sci 370:1665
Craig MH, Snow RW, Sueur D (1999) A climate based distribution model of malaria transmission
in Sub-Saharan Africa. Parasitol Today 15:104–105
Danilov-Danilian VI (2003) Climatic changes: viewed from Russia. TEIS, Moscow. 416 p
(In Russian)
Epstein PR (1999) Climate and health. Science 285:347–348
Estrada-Pe~na A, Ayllon N, de la Fuente J (2012) Impact of climate trends on tick-borne pathogen
transmission. Front Physiol 3:64
Filho WL, Azeiteiro UM, Alves F (2016) Climate change and health. Springer International
Publishing, Cham, p 532
Githeko AK, Lindsay SW, Confalonieri UE, Patz JA (2000) Climate change and vector-borne
diseases: a regional analysis. Bull WHO 78(9):1136–1147
Haines A, Kovats RS, Campbell-Lendrum D, Corvalan C (2006) Climate change and human
health: impacts, vulnerability and public health. Public Health 120:585–596
Harris A, Dumbuya B, Hynie M, Idahosa P, Keil R, Perkins P (2016) The social and political
dimensions of the Ebola response: global inequality, climate change and infectious diseases.
Climate Change Management, Springer International Publishing, Cham, pp 151–169
Jofre J, Blanch AR, Lucena F (2010) Water-borne infectious disease outbreaks associated with
water scarcity and rainfall events. In: Water scarcity in the Mediterranean: perspectives under
global change. Springer International Publishing, Heidelberg, p 234
Kislov AV, Yevstigneyev VM, Malkhazova SM, Sokolikhina NN, Surkova GV, Toropov TA,
Chernyshev AV, Chumachenko AN (2008) Forecast of climatic resources of the East European
plain under the 20st century climate warming. MAX Press, Moscow. 290 p (in Russian)
Kraemer MU, Sinka ME, Duda KA, Mylne AQ, Shearer FM, Barker CM, Moore CG, Carvalho
RG, Coelho GE, Van Bortel W, Hendrickx G, Schaffner F, Elyazar IR, Teng HJ, Brady OJ,
Messina JP, Pigott DM, Scott TW, Smith DL, Wint GR, Golding N, Hay SI (2015) The global
distribution of the arbovirus vectors Aedes aegypti and Ae. Albopictus. elife 4:e08347
162 S.M. Malkhazova et al.
Lieshouta M, Kovats RS, Livermorec MTJ, Martens P (2004) Climate change and malaria:
analysis of the SRES climate and socio-economic scenarios. Glob Environ Chang 14:87–99
Liumbruno GM, Calteri D, Petropulacos K, Mattivi A, Po C, Macini P, Tomasini I, Zucchelli P,
Silvestri AR, Sambri V, Pupella S, Catalano L, Piccinini V, Calizzani G, Grazzini G (2008)
The Chikungunya epidemic in Italy and its repercussion on the blood system. Blood Transfus 6
(4):199–210
Lysenko AJ, Kondrashin AV (1999) Malarialogy. Otkrytye systemy,Мoscow. 248 p (in Russian)
MacKenzie WR, Hoxie NJ, Proctor ME, Gradus MS, Blair KA, Peterson DE, Kazmierczak JJ,
Addiss DG, Fox KR, Rose JB (1994) A massive outbreak in Milwaukee of cryptosporidium
infection transmitted through the public water supply. N Engl J Med 331:161–167
Malkhazova SM (2006) Change of the medical-geographical picture of the world. In: Modern
global changes of environment, vol 2. Nauchny Mir, Moscow, pp 558–576 (in Russian)
Malkhazova SM, Shartova NV (2014) Malaria in Russia: past, present and future. In: Health and
environment change in urban areas. China Environment Press, Beijing, pp 247–265
Martens WJ, Niessen LW, Rotmans J, Jetten TH, McMichael AJ (1995) Potential impact of global
climate change on malaria risk. Environ Health Perspect 103(5):458–464
Medico-geographical Atlas of Russia “Natural Focal Diseases” (2015) In: Malkhazova SM
(ed) Faculty of Geography, Lomonosov Moscow State University, Moscow, 208 p (in Russian)
Messina JP, Pigott DM, Golding N, Duda KA, Brownstein JS, Weiss DJ, Gibson H, Robinson TP,
Gilbert M, William Wint GR, Nuttall PA, Gething PW, Myers MF, George DB, Hay SI (2015)
The global distribution of Crimean-Congo hemorrhagic fever. Trans R Soc Trop Med Hyg 109
(8):503–513
Mironova VA, Beljaev AE (2011) Migrations and malaria in Russia. In: Actual questions of
epidemiology of infectious diseases. Collection of scientific works, nr. 10. ZAO MP Gigiena,
Moscow, p 680–690
Moshkovsky SD, Rashina MG (1951) Epidemiology and medical parasitology for entomologists.
Medgiz, Moscow. 455 p (in Russian)
Nazareth T, Seixas G, Sousa CA (2016) Climate change and mosquito-borne diseases. In: Climate
change and health: improving resilience and reducing risks. Springer International Publishing,
Cham, pp 187–199
Ojeh VN, Aworinde SA (2016) Climate variation and challenges of human health in Nigeria:
malaria in perspective. In: Climate change and health. Springer International Publishing,
Cham, pp 171–185
Parham PE, Michael E (2010) Modelling climate change and malaria transmission. Adv Exp Med
Biol 673:184–199
Patz JA, Githeko AK, McCarty JP, Hussein S, Confalonieri U, De Wet N (2003) Climate change
and infectious diseases. In: Climate change and human health: risks and responses. World
Health Organization, Geneva, pp 103–132
Recent global changes of the natural environment (2006) vol 1, 696 p., vol 2, 776 p. M.:Nauchny
Mir (in Russian)
Reiter P (2001) Climate change and mosquito-borne disease. Environ Health Perspect
109:141–161
Rochlin I, Ninivaggi DV, Hutchinson ML, Farajollahi A (2013) Climate change and range
expansion of the Asian Tiger Mosquito (Aedes albopictus) in Northeastern USA: implications
for public health practitioners. PLoS One 8(4):e60874
Rogers DJ, Randolph SE (2000) The global spread of malaria in a future, warmer world. Science
289:1763–1765
Rosgidromet RAN, Earth Climate Change Monitoring Bulletin (2015) Moscow, 30 p (in Russian)
Roy-Dufresne E, Logan T, Simon JA, Chmur GL, Millien V (2013) Poleward expansion of the
White-Footed Mouse (Peromyscus leucopus) under climate change: implications for the spread
of Lyme disease. PLoS One 8(11):e80724
Semenza JC, Menne B (2009) Climate change and infectious diseases in Europe. Lancet Infect Dis
9:365–375
10 Epidemiological Consequences of Climate Change. . . 163
Vezzulli L, Grande C, Reid PC, Helaouet P, Edwards M, H€ofle MG, Brettar I, Colwell RR, Pruzzo
C (2016) Climate influence on Vibrio and associated human diseases during the past half-
century in the coastal North Atlantic. Proc Natl Acad Sci USA 113(34):E5062–E5071
WHO (2010) Practical guidelines on malaria elimination in countries of the WHO European
Region. WHO, Geneva. 109 р (in Russian)
Wu X, Lu Y, Zhou S, Chen L, Xu B (2016) Impact of climate change on human infectious
diseases: empirical evidence and human adaptation. Environ Int 86:14–23
Zell R (2004) Global climate change and the emergence/re-emergence of infectious diseases. Int J
Med Microbiol 293(37):16–26
Zitek K, Benes C (2005) Longitudinal epidemiology of leptospirosis in the Czech Republic.
Epidemiol Mikrobiol Imunol 54(1):21–26
Svetlana M. Malkhazova has a doctoral degree in geographical sciences. She is professor and
head of the Department of Biogeography, Faculty of Geography, Lomonosov Moscow State
University. Her main research interests relate to the problems of human ecology and medical
geography. She is the author of more than 250 scientific publications, including ten books, several
textbooks and medical and environmental atlases.
Natalia V. Shartova is PhD in geography; she is senior research fellow at the Department of
Landscape Geochemistry and Soil Geography, Faculty of Geography, Lomonosov Moscow State
University. Her main research interests are in medical geography and human ecology, particularly
in relation to the problems of urban ecology and urban population health. She is the author of
35 scientific publications.
Varvara A. Mironova has a PhD in geography. She is senior research fellow at the Department
of Biogeography, Faculty of Geography, Lomonosov Moscow State University. Her main research
interests include medical geography, especially problems related to nosogeography of natural
focal and natural endemic diseases, medico-geographical mapping and ecological and evolutional
parasitology. She is the author of 35 scientific publications.
164 S.M. Malkhazova et al.
Chapter 11
Climate Change and Projectionsof Temperature-Related Mortality
Dmitry Shaposhnikov and Boris Revich
Abstract The impacts of increasing year-round temperatures on mortality from all
non-accidental, all cardiovascular, and all non-cardiovascular causes were exam-
ined in the city of Akchangelsk in Russian North, where the climate change signal is
expected to be stronger than the global average. Projections of future daily tem-
peratures were made for IPCC B2, A1B, and A2 greenhouse gas emission scenarios
using regional downscaling of the selected ensemble of 16 general circulation
models. The distributed lag nonlinear models were used to estimate 30-day cumu-
lative risks of the exposure to heat and cold. The projected changes in annual
fractions of deaths attributed to nonoptimal temperatures are negative and not
significant at 95% confidence level for all categories of mortality and emission
pathways included in the study. The benefits of reduced cold-related mortality will
most likely outweigh the negative impacts of higher heat-related mortality during
the projection period 2045–2056. However, this situation may be reversed in the
longer run.
Keywords Climate projections • Population health • Distributed lag nonlinear
models • Nonoptimal temperatures • Attributable fractions and attributable
numbers of deaths
Introduction
IPCC’s Fifth Assessment report concluded that anthropogenic greenhouse gas
emissions and other anthropogenic drivers “are extremely likely to have been the
dominant cause of the observed warming since the mid-20th century” and warming
will continue into the future (IPCC 2013). Dynamic downscaling of global
atmosphere-ocean coupled general circulation models (AOGCM) to the regional
level showed that circumpolar regions would experience greater climatic changes
D. Shaposhnikov (*) • B. Revich
Laboratory of Forecasting of Environmental Quality and Human Health, Institute of Economic
Forecasting of Russian Academy of Sciences, Nakhimovsky Prospect 47, Moscow 117418,
Russia
e-mail: [email protected]
© Springer International Publishing AG 2018
R. Akhtar, C. Palagiano (eds.), Climate Change and Air Pollution,Springer Climate, DOI 10.1007/978-3-319-61346-8_11
165
than global averages. Due to several positive feedback mechanisms (most impor-
tantly, to changes in surface reflectivity caused by melting of such perfect
reflectants as snow and ice), it appears that climate change in the Arctic is more
rapid than elsewhere (ACIA 2005). Even under the most optimistic new Represen-
tative Concentration Pathway emissions scenario (RCP2.6), average surface tem-
peratures in the Russian Arctic will increase by 3–4 �C by the 2080s compared to
the 1990s (see Figure SPM.8a in IPCC 2013). An increasing interest of global
warming and public health researchers in the Russian Arctic guided our choice of
Arkhangelsk, Russian Federation, as the pilot region for this study. This region is
characterized by very fragile ecosystems, which, coupled with local social and
economic problems, leads to its particular vulnerability to both direct and indirect
impacts of global warming, such as infectious diseases (Grjibovski et al. 2012;
Tokarevich et al. 2011).
One of the most direct health impacts of climate change relates to changes in
annual mortality rates caused by exposure to ambient temperatures. In this context,
Arkhangelsk, being one of the largest cities in Russian North, is particularly
interesting because of very large seasonal variations of daily mean temperatures:
from�36 �C in January to 26 �C in July. Hence, the specific aim of this chapter is to
answer the question: will climate change induce any significant changes in popu-
lation attributable fractions (AFs or PAFs) of deaths experienced due to annual
exposition to nonoptimal temperatures? To provide an informed answer, the authors
used current and future distributions of daily temperatures and estimated associated
changes in cold- and heat-related attributable fractions (AFcold and AFheat).
Making projections inevitably involves a lot of explicit and implicit assumptions
about possible futures. Our intention was to minimize the number of such assump-
tions, especially when it comes to adaptation to future public health hazards.
Making projections, we relied on the three IPCC Special Report Emission Scenar-
ios and tried to follow “all other things being equal” principle in all subsequent
calculations. To reduce uncertainty in climate projections, we used the 2050s
instead of the 2080s in our projections, attributable fractions instead of attributed
numbers of deaths, and chose “no acclimatization no adaptation” scenario. In other
words, we assumed that the “historic” temperature-mortality relationship estimated
for 1999–2010 would not change until the 2050s, which implied that the minimum
mortality temperature (MMT) would not change. This may be questionable, as
other authors speculated that the adaptation would likely lead to gradual increase in
the MMT with time.
The physiologic mechanisms of cold-related deaths mainly involve cardiorespi-
ratory pathways. Cardiovascular deaths also make a major part of all excess
non-accidental deaths caused by exposition to heat. However, it should be noted
that many other than cardiovascular causes also showed significant increases in
death rates during extreme cold and heat (Shaposhnikov and Revich 2016;
Shaposhnikov et al. 2014). Along with all non-accidental (natural) deaths, we
studied all cardiovascular deaths as a more sensitive subgroup, where we expected
to observe the greatest impacts of changing temperatures, and all
non-cardiovascular deaths, as the complimentary subgroup.
166 D. Shaposhnikov and B. Revich
Methods
Data and Climate Projections
Climate simulations for this project were performed in 2011, based on methodology
of IPCC AR4, using 1980–1999 as the baseline period for climate simulations, and
the Special Report on Emissions Scenarios (SRES). Daily mortality data for the city
of Arkhangelsk was available from Russian Federal Statistical Service (Rosstat) forthe period 1999–2010, and the basic temperature-mortality relationship was derived
for this period. This relationship reflects adaptation of population to local climate,
and cannot change noticeably over few years, unless there are massive migrations.
Therefore, we considered the period 1980–1999 as the baseline for subsequent
projections of changes in temperature-dependent mortality. Daily mean tempera-
tures for daily mortality modeling were calculated from 3-h temperatures recorded
in Arkhangelsk and available from the website of Russian Institute of Hydromete-
orology Information http://aisori.meteo.ru/ClimateR.
Dynamic downscaling of the ensemble of 16 comparable global AOGCMs to
obtain monthly average temperature anomalies (scenario-based departures from the
baseline values) in Arkhangelsk Region for the projection period 2041–2060 was
performed in the Voeikov Main Geophysical Observatory, St. Petersburg, Russian
Federation, by the workgroup formed by the WHO project “Climate change health
impact and adaptation assessment for the north of the Russian Federation” (see
Acknowledgments). Such global models simultaneously simulate the Earth’s atmo-
sphere and oceans, land, and sea ice.
A medium-range climate projection period was preferred because climate
models already showed significant climate change signal, while health projections
avoided unwarranted assumptions about far more distant futures. The baseline
period 1980–1999 was compared with 2040–2059 projection period, and the
monthly temperature anomalies were calculated as the respective 20-year averages.
In climate simulations, “temperature anomaly” means the estimated difference
between the future and the baseline temperature values. It is averaged across
model runs for each model and across the outputs of different models included in
the ensemble. The confidence intervals around temperature anomalies are partly
attributed to intra-model and partly to inter-model differences.
Although the latest IPCC Assessment Report AR5 introduced new emission
scenarios called Representative Concentration Pathways, they have mostly
inherited the assumptions built in the “old” AR4 SRES scenarios. This project
made use of SRES scenario “families” B1, A1B, and A2 (Nakicenovic et al. 2000).
Although B1 is often regarded as “low emission,” A1B as “medium emission,” and
A2 as “high emission” scenarios, the difference between A1B and A2 scenarios in
terms of the associated increments of global surface temperatures will remain
negligible until the 2050s, as our climate simulations confirmed. The IPCC
workgroup did not attach probabilities to each particular SRES scenario, preferring
to treat them as equally sound “possible futures.”
11 Climate Change and Projections of Temperature-Related Mortality 167
Calculation of Fractions of Deaths Attributableto Temperatures
The attributable fraction AFx and attributable number AFx for a given exposure
x can be provided by
AFx ¼ 1� exp �βxð Þ;ANx ¼ n� AFx ð11:1Þ
where βx represents the risk associated with the exposure and n is total number of
exposed cases. The coefficient βx usually corresponds to the logarithm of a ratio
measure such as relative risk (so-called log-relative risk), relative rate, or odds ratio.
It is generally obtained from Poisson regression models which explain exponential
relationship (11.1) while adjusting for potential confounders. Poisson models, in
turn, are used in time series analysis of the dependent variables – outcomes per unit
of time which follow an (overdispersed) Poisson distribution.
With temperature as an exposure, additional complexity rises from laggedeffects of the exposure, when the effect is distributed over certain period of time
after the exposure occurs. Another important phenomenon associated with acute
exposure to temperature is short-term harvesting, when the additional deaths caused
by the exposure deplete the pool of susceptible subpopulation, so that noticeable
reduction in deaths follows the exposure a few days later. Although medium- and
long-term harvesting were observed after unusually strong and long-lasting heat
waves, such events are very rare and are not likely to happen within any given
20-year projection period (Shaposhnikov et al. 2015). In most studies of short-term
harvesting, 30-day or even 21-day follow-up period was considered enough to
capture the cumulative effect of an acute exposure to both heat and cold (Gasparrini
et al. 2010, p. 2229; 2015, p. 370). To estimate the total burden of additional deaths,
associated with the exposure, we had to account for the lagged effects and for the
short-term harvesting – i.e., exclude the deaths which were forward-displaced by
only a few days. With this purpose, we defined the overall relative risk, accumu-
lated within L days after the exposure to temperature Ti on day i as
RRoverall ¼PL
l¼0 Mlþi
Lþ 1ð ÞMMð11:2Þ
where Mi is mortality actually observed on day i and MM denotes minimum
mortality, the reference value against which the relative risk is calculated. The
minimum mortality corresponds to optimal temperature (minimum mortality tem-
perature MMT), at which the estimated value of overall relative risk cRR reaches
zero. Both values MMT and cRR were estimated from a distributed lag nonlinear
model (dlnm) as described below.
Note that the attributable number of deaths AN(Ti) is defined similarly to (11.2)
as average daily mortality within L days from the exposure, in excess of minimum
mortality:
168 D. Shaposhnikov and B. Revich
AN Tið Þ ¼PL
l¼0 Mlþi �MMð ÞLþ 1ð Þ ¼ RRoverall � 1ð ÞMM ð11:3Þ
It is estimated from the regression model for each day i of the time series and
then summed up across all days in the study period to arrive at cANtot, which can be
further subdivided into the partial sums across the subsets of all days with temper-
atures T below the optimal temperature and above the optimal temperature. These
partial sums are interpreted as the numbers of additional deaths attributed to cold
and heat. Then, the total attributable fraction cAFtot is defined as the ratio of total
attributable number of deaths cANtotwith total mortalityMtot during the study period,
and attributable to cold and heat fractions are defined similarly:
cAFcold ¼cANcold
Mtot; cAFheat ¼
cANheat
Mtotð11:4Þ
Thus, estimation of cRR Tð Þ becomes the essential first step in all calculations.
Note that the averaging of AF(Ti) across all cold days will not produce cAFcold and
the averaging of AF(Ti) across all hot days will not produce cAFheat defined by (11.4).
We calculated attributable fractions instead of attributable numbers to avoid mak-
ing assumptions about future population growth and changing proportions among
the cause-specific mortality rates. The R function attrdl.R was written by
A. Gasparrini to calculate the attributable risks after a dlnm model. This function
is now available in electronic supplement to (Gasparrini and Leone 2014) and
works with the R package dlnm 2.2.0 or higher. We used this function to calculate
“forward” attributable fractions and empirical confidence intervals around them,
using Monte Carlo simulation and assuming normal distributions of dlnm model
coefficients. Forward perspective interprets AF(Ti) as the future burden associated
with the current exposure to temperature Ti on day i and accumulated during the
following L days after the exposure. Contrariwise, backward interpretation of AFcalculates the contributions of L past exposures to the current risk observed on
day i.
Estimation of Overall Relative Risks
Overall (cumulative) relative risk cRR Tð Þ is calculated by summing up the contri-
butions of the effects (log-relative risks) of temperature for lags 0, 1, . . . L up to the
maximum lag considered in the model. Due to nonlinear nature of temperature-
mortality relationships at each lag, there was a need to develop a family of models
which can simultaneously describe the effects that smoothly change along the
dimension of temperature and the dimension of lags, measured in days after the
exposure event. One solution was proposed by Gasparrini et al. (2010), who
11 Climate Change and Projections of Temperature-Related Mortality 169
constructed two-dimensional “cross basis” functions within a standard generalized
linear model (glm) framework. The algorithm, which resembles smoothing on a
multidimensional grid, was implemented in an R package dlnm (Gasparrini 2011)
which is now publicly available on the R comprehensive archive network (CRAN).
We performed all calculations in R 3.3.2 statistical package (R Core Team 2016).
To describe the relationship in the space of temperature, we used natural cubic
spline with three internal knots placed at the 10th, 75th, and 90th centiles of year-
round distribution of daily mean temperatures, which corresponded to �11 �C,12 �C, and 16 �C in Arkhangelsk. The asymmetric choice of the middle knot (the
75th percentile) was dictated by asymmetrical shape of the underlying temperature-
mortality relationship. The shape of lag-mortality relationship varied smoothly
within the lag period between 0 and 30 days and described the dynamics of
mortality response after exposition to a given temperature. The lagged
log-relative risks β0(T ), β1(T ), . . ., β30(T ) at each temperature were fitted with a
natural cubical spline of lag variable l with an intercept, with three internal knots
spaced equally in the log scale: at days 1, 4, and 12. The Poisson model of daily
mortality was adjusted for seasonal and long-term trend, with natural cubic splines
of time with seven degrees of freedom (df) per year, and for day of week, using
seven categorical variables. We did not adjust the temperature-mortality relation-
ship for relative humidity or dew point temperature, because we had no reason to
assume that the distribution of these variables would remain unchanged until the
2050s.
In the result, the complex nonlinear lagged temperature-mortality dependency
was decomposed with the two-dimensional basis along the dimensions of temper-
ature and lags. Estimated model coefficients were used to calculate overall relative
risk of mortality cRR Tð Þ accumulated over 30 days after the exposure.
Assessing the Risks of Climate Change
The arguments of attrdl.R function include the vector of exposures, the cross basis
used for fitting a dlnm model; the vector of outcomes, the dlnm model (with a log
link function) used for calculation of lagged risks of the exposure; and other
parameters. In our study setting, the exposures were daily temperatures ~T, andthe outcomes were corresponding daily mortality counts ~M. Here we use an arrow
symbol as vector notation, meaning the complete and ordered time series of daily
observations Ti and Mi. Note that the model itself depends upon the vector of
exposures ~T. Using these notations, the equation for calculation of baseline
attributable fraction will look like this:
AFb ¼ attrdl ~T, crossbasis, ~M, model ð~T, . . .ÞÞ� ð11:5Þ
170 D. Shaposhnikov and B. Revich
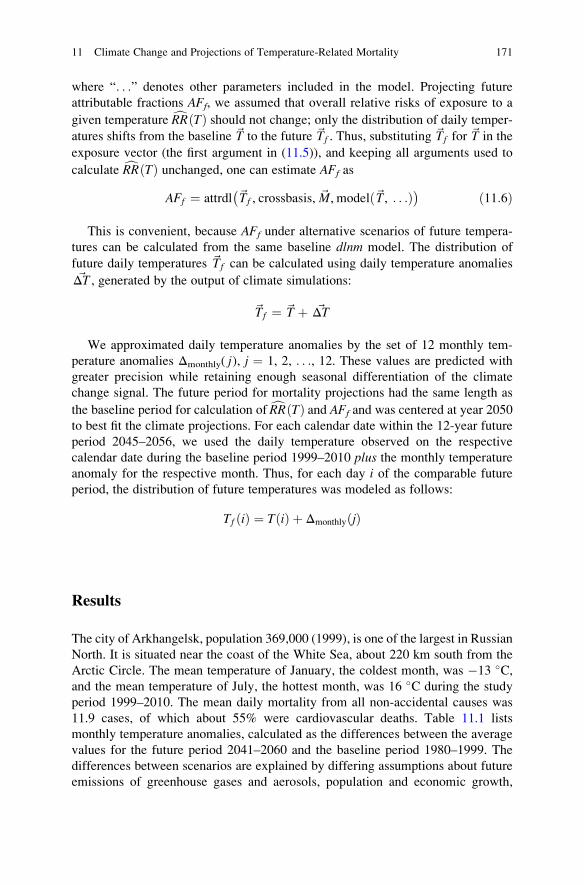
where “. . .” denotes other parameters included in the model. Projecting future
attributable fractions AFf, we assumed that overall relative risks of exposure to a
given temperature cRR Tð Þ should not change; only the distribution of daily temper-
atures shifts from the baseline ~T to the future ~Tf . Thus, substituting ~Tf for ~T in the
exposure vector (the first argument in (11.5)), and keeping all arguments used to
calculate cRR Tð Þ unchanged, one can estimate AFf as
AFf ¼ attrdl ~Tf , crossbasis, ~M, modelð~T, . . .Þ� � ð11:6Þ
This is convenient, because AFf under alternative scenarios of future tempera-
tures can be calculated from the same baseline dlnm model. The distribution of
future daily temperatures ~Tf can be calculated using daily temperature anomalies~ΔT , generated by the output of climate simulations:
~Tf ¼ ~T þ ~ΔT
We approximated daily temperature anomalies by the set of 12 monthly tem-
perature anomalies Δmonthly( j), j ¼ 1, 2, . . ., 12. These values are predicted with
greater precision while retaining enough seasonal differentiation of the climate
change signal. The future period for mortality projections had the same length as
the baseline period for calculation of cRR Tð Þ and AFf and was centered at year 2050
to best fit the climate projections. For each calendar date within the 12-year future
period 2045–2056, we used the daily temperature observed on the respective
calendar date during the baseline period 1999–2010 plus the monthly temperature
anomaly for the respective month. Thus, for each day i of the comparable future
period, the distribution of future temperatures was modeled as follows:
Tf ið Þ ¼ T ið Þ þ Δmonthly jð Þ
Results
The city of Arkhangelsk, population 369,000 (1999), is one of the largest in Russian
North. It is situated near the coast of the White Sea, about 220 km south from the
Arctic Circle. The mean temperature of January, the coldest month, was �13 �C,and the mean temperature of July, the hottest month, was 16 �C during the study
period 1999–2010. The mean daily mortality from all non-accidental causes was
11.9 cases, of which about 55% were cardiovascular deaths. Table 11.1 lists
monthly temperature anomalies, calculated as the differences between the average
values for the future period 2041–2060 and the baseline period 1980–1999. The
differences between scenarios are explained by differing assumptions about future
emissions of greenhouse gases and aerosols, population and economic growth,
11 Climate Change and Projections of Temperature-Related Mortality 171
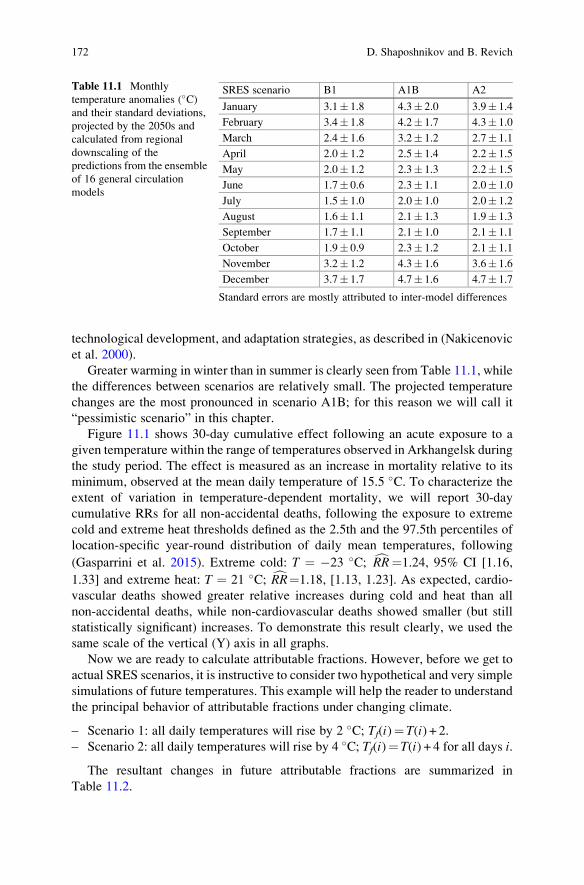
technological development, and adaptation strategies, as described in (Nakicenovic
et al. 2000).
Greater warming in winter than in summer is clearly seen from Table 11.1, while
the differences between scenarios are relatively small. The projected temperature
changes are the most pronounced in scenario A1B; for this reason we will call it
“pessimistic scenario” in this chapter.
Figure 11.1 shows 30-day cumulative effect following an acute exposure to a
given temperature within the range of temperatures observed in Arkhangelsk during
the study period. The effect is measured as an increase in mortality relative to its
minimum, observed at the mean daily temperature of 15.5 �C. To characterize the
extent of variation in temperature-dependent mortality, we will report 30-day
cumulative RRs for all non-accidental deaths, following the exposure to extreme
cold and extreme heat thresholds defined as the 2.5th and the 97.5th percentiles of
location-specific year-round distribution of daily mean temperatures, following
(Gasparrini et al. 2015). Extreme cold: T ¼ �23 �C; cRR¼1.24, 95% CI [1.16,
1.33] and extreme heat: T ¼ 21 �C; cRR¼1.18, [1.13, 1.23]. As expected, cardio-
vascular deaths showed greater relative increases during cold and heat than all
non-accidental deaths, while non-cardiovascular deaths showed smaller (but still
statistically significant) increases. To demonstrate this result clearly, we used the
same scale of the vertical (Y) axis in all graphs.
Now we are ready to calculate attributable fractions. However, before we get to
actual SRES scenarios, it is instructive to consider two hypothetical and very simple
simulations of future temperatures. This example will help the reader to understand
the principal behavior of attributable fractions under changing climate.
– Scenario 1: all daily temperatures will rise by 2 �C; Tf(i)¼ T(i) + 2.– Scenario 2: all daily temperatures will rise by 4 �C; Tf(i)¼ T(i) + 4 for all days i.
The resultant changes in future attributable fractions are summarized in
Table 11.2.
Table 11.1 Monthly
temperature anomalies (�C)and their standard deviations,
projected by the 2050s and
calculated from regional
downscaling of the
predictions from the ensemble
of 16 general circulation
models
SRES scenario B1 A1B A2
January 3.1� 1.8 4.3� 2.0 3.9� 1.4
February 3.4� 1.8 4.2� 1.7 4.3� 1.0
March 2.4� 1.6 3.2� 1.2 2.7� 1.1
April 2.0� 1.2 2.5� 1.4 2.2� 1.5
May 2.0� 1.2 2.3� 1.3 2.2� 1.5
June 1.7� 0.6 2.3� 1.1 2.0� 1.0
July 1.5� 1.0 2.0� 1.0 2.0� 1.2
August 1.6� 1.1 2.1� 1.3 1.9� 1.3
September 1.7� 1.1 2.1� 1.0 2.1� 1.1
October 1.9� 0.9 2.3� 1.2 2.1� 1.1
November 3.2� 1.2 4.3� 1.6 3.6� 1.6
December 3.7� 1.7 4.7� 1.6 4.7� 1.7
Standard errors are mostly attributed to inter-model differences
172 D. Shaposhnikov and B. Revich
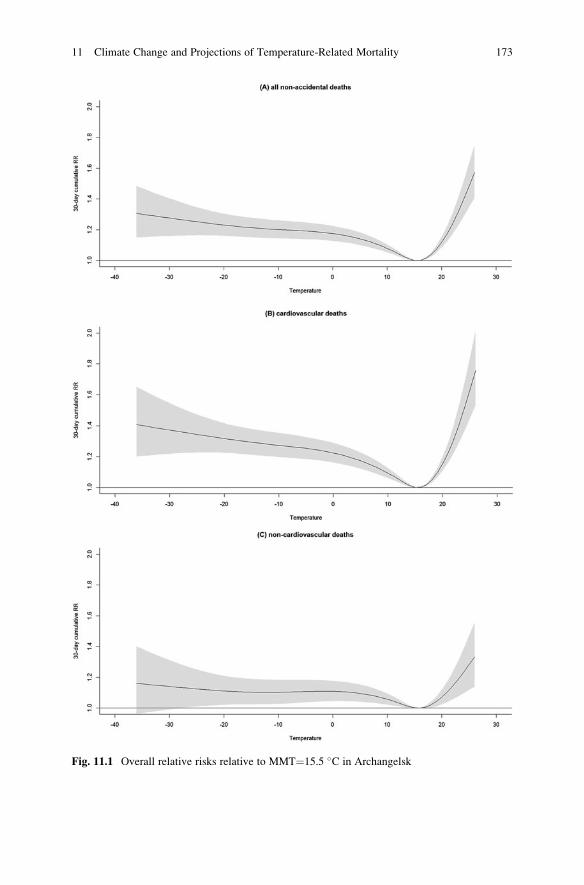
Fig. 11.1 Overall relative risks relative to MMT¼15.5 �C in Archangelsk
11 Climate Change and Projections of Temperature-Related Mortality 173
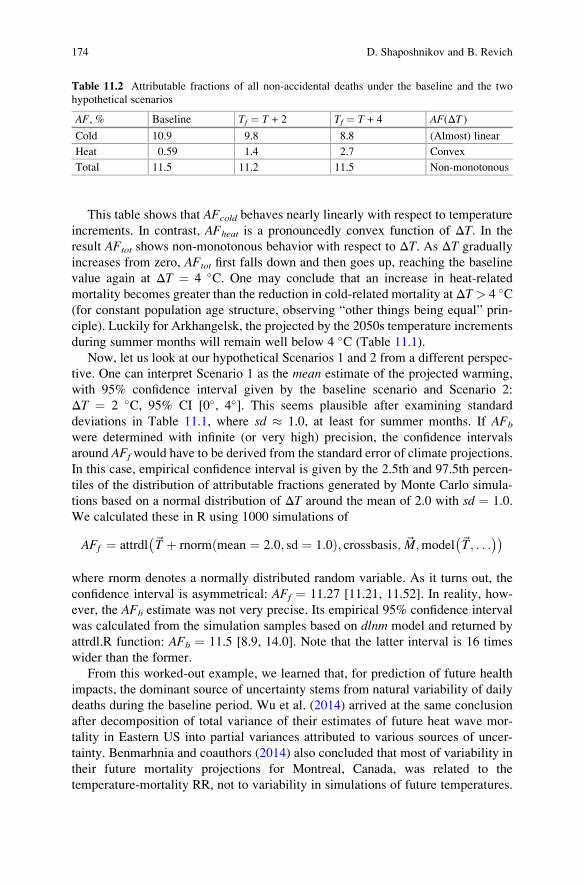
This table shows that AFcold behaves nearly linearly with respect to temperature
increments. In contrast, AFheat is a pronouncedly convex function of ΔT. In the
result AFtot shows non-monotonous behavior with respect to ΔT. As ΔT gradually
increases from zero, AFtot first falls down and then goes up, reaching the baseline
value again at ΔT ¼ 4 �C. One may conclude that an increase in heat-related
mortality becomes greater than the reduction in cold-related mortality at ΔT> 4 �C(for constant population age structure, observing “other things being equal” prin-
ciple). Luckily for Arkhangelsk, the projected by the 2050s temperature increments
during summer months will remain well below 4 �C (Table 11.1).
Now, let us look at our hypothetical Scenarios 1 and 2 from a different perspec-
tive. One can interpret Scenario 1 as the mean estimate of the projected warming,
with 95% confidence interval given by the baseline scenario and Scenario 2:
ΔT ¼ 2 �C, 95% CI [0�, 4�]. This seems plausible after examining standard
deviations in Table 11.1, where sd � 1.0, at least for summer months. If AFb
were determined with infinite (or very high) precision, the confidence intervals
around AFf would have to be derived from the standard error of climate projections.
In this case, empirical confidence interval is given by the 2.5th and 97.5th percen-
tiles of the distribution of attributable fractions generated by Monte Carlo simula-
tions based on a normal distribution of ΔT around the mean of 2.0 with sd ¼ 1.0.
We calculated these in R using 1000 simulations of
AFf ¼ attrdl ~T þ rnorm mean ¼ 2:0; sd ¼ 1:0ð Þ; crossbasis; ~M;model ~T; . . .� �� �
where rnorm denotes a normally distributed random variable. As it turns out, the
confidence interval is asymmetrical: AFf ¼ 11.27 [11.21, 11.52]. In reality, how-
ever, the AFb estimate was not very precise. Its empirical 95% confidence interval
was calculated from the simulation samples based on dlnm model and returned by
attrdl.R function: AFb ¼ 11.5 [8.9, 14.0]. Note that the latter interval is 16 times
wider than the former.
From this worked-out example, we learned that, for prediction of future health
impacts, the dominant source of uncertainty stems from natural variability of daily
deaths during the baseline period. Wu et al. (2014) arrived at the same conclusion
after decomposition of total variance of their estimates of future heat wave mor-
tality in Eastern US into partial variances attributed to various sources of uncer-
tainty. Benmarhnia and coauthors (2014) also concluded that most of variability in
their future mortality projections for Montreal, Canada, was related to the
temperature-mortality RR, not to variability in simulations of future temperatures.
Table 11.2 Attributable fractions of all non-accidental deaths under the baseline and the two
hypothetical scenarios
AF, % Baseline Tf ¼ T + 2 Tf ¼ T + 4 AF(ΔT )Cold 10.9 9.8 8.8 (Almost) linear
Heat 0.59 1.4 2.7 Convex
Total 11.5 11.2 11.5 Non-monotonous
174 D. Shaposhnikov and B. Revich
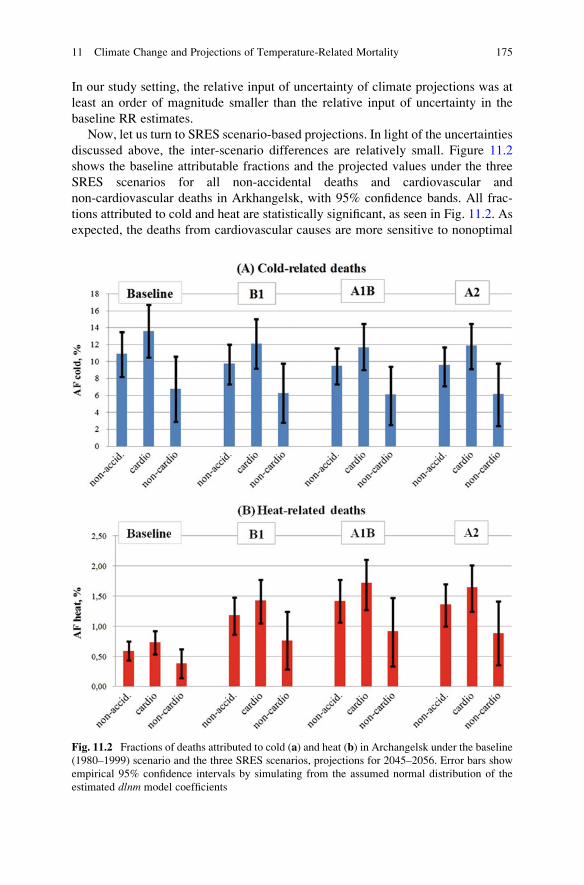
In our study setting, the relative input of uncertainty of climate projections was at
least an order of magnitude smaller than the relative input of uncertainty in the
baseline RR estimates.
Now, let us turn to SRES scenario-based projections. In light of the uncertainties
discussed above, the inter-scenario differences are relatively small. Figure 11.2
shows the baseline attributable fractions and the projected values under the three
SRES scenarios for all non-accidental deaths and cardiovascular and
non-cardiovascular deaths in Arkhangelsk, with 95% confidence bands. All frac-
tions attributed to cold and heat are statistically significant, as seen in Fig. 11.2. As
expected, the deaths from cardiovascular causes are more sensitive to nonoptimal
Fig. 11.2 Fractions of deaths attributed to cold (a) and heat (b) in Archangelsk under the baseline(1980–1999) scenario and the three SRES scenarios, projections for 2045–2056. Error bars show
empirical 95% confidence intervals by simulating from the assumed normal distribution of the
estimated dlnm model coefficients
11 Climate Change and Projections of Temperature-Related Mortality 175
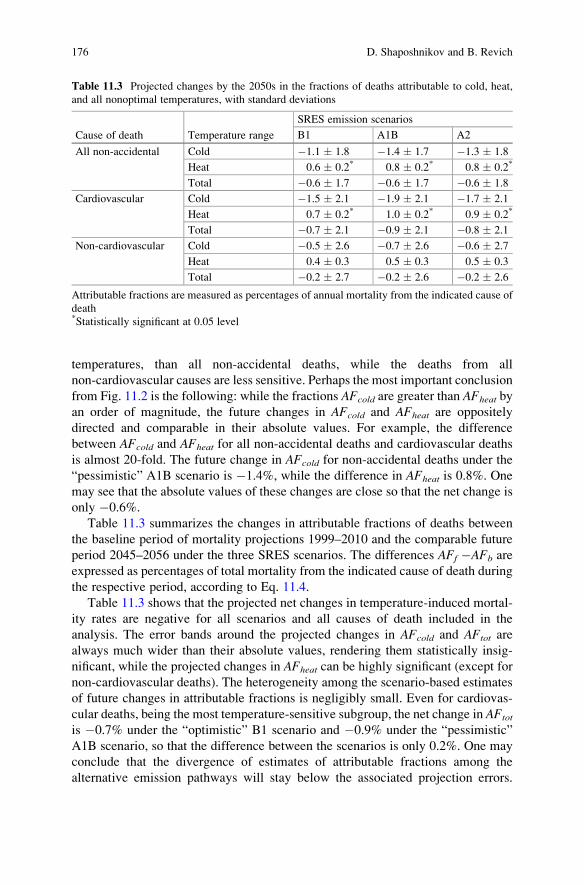
temperatures, than all non-accidental deaths, while the deaths from all
non-cardiovascular causes are less sensitive. Perhaps the most important conclusion
from Fig. 11.2 is the following: while the fractions AFcold are greater than AFheat by
an order of magnitude, the future changes in AFcold and AFheat are oppositely
directed and comparable in their absolute values. For example, the difference
between AFcold and AFheat for all non-accidental deaths and cardiovascular deaths
is almost 20-fold. The future change in AFcold for non-accidental deaths under the
“pessimistic” A1B scenario is �1.4%, while the difference in AFheat is 0.8%. One
may see that the absolute values of these changes are close so that the net change is
only �0.6%.
Table 11.3 summarizes the changes in attributable fractions of deaths between
the baseline period of mortality projections 1999–2010 and the comparable future
period 2045–2056 under the three SRES scenarios. The differences AFf �AFb are
expressed as percentages of total mortality from the indicated cause of death during
the respective period, according to Eq. 11.4.
Table 11.3 shows that the projected net changes in temperature-induced mortal-
ity rates are negative for all scenarios and all causes of death included in the
analysis. The error bands around the projected changes in AFcold and AFtot are
always much wider than their absolute values, rendering them statistically insig-
nificant, while the projected changes in AFheat can be highly significant (except for
non-cardiovascular deaths). The heterogeneity among the scenario-based estimates
of future changes in attributable fractions is negligibly small. Even for cardiovas-
cular deaths, being the most temperature-sensitive subgroup, the net change in AFtot
is �0.7% under the “optimistic” B1 scenario and �0.9% under the “pessimistic”
A1B scenario, so that the difference between the scenarios is only 0.2%. One may
conclude that the divergence of estimates of attributable fractions among the
alternative emission pathways will stay below the associated projection errors.
Table 11.3 Projected changes by the 2050s in the fractions of deaths attributable to cold, heat,
and all nonoptimal temperatures, with standard deviations
Cause of death Temperature range
SRES emission scenarios
B1 A1B A2
All non-accidental Cold �1.1 � 1.8 �1.4 � 1.7 �1.3 � 1.8
Heat 0.6 � 0.2* 0.8 � 0.2* 0.8 � 0.2*
Total �0.6 � 1.7 �0.6 � 1.7 �0.6 � 1.8
Cardiovascular Cold �1.5 � 2.1 �1.9 � 2.1 �1.7 � 2.1
Heat 0.7 � 0.2* 1.0 � 0.2* 0.9 � 0.2*
Total �0.7 � 2.1 �0.9 � 2.1 �0.8 � 2.1
Non-cardiovascular Cold �0.5 � 2.6 �0.7 � 2.6 �0.6 � 2.7
Heat 0.4 � 0.3 0.5 � 0.3 0.5 � 0.3
Total �0.2 � 2.7 �0.2 � 2.6 �0.2 � 2.6
Attributable fractions are measured as percentages of annual mortality from the indicated cause of
death*Statistically significant at 0.05 level
176 D. Shaposhnikov and B. Revich
However, it is very likely that the global warming scenarios will diverge in more
distant future, and by the 2080s, the heat-related increment will outweigh the cold-
related decrement in deaths.
Discussion
To our best knowledge, this is the first study which implemented distributed lag
nonlinear models for assessment of future impacts of global warming on mortality
rates. The authors measured the impacts of climate change on mortality by the
changes in attributable fractions of deaths. These fractions were calculated sepa-
rately for cold and heat; the sum of these gives the fraction of deaths attributed to
nonoptimal temperatures. The reference value in the applied AF measure corre-
sponds to an imaginary situation when all days of the study period have the optimal
temperature. Thus, the existence of such temperature becomes an essential prereq-
uisite, and the effect measure is based on a “counterfactual condition” meaning that
the reference state never actually occurred.
All nonoptimal temperatures will cause excess deaths. For example, all days
with T < 15.5 �C will produce cold-related deaths in Arkhangelsk, even though
these days cannot be considered “cold” in the ordinary sense of the word. As the
average temperatures of June and August in Arkhangelsk are close to 13 �C, most
summer days will contribute to cold-related deaths. Surely, some of cold-related
and heat-related deaths can be avoided, but the extent to which temperature-related
deaths can be prevented is not discussed here.
It is important to note that the attributable fractions are calculated by dividing the
attributable numbers by total mortality Mtot (Eq. 11.4). Therefore, the projected
changes in the attributable fractions will always have Mtot in the denominator. For
this reason, these changes seem to be fairly small, and surely not as impressive as
the results reported in many other studies of anticipated future burdens of global
warming. An informative synthesis of such results can be found in a systematic
review by Huang et al. (2011). The reason is that other studies used different metric:
they usually reported the projections of future heat-related mortality, which could
increase by several times compared to the current heat-related mortality. In other
words, these studies used different denominator, i.e., the baseline ANheat. Our
results may be easily recalculated in this way. For example, an increase in AFheat
for non-accidental deaths from 0.59% in the baseline to 1.42% in A1B in Table 11.2
means more than twofold increase in heat-related deaths, which corresponds to the
conclusion of Cheng et al. (2009), who projected that heat-related mortality in four
Canadian cities would more than double by the 2050s. Of course, such recalculation
cannot change the main conclusion of this paper: the projected net decrease in totaltemperature-related deaths.
In most international studies of future impacts of global warming on public
health, heat waves have gained much focus and attention. In this study, we
purposefully left heat waves and cold spells out of the equation, because the relative
11 Climate Change and Projections of Temperature-Related Mortality 177
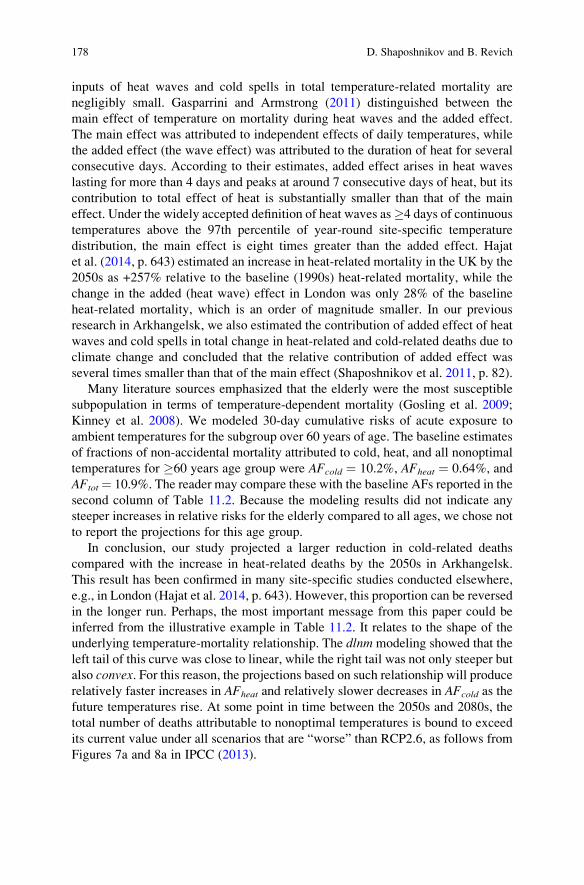
inputs of heat waves and cold spells in total temperature-related mortality are
negligibly small. Gasparrini and Armstrong (2011) distinguished between the
main effect of temperature on mortality during heat waves and the added effect.
The main effect was attributed to independent effects of daily temperatures, while
the added effect (the wave effect) was attributed to the duration of heat for several
consecutive days. According to their estimates, added effect arises in heat waves
lasting for more than 4 days and peaks at around 7 consecutive days of heat, but its
contribution to total effect of heat is substantially smaller than that of the main
effect. Under the widely accepted definition of heat waves as�4 days of continuous
temperatures above the 97th percentile of year-round site-specific temperature
distribution, the main effect is eight times greater than the added effect. Hajat
et al. (2014, p. 643) estimated an increase in heat-related mortality in the UK by the
2050s as +257% relative to the baseline (1990s) heat-related mortality, while the
change in the added (heat wave) effect in London was only 28% of the baseline
heat-related mortality, which is an order of magnitude smaller. In our previous
research in Arkhangelsk, we also estimated the contribution of added effect of heat
waves and cold spells in total change in heat-related and cold-related deaths due to
climate change and concluded that the relative contribution of added effect was
several times smaller than that of the main effect (Shaposhnikov et al. 2011, p. 82).
Many literature sources emphasized that the elderly were the most susceptible
subpopulation in terms of temperature-dependent mortality (Gosling et al. 2009;
Kinney et al. 2008). We modeled 30-day cumulative risks of acute exposure to
ambient temperatures for the subgroup over 60 years of age. The baseline estimates
of fractions of non-accidental mortality attributed to cold, heat, and all nonoptimal
temperatures for �60 years age group were AFcold ¼ 10.2%, AFheat ¼ 0.64%, and
AFtot¼ 10.9%. The reader may compare these with the baseline AFs reported in the
second column of Table 11.2. Because the modeling results did not indicate any
steeper increases in relative risks for the elderly compared to all ages, we chose not
to report the projections for this age group.
In conclusion, our study projected a larger reduction in cold-related deaths
compared with the increase in heat-related deaths by the 2050s in Arkhangelsk.
This result has been confirmed in many site-specific studies conducted elsewhere,
e.g., in London (Hajat et al. 2014, p. 643). However, this proportion can be reversed
in the longer run. Perhaps, the most important message from this paper could be
inferred from the illustrative example in Table 11.2. It relates to the shape of the
underlying temperature-mortality relationship. The dlnm modeling showed that the
left tail of this curve was close to linear, while the right tail was not only steeper but
also convex. For this reason, the projections based on such relationship will producerelatively faster increases in AFheat and relatively slower decreases in AFcold as the
future temperatures rise. At some point in time between the 2050s and 2080s, the
total number of deaths attributable to nonoptimal temperatures is bound to exceed
its current value under all scenarios that are “worse” than RCP2.6, as follows from
Figures 7a and 8a in IPCC (2013).
178 D. Shaposhnikov and B. Revich
Acknowledgments Funding source: The research has been supported by the grant program of
Russian Science Foundation, Project No. 16-18-10324. “Human in Megalopolis: Economic,
Demographic and Ecological Features”. The authors highlight the input of their colleagues from
Voeikov Main Geophysical Observatory in Saint-Petersburg, Russian Federation, who developed
regional climate projections for this study: Valentin Meleshko, Veronika Govorkova, and Tatyana
Pavlova.
References
ACIA (2005) Impacts of a warming arctic: arctic climate impact assessment. Cambridge Univer-
sity Press, New York. http://www.acia.uaf.edu/pages/overview.html
Benmarhnia T, Sottile MF, Plante C, Brand A, Casati B, Fournier M, Smargiass A (2014)
Variability in temperature-related mortality projections under climate change. Environ Health
Perspect 122:1293–1298. http://dx.doi.org/10.1289/ehp.1306954
Cheng CS, Campbell M, Li Q, Li G, Auld H, Day N et al (2009) Differential and combined impacts
of extreme temperatures and air pollution on human mortality in south-central Canada. Part II:
future estimates. Air Qual Atmos Health 1(4):223–235
Gasparrini A (2011) Distributed lag linear and non-linear models in R: the package dlnm. J Stat
Softw 43(8):1–20. http://www.jstatsoft.org/v43/i08/
Gasparrini A, Armstrong B (2011) The impact of heat waves on mortality. Epidemiology 22
(1):68–73. http://doi.org/10.1097/EDE.0b013e3181fdcd99
Gasparrini A, Leone M (2014) Attributable risk from distributed lag models. BMC Med Res
Methodol 14:55. http://www.biomedcentral.com/1471-2288/14/55
Gasparrini A, Armstrong B, Kenward MG (2010) Distributed lag non-linear models. Stat Med 29
(21):2224–2234. http://doi.org/10.1002/sim.3940
Gasparrini A, Guo Y, Hashizume M, Lavigne E et al (2015) Mortality risk attributable to high and
low ambient temperature: a multicountry observational study. Lancet 386:369–375. doi:10.
1016/S0140-6736(14)62114-0
Gosling SN, Lowe JA, McGregor GR et al (2009) Associations between elevated atmospheric
temperature and human mortality: a critical review of the literature. Clim Chang 92:299–341
Grjibovski AM, Bushueva V, Boltenkov VP et al (2012) Climate variations and salmonellosis in
northwest Russia: a time-series analysis. Epidemiol Infect 141(2):1–8. doi:10.1017/
S0950268812000544
Hajat S, Vardoulakis C, Sotiris E, Heaviside B (2014) Climate change effects on human health:
projections of temperature-related mortality for the UK during the 2020s, 2050s and 2080s. J
Epidemiol Community Health 68:641–648. doi:10.1136/jech-2013-202449
Huang C, Barnett AG, Wang X, Vaneckova P, FitzGerald G, Tong S (2011) Projecting future heat-
related mortality under climate change scenarios: a systematic review. Environ Health Perspect
119(12):1681–1690. http://doi.org/10.1289/ehp.1103456
IPCC (2013) Summary for policymakers. In: Stocker TF, Qin D, Plattner G-K, Tignor M, Allen
SK, Boschung J, Nauels A, Xia Y, Bex V, Midgley PM (eds) Climate change 2013: the
physical science basis. Contribution of working group I to the fifth assessment report of the
intergovernmental panel on climate change. Cambridge University Press, New York
Kinney PL, O’Neill MS, Bell ML et al (2008) Approaches for estimating effects of climate-change
on heat-related deaths: challenges and opportunities. Environ Sci Pol 11(1):87–96. http://dx.
doi.org/10.1016/j.envsci.2007.08.001
Nakicenovic N, Davidson O, Davis G, Grübler A, Kram T, Rovere ELL et al (2000) Special report
on emissions scenarios: a special report of working group III of the IPCC. Cambridge
University Press, New York
11 Climate Change and Projections of Temperature-Related Mortality 179
R Core Team (2016) R: a language and environment for statistical computing. R Foundation for
Statistical Computing, Vienna. https://www.R-project.org/
Shaposhnikov D, Revich B (2016) Towards meta-analysis of impacts of heat and cold waves on
mortality in Russian north. Urban Clim 15:16–24. doi:10.1016/j.uclim.2015.11.007
Shaposhnikov D, Revich B, Meleshko V, Govorkova V, Pavlova T (2011) Climate change may
reduce annual temperature-dependent mortality in subarctic: a case study of Archangelsk,
Russian Federation. Environ Nat Resour Res 1:75–91. doi:10.5539/ enrr.v1n1p75
Shaposhnikov D, Revich B, Bellander T, Bedada GB, Bottai M, Kharkova T, Kvasha E, Lezina E,
Lind T, Semutnikova E, Pershagen G (2014) Mortality related to interactions between heat
wave and wildfire air pollution during the summer of 2010 in Moscow. Epidemiology
25:359–364. doi:10.1097/EDE.0000000000000090
Shaposhnikov D, Revich B, Bellander T, Bedada GB, Bottai M, Kharkova T, Kvasha E, Lezina E,
Lind T, Pershagen G (2015) Long-term impact of Moscow heat wave and wildfires on
mortality. Epidemiology 26:e21–e22. doi:10.1097/EDE.0000000000000251
Tokarevich N, Tronin A, Blinova O, Buzinov R, Boltenkov V, Yurasova E, Nurse J (2011) The
impact of climate change on the expansion of Ixodes persulcatus habitat and the incidence of
tick borne encephalitis in the north of European Russia. Global Health Act 4:8448. doi:10.
3402/gha.v4i0.8448
Wu J, Zhou Y, Gao Y, Fu JS, Johnson BA, Huang C, Kim YM, Liu Y (2014) Estimation and
uncertainty analysis of impacts of future heat waves on mortality in the eastern United States.
Environ Health Perspect 122:10–16. http://dx.doi.org/10.1289/ehp.1306670
Dmitry Shaposhnikov Dmitry Shaposhnikov Laboratory of Forecasting of Environmental Qual-
ity and Human Health, Institute of Economic Forecasting of Russian Academy of Sciences,
Nakhimovsky Prospect 47, Moscow 117418, Russia
Boris Revich Laboratory of Forecasting of Environmental Quality and Human Health, Institute of
Economic Forecasting of Russian Academy of Sciences, Nakhimovsky Prospect 47, Moscow
117418, Russia
180 D. Shaposhnikov and B. Revich
Chapter 12
Climate Change and Air Qualityin Southeastern China: Hong Kong Study
Yun Fat Lam
Abstract As climate change continues to unfold over the next several decades in
response to increasing levels of greenhouse gases (GHGs) in the atmosphere, the
effects of climate change and future air quality will be more noticeable and
observable. Understanding future climate and air quality has become one of the
highest priorities for many countries and individual cities, where mitigation and
adaptation could be planned. In Hong Kong, local government has pledged to
reduce the GHG emissions by 60–65% from the 2005 level (i.e., 40 million tonnes
CO2 equivalent (CO2e) in 2005) by 2030. The reduction focuses mainly on local
energy saving, alternative transportation, and green energy generation. As Hong
Kong moves into less carbon-intense technologies in both transportation and energy
sectors, this much needed change will benefit the city’s local air quality. Currently,no long-term carbon reduction plan for 2050 has been identified in the government.
In terms of future air quality projections, strong relationships between emissions
and pollutant concentrations have been observed in Southeastern China under the
IPCC AR5 scenarios, where the reduction of regional emissions (e.g., SO2, NOx,
and PM) has a great effect on future PM2.5 air quality. Overall, PM2.5 air quality
over Pearl River Delta region has shown a clear improvement in 2050 under
RCP8.5 emission scenario, with a mean concentration reduction of 5–15% (up to
12 μg/m3). For ozone, a slight increase (i.e., 0–3%) of annual mean has been projected,
which may be due to the combined effect of slow emission reduction of NMVOCs and
less NOx titration in the VOCs limited regime. In addition, some studies also projected
the increase of typhoons tracking near Taiwan Strait in the future climatewould increase
the occurrence of summer ozone episodes in Hong Kong.
Keywords Climate change • Carbon reduction • Hong Kong • Future air quality •
O3 • PM2.5 • Tropical cyclone
Y.F. Lam (*)
School of Energy and Environment, City University of Hong Kong, HKSAR, Kowloon Tong,
Hong Kong
Guy Carpenter Asia-Pacific Climate Impact Centre, City University of Hong Kong, HKSAR,
Kowloon Tong, Hong Kong
e-mail: [email protected]
© Springer International Publishing AG 2018
R. Akhtar, C. Palagiano (eds.), Climate Change and Air Pollution,Springer Climate, DOI 10.1007/978-3-319-61346-8_12
181
Introduction
The earth’s climate is changing dramatically as a result of human activities.
Continued emission of greenhouse gases and air pollutants (i.e., short-lived climate
forcers) has modified the natural balance of solar radiation on our planet. Green-
house gases (GHGs) have caused heat to be retained in our earth system, triggering
global warming and climate change, which results in rising global average air and
ocean temperatures, changing distribution of precipitation, modifying regional air
circulation, and even air quality. It is a global challenge faced by everyone,
regardless of their size of government and its role in the national status. This
chapter summarizes (1) present status of Hong Kong air pollution, (2) climate
mitigation plan for Hong Kong, (3) potential co-benefits of air quality from climate
mitigation, and (4) projection of future air quality in Southeastern China.
Characteristics of the Study Area
Climate and Geographical Location
Hong Kong is located at the estuary of the Pearl River Delta (PRD) in China
surrounded by mountains and ocean. It lies between latitude 22� 080 North and
22� 350 North and longitude 113� 490 East and 114� 310 East, with subtropical
climate that tends toward temperate climate for half of the year (HKO 2003). It has
four distinct seasons, which are warm and humid spring (March and April), hot and
rainy summer (May, June, July, and August), pleasant and sunny autumn
(September and October), and cool and dry winter (November, December, January,
and February). The daily average temperature ranges from 12 to 31 �C and can
reach up to 36 �C in some areas due to the enhancement of the urban heat island
(UHI), which intensifies the urban temperature as a result of poor ventilation and
heat trapped by buildings. The prevailing direction of wind in Hong Kong follows
the large-scale East Asia monsoon circulation. In summer, direction tends to be
southwesterly, bringing humid marine air to the land. In winter, a persistent
northeastern wind carries relatively cold air from the north. Occasionally, Hong
Kong experiences tropical cyclones from the Western North Pacific or the South
China Sea in summer and autumn. These tropical cyclones not only bring the
potential issue of storm surge, mudslides, and heavy precipitation but also extreme
heat and air pollution to Hong Kong.
182 Y.F. Lam
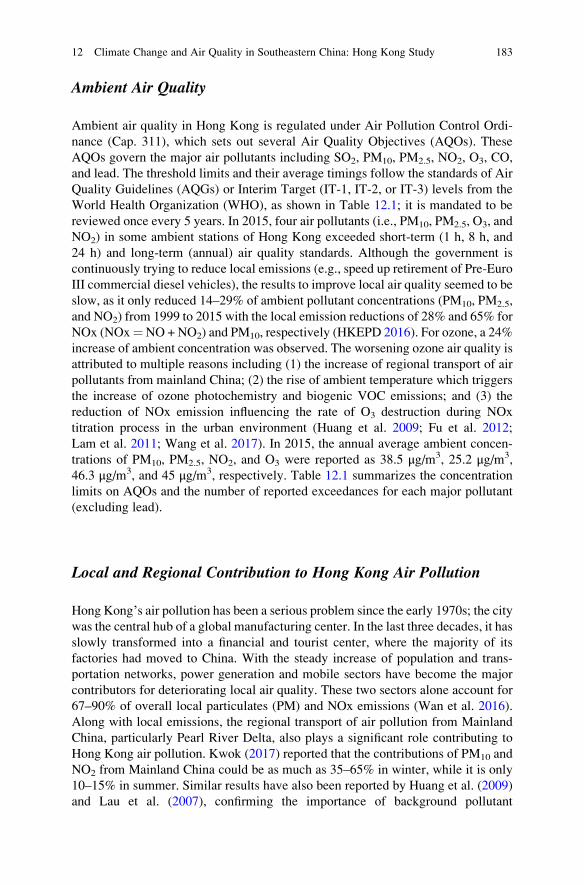
Ambient Air Quality
Ambient air quality in Hong Kong is regulated under Air Pollution Control Ordi-
nance (Cap. 311), which sets out several Air Quality Objectives (AQOs). These
AQOs govern the major air pollutants including SO2, PM10, PM2.5, NO2, O3, CO,
and lead. The threshold limits and their average timings follow the standards of Air
Quality Guidelines (AQGs) or Interim Target (IT-1, IT-2, or IT-3) levels from the
World Health Organization (WHO), as shown in Table 12.1; it is mandated to be
reviewed once every 5 years. In 2015, four air pollutants (i.e., PM10, PM2.5, O3, and
NO2) in some ambient stations of Hong Kong exceeded short-term (1 h, 8 h, and
24 h) and long-term (annual) air quality standards. Although the government is
continuously trying to reduce local emissions (e.g., speed up retirement of Pre-Euro
III commercial diesel vehicles), the results to improve local air quality seemed to be
slow, as it only reduced 14–29% of ambient pollutant concentrations (PM10, PM2.5,
and NO2) from 1999 to 2015 with the local emission reductions of 28% and 65% for
NOx (NOx¼NO + NO2) and PM10, respectively (HKEPD 2016). For ozone, a 24%
increase of ambient concentration was observed. The worsening ozone air quality is
attributed to multiple reasons including (1) the increase of regional transport of air
pollutants from mainland China; (2) the rise of ambient temperature which triggers
the increase of ozone photochemistry and biogenic VOC emissions; and (3) the
reduction of NOx emission influencing the rate of O3 destruction during NOx
titration process in the urban environment (Huang et al. 2009; Fu et al. 2012;
Lam et al. 2011; Wang et al. 2017). In 2015, the annual average ambient concen-
trations of PM10, PM2.5, NO2, and O3 were reported as 38.5 μg/m3, 25.2 μg/m3,
46.3 μg/m3, and 45 μg/m3, respectively. Table 12.1 summarizes the concentration
limits on AQOs and the number of reported exceedances for each major pollutant
(excluding lead).
Local and Regional Contribution to Hong Kong Air Pollution
Hong Kong’s air pollution has been a serious problem since the early 1970s; the city
was the central hub of a global manufacturing center. In the last three decades, it has
slowly transformed into a financial and tourist center, where the majority of its
factories had moved to China. With the steady increase of population and trans-
portation networks, power generation and mobile sectors have become the major
contributors for deteriorating local air quality. These two sectors alone account for
67–90% of overall local particulates (PM) and NOx emissions (Wan et al. 2016).
Along with local emissions, the regional transport of air pollution from Mainland
China, particularly Pearl River Delta, also plays a significant role contributing to
Hong Kong air pollution. Kwok (2017) reported that the contributions of PM10 and
NO2 from Mainland China could be as much as 35–65% in winter, while it is only
10–15% in summer. Similar results have also been reported by Huang et al. (2009)
and Lau et al. (2007), confirming the importance of background pollutant
12 Climate Change and Air Quality in Southeastern China: Hong Kong Study 183
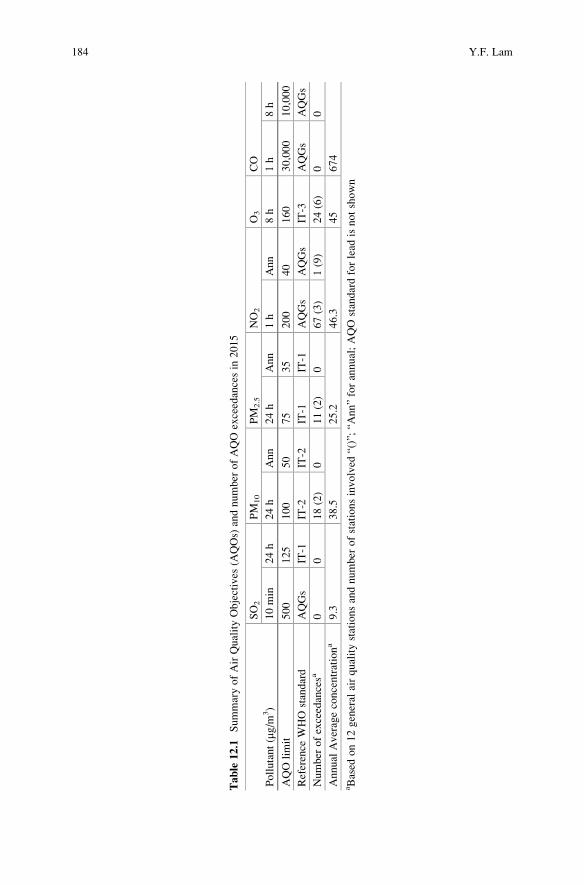
Table
12.1
SummaryofAirQualityObjectives
(AQOs)
andnumber
ofAQO
exceedancesin
2015
Pollutant(μg/m
3)
SO2
PM
10
PM
2.5
NO2
O3
CO
10min
24h
24h
Ann
24h
Ann
1h
Ann
8h
1h
8h
AQO
limit
500
125
100
50
75
35
200
40
160
30,000
10,000
Reference
WHO
standard
AQGs
IT-1
IT-2
IT-2
IT-1
IT-1
AQGs
AQGs
IT-3
AQGs
AQGs
Number
ofexceedancesa
00
18(2)
011(2)
067(3)
1(9)
24(6)
00
Annual
Averageconcentrationa
9.3
38.5
25.2
46.3
45
674
aBased
on12general
airqualitystationsandnumber
ofstationsinvolved
“()”;“A
nn”forannual;AQO
standardforlead
isnotshown
184 Y.F. Lam
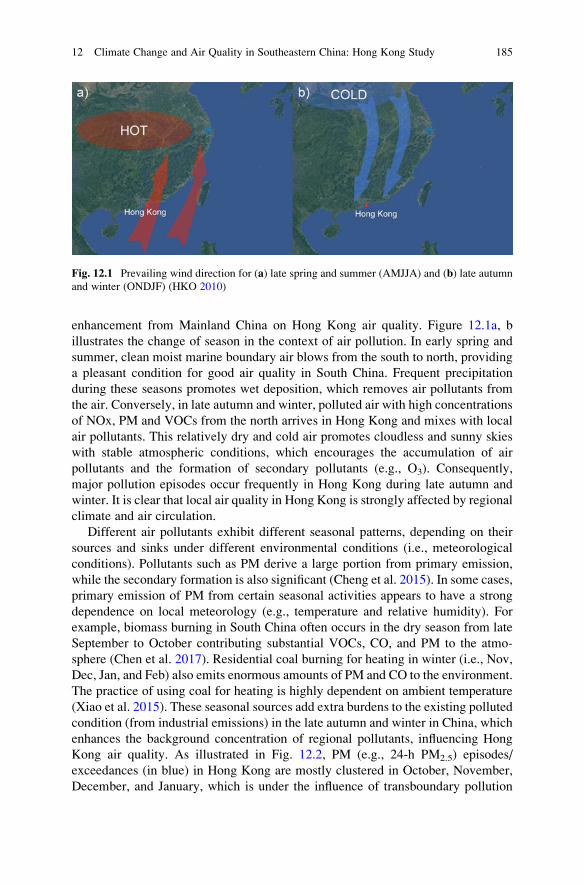
enhancement from Mainland China on Hong Kong air quality. Figure 12.1a, b
illustrates the change of season in the context of air pollution. In early spring and
summer, clean moist marine boundary air blows from the south to north, providing
a pleasant condition for good air quality in South China. Frequent precipitation
during these seasons promotes wet deposition, which removes air pollutants from
the air. Conversely, in late autumn and winter, polluted air with high concentrations
of NOx, PM and VOCs from the north arrives in Hong Kong and mixes with local
air pollutants. This relatively dry and cold air promotes cloudless and sunny skies
with stable atmospheric conditions, which encourages the accumulation of air
pollutants and the formation of secondary pollutants (e.g., O3). Consequently,
major pollution episodes occur frequently in Hong Kong during late autumn and
winter. It is clear that local air quality in Hong Kong is strongly affected by regional
climate and air circulation.
Different air pollutants exhibit different seasonal patterns, depending on their
sources and sinks under different environmental conditions (i.e., meteorological
conditions). Pollutants such as PM derive a large portion from primary emission,
while the secondary formation is also significant (Cheng et al. 2015). In some cases,
primary emission of PM from certain seasonal activities appears to have a strong
dependence on local meteorology (e.g., temperature and relative humidity). For
example, biomass burning in South China often occurs in the dry season from late
September to October contributing substantial VOCs, CO, and PM to the atmo-
sphere (Chen et al. 2017). Residential coal burning for heating in winter (i.e., Nov,
Dec, Jan, and Feb) also emits enormous amounts of PM and CO to the environment.
The practice of using coal for heating is highly dependent on ambient temperature
(Xiao et al. 2015). These seasonal sources add extra burdens to the existing polluted
condition (from industrial emissions) in the late autumn and winter in China, which
enhances the background concentration of regional pollutants, influencing Hong
Kong air quality. As illustrated in Fig. 12.2, PM (e.g., 24-h PM2.5) episodes/
exceedances (in blue) in Hong Kong are mostly clustered in October, November,
December, and January, which is under the influence of transboundary pollution
Fig. 12.1 Prevailing wind direction for (a) late spring and summer (AMJJA) and (b) late autumn
and winter (ONDJF) (HKO 2010)
12 Climate Change and Air Quality in Southeastern China: Hong Kong Study 185
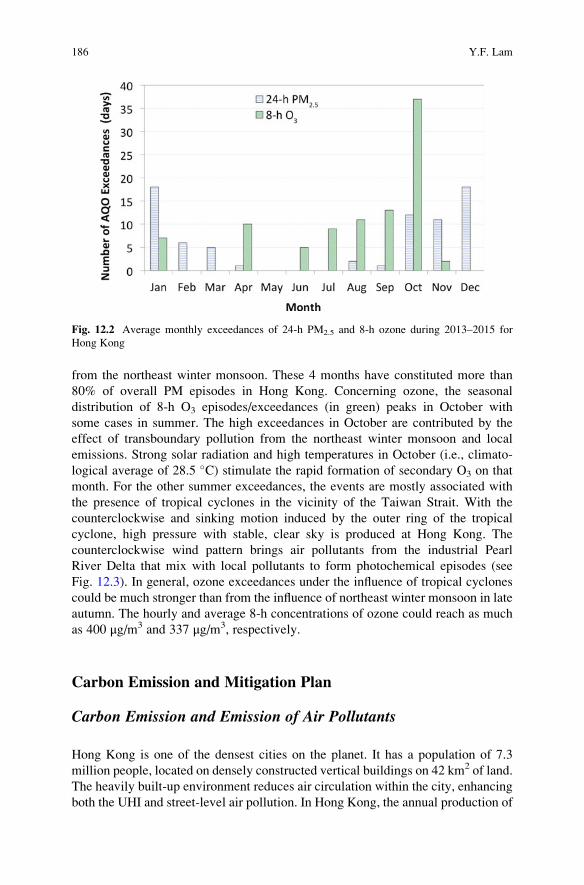
from the northeast winter monsoon. These 4 months have constituted more than
80% of overall PM episodes in Hong Kong. Concerning ozone, the seasonal
distribution of 8-h O3 episodes/exceedances (in green) peaks in October with
some cases in summer. The high exceedances in October are contributed by the
effect of transboundary pollution from the northeast winter monsoon and local
emissions. Strong solar radiation and high temperatures in October (i.e., climato-
logical average of 28.5 �C) stimulate the rapid formation of secondary O3 on that
month. For the other summer exceedances, the events are mostly associated with
the presence of tropical cyclones in the vicinity of the Taiwan Strait. With the
counterclockwise and sinking motion induced by the outer ring of the tropical
cyclone, high pressure with stable, clear sky is produced at Hong Kong. The
counterclockwise wind pattern brings air pollutants from the industrial Pearl
River Delta that mix with local pollutants to form photochemical episodes (see
Fig. 12.3). In general, ozone exceedances under the influence of tropical cyclones
could be much stronger than from the influence of northeast winter monsoon in late
autumn. The hourly and average 8-h concentrations of ozone could reach as much
as 400 μg/m3 and 337 μg/m3, respectively.
Carbon Emission and Mitigation Plan
Carbon Emission and Emission of Air Pollutants
Hong Kong is one of the densest cities on the planet. It has a population of 7.3
million people, located on densely constructed vertical buildings on 42 km2 of land.
The heavily built-up environment reduces air circulation within the city, enhancing
both the UHI and street-level air pollution. In Hong Kong, the annual production of
Fig. 12.2 Average monthly exceedances of 24-h PM2.5 and 8-h ozone during 2013–2015 for
Hong Kong
186 Y.F. Lam
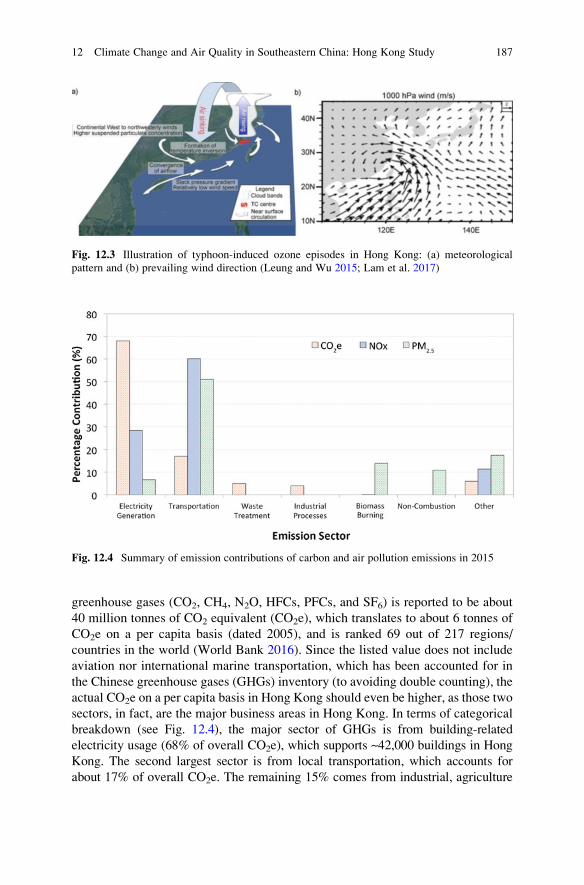
greenhouse gases (CO2, CH4, N2O, HFCs, PFCs, and SF6) is reported to be about
40 million tonnes of CO2 equivalent (CO2e), which translates to about 6 tonnes of
CO2e on a per capita basis (dated 2005), and is ranked 69 out of 217 regions/
countries in the world (World Bank 2016). Since the listed value does not include
aviation nor international marine transportation, which has been accounted for in
the Chinese greenhouse gases (GHGs) inventory (to avoiding double counting), the
actual CO2e on a per capita basis in Hong Kong should even be higher, as those two
sectors, in fact, are the major business areas in Hong Kong. In terms of categorical
breakdown (see Fig. 12.4), the major sector of GHGs is from building-related
electricity usage (68% of overall CO2e), which supports ~42,000 buildings in Hong
Kong. The second largest sector is from local transportation, which accounts for
about 17% of overall CO2e. The remaining 15% comes from industrial, agriculture
Fig. 12.3 Illustration of typhoon-induced ozone episodes in Hong Kong: (a) meteorological
pattern and (b) prevailing wind direction (Leung and Wu 2015; Lam et al. 2017)
Fig. 12.4 Summary of emission contributions of carbon and air pollution emissions in 2015
12 Climate Change and Air Quality in Southeastern China: Hong Kong Study 187
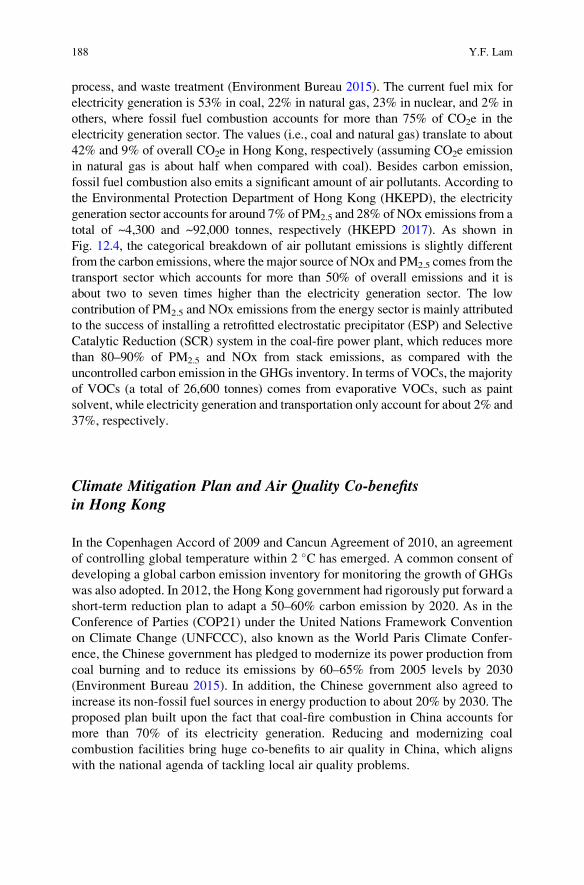
process, and waste treatment (Environment Bureau 2015). The current fuel mix for
electricity generation is 53% in coal, 22% in natural gas, 23% in nuclear, and 2% in
others, where fossil fuel combustion accounts for more than 75% of CO2e in the
electricity generation sector. The values (i.e., coal and natural gas) translate to about
42% and 9% of overall CO2e in Hong Kong, respectively (assuming CO2e emission
in natural gas is about half when compared with coal). Besides carbon emission,
fossil fuel combustion also emits a significant amount of air pollutants. According to
the Environmental Protection Department of Hong Kong (HKEPD), the electricity
generation sector accounts for around 7% of PM2.5 and 28% of NOx emissions from a
total of ~4,300 and ~92,000 tonnes, respectively (HKEPD 2017). As shown in
Fig. 12.4, the categorical breakdown of air pollutant emissions is slightly different
from the carbon emissions, where the major source of NOx and PM2.5 comes from the
transport sector which accounts for more than 50% of overall emissions and it is
about two to seven times higher than the electricity generation sector. The low
contribution of PM2.5 and NOx emissions from the energy sector is mainly attributed
to the success of installing a retrofitted electrostatic precipitator (ESP) and Selective
Catalytic Reduction (SCR) system in the coal-fire power plant, which reduces more
than 80–90% of PM2.5 and NOx from stack emissions, as compared with the
uncontrolled carbon emission in the GHGs inventory. In terms of VOCs, the majority
of VOCs (a total of 26,600 tonnes) comes from evaporative VOCs, such as paint
solvent, while electricity generation and transportation only account for about 2% and
37%, respectively.
Climate Mitigation Plan and Air Quality Co-benefitsin Hong Kong
In the Copenhagen Accord of 2009 and Cancun Agreement of 2010, an agreement
of controlling global temperature within 2 �C has emerged. A common consent of
developing a global carbon emission inventory for monitoring the growth of GHGs
was also adopted. In 2012, the Hong Kong government had rigorously put forward a
short-term reduction plan to adapt a 50–60% carbon emission by 2020. As in the
Conference of Parties (COP21) under the United Nations Framework Convention
on Climate Change (UNFCCC), also known as the World Paris Climate Confer-
ence, the Chinese government has pledged to modernize its power production from
coal burning and to reduce its emissions by 60–65% from 2005 levels by 2030
(Environment Bureau 2015). In addition, the Chinese government also agreed to
increase its non-fossil fuel sources in energy production to about 20% by 2030. The
proposed plan built upon the fact that coal-fire combustion in China accounts for
more than 70% of its electricity generation. Reducing and modernizing coal
combustion facilities bring huge co-benefits to air quality in China, which aligns
with the national agenda of tackling local air quality problems.
188 Y.F. Lam
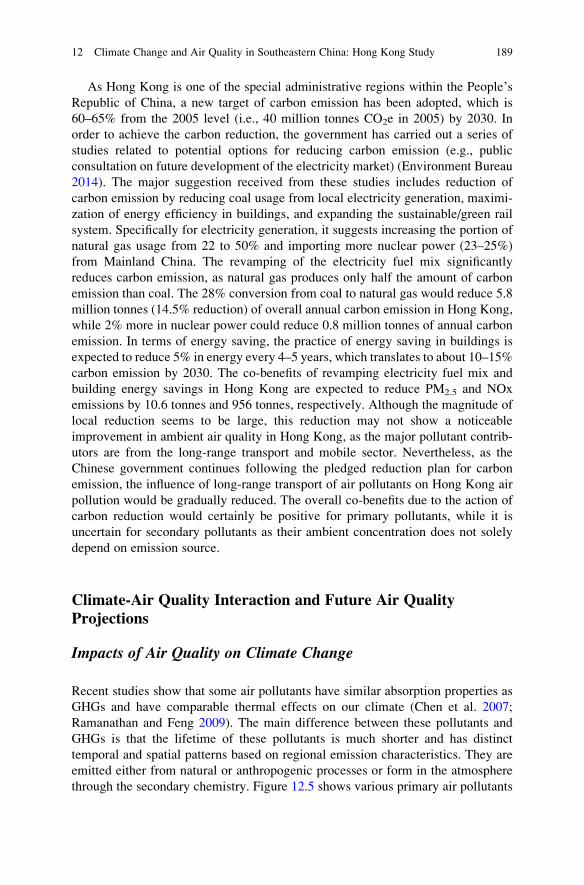
As Hong Kong is one of the special administrative regions within the People’sRepublic of China, a new target of carbon emission has been adopted, which is
60–65% from the 2005 level (i.e., 40 million tonnes CO2e in 2005) by 2030. In
order to achieve the carbon reduction, the government has carried out a series of
studies related to potential options for reducing carbon emission (e.g., public
consultation on future development of the electricity market) (Environment Bureau
2014). The major suggestion received from these studies includes reduction of
carbon emission by reducing coal usage from local electricity generation, maximi-
zation of energy efficiency in buildings, and expanding the sustainable/green rail
system. Specifically for electricity generation, it suggests increasing the portion of
natural gas usage from 22 to 50% and importing more nuclear power (23–25%)
from Mainland China. The revamping of the electricity fuel mix significantly
reduces carbon emission, as natural gas produces only half the amount of carbon
emission than coal. The 28% conversion from coal to natural gas would reduce 5.8
million tonnes (14.5% reduction) of overall annual carbon emission in Hong Kong,
while 2% more in nuclear power could reduce 0.8 million tonnes of annual carbon
emission. In terms of energy saving, the practice of energy saving in buildings is
expected to reduce 5% in energy every 4–5 years, which translates to about 10–15%
carbon emission by 2030. The co-benefits of revamping electricity fuel mix and
building energy savings in Hong Kong are expected to reduce PM2.5 and NOx
emissions by 10.6 tonnes and 956 tonnes, respectively. Although the magnitude of
local reduction seems to be large, this reduction may not show a noticeable
improvement in ambient air quality in Hong Kong, as the major pollutant contrib-
utors are from the long-range transport and mobile sector. Nevertheless, as the
Chinese government continues following the pledged reduction plan for carbon
emission, the influence of long-range transport of air pollutants on Hong Kong air
pollution would be gradually reduced. The overall co-benefits due to the action of
carbon reduction would certainly be positive for primary pollutants, while it is
uncertain for secondary pollutants as their ambient concentration does not solely
depend on emission source.
Climate-Air Quality Interaction and Future Air QualityProjections
Impacts of Air Quality on Climate Change
Recent studies show that some air pollutants have similar absorption properties as
GHGs and have comparable thermal effects on our climate (Chen et al. 2007;
Ramanathan and Feng 2009). The main difference between these pollutants and
GHGs is that the lifetime of these pollutants is much shorter and has distinct
temporal and spatial patterns based on regional emission characteristics. They are
emitted either from natural or anthropogenic processes or form in the atmosphere
through the secondary chemistry. Figure 12.5 shows various primary air pollutants
12 Climate Change and Air Quality in Southeastern China: Hong Kong Study 189
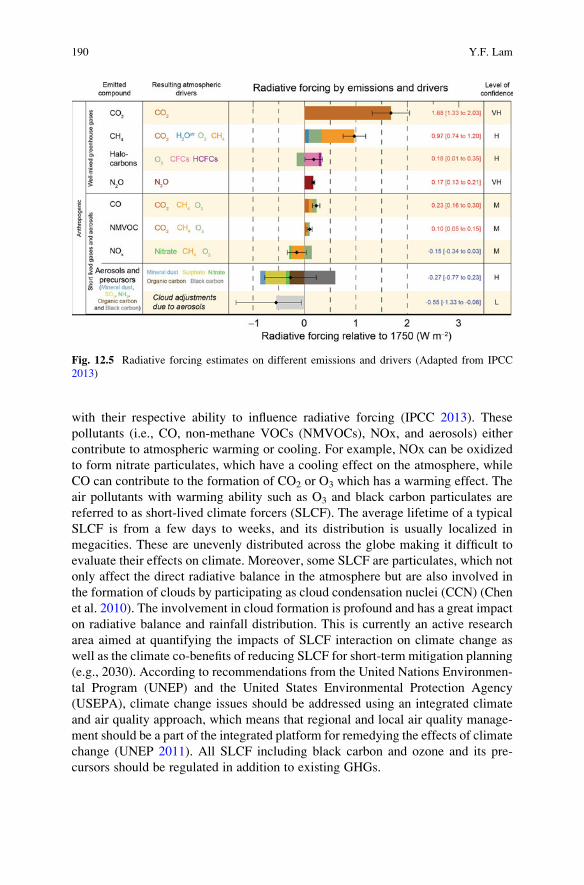
with their respective ability to influence radiative forcing (IPCC 2013). These
pollutants (i.e., CO, non-methane VOCs (NMVOCs), NOx, and aerosols) either
contribute to atmospheric warming or cooling. For example, NOx can be oxidized
to form nitrate particulates, which have a cooling effect on the atmosphere, while
CO can contribute to the formation of CO2 or O3 which has a warming effect. The
air pollutants with warming ability such as O3 and black carbon particulates are
referred to as short-lived climate forcers (SLCF). The average lifetime of a typical
SLCF is from a few days to weeks, and its distribution is usually localized in
megacities. These are unevenly distributed across the globe making it difficult to
evaluate their effects on climate. Moreover, some SLCF are particulates, which not
only affect the direct radiative balance in the atmosphere but are also involved in
the formation of clouds by participating as cloud condensation nuclei (CCN) (Chen
et al. 2010). The involvement in cloud formation is profound and has a great impact
on radiative balance and rainfall distribution. This is currently an active research
area aimed at quantifying the impacts of SLCF interaction on climate change as
well as the climate co-benefits of reducing SLCF for short-term mitigation planning
(e.g., 2030). According to recommendations from the United Nations Environmen-
tal Program (UNEP) and the United States Environmental Protection Agency
(USEPA), climate change issues should be addressed using an integrated climate
and air quality approach, which means that regional and local air quality manage-
ment should be a part of the integrated platform for remedying the effects of climate
change (UNEP 2011). All SLCF including black carbon and ozone and its pre-
cursors should be regulated in addition to existing GHGs.
Fig. 12.5 Radiative forcing estimates on different emissions and drivers (Adapted from IPCC
2013)
190 Y.F. Lam
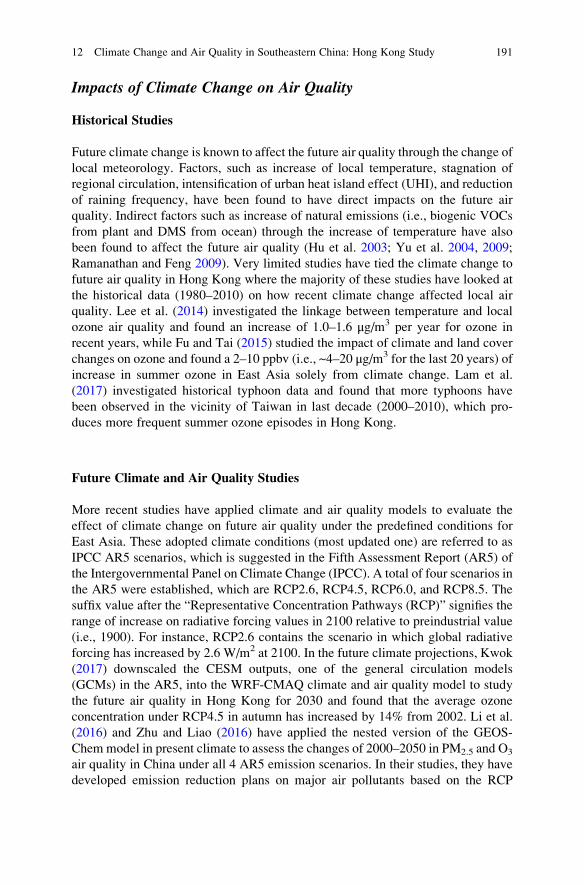
Impacts of Climate Change on Air Quality
Historical Studies
Future climate change is known to affect the future air quality through the change of
local meteorology. Factors, such as increase of local temperature, stagnation of
regional circulation, intensification of urban heat island effect (UHI), and reduction
of raining frequency, have been found to have direct impacts on the future air
quality. Indirect factors such as increase of natural emissions (i.e., biogenic VOCs
from plant and DMS from ocean) through the increase of temperature have also
been found to affect the future air quality (Hu et al. 2003; Yu et al. 2004, 2009;
Ramanathan and Feng 2009). Very limited studies have tied the climate change to
future air quality in Hong Kong where the majority of these studies have looked at
the historical data (1980–2010) on how recent climate change affected local air
quality. Lee et al. (2014) investigated the linkage between temperature and local
ozone air quality and found an increase of 1.0–1.6 μg/m3 per year for ozone in
recent years, while Fu and Tai (2015) studied the impact of climate and land cover
changes on ozone and found a 2–10 ppbv (i.e., ~4–20 μg/m3 for the last 20 years) of
increase in summer ozone in East Asia solely from climate change. Lam et al.
(2017) investigated historical typhoon data and found that more typhoons have
been observed in the vicinity of Taiwan in last decade (2000–2010), which pro-
duces more frequent summer ozone episodes in Hong Kong.
Future Climate and Air Quality Studies
More recent studies have applied climate and air quality models to evaluate the
effect of climate change on future air quality under the predefined conditions for
East Asia. These adopted climate conditions (most updated one) are referred to as
IPCC AR5 scenarios, which is suggested in the Fifth Assessment Report (AR5) of
the Intergovernmental Panel on Climate Change (IPCC). A total of four scenarios in
the AR5 were established, which are RCP2.6, RCP4.5, RCP6.0, and RCP8.5. The
suffix value after the “Representative Concentration Pathways (RCP)” signifies the
range of increase on radiative forcing values in 2100 relative to preindustrial value
(i.e., 1900). For instance, RCP2.6 contains the scenario in which global radiative
forcing has increased by 2.6 W/m2 at 2100. In the future climate projections, Kwok
(2017) downscaled the CESM outputs, one of the general circulation models
(GCMs) in the AR5, into the WRF-CMAQ climate and air quality model to study
the future air quality in Hong Kong for 2030 and found that the average ozone
concentration under RCP4.5 in autumn has increased by 14% from 2002. Li et al.
(2016) and Zhu and Liao (2016) have applied the nested version of the GEOS-
Chem model in present climate to assess the changes of 2000–2050 in PM2.5 and O3
air quality in China under all 4 AR5 emission scenarios. In their studies, they have
developed emission reduction plans on major air pollutants based on the RCP
12 Climate Change and Air Quality in Southeastern China: Hong Kong Study 191
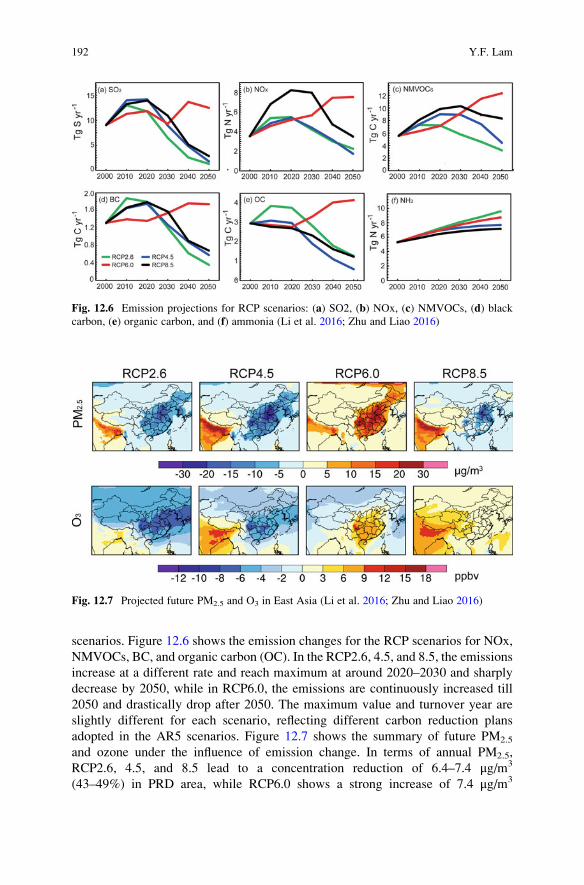
scenarios. Figure 12.6 shows the emission changes for the RCP scenarios for NOx,
NMVOCs, BC, and organic carbon (OC). In the RCP2.6, 4.5, and 8.5, the emissions
increase at a different rate and reach maximum at around 2020–2030 and sharply
decrease by 2050, while in RCP6.0, the emissions are continuously increased till
2050 and drastically drop after 2050. The maximum value and turnover year are
slightly different for each scenario, reflecting different carbon reduction plans
adopted in the AR5 scenarios. Figure 12.7 shows the summary of future PM2.5
and ozone under the influence of emission change. In terms of annual PM2.5,
RCP2.6, 4.5, and 8.5 lead to a concentration reduction of 6.4–7.4 μg/m3
(43–49%) in PRD area, while RCP6.0 shows a strong increase of 7.4 μg/m3
Fig. 12.6 Emission projections for RCP scenarios: (a) SO2, (b) NOx, (c) NMVOCs, (d) blackcarbon, (e) organic carbon, and (f) ammonia (Li et al. 2016; Zhu and Liao 2016)
Fig. 12.7 Projected future PM2.5 and O3 in East Asia (Li et al. 2016; Zhu and Liao 2016)
192 Y.F. Lam
(+50%). The large reductions of ambient PM2.5 in those three scenarios mainly
originate from the substantial reduction of primary emissions (e.g., EC/OC) and its
precursors (e.g., NOx and SO2). Eliminating EC, OC, and SO2 in 2050 has made
ammonia nitrate become the most abundant PM species. Therefore, reducing
agricultural NH3 and automobile NOx is suggested for further reducing annual
PM2.5 concentration in PRD. In terms of annual ozone, a slight decrease (i.e.,
~4.0 ppbv) under RCP2.6 and 4.5 has been observed in 2050 in PRD, which
comes from the significant reduction of NMVOCs and NOx in those two scenarios.
The highest reduction (~6.6 ppbv) of ozone has been observed in autumn and early
winter, which indicates that the influence of long-range transport from PRD would
be less in the future due to the emission reduction. As a result, ozone air quality in
Hong Kong would be expected to improve under those scenarios. It is observed that
no exceedance (using limit of 160 μg/m3) of maximum daily average 8-h (MDA8)
ozone is found in these future emission scenarios. On the other hand, a slight
increase (~0–3 ppbv) of annual ozone is observed under RCP6.0 and 8.5 in 2050
for PRD area. The increase of ozone could be attributed to the fact that the rate of
NOx reduction is much faster than the rate of VOCs reduction under the VOCs
limited environment, which triggers an increase of ozone (Wang et al. 2010).
Therefore, careful implementation of a reduction plan for ozone precursors would
be important, particularly for PRD area where biogenic sources may play a signif-
icant role in the formation of ozone as global warning continues to rise (Cheng et al.
2010). It should also be noted that the maximum increase (+6.2–6.6 ppbv) of annual
ozone occurs in 2040 (not 2050) under RCP6.5, and 8.5 indicates that there will still
be ozone air quality problems in the next 20 years. The exceedance of MDA8 ozone
would peak in 2030 (i.e., 34 incidents) and gradually reduce to no exceedance in
2050 when sufficient anthropogenic VOCs are reduced. With respect to the influ-
ence of tropical cyclone on ozone air quality in Hong Kong, some researchers have
projected the frequency of tropical cyclones (TC) in the vicinity of Taiwan would
be increased (Wang et al. 2011). As a TC produces a similar transport pattern as in
winter bringing pollutants from PRD to Hong Kong, it is projected that there would
still be an increase of summer ozone episodes till 2030 and would gradually
improve as the projected ozone after 2030 is reduced under RCP8.5, which lowers
the background ozone precursors from PRD during a TC event.
Summary
As one of the densest cities on the planet, Hong Kong has adopted a stronger
(60–65% carbon reduction by 2030) mitigation plan for combating climate change.
Although it may not be significant from a global perspective, it shows a strong
commitment as a global citizen. In Hong Kong, the major reduction of GHGs is
focused on the energy sector, where changing carbon-intensity fossil fuel (i.e., coal)
into less intense fuel such as natural gas, or nuclear, reducing building-related
energy usage, and adopting more green transportation. These mitigation plans
12 Climate Change and Air Quality in Southeastern China: Hong Kong Study 193
have moved Hong Kong toward becoming a healthier city. In terms of air pollution,
these mitigation plans carry some co-benefits on local air quality, where reduction
of coal/gasoline burning would reduce PM2.5 and NOx emitted into both roadside
and ambient environments. Under the future emission projections (IPCC AR5),
PM2.5 air quality for Hong Kong in 2050 would be improved under RCP2.6, 4.5 and
8.5 due to the reduction of primary PM and its precursors, while it is increased
under RCP6.0. In terms of ozone, less exceedance of ozone (based on MDA8) is
projected in 2050 under RCP2.6, 4.5 and 8.5 in PRD area.
Acknowledgments This work was conducted under the financial support of Guy Carpenter Asia-
Pacific Climate Impact Centre project, 9360126, and CityU project, 7004692. I thank Prof. Hong
Liao and Dr. Ke Li for providing important figures in this chapter.
References
Chen WT, Liao H, Seinfeld JH (2007) Future climate impacts of direct radiative forcing of
anthropogenic aerosols, tropospheric ozone, and long-lived greenhouse gases. J Geophys
Res-Atmos 112. doi:10.1029/2006jd008051
Chen W-T, Nenes A, Liao H, Adams PJ, Li J-LF, Seinfeld JH (2010) Global climate response to
anthropogenic aerosol indirect effects: present day and year 2100. J Geophys Res 115:D12207.
doi:10.1029/2008JD011619
Chen J, Li C, Ristovski Z, Milic A, Gu Y, IslamMS, Wang S, Hao J, Zhang H, He C, Guo H, Fu H,
Miljevic B, Morawska L, Thai P, Lam YF, Pereira G, Ding A, Huang X, Dumka UC (2017) A
review of biomass burning: emissions and impacts on air quality, health and climate in China.
Sci Total Environ 579:1000. http://dx.doi.org/10.1016/j.scitotenv.2016.11.025
Cheng HR, Guo H, Saunders SM, Lam SHM, Jiang F, Wang XM, Simpson IJ, Blake DR, Louie
PKK, Wang TJ (2010) Assessing photochemical ozone formation in the Pearl River Delta with
a photochemical trajectory model. Atmos Environ 44(34):4199–4208
Cheng Y, Lee SC, Gu Z, Ho KF, Zhang YW, Huang Y, Chow J, Watson JG, Gao JJ, Zhang RJ
(2015) PM2.5 and PM10-2.5 chemical composition and source apportionment near a Hong
Kong roadway. Particuology 18:96–104. http://dx.doi.org/10.1016/j.partic.2013.10.003
Environment Bureau (2014) Future fuel mix for electricity generation consultation document.
Retrieved from environment bureau website: http://www.enb.gov.hk/en/resources_publica
tions/policy_consultation/electricity_generation.html
Environment Bureau (2015) Hong Kong climate change report 2015. Retrieved from environment
bureau website: http://www.enb.gov.hk/sites/default/files/pdf/ClimateChangeEng.pdf
Fu Y, Tai APK (2015) Impact of climate and land cover changes on tropospheric ozone air quality
and public health in East Asia between 1980 and 2010. Atmos Chem Phys 15:10093–10106.
doi:10.5194/acp-15-10093-2015
Fu J, Dong X, Gao Y,Wong DC, Lam YF (2012) Sensitivity and linearity analysis of ozone in East
Asia: The effects of domestic emission and intercontinental transport. J Air Waste Manag.
Assoc., 62(9), pp 1102–1114
HKEPD (2016) Pollutant long-term trends (1990–2015). Retrieved from Hong Kong environmen-
tal protection department website: http://www.aqhi.gov.hk/api_history/english/report/files/
aqt15e.pdf
194 Y.F. Lam
HKEPD (2017) Data & Statistics: Emission Inventory for 2015. Retrieved from Hong Kong
environmental protection department website: http://www.epd.gov.hk/epd/english/
environmentinhk/air/data/emission_inve.html
HKO (2003) Climate of Hong Kong. Retrieved from http://www.hko.gov.hk/cis/climahk_e.htm
HKO (2010) The monsoons and climate change. Retrieved from http://www.weather.gov.hk/blog/
en/archives/00000071.htm
Hu ZZ, Yang S, Wu RG (2003) Long-term climate variations in China and global warming signals.
J Geophys Res-Atmos 108. doi:10.1029/2003jd003651
Huang X-F, Yu JZ, Yuan Z, Lau AKH, Louie PKK (2009) Source analysis of high particulate
matter days in Hong Kong. Atmos Environ 43:1196–1203
IPCC (2013) Summary for policymakers. In: Climate change 2013: the physical science basis.
Contribution of working group I to the fifth assessment report of the intergovernmental panel
on climate change, Cambridge University Press, Cambridge/New York, pp 1–30, doi:10.1017/
CBO9781107415324.004/
Kwok LK (2017) Development of hybrid statistical-dynamical model for air quality prediction:
establishment and application. Doctoral dissertation
Lam YF, Fu JS, Wu S, Mickley LJ (2011) Impacts of future climate change and effects of biogenic
emissions on surface ozone and particulate matter concentrations in the United States. Atmos
Chem Phys 11(10):4789–4806
Lam YF, Cheung HM, Yan CC (2017) Impact of tropical cyclone track change on regional air
quality. Sci Total Environ. Under review
Lau AKH, Lo A, Gray J, Yuan Z, Loh C (2007) Relative significance of local vs. regional sources:
Hong Kong’s air pollution, civic exchangeLee Y, Shindell D, Faluvegi G, Wenig M, Lam YF, Ning Z, Hao S, Lai C (2014) Increase of ozone
concentrations, its temperature sensitivity and the precursor factor in South China. Tellus B 66.
doi:http://dx.doi.org/10.3402/tellusb.v66.23455
Leung YKJ, Wu MC (2015) Influence of tropical cyclones on visibility in Hong Kong. Retrieved
from Hong Kong observatory website: http://www.hko.gov.hk/education/article_e.htm?
title¼ele_00089
Li K, Liao H, Zhu J, Moch JM (2016) Implications of RCP emissions on future PM2.5 air quality and
direct radiative forcing over China. J Geophys Res Atmos 121. doi:10.1002/ 2016JD025623
Ramanathan V, Feng Y (2009) Air pollution, greenhouse gases and climate change: global and
regional perspectives. Atmos Environ 43:37–50. doi:10.1016/j.atmosenv.2008.09.063
UNEP (2011) Climate change adaptation. Retrieved from http://www.unep.org/climatechange/
adaptation/InformationMaterials/News/PressRelease/tabid/6710/Default.aspx?
DocumentId¼2645&ArticleId¼8780
Wan Z, Leung R, Huang H (2016) 2014 Hong Kong emission inventory report (Report
No. EPD/TR/1/16). Hong Kong
Wang R, Wu L, Wang C (2011) Typhoon track changes associated with global warming. J Clim
24:3748–3752
Wang X, Zhang Y, Hu Y, Zhou W, Lu K, Zhong L, Zeng L, Shao M, Hu M, Russell AG (2010)
Process analysis and sensitivity study of regional ozone formation over the Pearl River Delta,
China, during the PRIDE-PRD2004 campaign using the Community Multiscale Air Quality
modeling system. Atmos Chem Phys 10(9):4423–4437
Wang T, Xue L, Brimblecombe P, Lam YF, Li L, Zhang L (2017) Ozone pollution in China: a
review of concentrations, meteorological influences, chemical precursors, and effects. Sci
Total Environ 575:1582–1596. https://doi.org/10.1016/j.scitotenv.2016.10.081
World Bank (2016) World development indicators. Retrieved from http://databank.worldbank.
org/data/reports.aspx?source¼2&series¼EN.ATM.CO2E.PC&country¼#
Xiao Q, Ma Z, Li S, Liu Y (2015) The impact of winter heating on air pollution in China. PLoS
One 10(1):e0117311. http://doi.org/10.1371/journal.pone.0117311
Yu RC, Wang B, Zhou TJ (2004) Tropospheric cooling and summer monsoon weakening trend
over. East Asia Geophys Res Lett 31. doi:10.1029/2004gl021270
12 Climate Change and Air Quality in Southeastern China: Hong Kong Study 195

Yu Y, Niu SJ, Niu HW, Wu ZY, Wu XH (2009) The weakening relationship between the
precipitation in north china during rainy season and the two high in the southern hemisphere.
2008 international workshop on education technology and training and 2008 international
workshop on geoscience and remote sensing, 1, pp 261–264, doi:10.1109/Ettandgrs.2008.139
Zhu J, Liao H (2016) Future ozone air quality and radiative forcing over China owing to future
changes in emissions under the Representative Concentration Pathways (RCPs). J Geophys
Res Atmos 121:1978–2001. doi:10.1002/2015JD023926
Yun Fat Lam is an Assistant Professor in the School of Energy and Environment at City
University of Hong Kong. He specializes in regional air quality management, emission inventory
development, and future air quality modeling under climate change scenarios.
196 Y.F. Lam

Part III
Case Studies: Developing Countries/Regions
Chapter 13
Trends and Seasonal Variations of Climate, Air
Quality, and Mortality in Three Major Cities
in Taiwan
Mei-Hui Li
Abstract The interactions among climate change, air pollution, and human health
are multiple and complex. Many epidemiological studies in Taiwan have consis-
tently demonstrated the effects of short-term exposures to extreme weather events,
particulate matter, and traffic-related air pollutants on a variety of health effects.
However, these findings might not explain or predict overall seasonal mortality
patterns to provide insights into the drivers of mortality acting on society levels for
public health policy and practice. There are very limited studies on seasonality of
weather, air pollution, and mortality in Taiwan. The objectives of this study are to
evaluate if there are any changes in trends and seasonality of mortality in three
major Taiwanese cities from 1991 to 2010 and examine its association with climatic
condition and air pollution. Among these major Taiwanese cities, seasonal mortal-
ity patterns are similar in two subtropical cities, Taipei and Taichung, compared to
another tropical city, Kaohsiung. Taipei had significantly increased trends in most
monthly temperature variables and the number of hot days examined during
1991–2010 compared to the other two cities. Winter/summer ratios of mortality
only showed a decreased trend in Taipei, but not in Taichung or Kaohsiung. Mean
monthly ambient temperature was also found as the most optimal temperature
variable for predicting all-cause monthly mortality at all three cities in this study.
Seasonal mortality patterns in three cities were with higher levels of deaths from
December to March. Trends in air quality are showing mixed patterns over the past
two decades. SO2, CO, and NOx concentrations have decreased significantly and
steadily, while O3 has significantly increased in recent years. In three major
Taiwanese cities, O3 and PM10 are major air pollutants of current concerns. The
results of this study showed that monthly mean O3, PM10, and NOx levels and
monthly mortality were not closely related, but temperature-related variables were
positively associated with monthly mortality among three major Taiwanese cities.
Moreover, changes in other socioeconomic and demographic factors may also play
a key role in determining seasonality mortality and morbidity and need to be
considered in future studies.
M.-H. Li (*)
Department of Geography, National Taiwan University, Taipei, Taiwan
e-mail: [email protected]
© Springer International Publishing AG 2018
R. Akhtar, C. Palagiano (eds.), Climate Change and Air Pollution,Springer Climate, DOI 10.1007/978-3-319-61346-8_13
199
Keywords Seasonal mortality patterns • Urbanization • Air pollution • Climate
change
Introduction
The global urban population has exceeded rural population since 2014 (United
Nations 2014). Urbanization is a process of intensive human activities in land use
and economic development. Urbanization has numerous negative effects on air
pollution worldwide, and urban areas are the significant emission sources of
greenhouse gases due to concentrate industries, transportation, and households.
The urban areas are also at great risk affected by climate change with increases in
the frequency and intensity of heavy rainfalls, heat waves, and other extreme
weather events (Lankao 2008; Romero-Lankao et al. 2012). Furthermore, air
quality is strongly dependent on weather and is sensitive to climate change. Both
climate change and air pollution are the most challenging global issues we face
today. Many processes of urbanization contribute to climate change and air pollu-
tion such as combustion of fossil fuels and land use changes; therefore, cities have
become research hotspots to understand the link between climate change and air
pollution on human health.
Seasonal variations of mortality and disease in human society are well known.
Proper assessment of seasonal mortality in a population is with important scientific
and public health implications. While climate change may lead to alter seasonality
of atmospheric condition, seasonal mortality patterns can be also influenced by
these changes. Especially, air pollution and climate change can influence each other
through complex interactions in the atmosphere and affect human health in differ-
ent regions. There are many short-term effects or epidemiological studies on the
relationships between air pollution and health or temperature and mortality in
Taiwan. Several recent studies have already reported significant associations
between daily temperature and daily mortality or cardiopulmonary diseases in
Taiwanese cities (Liang et al. 2008, 2009; Lin et al. 2011, 2012, 2013a, b; Wang
et al. 2012; Sung et al. 2013; Wang and Lin 2014). Moreover, there is growing
evidence that particulate matter is responsible for mortality and cardiorespiratory
diseases in Taiwanese cities (Tsai et al. 2010, 2014a, b, 2015; Chang et al. 2015a, b;
Cheng et al. 2015; Wang and Lin 2015). However, these recent findings might not
explain or predict overall seasonal mortality patterns. In fact, there are very limited
studies on seasonality of weather, air pollution, and mortality in Taiwan.
The objectives of this study are to evaluate if there are any changes in trends and
seasonality of weather, air pollution, and mortality in three Taiwanese cities from
1991 to 2010. First, the seasonal patterns of mortality, climate, and air quality are
described in three major Taiwanese cities. Second, any changes in trends of
mortality, climate, and air quality are examined in these three cities. Third, relation-
ships between climate, air pollution, and mortality are investigated.
200 M.-H. Li
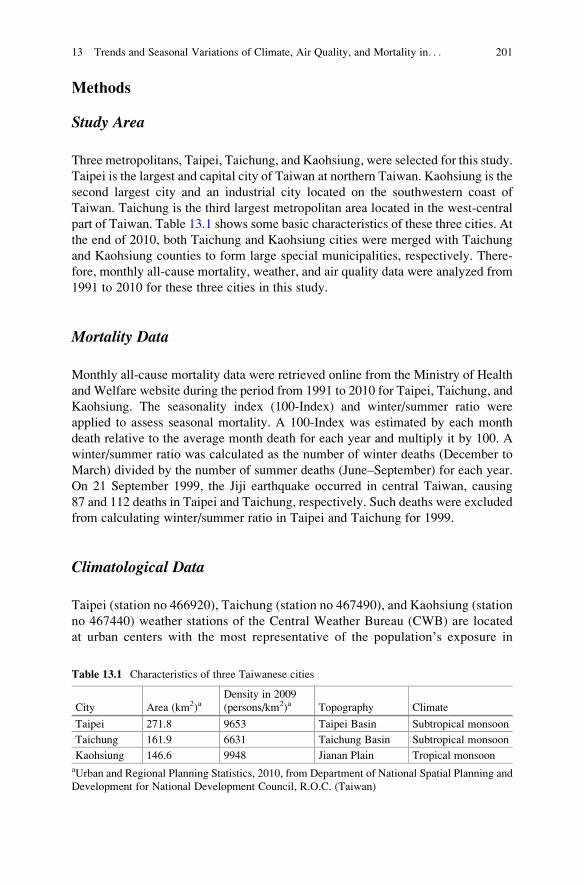
Methods
Study Area
Three metropolitans, Taipei, Taichung, and Kaohsiung, were selected for this study.
Taipei is the largest and capital city of Taiwan at northern Taiwan. Kaohsiung is the
second largest city and an industrial city located on the southwestern coast of
Taiwan. Taichung is the third largest metropolitan area located in the west-central
part of Taiwan. Table 13.1 shows some basic characteristics of these three cities. At
the end of 2010, both Taichung and Kaohsiung cities were merged with Taichung
and Kaohsiung counties to form large special municipalities, respectively. There-
fore, monthly all-cause mortality, weather, and air quality data were analyzed from
1991 to 2010 for these three cities in this study.
Mortality Data
Monthly all-cause mortality data were retrieved online from the Ministry of Health
and Welfare website during the period from 1991 to 2010 for Taipei, Taichung, and
Kaohsiung. The seasonality index (100-Index) and winter/summer ratio were
applied to assess seasonal mortality. A 100-Index was estimated by each month
death relative to the average month death for each year and multiply it by 100. A
winter/summer ratio was calculated as the number of winter deaths (December to
March) divided by the number of summer deaths (June–September) for each year.
On 21 September 1999, the Jiji earthquake occurred in central Taiwan, causing
87 and 112 deaths in Taipei and Taichung, respectively. Such deaths were excluded
from calculating winter/summer ratio in Taipei and Taichung for 1999.
Climatological Data
Taipei (station no 466920), Taichung (station no 467490), and Kaohsiung (station
no 467440) weather stations of the Central Weather Bureau (CWB) are located
at urban centers with the most representative of the population’s exposure in
Table 13.1 Characteristics of three Taiwanese cities
City Area (km2)aDensity in 2009
(persons/km2)a Topography Climate
Taipei 271.8 9653 Taipei Basin Subtropical monsoon
Taichung 161.9 6631 Taichung Basin Subtropical monsoon
Kaohsiung 146.6 9948 Jianan Plain Tropical monsoonaUrban and Regional Planning Statistics, 2010, from Department of National Spatial Planning and
Development for National Development Council, R.O.C. (Taiwan)
13 Trends and Seasonal Variations of Climate, Air Quality, and Mortality in. . . 201
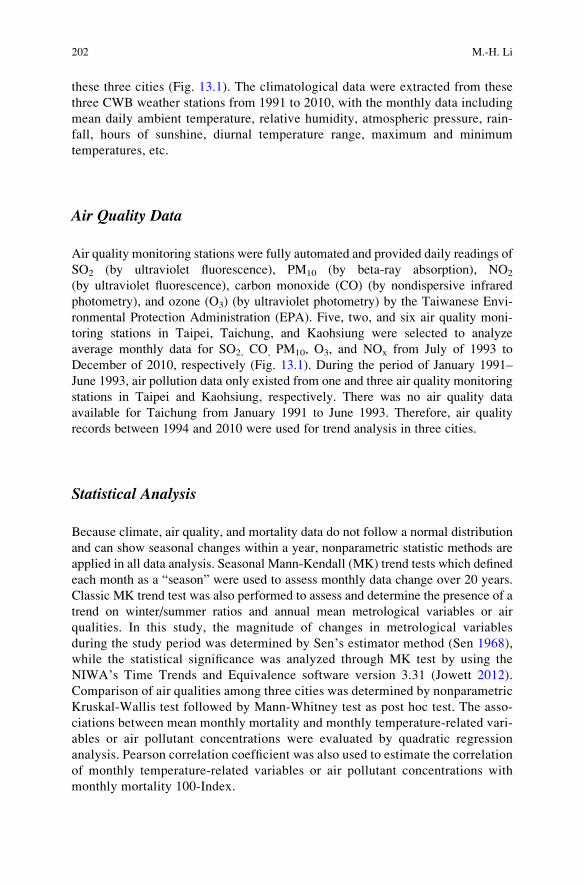
these three cities (Fig. 13.1). The climatological data were extracted from these
three CWB weather stations from 1991 to 2010, with the monthly data including
mean daily ambient temperature, relative humidity, atmospheric pressure, rain-
fall, hours of sunshine, diurnal temperature range, maximum and minimum
temperatures, etc.
Air Quality Data
Air quality monitoring stations were fully automated and provided daily readings of
SO2 (by ultraviolet fluorescence), PM10 (by beta-ray absorption), NO2
(by ultraviolet fluorescence), carbon monoxide (CO) (by nondispersive infrared
photometry), and ozone (O3) (by ultraviolet photometry) by the Taiwanese Envi-
ronmental Protection Administration (EPA). Five, two, and six air quality moni-
toring stations in Taipei, Taichung, and Kaohsiung were selected to analyze
average monthly data for SO2, CO, PM10, O3, and NOx from July of 1993 to
December of 2010, respectively (Fig. 13.1). During the period of January 1991–
June 1993, air pollution data only existed from one and three air quality monitoring
stations in Taipei and Kaohsiung, respectively. There was no air quality data
available for Taichung from January 1991 to June 1993. Therefore, air quality
records between 1994 and 2010 were used for trend analysis in three cities.
Statistical Analysis
Because climate, air quality, and mortality data do not follow a normal distribution
and can show seasonal changes within a year, nonparametric statistic methods are
applied in all data analysis. Seasonal Mann-Kendall (MK) trend tests which defined
each month as a “season” were used to assess monthly data change over 20 years.
Classic MK trend test was also performed to assess and determine the presence of a
trend on winter/summer ratios and annual mean metrological variables or air
qualities. In this study, the magnitude of changes in metrological variables
during the study period was determined by Sen’s estimator method (Sen 1968),
while the statistical significance was analyzed through MK test by using the
NIWA’s Time Trends and Equivalence software version 3.31 (Jowett 2012).
Comparison of air qualities among three cities was determined by nonparametric
Kruskal-Wallis test followed by Mann-Whitney test as post hoc test. The asso-
ciations between mean monthly mortality and monthly temperature-related vari-
ables or air pollutant concentrations were evaluated by quadratic regression
analysis. Pearson correlation coefficient was also used to estimate the correlation
of monthly temperature-related variables or air pollutant concentrations with
monthly mortality 100-Index.
202 M.-H. Li
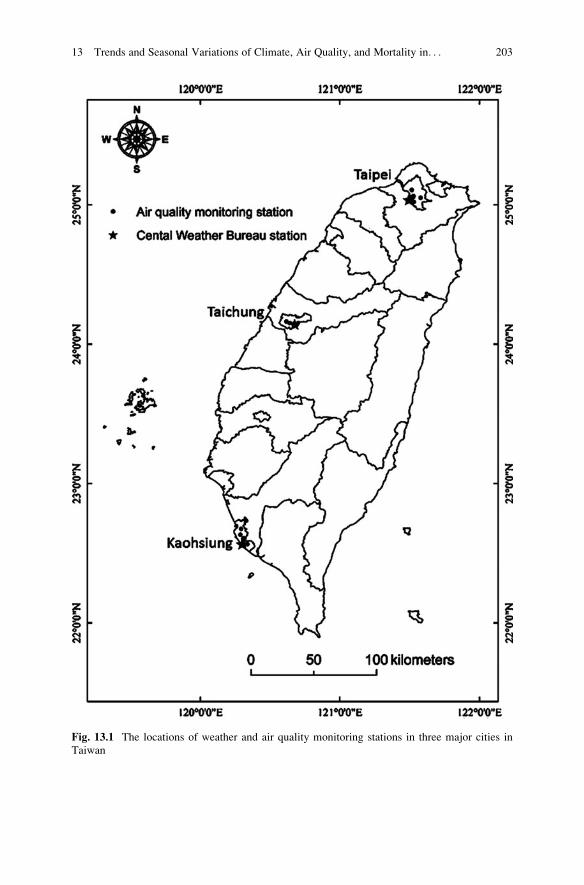
Fig. 13.1 The locations of weather and air quality monitoring stations in three major cities in
Taiwan
13 Trends and Seasonal Variations of Climate, Air Quality, and Mortality in. . . 203
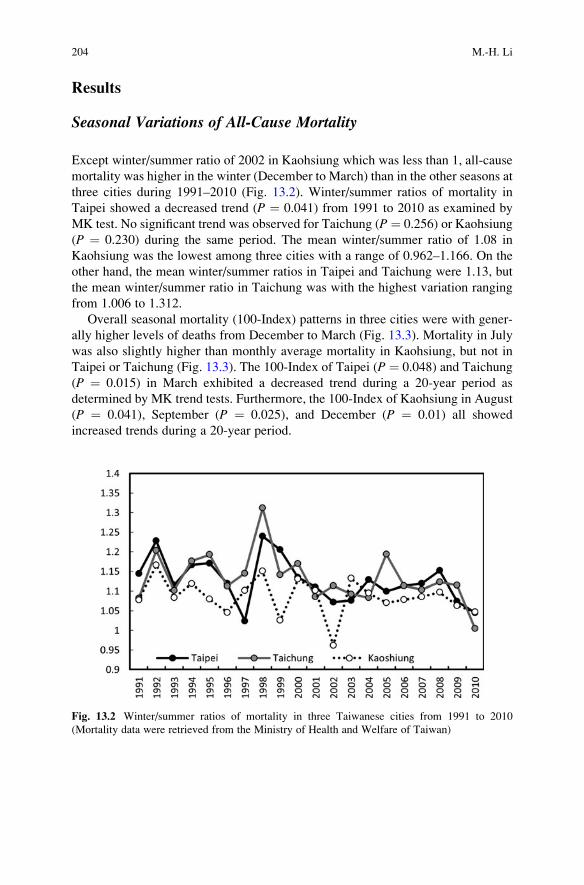
Results
Seasonal Variations of All-Cause Mortality
Except winter/summer ratio of 2002 in Kaohsiung which was less than 1, all-cause
mortality was higher in the winter (December to March) than in the other seasons at
three cities during 1991–2010 (Fig. 13.2). Winter/summer ratios of mortality in
Taipei showed a decreased trend (P ¼ 0.041) from 1991 to 2010 as examined by
MK test. No significant trend was observed for Taichung (P¼ 0.256) or Kaohsiung
(P ¼ 0.230) during the same period. The mean winter/summer ratio of 1.08 in
Kaohsiung was the lowest among three cities with a range of 0.962–1.166. On the
other hand, the mean winter/summer ratios in Taipei and Taichung were 1.13, but
the mean winter/summer ratio in Taichung was with the highest variation ranging
from 1.006 to 1.312.
Overall seasonal mortality (100-Index) patterns in three cities were with gener-
ally higher levels of deaths from December to March (Fig. 13.3). Mortality in July
was also slightly higher than monthly average mortality in Kaohsiung, but not in
Taipei or Taichung (Fig. 13.3). The 100-Index of Taipei (P ¼ 0.048) and Taichung
(P ¼ 0.015) in March exhibited a decreased trend during a 20-year period as
determined by MK trend tests. Furthermore, the 100-Index of Kaohsiung in August
(P ¼ 0.041), September (P ¼ 0.025), and December (P ¼ 0.01) all showed
increased trends during a 20-year period.
Fig. 13.2 Winter/summer ratios of mortality in three Taiwanese cities from 1991 to 2010
(Mortality data were retrieved from the Ministry of Health and Welfare of Taiwan)
204 M.-H. Li
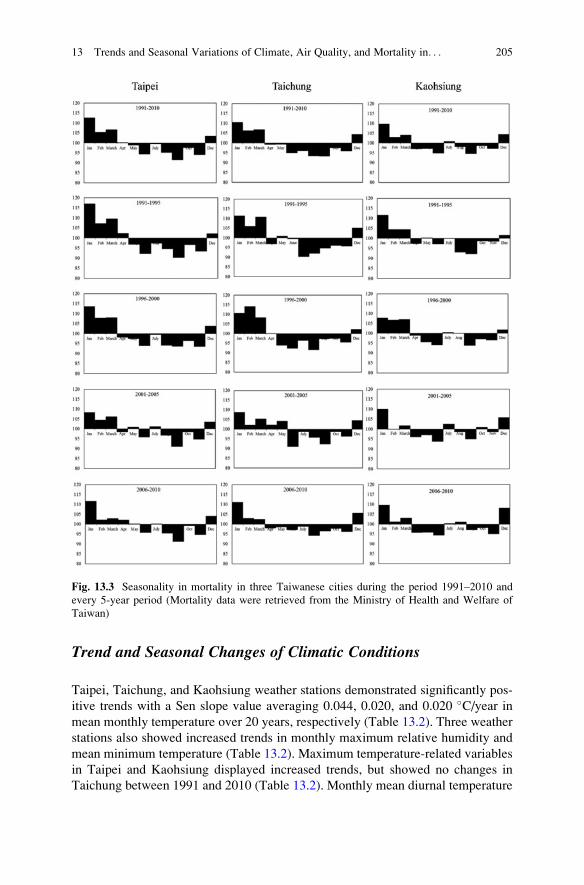
Trend and Seasonal Changes of Climatic Conditions
Taipei, Taichung, and Kaohsiung weather stations demonstrated significantly pos-
itive trends with a Sen slope value averaging 0.044, 0.020, and 0.020 �C/year inmean monthly temperature over 20 years, respectively (Table 13.2). Three weather
stations also showed increased trends in monthly maximum relative humidity and
mean minimum temperature (Table 13.2). Maximum temperature-related variables
in Taipei and Kaohsiung displayed increased trends, but showed no changes in
Taichung between 1991 and 2010 (Table 13.2). Monthly mean diurnal temperature
Fig. 13.3 Seasonality in mortality in three Taiwanese cities during the period 1991–2010 and
every 5-year period (Mortality data were retrieved from the Ministry of Health and Welfare of
Taiwan)
13 Trends and Seasonal Variations of Climate, Air Quality, and Mortality in. . . 205
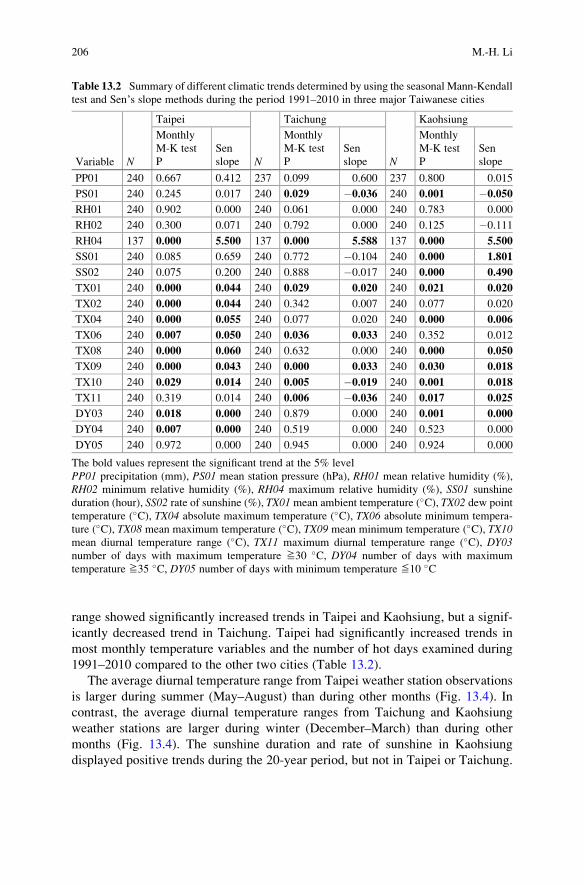
range showed significantly increased trends in Taipei and Kaohsiung, but a signif-
icantly decreased trend in Taichung. Taipei had significantly increased trends in
most monthly temperature variables and the number of hot days examined during
1991–2010 compared to the other two cities (Table 13.2).
The average diurnal temperature range from Taipei weather station observations
is larger during summer (May–August) than during other months (Fig. 13.4). In
contrast, the average diurnal temperature ranges from Taichung and Kaohsiung
weather stations are larger during winter (December–March) than during other
months (Fig. 13.4). The sunshine duration and rate of sunshine in Kaohsiung
displayed positive trends during the 20-year period, but not in Taipei or Taichung.
Table 13.2 Summary of different climatic trends determined by using the seasonal Mann-Kendall
test and Sen’s slope methods during the period 1991–2010 in three major Taiwanese cities
Variable N
Taipei
N
Taichung
N
Kaohsiung
Monthly
M-K test
P
Sen
slope
Monthly
M-K test
P
Sen
slope
Monthly
M-K test
P
Sen
slope
PP01 240 0.667 0.412 237 0.099 0.600 237 0.800 0.015
PS01 240 0.245 0.017 240 0.029 �0.036 240 0.001 �0.050
RH01 240 0.902 0.000 240 0.061 0.000 240 0.783 0.000
RH02 240 0.300 0.071 240 0.792 0.000 240 0.125 �0.111
RH04 137 0.000 5.500 137 0.000 5.588 137 0.000 5.500
SS01 240 0.085 0.659 240 0.772 �0.104 240 0.000 1.801
SS02 240 0.075 0.200 240 0.888 �0.017 240 0.000 0.490
TX01 240 0.000 0.044 240 0.029 0.020 240 0.021 0.020
TX02 240 0.000 0.044 240 0.342 0.007 240 0.077 0.020
TX04 240 0.000 0.055 240 0.077 0.020 240 0.000 0.006
TX06 240 0.007 0.050 240 0.036 0.033 240 0.352 0.012
TX08 240 0.000 0.060 240 0.632 0.000 240 0.000 0.050
TX09 240 0.000 0.043 240 0.000 0.033 240 0.030 0.018
TX10 240 0.029 0.014 240 0.005 �0.019 240 0.001 0.018
TX11 240 0.319 0.014 240 0.006 �0.036 240 0.017 0.025
DY03 240 0.018 0.000 240 0.879 0.000 240 0.001 0.000
DY04 240 0.007 0.000 240 0.519 0.000 240 0.523 0.000
DY05 240 0.972 0.000 240 0.945 0.000 240 0.924 0.000
The bold values represent the significant trend at the 5% level
PP01 precipitation (mm), PS01 mean station pressure (hPa), RH01 mean relative humidity (%),
RH02 minimum relative humidity (%), RH04 maximum relative humidity (%), SS01 sunshine
duration (hour), SS02 rate of sunshine (%), TX01mean ambient temperature (�C), TX02 dew point
temperature (�C), TX04 absolute maximum temperature (�C), TX06 absolute minimum tempera-
ture (�C), TX08 mean maximum temperature (�C), TX09 mean minimum temperature (�C), TX10mean diurnal temperature range (�C), TX11 maximum diurnal temperature range (�C), DY03number of days with maximum temperature ≧30 �C, DY04 number of days with maximum
temperature ≧35 �C, DY05 number of days with minimum temperature ≦10 �C
206 M.-H. Li
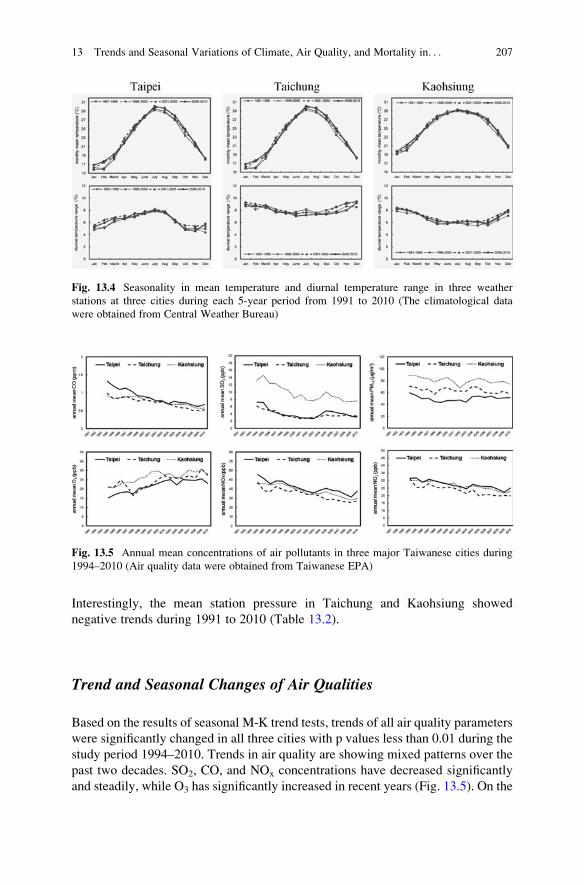
Interestingly, the mean station pressure in Taichung and Kaohsiung showed
negative trends during 1991 to 2010 (Table 13.2).
Trend and Seasonal Changes of Air Qualities
Based on the results of seasonal M-K trend tests, trends of all air quality parameters
were significantly changed in all three cities with p values less than 0.01 during the
study period 1994–2010. Trends in air quality are showing mixed patterns over the
past two decades. SO2, CO, and NOx concentrations have decreased significantly
and steadily, while O3 has significantly increased in recent years (Fig. 13.5). On the
Fig. 13.4 Seasonality in mean temperature and diurnal temperature range in three weather
stations at three cities during each 5-year period from 1991 to 2010 (The climatological data
were obtained from Central Weather Bureau)
Fig. 13.5 Annual mean concentrations of air pollutants in three major Taiwanese cities during
1994–2010 (Air quality data were obtained from Taiwanese EPA)
13 Trends and Seasonal Variations of Climate, Air Quality, and Mortality in. . . 207
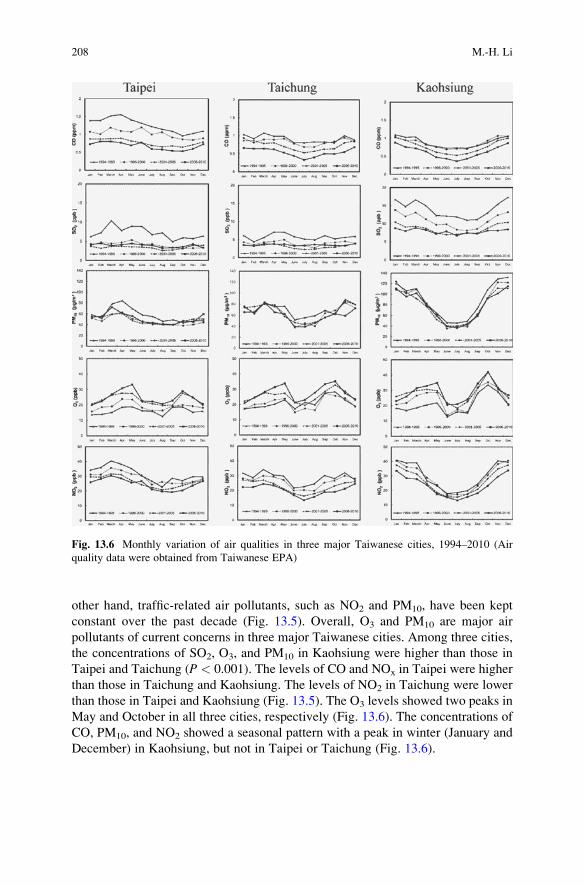
other hand, traffic-related air pollutants, such as NO2 and PM10, have been kept
constant over the past decade (Fig. 13.5). Overall, O3 and PM10 are major air
pollutants of current concerns in three major Taiwanese cities. Among three cities,
the concentrations of SO2, O3, and PM10 in Kaohsiung were higher than those in
Taipei and Taichung (P < 0.001). The levels of CO and NOx in Taipei were higher
than those in Taichung and Kaohsiung. The levels of NO2 in Taichung were lower
than those in Taipei and Kaohsiung (Fig. 13.5). The O3 levels showed two peaks in
May and October in all three cities, respectively (Fig. 13.6). The concentrations of
CO, PM10, and NO2 showed a seasonal pattern with a peak in winter (January and
December) in Kaohsiung, but not in Taipei or Taichung (Fig. 13.6).
Fig. 13.6 Monthly variation of air qualities in three major Taiwanese cities, 1994–2010 (Air
quality data were obtained from Taiwanese EPA)
208 M.-H. Li
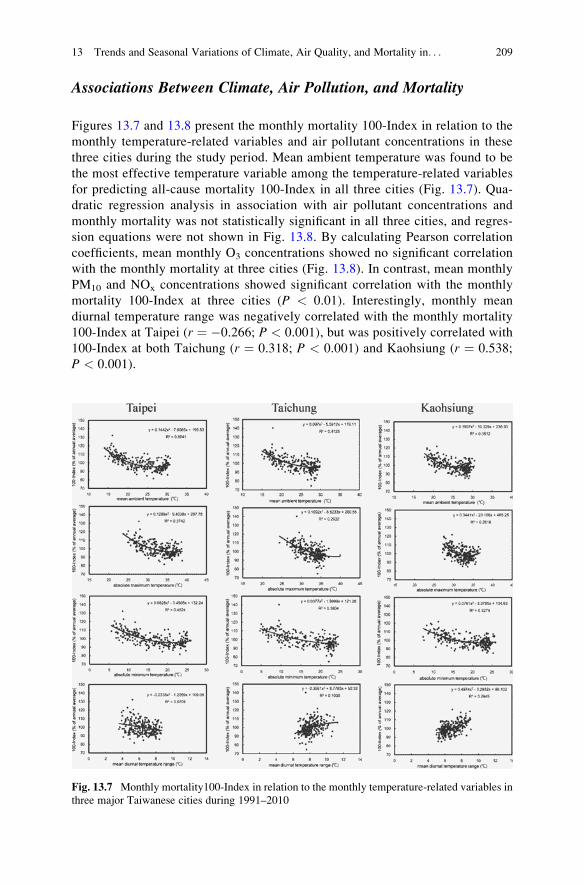
Associations Between Climate, Air Pollution, and Mortality
Figures 13.7 and 13.8 present the monthly mortality 100-Index in relation to the
monthly temperature-related variables and air pollutant concentrations in these
three cities during the study period. Mean ambient temperature was found to be
the most effective temperature variable among the temperature-related variables
for predicting all-cause mortality 100-Index in all three cities (Fig. 13.7). Qua-
dratic regression analysis in association with air pollutant concentrations and
monthly mortality was not statistically significant in all three cities, and regres-
sion equations were not shown in Fig. 13.8. By calculating Pearson correlation
coefficients, mean monthly O3 concentrations showed no significant correlation
with the monthly mortality at three cities (Fig. 13.8). In contrast, mean monthly
PM10 and NOx concentrations showed significant correlation with the monthly
mortality 100-Index at three cities (P < 0.01). Interestingly, monthly mean
diurnal temperature range was negatively correlated with the monthly mortality
100-Index at Taipei (r ¼ �0.266; P < 0.001), but was positively correlated with
100-Index at both Taichung (r ¼ 0.318; P < 0.001) and Kaohsiung (r ¼ 0.538;
P < 0.001).
Fig. 13.7 Monthly mortality100-Index in relation to the monthly temperature-related variables in
three major Taiwanese cities during 1991–2010
13 Trends and Seasonal Variations of Climate, Air Quality, and Mortality in. . . 209
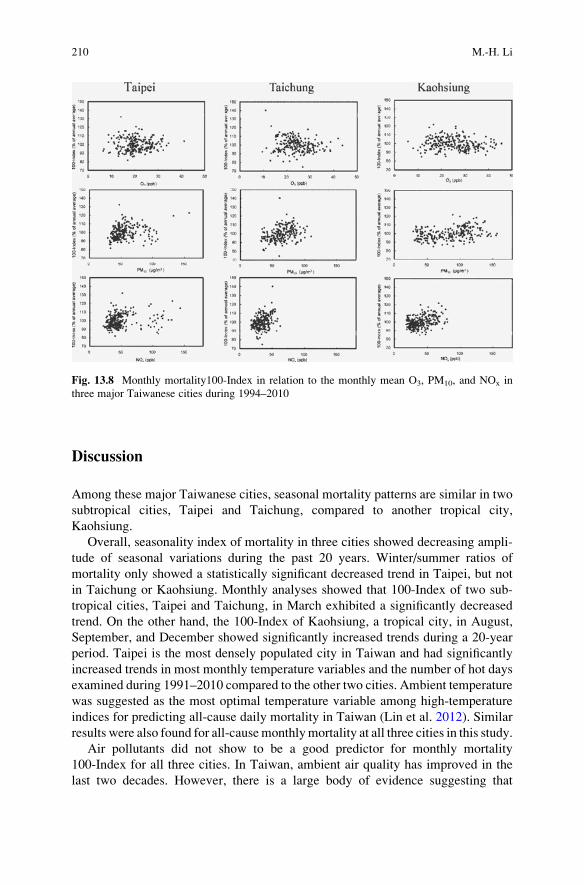
Discussion
Among these major Taiwanese cities, seasonal mortality patterns are similar in two
subtropical cities, Taipei and Taichung, compared to another tropical city,
Kaohsiung.
Overall, seasonality index of mortality in three cities showed decreasing ampli-
tude of seasonal variations during the past 20 years. Winter/summer ratios of
mortality only showed a statistically significant decreased trend in Taipei, but not
in Taichung or Kaohsiung. Monthly analyses showed that 100-Index of two sub-
tropical cities, Taipei and Taichung, in March exhibited a significantly decreased
trend. On the other hand, the 100-Index of Kaohsiung, a tropical city, in August,
September, and December showed significantly increased trends during a 20-year
period. Taipei is the most densely populated city in Taiwan and had significantly
increased trends in most monthly temperature variables and the number of hot days
examined during 1991–2010 compared to the other two cities. Ambient temperature
was suggested as the most optimal temperature variable among high-temperature
indices for predicting all-cause daily mortality in Taiwan (Lin et al. 2012). Similar
results were also found for all-causemonthlymortality at all three cities in this study.
Air pollutants did not show to be a good predictor for monthly mortality
100-Index for all three cities. In Taiwan, ambient air quality has improved in the
last two decades. However, there is a large body of evidence suggesting that
Fig. 13.8 Monthly mortality100-Index in relation to the monthly mean O3, PM10, and NOx in
three major Taiwanese cities during 1994–2010
210 M.-H. Li
exposure to air pollution, even at the current levels, leads to adverse health effects.
In Kaohsiung, higher levels of ambient air pollutants increase the risk of hospital
admissions for cardiovascular diseases (Chang et al. 2015a), respiratory diseases
(Tsai et al. 2014b; Cheng et al. 2015), and daily mortality for all causes (Tsai and
Yang 2014; Tsai et al. 2015). In Taipei, particulate matter and traffic-related air
pollutants, CO, O3, and NOx, were positively associated with increased risk of
hospital admissions for cardiovascular diseases (Yang 2008; Chiu et al. 2013),
asthma (Chan et al. 2009), respiratory diseases (Yu and Chien 2016), emergency
room visits for stroke in the warm seasons (Chen et al. 2014), and daily mortality
for all causes (Tsai et al. 2014a). On the other hand, many epidemiological studies
showed that air pollution level and daily mortality lack a strong association either in
Taipei or Kaohsiung (Tsai et al. 2003; Yang et al. 2004; Tseng et al. 2015). The
result of this study also showed that monthly mean O3, PM10, and NOx levels and
monthly mortality were not closely related at these three cities.
In conclusion, monthly mean temperature-related variables, but not monthly
mean air qualities, are positively associated with monthly mortality among three
major Taiwanese cities. Moreover, the changes in other socioeconomic and demo-
graphic factors may also play a key role in determining seasonality mortality and
morbidity and shall be considered in future studies.
References
Chan TC, Chen ML, Lin IF, Lee CH, Chiang PH, Wang DW, Chuang JH (2009) Spatiotemporal
analysis of air pollution and asthma patient visits in Taipei, Taiwan. Int J Health Geogr 8(1):1
Chang CC, Chen PS, Yang CY (2015a) Short-term effects of fine particulate air pollution on
hospital admissions for cardiovascular diseases: a case-crossover study in a tropical city. J
Toxicol Environ Health A 78(4):267–277
Chang CC, Chiu HF, Yang CY (2015b) Fine particulate air pollution and outpatient department
visits for headache in Taipei, Taiwan. J Toxicol Environ Health A 78(8):506–515
Chen SY, Lin YL, Chang WT, Lee CT, Chan CC (2014) Increasing emergency room visits for
stroke by elevated levels of fine particulate constituents. Sci Total Environ 473:446–450
Cheng MH, Chiu HF, Yang CY (2015) Coarse particulate air pollution associated with increased
risk of hospital admissions for respiratory diseases in a tropical city, Kaohsiung, Taiwan. Int J
Environ Res Public Health 12(10):13053–13068
Chiu HF, Peng CY, Wu TN, Yang CY (2013) Short-term effects of fine particulate air pollution on
ischemic heart disease hospitalizations in Taipei: a case-crossover study. Aerosol Air Qual Res
13:1563–1569
Jowett I (2012) Time trends and equivalence software, version 3.31
Lankao PR (2008) Urban areas and climate change: review of current issues and trends – issues
paper for the 2011 global report on human settlements, 101p. http://www.Ral.Ucar.Edu/staff/
prlankao/GRHS_2011_IssuesPaperfinal.Pdf. Accessed 18 August 2016
Liang WM, Liu WP, Chou SY, Kuo HW (2008) Ambient temperature and emergency room
admissions for acute coronary syndrome in Taiwan. Int J Biometeorol 52(3):223–229
Liang WM, Liu WP, Kuo HW (2009) Diurnal temperature range and emergency room admissions
for chronic obstructive pulmonary disease in Taiwan. Int J Biometeorol 53(1):17–23
13 Trends and Seasonal Variations of Climate, Air Quality, and Mortality in. . . 211
Lin YK, Ho TJ, Wang YC (2011) Mortality risk associated with temperature and prolonged
temperature extremes in elderly populations in Taiwan. Environ Res 111(8):1156–1163
Lin YK, Chang CK, Li MH, Wu YC, Wang YC (2012) High-temperature indices associated with
mortality and outpatient visits: characterizing the association with elevated temperature. Sci
Total Environ 427:41–49
Lin YK, Chang CK, Wang YC, Ho TJ (2013a) Acute and prolonged adverse effects of temperature
on mortality from cardiovascular diseases. PloS One 8(12):e82678
Lin YK, Chang CK, Chang SC, Chen PS, Lin C,Wang YC (2013b) Temperature, nitrogen dioxide,
circulating respiratory viruses and acute upper respiratory infections among children in Taipei,
Taiwan: a population-based study. Environ Res 120:109–118
Romero-Lankao P, Qin H, Dickinson K (2012) Urban vulnerability to temperature-related haz-
ards: a meta-analysis and meta-knowledge approach. Glob Environ Chang 22(3):670–683
Sen PK (1968) Estimates of the regression coefficient based on Kendall’s tau. J Am Stat Assoc
63:1379–1389
Sung TI, Wu PC, Lung SC, Lin CY, Chen MJ, Su HJ (2013) Relationship between heat index and
mortality of 6 major cities in Taiwan. Sci Total Environ 442:275–281
Tsai S, Yang CY (2014) Fine particulate air pollution and hospital admissions for pneumonia in a
subtropical city: Taipei, Taiwan. J Toxicol Environ Health A 77(4):192–201
Tsai SS, Huang CH, Goggins W, Wu TN, Yang CY (2003) Relationship between air pollution and
daily mortality in a tropical city: Kaohsiung, Taiwan. J Toxicol Environ Health A 66
(17):1341–1349
Tsai DH, Wang JL, Chuang KJ, Chan CC (2010) Traffic-related air pollution and cardiovascular
mortality in central Taiwan. Sci Total Environ 408(8):1818–1823
Tsai SS, Chang CC, Liou SH, Yang CY (2014a) The effects of fine particulate air pollution on
daily mortality: a case-crossover study in a subtropical city, Taipei, Taiwan. Int J Environ Res
Public Health 11(5):5081–5093
Tsai SS, Chiu HF, Liou SH, Yang CY (2014b) Short-term effects of fine particulate air pollution
on hospital admissions for respiratory diseases: a case-crossover study in a tropical city. J
Toxicol Environ Health A 77(18):1091–1101
Tsai SS, Weng YH, Chiu YW, Yang CY (2015) Short-term effect of coarse particles on daily
mortality rate in a tropical city, Kaohsiung, Taiwan. J Toxicol Environ Health A 78
(23–24):1409–1420
Tseng E, Ho WC, Lin MH, Cheng TJ, Chen PC, Lin HH (2015) Chronic exposure to particulate
matter and risk of cardiovascular mortality: cohort study from Taiwan. BMC Public Health
15(1):1
United Nations (2014) World urbanization prospects: the 2014 revision, highlights, department of
economic and social affairs, population division, New York, (ST/ESA/SER.A/352)
Wang YC, Lin YK (2014) Association between temperature and emergency room visits for
cardiorespiratory diseases, metabolic syndrome-related diseases, and accidents in metropolitan
Taipei. PloS One 9(6):e99599
Wang YC, Lin YK (2015) Mortality associated with particulate concentration and Asian dust
storms in Metropolitan Taipei. Atmos Environ 117:32–40
Wang YC, Lin YK, Chuang CY, Li MH, Chou CH, Liao CH, Sung FC (2012) Associating
emergency room visits with first and prolonged extreme temperature event in Taiwan: a
population-based cohort study. Sci Total Environ 416:97–104
Yang CY (2008) Air pollution and hospital admissions for congestive heart failure in a subtropical
city: Taipei, Taiwan. J Toxicol Environ Health A 71(16):1085–1090
Yang CY, Chang CC, Chuang HY, Tsai SS, Wu TN, Ho CK (2004) Relationship between air
pollution and daily mortality in a subtropical city: Taipei, Taiwan. Environ Int 30:519–523
Yu HL, Chien LC (2016) Short-term population-based non-linear concentration–response associ-
ations between fine particulate matter and respiratory diseases in Taipei (Taiwan): a spatio-
temporal analysis. J Expo Sci Environ Epidemiol 26(2):197–206
212 M.-H. Li
Mei-Hui Li is a professor in the department of Geography at National Taiwan University. She
received her Ph.D. degree from the University of Illinois at Urbana-Champaign. Her research
interests extend across a wide range of environmental problems, with a particular focus on how
anthropogenic activities affect the environment and human health. Her current work includes the
development of biomarkers and bioindicators to monitor aquatic ecosystems, as well as how
environmental change impacts ecosystem services and human health.
13 Trends and Seasonal Variations of Climate, Air Quality, and Mortality in. . . 213
Chapter 14
Climate Change and Urban Air PollutionHealth Impacts in Indonesia
Budi Haryanto
Abstract Climate change in Indonesia greatly affects economy, poor population,
human health, and the environment. It influences air pollutant emissions as higher
emissions of carbon dioxide (CO2) have caused rapidly worsening air pollution.
Urban areas being most affected by air pollution. The transportation sector con-
tributes the most (80%) to the air pollution followed by emissions from industry,
forest fires, and domestic activities. The large number of vehicles together with lack
of infrastructure results in major traffic congestions resulting in high levels of air
polluting substances, which have a significant negative effect on public health.
Current air pollution problems are greatest in Indonesia as it caused 50% of
morbidity across the country. Diseases stemming from vehicular emissions and
air pollution include acute respiratory infection, bronchial asthma, bronchitis, and
eye, skin irritations, lung cancer, and cardiovascular diseases. The prevalence and
incidence rate of diseases related to air pollution is predicted to become worse in the
near future since the range growth of energy consumption is about 6–8% per year. It
is impacted to the increasing of NOx up to 51% (from 814 kt/year in 2015 to
1,225 kt/year in 2030), PM2.5 up to 26% (from 87.7 kt/year in 2015 to 110.5 kt/year
in 2030), as well as other pollutants such as SO2, PM10, VOC, and O3. Most
recently, some studies on developing scenarios for reducing emission have been
conducted. These include analysis of fuel economy and the time effective for Euro
4 standard implementation as compliment to transportation improvement policy in
Indonesia, in which it suggested that the government of Indonesia must enhance
energy security and mitigate CO2 emissions, improve efficiency in energy produc-
tion and use, increase reliance on non-fossil fuels, and sustain the domestic supply
of oil and gas through decreased fossil fuel consumption, support the use of
proposed breakthrough technologies, and protect human health from air pollution
by conducting more research on health vulnerability and implementing more
effective adaptation of human health.
B. Haryanto (*)
Department of Environmental Health, Faculty of Public Health, Research Center for Climate
Change, University of Indonesia, Depok, Indonesia
e-mail: [email protected]; [email protected]
© Springer International Publishing AG 2018
R. Akhtar, C. Palagiano (eds.), Climate Change and Air Pollution,Springer Climate, DOI 10.1007/978-3-319-61346-8_14
215
Keywords Climate change • Air pollution • Health impacts • Reduction emission
scenarios
Indonesia and Climate Change
Indonesia is the world’s largest archipelagic state encompassing over 17,000
islands and home to over 260 million inhabitants (WPR 2016), which makes it
the fourth most populated country in the world and a significant emitter of green-
house gases due to deforestation and land-use change (WRI 2005). The Indonesian
archipelago lies between Asia and Australia. It is bounded by the South China Sea
in the north, the Pacific Ocean in the north and east, and the Indian Ocean in the
south and west. More than 80% of Indonesia’s territory is covered with water; the
land area is about 1.9 million square kilometers. The urbanization rate is very high
(4.4%). Two-thirds of the total population and more than half of the poor (57%)
reside on Java (BPS 2016). Nearly 60% of Indonesia’s terrestrial area is forested.
However, deforestation and land-use change is estimated at two million hectares
(ha) per year and accounts for 85% of the Indonesia’s annual greenhouse gas
emissions (WRI 2002). Indonesia’s forested land also supports extremely high
levels of biodiversity, which, in turn, support a diverse array of livelihoods and
ecosystem services. Vulnerability for food security is high due to the country’sdependence on the production of rice, the primary staple food, which is projected to
decrease as a result of climate change. Poverty of a large part of the population
(110–140 million live on less than USD 2 per day) decreases their adaptive capacity
to the effects of climate change (World Bank 2014). The combination of high
population density and high levels of biodiversity makes Indonesia one of the most
vulnerable countries to the impacts of climate change.
Trends and Future Climate
Indonesia is extremely vulnerable to climatic hazards, including a sea-level rise,
and the frequency of natural hazards appears to be increasing (Suryanti 2006).
Since 1990, the temperature in Indonesia has increased by 0.3 �C, and it is expectedto increase in the range of 1.5–3.7 �C by 2100, with a mean increase across models
of 2.5 �C (IPCC 2007a). The increase in GHG emissions will also continue to affect
the “natural” climate variability, thus leading to more intense weather events (Case
et al. 2007).
Indonesia also experienced intense rainfall due to the impact of climate change
which is predicted to result in about 2–3%more rainfall in Indonesia each year (Sari
et al. 2007). The amplified rainfall is expected to persist and result in a shorter rainy
season, with a substantial increase in the risk of floods. For example, the Jakarta
flood in February 2007 affected 80 districts and caused traffic chaos paralyzing the
216 B. Haryanto
affected cities. In the flood more than 70,000 houses had water levels ranging from
5 to 10 cm, and an estimated 420,000 to 440,000 people were displaced from their
homes (Case et al. 2007).
Climate change will also increase the average sea level as a result of the
increased volume of warmer water and the melting of polar ice caps. The mean
sea level in the Jakarta Bay will rise as much as 0.57 centimeters (cm) annually, and
the land surface will decline as high as 0.8 cm per year. In Indonesia, the combi-
nation of rising sea levels and land subsidence will move the coastline inland, which
will cause an increasing risk of flooding (ADB 2009).
Impacts of Climate Change
Climate change in Indonesia greatly affects many aspects of the country, including
economy, poor population, human health, and the environment. Vulnerability
studies have illustrated that the economically productive areas of Bali, Java,
Sumatra, and Papua are particularly vulnerable to the effects of climate change
(World Bank 2009). The poor communities that live on the coast and those
dependent on agriculture will greatly be affected by droughts, sea-level rises,
floods, and landslides (World Bank 2010). Despite these hazards, the annual benefit
of adopting measures to combat climate change is likely to exceed its expected
costs by the year 2050 (World Bank 2010). Thus, adopting methods and policies to
mitigate climate change now will promote the potential development of Indonesia
and help to preserve the country’s rich biodiversity.
Changing climate is already affecting the timing of seasons in Indonesia, with
the onset of the wet season delayed by up to 20 days in the period 1991–2003
compared to 1960–1990 in parts of Sumatra and Java, and it is expected that climate
change will cause a longer dry season and more intense wet season over much of
Indonesia. El Ni~no has a large impact on Indonesian climate. Its effect includes
decreased rainfall and water storage and an increased area affected by drought and
fire among others, whereas La Ni~na increases precipitation and is linked to flooding.Approximately 60% of Indonesians live in low-lying coastal cities and
extremely vulnerable to sea-level rise, with the 42 million people who live less
than 10 meter (m) above sea level. A 1 m rise in sea level could inundate 405,000 ha
of land and reduce Indonesia’s territory by inundating low-lying islands which
mark its borders, and a 50 cm rise in sea level, combined with land subsidence in
Jakarta Bay, could permanently inundate densely populated areas of Jakarta and
Bekasi with a population of 270,000 (PEACE 2007). The sea-level rise, along with
the observed sinking in the Jakarta Bay region, will have massive influences on
infrastructure and businesses (Case et al. 2007). The rise will also reduce coastal
livelihoods and farming. The sea-level rise will most likely affect the production of
both fish and prawn, with an estimated loss of over 7000 tons, worth over 0.5
million US dollars, in the Krawang and Subang districts. The Citarum Basin is also
expected to experience a loss of 15,000 tons of fish, shrimp, and prawn yield. The
14 Climate Change and Urban Air Pollution Health Impacts in Indonesia 217
overall effect of this sea-level rise will result in the reduction of potential average
income. For example, it is predicted that in the Subang region alone, 43,000 farm
laborers will lose their jobs. Also, more than 81,000 farmers will have to seek other
sources of income due to the flooding of farms from rising sea levels (Sari et al.
2007).
Climate change will also pose a threat to food security in Indonesia. One of the
major concerns for Indonesia is the risk of a reduced food security due to climate
change. Climate change will affect evaporation, precipitation, and run-off soil
moisture and water, hence affecting agriculture and food security. For example,
the 1997 El Nino droughts affected approximately 426,000 hectares of rice. A
model that simulated the impacts of climate change on crops at the Goddard
Institute of Space Studies in the United Kingdom depicted a decrease of crop
harvest in East and West Java. Along with these effects, climate change will also
lower soil fertility by 2–8%, which will result in the estimated decrease of rice
yields by 4% per year and maize by 50% per year (Sari et al. 2007).
Human health in Indonesia will be both directly affected by climate change,
through deaths from floods and other disasters, and also indirectly affected due to
increased infections and diseases. The more frequent prolonged heat waves,
extreme weather, floods, and droughts caused by climate change will also lead to
increased injury, sickness, and mortality (Case et al. 2007). The direct effects –
higher temperatures, sea-level rising, and frequent floods and heat waves – will lead
to more injury and deaths. Extreme occurrences influenced by climate change in
Indonesia, such as floods, hurricanes, tidal waves, landslides, droughts, and forest
fires, are happening more often than before. There are 300 events of extreme
occurrences from January to August 2008, resulting in 263 deaths, 1927 critically
injured, 66,988 with mild injuries, 7 missing, and 92,210 refugees. Those refugees
are susceptible to easily spreading communicable diseases, even worsened by
unpredictable climate. A rise in seawater temperature has contributed to the spread
of diseases such as malaria, dengue fever, diarrhea, cholera, and other vector-
related diseases (La Ni~na years). A change in temperature, humidity, and wind
speed is also contributing to the increase in vector population, increasing their life-
span and also widening their spread. This in turn may intensify the occurrence of
vector-related communicable diseases such as leptospirosis, malaria, dengue fever,
yellow fever, schistosomiasis, filariasis, and plague (Haryanto 2016). Many people
in Indonesia will also experience enlarged respiratory effects as a result of increased
burning and air pollution. Numerous studies have also observed the association
between climate-related factors – severe floods, droughts, and warming tempera-
tures – with diarrheal diseases such as malaria, hepatitis, cholera, and dengue fever
(Case et al. 2007). The rise in sea levels, precipitation changes, and increased
flooding may also degrade the quality of freshwater and potentially contaminate
drinking water. Thus, water-borne disease will become more common in the region.
Once again, the poor in Indonesia are going to be the most impacted by the threat to
human health posed by climate change. Many of the region’s poor live in coastal
areas, and most of the small farmers and fisherman are too poor to acquire access to
218 B. Haryanto
sufficient health services. Thus, the poor lack a safety net to protect them against the
threats that climate change causes.
Climate Change and Air Pollution
Weather conditions influence air quality via the transport and/or formation of
pollutants (or pollutant precursors). Weather conditions can also influence air
pollutant emissions, both biogenic emissions (such as pollen production) and
anthropogenic emissions (such as those caused by increased energy demand)
(Haryanto 2016). Higher emissions of carbon dioxide (CO2) have caused rapidly
worsening air pollution that wreaks havoc on the environment and people’s health,a problem that Indonesia knows far too well. Air pollution from fuel burning and
forest fire is well known as the main contributor driver for climate change in
Indonesia.
Urban areas are being most affected by air pollution. The transportation sector
contributes the most (80%) to the air pollution followed by emissions from industry,
forest fires, and domestic activities. The large number of vehicles together with lack
of infrastructure results in major traffic congestions (mainly in urban centers)
resulting in high levels of air polluting substances, which have a significant
negative effect on public health, quality and quantity of crops, forests buildings,
and surface water quality.
The average of sulfur content used for diesel fuel in Indonesia is 2156 ppm
(between 400 and 4600 ppm) in 2007 (Bappenas and Swisscontact 2006). The
sulfur concentration is higher than 2006 (1494 ppm). In 29 cities, sulfur concen-
tration is found above 1000 ppm. Index of PM10 concentration in Jakarta in
2001–2015 (Air Quality Monitoring System) shows the yearly average about
three times higher than WHO standard (20 μg/m3) (Pusarpedal KLHK 2015). The
source of PM10 in Jakarta is from fuel burning and soil. The excess of PM10 and
SO3 concentration also occurred in the cities of Surabaya and Bandung (BPLHD
DKI 2009). Air quality monitoring using non-AQMS in 30 cities shows high
concentration for NO2 (0–30 ppm) and SO2 (0–50 ppm). A number of vehicles
used on the road increase annually with the average of 12% (motorcycle 30%)
which are linear with the increasing of fuel consumption. Emission test in Jakarta
2005 found that 57% vehicles did not pass the test. Meanwhile the traffic jams
among cities continue and worsen. Kerosene is the cooking fuel used by 45% of the
households sampled (BPS SUSENAS 2005). Fuelwood is used by 42% of the
households sampled (in 12 provinces, >50% households used fuelwood for
cooking).
Indonesia holds the world’s third largest tropical forests, covering almost
two-thirds of the country’s land area, and globally significant biodiversity. Over
the past 50 years, Indonesia has lost over 40% of its total forest cover. Currently the
deforestation rate is very high (1.8% annually). Between 2000 and 2005, forest loss
rate per year is 1.1 million ha (MoE 2009) and 0.4 million ha from 2009 to 2011
14 Climate Change and Urban Air Pollution Health Impacts in Indonesia 219
(MoF 2013). This is alarming as the forest sector provides important ecosystem
services, significantly supports the country’s economic development, and contrib-
utes to livelihoods, particularly for the rural poor. The Indonesian forests are
threatened by logging and agricultural clearance that results in deforestation.
Fires associated with agricultural and plantation development in Indonesia
impact ecosystem services and release emissions into the atmosphere that degrade
regional air quality and contribute to greenhouse gas concentrations. Primary forest
clearance in Indonesia totaled 6.02 Mha from 2000 to 2012 (Margono et al. 2014),
with some of the highest deforestation rates observed in carbon-rich peatland
forests in Sumatra and Kalimantan (Miettinen et al. 2011; Margono et al. 2014).
Forty-five percent of Indonesia’s deforestation from 2000 to 2010 was observed on
oil palm, timber, logging, and coal mining concessions (Abood et al. 2015), and by
2010, industrial plantations covered 2.3 Mha of peatlands in Sumatra and Kaliman-
tan, with approximately 70% developed since 2000 (Miettinen et al. 2012a). Fires
are considered to be a cheap and effective method to clear and maintain land for
agricultural and plantation development (Simorangkir 2007), but also damage
biodiversity, reduce carbon storage potential, and can severely degrade regional
air quality.
In 2015, within June to October, it is estimated that more than 2.6 million ha of
Indonesia’s forest and peatland are burned, bumping the country’s annual emission
from sixth largest emitter in the world to fourth largest. Various data also recorded
an increase of at least 55% more hotspots in 2015 compared to 2014, where Sipongi
(Ministry of Environment and Forestry’s database) shows that in 11 prioritized
provinces, there are more than 108,622 hotspots, with Central Kalimantan and
South Sumatra ranked number one and two, respectively, with 30,204 and 28,327
hotspots (MoEF 2015). A more urgent and devastating consequence of wildfires is
its effect on people’s health, directly and immediately affecting people who live in
haze-affected areas. Pollutant standard index (PSI) reached the highest level in
September and October 2015, far above the very dangerous level of 400. In Central
Kalimantan, the PSI reached the highest level of 3300, ten times the dangerous level
of 300.
Diseases Related to Air Pollution: Research Evidence
Ambient air pollution, which is mainly caused by the combustion of nonrenewable
fossil fuels for electricity generation, transport, and industry, has been worsening
over the past five decades (Rowshand et al. 2009; Ying et al. 2015). Many
epidemiological studies have indicated that air pollutants such as particulate matter
(PM), nitrogen dioxide (NO2), sulfur dioxide (SO2), and ozone (O3) are responsible
for increasing mortality and morbidity in different populations around the world,
especially from respiratory and cardiovascular diseases (CVD) (Rowshand et al.
2009; Samet and Krewski 2007; Tsai et al. 2014; Tsangari et al. 2016). A global
study of the burden of diseases in the year 2000 suggested that nearly two-thirds of
220 B. Haryanto
the estimated 800,000 deaths and 4.6 million lost years of healthy life worldwide
caused by exposure to air pollution in that year were in the developing countries of
Asia (World Health Organization 2002), and this phenomenon has continued until
very recently (World Health Organization 2014). Air pollution in major cities,
especially in developing countries, has reached a crisis point. The bad air quality
is responsible for the death of three million people each year and presents a
dilemma for millions worldwide that suffer asthma, acute respiratory diseases,
cardiovascular diseases, and lung cancer (MOE and KPBB 2006). In Indonesia,
exposure to air pollutants can have many serious health effects, especially follow-
ing severe pollution episodes. Long-term exposure to elevated levels of air pollu-
tion may have greater health effects than acute exposure. Current air pollution
problems are greatest in Indonesia as it caused 50% of morbidity across the country
(Haryanto and Franklin 2011).
Air pollution is proven as a major environmental hazard to residents in Jakarta,
regardless of their socioeconomic status. Transportation comprises 27% of
Indonesia’s GHG emissions, and traffic congestion is a huge problem in Jakarta.
Diseases stemming from vehicular emissions and air pollution include acute respi-
ratory infection, bronchial asthma, bronchitis, and eye and skin irritations, and it has
been recorded that the most common disease in northern Jakarta communities is
acute upper respiratory tract infection – at 63% of total visits to health-care centers
(Haryanto 2008). The prevalence of acute respiratory infection exceeds the national
prevalence (25.5%) in 16 provinces, whereas the top 10 highest rank of the
prevalence are in the city/district Kaimana (63.8%), Manggarai Barat (63.7%),
Lembata (62%), Manggarai (61.1%), Pegunungan Bintang (59.5%), Ngada
(58.6%), Sorong Selatan (56.5%), Sikka (55.8%), Raja Ampat (55.8%), and Puncak
Jaya (56.7%). The prevalence of cough in 2007 is 45% and flu 44% without any
significant different between urban and rural.
National Basic Health Research 2007 reported that the prevalence of acute
respiratory infection exceeds the national prevalence (25.5%) in 16 provinces.
The prevalence of cough in 2007 is 45% and flu 44% without any significant
difference between urban and rural. The prevalence of pneumonia exceeds the
national prevalence (2.18%) in 14 provinces. The prevalence of tuberculosis
(TB) exceeds the national prevalence (0.99%) in 17 provinces. In 2007, a number
of 232,358 cases found out of 268,042 TB cases (86.7%). The prevalence of asthma
exceeds the national prevalence (4%) in nine provinces (Ministry of Health 2008).
Pneumonia is overall the number one killer disease for infants (22.3%) and children
under 5 years of age (23.6%) and is among the top 10 diseases that result in deaths
among the adult population. The WHO in 2002 estimates acute lower respiratory
infection (ALRI) deaths attributable to solid fuel use (for children under 5 years) in
Indonesia at 3130 population, while chronic obstructive pulmonary disease (COPD)
deaths attributable to solid fuel use (for 30 years old and more) were estimated at
12,160 population (Haryanto 2016).
Air pollution of leaded gasoline exposure impact studies found that blood lead
levels (BLLs) of elementary school children in Bandung was 66% above the CDC
(Centers for Disease Control and Prevention, USA) level of 10 ug/dl in 2005 and
14 Climate Change and Urban Air Pollution Health Impacts in Indonesia 221
53% in 2006 (Haryanto et al. 2015). The Committee of Leaded-Gasoline Phasing
Out found 90% of children under 5 years old living near road and children’s roadhave BLLs above 10 ug/dl in Makassar in 2005. An indoor air study found about
50% of Jakarta’s professionals reported their symptoms of sick building syndrome
in the average of five times during 3 months observations due to indoor air quality at
their workplace (Haryanto and Sartika 2009).
Pneumonia is overall the number one killer disease for infant (22.3%) and
children under 5 years of age (23.6%) and among the top 10 diseases that result
in deaths among the adult population. The WHO, in 2002, estimates acute lower
respiratory infection (ALRI) deaths attributable to solid fuel use (for children under
5 years old) in Indonesia at 3130, while chronic obstructive pulmonary disease
(COPD) deaths attributable to solid fuel use (for 30 years old and more population)
were estimated at 12,160 population.
Air quality impacts are not limited to source regions (primarily in Central and
Southern Sumatra and Southern Kalimantan) but can be transported in the atmo-
sphere to affect transboundary locations such as Singapore (Hyer and Chew 2010;
Atwood et al. 2013; Reddington et al. 2014; Kim et al. 2015). Air pollution from
forest fire source in Sumatra and Kalimantan has had affected millions of human
health in Sumatra, Kalimantan, and neighborhood countries, Singapore and Malay-
sia (Haryanto 2016).
The human cost of air pollution in Indonesia is shocking: the 2015 haze caused
more than 28 million people are exposed, at least ten deaths from haze-related
illness, and 560,000 people suffer from haze-related respiratory problem – the real
number is likely to be higher as people living in remote areas and villages did not go
to hospital or local health center (MoH 2015) and firefighting costs are pushing $50
million per week. In 2010, 57.8% of the population in Jakarta was reported to have
suffered from different air pollution-related illnesses (e.g., asthma, bronchopneu-
monia, and chronic obstructive pulmonary disease or COPD, among others).
Associated costs were estimated at IDR 38.5 trillion – with the effect of decline
in productive days on economic growth (Safrudin 2015). Moreover, the national
35,000-megawatt development project is expected to increase the number of pre-
mature deaths from 6500 to 28,300 people per year due to impending air pollution
from coal-fired power plants (Greenpeace 2015). Thus, emissions and consequent
air pollution from mobile sources (i.e., motor vehicles) affect a range of sectors and
contribute to or affect the economy as a whole. Increased health costs and reduced
activity days (lower productivity) from air pollution-related illnesses directly cause
a lower quality of life and indirectly reduce GDP for a specific city or country. Total
economic cost, including direct damage (crops, forests, infrastructures), cost of
responding to the wildfires, and losses in other economic trades, is estimated to
exceed US $16 billion (IDR 221 trillion), more than double the costs of 2004
tsunami and three times the national health budget in 2015 (World Bank 2015).
This number is higher than the estimates of economic losses from 1997 forest fires.
222 B. Haryanto
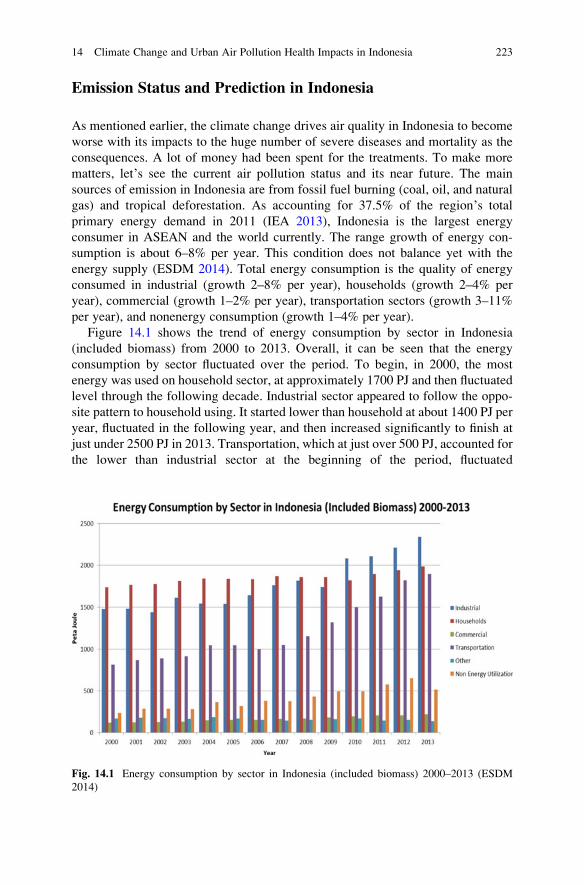
Emission Status and Prediction in Indonesia
As mentioned earlier, the climate change drives air quality in Indonesia to become
worse with its impacts to the huge number of severe diseases and mortality as the
consequences. A lot of money had been spent for the treatments. To make more
matters, let’s see the current air pollution status and its near future. The main
sources of emission in Indonesia are from fossil fuel burning (coal, oil, and natural
gas) and tropical deforestation. As accounting for 37.5% of the region’s total
primary energy demand in 2011 (IEA 2013), Indonesia is the largest energy
consumer in ASEAN and the world currently. The range growth of energy con-
sumption is about 6–8% per year. This condition does not balance yet with the
energy supply (ESDM 2014). Total energy consumption is the quality of energy
consumed in industrial (growth 2–8% per year), households (growth 2–4% per
year), commercial (growth 1–2% per year), transportation sectors (growth 3–11%
per year), and nonenergy consumption (growth 1–4% per year).
Figure 14.1 shows the trend of energy consumption by sector in Indonesia
(included biomass) from 2000 to 2013. Overall, it can be seen that the energy
consumption by sector fluctuated over the period. To begin, in 2000, the most
energy was used on household sector, at approximately 1700 PJ and then fluctuated
level through the following decade. Industrial sector appeared to follow the oppo-
site pattern to household using. It started lower than household at about 1400 PJ per
year, fluctuated in the following year, and then increased significantly to finish at
just under 2500 PJ in 2013. Transportation, which at just over 500 PJ, accounted for
the lower than industrial sector at the beginning of the period, fluctuated
Fig. 14.1 Energy consumption by sector in Indonesia (included biomass) 2000–2013 (ESDM
2014)
14 Climate Change and Urban Air Pollution Health Impacts in Indonesia 223
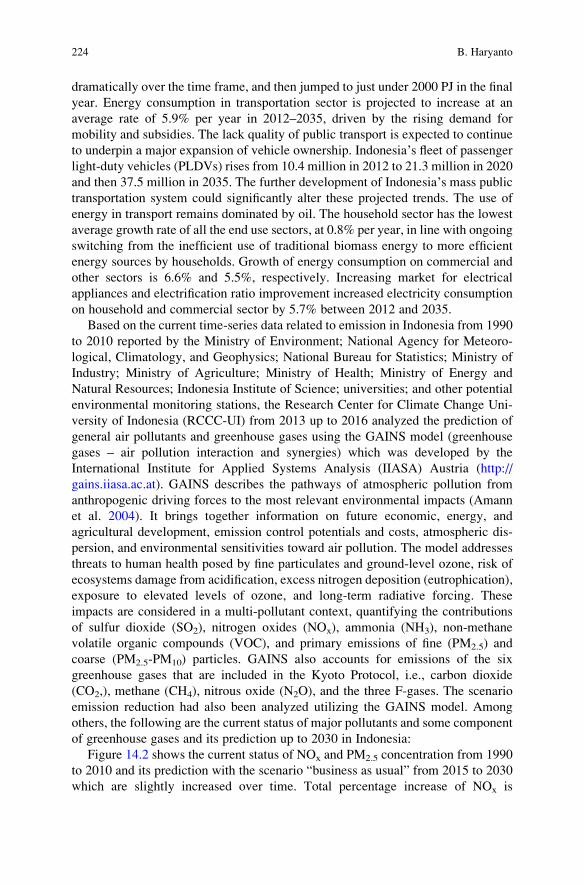
dramatically over the time frame, and then jumped to just under 2000 PJ in the final
year. Energy consumption in transportation sector is projected to increase at an
average rate of 5.9% per year in 2012–2035, driven by the rising demand for
mobility and subsidies. The lack quality of public transport is expected to continue
to underpin a major expansion of vehicle ownership. Indonesia’s fleet of passengerlight-duty vehicles (PLDVs) rises from 10.4 million in 2012 to 21.3 million in 2020
and then 37.5 million in 2035. The further development of Indonesia’s mass public
transportation system could significantly alter these projected trends. The use of
energy in transport remains dominated by oil. The household sector has the lowest
average growth rate of all the end use sectors, at 0.8% per year, in line with ongoing
switching from the inefficient use of traditional biomass energy to more efficient
energy sources by households. Growth of energy consumption on commercial and
other sectors is 6.6% and 5.5%, respectively. Increasing market for electrical
appliances and electrification ratio improvement increased electricity consumption
on household and commercial sector by 5.7% between 2012 and 2035.
Based on the current time-series data related to emission in Indonesia from 1990
to 2010 reported by the Ministry of Environment; National Agency for Meteoro-
logical, Climatology, and Geophysics; National Bureau for Statistics; Ministry of
Industry; Ministry of Agriculture; Ministry of Health; Ministry of Energy and
Natural Resources; Indonesia Institute of Science; universities; and other potential
environmental monitoring stations, the Research Center for Climate Change Uni-
versity of Indonesia (RCCC-UI) from 2013 up to 2016 analyzed the prediction of
general air pollutants and greenhouse gases using the GAINS model (greenhouse
gases – air pollution interaction and synergies) which was developed by the
International Institute for Applied Systems Analysis (IIASA) Austria (http://
gains.iiasa.ac.at). GAINS describes the pathways of atmospheric pollution from
anthropogenic driving forces to the most relevant environmental impacts (Amann
et al. 2004). It brings together information on future economic, energy, and
agricultural development, emission control potentials and costs, atmospheric dis-
persion, and environmental sensitivities toward air pollution. The model addresses
threats to human health posed by fine particulates and ground-level ozone, risk of
ecosystems damage from acidification, excess nitrogen deposition (eutrophication),
exposure to elevated levels of ozone, and long-term radiative forcing. These
impacts are considered in a multi-pollutant context, quantifying the contributions
of sulfur dioxide (SO2), nitrogen oxides (NOx), ammonia (NH3), non-methane
volatile organic compounds (VOC), and primary emissions of fine (PM2.5) and
coarse (PM2.5-PM10) particles. GAINS also accounts for emissions of the six
greenhouse gases that are included in the Kyoto Protocol, i.e., carbon dioxide
(CO2,), methane (CH4), nitrous oxide (N2O), and the three F-gases. The scenario
emission reduction had also been analyzed utilizing the GAINS model. Among
others, the following are the current status of major pollutants and some component
of greenhouse gases and its prediction up to 2030 in Indonesia:
Figure 14.2 shows the current status of NOx and PM2.5 concentration from 1990
to 2010 and its prediction with the scenario “business as usual” from 2015 to 2030
which are slightly increased over time. Total percentage increase of NOx is
224 B. Haryanto
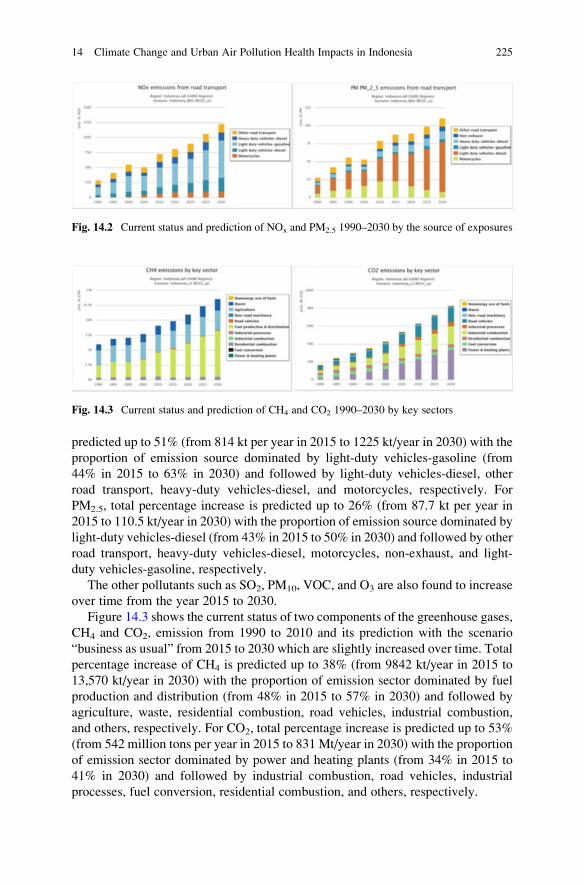
predicted up to 51% (from 814 kt per year in 2015 to 1225 kt/year in 2030) with the
proportion of emission source dominated by light-duty vehicles-gasoline (from
44% in 2015 to 63% in 2030) and followed by light-duty vehicles-diesel, other
road transport, heavy-duty vehicles-diesel, and motorcycles, respectively. For
PM2.5, total percentage increase is predicted up to 26% (from 87.7 kt per year in
2015 to 110.5 kt/year in 2030) with the proportion of emission source dominated by
light-duty vehicles-diesel (from 43% in 2015 to 50% in 2030) and followed by other
road transport, heavy-duty vehicles-diesel, motorcycles, non-exhaust, and light-
duty vehicles-gasoline, respectively.
The other pollutants such as SO2, PM10, VOC, and O3 are also found to increase
over time from the year 2015 to 2030.
Figure 14.3 shows the current status of two components of the greenhouse gases,
CH4 and CO2, emission from 1990 to 2010 and its prediction with the scenario
“business as usual” from 2015 to 2030 which are slightly increased over time. Total
percentage increase of CH4 is predicted up to 38% (from 9842 kt/year in 2015 to
13,570 kt/year in 2030) with the proportion of emission sector dominated by fuel
production and distribution (from 48% in 2015 to 57% in 2030) and followed by
agriculture, waste, residential combustion, road vehicles, industrial combustion,
and others, respectively. For CO2, total percentage increase is predicted up to 53%
(from 542 million tons per year in 2015 to 831 Mt/year in 2030) with the proportion
of emission sector dominated by power and heating plants (from 34% in 2015 to
41% in 2030) and followed by industrial combustion, road vehicles, industrial
processes, fuel conversion, residential combustion, and others, respectively.
Fig. 14.2 Current status and prediction of NOx and PM2.5 1990–2030 by the source of exposures
Fig. 14.3 Current status and prediction of CH4 and CO2 1990–2030 by key sectors
14 Climate Change and Urban Air Pollution Health Impacts in Indonesia 225
The increasing trend over time is also found among the other components of
greenhouse gases such as N2O, CO, NH3, and non-CO2 GHG.
Efforts to Combat Air Pollution
Several activities have been developing, implementing, and improving to prevent
and control climate change and air pollution in Indonesia. In 1999, the Indonesian
Ministry of Environment suggested several steps to the Indonesian government in
order to combat the effects and impacts of climate change. Among others, it is to
prevent forest fires in areas that are prone to such fires due to forestry is the main
cause of Indonesia’s high greenhouse gas emission, and thus it must be the
country’s primary concern. A decade later, in May 2011, Indonesia announced a
moratorium on granting new concession licenses in primary forests and peatlands
while working toward land-use planning reforms that would help Indonesia achieve
its greenhouse gas reduction targets (Austin et al. 2012). However, recent work
analyzing the effect of this moratorium indicates that it would have offered only
slight reductions (�5%) in national greenhouse gas emissions from deforestation if
the policy had been in place over the prior decade (Busch et al. 2015). In addition, it
remains unclear how much fire activity was associated with deforestation and
management within different concession types during this time period. Logging
concessions tend to have much lower deforestation rates than oil palm or timber
concessions (Abood et al. 2015; Busch et al. 2015). However, given the tendency of
logging concessions to be reclassified into other types of plantations (Gaveau et al.
2013) and with 35% of Indonesia’s remaining forest area located within industrial-
scale (not smallholder) concessions (Abood et al. 2015), it is crucial to understand
differences among various industries regarding both deforestation and fire activity,
along with the subsequent impacts on air quality and public health.
To make more focus, the efforts to combat the increasing trend of air pollution in
Indonesia should be differentiated into two general efforts, reducing the sources of
pollutants (mitigation) and preventing wider and more severe impacts to the
population (adaptation). These efforts of mitigation and adaptation to combat air
pollution in Indonesia are the following.
Mitigation
Mitigation refers to anthropogenic actions to reduce the emissions of greenhouse
gases to the atmosphere, and thus reduce the magnitude of future climate change
(IPCC 2007b), and is important in Indonesia due to its status as the third largest
emitter of greenhouse gases, principally from large emissions from deforestation.
Policies exist to reduce deforestation and thus emissions but are currently not well
implemented. Indonesia’s energy policy is to increase the use of fossil fuels, in
226 B. Haryanto
particular coal, with the result that emissions from the energy sector are expected to
triple by 2030 (PEACE 2007; MOE 2007). Policies are in place to support the use of
renewables, but there is a lack of financial incentives to support these policies and
encourage uptake. The government is also expanding the production of biofuel, for
both domestic use and export. This is largely produced from palm oil and will
require an extra 200,000 ha of plantations in 2009, driving deforestation (PEACE
2007). Biofuel produced from Jatropha has the potential to rehabilitate degraded
land and provide a source of rural livelihoods, but issues around deforestation and
conflict over land remain to be resolved.
It is estimated that Indonesia has the potential for 235 million tons of CO2
equivalent (mtCO2e) in emissions reductions through the Clean Development
Mechanism (CDM); however there are currently only eight projects registered
with the Executive Board of the CDM, accounting for 13mtCO2e of reductions.
GTZ and the Asian Development Bank have been building the capacity for CDM in
Indonesia; however, compared to neighboring countries in Asia, CDM is underde-
veloped in Indonesia (PEACE 2007). Indonesia is currently lobbying the UNFCCC
to include the proposal on avoided deforestation (REDD), whereby developing
countries would receive compensation for preventing deforestation, as part of the
international agreement on climate change.
In 2009 at the G20 Summit, Susilo Bambang Yudhoyono, the previous presi-
dent, called for the emissions target that become the basis for Indonesia’s IntendedNationally Determined Contributions (INDC) in 2015, a 26% reduction in green-
house gas (GHG) emissions below business as usual by 2020 and up to 41%
reduction by 2020 with international assistance. The current INDC stands at 29%
reduction by 2030 and the same 41% conditional target. In 2011, Yudhoyono
declared Presidential Regulation Number 61 which included the National Action
Plan for Greenhouse Gas Reduction (Rencana Nasional Penurunan Emisi GasRumah Kaca, RAN-GRK). Presidential Regulation No. 61 was the outcome of the
G20 summit and the Conference of the Parties (COP) meetings in Cancun and
Copenhagen. The decree intended to use RAN-GRK as a reference document for
GHG emissions in any government development planning. RAN-GRK has been
expanded since the decree. It identifies the actions that Indonesia will take to reduce
its GHG emissions. In 2012, Bappenas (Board of National Development Planning)
established a secretariat for RAN-GRK. The executive branch has largely developedand implemented RAN-GRK.
RAN-GRK is the “plan of action” for Indonesia’s emissions reductions targets. It
requires the participation of government ministries and institutions to reduce GHG
emissions. RAN-GRK identifies five major sectors that will be essential to achieve
local action plan (RAD)-GRK’s emission reduction target. These are forestry and
peatlands, agriculture, energy, industry, transportation, and waste. The responsible
government ministries are Bappenas, the ministries of environment, forestry, agri-
culture, public works, industry, transportation, energy, and finance. Although RAN-GRK is a national action plan, it also lays the foundation for the actions of
provinces, localities, and private enterprises to implement GHG reductions. RAN-GRK mandates that Indonesia’s provinces develop and submit a local action plan
14 Climate Change and Urban Air Pollution Health Impacts in Indonesia 227
(RAD-GRK). RAN-GRK provides capacity building, budgets, and potential partic-
ipation in domestic and international markets to local governments to incentivize
them to contribute to RAN-GRK’s goals. RAD-GRKs are tailored to the develop-
ment plans of each of the provinces. The Ministry of Home Affairs with the support
of Bappenas and the Ministry of the Environment oversees and coordinates the
preparation of RAD-GRKs. Bappenas creates the guidelines for each of the local
action plans. Local action plans are planned with these expectations:
– Calculation of GHG inventory and of a provincial multi-sectoral business-as-
usual (BAU) baseline
– Identification and selection of mitigation actions
– Development of mitigation scenarios according to selected and prioritized GHG
mitigation actions in line with their local development priorities and plans
– Identification of the key stakeholders/institutions and financial resources
Local governments can also encourage the involvement of public and private
companies by raising awareness of the climate change impacts and facilitating
public private partnerships (among other options).
In early January 2016, BRG (Peatland Restoration Body, Badan RestorasiGambut) was established with the target of restoring two million ha of peatland
within 5 years. BRG, which works directly under President Joko Widodo, aims to
achieve 30% or 600,000 ha by the end of 2016 in four regencies, Pulang Pisau in
Central Kalimantan, Ogan Komering Ilir and Musi Banyuasin in South Sumatra,
and Meranti in Riau (BRG 2016). Another effort backed by the government is One
Map Policy (MSP 2016), a project aimed to create a single map for land tenure, land
use, and other spatial planning in Indonesia. The unclear land ownership system,
overlapping interest, and claims on land between community and plantation com-
panies hamper the legal enforcement of wildfires and social conflict results from
these complications. One Map is expected to provide a single reference map that
will help the investigation of wildfires cases.
These efforts will not provide immediate results. The government of Indonesia
had stated that it will take at least 3 years before any significant results can be seen.
This means that the program to help society in mitigating the impacts of haze and
wildfires should be the government’s top priority. It has become more urgent as
several fires have started in Sumatra and Kalimantan on June 2016; Riau govern-
ment even declared emergency state as the province saw 45 hotspots in March 27.
There are ongoing debates surrounding the practice of slash and burn in land
clearing including the debate on the provision which allows smallholders to legally
burn up to 2 ha of land and debate around opposing claims regarding source and
causes of wildfires between palm oil plantations and small-scale farmers. There is
also a lack of understanding in regard to farmers’ decision-making, motivation, and
aspiration in this area, considering complexity of their life, including their aspira-
tion for children’s education and well-being.
228 B. Haryanto
Adaptation
Adaptation can be seen as adjustments in human or physical systems in response to
current or expected climate changes in order to cope with the impacts of climate
change and take advantage of any new opportunities (IPCC 2007b). To achieve its
goals for economic development and poverty reduction, in particular among the
poorest and most marginalized sectors of population, Indonesia will need to adapt
to climate change. It is also clear that many Indonesians are already adapting to
climate change, for example, by building houses on stilts to respond to increased
flooding, or responding to decreased reliability of fish catches by diversifying
livelihoods, and that indigenous adaptation strategies should form the base for
building adaptation to future change (UNDP 2007). Adaptation and mitigation in
Indonesia are strongly coupled, as continued rapid deforestation will not only
exacerbate the impacts of climate change but also constrain the adaptation options
that are available to vulnerable communities. The priority sectors for adaptation are
seen as agriculture, water, coastal, and urban areas.
There are adaptation options that are specific for each of these sectors, for
example, faster-growing crops varieties in the agricultural sector; however there
are also general needs to be addressed which will build capacity for adaptation
across sectors. These include the development of a system to provide climate
information to actors at different scales, for example, seasonal forecasts, and
training in how to use this information effectively to manage climate risks. Training
in vulnerability analysis and assessment of adaptation options would help to
identify priorities for adaptation. Initiatives such as the development of community
action plans to cope with flooding are being pursued in the field of disaster risk
reduction (DRR) but are equally relevant in building community resilience to future
climate change. Adaptation to climate change will be a long-term process, and as
such will require long-term partnerships and cooperation between different actors at
different scales. Encouraging dialogue between these different actors, in a similar
way to the workshop convened to discuss the Climate Change Adaptation Program
(ICCAP), will help to foster the relationships needed to enable adaptation to take
place.
In order to speed innovation, the Indonesian government must focus on improv-
ing the technology and transfer of information to the farmer. It is also important to
strengthen the research that is done on the development of more sustainable
agricultural practices. The government must also promote innovative and improved
agricultural practices that release the least amount of greenhouse gases into the
atmosphere. However, such program intervention will not be as effective and
relevant as it should be without understanding the experience of people who are
directly affected by haze. Various reports indicate that some people are not using
masks in haze-affected areas, while there is very limited or no reports that provide a
better understanding toward people’s willingness, awareness, and access (or lack
of) to use proper mask during haze or how family manage and cope with the haze-
related risks, especially in relation to their and their children’s health.
14 Climate Change and Urban Air Pollution Health Impacts in Indonesia 229
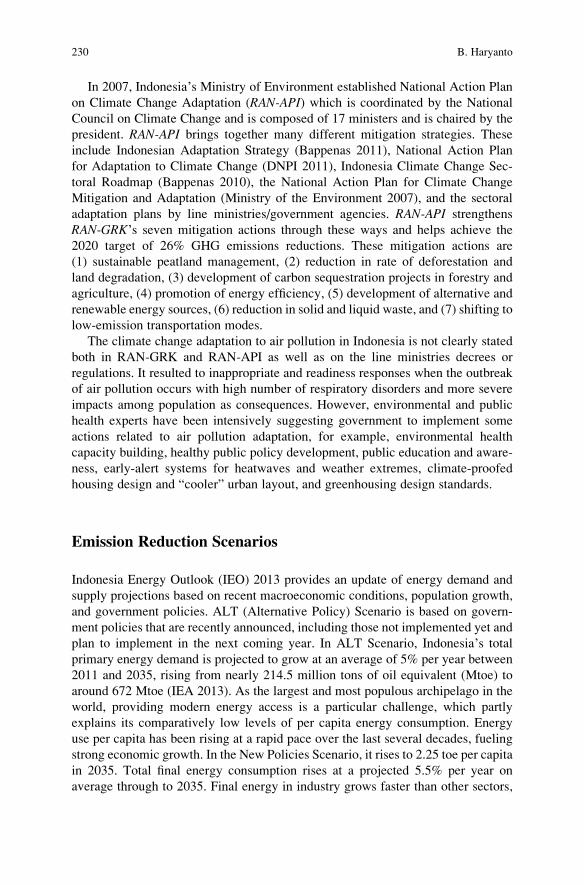
In 2007, Indonesia’s Ministry of Environment established National Action Plan
on Climate Change Adaptation (RAN-API) which is coordinated by the National
Council on Climate Change and is composed of 17 ministers and is chaired by the
president. RAN-API brings together many different mitigation strategies. These
include Indonesian Adaptation Strategy (Bappenas 2011), National Action Plan
for Adaptation to Climate Change (DNPI 2011), Indonesia Climate Change Sec-
toral Roadmap (Bappenas 2010), the National Action Plan for Climate Change
Mitigation and Adaptation (Ministry of the Environment 2007), and the sectoral
adaptation plans by line ministries/government agencies. RAN-API strengthens
RAN-GRK’s seven mitigation actions through these ways and helps achieve the
2020 target of 26% GHG emissions reductions. These mitigation actions are
(1) sustainable peatland management, (2) reduction in rate of deforestation and
land degradation, (3) development of carbon sequestration projects in forestry and
agriculture, (4) promotion of energy efficiency, (5) development of alternative and
renewable energy sources, (6) reduction in solid and liquid waste, and (7) shifting to
low-emission transportation modes.
The climate change adaptation to air pollution in Indonesia is not clearly stated
both in RAN-GRK and RAN-API as well as on the line ministries decrees or
regulations. It resulted to inappropriate and readiness responses when the outbreak
of air pollution occurs with high number of respiratory disorders and more severe
impacts among population as consequences. However, environmental and public
health experts have been intensively suggesting government to implement some
actions related to air pollution adaptation, for example, environmental health
capacity building, healthy public policy development, public education and aware-
ness, early-alert systems for heatwaves and weather extremes, climate-proofed
housing design and “cooler” urban layout, and greenhousing design standards.
Emission Reduction Scenarios
Indonesia Energy Outlook (IEO) 2013 provides an update of energy demand and
supply projections based on recent macroeconomic conditions, population growth,
and government policies. ALT (Alternative Policy) Scenario is based on govern-
ment policies that are recently announced, including those not implemented yet and
plan to implement in the next coming year. In ALT Scenario, Indonesia’s total
primary energy demand is projected to grow at an average of 5% per year between
2011 and 2035, rising from nearly 214.5 million tons of oil equivalent (Mtoe) to
around 672 Mtoe (IEA 2013). As the largest and most populous archipelago in the
world, providing modern energy access is a particular challenge, which partly
explains its comparatively low levels of per capita energy consumption. Energy
use per capita has been rising at a rapid pace over the last several decades, fueling
strong economic growth. In the New Policies Scenario, it rises to 2.25 toe per capita
in 2035. Total final energy consumption rises at a projected 5.5% per year on
average through to 2035. Final energy in industry grows faster than other sectors,
230 B. Haryanto
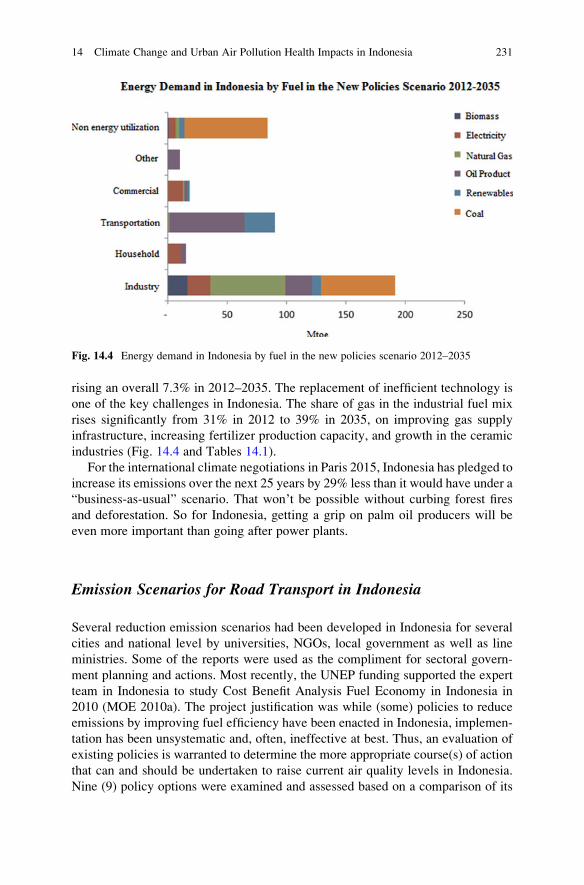
rising an overall 7.3% in 2012–2035. The replacement of inefficient technology is
one of the key challenges in Indonesia. The share of gas in the industrial fuel mix
rises significantly from 31% in 2012 to 39% in 2035, on improving gas supply
infrastructure, increasing fertilizer production capacity, and growth in the ceramic
industries (Fig. 14.4 and Tables 14.1).
For the international climate negotiations in Paris 2015, Indonesia has pledged to
increase its emissions over the next 25 years by 29% less than it would have under a
“business-as-usual” scenario. That won’t be possible without curbing forest fires
and deforestation. So for Indonesia, getting a grip on palm oil producers will be
even more important than going after power plants.
Emission Scenarios for Road Transport in Indonesia
Several reduction emission scenarios had been developed in Indonesia for several
cities and national level by universities, NGOs, local government as well as line
ministries. Some of the reports were used as the compliment for sectoral govern-
ment planning and actions. Most recently, the UNEP funding supported the expert
team in Indonesia to study Cost Benefit Analysis Fuel Economy in Indonesia in
2010 (MOE 2010a). The project justification was while (some) policies to reduce
emissions by improving fuel efficiency have been enacted in Indonesia, implemen-
tation has been unsystematic and, often, ineffective at best. Thus, an evaluation of
existing policies is warranted to determine the more appropriate course(s) of action
that can and should be undertaken to raise current air quality levels in Indonesia.
Nine (9) policy options were examined and assessed based on a comparison of its
Fig. 14.4 Energy demand in Indonesia by fuel in the new policies scenario 2012–2035
14 Climate Change and Urban Air Pollution Health Impacts in Indonesia 231
estimated costs and projected benefits, and the policy alternative which yields the
highest advantage per unit cost was determined. Calculations and corresponding
recommendations made take into account the local, national, and regional socio-
political conditions to arrive at scenarios to address air pollution levels in Indonesia.
The nine (9) policy options proposed and evaluated in the study include:
– Option 1. Implementing Euro 2 in 2005, Euro 3 in 2015, and Euro 4 in 2020.
– Option 2. Enhance fuel efficiency by 10% in 2009.
– Option 3. Convert at least 1% of passenger cars and buses to compressed natural
gas (CNG) in 2009, 2% in 2011, and 5% in 2021.
– Option 4. Use catalytic converters on 25% of vehicles that run on diesel:
passenger cars, buses, and trucks.
– Option 5. Beginning in 2009, scrap 50% of vehicles that are more than
20 (20) years old.
– Option 6. Promote and use hybrid technology for at least 0.05% of passenger
cars and buses in 2009, 0.1% in 2011, 0.5 in 2016, and 1% in 2021.
– Option 7. Convert at least 1% of passenger cars to biofuels in 2009, 2% in 2011,
and 5% in 2021.
– Option 8. Owners of passenger cars and motorcycles shift to public transport by
at least 5% and 1% in 2011, 10% and 5% in 2014, 20% and 10% in 2018, and
40% and 20% in 2025.
– Option 9. Implement Euro 2 in 2005 and adopt Euro 3 in 2013 and Euro
4 in 2016.
For all the proposed scenarios, it is assumed that Option 1 or the improvement of
fuel quality by meeting Euro 2 standards has been implemented.
Implementing the baseline (i.e., improvement of fuel quality) alone will result in
the reduction of sulfur levels below 500 ppm, leading to reduced health costs and
productivity losses of IDR 38,963 billion (net present value, NPV) for the period
2005–2030 and approximately IDR 71,395 billion (NPV) in fuel savings. These are
the baseline figures by which all the other policy options were measured against.
Alternatively, the policy’s expected economic gains and savings are that which the
other eight options aim to enhance or build on. In terms of gaining the highest
economic benefits and generating savings from fuel subsidies, adopting hybrid
vehicle technology (Option 5) would be considered the best option with IDR
Table 14.1 Energy demand in Indonesia by fuel in the new policies scenario (Mtoe)
Type 2012 2020 2025 2030 2035 2012–2035
Coal 38 90 114 127 145 6.0%
Oil 78 96 124 158 180 3.7%
Gas 43 85 131 153 172 6.2%
Hydro 2 2 2 4 7 7.2%
Bioenergy 8 16 24 28 34 6.6%
Other renewables 1 29 41 66 100 20.3%
Total 170 318 437 537 639 5.9%
232 B. Haryanto
1,563,678 billion (NPV) for reduced health cost and production losses for
2005–2030 and IDR 1,098,827 billion (NPV) in fuel saving for 2009–2030. Even
though, it needs the most investment cost both in the refinery and auto manufac-
turer. The retiring or scrapping of old vehicles (Option 6) would be considered the
most cost-effective. However, because it raises social equity issues and requires
high compensation costs, political and social challenges may hinder its implemen-
tation and/or effectiveness. Moreover, it assumes a reliable public transport system
that can and will absorb the increase in the number of commuters who will stand to
lose their motor vehicles to comply with the policy. Also, the political implications
of implementing the policy make it unpopular to incumbent politicians and/or
officials.
The option to enhance fuel efficiency, which builds on the baseline, yields the
second highest economic gain and savings. Risks for implementing it are low, thus,
the likelihood of the government promoting and undertaking it is high. Setting up
incentives for the auto industry to produce more fuel-efficient vehicles should
accompany policy implementation to ensure its effectiveness. Promotion and adop-
tion of the use of CNG, hybrid technology in vehicles, and biofuels all yield positive
net economic benefits and fuel savings, with CNG showing the highest economic
gains and the use of biofuels providing the largest savings. However, all three
options entail high costs: a catalytic converter to shift from conventional gas to
CNG, acquiring or providing incentives for investments in hybrid technology, and
the unsubsidized prices of biofuels. Option 9, i.e., implementation of Euro 4 stan-
dards in 2016, is consistent with the positive, upward trend of the expected
economic gains of and fuel savings from the other policy options. The success of
implementing Option 8, or encouraging the shift from private to public transport, is
largely contingent on the public’s behavior. However, it could also be argued that
improving the current state of the country’s public transport can help influence the
public’s attitude toward and usage of it. Nevertheless, the benefits of improved
public transport in terms of reduced air pollution, fuel consumption, and traffic
congestion and overall improved quality of life are underscored. These are more
than enough justifications to adopt and pursue implementation of this policy option.
The adoption and use of CNG, hybrid technology, and improvement of public
transport appear to be the most cost-effective among all the nine options. Thus,
given the projected economic gains, expected fuel savings, and least cost to reduce
emissions per ton, provision and improvement of public transport seems to be the
most promising, in terms of both short- and long-term effects.
Research Center for Climate Change – University of Indonesia (RCCC-UI), by
support funding from Toyota Clean Air Project Japan (TCAP) and technical
assistant of International Institute for Applied Systems Analysis (IIASA) Austria,
has been conducting 4 years study on Reduction Emission Scenarios Development
for Indonesia based on energy transportation since 2014. In this study, emission
scenarios define as the combination of activity projections and control strategies.
The activities data are used and input to the GAINS model for calculating emis-
sions. Prior to the development of dataset, some calculations and mathematical
conversions were conducted to meet the format of GAINS’ datasets. There are four
14 Climate Change and Urban Air Pollution Health Impacts in Indonesia 233
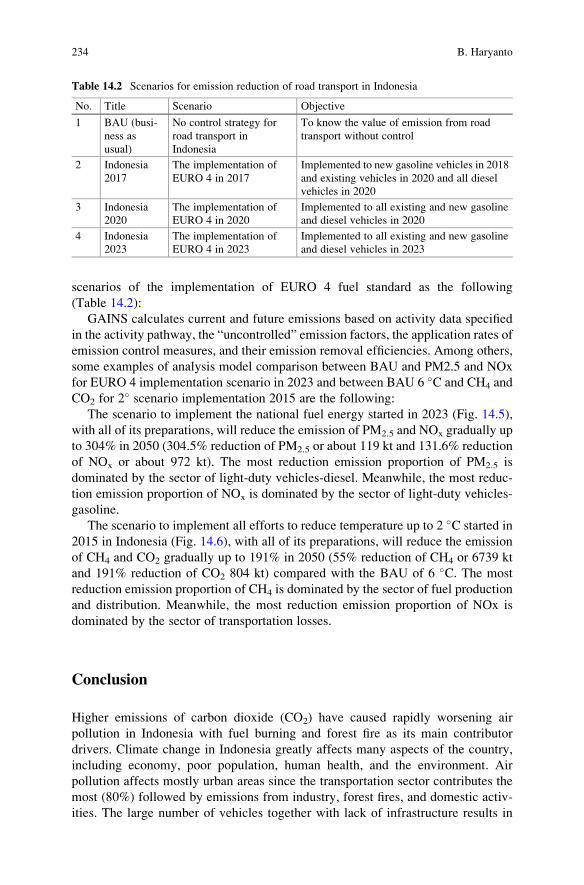
scenarios of the implementation of EURO 4 fuel standard as the following
(Table 14.2):
GAINS calculates current and future emissions based on activity data specified
in the activity pathway, the “uncontrolled” emission factors, the application rates of
emission control measures, and their emission removal efficiencies. Among others,
some examples of analysis model comparison between BAU and PM2.5 and NOx
for EURO 4 implementation scenario in 2023 and between BAU 6 �C and CH4 and
CO2 for 2� scenario implementation 2015 are the following:
The scenario to implement the national fuel energy started in 2023 (Fig. 14.5),
with all of its preparations, will reduce the emission of PM2.5 and NOx gradually up
to 304% in 2050 (304.5% reduction of PM2.5 or about 119 kt and 131.6% reduction
of NOx or about 972 kt). The most reduction emission proportion of PM2.5 is
dominated by the sector of light-duty vehicles-diesel. Meanwhile, the most reduc-
tion emission proportion of NOx is dominated by the sector of light-duty vehicles-
gasoline.
The scenario to implement all efforts to reduce temperature up to 2 �C started in
2015 in Indonesia (Fig. 14.6), with all of its preparations, will reduce the emission
of CH4 and CO2 gradually up to 191% in 2050 (55% reduction of CH4 or 6739 kt
and 191% reduction of CO2 804 kt) compared with the BAU of 6 �C. The most
reduction emission proportion of CH4 is dominated by the sector of fuel production
and distribution. Meanwhile, the most reduction emission proportion of NOx is
dominated by the sector of transportation losses.
Conclusion
Higher emissions of carbon dioxide (CO2) have caused rapidly worsening air
pollution in Indonesia with fuel burning and forest fire as its main contributor
drivers. Climate change in Indonesia greatly affects many aspects of the country,
including economy, poor population, human health, and the environment. Air
pollution affects mostly urban areas since the transportation sector contributes the
most (80%) followed by emissions from industry, forest fires, and domestic activ-
ities. The large number of vehicles together with lack of infrastructure results in
Table 14.2 Scenarios for emission reduction of road transport in Indonesia
No. Title Scenario Objective
1 BAU (busi-
ness as
usual)
No control strategy for
road transport in
Indonesia
To know the value of emission from road
transport without control
2 Indonesia
2017
The implementation of
EURO 4 in 2017
Implemented to new gasoline vehicles in 2018
and existing vehicles in 2020 and all diesel
vehicles in 2020
3 Indonesia
2020
The implementation of
EURO 4 in 2020
Implemented to all existing and new gasoline
and diesel vehicles in 2020
4 Indonesia
2023
The implementation of
EURO 4 in 2023
Implemented to all existing and new gasoline
and diesel vehicles in 2023
234 B. Haryanto
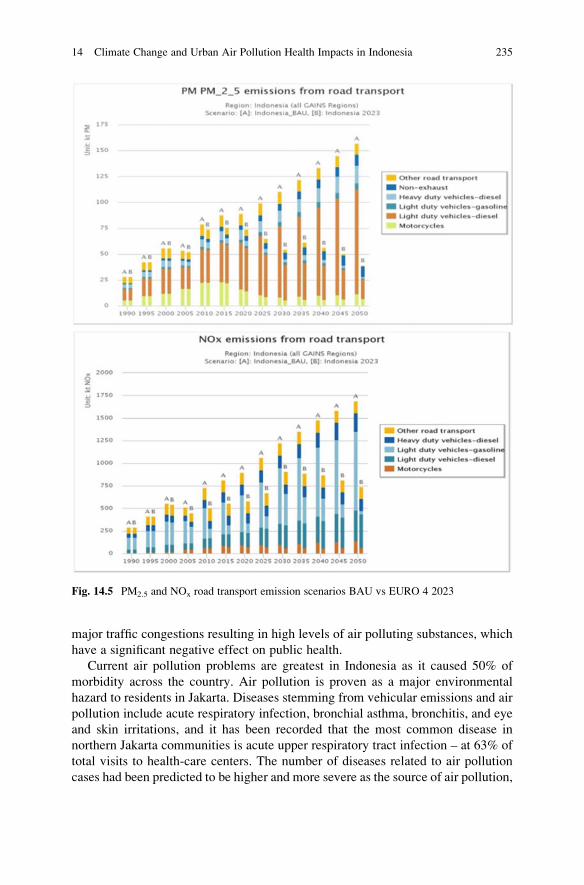
major traffic congestions resulting in high levels of air polluting substances, which
have a significant negative effect on public health.
Current air pollution problems are greatest in Indonesia as it caused 50% of
morbidity across the country. Air pollution is proven as a major environmental
hazard to residents in Jakarta. Diseases stemming from vehicular emissions and air
pollution include acute respiratory infection, bronchial asthma, bronchitis, and eye
and skin irritations, and it has been recorded that the most common disease in
northern Jakarta communities is acute upper respiratory tract infection – at 63% of
total visits to health-care centers. The number of diseases related to air pollution
cases had been predicted to be higher and more severe as the source of air pollution,
Fig. 14.5 PM2.5 and NOx road transport emission scenarios BAU vs EURO 4 2023
14 Climate Change and Urban Air Pollution Health Impacts in Indonesia 235
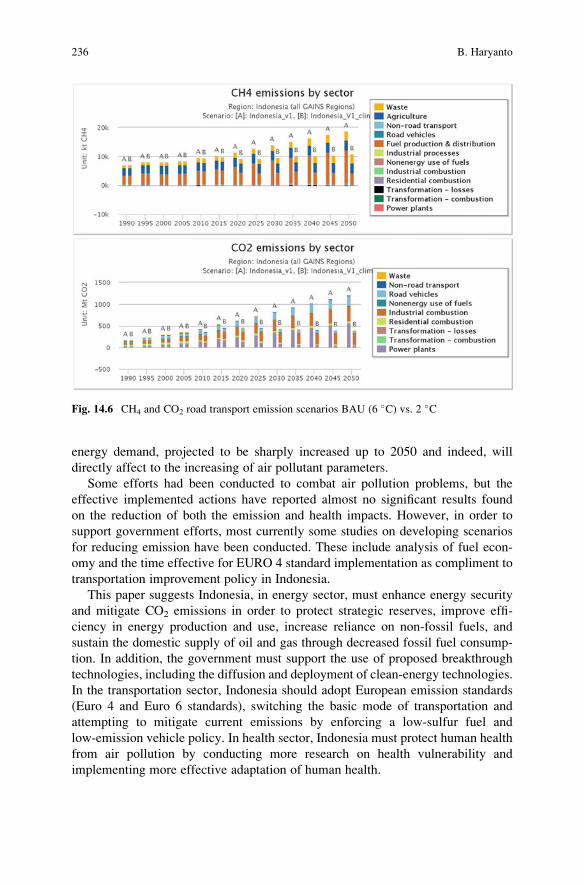
energy demand, projected to be sharply increased up to 2050 and indeed, will
directly affect to the increasing of air pollutant parameters.
Some efforts had been conducted to combat air pollution problems, but the
effective implemented actions have reported almost no significant results found
on the reduction of both the emission and health impacts. However, in order to
support government efforts, most currently some studies on developing scenarios
for reducing emission have been conducted. These include analysis of fuel econ-
omy and the time effective for EURO 4 standard implementation as compliment to
transportation improvement policy in Indonesia.
This paper suggests Indonesia, in energy sector, must enhance energy security
and mitigate CO2 emissions in order to protect strategic reserves, improve effi-
ciency in energy production and use, increase reliance on non-fossil fuels, and
sustain the domestic supply of oil and gas through decreased fossil fuel consump-
tion. In addition, the government must support the use of proposed breakthrough
technologies, including the diffusion and deployment of clean-energy technologies.
In the transportation sector, Indonesia should adopt European emission standards
(Euro 4 and Euro 6 standards), switching the basic mode of transportation and
attempting to mitigate current emissions by enforcing a low-sulfur fuel and
low-emission vehicle policy. In health sector, Indonesia must protect human health
from air pollution by conducting more research on health vulnerability and
implementing more effective adaptation of human health.
Fig. 14.6 CH4 and CO2 road transport emission scenarios BAU (6 �C) vs. 2 �C
236 B. Haryanto
References
Abood SA, Lee JSH, Burivalova Z, Garcia-Ulloa J, Koh LP (2015) Relative contributions of the
logging, fiber, oil palm, and mining industries to forest loss in Indonesia Conserv. Lett 8:58–67
Amann M, Cofala J, Heyes C, Klimont Z, Mechler R, Posch M, Schopp W (2004) Rains review
2004. Interim Rep IIASA Austria (February 2004)
Asian Development Bank (2009) The economics of climate change in Southeast Asia: a regional
review (Manila, The Philippines: Asian Development Bank, April); available at: http://www.adb.
org/Documents/Books/Economics-Climate-Change-SEA/PDF/Economics-Climate-Change.pdf
Atwood SA, Reid JS, Kreidenweis SM, Yu LE, Salinas SV, Chew BN, Balasubramanian R (2013)
Analysis of source regions for smoke events in Singapore for the 2009 El Ni~no burning seasonAtmos. Environment 78:219–230
Austin K, Sheppard S, Stolle F (2012) Indonesia’s moratorium on new forest concessions: key
findings and next steps WRI working paper. World Resources Institute, Washington,
DC. www.wri.org/publication/indonesia-moratorium-on-new-forest-concessions
Badan Restorasi Gambut (2016) Peraturan Presiden No. 1 Tahun 2016 tentang Badan Restorasi
Gambut. Sekretariat Kabinet Republik Indonesia, Januari 2016, Jakarta
Bappenas & Swisscontact (2006) National strategy and action plan of urban air quality improve-
ment. Pelangi, 1999 on Haryanto, B. (2008). Climate change and public health adaptation in
Indonesia. Working paper for the workshop on mapping causal complexity in climate change
impacts and adaptation. The Nautilus Institute – the Royal Melbourne Institute of Technology
University, Melbourne 21–22 October 2008
Biro Pusat Statistik (2005) Survey Sosial Ekonomi (Susenas) – National Survey on Social and
Economic Report 2004. Jakarta
Biro Pusat Statistik (2016) at https://www.bps.go.id/linkTableDinamis/view/id/1119
BPLHD DKI (2009) http://bplhd.jakarta.go.id/filing/materi%202_Bahan%20FGD%20pencegahan%
20Dampak%20LLAJ%20pemprov%20DKI%20LH.pdf
Busch J et al (2015) Reductions in emissions from deforestation from Indonesia’s moratorium on
new oil palm, timber, and logging concessions. Proc Natl Acad Sci U S A 112:1328–1333
Case M, Ardiansyah F, Spector E (2007) Climate change in Indonesia. Implications for humans
and nature. World Wide Fund for Nature (WWF), Gland, Switzerland. Available at: http://
assets.panda.org/downloads/indoesian_climate_change_impacts_report_14nov07.pdf
Gaveau DLA et al (2013) Reconciling forest conservation and logging in Indonesian Borneo.
PLoS One 8:e69887
Greenpeace (2015) Human cost of coal power: how coal-fired power plants threaten the health of
Indonesians. August 2015, http://www.greenpeace.org/seasia/id/PageFiles/695938/full-report-
human-cost-of-coal-power.pdf
Haryanto B (2016) Climate change and human health scenario in South and Southeast Asia.
Akhtar R, editor. Springer ISSN 1879-7180, 2016
Haryanto B, Franklin P (2011) Air pollution: a tale of two countries. Rev Environ Health 26
(1):75–82
Haryanto B, Sartika RD (2009) The effect of anti-oxidant supplementation in reducing the
frequency of sick building syndrome among professionals in Jakarta 2008–2009. Indonesian
Public Health Association & Faculty of Public Health University of Indonesia.
Haryanto B, Djaja IM, Sutrisna B (2015) Effect of calcium supplementation on school children’sblood lead levels in Indonesia. Int J Sci Res 4(5):1620–1625
Hyer EJ, Chew BN (2010) Aerosol transport model evaluation of an extreme smoke episode in
Southeast Asia Atmos. Environment 44:1422–1427
International Energy Agency (IEA) (2013) World energy outlook 2013. OECD/IEA, 2013
IPCC (2007a) Working group I, chapter 11: regional climate projections. In: Solomon S, Qin D,
Manning M, Chen Z, Marquis M, Averyt KB, Tignor M, Miller HL (eds) Climate change 2007:
the physical science basis. Contribution of working group I to the fourth assessment report of
the intergovernmental panel on climate change. Cambridge University Press, Cambridge
14 Climate Change and Urban Air Pollution Health Impacts in Indonesia 237
IPCC (2007b) Appendix 1: glossary. In: Parry ML, Canziani OF, Palutikof JP, van der Linden PJ,
Hanson CE (eds) Climate change 2007: impacts, adaptation and vulnerability. Contribution of
working group II to the fourth assessment report of the intergovernmental panel on climate
change. Cambridge University Press, Cambridge, pp 273–313
Kementerian Enerji dan Sumber Daya Mineral (ESDM) (2014) Statistik Minyak Bumi 2012. Pusat
Data dan Teknologi Informasi ESDM
Kim PS, Jacob DJ, Mickley LJ, Koplitz SN, Marlier ME, DeFries RS, Myers SS, Chew BN, Mao
YH (2015) Sensitivity of population smoke exposure to fire locations in equatorial Asia. Atmos
Environ 102:11–17
Margono BA, Potapov PV, Turubanova S, Stolle F, Hansen MC (2014) Primary forest cover loss
in Indonesia over 2000–2012. Nat Clim Chang 4:730–735
Menuju Satu Peta (MSP), One Map Policy (2016) Peraturan Presiden Nomor 9 Tahun 2016
tentang Percepatan Pelaksanaan Kebijakan Satu Peta. Sekretariat Kabinet Republik Indonesia,
February 2016, Jakarta
Miettinen J, Shi C, Liew SC (2011) Deforestation rates in insular Southeast Asia between 2000 and
2010. Glob Chang Biol 17:2261–2270
Miettinen J, Hooijer A, Shi C, Tollenaar D, Vernimmen R, Liew SC, Malins C, Page SE (2012a)
Extent of industrial plantations on Southeast Asian peatlands in 2010 with analysis of historical
expansion and future projections. GCB Bioenergy 4:908–918
Ministry of Environment (2007) Climate variability and climate change, and their implications.
MOE Republic of Indonesia, Jakarta
Ministry of Environment (2009) Indonesian environmental status 2008. Jakarta
Ministry of Environment and Forestry (2015) http://sipongi.menlhk.go.id/home/karhutla_monitor
ing_system
Ministry of Forestry of Indonesia (2013) Statistics of forest planology 2012. Directorate general of
forest planology, ministry of forestry of Indonesia 2013
Ministry of Health (2008) National basic health research report 2007. Institute for Health Research
and Development, Jakarta
Ministry of Health (2015) Laporan Masalah Kesehatan akibat Kabut Asap Kebakaran Hutan dan
Lahan Tahun 2015
MoE &KPBB (2006) Indonesian fuel quality report 2006. Clean fuel: a requirement for air quality
improvement
PEACE (2007) Indonesia and climate change: current status and policies. PEACE, Jakarta
Pusarpedal KLHK (2015) http://pusarpedal.menlh.go.id/wp-content/uploads/2014/07/5.
Pemantauan-Kualitas-Udara-Ambien-dengan-Peralatan-AQMS.pdf
Reddington CL, Yoshioka M, Balasubramanian R, Ridley D, Toh YY, Arnold SR, Spracklen DV
(2014) Contribution of vegetation and peat fires to particulate air pollution in Southeast Asia.
Environ Res Lett 9:094006
Rowshand GR, Khoshakhlagh F, Negahban S et al (2009) Impact of air pollution on climate
fluctuations in Tehran city. Environ Sci 7:173–191
Safrudin A (2015) Low sulfur fuel, vehicle emission and fuel economy standard (presentation at
the Conclave of Champion Cities of Asia and Africa in Clean Air and Sustainable Mobility,
New Delhi, April 9–10, 2015), http://www.cseindia.org/userfiles/ahmad-safrudin-delhi-presen
tation.pdf
Samet J, Krewski D (2007) Health effects associated with exposure to ambient air pollution. J
Toxic Environ Health A 70:227–242
Sari AP, Maulidya M, Butarbutar RN, Sari RE, Rusmantoro W (2007) Executive summary:
Indonesia and climate change – working paper on current status and policies. The World
Bank, Washington, DC and Department for International Development (DFID), London, UK,
March. Available at: http://www.conflictrecovery.org/bin/PEACEClimateChange-ExecSum.
Simorangkir D (2007) Fire use: is it really the cheaper land preparation method for large-scale
plantation? Mitig Adapt Strateg Glob Chang 12(1):147–164
238 B. Haryanto
Suryanti Y (2006) Summary on awareness raising and capacity building to address vulnerability
and adaptation to climate change. Ministry of Environment, Republic of Indonesia, Jakarta
Tsai SS, Chiu HF, Liou SH, Yang CY (2014) Short-term effects of fin particulate air pollution on
hospital admissions for respiratory diseases: a case-crossover study in a tropical city. J Toxicol
Environ Health Part A 77:1091–1101
Tsangari H, Paschalidou AK, Kassomenos AP, Vardoulakis S, Heaviside C, Georgiou KE et al
(2016) Extreme weather and air pollution effects on cardiovascular and respiratory hospital
admissions in Cyprus. Sci Total Environ 542:247–253
World Bank (2009) Indonesia rising: mainstreaming climate change for sustainability. World
Bank Office Jakarta, Jakarta. available at: http://go.worldbank.org/JIGX6UTVJ0
World Bank (2010) Indonesia: climate Change. The World Bank, Washington, DC. online
resource; available at: http://go.worldbank.org/HQQFW5MV70
World Bank (2014) World development report 2014: risk and opportunity. At http://siteresources.
worldbank.org/resources
World Bank (2015) http://www.worldbank.org/en/news/feature/2015/12/01/indonesias-fire-and-
haze-crisis
World Health Organization (2002) World health report 2002: reducing risk, promoting healthy
life. WHO, Geneva
World Health Organization (2014) Burden of disease from ambient air pollution for 2012. http://
www.who.int/phe/health_topics/outdoorair/databases/AAP_BoD_results_March2014.pdf.
Last accessed February 2016
World Population Review (2002) A guide to world resources 2002–2004. At http://pdf.wri.org/
wr2002_execsumm
World Population Review (2005) The wealth of the poor: Managing ecosystems to fight poverty.
At http://www.wri.org
World Population Review (2016) at http://worldpopulationreview.com/countries/indonesia-
population/
Ying Z, Gong WS, Xia MY, Zheng SK, Fan CY, Xu L et al (2015) Association between ambient
air pollution and hospital emergency admissions for respiratory and cardiovascular diseases in
Beijing: a time series study. Biomed Environ Sci 28:352–363
Dr. Budi Haryanto is a Lecturer in the Department of Environmental Health and the Deputy
Director of Research Center for Climate Change at Universitas Indonesia, BOD of the PBC
Environment and Health and Co-chair of Environmental Health for APRU. He has published
numerous air pollution and climate change health impacts studies and is actively involved in
scientific climate talks at IPCC’s COP 15 Copenhagen, COP 21 Paris and COP 22 Marrakech.
14 Climate Change and Urban Air Pollution Health Impacts in Indonesia 239
Chapter 15
Climate Change and Air Pollution in Malaysia
Nasrin Aghamohammadi and Marzuki Isahak
Abstract Air pollution due to anthropological activities and natural disasters are
the major challenges for environmental issues for last few decades. Human
activities and population growth aggregate the atmospheric composition and
damaged Earth’s atmosphere. Southeast Asia (SEA) is facing with natural disas-
ters such as flood and tsunami that are challenging international attempts to
address these issues for climate change. Transboundary haze is one of the signif-
icant environmental issues in SEA since 1983. The transboundary haze pollution
has adverse impacts on environment due to greenhouse gases (GHGs) emissions
as well as ecosystem and biodiversity which caused climate changes in recent
decades.
Keywords Haze • Tropical country • Malaysia • Open burning • Health impact •
Forest fire
Introduction
Air pollution due to anthropological activities and natural disasters are the major
challenges for environmental issues for last few decades. Human activities and
population growth aggregate the atmospheric composition and damaged Earth’satmosphere. Southeast Asia (SEA) is facing with natural disasters such as flood and
tsunami that are challenging international attempts to address these issues for
climate change. Transboundary haze is one of the significant environmental issues
in SEA since 1983. The transboundary haze pollution has adverse impacts on
environment due to greenhouse gases (GHGs) emissions as well as ecosystem
and biodiversity which caused climate changes in recent decades.
Land use changes and land clearing using open burning in SEA caused the haze
with significant density level that considered as transboundary haze pollution. The
N. Aghamohammadi (*) • M. Isahak
Centre for Occupational and Environmental Health, Department of Social and Preventive
Medicine, Faculty of Medicine, University of Malaya, 50603 Kuala Lumpur, Malaysia
e-mail: [email protected]
© Springer International Publishing AG 2018
R. Akhtar, C. Palagiano (eds.), Climate Change and Air Pollution,Springer Climate, DOI 10.1007/978-3-319-61346-8_15
241
wind direction and the El Ni~no phenomenon caused drier condition which deteri-
orates transboundary haze pollution and prolonged duration of haze episode in
SEA. Urbanization, industrialization and population growth are the major factors
that trigger air pollution due to local emissions. Many studies during these decades
confirmed the different levels of air pollutant during the haze episode that triggered
transboundary pollution in Malaysia and neighbouring countries.
Air pollution due to transboundary haze pollution causes climatic changes which
have significant impact on human health and lifestyle as the pollution has adverse
health impact along with natural disaster.
Some of epidemiological data correlated between air pollution, morbidity and
premature mortality. The number of cases for morbidity and/or premature mortality
associated with air pollution was determined. Studies by Aouizerats et al. (2015)
and Behera et al. (2015) found that the visibility was reduced to 0.5 km during the
haze due to significant concentration of particulated matter with aerodynamic size
below 10 μm (PM10). This proved biomass burning which is the most contributor to
the haze episode reduces visibility as well as affects human health as the reduction
in visibility may cause accidents during the haze episode. Particulated matter can
penetrate into human respiratory system with aerodynamic size below 10 as they
may be trapped in upper respiratory system, while it will be more harmful when the
size reduces below 2.5 (PM2.5) due to deeper penetration in lower respiratory
system and reach into the bloodstream.
As the transboundary haze is the critical issue in Malaysian air quality during dry
season annually, therefore this chapter will discuss on haze pollution disaster which
has significant impact on climate change of Malaysia and may cause natural
disasters.
Haze Scenario in Malaysia
Malaysia has the first record of disturbing haze in 1983; the forest fires in Sumatra
caused haze in 1991 for the second time that occurred during the month of
September. The main cause of the problem was identified as forest fires in
Kalimantan and Southern Sumatra. Subsequently, haze polluted Malaysia in
1997 with the dry weather and stable atmospheric conditions coupled with
emissions from local pollution sources such as from motor vehicles, industries
and open burning of wastes also aggravated the situation (Keywood et al. 2003).
This haze episode was considered one of the worst situations due to co-occurrence
of El Ni~no, which prolonged the dry season in that year. In 2005, haze emergency
was declared in the month of August as the Air Pollution Index (API) announced
unhealthy, and few flights were suspended; few years after 2013, a short period of
haze with highest API in the month of June occurred due to transboundary
pollution where forest fires were happening in Sumatra. At this time many schools
closed due to haze emergency, and API exceeded to hazardous point. 2015 has the
longest duration of haze episode in Malaysia due to massive forest fires and
242 N. Aghamohammadi and M. Isahak
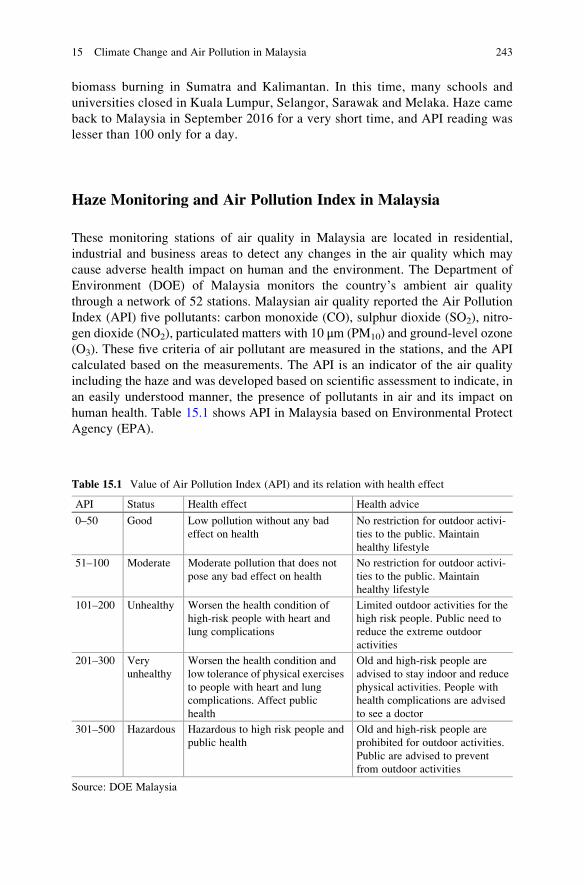
biomass burning in Sumatra and Kalimantan. In this time, many schools and
universities closed in Kuala Lumpur, Selangor, Sarawak and Melaka. Haze came
back to Malaysia in September 2016 for a very short time, and API reading was
lesser than 100 only for a day.
Haze Monitoring and Air Pollution Index in Malaysia
These monitoring stations of air quality in Malaysia are located in residential,
industrial and business areas to detect any changes in the air quality which may
cause adverse health impact on human and the environment. The Department of
Environment (DOE) of Malaysia monitors the country’s ambient air quality
through a network of 52 stations. Malaysian air quality reported the Air Pollution
Index (API) five pollutants: carbon monoxide (CO), sulphur dioxide (SO2), nitro-
gen dioxide (NO2), particulated matters with 10 μm (PM10) and ground-level ozone
(O3). These five criteria of air pollutant are measured in the stations, and the API
calculated based on the measurements. The API is an indicator of the air quality
including the haze and was developed based on scientific assessment to indicate, in
an easily understood manner, the presence of pollutants in air and its impact on
human health. Table 15.1 shows API in Malaysia based on Environmental Protect
Agency (EPA).
Table 15.1 Value of Air Pollution Index (API) and its relation with health effect
API Status Health effect Health advice
0–50 Good Low pollution without any bad
effect on health
No restriction for outdoor activi-
ties to the public. Maintain
healthy lifestyle
51–100 Moderate Moderate pollution that does not
pose any bad effect on health
No restriction for outdoor activi-
ties to the public. Maintain
healthy lifestyle
101–200 Unhealthy Worsen the health condition of
high-risk people with heart and
lung complications
Limited outdoor activities for the
high risk people. Public need to
reduce the extreme outdoor
activities
201–300 Very
unhealthy
Worsen the health condition and
low tolerance of physical exercises
to people with heart and lung
complications. Affect public
health
Old and high-risk people are
advised to stay indoor and reduce
physical activities. People with
health complications are advised
to see a doctor
301–500 Hazardous Hazardous to high risk people and
public health
Old and high-risk people are
prohibited for outdoor activities.
Public are advised to prevent
from outdoor activities
Source: DOE Malaysia
15 Climate Change and Air Pollution in Malaysia 243
Sources of Haze in Malaysia and Its Effect on ClimateChange
Fire is commonly used in Indonesia as well as in Southeast Asia to clear land and to
get rid of the agricultural waste, crops and debris for the establishment of planta-
tions as it is the cheapest and cost-effective method of clearance. Most of the time,
the fires flash out of control during the dry seasons, and the flames engulf vast areas.
The combustion is not completed due to lack of oxygen during the burning, and
acres of peatlands are covering in the region, thus causing thick smoke and
brownish haze to cover the region.
Wild land fires and wildfires have been a characteristic of Southeast Asia
ecology for centuries. It may happen by reducing the period of rainfalls especially
during dry season; the past fires were smaller in area and more spread out over time.
Forest fires and biomass burning in Borneo, Sabah, Sarawak and Sumatra have been
reported a number of times over the last century. The sources of fires in forest are by
human activities such as agricultural activities, ecotourism, camping in the forest
and making fires as well as lightening caused fires that have insignificant impact on
forest fires.
Forest clearing and peatland drainage associated with one of these projects, the
Mega Rice Project, contributed substantially to the emissions observed during the
1997 El Ni~no (Page et al. 2002; Field et al. 2009).
The argument of forest conversion by showing that the native forests of Borneo
have been impacted by selective logging, burning and land use conversion to
extraordinary scales since industrial-scale extractive industries began in the early
1970s supported by Gaveau et al. (2014a). This study estimated that the reduction
of Borneo’s forested area was about 737,188 km2 (30.2%) until 1973. Gaveau et al.
(2014b) assessed the pollution levels generated, estimated climatic conditions prior
to the fires and calculated the area burned prior vegetation cover and land owner-
ship preceding the fires in Sumatra using satellite imageries. This study shown that
84,717 ha which is 52% of the total burned area was within concessions, i.e. land
allocated to stakeholders and companies for plantation development. However,
60% of burned areas in concessions (50,248 ha or 31% of total burned area) were
also occupied by communities. This scenario made attribution of fires problematic.
The remaining 48% of the total burned land (79,012 ha) was owned by Indonesia’sMinistry of Forestry (under central government). Another source of the haze is slash
and burn of the remains of agricultural activities. There are three groups responsible
for the fires: traditional cultivators, small-scale investors and large-scale investors.
The traditional cultivators are the inactive farmers who burn their small plots of
land after harvest to rejuvenate the soil and to keep their land free of weeds (Wosten
et al. 2008). Others include the shifting cultivators who practice the slash-and-burn
technique to clear a stretch of the forest for cultivation. Slash and burn is a cheap
land clearing technique usually done for agricultural development especially in
Western Africa, South America and Southeast Asia (Nganje et al. 2001; Varma
2003). Slash and burn is also part of traditional livelihood where small farmer
244 N. Aghamohammadi and M. Isahak
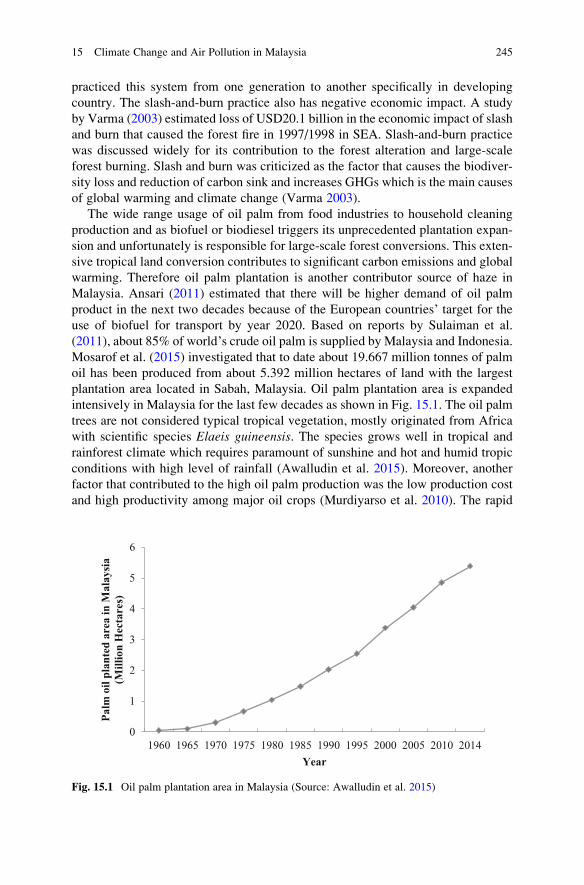
practiced this system from one generation to another specifically in developing
country. The slash-and-burn practice also has negative economic impact. A study
by Varma (2003) estimated loss of USD20.1 billion in the economic impact of slash
and burn that caused the forest fire in 1997/1998 in SEA. Slash-and-burn practice
was discussed widely for its contribution to the forest alteration and large-scale
forest burning. Slash and burn was criticized as the factor that causes the biodiver-
sity loss and reduction of carbon sink and increases GHGs which is the main causes
of global warming and climate change (Varma 2003).
The wide range usage of oil palm from food industries to household cleaning
production and as biofuel or biodiesel triggers its unprecedented plantation expan-
sion and unfortunately is responsible for large-scale forest conversions. This exten-
sive tropical land conversion contributes to significant carbon emissions and global
warming. Therefore oil palm plantation is another contributor source of haze in
Malaysia. Ansari (2011) estimated that there will be higher demand of oil palm
product in the next two decades because of the European countries’ target for theuse of biofuel for transport by year 2020. Based on reports by Sulaiman et al.
(2011), about 85% of world’s crude oil palm is supplied by Malaysia and Indonesia.
Mosarof et al. (2015) investigated that to date about 19.667 million tonnes of palm
oil has been produced from about 5.392 million hectares of land with the largest
plantation area located in Sabah, Malaysia. Oil palm plantation area is expanded
intensively in Malaysia for the last few decades as shown in Fig. 15.1. The oil palm
trees are not considered typical tropical vegetation, mostly originated from Africa
with scientific species Elaeis guineensis. The species grows well in tropical and
rainforest climate which requires paramount of sunshine and hot and humid tropic
conditions with high level of rainfall (Awalludin et al. 2015). Moreover, another
factor that contributed to the high oil palm production was the low production cost
and high productivity among major oil crops (Murdiyarso et al. 2010). The rapid
0
1
2
3
4
5
6
1960 1965 1970 1975 1980 1985 1990 1995 2000 2005 2010 2014
Palm
oil
plan
ted
area
in M
alay
sia
(Mill
ion
Hec
tare
s)
Year
Fig. 15.1 Oil palm plantation area in Malaysia (Source: Awalludin et al. 2015)
15 Climate Change and Air Pollution in Malaysia 245
expansion of oil palm plantation in Malaysia increases demand for large land areas
which include not only natural tropical forest but also peatland forest. Figure 15.1
shows the oil palm plantation area in Malaysia since 1960 till year 2014. The
plantation areas dramatically are increasing every 5 years.
The main threat to peatland is fires which are the main cause of haze pollution
during forest fires in Malaysia. The exploitation of peatland includes all activities
that change the pristine ecosystem of peatland such as logging, agriculture and
water drainage. The gas fluxes between peatland areas and atmosphere were also
affected by these destructive activities on peatland ecosystem (Miettinen and Liew
2010). According to Usup et al. (2000), fire that occurred in peatland area is due to
the organic matter either already decomposed or still continue to decompose which
are susceptible to fire. Dried peat is very susceptible to fire with the aid of dry
season that usually lasts from May to October (Jaenicke et al. 2010). Organic peat
soil combusted steadily and slowly without flame into the soil (Rein et al. 2008).
This stage of burning which is considered as incomplete combustion is usually
known as smouldering process. Smouldering can be described as slow, low tem-
perature, flameless form of combustion and the most persistent type of combustion
(Zaccone et al. 2014) which produce significant amount of CO2, CO and particulate
matter with harmful effect on human health. Peatland area is difficult to extinguish
where it can smoulder deep underground and burn again during the next dry period
(See et al. 2007; Blake et al. 2009). The fire in peat soil can persist for long period
and can have enough time to spread deep underground with high production of
particulate matter (Zaccone et al. 2014).
According to Keywood et al. (2003), the emission from combustion process such
as vehicle emission, industrial emission and biomass burning produced high
amount of particle that influences the formation of haze. Other air pollutant
emissions from motor vehicle and other burning processes are NOx, CO, SO2
aerosol which is the most important haze-producing species and carbon dioxide
(CO2). Atmospheric conversion of SO2 to SO42� produced sulphur in airborne
particulate matter (Hopke et al. 2008). The emission of SO2 came from motor
vehicle, fossil fuel and high sulphur fuel dependency for industrial production and
electric power generation (Abdullah et al. 2012).
Motor vehicle produced significant emission of air pollutant. As reported by
KeTTHA (2011), there are increasing numbers of vehicles where in year 2009,
more than one million units of new vehicle were registered, and there were
approximately 20 million registered vehicles on the road. Increasing number of
vehicle contributes to high amount of pollutant due to petrol combustion. Refer-
ring to Afroz et al. (2003), the major air pollution in Malaysia came from motor
vehicle that contributing to at least 70–75% of total air pollution. Motor vehicle
emissions consequently impacted the spatial and temporal distribution of ambient
concentration that also determined by meteorological factors (Kim and Guldmann
2011).
Other sources of air pollution that can contribute to haze problem are stationary
sources such as industrial emission and urbanization. According to Abdullah et al.
(2012), in year 1998–2008, the industrial and urban areas contributed high
246 N. Aghamohammadi and M. Isahak
concentration of PM10 which exceeded Malaysia Ambient Air Quality Guideline
permissible level. Moreover, the concentration of PM10 in urban area is usually
higher than rural area. Industrial areas in Malaysia are highly concentrated in
Selangor, Sarawak, Johor, Sabah, Perak and Pahang which also producing high
demand of fossil fuel and energy (Afroz et al. 2003). Heavy metals are one of the
elements in air pollutant that related to industrial emission. According to Lopez
et al. (2005), air pollutants with high concentration of lead, copper and nickel are
relatively related to industrial sources.
Open burning source is one of the main contributors for high air pollutant
concentration that enhance the haze episode. According to Lemieux et al. (2004),
any combustion of materials in ambient environment described the open burning
activity that include unintentional forest fires, burning of grain field for the prep-
aration of next growing season and also fireworks at public celebration. Referring to
Yu et al. (2012), open burning is the major source of global air pollutant that is
responsible for 40% of all emitted CO, 32% of emitted CO2, 20% of emitted aerosol
and 50% of emitted poly aroma hydrocarbons (PAHs). In Malaysia, the penalty
for open burning has been raised from RM100,000 to RM500,000 to show the
seriousness of this action towards environmental pollution (Afroz et al. 2003). A
study by Latif et al. (2011) found that a concentration of 31.8 μg/m3 for suspended
particulate with particle size <1.5 μm was closely related to open burning in
agricultural area in Sekincan, Selangor. The study by Amil N. (2016) showed that
PM2.5 mass averaged at 28� 18 μgm3, 2.8-fold higher than the World Health
Organization (WHO) annual guideline. The PM2.5 mass ranged between 6 and
118 μgm3 with the daily basis of WHO guideline exceeded 43%. High concentration
of particulate matter with small particle size during open burning can worsen the air
quality and cause severe haze pollution and higher carbon footprint which contributes
to climate change. Climatic change consequences are natural disasters such as flood
and tsunami. This phenomenon can contribute to adverse health impact due to
waterborne diseases, food-borne diseases, poverty, loss of shelters and communicable
diseases.
Impact of Haze on Human Health
Haze is not a new issue in Malaysia. Together with other countries in Southeast
Asia region, Malaysia had been affected several times by haze episode due to the
open forest burning in Indonesia. First haze episode was recorded in 1983 followed
by 1990, 1991 and 1994. The worst episode occurred in 1997 when the whole
country was covered with thick smoke haze from Kalimantan and Sumatra. During
this time, Malaysian government declared emergency in some of the states such as
Sarawak and Johor due to the hazardous Air Pollution Index (API) reading which
was greater than 300 (PM10 > 420 μg/m3) that leads to the closure of schools in the
affected area (Othman et al. 2014; Mohd Shahwahid H.O et al.2016). Since then,
several minor haze episodes were also recorded in 2005, 2006 and 2010. It was
15 Climate Change and Air Pollution in Malaysia 247
followed by severe episodes in 2013 with Muar of Johor, which recorded the
highest API reading of 641 (Mohd Shahwahid et al. 2016).
Majority of the health impact were associated with respiratory condition such as
asthma, acute bronchitis, allergic rhinitis and acute upper respiratory tract illness
(URTI). It was also associated with conjunctivitis and eczema which include
contact dermatitis (Emmanuel 2000). In addition, short-term exposures to haze
can also be associated with cardiac arrhythmias, worsening heart failure and
increased risk of developing acute myocardial infarction among high-risk patients
(Brook et al. 2004). During the severe haze episode in 1997, casualty visit in
Kuching and Kuala Lumpur showed 100% increases with majority of the cases
were due to asthma or acute respiratory infection. In Singapore, similar pattern was
also observed in that year with an increase of 30% outpatient cases due to haze-
related illness by Emmanuel (2000).
Apart from health effects, haze can also give significant economic impacts to the
affected country. The total economic impact due to haze can be in a form of cost of
illness from both patient’s and provider’s perspective. These include medical
treatment and hospitalization, medical-related leave taken due to the haze, cost of
buying personal protective equipment, cost due to reduced-activity days or loss of
productivity and foregone income opportunities (Mohd Shahwahid et al. 2016). A
study done in Malaysia by Jamal et al. found that ‘the average annual economic loss
due to the inpatient health impact of haze was valued at MYR273,000’ (Othman
et al. 2014). Another study done on the economic impact of haze episode in
Malaysia in 2013 stated that the total cost of illness due to haze was about
MYR410,587,779 (Mohd Shahwahid et al. 2016).
Climatic and environmental factors play an important role in the breeding and
dispersion of the Aedes mosquito, a primary vector of dengue fever. By monitoring
these factors, it is possible to predict the emergence of a dengue endemic and
subsequently reduce its spread. Study by Aghamohammadi et al. (2015) investi-
gated the correlation between the Air Pollution Index (API) and the reported
number of dengue cases in five districts of Malaysia. Data of the API and the
number of dengue cases from five districts in the state of Selangor in the years 2013
and 2014 were obtained from the Malaysian Department of Environment website
and the Malaysian Ministry of Health website, respectively. Average API readings
for each week were assigned to either good (<50), moderate (50–100) or unhealthy
(>100), and the total number of cases in each district that fell into either one of
these API categories was summed up. Cumulatively, in 2013 and 2014, 66.5% of
dengue cases were recorded when the API reading was within ‘good’ levels, while31.8% and 1.7% of cases were recorded while the API reading were within
‘moderate’ and ‘unhealthy’ levels, respectively. Spearman’s correlation, ρ, testand significance testing were carried out between the API categories and the
number of recorded dengue cases in the five districts. The results were
R ¼ �0.532 with a p-value (0.002) < α ¼ 0.01 (n ¼ 30). These results show that
there is a statistically significant negative correlation between the dengue cases and
the API value. In conclusion, the significant relationship between the API values
248 N. Aghamohammadi and M. Isahak
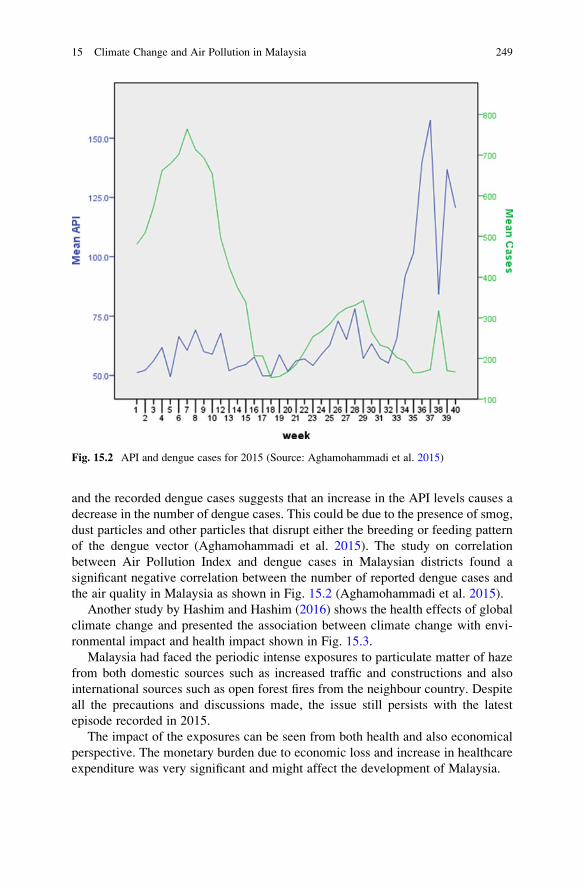
and the recorded dengue cases suggests that an increase in the API levels causes a
decrease in the number of dengue cases. This could be due to the presence of smog,
dust particles and other particles that disrupt either the breeding or feeding pattern
of the dengue vector (Aghamohammadi et al. 2015). The study on correlation
between Air Pollution Index and dengue cases in Malaysian districts found a
significant negative correlation between the number of reported dengue cases and
the air quality in Malaysia as shown in Fig. 15.2 (Aghamohammadi et al. 2015).
Another study by Hashim and Hashim (2016) shows the health effects of global
climate change and presented the association between climate change with envi-
ronmental impact and health impact shown in Fig. 15.3.
Malaysia had faced the periodic intense exposures to particulate matter of haze
from both domestic sources such as increased traffic and constructions and also
international sources such as open forest fires from the neighbour country. Despite
all the precautions and discussions made, the issue still persists with the latest
episode recorded in 2015.
The impact of the exposures can be seen from both health and also economical
perspective. The monetary burden due to economic loss and increase in healthcare
expenditure was very significant and might affect the development of Malaysia.
Fig. 15.2 API and dengue cases for 2015 (Source: Aghamohammadi et al. 2015)
15 Climate Change and Air Pollution in Malaysia 249
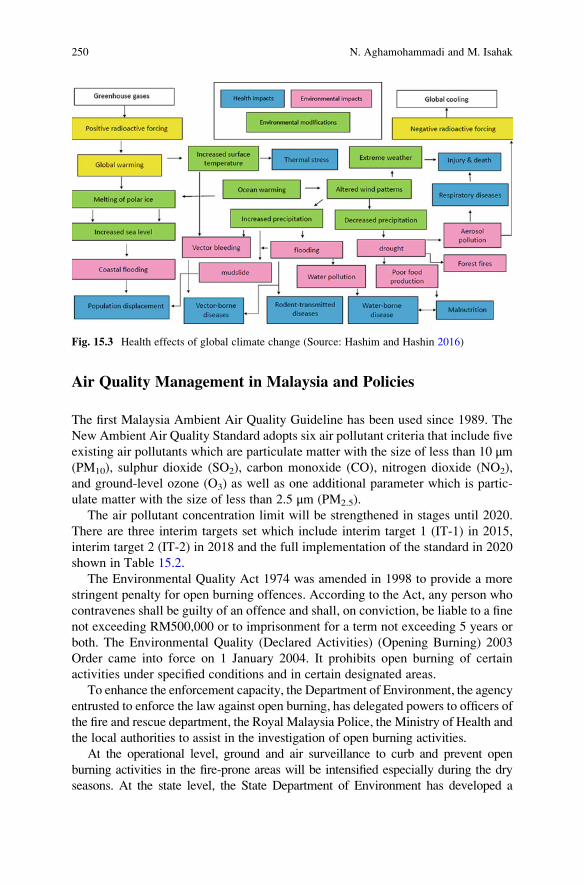
Air Quality Management in Malaysia and Policies
The first Malaysia Ambient Air Quality Guideline has been used since 1989. The
New Ambient Air Quality Standard adopts six air pollutant criteria that include five
existing air pollutants which are particulate matter with the size of less than 10 μm(PM10), sulphur dioxide (SO2), carbon monoxide (CO), nitrogen dioxide (NO2),
and ground-level ozone (O3) as well as one additional parameter which is partic-
ulate matter with the size of less than 2.5 μm (PM2.5).
The air pollutant concentration limit will be strengthened in stages until 2020.
There are three interim targets set which include interim target 1 (IT-1) in 2015,
interim target 2 (IT-2) in 2018 and the full implementation of the standard in 2020
shown in Table 15.2.
The Environmental Quality Act 1974 was amended in 1998 to provide a more
stringent penalty for open burning offences. According to the Act, any person who
contravenes shall be guilty of an offence and shall, on conviction, be liable to a fine
not exceeding RM500,000 or to imprisonment for a term not exceeding 5 years or
both. The Environmental Quality (Declared Activities) (Opening Burning) 2003
Order came into force on 1 January 2004. It prohibits open burning of certain
activities under specified conditions and in certain designated areas.
To enhance the enforcement capacity, the Department of Environment, the agency
entrusted to enforce the law against open burning, has delegated powers to officers of
the fire and rescue department, the Royal Malaysia Police, the Ministry of Health and
the local authorities to assist in the investigation of open burning activities.
At the operational level, ground and air surveillance to curb and prevent open
burning activities in the fire-prone areas will be intensified especially during the dry
seasons. At the state level, the State Department of Environment has developed a
Fig. 15.3 Health effects of global climate change (Source: Hashim and Hashin 2016)
250 N. Aghamohammadi and M. Isahak
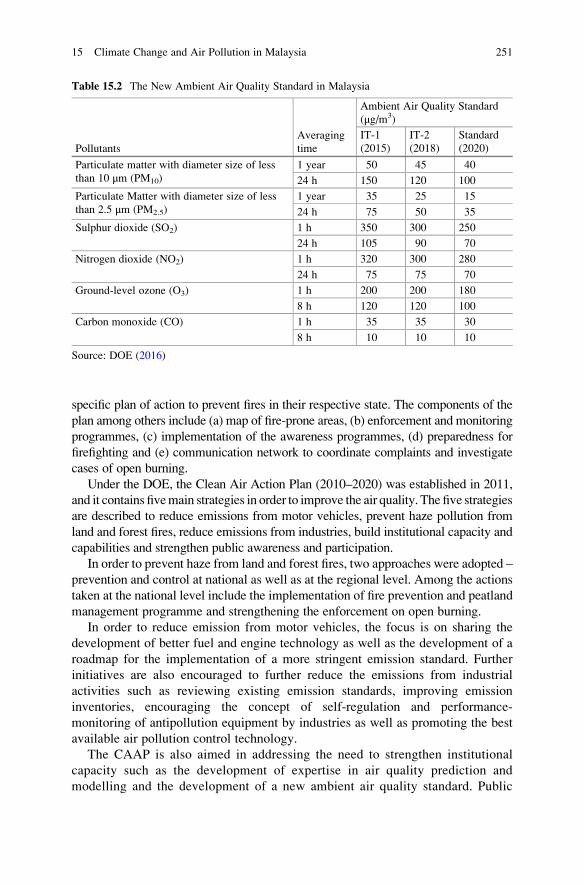
specific plan of action to prevent fires in their respective state. The components of the
plan among others include (a) map of fire-prone areas, (b) enforcement and monitoring
programmes, (c) implementation of the awareness programmes, (d) preparedness for
firefighting and (e) communication network to coordinate complaints and investigate
cases of open burning.
Under the DOE, the Clean Air Action Plan (2010–2020) was established in 2011,
and it contains fivemain strategies in order to improve the air quality. The five strategies
are described to reduce emissions from motor vehicles, prevent haze pollution from
land and forest fires, reduce emissions from industries, build institutional capacity and
capabilities and strengthen public awareness and participation.
In order to prevent haze from land and forest fires, two approaches were adopted –
prevention and control at national as well as at the regional level. Among the actions
taken at the national level include the implementation of fire prevention and peatland
management programme and strengthening the enforcement on open burning.
In order to reduce emission from motor vehicles, the focus is on sharing the
development of better fuel and engine technology as well as the development of a
roadmap for the implementation of a more stringent emission standard. Further
initiatives are also encouraged to further reduce the emissions from industrial
activities such as reviewing existing emission standards, improving emission
inventories, encouraging the concept of self-regulation and performance-
monitoring of antipollution equipment by industries as well as promoting the best
available air pollution control technology.
The CAAP is also aimed in addressing the need to strengthen institutional
capacity such as the development of expertise in air quality prediction and
modelling and the development of a new ambient air quality standard. Public
Table 15.2 The New Ambient Air Quality Standard in Malaysia
Pollutants
Averaging
time
Ambient Air Quality Standard
(μg/m3)
IT-1
(2015)
IT-2
(2018)
Standard
(2020)
Particulate matter with diameter size of less
than 10 μm (PM10)
1 year 50 45 40
24 h 150 120 100
Particulate Matter with diameter size of less
than 2.5 μm (PM2.5)
1 year 35 25 15
24 h 75 50 35
Sulphur dioxide (SO2) 1 h 350 300 250
24 h 105 90 70
Nitrogen dioxide (NO2) 1 h 320 300 280
24 h 75 75 70
Ground-level ozone (O3) 1 h 200 200 180
8 h 120 120 100
Carbon monoxide (CO) 1 h 35 35 30
8 h 10 10 10
Source: DOE (2016)
15 Climate Change and Air Pollution in Malaysia 251
awareness and public participation programmes are given a new push to attract
the interest of the students, environmental practitioners, corporate leaders and
decision-makers.
References
Abdullah AM, Samah MAA, Tham YJ (2012) An overview of the air pollution trend in Klang
Valley, Malaysia. Open Environ Sci 6:13–19
Afroz R, Hassan MN, Ibrahim NA (2003) Review of air pollution and health impacts in Malaysia.
Environ Res 92:71–77
Aghamohammadi N, Zaki R, Ragupathy K, Yahya A (2015) Correlation between air pollution
index and dengue cases in Malaysian Districts, 47th Asia-Pacific Academic Consortium for
Public Health, 21 Oct 2015 to 23 Oct 2015, University of Indonesia
Amil N, Latif MT, Khan MF, Mohamad M (2016) Seasonal variability of PM2:5 composition and
sources in the Klang Valley urban-industrial environment. Atmos Chem Phys 16:5357–5381
Ansari AH (2011) Peatlands and global warming: a study with special reference to South-East
Asian countries. Aust J Basic Appl Sci 5(7):596–605
Aouizerats B, Van Der Werf GR, Balasubramanian R, Betha R (2015) Importance of
transboundary transport of biomass burning emissions to regional air quality in Southeast
Asia during a high fire event. Atmos Chem Phys 15:363–373
Awalludin MF, Sulaiman O, Hashim R, Nadhari WNAW (2015) An overview of the oil palm
industry in Malaysia and its waste utilization through thermochemical conversion, specifically
via liquefaction. Renew Sust Energy Rev 50:1469–1484
Behera SN, Betha R, Huang X, Balasubramanian R (2015) Characterization and estimation of
human airway deposition of size-resolved particulate-bound trace elements during a recent
haze episode in Southeast Asia. Environ Sci Pollut Res 22:4265–4280
Blake D, Hinwood AL, Horwitz P (2009) Peat fires and air quality: volatile organic compounds
and particulates. Chemosphere 76:419–423
Brook RD, Franklin B, Cascio W, Hong Y, Howard G, Lipsett M, et al. (2004) AHA Sci Statement
6083(71)
DOE (1997) Malaysia environmental quality report. Department of Environment, Kuala Lumpur
DOE (2016) Air quality standards. http://www.doe.gov.my/portalv1/wp-content/uploads/2013/01/
Air-Quality-Standard-BI.pdf
Emmanuel SC (2000) Impact to lung health of haze from forest fires: the Singapore experience.
Respirology 5(2):175–182
Field RD, van der Werf GR, Shen SP (2009) Human amplification of drought-induced biomass
burning in Indonesia since 1960s. Nat Geosci 2:185–188
Gaveau DLA, Sloan S, Molidena E, Yaen H, Sheil D, Abram NK (2014a) Four decades of forest
persistence, clearance and logging on Borneo. PLoS One 9(7):e101654
Gaveau DLA, Salim MA, Hergoualc’h K, Locatelli B, Sloan S, Wooster M, Marlier ME,
Molidena E, Yaen H, DeFries R, Verchot L, Murdiyarso D, Nasi R, Holmgren P, Sheil D
(2014b) Major atmospheric emissions from peat fires in Southeast Asia during non-drought
years: evidence from the 2013 Sumatran fires. Sci Rep 4:1–7
Hashim JH, Hashim Z (2016) Climate change, extreme weather events, and human health
implications in the Asia Pacific Region Asia Pacific. J Public Health 28(2S):8S–14S
Hopke PK, Cohen DD, Begum BA, Biswas SK, Ni B, Pandit GG, Santoso M, Chung Y-S, Davy P,
Markwitz A, Waheed S, Siddique N, Santos FL, Pabroa PCB, Seneviratne MCS,
Wimolwattanapun W, Bunprapob S, Vuong TB, Hien PD, Markowicz A (2008) Urban air
quality in the Asian region. Sci Total Environ 404:103–112
Jaenicke J, Englhart S, Siegert F (2010) Monitoring the effect of restoration measures in Indonesian
peatlands by radar satellite imagery. J Environ Manag 92(3):630–638
252 N. Aghamohammadi and M. Isahak
KeTTHA (2011) Low carbon cities: framework and assessment system. Kementerian Tenaga,
Teknologi Hijau dan Air, Putrajaya
Keywood MD, Ayers GP, Gras JL, Boers JL, Leong CP (2003) Haze in the Klang Valley of
Malaysia. Atmos Chem Phys Discuss 3:615–653
Kim Y, Guldmann J-M (2011) Impact of traffic flows and wind directions on air pollution
concentrations in Seoul, Korea. Atmos Environ 45:2803–2810
Latif MT, Anuwar NY, Srithawirat T, Razak IS, Ramli NA (2011) Composition of Levoglucosan
and surfactants in atmospheric aerosols from biomass burning. Aerosol Air Qual Res 11
(7):837–845
Lemieux PM, Lutes CC, Santoianni DA (2004) Emissions of organic air toxics from open burning:
a comprehensive review. Prog Energy Combust 30:1–32
Lopez JM, Callen MS, Murillo R, Garcia T, Navarro MV, de la Cruz MT, Mastral AM (2005)
Levels of selected metals in ambient air PM10 in an urban site of Zaragoza (Spain). Environ
Res 99:58–67
Miettinen J, Liew SC (2010) Status of peatland degradation and development in Sumatra and
Kalimantan. Ambio 39:394–401
Mohd Shahwahid HO (2016) The economic value of the June 2013 Haze impacts on Peninsular
Malaysia. EEPSEA Research Report No. 2016-RR3. Economy and Environment Program for
Southeast Asia, Laguna
Mosarof MH, Kalam MA, Masjuki HH, Ashraful AM, Rashed MM, Imdadul HK, Monirul IM
(2015) Implementation of palm biodiesel based on economic aspects, performance, emission,
and wear characteristics. Energy Convers Manag 105:617–629
Murdiyarso D, Hergoualc’h K, Verchot LV (2010) Opportunities for reducing greenhouse gas
emissions in tropical peatlands. Proc Natl Acad Sci U S A 107(46):19655–19660
Nganje W, Schuck EC, Yantio D, Aquach E (2001) Farmer education and adoption of slash and
burn agriculture, Agribusiness & Applied Economic Miscellaneous Report No. 190. North
Dakota State University
Othman J, Sahani M, Mahmud M, Sheikh Ahmad MK (2014) Transboundary smoke haze
pollution in Malaysia: inpatient health impacts and economic valuation. Environ Pollut
Elsevier Ltd 189:194–201
Page SE, Siegert F, Rieley JO, Boehm H-DV, Jayak A, Limink S (2002) The amount of carbon
released from peat and forest fires in Indonesia during 1997. Nature 420:61–65
Rein G, Cleaver N, Ashton C, Pironi P (2008) The severity of smouldering peat fires and damages
to the forest soil. Catena 74(3):304–309
See SW, Balasubramanian R, Rianawati E, Karthikeyan S, Streets DG (2007) Characterization and
source apportionment of particulate matter 2.5 μm in Sumatra, Indonesia, during a recent peat
fire episode. Environ Sci Technol 41(10):3488–3494
Sulaiman F, Abdullah N, Gerhauser H, Shariff A (2011) An outlook of Malaysian energy, oil palm
industry and its utilization of wastes as useful resources. Biomass Bioenergy 35:3775–3786
Usup A, Takahashi H, Limin SH (2000) Aspect and mechanism of peat fire in tropical peat land: a
case study in Central Kalimantan 1997, Proceedings of the international symposium on tropical
peatlands, pp 79–88
Varma A (2003) The economics of slash and burn: a case study of the 1997–1998 Indonesian forest
fires. Ecol Econ 46:159–171
Wosten JHM, Clymans E, Page SE, Rieley JO, Limin SH (2008) Peat–water interrelationships in a
tropical peatland ecosystem in Southeast Asia. Catena 73:212–224
Yu T-Y, Lin C-Y, Chang L-FW (2012) Estimating air pollutant emission factors from open
burning of rice straw by the residual mass method. Atmos Environ 54:428–438
Zaccone C, Rein G, D’Orazio V, Hadden RM, Belcher CM, Miano TM (2014) Smouldering fire
signatures in peat and their implications for palaeoenvironmental reconstructions. Geochim
Cosmochim Acta 137:134–146
15 Climate Change and Air Pollution in Malaysia 253
Dr Nasrin Aghamohammadi (Env. Health Eng. BSc, Chem. Eng. PhD) is an Environmental
Health Engineer (PhD in Chemical Engineering, MSc in Civil Engineering, and BSc in Environ-
mental Health Engineering) and joined as a senior lecturer at the Department of Social and
Preventive Medicine, Faculty of Medicine, University of Malaya. Her core expertise is in
environmental engineering and Health. Her ongoing project is a grand challenge project focusing
on Urban Heat Island and thermal comfort for urban residents in Kuala Lumpur as world class city
by 2030.
Dr Marzuki Isahak (MBBS, MPH, DrPH) is a senior medical lecturer and public health
physician at the Department of Social and Preventive Medicine, Faculty of Medicine, University
of Malaya (UM). He is currently the head of Occupational Safety, Health and Environment Unit in
UM Medical Centre. He is also a council member in the Academy of Occupational and Environ-
mental Medicine, Malaysia.
254 N. Aghamohammadi and M. Isahak
Chapter 16
Climate Change, Air Pollution, and HumanHealth in Bangkok
Uma Langkulsen and Desire Rwodzi
Abstract Background While a number of studies have published the health
effects of climate change and air pollution, little has been studied in Thailand on
the health effects following interactions between air pollution and climate change.
Objectives The aim of the study was to explore the interplays between climate
change and air pollution and how these in turn impact on human health among
residents of Bangkok, Thailand.
Methods We conducted a descriptive study based on existing data on air pollution
from Thailand’s Pollution Control Department, data on number of vehicles from the
Transport Statistics Subdivision under Thailand’s Department of Land Transport,
data on rainfall and temperature from the Thai Meteorological Department, data on
health outcomes from Thailand Ministry of Public Health, and demographic data
from the Department of Provincial Administration.
Results As of 2016, the Pollution Control Department of Thailand had a total of
17 air pollution monitoring stations around Bangkok, including 6 roadside and
11 general area stations. While there has been a downward trend in PM10 concen-
trations from 1992 to 2015, PM2.5 concentrations have not only been above-
recommended standards but also going up. The number of registered vehicles in
Bangkok peaked at more than one million in 2013, but since then a declining trend
has been observed. In Bangkok, temperatures peaked around April, while rainfall
peaked during the month of September. Overall, both annual minimum and max-
imum temperatures have been going up since 1951. The average amount of rainfall
received monthly had two peaks, first in May and later in September. From 1951 to
2015, the mean annual rainfall in Thailand went below 1400 mm only in 1977,
1979, and 1992. Mortality rates due to diseases of the circulatory and respiratory
system have also been going up since 2010, with mortality rates per 100,000
population higher among males than females. While the number of outpatients
U. Langkulsen (*)
Faculty of Public Health, Thammasat University, Pathumthani 12121, Thailand
e-mail: [email protected]
D. Rwodzi
Strategic Information Hub, UNAIDS Eastern and Southern Africa Region, Johannesburg,
South Africa
e-mail: [email protected]
© Springer International Publishing AG 2018
R. Akhtar, C. Palagiano (eds.), Climate Change and Air Pollution,Springer Climate, DOI 10.1007/978-3-319-61346-8_16
255
due to diseases of the circulatory system continues to increase, outpatients due to
respiratory diseases peaked around 2010, and since then a downward trend has been
observed.
Conclusion Results suggest possible correlations between air pollution-climate
change interactions and mortality due to diseases of the respiratory and circulatory
systems.
Keywords Climate change • Air pollution • Temperature • Human health •
Bangkok
Introduction
A growing body of evidence suggests that the global climate is changing rapidly,
and the planet has warmed substantially as a result of increased greenhouse gas
emissions largely from human activities (D’Amato et al. 2015; Franchini and
Mannucci 2015). Consequently, climate change is attributed to a global rise and
variability in ambient temperature, increased air pollution, an increased frequency
of heat waves, of adverse weather events such as floods and drought periods, as well
as an uneven distribution of allergens and vector-borne infectious diseases
(D’Amato et al. 2015; Franchini and Mannucci 2015). Changes in climatic condi-
tions as well as air quality have measurable impact on human health (Mirsaeidi
et al. 2016), in part by altering the epidemiology of climate-sensitive pathogens.
Climate change may modify the incidence and severity of respiratory infections by
affecting vectors, and host immune responses to, for example, infections, such as
avian influenza, are being experienced in areas previously unaffected, apparently
because of global warming (Mirsaeidi et al. 2016).
Variability in ambient temperature is reported to have had its toll on human
health in different parts of the world. In Brisbane, both hot and cold temperatures
were associated with increases in emergency department admissions for childhood
asthma, and their effects both appeared to be acute (Xu et al. 2013). A recent study
in China showed that a 1 �C increase in diurnal temperature range corresponded to
an increase in total non-accidental mortality, cardiovascular mortality, and respi-
ratory mortality during the cool seasons (Zhou et al. 2014).
Interrelationships between air pollution and climate change are complex, and in
a reciprocal interplay, various air pollutants contribute to global warming, while
global warming in turn leads to the formation of various pollutant compounds
(Schulte et al. 2016). A recent study evaluating associations between air pollutants
and meteorological factors reported strong correlations between and among gas
pollutants due to their photochemical activity, as well as positive correlation
between air temperature and pollutants (Lagidze et al. 2015). D’Amato et al.
(2015) posited that an individual’s response following air pollution exposure
depends on the source and components of air pollution, as well as the underlying
meteorological conditions. Indeed, it has been observed that some air pollution-
256 U. Langkulsen and D. Rwodzi
related outcomes such as asthma do not depend only on increased air pollution
levels but also on atmospheric conditions favoring the accumulation of air pollut-
ants at ground level (D’Amato et al. 2013).
Due to climate change, air pollution patterns are changing in several urbanized
areas of the world, with a significant effect on respiratory health and consequences
ranging from decreases in lung function to allergic diseases, new onset of diseases,
and exacerbation of chronic respiratory diseases (D’Amato et al. 2013). Associa-
tions between short-term exposure to air pollutants and mortality have been
reported in several studies (Guo et al. 2014; Shang et al. 2013; Tsai et al. 2014).
Long-term exposures to pollutants have also been linked to mortality (Chen et al.
2012, 2013; Deguen et al. 2015). However, a growing body of evidence suggests
that long-term exposures have greater effects than short-term variation of pollut-
ants’ concentrations (Beverland et al. 2012; Deguen et al. 2015).
The objective of this study is to use existing data from Thailand’s Pollution
Control Department and Ministry of Public Health to explore the scenario in
Bangkok in terms of the interplays between climate change and air pollution and
how these in turn impact on human health.
Methods
This study is based on existing data on air pollution, rainfall and temperature, and
health outcomes from relevant ministries and agencies. We obtained data on air
pollution from the Pollution Control Department of Thailand. This included latest
data on the number and distribution of monitoring stations in Bangkok, annual
average PM10 concentrations from 1992 through 2015, and PM2.5 concentrations
from 2011 to 2015. Additional data on the number of registered vehicles from 2006
to 2015 was sourced from the Transport Statistics Subdivision under Thailand’sDepartment of Land Transport.
We sourced data on average temperature and rainfall in Bangkok from the Thai
Meteorological Department. Data on health outcomes, including morbidity, mor-
tality, and low birth weight, was obtained from Thailand’s Ministry of Public
Health. Additional data on the demographics of Bangkok was obtained from the
Department of Provincial Administration.
Demographics of Bangkok
The Department of Provincial Administration reported that as of December 2015,
Bangkok had a total population of 5,696,409. This comprised 5,605,672 (98%) Thai
nationals and 90,737 (2%) non-Thai nationals.
16 Climate Change, Air Pollution, and Human Health in Bangkok 257
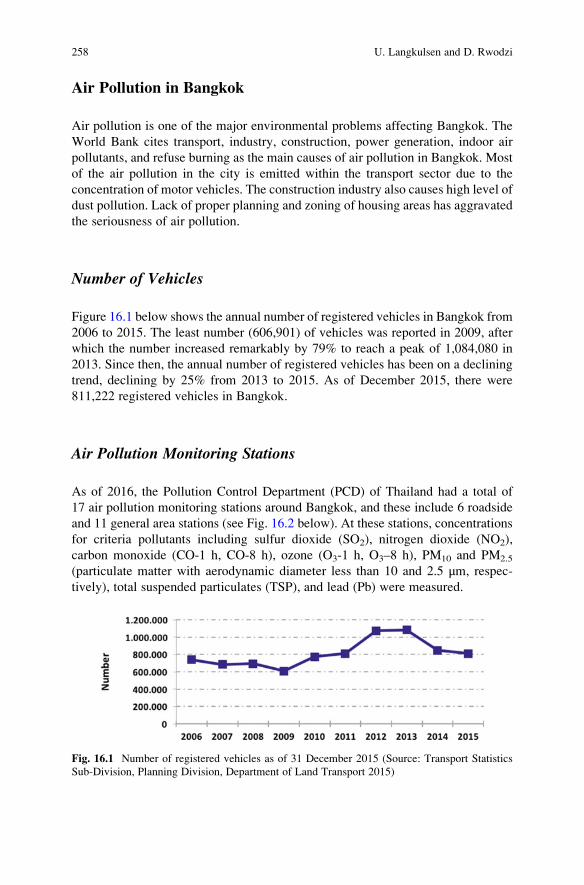
Air Pollution in Bangkok
Air pollution is one of the major environmental problems affecting Bangkok. The
World Bank cites transport, industry, construction, power generation, indoor air
pollutants, and refuse burning as the main causes of air pollution in Bangkok. Most
of the air pollution in the city is emitted within the transport sector due to the
concentration of motor vehicles. The construction industry also causes high level of
dust pollution. Lack of proper planning and zoning of housing areas has aggravated
the seriousness of air pollution.
Number of Vehicles
Figure 16.1 below shows the annual number of registered vehicles in Bangkok from
2006 to 2015. The least number (606,901) of vehicles was reported in 2009, after
which the number increased remarkably by 79% to reach a peak of 1,084,080 in
2013. Since then, the annual number of registered vehicles has been on a declining
trend, declining by 25% from 2013 to 2015. As of December 2015, there were
811,222 registered vehicles in Bangkok.
Air Pollution Monitoring Stations
As of 2016, the Pollution Control Department (PCD) of Thailand had a total of
17 air pollution monitoring stations around Bangkok, and these include 6 roadside
and 11 general area stations (see Fig. 16.2 below). At these stations, concentrations
for criteria pollutants including sulfur dioxide (SO2), nitrogen dioxide (NO2),
carbon monoxide (CO-1 h, CO-8 h), ozone (O3-1 h, O3–8 h), PM10 and PM2.5
(particulate matter with aerodynamic diameter less than 10 and 2.5 μm, respec-
tively), total suspended particulates (TSP), and lead (Pb) were measured.
Fig. 16.1 Number of registered vehicles as of 31 December 2015 (Source: Transport Statistics
Sub-Division, Planning Division, Department of Land Transport 2015)
258 U. Langkulsen and D. Rwodzi
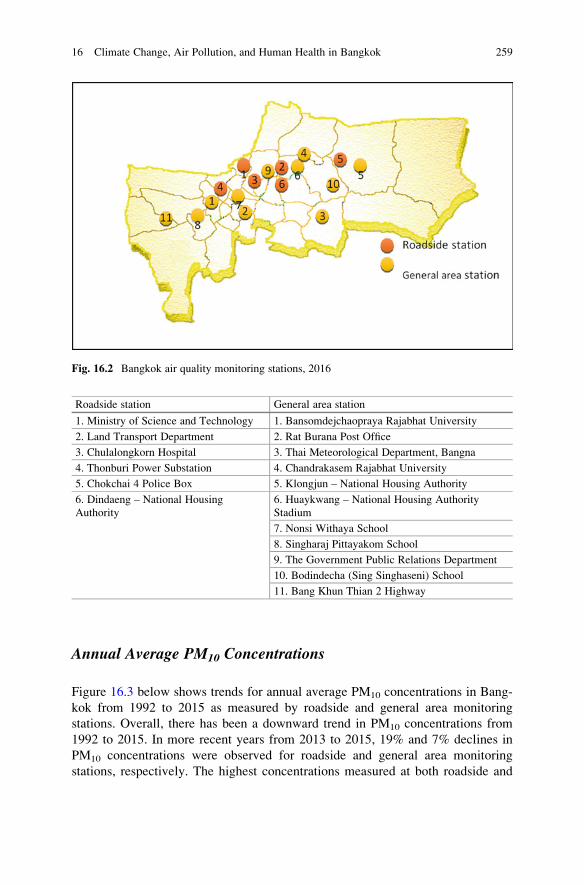
Roadside station General area station
1. Ministry of Science and Technology 1. Bansomdejchaopraya Rajabhat University
2. Land Transport Department 2. Rat Burana Post Office
3. Chulalongkorn Hospital 3. Thai Meteorological Department, Bangna
4. Thonburi Power Substation 4. Chandrakasem Rajabhat University
5. Chokchai 4 Police Box 5. Klongjun – National Housing Authority
6. Dindaeng – National Housing
Authority
6. Huaykwang – National Housing Authority
Stadium
7. Nonsi Withaya School
8. Singharaj Pittayakom School
9. The Government Public Relations Department
10. Bodindecha (Sing Singhaseni) School
11. Bang Khun Thian 2 Highway
Annual Average PM10 Concentrations
Figure 16.3 below shows trends for annual average PM10 concentrations in Bang-
kok from 1992 to 2015 as measured by roadside and general area monitoring
stations. Overall, there has been a downward trend in PM10 concentrations from
1992 to 2015. In more recent years from 2013 to 2015, 19% and 7% declines in
PM10 concentrations were observed for roadside and general area monitoring
stations, respectively. The highest concentrations measured at both roadside and
Fig. 16.2 Bangkok air quality monitoring stations, 2016
16 Climate Change, Air Pollution, and Human Health in Bangkok 259
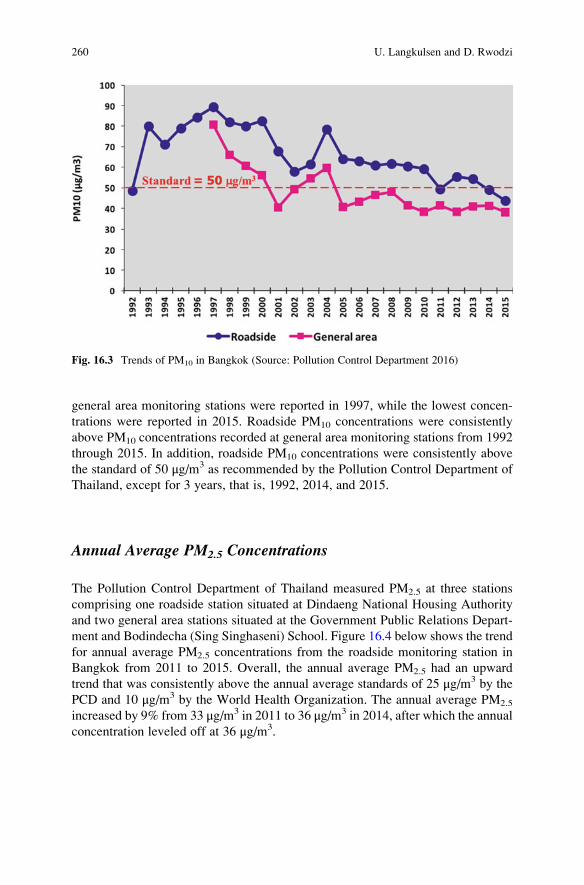
general area monitoring stations were reported in 1997, while the lowest concen-
trations were reported in 2015. Roadside PM10 concentrations were consistently
above PM10 concentrations recorded at general area monitoring stations from 1992
through 2015. In addition, roadside PM10 concentrations were consistently above
the standard of 50 μg/m3 as recommended by the Pollution Control Department of
Thailand, except for 3 years, that is, 1992, 2014, and 2015.
Annual Average PM2.5 Concentrations
The Pollution Control Department of Thailand measured PM2.5 at three stations
comprising one roadside station situated at Dindaeng National Housing Authority
and two general area stations situated at the Government Public Relations Depart-
ment and Bodindecha (Sing Singhaseni) School. Figure 16.4 below shows the trend
for annual average PM2.5 concentrations from the roadside monitoring station in
Bangkok from 2011 to 2015. Overall, the annual average PM2.5 had an upward
trend that was consistently above the annual average standards of 25 μg/m3 by the
PCD and 10 μg/m3 by the World Health Organization. The annual average PM2.5
increased by 9% from 33 μg/m3 in 2011 to 36 μg/m3 in 2014, after which the annual
concentration leveled off at 36 μg/m3.
Fig. 16.3 Trends of PM10 in Bangkok (Source: Pollution Control Department 2016)
260 U. Langkulsen and D. Rwodzi
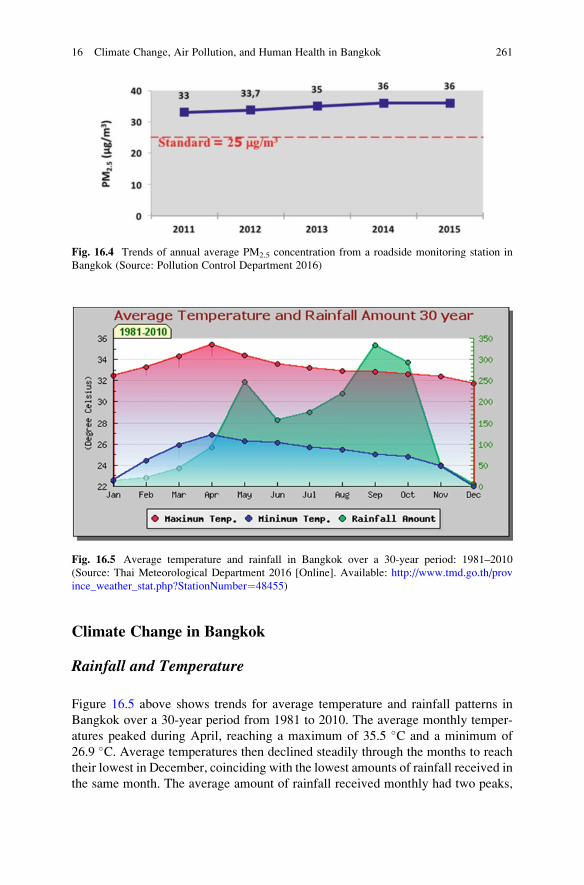
Climate Change in Bangkok
Rainfall and Temperature
Figure 16.5 above shows trends for average temperature and rainfall patterns in
Bangkok over a 30-year period from 1981 to 2010. The average monthly temper-
atures peaked during April, reaching a maximum of 35.5 �C and a minimum of
26.9 �C. Average temperatures then declined steadily through the months to reach
their lowest in December, coinciding with the lowest amounts of rainfall received in
the same month. The average amount of rainfall received monthly had two peaks,
Fig. 16.4 Trends of annual average PM2.5 concentration from a roadside monitoring station in
Bangkok (Source: Pollution Control Department 2016)
Fig. 16.5 Average temperature and rainfall in Bangkok over a 30-year period: 1981–2010
(Source: Thai Meteorological Department 2016 [Online]. Available: http://www.tmd.go.th/prov
ince_weather_stat.php?StationNumber¼48455)
16 Climate Change, Air Pollution, and Human Health in Bangkok 261
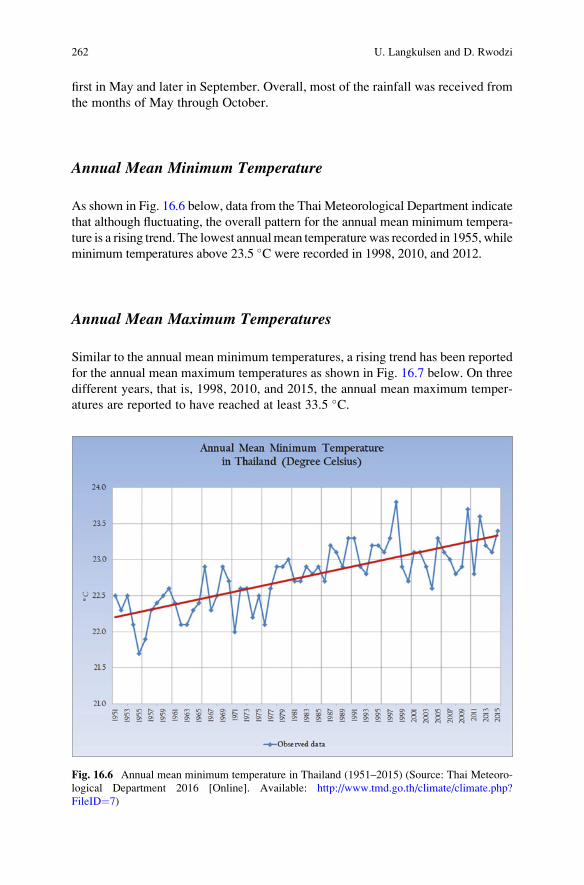
first in May and later in September. Overall, most of the rainfall was received from
the months of May through October.
Annual Mean Minimum Temperature
As shown in Fig. 16.6 below, data from the Thai Meteorological Department indicate
that although fluctuating, the overall pattern for the annual mean minimum tempera-
ture is a rising trend. The lowest annualmean temperature was recorded in 1955, while
minimum temperatures above 23.5 �C were recorded in 1998, 2010, and 2012.
Annual Mean Maximum Temperatures
Similar to the annual mean minimum temperatures, a rising trend has been reported
for the annual mean maximum temperatures as shown in Fig. 16.7 below. On three
different years, that is, 1998, 2010, and 2015, the annual mean maximum temper-
atures are reported to have reached at least 33.5 �C.
Fig. 16.6 Annual mean minimum temperature in Thailand (1951–2015) (Source: Thai Meteoro-
logical Department 2016 [Online]. Available: http://www.tmd.go.th/climate/climate.php?
FileID¼7)
262 U. Langkulsen and D. Rwodzi
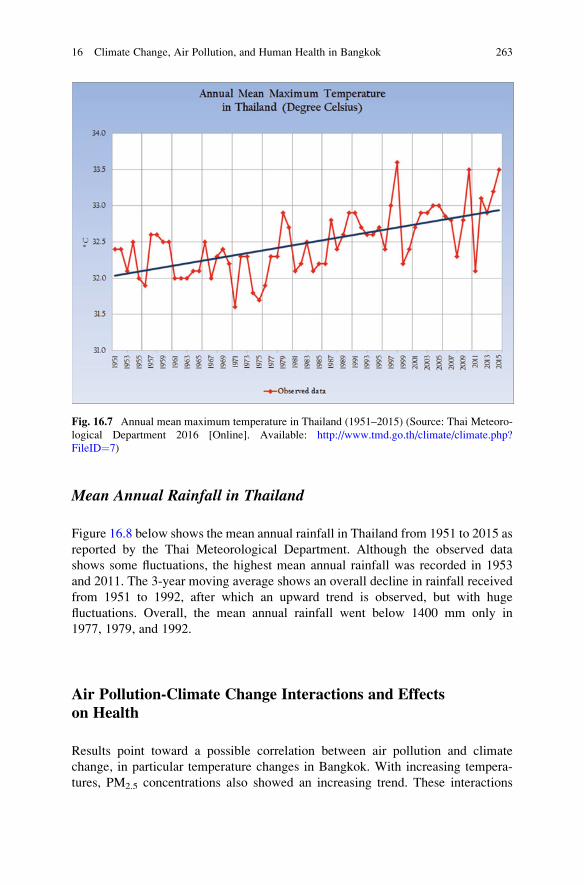
Mean Annual Rainfall in Thailand
Figure 16.8 below shows the mean annual rainfall in Thailand from 1951 to 2015 as
reported by the Thai Meteorological Department. Although the observed data
shows some fluctuations, the highest mean annual rainfall was recorded in 1953
and 2011. The 3-year moving average shows an overall decline in rainfall received
from 1951 to 1992, after which an upward trend is observed, but with huge
fluctuations. Overall, the mean annual rainfall went below 1400 mm only in
1977, 1979, and 1992.
Air Pollution-Climate Change Interactions and Effectson Health
Results point toward a possible correlation between air pollution and climate
change, in particular temperature changes in Bangkok. With increasing tempera-
tures, PM2.5 concentrations also showed an increasing trend. These interactions
Fig. 16.7 Annual mean maximum temperature in Thailand (1951–2015) (Source: Thai Meteoro-
logical Department 2016 [Online]. Available: http://www.tmd.go.th/climate/climate.php?
FileID¼7)
16 Climate Change, Air Pollution, and Human Health in Bangkok 263
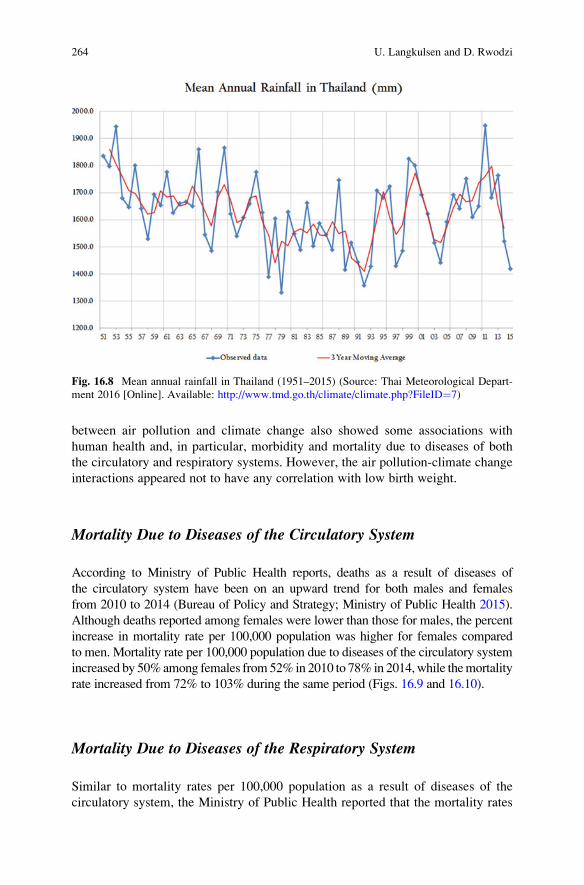
between air pollution and climate change also showed some associations with
human health and, in particular, morbidity and mortality due to diseases of both
the circulatory and respiratory systems. However, the air pollution-climate change
interactions appeared not to have any correlation with low birth weight.
Mortality Due to Diseases of the Circulatory System
According to Ministry of Public Health reports, deaths as a result of diseases of
the circulatory system have been on an upward trend for both males and females
from 2010 to 2014 (Bureau of Policy and Strategy; Ministry of Public Health 2015).
Although deaths reported among females were lower than those for males, the percent
increase in mortality rate per 100,000 population was higher for females compared
to men. Mortality rate per 100,000 population due to diseases of the circulatory system
increased by 50%among females from52% in 2010 to 78% in 2014,while themortality
rate increased from 72% to 103% during the same period (Figs. 16.9 and 16.10).
Mortality Due to Diseases of the Respiratory System
Similar to mortality rates per 100,000 population as a result of diseases of the
circulatory system, the Ministry of Public Health reported that the mortality rates
Fig. 16.8 Mean annual rainfall in Thailand (1951–2015) (Source: Thai Meteorological Depart-
ment 2016 [Online]. Available: http://www.tmd.go.th/climate/climate.php?FileID¼7)
264 U. Langkulsen and D. Rwodzi
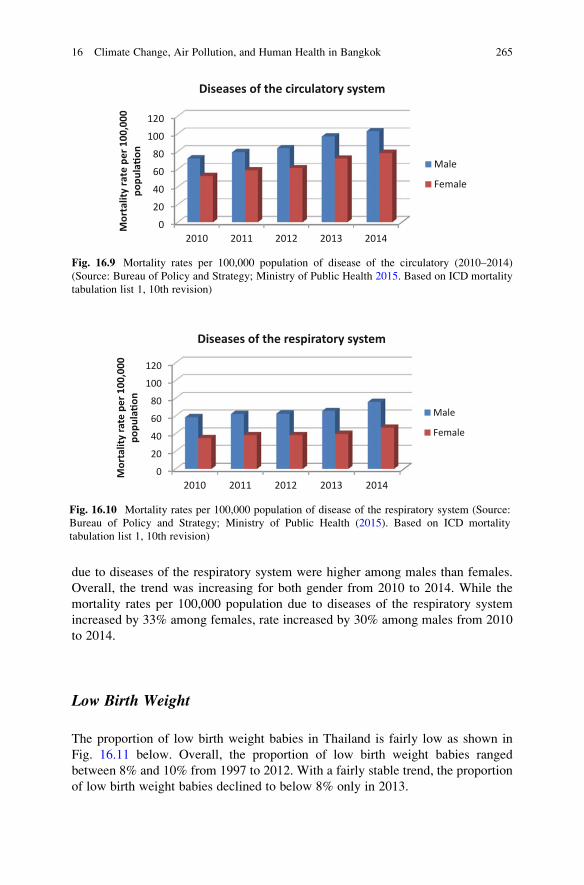
due to diseases of the respiratory system were higher among males than females.
Overall, the trend was increasing for both gender from 2010 to 2014. While the
mortality rates per 100,000 population due to diseases of the respiratory system
increased by 33% among females, rate increased by 30% among males from 2010
to 2014.
Low Birth Weight
The proportion of low birth weight babies in Thailand is fairly low as shown in
Fig. 16.11 below. Overall, the proportion of low birth weight babies ranged
between 8% and 10% from 1997 to 2012. With a fairly stable trend, the proportion
of low birth weight babies declined to below 8% only in 2013.
0
20
40
60
80
100
120
2010 2011 2012 2013 2014
Mor
talit
y ra
te p
er 1
00,0
00
popu
la�o
n
Diseases of the circulatory system
Male
Female
Fig. 16.9 Mortality rates per 100,000 population of disease of the circulatory (2010–2014)
(Source: Bureau of Policy and Strategy; Ministry of Public Health 2015. Based on ICD mortality
tabulation list 1, 10th revision)
0
20
40
60
80
100
120
2010 2011 2012 2013 2014
Mor
talit
y ra
te p
er 1
00,0
00po
pula
�on
Diseases of the respiratory system
Male
Female
Fig. 16.10 Mortality rates per 100,000 population of disease of the respiratory system (Source:
Bureau of Policy and Strategy; Ministry of Public Health (2015). Based on ICD mortality
tabulation list 1, 10th revision)
16 Climate Change, Air Pollution, and Human Health in Bangkok 265
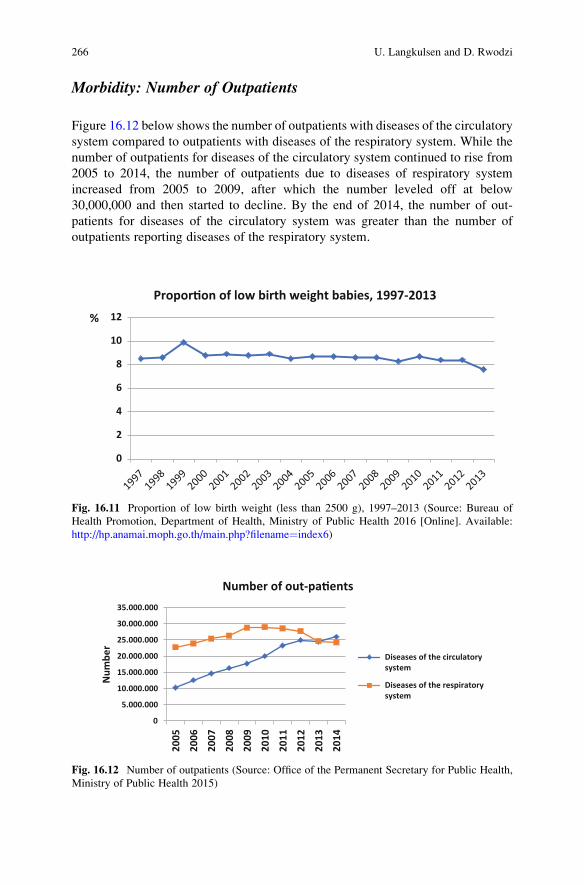
Morbidity: Number of Outpatients
Figure 16.12 below shows the number of outpatients with diseases of the circulatory
system compared to outpatients with diseases of the respiratory system. While the
number of outpatients for diseases of the circulatory system continued to rise from
2005 to 2014, the number of outpatients due to diseases of respiratory system
increased from 2005 to 2009, after which the number leveled off at below
30,000,000 and then started to decline. By the end of 2014, the number of out-
patients for diseases of the circulatory system was greater than the number of
outpatients reporting diseases of the respiratory system.
0
2
4
6
8
10
12%
Propor�on of low birth weight babies, 1997-2013
Fig. 16.11 Proportion of low birth weight (less than 2500 g), 1997–2013 (Source: Bureau of
Health Promotion, Department of Health, Ministry of Public Health 2016 [Online]. Available:
http://hp.anamai.moph.go.th/main.php?filename¼index6)
0
5.000.000
10.000.000
15.000.000
20.000.000
25.000.000
30.000.000
35.000.000
2005
2006
2007
2008
2009
2010
2011
2012
2013
2014
Num
ber
Number of out-pa�ents
Diseases of the circulatorysystem
Diseases of the respiratorysystem
Fig. 16.12 Number of outpatients (Source: Office of the Permanent Secretary for Public Health,
Ministry of Public Health 2015)
266 U. Langkulsen and D. Rwodzi
Government Response
Air Pollution Mitigation
Over the last two decades, remarkable contributions have been made by the Royal
of Thai government, the Pollution Control Department (PCD), other government
organizations, as well as private agencies in an attempt to resolve the air pollution
challenges and preserve the environments. The main role of the local government in
air quality management is in the enforcement of existing policies through inspec-
tion and public awareness raising. Bangkok Metropolitan Administration (BMA)
declared 1999 as the Air Pollution Mitigation Year and implemented the following
13 measures:
– Providing free car engine tune-up service stations for the public.
– Publishing car engine maintenance manuals for public distribution.
– Setting up black-smoke inspection points in 50 districts jointly with the traffic
police.
– Setting up six mobile black-smoke inspection units in six areas.
– Setting up motorcycle white-smoke and noise-level inspection units in the inner
area of Bangkok.
– Reporting about air pollution in critical areas in cooperation with PCD through
the display boards and air quality reports to promote pollution-free streets.
– Designating pollution-free streets, which prohibited single-occupant vehicles.
Originally, there were three streets, later increased to eight streets.
– Paving road shoulders to reduce dust.
– Enforcing windscreens for buildings which were under construction.
– Enforcing dust controls for trucks by covering loads and cleaning wheels.
– Putting up campaign boards to inform the public on various measures being
implemented.
– Designating car-free streets to reduce air pollution.
– Improving fuel quality by joint efforts to reduce air pollution.
Improvements in Air Quality
Bangkok’s air quality has improved enormously in comparison with previous
decades largely due to the city having far fewer buses, trucks, and motorcycles
emitting smoke. In addition, remarkable improvements have been reported regard-
ing Bangkok’s air quality management capabilities in recent years. With stringent
laws and policies on the use of unleaded fuel, as well as new vehicle emission
standards, ambient lead concentrations as well as roadside concentrations of CO,
NOx, and SO2 have been greatly reduced and put under control. The Thai govern-
ment is pursuing the stringent emission standards of Europe. As such, emission
16 Climate Change, Air Pollution, and Human Health in Bangkok 267
controls have been progressive; however, the levels of TSP, PM, and O3 have
increased in recent years. Bangkok is still to attain a relatively “clean” urban air
status; however, the integrated approach and strategies for national and local air
quality management promise positive results in further improving the air quality in
Bangkok.
According to projections made from the Bangkok Air Quality Management
Project, it is estimated that a 10 μg/m3 decline in the annual average of PM10
concentrations in Bangkok would result in the following reductions:
– 700–2000 premature deaths
– 3000–9300 new cases of chronic respiratory diseases
– 560–1570 respiratory and cardiovascular hospital admissions
– 2,900,000–9,100,000 days with respiratory symptoms severe enough to restrict a
person’s normal activities
– 2,200,000–74,000,000 days with minor respiratory symptoms
Discussion and Conclusions
This study investigated the correlations between climate change and air pollution
and how these in turn impact on human health among residents of Bangkok,
Thailand. Overall, results suggest possible correlations between increases in tem-
perature and increases in PM2.5 concentrations, which appeared to be correlated
with increases in mortality due to diseases of the respiratory and circulatory
systems.
We observed increasing trends in mortality due to cardiovascular and respiratory
illnesses, and this was correlated to increases in annual temperatures as well as
increases in PM2.5 concentrations. Confirming our findings, a recent study in
Thailand highlighted that increases in concentrations of major air pollutants had
significant short-term impacts on non-accidental mortality, with O3 significantly
associated with cardiovascular mortality, while PM10 was significantly related to
respiratory mortality (Guo et al. 2014). High temperatures on the other hand
increased the associations of PM with daily mortality in eight Chinese cities
(Meng et al. 2012). Such findings do have implications on health effects of both
air pollution exposure and climate change.
A number of studies have demonstrated that mortality risks following air
pollution exposure to differ by weather type or season (Guo et al. 2014; Vanos
et al. 2015). Guo et al. (2014) showed that the effects of all air pollutants on all
mortality types were stronger during summer and winter seasons compared to the
rainy season. This study, however, did not investigate the seasonality issue, the
reason being that the available data on health effects was not disaggregated
according to seasons.
Based on previous epidemiological investigations, associations between air
pollution and mortality differ by individual characteristics (Li et al. 2016),
268 U. Langkulsen and D. Rwodzi
neighborhood characteristics (Deguen et al. 2015), and underlying health condi-
tions (Vichit-Vadakan et al. 2010). In Thailand, the associations between mortality
due to all natural causes and PM10 exposure increased with age, with the strongest
effects reported among people aged 75 years and older (Vichit-Vadakan et al.
2010). Li et al. (2016) also reported stronger air pollution effects on COPD
mortality among the elderly and males. Plausible explanations suggested for gender
differences in air pollution effects include confounding effects of smoking and
job-related chemical exposures associated with the male gender (Li et al. 2016).
Among the most susceptible groups are infants with respiratory illnesses, children
less than 5 years of age with lower respiratory infections (LRIs), and people with
asthma (Vichit-Vadakan et al. 2010). A recent study observed pollution-induced
cardiovascular disease mortality risk both for those with and without existing cardio
metabolic disorders (Pope et al. 2015). Our study, however, did not disaggregate the
mortality data by characteristics related to individuals, neighborhood, or underlying
health conditions.
Short-term exposure to air pollution at very high concentrations, as well as long-
term exposure to relatively low concentrations of pollutants PM, ozone, and NO2,
has been linked with adverse health outcomes in previous investigations. Prolonged
exposure to PM has probably a greater impact on public health in comparison with
short-term exposure to peak concentrations. It has been documented in previous
investigations that subjects residing in close proximity to busy roads often experi-
ence more short-term and long-term effects of traffic-related air pollution than those
residing further away. In urban areas, due to the settlement patterns, up to 10% of
the population may be residing in such “hot spots.” The unequal distribution of air
pollution exposure and subsequent health outcomes raise concerns over environ-
mental justice and equity.
Of prime concern are the effects of long-term exposure to PM on mortality.
Long-term exposure to low and moderate levels of fine PM has been associated with
a reduction in life expectancy by up to some months. Some analysis has been
published on the relative public health significance of short-term and long-term
exposures to PM, with “disability-adjusted life years” (DALYs) estimated for both.
The analysis submits that the public health significance of long-term effects of PM
exposure clearly outweighs the public health significance of the short-term effects.
However, this does not lessen the significance of the short-term effects of PM,
which consist of attributable deaths and hospital admissions for cardiovascular and
respiratory adverse outcomes.
Our study had some limitations worth mentioning. First, it is a descriptive study
that shows only correlation and not causation. Secondly, the lack of data on health
effects disaggregated by season made it impossible to investigate the effect of
temperature on the relationships between air pollution exposure and health out-
comes. In conclusion, this study highlighted that there is a possible correlation
between air pollution-climate change interactions and health effects on the popu-
lation of Bangkok, and this may have implications on the health impact of both air
pollution exposure and climate change.
16 Climate Change, Air Pollution, and Human Health in Bangkok 269
References
Beverland IJ, Cohen GR, Heal MR, Carder M, Yap C, Robertson C, Hart CL, Agius RM (2012) A
comparison of short-term and long-term air pollution exposure associations with mortality in
two cohorts in Scotland. Environ Health Perspect 120(9):1280–1285. doi:10.1289/ehp.
1104509
Bureau of Policy and Strategy; Ministry of Public Health (2015) Public health statistics A.D. 2014.
Printing Press of the War Veterans Organization of Thailand under Royal Patronage of His
Majesty the King, Bangkok, 230 p. ISSN 08570-3093
Chen R, Kan H, Chen B, Huang W, Bai Z, Song G, Pan G, CAPES Collaborative Group (2012)
Association of particulate air pollution with daily mortality: the China Air Pollution and Health
Effects Study. Am J Epidemiol 175(11):1173–1181. doi:10.1093/aje/kwr425
Chen H, Goldberg MS, Burnett RT, Jerrett M, Wheeler AJ, Villeneuve PJ (2013) Long-term
exposure to traffic-related air pollution and cardiovascular mortality. Epidemiology 24
(1):35–43. doi:10.1097/EDE.0b013e318276c005
D’Amato G, Baena-Cagnani CE, Cecchi L, Annesi-Maesano I, Nunes C, Ansotegui I, D’Amato M,
Liccardi G, Sofia M, Canonica WG (2013) Climate change, air pollution and extreme events
leading to increasing prevalence of allergic respiratory diseases. Multidiscip Respir Med 8
(1):12. doi:10.1186/2049-6958-8-12
D’Amato G, Holgate ST, Pawankar R, Ledford DK, Cecchi L, Al-Ahmad M, . . . Annesi-Maesano
I (2015) Meteorological conditions, climate change, new emerging factors, and asthma and
related allergic disorders. A statement of the World Allergy Organization. World Allergy
Organ J 8(1):25. doi:10.1186/s40413-015-0073-0
Deguen S, Petit C, Delbarre A, Kihal W, Padilla C, Benmarhnia T, Lapostolle A, Chauvin P,
Zmirou-Navier D (2015) Neighbourhood characteristics and long-term air pollution levels
modify the association between the short-term nitrogen dioxide concentrations and all-cause
mortality in Paris. PLoS One 10(7):e0131463. doi:10.1371/journal.pone.0131463
Franchini M, Mannucci PM (2015) Impact on human health of climate changes. Eur J Intern Med
26(1):1–5. doi:10.1016/j.ejim.2014.12.008
Guo Y, Li S, Tawatsupa B, Punnasiri K, Jaakkola JJ, Williams G (2014) The association between
air pollution and mortality in Thailand. Sci Rep 4:5509. doi:10.1038/srep05509
Lagidze L, Matchavariani L, Tsivtsivadze N, Khidasheli N, Paichadze N, Motsonelidze N,
Vakhtangishvili M (2015) Medical aspects of atmosphere pollution in Tbilisi, Georgia. J
Environ Biol 36. Spec No:101–106
Li L, Yang J, Song YF, Chen PY, Ou CQ (2016) The burden of COPD mortality due to ambient air
pollution in Guangzhou, China. Sci Rep 6:25900. doi:10.1038/srep25900
Meng X, Zhang Y, Zhao Z, Duan X, Xu X, Kan H (2012) Temperature modifies the acute effect of
particulate air pollution on mortality in eight Chinese cities. Sci Total Environ
435–436:215–221. doi:10.1016/j.scitotenv.2012.07.008
Mirsaeidi M, Motahari H, Taghizadeh Khamesi M, Sharifi A, Campos M, Schraufnagel DE (2016)
Climate change and respiratory infections. Ann Am Thorac Soc. doi:10.1513/AnnalsATS.
201511-729PS
Pope CA 3rd, Turner MC, Burnett RT, Jerrett M, Gapstur SM, Diver WR, Krewski D, Brook RD
(2015) Relationships between fine particulate air pollution, cardiometabolic disorders, and
cardiovascular mortality. Circ Res 116(1):108–115. doi:10.1161/CIRCRESAHA.116.305060
Schulte PA, Bhattacharya A, Butler CR, Chun HK, Jacklitsch B, Jacobs T, . . .Wagner GR (2016)
Advancing the framework for considering the effects of climate change on worker safety and
health. J Occup Environ Hyg 1–60. doi:10.1080/15459624.2016.1179388
Shang Y, Sun Z, Cao J, Wang X, Zhong L, Bi X, Liu W, Zhu T, Huang W (2013) Systematic
review of Chinese studies of short-term exposure to air pollution and daily mortality. Environ
Int 54:100–111. doi:10.1016/j.envint.2013.01.010
270 U. Langkulsen and D. Rwodzi
Tsai SS, Chen CC, Yang CY (2014) Short-term effect of fine particulate air pollution on daily
mortality: a case-crossover study in a tropical city, Kaohsiung, Taiwan. J Toxicol Environ
Health A 77(8):467–477. doi:10.1080/15287394.2014.881247
Vanos JK, Cakmak S, Kalkstein LS, Yagouti A (2015) Association of weather and air pollution
interactions on daily mortality in 12 Canadian cities. Air Qual Atmos Health 8(3):307–320.
doi:10.1007/s11869-014-0266-7
Vichit-Vadakan N, Vajanapoom N, Ostro B, HEI Health Review Committee (2010) Part 3. Esti-
mating the effects of air pollution on mortality in Bangkok, Thailand. Res Rep Health Eff Inst
(154):231–268
Xu Z, Huang C, Hu W, Turner LR, Su H, Tong S (2013) Extreme temperatures and emergency
department admissions for childhood asthma in Brisbane, Australia. Occup Environ Med 70
(10):730–735. doi:10.1136/oemed-2013-101538
Zhou X, Zhao A, Meng X, Chen R, Kuang X, Duan X, Kan H (2014) Acute effects of diurnal
temperature range on mortality in 8 Chinese cities. Sci Total Environ 493:92–97. doi:10.1016/
j.scitotenv.2014.05.116
Uma Langkulsen received a doctoral degree in environmental management from the National
Research Center for Environmental and Hazardous Waste Management (NRC-EHWM),
Chulalongkorn University. In 2007, she received a postdoctoral scholarship from the Commission
on Higher Education of Thailand under the programme Strategic Scholarships Fellowships
Frontier Research Networks. She continued to produce original research in health impact of
climate change on occupational health and productivity.
Desire Rwodzi received his Bachelor of Science in Health Education and Promotion from
University of Zimbabwe in 2007 and Master of Public Health in Global Health from Thammasat
University, Thailand in 2012. Mr. Desire worked for two years serving as Data Analyst Consultant,
UNAIDS RST East and Southern Africa, South Africa.
16 Climate Change, Air Pollution, and Human Health in Bangkok 271
Chapter 17
Climate Change, Air Pollution and HumanHealth in Delhi, India
Hem H. Dholakia and Amit Garg
Abstract Over centuries, the Indian capital of Delhi has been the seat of power for
several empires. Today, however, Delhi finds itself in the unenviable position of
being among the world’s most polluted cities. Mitigating air pollution as well as
greenhouse gases in Delhi without adversely impacting development remains a
crucial goal. Further, climate change has profound impacts that Delhi must adapt
to. From a health perspective, in addition to health impacts of pollution, addressing
health impacts of climate change such as heatwaves is important.
This chapter understands the transitions of key drivers of energy use such as
population, vehicle use and per capita incomes that in turn drive emissions of
pollutants and greenhouse gases. It provides estimates of greenhouse gas and
pollutant emissions from Delhi. It estimates pollution as well as future heat-related
mortality for Delhi. Finally, it argues that policies for GHG as well as pollutant
mitigation require to be better aligned. This will ensure that health co-benefits are
accrued for Delhi.
Keywords Delhi • Air pollution • GHG • Health impacts • Co-benefits
Introduction
Over centuries, the Indian capital of Delhi has been the seat of power for several
empires. Culture, history, art and economy are complexly interwoven into the fabric
of the city that has drawn people from around the world. Today, however, Delhi
finds itself in the unenviable position of being among the world’s most polluted
cities (Fig. 17.1). Urbanisation, population growth, rising incomes, increase in
vehicle ownership, growing energy demand and proximity to industrial hubs have
all contributed to the steady rise in pollution levels over time. Associated with
H.H. Dholakia (*)
Council on Energy, Environment and Water, New Delhi, India
e-mail: [email protected]
A. Garg
Indian Institute of Management, Ahmedabad, India
e-mail: [email protected]
© Springer International Publishing AG 2018
R. Akhtar, C. Palagiano (eds.), Climate Change and Air Pollution,Springer Climate, DOI 10.1007/978-3-319-61346-8_17
273
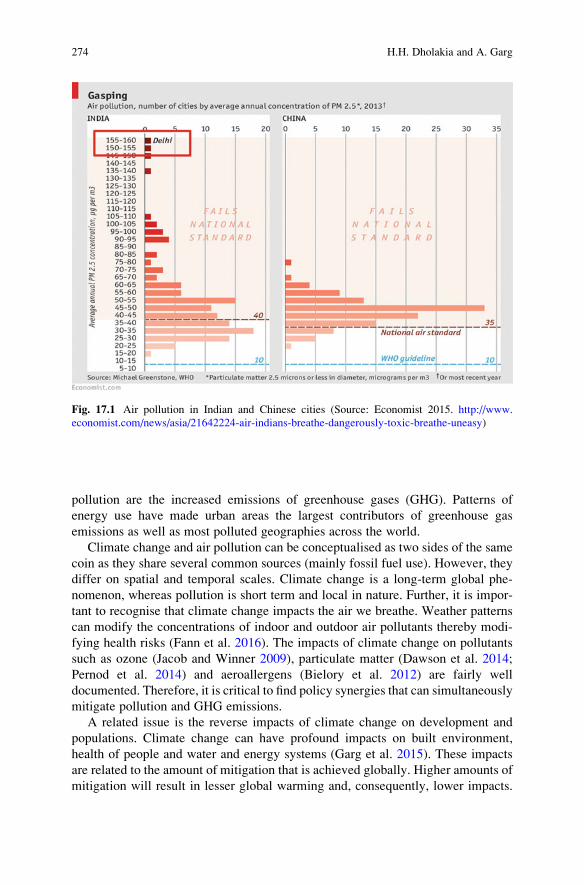
pollution are the increased emissions of greenhouse gases (GHG). Patterns of
energy use have made urban areas the largest contributors of greenhouse gas
emissions as well as most polluted geographies across the world.
Climate change and air pollution can be conceptualised as two sides of the same
coin as they share several common sources (mainly fossil fuel use). However, they
differ on spatial and temporal scales. Climate change is a long-term global phe-
nomenon, whereas pollution is short term and local in nature. Further, it is impor-
tant to recognise that climate change impacts the air we breathe. Weather patterns
can modify the concentrations of indoor and outdoor air pollutants thereby modi-
fying health risks (Fann et al. 2016). The impacts of climate change on pollutants
such as ozone (Jacob and Winner 2009), particulate matter (Dawson et al. 2014;
Pernod et al. 2014) and aeroallergens (Bielory et al. 2012) are fairly well
documented. Therefore, it is critical to find policy synergies that can simultaneously
mitigate pollution and GHG emissions.
A related issue is the reverse impacts of climate change on development and
populations. Climate change can have profound impacts on built environment,
health of people and water and energy systems (Garg et al. 2015). These impacts
are related to the amount of mitigation that is achieved globally. Higher amounts of
mitigation will result in lesser global warming and, consequently, lower impacts.
Fig. 17.1 Air pollution in Indian and Chinese cities (Source: Economist 2015. http://www.
economist.com/news/asia/21642224-air-indians-breathe-dangerously-toxic-breathe-uneasy)
274 H.H. Dholakia and A. Garg
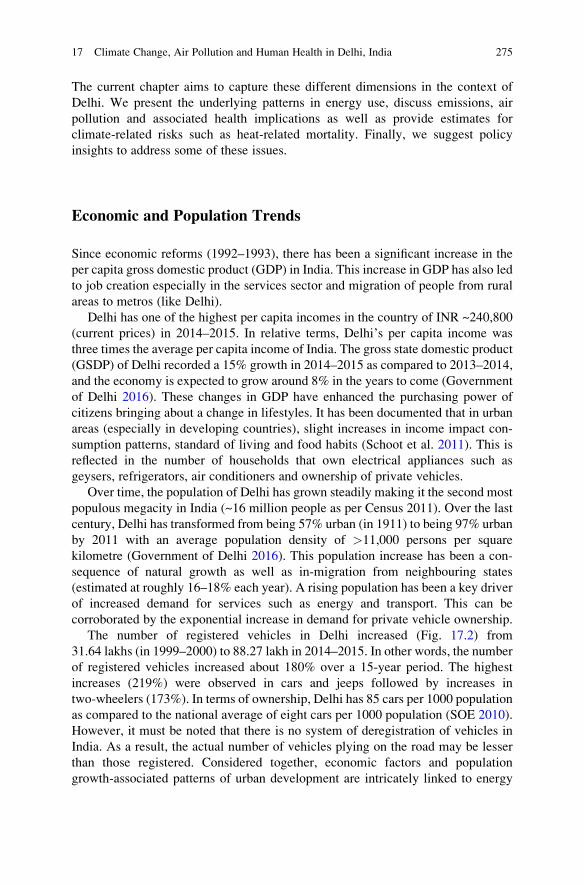
The current chapter aims to capture these different dimensions in the context of
Delhi. We present the underlying patterns in energy use, discuss emissions, air
pollution and associated health implications as well as provide estimates for
climate-related risks such as heat-related mortality. Finally, we suggest policy
insights to address some of these issues.
Economic and Population Trends
Since economic reforms (1992–1993), there has been a significant increase in the
per capita gross domestic product (GDP) in India. This increase in GDP has also led
to job creation especially in the services sector and migration of people from rural
areas to metros (like Delhi).
Delhi has one of the highest per capita incomes in the country of INR ~240,800
(current prices) in 2014–2015. In relative terms, Delhi’s per capita income was
three times the average per capita income of India. The gross state domestic product
(GSDP) of Delhi recorded a 15% growth in 2014–2015 as compared to 2013–2014,
and the economy is expected to grow around 8% in the years to come (Government
of Delhi 2016). These changes in GDP have enhanced the purchasing power of
citizens bringing about a change in lifestyles. It has been documented that in urban
areas (especially in developing countries), slight increases in income impact con-
sumption patterns, standard of living and food habits (Schoot et al. 2011). This is
reflected in the number of households that own electrical appliances such as
geysers, refrigerators, air conditioners and ownership of private vehicles.
Over time, the population of Delhi has grown steadily making it the second most
populous megacity in India (~16 million people as per Census 2011). Over the last
century, Delhi has transformed from being 57% urban (in 1911) to being 97% urban
by 2011 with an average population density of >11,000 persons per square
kilometre (Government of Delhi 2016). This population increase has been a con-
sequence of natural growth as well as in-migration from neighbouring states
(estimated at roughly 16–18% each year). A rising population has been a key driver
of increased demand for services such as energy and transport. This can be
corroborated by the exponential increase in demand for private vehicle ownership.
The number of registered vehicles in Delhi increased (Fig. 17.2) from
31.64 lakhs (in 1999–2000) to 88.27 lakh in 2014–2015. In other words, the number
of registered vehicles increased about 180% over a 15-year period. The highest
increases (219%) were observed in cars and jeeps followed by increases in
two-wheelers (173%). In terms of ownership, Delhi has 85 cars per 1000 population
as compared to the national average of eight cars per 1000 population (SOE 2010).
However, it must be noted that there is no system of deregistration of vehicles in
India. As a result, the actual number of vehicles plying on the road may be lesser
than those registered. Considered together, economic factors and population
growth-associated patterns of urban development are intricately linked to energy
17 Climate Change, Air Pollution and Human Health in Delhi, India 275
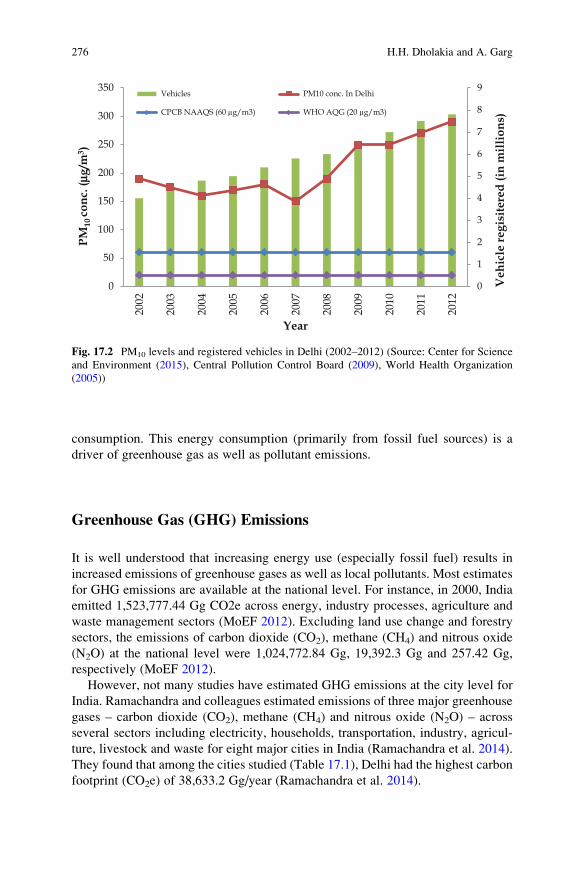
consumption. This energy consumption (primarily from fossil fuel sources) is a
driver of greenhouse gas as well as pollutant emissions.
Greenhouse Gas (GHG) Emissions
It is well understood that increasing energy use (especially fossil fuel) results in
increased emissions of greenhouse gases as well as local pollutants. Most estimates
for GHG emissions are available at the national level. For instance, in 2000, India
emitted 1,523,777.44 Gg CO2e across energy, industry processes, agriculture and
waste management sectors (MoEF 2012). Excluding land use change and forestry
sectors, the emissions of carbon dioxide (CO2), methane (CH4) and nitrous oxide
(N2O) at the national level were 1,024,772.84 Gg, 19,392.3 Gg and 257.42 Gg,
respectively (MoEF 2012).
However, not many studies have estimated GHG emissions at the city level for
India. Ramachandra and colleagues estimated emissions of three major greenhouse
gases – carbon dioxide (CO2), methane (CH4) and nitrous oxide (N2O) – across
several sectors including electricity, households, transportation, industry, agricul-
ture, livestock and waste for eight major cities in India (Ramachandra et al. 2014).
They found that among the cities studied (Table 17.1), Delhi had the highest carbon
footprint (CO2e) of 38,633.2 Gg/year (Ramachandra et al. 2014).
0
1
2
3
4
5
6
7
8
9
0
50
100
150
200
250
300
350
2002
2003
2004
2005
2006
2007
2008
2009
2010
2011
2012
Veh
icle
regi
site
red
(in m
illio
ns)
PM10
conc
. (mg
/m3 )
Year
Vehicles PM10 conc. In Delhi
CPCB NAAQS (60 µg/m3) WHO AQG (20 µg/m3)
Fig. 17.2 PM10 levels and registered vehicles in Delhi (2002–2012) (Source: Center for Science
and Environment (2015), Central Pollution Control Board (2009), World Health Organization
(2005))
276 H.H. Dholakia and A. Garg
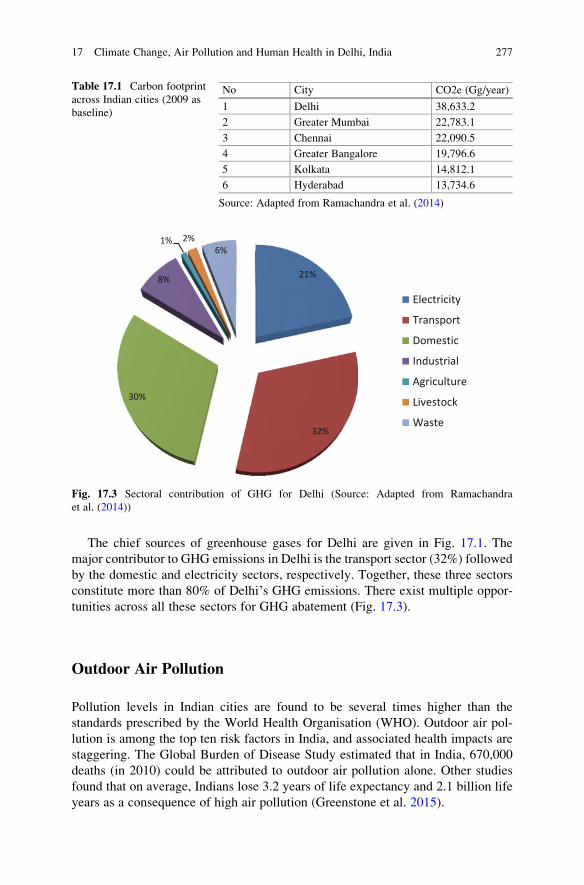
The chief sources of greenhouse gases for Delhi are given in Fig. 17.1. The
major contributor to GHG emissions in Delhi is the transport sector (32%) followed
by the domestic and electricity sectors, respectively. Together, these three sectors
constitute more than 80% of Delhi’s GHG emissions. There exist multiple oppor-
tunities across all these sectors for GHG abatement (Fig. 17.3).
Outdoor Air Pollution
Pollution levels in Indian cities are found to be several times higher than the
standards prescribed by the World Health Organisation (WHO). Outdoor air pol-
lution is among the top ten risk factors in India, and associated health impacts are
staggering. The Global Burden of Disease Study estimated that in India, 670,000
deaths (in 2010) could be attributed to outdoor air pollution alone. Other studies
found that on average, Indians lose 3.2 years of life expectancy and 2.1 billion life
years as a consequence of high air pollution (Greenstone et al. 2015).
Table 17.1 Carbon footprint
across Indian cities (2009 as
baseline)
No City CO2e (Gg/year)
1 Delhi 38,633.2
2 Greater Mumbai 22,783.1
3 Chennai 22,090.5
4 Greater Bangalore 19,796.6
5 Kolkata 14,812.1
6 Hyderabad 13,734.6
Source: Adapted from Ramachandra et al. (2014)
21%
32%
30%
8%
1% 2%6%
Electricity
Transport
Domestic
Industrial
Agriculture
Livestock
Waste
Fig. 17.3 Sectoral contribution of GHG for Delhi (Source: Adapted from Ramachandra
et al. (2014))
17 Climate Change, Air Pollution and Human Health in Delhi, India 277
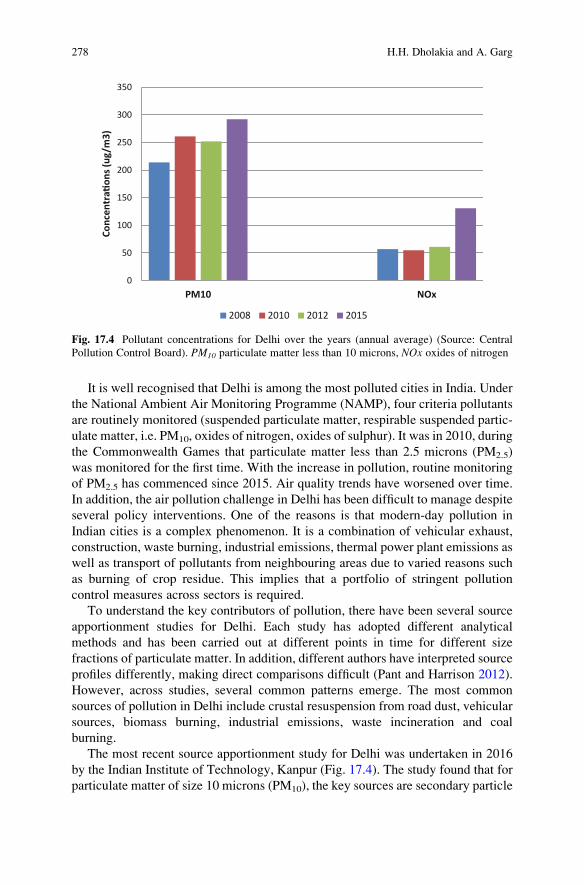
It is well recognised that Delhi is among the most polluted cities in India. Under
the National Ambient Air Monitoring Programme (NAMP), four criteria pollutants
are routinely monitored (suspended particulate matter, respirable suspended partic-
ulate matter, i.e. PM10, oxides of nitrogen, oxides of sulphur). It was in 2010, during
the Commonwealth Games that particulate matter less than 2.5 microns (PM2.5)
was monitored for the first time. With the increase in pollution, routine monitoring
of PM2.5 has commenced since 2015. Air quality trends have worsened over time.
In addition, the air pollution challenge in Delhi has been difficult to manage despite
several policy interventions. One of the reasons is that modern-day pollution in
Indian cities is a complex phenomenon. It is a combination of vehicular exhaust,
construction, waste burning, industrial emissions, thermal power plant emissions as
well as transport of pollutants from neighbouring areas due to varied reasons such
as burning of crop residue. This implies that a portfolio of stringent pollution
control measures across sectors is required.
To understand the key contributors of pollution, there have been several source
apportionment studies for Delhi. Each study has adopted different analytical
methods and has been carried out at different points in time for different size
fractions of particulate matter. In addition, different authors have interpreted source
profiles differently, making direct comparisons difficult (Pant and Harrison 2012).
However, across studies, several common patterns emerge. The most common
sources of pollution in Delhi include crustal resuspension from road dust, vehicular
sources, biomass burning, industrial emissions, waste incineration and coal
burning.
The most recent source apportionment study for Delhi was undertaken in 2016
by the Indian Institute of Technology, Kanpur (Fig. 17.4). The study found that for
particulate matter of size 10 microns (PM10), the key sources are secondary particle
0
50
100
150
200
250
300
350
PM10 NOx
Conc
entr
a�on
s (ug
/m3)
2008 2010 2012 2015
Fig. 17.4 Pollutant concentrations for Delhi over the years (annual average) (Source: Central
Pollution Control Board). PM10 particulate matter less than 10 microns, NOx oxides of nitrogen
278 H.H. Dholakia and A. Garg
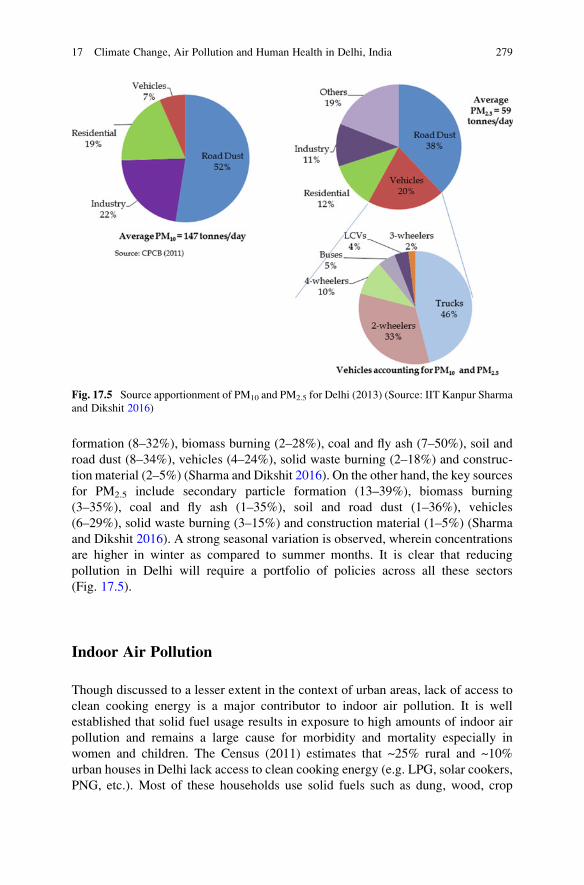
formation (8–32%), biomass burning (2–28%), coal and fly ash (7–50%), soil and
road dust (8–34%), vehicles (4–24%), solid waste burning (2–18%) and construc-
tion material (2–5%) (Sharma and Dikshit 2016). On the other hand, the key sources
for PM2.5 include secondary particle formation (13–39%), biomass burning
(3–35%), coal and fly ash (1–35%), soil and road dust (1–36%), vehicles
(6–29%), solid waste burning (3–15%) and construction material (1–5%) (Sharma
and Dikshit 2016). A strong seasonal variation is observed, wherein concentrations
are higher in winter as compared to summer months. It is clear that reducing
pollution in Delhi will require a portfolio of policies across all these sectors
(Fig. 17.5).
Indoor Air Pollution
Though discussed to a lesser extent in the context of urban areas, lack of access to
clean cooking energy is a major contributor to indoor air pollution. It is well
established that solid fuel usage results in exposure to high amounts of indoor air
pollution and remains a large cause for morbidity and mortality especially in
women and children. The Census (2011) estimates that ~25% rural and ~10%
urban houses in Delhi lack access to clean cooking energy (e.g. LPG, solar cookers,
PNG, etc.). Most of these households use solid fuels such as dung, wood, crop
Fig. 17.5 Source apportionment of PM10 and PM2.5 for Delhi (2013) (Source: IIT Kanpur Sharma
and Dikshit 2016)
17 Climate Change, Air Pollution and Human Health in Delhi, India 279
residue, etc. It has been estimated that 16–25% of indoor air pollution contributes to
outdoor air pollution levels (Smith et al. 2013). Provision of clean cooking energy
remains important in urban areas not only to reduce pollution but protect the health
of people.
Box 1 Addressing Brick Kilns
As the second largest producer of coal-fired bricks (150–200 million annu-
ally), India’s brick sector is saddled with older traditional technology, making
it one of the most polluting sectors. It is estimated that brick production in
India consumes 25 million tonnes of coal annually. One of the barriers that
have prevented adoption of cleaner technology is the production costs. Using
cleaner technology (Table B1) such as vertical shaft nearly doubles the
production costs relative to traditional technologies (down draft kiln). How-
ever, there is a significant reduction in PM10 as well as PM2.5 with cleaner
technology implementation. As India implements urban development
programmes such as ‘Smart Cities Mission’ and ‘Atal Mission on Urban
Rejuvenation and Transformation (AMRUT)’, addressing issues in the
brick sector will prove important to minimise pollution as well as GHG
emissions. This will require a policy push as well as finance.
Delhi set up an Air Ambience Fund that collected a cess of diesel sale. As
of March 2015, this fund had INR 385 crore. Whereas industries cannot
escape installing pollution control equipment, some of this money could be
used as loan guarantees or viability gap funding to promote clean technolo-
gies for the brick kiln sector.
Health Impacts
Air Pollution
The physiological basis of air pollution impacts on human health is complex and
multifaceted in nature. Most of the underlying evidence for physiological impacts
comes from animal model studies, and there is general consensus that cellular
injury and inflammation play a key role (USEPA 2009). The impacts of pollution
not only affect the pulmonary system but also extend to cardiovascular,
haematopoietic as well as central nervous system.
Air pollution may impact health in different ways. The impacts of particulate
matter inhalation may be acute or chronic in nature. This depends on whether
exposure to particulate matter is short term or long term in nature. Air pollution
may (1) increase risk of underlying diseases, leading to frailty and higher risk of
short-term deaths in frail individuals; (2) increase risk of chronic diseases leading to
frailty but may not be related to timing of death; or (3) increase the risk of short-
term death in frail individuals but may not be related to risk of chronic disease
280 H.H. Dholakia and A. Garg
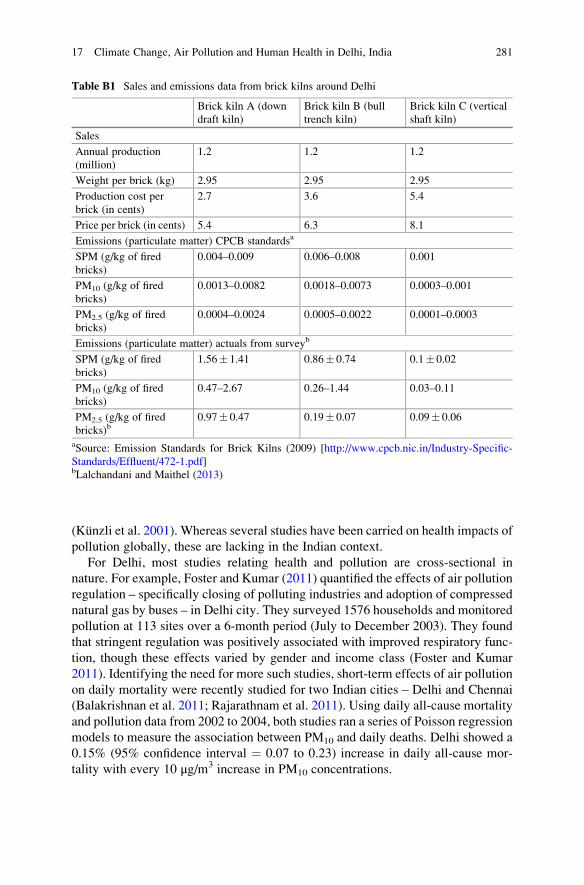
(Künzli et al. 2001). Whereas several studies have been carried on health impacts of
pollution globally, these are lacking in the Indian context.
For Delhi, most studies relating health and pollution are cross-sectional in
nature. For example, Foster and Kumar (2011) quantified the effects of air pollution
regulation – specifically closing of polluting industries and adoption of compressed
natural gas by buses – in Delhi city. They surveyed 1576 households and monitored
pollution at 113 sites over a 6-month period (July to December 2003). They found
that stringent regulation was positively associated with improved respiratory func-
tion, though these effects varied by gender and income class (Foster and Kumar
2011). Identifying the need for more such studies, short-term effects of air pollution
on daily mortality were recently studied for two Indian cities – Delhi and Chennai
(Balakrishnan et al. 2011; Rajarathnam et al. 2011). Using daily all-cause mortality
and pollution data from 2002 to 2004, both studies ran a series of Poisson regression
models to measure the association between PM10 and daily deaths. Delhi showed a
0.15% (95% confidence interval ¼ 0.07 to 0.23) increase in daily all-cause mor-
tality with every 10 μg/m3 increase in PM10 concentrations.
Table B1 Sales and emissions data from brick kilns around Delhi
Brick kiln A (down
draft kiln)
Brick kiln B (bull
trench kiln)
Brick kiln C (vertical
shaft kiln)
Sales
Annual production
(million)
1.2 1.2 1.2
Weight per brick (kg) 2.95 2.95 2.95
Production cost per
brick (in cents)
2.7 3.6 5.4
Price per brick (in cents) 5.4 6.3 8.1
Emissions (particulate matter) CPCB standardsa
SPM (g/kg of fired
bricks)
0.004–0.009 0.006–0.008 0.001
PM10 (g/kg of fired
bricks)
0.0013–0.0082 0.0018–0.0073 0.0003–0.001
PM2.5 (g/kg of fired
bricks)
0.0004–0.0024 0.0005–0.0022 0.0001–0.0003
Emissions (particulate matter) actuals from surveyb
SPM (g/kg of fired
bricks)
1.56� 1.41 0.86� 0.74 0.1� 0.02
PM10 (g/kg of fired
bricks)
0.47–2.67 0.26–1.44 0.03–0.11
PM2.5 (g/kg of fired
bricks)b0.97� 0.47 0.19� 0.07 0.09� 0.06
aSource: Emission Standards for Brick Kilns (2009) [http://www.cpcb.nic.in/Industry-Specific-
Standards/Effluent/472-1.pdf]bLalchandani and Maithel (2013)
17 Climate Change, Air Pollution and Human Health in Delhi, India 281
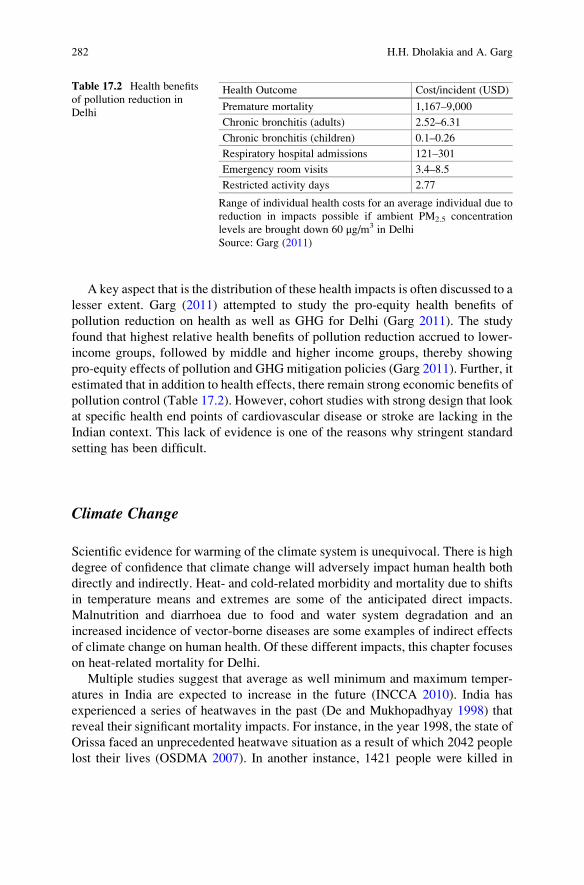
A key aspect that is the distribution of these health impacts is often discussed to a
lesser extent. Garg (2011) attempted to study the pro-equity health benefits of
pollution reduction on health as well as GHG for Delhi (Garg 2011). The study
found that highest relative health benefits of pollution reduction accrued to lower-
income groups, followed by middle and higher income groups, thereby showing
pro-equity effects of pollution and GHGmitigation policies (Garg 2011). Further, it
estimated that in addition to health effects, there remain strong economic benefits of
pollution control (Table 17.2). However, cohort studies with strong design that look
at specific health end points of cardiovascular disease or stroke are lacking in the
Indian context. This lack of evidence is one of the reasons why stringent standard
setting has been difficult.
Climate Change
Scientific evidence for warming of the climate system is unequivocal. There is high
degree of confidence that climate change will adversely impact human health both
directly and indirectly. Heat- and cold-related morbidity and mortality due to shifts
in temperature means and extremes are some of the anticipated direct impacts.
Malnutrition and diarrhoea due to food and water system degradation and an
increased incidence of vector-borne diseases are some examples of indirect effects
of climate change on human health. Of these different impacts, this chapter focuses
on heat-related mortality for Delhi.
Multiple studies suggest that average as well minimum and maximum temper-
atures in India are expected to increase in the future (INCCA 2010). India has
experienced a series of heatwaves in the past (De and Mukhopadhyay 1998) that
reveal their significant mortality impacts. For instance, in the year 1998, the state of
Orissa faced an unprecedented heatwave situation as a result of which 2042 people
lost their lives (OSDMA 2007). In another instance, 1421 people were killed in
Table 17.2 Health benefits
of pollution reduction in
Delhi
Health Outcome Cost/incident (USD)
Premature mortality 1,167–9,000
Chronic bronchitis (adults) 2.52–6.31
Chronic bronchitis (children) 0.1–0.26
Respiratory hospital admissions 121–301
Emergency room visits 3.4–8.5
Restricted activity days 2.77
Range of individual health costs for an average individual due to
reduction in impacts possible if ambient PM2.5 concentration
levels are brought down 60 μg/m3 in Delhi
Source: Garg (2011)
282 H.H. Dholakia and A. Garg
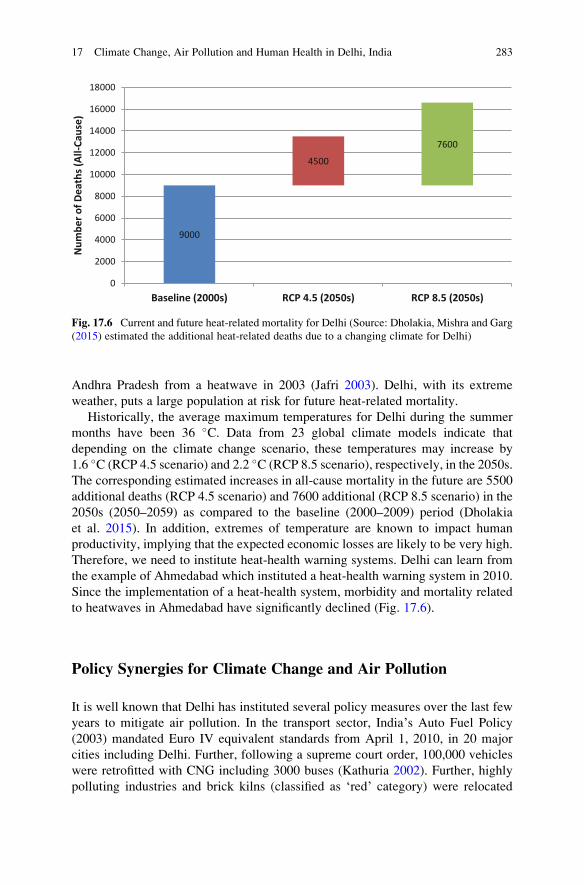
Andhra Pradesh from a heatwave in 2003 (Jafri 2003). Delhi, with its extreme
weather, puts a large population at risk for future heat-related mortality.
Historically, the average maximum temperatures for Delhi during the summer
months have been 36 �C. Data from 23 global climate models indicate that
depending on the climate change scenario, these temperatures may increase by
1.6 �C (RCP 4.5 scenario) and 2.2 �C (RCP 8.5 scenario), respectively, in the 2050s.
The corresponding estimated increases in all-cause mortality in the future are 5500
additional deaths (RCP 4.5 scenario) and 7600 additional (RCP 8.5 scenario) in the
2050s (2050–2059) as compared to the baseline (2000–2009) period (Dholakia
et al. 2015). In addition, extremes of temperature are known to impact human
productivity, implying that the expected economic losses are likely to be very high.
Therefore, we need to institute heat-health warning systems. Delhi can learn from
the example of Ahmedabad which instituted a heat-health warning system in 2010.
Since the implementation of a heat-health system, morbidity and mortality related
to heatwaves in Ahmedabad have significantly declined (Fig. 17.6).
Policy Synergies for Climate Change and Air Pollution
It is well known that Delhi has instituted several policy measures over the last few
years to mitigate air pollution. In the transport sector, India’s Auto Fuel Policy
(2003) mandated Euro IV equivalent standards from April 1, 2010, in 20 major
cities including Delhi. Further, following a supreme court order, 100,000 vehicles
were retrofitted with CNG including 3000 buses (Kathuria 2002). Further, highly
polluting industries and brick kilns (classified as ‘red’ category) were relocated
9000
4500
7600
0
2000
4000
6000
8000
10000
12000
14000
16000
18000
Baseline (2000s) RCP 4.5 (2050s) RCP 8.5 (2050s)
Num
ber o
f Dea
ths (
All-C
ause
)
Fig. 17.6 Current and future heat-related mortality for Delhi (Source: Dholakia, Mishra and Garg
(2015) estimated the additional heat-related deaths due to a changing climate for Delhi)
17 Climate Change, Air Pollution and Human Health in Delhi, India 283
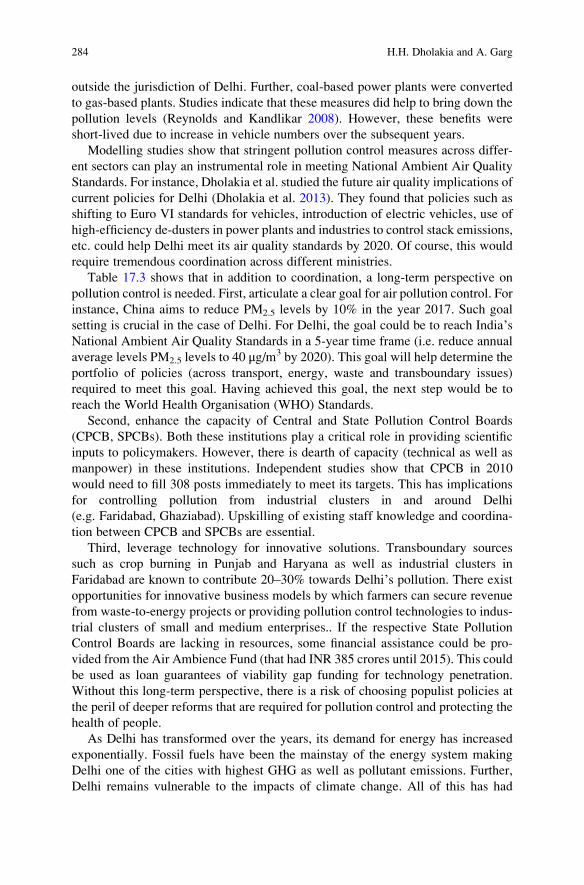
outside the jurisdiction of Delhi. Further, coal-based power plants were converted
to gas-based plants. Studies indicate that these measures did help to bring down the
pollution levels (Reynolds and Kandlikar 2008). However, these benefits were
short-lived due to increase in vehicle numbers over the subsequent years.
Modelling studies show that stringent pollution control measures across differ-
ent sectors can play an instrumental role in meeting National Ambient Air Quality
Standards. For instance, Dholakia et al. studied the future air quality implications of
current policies for Delhi (Dholakia et al. 2013). They found that policies such as
shifting to Euro VI standards for vehicles, introduction of electric vehicles, use of
high-efficiency de-dusters in power plants and industries to control stack emissions,
etc. could help Delhi meet its air quality standards by 2020. Of course, this would
require tremendous coordination across different ministries.
Table 17.3 shows that in addition to coordination, a long-term perspective on
pollution control is needed. First, articulate a clear goal for air pollution control. For
instance, China aims to reduce PM2.5 levels by 10% in the year 2017. Such goal
setting is crucial in the case of Delhi. For Delhi, the goal could be to reach India’sNational Ambient Air Quality Standards in a 5-year time frame (i.e. reduce annual
average levels PM2.5 levels to 40 μg/m3 by 2020). This goal will help determine the
portfolio of policies (across transport, energy, waste and transboundary issues)
required to meet this goal. Having achieved this goal, the next step would be to
reach the World Health Organisation (WHO) Standards.
Second, enhance the capacity of Central and State Pollution Control Boards
(CPCB, SPCBs). Both these institutions play a critical role in providing scientific
inputs to policymakers. However, there is dearth of capacity (technical as well as
manpower) in these institutions. Independent studies show that CPCB in 2010
would need to fill 308 posts immediately to meet its targets. This has implications
for controlling pollution from industrial clusters in and around Delhi
(e.g. Faridabad, Ghaziabad). Upskilling of existing staff knowledge and coordina-
tion between CPCB and SPCBs are essential.
Third, leverage technology for innovative solutions. Transboundary sources
such as crop burning in Punjab and Haryana as well as industrial clusters in
Faridabad are known to contribute 20–30% towards Delhi’s pollution. There existopportunities for innovative business models by which farmers can secure revenue
from waste-to-energy projects or providing pollution control technologies to indus-
trial clusters of small and medium enterprises.. If the respective State Pollution
Control Boards are lacking in resources, some financial assistance could be pro-
vided from the Air Ambience Fund (that had INR 385 crores until 2015). This could
be used as loan guarantees of viability gap funding for technology penetration.
Without this long-term perspective, there is a risk of choosing populist policies at
the peril of deeper reforms that are required for pollution control and protecting the
health of people.
As Delhi has transformed over the years, its demand for energy has increased
exponentially. Fossil fuels have been the mainstay of the energy system making
Delhi one of the cities with highest GHG as well as pollutant emissions. Further,
Delhi remains vulnerable to the impacts of climate change. All of this has had
284 H.H. Dholakia and A. Garg
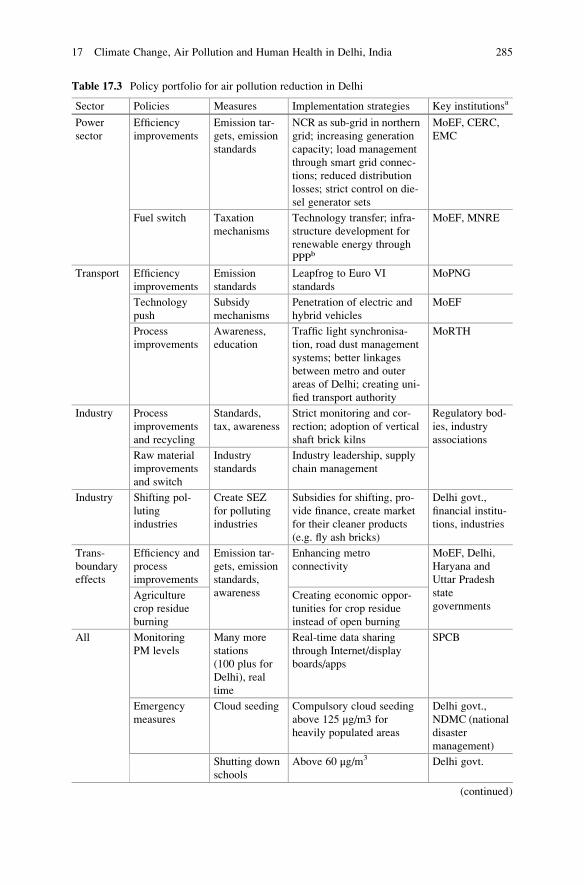
Table 17.3 Policy portfolio for air pollution reduction in Delhi
Sector Policies Measures Implementation strategies Key institutionsa
Power
sector
Efficiency
improvements
Emission tar-
gets, emission
standards
NCR as sub-grid in northern
grid; increasing generation
capacity; load management
through smart grid connec-
tions; reduced distribution
losses; strict control on die-
sel generator sets
MoEF, CERC,
EMC
Fuel switch Taxation
mechanisms
Technology transfer; infra-
structure development for
renewable energy through
PPPb
MoEF, MNRE
Transport Efficiency
improvements
Emission
standards
Leapfrog to Euro VI
standards
MoPNG
Technology
push
Subsidy
mechanisms
Penetration of electric and
hybrid vehicles
MoEF
Process
improvements
Awareness,
education
Traffic light synchronisa-
tion, road dust management
systems; better linkages
between metro and outer
areas of Delhi; creating uni-
fied transport authority
MoRTH
Industry Process
improvements
and recycling
Standards,
tax, awareness
Strict monitoring and cor-
rection; adoption of vertical
shaft brick kilns
Regulatory bod-
ies, industry
associations
Raw material
improvements
and switch
Industry
standards
Industry leadership, supply
chain management
Industry Shifting pol-
luting
industries
Create SEZ
for polluting
industries
Subsidies for shifting, pro-
vide finance, create market
for their cleaner products
(e.g. fly ash bricks)
Delhi govt.,
financial institu-
tions, industries
Trans-
boundary
effects
Efficiency and
process
improvements
Emission tar-
gets, emission
standards,
awareness
Enhancing metro
connectivity
MoEF, Delhi,
Haryana and
Uttar Pradesh
state
governmentsAgriculture
crop residue
burning
Creating economic oppor-
tunities for crop residue
instead of open burning
All Monitoring
PM levels
Many more
stations
(100 plus for
Delhi), real
time
Real-time data sharing
through Internet/display
boards/apps
SPCB
Emergency
measures
Cloud seeding Compulsory cloud seeding
above 125 μg/m3 for
heavily populated areas
Delhi govt.,
NDMC (national
disaster
management)
Shutting down
schools
Above 60 μg/m3 Delhi govt.
(continued)
17 Climate Change, Air Pollution and Human Health in Delhi, India 285
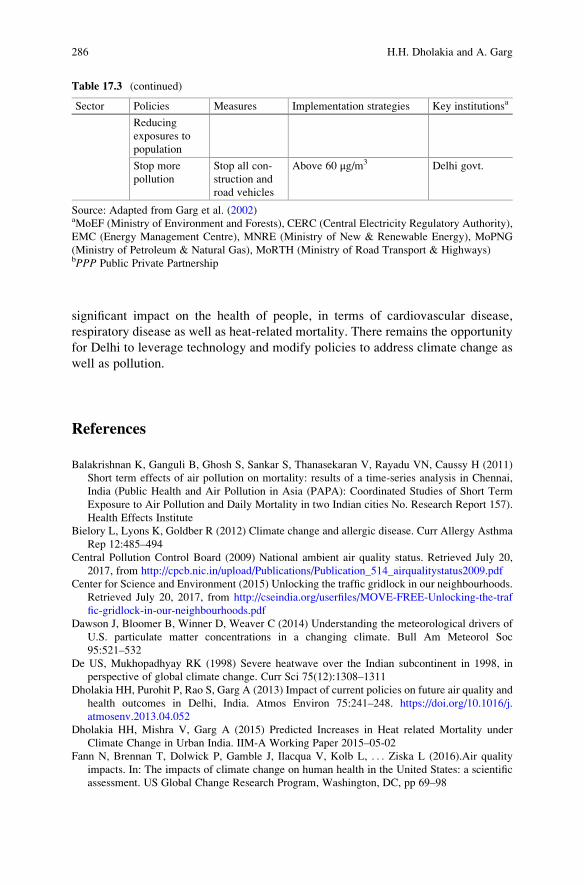
significant impact on the health of people, in terms of cardiovascular disease,
respiratory disease as well as heat-related mortality. There remains the opportunity
for Delhi to leverage technology and modify policies to address climate change as
well as pollution.
References
Balakrishnan K, Ganguli B, Ghosh S, Sankar S, Thanasekaran V, Rayadu VN, Caussy H (2011)
Short term effects of air pollution on mortality: results of a time-series analysis in Chennai,
India (Public Health and Air Pollution in Asia (PAPA): Coordinated Studies of Short Term
Exposure to Air Pollution and Daily Mortality in two Indian cities No. Research Report 157).
Health Effects Institute
Bielory L, Lyons K, Goldber R (2012) Climate change and allergic disease. Curr Allergy Asthma
Rep 12:485–494
Central Pollution Control Board (2009) National ambient air quality status. Retrieved July 20,
2017, from http://cpcb.nic.in/upload/Publications/Publication_514_airqualitystatus2009.pdf
Center for Science and Environment (2015) Unlocking the traffic gridlock in our neighbourhoods.
Retrieved July 20, 2017, from http://cseindia.org/userfiles/MOVE-FREE-Unlocking-the-traf
fic-gridlock-in-our-neighbourhoods.pdf
Dawson J, Bloomer B, Winner D, Weaver C (2014) Understanding the meteorological drivers of
U.S. particulate matter concentrations in a changing climate. Bull Am Meteorol Soc
95:521–532
De US, Mukhopadhyay RK (1998) Severe heatwave over the Indian subcontinent in 1998, in
perspective of global climate change. Curr Sci 75(12):1308–1311
Dholakia HH, Purohit P, Rao S, Garg A (2013) Impact of current policies on future air quality and
health outcomes in Delhi, India. Atmos Environ 75:241–248. https://doi.org/10.1016/j.
atmosenv.2013.04.052
Dholakia HH, Mishra V, Garg A (2015) Predicted Increases in Heat related Mortality under
Climate Change in Urban India. IIM-A Working Paper 2015–05-02
Fann N, Brennan T, Dolwick P, Gamble J, Ilacqua V, Kolb L, . . . Ziska L (2016).Air quality
impacts. In: The impacts of climate change on human health in the United States: a scientific
assessment. US Global Change Research Program, Washington, DC, pp 69–98
Table 17.3 (continued)
Sector Policies Measures Implementation strategies Key institutionsa
Reducing
exposures to
population
Stop more
pollution
Stop all con-
struction and
road vehicles
Above 60 μg/m3 Delhi govt.
Source: Adapted from Garg et al. (2002)aMoEF (Ministry of Environment and Forests), CERC (Central Electricity Regulatory Authority),
EMC (Energy Management Centre), MNRE (Ministry of New & Renewable Energy), MoPNG
(Ministry of Petroleum & Natural Gas), MoRTH (Ministry of Road Transport & Highways)bPPP Public Private Partnership
286 H.H. Dholakia and A. Garg
Foster A, Kumar N (2011) Health effects of air quality regulations in Delhi, India. Atmos Environ
45(9):1675–1683. https://doi.org/10.1016/j.atmosenv.2011.01.005
Garg A, Kapshe M, Shukla PR, Ghosh D, (2002) Large point source (LPS) emissions from India:
regional and sectoral analysis. Atmos Environ 36(2):213–224
Garg A (2011) Pro-equity effects of ancillary benefits of climate change policies: a case study of
human health impacts of outdoor air pollution in New Delhi. World Dev 39(6):1002–1025.
https://doi.org/10.1016/j.worlddev.2010.01.003
Garg A, Mishra V, Dholakia H (2015) Climate change and India: adaptation gap. New Delhi
Government of Delhi (2016) Economic survey of Delhi 2014–15. Delhi. Retrieved from http://
www.indiaenvironmentportal.org.in/files/file/economic%20survey%20of%20Delhi%202014-
15.pdf
Greenstone M, Nilekani J, Pande R, Ryan N, Sudarshan A, Sugathan A (2015) Lower pollution,
longer lives: life expectancy gains if India reduced particulate matter pollution. Econ Polit
Wkly 8:40–46
INCCA (2010) Climate change: India 4 � 4 assessment. Analysis. Indian Network on Climate
Change Assessment, New Delhi
Jacob D, Winner D (2009) Effect of climate change on air quality. Atmos Environ 43:51–63
Jafri S (2003) Andhra Pradesh finally gets respite from heat wave. Retrieved 20 Oct 2013, from
http://www.rediff.com/news/2003/jun/13rain.htm
Kathuria V (2002) Vehicular pollution control in Delhi. Transp Res Part D: Transp Environ 7
(5):373–387
Künzli N, Medina S, Kaiser R, Quenel P, Horak F, Studnicka M (2001) Assessment of deaths
attributable to air pollution: should we use risk estimates based on time series or on cohort
studies? Am J Epidemiol 153(11):1050–1055
Lalchandani D, Maithel S (2013) Towards cleaner bricks kilns in India. Retrieved July 20, 2017,
from http://www.gkspl.in/reports/energy_efficiency/Towards%20Cleaner%20Brick%20Kilns
%20in%20India.pdf
MoEF (2012) India: second National Communication to the United Nations framework conven-
tion on climate change. Ministry of Environment and Forests, Government of Delhi, New
Delhi. Retrieved from http://unfccc.int/resource/docs/natc/indnc2.pdf
OSDMA (2007) Heat wave. Retrieved 20 Oct 2013, from http://v3.osdma.org/ViewDetails.aspx?
vchglinkid¼GL002&vchplinkid¼PL008
Pant P, Harrison RM (2012) Critical review of receptor modelling for particulate matter: a case
study of India. Atmos Environ 49:1–12. https://doi.org/10.1016/j.atmosenv.2011.11.060
Pernod A, Zhang Y, Wang K, Wu S, Leung L (2014) Impacts of future climate and emission
changes on U.S. air quality. Atmos Environ 89:533–547
Rajarathnam U, Seghal M, Nairy S, Patnayak RC, Chhabra S, Kilnani KV, Ragavan S (2011) Time
series study on air pollution and mortality in Delhi, Research report no. report no. 157. Health
Effects Institute, Boston
Ramachandra TV, Sreejith K, Bharath HA (2014) Sector-wise assessment of carbon footprint
across major cities in India. In: Muthu SS (ed) Assessment of carbon footprint in different
industrial sectors, volume 2. Springer Singapore, Singapore, pp 207–267. Retrieved from
http://link.springer.com/10.1007/978-981-4585-75-0_8
Reynolds CCO, Kandlikar M (2008) Climate impacts of air quality policy: switching to a natural
gas-fueled public transportation system in New Delhi. Environ Sci Technol 42(16):5860–5865.
https://doi.org/10.1021/es702863p
Schoot Uiterkamp BJ, Azadi H, Ho P (2011) Sustainable recycling model: a comparative analysis
between India and Tanzania. Resour Conserv Recycl 55(3):344–355. https://doi.org/10.1016/j.
resconrec.2010.10.009
Sharma M, Dikshit O (2016) Comprehensive study on air pollution and green house gases (GHGs)
in Delhi. Indian Instittute of Technology, Kanpur, Kanpur. Retrieved from http://delhi.gov.in/
DoIT/Environment/PDFs/Final_Report.pdf
17 Climate Change, Air Pollution and Human Health in Delhi, India 287
Smith KR, Frumkin H, Balakrishnan K, Butler CD, Chafe ZA, Fairlie I, . . . Schneider M (2013).
Energy and human health. Annu Rev Publ Health, 34(1):159–188. https://doi.org/10.1146/
annurev-publhealth-031912-114404
SOE (2010) State of the environment report for Delhi. Ministry of Environment and Forests,
Government of Delhi, Delhi
USEPA (2009) Integrated science assessment for particulate matter. (No. EPA/600/R-08/139F).
United States Environment Protection Agency
World Health Organisation (2005) Air quality guidelines – global update 2005. Retrieved July 20,
2017, from http://www.who.int/phe/health_topics/outdoorair/outdoorair_aqg/en/
Hem H. Dholakia is a senior research associate with the Council on Energy, Environment and
Water, New Delhi. His research addresses the linkages between energy, environment, human
health and public policy in India. He was a recipient of the Young Scientist Summer Award (2012)
at the International Institute of Applied Systems Analysis (Austria). He has published six papers in
international peer-reviewed journals and three book chapters and coauthored a book. He holds a
PhD from IIMA and a master’s from Brighton University (UK).
Amit Garg is a professor with the Public Systems Group at the Indian Institute of Management
Ahmedabad. His research interests include the water-energy-agriculture nexus, energy plantation,
corporate accounting of greenhouse gases and vulnerability assessment and adaptation due to
climate change. He has worked on several research and consulting assignments for international
and Indian organizations. He has coauthored six books and 18 international research reports and
published extensively in international peer-reviewed journals. He has been a lead author of four
reports for UN’s Intergovernmental Panel on Climate Change. He holds a PhD from IIMA and a
master’s from IIT Roorkee.
288 H.H. Dholakia and A. Garg
Chapter 18
Climate Change and Air Pollution in Mumbai
S. Siva Raju and Khushboo Ahire
Abstract Climate change and global warming are potential threats to the existence
of living beings, and it is increasingly noticed in recent years. Consistent increase in
population growth and activities undertaken for furthering socio-economic devel-
opment, with the application of technologies, not only exhaust resources but also
pollute environment, thereby resulting in environmental degradation. Climate
change affects all sections of population and more to the vulnerable sections like
elderly and children. Amongst various adverse climatic conditions, air pollution is a
major one, as it affects health and wellbeing of the population. Epidemiological
studies in cities like Mumbai have revealed that with raised pollution levels, there
was an increased occurrence of dyspnoea, chronic and intermittent cough, frequent
colds, chronic bronchitis, cardiac disorders, high blood pressure and deaths due to
non-tuberculosis respiratory and ischaemic heart diseases. The city of Mumbai,
which is considered as a case study for the paper, is the capital city of Maharashtra
state. The Maharashtra Pollution Control Board (MPCB) is implementing various
environmental legislations in the state along with various other organisations which
are promoting good practices of afforestation, solid waste management and traffic
diversions of road ways to curtail the pollutants in the environment. To mention a
few, with the projects like Eastern Freeway, Santa Cruz-Chembur Link Road and
Andheri-Ghatkopar Link Road, it is expected that the connectivity of various areas
of the Mumbai city is well networked and these measures are greatly contributing to
combat air pollution in the region. To tackle further the issues related to environ-
mental degradation, it is important to act at individual level as well as collectively.
Hence, the city dwellers have a major role to play, in protecting the ecosystem of
the city, and to actively participate in anti-pollution measures. The paper focuses on
various aspects related to climate change scenario and its impacts, with a specific
reference to Mumbai by critically analysing various reports and secondary data on
climate change and air pollution issues.
S. Siva Raju (*)
Tata Institute of Social Sciences (TISS), Hyderabad Campus, Mumbai, India
e-mail: [email protected]
K. Ahire
School of Development Studies, Tata Institute of Social Sciences, Mumbai, India
e-mail: [email protected]
© Springer International Publishing AG 2018
R. Akhtar, C. Palagiano (eds.), Climate Change and Air Pollution,Springer Climate, DOI 10.1007/978-3-319-61346-8_18
289
Keywords Climate change • Ecological degradation • Air pollution •
Environmental risk factors • Epidemiology • Anti-pollution measures
Introduction
Climate change and global warming, two mounting issues, are potential threats to
the existence of living beings. Some impacts of climate change are melting water
from the glaciers, flash floods, inconsistent rainfall, sudden changes in atmospheric
temperature and extinction of endangered species. Through processes of rapid
industrialisation and urbanisation, human activities have led to adverse effects
like ‘greenhouse gas emissions’ and air pollution which, over the long term, have
contributed to the problem of climate change. Industrialisation and urbanisation
also have significance in contributing to the high growth rate of population, leading
to issues related to overcrowding and environmental pollution, especially in the
developing countries like India. Since urbanisation in most of the developing
countries is limited and concentrated to a few cities, the burden of population and
pressure on civic amenities is higher in such cities.
Mumbai, being the economic capital of India, has a wide range of income
opportunities to offer to populations across India. Against the background of
India striving to improve its economic growth rate through stimulating economic
activities, the trend of migration during the last 10 years is largest in Greater
Mumbai amongst urban agglomerations (UAs) (Census GoI 2011). The data related
to the proportion of in-migrants to that of total population amongst all the UAs
indicates that Greater Mumbai stands first, accommodating approximately 18.4
million in-migrants, followed by Delhi (16.3 millions) and Kolkata (14.1 millions).
Mumbai, which had witnessed 30.47% population growth during 1991–2001, has
slowed down to 12.05% during 2001–2011 (Census GoI 2011). Though majority of
the industries in Mumbai have transformed from manufacture sector to the service
sector, industrial pollution to a certain extent has been replaced by vehicular
pollution. Continuous vehicular activities in Mumbai have contributed significantly
in deteriorating the quality of air, causing various health issues. ‘Recording a slum
population of 77.55 percent and a Human Development Index of 0.05 in Deonar
region, 256 slum settlements and 13 large resettlement colonies in this ward are
reflective of the creation of a ghetto in global city’ (TISS 2015).
Industrial Development
Industrialisation is the process by which an economy is transformed from primarily
agricultural to one based on the manufacturing of goods. In this process, individual
manual labour is often replaced by mechanised mass production.
290 S. Siva Raju and K. Ahire
Historically, industrialisation has played a crucial role in developed countries
with its positive after effects of settled global trade that leads to long-term economic
growth. Various innovations that occurred during the industrial revolution as with
transport and manufacturing products created a global economy stimulating eco-
nomic growth in these countries. As a consequence of the transmission of global
trade, capital and population migration flows considerably to developing countries.
The development of first-world countries is largely due to factors like speed of
transmission of the industrial revolution, institutional readiness, developed capital-
ist institutions in factor markets and supportive economic and political institutions,
whereas, for developing countries, such factors of development are still in the
pipeline, and the main engine of growth is exports which varied across countries.
Natural resources are being extensively used for rapid industrialisation and to
fulfil the needs of growing populations that leads to the degradation of environment.
Environmental degradation is one of the most significant issues in the world
today. The United Nations International Strategy for Disaster Reduction (1999)
characterises environmental degradation as the lessening of the limit of the earth to
meet social and environmental destinations and needs.
Environmental degradation is the disintegration of the earth or deterioration of
the environment through mal-consumption of natural resources, for example, air,
water and soil, the destruction of environments and extinction of species of various
wildlife. It is characterised as any such aggravation to nature’s turf. Ecological
effect or degradation is caused by expanding human populace and their consistent
activities for socio-economic development with the application of technologies that
exhaust resources and pollute environment.
Causes of Environmental Degradation
Amongst several life species in the environment, some species require specific
areas to help procure food, living space and other resources. At the point when the
biome is divided, vast patches of living space do not exist anymore, which makes it
difficult for wildlife to get the assets they need in order to survive. As detailed out
by Rinkesh (2009), the environment goes on, even though the animals and plant life
are not there to help sustain it properly.
Land disturbance: Land damage is basic cause of environmental degradation.
Various foreign and obtrusive plant species, for instance, garlic mustard,
adversely impact due to rupture in environmental surroundings by growing
rapidly while eliminating the local greenery. Such invasive growth of species
limits the food assets and creates disturbances to other environmental life.
Pollution: Pollution, in whatever form, air, water, land or noise, is harmful. Airpollution causes health issues for the population. Water pollution degrades the
quality of water that we use for drinking purposes. Land pollution results in
degradation of the earth’s surface. Noise pollution arisen due to large sounds like
18 Climate Change and Air Pollution in Mumbai 291
honking of vehicles on a busy road or machines producing large noise in a
factory or a mill can cause irreparable damage to our ears when exposed
continuously.
Overpopulation: Rapid population growth, due to a decrease in the mortality rate
and increased lifespan, puts strain on natural resources and thereby results in
degradation of environment. More population simply means more demand for
basic needs – food, clothes and shelter – which all requires additional space and
resources. This results in deforestation which is another factor of environmental
degradation.
Landfills: Landfills pollute the environment and destroy the beauty of a city.
Landfills come due to the large amount of wastes that get generated by various
sources like households, industries, factories and hospitals. It poses a high risk tothe environment and to the people. Landfills produce foul smell when burned
and cause environmental degradation.
Deforestation: Rapid growth in population and urban sprawl are two major causes
of deforestation. Apart from that, the use of forest land for agriculture, animal
grazing and harvest for firewood and logging are some of the other causes of
deforestation. It contributes to a great extent to global warming as decreased
forest size puts carbon back into the environment.
Natural causes: Avalanches, quakes, tidal waves, storms and wildfires affect nearby
animal and plant groups. This can either come to fruition through physical
demolition as the result of a specific disaster or through the long-term degrada-
tion of assets by the introduction of an obtrusive foreign species to the
environment.
Of course, humans are not completely to blame. Earth itself causes ecological
issues. While environmental degradation is most normally connected with human
activities, the environment is always changing. With or without the effect of human
exercises, a few biological systems degrade to the point where they cannot support
the life that is supposed to live there.
Effects of Environmental Degradation
Human health may be impacted by environmental degradation. Fine particulate of
air pollution adversely affects human health and gives rise to various pulmonary
diseases such as pneumonia and asthma. A recent study by Arden and Douglas
(2012) shows that air pollution causes mortality, cardiovascular diseases and
chronic obstructive pulmonary diseases.
Many organisms are susceptible to the pollutants. Increased air pollution and
degradation of environment has implications on loss of biodiversity. Deforestation,
global warming, overpopulation and pollution are a few major causes for loss of
biodiversity.
292 S. Siva Raju and K. Ahire
Ozone layer is responsible for protecting earth from harmful UVB radiations.
The greenhouse gases like carbon monoxide, carbonyl sulphide, chlorofluorocar-
bons and other compounds in the atmosphere cause threats to the ozone layer and
living beings.
Environmental degradation can have a big economic impact also. The economic
impact can also be in terms of losses to tourism and other industries. Restoration of
green cover, cleaning up of landfills and protection of endangered species are some
of the measures essential for the holistic development of the country.
Climate Change and Its Effects
Climate change is increasingly noticed in recent years, and it is adversely affecting
the past climatic conditions of the earth. Just in the last 650,000 years, according to
NASA research, ‘there have been seven cycles of glacial advance and retreat, with
the abrupt end of the last ice age about 7000 years ago marking the beginning of the
modern climate era and of human civilisation’ (https://climate.nasa.gov/evidence/).
These changes started with the minute variations in the orbit of the earth while
having impacts on the solar energy. Scientific research, such as of NASA, have
inferred that the greenhouse gases and carbon dioxide have the ability to affect the
transfer of infrared energy through the atmosphere and the increasing amount of
such gases leads to global warming. Events of ice cores drawn from regions like
Greenland, Antarctica and tropical mountain glaciers are predicted to be earth’sclimate response to the raising greenhouse gas levels.
Climate change affects all sections of population and more to the vulnerable
sections like elderly and children. According to the UNICEF (2016), ‘children in
certain countries are at greater risk from the impacts of climate change; more than
600 million children live in the 10 countries that are most vulnerable to climate
change’. On the contrary, children are the least responsible for causing climate
change, and yet they are highly vulnerable to bear the significant impacts.
Similarly, for elderly, the adverse climatic conditions, especially effects of air
pollution, are not conducive for their health and wellbeing. According to Siva Raju
and Smita (2016), ‘an older person’s sensitivity and risk of injury or loss increases
in proportion to their level of physical and/or cognitive impairment, level of social
isolation and financial dependency’.They are also of the view that given a range of environmental exposures,
supporting older persons to maintain good health and be physically active is a
key strategy in building resilience to and reducing vulnerability to climate change.
18 Climate Change and Air Pollution in Mumbai 293
Air Pollution
Air pollution is ‘a contamination of the indoor or outdoor environment by any
chemical, physical or biological agent that modifies the natural characteristics of
the atmosphere’ (WHO 2016). Some of the common sources of air pollution include
household combustion devices, motor vehicles, industrial facilities and forest fires.
Harmful pollutants include particulate matter, carbon monoxide, ozone, nitrogen
dioxide and sulphur dioxide, which can cause respiratory and other diseases.
The concept of an Air Quality Index (AQI) has been developed and used
effectively in many developed countries. An AQI transforms weighted values of
individual air pollution-related parameters (SO2, CO, visibility, etc.) into a single
number or set of numbers (National Air Quality Index 2015). There have not been
significant efforts to develop and use AQI in India, primarily due to the absence of a
dedicated air quality assessing and monitoring programme until 1984 and lack of
public awareness about air pollution, till recently. The challenge of communicating
with the people in a comprehensible manner about air pollution has two dimen-
sions: (i) translate the complex scientific and medical information into simple and
precise knowledge and (ii) communicate with citizens in the historical, current and
futuristic senses. Addressing these challenges and thus developing an efficient and
comprehensible AQI scale is much needed in the present day context (Table 18.1).
Indian metropolitan cities remain exposed to high levels of air pollutants mainly
due to high vehicular movements and poor roads. Although the concentration of
these pollutants varies according to the traffic density, type of vehicles and time of
day, some people by virtue of their occupation are more exposed to high levels of
traffic-related air pollutants (TERI 2015). These people include filling station
workers, traffic policemen, professional drivers and toll-booth workers because of
the proximity and high emissions from vehicle idling, deceleration and accelera-
tion. In a recently conducted study on air quality monitoring (PM2.5, CO, NOX,
SO2 and EC/OC) at highway toll plazas, municipality toll plazas and control sites, it
was found that there was a high level of air pollution at almost all locations with
PM2.5 values exceeding the national permissible limit (60 μg/m3) except at a few
control sites. The study found that pollutant concentrations were highest at munic-
ipality toll plazas with minimum protective work areas. The observed reduction in
lung function indices was significant over years of occupational exposure even after
making adjustments for age, amongst non-smoking outdoor workers (CPCB 2015).
According to a World Bank study in India as cited in TERI (2015), in 2009,
about 1100 billion INR (1.7% of GDP) and more than 800 billion INR (1.3% of
GDP) were estimated as the annual cost of environment damage caused by ambient
air pollution and household air pollution, respectively, in India. This translates to
that about 52% of the relative share of damage cost by environment category was
due to ambient and household air pollution put together (World Bank 2013). Data
from the country’s apex environmental regulator, the Central Pollution Control
Board (CPCB), reveals that 77% of Indian urban agglomerations exceeded National
Ambient Air Quality Standard (NAAQS) for reparable suspended particulate matter
PM10 in 2010 (CPCB 2010). Estimates from the WHO suggest that 13 of the
294 S. Siva Raju and K. Ahire
20 cities in the world with the worst fine particulate PM2.5 air pollution are in India,
including Delhi, the worst-ranked city ranked 7th. Air pollution also leads to a
reduction in life expectancy. Using a combination of ground-level in situ measure-
ments and satellite-based remote sensing data, it has been estimated that 660 million
people, over half of India’s population or nearly every Indian (1204 million people
or 99.5% of the population), live in areas that exceed the Indian National Ambient
Air Quality Standard for fine particulate pollution. Reducing pollution in these
areas to achieve the standard would increase life expectancy for these Indians by
3.2 years on an average for a total of 2.1 billion life years (Greenstone et al. 2015).
Apart from there, studies around the world conclusively showed that air pollution
is a serious environmental risk factor that causes or aggravates acute and chronic
diseases in living beings. A study conducted in six cities of India, viz. Chennai,
Delhi, Hyderabad, Indore, Kolkata and Nagpur, by Ghosh and Mukherjee (2010),
has inferred that ‘an increase in ambient air pollution significantly increases child
morbidity, especially respiratory problems and high prevalence of allergy in them’.A study carried out by Awasthi et al. (1996) noticed a close relation of between
ambient air pollutants and respiratory symptoms complex (RSC) in preschool
children, of 1 month to 4.5 years.
A study by Sinha and Bandyopadhyay (1998) has tried to capture the metallic
constituents of aerosol present in biosphere, which have been identified as potential
health hazards to human beings. The study examined the concentration of Cd
(cadmium), Zn (zinc), Fe (iron), Pb (lead) and Cr (chromium) in ambient air of
Delhi, Mumbai, Calcutta and Chennai cities in India. The health survey conducted
in 1997–1998 by All India Institute of Medical Sciences (AIIMS), on individuals
residing in the residential areas of Delhi, revealed that the air pollution led to
irritation of the eyes (affecting about 44.4% of the subjects surveyed), cough
(28%) and respiratory problems (5.9%) (Kumar 1999).
Similarly, a study by the National Environmental Engineering Research Institute
(NEERI) revealed ‘open burning and landfill fires of municipal solid waste (MSW)’as being the major sources of air pollution in Mumbai (CPCB 2010). The survey
results show that about 2% of total generated MSW is burnt on the streets and slum
areas and 10% of the total generated MSW is burnt in landfills by management
authorities or due to accidental landfill fires, thereby emitting large amounts of CO,
PM, carcinogenic HC and NOX.
According to Sharma and Tiwari (2000), coastal cities like Mumbai are under-
going social, economic and political transition. They noted that ‘this is an
Table 18.1 India – AQI
category and rangeAQI category AQI range
Good 0–50
Satisfactory 51–100
Moderate 101–200
Poor 201–300
Very poor 301–400
Severe 4001–500
Source: National Air Quality Index (www.cpcb.nic.in)
18 Climate Change and Air Pollution in Mumbai 295
appropriate time to rejuvenate these cities and protect them from further deteriora-
tion; otherwise, they will lose their comparative advantages to newer cities which
have been more environmentally oriented’. Another factor that coastal cities likeMumbai needs attention is the policy of reclaiming land. Increasing reclamation for
accommodating population density is not only depleting the coastal biodiversity but
also threatening the existence of the city due to rise in sea water levels and the
consequential submergence and flooding.
Mukhopadhyay (2003) opines that some of the changes in population distribu-
tion are due to the Development Control Rules of Mumbai that were originally
formulated under the Bombay Town Planning Act of 1955. These rules have
undergone considerable modifications over time. For instance, changes in the FSI
in different parts of the city have affected population distribution. For example,
Chembur is an area where a cluster of sensitive installations like oil refineries, the
Bhabha Atomic Research Centre (BARC), a fertiliser plant and naval ammunition
depot had prompted the government to initially limit FSI to 0.5. However, this was
increased to 0.75 and later in 1998 to 1.00. It led to a spurt in conversion of
bungalows into high-rise apartments and consequent population growth, which
has close bearing on environmental pollution.
Rode Sanjay (2000) studied rising solid wastes in Mumbai Metropolitan Region.
Such rise in solid waste generation was also observed in Brihanmumbai, Thane,
Mira-Bhayander, Kalyan-Dombivali, Ulhasnagar, Navi Mumbai and Bhiwandi-
Nizampur Municipal Corporation. The study accentuated that due to urbanisation,
population increase, over-transportation and food habits, solid waste has been
increased tremendously. Inefficient solid waste management has resulted in signif-
icant rise in epidemics of the population residing in these areas. The study strongly
recommended for improved solid waste management system in the city.
Several epidemiological studies in Mumbai have revealed that with moderately
raised pollution levels, there was an increased occurrence of dyspnoea, chronic and
intermittent cough, frequent colds, chronic bronchitis and cardiac disorders, high
blood pressure and deaths due to non-tuberculosis respiratory and ischaemic heart
diseases (Kamat 2000). Another study in Mumbai, Parikh and Hadkar (2003), has
specifically highlighted the high health costs spent by patients on the treatment of
severe attacks related to air pollution. Greater emphasis therefore is required in
urban planning and infrastructure development.
Mumbai City: A Profile
Mumbai is a metropolitan city and has a population of 12,442,373 (Census 2011).
The annual growth rate of Municipal Corporation of Greater Mumbai was 1.90% in
census 2001, which has reduced to 0.38% by 2011.
296 S. Siva Raju and K. Ahire
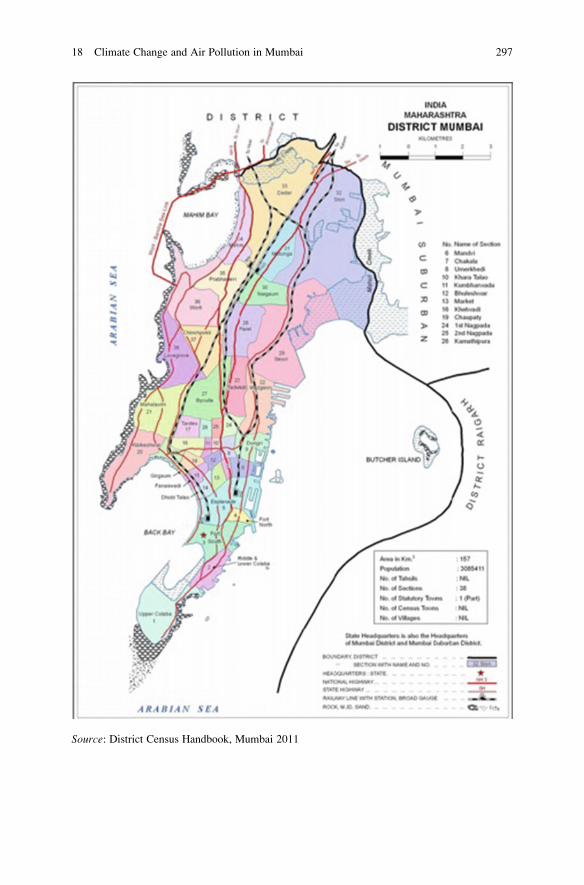
Source: District Census Handbook, Mumbai 2011
18 Climate Change and Air Pollution in Mumbai 297
The urban dynamics in Mumbai appears to be a mix of a perpetually expanding
global city, with new ideas, institutions and opportunities and persistent, emerging
and complex forms of poverty and widening deficits in human development (TISS
2015). The city pays highest income tax, as a commercial capital of the nation
(MCGM), and is home to 42% of population residing in slums (Census 2011).
Early development in Greater Mumbai revolved around the port and the mills to
its south. As the city grew, it expanded northwards along its twin suburban railway
networks, and till 1968, most of the growth in Mumbai Metropolitan Region
(MMR) was confined to Greater Mumbai. Post-1968, the suburbs in Greater
Mumbai grew along with areas surrounding Greater Mumbai, viz. Thane, Kalyan,
Mira-Bhayander, Vasai-Virar and Navi Mumbai. The suburban rail networks have
been crucial in this story of urban expansion. Since 1980, the MMR has been
witnessing a higher decadal growth rate than Greater Mumbai. The MMR added
3.44 million people in the last decade. However, the annual compound decadal
growth rate (2001–2011) of the MMR, which is 1.65%, is lower (2.79%) than the
previous decade (1991–2001). Within the MMR, the fastest-growing cities in the
last decade (2001–2011) are Navi Mumbai, Vasai-Virar, Mira-Bhayander and
Thane.
The Mumbai Metropolitan Region lies to the west of the Sahyadri hill range and
is part of the North Konkan region. It broadly lies between the rivers Tansa in the
north and Patalganga in the south. The southwestern boundary extends beyond the
Patalganga River and includes the town of Alibag and Pen. On the west, the MMR
is bounded by the Arabian Sea; on the southeast, it extends to the foothills of the
Sahyadris; and in the north-east, its extent is contiguous with the administrative
boundaries of Bhiwandi, Kalyan and Ambernath Tehsils. The geography of the
region is a significant determinant of urbanisation in MMR. The MMR is largely a
low land, though not plain. A series of north-south trending hill ridges bring
significant local elevational variation, though the average elevation of most areas
is below 100 m above sea level.
The significant geographical features of the region include hills, rivers, lowlands
and a long coastline, which in turn determine the nature of land uses prevalent in the
region. The MMR is typical of the Deccan basaltic terrain with flat-topped moun-
tains bordering a low-lying coastal region traversed by five rivers.
Mumbai City: Climate and Environmental Issues
The climate of MMR can be described as warm and humid. MMR receives ample
rainfall from the southwestern monsoons during the wet monsoon season between
June and September every year. The annual rainfall ranges between 180 and
248 cm. The monsoons are followed by three short cooler winter months between
December and February. The rest of the months are hot.
Temperature: Typically, January is the coldest month of the year with May being
the warmest, in accordance with the course of the sun. During the monsoons, the
298 S. Siva Raju and K. Ahire
temperature is nearly uniform at around 27 �C. In October, the temperature rises
before beginning to fall gradually reaching its minimum in January.
Wind: The normal seasonal prevailing wind direction during the dry season is
west-north-west except during the monsoons when it is southwest. During
December, the wind direction fluctuates between west-north-west and east-north-
east. There is considerable diurnal and seasonal variation though there is little
fluctuation in the velocity in the dry season. The winds are light and variable at
8 kmph during the dry season and reach a peak of around 13 kmph during the
monsoon. Southern parts of MMR have higher wind velocities at around 10 kmph
during the dry season peaking to about 25 kmph during the wet season. Squalls are
common during the monsoon and accompanied by gusty winds.
Monsoons: The southwestern monsoons generally arrive in the Mumbai area
during the second week of June and continue till late September. The average
rainfall in the region is over 2000 mm, with the coastal areas receiving much less
rain than the interior plains typically, though they receive the first onslaught of the
rains. Due to local topographical conditions, Matheran which is situated at 760 m
above MSL receives the highest rainfall in the region.
Climate variation: Though typically the climate of Mumbai and its surrounds are
termed as equable with no large seasonal fluctuations of temperature (due to the
proximity to the sea and the relatively large amount of humidity in the atmosphere),
over the years, however, with increasing urbanisation, there are variations in the
climate. Studies in the long-term trends of rainfall reveal a significant increase in
monsoon rains for Mumbai between 1901 and 2000, significant reduction in wind
speeds (59%) along with significant changes in frequencies of occurrence of
warmer days (maximum temperatures above certain threshold) and colder days
(minimum temperatures below certain threshold).
Private motorised transport, with an annual growth rate of 15.5%, is fast becom-
ing the most preferred mode for intra-city travels, primarily due to intolerable
crowding levels in suburban trains. Within Greater Mumbai, the proportion of
cars is the highest compared to Eastern Suburbs.
The traffic survey in Greater Mumbai shows high volumes of traffic exchanges,
along the connection to Vasai-Virar towards north and along connections towards
Navi Mumbai.
All the main arterial roads have a high percentage of private vehicle traffic (cars)
ranging 24–51% of total transport volume, whereas percentage of bus traffic is very
low. This is one of the major reasons for traffic congestion along the corridors.
Good vehicles ply highest on Sion Panvel Highway from and towards Navi Mumbai
(42% of total traffic volume) due to the presence of JNPT and other goods that are
handled in the area.
18 Climate Change and Air Pollution in Mumbai 299
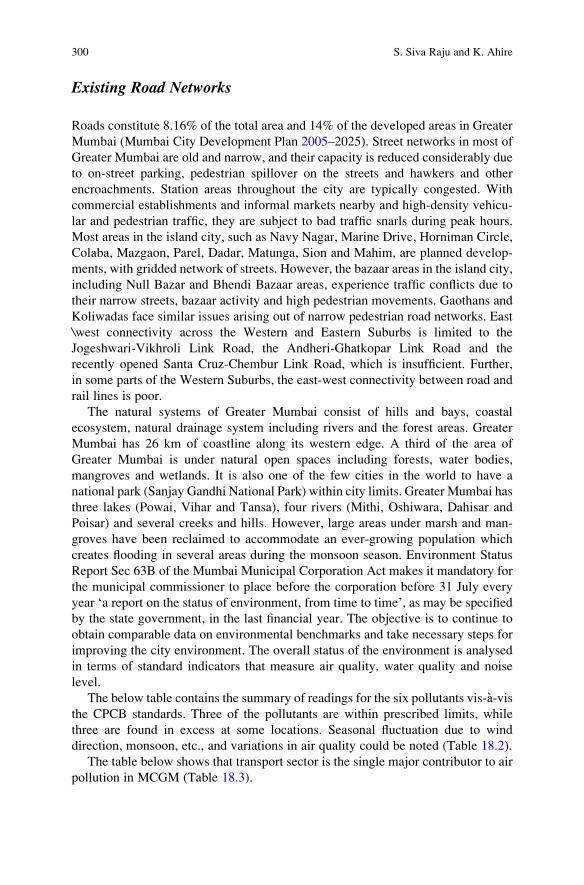
Existing Road Networks
Roads constitute 8.16% of the total area and 14% of the developed areas in Greater
Mumbai (Mumbai City Development Plan 2005–2025). Street networks in most of
Greater Mumbai are old and narrow, and their capacity is reduced considerably due
to on-street parking, pedestrian spillover on the streets and hawkers and other
encroachments. Station areas throughout the city are typically congested. With
commercial establishments and informal markets nearby and high-density vehicu-
lar and pedestrian traffic, they are subject to bad traffic snarls during peak hours.
Most areas in the island city, such as Navy Nagar, Marine Drive, Horniman Circle,
Colaba, Mazgaon, Parel, Dadar, Matunga, Sion and Mahim, are planned develop-
ments, with gridded network of streets. However, the bazaar areas in the island city,
including Null Bazar and Bhendi Bazaar areas, experience traffic conflicts due to
their narrow streets, bazaar activity and high pedestrian movements. Gaothans and
Koliwadas face similar issues arising out of narrow pedestrian road networks. East
\west connectivity across the Western and Eastern Suburbs is limited to the
Jogeshwari-Vikhroli Link Road, the Andheri-Ghatkopar Link Road and the
recently opened Santa Cruz-Chembur Link Road, which is insufficient. Further,
in some parts of the Western Suburbs, the east-west connectivity between road and
rail lines is poor.
The natural systems of Greater Mumbai consist of hills and bays, coastal
ecosystem, natural drainage system including rivers and the forest areas. Greater
Mumbai has 26 km of coastline along its western edge. A third of the area of
Greater Mumbai is under natural open spaces including forests, water bodies,
mangroves and wetlands. It is also one of the few cities in the world to have a
national park (Sanjay Gandhi National Park) within city limits. Greater Mumbai has
three lakes (Powai, Vihar and Tansa), four rivers (Mithi, Oshiwara, Dahisar and
Poisar) and several creeks and hills. However, large areas under marsh and man-
groves have been reclaimed to accommodate an ever-growing population which
creates flooding in several areas during the monsoon season. Environment Status
Report Sec 63B of the Mumbai Municipal Corporation Act makes it mandatory for
the municipal commissioner to place before the corporation before 31 July every
year ‘a report on the status of environment, from time to time’, as may be specified
by the state government, in the last financial year. The objective is to continue to
obtain comparable data on environmental benchmarks and take necessary steps for
improving the city environment. The overall status of the environment is analysed
in terms of standard indicators that measure air quality, water quality and noise
level.
The below table contains the summary of readings for the six pollutants vis-�a-visthe CPCB standards. Three of the pollutants are within prescribed limits, while
three are found in excess at some locations. Seasonal fluctuation due to wind
direction, monsoon, etc., and variations in air quality could be noted (Table 18.2).
The table below shows that transport sector is the single major contributor to air
pollution in MCGM (Table 18.3).
300 S. Siva Raju and K. Ahire
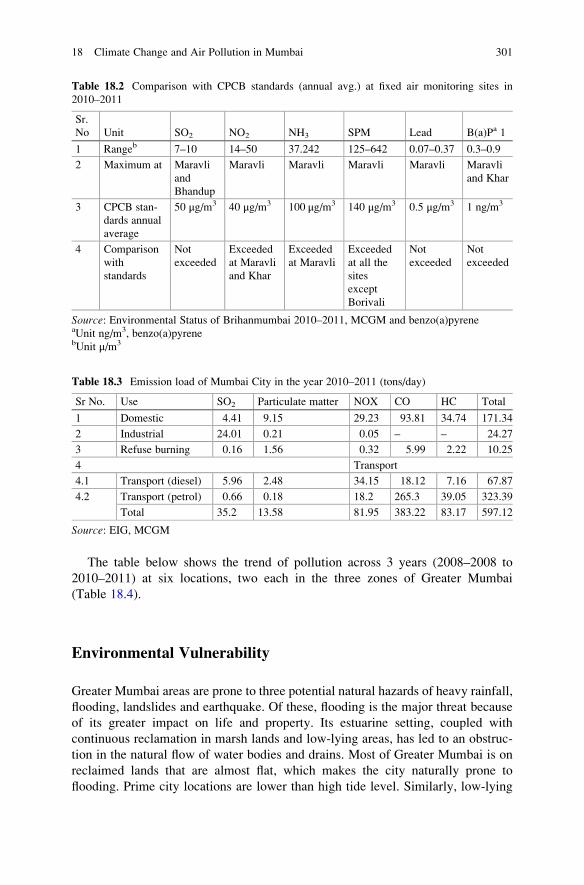
The table below shows the trend of pollution across 3 years (2008–2008 to
2010–2011) at six locations, two each in the three zones of Greater Mumbai
(Table 18.4).
Environmental Vulnerability
Greater Mumbai areas are prone to three potential natural hazards of heavy rainfall,
flooding, landslides and earthquake. Of these, flooding is the major threat because
of its greater impact on life and property. Its estuarine setting, coupled with
continuous reclamation in marsh lands and low-lying areas, has led to an obstruc-
tion in the natural flow of water bodies and drains. Most of Greater Mumbai is on
reclaimed lands that are almost flat, which makes the city naturally prone to
flooding. Prime city locations are lower than high tide level. Similarly, low-lying
Table 18.2 Comparison with CPCB standards (annual avg.) at fixed air monitoring sites in
2010–2011
Sr.
No Unit SO2 NO2 NH3 SPM Lead B(a)Pa 1
1 Rangeb 7–10 14–50 37.242 125–642 0.07–0.37 0.3–0.9
2 Maximum at Maravli
and
Bhandup
Maravli Maravli Maravli Maravli Maravli
and Khar
3 CPCB stan-
dards annual
average
50 μg/m3 40 μg/m3 100 μg/m3 140 μg/m3 0.5 μg/m3 1 ng/m3
4 Comparison
with
standards
Not
exceeded
Exceeded
at Maravli
and Khar
Exceeded
at Maravli
Exceeded
at all the
sites
except
Borivali
Not
exceeded
Not
exceeded
Source: Environmental Status of Brihanmumbai 2010–2011, MCGM and benzo(a)pyreneaUnit ng/m3, benzo(a)pyrenebUnit μ/m3
Table 18.3 Emission load of Mumbai City in the year 2010–2011 (tons/day)
Sr No. Use SO2 Particulate matter NOX CO HC Total
1 Domestic 4.41 9.15 29.23 93.81 34.74 171.34
2 Industrial 24.01 0.21 0.05 – – 24.27
3 Refuse burning 0.16 1.56 0.32 5.99 2.22 10.25
4 Transport
4.1 Transport (diesel) 5.96 2.48 34.15 18.12 7.16 67.87
4.2 Transport (petrol) 0.66 0.18 18.2 265.3 39.05 323.39
Total 35.2 13.58 81.95 383.22 83.17 597.12
Source: EIG, MCGM
18 Climate Change and Air Pollution in Mumbai 301
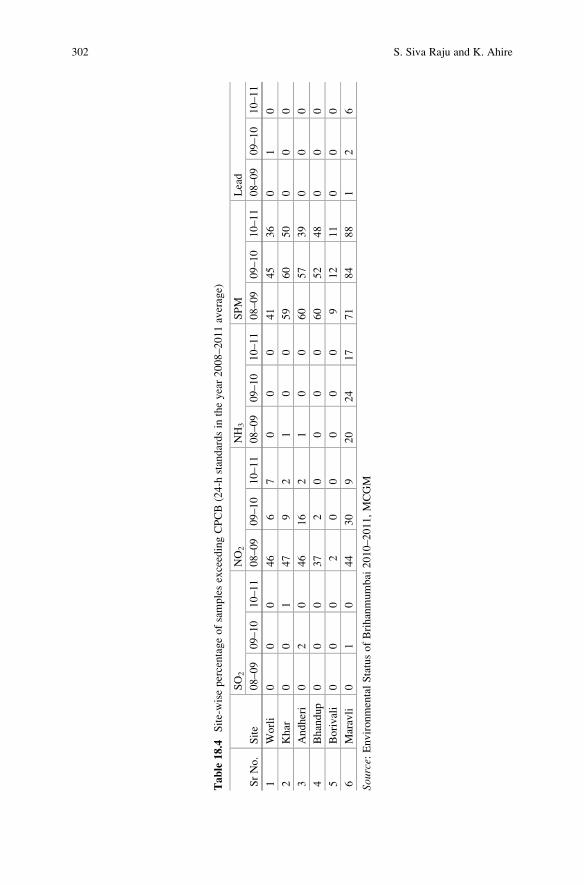
Table
18.4
Site-wisepercentageofsamplesexceedingCPCB(24-h
standardsin
theyear2008–2011average)
SrNo.
Site
SO2
NO2
NH3
SPM
Lead
08–09
09–10
10–11
08–09
09–10
10–11
08–09
09–10
10–11
08–09
09–10
10–11
08–09
09–10
10–11
1Worli
00
046
67
00
041
45
36
01
0
2Khar
00
147
92
10
059
60
50
00
0
3Andheri
02
046
16
21
00
60
57
39
00
0
4Bhandup
00
037
20
00
060
52
48
00
0
5Borivali
00
02
00
00
09
12
11
00
0
6Maravli
01
044
30
920
24
17
71
84
88
12
6
Sou
rce:
EnvironmentalStatusofBrihanmumbai
2010–2011,MCGM
302 S. Siva Raju and K. Ahire
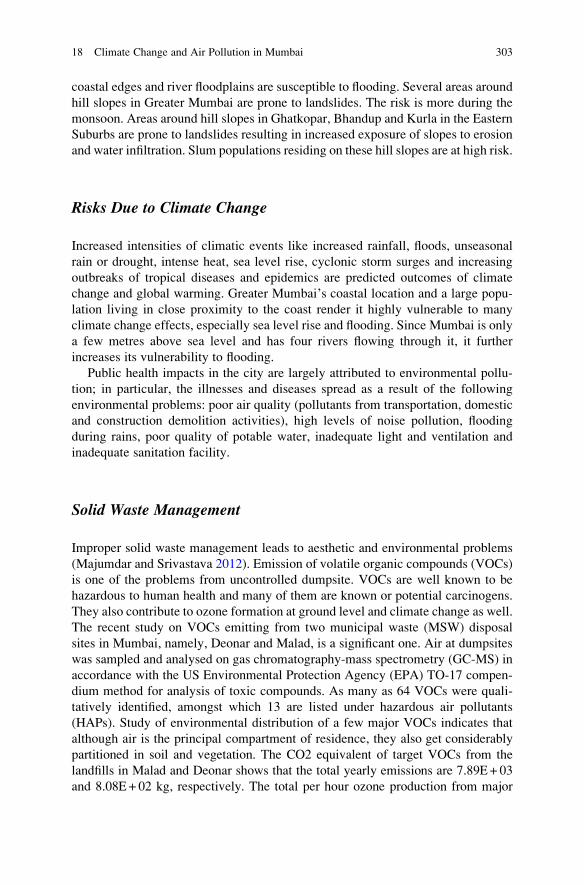
coastal edges and river floodplains are susceptible to flooding. Several areas around
hill slopes in Greater Mumbai are prone to landslides. The risk is more during the
monsoon. Areas around hill slopes in Ghatkopar, Bhandup and Kurla in the Eastern
Suburbs are prone to landslides resulting in increased exposure of slopes to erosion
and water infiltration. Slum populations residing on these hill slopes are at high risk.
Risks Due to Climate Change
Increased intensities of climatic events like increased rainfall, floods, unseasonal
rain or drought, intense heat, sea level rise, cyclonic storm surges and increasing
outbreaks of tropical diseases and epidemics are predicted outcomes of climate
change and global warming. Greater Mumbai’s coastal location and a large popu-
lation living in close proximity to the coast render it highly vulnerable to many
climate change effects, especially sea level rise and flooding. Since Mumbai is only
a few metres above sea level and has four rivers flowing through it, it further
increases its vulnerability to flooding.
Public health impacts in the city are largely attributed to environmental pollu-
tion; in particular, the illnesses and diseases spread as a result of the following
environmental problems: poor air quality (pollutants from transportation, domestic
and construction demolition activities), high levels of noise pollution, flooding
during rains, poor quality of potable water, inadequate light and ventilation and
inadequate sanitation facility.
Solid Waste Management
Improper solid waste management leads to aesthetic and environmental problems
(Majumdar and Srivastava 2012). Emission of volatile organic compounds (VOCs)
is one of the problems from uncontrolled dumpsite. VOCs are well known to be
hazardous to human health and many of them are known or potential carcinogens.
They also contribute to ozone formation at ground level and climate change as well.
The recent study on VOCs emitting from two municipal waste (MSW) disposal
sites in Mumbai, namely, Deonar and Malad, is a significant one. Air at dumpsites
was sampled and analysed on gas chromatography-mass spectrometry (GC-MS) in
accordance with the US Environmental Protection Agency (EPA) TO-17 compen-
dium method for analysis of toxic compounds. As many as 64 VOCs were quali-
tatively identified, amongst which 13 are listed under hazardous air pollutants
(HAPs). Study of environmental distribution of a few major VOCs indicates that
although air is the principal compartment of residence, they also get considerably
partitioned in soil and vegetation. The CO2 equivalent of target VOCs from the
landfills in Malad and Deonar shows that the total yearly emissions are 7.89E+ 03
and 8.08E+ 02 kg, respectively. The total per hour ozone production from major
18 Climate Change and Air Pollution in Mumbai 303
VOCswas found to be 5.34E-01 ppb in Deonar and 9.55E-02 ppb inMalad. The total
carcinogenic risk for the workers in the dumpsite considering all target HAPs are
calculated to be 275 persons in one million in Deonar and 139 persons in one million
in Malad.
State’s Efforts to Control Pollution
The Maharashtra Pollution Control Board (MPCB) is implementing various envi-
ronmental legislations in the state of Maharashtra, mainly including Water (Pre-
vention and Control of Pollution) Act, 1974; Air (Prevention and Control of
Pollution) Act, 1981; Water (Cess) Act, 1977; some of the provisions under
Environmental (Protection) Act, 1986; and the rules framed thereunder like Bio-
medical Waste (M&H) Rules, 1998; Hazardous Waste (M&H) Rules, 2000; Munic-
ipal Solid Waste Rules, 2000; and others. MPCB is functioning under the
administrative control of Environment Department of Government of Maharashtra.
Various organisations are promoting good practices to curtail the pollutants in
the environment and promoting the afforestation and solid waste management
practices. One of the best practices is to monitor the air pollution (see Table 18.5)
by the pollution control boards.
Efforts in Traffic Diversion
Though 2150 trains travel through the city, carrying millions of Mumbaikars to
their destinations, for 75 lakh odd commuters, ‘every day brings with it the
challenge of searching for foot-space in a train that cannot hold a pebble more’(Mumbai Metro Rail Corporation LTD (2016) Available at: https://www.mmrcl.
com/en/about-mmrc/know-your-metro).
Mumbai Metro Line-3 (MML-3) is one of such key projects to improve the
transportation scenario in Mumbai. MML-3 project – a 33.5-km-long corridor
running along Colaba-Bandra-SEEPZ – envisages to decongest the traffic situation
in the city. It aims to provide a Mass Rapid Transit System that would supplement
the inadequate suburban railway system of Mumbai by bringing metro closer to the
doorsteps of the people.
By 2021, it aspires to bring reduction in vehicle trips/day by 456,771 and
reduction in fuel consumptions – petrol and diesel – in litre/day by 243,390. The
average daily money savings due to reduction in number of vehicle trips would be
Rs. 158.14 lakhs, followed by 12,590 tonnes/year reduction in emission pollution
(Mumbai Metro Rail Corporation LTD 2016).
The monorail is an efficient feeder transit system benefiting commuters and will
offer efficient, safe, air-conditioned, comfortable and affordable public transport.
304 S. Siva Raju and K. Ahire
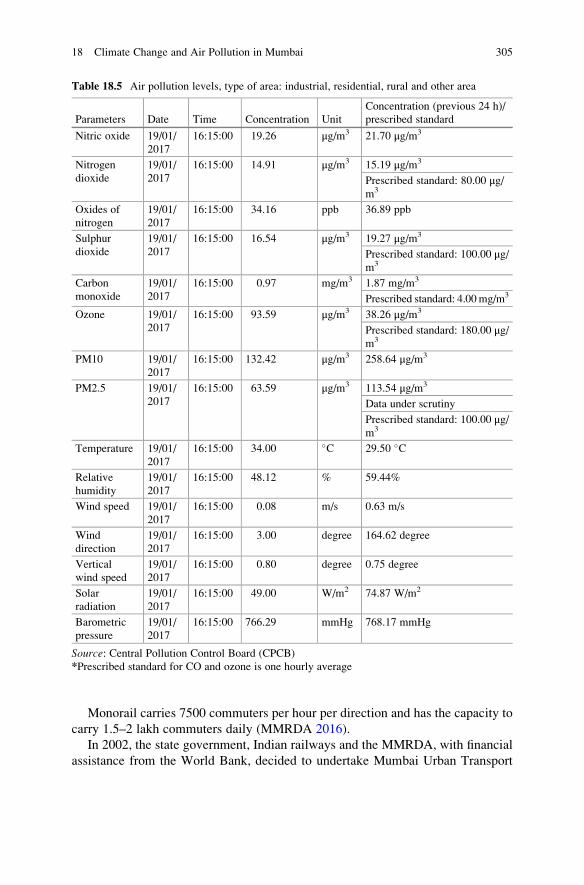
Monorail carries 7500 commuters per hour per direction and has the capacity to
carry 1.5–2 lakh commuters daily (MMRDA 2016).
In 2002, the state government, Indian railways and the MMRDA, with financial
assistance from the World Bank, decided to undertake Mumbai Urban Transport
Table 18.5 Air pollution levels, type of area: industrial, residential, rural and other area
Parameters Date Time Concentration Unit
Concentration (previous 24 h)/
prescribed standard
Nitric oxide 19/01/
2017
16:15:00 19.26 μg/m3 21.70 μg/m3
Nitrogen
dioxide
19/01/
2017
16:15:00 14.91 μg/m3 15.19 μg/m3
Prescribed standard: 80.00 μg/m3
Oxides of
nitrogen
19/01/
2017
16:15:00 34.16 ppb 36.89 ppb
Sulphur
dioxide
19/01/
2017
16:15:00 16.54 μg/m3 19.27 μg/m3
Prescribed standard: 100.00 μg/m3
Carbon
monoxide
19/01/
2017
16:15:00 0.97 mg/m3 1.87 mg/m3
Prescribed standard: 4.00mg/m3
Ozone 19/01/
2017
16:15:00 93.59 μg/m3 38.26 μg/m3
Prescribed standard: 180.00 μg/m3
PM10 19/01/
2017
16:15:00 132.42 μg/m3 258.64 μg/m3
PM2.5 19/01/
2017
16:15:00 63.59 μg/m3 113.54 μg/m3
Data under scrutiny
Prescribed standard: 100.00 μg/m3
Temperature 19/01/
2017
16:15:00 34.00 �C 29.50 �C
Relative
humidity
19/01/
2017
16:15:00 48.12 % 59.44%
Wind speed 19/01/
2017
16:15:00 0.08 m/s 0.63 m/s
Wind
direction
19/01/
2017
16:15:00 3.00 degree 164.62 degree
Vertical
wind speed
19/01/
2017
16:15:00 0.80 degree 0.75 degree
Solar
radiation
19/01/
2017
16:15:00 49.00 W/m2 74.87 W/m2
Barometric
pressure
19/01/
2017
16:15:00 766.29 mmHg 768.17 mmHg
Source: Central Pollution Control Board (CPCB)
*Prescribed standard for CO and ozone is one hourly average
18 Climate Change and Air Pollution in Mumbai 305
Project (MUTP) to find out long-term solution to city’s transport and communica-
tion issues.
Besides these, other projects (MMRDA 2016) are also initiated to manage the
vehicular traffic in the city.
– Eastern Freeway: This 16.8-km access-controlled freeway connects the Eastern
Expressway at Ghatkopar with South Mumbai at P D’Mello Road. A 13.59-km
stretch from Orange Gate on P D’Mello Road up to Panjarpol, near RK Studios
in Chembur, is operational, reducing travel time from 90 min to a mere 15 min.
– Santa Cruz-Chembur Link Road: The 6.5-km double-deck flyover has reduced
journey time from Santa Cruz to Chembur to 17 min.
– Andheri-Ghatkopar Link Road: The 7.9-km road connecting the Western
Express Highway in Andheri to Ghatkopar via Saki Naka and Asalpha is almost
fully operational.
– Sahar Elevated Access Road connecting to the international airport: This
2-km-long elevated road connects the Mumbai International Airport to the
Western Express Highway.
With these projects, it is expected that the connectivity of various areas of
Mumbai City is well networked and these measures greatly are contributing to
combat air pollution in the region.
Suggestive Measures
To tackle further the issues related to environmental degradation, it is important to
act at individual level as well as collectively. The idea of sustainable development
needs to be imbibed and reflected in every developmental scheme, policy and
project in the city. To specify a few such measures, the following needs emphasis:
For industries:
– Specific disincentives need to be imposed on the industries that use high-end
energy, add-on to the emissions and carbon footprints.
– Machineries with anti-pollution techniques that would have zero emission
effects need to be installed.
– Ensuring tall chimneys for the industries to avoid air pollution at the lower
atmosphere.
– Providing incentives for small and medium towns to develop in the industrial
sector. Necessary support of building the infrastructure like subsidised electric-
ity, water and transport needs to be provided to such towns.
– Restricting the already industrialised areas from further installation of new
industries to dilute the level of pollution.
– Tax holidays need to be facilitated.
– Separate space in the outskirts for recycling of the waste needs to be kept.
306 S. Siva Raju and K. Ahire
– Tying up with the organisations which have successfully combated the air
pollution.
Community level:
– Awareness programme on air pollution
– Promoting eco-friendly alternatives as a part of lifestyle
– Use of cycles and public transport as a green transport system for reducing
congestion and pollution levels
– Collective action for conserving environment
Above all, the city dwellers have a major role to play, individually and collec-
tively, in protecting the ecosystem of the city and to actively participate in anti-
pollution measures which can go a long way in sustainable development of the city.
Acknowledgements The authors would like to thank Dr. B. Anil and Ms. Maya Pillai for their
assistance in the preparation of the paper.
References
Arden Pope III C, Dockery DW (2012) Health effects of fine particulate air pollution: lines that
connect. J Air Waste Manage Assoc 56, 2006 – Issue 6
Awasthi S, Glick HA, Fletcher RH, Ahmed N (1996) Ambient air pollution and respiratory
symptoms complex in preschool children. Indian J Med Res 104:257–262
Bhagat RB, Jones GW (2013) Population change and migration in Mumbai metropolitan region:
implications for planning and governance 201:1–25
Census (2011) Office of the registrar general of India. New Delhi
CPCB (2010) Air quality assessment, emissions inventory and source apportionment studies:
Mumbai. Central Pollution Control Board. Available online at: http://cpcb.nic.in/Mumbai-
report.pdf
CPCB (2015) National Air Quality Index. Central Pollution Control Board, Ministry of Environ-
ment, Forests and Climate Change, New Delhi
Davidson CI, Phalen RF, Solomon PA (2005) Airborne particulate matter and human health: a
review. Aerosol Sci Technol 39(8):737–749. Available at: http://www.tandfonline.com/doi/
abs/10.1080/02786820500191348
Gandhe HD, Kumar A (2016) Efficient resource recovery options frommunicipal solid waste: case
study of Patna, India. Curr World Environ 11(1):72–76
Ghosh A, Mukherjee A (2010) Air pollution and child health in urban India. Indian Statistical
Institute, New Delhi
Greenstone M et al (2015) Lower pollution, longer lives: life expectancy gains if India reduced
particulate matter pollution. Econ Polit Wkly L(8)
Kamat SR (2000) Mumbai studies of urban air pollution and health resulting synergistic effects of
SPM, S02 and NO, International conference on environmental and occupational respiratory
diseases. Indian Toxicological Research Centre, Lucknow
Kumar R (1999) Effects of environmental pollution on the status of human health of Delhi
residents. All India Institute of Medical Sciences, New Delhi
Majumdar D, Srivastava A (2012) Volatile organic compound emissions from municipal
solid waste disposal sites: a case study of Mumbai, India. J Air Waste Manage Assoc
62(4):398–407. Available at: http://www.scopus.com/inward/record.url?eid=2-s2.0-
84862265338&partnerID=tZOtx3y1
18 Climate Change and Air Pollution in Mumbai 307
Mukhopadhyay T (2003) Urban commercial landscape- a case study of Mumbai. The City 1
(4):39–43
Mumbai City Development Plan 2005–2025. Available at: http://www.mcgm.gov.in/irj/
go/km/docs/documents/MCGM%20Department%20List/City%20Engineer/Deputy%20City
%20Engineer%20(Planning%20and%20Design)/City%20Development%20Plan/Vision%20
Statement.pdf
Mumbai Metropolitan Region Development Authority (2016) Draft Mumbai metropolitan
regional plan report 2016–2036. Available online at: https://mmrda.maharashtra.gov.in/
regional-plan
NASA Global Climate Change. Available at: https://climate.nasa.gov/evidence/
Parikh JK, Hadker N (2003) Economic impacts of urban air pollution: valuation for Mumbai,
India. Int J Environ Pollut 19:498–515
Rode Sanjay (2000) Waste Management in Municipal Corporation of Mumbai Metropolitan
Region
Sharma VK, Tiwari P (2000) Environmental problems of coastal areas in India. Bookwell, Delhi,
p 48
Sinha S, Bandhopadhyay TK (1998) Review of trace elements in air environment and its health
impact in some Indian cities. J IPHE, India 1:35–48
Siva Raju S, Smita B (2016) Climate change and its vulnerability for the elderly in India. In:
Akhtar R (ed) Climate change and human health scenario in south and Southeast Asia.
Springer, New Delhi
Tata Institute of Social Sciences (TISS) (2015) Social economic conditions and vulnerabilities.
A report of the baseline survey of M(East) ward, Mumbai. Available at: urk.tiss.edu/images/
pdf/M-Ward-Report
TERI (2015) Air pollution and health. Discussion paper by The Energy and Resources Institute:
New Delhi
United Nations Children’s Fund, 2016. Available at: https://www.unicef.org/environment/index_
60332.html
United Nations International Strategy for Disaster Reduction (UNISDR) (1999) Available at:
http://www.unisdr.org/who-we-are/mandate
World Bank (2013) World development indicators. World Bank, Washington, DC
World Health Organisation (2016) Health topics: air pollution. Available at: http://www.who.int/
topics/air_pollution/en/
S. Siva Raju is deputy director, Tata Institute of Social Sciences (Hyderabad Campus). His broad
fields of interest for research projects are ageing, health and development. He has directed many
research projects in these areas. He is a member of the Committee on Protection andWelfare of the
Elderly Persons for the National Human Rights Commission; Expert Committee member on
Ageing, Ministry of Social Justice and Empowerment; honorary director of International Longev-
ity Centre, Pune; advisor to the Ministry of Social Security, Govt. of Mauritius; and a coordinator
of the UNFPA Initiative on Building Knowledge Base on Population Ageing in India.
Khushboo Ahire is research scholar at the School of Development Studies, Tata Institute of Social
Sciences, Mumbai, India. Currently, she is associated in a UNFPA sponsored project on Building
Knowledge Base on Population Ageing in India as Project Officer. She is pursuing her research in
the area of intergenerational bonds and quality of life of the elderly. Her research areas mainly
include population ageing, environment and sustainability, corporate social responsibility (CSR),
human development and research methodology. She has participated in various national and
international conferences, workshops and seminars focusing on various social issues. She has to
her credit publications in the areas of climate change and air pollution, wellbeing of the elderly and
social impacts of CSR projects in the area. Khushboo has considerable experience in conducting
social research projects.
308 S. Siva Raju and K. Ahire
Chapter 19
Climate Change and Air Pollution in East Asia:Taking Transboundary Air Pollution intoAccount
Ken Yamashita and Yasushi Honda
Abstract Co-benefit and co-control of SLCPs is the key concept to tackle simul-
taneously with problems of transboundary air pollution and climate change. Espe-
cially in East Asia, severe air pollution causing millions of premature mortality by
PM2.5 and ozone should be solved without delay as well as mitigation of global
warming. Cost-benefit approach discussed in this chapter is one of the most
effective and rational way to lead the feasible and appropriate policy for the
challenge we need to do.
Keywords Risk assessment • Transboundary air pollution • Co-benefit/co-
control • Human health • SLCPs
Introduction
The atmospheric environment is the critical issue in many regions of the world. The
air pollution problems need to be assessed both in global and local scale due to its
transboundary transportation and local effects. Hemispheric air pollution of ozone
by intercontinental transportation, globally spread aerosols, and enormous nitrogen
oxide emission from Asia is threatening human health, ecosystem, and also climate
change (Akimoto 2003), and regional frameworks have been approaching the
problems. In Europe, the atmospheric management has been tackled through the
framework of the 1979 Convention on Long-Range Transboundary Air Pollution
(CLRTAP) and European Union (EU) air pollution policy (Schroeder and Yocum
2006). Those regal institutions have the significant interlinkage between interna-
tional, national, and local level. In Asia, the 2002 Agreement on Transboundary
K. Yamashita (*)
Data Management Department, Asia Center for Air Pollution Research (ACAP), 1182 Sowa,
Nishi-ku, Niigata-shi 950-2144, Japan
e-mail: [email protected]
Y. Honda
Faculty of Health and Sport Sciences, University of Tsukuba, 1-1-1 Tennodai, Tsukuba
305-8577, Ibaraki, Japan
© Springer International Publishing AG 2018
R. Akhtar, C. Palagiano (eds.), Climate Change and Air Pollution,Springer Climate, DOI 10.1007/978-3-319-61346-8_19
309
Haze Pollution (Haze Agreement) by the Association of Southeast Asian Nations
(ASEAN), Acid Deposition Monitoring Network in East Asia (EANET) which
started in 1998, and Male Declaration on Control and Prevention of Air Pollution
and Its Likely Transboundary Effects for South Asia (Male Declaration) which
began in 1998 are the regimes for transboundary air pollution (Bergin et al. 2005).
Haze Agreement is only for haze pollution from large and uncontrolled forest fire
though it is the regal regime; EANET and Male Declaration are non-regal regime
and have limited activity scope. Recently co-benefit or co-control is the key concept
to assess the air pollution and global warming problems simultaneously in terms of
effective and efficient approach. Ozone and black carbon (BC) are called as short-
lived climate pollutants (SLCPs) which cause global warming in relatively short
time scale comparing with long-lived greenhouse gases (LLGHG) such as carbon
dioxides (CO2). The reduction of emission of SLCPs by 2050 as well as the
mitigation of emission of LLGHG is indispensable for addressing near-term climate
change and to keep the increase of the temperature within 2 �C in this century
(UNEP 2011). The Climate and Clean Air Coalition (CCAC) was established in
2014 by governments, civil society, and private sectors to cope with this issue in the
Asia and Pacific region, and the Asia Pacific Clean Air Partnership (APCAP) was
also launched in 2014 by the United Nations Environmental Program (UNEP) in
cooperation with governments and partners to tackle with air pollution problems in
the region. We discuss here the adverse effect on human health by air pollution,
especially transboundary air pollution of PM2.5 and ozone in East Asia, and cost-
benefit analysis of its control and related global warming issues on the health effects
in terms of co-benefit/co-control approach. We then hope to provide the scientific
evidence and suggestion for better achieving clean atmospheric environment.
Transboundary Air Pollution in East Asia
In East Asian region, air pollution problems are still big issue to be solved
immediately in both of developed and developing countries. Due to continuing
rapid economic growth and consequent enormous emission of air pollutants which
are transported over countries (transboundary air pollution), the high concentration
in atmospheric environment of nitrogen oxides (NOx), the sulfur oxides (SO2), and
the carbon monoxide (CO) is observed especially in megacities. Aerosol loadings
and tropospheric ozone also has been increasing in past decades in Asia. The
secondary particulate matter formed by air pollutant gases and aerosols through
physical reaction as well as primary aerosol is closely associated with human
activities, and emissions inside East Asia have the largest influence on East Asian
ozone itself with 60% of East Asian surface ozone (TFRC 2015). Recently, ozone
and fine particle (PM2.5) which are typical transboundary air pollutants are focused
on not only their adverse effect on human health such as respiratory and cardiac
diseases but also their character as SLCPs. So in order to address regional air
pollution and subsidiary global warming in East Asia, it is necessary to analyze
310 K. Yamashita and Y. Honda
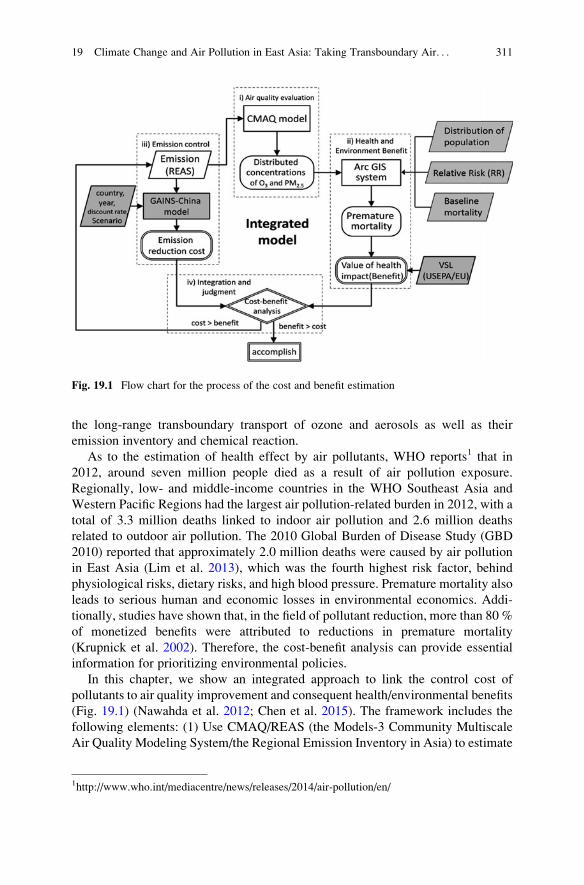
the long-range transboundary transport of ozone and aerosols as well as their
emission inventory and chemical reaction.
As to the estimation of health effect by air pollutants, WHO reports1 that in
2012, around seven million people died as a result of air pollution exposure.
Regionally, low- and middle-income countries in the WHO Southeast Asia and
Western Pacific Regions had the largest air pollution-related burden in 2012, with a
total of 3.3 million deaths linked to indoor air pollution and 2.6 million deaths
related to outdoor air pollution. The 2010 Global Burden of Disease Study (GBD
2010) reported that approximately 2.0 million deaths were caused by air pollution
in East Asia (Lim et al. 2013), which was the fourth highest risk factor, behind
physiological risks, dietary risks, and high blood pressure. Premature mortality also
leads to serious human and economic losses in environmental economics. Addi-
tionally, studies have shown that, in the field of pollutant reduction, more than 80 %
of monetized benefits were attributed to reductions in premature mortality
(Krupnick et al. 2002). Therefore, the cost-benefit analysis can provide essential
information for prioritizing environmental policies.
In this chapter, we show an integrated approach to link the control cost of
pollutants to air quality improvement and consequent health/environmental benefits
(Fig. 19.1) (Nawahda et al. 2012; Chen et al. 2015). The framework includes the
following elements: (1) Use CMAQ/REAS (the Models-3 Community Multiscale
Air Quality Modeling System/the Regional Emission Inventory in Asia) to estimate
1http://www.who.int/mediacentre/news/releases/2014/air-pollution/en/
Fig. 19.1 Flow chart for the process of the cost and benefit estimation
19 Climate Change and Air Pollution in East Asia: Taking Transboundary Air. . . 311
the emission and distributed concentration of ozone and PM2.5 in East Asia;
(2) a. evaluate premature mortalities in East Asia using the concentration-reaction
function through geographic information system (GIS) and b. assess the benefit of
saving lives based on value of statistical life (VSL); (3) use GAINS-China model
(Amann et al. 2011) to evaluate the cost of reducing pollutant emissions; and
(4) compare costs and benefits. If the benefit is larger than the cost, the emission-
control scenario is beneficial for the welfare of society; otherwise the scenario is
inefficient, and we need to either use new ozone and PM2.5 emission scenarios or
new technology of GAINS model.
Health Effects by Air Pollution (Ozone and PM2.5)
Regional Chemical Transport Model and Emission Inventory
In this section, we show the health effects by air pollution: PM2.5 and ozone in East
Asia. The CMAQ/REAS modeling system is used to simulate the spatial distribu-
tions and temporal variations of PM2.5 components and ozone in the East Asian
region. The ozone and PM2.5 concentrations were simulated by Uno et al. (2005)
and Kurokawa et al. (2009) for the years 2000 and 2005 and by Yamaji et al. (2006,
2008) for the year 2020 scenarios using the three-dimensional regional-scale
chemical transport model, based on the CMAQ ver. 4.4. This model is driven by
the meteorological field simulated by the Regional Atmospheric Modeling System
(RAMS) ver. 4.3 (for the year 2020) and ver. 4.4 (for the years 2000–2005). The
grid resolution is 80� 80 km, 14 layers for 23 km in the sigma-z coordinate system,
and the height of the first layer is 150 m.
The CMAQ modeling system is coupled with REAS, which includes the fol-
lowing emissions: SO2, NOx, CO, NMVOC, black carbon (BC), and organic carbon
(OC) from fuel combustion and industrial sources. REAS has three scenarios for
China in 2020: PSC (policy success case), REF (reference case), and PFC (policy
failure case). Regarding the emission of NOx, in the 2020 PSC scenario, the NOx
emissions in China will have a slight decrease of 1% from 2000 to 2020. In the 2020
REF scenario, NOx emissions in China (15.6 Tg) will increase by 40% from 2000
(11.2 Tg). In the 2020 PFC scenario, NOx emissions emitted in China will increase
by 128% from 2000. Regarding the emission of NMVOC, in the 2020 PSC
scenario, the NMVOC emissions emitted in China will have a large increase of
97% from 2000. In the 2020 REF scenario, NMVOC emissions in China (35.1 Tg)
will increase rapidly by 128% from 2000 (14.7 Tg). In the 2020 PFC scenario,
NMVOC emissions in China will increase by 163% from 2000 (Ohara et al. 2007).
The spatial distributions and annual variations of the annual mean PM2.5 concen-
trations are calculated based on the annual mean concentrations of the following
components: EC, OC, NO3�, SO4
2�, and NH4+.
Though it is the best way to use the results of monitoring to estimate the amount
of exposure by air pollutants, we usually use the results of the Regional Chemical
312 K. Yamashita and Y. Honda
Transport Model (RCTM) such as CMAQ because the monitoring sites in East Asia
are not deployed enough to cover the area concerned. The estimated exposure by
RCTM, however, has some uncertainty. A study indicated the example of the
uncertainty which has different results (premature mortality) by 2.5 times between
using monitoring data and output of RCTM (Nawahda et al. 2013).
PM2.5: Exposure and Premature Mortality Analysis
The distributed annual premature mortality rate in each grid cell is calculated as
follows using Eq. 19.1 for PM2.5 mean annual concentrations above 10 μgm�3 for
the age group of 30 years and above:
mortalityPM2:5ði, j, tÞ ¼ popði, j, tÞMbði, j, tÞβPM2:5△PM2:5ði, j, tÞ ð19:1Þβ ¼ ln RRð Þ=△CPM2:5 ð19:2Þ
where mortality indicates premature mortality, i,j specify the location of a grid cell
within the simulation domain, t is the year of simulation, pop is the exposed
population, Mb is the annual baseline mortality, β is the PM2.5 CR coefficient,
which can be calculated using Eq. (19.2), and △C is the change in concentration.
According to Pope III et al. (2002), an increase of 10 μgm�3 annual average of
PM2.5, within a range from around 7.5 to 30 μgm�3, caused a 4% (95% confidence
interval: 1.01–1.08) increase in mortality rate for the age group of 30 years and
above. This gives β a value around 0.004 and △PM2.5 (i,j,t) is the change in the
annual mean concentrations above 10 μgm�3. We use the same β value also for
mean annual concentrations above 30 μgm�3 similar to Cohen et al. (2005); they
linearly extrapolated the PM2.5 CR function to cover a wider range from 0 to
90 μgm�3.
Ozone: Exposure and Premature Mortality Analysis
The distributed annual premature mortality rate based on a RR value of 1.003 (95%
confidence interval (CI): 1.001–1.004) [0.3% increase in daily premature mortality
caused by a 10 μgm�3 (~5 ppb) change in 8-h maximum mean concentration above
70 μgm�3 (~35 ppb)] at each grid cell is calculated by summing the daily premature
mortality, which can be calculated using the following function (US-EPA 2006):
mortalityO3 i; j; nð Þ ¼ Yo i; j; nð Þ 1� exp �βO3ΔO3 i; j; nð Þ½ �f g ð19:3Þ
where n is the calculation day and Yo is the daily incidence of premature mortality at
a certain ozone level where there is no clear health effect likely to occur. We
19 Climate Change and Air Pollution in East Asia: Taking Transboundary Air. . . 313
estimate it in our study by multiplying the population of the age group of 30 years
and above by the daily baseline mortality for this age group. β is estimated using
Eq. (19.2) based on a RR value of 1.003, which gives β a value around 0.0003. ΔO3
is the change in ozone concentration calculated based on the daily maximum 8-h
mean concentrations above 35 ppb (or the value of the SOMO35 index of the day n)as follows:
SOMO35 i; j; nð Þ ¼ max 8 h mean� 35½ �n ð19:4Þ
The daily maximum 8-h mean concentration is the highest moving 8 h average to
occur from 0:00 h to 23:00 h in a day.
Population Distribution
We obtain the population distribution in East Asia from the Gridded Population of
the World (GPWv3) (CIESIN 2005); the size of the population grid cell is around
0.04167 degree. The total population within the simulation domain was about
(1970) million in 2000 and (2057) million in 2005. In this study, we estimate the
premature mortality rate for the age group of 30 years and above, which includes
most of the working age groups in East Asia (WHO 2010a, b). According to the
United Nations Department of Economic and Social Affairs/Population Division
(2008), the fractions of population in East Asia that were 30 years and above for the
years 2000 and 2005 were 51% and 55%, respectively. The distributed population
for the year 2020 is estimated based on the population projections for the year 2015
by GPWv3 and the estimated growth rate of 0.42% in East Asia for the period from
2015 to 2020 by the United Nations Department of Economic and Social Affairs/
Population Division (2008). However, there is no information about age-specific
mortality rates for most of the countries in East Asia. Therefore, we estimate the
baseline mortality for the age group of 30 years and above based on the WHO
mortality database (WHO 2006) as shown in Table 19.1.
Premature Mortality
The premature mortality caused by exposure to both ozone and PM2.5 in East Asia
for the years 2000, 2005, and 2020 (PSC, REF, PFC) are estimated to be about
(316), (520), (451), (649), and (1035) thousand, respectively (Nawahda et al. 2012).
The estimated premature mortality of each country, caused by exposure to PM2.5
annual mean concentrations above 10 μgm�3 and the daily maximum 8-h mean
concentrations of ozone which are above 35 ppb for the age group of 30 years and
above in East Asia for the years 2000, 2005, and 2020, is shown in Fig. 19.2.
314 K. Yamashita and Y. Honda
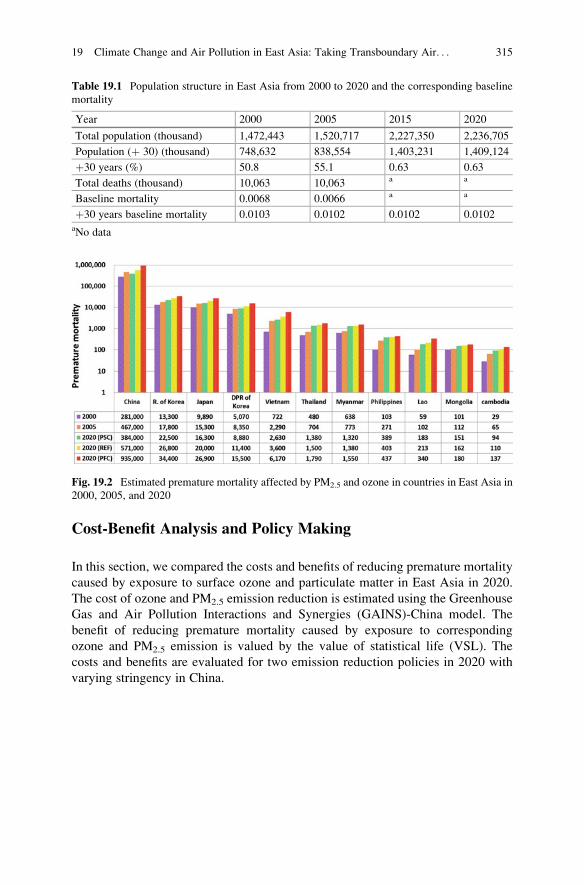
Cost-Benefit Analysis and Policy Making
In this section, we compared the costs and benefits of reducing premature mortality
caused by exposure to surface ozone and particulate matter in East Asia in 2020.
The cost of ozone and PM2.5 emission reduction is estimated using the Greenhouse
Gas and Air Pollution Interactions and Synergies (GAINS)-China model. The
benefit of reducing premature mortality caused by exposure to corresponding
ozone and PM2.5 emission is valued by the value of statistical life (VSL). The
costs and benefits are evaluated for two emission reduction policies in 2020 with
varying stringency in China.
Table 19.1 Population structure in East Asia from 2000 to 2020 and the corresponding baseline
mortality
Year 2000 2005 2015 2020
Total population (thousand) 1,472,443 1,520,717 2,227,350 2,236,705
Population (þ 30) (thousand) 748,632 838,554 1,403,231 1,409,124
þ30 years (%) 50.8 55.1 0.63 0.63
Total deaths (thousand) 10,063 10,063 a a
Baseline mortality 0.0068 0.0066 a a
þ30 years baseline mortality 0.0103 0.0102 0.0102 0.0102aNo data
Fig. 19.2 Estimated premature mortality affected by PM2.5 and ozone in countries in East Asia in
2000, 2005, and 2020
19 Climate Change and Air Pollution in East Asia: Taking Transboundary Air. . . 315
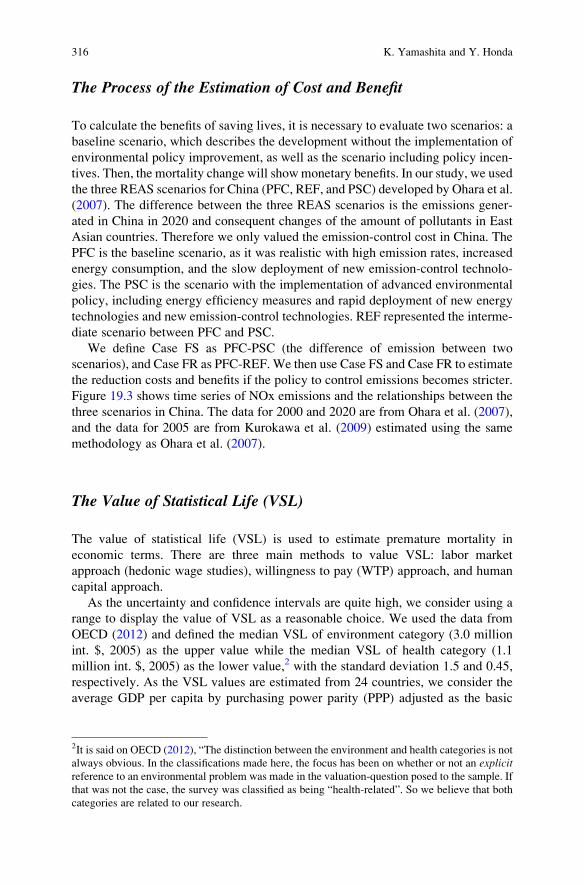
The Process of the Estimation of Cost and Benefit
To calculate the benefits of saving lives, it is necessary to evaluate two scenarios: a
baseline scenario, which describes the development without the implementation of
environmental policy improvement, as well as the scenario including policy incen-
tives. Then, the mortality change will showmonetary benefits. In our study, we used
the three REAS scenarios for China (PFC, REF, and PSC) developed by Ohara et al.
(2007). The difference between the three REAS scenarios is the emissions gener-
ated in China in 2020 and consequent changes of the amount of pollutants in East
Asian countries. Therefore we only valued the emission-control cost in China. The
PFC is the baseline scenario, as it was realistic with high emission rates, increased
energy consumption, and the slow deployment of new emission-control technolo-
gies. The PSC is the scenario with the implementation of advanced environmental
policy, including energy efficiency measures and rapid deployment of new energy
technologies and new emission-control technologies. REF represented the interme-
diate scenario between PFC and PSC.
We define Case FS as PFC-PSC (the difference of emission between two
scenarios), and Case FR as PFC-REF.We then use Case FS and Case FR to estimate
the reduction costs and benefits if the policy to control emissions becomes stricter.
Figure 19.3 shows time series of NOx emissions and the relationships between the
three scenarios in China. The data for 2000 and 2020 are from Ohara et al. (2007),
and the data for 2005 are from Kurokawa et al. (2009) estimated using the same
methodology as Ohara et al. (2007).
The Value of Statistical Life (VSL)
The value of statistical life (VSL) is used to estimate premature mortality in
economic terms. There are three main methods to value VSL: labor market
approach (hedonic wage studies), willingness to pay (WTP) approach, and human
capital approach.
As the uncertainty and confidence intervals are quite high, we consider using a
range to display the value of VSL as a reasonable choice. We used the data from
OECD (2012) and defined the median VSL of environment category (3.0 million
int. $, 2005) as the upper value while the median VSL of health category (1.1
million int. $, 2005) as the lower value,2 with the standard deviation 1.5 and 0.45,
respectively. As the VSL values are estimated from 24 countries, we consider the
average GDP per capita by purchasing power parity (PPP) adjusted as the basic
2It is said on OECD (2012), “The distinction between the environment and health categories is not
always obvious. In the classifications made here, the focus has been on whether or not an explicitreference to an environmental problem was made in the valuation-question posed to the sample. If
that was not the case, the survey was classified as being “health-related”. So we believe that both
categories are related to our research.
316 K. Yamashita and Y. Honda
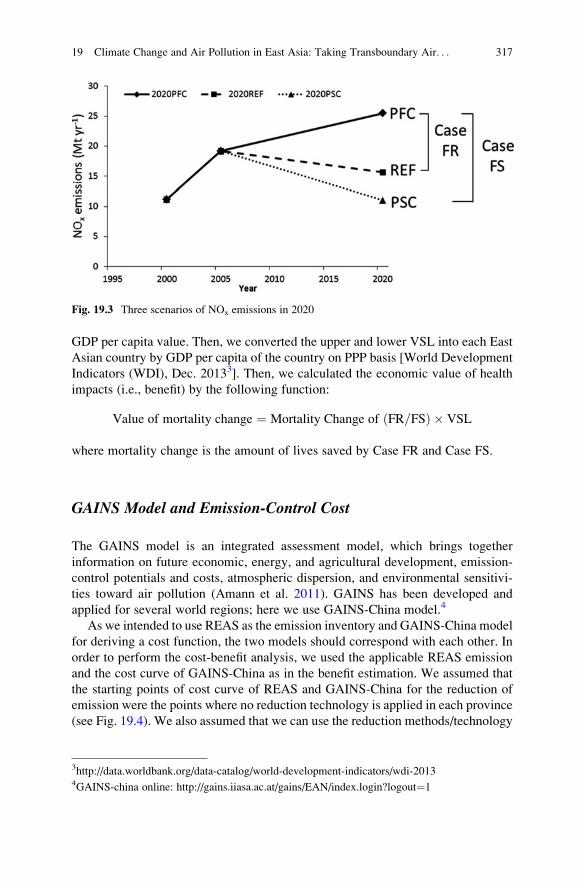
GDP per capita value. Then, we converted the upper and lower VSL into each East
Asian country by GDP per capita of the country on PPP basis [World Development
Indicators (WDI), Dec. 20133]. Then, we calculated the economic value of health
impacts (i.e., benefit) by the following function:
Value of mortality change ¼ Mortality Change of ðFR=FSÞ � VSL
where mortality change is the amount of lives saved by Case FR and Case FS.
GAINS Model and Emission-Control Cost
The GAINS model is an integrated assessment model, which brings together
information on future economic, energy, and agricultural development, emission-
control potentials and costs, atmospheric dispersion, and environmental sensitivi-
ties toward air pollution (Amann et al. 2011). GAINS has been developed and
applied for several world regions; here we use GAINS-China model.4
As we intended to use REAS as the emission inventory and GAINS-China model
for deriving a cost function, the two models should correspond with each other. In
order to perform the cost-benefit analysis, we used the applicable REAS emission
and the cost curve of GAINS-China as in the benefit estimation. We assumed that
the starting points of cost curve of REAS and GAINS-China for the reduction of
emission were the points where no reduction technology is applied in each province
(see Fig. 19.4). We also assumed that we can use the reduction methods/technology
Fig. 19.3 Three scenarios of NOx emissions in 2020
3http://data.worldbank.org/data-catalog/world-development-indicators/wdi-20134GAINS-china online: http://gains.iiasa.ac.at/gains/EAN/index.login?logout¼1
19 Climate Change and Air Pollution in East Asia: Taking Transboundary Air. . . 317
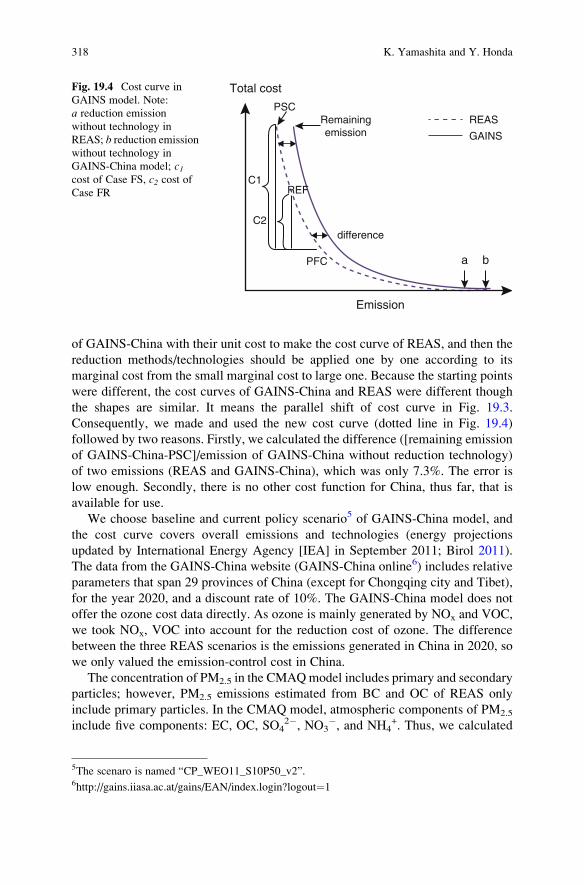
of GAINS-China with their unit cost to make the cost curve of REAS, and then the
reduction methods/technologies should be applied one by one according to its
marginal cost from the small marginal cost to large one. Because the starting points
were different, the cost curves of GAINS-China and REAS were different though
the shapes are similar. It means the parallel shift of cost curve in Fig. 19.3.
Consequently, we made and used the new cost curve (dotted line in Fig. 19.4)
followed by two reasons. Firstly, we calculated the difference ([remaining emission
of GAINS-China-PSC]/emission of GAINS-China without reduction technology)
of two emissions (REAS and GAINS-China), which was only 7.3%. The error is
low enough. Secondly, there is no other cost function for China, thus far, that is
available for use.
We choose baseline and current policy scenario5 of GAINS-China model, and
the cost curve covers overall emissions and technologies (energy projections
updated by International Energy Agency [IEA] in September 2011; Birol 2011).
The data from the GAINS-China website (GAINS-China online6) includes relative
parameters that span 29 provinces of China (except for Chongqing city and Tibet),
for the year 2020, and a discount rate of 10%. The GAINS-China model does not
offer the ozone cost data directly. As ozone is mainly generated by NOx and VOC,
we took NOx, VOC into account for the reduction cost of ozone. The difference
between the three REAS scenarios is the emissions generated in China in 2020, so
we only valued the emission-control cost in China.
The concentration of PM2.5 in the CMAQmodel includes primary and secondary
particles; however, PM2.5 emissions estimated from BC and OC of REAS only
include primary particles. In the CMAQ model, atmospheric components of PM2.5
include five components: EC, OC, SO42�, NO3
�, and NH4+. Thus, we calculated
Remainingemission
Total cost
Emission
difference
PSC
PFC
C1
C2
REAS
GAINS
a b
REF
Fig. 19.4 Cost curve in
GAINS model. Note:
a reduction emission
without technology in
REAS; b reduction emission
without technology in
GAINS-China model; c1cost of Case FS, c2 cost ofCase FR
5The scenaro is named “CP_WEO11_S10P50_v2”.6http://gains.iiasa.ac.at/gains/EAN/index.login?logout¼1
318 K. Yamashita and Y. Honda
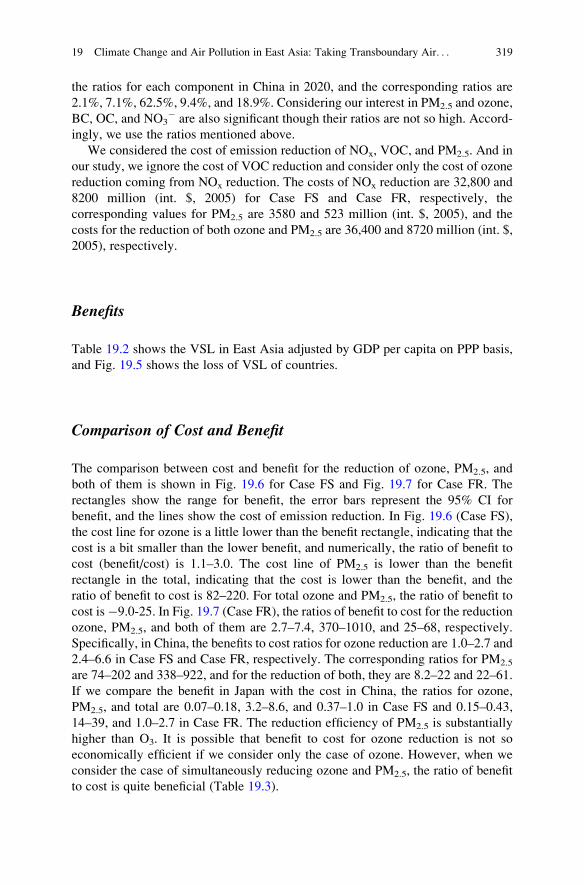
the ratios for each component in China in 2020, and the corresponding ratios are
2.1%, 7.1%, 62.5%, 9.4%, and 18.9%. Considering our interest in PM2.5 and ozone,
BC, OC, and NO3� are also significant though their ratios are not so high. Accord-
ingly, we use the ratios mentioned above.
We considered the cost of emission reduction of NOx, VOC, and PM2.5. And in
our study, we ignore the cost of VOC reduction and consider only the cost of ozone
reduction coming from NOx reduction. The costs of NOx reduction are 32,800 and
8200 million (int. $, 2005) for Case FS and Case FR, respectively, the
corresponding values for PM2.5 are 3580 and 523 million (int. $, 2005), and the
costs for the reduction of both ozone and PM2.5 are 36,400 and 8720 million (int. $,
2005), respectively.
Benefits
Table 19.2 shows the VSL in East Asia adjusted by GDP per capita on PPP basis,
and Fig. 19.5 shows the loss of VSL of countries.
Comparison of Cost and Benefit
The comparison between cost and benefit for the reduction of ozone, PM2.5, and
both of them is shown in Fig. 19.6 for Case FS and Fig. 19.7 for Case FR. The
rectangles show the range for benefit, the error bars represent the 95% CI for
benefit, and the lines show the cost of emission reduction. In Fig. 19.6 (Case FS),
the cost line for ozone is a little lower than the benefit rectangle, indicating that the
cost is a bit smaller than the lower benefit, and numerically, the ratio of benefit to
cost (benefit/cost) is 1.1–3.0. The cost line of PM2.5 is lower than the benefit
rectangle in the total, indicating that the cost is lower than the benefit, and the
ratio of benefit to cost is 82–220. For total ozone and PM2.5, the ratio of benefit to
cost is�9.0-25. In Fig. 19.7 (Case FR), the ratios of benefit to cost for the reduction
ozone, PM2.5, and both of them are 2.7–7.4, 370–1010, and 25–68, respectively.
Specifically, in China, the benefits to cost ratios for ozone reduction are 1.0–2.7 and
2.4–6.6 in Case FS and Case FR, respectively. The corresponding ratios for PM2.5
are 74–202 and 338–922, and for the reduction of both, they are 8.2–22 and 22–61.
If we compare the benefit in Japan with the cost in China, the ratios for ozone,
PM2.5, and total are 0.07–0.18, 3.2–8.6, and 0.37–1.0 in Case FS and 0.15–0.43,
14–39, and 1.0–2.7 in Case FR. The reduction efficiency of PM2.5 is substantially
higher than O3. It is possible that benefit to cost for ozone reduction is not so
economically efficient if we consider only the case of ozone. However, when we
consider the case of simultaneously reducing ozone and PM2.5, the ratio of benefit
to cost is quite beneficial (Table 19.3).
19 Climate Change and Air Pollution in East Asia: Taking Transboundary Air. . . 319
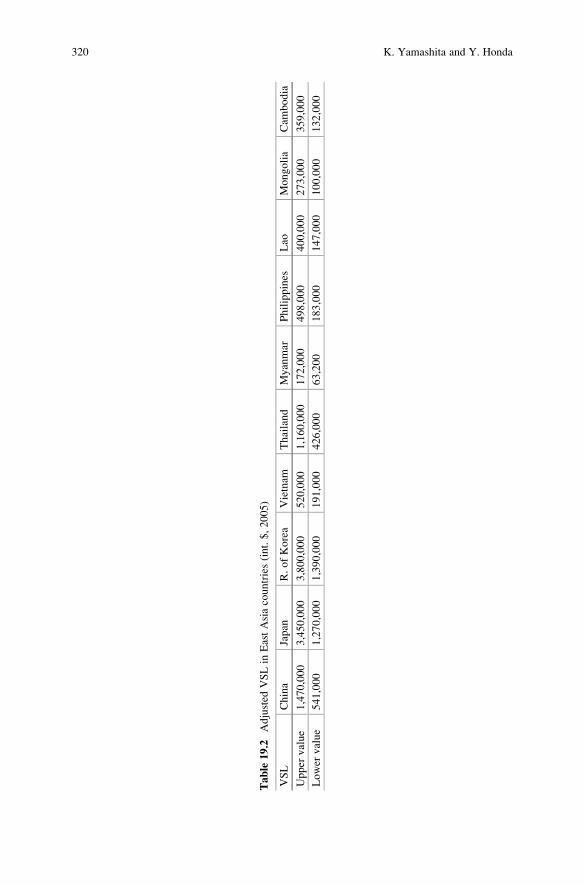
Table
19.2
Adjusted
VSLin
EastAsiacountries(int.$,2005)
VSL
China
Japan
R.ofKorea
Vietnam
Thailand
Myanmar
Philippines
Lao
Mongolia
Cam
bodia
Upper
value
1,470,000
3,450,000
3,800,000
520,000
1,160,000
172,000
498,000
400,000
273,000
359,000
Lower
value
541,000
1,270,000
1,390,000
191,000
426,000
63,200
183,000
147,000
100,000
132,000
320 K. Yamashita and Y. Honda
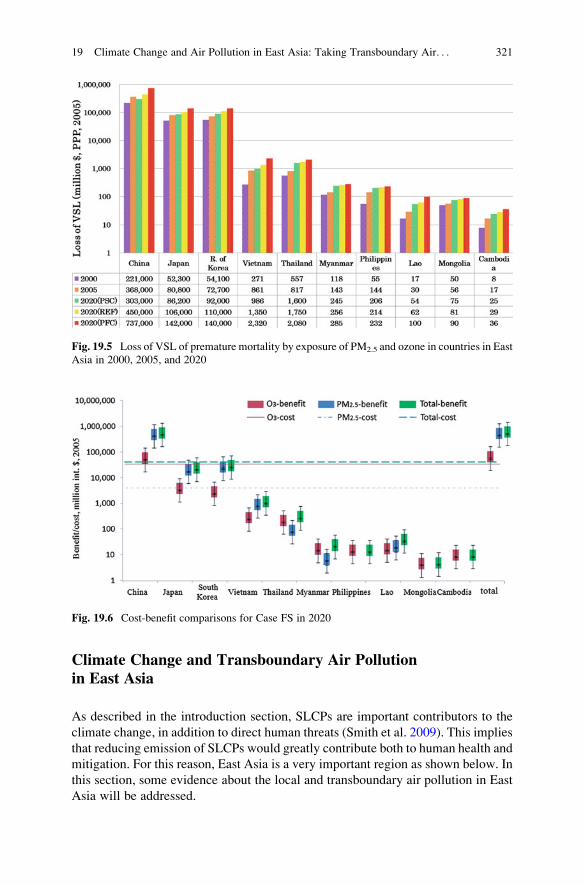
Climate Change and Transboundary Air Pollutionin East Asia
As described in the introduction section, SLCPs are important contributors to the
climate change, in addition to direct human threats (Smith et al. 2009). This implies
that reducing emission of SLCPs would greatly contribute both to human health and
mitigation. For this reason, East Asia is a very important region as shown below. In
this section, some evidence about the local and transboundary air pollution in East
Asia will be addressed.
Fig. 19.5 Loss of VSL of premature mortality by exposure of PM2.5 and ozone in countries in East
Asia in 2000, 2005, and 2020
Fig. 19.6 Cost-benefit comparisons for Case FS in 2020
19 Climate Change and Air Pollution in East Asia: Taking Transboundary Air. . . 321
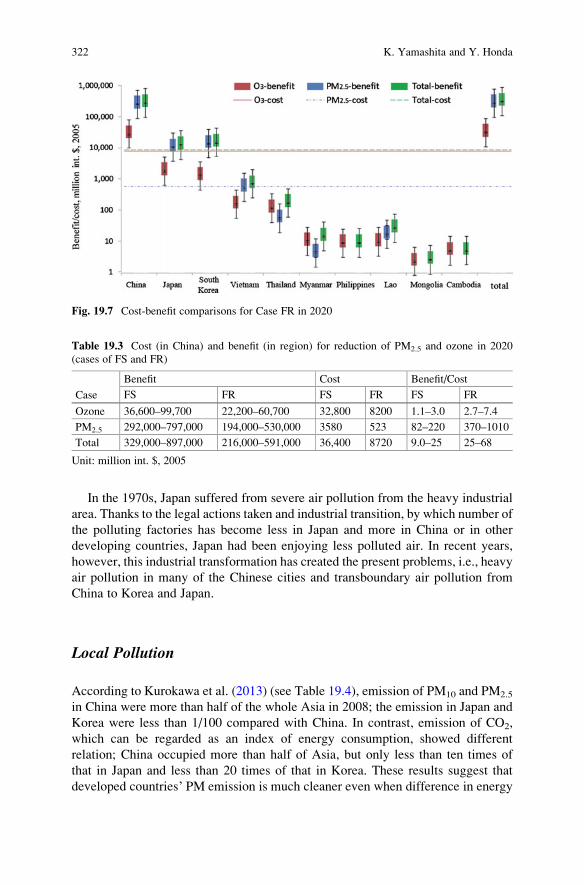
In the 1970s, Japan suffered from severe air pollution from the heavy industrial
area. Thanks to the legal actions taken and industrial transition, by which number of
the polluting factories has become less in Japan and more in China or in other
developing countries, Japan had been enjoying less polluted air. In recent years,
however, this industrial transformation has created the present problems, i.e., heavy
air pollution in many of the Chinese cities and transboundary air pollution from
China to Korea and Japan.
Local Pollution
According to Kurokawa et al. (2013) (see Table 19.4), emission of PM10 and PM2.5
in China were more than half of the whole Asia in 2008; the emission in Japan and
Korea were less than 1/100 compared with China. In contrast, emission of CO2,
which can be regarded as an index of energy consumption, showed different
relation; China occupied more than half of Asia, but only less than ten times of
that in Japan and less than 20 times of that in Korea. These results suggest that
developed countries’ PM emission is much cleaner even when difference in energy
Fig. 19.7 Cost-benefit comparisons for Case FR in 2020
Table 19.3 Cost (in China) and benefit (in region) for reduction of PM2.5 and ozone in 2020
(cases of FS and FR)
Case
Benefit Cost Benefit/Cost
FS FR FS FR FS FR
Ozone 36,600–99,700 22,200–60,700 32,800 8200 1.1–3.0 2.7–7.4
PM2.5 292,000–797,000 194,000–530,000 3580 523 82–220 370–1010
Total 329,000–897,000 216,000–591,000 36,400 8720 9.0–25 25–68
Unit: million int. $, 2005
322 K. Yamashita and Y. Honda
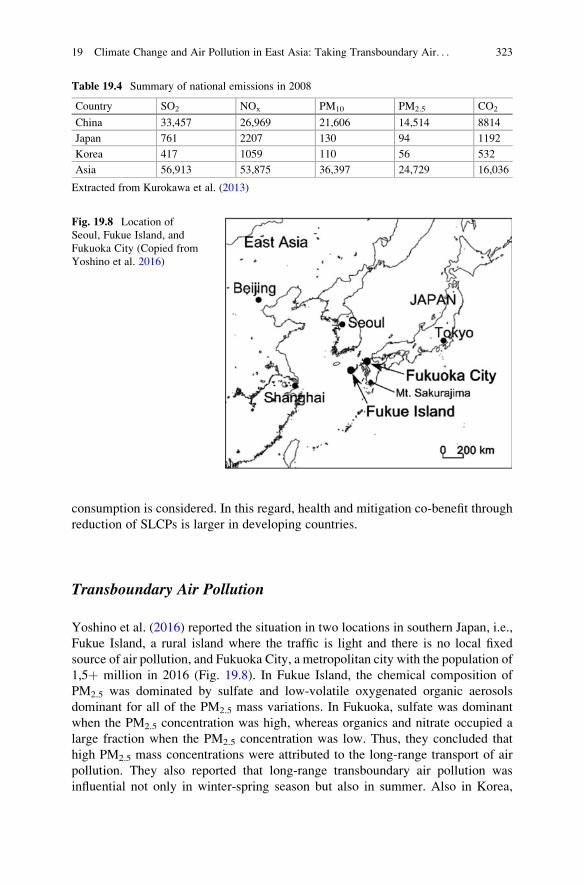
consumption is considered. In this regard, health and mitigation co-benefit through
reduction of SLCPs is larger in developing countries.
Transboundary Air Pollution
Yoshino et al. (2016) reported the situation in two locations in southern Japan, i.e.,
Fukue Island, a rural island where the traffic is light and there is no local fixed
source of air pollution, and Fukuoka City, a metropolitan city with the population of
1,5þ million in 2016 (Fig. 19.8). In Fukue Island, the chemical composition of
PM2.5 was dominated by sulfate and low-volatile oxygenated organic aerosols
dominant for all of the PM2.5 mass variations. In Fukuoka, sulfate was dominant
when the PM2.5 concentration was high, whereas organics and nitrate occupied a
large fraction when the PM2.5 concentration was low. Thus, they concluded that
high PM2.5 mass concentrations were attributed to the long-range transport of air
pollution. They also reported that long-range transboundary air pollution was
influential not only in winter-spring season but also in summer. Also in Korea,
Table 19.4 Summary of national emissions in 2008
Country SO2 NOx PM10 PM2.5 CO2
China 33,457 26,969 21,606 14,514 8814
Japan 761 2207 130 94 1192
Korea 417 1059 110 56 532
Asia 56,913 53,875 36,397 24,729 16,036
Extracted from Kurokawa et al. (2013)
Fig. 19.8 Location of
Seoul, Fukue Island, and
Fukuoka City (Copied from
Yoshino et al. 2016)
19 Climate Change and Air Pollution in East Asia: Taking Transboundary Air. . . 323
aerosols from China played a major role in the occurrence of severe air pollution
episodes for 4þ days in cold seasons 2001–2013 in Seoul, Korea; the concentration
of PM10 sometimes exceeded 100 μg/m3 (Oha et al. 2015).
Since the global warming was first identified, the north-south problem was one
of the toughest challenges we have had; developing countries which emitted little
greenhouse gases suffer most, and developed countries which emitted a lot of
greenhouse gases suffer less. As described above, however, massive emission of
pollutants in China has been causing high PM concentration days not only domes-
tically but also in neighboring countries such as Korea and Japan. This situation
urges both developed and developing countries to solve this problem; developed
countries should provide new technologies to reduce simultaneously greenhouse
gas and pollutant emissions, especially SLCPs.
Summary and Conclusion
In this chapter, we showed an integrated approach to compare the reduction costs
for ozone and PM2.5 with the corresponding benefits of reducing the premature
mortality rate due to exposure to ozone and PM2.5 which are categorized as SLCPs.
Assessing premature mortality risks caused by exposure to elevated concentrations
of PM2.5 and ozone in East Asia involves many uncertainties with regard to
emission inventories, modeling systems, population distribution, and age-specific
mortality rates. It is also recognized that statistically significant Asian epidemio-
logical studies for ozone and PM2.5 effects on human health are necessary. Based on
the estimation of premature mortality, we see that the cost efficiency to reduce
PM2.5 is considerably higher than ozone, and reduction of both ozone and PM2.5 is
quite beneficial in either case of emission reduction policy. Also we introduced the
relationship between SLCPs and transboundary air pollutants in East Asia.
Therefore, taking the crucial and complex aspects of the atmospheric environ-
ment into account, it is certainly pointed out that SLCPs are key factors, in terms of
co-benefit/co-control, to approach the air pollution and climate change problems
not only in East Asia but in the world. The further study should be enhanced to
elucidate the uncertainty points mentioned above to provide the exact and persuad-
able scientific evidences to policy makers and related initiatives so that they can
choose the most effective and efficient policy immediately.
References
Akimoto H (2003) Global air quality and pollution. Science 302:1716–1719
Amann M, Bertok I, Borken-Kleefeld J, Cofala J, Heyes C, H€oglund-Isaksson L et al (2011) Cost-
effective control of air quality and greenhouse gases in Europe: modeling and policy applica-
tions. Environ Model Softw 26(12):1489–1501
324 K. Yamashita and Y. Honda
Bergin SM, West JJ, Keating JT, Russell GA (2005) Regional atmospheric pollution and
transboundary air quality management. Annu Rev Environ Resour 30:1–37
Birol F (2011) World energy outlook 2011. International Energy Agency (IEA)
Chen F, Yamashita K, Kurokawa J, Klimont Z (2015) Cost-benefit analysis of reducing premature
mortality caused by exposure to ozone and PM2.5 in East Asia in 2020. Water, Air and Soil
Pollution
CIESIN (2005) Gridded population of the world, version 3 (GPWv3). Center for International
Earth Science Information Network (CIESIN), Columbia University
Cohen A, Anderson H, Ostra B et al (2005) The global burden of disease due to outdoor air
pollution. J Toxic Environ Health A 68:1–7
Krupnick A, Alberini A, Cropper M, Simon N, O’Brien B, Goeree R, Heintzelman M (2002) Age,
health and the willingness to pay for mortality risk reductions: a contingent valuation survey of
Ontario residents. J Risk Uncertain 24(2):161–186
Kurokawa J, Ohara T, Uno I, Hayasaki M, Tanimoto H (2009) Influence of meteorological
variability on interannual variations of springtime boundary layer ozone over Japan during
1981–2005. Atmos Chem Phys 9(17):6287–6304
Kurokawa J, Ohara T, Morikawa T, Hanayama S, Janssens-Maenhout G, Fukui T, Kawashima K,
Akimoto H (2013) Emissions of air pollutants and greenhouse gases over Asian regions during
2000–2008: regional emission inventory in Asia (REAS) version 2. Atmos Chem Phys 13
(21):11019–11058
Lim SS, Vos T, Flaxman AD, Danaei G, Shibuya K, Adair-Rohani H et al (2013) A comparative
risk assessment of burden of disease and injury attributable to 67 risk factors and risk factor
clusters in 21 regions, 1990–2010: a systematic analysis for the Global Burden of Disease
Study 2010. Lancet 380(9859):2224–2260
Nawahda A, Yamashita K, Ohara T, Kurokawa J, Yamaji K (2012) Evaluation of premature
mortality caused by exposure to PM2.5 and ozone in East Asia: 2000, 2005, 2020. Water Air
Soil Pollut 223(6):3445–3459
Nawahda A, Yamashita K, Ohara T, Kurokawa J, Ohizumi T, Chen F, Akimoto H (2013)
Premature mortality in Japan due to ozone. Atmos Environ 81:538–545
OECD (2012) Mortality risk valuation in environment, health and transport policies. OECD
Publishing. http://dx.doi.org/10.1787/9789264130807-en
Oha H, Hoa C, Kimb J, Chenc D, Leea S, Choid Y, Change L, Songe C (2015) Long-range
transport of air pollutants originating in China: a possible major cause of multi-day high-PM10
episodes during cold season in Seoul, Korea. Atmos Environ 109:23–30
Ohara T, Akimoto H, Kurokawa JI, Horii N, Yamaji K, Yan X, Hayasaka T (2007) An Asian
emission inventory of anthropogenic emission sources for the period 1980–2020. Atmos Chem
Phys 7(16):4419–4444
Pope CA III, Burnett RT, Thun MJ et al (2002) Lung cancer, cardiopulmonary mortality, and long-
term exposure to fine particulate air pollution. J Am Med Assoc 287(9):1132–1141
Schroeder H, Yocum D (2006) European institutions for controlling chemical air pollution: an
analysis of CLRTAP-European Union interplay. In: Simeonov L, Chiria E (eds) Chemicals as
intentional and accidental global environmental threats. Springer, p 321–336
Smith KR, Jerrett M, Anderson HR, Burnett RT, Stone V, Derwent R, Atkinson RW, Cohen A,
Shonkoff SB, Krewski D, Pope CA 3rd, Thun MJ, Thurston G (2009) Public health benefits of
strategies to reduce greenhouse-gas emissions: health implications of short-lived greenhouse
pollutants. Lancet. Dec 19 374(9707):2091–2103. doi:10.1016/S0140-6736(09)61716-5
Task Force on Research Coordination (TFRC), Scientific Advisory Committee (SAC), Acid
Deposition Monitoring Network in East Asia (EANET) (2015) Review on the state of air
pollution in East Asia. EANET
United Nations Department of Economic and Social Affairs/Population Division (2008) World
population prospects: the 2008 revision, http://esa.un.org/unpp/
United Nations Environment Programme (UNEP) (2011) Near-term climate protection and clean
air benefits: actions for controlling short-lived climate forcers. UNEP
19 Climate Change and Air Pollution in East Asia: Taking Transboundary Air. . . 325
Uno I, Ohara T, Sugata S et al (2005) Development of the RAMS/CMAQ Asian scale chemical
transport modeling system. J Jpn Soc Atmos Environ 40(4):148–164
US-EPA (2006) Ozone health risk assessment for selected urban areas. http://www.epa.gov/
ttnnaaqs/standards/ozone/data/ozone_ra_2nd_draft_tsd_mainbody_7-18-2006.pdf
WHO (2006) Mortality database. World Health Organization. http://apps.who.int/whosis/data
base/mort/table1.cfm
WHO (2010a) Demographic tables. World Health Organization. http://www.wpro.who.int/
WHO (2010b) Mortality database. World Health Organization. http://www.who.int/
Yamaji K, Ohara T, Uno I, Tanimoto H, Kurokawa JI, Akimoto H (2006) Analysis of the seasonal
variation of ozone in the boundary layer in East Asia using the Community multi-scale air
quality model: what controls surface ozone levels over Japan? Atmos Environ 40
(10):1856–1868
Yamaji K, Ohara T, Uno I, Kurokawa JI, Pochanart P, Akimoto H (2008) Future prediction of
surface ozone over east Asia using models-3 Community multiscale air quality modeling
system and regional emission inventory in Asia. J Geophys Res 113:D08306
Yoshino A, Takami A, Sato K, Shimizu A, Kaneyasu N, Hatakeyama S, Hara K, Hayashi M (2016)
Influence of trans-boundary air pollution on the urban atmosphere in Fukuoka, Japan. Atmo-
sphere 7(4):51. doi:10.3390/atmos7040051
Ken Yamashita, PhD, head of Data Management Department, Asia Center for Air Pollution
Research (ACAP), has more than 34 years of experience in research, administration and manage-
ment and has coordinating experiences in the field of environmental sciences and policies with
special emphasis on the risk assessment of atmospheric environment in East Asia.
Yasushi Honda, MD, PhD, professor at the Faculty of Health and Sport Sciences, University of
Tsukuba, has been working on climate change health impact, especially on heat-related mortality
impact, and was a lead author of the Fourth (Asia) and Fifth (human health) Intergovernmental
Panel on Climate Change Assessment Report and a convening lead author of SREX.
326 K. Yamashita and Y. Honda
Chapter 20
Climate Change, Air Pollution and Healthin South Africa
Eugene Cairncross, Aqiel Dalvie, Rico Euripidou, James Irlam,
and Rajen Nithiseelan Naidoo
Abstract Climate change and air pollution pose significant short-term and long-
term health risks to South Africans due to the carbon intensity of the national
economy, the severe air pollution around coal mining and coal-fired power stations
in many widespread populated areas and the particular vulnerability of many sub-
groups in a country burdened by extreme inequality and a severe quadruple
epidemic of acute and chronic disease.
There are limited local studies on the respiratory, cardiovascular and other health
risks of air pollution. Inadequate disease surveillance and air quality data pose a
challenge for monitoring and research.
A number of interventions to mitigate or adapt to climate change with important
co-benefits for air quality and public health are described for the following eco-
nomic sectors: energy, industry, human settlements, transport, healthcare and
business sector.
There is good policy commitment to address climate change and air pollution,
but implementation needs to be drastically improved.
Keywords Air pollution • Climate change • Mitigation • Public health • Energy •
Coal
E. Cairncross • J. Irlam (*)
Primary Health Care Directorate, Faculty of Health Sciences, University of Cape Town,
Observatory, Capetown 7925, South Africa
e-mail: [email protected]; [email protected]
A. Dalvie
School of Public Health & Family Medicine, Faculty of Health Sciences, University of Cape
Town, Observatory, Capetown 7925, South Africa
e-mail: [email protected]
R. Euripidou
groundWork, Friends of the Earth South Africa, Pietermaritzburg, South Africa
e-mail: [email protected]
R.N. Naidoo
Discipline of Occupational and Environmental Health, University of KwaZulu-Natal, Durban,
South Africa
e-mail: [email protected]
© Springer International Publishing AG 2018
R. Akhtar, C. Palagiano (eds.), Climate Change and Air Pollution,Springer Climate, DOI 10.1007/978-3-319-61346-8_20
327
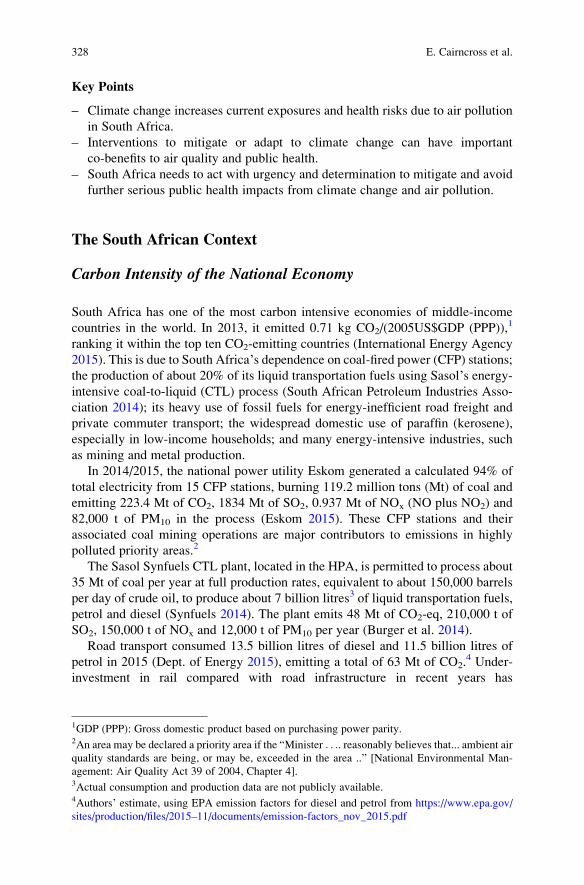
Key Points
– Climate change increases current exposures and health risks due to air pollution
in South Africa.
– Interventions to mitigate or adapt to climate change can have important
co-benefits to air quality and public health.
– South Africa needs to act with urgency and determination to mitigate and avoid
further serious public health impacts from climate change and air pollution.
The South African Context
Carbon Intensity of the National Economy
South Africa has one of the most carbon intensive economies of middle-income
countries in the world. In 2013, it emitted 0.71 kg CO2/(2005US$GDP (PPP)),1
ranking it within the top ten CO2-emitting countries (International Energy Agency
2015). This is due to South Africa’s dependence on coal-fired power (CFP) stations;the production of about 20% of its liquid transportation fuels using Sasol’s energy-intensive coal-to-liquid (CTL) process (South African Petroleum Industries Asso-
ciation 2014); its heavy use of fossil fuels for energy-inefficient road freight and
private commuter transport; the widespread domestic use of paraffin (kerosene),
especially in low-income households; and many energy-intensive industries, such
as mining and metal production.
In 2014/2015, the national power utility Eskom generated a calculated 94% of
total electricity from 15 CFP stations, burning 119.2 million tons (Mt) of coal and
emitting 223.4 Mt of CO2, 1834 Mt of SO2, 0.937 Mt of NOx (NO plus NO2) and
82,000 t of PM10 in the process (Eskom 2015). These CFP stations and their
associated coal mining operations are major contributors to emissions in highly
polluted priority areas.2
The Sasol Synfuels CTL plant, located in the HPA, is permitted to process about
35 Mt of coal per year at full production rates, equivalent to about 150,000 barrels
per day of crude oil, to produce about 7 billion litres3 of liquid transportation fuels,
petrol and diesel (Synfuels 2014). The plant emits 48 Mt of CO2-eq, 210,000 t of
SO2, 150,000 t of NOx and 12,000 t of PM10 per year (Burger et al. 2014).
Road transport consumed 13.5 billion litres of diesel and 11.5 billion litres of
petrol in 2015 (Dept. of Energy 2015), emitting a total of 63 Mt of CO2.4 Under-
investment in rail compared with road infrastructure in recent years has
1GDP (PPP): Gross domestic product based on purchasing power parity.2An area may be declared a priority area if the “Minister . . .. reasonably believes that... ambient air
quality standards are being, or may be, exceeded in the area ..” [National Environmental Man-
agement: Air Quality Act 39 of 2004, Chapter 4].3Actual consumption and production data are not publicly available.4Authors’ estimate, using EPA emission factors for diesel and petrol from https://www.epa.gov/
sites/production/files/2015–11/documents/emission-factors_nov_2015.pdf
328 E. Cairncross et al.
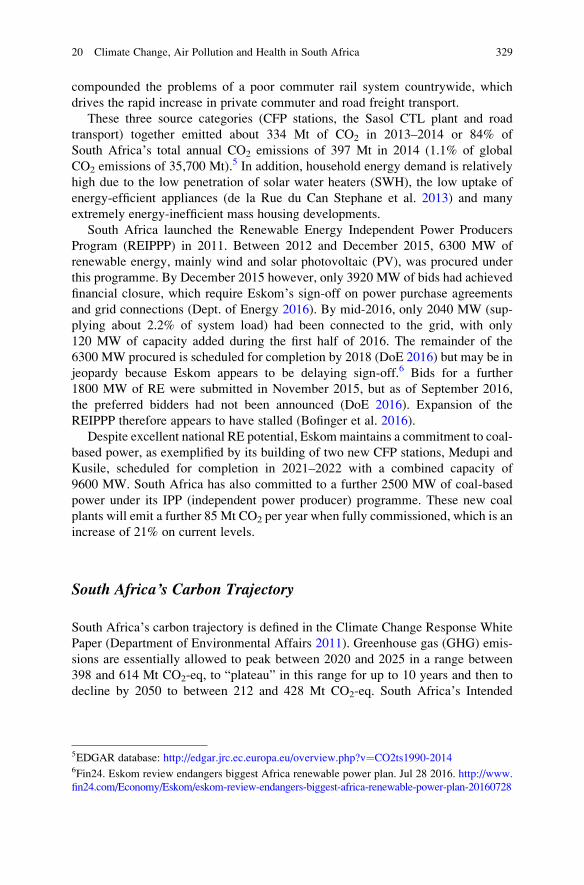
compounded the problems of a poor commuter rail system countrywide, which
drives the rapid increase in private commuter and road freight transport.
These three source categories (CFP stations, the Sasol CTL plant and road
transport) together emitted about 334 Mt of CO2 in 2013–2014 or 84% of
South Africa’s total annual CO2 emissions of 397 Mt in 2014 (1.1% of global
CO2 emissions of 35,700 Mt).5 In addition, household energy demand is relatively
high due to the low penetration of solar water heaters (SWH), the low uptake of
energy-efficient appliances (de la Rue du Can Stephane et al. 2013) and many
extremely energy-inefficient mass housing developments.
South Africa launched the Renewable Energy Independent Power Producers
Program (REIPPP) in 2011. Between 2012 and December 2015, 6300 MW of
renewable energy, mainly wind and solar photovoltaic (PV), was procured under
this programme. By December 2015 however, only 3920 MW of bids had achieved
financial closure, which require Eskom’s sign-off on power purchase agreements
and grid connections (Dept. of Energy 2016). By mid-2016, only 2040 MW (sup-
plying about 2.2% of system load) had been connected to the grid, with only
120 MW of capacity added during the first half of 2016. The remainder of the
6300 MW procured is scheduled for completion by 2018 (DoE 2016) but may be in
jeopardy because Eskom appears to be delaying sign-off.6 Bids for a further
1800 MW of RE were submitted in November 2015, but as of September 2016,
the preferred bidders had not been announced (DoE 2016). Expansion of the
REIPPP therefore appears to have stalled (Bofinger et al. 2016).
Despite excellent national RE potential, Eskommaintains a commitment to coal-
based power, as exemplified by its building of two new CFP stations, Medupi and
Kusile, scheduled for completion in 2021–2022 with a combined capacity of
9600 MW. South Africa has also committed to a further 2500 MW of coal-based
power under its IPP (independent power producer) programme. These new coal
plants will emit a further 85 Mt CO2 per year when fully commissioned, which is an
increase of 21% on current levels.
South Africa’s Carbon Trajectory
South Africa’s carbon trajectory is defined in the Climate Change Response White
Paper (Department of Environmental Affairs 2011). Greenhouse gas (GHG) emis-
sions are essentially allowed to peak between 2020 and 2025 in a range between
398 and 614 Mt CO2-eq, to “plateau” in this range for up to 10 years and then to
decline by 2050 to between 212 and 428 Mt CO2-eq. South Africa’s Intended
5EDGAR database: http://edgar.jrc.ec.europa.eu/overview.php?v¼CO2ts1990-20146Fin24. Eskom review endangers biggest Africa renewable power plan. Jul 28 2016. http://www.
fin24.com/Economy/Eskom/eskom-review-endangers-biggest-africa-renewable-power-plan-20160728
20 Climate Change, Air Pollution and Health in South Africa 329
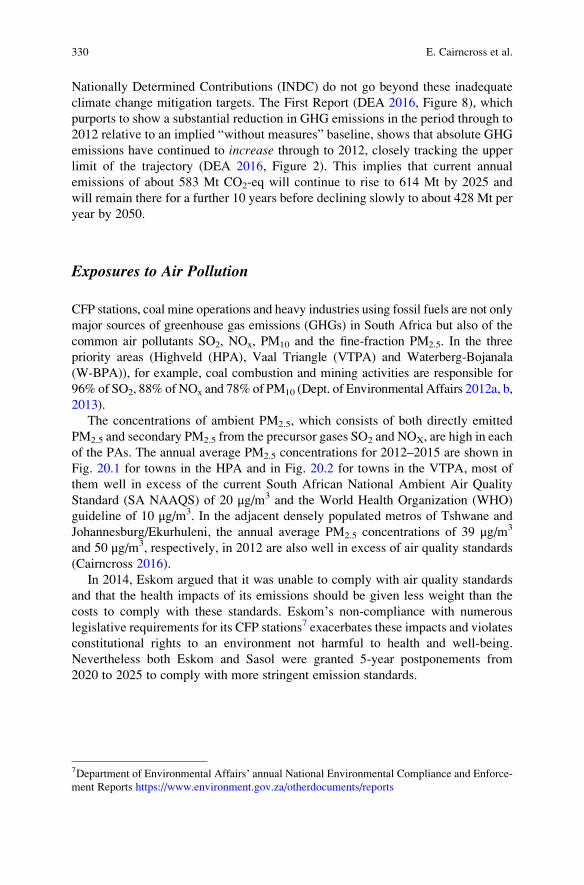
Nationally Determined Contributions (INDC) do not go beyond these inadequate
climate change mitigation targets. The First Report (DEA 2016, Figure 8), which
purports to show a substantial reduction in GHG emissions in the period through to
2012 relative to an implied “without measures” baseline, shows that absolute GHG
emissions have continued to increase through to 2012, closely tracking the upper
limit of the trajectory (DEA 2016, Figure 2). This implies that current annual
emissions of about 583 Mt CO2-eq will continue to rise to 614 Mt by 2025 and
will remain there for a further 10 years before declining slowly to about 428 Mt per
year by 2050.
Exposures to Air Pollution
CFP stations, coal mine operations and heavy industries using fossil fuels are not only
major sources of greenhouse gas emissions (GHGs) in South Africa but also of the
common air pollutants SO2, NOx, PM10 and the fine-fraction PM2.5. In the three
priority areas (Highveld (HPA), Vaal Triangle (VTPA) and Waterberg-Bojanala
(W-BPA)), for example, coal combustion and mining activities are responsible for
96% of SO2, 88% of NOx and 78% of PM10 (Dept. of Environmental Affairs 2012a, b,
2013).
The concentrations of ambient PM2.5, which consists of both directly emitted
PM2.5 and secondary PM2.5 from the precursor gases SO2 and NOX, are high in each
of the PAs. The annual average PM2.5 concentrations for 2012–2015 are shown in
Fig. 20.1 for towns in the HPA and in Fig. 20.2 for towns in the VTPA, most of
them well in excess of the current South African National Ambient Air Quality
Standard (SA NAAQS) of 20 μg/m3 and the World Health Organization (WHO)
guideline of 10 μg/m3. In the adjacent densely populated metros of Tshwane and
Johannesburg/Ekurhuleni, the annual average PM2.5 concentrations of 39 μg/m3
and 50 μg/m3, respectively, in 2012 are also well in excess of air quality standards
(Cairncross 2016).
In 2014, Eskom argued that it was unable to comply with air quality standards
and that the health impacts of its emissions should be given less weight than the
costs to comply with these standards. Eskom’s non-compliance with numerous
legislative requirements for its CFP stations7 exacerbates these impacts and violates
constitutional rights to an environment not harmful to health and well-being.
Nevertheless both Eskom and Sasol were granted 5-year postponements from
2020 to 2025 to comply with more stringent emission standards.
7Department of Environmental Affairs’ annual National Environmental Compliance and Enforce-
ment Reports https://www.environment.gov.za/otherdocuments/reports
330 E. Cairncross et al.
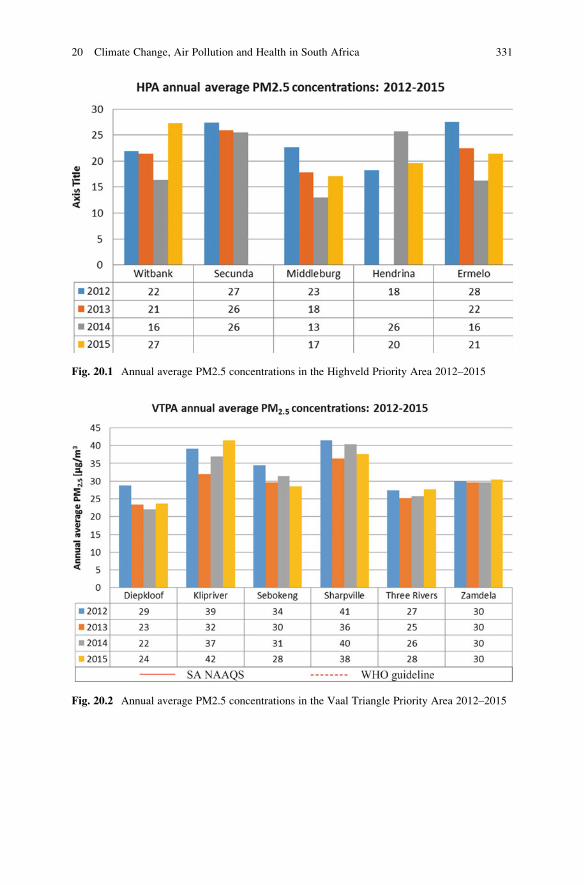
Fig. 20.1 Annual average PM2.5 concentrations in the Highveld Priority Area 2012–2015
Fig. 20.2 Annual average PM2.5 concentrations in the Vaal Triangle Priority Area 2012–2015
20 Climate Change, Air Pollution and Health in South Africa 331
Health Risks Due to Air Pollution in South Africa
South Africa carries a quadruple burden of disease, characterised by high morbidity
and mortality from four broad groups of causes: injuries, non-communicable
disease, HIV/AIDS and tuberculosis and communicable diseases, perinatal condi-
tions, maternal causes and nutritional deficiencies. Significant subnational varia-
tions reflect deep and persistent health inequalities and indicate that population
groups and provinces are at different stages of the health transition (Pillay-van Wyk
et al. 2016). The health risks due to air pollution in South Africa are not insignif-
icant however, as illustrated by a number of studies below.
Respiratory Conditions
The scientific literature over the past few decades provides substantial evidence for
the association of air pollution with various respiratory outcomes, especially among
children. These include the presentation of asthma symptoms (Mann et al. 2010;
Zora et al. 2013), lung function impacts (Weinmayr et al. 2010) and visits to
emergency departments (Nastos et al. 2010). Implicated pollutants include partic-
ulate matter, ozone, sulphur dioxide and oxides of nitrogen (Graveland et al. 2011;
McConnell et al. 2010; Pan et al. 2010; Strickland et al. 2010). Proxy markers of air
pollution, such as vehicle traffic (Jung et al. 2015) and industry (Rovira et al. 2014),
have also been documented. Those at greatest risk include children, those with
pre-existing respiratory diseases and the elderly.
The literature among populations in South Africa and southern Africa is limited
and focused mostly on children. Ecological approaches have generally been
employed as crude proxy markers of exposure, such as comparing towns with
known levels of ambient exposure, although more recent studies have used more
sophisticated exposure metrics. Studies have mostly been in areas with higher
levels of industrial pollution, such as towns in the Vaal Triangle area, and in the
south Durban and Cape Town metropoles.
Despite high levels of ambient and indoor pollution in low-income communities,
early comparisons of exposed and less exposed communities provided limited
evidence of pollutant-related respiratory outcomes among children. In a 1986
study of about 1000 schoolchildren from Sasolburg, site of the CTL plant, for
example, little difference in reported symptoms was found compared to nearby less
exposed communities, although there were small differences in lung function
parameters (Coetzee et al. 1986). A more extensive study of about 10,000
schoolchildren within the Vaal Triangle area reported that 8–12-year-olds in com-
munities without electricity had a 65% increased prevalence of upper airway
symptoms and a 29% higher prevalence of lower respiratory tract illnesses. The
risk of asthma was almost twofold higher among children from Vaal Triangle
communities than among those from a less polluted town (Terblanche et al. 1992).
332 E. Cairncross et al.
Similar ecologic studies have been done in the Highveld area of the north-
eastern province of Mpumalanga, which is also home to several coal mines and
CFP stations. A study of about 1000 children from higher exposed communities
found an increased risk of respiratory symptoms (cough, wheeze and asthma) than
among children from less exposed areas, although there was no difference in lung
function measures (Zwi et al. 1990). A more recent study in the Highveld, using
questionnaire-based exposure and outcome data, found a significantly increased
risk of wheeze among schoolchildren due to environmental tobacco smoke, use of
gas for indoor heating and the proximity to schools of heavy trucks (Shirinde et al.
2014).
Given the high burden of childhood infectious diseases in southern Africa,
quantifying the additional risk from pollution is important for public health. Sur-
vival analysis of under-five mortality data from the World Health Survey of 2003,
pooled for 16 African countries, showed a significant impact of indoor biomass
fuels on acute lower respiratory tract infection mortality (adjusted HR ¼ 2.35 (95%
CI 1.22–4.52)) (Rehfuess et al. 2009). This finding has been replicated in studies in
the Highveld area where the prevalence of respiratory symptoms among
schoolchildren was substantially higher among those exposed to indoor biomass
fuels (Albers et al. 2015). In other studies in South Africa, child tuberculosis has
presented with an increased risk among those exposed to environmental tobacco
smoke (du Preez et al. 2011) and to indoor air pollution (Jafta et al. 2015).
More recent respiratory health studies have developed more direct and sophis-
ticated measures of air pollution exposure and have focused on short-term out-
comes such as acute respiratory symptoms and measures of lung function. A study
using a repeated measures panel design of young schoolchildren in the city of
Durban, for example (Naidoo et al. 2013), enabled the direct associations between
specific pollutants and short-term outcomes to be assessed. A previous study found
high prevalence of asthma among children at primary schools in the industrially
intense areas of south Durban, with short-term levels of PM10, nitrogen dioxide
(NO2) and SO2 significantly associated with increased respiratory symptoms and
decrements of pulmonary function among asthmatic children (Kistnasamy et al.
2008). Another study in south Durban had found that acute respiratory outcomes,
such as cough and wheeze, as well as daily lung function measures, were directly
associated with short-term fluctuations in pollutants, particularly oxides of nitrogen
and particulate matter (Naidoo et al. 2007). Naidoo et al. (2013) compared children
in the southern areas and less industrialised northern areas of Durban and found a
greater risk in the south of doctor-diagnosed asthma, persistent asthma, and airway
hyper-reactivity. There was also a twofold increased risk for airway hyper-
reactivity with SO2 exposure (Naidoo et al. 2013).
More complex epidemiological studies in South Africa are likely to show more
robust exposure-outcome relationships. Two birth cohort studies with a focus on
environmental pollution and respiratory outcomes are underway in the city of
Durban and in various settings in the Western Cape Province. The latter study
has characterised indoor air pollution among the disadvantaged communities under
20 Climate Change, Air Pollution and Health in South Africa 333
study, with substantial use of biomass fuels resulting in high levels of benzene,
carbon monoxide and oxides of nitrogen (Vanker et al. 2015). These birth cohort
studies have used well-developed metrics of exposure and outcomes at various
stages of childhood development, such as neonatal respiratory histories, increased
frequency of infant respiratory infections, infant wheeze and lung function mea-
sures up to early childhood.
A particular concern in South Africa is exposure to asbestos, silica and other
minerals from large mine dumps in areas generally remote from industrial centres.
These dumps have been associated with both acute and chronic respiratory out-
comes, including chronic obstructive lung disease, pneumoconiosis and cancers of
the respiratory tract. The risk of living in close proximity to a mine dump has been
associated with increased risks of asthma, chronic bronchitis, pneumonia and
emphysema, as well as symptoms of chronic cough and wheeze among those
above the age of 55 (Nkosi et al. 2015). The cancer-related risk in the study by
Nkosi et al. (2015) is of interest, as cancer and pollution studies in southern Africa
are almost non-existent. This is largely because of the absence of national
population-based cancer registries and the lack of appropriate measures of cumu-
lative pollution exposure within communities. Mzileni et al. (1999) showed an
increased risk of lung cancer in men working in dusty environments and in men and
women residing in asbestos-mining communities (Mzileni et al. 1999).
Faced with the challenges of conducting large epidemiological studies with
robust measures of exposure, designs that incorporate burden of disease analyses
or mortality databases become important approaches to understanding the relation-
ships between pollution and respiratory health. The South African census data has
therefore been used to determine the burden of respiratory disease in children and
adults due to indoor and ambient pollution. Approximately 2500 excess deaths, or
0.5% of all deaths, and 60,934 disability-adjusted life years (DALYs) have been
associated with exposure to indoor solid fuel use in South Africa (Norman et al.
2007a).
Indoor air pollution is now clearly understood to have the greatest burden of
non-communicable disease globally causing approximately 3.5–4 million deaths
per year (Gordon and et al. 2014).
Heart Disease
Cardiovascular diseases (CVD), such as heart valve problems, stroke, arrhythmia
and “heart attacks”, currently cause about a third of deaths globally and are likely
increasing in both developing and developed countries (Deaton et al. 2011). The
short- and long-term effects of air pollutants on CVD have been little studied in
developing countries however.
The most recent burden of disease analysis of the South African census esti-
mated that 3.7% of all cardiopulmonary deaths in South Africa are due to ambient
air pollution (Norman et al. 2007b). The only completed South African
334 E. Cairncross et al.
epidemiological study used a case-crossover design for almost 150,000 cardiovas-
cular and respiratory deaths in Cape Town, together with pollution data from the
city’s monitoring stations for 2001–2006 (Wichmann and Voyi 2012). It found a
significant 3% increase in CVD mortality per interquartile increase in NO2, PM10
and SO2 (8 μg/m3) in the warm season but found no effects in the winter season.
Limitations of this study were the use of ecological measures of exposure (air
pollution levels at one monitoring station representing levels in an area) and
outcome (mortality in an area).
A cohort study of 600 adults in four informal settlements in the Western Cape is
currently underway. CVD outcomes will be measured by questionnaire, and air
pollution will be estimated by land-use regression modelling to produce spatially
distributed air pollution levels (Dalvie et al. 2014).
Other Health Conditions
Cancers of the respiratory tract caused by air pollution accounted for 5.1% of all
respiratory cancers and 1.1% of acute respiratory tract infection-related deaths in
children under 5 years. These accounted for 0.9% of all deaths and 0.4% of all years
of life lost (YLL) in South Africa (Norman et al. 2007b).
There is increasing evidence from epidemiologic and animal studies that air
pollution might cause central nervous system (CNS) effects such as chronic brain
inflammation, white matter abnormalities leading to increased risk for autism,
lower IQ in children, behaviour problems and neurodegenerative diseases such as
Parkinson’s disease and Alzheimer’s disease (Block et al. 2012). The mechanism of
CNS effects is not well understood however; air pollutants either have direct effects
on the CNS or else indirect effects via the cardiovascular system. Many air
pollutants are associated with adverse effects on the CNS, including particulate
matter, polycyclic aromatic hydrocarbons (PAHs), black carbon, heavy metals,
volatile organic compounds (VOCs), environmental tobacco smoke (ETS), ozone
and carbon monoxide (CO). The mechanisms by which outdoor pollutants could
impact brain function include the indirect effects of peripheral inflammation,
changes in the blood-brain barrier and direct neuronal and white matter injury.
Neurotoxicity is likely to arise during periods of highest vulnerability (in utero,
childhood and old age) and from lifetime exposure. Epidemiological studies have
provided evidence that living in conditions with elevated air pollution is linked to
decreased cognitive function, lower neurobehavioural testing scores in children, a
decline in neuropsychological development in the first 4 years of life and neuropa-
thology (Block et al. 2012). Genetic factors and epigenetic influences may modify
CNS effects due to air pollution. Further research is required to establish CNS
effects due to air pollution, as quantitative data from South Africa are lacking. A
cohort study is being conducted on neurobehavioural effects due to pesticide drift
among schoolchildren in the rural Western Cape (Baseera et al. 2016).
20 Climate Change, Air Pollution and Health in South Africa 335
Current and Future Climate Hazards in South Africa
Global climate change is predicted to further the trends of marked temperature rise
in South Africa, alongside increased rainfall variability, sea level rise and more
extreme weather events (South Africa INDC 2015). Under a high-emission scenario
(RCP8.5),8 mean annual temperature is projected to rise by about 5.1 �C on average
from 1990 to 2100 (and by 1.4 �C under the low scenario of RCP2.6) and the annual
average of “heatwaves” (at least seven consecutive days with maximum tempera-
tures above the 90th percentile threshold for that time of the year) from under 5 days
to an average 145 days during the same period (or 25 days under RCP2.6). The
longest dry spell is projected to increase by about 30 days to approximately
110 days in 2100 (or by less than 10 days under RCP2.6), with continuing large
year-to-year variability (World Health Organisation 2015). The Mediterranean-
type climatic region (the south-western Cape Province) is at particular risk of a
drier climate (Dept. of Environmental Affairs 2016).
Without significant adaptation under a high-emission scenario, 13,900 people in
South Africa per year on average may be affected by flooding due to sea level rise
between 2070 and 2100. An additional 8500 people annually above the estimated
affected population of 45,900 in 2010 may be at risk of inland river flooding by
2030 as a result of climate change.9 No change in the number of days with very
heavy precipitation (20 mm or more) is projected under either high- or
low-emission scenarios [RCP 2.6], remaining around 6–7 days on average (World
Health Organisation 2015).
Future Health Risks of Climate Change and Air Pollution
Increases in mean temperatures and prolonged heatwaves raise the risk of air
pollution and consequent health impacts via several pathways: more ground-level
ozone affects lung function and causes respiratory symptoms, eye irritation and
broncho-constriction, as does smoke from more frequent and intense wildfires; and
more aeroallergens (pollens, spores, moulds and allergenic plants) increase allergic
reactions and asthma (Jonathan Patz and Frumkin 2016). Those with pre-existing
respiratory and cardiovascular conditions, especially the elderly, are most vulner-
able to heatwaves and episodes of poor air quality (Myers and Rother 2013).
Occupational groups with prolonged sun and heat exposure in South Africa, such
as manual labourers in the agricultural, construction and mining sectors, are
vulnerable to sunburn, sleeplessness, irritability and heat exhaustion (Mathee
et al. 2010). Residents of poorly constructed and informal housing, which is highly
8Model projections from CMIP5 for RCP8.5 and RCP2.6.9World Resources Institute Aqueduct Global Flood Analyzer, which assumes continued current
socio-economic trends and a 25-year flood protection. http://www.wri.org
336 E. Cairncross et al.
prevalent in cities and towns across South Africa, are most at risk during extreme
events, such as heatwaves (Scovronick and Armstrong 2012), fires, floods and
storms. In rural areas such as the northern Limpopo Province, future increases in
temperature and declining rainfall under climate change scenarios up to 2050 may
result in significantly more childhood diarrhoea and respiratory infections, which
are currently most prevalent, and slight increases in the incidence of asthma,
malaria and meningitis (Thompson et al. 2012).
A study in under-five children in the Cape Town Metropolitan Area (CTMA),
based on diarrhoea incidence data from two peak periods in 2012–2013 and
2013–2014, found an association with rising minimum and maximum temperatures,
which suggests the need for public early-warning systems when temperature
changes are expected (Musengimana et al. 2016).
Opportunities for Climate-Health Co-benefits: Measuresto Mitigate Air Pollutants and GHG Emissions
Although climate change has been recognised as a major threat to public health in
the twenty-first century, it also presents a significant opportunity to improve public
health by prioritising measures that can improve air quality in the short term and
can mitigate GHG emissions and improve resilience in a changing climate (Watts
et al. 2015). Key measures are described below with reference to contemporary data
and examples from different sectors of the South African economy.
Energy Sector
South Africa has great potential for adding renewable energy to the electricity
system: a large land area with a low population density so space is not a constraint, a
widespread interconnected electricity system that enables spatial aggregation and
minimal seasonality of solar and wind energy supply. A detailed analysis of
national wind and solar resources concluded that more than 80% of
South Africa’s land mass has enough wind resource for economical wind farms
with very high annual load factors of greater than 30%,10 that up to 65% of
electricity supply can be achieved from a combined wind and solar PV fleet without
any significant excess energy and that low seasonality in both wind and solar PV
10Another study calculated that in order to generate enough electricity to meet current
South African demand (approx. 250 TWh/year), 0.6% of available South African land mass
would need to be dedicated to wind farms with an installed capacity of approx. 75 GW (Energy
Centre 2016).
20 Climate Change, Air Pollution and Health in South Africa 337
supplies makes the integration easier, because no seasonal storage is required to
balance fluctuations (Energy Centre 2016).
A more recent analysis calculated that a “re-optimised” mix of solar PV, wind and
natural gas providing 70% of national power by 2040 would be almost R90 billion
per year cheaper than a “business-as-usual” scenario by then, even before factoring in
the cost savings of an estimated 60% reduction in CO2 emissions.
South Africa therefore has the potential to replace a large proportion, if not all, of
its coal-based power with renewable wind and solar energy, at negative carbon-
avoidance cost and stimulate a local solar PV and wind manufacturing industry
(Wright et al. 2016).
The total phase-out of coal-based power by 2050, the decommissioning of the
CTL plant by 2040, and reducing transport emissions could enable South Africa to
meet its low-carbon target of 214 Mt CO2-eq per year by 2050 and achieve a carbon
budget 40–60% lower than the current trajectory. Co-benefits would include the
reduction of air and water pollution from coal mining and combustion and job
creation and re-industrialisation in the renewable energy sector.11
Industrial Sector
The industrial sector is the biggest user of energy in South Africa, accounting for
approximately half of national electricity consumption. Consumption in the mining
sector is primarily for ore processing, pumping and heating, ventilation and cooling
systems, for iron and steel production furnaces and for electrochemical processes in
the non-ferrous metals subsector. Concerted efforts to improve both technological
and process efficiencies in these energy-intensive subsectors would yield large
savings in electricity consumption and significant decreases in air pollution.
The case study below on the Multi-Point Plan for reduction of SO2 in the South
Durban Basin illustrates the importance too of stakeholder engagement and over-
sight in significantly reducing chronic air pollution in a large metropolitan
industrial area.
Human Settlements
The 18 major metropoles in South Africa, home to 46% of the total population but
occupying only 4.6% of land space, consume, with a number of secondary cities,
about 37% of national energy, 46% of national electricity consumption, 52% of
petrol and diesel consumption, 32% of energy-related GHG emissions and 70% of
wealth production (Wolpe and Reddy 2015).
11Coal power plants consume 7–8% of the power that they produce, which will reduce national
power demand.
338 E. Cairncross et al.
The state’s Free Basic Alternative Energy (FBAE) programme aims to provide
alternative energy free of charge to indigent households in non-electrified areas to
support their basic needs. Pilot projects have included installation of SWH and
geysers, clean cooking fuels (methanol), insulated ceilings, hot water boxes, biogel
lighting and more efficient cooking stoves and lighting. The FBAE is poorly
implemented however, and existing projects are benefiting only a limited number
of households (Mohlakoana 2014).
Climate mitigation measures in some South African cities include RE from
landfill gas, sewerage methane, micro-hydro on water distribution systems and
solar PV on rooftops, provision of energy subsidies to the poor, promotion of EE,
reduction of water leakage distribution systems and waste recycling (Department of
Environmental Affairs 2015).
Transport Sector
The transport sector is the main consumer of energy in most South African cities.
Effective management of transport supply and demand to reduce transport emis-
sions can have significant co-benefits for public health and quality of life due to less
air pollution and increased physical activity (Woodcock et al. 2009). Measures
recommended by national and municipal transport policies in South Africa to help
promote public and non-motorised transport modes include urban densification,
better public transport and better infrastructure for cycling and walking, and these
are being implemented by means of integrated transport plans in metropolitan
areas. Transport emissions could also be reduced by requiring all new public
transport vehicles to be low carbon, by shifting road freight to rail where possible
and by promoting greater fuel efficiency, driving efficiency and system efficiency
(Department of Transport 2006). Nevertheless, emission reductions in the transport
sector have been limited, and traffic congestion and private commuter vehicles
remain the norm. It is clear that a range of strategies are required to shift
behavioural dynamics, using both incentive and disincentive schemes.
Healthcare Sector
Climate change and air pollution have important implications for the healthcare
sector. Extreme weather events, such as flooding and heatwaves, may directly
impact health system infrastructure in the form of structural damage and power
outages at times when health centres may be struggling already with the health
impact of such events. Direct and indirect health impacts of climate change may
also weaken an already overburdened health system by adding to staff workload
and overwhelming emergency response capacity to disease outbreaks (Myers and
Rother 2013).
20 Climate Change, Air Pollution and Health in South Africa 339
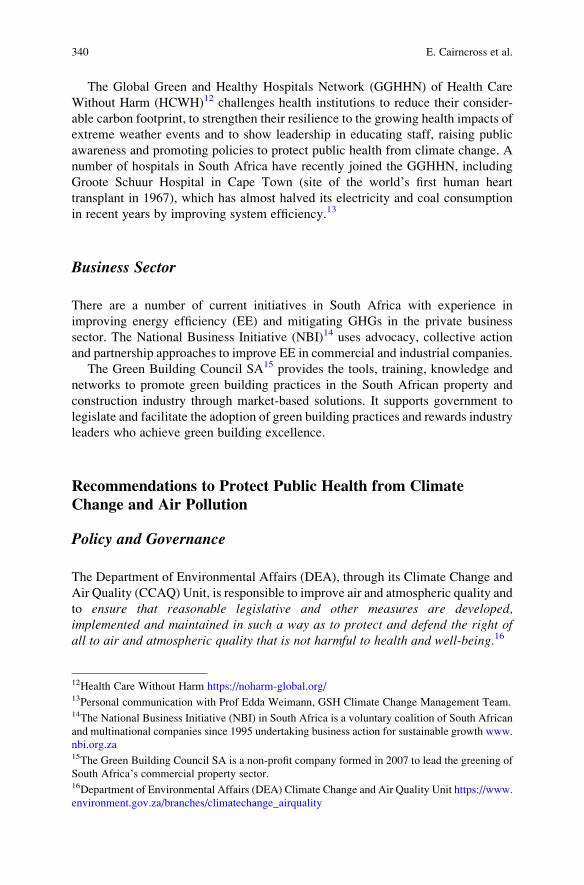
The Global Green and Healthy Hospitals Network (GGHHN) of Health Care
Without Harm (HCWH)12 challenges health institutions to reduce their consider-
able carbon footprint, to strengthen their resilience to the growing health impacts of
extreme weather events and to show leadership in educating staff, raising public
awareness and promoting policies to protect public health from climate change. A
number of hospitals in South Africa have recently joined the GGHHN, including
Groote Schuur Hospital in Cape Town (site of the world’s first human heart
transplant in 1967), which has almost halved its electricity and coal consumption
in recent years by improving system efficiency.13
Business Sector
There are a number of current initiatives in South Africa with experience in
improving energy efficiency (EE) and mitigating GHGs in the private business
sector. The National Business Initiative (NBI)14 uses advocacy, collective action
and partnership approaches to improve EE in commercial and industrial companies.
The Green Building Council SA15 provides the tools, training, knowledge and
networks to promote green building practices in the South African property and
construction industry through market-based solutions. It supports government to
legislate and facilitate the adoption of green building practices and rewards industry
leaders who achieve green building excellence.
Recommendations to Protect Public Health from ClimateChange and Air Pollution
Policy and Governance
The Department of Environmental Affairs (DEA), through its Climate Change and
Air Quality (CCAQ) Unit, is responsible to improve air and atmospheric quality and
to ensure that reasonable legislative and other measures are developed,implemented and maintained in such a way as to protect and defend the right ofall to air and atmospheric quality that is not harmful to health and well-being.16
12Health Care Without Harm https://noharm-global.org/13Personal communication with Prof Edda Weimann, GSH Climate Change Management Team.14The National Business Initiative (NBI) in South Africa is a voluntary coalition of South African
and multinational companies since 1995 undertaking business action for sustainable growth www.
nbi.org.za15The Green Building Council SA is a non-profit company formed in 2007 to lead the greening of
South Africa’s commercial property sector.16Department of Environmental Affairs (DEA) Climate Change and Air Quality Unit https://www.
environment.gov.za/branches/climatechange_airquality
340 E. Cairncross et al.
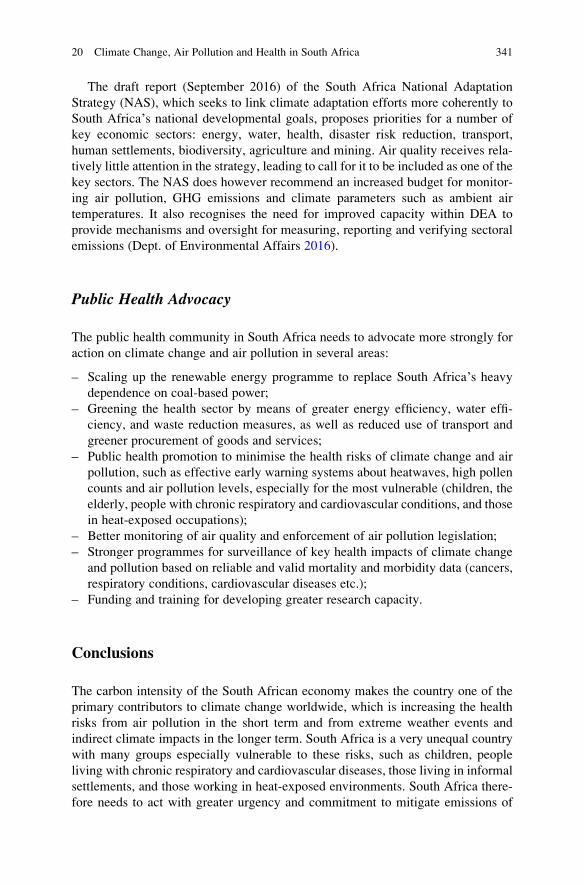
The draft report (September 2016) of the South Africa National Adaptation
Strategy (NAS), which seeks to link climate adaptation efforts more coherently to
South Africa’s national developmental goals, proposes priorities for a number of
key economic sectors: energy, water, health, disaster risk reduction, transport,
human settlements, biodiversity, agriculture and mining. Air quality receives rela-
tively little attention in the strategy, leading to call for it to be included as one of the
key sectors. The NAS does however recommend an increased budget for monitor-
ing air pollution, GHG emissions and climate parameters such as ambient air
temperatures. It also recognises the need for improved capacity within DEA to
provide mechanisms and oversight for measuring, reporting and verifying sectoral
emissions (Dept. of Environmental Affairs 2016).
Public Health Advocacy
The public health community in South Africa needs to advocate more strongly for
action on climate change and air pollution in several areas:
– Scaling up the renewable energy programme to replace South Africa’s heavydependence on coal-based power;
– Greening the health sector by means of greater energy efficiency, water effi-
ciency, and waste reduction measures, as well as reduced use of transport and
greener procurement of goods and services;
– Public health promotion to minimise the health risks of climate change and air
pollution, such as effective early warning systems about heatwaves, high pollen
counts and air pollution levels, especially for the most vulnerable (children, the
elderly, people with chronic respiratory and cardiovascular conditions, and those
in heat-exposed occupations);
– Better monitoring of air quality and enforcement of air pollution legislation;
– Stronger programmes for surveillance of key health impacts of climate change
and pollution based on reliable and valid mortality and morbidity data (cancers,
respiratory conditions, cardiovascular diseases etc.);
– Funding and training for developing greater research capacity.
Conclusions
The carbon intensity of the South African economy makes the country one of the
primary contributors to climate change worldwide, which is increasing the health
risks from air pollution in the short term and from extreme weather events and
indirect climate impacts in the longer term. South Africa is a very unequal country
with many groups especially vulnerable to these risks, such as children, people
living with chronic respiratory and cardiovascular diseases, those living in informal
settlements, and those working in heat-exposed environments. South Africa there-
fore needs to act with greater urgency and commitment to mitigate emissions of
20 Climate Change, Air Pollution and Health in South Africa 341
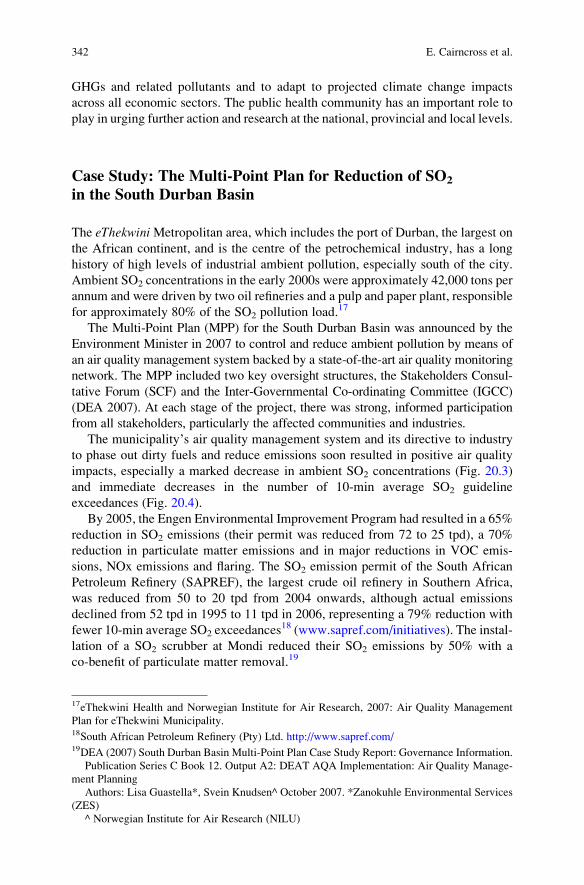
GHGs and related pollutants and to adapt to projected climate change impacts
across all economic sectors. The public health community has an important role to
play in urging further action and research at the national, provincial and local levels.
Case Study: The Multi-Point Plan for Reduction of SO2
in the South Durban Basin
The eThekwiniMetropolitan area, which includes the port of Durban, the largest on
the African continent, and is the centre of the petrochemical industry, has a long
history of high levels of industrial ambient pollution, especially south of the city.
Ambient SO2 concentrations in the early 2000s were approximately 42,000 tons per
annum and were driven by two oil refineries and a pulp and paper plant, responsible
for approximately 80% of the SO2 pollution load.17
The Multi-Point Plan (MPP) for the South Durban Basin was announced by the
Environment Minister in 2007 to control and reduce ambient pollution by means of
an air quality management system backed by a state-of-the-art air quality monitoring
network. The MPP included two key oversight structures, the Stakeholders Consul-
tative Forum (SCF) and the Inter-Governmental Co-ordinating Committee (IGCC)
(DEA 2007). At each stage of the project, there was strong, informed participation
from all stakeholders, particularly the affected communities and industries.
The municipality’s air quality management system and its directive to industry
to phase out dirty fuels and reduce emissions soon resulted in positive air quality
impacts, especially a marked decrease in ambient SO2 concentrations (Fig. 20.3)
and immediate decreases in the number of 10-min average SO2 guideline
exceedances (Fig. 20.4).
By 2005, the Engen Environmental Improvement Program had resulted in a 65%
reduction in SO2 emissions (their permit was reduced from 72 to 25 tpd), a 70%
reduction in particulate matter emissions and in major reductions in VOC emis-
sions, NOx emissions and flaring. The SO2 emission permit of the South African
Petroleum Refinery (SAPREF), the largest crude oil refinery in Southern Africa,
was reduced from 50 to 20 tpd from 2004 onwards, although actual emissions
declined from 52 tpd in 1995 to 11 tpd in 2006, representing a 79% reduction with
fewer 10-min average SO2 exceedances18 (www.sapref.com/initiatives). The instal-
lation of a SO2 scrubber at Mondi reduced their SO2 emissions by 50% with a
co-benefit of particulate matter removal.19
17eThekwini Health and Norwegian Institute for Air Research, 2007: Air Quality Management
Plan for eThekwini Municipality.18South African Petroleum Refinery (Pty) Ltd. http://www.sapref.com/19DEA (2007) South Durban Basin Multi-Point Plan Case Study Report: Governance Information.
Publication Series C Book 12. Output A2: DEAT AQA Implementation: Air Quality Manage-
ment Planning
Authors: Lisa Guastella*, Svein Knudsen^ October 2007. *Zanokuhle Environmental Services
(ZES)
^ Norwegian Institute for Air Research (NILU)
342 E. Cairncross et al.
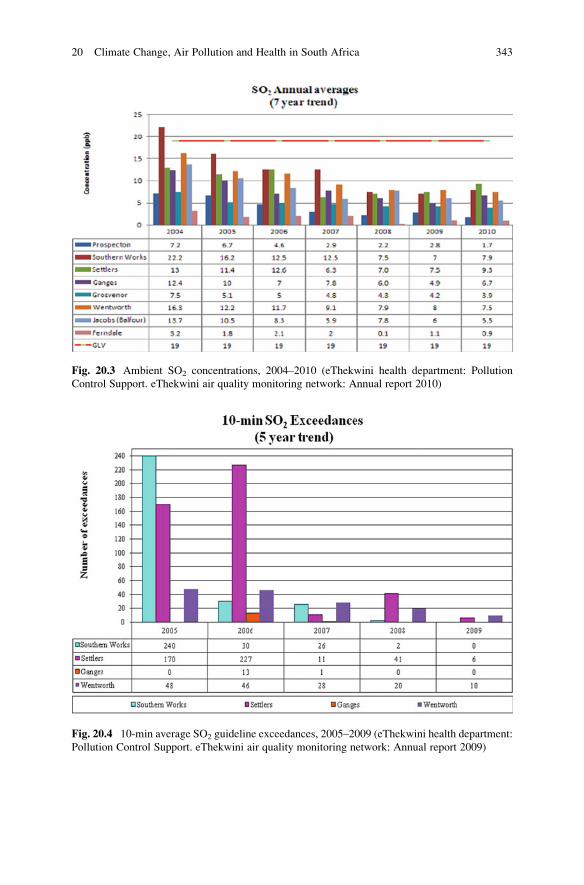
Fig. 20.3 Ambient SO2 concentrations, 2004–2010 (eThekwini health department: Pollution
Control Support. eThekwini air quality monitoring network: Annual report 2010)
Fig. 20.4 10-min average SO2 guideline exceedances, 2005–2009 (eThekwini health department:
Pollution Control Support. eThekwini air quality monitoring network: Annual report 2009)
20 Climate Change, Air Pollution and Health in South Africa 343
References
Albers PN, Wright CY, Voyi KV, Mathee A (2015) Household fuel use and child respiratory ill
health in two towns in Mpumalanga, South Africa. S Afr Med J 105(7):573–577. doi:10.7196/
SAMJnew.7934
Baseera W, Mhlanga S, Roosli M, Dalvie M (2016) An epidemiological cohort study of school-
going children investigating reproductive and neurobehavioral effects due to environmental
pesticide and cell phone use exposure in the Western Cape, South Africa (Research proposal).
Faculty of Health Sciences, University of Cape Town
Block ML, Elder A, Auten RL, Bilbo SD, Chen H, Chen J-C,. .. Dorman DC (2012) The outdoor
air pollution and brain health workshop. Neurotoxicology 33(5):972–984
Bofinger S, Zimmermann B, Gerlach-Fraunhofer A, Bischof-Niemz T, Mushwana C (2016) Wind
and solar PV resource aggregation study for South Africa Pretoria
Burger L, von Gruenewaldt R, Bird T (2014) Atmospheric impact report: Sasol Secunda facility.
Retrieved from http://www.srk.co.za/files/File/South-Africa/publicDocuments/Sasol_Post
ponement/Nitro/Annexure_A_Nitro_Atomospheric_Impact_Report.pdf
Cairncross E (2016) The State of South Africa’s air quality monitoring network and its air quality.
Paper presented at the National Association for Clean Air
Coetzee AM, Smith FC, van der Merwe CA, Dreyer RJ (1986) The influence of air pollution on
health in the Sasolburg area. S Afr Med J 70(6):339–343
CSIR Energy Centre (2016) Statistics of utility-scale solar PV and wind in South Africa in the first
half of 2016. Retrieved from Pretoria
Dalvie M, Jeebhay M, Naidoo R (2014) An epidemiological cohort study of school children
investigating asthma and of adults investigating cardiopulmonary outcomes (Research pro-
posal). Department of Environmental Affairs and Developmental Planning. University of Cape
Town
de la Rue du Can Stephane LV, Leventis Greg, Berkeley Lawrence, Covary Theo, Professor Xia
(2013) Energy efficiency country study: Republic of South Africa. Retrieved from https://ies.
lbl.gov/sites/all/files/south_africa_country_study_lbnl_report_final_0.pdf
Deaton C, Froelicher ES, Wu LH, Ho C, Shishani K, Jaarsma T (2011) The global burden of
cardiovascular disease. Eur J Cardiovasc Nurs 10(Suppl 2):S5–13. doi:10.1016/S1474-5151
(11)00111-3
Department of Environmental Affairs (2011) National climate change response white paper.
Republic of South Africa, Pretoria
Department of Environmental Affairs (2015) SA 2050 carbon calculator retrieved from http://
2050.lateral.co.za/. http://2050.lateral.co.za/
Department of Transport (2006) National Land Transport Strategic Framework (NLTSF). Retrieved
from http://us-cdn.creamermedia.co.za/assets/articles/attachments/03496_notice1468.pdf
Dept. of Energy (2015) Annual fuel sales volumes pretoria. Retrieved from http://www.energy.
gov.za/files/media/media_SAVolumes.html
Dept. of Energy (2016) Independent power producers program. Retrieved from http://www.
energy.gov.za/files/media/media_SAVolumes.html
Dept. of Environmental Affairs (2012a) Highveld priority area: air quality management plan.
Government Gazette No. 35072, 2 Mar 2012. Pretoria
Dept. of Environmental Affairs (2012b) Waterberg-Bojanala priority area air quality management
plan
Dept. of Environmental Affairs (2013) The medium term review of the 2009 vaal triangle priority
area: air quality management plan final review report. Retrieved from
Dept. of Environmental Affairs (2016) South Africa National Adaptation Strategy- DRAFT (Sept
2016). Retrieved from
du Preez K, Mandalakas AM, Kirchner HL, Grewal HM, Schaaf HS, van Wyk SS, Hesseling AC
(2011) Environmental tobacco smoke exposure increases Mycobacterium tuberculosis infec-
tion risk in children. Int J Tuberc Lung Dis 15(11):1490–1496, i. doi:10.5588/ijtld.10.0759
344 E. Cairncross et al.
Eskom (2015) Factsheets 2015. Statistical table 1A: ten year technical statistics. Retrieved from
http://www.eskom.co.za/IR2015/Documents/Eskom_fact_sheets_2015.pdf
Gordon et al (2014) Respiratory risks from household air pollution in low and middle income
countries. Lancet Respir Med Comm 2(10):823–860
Graveland H, Van Roosbroeck SA, Rensen WM, Brunekreef B, Gehring U (2011) Air pollution
and exhaled nitric oxide in Dutch schoolchildren. Occup Environ Med 68(8):551–556. doi:10.
1136/oem.2010.056812
International Energy Agency (2015) CO2 emissions from fuel combustion highlights. Retrieved
from www.iea.org
Jafta N, Jeena PM, Barregard L, Naidoo RN (2015) Childhood tuberculosis and exposure to indoor
air pollution: a systematic review and meta-analysis. Int J Tuberc Lung Dis 19(5):596–602.
doi:10.5588/ijtld.14.0686
Jung DY, Leem JH, Kim HC, Kim JH, Hwang SS, Lee JY, Kim BJ, Hong YC, Hong SJ, Kwon HJ
(2015) Effect of traffic-related air pollution on allergic disease: results of the Children’s health
and environmental research. Allergy, Asthma Immunol Res 7(4):359–366. doi:10.4168/aair.
2015.7.4.359
Kistnasamy EJ, Robins TG, Naidoo N (2008) The relationship between asthma and ambient air
pollutants among primary school students in Durban, South Africa. Int J Environment and
Health 2:365–385
Mann JK, Balmes JR, Bruckner TA, Mortimer KM, Margolis HG, Pratt B, Hammond SK,
Lurmann FW, Tager IB (2010) Short-term effects of air pollution on wheeze in asthmatic
children in Fresno, California. Environ Health Perspect 118(10):1497–1502. doi:10.1289/ehp.
0901292
Mathee A, Oba J, Rose A (2010) Climate change impacts on working people (the HOTHAPS
initiative): findings of the South African pilot study. Global Health Action, 3
McConnell R, Islam T, Shankardass K, Jerrett M, Lurmann F, Gilliland F, Gauderman J, Avol E,
Künzli N, Yao L, Peters J, Berhane K (2010) Childhood incident asthma and traffic-related air
pollution at home and school. Environ Health Perspect 118(7):1021–1026. doi:10.1289/ehp.
0901232
Mohlakoana N (2014) Implementing the south african free basic alternative energy policy. (Ph.
D.), University of Twente. Retrieved from http://doc.utwente.nl/93045/1/thesis_N_
Mohlakoana.pdf
Musengimana G, Mukinda FK, Machekano R, Mahomed H (2016) Temperature variability and
occurrence of diarrhoea in children under five-years-old in Cape town metropolitan
sub-districts. Int J Environ Res Public Health 13(9):859
Myers JE, Rother H (2013) Public health impact and response to climate change in South Africa.
In: Padarath A, English R (eds) South African health review 2012/13. Health Systems Trust,
Durban
Mzileni O, Sitas F, Steyn K, Carrara H, Bekker P (1999) Lung cancer, tobacco, and environmental
factors in the African population of the Northern Province, South Africa. Tob Control 8
(4):398–401. Retrieved from http://tobaccocontrol.bmj.com/content/8/4/398.full.pdf
Naidoo R, Gqaleni N., Batterman S, Robins T (2007) South Durban health study. Final Project
Report. Center for Occupational and Environmental Health, University of KwaZulu-Natal,
Durban, South Africa. Retrieved from http://doeh.ukzn.ac.za/Libraries/Documents/SDHS_
FINAL_Report_revision_February_2007.sflb.ashx
Naidoo RN, Robins TG, Batterman S, Mentz G, Jack C (2013) Ambient pollution and respiratory
outcomes among schoolchildren in Durban, South Africa. Sajch 7(4):127–134. doi:10.7196/
sajch.598
Nastos PT, Paliatsos AG, Anthracopoulos MB, Roma ES, Priftis KN (2010) Outdoor particulate
matter and childhood asthma admissions in Athens, Greece: a time-series study. Environ
Health 9:45. doi:10.1186/1476-069X-9-45
20 Climate Change, Air Pollution and Health in South Africa 345
Nkosi V, Wichmann J, Voyi K (2015) Chronic respiratory disease among the elderly in
South Africa: any association with proximity to mine dumps? Environ Health 14:33. doi:10.
1186/s12940-015-0018-7
Norman R, Barnes B, Mathee A, Bradshaw D (2007a) Estimating the burden of disease attribut-
able to indoor air pollution from household use of solid fuels in South Africa in 2000. S Afr
Med J 97(8 Pt 2):764–771
Norman R, Cairncross E, Witi J, Bradshaw D (2007b) Estimating the burden of disease attributable
to urban outdoor air pollution in South Africa in 2000. S Afr Med J 97(8 Pt 2):782–790
Pan G, Zhang S, Feng Y, Takahashi K, Kagawa J, Yu L et al (2010) Air pollution and children’srespiratory symptoms in six cities of Northern China. Respir Med 104(12):1903–1911. doi:10.
1016/j.rmed.2010.07.018
Pillay-vanWyk V, Msemburi W, Laubscher R, Dorrington RE, Groenewald P, Glass T et al (2016)
Mortality trends and differentials in South Africa from 1997 to 2012: second National Burden
of Disease Study. Lancet Glob Health 4(9):e642–e653. Retrieved from http://ac.els-cdn.com/
S2214109X16301139/1-s2.0-S2214109X16301139-main.pdf?_tid¼7f53138e-855f-11e6-
b1c8-00000aab0f6c&acdnat¼1475055768_86aaba8344268e04584729b710d57390
Rehfuess EA, Tzala L, Best N, Briggs DJ, Joffe M (2009) Solid fuel use and cooking practices as a
major risk factor for ALRI mortality among African children. J Epidemiol Community Health
63(11):887–892. doi:10.1136/jech.2008.082685
Rovira E, Cuadras A, Aguilar X, Esteban L, Borras-Santos A, Zock JP, Sunyer J (2014) Asthma,
respiratory symptoms and lung function in children living near a petrochemical site. Environ
Res 133:156–163. doi:10.1016/j.envres.2014.05.022
Scovronick N, Armstrong B (2012) The impact of housing type on temperature-related mortality
in South Africa, 1996–2015. Environ Res 113:46–51. Retrieved from http://ac.els-cdn.com/
S0013935112000072/1-s2.0-S0013935112000072-main.pdf?_tid¼78c1d89e-8563-11e6-
806c-00000aab0f6b&acdnat¼1475057475_3e4fcf5dd1f15c684303fee5e73ee603
Shirinde J, Wichmann J, Voyi K (2014) Association between wheeze and selected air pollution
sources in an air pollution priority area in South Africa: a cross-sectional study. Environ Health
13(1):32. doi:10.1186/1476-069x-13-32
South African Petroleum Industries Association. (2014). Annu Rep. Retrieved from www.sapia.
org.za/
Strickland MJ, Darrow LA, Klein M, Flanders WD, Sarnat JA, Waller LA, Sarnat SE, Mulholland
JA, Tolbert PE (2010) Short-term associations between ambient air pollutants and pediatric
asthma emergency department visits. Am J Respir Crit Care Med 182(3):307–316. doi:10.
1164/rccm.200908-1201OC
Synfuels (2014) Synfuels AIR2014
Terblanche AP, Opperman L, Nel CM, Reinach SG, Tosen G, Cadman A (1992) Preliminary
results of exposure measurements and health effects of the Vaal Triangle Air Pollution Health
Study. S Afr Med J 81(11):550–556
Thompson AA, Matamale L, Kharidza SD (2012) Impact of climate change on children’s health inLimpopo Province, South Africa. Int J Environ Res Public Health 9(3):831–854. Retrieved
from https://www.ncbi.nlm.nih.gov/pmc/articles/PMC3367281/pdf/ijerph-09-00831.pdf
Vanker A, Barnett W, Nduru PM, Gie RP, Sly PD, Zar HJ (2015) Home environment and indoor
air pollution exposure in an African birth cohort study. Sci Total Environ 536:362–367. doi:10.
1016/j.scitotenv.2015.06.136
Watts N, Adger WN, Agnolucci P, Blackstock J, Byass P, Cai W,. .. Cooper A (2015) Health and
climate change: policy responses to protect public health. Lancet 386(10006):1861–1914
Weinmayr G, Romeo E, De Sario M, Weiland SK, Forastiere F (2010) Short-term effects of PM10
and NO2 on respiratory health among children with asthma or asthma-like symptoms: a
systematic review and meta-analysis. Environ Health Perspect 118(4):449–457. doi:10.1289/
ehp.0900844
Wichmann J, Voyi K (2012) Ambient air pollution exposure and respiratory, cardiovascular and
cerebrovascular mortality in Cape Town, South Africa: 2001–2006. Int J Environ Res Public
Health 9(11):3978–4016. doi:10.3390/ijerph9113978
346 E. Cairncross et al.
Wolpe P, Reddy Y (2015) The contribution of low-carbon cities to South Africa’s greenhouse gasemissions reduction goals: briefing on urban energy use and greenhouse gas emissions.
Stockholm Environment Institute, Stockholm
Woodcock J, Edwards P, Tonne C, Armstrong BG, Ashiru O, Banister D, Roberts I (2009) Public
health benefits of strategies to reduce greenhouse-gas emissions: urban land transport. Lancet
374(9705):1930–1943
World Health Organisation (2015) Climate and health country profile 2015: South Africa
Retrieved from http://www.who.int/globalchange/resources/country-profiles/en/#S
Wright J, Bischof-Niemz T, Calitz J, Mushwana C (2016, November) Least-cost electricity mix
for South Africa by 2040: scenarios for South Africa’s future electricity mix. Paper presented at
the Windaba, Cape Town
Zora JE, Sarnat SE, Raysoni AU, Johnson BA, LiWW, Greenwald R, Holguin F, Stock TH, Sarnat
JA (2013) Associations between urban air pollution and pediatric asthma control in El Paso,
Texas. Sci Total Environ 448:56–65. doi:10.1016/j.scitotenv.2012.11.067
Zwi S, Davies JC, Becklake MR, Goldman HI, Reinach SG, Kallenbach JM (1990) Respiratory
health status of children in the eastern Transvaal highveld. S Afr Med J 78(11):647–653
Eugene Cairncross has a chemical engineering degree and a PhD. After many years working in a
variety of chemical industries, followed by a similar period in academia, he now focuses on air
pollution, coal power emissions, the burden of disease attributable to air pollution, on climate
change, marathon running, swimming and two grandchildren.
Aqiel Dalvie has a PhD in Public Health and is an academic at the University of Cape Town’sFaculty of Health Sciences within the Centre for Environmental and Occupational Health
Research in the School of Public Health and Family Medicine. His research interest include health
impacts due to endocrine disruptors, pesticides, air pollution, water pollution and climate change.
Rico Euripidou manages an environmental health campaign for groundWork, Friends of the
Earth, South Africa. He trained as an environmental epidemiologist at the London School of
Hygiene and Tropical Medicine. Previously, Rico worked for the National Poisons Information
Service and the University of Witwatersrand. Rico’s interests lie in energy policy, climate change
and public health, all of course interrelated.
James Irlam is an academic at the University of Cape Town Faculty of Health Sciences within the
Primary Health Care (PHC) Directorate. He believes that the PHC vision of Health for All depends
on a healthy environment. He is interested in the health impacts of climate change and in a socially
just transition towards renewable energy in South Africa.
Rajen Nithiseelan Naidoo, an associate professor and head of the Department in Occupational
and Environmental Health at the University of KwaZulu-Natal, has been in academic research for
over 25 years. His areas of research focus on occupational and environmental respiratory diseases,
with projects funded by major national and international agencies. He has over 50 peer-reviewed
publications, with presentations at several international conferences.
20 Climate Change, Air Pollution and Health in South Africa 347
Chapter 21
The Impact of Climate Change and AirPollution on the Caribbean
Muge Akpinar-Elci and Olaniyi Olayinka
Abstract A review of air pollution, the impact of climate change on air pollution,
and the population health impacts of these in the Caribbean region are discussed.
Air quality standards are not usually enforced in many Caribbean countries thereby
increasing the risks of morbidity and mortality from exposure to air pollutants.
Among people living in the Caribbean, an increase in respiratory diseases such as
asthma has been linked to exposure to air pollutants resulting from natural events
and especially human activities. Unfortunately, dependence on fossil fuels (region-
ally and globally), poor land use and waste management, and industrialization all
contribute to poor air quality in the Caribbean. In addition, climate change is
predicted to exacerbate air pollution and its negative health effects in a region
considered to be one of the most vulnerable to global climate change. Key drivers of
air pollution in the region are discussed, and recommendations on climate change
adaptation and mitigation strategies are highlighted.
Keywords Air pollution • Caribbean • Particulate matter • Air quality • Climate
change • Health impacts
Introduction
History is replete with the negative human impacts of air pollution (WHO 2008).
Although it is hard to find historical data on air pollution in the Caribbean, there are
reports suggesting a long history of air quality issues in the region (de Koning et al.
1985; Romieu et al. 1989; Sanhueza et al. 1982). For example, a 1996 World Bank
report on global air pollution from automobiles showed that one of the most
industrialized countries in the Caribbean produced leaded gasoline for local use
while exporting unleaded fuel (The World Bank 1996, p. 226); by the mid-1990s,
the use of leaded gasoline had significantly declined in many developed countries
due to public health safety concerns (Nriagu 1990). In a 2005 review of the public
M. Akpinar-Elci (*) • O. Olayinka (*)
School of Community & Environmental Health and Center for Global Health,
Old Dominion University, Norfolk, VA 23529, USA
e-mail: [email protected]; [email protected]
© Springer International Publishing AG 2018
R. Akhtar, C. Palagiano (eds.), Climate Change and Air Pollution,Springer Climate, DOI 10.1007/978-3-319-61346-8_21
349
health impacts of urban air quality in Latin America and the Caribbean, Cifuentes
and his colleagues suggested that exposure to particulate matter in 26 cities across
the region is “more than twice the US standard”; while ground-level ozone might be
a problem in the region, the lack of data made it difficult for the authors to conduct
ozone exposure-impact analysis (Cifuentes et al. 2005). Although countries in
WHO’s Southeast Asia and Western Pacific regions are the hardest hit, a couple
of population-based studies across the Caribbean suggests that significant air
quality problem still exists in the region (Akpinar-Elci et al. 2015, 2015; Amadeo
et al. 2015; Bautista et al. 2009; Brauer et al. 2015; Chafe et al. 2015; PAHO-WHO
2005).
Clean air is considered a fundamental human right globally; unfortunately, air
pollution remains a major contributor to morbidity and mortality, especially in
developing countries (including Caribbean countries) due to the general lack of air
quality regulations and enforcement coupled with socioeconomic, geographic, and
climatological factors (Amadeo et al. 2015; Jessamy 2016; Krzyzanowski and
Cohen 2008; Macpherson and Akpinar-Elci 2015; Schwindt et al. 2010; Segal
and Nilsson 2015; Tanveer et al. 2014). According to WHO, the attributable
mortality and disability adjusted life years (DALYs) due to outdoor air pollution
in the Americas subregion B (which include states and territories in the Caribbean)
were 30 deaths and 307 DALYS per 1000 population; these values exceed the
attributable mortality and DALYs (28 deaths and 200 DALYs per 1000 population)
reported from their more developed neighbors (the Americas subregion A including
Canada and the United States) (Ostro 2004). These statistics are not surprising as air
pollution is considered the largest environmental health risk factor globally. In fact,
the World Health Organization (WHO) estimated seven million deaths were linked
to air pollution in 2012. During the same year, outdoor air pollution accounted for
3.7 million deaths globally (WHO 2014a). It is projected that deaths from air
pollution will increase in the future as air quality deteriorates in major cities of
low- and middle-income countries. Globally, carbon dioxide (CO2), ground-level
ozone, nitrogen dioxide, particulate matter, and sulfur dioxide remain the major air
pollutants (Jacobson 2009).
In general, maintaining ambient air quality standards remain a challenge in many
parts of the Caribbean (Cifuentes et al. 2005; Jessamy 2016; Prospero et al. 2014).
This is likely to be compounded by climate change given that meteorological and
climatological factors (including local temperature, wind speed, wind direction,
poor air circulation, precipitation, and level of humidity) significantly impact air
quality (Jacob and Winner 2009; UNEP 2005, p. 3). Additionally, scientific evi-
dence has emerged suggesting a relationship between long-term weather patterns
(the climate) and human activities (IPCC 2007). For example, a change in the
climate favoring a rise in atmospheric temperature (either from natural or human
activities) is likely to increase the demand for air conditioning especially in tropical
climates where the mean daily minimum temperature is typically above 180 �C(Trewin 2014). This invariably increases energy consumption in residential and
commercial buildings. Because energy production is largely dependent on the
burning of fossil fuels, the downstream effects are an increase in the atmospheric
350 M. Akpinar-Elci and O. Olayinka
concentration of air pollutants (e.g., particulate matter such as black carbon) and
greenhouse gases (GHG). The long-term cumulative effects of GHG include global
warming, an important indicator of climate change (IPCC 2007). Also, there is
scientific evidence that a changing climate will alter the concentration of airborne
respiratory allergens due to the effect of CO2 and temperature on plant growth and
the health burden of meteorological events such as windblown dust and mold
(Gennaro et al. 2014; Gyan et al. 2005; Jacob and Winner 2009; Monteil 2008).
Since the Intergovernmental Panel on Climate Change (IPCC) was established to
assess the evidence on climate change in 1988, studies on the link between air
pollution and climate change have been widely investigated. Similarly, the scien-
tific community ramped up efforts to address air pollution-climate-sensitive health
issues. In this chapter, we will review the relationship between air pollution and
climate change and their impacts on the health of people in the Caribbean. Small
Island Developing States (SIDS) communities constitute around 5% of the global
population (AOSIS 2015). Caribbean states are developing economies and repre-
sent about half of the Alliance of Small Island States (AOSIS 2015; UN 2012;
UNEP et al. 2004). We especially focused on the Caribbean in this chapter due to
their large coastal areas and relatively small economies, which makes the region
highly vulnerable to the impact of climate change despite contributing little to
global greenhouse gas emission (GHG) (CDKN and ODI 2014).
Climate change and air pollution impact a range of health indicators in Small
Island Developing States (SIDS) raising problems for economies and national
security. While a comprehensive presentation of the scientific evidence is beyond
the scope of this chapter, we have tried to highlight some of the key relationships
between climate change and air pollution. Although historical events are alluded to
in this chapter, our assessment of the air quality issues facing people in the
Caribbean (Fig. 21.1.) is based on a review of epidemiologic studies, anecdotal
reports, and evidence presented in the 2014 IPCC Fifth Assessment Report. These
are followed by suggestions for mitigation and adaptation strategies to combat the
negative impacts of climate change.
Sources of Air Pollutants in the Caribbean
Generally, the main cause of air pollution in the Caribbean is human activities
including those related to the use of fossil fuels (Akpinar-Elci and Sealy 2014;
CDKN and ODI 2014; IPCC 2014). Some air pollutants, particularly GHGs, alter
the composition of the atmosphere and worsen the health impact of air pollution on
the Caribbean people despite the region contributing relatively little to global GHG
emissions (Akpinar-Elci and Sealy 2014; CDKN and ODI 2014; Dodman 2009). As
an indicator of urban air quality, the majority of the Caribbean countries reference
the WHO Air Quality Guidelines (AQG) for ambient PM2.5 (i.e., 10 μg/m3 annual
mean and 25 μg/m3 24-h mean) and PM10 (i.e., 20 μg/m3 annual mean and 50 μg/m3 24-h mean) (Cifuentes et al. 2005; Krzyzanowski and Cohen 2008). However,
21 The Impact of Climate Change and Air Pollution on the Caribbean 351
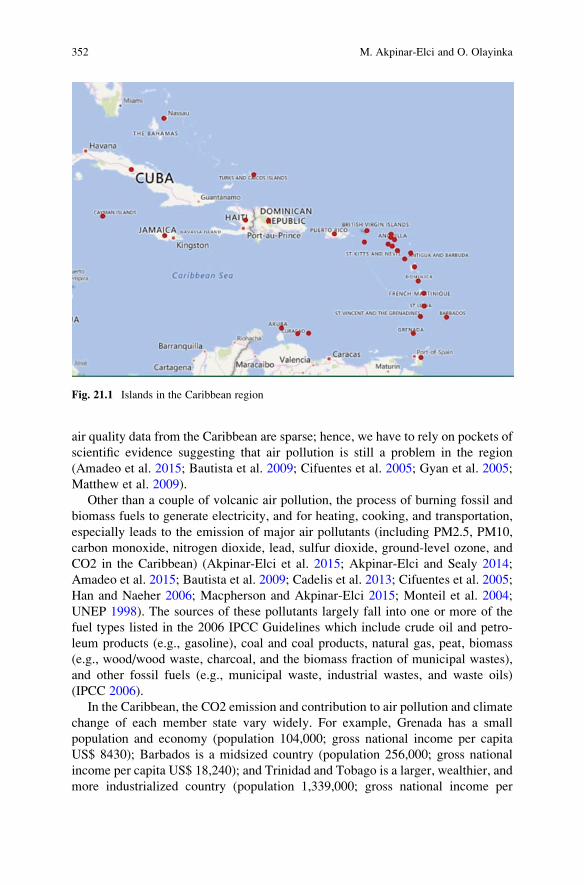
air quality data from the Caribbean are sparse; hence, we have to rely on pockets of
scientific evidence suggesting that air pollution is still a problem in the region
(Amadeo et al. 2015; Bautista et al. 2009; Cifuentes et al. 2005; Gyan et al. 2005;
Matthew et al. 2009).
Other than a couple of volcanic air pollution, the process of burning fossil and
biomass fuels to generate electricity, and for heating, cooking, and transportation,
especially leads to the emission of major air pollutants (including PM2.5, PM10,
carbon monoxide, nitrogen dioxide, lead, sulfur dioxide, ground-level ozone, and
CO2 in the Caribbean) (Akpinar-Elci et al. 2015; Akpinar-Elci and Sealy 2014;
Amadeo et al. 2015; Bautista et al. 2009; Cadelis et al. 2013; Cifuentes et al. 2005;
Han and Naeher 2006; Macpherson and Akpinar-Elci 2015; Monteil et al. 2004;
UNEP 1998). The sources of these pollutants largely fall into one or more of the
fuel types listed in the 2006 IPCC Guidelines which include crude oil and petro-
leum products (e.g., gasoline), coal and coal products, natural gas, peat, biomass
(e.g., wood/wood waste, charcoal, and the biomass fraction of municipal wastes),
and other fossil fuels (e.g., municipal waste, industrial wastes, and waste oils)
(IPCC 2006).
In the Caribbean, the CO2 emission and contribution to air pollution and climate
change of each member state vary widely. For example, Grenada has a small
population and economy (population 104,000; gross national income per capita
US$ 8430); Barbados is a midsized country (population 256,000; gross national
income per capita US$ 18,240); and Trinidad and Tobago is a larger, wealthier, and
more industrialized country (population 1,339,000; gross national income per
Fig. 21.1 Islands in the Caribbean region
352 M. Akpinar-Elci and O. Olayinka
capita US$ 24,240) (TheWorld Bank 2016). United Nations data show that in 2011,
Trinidad and Tobago emitted significantly more CO2 per capita than the United
States (37.2 and 16.8 metric tons of CO2 per capita, respectively), while emissions
in Barbados and Grenada were significantly lower (5.6 and 2.4 metric tons of CO2
per capita, respectively) (The United Nations 2015). Therefore, air pollution is a
huge public health concern in the highly industrialized Trinidad and Tobago.
Because of the close proximity of the Caribbean islands, air pollutants from one
island travel around the whole region, hence impacting the health of people at
distant sites.
According to a recent report, the energy and transportation sectors are respon-
sible for most of the air pollution in Trinidad and Tobago (UNFCCC 2013). In fact,
Trinidad, along with the Bahamas and Saint Kitts and Nevis, has one of the highest
registered vehicles rate per 1000 population in the Caribbean (WHO 2013). The
preponderance of older cars on many islands (Jacobson estimates that 1000 old cars
without emission controls produce as much pollution as 100,000 new cars), along
with the fact that many of these idyllic places burn sugarcane, winds up causing
pollution (Jacobson 2009; The World Bank 1996). Additionally, unhealthy prac-
tices such as sugarcane harvesting burning practices and the uncontrolled burning
of forest and bushes are not uncommon in the country and in other parts of the
Caribbean (Akpinar-Elci, Coomansingh et al. 2015; EMA 2001; Macpherson and
Akpinar-Elci 2015). Recent population-based studies and focus group discussion
conducted in Grenada found domestic bush burning is a common practice on the
island (Akpinar-Elci et al. 2015; Macpherson and Akpinar-Elci 2015). In addition
to CO2 emission, vehicle emissions and ash from bush/forest burning generate a
significant amount of fine particles (i.e., PM2.5).
Air quality is also impacted by pollutants from natural sources including wind-
blown dust, wildfires, and gases and PM emitted during volcanic eruptions. Of note,
air pollutants can originate from a local/regional source or from a distant/global
source. Some natural events, such as the transportation of volcanic ash and dust
across long distances, have been shown to contribute to air pollution and respiratory
diseases in some Caribbean countries. In a 2015 study of air pollution and respira-
tory health among elementary school children in Guadeloupe, the authors found
that the mean PM10 levels in over 70% of the schools exceeded the WHO AQG
(Amadeo et al. 2015). There is a high index of suspicion that Saharan dust is
responsible for the high PM10 levels in Guadeloupe. Similarly, climate-driven
humidity interacting with dust from the Sahara has been shown to produce PM in
Barbados, Grenada, Trinidad and Tobago, and US Virgin Islands, hence increasing
visits to the emergency department due to exacerbated asthma in the Caribbean
(Akpinar-Elci et al. 2015; Garrison et al. 2014; Gyan et al. 2005; Monteil 2008).
Furthermore, ash from the Soufriere volcano in Montserrat was linked to an
increase in asthma admissions in Guadeloupe after it erupted in 2010 (Cadelis
et al. 2013). It is worth noting that the particle size of Saharan dust varies from less
than 5 μm (as reported in studies from Barbados and Bermuda) to between 5 and
30 μm (Goudie and Middleton 2001). Similarly, studies have shown the particle
21 The Impact of Climate Change and Air Pollution on the Caribbean 353
size of fine volcanic ash/dust (an admixture of PM, toxic gases like sulfur dioxide,
and water vapor) to vary up to less than 60 μm (Lowe and Hunt 2001).
Air pollutants that are released directly into the atmosphere are classified as
“primary pollutants” and are a source of indoor and outdoor air pollution in parts of
the Caribbean (PAHO-WHO 2005). Fine particulate matter (e.g., particles less than
2.5 μm [PM2.5]) has been reported to occur from indoor activities such as smoking,
“cooking, cleaning, and other general activities involving either combustion (e.g.,
candles) or resuspension (e.g., any physical movement such as walking, dusting,
vacuuming, etc.)” (Long et al. 2000). Direct exposure to PM2.5 from cooking stove,
for instance, is particularly common among low-income populations, as was found
in a 2009 study of children in parts of the Dominican Republic (Bautista et al.
2009).
On the other hand, secondary pollutants are formed in the atmosphere following
a series of photochemical reactions. Although studies suggest that the atmospheric
concentration of secondary pollutants (especially ground-level ozone) in the Carib-
bean is less compared with developed countries, industrialization and increase in
fossil fuel-powered vehicles in countries like Trinidad and Tobago may reverse this
trend (Amadeo et al. 2015). Both short- and long-term exposures to ozone increase
the risk of morbidity and mortality from cardiovascular and respiratory diseases
(Bell et al. 2005).
Overall, domestic and commercial activities including the use of fossil fuels are
likely to contribute more to air quality problems in the Caribbean, especially as the
demand for energy increases as population grows. However, if Caribbean countries
and the global community adopt the “stringent mitigation scenario,” in addition to
effective adaptation strategies, air quality in the region is likely to improve in the
near future (Akpinar-Elci and Sealy 2014; IPCC 2014).
Air Pollution, Climate Change, and Health Effects
The human health impact of air pollution on the Caribbean people is well
documented. According to a USAID 2009 report: “The burden of disease associated
with non-communicable chronic diseases (NCDs) is greater than the burden of
disease associated with communicable diseases or injuries in Latin America and the
Caribbean (LAC); however, much less attention has been given to NCDs” (Ander-
son et al. 2009). Current literature reports smoking, allergy, infection, tropical
climate, diesel exposure, charcoal smoke, mite, and Sahara dust as risk factors for
asthma in the Caribbean (Bautista et al. 2009; Calo et al. 2009; Ivey et al. 2003;
Matthew et al. 2009; Milian and Dıaz 2004; Monteil 2008; Monteil et al. 2004).
Outdoor air pollution is particularly a major public health concern in the Caribbean
with a 2014 ambient air pollution data from the WHO showing the annual mean
concentrations of PM2.5 in some Caribbean countries were above the recommended
annual mean of 10 μg/m3 (WHO 2014b) (Fig. 21.2.).
354 M. Akpinar-Elci and O. Olayinka
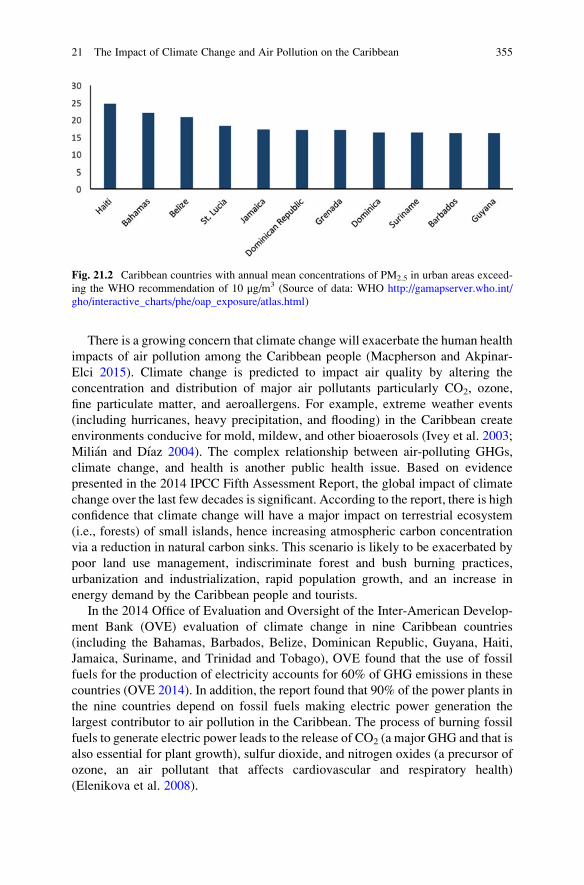
There is a growing concern that climate change will exacerbate the human health
impacts of air pollution among the Caribbean people (Macpherson and Akpinar-
Elci 2015). Climate change is predicted to impact air quality by altering the
concentration and distribution of major air pollutants particularly CO2, ozone,
fine particulate matter, and aeroallergens. For example, extreme weather events
(including hurricanes, heavy precipitation, and flooding) in the Caribbean create
environments conducive for mold, mildew, and other bioaerosols (Ivey et al. 2003;
Milian and Dıaz 2004). The complex relationship between air-polluting GHGs,
climate change, and health is another public health issue. Based on evidence
presented in the 2014 IPCC Fifth Assessment Report, the global impact of climate
change over the last few decades is significant. According to the report, there is high
confidence that climate change will have a major impact on terrestrial ecosystem
(i.e., forests) of small islands, hence increasing atmospheric carbon concentration
via a reduction in natural carbon sinks. This scenario is likely to be exacerbated by
poor land use management, indiscriminate forest and bush burning practices,
urbanization and industrialization, rapid population growth, and an increase in
energy demand by the Caribbean people and tourists.
In the 2014 Office of Evaluation and Oversight of the Inter-American Develop-
ment Bank (OVE) evaluation of climate change in nine Caribbean countries
(including the Bahamas, Barbados, Belize, Dominican Republic, Guyana, Haiti,
Jamaica, Suriname, and Trinidad and Tobago), OVE found that the use of fossil
fuels for the production of electricity accounts for 60% of GHG emissions in these
countries (OVE 2014). In addition, the report found that 90% of the power plants in
the nine countries depend on fossil fuels making electric power generation the
largest contributor to air pollution in the Caribbean. The process of burning fossil
fuels to generate electric power leads to the release of CO2 (a major GHG and that is
also essential for plant growth), sulfur dioxide, and nitrogen oxides (a precursor of
ozone, an air pollutant that affects cardiovascular and respiratory health)
(Elenikova et al. 2008).
Fig. 21.2 Caribbean countries with annual mean concentrations of PM2.5 in urban areas exceed-
ing the WHO recommendation of 10 μg/m3 (Source of data: WHO http://gamapserver.who.int/
gho/interactive_charts/phe/oap_exposure/atlas.html)
21 The Impact of Climate Change and Air Pollution on the Caribbean 355
Extrapolating from studies conducted in other parts of the world, climate change
is predicted to affect the respiratory and cardiovascular health of populations across
the Caribbean. The impact on the population’s health will result from increases in
environmental exposure to PM (e.g., black carbon, soot, and Saharan dust), pollens,
mold, other bioaerosols, and ground-level ozone. PM2.5, for instance, has been
proposed to induce and worsen inflammation and oxidative stress in both the
pulmonary and cardiovascular systems (Brook et al. 2010). Aeroallergens also
affect respiratory health by inducing inflammatory reaction in the respiratory
airway. Studies suggest that increased atmospheric CO2 levels is associated with
an increase in ragweed, an allergenic and immunogenic weed that flourishes in
tropical and subtropical climates and native to Guadeloupe, Jamaica, and Marti-
nique (CABI 2016; Ziska et al. 2011). Unfortunately, aeroallergens from pollen-
producing plants are expected to rise in the future (Richter et al. 2013).
Adaptation Strategies to Climate Change
According to IPCC, an integrated approach to climate adaptation and mitigation is
the best way to combat climate change (IPCC 2014). With regard to air pollution,
atmospheric pollutants in most Caribbean countries are either generated locally
(e.g., from automobiles), while most result from activities at distant sites (e.g.,
Sahara dust, GHGs emitted by “heavy polluters,” and volcanic eruption). Consid-
ering the relatively lower socioeconomic and political status and the low carbon
footprint of Caribbean countries in general, the Caribbean people need the collab-
oration of the global community in implementing climate mitigation and adaptation
strategies in the region. We believe these strategies should include (1) the enact-
ment of laws and regulations targeted at reducing uncontrolled forest, bush, and
trash burning [e.g., sustainable municipal waste management, improved land use
management, and agricultural practices such as reforestation], (2) investment in
sustainable and green technologies that reduce dependence on fossil fuels,
(3) strengthening of public health infrastructure and surveillance systems, and
(4) education of the population on the health risks of air pollution and climate
change.
The Nairobi Work Programme of the United Nations Framework Convention on
Climate Change (UNFCCC) also recommends a number of good practices in the
adaptation planning process. These include engaging members of the community in
the development of a structured and iterative knowledge base, establishing moni-
toring systems that are participatory to provide a consistent and reliable source of
information, leveraging technology to increase the capacity of the health sector to
respond to climate change variability, and raising public awareness of the potential
health risks under a changing climate and the need for taking action to address these
risks (UNFCCC 2015).
356 M. Akpinar-Elci and O. Olayinka
Conclusions
In summary, the burden of air pollution on the Caribbean people will increase with
climate change, unless stringent measures are taken at the community, country/
government, and global levels. Particularly, given the established human health
effects of air pollutants such as ozone, environmental surveillance of these pollut-
ants and longitudinal studies of their impact on the health of populations across the
Caribbean are recommended. Finally, how climate change is likely to influence the
effects of air pollution on states and territories in the region should be considered.
References
Akpinar-Elci M, Sealy H (2014) Climate change and public health in small island states and
Caribbean countries. In: Global climate change and public health. Springer, New York, pp
279–292
Akpinar-Elci M, Coomansingh K, Blando J, Mark L (2015a) Household bush burning practice and
related respiratory symptoms in Grenada, the Caribbean. J Air Waste Manage Assoc 65
(9):1148–1152
Akpinar-Elci M,Martin FE, Behr JG, Diaz R (2015b) Saharan dust, climate variability, and asthma
in Grenada, the Caribbean. Int J Biometeorol 59(11):1667–1671
Amadeo B, Robert C, Rondeau V, Mounouchy M-A, Cordeau L, Birembaux X, Marcin G (2015)
Impact of close-proximity air pollution on lung function in schoolchildren in the French West
Indies. BMC Public Health 15(1):1
Anderson GF, Waters H, Pittman P, Herbert R, Chu E, Das K (2009) Non-communicable chronic
diseases in Latin America and the Caribbean. Retrieved September, 2016. http://www.archive.
healthycaribbean.org/publications/documents/NCD-in-LAC-USAID.pdf
AOSIS (2015) The alliance of small island states. Retrieved October, 2016, from http://aosis.org/
about-aosis/
Bautista LE, Correa A, Baumgartner J, Breysse P, Matanoski GM (2009) Indoor charcoal smoke
and acute respiratory infections in young children in the Dominican Republic. Am J Epidemiol
169(5):572–580
Bell ML, Dominici F, Samet JM (2005) A meta-analysis of time-series studies of ozone and
mortality with comparison to the national morbidity, mortality, and air pollution study.
Epidemiology 16(4):436
Brauer M, Freedman G, Frostad J, Van Donkelaar A, Martin RV, Dentener F, Apte JS (2015)
Ambient air pollution exposure estimation for the global burden of disease 2013. Environ Sci
Technol 50(1):79–88
Brook RD, Rajagopalan S, Pope CA, Brook JR, Bhatnagar A, Diez-Roux AV, Mittleman MA
(2010) Particulate matter air pollution and cardiovascular disease an update to the scientific
statement from the American Heart Association. Circulation 121(21):2331–2378
CABI (2016) Ambrosia artemisiifolia (common ragweed). distribution table. Retrieved September
2016, from http://www.cabi.org/isc/datasheet/4691
Cadelis G, Tourres R, Molinie J, Petit RH (2013) Exacerbations of asthma in Guadeloupe (French
West Indies) and volcanic eruption in Montserrat (70 km from Guadeloupe). Rev Mal Respir
30(3):203–214. doi:10.1016/j.rmr.2012.11.002
Calo WA, Quintana R, Catoni I, Valle Y, Alvarez JJ, Colon WM,. . . Kallis M (2009) Clinical
conditions associated with environmental exposures: an epidemiologic study in two commu-
nities in Juana Diaz, Puerto Rico. P R Health Sci J, 28(2):126.
21 The Impact of Climate Change and Air Pollution on the Caribbean 357
CDKN, ODI (2014) The IPCC’s fifth assessment report| what’s in it for small island developing
states? Climate & Development Knowledge Network (CDKN) and Overseas Development
Institute (ODI). Retrieved August, 2016, from http://cdkn.org/wp-content/uploads/2014/08/
CDKN_IPCC_Whats_in_it_for_SIDS.pdf
Chafe ZA, Brauer M, Klimont Z, Van Dingenen R, Mehta S, Rao S,. . . Smith KR (2015)
Household cooking with solid fuels contributes to ambient PM2.5 air pollution and the burden
of disease. University of British Columbia
Cifuentes LA, Krupnick AJ, O’Ryan R, Toman M (2005) Urban air quality and human health in
Latin America and the Caribbean: Inter-American Development Bank
de Koning HW, Smith K, Last J (1985) Biomass fuel combustion and health. Bull World Health
Organ 63(1):11
Dodman D (2009) Blaming cities for climate change? An analysis of urban greenhouse gas
emissions inventories. Environ Urban 21(1):185–201
Elenikova Z, Goossens E, Adams A (2008) Air pollution from electricity-generating large
combustion plants: An assessment of the theoretical emission reduction of SO2 and NOX
through implementation of BAT as set in the BREFs
EMA (2001) Trinidad and Tobago State of the Environment Report 2000. Retrieved September,
2016, from http://apps.unep.org/redirect.php?file¼/publications/pmtdocuments/-Trinidad%
20and%20Tornado%20State%20of%20the%20Environment%20Report%202000%20-%
20Air%20Pollution-2000Trinidad%20and%20Tobago%20EMA%20SOE%20Report%
202000.pdf
Garrison VH, Majewski MS, Foreman WT, Genualdi SA, Mohammed A, Simonich SM (2014)
Persistent organic contaminants in Saharan dust air masses in West Africa, Cape Verde and the
eastern Caribbean. Sci Total Environ 468:530–543
Gennaro DA, Karl CB, Lorenzo C, Isabella A-M, Sanduzzi Zamparelli A, Gennaro L,. . . StanziolaAA (2014) Climate change and air pollution effects on pollen allergy and other allergic
respiratory diseases. Allergo J, 23(1):570–576.
Goudie A, Middleton N (2001) Saharan dust storms: nature and consequences. Earth Sci Rev 56
(1):179–204
Gyan K, Henry W, Lacaille S, Laloo A, Lamsee-Ebanks C, McKay S, Antoine RM, Monteil MA
(2005) African dust clouds are associated with increased paediatric asthma accident and
emergency admissions on the Caribbean island of Trinidad. Int J Biometeorol 49
(6):371–376. doi:10.1007/s00484-005-0257-3
Han X, Naeher LP (2006) A review of traffic-related air pollution exposure assessment studies in
the developing world. Environ Int 32(1):106–120
IPCC (2006) Guidelines for national greenhouse gas inventories. Retrieved September, 2016, from
http://www.ipccnggip.iges.or.jp/public/2006gl/pdf/2_Volume2/V2_1_Ch1_Introduction.pdf
IPCC (2007) Climate Change 2007: synthesis report. contribution of Working Groups I, II and III
to the fifth assessment report of the Intergovernmental Panel on Climate Change [Core Writing
Team, Pachauri RK, Reisinger A (eds)]. IPCC, Geneva, 104 pp
IPCC (2014) Climate Change 2014: synthesis report. contribution of Working Groups I, II and III
to the fifth assessment report of the Intergovernmental Panel on Climate Change [Core Writing
Team, Pachauri RK, Reisinger A (eds)]. IPCC, Geneva, 151 pp
Ivey M, Simeon D, Monteil MA (2003) Climatic variables are associated with seasonal acute
asthma admissions to accident and emergency room facilities in Trinidad, West Indies. Clin
Exp Allergy 33(11):1526–1530
Jacob DJ, Winner DA (2009) Effect of climate change on air quality. Atmos Environ 43(1):51–63
Jacobson MZ (2009) Review of solutions to global warming, air pollution, and energy security.
Energy Environ Sci 2(2):148–173
Jessamy V (2016) A potentially explosive health crisis in the Caribbean. Newsday. Retrieved from
http://www.newsday.co.tt/commentary/0,138724.html
Krzyzanowski M, Cohen A (2008) Update of WHO air quality guidelines. Air Qual Atmos Health
1(1):7–13
358 M. Akpinar-Elci and O. Olayinka
Long CM, Suh HH, Koutrakis P (2000) Characterization of indoor particle sources using contin-
uous mass and size monitors. J Air Waste Manage Assoc 50(7):1236–1250
Lowe DJ, Hunt JB (2001) A summary of terminology used in tephra-related studies
Macpherson CC, Akpinar-Elci M (2015) Caribbean heat threatens health, well-being and the
future of humanity. Pub Health Ethics 8:196–208. phv008
Matthew J, Pereira LMP, Pappas TE, Swenson CA, Grindle KA, Roberg KA, Gern JE (2009)
Distribution and seasonality of rhinovirus and other respiratory viruses in a cross-section of
asthmatic children in Trinidad, West Indies. Ital J Pediatr 35(1):1
Milian E, Dıaz AM (2004) Allergy to house dust mites and asthma. P R Health Sci J 23(1)
Monteil MA (2008) Saharan dust clouds and human health in the English-speaking Caribbean:
what we know and don’t know. Environ Geochem Health 30(4):339–343
Monteil MA, Joseph G, Chang Kit C, Wheeler G, Antoine RM (2004) Smoking at home is strongly
associated with symptoms of asthma and rhinitis in children of primary school age in Trinidad
and Tobago. Rev Panam Salud Publica 16(3):193–198
Nriagu JO (1990) The rise and fall of leaded gasoline. Sci Total Environ 92:13–28
Ostro B (2004) Outdoor air pollution. WHO Environ Burden Dis Ser 5
OVE (2014) Thematic evaluation. Climate change at the IDB: building resilience and reducing
emissions. Office of Evaluation and Oversight of the Inter-American Development Bank.
Retrieved September, 2016, from https://publications.iadb.org/bitstream/handle/11319/6692/
CC_EnglishBRIK.pdf?sequence¼1
PAHO-WHO (2005) An assessment of health effects of ambient air pollution in Latin America and
the Caribbean. Retrieved September, 2016, from http://www.bvsde.paho.org/bvsea/fulltext/
assess.pdf
Prospero JM, Collard FX, Molinie J, Jeannot A (2014) Characterizing the annual cycle of African
dust transport to the Caribbean Basin and South America and its impact on the environment
and air quality. Glob Biogeochem Cycles 28(7):757–773
Richter R, Berger UE, Dullinger S, Essl F, Leitner M, Smith M, Vogl G (2013) Spread of invasive
ragweed: climate change, management and how to reduce allergy costs. J Appl Ecol 50
(6):1422–1430
Romieu I, Weitzenfeld H, Finkelman J (1989) Urban air pollution in Latin America and the
Caribbean: health perspectives. World Health Stat Q. Rapport trimestriel de statistiques
sanitaires mondiales 43(3):153–167
Sanhueza E, Africano M, Romero J (1982) Air pollution in tropical areas. Sci Total Environ
23:3–10
Schwindt CD, Bacchus H, Leu S-Y, Tjoa T, Klebanova Y, Delfino RJ (2010) Characterization of
the asthmatic population of St. Vincent and the Grenadines: asthma severity levels and atopic
sensitization. J Asthma 47(8):871–877
Segal C, Nilsson A (2015). The use of human rights in the fight against air pollution.
Tanveer Z, Nadeem I, Raza S, Akram N (2014) Impact of global air pollution on human health: an
empirical investigation. J Glob Sci Issues 2(4)
The United Nations (2015) Carbon dioxide emissions (CO2), metric tons of CO2 per capita
(CDIAC). Retrieved October, 2016, from http://mdgs.un.org/unsd/mdg/SeriesDetail.aspx?
srid¼751
The World Bank (1996) Air pollution from motor vehicles: standards and technologies for
controlling emissions. Retrieved September, 2016, from http://www.un.org/esa/gite/iandm/
faizpaper.pdf
The World Bank (2016) Latin America & Caribbean. Retrieved October, 2016, from http://data.
worldbank.org/region/latin-america-and-caribbean?view¼chart
Trewin B (2014) The climates of the tropics and how they are changing. State Trop:39–52
UN (2012) World economic situation and prospects 2012. Retrieved September, 2016, from http://
www.un.org/en/development/desa/policy/wesp/wesp_current/2012country_class.pdf
UNEP (1998) Management of wastes in small island developing states. Retrieved September,
2016, from http://islands.unep.ch/dd98-7a2.htm
21 The Impact of Climate Change and Air Pollution on the Caribbean 359
UNEP (2005) Urban air quality management toolbook. Retrieved September, 2016, from http://
www.unep.org/urban_environment/PDFs/toolkit.pdf
UNEP, Villasol A, Beltran J (2004) Caribbean Islands, GIWA Regional assessment 4. FortnamM,
Blime P (eds) University of Kalmar, Kalmar, Sweden. Retrieved September, 2016, from http://
www.unep.org/dewa/giwa/areas/reports/r4/giwa_regional_assessment_r4.pdf
UNFCCC (2013) Trinidad and Tobago. Intended nationally determined contribution under the
United Nations framework convention on climate change. Retrieved September, 2016, from
http://www4.unfccc.int/Submissions/INDC/Published%20Documents/Trinidad%20and%
20Tobago/1/Trinidad%20and%20Tobago%20Final%20INDC.pdf
UNFCCC (2015) Good practices and lessons learned in adaptation planning processes addressing
ecosystems, human settlements, water resources and health, and in processes and structures for
linking national and local adaptation planning: a synthesis of case studies. Retrieved
September, 2016, from http://unfccc.int/resource/docs/2015/sbsta/eng/04.pdf
WHO (2008) Outdoor air pollution. Children’s health and the environment. Retrieved August,
2016, from http://www.who.int/ceh/capacity/Outdoor_air_pollution.pdf
WHO (2013) Road safety facts in the region of the Americas, 2013. Retrieved September, 2016,
from http://www.who.int/violence_injury_prevention/road_safety_status/2013/report/factsheet_
paho_en.pdf
WHO (2014a) 7 million premature deaths annually linked to air pollution. Retrieved August, 2016,
from http://www.who.int/mediacentre/news/releases/2014/air-pollution/en/
WHO (2014b) Public health and environment: ambient air pollution. Annual mean concentrations
of fine particulate matter (PM2.5) in urban areas, 2014. Retrieved September, 2016, from
http://gamapserver.who.int/gho/interactive_charts/phe/oap_exposure/atlas.html
Ziska L, Knowlton K, Rogers C, Dalan D, Tierney N, Elder MA, . . . Hedberg C (2011). Recent
warming by latitude associated with increased length of ragweed pollen season in central North
America. Proc Natl Acad Sci, 108(10):4248–4251
Muge Akpinar-Elci, MD, MPH, worked for NIH and CDC/NIOSH. She was also a director of
World Health Organization (WHO) Collaborating Center for Environmental and Occupational
Health in Grenada. She joined Old Dominion University as a director of Center for Global Health
and became a chair of the School of Community and Environmental Health. Her clinical and field
research experiences include pulmonary medicine and environmental global health.
Olaniyi Olayinka, MBChB, MPH, is an assistant professor at the Center for Global Health at Old
Dominion University. His research experience and interests include studies of the human health
impacts of environmental and occupational hazards. Current research interests include environ-
mental epidemiology, disaster science, community resilience and preparedness activities.
360 M. Akpinar-Elci and O. Olayinka
Chapter 22
Compounding Factors: Air Pollutionand Climate Variability in Mexico City
Marıa Eugenia Ibarraran, Ivan Islas, and Jose Abraham Ortınez
Abstract In early 2016, Mexico City suffered from repeated severe episodes of
high ozone concentrations. Tropospheric ozone is a secondary compound produced
by precursors such as nitrogen oxides and volatile organic compounds. However,
other conditions such as cloud coverage, solar radiation, humidity, wind speed, and
temperature play a significant role on the rate at which ground-level ozone forms.
During periods of low precipitation, that is, March through May 2016, Mexico City
Metropolitan Area (MCMA) witnessed high concentrations of tropospheric ozone.
We look at the correlation between the occurrence of El Ni~no events, meteorolog-
ical conditions, and ground concentration of ozone. We also describe other features
of MCMA that can contribute to explain this deterioration of air quality as well as
discuss health and economic costs this may entail. We finally address some public
policies that may help reduce low air quality in this and other metropolitan areas.
Keywords Mexico City • Air pollution • Climate variability • Ozone peaks •
Atmospheric stability • Supreme Court rulings
Introduction
In the spring of 2016, Mexico City faced several air pollution events that led to
implementing harsh restrictions on the population to improve air quality. There are
several reasons why pollution levels met contingency level concentrations, some being
a Supreme Court ruling allowing all private passenger vehicles to circulate every day,
no matter model year, as long as they approve the inspection and maintenance test;
M.E. Ibarraran (*)
Universidad Iberoamericana Puebla, Blvd. del Ni~no Poblano 2901, Reserva Territorial
Atlixcayotl, San Andres Cholula, Puebla 72810, Mexico
e-mail: [email protected]
I. Islas
Mexico Low Emissions Development Program, Mexico City, Mexico
J.A. Ortınez
Instituto Nacional de Ecologıa y Cambio Climatico and Centro de Ciencias de la Atmosfera,
UNAM, Mexico City, Mexico
© Springer International Publishing AG 2018
R. Akhtar, C. Palagiano (eds.), Climate Change and Air Pollution,Springer Climate, DOI 10.1007/978-3-319-61346-8_22
361
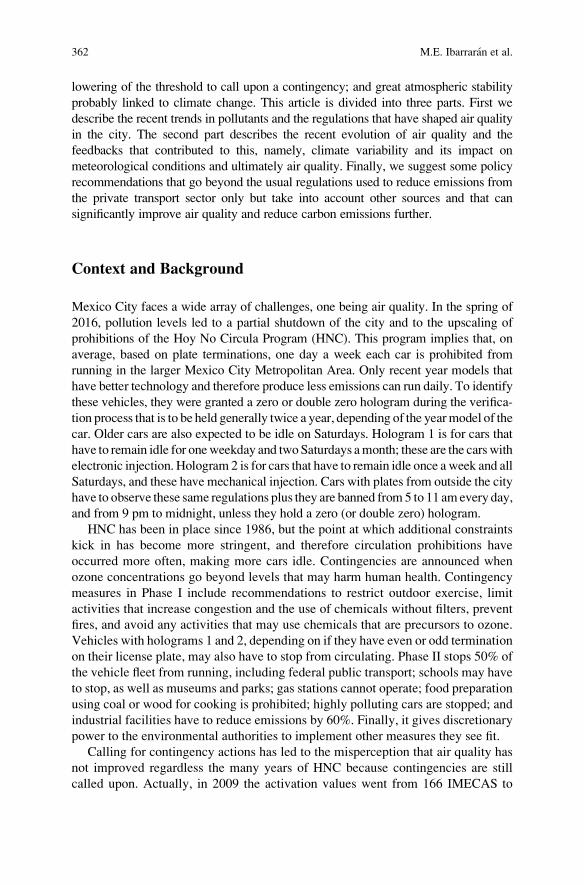
lowering of the threshold to call upon a contingency; and great atmospheric stability
probably linked to climate change. This article is divided into three parts. First we
describe the recent trends in pollutants and the regulations that have shaped air quality
in the city. The second part describes the recent evolution of air quality and the
feedbacks that contributed to this, namely, climate variability and its impact on
meteorological conditions and ultimately air quality. Finally, we suggest some policy
recommendations that go beyond the usual regulations used to reduce emissions from
the private transport sector only but take into account other sources and that can
significantly improve air quality and reduce carbon emissions further.
Context and Background
Mexico City faces a wide array of challenges, one being air quality. In the spring of
2016, pollution levels led to a partial shutdown of the city and to the upscaling of
prohibitions of the Hoy No Circula Program (HNC). This program implies that, on
average, based on plate terminations, one day a week each car is prohibited from
running in the larger Mexico City Metropolitan Area. Only recent year models that
have better technology and therefore produce less emissions can run daily. To identify
these vehicles, they were granted a zero or double zero hologram during the verifica-
tion process that is to be held generally twice a year, depending of the yearmodel of the
car. Older cars are also expected to be idle on Saturdays. Hologram 1 is for cars that
have to remain idle for oneweekday and twoSaturdays amonth; these are the cars with
electronic injection. Hologram 2 is for cars that have to remain idle once aweek and all
Saturdays, and these have mechanical injection. Cars with plates from outside the city
have to observe these same regulations plus they are banned from5 to 11 amevery day,
and from 9 pm to midnight, unless they hold a zero (or double zero) hologram.
HNC has been in place since 1986, but the point at which additional constraints
kick in has become more stringent, and therefore circulation prohibitions have
occurred more often, making more cars idle. Contingencies are announced when
ozone concentrations go beyond levels that may harm human health. Contingency
measures in Phase I include recommendations to restrict outdoor exercise, limit
activities that increase congestion and the use of chemicals without filters, prevent
fires, and avoid any activities that may use chemicals that are precursors to ozone.
Vehicles with holograms 1 and 2, depending on if they have even or odd termination
on their license plate, may also have to stop from circulating. Phase II stops 50% of
the vehicle fleet from running, including federal public transport; schools may have
to stop, as well as museums and parks; gas stations cannot operate; food preparation
using coal or wood for cooking is prohibited; highly polluting cars are stopped; and
industrial facilities have to reduce emissions by 60%. Finally, it gives discretionary
power to the environmental authorities to implement other measures they see fit.
Calling for contingency actions has led to the misperception that air quality has
not improved regardless the many years of HNC because contingencies are still
called upon. Actually, in 2009 the activation values went from 166 IMECAS to
362 M.E. Ibarraran et al.
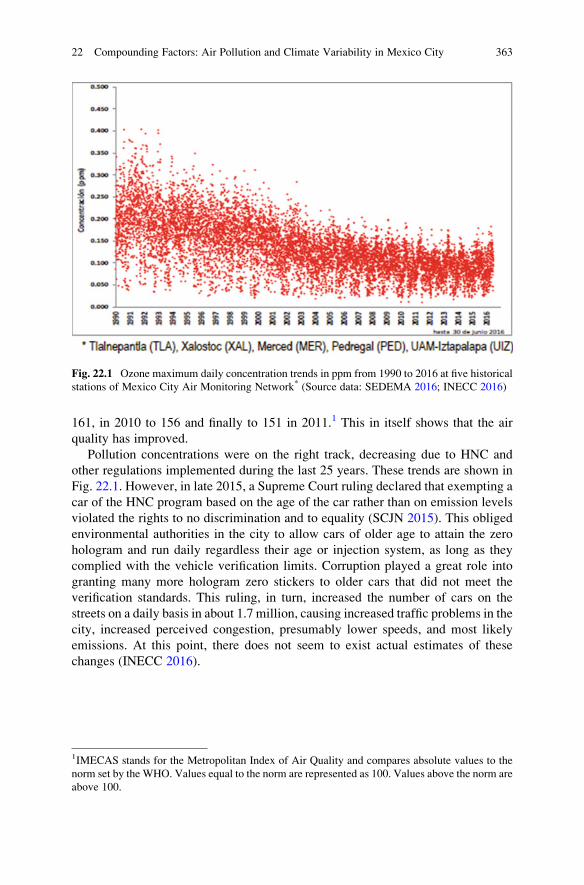
161, in 2010 to 156 and finally to 151 in 2011.1 This in itself shows that the air
quality has improved.
Pollution concentrations were on the right track, decreasing due to HNC and
other regulations implemented during the last 25 years. These trends are shown in
Fig. 22.1. However, in late 2015, a Supreme Court ruling declared that exempting a
car of the HNC program based on the age of the car rather than on emission levels
violated the rights to no discrimination and to equality (SCJN 2015). This obliged
environmental authorities in the city to allow cars of older age to attain the zero
hologram and run daily regardless their age or injection system, as long as they
complied with the vehicle verification limits. Corruption played a great role into
granting many more hologram zero stickers to older cars that did not meet the
verification standards. This ruling, in turn, increased the number of cars on the
streets on a daily basis in about 1.7 million, causing increased traffic problems in the
city, increased perceived congestion, presumably lower speeds, and most likely
emissions. At this point, there does not seem to exist actual estimates of these
changes (INECC 2016).
Fig. 22.1 Ozone maximum daily concentration trends in ppm from 1990 to 2016 at five historical
stations of Mexico City Air Monitoring Network* (Source data: SEDEMA 2016; INECC 2016)
1IMECAS stands for the Metropolitan Index of Air Quality and compares absolute values to the
norm set by the WHO. Values equal to the norm are represented as 100. Values above the norm are
above 100.
22 Compounding Factors: Air Pollution and Climate Variability in Mexico City 363
Peaks and Feedbacks
In mid-March of 2016, the highest ozone concentration episode of the last 14 years
took place, and Phase I of an environmental contingency was called upon. Several
factors played a role for this to happen. As Fig. 22.2 shows, there seems to be an
inverse relation between ozone concentration levels and wind speed. Reduced wind
speeds come from changes in meteorological patterns probably fostered by climate
change.
Since, due to climatological conditions, additional high-concentration level
events were expected to happen, a revamped HNC was designed that would operate
from April 1 to June 30. This increased the days in which each car had to be idle and
eliminated exceptions for newer cars with a zero hologram. Now all cars had to be
idle for two Saturdays a month as well. New standards were set for the vehicle
verification program, giving holograms an exemption from the HNC program based
on emissions rather than on the year model of the car. Restrictions on circulation,
even under the presence of a zero hologram, were reestablished for all cars.
Mexico City faced 80 atmospheric contingencies between March and June of
2016. Phase I contingencies became active and lasted anywhere from a few hours to
3 days. Most lasted for 1 day only. The day after the contingency was called upon
and emission control actions were implemented, maximum ozone concentration
decreased from 23% to 37% (INECC 2016). However, in one case, in May 2–5,
even though ozone concentrations reduced the next day, the day later it climbed
back up, maybe due to atmospheric stability in this central part of the country that
inhibited dispersion of pollutants. On the other hand, CO concentrations went down
anywhere from 11% to 47% and NOx from 5% to 46% after doubling up HNC. This
Fig. 22.2 Ozone and wind speed during the high pollution concentration episode (Source data:
SEDEMA 2016)
364 M.E. Ibarraran et al.
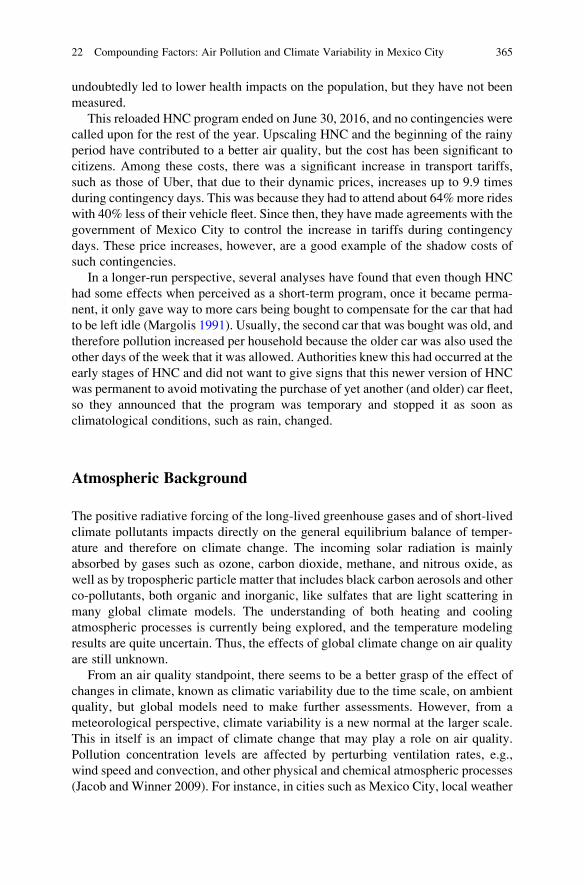
undoubtedly led to lower health impacts on the population, but they have not been
measured.
This reloaded HNC program ended on June 30, 2016, and no contingencies were
called upon for the rest of the year. Upscaling HNC and the beginning of the rainy
period have contributed to a better air quality, but the cost has been significant to
citizens. Among these costs, there was a significant increase in transport tariffs,
such as those of Uber, that due to their dynamic prices, increases up to 9.9 times
during contingency days. This was because they had to attend about 64%more rides
with 40% less of their vehicle fleet. Since then, they have made agreements with the
government of Mexico City to control the increase in tariffs during contingency
days. These price increases, however, are a good example of the shadow costs of
such contingencies.
In a longer-run perspective, several analyses have found that even though HNC
had some effects when perceived as a short-term program, once it became perma-
nent, it only gave way to more cars being bought to compensate for the car that had
to be left idle (Margolis 1991). Usually, the second car that was bought was old, and
therefore pollution increased per household because the older car was also used the
other days of the week that it was allowed. Authorities knew this had occurred at the
early stages of HNC and did not want to give signs that this newer version of HNC
was permanent to avoid motivating the purchase of yet another (and older) car fleet,
so they announced that the program was temporary and stopped it as soon as
climatological conditions, such as rain, changed.
Atmospheric Background
The positive radiative forcing of the long-lived greenhouse gases and of short-lived
climate pollutants impacts directly on the general equilibrium balance of temper-
ature and therefore on climate change. The incoming solar radiation is mainly
absorbed by gases such as ozone, carbon dioxide, methane, and nitrous oxide, as
well as by tropospheric particle matter that includes black carbon aerosols and other
co-pollutants, both organic and inorganic, like sulfates that are light scattering in
many global climate models. The understanding of both heating and cooling
atmospheric processes is currently being explored, and the temperature modeling
results are quite uncertain. Thus, the effects of global climate change on air quality
are still unknown.
From an air quality standpoint, there seems to be a better grasp of the effect of
changes in climate, known as climatic variability due to the time scale, on ambient
quality, but global models need to make further assessments. However, from a
meteorological perspective, climate variability is a new normal at the larger scale.
This in itself is an impact of climate change that may play a role on air quality.
Pollution concentration levels are affected by perturbing ventilation rates, e.g.,
wind speed and convection, and other physical and chemical atmospheric processes
(Jacob and Winner 2009). For instance, in cities such as Mexico City, local weather
22 Compounding Factors: Air Pollution and Climate Variability in Mexico City 365
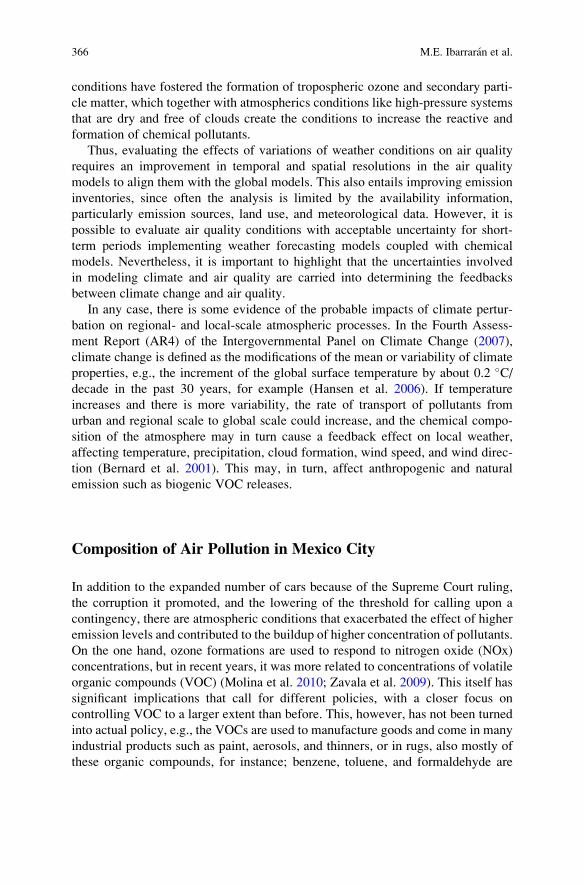
conditions have fostered the formation of tropospheric ozone and secondary parti-
cle matter, which together with atmospherics conditions like high-pressure systems
that are dry and free of clouds create the conditions to increase the reactive and
formation of chemical pollutants.
Thus, evaluating the effects of variations of weather conditions on air quality
requires an improvement in temporal and spatial resolutions in the air quality
models to align them with the global models. This also entails improving emission
inventories, since often the analysis is limited by the availability information,
particularly emission sources, land use, and meteorological data. However, it is
possible to evaluate air quality conditions with acceptable uncertainty for short-
term periods implementing weather forecasting models coupled with chemical
models. Nevertheless, it is important to highlight that the uncertainties involved
in modeling climate and air quality are carried into determining the feedbacks
between climate change and air quality.
In any case, there is some evidence of the probable impacts of climate pertur-
bation on regional- and local-scale atmospheric processes. In the Fourth Assess-
ment Report (AR4) of the Intergovernmental Panel on Climate Change (2007),
climate change is defined as the modifications of the mean or variability of climate
properties, e.g., the increment of the global surface temperature by about 0.2 �C/decade in the past 30 years, for example (Hansen et al. 2006). If temperature
increases and there is more variability, the rate of transport of pollutants from
urban and regional scale to global scale could increase, and the chemical compo-
sition of the atmosphere may in turn cause a feedback effect on local weather,
affecting temperature, precipitation, cloud formation, wind speed, and wind direc-
tion (Bernard et al. 2001). This may, in turn, affect anthropogenic and natural
emission such as biogenic VOC releases.
Composition of Air Pollution in Mexico City
In addition to the expanded number of cars because of the Supreme Court ruling,
the corruption it promoted, and the lowering of the threshold for calling upon a
contingency, there are atmospheric conditions that exacerbated the effect of higher
emission levels and contributed to the buildup of higher concentration of pollutants.
On the one hand, ozone formations are used to respond to nitrogen oxide (NOx)
concentrations, but in recent years, it was more related to concentrations of volatile
organic compounds (VOC) (Molina et al. 2010; Zavala et al. 2009). This itself has
significant implications that call for different policies, with a closer focus on
controlling VOC to a larger extent than before. This, however, has not been turned
into actual policy, e.g., the VOCs are used to manufacture goods and come in many
industrial products such as paint, aerosols, and thinners, or in rugs, also mostly of
these organic compounds, for instance; benzene, toluene, and formaldehyde are
366 M.E. Ibarraran et al.
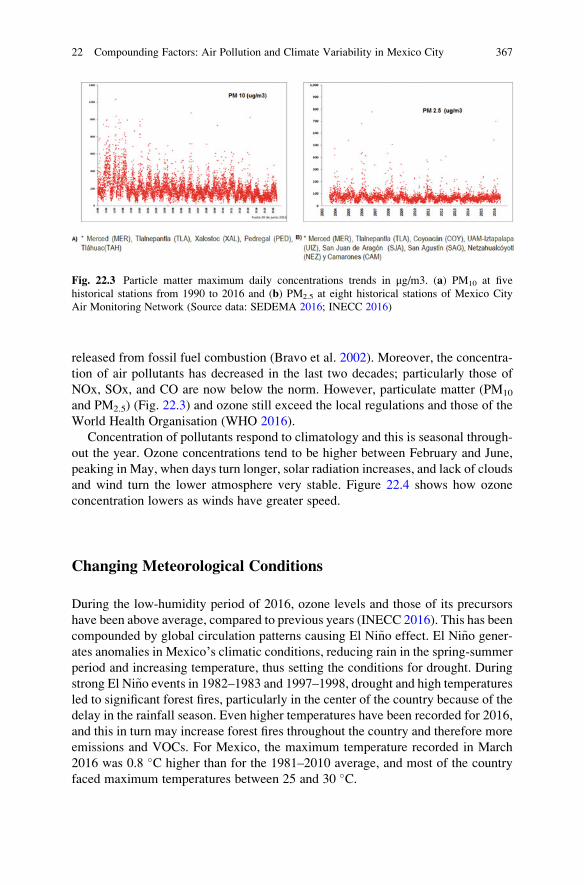
released from fossil fuel combustion (Bravo et al. 2002). Moreover, the concentra-
tion of air pollutants has decreased in the last two decades; particularly those of
NOx, SOx, and CO are now below the norm. However, particulate matter (PM10
and PM2.5) (Fig. 22.3) and ozone still exceed the local regulations and those of the
World Health Organisation (WHO 2016).
Concentration of pollutants respond to climatology and this is seasonal through-
out the year. Ozone concentrations tend to be higher between February and June,
peaking in May, when days turn longer, solar radiation increases, and lack of clouds
and wind turn the lower atmosphere very stable. Figure 22.4 shows how ozone
concentration lowers as winds have greater speed.
Changing Meteorological Conditions
During the low-humidity period of 2016, ozone levels and those of its precursors
have been above average, compared to previous years (INECC 2016). This has been
compounded by global circulation patterns causing El Ni~no effect. El Ni~no gener-
ates anomalies in Mexico’s climatic conditions, reducing rain in the spring-summer
period and increasing temperature, thus setting the conditions for drought. During
strong El Ni~no events in 1982–1983 and 1997–1998, drought and high temperatures
led to significant forest fires, particularly in the center of the country because of the
delay in the rainfall season. Even higher temperatures have been recorded for 2016,
and this in turn may increase forest fires throughout the country and therefore more
emissions and VOCs. For Mexico, the maximum temperature recorded in March
2016 was 0.8 �C higher than for the 1981–2010 average, and most of the country
faced maximum temperatures between 25 and 30 �C.
Fig. 22.3 Particle matter maximum daily concentrations trends in μg/m3. (a) PM10 at five
historical stations from 1990 to 2016 and (b) PM2.5 at eight historical stations of Mexico City
Air Monitoring Network (Source data: SEDEMA 2016; INECC 2016)
22 Compounding Factors: Air Pollution and Climate Variability in Mexico City 367
Meteorological conditions may have played an important role in increasing air
pollution in 2016. Early in the year, wind currents covered most of the country, as
shown in Fig. 22.5. During that period, the anticyclonic perturbations covered the
central region ofMexico, whereMexico City is located. However, in April, the current
moved northward and byMay winds were located in the north, and the central part had
Fig. 22.5 Wind currents in March 2016. Note: Flow wind current @ 700 hPa and wind speed of
19.1 m/s, with cyclonic circulation over the central region of Mexico, March 10 @ 18 UTC. 2016.
(Source: www.windytv.com)
Fig. 22.4 Behavior of high concentration of ozone and low wind speed (Source data: SEDEMA
2016)
368 M.E. Ibarraran et al.
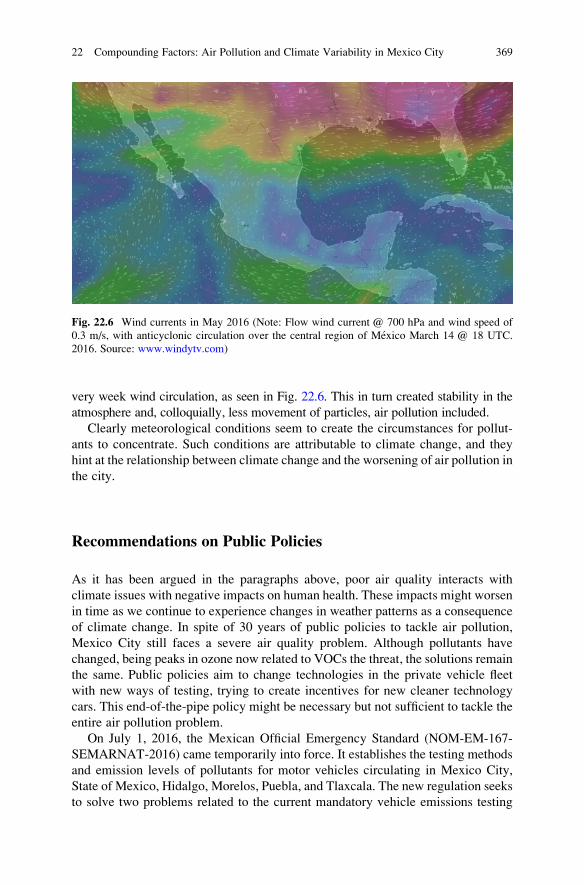
very week wind circulation, as seen in Fig. 22.6. This in turn created stability in the
atmosphere and, colloquially, less movement of particles, air pollution included.
Clearly meteorological conditions seem to create the circumstances for pollut-
ants to concentrate. Such conditions are attributable to climate change, and they
hint at the relationship between climate change and the worsening of air pollution in
the city.
Recommendations on Public Policies
As it has been argued in the paragraphs above, poor air quality interacts with
climate issues with negative impacts on human health. These impacts might worsen
in time as we continue to experience changes in weather patterns as a consequence
of climate change. In spite of 30 years of public policies to tackle air pollution,
Mexico City still faces a severe air quality problem. Although pollutants have
changed, being peaks in ozone now related to VOCs the threat, the solutions remain
the same. Public policies aim to change technologies in the private vehicle fleet
with new ways of testing, trying to create incentives for new cleaner technology
cars. This end-of-the-pipe policy might be necessary but not sufficient to tackle the
entire air pollution problem.
On July 1, 2016, the Mexican Official Emergency Standard (NOM-EM-167-
SEMARNAT-2016) came temporarily into force. It establishes the testing methods
and emission levels of pollutants for motor vehicles circulating in Mexico City,
State of Mexico, Hidalgo, Morelos, Puebla, and Tlaxcala. The new regulation seeks
to solve two problems related to the current mandatory vehicle emissions testing
Fig. 22.6 Wind currents in May 2016 (Note: Flow wind current @ 700 hPa and wind speed of
0.3 m/s, with anticyclonic circulation over the central region of Mexico March 14 @ 18 UTC.
2016. Source: www.windytv.com)
22 Compounding Factors: Air Pollution and Climate Variability in Mexico City 369
(PVVO). First, it addresses the technological and regulatory backwardness of the
testing centers, updating its procedures by making use of diagnostic systems on
board the vehicle for model year 2006 and later model year, and reduces the
maximum allowable emission limits. Second, it aims to tackle corruption in testing
centers through a centralized system of processing and storage of data and by on-
the-road monitoring using remote sensing. These measures are undoubtedly an
improvement in the PVVO, and despite not being infallible, they ensure that
vehicles on the road are appropriately tested lowering the probability of gaming
the system.
However, public policy must be evaluated in terms of its effectiveness to solve a
problem, in this case an acute air pollution suffered by Mexico City Metropolitan
Area, and its efficiency, that is, cost relative to other measures that curb air
pollutants. To evaluate public policies, there must be a set of measurable indicators
and targets they should achieve. Regarding the Mexican Official Emergency Stan-
dard, environmental authorities have not set a verifiable goal and a quantitative
indicator to measure the potential success of this new emergency standard. Even
more, the results will have to be assessed in similar weather conditions without
other affecting factors, such as the rainy season.
A possible indirect indicator could be the number of vehicles verified, approved,
and rejected, and compare them to those of previous semesters. The new standard
could result in fewer vehicles obtaining hologram zero that allows them to circulate
every day. After 1 year, this measure would probably reduce the number of vehicles
on the road since most likely not all the extra 1.7 million vehicles would be able to
get hologram zero again. If we assume that the measure is effective in restricting the
holograms, it should be expected that at least part of that universe will return to
hologram 1. This in turn should be related to a more direct indicator, the number of
environmental contingencies enacted in 1 year compared to the previous one.
If there are less environmental contingencies in future years relative to 2016,
remains to be seen. However, this might not be the case, as there are two factors that
the new standard is not tackling: driving activity, measured in kilometers driven
annually by private passenger cars, and other sources of pollution. The standard
addresses only part of a component of the problem: anti-pollution vehicle technol-
ogies. This measure sets aside vehicle activity. Restricting the use of the vehicle
once a week does not translate directly into lower vehicle travel or less emissions,
since generally the substitute for that vehicle is another motor vehicle with the same
or older technology. While the program has encouraged a newer and cleaner fleet in
the Valley of Mexico, it has been unable to reduce the volume of the on-road fleet or
the driving behavior of the population as there are few other quality options to
commute in the city. Kilometers traveled by car increase year after year, causing
more pollution and serious congestion problems that affect the economy of the city.
The second problem not addressed by the current policy is fixed sources of
pollution, which include area sources. They are the first source of emissions of
VOCs and the other important precursor of O3.
370 M.E. Ibarraran et al.
Economic Instruments Toward a Change in the EnergyMatrix
Environmental authorities stated that the new regulation is only one of several
measures that are being taken to strengthen the system of air quality monitoring.
Other mechanisms are the use of economic instruments to finance a megalopolitan
fund to improve public transport and to build infrastructure for other non-motorized
transport means. Other policies include better standards for fixed and mobile
sources. This means that measures that aim to address the background environmen-
tal problem and its long-term effects are yet to be announced and that without them,
the new vehicle verification standard will do little to mitigate air pollution, becom-
ing, at best, a necessary but insufficient measure.
If authorities want to send the right signals of the social costs of fossil fuels use,
not only those of mobile sources, it is important to attack directly the pollutant
emissions coming from those sources or the use of fossil fuels as inputs of other
activities. The goal of an economic instrument is to explicitly set this social external
cost and internalize it. There are two ways it can be done, either by setting a cap on
emissions or by imposing a price through a tax to pollutant emissions. The more
general and directed to the pollutants, the more effective such taxes will be to curb
emissions.
Economic instruments serve as incentives to influence the behavior of individ-
uals. Contrary to regulatory instruments, economic instruments provide greater
freedom to people to make decisions on energy use, for example, so they are
more efficient in reducing the social impact. In addition, economic instruments
can contribute to strengthen pollution control by generating tax revenue. It is
important to mention that economic instruments do not replace but complement
and reinforce regulatory approaches. Economic instruments therefore must be
considered as important components of the mixtures of policies and not as inde-
pendent policy packages (GTZ 2010).
Mexico already has a carbon tax at the national level. The carbon tax is part of
the economic package of fiscal year 2014. This tax covers approximately 40% of
total GHG emissions at the national level. It is not a tax on the total carbon content
of fuels but rather additional emissions compared to those of natural gas, which is
not subject to the carbon tax. The tax rate varies between US$ 1 and US$ 4/tCO2,
depending on the type of fuel and with a limit of 3% of the sale price of the fuel. The
tax is paid at the time of importation or production and can be credited, except for
the final sale (similar to VAT). According to the Federal Revenue Act for fiscal year
2014, the federation would receive tax revenues representing 0.328% of the federal
government’s total revenues. By 2015, they represented 0.210% of total revenues.
So far, revenues from this tax are not labeled to direct investment in environmental
measures.
There are three drawbacks that stop the Mexican carbon tax from becoming a
true Pigouvian tax controlling global and local pollution. The first one is that the tax
is not based on the social cost of carbon. Even more, it is too low to change
22 Compounding Factors: Air Pollution and Climate Variability in Mexico City 371
investment decisions and does not creates incentives to shift to clean technologies
across different sectors. It has become only another source of fiscal revenue. The
second one is that it does not tax gas, a fossil fuel producing methane fugitive
emissions at the source of extraction and in its transportation. At the local level, its
combustion in fixed and mobile sources produces important local pollutants that
impact human health. The third one is that it misses the opportunity of a double
dividend by not directly recycling tax revenues either by a reduction on income
taxes or lowering any other tax that imposes a cost on economic activities (Landa
et al. 2016).
Conclusions
In sum, regardless the long-run efforts put into reducing air pollution in Mexico
City, most of the policies have concentrated on vehicle emissions. This has proved
not to be enough given the increase in vehicles circulating in the city and the poor
public transport options that have not kept pace with demand for mobility. A
reduction in urban local pollutants and greenhouse gases that may reduce air
pollution and mitigate climate change will only come from a true change in the
energy matrix. Such a change may only be produced in the medium run by the use
of economic incentives to deter the use of highly polluting fuels and to embark into
long-term investments that will need less and cleaner energy sources.
References
Bernard SM, Samet JM, Grambsch A, Ebi KL, Romieu I (2001) The potential impacts of climate
variability and change on air pollution-related health effects in the United States. Environ
Health Perspect 109(Supplement 2):199–209
Bravo H, Sosa R, Sanchez P, Bueno E, Gonzalez L (2002) Concentrations of benzene and toluene
in the atmosphere of the southwestern area at the Mexico City Metropolitan Zone, Atmos
Environ 36(23):3843–3849. ISSN 1352-2310, http://dx.doi.org/10.1016/S1352-2310(02)
00292-3
Deutsche Gesellschaft für Technische Zusammenarbeit (GTZ) (2010) Economic Instruments in
the waste management sector. Experiences from OECD and Latin American Countries. Report
prepared by Green Budget Germany on behalf of GmbH. Berlin. Disponible en: http://www.
foes.de/pdf/2010%20FOES%20Economic%20Instruments%20Waste%20Management%
20final.pdf
Hansen J, Sato M, Ruedy R, Lo K, Lea DW, Medina-Elizade M (2006) Global temperature
change. Proc Natl Acad Sci U S A 103(39):14288–14293
INECC (2016) Evolucion de la Calidad del Aire en la ZMVM y episodios de ozono durante la
temporada seca-caliente 2016. Informe Tecnico, SEMARNAT
IPCC (2007) Climate Change 2007: synthesis report. contribution of Working Groups I, II and III
to the fourth assessment report of the Intergovernmental ¨Panel on Climate Change [Core
Writing Team, Pachauri RK, Resinger A (eds)]. IPCC, Geneva, 104 pp
372 M.E. Ibarraran et al.
Jacob DJ, Winner DA (2009) Effect of climate change on air quality. Atmos Environ 43(1):51–63.
http://dx.doi.org/10.1016/j.atmosenv.2008.09.051
Landa G, Reynes F, Islas I, Bellocq F, Grazi F (2016) Towards a low carbon growth in Mexico: is a
double dividend possible? A dynamic general equilibrium assessment. Energy Policy 96
(2016):314–327. www.elsevier.com/locate/enpol
Margolis S (1991) Back-of-the-envelope estimates of environmental damage costs in Mexico.
Working paper IDP104. The World Bank, Washington, DC
Molina LT, Madronich S, Gaffney JS, Apel E, de Foy B, Fast J, Ferrare R, Herndon S, Jimenez JL,
Lamb B, Osornio-Vargas AR, Russell P, Schauer JJ, Stevens PS, Volkamer R, Zavala M
(2010) An overview of the MILAGRO2006 campaign: Mexico City emissions and their
transport and transformation. Atmos Chem Phys 10(8697–8760):2010. doi:10.5194/acp-10-
8697-2010
SCJN (2015) Gaceta del Semanario de la Suprema Corte de la Nacion, No. 25894. Mexico
D.F. http://sjf.scjn.gob.mx/SJFSist/paginas/DetalleGeneralScroll.aspx?id¼25894&
Clase¼DetalleTesisEjecutorias&IdTe¼2010225
SEDEMA (2016), http://www.aire.cdmx.gob.mx/estadisticas-consultas/concentraciones/index.
php
WHO World Health Organization, Air quality guidelines global update. http://www.who.int/
mediacentre/factsheets/fs313/en/
Zavala M, Lei W, Molina MJ, Molina LT (2009) Modeled and observed ozone sensitivity to
mobile-source emissions in Mexico City. Atmos Chem Phys 9:39–55
Marıa Eugenia Ibarraran is director of the Research Institute on Environment, Xabier
Gorostiaga S. J., at Universidad Iberoamericana Puebla. She earned a PhD in geography and an
MA in energy and environmental studies from Boston University and a BA in economics from
Instituto Tecnologico Autonomo de Mexico (ITAM). Her research interests are development
policies, energy and environmental economics modelling and policy-making, as well as mitigation
and adaptation to climate change.
Ivan Islas holds a degree in economics from Universidad de las Americas Puebla and a master’sdegree in environmental economics and natural resources from University College London. He
was the director of Environmental Economics at the National Institute of Ecology and Climate
Change (2005–2015), where he specialized in economic analysis of energy and climate policies.
He is now the climate policy lead for the Mexico Low Emissions Development Program.
Jose Abraham Ortınez was the former deputy director of the Environmental Modelling Division
at INECC. He received his BSc in chemical engineering and MSc in atmospheric physics from the
UNAM and currently is finishing his PhD in the field of emission inventories and modelling and
black carbon measurements. His main area of experience is air quality modelling, emission
inventories, air pollution monitoring and policy-making.
22 Compounding Factors: Air Pollution and Climate Variability in Mexico City 373
Chapter 23
Air Pollution, Climate Change, and HumanHealth in Brazil
Julia Alves Menezes, Carina Margonari, Rhavena Barbosa Santos,
and Ulisses Confalonieri
Abstract Air pollution, especially after the industrial revolution, has adversely
affected human health both in Brazil and worldwide. In Brazil, the most common
pollutants are associated with biomass burning and the energy sector (transport) and
include aldehydes, sulfur dioxide nitrogen dioxide, hydrocarbons (methane and
non-methane), particulate matter, and ozone. These gases accumulate in the strato-
sphere and may influence both directly and indirectly the greenhouse effect which,
in turn, impacts the climate and human health. The combination of changes in
precipitation and temperature patterns coupled with increased pollution may inten-
sify problems related to infectious diseases, coronary-respiratory diseases, cancer,
and premature death, among other health issues. Surveys designed locally may
reveal where the data is insufficient and what information on climate risks and
associated health conditions need to be better understood. This may provide
accurate information on national policies and support the most urgent adaptation
actions to the populations at risk.
Keywords Air pollution • Pollution in Brazil • Human health • Climate change •
Particulate matter • Ozone
Introduction
Atmospheric pollutant is any form of matter or energy with intensity and in
quantity, concentration, time, or characteristics not in accordance with established
levels and which render or may render the air inappropriate, harmful, or offensive to
health; inconvenient to public welfare; harmful to materials, fauna, and flora; and
detrimental to the safety, usage, and enjoyment of property and the normal activ-
ities of the community (CONAMA Resolution 003 1990).
J.A. Menezes (*) • C. Margonari • R.B. Santos • U. Confalonieri
Rene Rachou Institute, FIOCRUZ, Belo Horizonte, Brazil
e-mail: [email protected]; [email protected];
[email protected]; [email protected]
© Springer International Publishing AG 2018
R. Akhtar, C. Palagiano (eds.), Climate Change and Air Pollution,Springer Climate, DOI 10.1007/978-3-319-61346-8_23
375
A milestone for the air pollution background was the measurement of carbon
monoxide (CO) concentration over Asia, Africa, and South America, in 1981.
Performed by the Columbia space shuttle, it was the first time that pollution was
perceived as an international problem. The images showed that, in addition to the
burning of fossil fuels, the biomass burning (forest fires and burning of agricultural
residues, among others) could affect regional and global air quality (Akimoto
2003).
In general, air quality is the result of the interaction of a complex set of factors,
such as the magnitude of the emissions, topography, and meteorological conditions
of the region, which may be favorable or not to the dispersion of the pollutants.
Regarding the magnitude of emissions, anthropic activities related to industrial
processes and power generation, motor vehicles, and forest fires are considered the
major causes of the introduction of polluting substances into the atmosphere. The
pollutants emitted by these activities are diverse and comprise an important group
due to the frequency of occurrence and adverse effects to the environment and
health, namely, aldehydes (RCHO), sulfur dioxide (SO2), hydrocarbons (methane
and non-methane hydrocarbons), total suspended particles (TSP) and inhalable
particles (particulate matter, PM), carbon monoxide (CO), photochemical oxidants
expressed as ozone (O3), and nitrogen oxides (NOx) (Brazilian Ministry of Health
2013).
Some environmental and human health damage from the most important air
pollutants are shown in Table 23.1.
Atmospheric Pollution: A Brief Brazilian Policy Scenario
The Brazilian government established air quality patterns for some of these pollut-
ants through the Resolution 003/90 of the National Council of Environment
(CONAMA), and there is a National Air Quality Control Program, implemented
in 1989 (CONAMA resolution n� 005 1989), and its goal is to fix parameters to the
emission of gaseous pollutants and particulate matter by stationary sources. The
mean values were established for the following pollutants: total suspended particles
(TSP), smoke, inhalable particles (PM10), nitrogen dioxide (NO2), sulfur dioxide
(SO2), carbon monoxide (CO), and ozone (O3), as shown in Table 23.2. This
resolution also defined two types of air quality pattern, a primary one, in which
overcoming the established threshold may impact health, and a secondary one,
where the concentration causes minimum adverse effect on the human well-being.
Although PM2.5 is of great relevance to the air pollution and public health issue, the
country does not yet have any regulations for the concentration of this pollutant.
The World Health Organization (WHO) recognizes countries’ autonomy in regu-
lating their air quality parameters rather than following global standardizations,
once important conditions such as health risks, technical viability, and economic
factors are locally defined (WHO 2006).
376 J.A. Menezes et al.
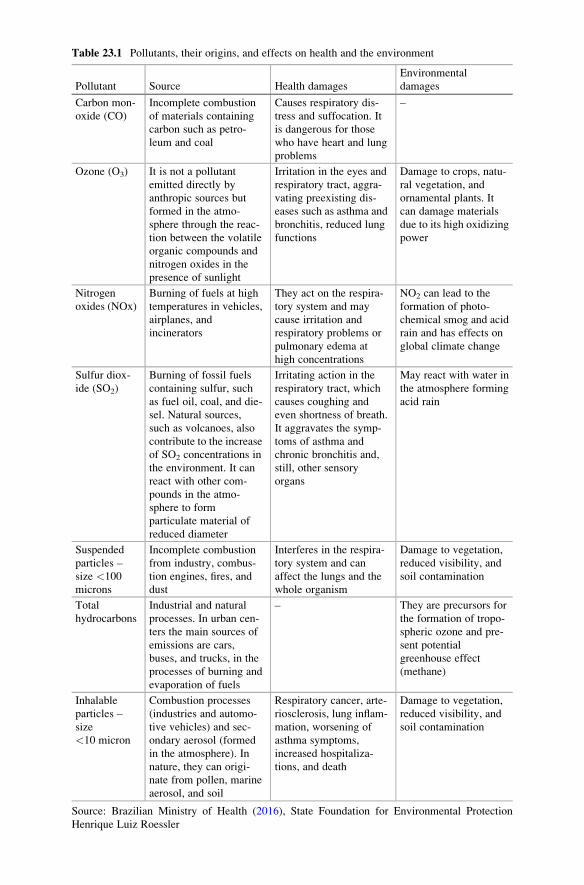
Table 23.1 Pollutants, their origins, and effects on health and the environment
Pollutant Source Health damages
Environmental
damages
Carbon mon-
oxide (CO)
Incomplete combustion
of materials containing
carbon such as petro-
leum and coal
Causes respiratory dis-
tress and suffocation. It
is dangerous for those
who have heart and lung
problems
–
Ozone (O3) It is not a pollutant
emitted directly by
anthropic sources but
formed in the atmo-
sphere through the reac-
tion between the volatile
organic compounds and
nitrogen oxides in the
presence of sunlight
Irritation in the eyes and
respiratory tract, aggra-
vating preexisting dis-
eases such as asthma and
bronchitis, reduced lung
functions
Damage to crops, natu-
ral vegetation, and
ornamental plants. It
can damage materials
due to its high oxidizing
power
Nitrogen
oxides (NOx)
Burning of fuels at high
temperatures in vehicles,
airplanes, and
incinerators
They act on the respira-
tory system and may
cause irritation and
respiratory problems or
pulmonary edema at
high concentrations
NO2 can lead to the
formation of photo-
chemical smog and acid
rain and has effects on
global climate change
Sulfur diox-
ide (SO2)
Burning of fossil fuels
containing sulfur, such
as fuel oil, coal, and die-
sel. Natural sources,
such as volcanoes, also
contribute to the increase
of SO2 concentrations in
the environment. It can
react with other com-
pounds in the atmo-
sphere to form
particulate material of
reduced diameter
Irritating action in the
respiratory tract, which
causes coughing and
even shortness of breath.
It aggravates the symp-
toms of asthma and
chronic bronchitis and,
still, other sensory
organs
May react with water in
the atmosphere forming
acid rain
Suspended
particles –
size <100
microns
Incomplete combustion
from industry, combus-
tion engines, fires, and
dust
Interferes in the respira-
tory system and can
affect the lungs and the
whole organism
Damage to vegetation,
reduced visibility, and
soil contamination
Total
hydrocarbons
Industrial and natural
processes. In urban cen-
ters the main sources of
emissions are cars,
buses, and trucks, in the
processes of burning and
evaporation of fuels
– They are precursors for
the formation of tropo-
spheric ozone and pre-
sent potential
greenhouse effect
(methane)
Inhalable
particles –
size
<10 micron
Combustion processes
(industries and automo-
tive vehicles) and sec-
ondary aerosol (formed
in the atmosphere). In
nature, they can origi-
nate from pollen, marine
aerosol, and soil
Respiratory cancer, arte-
riosclerosis, lung inflam-
mation, worsening of
asthma symptoms,
increased hospitaliza-
tions, and death
Damage to vegetation,
reduced visibility, and
soil contamination
Source: Brazilian Ministry of Health (2016), State Foundation for Environmental Protection
Henrique Luiz Roessler
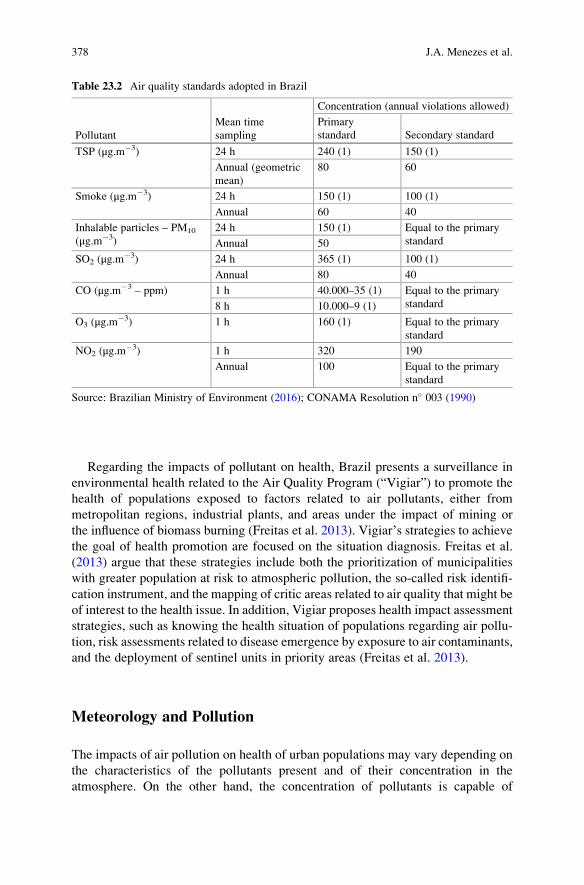
Regarding the impacts of pollutant on health, Brazil presents a surveillance in
environmental health related to the Air Quality Program (“Vigiar”) to promote the
health of populations exposed to factors related to air pollutants, either from
metropolitan regions, industrial plants, and areas under the impact of mining or
the influence of biomass burning (Freitas et al. 2013). Vigiar’s strategies to achievethe goal of health promotion are focused on the situation diagnosis. Freitas et al.
(2013) argue that these strategies include both the prioritization of municipalities
with greater population at risk to atmospheric pollution, the so-called risk identifi-
cation instrument, and the mapping of critic areas related to air quality that might be
of interest to the health issue. In addition, Vigiar proposes health impact assessment
strategies, such as knowing the health situation of populations regarding air pollu-
tion, risk assessments related to disease emergence by exposure to air contaminants,
and the deployment of sentinel units in priority areas (Freitas et al. 2013).
Meteorology and Pollution
The impacts of air pollution on health of urban populations may vary depending on
the characteristics of the pollutants present and of their concentration in the
atmosphere. On the other hand, the concentration of pollutants is capable of
Table 23.2 Air quality standards adopted in Brazil
Pollutant
Mean time
sampling
Concentration (annual violations allowed)
Primary
standard Secondary standard
TSP (μg.m�3) 24 h 240 (1) 150 (1)
Annual (geometric
mean)
80 60
Smoke (μg.m�3) 24 h 150 (1) 100 (1)
Annual 60 40
Inhalable particles – PM10
(μg.m�3)
24 h 150 (1) Equal to the primary
standardAnnual 50
SO2 (μg.m�3) 24 h 365 (1) 100 (1)
Annual 80 40
CO (μg.m�3 – ppm) 1 h 40.000–35 (1) Equal to the primary
standard8 h 10.000–9 (1)
O3 (μg.m�3) 1 h 160 (1) Equal to the primary
standard
NO2 (μg.m�3) 1 h 320 190
Annual 100 Equal to the primary
standard
Source: Brazilian Ministry of Environment (2016); CONAMA Resolution n� 003 (1990)
378 J.A. Menezes et al.
determining an increased likelihood pathological effects, such as allergies, although
some meteorological and climatic aspects may also influence on the permanence
and generation of pollutants, contributing to the higher or lower incidence of
diseases.
The concentration of atmospheric pollutants is a result of interactions between
the local climate patterns, the atmospheric circulation characteristics, the wind,
topography, human activities (transportation, energy generation), and human
response to climate change, among other factors (Ebi and McGregor 2008). Air
pollution events are frequently associated to some phenomena such as (1) anticy-
clone or stationary high-pressure systems that reduce the dispersion, diffusion, and
deposition of pollutants; (2) physical characteristics of the wind, like turbulence and
temperature; and (3) meteorological conditions that influence chemical and phys-
ical processes involved in the formation of secondary pollutants, such as ozone
(Arya 2000; Nilsson et al. 2001; Rao et al. 2013).
Although the meteorological conditions may act dissipating or concentrating
pollutants, some of them present a straight relationship to climate, impacting it
either at the regional or global levels. The report Integrated assessment of blackcarbon and tropospheric ozone: summary for decision makers, published by the
United Nations Environment Programme and the World Meteorological Associa-
tion, highlights the impacts of black carbon, a component of particulate matter, and
ozone as pollutants affecting the climate dynamics, since they are capable of
disturbing tropical rainfall and regional circulation patterns (UNEP and WMO
2011). Currently, there are only expectations about climate change effects on air
pollution concentrations, although the human-induced climate change is known to
influence some meteorological factors, such as temperature, precipitation, and solar
radiation, which directly affect the concentration of some pollutants (Kinney 2008).
These climate drivers of the pollutant cycle are modified as climate changes, and
this in turn is expected to affect air quality (Giorgi and Meleux 2007).
In general, regional and global climate models have shown that global warming
may result in a worsening of air quality in urban centers, including increased levels
of ozone, particulate matter (PM), and pollens, among others (Harlan and Ruddell
2011; Jacob and Winner 2009; Kinney 2008). In the case of PM, for example,
studies pointed out that climate change may reduce or increase its concentration due
to regional differences in rainfall or temperature (Heald et al. 2008; Jacob and
Winner 2009). The studies for tropospheric ozone are quite conflicting, since some
of them have shown a decrease in its concentration due to humidity and temperature
rise, whereas others have observed an increase related to warmer temperatures
(Aw and Kleeman 2003; Girogi and Meleux 2007; Sillmaan and Samson 1995).
Some mechanisms by which the climate change may affect air quality, either local
or regionally, are changes in rates of chemical reactions and the height of the
atmospheric layers that are closest to the ground, influencing the vertical mixture
of pollutants. The modification of human behavior or changes in the levels of
biogenic emissions – some vegetation species naturally produce ozone precursors,
but in larger quantities at higher temperatures – is considered an indirect effect that
may increase or decrease anthropogenic emissions (Ebi and McGregor 2008).
23 Air Pollution, Climate Change, and Human Health in Brazil 379
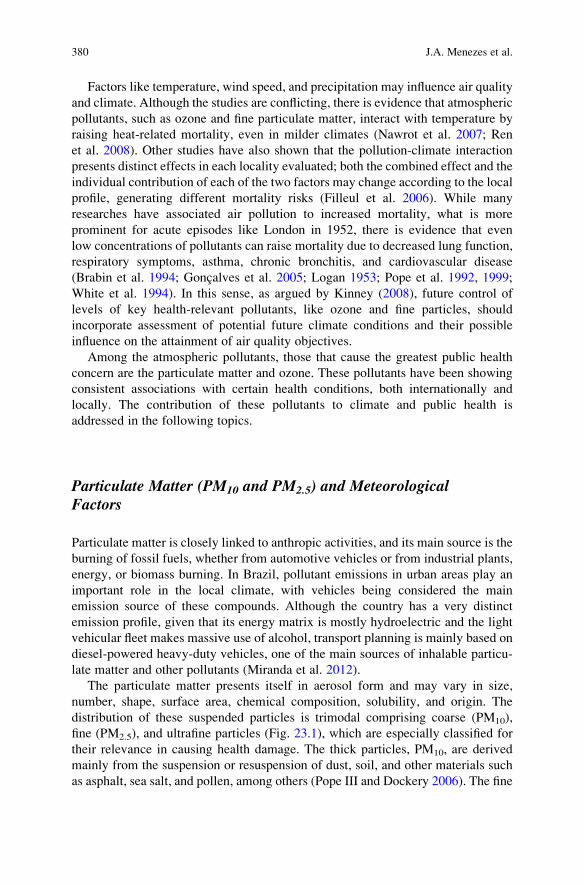
Factors like temperature, wind speed, and precipitation may influence air quality
and climate. Although the studies are conflicting, there is evidence that atmospheric
pollutants, such as ozone and fine particulate matter, interact with temperature by
raising heat-related mortality, even in milder climates (Nawrot et al. 2007; Ren
et al. 2008). Other studies have also shown that the pollution-climate interaction
presents distinct effects in each locality evaluated; both the combined effect and the
individual contribution of each of the two factors may change according to the local
profile, generating different mortality risks (Filleul et al. 2006). While many
researches have associated air pollution to increased mortality, what is more
prominent for acute episodes like London in 1952, there is evidence that even
low concentrations of pollutants can raise mortality due to decreased lung function,
respiratory symptoms, asthma, chronic bronchitis, and cardiovascular disease
(Brabin et al. 1994; Goncalves et al. 2005; Logan 1953; Pope et al. 1992, 1999;
White et al. 1994). In this sense, as argued by Kinney (2008), future control of
levels of key health-relevant pollutants, like ozone and fine particles, should
incorporate assessment of potential future climate conditions and their possible
influence on the attainment of air quality objectives.
Among the atmospheric pollutants, those that cause the greatest public health
concern are the particulate matter and ozone. These pollutants have been showing
consistent associations with certain health conditions, both internationally and
locally. The contribution of these pollutants to climate and public health is
addressed in the following topics.
Particulate Matter (PM10 and PM2.5) and MeteorologicalFactors
Particulate matter is closely linked to anthropic activities, and its main source is the
burning of fossil fuels, whether from automotive vehicles or from industrial plants,
energy, or biomass burning. In Brazil, pollutant emissions in urban areas play an
important role in the local climate, with vehicles being considered the main
emission source of these compounds. Although the country has a very distinct
emission profile, given that its energy matrix is mostly hydroelectric and the light
vehicular fleet makes massive use of alcohol, transport planning is mainly based on
diesel-powered heavy-duty vehicles, one of the main sources of inhalable particu-
late matter and other pollutants (Miranda et al. 2012).
The particulate matter presents itself in aerosol form and may vary in size,
number, shape, surface area, chemical composition, solubility, and origin. The
distribution of these suspended particles is trimodal comprising coarse (PM10),
fine (PM2.5), and ultrafine particles (Fig. 23.1), which are especially classified for
their relevance in causing health damage. The thick particles, PM10, are derived
mainly from the suspension or resuspension of dust, soil, and other materials such
as asphalt, sea salt, and pollen, among others (Pope III and Dockery 2006). The fine
380 J.A. Menezes et al.
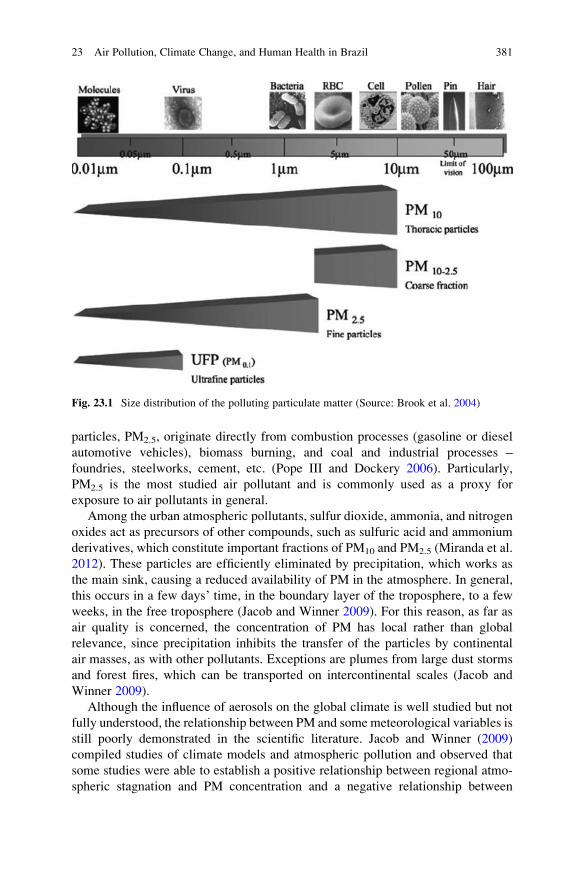
particles, PM2.5, originate directly from combustion processes (gasoline or diesel
automotive vehicles), biomass burning, and coal and industrial processes –
foundries, steelworks, cement, etc. (Pope III and Dockery 2006). Particularly,
PM2.5 is the most studied air pollutant and is commonly used as a proxy for
exposure to air pollutants in general.
Among the urban atmospheric pollutants, sulfur dioxide, ammonia, and nitrogen
oxides act as precursors of other compounds, such as sulfuric acid and ammonium
derivatives, which constitute important fractions of PM10 and PM2.5 (Miranda et al.
2012). These particles are efficiently eliminated by precipitation, which works as
the main sink, causing a reduced availability of PM in the atmosphere. In general,
this occurs in a few days’ time, in the boundary layer of the troposphere, to a few
weeks, in the free troposphere (Jacob and Winner 2009). For this reason, as far as
air quality is concerned, the concentration of PM has local rather than global
relevance, since precipitation inhibits the transfer of the particles by continental
air masses, as with other pollutants. Exceptions are plumes from large dust storms
and forest fires, which can be transported on intercontinental scales (Jacob and
Winner 2009).
Although the influence of aerosols on the global climate is well studied but not
fully understood, the relationship between PM and some meteorological variables is
still poorly demonstrated in the scientific literature. Jacob and Winner (2009)
compiled studies of climate models and atmospheric pollution and observed that
some studies were able to establish a positive relationship between regional atmo-
spheric stagnation and PM concentration and a negative relationship between
Fig. 23.1 Size distribution of the polluting particulate matter (Source: Brook et al. 2004)
23 Air Pollution, Climate Change, and Human Health in Brazil 381
relative humidity and PM. The precipitation, as the main dissipating mechanism,
presents a tendency to decrease the concentration of particles, wherein the fre-
quency of these rains is a determinant factor (Balkanski et al. 1993; Dawson et al.
2007). A study conducted in six Brazilian capitals showed that there are differences
in PM concentration due to some meteorological factors (Miranda et al. 2012). In
the cities of S~ao Paulo, Rio de Janeiro, Belo Horizonte, and Curitiba, there was a
strong negative correlation between PM2.5 and accumulated precipitation. How-
ever, the wind speed was not associated with the concentration of these particles in
any of the cities studied.
An important aspect related to PM is its composition – if derived from sulfuric
acid, there is a tendency to increase the concentration along with the temperature.
Yet, if derived from nitrates, compounds that experience conversion from particle
to gas with increased temperatures, the tendency is of PM reduction (Dawson et al.
2007; Tsigaridis and Kanakidou 2007). Miranda et al. (2012) observed that the
concentrations of SO42� ions were the highest among several types of cations and
anions measured in some Brazilian cities. These results demonstrate that climate
change may significantly influence the air quality in the country, especially in urban
centers. Moreover, in large cities, a fraction of the fine particulate matter produced
by vehicular combustion engines has the property of strongly absorb radiation, the
so-called black carbon. This compound, which is also widely produced in forest
fires, is able to interfere on climate in three different ways: (1) directly absorbing
the radiation, (2) reducing the albedo of snow and ice by deposition, and
(3) interacting with clouds, due to its aerosol nature (Costa and Pauliquevis
2014). Due to its ability to raise the atmospheric temperature, black carbon also
plays an important role in global climate change. Jacobson (2001) suggests both
that atmospheric warming due to black carbon-type aerosols could balance the
cooling effect associated with other types (sulfates) and that its direct radiative
forcing may exceed that associated to CH4. Thus, aerosol particles, a product of
incomplete combustion processes, would be second only to CO2 in the radiative
contribution to the warming of the atmosphere (Freitas et al. 2005).
Although not conclusive, some climate models examined the impacts of climate
change on air pollution and pointed out that (1) PMmay reduce in some regions and
increase in others, mainly due to differences in precipitation regime, and (2) there
may be a positive response from PM to the expected temperature raise for the next
decades, especially in already polluted areas (Heald et al. 2008; Jacob and Winner
2009). Other indirect processes of climate change may also be responsible for
raising the concentration of PM, as is the case of forest fires becoming more
frequent in a drier climate. In this sense, air pollution maps, produced by the
WHO for the 5-year period 2008–2013, show for Brazil an annual estimate for
PM2.5 of at least 11–15 μg.m�3 and for the region known as “arc of deforestation,”
and with high forest fires’ frequency of fires, this value rises to 16–25 μg.m�3
(WHO 2016).
382 J.A. Menezes et al.
Ozone and Climate
Ozone (O3) may occur naturally or be formed in a secondary process by the
photochemical oxidation of carbon dioxide, methane, and other volatile organic
compounds (VOCs) under conditions of intense radiation and high temperatures.
Biogenic emissions of O3 occur mainly by vegetation that produces VOCs, one of
its precursors, but this pattern has been changing in the last century due to changes
in land use associated with biomass burning, urbanization, and massive use of
petroleum-powered automotive vehicles, which produce nitrogen oxides and VOCs
in large quantities (Ebi and McGregor 2008).
Unlike particulate matter, O3 may remain in the atmosphere for days to weeks
and is liable to be carried out from the continents to very distant locations when
available in the free troposphere. This allows high concentrations of this gas to be
extended for thousands of miles, including rural or nonexposed areas far from the
emission source. In Brazil, a study carried out in Cubat~ao, a state of S~ao Paulo,
showed that only a small portion of the observed pollutants were from local
sources; the rest were due to mass transport-high-pollutant concentrations associ-
ated with north-northeast (land breeze) and south-southeast (sea breeze) air flow
(Silva 2013). Historically, atmospheric concentrations of O3 have increased in both
polluted and remote regions, having since the industrial age doubled due to the
anthropogenic emissions of its major precursors, methane and nitrogen oxides
(Brook et al. 2004; Wang and Jacob 1998).
Atmospheric O3 is considered a greenhouse gas, with two roles in the thermal
balance of the planet: (1) to absorb ultraviolet radiation, warming the stratosphere,
and (2) to absorb infrared radiation that is reflected by the earth’s surface, trappingheat in the troposphere. The influence of O3 concentration on climate, then, depends
on the altitude at which these processes occur. Thus, although industrial ozone-
depleting gases such as chlorine and bromine may have a cooling effect on the
stratosphere, other O3 precursor gases produced in anthropic processes remain in
the troposphere, leading to surface warming.
Meteorological and chemical factors, such as temperature, humidity, winds, and
the presence of other gases, influence O3 formation, and the formed O3 affects other
components of the atmosphere. The higher solar radiation during the summer
months, for example, is related to increase O3 concentrations (Ebi and McGregor
2008; Nilsson et al. 2001). In general, the temperature increase can accelerate the
reaction rates, with a strong correlation between high levels of O3 and very warm
days. Several studies have shown that high concentrations of O3 may be due to
higher biogenic hydrocarbon production, higher anthropogenic VOC production,
and stagnation of atmospheric circulation, all of which are influenced by temper-
ature (Sillmaan and Samson 1995; Lamb et al. 1987). In urban areas, the ozone
formation peak is quite extensive and tends to last between the late morning and late
afternoon, when the radiation is at its maximum. However, meteorological pro-
cesses, such as thermal inversion, wind direction, and velocity, and the presence of
23 Air Pollution, Climate Change, and Human Health in Brazil 383
other precursor compounds, may affect this pattern, causing peaks to occur at any
time between morning and afternoon (Brook et al. 2004).
Regarding the urban impacts associated with the combination of air pollution
and climate change, regional climate models have shown that, for the twenty-first
century, the correlations found in the present between ozone and meteorological
variables are sustained in the long-term projections (Jacob and Winner 2009).
Furthermore, the ozone concentrations observed in the modeling were reasonably
consistent with the current surface ozone measurements (West et al. 2007).
Changes in ozone concentrations projected by future emission scenarios have
been developed for various regions of the world, as well detailed by Ebi and
McGregor (2008). The global maximum ozone concentration measured at 8 h is
projected to increase by 9.4 parts per billion per volume (ppbv) compared to a
concentration simulation in the year 2000, with the highest increases over South
Asia (almost 15 ppbv) and with remarkable increases for the Middle East, Southeast
Asia, Latin America, and East Asia (West et al. 2007).
The CONAMA, through resolution 003/90, states that the mean concentration of
O3 per hour cannot exceed 160 μg.m�3. However, studies in the two Brazilian
megacities, S~ao Paulo and Rio de Janeiro, have shown a different scenario. In the
year 2015 for S~ao Paulo, for example, the national limit was exceeded by 80 days
(CETESB 2016). For both cities, the phenomenon of higher concentration of O3
during weekends was observed, precisely when there is less vehicle circulation.
This phenomenon was first reported in the United States, in 1970, and it is common
to large centers, presenting several explanations that relate to the availability of
other O3 precursor compounds. In general, the VOC/NOx ratio defines O3-forming
process in which one of the possible paths is the high VOC/NOx ratios favoring
reactions with OH radicals, which increases ozone formation (Martins et al. 2015).
This was the case of Rio de Janeiro, where the highest O3 concentrations at
weekends were controlled by VOC. The VOC/NOx ratio was high during weekends
because the NOx reductions were more significant, which increased ozone forma-
tion in the period of the study (Martins et al. 2015).
Impacts on Health of Particulate Matter and Ozone in Brazil
The climate change perspective presents challenges to the issue of urban air
pollution and its impacts on health, as the pollutants can either exacerbate some
climatic parameters as be influenced by them. In regard to health, the particulate
matter is associated with a range of acute and chronic diseases mainly related to the
respiratory tract and the cardiovascular system. A publication of the Organization
for Economic Cooperation and Development (OECD) estimates that more than 3.5
million people die prematurely because of atmospheric particulate matter concen-
tration and that air pollution is expected to become the main environmental cause of
mortality in the world by 2050 (OECD 2014).
384 J.A. Menezes et al.
Several studies have demonstrated the relationship between the high concentra-
tion of PM and cardiovascular or respiratory diseases worldwide (Gouveia and
Fletcher 2000; Pope et al. 1992; Peng et al. 2005; Orsini et al. 1986). Several
epidemiological studies have evidenced associations of particulate matter with the
incidence of respiratory diseases in Brazil (Braga et al. 1998; Gouveia and Fletcher
2000; Gouveia et al. 2006; Miranda et al. 2012; Nardocci et al. 2013; Romieu et al.
2012; Saldiva et al. 1994). Gouveia et al. (2006) identified an association of
inhalable particulate matter with increases of 4.6% in hospitalizations for asthma
in children and 4.3% for chronic obstructive pulmonary disease and 1.5% for
ischemic heart disease in the elderly. In fact, the population at greater risk are the
elderly, children, those with chronic lung diseases or coronary disease, and patients
with diabetes (Ribeiro 2008). The large Brazilian cities have shown higher levels
than those established by the WHO for both pollutants, PM10 and PM2.5, with an
estimated excess of deaths associated with these concentrations of materials
(Miranda et al. 2012; Orsini et al. 1986). Miranda et al. (2012) observed an excess
mortality risk of more than 13,000 deaths per year associated with PM2.5 concen-
trations above that recommended by the WHO for several Brazilian capitals.
Regarding ozone, it is one of the pollutants that contributes the most to the
degradation of air quality in large urban centers. Exposure to high concentrations is
associated with increased hospital admissions for pneumonia, chronic obstructive
pulmonary disease, asthma, bronchitis, allergic rhinitis, and other respiratory dis-
eases, as well as premature mortality (Aris et al. 1993; Bell 2005; Ebi and
McGregor 2008; Frampton et al. 1999; Gryparis et al. 2004; Ito et al. 2005). A
study conducted in nine megacities of Latin America examined the association
between exposure to air pollution and mortality. It was observed that, in S~ao Paulo
and Rio de Janeiro, besides all-cause mortality being significantly associated with
ozone, there was also an estimated higher risk of death for the summer (Romieu
et al. 2012). For both cities, the higher risk of ozone-related mortality was associ-
ated with respiratory causes, especially in the low and high socioeconomic status
groups. Although the impacts in the respiratory system are more common, Nardocci
et al. (2013) observed, in addition to the association between O3 and respiratory
diseases in children under 5 years, also an association between this pollutant and
cardiovascular diseases in adults above 39 years old in the city of Cubat~ao, S~aoPaulo, a Brazilian city known for industrial pollution.
The Case of Megacities
The rapid growth of the world’s population, especially in developing countries,
coupled with the processes of continuous industrialization and migration to urban
centers, has transformed megacities into important sources of pollutant emissions.
While some health impacts on the inhabitants of these large centers also have a
social character, environmental consequences can be noticed at regional and global
scales. Therefore, air quality at these various scales and their related problems and
23 Air Pollution, Climate Change, and Human Health in Brazil 385
impacts, including climate change, should be addressed in an integrated approach
(Akimoto 2003).
However, there are several megacities yet understudied around the globe, espe-
cially in Africa and Asia. Thus, monitoring data are not readily available to these
and other regions, making comparative studies difficult. A 2010 study assessed the
health risks in megacities in terms of mortality and morbidity due to air pollution
(Gurjar et al. 2010). From the WHO standardization of atmospheric pollutants SO2,
NO2, and total suspended particles, mortality and morbidity risk due to atmospheric
pollution were calculated. The findings showed that some cities such as Los
Angeles, New York, Osaka, Kobe, S~ao Paulo, and Tokyo presented low mortality
rate from these pollutants. On the other hand, high numbers of deaths (15,000 a
year) and elevated TSP concentration (~ 670 μg.m�3) were observed in Karachi,
Pakistan. The research points out to the importance of calculating types of risk
estimate and the need to do so in parallel with the development of air pollution
monitoring networks to obtain a more realistic basis for the consequences of air
pollution (Gurjar et al. 2010). Besides that, there is a need to solve uncertainties
among different monitoring methodologies, which will assist in estimating the
pollution health effects and the projections of future changes (Marlier et al. 2016).
Molina and Molina (2004) argue that there is no single strategy to address the
problems of air pollution in megacities. But a possible strategy based on experi-
ences, successful or not, in many cities, is the integrated approach that considers
scientific, technical, infrastructure, economic, social, and political aspects.
Highlights for S~ao Paulo Capital
S~ao Paulo is considered one of the most polluted cities in the world occupying the
sixth position along with Mexico City; it is behind only to Beijing (China), Cairo
(Egypt), Jakarta (Indonesia), Los Angeles (USA), and Moscow (Russia). The
polluted air of the city of S~ao Paulo is considered a public health problem by
several researchers (B€ohm et al. 1989; Saldiva et al. 1994 1995; Coelho et al. 2010).
Thus, the city suffers from the worsening of pulmonary diseases and clinical
condition of the patients with cardiac diseases, as well as neonatal deaths and
hematological, ophthalmological, neurological, and dermatological problems,
among others (Imai et al. 1985; Saldiva et al. 1994, 1995; Braga 1998; Braga
et al. 2002; Goncalves et al. 2005).
The first studies relating air pollution and population health in Brazil were
developed by Ribeiro (1971). In the region of Santo Andre, a state of S~ao Paulo,
the author observed an association between the number of visits for upper respira-
tory infection and asthmatic bronchitis in children under 12 years old and the
monthly rates of sulfate and suspended dust. Later, Mendes and Wakanatsu
(1976) observed, for the first time, the acute effects of three intense episodes of
air pollution in S~ao Caetano do Sul, a city in the state of S~ao Paulo. The review of
8000 medical records occurred in June 1979, showed morbidity peaks overlapping
386 J.A. Menezes et al.
pollution peaks of particulate material and SO2. The authors also verified an
increase in the number of cases of respiratory and cardiovascular diseases surpass-
ing the increase of attendances by other causes. Soon afterwards, Ribeiro et al.
(1976) compared, through respiratory function tests, the conditions of 2000
schoolchildren aged 7–12 years living in two distinct areas of Greater S~ao Paulo,
one industrialized and the other semirural. The results showed lower rates of
ventilatory capacity and symptoms of chronic lung diseases in children of the
industrial region, even after controlling for socioeconomic variables.
Regarding at-risk age groups, studies have shown that children and the elderly
are the most affected by air pollution, both in Brazil and internationally (Barbosa
et al. 2015; Braga et al. 1999, 2001; Martins et al. 2002a, b, Rodrigues et al. 2010;
Rom~ao et al. 2013; Saldiva et al. 1994, 1995). In Brazil, Barbosa et al. (2015)
observed a significant association between visits of children and adolescents with
sickle cell anemia to the pediatric emergency room in S~ao Paulo and the variation
(increase) of PM10, NO2, SO2, CO, and O3. Another survey studied the association
of respiratory morbidity in children under 13 years old to thermal comfort, air
pollutants, and meteorological variations in the city of S~ao Paulo (Coelho et al.
2010). The analysis performed showed that the air pollutants were statistically
correlated with (a) hospitalizations for upper respiratory tract infections and other
diseases of the respiratory tract, (b) respiratory infections of the lower respiratory
tract, and (c) infections caused by influenza and pneumonia. Despite these positive
results, it is known that health depends not only on environmental factors but also
on results from hereditary, nutritional, and economic factors.
The WHO sets safe limits for annual mean concentration of air pollutants: 20 μg.m�3 for PM10 and 10 μg.m�3 for PM2.5. Brazil has a national air quality standard
that specifies limits for the availability of inhaling thick particles (150 μg.m�3/day),
but makes no mention to finer particles, PM2.5, which are able to penetrate the
respiratory tract in more depth and are associated with significant health conditions
(Saldiva et al. 1994; Lanki et al. 2006; St€olzel et al. 2007). Previous research has
shown that impacts relapse in a more adversely way upon the extremes of the age
spectrum due to physiological and sensitivity conditions. Gouveia and Fletcher
(2000) found an increase in mortality due to respiratory diseases of 6% together
with increased fine particulate matter and sulfur dioxide concentrations – an even
higher mortality risk for the population over 65 years old was observed in the S~aoPaulo city. The trend of higher mortality risk for the elderly population was also
confirmed in other studies, whereas the same was observed for children in Brazil,
who presented an increase in hospital respiratory admission of 12% when consid-
ered PM10 (Braga et al. 1999; Saldiva et al. 1995).
Reviewing air pollution and pregnancy problems, various degrees of association
between air pollution and problems in intrauterine growth have been found: low
birth weight, conception problems, premature birth, and death from respiratory
diseases due to exposure to particulate matter in the postnatal period. Rom~ao et al.
(2013) developed a study in Santo Andre, a state of S~ao Paulo, a municipality
heavily affected by traffic and pollution. A significant association was found
between the risk of being born with low weight and exposure to PM10 between
23 Air Pollution, Climate Change, and Human Health in Brazil 387
the first and second trimester of pregnancy. Santos et al. (2016) observed similar
results regarding maternal exposure in the first and third trimester of gestation to air
pollution in the city of S~ao Jose dos Campos, S~ao Paulo, with effects on weight of
newborns.
About the elderly, Martins et al. (2002a) verified the effect of air pollution on the
attendance of this group due to pneumonia and influenza in S~ao Paulo city. The
ecological study encompassed the time series from 1996 to 1998 and used descrip-
tive statistics of the following atmospheric pollutants: particulate matter (PM),
carbon monoxide (CO), sulfur dioxide (SO2), nitrogen dioxide (NO2), and ozone
(O3). The number of visits for pneumonia and influenza had a significant positive
correlation with CO, SO2, and PM10. In S~ao Paulo, studies have shown an increase
of 18% in hospitalizations for chronic obstructive pulmonary disease and of 14%
for asthma among the elderly. This increase was associated with daily variations in
ozone concentrations up to 35.87 μg.m�3 (Braga et al. 2001; Martins et al. 2002b).
Biological studies, developed in the city of S~ao Paulo, also demonstrate the
consequences that pollution might bring to the human/animal organism. de Brito
et al. (2014) observed that mice exposed to concentrated atmospheric particles
(CAPs) presented lung inflammation with increased neutrophils and macrophages.
Mice exposed in the cold/dry period presented the most prominent inflammations.
This was due to the difficulty of dispersing pollutants in the cold/dry season, which
aggravates air quality in large urban centers (Albuquerque et al. 2012; Matsumoto
et al. 2010). In the short term, the findings demonstrated that exposure to low
concentrations of CAPs caused significant pulmonary inflammation and, to a lesser
extent, changes in blood parameters. In addition, the data suggest that changes in
climate may slightly alter the toxicity of CAPs in the cold/dry period and may
produce a more exacerbated response.
Nationally, there is a huge contribution of the biomass burning to the concen-
tration of particulate matter in the air, whether due to forest fires – mainly in the
northern region of Brazil – or by sugarcane burning, a common procedure in the
southeast region. Studies conducted in Araraquara and Piracicaba, located in the
state of S~ao Paulo, which produces 60% of Brazil’s sugarcane, found a positive
association between the number of daily therapeutic inhalations in health services
and the concentration of particulate matter generated by sugarcane burning (Arbex
et al. 2000; Cancado et al. 2006). The annual mean PM10 was 56 μg.m�3, the same
as that of the city of S~ao Paulo in 1997, with variations between 88 and 29 μg.m�3,
corresponding to the harvest and inter-harvest periods, respectively. These studies
raise an interesting point in demonstrating that the sugarcane straw burning emits
pollutants that lead to an increase in respiratory morbidity like the pollution
produced by fossil fuels in large urban centers (Abex et al. 2000; Cancado et al.
2006). In addition to worsening local air quality, pollution from this type of biomass
burning may extend miles away, reaching populations far from the emission source.
Recently, there has been an effort by Brazilian researchers to understand and
demonstrate the atmospheric pollution effects, especially in the state of S~ao Paulo.
A review carried out in 2015 by Pereira and Limonge showed that among the
studies selected for analysis, 76% were developed in the state of S~ao Paulo
388 J.A. Menezes et al.
(Table 23.3). According to the results presented, the inhalable fraction of PM10 was
positively associated with health outcomes in 62.5% of the evaluated surveys, even
though it was below the daily and annual limits recommended by CONAMA. This
result points out to two evidences. The first is related to the particulate matter
comprising the air pollution indicator mostly used in the monitoring of air quality.
The other evidence reveals the necessity to revise national parameters of particulate
matter and the inclusion of PM2.5 fraction in the national environmental legislation
(Andrade-Filho et al. 2013; Mascarenhas et al. 2008; Ignotti et al. 2010a, b).
Forest Fires and Health in Northern Brazil
Burnings in the Brazilian rain forests of the northern region, where the Amazon
biome is located, are related to the human occupation of the territory, which has
been occurring in migratory pulses with a focus on mining and/or the opening of
agricultural frontiers (Ribeiro and Asunc~ao 2002). Biomass burning has become a
common practice in the Amazon and, in the last decades, has been mainly related to
agricultural production and pasture formation. According to Ribeiro and Assunc~ao(2002), the practice consists of incomplete combustion in the open air and depends
on the type of biomass being burned and its density, humidity, and environmental
conditions, especially wind speed. In this process, the resulting emissions initially
comprise of carbon monoxide (CO) and particulate matter (soot), as well as simple
and complex organic compounds represented by hydrocarbons (HC) and other
volatile and semi-volatile organic compounds, which are of great interest in terms
of public health due to high toxicity characteristics. In addition to direct emissions,
atmosphere reactions between these pollutants and several other compounds pre-
sent in the air occur, such as photochemical reactions with important participation
of the sun’s ultraviolet radiation, resulting in compounds that may be more toxic
than their precursors, namely, ozone (O3), peroxyacyl nitrates (PAN), and alde-
hydes (Ribeiro and Assunc~ao 2002; Artaxo et al. 2005).
One of the most important episodes recorded in the northern region was the 1998
fire in the state of Roraima, where burnings used to clear pastures and remnants of
forest escaped human control and destroyed an area of around 40,000 km2 – about
20% of the state (Ribeiro and Asunc~ao 2002). The effects on the environment were
severe; however, those related to human health did not present great magnitude
because of the low population density of the state and the northern region. In spite
of this demographic factor, the risk of occurrence of similar events is constant for
the region, since the same situation observed in Roraima is reproduced along the
“arc of deforestation” to the south of the Amazon, comprising part of the states of
Rondonia, Acre, Amazonas, Para, Mato Grosso, Tocantins, and Maranh~ao(Nascimento et al. 2000; Ribeiro and Assunc~ao 2002). According to the National
Institute of Space Research (INPE), the number of forest fires accumulated in Brazil
between 2012 and 2016 was 149,385 (INPE 2016). In relation to the Legal Amazon,
made up of nine Brazilian states, in the same period, the region accumulated 72% of
23 Air Pollution, Climate Change, and Human Health in Brazil 389
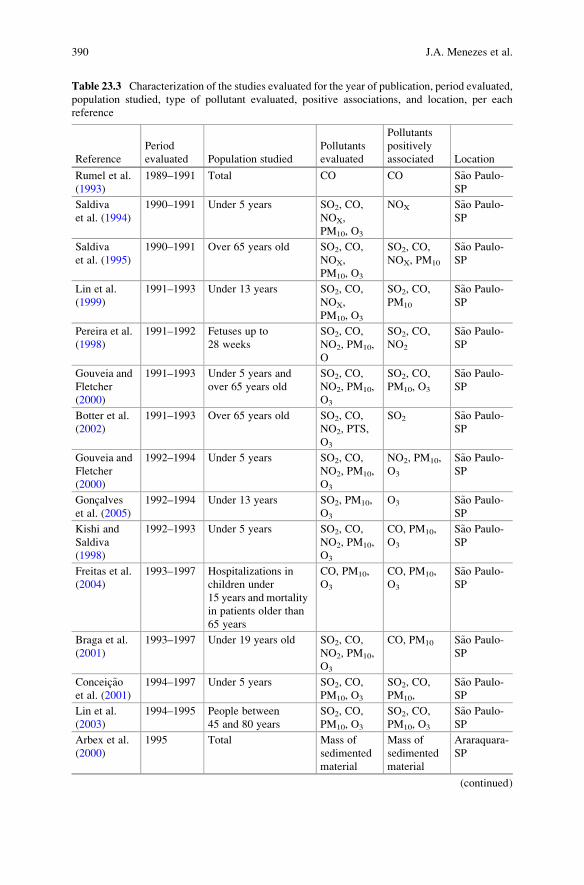
Table 23.3 Characterization of the studies evaluated for the year of publication, period evaluated,
population studied, type of pollutant evaluated, positive associations, and location, per each
reference
Reference
Period
evaluated Population studied
Pollutants
evaluated
Pollutants
positively
associated Location
Rumel et al.
(1993)
1989–1991 Total CO CO S~ao Paulo-
SP
Saldiva
et al. (1994)
1990–1991 Under 5 years SO2, CO,
NOX,
PM10, O3
NOX S~ao Paulo-
SP
Saldiva
et al. (1995)
1990–1991 Over 65 years old SO2, CO,
NOX,
PM10, O3
SO2, CO,
NOX, PM10
S~ao Paulo-
SP
Lin et al.
(1999)
1991–1993 Under 13 years SO2, CO,
NOX,
PM10, O3
SO2, CO,
PM10
S~ao Paulo-
SP
Pereira et al.
(1998)
1991–1992 Fetuses up to
28 weeks
SO2, CO,
NO2, PM10,
O
SO2, CO,
NO2
S~ao Paulo-
SP
Gouveia and
Fletcher
(2000)
1991–1993 Under 5 years and
over 65 years old
SO2, CO,
NO2, PM10,
O3
SO2, CO,
PM10, O3
S~ao Paulo-
SP
Botter et al.
(2002)
1991–1993 Over 65 years old SO2, CO,
NO2, PTS,
O3
SO2 S~ao Paulo-
SP
Gouveia and
Fletcher
(2000)
1992–1994 Under 5 years SO2, CO,
NO2, PM10,
O3
NO2, PM10,
O3
S~ao Paulo-
SP
Goncalves
et al. (2005)
1992–1994 Under 13 years SO2, PM10,
O3
O3 S~ao Paulo-
SP
Kishi and
Saldiva
(1998)
1992–1993 Under 5 years SO2, CO,
NO2, PM10,
O3
CO, PM10,
O3
S~ao Paulo-
SP
Freitas et al.
(2004)
1993–1997 Hospitalizations in
children under
15 years and mortality
in patients older than
65 years
CO, PM10,
O3
CO, PM10,
O3
S~ao Paulo-
SP
Braga et al.
(2001)
1993–1997 Under 19 years old SO2, CO,
NO2, PM10,
O3
CO, PM10 S~ao Paulo-
SP
Conceic~aoet al. (2001)
1994–1997 Under 5 years SO2, CO,
PM10, O3
SO2, CO,
PM10,
S~ao Paulo-
SP
Lin et al.
(2003)
1994–1995 People between
45 and 80 years
SO2, CO,
PM10, O3
SO2, CO,
PM10, O3
S~ao Paulo-
SP
Arbex et al.
(2000)
1995 Total Mass of
sedimented
material
Mass of
sedimented
material
Araraquara-
SP
(continued)
390 J.A. Menezes et al.
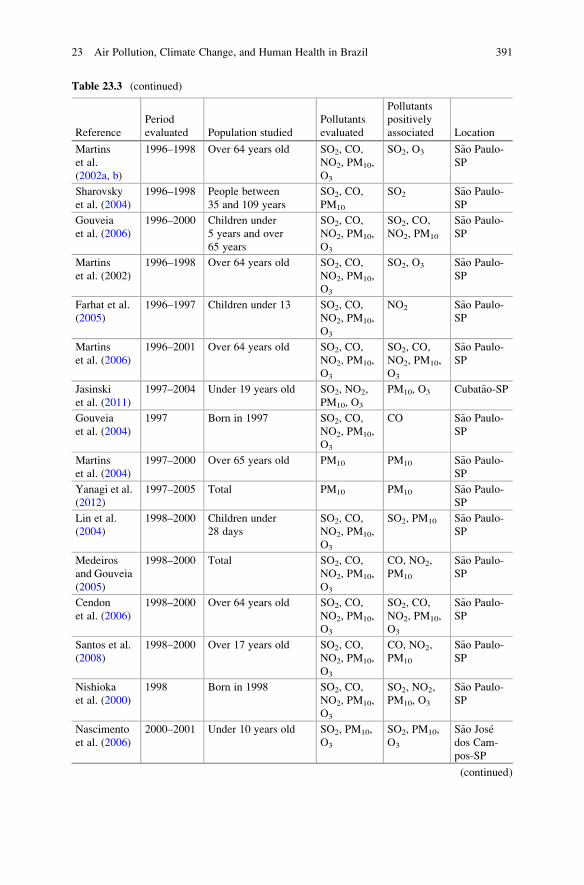
Table 23.3 (continued)
Reference
Period
evaluated Population studied
Pollutants
evaluated
Pollutants
positively
associated Location
Martins
et al.
(2002a, b)
1996–1998 Over 64 years old SO2, CO,
NO2, PM10,
O3
SO2, O3 S~ao Paulo-
SP
Sharovsky
et al. (2004)
1996–1998 People between
35 and 109 years
SO2, CO,
PM10
SO2 S~ao Paulo-
SP
Gouveia
et al. (2006)
1996–2000 Children under
5 years and over
65 years
SO2, CO,
NO2, PM10,
O3
SO2, CO,
NO2, PM10
S~ao Paulo-
SP
Martins
et al. (2002)
1996–1998 Over 64 years old SO2, CO,
NO2, PM10,
O3
SO2, O3 S~ao Paulo-
SP
Farhat et al.
(2005)
1996–1997 Children under 13 SO2, CO,
NO2, PM10,
O3
NO2 S~ao Paulo-
SP
Martins
et al. (2006)
1996–2001 Over 64 years old SO2, CO,
NO2, PM10,
O3
SO2, CO,
NO2, PM10,
O3
S~ao Paulo-
SP
Jasinski
et al. (2011)
1997–2004 Under 19 years old SO2, NO2,
PM10, O3
PM10, O3 Cubat~ao-SP
Gouveia
et al. (2004)
1997 Born in 1997 SO2, CO,
NO2, PM10,
O3
CO S~ao Paulo-
SP
Martins
et al. (2004)
1997–2000 Over 65 years old PM10 PM10 S~ao Paulo-
SP
Yanagi et al.
(2012)
1997–2005 Total PM10 PM10 S~ao Paulo-
SP
Lin et al.
(2004)
1998–2000 Children under
28 days
SO2, CO,
NO2, PM10,
O3
SO2, PM10 S~ao Paulo-
SP
Medeiros
and Gouveia
(2005)
1998–2000 Total SO2, CO,
NO2, PM10,
O3
CO, NO2,
PM10
S~ao Paulo-
SP
Cendon
et al. (2006)
1998–2000 Over 64 years old SO2, CO,
NO2, PM10,
O3
SO2, CO,
NO2, PM10,
O3
S~ao Paulo-
SP
Santos et al.
(2008)
1998–2000 Over 17 years old SO2, CO,
NO2, PM10,
O3
CO, NO2,
PM10
S~ao Paulo-
SP
Nishioka
et al. (2000)
1998 Born in 1998 SO2, CO,
NO2, PM10,
O3
SO2, NO2,
PM10, O3
S~ao Paulo-
SP
Nascimento
et al. (2006)
2000–2001 Under 10 years old SO2, PM10,
O3
SO2, PM10,
O3
S~ao Jose
dos Cam-
pos-SP
(continued)
23 Air Pollution, Climate Change, and Human Health in Brazil 391
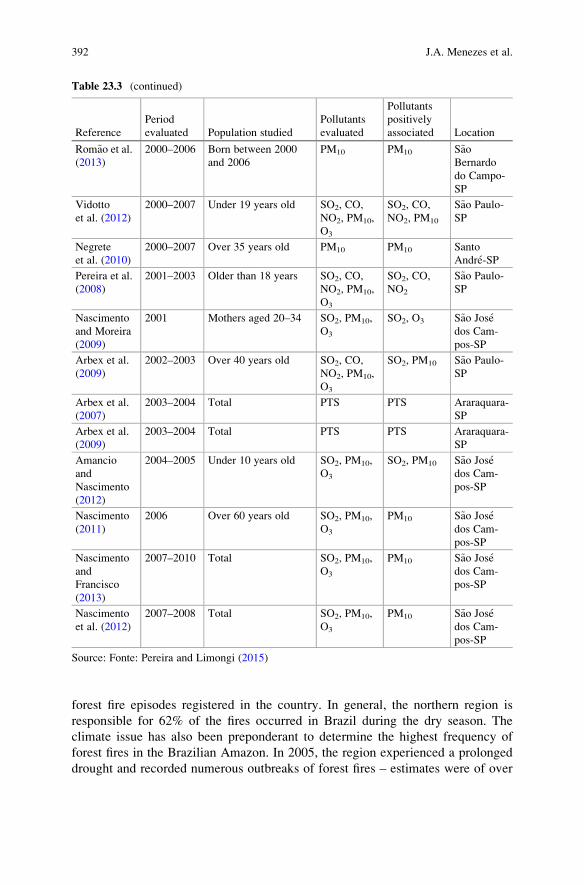
forest fire episodes registered in the country. In general, the northern region is
responsible for 62% of the fires occurred in Brazil during the dry season. The
climate issue has also been preponderant to determine the highest frequency of
forest fires in the Brazilian Amazon. In 2005, the region experienced a prolonged
drought and recorded numerous outbreaks of forest fires – estimates were of over
Table 23.3 (continued)
Reference
Period
evaluated Population studied
Pollutants
evaluated
Pollutants
positively
associated Location
Rom~ao et al.(2013)
2000–2006 Born between 2000
and 2006
PM10 PM10 S~aoBernardo
do Campo-
SP
Vidotto
et al. (2012)
2000–2007 Under 19 years old SO2, CO,
NO2, PM10,
O3
SO2, CO,
NO2, PM10
S~ao Paulo-
SP
Negrete
et al. (2010)
2000–2007 Over 35 years old PM10 PM10 Santo
Andre-SP
Pereira et al.
(2008)
2001–2003 Older than 18 years SO2, CO,
NO2, PM10,
O3
SO2, CO,
NO2
S~ao Paulo-
SP
Nascimento
and Moreira
(2009)
2001 Mothers aged 20–34 SO2, PM10,
O3
SO2, O3 S~ao Jose
dos Cam-
pos-SP
Arbex et al.
(2009)
2002–2003 Over 40 years old SO2, CO,
NO2, PM10,
O3
SO2, PM10 S~ao Paulo-
SP
Arbex et al.
(2007)
2003–2004 Total PTS PTS Araraquara-
SP
Arbex et al.
(2009)
2003–2004 Total PTS PTS Araraquara-
SP
Amancio
and
Nascimento
(2012)
2004–2005 Under 10 years old SO2, PM10,
O3
SO2, PM10 S~ao Jose
dos Cam-
pos-SP
Nascimento
(2011)
2006 Over 60 years old SO2, PM10,
O3
PM10 S~ao Jose
dos Cam-
pos-SP
Nascimento
and
Francisco
(2013)
2007–2010 Total SO2, PM10,
O3
PM10 S~ao Jose
dos Cam-
pos-SP
Nascimento
et al. (2012)
2007–2008 Total SO2, PM10,
O3
PM10 S~ao Jose
dos Cam-
pos-SP
Source: Fonte: Pereira and Limongi (2015)
392 J.A. Menezes et al.
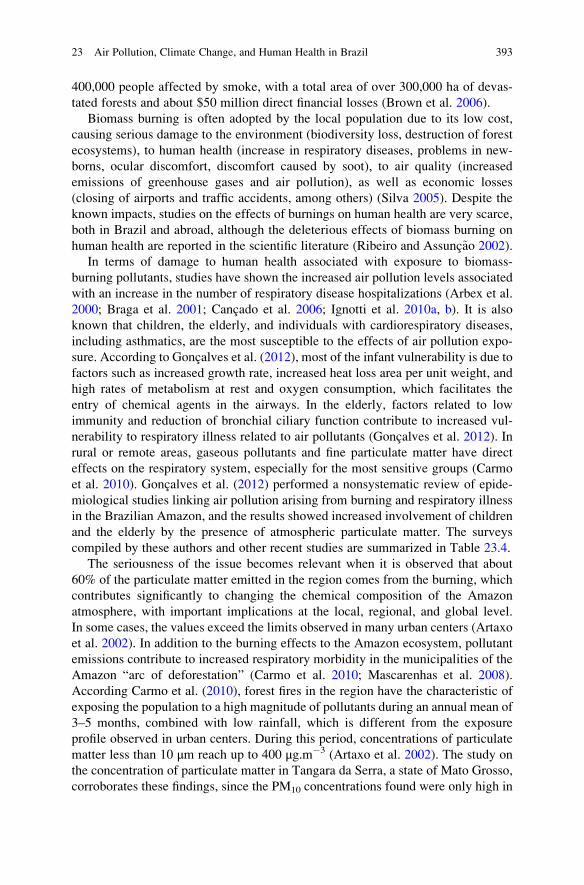
400,000 people affected by smoke, with a total area of over 300,000 ha of devas-
tated forests and about $50 million direct financial losses (Brown et al. 2006).
Biomass burning is often adopted by the local population due to its low cost,
causing serious damage to the environment (biodiversity loss, destruction of forest
ecosystems), to human health (increase in respiratory diseases, problems in new-
borns, ocular discomfort, discomfort caused by soot), to air quality (increased
emissions of greenhouse gases and air pollution), as well as economic losses
(closing of airports and traffic accidents, among others) (Silva 2005). Despite the
known impacts, studies on the effects of burnings on human health are very scarce,
both in Brazil and abroad, although the deleterious effects of biomass burning on
human health are reported in the scientific literature (Ribeiro and Assunc~ao 2002).
In terms of damage to human health associated with exposure to biomass-
burning pollutants, studies have shown the increased air pollution levels associated
with an increase in the number of respiratory disease hospitalizations (Arbex et al.
2000; Braga et al. 2001; Cancado et al. 2006; Ignotti et al. 2010a, b). It is also
known that children, the elderly, and individuals with cardiorespiratory diseases,
including asthmatics, are the most susceptible to the effects of air pollution expo-
sure. According to Goncalves et al. (2012), most of the infant vulnerability is due to
factors such as increased growth rate, increased heat loss area per unit weight, and
high rates of metabolism at rest and oxygen consumption, which facilitates the
entry of chemical agents in the airways. In the elderly, factors related to low
immunity and reduction of bronchial ciliary function contribute to increased vul-
nerability to respiratory illness related to air pollutants (Goncalves et al. 2012). In
rural or remote areas, gaseous pollutants and fine particulate matter have direct
effects on the respiratory system, especially for the most sensitive groups (Carmo
et al. 2010). Goncalves et al. (2012) performed a nonsystematic review of epide-
miological studies linking air pollution arising from burning and respiratory illness
in the Brazilian Amazon, and the results showed increased involvement of children
and the elderly by the presence of atmospheric particulate matter. The surveys
compiled by these authors and other recent studies are summarized in Table 23.4.
The seriousness of the issue becomes relevant when it is observed that about
60% of the particulate matter emitted in the region comes from the burning, which
contributes significantly to changing the chemical composition of the Amazon
atmosphere, with important implications at the local, regional, and global level.
In some cases, the values exceed the limits observed in many urban centers (Artaxo
et al. 2002). In addition to the burning effects to the Amazon ecosystem, pollutant
emissions contribute to increased respiratory morbidity in the municipalities of the
Amazon “arc of deforestation” (Carmo et al. 2010; Mascarenhas et al. 2008).
According Carmo et al. (2010), forest fires in the region have the characteristic of
exposing the population to a high magnitude of pollutants during an annual mean of
3–5 months, combined with low rainfall, which is different from the exposure
profile observed in urban centers. During this period, concentrations of particulate
matter less than 10 μm reach up to 400 μg.m�3 (Artaxo et al. 2002). The study on
the concentration of particulate matter in Tangara da Serra, a state of Mato Grosso,
corroborates these findings, since the PM10 concentrations found were only high in
23 Air Pollution, Climate Change, and Human Health in Brazil 393
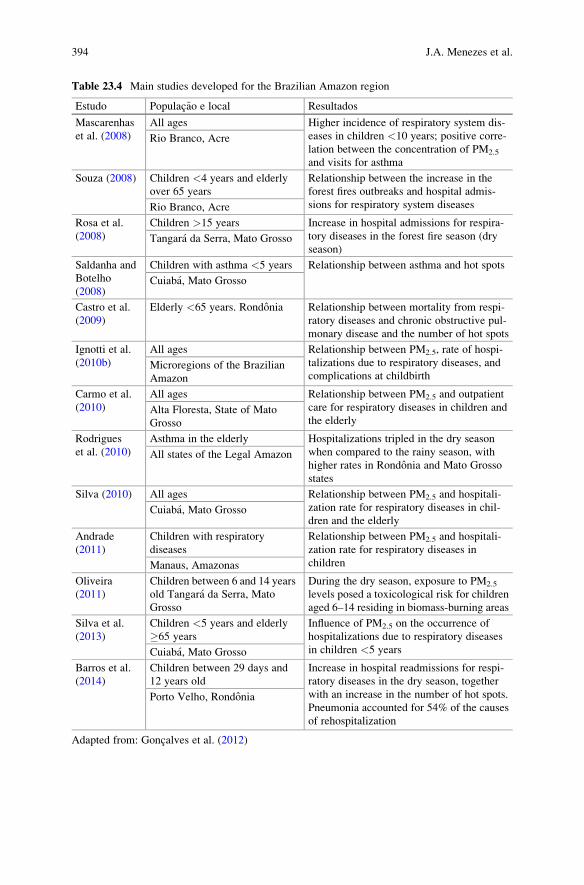
Table 23.4 Main studies developed for the Brazilian Amazon region
Estudo Populac~ao e local Resultados
Mascarenhas
et al. (2008)
All ages Higher incidence of respiratory system dis-
eases in children <10 years; positive corre-
lation between the concentration of PM2.5
and visits for asthma
Rio Branco, Acre
Souza (2008) Children <4 years and elderly
over 65 years
Relationship between the increase in the
forest fires outbreaks and hospital admis-
sions for respiratory system diseasesRio Branco, Acre
Rosa et al.
(2008)
Children >15 years Increase in hospital admissions for respira-
tory diseases in the forest fire season (dry
season)Tangara da Serra, Mato Grosso
Saldanha and
Botelho
(2008)
Children with asthma <5 years Relationship between asthma and hot spots
Cuiaba, Mato Grosso
Castro et al.
(2009)
Elderly <65 years. Rondonia Relationship between mortality from respi-
ratory diseases and chronic obstructive pul-
monary disease and the number of hot spots
Ignotti et al.
(2010b)
All ages Relationship between PM2.5, rate of hospi-
talizations due to respiratory diseases, and
complications at childbirthMicroregions of the Brazilian
Amazon
Carmo et al.
(2010)
All ages Relationship between PM2.5 and outpatient
care for respiratory diseases in children and
the elderlyAlta Floresta, State of Mato
Grosso
Rodrigues
et al. (2010)
Asthma in the elderly Hospitalizations tripled in the dry season
when compared to the rainy season, with
higher rates in Rondonia and Mato Grosso
states
All states of the Legal Amazon
Silva (2010) All ages Relationship between PM2.5 and hospitali-
zation rate for respiratory diseases in chil-
dren and the elderlyCuiaba, Mato Grosso
Andrade
(2011)
Children with respiratory
diseases
Relationship between PM2.5 and hospitali-
zation rate for respiratory diseases in
childrenManaus, Amazonas
Oliveira
(2011)
Children between 6 and 14 years
old Tangara da Serra, Mato
Grosso
During the dry season, exposure to PM2.5
levels posed a toxicological risk for children
aged 6–14 residing in biomass-burning areas
Silva et al.
(2013)
Children <5 years and elderly
�65 years
Influence of PM2.5 on the occurrence of
hospitalizations due to respiratory diseases
in children <5 yearsCuiaba, Mato Grosso
Barros et al.
(2014)
Children between 29 days and
12 years old
Increase in hospital readmissions for respi-
ratory diseases in the dry season, together
with an increase in the number of hot spots.
Pneumonia accounted for 54% of the causes
of rehospitalization
Porto Velho, Rondonia
Adapted from: Goncalves et al. (2012)
394 J.A. Menezes et al.
the months of August, September, and October, just when the largest forest fire
numbers occurred in the state – between 2008 and 2009 (Moreira et al. 2014).
Similarly, Santiago et al. (2015), to characterize the present particulate matter in
Cuiaba, state of Mato Grosso, found the highest concentration of suspended par-
ticulate matter in September – 306 μg.m�3 after a long dry period, which exceeds
the primary limit set by CONAMA.
Conclusions
In the Brazilian scenario, two major factors influence the patterns of emission and
the air quality associated: the economic development model based on commodities,
which puts great demands on natural resources and is linked to some poor techno-
logical practices such as slash-and-burn agriculture and deforestation for livestock
expansion, and the traffic in large urban centers. This is characterized by intense
vehicle flows, absence of urban and traffic planning, and the massive usage of
diesel-powered vehicle fleet. As demonstrated in here, the result has been the
overcoming of the national and international thresholds of emission of important
pollutants, such as PM and ozone, in several Brazilian cities, with relevant conse-
quences to the health of the population. In the near future, the climate change
represents a threat to the maintenance of the basic air quality patterns, since there is
a consistent relationship between the availability of some pollutants in the atmo-
sphere and alterations in the regional dynamic of climate, since the generation and
dispersion of air pollutants may also be influenced by certain meteorological and
climatic factors. Therefore, to maintain the air quality in satisfactory levels, con-
sidering the prospects of climate change, it is necessary both to improve the
national patterns, once not even PM2.5, recognized for its ability to cause significant
harm to human health, is parameterized by Brazilian standards, and to promote the
use of renewable energy and less aggressive economic practices to the environment
aiming to mitigate the climate change impacts. In addition, a more effective
monitoring network to assess the emissions and types of pollutants present in all
parts of the country would greatly contribute to a better understanding of the
association between health problems and pollution in the various regions of Brazil,
and not only in the southeastern region, the most populated and polluted region of
Brazil.
References
Akimoto H (2003) Global air quality and pollution. Science 302(5651):1716–1719
Albuquerque TT, Andrade MF, Ynoue RY (2012) Characterization of atmospheric aerosols in the
city of S~ao Paulo, Brazil: comparisons between polluted and unpolluted periods. Environ
Monit Assess 184(2):969–984
23 Air Pollution, Climate Change, and Human Health in Brazil 395
Amancio CT, Nascimento LFC (2012) Asma e poluentes ambientais: um estudo de series
temporais. Rev Assoc Med Bras 58(3):302–307
Andrade Filho VSD (2011) Estudo da associac~ao entre material particulado emitido em queimadas
e doencas respiratorias no municıpio de Manaus, AM. Master dissertation. National Institute of
Research of Amazon
Andrade Filho VSD, Artaxo P, Hacon S, Carmo CND, Cirino G (2013) Aerossois de queimadas e
doencas respiratorias em criancas, Manaus, Brasil. Rev Saude Publica 47(2):239–247
Arbex MA, B€ohm GM, Saldiva PH, Conceicao GM III, A. C. P, Braga AL (2000) Assessment of
the effects of sugar cane plantation burning on daily counts of inhalation therapy. J Air Waste
Manage Assoc 50(10):1745–1749
Arbex MA, Martins LC, de Oliveira RC, Pereira LAA, Arbex FF, Cancado JED, . . ., Braga ALF(2007) Air pollution from biomass burning and asthma hospital admissions in a sugar cane
plantation area in Brazil. J Epidemiol Community Health 61(5):395–400
Arbex MA, de Souza Conceic~ao GM, Cendon SP, Arbex FF, Lopes AC, Moyses EP, . . ., BragaALF (2009) Urban air pollution and chronic obstructive pulmonary disease-related emergency
department visits. J Epidemiol Community Health 63(10):777–783
Aris RM, Christian D, Hearne PQ, Kerr K, Finkbeiner WE, Balmes JR (1993) Ozone-induced
airway inflammation in human subjects as determined by airway lavage and biopsy. Am Rev
Respir Dis 148(5):1363–1372
Artaxo P, Martins JV, Yamasoe MA, Procopio AS, Pauliquevis TM, Andreae MO, . . ., Leal AMC
(2002) Physical and chemical properties of aerosols in the wet and dry seasons in Rondonia,
Amazonia. J Geophys Res: Atmos 107(D20)
Artaxo P, Gatti LV, Leal AMC, Longo KM, Freitas SRD, Lara LL, . . ., Rizzo LV (2005) Quımica
atmosferica na Amazonia: a floresta e as emissões de queimadas controlando a composic~ao daatmosfera amazonica. Acta Amazon 35(2):185–196
Arya SP (2000) Air pollution meteorology and dispersion. Bound Lay Meteorol 94:171–172
Aw J, Kleeman MJ (2003) Evaluating the first-order effect of intraannual temperature variability
on urban air pollution. J Geophys Res Atmos 108(D12):4365
Balkanski YJ, Jacob DJ, Gardner GM, Graustein WC, Turekian KK (1993) Transport and
residence times of tropospheric aerosols inferred from a global three-dimensional simulation
of 210Pb. J Geophys Res Atmos 98(D11):20573–20586
Barbosa SMM, Farhat SCL, Martins LC, Pereira LAA, Saldiva PHN, Zanobetti A, Braga ALF
(2015) Air pollution and children’s health: sickle cell disease. Cad Saude Publica 31
(2):265–275
Barros MMA, Goncalves KDS, Hacon SDS (2014) Reinternacões hospitalares por doencas
respiratorias em menores de 12 anos e as queimadas em Porto Velho–RO, Amazonia
Ocidental. Rev Saude, Meio Ambiente Sustentabilidade 8(3)
Bell ML, Dominici F, Samet JM (2005) Meta-analysis of ozone and mortality. Epidemiology 16
(5):S35
B€ohm GM, Saldiva PHN, Pasqualucci CAG, Massad E, de Arruda Martins M, Zin WA., . . ., NegriEM (1989) Biological effects of air pollution in S~ao Paulo and Cubat~ao. Environ Res 49
(2):208–216
Botter DA, Jorgensen B, Peres AA (2002) A longitudinal study of mortality and air pollution for
S~ao Paulo, Brazil. J Expo Anal Environ Epidemiol 12(5):335–343
Brabin B, Smith M, Milligan P, Benjamin C, Dunne E, Pearson M (1994) Respiratory morbidity in
Merseyside schoolchildren exposed to coal dust and air pollution. Arch Dis Child 70
(4):305–312
Braga ALF (1998). Quantificac~ao dos efeitos da poluic~ao do ar sobre a saude da populac~aopediatrica da cidade de S~ao Paulo e proposta de monitorizac~ao. Doctoral thesis, S~ao Paulo
University, School of Medicine
Braga AL, Conceic~ao G, Pereira LA, Kishi HS, Pereira JC, Andrade MF, . . ., Latorre MR (1999)
Air pollution and pediatric respiratory hospital admissions in S~ao Paulo, Brazil. J Environ Med
1(2):95–102
396 J.A. Menezes et al.
Braga AL, Saldiva PH, Pereira LA, Menezes JJ, Conceic~ao GM, Lin CA, . . ., Dockery DW (2001)
Health effects of air pollution exposure on children and adolescents in S~ao Paulo, Brazil.
Pediatr Pulmonol 31(2):106–113
Braga ALF, Zanobetti A, Schwartz J (2002) The effect of weather on respiratory and cardiovas-
cular deaths in 12 US cities. Environ Health Perspect 110(9):859
de Brito JM, Macchione M, Yoshizaki K, Toledo-Arruda AC, Saraiva-Romanholo BM, Andrade
MdeF, Mauad T, Rivero DHRF, Saldiva PHN (2014) Acute cardiopulmonary effects induced
by the inhalation of concentrated ambient particles during seasonal variation in the city of Sao
Paulo. J Appl Physiol 117(5):492–499
Brazilian Ministry of Environment (2016) Poluentes Atmosfericos. Available at: http://www.
mma.gov.br/cidades-sustentaveis/qualidade-do-ar/poluentes-atmosf%C3%A9ricos. Accessed
3 Nov 2016
Brazilian Ministry of Health (2013) Department of Health Surveillance. Surveillance in Environ-
mental Health related to the Air Quality Program – VIGIAR. Instrument of Identification of
Municipalities of Risk, 2012: Situation of the Brazilian states. Brasilia
Brook RD, Franklin B, Cascio W, Hong Y, Howard G, Lipsett M, . . .. Tager I (2004) Air pollutionand cardiovascular disease. A statement for healthcare professionals from the expert panel on
population and prevention Science of the American Heart Association. Circulation 109
(21):2655–2671
Brown IF, Schroeder W, Setzer A, Maldonado R, Pantoja N, Duarte A, Marengo J (2006)
Monitoring fires in southwestern Amazonia rain forests. Eos 87(26):253–264
Cancado JE, Saldiva PH, Pereira LA, Lara LB, Artaxo P, Martinelli LA, . . ., Braga AL (2006) The
impact of sugar cane-burning emissions on the respiratory system of children and the elderly.
Environ Health Perspect 725–729
Carmo CN, Hacon S, Longo KM, Freitas S, Ignotti E, Ponce de Leon A, Artaxo P (2010)
Associac~ao entre material particulado de queimadas e doencas respiratorias na regi~ao sul da
Amazonia brasileira. Rev Panam Salud Publica 27(1):10–16
Castro HA, Goncalves KS, Hacon SS (2009) Tendencia da mortalidade por doencas respiratorias
em idosos e as queimadas no estado de Rondonia/Brasil – perıodo entre 1998 e 2005. Cien
Saude Colet 14(6):2083–2090
Cendon S, Pereira LA, Braga AL, Conceic~ao G, Cury Junior A, Romaldini H, . . ., Saldiva PH
(2006) Air pollution effects on myocardial infarction. Rev Saude Publica 40(3):414–419
Coelho MSZS, Goncalves FLT, Latorre MRDO (2010) Statistical analysis aiming at predicting
respiratory tract disease hospital admissions from environmental variables in the city of S~aoPaulo. J Environ Public Health 2010:209270
Companhia de Tecnologia de Saneamento Ambiental do estado de S~ao Paulo – CETESB (2016)
Qualidade do ar no estado de S~ao Paulo, 2015.CETESB, 167 pp. Available at: http://ar.cetesb.sp.gov.br/wp-content/uploads/sites/37/2013/12/RQAR-2015.pdf. Accessed on 30 Oct 2016
Conceicao GM, Miraglia SG, Kishi HS, Saldiva PH, Singer JM (2001) Air pollution and child
mortality: a time-series study in S~ao Paulo, Brazil. Environ Health Perspect 109(Suppl 3):347
Conselho Nacional do Meio Ambiente – CONAMA. Resolution N�005 of June 15 (1989) OfficialJournal of the Federative Republic of Brazil. Institutes the National Air Quality Control
Programee – PRONAR, Brasılia. 1989
Conselho Nacional do Meio Ambiente – CONAMA. Resolution N� 003 of June 28 (1990) OfficialJournal of the Federative Republic of Brazil. Sets standards of primary and secondary air
quality and even the criteria for acute episodes of air pollution, Brasilia, Brazil, 1990
Costa AA, Pauliquevis Junior TM (2014) Aerossois atmosfericos e nuvens. In: Ambrizzi T, Araujo
M (eds) Base cientıfica das mudancas climaticas. Contribuic~ao do Grupo de Trabalho 1 do
Painel Brasileiro de Mudancas Climaticas ao Primeiro Relatorio da Avaliac~ao Nacional sobre
Mudancas Climaticas, Chap. 6. COPPE. Universidade Federal do Rio de Janeiro, Rio de
Janeiro, pp 209–236
Dawson JP, Adams PJ, Pandis SN (2007) Sensitivity of PM 2.5 to climate in the Eastern US: a
modeling case study. Atmos Chem Phys 7(16):4295–4309
23 Air Pollution, Climate Change, and Human Health in Brazil 397
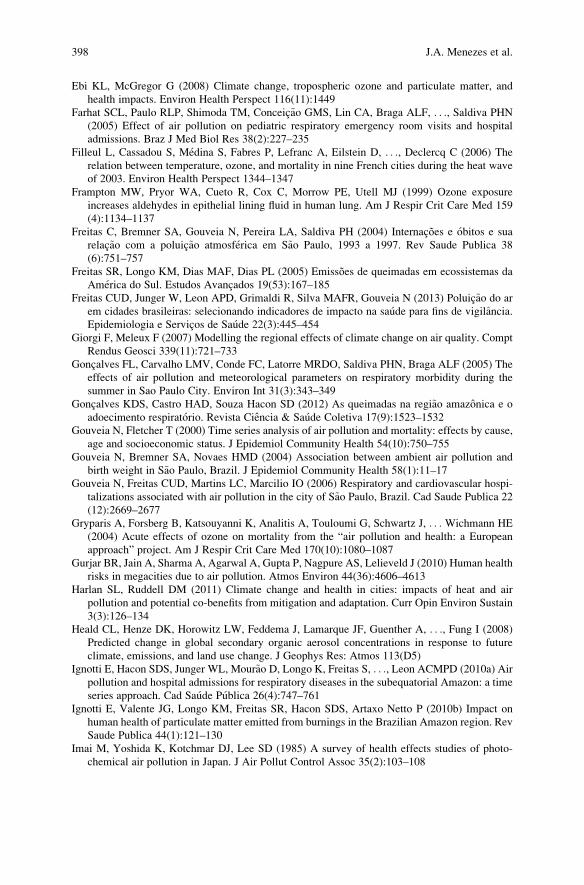
Ebi KL, McGregor G (2008) Climate change, tropospheric ozone and particulate matter, and
health impacts. Environ Health Perspect 116(11):1449
Farhat SCL, Paulo RLP, Shimoda TM, Conceic~ao GMS, Lin CA, Braga ALF, . . ., Saldiva PHN
(2005) Effect of air pollution on pediatric respiratory emergency room visits and hospital
admissions. Braz J Med Biol Res 38(2):227–235
Filleul L, Cassadou S, Medina S, Fabres P, Lefranc A, Eilstein D, . . ., Declercq C (2006) The
relation between temperature, ozone, and mortality in nine French cities during the heat wave
of 2003. Environ Health Perspect 1344–1347
Frampton MW, Pryor WA, Cueto R, Cox C, Morrow PE, Utell MJ (1999) Ozone exposure
increases aldehydes in epithelial lining fluid in human lung. Am J Respir Crit Care Med 159
(4):1134–1137
Freitas C, Bremner SA, Gouveia N, Pereira LA, Saldiva PH (2004) Internacões e obitos e sua
relac~ao com a poluic~ao atmosferica em S~ao Paulo, 1993 a 1997. Rev Saude Publica 38
(6):751–757
Freitas SR, Longo KM, Dias MAF, Dias PL (2005) Emissões de queimadas em ecossistemas da
America do Sul. Estudos Avancados 19(53):167–185
Freitas CUD, Junger W, Leon APD, Grimaldi R, Silva MAFR, Gouveia N (2013) Poluic~ao do ar
em cidades brasileiras: selecionando indicadores de impacto na saude para fins de vigilancia.
Epidemiologia e Servicos de Saude 22(3):445–454
Giorgi F, Meleux F (2007) Modelling the regional effects of climate change on air quality. Compt
Rendus Geosci 339(11):721–733
Goncalves FL, Carvalho LMV, Conde FC, Latorre MRDO, Saldiva PHN, Braga ALF (2005) The
effects of air pollution and meteorological parameters on respiratory morbidity during the
summer in Sao Paulo City. Environ Int 31(3):343–349
Goncalves KDS, Castro HAD, Souza Hacon SD (2012) As queimadas na regi~ao amazonica e o
adoecimento respiratorio. Revista Ciencia & Saude Coletiva 17(9):1523–1532
Gouveia N, Fletcher T (2000) Time series analysis of air pollution and mortality: effects by cause,
age and socioeconomic status. J Epidemiol Community Health 54(10):750–755
Gouveia N, Bremner SA, Novaes HMD (2004) Association between ambient air pollution and
birth weight in S~ao Paulo, Brazil. J Epidemiol Community Health 58(1):11–17
Gouveia N, Freitas CUD, Martins LC, Marcilio IO (2006) Respiratory and cardiovascular hospi-
talizations associated with air pollution in the city of S~ao Paulo, Brazil. Cad Saude Publica 22
(12):2669–2677
Gryparis A, Forsberg B, Katsouyanni K, Analitis A, Touloumi G, Schwartz J, . . . Wichmann HE
(2004) Acute effects of ozone on mortality from the “air pollution and health: a European
approach” project. Am J Respir Crit Care Med 170(10):1080–1087
Gurjar BR, Jain A, Sharma A, Agarwal A, Gupta P, Nagpure AS, Lelieveld J (2010) Human health
risks in megacities due to air pollution. Atmos Environ 44(36):4606–4613
Harlan SL, Ruddell DM (2011) Climate change and health in cities: impacts of heat and air
pollution and potential co-benefits from mitigation and adaptation. Curr Opin Environ Sustain
3(3):126–134
Heald CL, Henze DK, Horowitz LW, Feddema J, Lamarque JF, Guenther A, . . ., Fung I (2008)
Predicted change in global secondary organic aerosol concentrations in response to future
climate, emissions, and land use change. J Geophys Res: Atmos 113(D5)
Ignotti E, Hacon SDS, Junger WL, Mour~ao D, Longo K, Freitas S, . . ., Leon ACMPD (2010a) Air
pollution and hospital admissions for respiratory diseases in the subequatorial Amazon: a time
series approach. Cad Saude Publica 26(4):747–761
Ignotti E, Valente JG, Longo KM, Freitas SR, Hacon SDS, Artaxo Netto P (2010b) Impact on
human health of particulate matter emitted from burnings in the Brazilian Amazon region. Rev
Saude Publica 44(1):121–130
Imai M, Yoshida K, Kotchmar DJ, Lee SD (1985) A survey of health effects studies of photo-
chemical air pollution in Japan. J Air Pollut Control Assoc 35(2):103–108
398 J.A. Menezes et al.
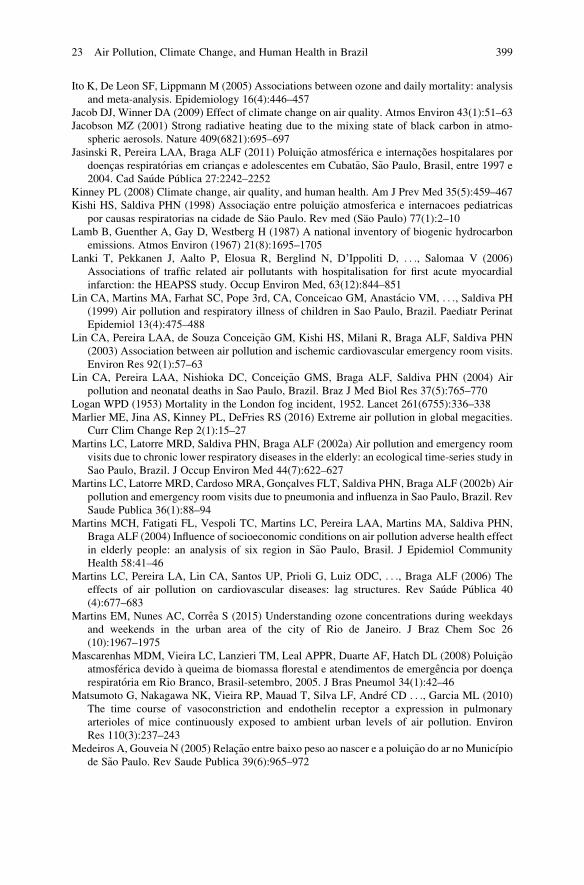
Ito K, De Leon SF, Lippmann M (2005) Associations between ozone and daily mortality: analysis
and meta-analysis. Epidemiology 16(4):446–457
Jacob DJ, Winner DA (2009) Effect of climate change on air quality. Atmos Environ 43(1):51–63
Jacobson MZ (2001) Strong radiative heating due to the mixing state of black carbon in atmo-
spheric aerosols. Nature 409(6821):695–697
Jasinski R, Pereira LAA, Braga ALF (2011) Poluic~ao atmosferica e internacões hospitalares pordoencas respiratorias em criancas e adolescentes em Cubat~ao, S~ao Paulo, Brasil, entre 1997 e
2004. Cad Saude Publica 27:2242–2252
Kinney PL (2008) Climate change, air quality, and human health. Am J Prev Med 35(5):459–467
Kishi HS, Saldiva PHN (1998) Associacao entre poluicao atmosferica e internacoes pediatricas
por causas respiratorias na cidade de Sao Paulo. Rev med (Sao Paulo) 77(1):2–10
Lamb B, Guenther A, Gay D, Westberg H (1987) A national inventory of biogenic hydrocarbon
emissions. Atmos Environ (1967) 21(8):1695–1705
Lanki T, Pekkanen J, Aalto P, Elosua R, Berglind N, D’Ippoliti D, . . ., Salomaa V (2006)
Associations of traffic related air pollutants with hospitalisation for first acute myocardial
infarction: the HEAPSS study. Occup Environ Med, 63(12):844–851
Lin CA, Martins MA, Farhat SC, Pope 3rd, CA, Conceicao GM, Anastacio VM, . . ., Saldiva PH(1999) Air pollution and respiratory illness of children in Sao Paulo, Brazil. Paediatr Perinat
Epidemiol 13(4):475–488
Lin CA, Pereira LAA, de Souza Conceic~ao GM, Kishi HS, Milani R, Braga ALF, Saldiva PHN
(2003) Association between air pollution and ischemic cardiovascular emergency room visits.
Environ Res 92(1):57–63
Lin CA, Pereira LAA, Nishioka DC, Conceic~ao GMS, Braga ALF, Saldiva PHN (2004) Air
pollution and neonatal deaths in Sao Paulo, Brazil. Braz J Med Biol Res 37(5):765–770
Logan WPD (1953) Mortality in the London fog incident, 1952. Lancet 261(6755):336–338
Marlier ME, Jina AS, Kinney PL, DeFries RS (2016) Extreme air pollution in global megacities.
Curr Clim Change Rep 2(1):15–27
Martins LC, Latorre MRD, Saldiva PHN, Braga ALF (2002a) Air pollution and emergency room
visits due to chronic lower respiratory diseases in the elderly: an ecological time-series study in
Sao Paulo, Brazil. J Occup Environ Med 44(7):622–627
Martins LC, Latorre MRD, Cardoso MRA, Goncalves FLT, Saldiva PHN, Braga ALF (2002b) Air
pollution and emergency room visits due to pneumonia and influenza in Sao Paulo, Brazil. Rev
Saude Publica 36(1):88–94
Martins MCH, Fatigati FL, Vespoli TC, Martins LC, Pereira LAA, Martins MA, Saldiva PHN,
Braga ALF (2004) Influence of socioeconomic conditions on air pollution adverse health effect
in elderly people: an analysis of six region in S~ao Paulo, Brasil. J Epidemiol Community
Health 58:41–46
Martins LC, Pereira LA, Lin CA, Santos UP, Prioli G, Luiz ODC, . . ., Braga ALF (2006) The
effects of air pollution on cardiovascular diseases: lag structures. Rev Saude Publica 40
(4):677–683
Martins EM, Nunes AC, Correa S (2015) Understanding ozone concentrations during weekdays
and weekends in the urban area of the city of Rio de Janeiro. J Braz Chem Soc 26
(10):1967–1975
Mascarenhas MDM, Vieira LC, Lanzieri TM, Leal APPR, Duarte AF, Hatch DL (2008) Poluic~aoatmosferica devido �a queima de biomassa florestal e atendimentos de emergencia por doenca
respiratoria em Rio Branco, Brasil-setembro, 2005. J Bras Pneumol 34(1):42–46
Matsumoto G, Nakagawa NK, Vieira RP, Mauad T, Silva LF, Andre CD . . ., Garcia ML (2010)
The time course of vasoconstriction and endothelin receptor a expression in pulmonary
arterioles of mice continuously exposed to ambient urban levels of air pollution. Environ
Res 110(3):237–243
Medeiros A, Gouveia N (2005) Relac~ao entre baixo peso ao nascer e a poluic~ao do ar no Municıpio
de S~ao Paulo. Rev Saude Publica 39(6):965–972
23 Air Pollution, Climate Change, and Human Health in Brazil 399
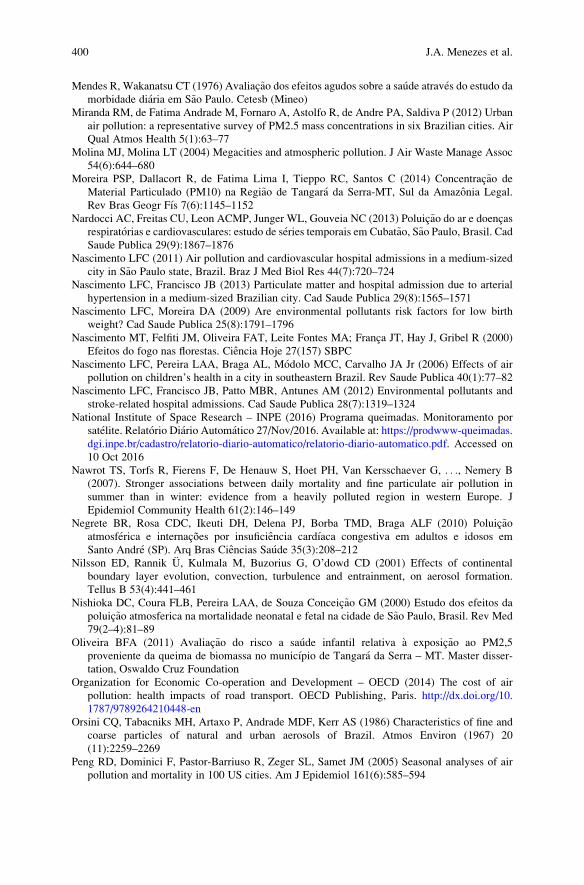
Mendes R, Wakanatsu CT (1976) Avaliac~ao dos efeitos agudos sobre a saude atraves do estudo damorbidade diaria em S~ao Paulo. Cetesb (Mineo)
Miranda RM, de Fatima Andrade M, Fornaro A, Astolfo R, de Andre PA, Saldiva P (2012) Urban
air pollution: a representative survey of PM2.5 mass concentrations in six Brazilian cities. Air
Qual Atmos Health 5(1):63–77
Molina MJ, Molina LT (2004) Megacities and atmospheric pollution. J Air Waste Manage Assoc
54(6):644–680
Moreira PSP, Dallacort R, de Fatima Lima I, Tieppo RC, Santos C (2014) Concentrac~ao de
Material Particulado (PM10) na Regi~ao de Tangara da Serra-MT, Sul da Amazonia Legal.
Rev Bras Geogr Fıs 7(6):1145–1152
Nardocci AC, Freitas CU, Leon ACMP, Junger WL, Gouveia NC (2013) Poluic~ao do ar e doencasrespiratorias e cardiovasculares: estudo de series temporais em Cubat~ao, S~ao Paulo, Brasil. CadSaude Publica 29(9):1867–1876
Nascimento LFC (2011) Air pollution and cardiovascular hospital admissions in a medium-sized
city in S~ao Paulo state, Brazil. Braz J Med Biol Res 44(7):720–724
Nascimento LFC, Francisco JB (2013) Particulate matter and hospital admission due to arterial
hypertension in a medium-sized Brazilian city. Cad Saude Publica 29(8):1565–1571
Nascimento LFC, Moreira DA (2009) Are environmental pollutants risk factors for low birth
weight? Cad Saude Publica 25(8):1791–1796
Nascimento MT, Felfiti JM, Oliveira FAT, Leite Fontes MA; Franca JT, Hay J, Gribel R (2000)
Efeitos do fogo nas florestas. Ciencia Hoje 27(157) SBPC
Nascimento LFC, Pereira LAA, Braga AL, Modolo MCC, Carvalho JA Jr (2006) Effects of air
pollution on children’s health in a city in southeastern Brazil. Rev Saude Publica 40(1):77–82
Nascimento LFC, Francisco JB, Patto MBR, Antunes AM (2012) Environmental pollutants and
stroke-related hospital admissions. Cad Saude Publica 28(7):1319–1324
National Institute of Space Research – INPE (2016) Programa queimadas. Monitoramento por
satelite. Relatorio Diario Automatico 27/Nov/2016. Available at: https://prodwww-queimadas.
dgi.inpe.br/cadastro/relatorio-diario-automatico/relatorio-diario-automatico.pdf. Accessed on
10 Oct 2016
Nawrot TS, Torfs R, Fierens F, De Henauw S, Hoet PH, Van Kersschaever G, . . ., Nemery B
(2007). Stronger associations between daily mortality and fine particulate air pollution in
summer than in winter: evidence from a heavily polluted region in western Europe. J
Epidemiol Community Health 61(2):146–149
Negrete BR, Rosa CDC, Ikeuti DH, Delena PJ, Borba TMD, Braga ALF (2010) Poluic~aoatmosferica e internacões por insuficiencia cardıaca congestiva em adultos e idosos em
Santo Andre (SP). Arq Bras Ciencias Saude 35(3):208–212
Nilsson ED, Rannik U, Kulmala M, Buzorius G, O’dowd CD (2001) Effects of continental
boundary layer evolution, convection, turbulence and entrainment, on aerosol formation.
Tellus B 53(4):441–461
Nishioka DC, Coura FLB, Pereira LAA, de Souza Conceic~ao GM (2000) Estudo dos efeitos da
poluic~ao atmosferica na mortalidade neonatal e fetal na cidade de S~ao Paulo, Brasil. Rev Med
79(2–4):81–89
Oliveira BFA (2011) Avaliac~ao do risco a saude infantil relativa �a exposic~ao ao PM2,5
proveniente da queima de biomassa no municıpio de Tangara da Serra – MT. Master disser-
tation, Oswaldo Cruz Foundation
Organization for Economic Co-operation and Development – OECD (2014) The cost of air
pollution: health impacts of road transport. OECD Publishing, Paris. http://dx.doi.org/10.
1787/9789264210448-en
Orsini CQ, Tabacniks MH, Artaxo P, Andrade MDF, Kerr AS (1986) Characteristics of fine and
coarse particles of natural and urban aerosols of Brazil. Atmos Environ (1967) 20
(11):2259–2269
Peng RD, Dominici F, Pastor-Barriuso R, Zeger SL, Samet JM (2005) Seasonal analyses of air
pollution and mortality in 100 US cities. Am J Epidemiol 161(6):585–594
400 J.A. Menezes et al.
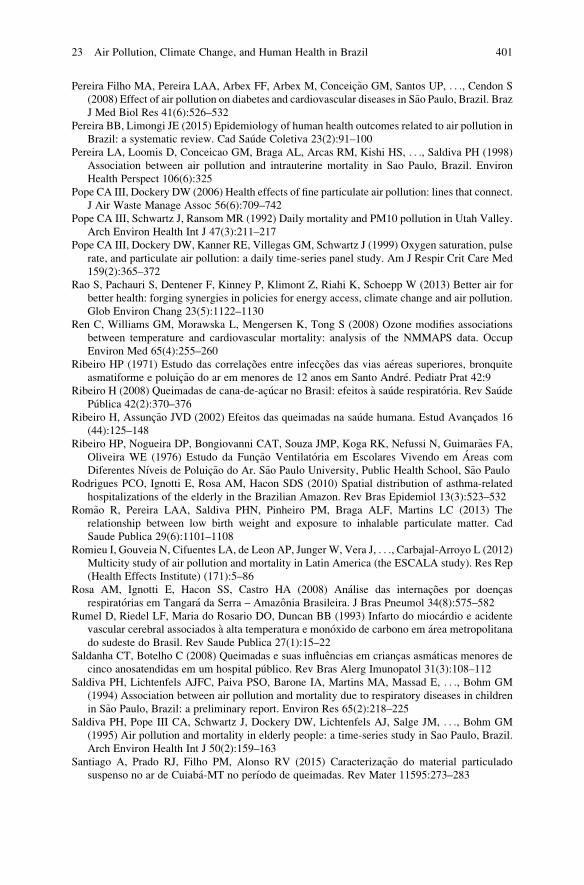
Pereira Filho MA, Pereira LAA, Arbex FF, Arbex M, Conceic~ao GM, Santos UP, . . ., Cendon S
(2008) Effect of air pollution on diabetes and cardiovascular diseases in S~ao Paulo, Brazil. BrazJ Med Biol Res 41(6):526–532
Pereira BB, Limongi JE (2015) Epidemiology of human health outcomes related to air pollution in
Brazil: a systematic review. Cad Saude Coletiva 23(2):91–100
Pereira LA, Loomis D, Conceicao GM, Braga AL, Arcas RM, Kishi HS, . . ., Saldiva PH (1998)
Association between air pollution and intrauterine mortality in Sao Paulo, Brazil. Environ
Health Perspect 106(6):325
Pope CA III, Dockery DW (2006) Health effects of fine particulate air pollution: lines that connect.
J Air Waste Manage Assoc 56(6):709–742
Pope CA III, Schwartz J, Ransom MR (1992) Daily mortality and PM10 pollution in Utah Valley.
Arch Environ Health Int J 47(3):211–217
Pope CA III, Dockery DW, Kanner RE, Villegas GM, Schwartz J (1999) Oxygen saturation, pulse
rate, and particulate air pollution: a daily time-series panel study. Am J Respir Crit Care Med
159(2):365–372
Rao S, Pachauri S, Dentener F, Kinney P, Klimont Z, Riahi K, Schoepp W (2013) Better air for
better health: forging synergies in policies for energy access, climate change and air pollution.
Glob Environ Chang 23(5):1122–1130
Ren C, Williams GM, Morawska L, Mengersen K, Tong S (2008) Ozone modifies associations
between temperature and cardiovascular mortality: analysis of the NMMAPS data. Occup
Environ Med 65(4):255–260
Ribeiro HP (1971) Estudo das correlacões entre infeccões das vias aereas superiores, bronquiteasmatiforme e poluic~ao do ar em menores de 12 anos em Santo Andre. Pediatr Prat 42:9
Ribeiro H (2008) Queimadas de cana-de-acucar no Brasil: efeitos �a saude respiratoria. Rev SaudePublica 42(2):370–376
Ribeiro H, Assunc~ao JVD (2002) Efeitos das queimadas na saude humana. Estud Avancados 16
(44):125–148
Ribeiro HP, Nogueira DP, Bongiovanni CAT, Souza JMP, Koga RK, Nefussi N, Guimar~aes FA,Oliveira WE (1976) Estudo da Func~ao Ventilatoria em Escolares Vivendo em Areas com
Diferentes Nıveis de Poluic~ao do Ar. S~ao Paulo University, Public Health School, S~ao Paulo
Rodrigues PCO, Ignotti E, Rosa AM, Hacon SDS (2010) Spatial distribution of asthma-related
hospitalizations of the elderly in the Brazilian Amazon. Rev Bras Epidemiol 13(3):523–532
Rom~ao R, Pereira LAA, Saldiva PHN, Pinheiro PM, Braga ALF, Martins LC (2013) The
relationship between low birth weight and exposure to inhalable particulate matter. Cad
Saude Publica 29(6):1101–1108
Romieu I, Gouveia N, Cifuentes LA, de Leon AP, Junger W, Vera J, . . ., Carbajal-Arroyo L (2012)
Multicity study of air pollution and mortality in Latin America (the ESCALA study). Res Rep
(Health Effects Institute) (171):5–86
Rosa AM, Ignotti E, Hacon SS, Castro HA (2008) Analise das internacões por doencas
respiratorias em Tangara da Serra – Amazonia Brasileira. J Bras Pneumol 34(8):575–582
Rumel D, Riedel LF, Maria do Rosario DO, Duncan BB (1993) Infarto do miocardio e acidente
vascular cerebral associados �a alta temperatura e monoxido de carbono em area metropolitana
do sudeste do Brasil. Rev Saude Publica 27(1):15–22
Saldanha CT, Botelho C (2008) Queimadas e suas influencias em criancas asmaticas menores de
cinco anosatendidas em um hospital publico. Rev Bras Alerg Imunopatol 31(3):108–112
Saldiva PH, Lichtenfels AJFC, Paiva PSO, Barone IA, Martins MA, Massad E, . . ., Bohm GM
(1994) Association between air pollution and mortality due to respiratory diseases in children
in S~ao Paulo, Brazil: a preliminary report. Environ Res 65(2):218–225
Saldiva PH, Pope III CA, Schwartz J, Dockery DW, Lichtenfels AJ, Salge JM, . . ., Bohm GM
(1995) Air pollution and mortality in elderly people: a time-series study in Sao Paulo, Brazil.
Arch Environ Health Int J 50(2):159–163
Santiago A, Prado RJ, Filho PM, Alonso RV (2015) Caracterizac~ao do material particulado
suspenso no ar de Cuiaba-MT no perıodo de queimadas. Rev Mater 11595:273–283
23 Air Pollution, Climate Change, and Human Health in Brazil 401
Santos UP, Terra-Filho M, Lin CA, Pereira LAA, Vieira TCB, Saldiva PHN, Braga ALF (2008)
Cardiac arrhythmia emergency room visits and environmental air pollution in Sao Paulo,
Brazil. J Epidemiol Community Health 62(3):267–272
Santos VDP, Medeiros APPD, Lima TACD, Nascimento LFC (2016) Air pollutants associated
with insufficient birth weight. Rev Bras Epidemiol 19(1):89–99
Sharovsky R, Cesar LAM, Ramires JAF (2004) Temperature, air pollution, and mortality from
myocardial infarction in Sao Paulo, Brazil. Braz J Med Biol Res 37(11):1651–1657
Sillman S, Samson PJ (1995) Impact of temperature on oxidant photochemistry in urban, polluted
rural and remote environments. J Geophys Res Atmos 100(D6):11497–11508
Silva RG (2005) Disposic~ao a pagar para evitar danos �a saude oriundos das queimadas: uma
aplicac~ao do metodo de valorac~ao contingente no estado do Acre. Doctoral thesis. Vicosa
University, Postgraduate program in applied economics
Silva AMC (2010) Quantificac~ao dos efeitos na saude da exposic~ao �a queima de biomassa: uma
contribuic~ao ao entendimento dos efeitos da exposic~ao ao material particulado(PM2,5) em
grupos populacionais sensıveis na Amazonia Legal. Doctoral thesis, Oswaldo Cruz Foundation
Silva MFD (2013) Reatividade fotoquımica da atmosfera de Cubat~ao e a influencia de fontes
exogenas. Doctoral thesis, S~ao Paulo University, Public Health Faculty. 256 p
Silva AMCD, Mattos IE, Ignotti E, Hacon SDS (2013) Material particulado originario de
queimadas e doencas respiratorias. Rev Saude Publica 47(2):345–352
Souza LSN (2008). Analise de Impactos das Queimadas sobrea Saude Humana: Um estudo de
caso do Municıpio de Rio Branco, Acre. Master dissertation. National School of Public Healt
(ENSP), Rio de Janeiro
State Foundation for Environmental Protection Henrique Luiz Roessler (“FEPAM”). Secretariat of
state of the environment of the state of Rio Grande do Sul. Qualidade ambiental: poluentes e
seus efeitos. Available at: http://www.fepam.rs.gov.br/qualidade/poluentes.asp#
St€olzel M, Breitner S, Cyrys J, Pitz M, W€olke G, Kreyling W, . . ., Peters A (2007) Daily mortality
and particulate matter in different size classes in Erfurt, Germany. J Expo Sci Environ
Epidemiol 17(5):458–467
Tsigaridis K, Kanakidou M (2007) Secondary organic aerosol importance in the future atmo-
sphere. Atmos Environ 41(22):4682–4692
United Nations Environment Programme, World Meteorological Organization (2011) Integrated
assessment of black carbon and tropospheric ozone: summary for decision makers. Nairobi,
United Nations Environment Programme. Availabe at: http://www.unep.org/dewa/Portals/67/
pdf/BlackCarbon_SDM.pdf. Accessed 26 Mar 2013
Vidotto JP, Pereira LAA, Braga ALF, Silva CA, Sallum AM, Campos LM, . . ., Farhat SCL (2012)
Atmospheric pollution: influence on hospital admissions in paediatric rheumatic diseases.
Lupus 21(5):526–533
Wang Y, Jacob DJ (1998) Anthropogenic forcing on tropospheric ozone and OH since
preindustrial times. J Geophys Res 103(D23):31123
West JJ, Szopa S, Hauglustaine DA (2007) Human mortality effects of future concentrations of
tropospheric ozone. Compt Rendus Geosci 339(11):775–783
White MC, Etzel RA, Wilcox WD, Lloyd C (1994) Exacerbations of childhood asthma and ozone
pollution in Atlanta. Environ Res 65(1):56–68
World Health Organization (2006) Air quality guidelines: global update 2005: particulate matter,
ozone, nitrogen dioxide, and sulfur dioxide. World Health Organization. Available at: http://
www.euro.who.int/__data/assets/pdf_file/0005/78638/E90038.pdf?ua¼1
World Health Organization (2016) Global ambient air pollution database (update 2016). Available
at: http://maps.who.int/airpollution/. Accessed on 4 Nov 2016
Yanagi Y, Assunc~ao JVD, Barrozo LV (2012) The impact of atmospheric particulate matter on
cancer incidence and mortality in the city of Sao Paulo. Cad Saude, Brazil
402 J.A. Menezes et al.
Julia Alves Menezes is a biologist, holds a master’s degree in health sciences and studies the
epidemiological aspects of infectious diseases and public health, especially leishmaniasis.
Recently, she has been dedicated to studies regarding human and socio-environmental vulnera-
bility to climate and the impacts of global environmental changes on health and human systems at
the Rene Rachou Institute, Oswaldo Cruz Foundation, Brazil.
Carina Margonari is a biologist with a master’s in molecular and cell biology and a PhD in
parasitic biology. As a researcher at Rene Rachou Institute, Oswaldo Cruz Foundation, Brazil, her
work is focused on parasitology and molecular biology, with emphasis in entomology and
epidemiology, mainly in subjects related to tropical diseases, such as leishmaniasis transmitted
by female phlebotomine sandflies, and public health, and collaborates with studies related to
human vulnerability to climate change.
Rhavena Barbosa Santos has a degree in nursing and a master’s in public health and studies
vulnerability to climate focusing on the human and social aspects of environmental change.
Recently, Rhavena has been dedicated to the study of a metric of vulnerability related to
hydrometeorological disasters at the Rene Rachou Institute, Oswaldo Cruz Foundation, Brazil.
Ulisses Confalonieri is a physician, holds a master’s in parasitology and a PhD in science and is
senior researcher at the Rene Rachou Institute, Oswaldo Cruz Foundation, Brazil. Works with
epidemiology; the ecology of infectious processes, especially emerging diseases; and the impacts
of global environmental changes on health, particularly the dynamics of infectious diseases.
Coordinated working groups at the Intergovernmental Panel on Climate Change (IPCC) and the
Millennium Ecosystem Assessment.
23 Air Pollution, Climate Change, and Human Health in Brazil 403
Chapter 24
Climate Change, Air Pollution, and InfectiousDiseases: A New Epidemiological Scenarioin Argentina
Daniel Oscar Lipp
Abstract Over the past 50 years, human activity, in particular the consumption of
fossil fuels, has released quantities of CO2 and other greenhouse gases sufficient to
retain more heat in the lower layers of the atmosphere and to alter global climate.
Sea level is increasing, glaciers are melting, and rainfall regimes are changing.
Extreme weather events are becoming more intense and frequent. On the other
hand, it is estimated that by 2030, climate change will increase the risk of some
health parameters to double. Health effects related to climate change can be either
direct, as heat waves, or indirect, through changes in vectors, water quality, and
food, which favors the onset of diseases. Our intention is to provide the reader with
what is being done in Argentina about these diseases provoked and increased by
climate change. Of course, when answering questions like these, we should limit
ourselves to making a report of each particular noxa, despite the obvious impor-
tance of it, and to stop in those with the greatest impact in the country.
Keywords Air pollution-climate change in Argentina • Infectious diseases •
Emerging diseases and climate change • Global warming • Climate variability •
Climate change and health
Climate Change and Infectious Diseases
In Argentina, there are very limited studies that anticipate epidemiological conse-
quences due to climate change. From the outset, since this phenomenon had an
impact in Argentina, it did carry out how many speculations occurred to health
specialists without a firm basis in their determinations. It is not my way to proceed
with such a current issue, such as climate change and its potential health impacts.
Many people expect reliable reports of this very specific, changing, and
D.O. Lipp (*)
Catholic University Argentina, Buenos Aires, Argentina
Buenos Aires’ University, Buenos Aires, Argentinae-mail: [email protected]
© Springer International Publishing AG 2018
R. Akhtar, C. Palagiano (eds.), Climate Change and Air Pollution,Springer Climate, DOI 10.1007/978-3-319-61346-8_24
405
controversial field. Therefore I will be careful in this study and will limit myself to
the best medical information available in Argentina.
Until now it has not been possible to prove conclusively and emphatically that
climate change experienced in recent decades has increased the overall risk of
transmission of insect-borne diseases, but there is enough scientific evidence to
suspect it. In addition to climate change, there are many factors that can influence
the epidemiology of vector diseases, such as atmospheric composition, urbaniza-
tion, economic and social development, international trade, human migration,
industrial development, land use, irrigation, and agricultural development. The
recent resurgence of many of these diseases in the world could be attributed more
to political, economic, and human activity changes rather than climate change.
Therefore, climate alone is not a sufficient cause for the establishment of endemic
foci in Argentina, although a requirement. The latter must be clear.
The direct effects of climate change on health include all those diseases caused
by direct exposure to meteorological variables. Among these are diseases caused by
extremes of heat and cold, such as heat waves and cold waves that raise rates of
death, especially among older people with chronic pathologies linked to the heart
and lungs. The elderly and the sick are therefore at greater risk of contracting them.
The well-known phenomenon of the urban heat island can increase the negative
effects of these impacts. Another effect on health is given by air pollution. Climate
change can affect the ozone concentration at ground level by increasing the number
of respiratory diseases caused by this gas. Another direct effect on health is given
by the accumulation of powder in suspension. This dust appears as a contamination
of the particulate material of different granulometry that can be transported by the
winds through great distances causing serious respiratory-like ailments. Research in
Argentina on the dangers of these diseases is very limited. There is a clear need to
expand knowledge about this issue in Argentina because it will allow us to act
quickly, safely, and firmly in the face of the forthcoming climate change. The
indirect effects of climate change on health are probably the most important.
Changes in climatic conditions affect health indirectly, particularly through
changes in the biological and ecological processes that influence the transmission
of some diseases, especially infectious diseases. They have a strong character of
being influenced by global warming (Flannery 2006-38).In general terms, infectious diseases can be classified into two broad categories
according to their mode of transmission. On the one hand, if they are transmitted
directly from person to person through direct contact or if they are indirectly
propagated through a vector or host such as mosquitoes and ticks or a
non-biological physical element such as water and the ground. In general, diseases
that are transmitted by direct contact, or from person to person, are much less
influenced by climatic factors as the disease agent spends very little time outside the
human host (measles, tuberculosis, and transmitted infections such as HIV, herpes,
and syphilis). In contrast, cycles of transmission requiring, for example, a
nonhuman vector or host are more susceptible to external environmental influences
than those diseases which include only the pathogen and the human (Perczyk et al.
2004-7).
406 D.O. Lipp
The Diseases of Major Impact
A recent report by the Intergovernmental Panel on Climate Change (IPCC) argues
that Argentina will face during this century the dramatic increase in some infectious
diseases such as Chagas, dengue, and malaria, three pathologies that currently
prevail the tropical and subtropical regions. They would find a more favorable
climate for their expansion and would be favored by the possible new conditions of
humidity and heat. Climatic conditions have a strong influence on insect-borne
diseases or other intermediaries. Climate changes are likely to prolong transmission
stations of important vector-borne diseases and alter their geographical distribution.
In this sense, Argentina is expected to expand considerably in areas affected by
dengue fever and Chagas’ disease.Dengue is a growing problem for global public health due to several factors such
as climate change, increasing world population in urban areas in an accelerated and
unplanned manner, inadequate collection of waste, and accumulation of containers
that favor breeding of mosquitoes. These factors are compounded by the risk of
travel and migrations to endemic areas and insufficient control of vectors, all
elements that have an impact on the spread of this disease. The disease is caused
by a virus that is transmitted through the bite of infected mosquitoes, mainly of the
species “Aedes aegypti,” which makes the control of the vector a fundamental tool
for the prevention of the disease. It does not spread from person to person, through
objects, or orally, respiratory, or sexual. “Aedes aegypti” is a small, house-eating
insect.
The bite of this mosquito also transmits the virus Zika. Climate change also
favors the proliferation of Zika virus and other mosquito-borne viruses. The
increase in temperatures has contributed to expand the habitat of these vectors by
increasing the incidence of the disease in areas that until then were free of the
flagellum. The heat and humidity, associated with climate change, create the ideal
conditions for the procreation of mosquitoes. Regions that were earlier drier and
colder now experience temperature rise higher and more rainfall, which causes
mosquitoes to expand their breeding grounds, which increases the number of
populations at risk. At least 22 Latin American countries have reported cases of
Zika virus, among which Brazil is the most affected. It is believed that the Zika
virus could have come to Brazil through Asian tourists. In October 2015, Brazil’shealth authorities confirmed an increase in the prevalence of microcephaly in the
northeast of the country, which coincided with an outbreak of the Zika virus. Later,
there were described other congenital anomalies, placental insufficiency, late fetal
growth, and fetal death associated with the infection of Zika virus during the
pregnancy. The latter event I lead that the 1� of February, 2016, the World Health
Organization (WHO) was declaring an emergency of public health of international
importance. In Argentina, the first outbreak was identified this year by virus of the
Zika of vectorial transmission in Tucuman province. In the same one, 25 autoch-
thonous cases were confirmed, three of which corresponded to pregnant women. In
24 Climate Change, Air Pollution, and Infectious Diseases: A New. . . 407
the course of 2016, other 266 cases were notified studies for Zika in the frame of the
integrated vigilance of arbovirus.
Malaria is another evil that threatens to spread due to climate change. Of
parasitic origin, this is produced by protozoa of the genus Plasmodium and trans-
mitted to man through the bite of hematophagous Diptera of the genus Anopheles.The parasite that causes the disease, which can be fatal if not treated in a timely
manner, reproduces in the liver of the person who contracts and then infects the red
blood cells. This disease is preventable and curable by treatment with medication.
In Argentina, the main risk zone is the north of the province of Salta, especially the
rural area of the departments San Martın and Oran. In the last 3 years, no cases of
the disease have been registered, so the country is in the process of declaring itself
free of indigenous cases of malaria. In 2010, the last reported autochthonous cases
were recorded in the border area. In 2011, 2012, and 2013, respectively, 18, 4, and
2 cases were checked, all imported. Through the years, with qualified technical staff
and distributed in different operational bases and through a unified methodology,
consisting of the development of epidemiological surveillance actions, search for
febrile patients, timely diagnosis, supervised treatment, and spraying of patient
housing and neighboring areas, a significant reduction of the vector transmission
surface was achieved, which currently reaches an area of 28,000 km2 (Ministry of
Health, Presidency of the Nation 2016a, b, c, d).
Chagas Disease in Argentina
Chagas disease, on the other hand, is one of the most widespread diseases in Latin
America. It is a life-threatening disease caused by the protozoan parasite
Trypanosoma cruzi. The most frequent form of contagion is by the bite of the
vinchuca. The latest case estimates indicate that in Argentina, there would be
7,300,000 people exposed, 1,505,235 infected, of whom 376,309 would present
Chagasic heart diseases. This constitutes the disease as one of the main public
health problems. There are people with Chagas in the whole country because in
addition to the vectorial transmission, human migrations and the existence of other
transmission routes spread the disease throughout the whole territory. Chagas
disease is a current topic of study in Argentina as it constitutes a real threat due
to climate change. Its prevention is one of the most significant points of health
authorities because it prevents the occurrence of evil and spread throughout the
region. Extreme personal and environmental hygiene measures are carried out, and
disinfection campaigns are carried out in the most affected areas. This disease is
notifiable. Regarding their vectorial transmission, the Argentine provinces are
classified as high, medium, and low risk of transmission of the parasite. There are
also some so-called safe areas due to the magnitude of the number of existing
vectors. In what areas of the country does the disease exist? The Chagas is found in
those areas of our territory where there are vinchucas, although migratory move-
ments have generated an increase of infection in places where the insect is not
408 D.O. Lipp
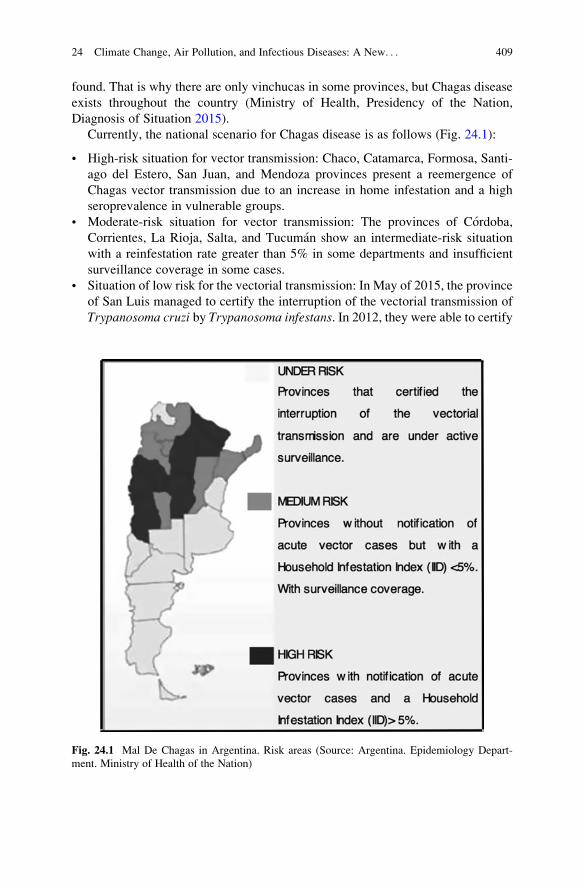
found. That is why there are only vinchucas in some provinces, but Chagas disease
exists throughout the country (Ministry of Health, Presidency of the Nation,
Diagnosis of Situation 2015).
Currently, the national scenario for Chagas disease is as follows (Fig. 24.1):
• High-risk situation for vector transmission: Chaco, Catamarca, Formosa, Santi-
ago del Estero, San Juan, and Mendoza provinces present a reemergence of
Chagas vector transmission due to an increase in home infestation and a high
seroprevalence in vulnerable groups.
• Moderate-risk situation for vector transmission: The provinces of Cordoba,
Corrientes, La Rioja, Salta, and Tucuman show an intermediate-risk situation
with a reinfestation rate greater than 5% in some departments and insufficient
surveillance coverage in some cases.
• Situation of low risk for the vectorial transmission: In May of 2015, the province
of San Luis managed to certify the interruption of the vectorial transmission of
Trypanosoma cruzi by Trypanosoma infestans. In 2012, they were able to certify
Fig. 24.1 Mal De Chagas in Argentina. Risk areas (Source: Argentina. Epidemiology Depart-
ment. Ministry of Health of the Nation)
24 Climate Change, Air Pollution, and Infectious Diseases: A New. . . 409
the provinces of Misiones and Santa Fe, along with six departments in the south
of Santiago del Estero (Aguirre, Miter, Rivadavia, Belgrano, Quebracho, and
Ojo de Agua). The provinces of Entre Rıos, Jujuy, La Pampa, Neuquen, and Rıo
Negro managed to recertify the interruption of vector transmission (Ministry of
Health, Presidency of the Nation, Chagas in the country and Latin
America 2016).
Situation of the Dengue in Argentina
For the scientific community of our country, the progressive increase of temper-
ature is a fact that does not admit discrepancies, so the health authorities have
proposed prevention and treatment programs to be carried out in areas affected by
dengue, pathology which today affects more than 38,000 people in Argentina. In
Argentina, the behavior of dengue has so far been epidemic. Outbreaks began
with the introduction of the virus by travelers to countries with viral circulation.
During the winter months, cases were not recorded between 1 year and the next,
reemerging the disease in some areas during the months of high temperatures
(Ministry of Health, Presidency of the Nation, Information for Health
Teams 2016).
This disease is currently the subject of special attention in Argentina due to
several factors: climate change, in particular, increased travel and migration,
inadequate collection of waste, and inadequate provision of drinking water for
storage in containers usually discovered. The occurrence of dengue cases in Argen-
tina is restricted to the months of highest temperature (November to May) and is
directly linked to the occurrence of outbreaks in bordering countries. During 2009,
the first major dengue outbreak occurred in Argentina, with autochthonous cases of
the disease in 11 provincial jurisdictions. In contrast, in the current season, out-
breaks of dengue prevailed at the usual period of its beginning, affecting a greater
number of localities and provinces. Figure 24.2 shows the registered cases of
dengue in the country during 2009 and 2016. Among the causes that motivated
these outbreaks are highlighted (Stamboulian Health Services 2016):
• An increase in the flow of travelers, mainly due to the summer holiday season,
which were directed to and from areas with viral circulation in the country and in
bordering countries (especially Brazil, Paraguay, and Bolivia), favoring a
greater circulation of the virus in our territory
• The increase in temperature and precipitation due to the El Ni~no phenomenon
• The floods mainly produced in the provinces of the Litoral as a consequence of
this phenomenon
410 D.O. Lipp
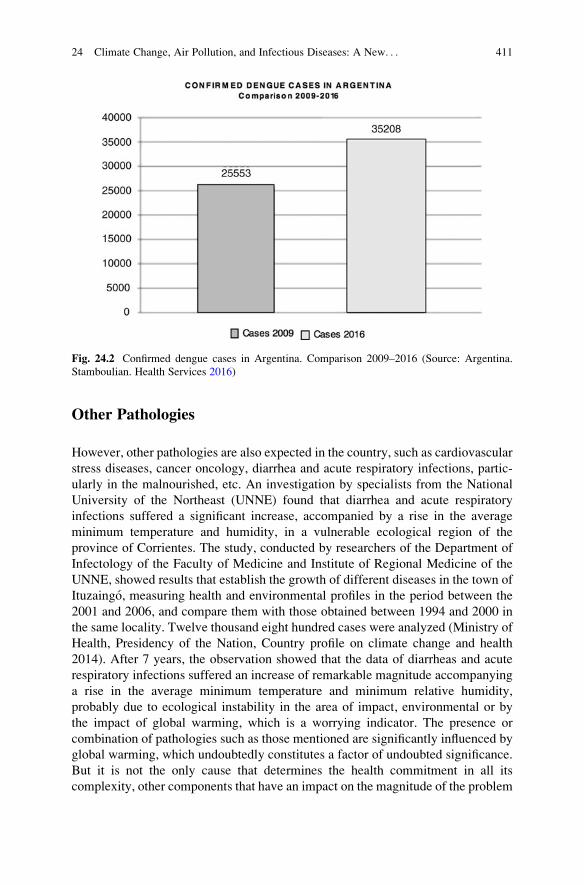
Other Pathologies
However, other pathologies are also expected in the country, such as cardiovascular
stress diseases, cancer oncology, diarrhea and acute respiratory infections, partic-
ularly in the malnourished, etc. An investigation by specialists from the National
University of the Northeast (UNNE) found that diarrhea and acute respiratory
infections suffered a significant increase, accompanied by a rise in the average
minimum temperature and humidity, in a vulnerable ecological region of the
province of Corrientes. The study, conducted by researchers of the Department of
Infectology of the Faculty of Medicine and Institute of Regional Medicine of the
UNNE, showed results that establish the growth of different diseases in the town of
Ituzaingo, measuring health and environmental profiles in the period between the
2001 and 2006, and compare them with those obtained between 1994 and 2000 in
the same locality. Twelve thousand eight hundred cases were analyzed (Ministry of
Health, Presidency of the Nation, Country profile on climate change and health
2014). After 7 years, the observation showed that the data of diarrheas and acute
respiratory infections suffered an increase of remarkable magnitude accompanying
a rise in the average minimum temperature and minimum relative humidity,
probably due to ecological instability in the area of impact, environmental or by
the impact of global warming, which is a worrying indicator. The presence or
combination of pathologies such as those mentioned are significantly influenced by
global warming, which undoubtedly constitutes a factor of undoubted significance.
But it is not the only cause that determines the health commitment in all its
complexity, other components that have an impact on the magnitude of the problem
Fig. 24.2 Confirmed dengue cases in Argentina. Comparison 2009–2016 (Source: Argentina.
Stamboulian. Health Services 2016)
24 Climate Change, Air Pollution, and Infectious Diseases: A New. . . 411
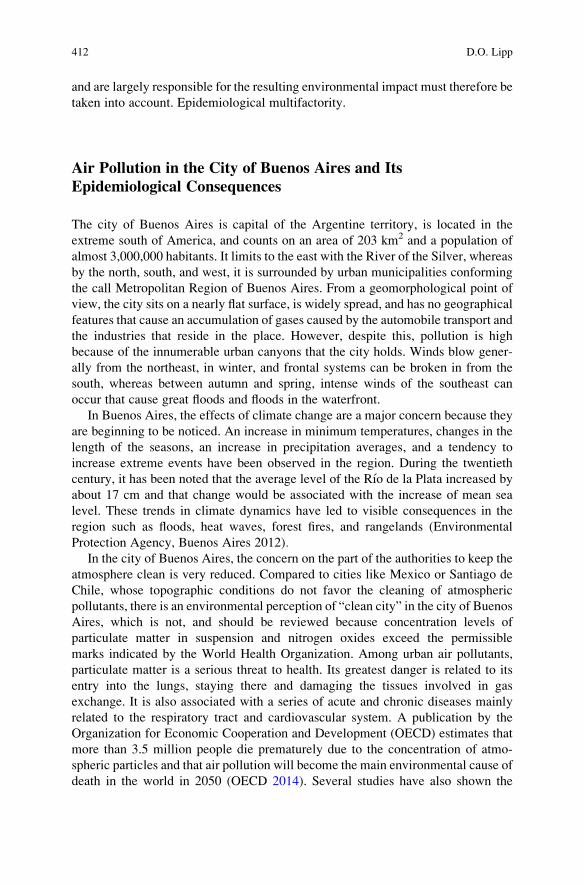
and are largely responsible for the resulting environmental impact must therefore be
taken into account. Epidemiological multifactority.
Air Pollution in the City of Buenos Aires and ItsEpidemiological Consequences
The city of Buenos Aires is capital of the Argentine territory, is located in the
extreme south of America, and counts on an area of 203 km2 and a population of
almost 3,000,000 habitants. It limits to the east with the River of the Silver, whereas
by the north, south, and west, it is surrounded by urban municipalities conforming
the call Metropolitan Region of Buenos Aires. From a geomorphological point of
view, the city sits on a nearly flat surface, is widely spread, and has no geographical
features that cause an accumulation of gases caused by the automobile transport and
the industries that reside in the place. However, despite this, pollution is high
because of the innumerable urban canyons that the city holds. Winds blow gener-
ally from the northeast, in winter, and frontal systems can be broken in from the
south, whereas between autumn and spring, intense winds of the southeast can
occur that cause great floods and floods in the waterfront.
In Buenos Aires, the effects of climate change are a major concern because they
are beginning to be noticed. An increase in minimum temperatures, changes in the
length of the seasons, an increase in precipitation averages, and a tendency to
increase extreme events have been observed in the region. During the twentieth
century, it has been noted that the average level of the Rıo de la Plata increased by
about 17 cm and that change would be associated with the increase of mean sea
level. These trends in climate dynamics have led to visible consequences in the
region such as floods, heat waves, forest fires, and rangelands (Environmental
Protection Agency, Buenos Aires 2012).In the city of Buenos Aires, the concern on the part of the authorities to keep the
atmosphere clean is very reduced. Compared to cities like Mexico or Santiago de
Chile, whose topographic conditions do not favor the cleaning of atmospheric
pollutants, there is an environmental perception of “clean city” in the city of Buenos
Aires, which is not, and should be reviewed because concentration levels of
particulate matter in suspension and nitrogen oxides exceed the permissible
marks indicated by the World Health Organization. Among urban air pollutants,
particulate matter is a serious threat to health. Its greatest danger is related to its
entry into the lungs, staying there and damaging the tissues involved in gas
exchange. It is also associated with a series of acute and chronic diseases mainly
related to the respiratory tract and cardiovascular system. A publication by the
Organization for Economic Cooperation and Development (OECD) estimates that
more than 3.5 million people die prematurely due to the concentration of atmo-
spheric particles and that air pollution will become the main environmental cause of
death in the world in 2050 (OECD 2014). Several studies have also shown the
412 D.O. Lipp
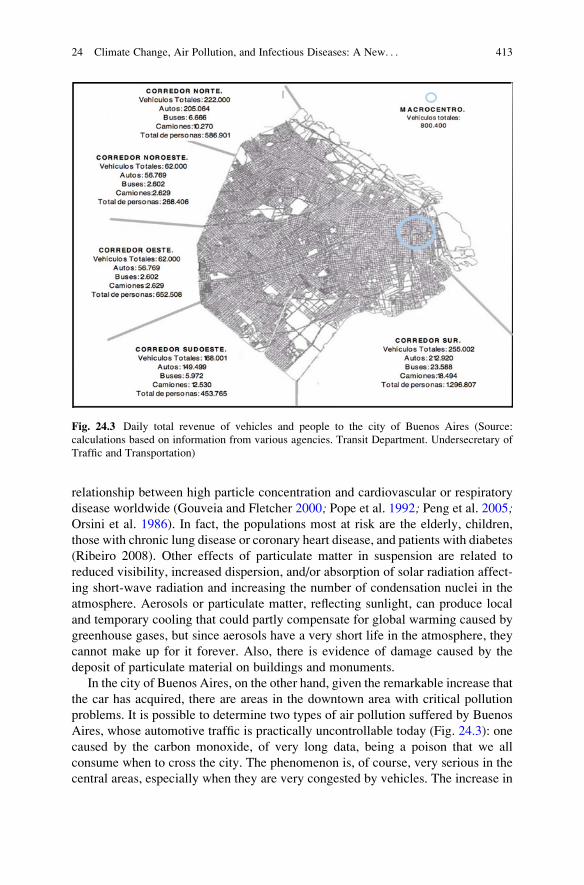
relationship between high particle concentration and cardiovascular or respiratory
disease worldwide (Gouveia and Fletcher 2000; Pope et al. 1992; Peng et al. 2005;Orsini et al. 1986). In fact, the populations most at risk are the elderly, children,
those with chronic lung disease or coronary heart disease, and patients with diabetes
(Ribeiro 2008). Other effects of particulate matter in suspension are related to
reduced visibility, increased dispersion, and/or absorption of solar radiation affect-
ing short-wave radiation and increasing the number of condensation nuclei in the
atmosphere. Aerosols or particulate matter, reflecting sunlight, can produce local
and temporary cooling that could partly compensate for global warming caused by
greenhouse gases, but since aerosols have a very short life in the atmosphere, they
cannot make up for it forever. Also, there is evidence of damage caused by the
deposit of particulate material on buildings and monuments.
In the city of Buenos Aires, on the other hand, given the remarkable increase that
the car has acquired, there are areas in the downtown area with critical pollution
problems. It is possible to determine two types of air pollution suffered by Buenos
Aires, whose automotive traffic is practically uncontrollable today (Fig. 24.3): one
caused by the carbon monoxide, of very long data, being a poison that we all
consume when to cross the city. The phenomenon is, of course, very serious in the
central areas, especially when they are very congested by vehicles. The increase in
Fig. 24.3 Daily total revenue of vehicles and people to the city of Buenos Aires (Source:
calculations based on information from various agencies. Transit Department. Undersecretary of
Traffic and Transportation)
24 Climate Change, Air Pollution, and Infectious Diseases: A New. . . 413
vehicular traffic in the center of large cities has increased the traffic to unexpected
levels. However, the pollutant activity of man does not end with this primary
pollutant, insidiously toxic and even more deadly. There is a second type of
pollution caused by the car: photochemical pollution. When the sun illuminates in
the morning, the gases released by vehicles, especially NOx and hydrocarbons,
react photochemically and generate, among other things, ozone (Venegas et al.
2003). This substance, in almost infinitesimal concentrations, is very irritating to
our mucous membranes. In addition, its effects on the respiratory system, and
particularly on the pulmonary parenchyma, have also been recognized and
documented. Ozone is one of the pollutants that contribute most to the degradation
of air quality in large urban centers. Exposure to high concentrations is associated
with increased hospital admissions for pneumonia, chronic obstructive pulmonary
disease, asthma, bronchitis, allergic rhinitis and other respiratory diseases, as well
as premature mortality (Aris et al. 1993; Bell and McGregor 2008; Frampton et al.
1999; Gryparis et al. 2004; Ito et al. 2005). But the increased risk of ozone-related
mortality is associated with respiratory causes, especially in low and high socio-
economic status groups. Although the impacts on the respiratory system are more
common, Nardocci et al. (2013) observed, in addition to the association between O3
and respiratory diseases in children under 5 years of age, an association between
this contaminant and cardiovascular diseases in adults older than 39 years. Due to
the toxic nature of this gas and the potential risk it poses to human health, its
permitted levels have already been carefully established by institutions such as the
United States Environmental Protection Agency (EPA).
However, a phenomenon that is likely to be a major concern for large cities if
they do not fit into a preventive action on air pollution is the so-called ozone
weekend effect whose sole and exclusive responsibility is attributed to the car.
The “ozone weekend effect” refers to the curious finding in certain metropolis of
high concentrations of ozone during the weekends compared to other days of the
week. This is very striking because the higher emissions of ozone-producing
compounds usually occur on weekdays rather than on weekends (Lipp et al. 2010).Research has been carried out in Buenos Aires for the damages caused by
atmospheric pollution. The SAEMC through a study showed a clear correlation
between the variation of air compounds measured in the city and mortality. Data on
the concentration of carbon monoxide and nitrogen oxides were used as these are
the compounds measured by the monitoring network of the Government of the city
of Buenos Aires.
SAEMC verified a 3.6% increase in daily deaths the following day to a rise in
1 ppm (part per million) of atmospheric CO. Analysis of nitrogen oxides (NOx) also
shows a significant correlation with daily mortality, particularly due to respiratory
causes. On the same day that the NOx level in air increases by 10 ppb (parts per
billion), mortality from this cause increases by 0.7% and cardiovascular mortality
by 0.4%. The results of this work express strongly that even in a city that generally
does not surpass the concentration levels of contaminants established in local
regulations, pollution causes an effect on health that in extreme cases leads to
death. There is no further study (Abrutzky et al. 2014). The epidemiological
414 D.O. Lipp
information in the city is extremely poor. On the other hand, the data obtained from
studies carried out in cities of developed countries are not totally extrapolable to our
environment, since the susceptibility of children and adults to the effects of air
pollutants is potentially greater in the region due to poverty, malnutrition, immu-
nological deficiencies, and poor living conditions. In addition, many of the health
effects are not easy to isolate technically since they may be obeying also, or jointly,
to other causes.
Actions in the Field of Climate Change in the Country
Given the state of concern about climate change, many countries, including Argen-
tina, have emphasized reducing greenhouse gas emission levels while improving
local air pollution conditions. In this direction, the Ministry of Environment and
Sustainable Development of the Nation, today elevated to the rank of Ministry, has
been working in a systematic way in order to contribute to the development of
policies to avoid the increase of its emissions. Within the United Nations, the
United Nations Framework Convention on Climate Change (UNFCCC) was cre-
ated in 1992 to ensure that the concentration of greenhouse gases in the atmosphere
does not continue to increase, that is to say, to stabilize to a level that prevents
dangerous interferences with the climatic system. Our country signed and ratified
this international agreement in 1992 and 1993, respectively. However, for devel-
oping countries, there are no quantifiable targets for reducing their GHG emissions,
but there are particular commitments, including an inventory of emissions by
sources and removals by GHG sinks, an overview of the steps taken or to be
taken to implement the convention and any other information deemed relevant to
achieve the objective of the convention. Our country complied with this commit-
ment by submitting this first communication to the UNFCCC, according to the
methodology established by the IPCC in June 1997 (Secretariat of Environment and
Sustainable Development of the Nation 2012).
Since that date, our country has published several emission inventories, the last
of which was presented in 2000. In addition, through the Argentine Carbon Fund
program, promotion and technical assistance are offered to proponents of potential
GHG emission reduction projects, in order to assess whether they comply with the
requirements of the Clean Development Mechanism. At present, the Argentine
Carbon Fund has a portfolio of more than 340 projects in different degrees of
maturity and of different sectors, among which the most numerous correspond to
the category of energy, waste management, and forestry. On the other hand, a
carbon footprint calculator has been developed at the municipal level that allows
the identification of the emission sources that are under the administration of a
municipal government, such as offices and municipal buildings, hospitals, schools,
bus terminals, vehicle fleets, among others, and determines their temporal evolution
as a basis for the development of mitigation strategies. Currently this tool is under
review and adjustment.
24 Climate Change, Air Pollution, and Infectious Diseases: A New. . . 415
Conclusion
Argentine experts on climate change say that global warming will affect the country
if the concentration of carbon dioxide is almost double the current. In this sense,
however, the country has advanced in the development of environmental strategies
with a particular imprint in which interinstitutional cooperation between national,
provincial, and municipal levels is combined, as well as intersectoral articulation,
integrating actors, and organizations of society civil. On the other hand, the
establishment of institutional and legal frameworks such as the enactment of the
Law of Forests and the Law of Glaciers, the ratification of international conven-
tions, and the nationalization of strategic natural resources. According to experts,
since 1995, a number of technologies have been developed which have made it
possible to moderate this phenomenon in particular, such as the construction of low
emission engines and turbines, the techniques used by some metallurgical industries
and chemical products to reduce the emission of gases and, mainly in some areas of
the country, the substitution of coal, oil, and its derivatives by other nonpolluting
energy sources such as wind, solar, and nuclear energy. With regard to urban
transport, which we have been discussing here for being responsible for the
enormous quantities of gases that are sent to the atmosphere, there have also been
notable and valuable advances in the field of climate change in the last decade. In
the above line, there is an incipient tendency of the Argentine automotive industry
to offer less polluting public and private transport units, based on both the technical
improvements of its engines and the type of fuel used. However, these technical
changes would not have immediate effects on mitigating the problem, due to the
slow replacement of public and private transport fleets. Currently, the Congress of
the Argentine Nation is debating how to progress toward the fulfillment of the goals
established to generate energy from renewable sources. The development of renew-
able energies requires the absolute attention of the state, since they can contribute
not only to the global climatic situation but also bring economic benefits for
Argentina that allow to recover the energy self-sufficiency. Argentina depends on
87% of fossil fuels to generate its energy. In 2013, only 1.4% of electricity came
from renewable sources, despite having a law that establishes that this contribution
should reach 8% in 2016. The new findings of the IPCC show that this is only
possible if investments and subsidies for the development of renewable energies
and energy efficiency are reoriented.
References
Abrutzky R, Dawidowski L, Murgida A, Natenzon CE (2014) Contaminacion del aire en la Ciudad
Autonoma de Buenos Aires: El riesgo de hoy o el cambio climatico futuro, una falsa opcion.
Ciencia Saude Coletiva 19(9):3763–3773. Associac~ao Brasileira de Pos-Graduac~ao em Saude
Coletiva Rio de Janeiro, Brasil
416 D.O. Lipp
Aris RM, Christian D, Hearne PQ, Kerr K, Finkbeiner WE, Balmes JR (1993) Ozone-induced
airway inflammation in human subjects as determined by airway lavage and biopsy. Am Rev
Respir Dis 148(5):1363–1372
BUENOS AIRES (ARGENTINA). Agencia de Proteccion Ambiental. Plan Estrategico
2008–2012. Gobierno de la ciudad de Buenos Aires
Flannery TF (2006) la amenaza del cambio climatico: historia y futuro. Madrid, Ed. Santillana,
2006. 393p
Frampton MW, Pryor WA, Cueto R, Cox C, Morrow PE, Utell MJ (1999) Ozone exposure
increases aldehydes in epithelial lining fluid in human lung. Am J Respir Crit Care Med 159
(4):1134–1137
Gouveia N, Fletcher T (2000) Time series analysis of air pollution and mortality: effects by cause,
age and socioeconomic status. J Epidemiol Community Health 54(10):750–755
Gryparis A, Forsberg B, Katsouyanni K, Analitis A, Touloumi G, Schwartz J, ... Wichmann HE
(2004) Acute effects of ozone on mortality from the “air pollution and health: a European
approach” project. Am J Respir Crit Care Med 170(10):1080–1087
Hernandez Nava E (2014) Cambio Climatico, Salud Humana y Enfermedades emergentes.
Universidad de Cantabria, Facultad de Filosofıa y Letras, Cantabria. Curso 20–2014
Ito K, De Leon SF, Lippmann M (2005) Associations between ozone and daily mortality: analysis
and meta-analysis. Epidemiology 16(4):446–457
Lipp DO, Gassmann MI (2010) Modelling the weekend effect in Buenos Aires City. Turin, Italia:
Italia. Congreso. 31st NATO/SPS international technical meeting on air pollution modelling
and its application. NATO
Ministerio de Salud. Presidencia de la Nacion (2014) Perfil de paıs sobre cambio climatico y salud.
http://www.msal.gob.ar/. Argentina
Ministerio de Salud. Presidencia de la Nacion (2015) Diagnostico de Situacion. http://www.msal.
gob.ar/chagas/index.php/institucional/diagnostico Argentina
Ministerio de Salud. Presidencia de la Nacion (2016a) http://www.msal.gob.ar/chagas/. Argentina
Ministerio de Salud. Presidencia de la Nacion (2016b) http://www.msal.gob.ar/index.php/compo
nent/content/article/48/98-paludismo-o-malaria. Argentina
Ministerio de Salud. Presidencia de la Nacion (2016c) El Chagas en el paıs y America Latina.
http://www.msal.gob.ar/chagas/index.php/informacion-para-ciudadanos/el-chagas-en-el-pais-
y-america-latina Argentina
Ministerio de Salud. Presidencia de la Nacion (2016d) Informacion para Equipos de Salud. http://
www.msal.gov.ar/dengue/informacion-para-equipos/. Argentina
Nardocci AC, Freitas CU, Leon ACMP, Junger WL, Gouveia NC (2013) Poluic~ao do ar e doencasrespiratorias e cardiovasculares: estudo de series temporais em Cubat~ao, S~ao Paulo, Brasil. CadSaude Publica 29(9):1867–1876
Organization for Economic Co-operation and Development – OECD (2014) The cost of air
pollution: health impacts of road transport. OECD Publishing, Paris. DOI: http://dx.doi.org/
10.1787/9789264210448-en
Orsini CQ, Tabacniks MH, Artaxo P, Andrade MDF, Kerr AS (1986) Characteristics of fine and
coarse particles of natural and urban aerosols of Brazil. Atmos Environ (1967) 20
(11):2259–2269
Peng RD, Dominici F, Pastor-Barriuso R, Zeger SL, Samet JM (2005) Seasonal analyses of airpollution and mortality in 100 US cities. Am J Epidemiol 161(6):585–594
Perczyk D, Bromioli M, Carlino H, Gonzalez MP, Andelman M (2004) Para Entender el Cambio
Climatico. Ministerio de Salud y Ambiente de la Nacion, Buenos Aires. 2004
Pope CA III, Schwartz J, Ransom MR (1992) Daily mortality and PM10 pollution in Utah Valley.
Arch Environ Health: Int J 47(3):211–217
ArgentinaSecretaria de Ambiente y Desarrollo Sustentable (2009) El cambio climatico en Argen-
tina. SA y DS, Buenos Aires
Secretarıa de Ambiente y Desarrollo Sustentable de la Nacion (2012) Informe sobre el Estado del
Ambiente A~no 2012. Buenos Aires
24 Climate Change, Air Pollution, and Infectious Diseases: A New. . . 417

Stamboulian. Servicios de Salud (2016) http://www.stamboulian.com.ar/viajeros.aspx?
idContenido¼450. Argentina
Venegas LE, Mazzeo NA (2003) Calidad del aire en una zona de la Ciudad de Buenos
Aires (Argentina). III Congresso Interamericano de Qualidade do Ar, ULBRA, Canoas, RS,
Brasil. CD
Daniel Oscar Lipp is doctor in geography at the University of Salvador (Argentina) and has
earned a master’s in environmental sciences (natural resources) from the University of Buenos
Aires and worked on issues related to the environmental area, more specifically the study of air
pollution. He has worked as a researcher and teacher at the Catholic University of Salta (Argen-
tina) and is the author of scientific publications (with reference) of national and international
circulation in environmental issues. He is currently a member of the Argentine Society of
Geographical Studies (GAEA) and participates in its activities.
418 D.O. Lipp

Part IV
Conclusion
Chapter 25
Summary and Conclusion
Rais Akhtar and Cosimo Palagiano
Keywords Urban air quality • Hippocrates • Industrial revolution • Great Smog •
Ozone pollution
Concern about air pollution has been known for thousands of years. “Complaints
about its effects on human health and the built environment were first voiced by the
citizens of ancient Athens and Rome. Urban air quality, however, worsened during
the Industrial Revolution, as the widespread use of coal in factories in Britain,
Germany, the United States and other nations ushered in an ‘age of smoke’”(Mosley 2014). As urban areas developed, pollution sources, such as chimneys
and industrial processes, were concentrated, leading to visible and damaging
pollution dominated by smoke. The harmful effects of air pollution were recognized
by Hippocrates in his fifth-century treatise Air, Water and Places; Hippocrates
noted that people’s health could be affected by the air they breathe and that quality
of the air differed by area (cited in Adams 1891).
Air pollution disasters such as London’s sulphur-laden “Great Smog” in 1952
that killed an estimated 4000 people demonstrated conclusively the damage it
caused to human health and instigate parliament to enact the 1956 Clean Air Act
to reduce coal burning and begin serious air pollution reform in England.
In the United States, concern for the air quality in and around large cities was
increasing during the latter 1800s and resulted in local laws and regulations
followed ultimately by federal air pollution control regulations. A degree of par-
ticulate air pollution in Australia before colonization is likely to have been frequent,
due to the widespread indigenous practice of deliberately lighting fires to manage
their landscape, a process today called “fire-stick farming” (Gammage 2011, Jones
2012 cited in Butler and Whelan’s chapter in this book on Australia).
R. Akhtar (*)
International Institute of Health Management and Research (IIHMR), New Delhi, India
e-mail: [email protected]
C. Palagiano
Dipartimento Di Scienze Documentarie, Linguistico-Filologiche e Geografiche, Sapienza
University of Rome, Rome, Italy
e-mail: [email protected]
© Springer International Publishing AG 2018
R. Akhtar, C. Palagiano (eds.), Climate Change and Air Pollution,Springer Climate, DOI 10.1007/978-3-319-61346-8_25
421
Thus climate change represents a range of environmental hazards including air
pollution and will affect populations wherever the current burden of climate-sensitive
disease is high – such as the urban poor in low- and middle-income countries.
Understanding the current impact of weather, climate and air pollution variability on
the health of populations is the first step towards assessing future impacts.
About 54% of the world’s population lives in urban areas, a proportion that is
expected to increase to 66% by 2050. Projections show that urbanization combined
with the overall growth of the world’s population could add another 2.5 billion
people to urban populations by 2050, with close to 90% of the increase concentrated
in Asia and Africa, according to a new United Nations report launched today.
We are aware about the scientific explanations that climate change occurs
because excessive amount of greenhouse gases were emitted into the atmosphere
due to human activity. Human influence on the climate system is clear, and recent
anthropogenic emissions of greenhouse gases are the highest in history. The Earth’satmosphere has already warmed by 0.85 �C from 1880 to 2012. Recent climate
changes have had widespread impacts on human and natural systems (IPCC 2014).
Having said that, “Weather and climate play important roles in determining
patterns of air quality over multiple scales in time and space, owing to the fact that
emissions, transport, dilution, chemical transformation and eventual deposition of
air pollutants all can be influenced by meteorological variables such as temperature,
humidity, wind speed and direction and mixing height. There is growing recogni-
tion that development of optimal control strategies for key pollutants like ozone and
fine particles now requires assessment of potential future climate conditions and
their influence on the attainment of air quality objectives. In addition, other air
contaminants of relevance to human health, including smoke from wildfires and
airborne pollens and moulds, may be influenced by climate change” (Kinney 2008).
In the study by Kinney, the focus was on the ways in which human health-relevant
measures of air quality, including ozone, particulate matter and aeroallergens, may
be influenced by climate variability and change.
Focusing on climate change impacts on air pollution, particularly ozone pollu-
tion, IPCC has also clearly stressed that “pollen, smoke and ozone levels likely to
increase in warming world, affecting health of residents in major cities. Rising
temperatures will worsen air quality through a combination of more ozone in cities,
bigger wild fires and worse pollen outbreaks, according to a major UN climate
report. It is formed by the reaction with sunlight (photochemical reaction) of
pollutants such as nitrogen oxides (NO2)” (Wynn 2014). Frequent forest fires in
certain regions in Australia and in the state of California are examples of such
events. World Meteorological Organization (WMO) has now certified that 2016
was the warmest year.
In Italy and in many Mediterranean regions, ozone is particularly dangerous,
because of the solar radiation, which captures the oxide from the chemical com-
pounds such as the sulphur and nitrogen dioxide and binds them to oxygen free in
the air. So ozone rises producing many health problems to humans. This comes true
in the cities, where the car traffic is very congested.
Rome is the Italian city with the much congested traffic. But the car traffic
problems are severe in many cities both of developed and developing countries. We
422 R. Akhtar and C. Palagiano
can give as example Beijing and Bangkok, where the car traffic is very intense, with
many air pollution and health impacts.
With reference to human health implications, the air pollution is currently the
leading environmental cause of premature deaths. The findings of the World Health
Organization contend that air pollution is the world’s biggest environmental health
risk, killing seven million people in 2012 (in comparison to four million deaths due
to malaria and 3.1 million deaths of children under five due to malnutrition).
Deteriorating air quality will mostly affect the elderly, children, people with
chronic ill-health and expectant mothers, with growing population in urban areas
in the coming decades and the rise in vulnerable population.
The present book comprises studies on developed and developing countries. The
book is aimed to present a regional analysis pertaining to climate change, air
pollution and human health, focusing on climate change, air pollution and adapta-
tion strategies in geographically and socio-economically varied countries of the
world.
In the context of developed countries, for instance, Australia, there also needs to
be a much greater appreciation of the health and economic costs of air pollution and
climate change. It is enormously misleading to claim that coal-fired electricity is
“cheap”. Coal mining, coal combustion and coal export cause significant health
costs, in the past, present and future. Furthermore, the price of alternatives such as
wind and solar continues to fall. Reducing emissions from the burning of wood and
the combustion of vehicular fuel is more challenging, but much can also be
accomplished in these spheres too, including electric vehicles, public transport,
and, in the foreseeable future, domestic production and consumption of solar
energy, incorporating batteries.
In developing countries, for instance, Mexico, most of the policies have con-
centrated on vehicle emissions. This has proved not to be enough given the increase
in vehicles circulating in the city and the poor public transport options that have not
kept pace with demand for mobility. A reduction in urban local pollutants and
greenhouse gases that may reduce air pollution and mitigate climate change will
only come from a true change in the energy matrix. Such a change may only be
produced in the medium run by the use of economic incentives to deter the use of
highly polluting fuels and to embark into long-term investments that will need less
and cleaner energy sources.
In the Caribbean, the research indicates that the burden of air pollution on the
people will increase with climate change, unless stringent measures are taken at the
community, country/government and global levels. Particularly, given the
established human health effects of air pollutants such as ozone, environmental
surveillance of these pollutants and longitudinal studies of their impact on the
health of populations across the Caribbean are recommended. Finally, how climate
change is likely to influence the effects of air pollution on states and territories in
the region should be considered.
Wildland fire is an important component to ecological health in California
forests. Wildland fire smoke is a risk factor to human health. Exposure to smoke
from fire cannot be eliminated, but managed fire in a fire-prone ecosystem for forest
25 Summary and Conclusion 423
health and resiliency allows exposure to be mitigated while promoting other eco-
system services that benefit people. California’s Sierra Nevada is a paragon of landmanagement policy in a fire-prone natural system. Past fire suppression has led to
extreme fuel loading where extreme fire events are much more likely, particularly
with climate change increasing the length of fire season and the probability of
extreme weather. California’s Sierra Nevada is an example to showcase the clash
of increased development and urbanization, past land management policy, future
scenarios including climate change and the intertwining of ecological health and
human health. Fire suppression to avoid smoke impact has proven to be an unreliable
way to decrease smoke-related health impacts. Instead, ecological beneficial fires
should be employed, and their management should be based on smoke impacts at
monitors, making air monitoring the foundation of fire management actions giving
greater flexibility for managing fires. Tolerance of smoke impacts from restoration
fire that is best for forest health and resiliency, as well as for human health, is
paramount and preferred over the political expediency of reducing smoke impacts
today that ignores that we are mortgaging these impacts to future generations.
Another example from developing countries comes from South Africa. Climate
change and air pollution pose significant short-term and long-term health risks to
South Africans due to the carbon intensity of the national economy, severe air
pollution around coal mining and coal-fired power stations and the vulnerability of
many subgroups in a nation burdened by extreme inequality and severe acute and
chronic diseases.
There are limited local studies on the respiratory, cardiovascular and other health
risks of air pollution. Inadequate disease surveillance and air quality data pose a
challenge for air pollution monitoring and research to its health impacts.
Key measures suggested to mitigate emissions are concerned with the energy,
industry, human settlements, transport, health care and business sectors. The public
health community has an important role to play in urging further action and
research at the national, provincial and local levels.
Mitigating air pollution as well as greenhouse gases in Delhi, one of the most
polluted cities in the world, without adversely impacting development remains a
crucial goal. Further, climate change has profound impacts that Delhi must adapt
to. From a health perspective, in addition to health impacts of pollution, addressing
health impacts of climate change such as heat waves is important.
This study onDelhi understands the transitions of key drivers of energy use such as
population, vehicle use and per-capita incomes that in turn drive emissions of pollut-
ants and greenhouse gases. It provides estimates of greenhouse gas and pollutant
emissions fromDelhi. It estimates pollution aswell as future heat-relatedmortality for
Delhi. Finally, it argues that policies for GHG aswell as pollutantmitigation require to
be better aligned. This will ensure that health co-benefits are accrued for Delhi.
In case of developed region, Hong Kong is one of the densest cities on the planet
and has adopted a stronger (60–65% carbon reduction by 2030) mitigation plan for
combating climate change. Although it may not be significant from a global
perspective, it shows a strong commitment as a global citizen. The major reduction
of GHGs in Hong Kong, is focused on the energy sector, where changing carbon-
intensity fossil fuel (i.e. coal) into less intense fuel such as natural gas, or nuclear,
424 R. Akhtar and C. Palagiano
reducing building-related energy usage and adopting more green transportation.
These mitigation plans have moved Hong Kong towards becoming a healthier city.
In terms of air pollution, these mitigation plans carry some co-benefit on local air
quality, where reduction of coal/gasoline burning would reduce PM2.5 and NOx
emitted into both roadside and ambient environments. Under the future emission
projections (IPCC AR5), PM2.5 air quality for Hong Kong in 2050 would be
improved under RCP2.6, 4.5 and 8.5 due to the reduction of primary PM and its
precursors, while it is increased under RCP6.0. In terms of ozone, less exceedance of
ozone (based onMDA8) is projected in 2050 under RCP2.6, 4.5 and 8.5 in PRD area.
To sum up, the analysis of different chapters regionally diversified did reveal the
association between climate change and air pollution and impacts on human health.
The discussion also highlights themitigation strategies to be adopted to combat climate
change and minimize GHG emissions in both developed and developing countries.
References
Adams F (1891) The genuine works of Hippocrates. William Wood and Company, New York
IPCC (2014) Climate change: impact, adaptation and mitigation, WG II, AR5, chapter 24 Asia.
Cambridge University Press, Cambridge
Kinney PL (2008) Climate change, air quality, and human health. Am J Prev Med 35(5):459–467
Mosley S (2014) Environmental history of air pollution and protection. In: World environmental
history, encyclopedia of life support systems (EOLSS), Paris. http://www.eolss.net
Wynn, G. (2014) Climate change will hike air pollution deaths says UN study, Climate Home,
March 28
Rais Akhtar is presently adjunct professor of the International
Institute of Health Management Research, New Delhi.
Cosimo Palagiano is emeritus professor in geography at the
Department of Documentary, Linguistic-Philological and Geo-
graphical Sciences, Sapienza University of Rome.
25 Summary and Conclusion 425
Index
AAir modelling, 12
Air pollution, 36, 37, 49–52, 54–57, 59–63, 69,
70, 72, 73, 76, 78–82, 101, 108, 115,
122, 131, 133–138, 140–146, 152,
182–186, 189, 194, 200, 202, 209, 211,
216–221, 223–234, 236, 241–252,
256–259, 262–264, 266–269, 273–286,
290–296, 298–307, 310–312, 314–322,
324, 331–333, 335–337, 339, 343–349,
351–354, 357, 358, 360–371, 373–377,
394–397, 401, 403, 405, 406, 408, 409,
411, 414, 416, 421–425
Air quality, 3, 4, 9–12, 14, 16, 17, 19–21, 35,
50, 55, 59, 63, 71, 73, 82, 91, 93–97,
100, 102, 111, 112, 115–117, 121–124,
136, 137, 139, 142, 182, 184–186,
188–194, 200–202, 204, 206, 209–211,
219, 220, 222, 223, 226, 231, 242, 243,
247, 249–252, 256, 259, 267, 268, 278,
284, 294, 295, 300, 303, 310, 312, 318,
322–324, 331–333, 335–337, 343, 344,
347, 351, 353, 358, 360–364, 367, 369,
370, 375, 377, 395, 403, 421–425
Ambient, 5, 9, 10, 15, 16, 21, 50, 71, 73, 96,
121, 122, 134, 138, 156, 166, 178, 183,
185, 189, 193, 194, 202, 206, 209–211,
220, 243, 246, 247, 250, 251, 256, 267,
278, 282, 284, 294, 295, 310, 312, 314,
316, 323–325, 332, 333, 336, 347, 425
Anti-pollution measures, 307
Argentina, 30, 387, 389–393, 397, 398
Arkhangelsk, 166, 167, 170–172, 174, 175,
177, 178
Atmospheric stability, 344, 346
Attributable fractions (AF), 166, 168–170, 172,
174–177
Attributable numbers of deaths, 166, 168
Australia, 4, 5, 43, 123, 131, 133–138,
140–146, 216, 421–423
BBangkok, 256–259, 262–264, 266–269, 423
Brazil, 4, 30, 357, 358, 360–371, 373–377, 389,
392
CCalifornia, 4, 5, 43, 100, 101, 103–116,
119–124, 422, 423
Carbon reduction, 189, 192, 193, 424
Caribbean, 331–333, 335–337, 339, 423
Changing climate, 3, 9–12, 14, 16, 17, 19–21,
103, 172, 217, 283, 319, 333, 338
Chemical transport models (CTMs), 3, 10, 14,
16, 403–405
China, 4, 5, 18, 28, 32, 34, 36, 37, 41–43, 134,
182, 184–186, 188–194, 216, 256, 284,
368, 403, 404, 407–411, 414, 416
Climate change, 26–29, 31–37, 41–44, 49–52,
54–57, 59–63, 69, 70, 72, 73, 76, 78–82,
100, 101, 103–116, 119–124, 131,
133–138, 140–146, 151–161, 165–178,
182, 184–186, 188–194, 200, 216–221,
223–234, 236, 241–252, 256–259,
262–264, 266–269, 273–286, 290–296,
298–307, 310–312, 314–322, 324,
© Springer International Publishing AG 2018
R. Akhtar, C. Palagiano (eds.), Climate Change and Air Pollution,Springer Climate, DOI 10.1007/978-3-319-61346-8
427
331–333, 335–337, 339, 344, 346, 347,
351, 354, 357, 358, 360–371, 373–377,
387, 388, 391, 393, 396, 398, 422–425
Climate change and health, 142, 143,
336–338, 393
Climate change impact, 3, 16, 41, 43, 49–52,
54–57, 59–63, 228, 274, 377, 422
Climate change in Argentina, 387–398
Climate projection, 53, 56, 166, 167, 171, 174,
175, 191
Climate variability, 3, 26, 153, 216, 343–349,
351–354, 422
Coal burning, 132, 134, 136, 185, 188, 278, 421
Coal mines, 136, 137, 139–141, 146, 220, 310,
312, 315, 320, 423, 424
Co-benefit, 11, 16–18, 145, 146, 182, 188–190,
194, 319–322, 402, 416, 424
Co-benefit/control, 402, 416
Conference of the parties (COP), 28, 30–34, 227
COP 21, 30, 34, 41–44
DDelhi, 5, 21, 33, 132, 273–286, 290, 295, 424
Desertification, 27, 36
Diseases, 3, 27, 50, 70, 106, 132, 152, 166, 200,
218, 247, 256, 277, 292, 314, 335, 359,
387, 388, 402, 422
Distributed lag nonlinear model
(dlnm), 168, 177
EEcological degradation, 291, 292
Ecological health, 100, 112, 423
El Ni~no, 93, 217, 218, 242, 244, 349, 392Emerging diseases and climate change,
387–392
Environmental health risk factors, 332
Epidemiological consequences, 151–161, 387,
394–397
Epidemiology, 21, 105–109, 123, 143,
151–161, 200, 211, 220, 242, 256, 268,
296, 315–317, 333, 367, 375, 387, 388,
390, 392, 394–397, 416
EU ambient quality directive, 71–73
Europe, 35, 36, 43, 49–52, 54–57, 59–63, 69,
71–73, 80–82, 137, 153, 155, 267, 401
FForest fire, 4, 5, 37, 43, 54, 93, 100, 101,
103–116, 119–124, 139, 218, 219, 222,
226, 231, 234, 242, 244–247, 249, 251,
294, 349, 358, 363, 364, 370–377, 394,
402, 422
Future air quality, 14, 182, 189–193, 284
GGeography, 59, 73, 91, 94, 96, 139, 152,
154–156, 158, 160, 161, 182, 274, 298,
332, 389, 394, 403, 423
Global warming, 5, 12, 26, 27, 31, 33, 44, 166,
177, 182, 245, 256, 274, 290, 292, 293,
303, 333, 361, 388, 393, 395, 398, 402,
416
Great Smog, 421
Greenhouse effect, 3, 26, 28, 32, 359
Greenhouse gases (GHG), 11, 18, 26, 27,
29–32, 34, 44, 45, 51, 53, 59, 114, 115,
134, 135, 137, 165, 171, 182, 187–190,
193, 200, 216, 220, 221, 224, 226–230,
241, 245, 256, 274, 276, 277, 280, 282,
284, 290, 293, 311, 319–323, 333, 337,
338, 347, 353, 354, 365, 375, 395, 397,
402, 407, 416, 422–425
HHaze, 100, 142, 220, 222, 228, 229, 241–249,
251, 401
Health, 9–11, 27, 49, 71, 100, 132, 151, 166,
183, 200, 217, 242, 256, 274, 290, 312,
331, 344, 357, 387, 401, 421
Health impact, 5, 9–12, 14, 16, 17, 19–21, 51,
62, 77, 80, 92, 100, 109, 111, 121–123,
140, 153, 166, 167, 174, 216–221,
223–234, 236, 242, 243, 247–249, 277,
280–283, 312, 318, 321, 332, 333, 336,
337, 347, 360, 367, 387, 409, 423, 424
High blood pressure, 296, 403
Hippocrates, 421
Hong Kong, 182, 184–186, 188–194, 424
Human health, 27, 35, 37, 49, 61, 71, 73–77,
82, 92, 94, 95, 97, 100, 101, 105–107,
113, 115, 121, 123, 135, 152, 200, 217,
218, 222, 224, 234, 236, 242, 243,
246–249, 256–259, 262–264, 266–269,
273–286, 292, 303, 336, 337, 339, 344,
351, 354, 357, 358, 360–371, 373–377,
395, 401, 402, 413, 416, 421–425
Hurricanes
Harvey, 43, 46
Katrina, 43, 46
Sandy, 43, 46
428 Index
IIndia, 4, 5, 10–12, 16, 18, 21, 28, 32, 34,
35, 41–43, 45, 134, 273–286, 290,
294, 295
Infectious diseases, 35, 36, 134, 135,
142, 143, 152–155, 166, 256, 315,
387, 388
Intergovernmental Panel on Climate Change
(IPCC), 3, 19, 20, 26, 29, 31–33, 44,
51–53, 56–59, 62, 135, 165, 167, 172,
178, 190, 191, 194, 216, 226, 229,
332–334, 336–338, 348, 389, 397, 398,
422, 425
LLung cancer, 5, 9, 13, 17, 71, 73, 76, 133, 134,
221, 316
MMalaria, 4, 5, 27, 36, 37, 70, 151–161, 218,
319, 389, 390, 423
Malaysia, 222, 241–252
Malnutrition, 4, 5, 37, 152, 282, 397, 423
Mediterranean climate, 3
Mexico City, 343–349, 351–354, 368
Modeling, 114, 115, 122, 156, 167, 178, 347,
366, 403, 416
Mumbai, 277, 290–296, 298–307
NNitrogen oxides (NO2), 4, 49, 50, 54, 70,
76–78, 80, 81, 94, 115, 183, 202, 208,
219, 220, 224, 243, 250, 251, 258, 269,
278, 301, 302, 310, 315, 317, 337, 348,
358–360, 363, 365, 368–370, 372, 394,
396, 401, 402, 422
North, 50, 55, 57, 62, 73, 105, 107, 108, 145,
153, 159, 160, 166, 167, 171, 182, 185,
216, 298, 299, 350, 394, 416
Northern Europe, 49–52, 54–57, 59–63
OOpen burning, 241, 242, 247, 250, 285, 295
Ozone (O3), 26, 49, 70, 94, 115, 133, 183, 202,
220, 243, 258, 274, 293, 314, 332, 344,
358, 388, 401, 422
Ozone exposure, 10, 12, 13, 16, 332, 405, 406
Ozone peaks, 344
PParis Climate Agreement, 42, 44
Particulate matter (PM), 3, 49, 73, 74, 93, 94,
105, 108, 113, 115, 118, 123, 133, 134,
136, 141, 200, 211, 220, 246, 247, 249,
251, 258, 274, 278, 280, 281, 294, 301,
314, 315, 317, 324, 332, 336, 337, 349,
358, 361–367, 369–371, 375, 377, 394,
395, 402, 407, 422
PM2.5 exposure, 10, 11, 13, 15, 16, 21
Policy, 31, 42, 49, 73, 100, 217, 250–252,
264, 274, 296, 321, 344, 358–360, 397,
401, 423
Pollutants, 11, 26, 49, 70, 94, 100, 133, 134,
151, 182, 202, 219, 242, 256, 274, 292,
312, 332, 344, 358, 394, 402, 422, 423
Population health, 5, 94, 368
Premature mortality burden, 11, 20, 21
Prognosis, 155–161
Public health, 12, 100, 102, 111, 112, 115,
121–124, 139, 151, 161, 166, 177, 200,
219, 226, 230, 235, 243, 257, 264–266,
269, 303, 315, 319, 321–323, 332,
335–338, 358, 362, 368, 371, 389, 390,
424
RReduction emission scenarios, 231, 233
Renewable energy, 33, 42, 82, 137, 145, 230,
285, 286, 311, 319, 377, 398
Representative Concentration Pathways (RCP)
scenarios, 14–16, 20, 51–53, 59, 60, 62,
63, 191
Respiratory problems, 3, 36, 140, 222, 295, 359
Risk assessment, 120, 360
Russia, 4, 151–161, 166, 368
SS~ao Paulo, 364–374
Seasonal mortality patterns, 200, 210
Short lived climate pollutant (SLCP), 347, 402,
413, 416
Social licence, 133
Spatial variability, 56, 95
Index 429
SSP scenarios, 19, 20
Supreme court ruling, 343, 345, 348
TTemperature, 11, 26, 51, 72, 95, 103, 132, 152,
166, 182, 200, 216, 246, 256, 282, 290,
318, 332, 347, 359, 389, 402, 422
Temperature increase, 28, 103, 348, 365
Trans boundary air pollution, 401, 402, 415, 416
Tropical country, 245, 246
Tropical cyclones, 55, 182, 186, 193
Trump, Donald., 5, 30, 44, 45, 135
UUrban air, 3, 93, 216–221, 223–234, 236, 268,
332, 333, 366, 394, 421
Urbanisation, 50, 152, 200, 216, 242, 246, 257,
273, 290, 296, 298, 299, 337, 365, 388,
422, 424
Urban quality of life, 82
WWildland fire smoke, 100, 111, 115, 121, 123,
423
World Health Organization (WHO), 5, 35,
50, 71, 73, 132, 156, 167, 183, 184,
219, 221, 247, 260, 276, 277, 284, 294,
295, 312, 331–333, 335, 336, 345,
358, 364, 367–369, 389, 394, 403,
406, 423
World Meterological Organization (WMO), 4,
28, 31, 43, 361, 422
430 Index
Related Documents