Railway Marketing and Corporate Plans: Standards and Practices PCM, NAIR

Welcome message from author
This document is posted to help you gain knowledge. Please leave a comment to let me know what you think about it! Share it to your friends and learn new things together.
Transcript

Railway Marketing and Corporate Plans:
Standards and Practices
PCM, NAIR

Objectives…
• International Marketing
• Marketing in Railways
• UNDP Report
• Country Railways
• Customer centricity
• “Managing Government, Governing Management”

International Marketing (IM) (Source: IGNOU, School of Management Studies)
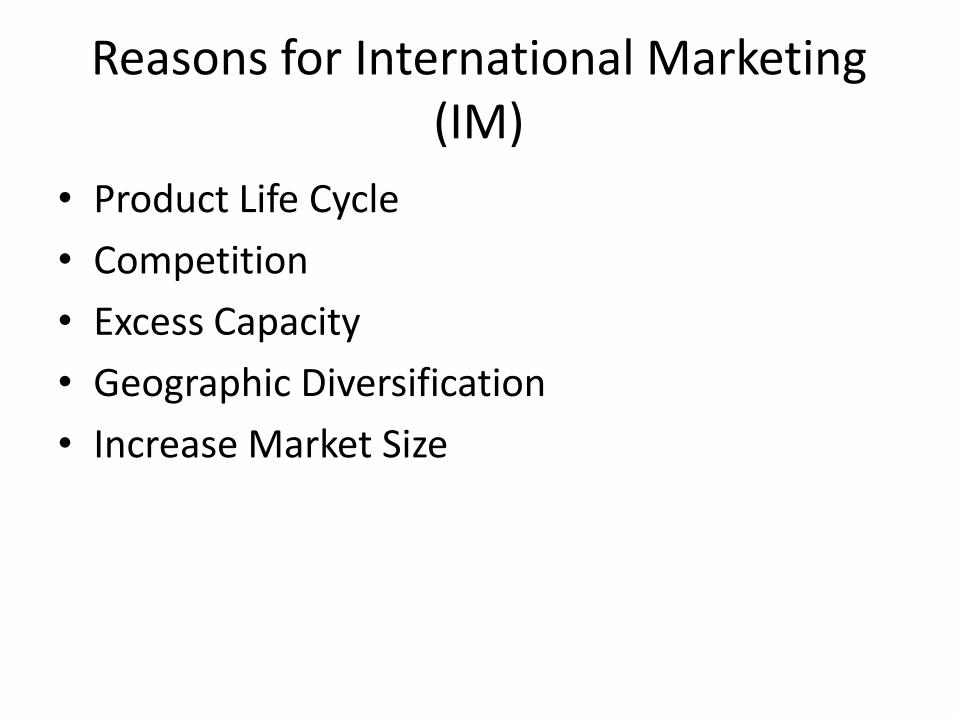
Reasons for International Marketing (IM)
• Product Life Cycle
• Competition
• Excess Capacity
• Geographic Diversification
• Increase Market Size

Modes for Entry
• Exporting • Licensing • Joint Venture • Manufacturing • Managing Contracts Agency Subsidiary Export Management Piggyback

Government Policies - Asia
Outward-oriented Inward-oriented
Strongly Moderately Strongly Moderately
Hong Kong Thailand Myanmar India
Japan Vietnam Pakistan
Singapore Cambodia Sri Lanka
South Korea Bhutan Indonesia
Bangladesh
Nepal
Philippines

IM: Requirements
• Institutional Framework – Ministry and Departments
• Consultative and deliberative bodies – Board of Trade (1989), Central Advisory Council
• Commodity Organizations – EPCs (Export promotion Councils)
• Service Institutions – TDA (Trade Development Authority, 1970)

IM: Business Environment
• Cultural
• Political and Legal
• Trade, Monetary and Finance

Policy Framework
• EXIM Policy – framework, motion, simplification, streamlining
• Documentation
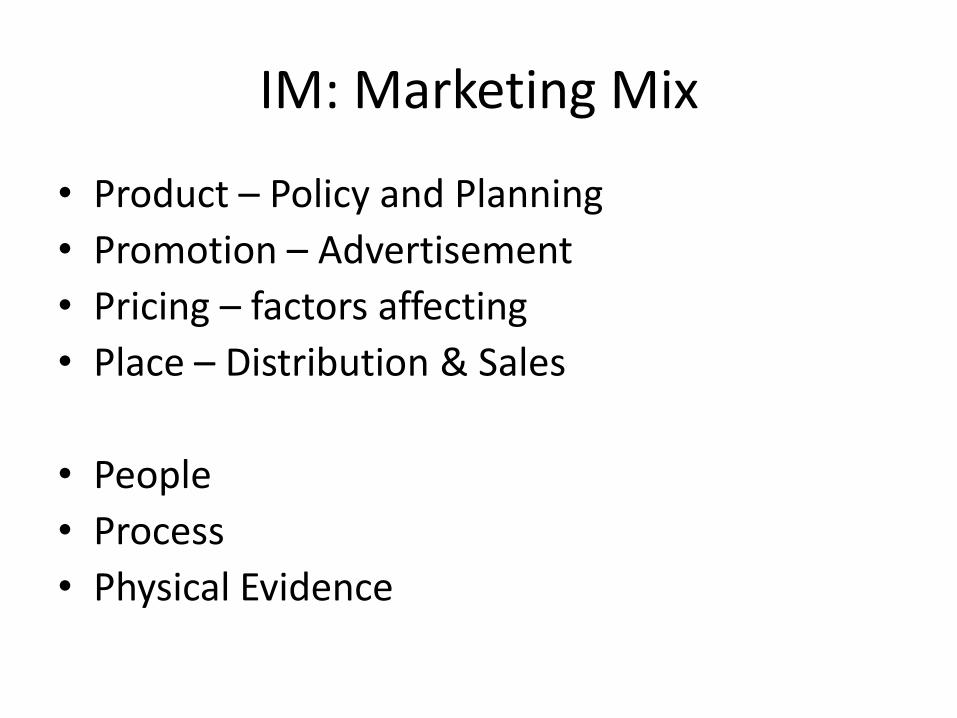
IM: Marketing Mix
• Product – Policy and Planning
• Promotion – Advertisement
• Pricing – factors affecting
• Place – Distribution & Sales
• People
• Process
• Physical Evidence

Marketing Selection & Segmentation
Invest/ Grow
Dominate/ Divest/ Joint
Venture
Selectively Strategies
Harvest/ Divest/ Combine/
License
High
Low
High Low
Competitive Strengths
Co
un
try
Att
ract
iven
ess
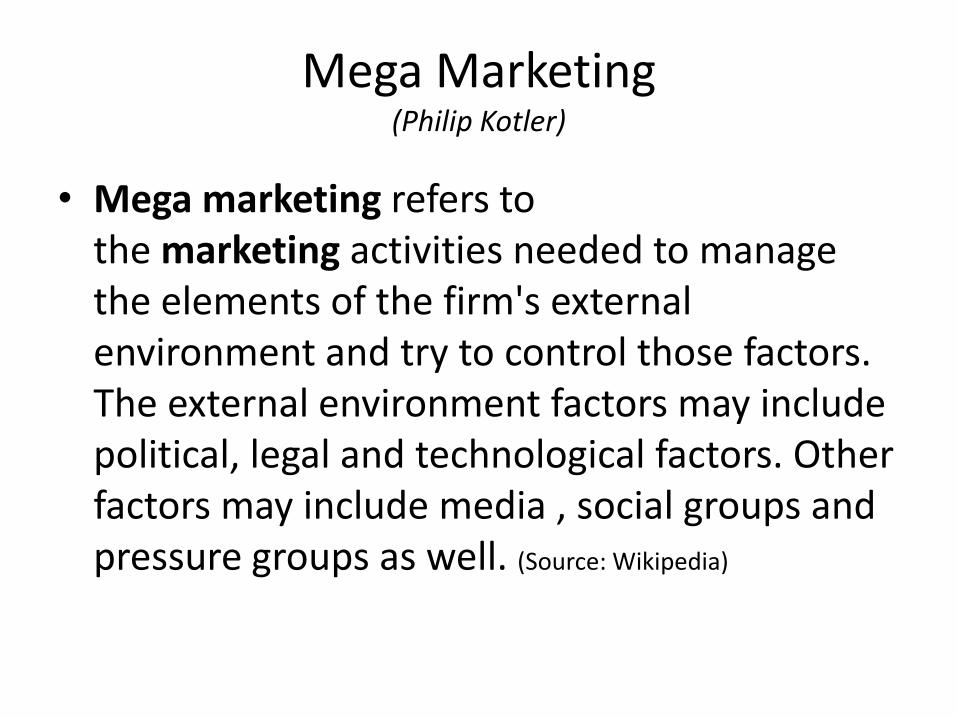
Mega Marketing (Philip Kotler)
• Mega marketing refers to the marketing activities needed to manage the elements of the firm's external environment and try to control those factors. The external environment factors may include political, legal and technological factors. Other factors may include media , social groups and pressure groups as well. (Source: Wikipedia)

Segmentation: Planning decisions
• Diagnosis of situation
• Situation Analysis – SWOT, 5Cs, Porter’s Five Forces Analysis
• Objectives
• Sales/Profit Forecasts
• Marketing Program
• Budget
E-Commerce – Retail On-line Marketing

Railway organizations
• Traditionally vertically integrated and state-owned & controlled, regulated
• Many have been corporatized, privatized
• State funding – not always
• Challenges from other modes – roads, air, water
• Public utility - providing Private Goods
• Largely product-centric – less service leadership

Railways do marketing…!?
• Sales, advertising – promotion only?
• Famous 7Ps
• Forces – Porter’s 5 forces model
• Private Goods provider
• Ramsey Pricing?
• Giving back to the nation
• No option left but to respond to the reality of the environment and the economy

Realities…
• Cross-subsidization between profitable and unprofitable services/areas - freight, passenger, parcel, and within service
• Dependency on Government funding
• Privatization may not be the solution, many flip sides
• No position of marketing unit in the corporate structure

Railway as a % of Road Cost (source: Morgan Stanley Report, Nov., 2015)
0
10
20
30
40
50
60
70
80
90
Energy Consumption
Financial Cost CO2 Emmission Accident Cost
83% 80%
20% 13%

Rail Spending (% of Rail & Road spending), C2013
14% 19%
24% 26% 31%
50% 50%
0
10
20
30
40
50
60
USA India China Germany Australia Russia UK

UNDP Reports
• https://www.youtube.com/watch?v=oyLXsPRuR3w

UNDP Report Country Iran Afghani
stan Pakistan
India Bangladesh
Nepal Bhutan Sri Lanka
Myanmar
Thailand
Cambodia
Vietnam
HDI Rank, 2014
69 171 147 130 142 145 132 73 148 93 143 116
Population 2014 (ml)
78.5 31.3 185.1 1267.4 158.5 28.1 0.8 21.4 53.7 67.2 15.4 92.5
Poverty MD HC % Year
-------
58.8 (2011)
45.6 (2013)
55.3 (2006)
49.5 (2011)
41.4 (2011)
29.4 (2010)
--------
---------
1.0 (2006)
46.8 (2010)
6.4 (2011)
GNI 2014 PC (PPP $)
15439.8
1885.3 4866.2 5497.5 3191.5 2311.3 7175.5 9778.6 4609.7 13322.9
2948.9 5091.8
Literacy Rate >15Y
84.3 (2012)
31.7 (2011)
54.7 (2011)
-------
58.8 (2012)
57.4 (2011)
52.8 (2005)
91.2 (2010)
92.6 (2012)
96.4 (2010)
---------
90.2 (2008)
EXIM % GDP (2013)
57.7 (2005)
55.4 33.1 53.3 46.3 48.2 103.7 54.5 1.1 (2001)
143.8 139.5 163.7
Mobile /100 pax (2014)
87.8 74.9 73.3 74.5 75.9 82.5 82.1 103.2 49.5 144.4 155.1 147.1

69
171
147
130
142 145
132
73
148
93
143
116
HDI Rank, 2014
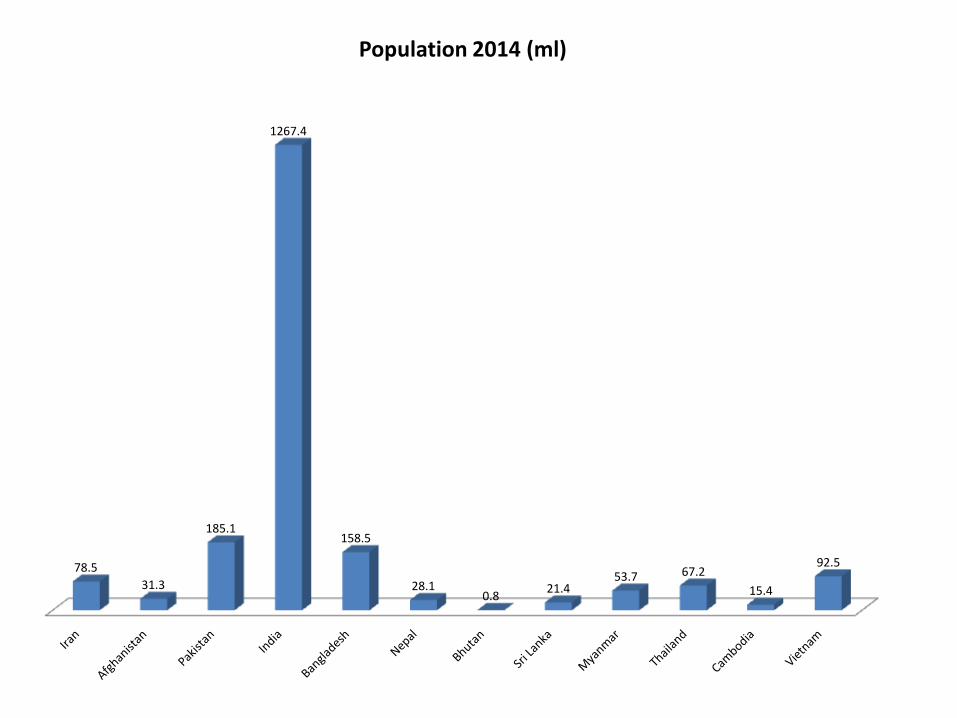
78.5
31.3
185.1
1267.4
158.5
28.1 0.8
21.4 53.7 67.2
15.4
92.5
Population 2014 (ml)
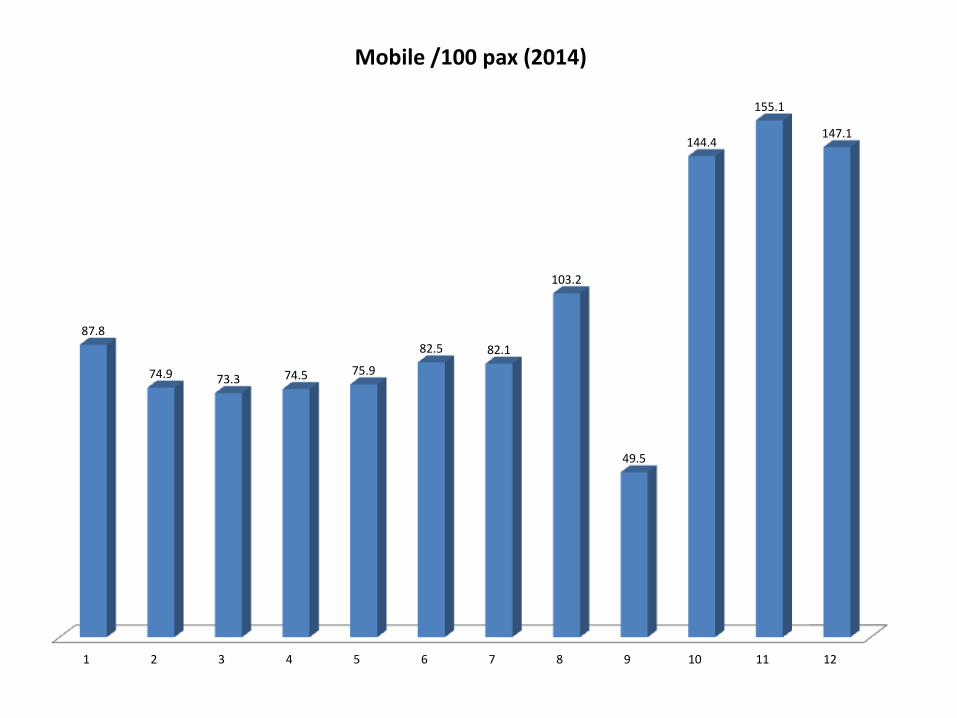
1 2 3 4 5 6 7 8 9 10 11 12
87.8
74.9 73.3 74.5 75.9
82.5 82.1
103.2
49.5
144.4
155.1
147.1
Mobile /100 pax (2014)

15439.8
1885.3
4866.2
5497.5
3191.5
2311.3
7175.5
9778.6
4609.7
13322.9
2948.9
5091.8
GNI 2014 PC (PPP 2011 $)

Indian Railways http://www.indianrailways.gov.in/
Suresh Prabhakar Prabhu
Hon’ble Minister for Railways

Important Statistics Particulars/Years 1950-51 2012-13 2013-14 2014-15
No. of Passengers (Million)
1284 8421 8397 8224
Pass. Earnings (In Rs. Cr.)
98.20 31322.84 36532.25 42189.81
Freight Loading (MT)
93 1014.15 1058.81 1101.08
Freight Revenue Earning (In Rs. Cr.)
139.30 83478.83 91570.85 103100.15
Gross Revenue Receipt (Rs. Cr.)
263.30 126181.43 143213.87 161017.25
Working Expenses (Rs. Cr.)
215.74 112565.24 131464.80 144178.76
Excess (Rs. Cr.) 15.05 8266.25 3740.40 7664.94 Operating Ratio 81 90.19 93.60 91.75

Cabinet Summery for March, 2016 Originating (MT) 2014-15 2015-16 2015-16 Shortfall Commodity Actuals Target Actual Diff . To Target
Coal 545.81 585.00 551.67 Raw Mat. For Steel Plants 18.28 21.00 20.30 Pig Iron and Finished steel 42.84 43.50 42.47 Iron Ore for Exports
112.77
125.00
117.38 Iron Ore for Steel Plants
Iron Ore for other users
Cement 109.80 120.50 106.07 Food grains 55.47 62.00 45.84 Fertilizers 47.41 49.50 52.25 POL 41.10 43.25 43.96 Container Services 48.38 54.50 46.18 Other Goods 73.40 82.00 78.05
TOTAL 1095.26 1186.25 1104.17 - 8.46%
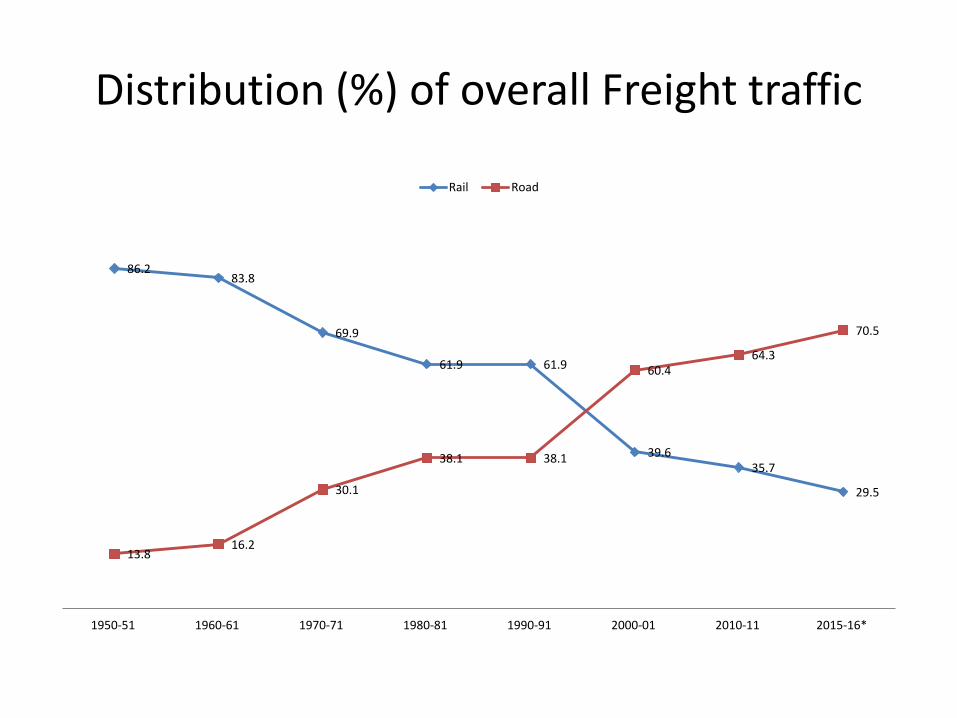
86.2 83.8
69.9
61.9 61.9
39.6 35.7
29.5
13.8 16.2
30.1
38.1 38.1
60.4 64.3
70.5
1950-51 1960-61 1970-71 1980-81 1990-91 2000-01 2010-11 2015-16*
Rail Road
Distribution (%) of overall Freight traffic

Cabinet Summery for March, 2016 Freight Traffic
Item Target Actual (Prov.) Diff. (%) Actual Cumulative up to July, 2015 (Prov.)
NET TONNE-KM IN BILLIONS
61.69 56.47 -8.46 655.60

March, 2015 Cumulative up to march, 2015
March, 2016 Cumulative up to March, 2016
Suburban 371.60 4503.73 376.99 4459.38
Non-Sub-urban 315.77 3725.94 302.52 3692.52
TOTAL 687.37 8229.67 679.51 8151.90
Cabinet Summery for March, 2016 No. of Passengers booked (in millions)
March, 2016 (Approx.) Cumulative up to March, 2016
Budget proportion
Approx. Actual
Difference Budget Proportion
Approx. Actual
Difference
Gross Earnings
16429.35 15503.92 -925.43 167784.02 163384.74 -4399.28
Ordinary Working Expenses
5012.45 6010.39 997.94 109094.63 107709.25 -1345.38
Earnings and Working Expenses (Rs. in Crores)

Classification and Rates of Goods
• http://www.indianrailways.gov.in/railwayboard/uploads/DATA/AKASH/Goods%20Tariff%20No_48%20Pt_I%20Vol_II%20%26%20Pt_II.pdf
• http://www.indianrailways.gov.in/railwayboard/uploads/directorate/traffic_comm/Freight_Rate_2016/Corrig_15_RC_8_15.pdf

Railway PSUs (Public Sector Undertakings) and other Organisations
• http://indianrailways.gov.in/railwayboard/uploads/directorate/stat_econ/Annualreport10-11/Undertaking_organisation.pdf

New and Important Initiatives
• Freight: Private Freight Terminals, Ware housing, Finance models, Partnerships, Empty Flow schemes, Smalls and multi-points, Incentive schemes
• Parcel: Parcel Cargo trains, Parcel terminals, Parcel wagons, Revised Leasing of parcel spaces, e-commerce
• Passenger: Pricing – Premium, Surge, Tatkal, new services, new services
• Non-Fare box: Advertisement, etc • FDI (Foreign Direct Investment) – 100% • Make In India Initiatives – Export potential • JVs, PPPs • IT solutions – PRS, FOIS/TMS, E-Ticketing, etc. • Reforms: Bibek Debroy Committee, Reconstitution of
Railway Board, Delegation, MOUs

Economic Environment
• Since 2014-15, Rainfall deficient
• Agricultural production and rural demand prospect not so bright
• Industry remains sluggish with low investment demand
• Economy not performed well in external market

Contd…
• Growth in GVA (Gross Value Added) at the base prices for 2015-16 for ‘mining and quarrying’ sector estimated to be 6.9% as compared to the growth of 10.8% in 2014-15
• Production of coal, crude oil and natural gas – growth rates 4.6% (-)0.8%, (-)2.8% in Apr-Dec, 2014-15 respectively

Contd…
• Construction sector growth 3.7% against 4.4% of previous year 2014-15
• GFCF (Gross Fixed Capital Formation) as % of GDP is declining - 33.4% in 2013-14 to 29.4% in 2015-16, a reflection of weakening of investment activities in the economy
• Needs $1 trillion in new infrastructure over next five years for 7.8% growth in GDP in 2016-17 and 10% by 2019-20

Recent Global scenario
• Slowdown of growth in China, US and major EU countries (external front of India)
• Considerable built-up inventories, in coal, iron and steel, etc
• Prices crashfor raw materials • Reduced liquidity • Sluggish industrial and infrastructure performance • Reduced income opportunities • Slowdown in capital market activities • Decrease in real estate developments • Increased inflation expectation • Diminishing business and consumption confidence

Pakistan Railways http://www.railways.gov.pk/
Khawaja Saad Rafiq
Federal Minister for Railways

Recent Reforms iniciatives
• The Railways Board was reconstituted on February 20, 2015. The new Railway Board consists of the following members:
• Ex-officio members:
I. Secretary/Ministry of Railways (Chairman of the Board)
ii. Secretary, Communications Division
iii. Secretary, Finance Division
iv. Secretary, Planning & Development Division
v. General Manager (Operations), Pakistan Railway
vi. General Manager (Manufacturing & Services), Pakistan Railway
vii. Member Finance, Ministry of Railways
• Private Members:
I. Mr. Ashtar Ausaf Ali
ii. Mr. Muhammad Ishfaq Khattak
iii. Dr. Zahid Saleem, Chief Executive Officer,
COMSAT University
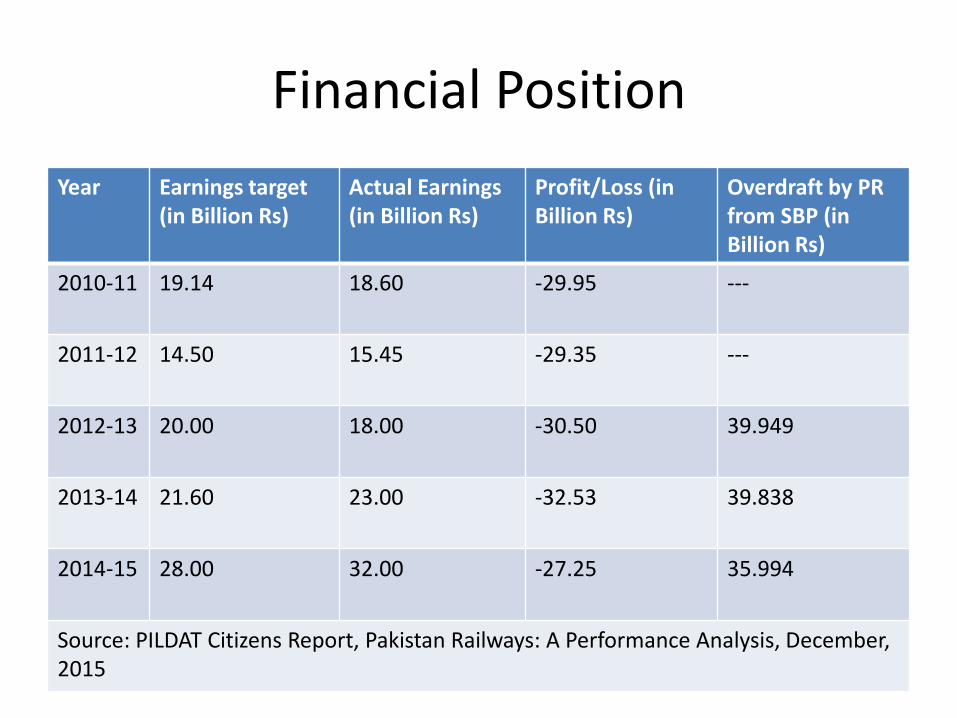
Financial Position
Year Earnings target (in Billion Rs)
Actual Earnings (in Billion Rs)
Profit/Loss (in Billion Rs)
Overdraft by PR from SBP (in Billion Rs)
2010-11 19.14 18.60 -29.95 ---
2011-12 14.50 15.45 -29.35 ---
2012-13 20.00 18.00 -30.50 39.949
2013-14 21.60 23.00 -32.53 39.838
2014-15 28.00 32.00 -27.25 35.994
Source: PILDAT Citizens Report, Pakistan Railways: A Performance Analysis, December, 2015

Revenue Generation
Year % Passenger Earnings
% Parcel, etc Earnings
% Freight Earnings
% Misc. Earnings
2010-11 64.29 5.47 17.93 12.30
2011-12 72.18 6.59 10.25 10.97
2012-13 74.91 5.45 10.98 8.66
2013-14 69.34 4.93 15.60 10.13
2014-15 56.29 4.07 26.16 13.46
Source: PILDAT Citizens Report, Pakistan Railways: A Performance Analysis, December, 2015

Outsourced Trains
• Business Train – Feb, 2012
• Shalimar – Mar, 2012
• Night Coach – Jan, 2013
• Cargo Express – Sep, 2014
Plan to run under PPP:
• Fareed Exp
• Bolan Exp
• Khushal Khan Khattak Exp

PILDAT Citizens Report, Pakistan Railways: A Performance Analysis, December, 2015
• The report suggests policy recommendations. Some of these recommendations are as follows:
i. Pakistan Railways must develop and follow a strategic business plan to ensure financial targets are met and the institution is driven out of deficit.
ii. PR must consider developing a competent Human Resource (HR) department to devise strategies for training and posting of officers and staff strictly according to merit.
iii. Parcel Business initiatives such as leasing space in luggage vans of passenger trains to Courier Service Providers for attracting parcels traffic should be adopted.
iv. 95.38% of PR's passengers travel using economy class services. Passenger Business initiatives must take this into account and increase passenger base to attract other classes as well.
v. Initiatives such as E-ticketing will not only attract a larger passenger base but also address ticketless travelling to some extent. In addition to this, outsourcing ticket checking on Branch Line Trains can help curb ticketless travelling.
vi. Increase PR's market presence by better advertising service enhancing initiatives. This could be commissioned to a private marketing agency.

PILDAT Citizens Report, Pakistan Railways: A Performance Analysis, December, 2015
• However, instead of outright privatisation of PR, which may not be possible in view of the complex nature of its working, many innovative steps can be taken to improve its performance as well as increasing revenues. These possible remedies include the following:
i. Outsourcing non-core activities such as running of workshops, sleeper manufacturing factories, and locomotive manufacturing factory.
ii. Under Track Access Policy private firms should be encouraged to bring in their own rolling stock (locomotives and wagons) to operate freight trains.
iii. PR should insist on finalisation of National Transportation Policy so that funds allocated could be judiciously distributed among different modes of transportation.
iv. Introduce IT based solutions for E-governance to increase departments' efficacy.
v.PR must consider developing a competent HR department to devise strategies for training and posting of officers and staff strictly according to merit.

PILDAT Citizens Report, Pakistan Railways: A Performance Analysis, December, 2015
vi. Freight Business initiatives should be undertaken such as inducting high capacity wagons that are capable of running at higher speeds. This would enable empty wagons to be dispatched quickly to originating stations, especially at the Karachi Port for fresh loading. Guaranteed supply of wagons to customers investing in railway wagons coupled with freight rates rebate can further increase freight revenue.
vii. Parcel Business initiatives such as leasing space in luggage vans of passenger trains to Courier Service Providers for attracting parcels traffic. This practice is being followed by Indian Railways.
viii. 95.38% of PR's passengers travel using economy class services. Passenger Business initiatives must account for this factor.
ix. Initiatives such as E-ticketing will not only attract a larger passenger base but also address ticketless travelling to some extent. In addition to this, outsource ticket checking on Branch Line Trains can also help curbing ticketless travelling.
x. PR should consider increasing its market presence by promoting their service enhancing initiatives. This should be commissioned to a private marketing agency.
xi. A proper business plan with targets and a sound monitoring mechanism should be adopted.
PILDAT Citizens Report, Pakistan Railways: A Performance Analysis, December, 2015
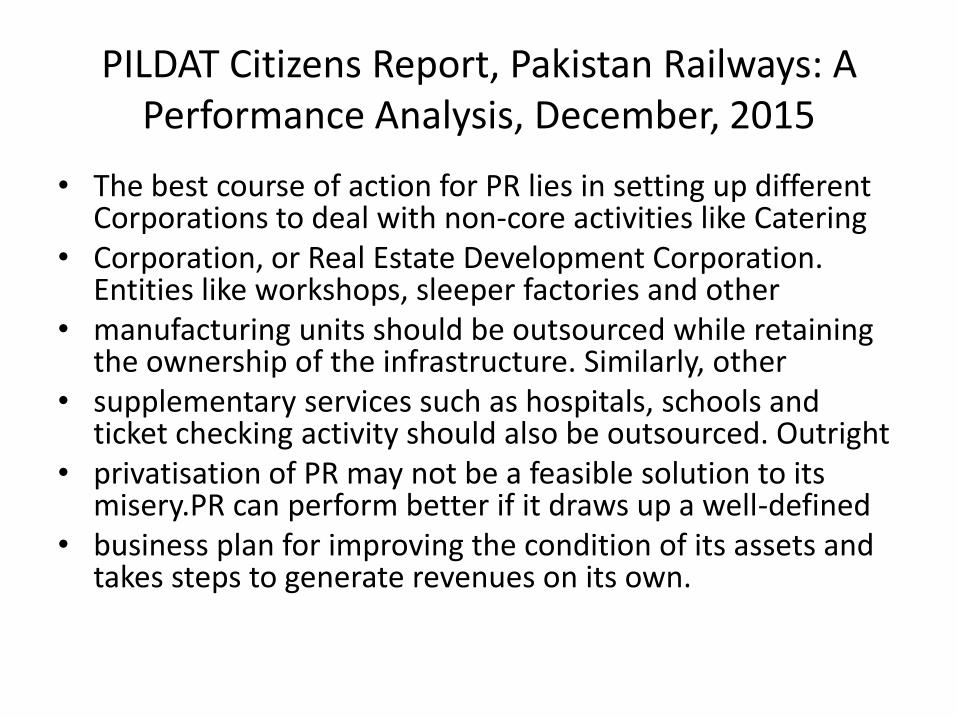
• The best course of action for PR lies in setting up different Corporations to deal with non-core activities like Catering
• Corporation, or Real Estate Development Corporation. Entities like workshops, sleeper factories and other
• manufacturing units should be outsourced while retaining the ownership of the infrastructure. Similarly, other
• supplementary services such as hospitals, schools and ticket checking activity should also be outsourced. Outright
• privatisation of PR may not be a feasible solution to its misery.PR can perform better if it draws up a well-defined
• business plan for improving the condition of its assets and takes steps to generate revenues on its own.

Bangladesh Railway http://www.railway.gov.bd/
ম োঃ আ জ দ
ম সেন
পরিচ লক
Md. Amzad Hossain Director General

Key Performance Ratios (figures in BDT million)
Source: https://www.adb.org/sites/default/files/linked-documents/49094-001-sd-01.pdf
Financial Performance
2010 2011 2012 2013 2014
Revenue - wihtout PSO Compensation
5,663 6,295 6,034 8,043 8,002
Revenue – with PSO and Welfare Grant
6,731 7,470 7,264 9,293 9,221
Operating Expenses
-12,572 -14,918 -15,671 -15,624 -16,017
Net Operating Deficit
-5,840 -7,447 -8,406 -7,581 -8,015

Key Performance Ratios (figures in %)
Source: https://www.adb.org/sites/default/files/linked-documents/49094-001-sd-01.pdf
Financial Ratios
2008 2009 2010 2011 2012
Operating Ratio – without subsidy
222
237
260
194
200
Operating Ratio – with subsidy
187
200
216
168
174

Vietnam Railways
• Vietnam Railways (Đường sắt Việt Nam) is the state-owned operator of the railway system in Vietnam. The principal route is the 1,600 km (990 mi) single track North-South Railway line, running between Hanoi and Ho Chi Minh City.
• This was built at the metre gauge in the 1880s during the French
colonial rule. There are also standard gauge lines running from Hanoi to the People’s Republic of China, eventually leading to Beijing, and some mixed gauge in and around Hanoi. (source: Wikipedia)
• Report on Vietnam Railways
http://www.s-ge.com/sites/default/files/private_files/2014%2002%2018%20Overview%20Vietnam%20Railway_vf.pdf

7 S Framework: For Developing a Market-Oriented Organization
Shared Values
Style
Structure
Skills/ Staffing
Systems
Strategy
Super-ordinate
Goal
51 (Source: Mckinsey)

Paradigm Shift…
CUSTOMER CENTRICITY
PRODUCT CENTRICITY


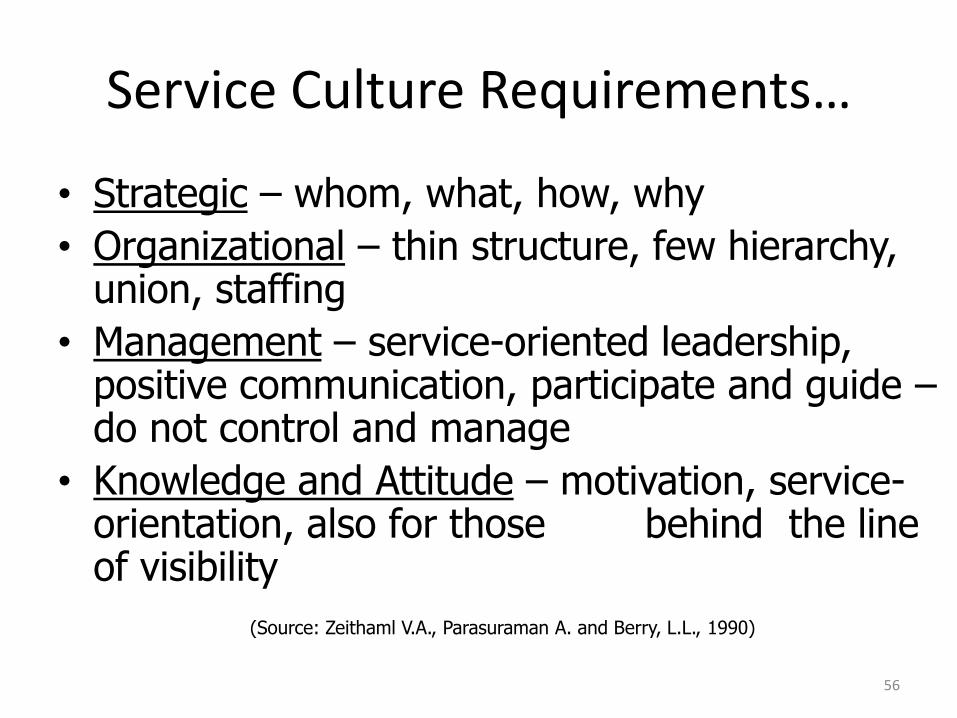
• Strategic – whom, what, how, why
• Organizational – thin structure, few hierarchy, union, staffing
• Management – service-oriented leadership, positive communication, participate and guide – do not control and manage
• Knowledge and Attitude – motivation, service-orientation, also for those behind the line of visibility
(Source: Zeithaml V.A., Parasuraman A. and Berry, L.L., 1990)
56
Service Culture Requirements…
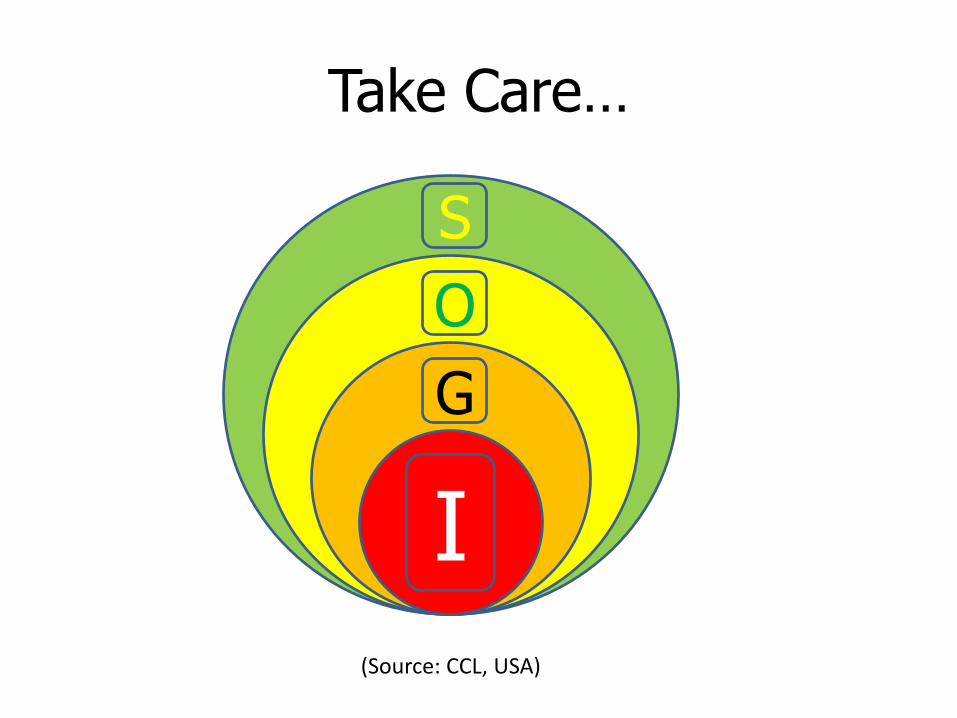
Take Care…
S
O
G
I (Source: CCL, USA)

Reading material…
“Managing Government,
Governing Management”
--- by Henry Mintzberg (1996), HBR
mintzberg managing govts.pdf
Long live Trans-Asian Connectivity & Culture!!!
https://www.youtube.com/watch?v=kjSOG5MroJk

• Thank You
• धन्यवाद Dhanyavaad
• Shukriya شکریہ
• ধনযব দ Dhannobaad
• ඔබට ස්තුතියි obaṭa stutiyi
• Kyaayyjuutainpartaal
• Kaadinchhey La
• ขอขอบคณุ K̄hx kh̄xbkhuṇ
• អរគុណ arkoun
• cho tôi biết
Related Documents