RAILROAD SAFETY STATISTICS 2008 PRELIMINARY ANNUAL REPORT THIS PUBLICATION CONTAINS REPORTS SUBMITTED THROUGH AUGUST, 2009 U.S. Department of Transportation Federal Railroad Administration (DATA AS OF NOVEMBER 13, 2009)

Welcome message from author
This document is posted to help you gain knowledge. Please leave a comment to let me know what you think about it! Share it to your friends and learn new things together.
Transcript
RAILROAD
SAFETY STATISTICS
2008 PRELIMINARY ANNUAL REPORT
THIS PUBLICATION CONTAINS REPORTS SUBMITTED THROUGH AUGUST, 2009 U.S. Department of Transportation Federal Railroad Administration (DATA AS OF NOVEMBER 13, 2009)
Railroad Safety Statistics – Annual Report 2008 – Preliminary November 13, 2009
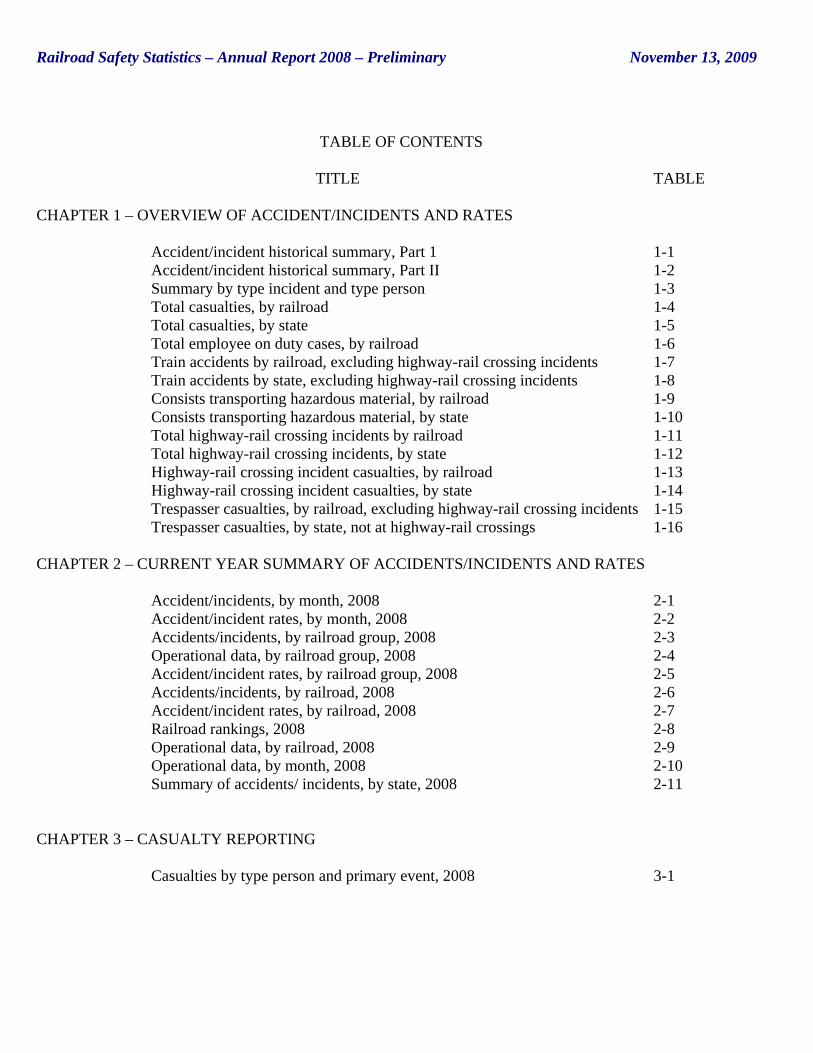
TABLE OF CONTENTS
TITLE TABLE CHAPTER 1 – OVERVIEW OF ACCIDENT/INCIDENTS AND RATES Accident/incident historical summary, Part 1 1-1 Accident/incident historical summary, Part II 1-2 Summary by type incident and type person 1-3 Total casualties, by railroad 1-4 Total casualties, by state 1-5 Total employee on duty cases, by railroad 1-6 Train accidents by railroad, excluding highway-rail crossing incidents 1-7 Train accidents by state, excluding highway-rail crossing incidents 1-8 Consists transporting hazardous material, by railroad 1-9 Consists transporting hazardous material, by state 1-10 Total highway-rail crossing incidents by railroad 1-11 Total highway-rail crossing incidents, by state 1-12 Highway-rail crossing incident casualties, by railroad 1-13 Highway-rail crossing incident casualties, by state 1-14 Trespasser casualties, by railroad, excluding highway-rail crossing incidents 1-15 Trespasser casualties, by state, not at highway-rail crossings 1-16 CHAPTER 2 – CURRENT YEAR SUMMARY OF ACCIDENTS/INCIDENTS AND RATES Accident/incidents, by month, 2008 2-1 Accident/incident rates, by month, 2008 2-2 Accidents/incidents, by railroad group, 2008 2-3 Operational data, by railroad group, 2008 2-4 Accident/incident rates, by railroad group, 2008 2-5 Accidents/incidents, by railroad, 2008 2-6 Accident/incident rates, by railroad, 2008 2-7 Railroad rankings, 2008 2-8 Operational data, by railroad, 2008 2-9 Operational data, by month, 2008 2-10 Summary of accidents/ incidents, by state, 2008 2-11 CHAPTER 3 – CASUALTY REPORTING Casualties by type person and primary event, 2008 3-1
Railroad Safety Statistics – Annual Report 2008 – Preliminary November 13, 2009
TITLE TABLE
Fatalities by type person killed and railroad, 2008 3-2 Fatalities by type person killed and state, 2008 3-3 Nonfatal conditions by type person and railroad, 2008 3-4 Nonfatal conditions by type person and state, 2008 3-5 Reportable conditions, all type persons, 2008 3-6 Total casualties by age of individual and type person, 2008 3-7 Total casualties by month and type person, 2008 3-8 Total casualties by time of day and type person, 2008 3-9 CHAPTER 4 – EMPLOYEE ON DUTY CASUALTIES Reportable conditions to employees on duty, 2008 4-1 Reportable conditions to employees on duty, by railroad, 2008 4-2 Reportable conditions to employees on duty, by state, 2008 4-3 Reportable conditions to employees on duty, by activity, 2008 4-4 Reportable conditions to employees on duty, by event, 2008 4-5 Reportable conditions to employees on duty, by location, 2008 4-6 Reportable conditions to employees on duty, by job, 2008 4-7 Occupational illnesses of employees on duty, 2008 4-8 Occupational illnesses of employees on duty, by railroad, 2008 4-9 CHAPTER 5 – TRAIN ACCIDENTS Train accidents by railroad, type, and major cause, 2008 5-1 Train accidents by state, type, and major cause, 2008 5-2 Train accidents by month, type and major cause, 2008 5-3 Train accidents by day, type, and major cause, 2008 5-4 Train accidents by time of day, type, and major cause, 2008 5-5 Train accidents by type and major cause, 2008 5-6 Train accidents by sub-cause and type, 2008 5-7 Train accidents with contributing cause, 2008 5-8 Train accidents by specific cause, and type, 2008 5-9 Train accidents by type track and class, 2008 5-10 Train accidents by type track and consist speed, 2008 5-11 Train accidents by weather condition, 2008 5-12 Train accidents by consist length, 2008 5-13 Train accidents by type track and consist, 2008 5-14 Train accidents by consist length and type consist, 2008 5-15 Involvement in train accidents by type consist, 2008 5-16 Damage by track type, 2008 5-17 Damage by consist type, 2008 5-18
Railroad Safety Statistics – Annual Report 2008 – Preliminary November 13, 2009
TITLE TABLE CHAPTER 6 – TRAIN ACCIDENTS/INVOLVING CONSISTS TRANSPORTING HAZARDOUS MATERIALS Consists transporting hazardous material, by railroad, 2008 6-1 Consists transporting hazardous material, by state, 2008 6-2 Consists transporting hazardous material, by sub-cause, 2008 6-3 Consists transporting hazardous material, by accident type, 2008 6-4 CHAPTER 7 – HIGHWAY-RAIL INCIDENTS Total highway-rail incidents, by railroad, 2008 7-1 Total highway-rail incidents, by state, 2008 7-2 Total highway-rail casualties by state and age group, 2008 7-3 Total highway-rail incidents, by month, 2008 7-4 Total highway-rail incidents, by day, 2008 7-5 Total highway-rail incidents, by hour of day, 2008 7-6 Total highway-rail incidents, by type highway user, 2008 7-7 Total highway-rail incidents, by user, 2008 7-8 Total highway-rail incidents, by warning device, 2008 7-9 Total highway-rail incidents, by weather, 2008 7-10 CHAPTER 8 – HIGHWAY-RAIL INCIDENTS AT PUBLIC CROSSINGS THAT INVOLVE MOTOR VEHICLES Rates for motor vehicle incidents at public crossings, by state, 2008 8-1 Rates for motor vehicle incidents at public crossings, by warning device, 2008 8-2 Motor vehicle incidents at public crossings, by railroad and type warning, 2008 8-3 Motor vehicle incidents at public crossings, by state and type warning, 2008 8-4 Motor vehicle incidents at public crossings, by type consist and consist speed,
2008 8-5
Motor vehicle incidents at public crossings, by type warning, motorist action and warning location, 2008
8-6
Motor vehicle incidents at public crossings, by type vehicle, vehicle speed and driver gender, 2008
8-7
Motor vehicle incidents at public crossings, by vehicle speed, weather and condition of driver, 2008
8-8
Motor vehicle incidents at public crossings, by driver age, gender, and type vehicle, 2008
8-9
Motor vehicles that struck consist at public crossings, by consist length, portion of train struck and warning type, 2008
8-10
Motor vehicle incidents at public crossings, by consist length, type consist, and driver gender, 2008
8-11
Railroad Safety Statistics – Annual Report 2008 – Preliminary November 13, 2009
TITLE TABLE
Motor vehicle incidents at public crossings, by type consist, number of people
on train, and type person hurt, 2008 8-12
Motor vehicle incidents at public crossings, by type vehicle, number of occupants, and vehicle damage, 2008
8-13
Motor vehicle incidents at public crossings, by type warning, position on crossing and if hazardous material was released, 2008
8-14
Motor vehicle incidents at public crossings, by type vehicle and warning, 2008 8-15 Motor vehicle incidents at public crossings, by warning status for incidents
occurring at crossings with train activated devices, by type vehicle, 2008 8-16
CHAPTER 9 – HIGHWAY-RAIL INVENTORY At-grade highway-rail crossings, by railroad, 2008 9-1 At-grade highway-rail crossings, by state, 2008 9-2 Public at-grade crossings, by warning device and railroad, 2008 9-3 Public at grade crossings, by warning device and state, 2008 9-4 Private/pedestrian at-grade crossings, by type development and railroad, 2008 9-5 Private/pedestrian at-grade crossings, by type development and state, 2008 9-6 CHAPTER 10 – TRESPASSERS, NOT AT HIGHWAY-RAIL CROSSINGS Reportable conditions to trespassers, 2008 10-1 Trespassers killed, by railroad and age, 2008 10-2 Trespassers killed, by state and age, 2008 10-3 Trespassers injured, by railroad and age, 2008 10-4 Trespassers injured, by state and age, 2008 10-5 Trespasser casualties, by state and age group, 2008 10-6 Trespasser casualties, by month and day, 2008 10-7 Trespasser casualties, by time and day, 2008 10-8 Trespasser casualties, by location, 2008 10-9 Trespasser casualties, by event, 2008 10-10 RAILROADS WHOSE EMPLOYEES WORKED LESS THAN 400,000 HOURS
Railroad Safety Statistics – Annual Report 2008 – Preliminary November 13, 2009
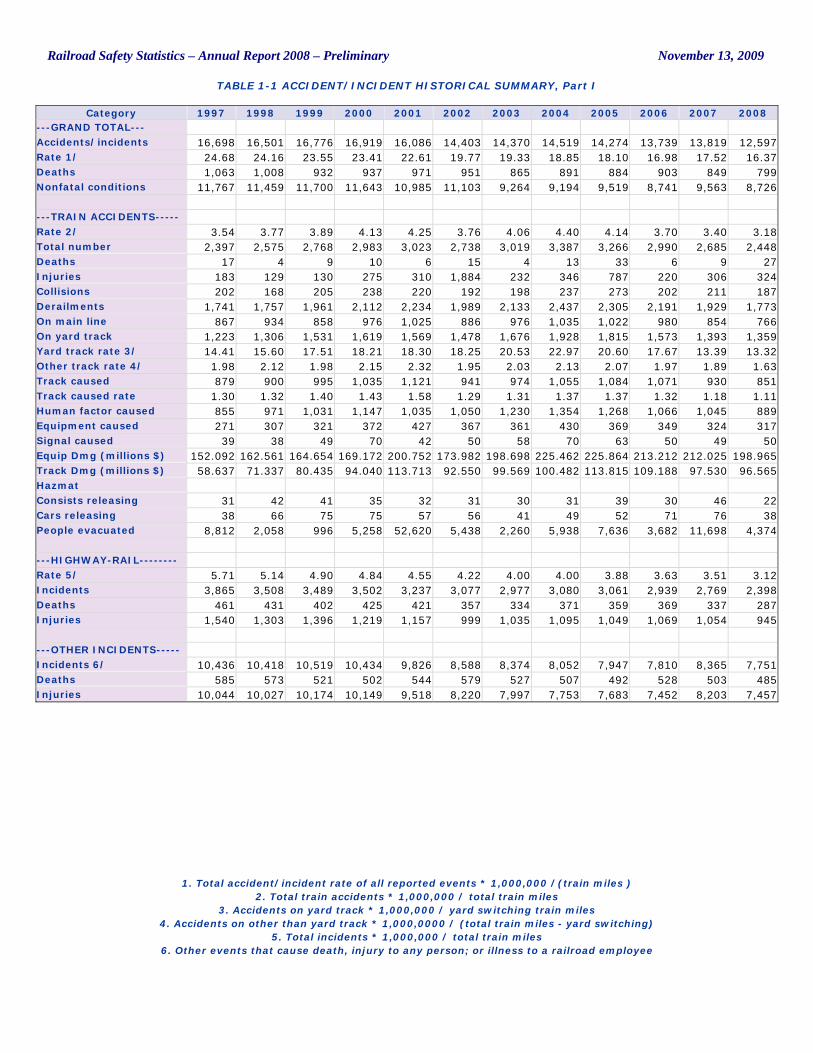
TABLE 1-1 ACCIDENT/INCIDENT HISTORICAL SUMMARY, Part I
1. Total accident/incident rate of all reported events * 1,000,000 /(train miles )
2. Total train accidents * 1,000,000 / total train miles 3. Accidents on yard track * 1,000,000 / yard switching train miles
4. Accidents on other than yard track * 1,000,0000 / (total train miles - yard switching) 5. Total incidents * 1,000,000 / total train miles
6. Other events that cause death, injury to any person; or illness to a railroad employee
Category 1997 1998 1999 2000 2001 2002 2003 2004 2005 2006 2007 2008 ---GRAND TOTAL--- Accidents/incidents 16,698 16,501 16,776 16,919 16,086 14,403 14,370 14,519 14,274 13,739 13,819 12,597 Rate 1/ 24.68 24.16 23.55 23.41 22.61 19.77 19.33 18.85 18.10 16.98 17.52 16.37 Deaths 1,063 1,008 932 937 971 951 865 891 884 903 849 799 Nonfatal conditions 11,767 11,459 11,700 11,643 10,985 11,103 9,264 9,194 9,519 8,741 9,563 8,726
---TRAIN ACCIDENTS----- Rate 2/ 3.54 3.77 3.89 4.13 4.25 3.76 4.06 4.40 4.14 3.70 3.40 3.18 Total number 2,397 2,575 2,768 2,983 3,023 2,738 3,019 3,387 3,266 2,990 2,685 2,448 Deaths 17 4 9 10 6 15 4 13 33 6 9 27 Injuries 183 129 130 275 310 1,884 232 346 787 220 306 324 Collisions 202 168 205 238 220 192 198 237 273 202 211 187 Derailments 1,741 1,757 1,961 2,112 2,234 1,989 2,133 2,437 2,305 2,191 1,929 1,773 On main line 867 934 858 976 1,025 886 976 1,035 1,022 980 854 766 On yard track 1,223 1,306 1,531 1,619 1,569 1,478 1,676 1,928 1,815 1,573 1,393 1,359 Yard track rate 3/ 14.41 15.60 17.51 18.21 18.30 18.25 20.53 22.97 20.60 17.67 13.39 13.32 Other track rate 4/ 1.98 2.12 1.98 2.15 2.32 1.95 2.03 2.13 2.07 1.97 1.89 1.63 Track caused 879 900 995 1,035 1,121 941 974 1,055 1,084 1,071 930 851 Track caused rate 1.30 1.32 1.40 1.43 1.58 1.29 1.31 1.37 1.37 1.32 1.18 1.11 Human factor caused 855 971 1,031 1,147 1,035 1,050 1,230 1,354 1,268 1,066 1,045 889 Equipment caused 271 307 321 372 427 367 361 430 369 349 324 317 Signal caused 39 38 49 70 42 50 58 70 63 50 49 50 Equip Dmg (millions $) 152.092 162.561 164.654 169.172 200.752 173.982 198.698 225.462 225.864 213.212 212.025 198.965 Track Dmg (millions $) 58.637 71.337 80.435 94.040 113.713 92.550 99.569 100.482 113.815 109.188 97.530 96.565 Hazmat Consists releasing 31 42 41 35 32 31 30 31 39 30 46 22 Cars releasing 38 66 75 75 57 56 41 49 52 71 76 38 People evacuated 8,812 2,058 996 5,258 52,620 5,438 2,260 5,938 7,636 3,682 11,698 4,374
---HIGHWAY-RAIL-------- Rate 5/ 5.71 5.14 4.90 4.84 4.55 4.22 4.00 4.00 3.88 3.63 3.51 3.12 Incidents 3,865 3,508 3,489 3,502 3,237 3,077 2,977 3,080 3,061 2,939 2,769 2,398 Deaths 461 431 402 425 421 357 334 371 359 369 337 287 Injuries 1,540 1,303 1,396 1,219 1,157 999 1,035 1,095 1,049 1,069 1,054 945
---OTHER INCIDENTS----- Incidents 6/ 10,436 10,418 10,519 10,434 9,826 8,588 8,374 8,052 7,947 7,810 8,365 7,751 Deaths 585 573 521 502 544 579 527 507 492 528 503 485 Injuries 10,044 10,027 10,174 10,149 9,518 8,220 7,997 7,753 7,683 7,452 8,203 7,457
Railroad Safety Statistics – Annual Report 2008 – Preliminary November 13, 2009
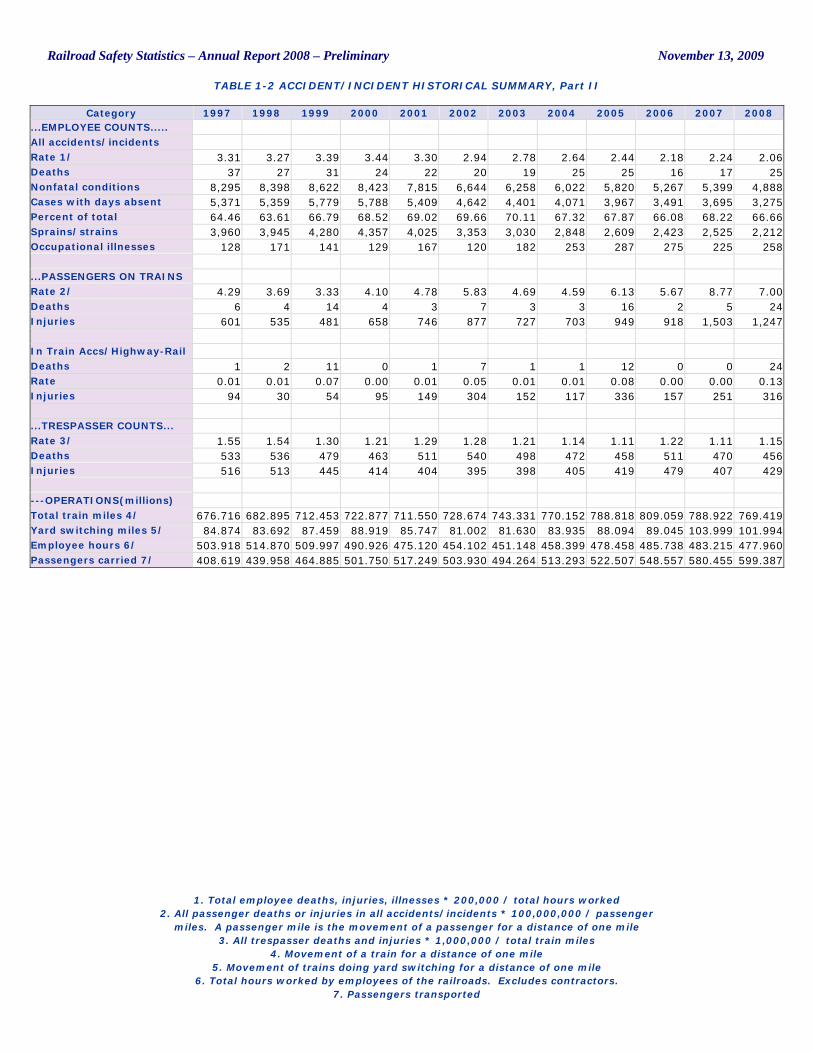
TABLE 1-2 ACCIDENT/INCIDENT HISTORICAL SUMMARY, Part II
1. Total employee deaths, injuries, illnesses * 200,000 / total hours worked
2. All passenger deaths or injuries in all accidents/incidents * 100,000,000 / passenger miles. A passenger mile is the movement of a passenger for a distance of one mile
3. All trespasser deaths and injuries * 1,000,000 / total train miles 4. Movement of a train for a distance of one mile
5. Movement of trains doing yard switching for a distance of one mile 6. Total hours worked by employees of the railroads. Excludes contractors.
7. Passengers transported
Category 1997 1998 1999 2000 2001 2002 2003 2004 2005 2006 2007 2008 ...EMPLOYEE COUNTS..... All accidents/incidents Rate 1/ 3.31 3.27 3.39 3.44 3.30 2.94 2.78 2.64 2.44 2.18 2.24 2.06 Deaths 37 27 31 24 22 20 19 25 25 16 17 25 Nonfatal conditions 8,295 8,398 8,622 8,423 7,815 6,644 6,258 6,022 5,820 5,267 5,399 4,888 Cases with days absent 5,371 5,359 5,779 5,788 5,409 4,642 4,401 4,071 3,967 3,491 3,695 3,275 Percent of total 64.46 63.61 66.79 68.52 69.02 69.66 70.11 67.32 67.87 66.08 68.22 66.66 Sprains/strains 3,960 3,945 4,280 4,357 4,025 3,353 3,030 2,848 2,609 2,423 2,525 2,212 Occupational illnesses 128 171 141 129 167 120 182 253 287 275 225 258
...PASSENGERS ON TRAINS Rate 2/ 4.29 3.69 3.33 4.10 4.78 5.83 4.69 4.59 6.13 5.67 8.77 7.00 Deaths 6 4 14 4 3 7 3 3 16 2 5 24 Injuries 601 535 481 658 746 877 727 703 949 918 1,503 1,247
In Train Accs/Highway-Rail Deaths 1 2 11 0 1 7 1 1 12 0 0 24 Rate 0.01 0.01 0.07 0.00 0.01 0.05 0.01 0.01 0.08 0.00 0.00 0.13 Injuries 94 30 54 95 149 304 152 117 336 157 251 316
...TRESPASSER COUNTS... Rate 3/ 1.55 1.54 1.30 1.21 1.29 1.28 1.21 1.14 1.11 1.22 1.11 1.15 Deaths 533 536 479 463 511 540 498 472 458 511 470 456 Injuries 516 513 445 414 404 395 398 405 419 479 407 429
---OPERATIONS(millions) Total train miles 4/ 676.716 682.895 712.453 722.877 711.550 728.674 743.331 770.152 788.818 809.059 788.922 769.419 Yard switching miles 5/ 84.874 83.692 87.459 88.919 85.747 81.002 81.630 83.935 88.094 89.045 103.999 101.994 Employee hours 6/ 503.918 514.870 509.997 490.926 475.120 454.102 451.148 458.399 478.458 485.738 483.215 477.960 Passengers carried 7/ 408.619 439.958 464.885 501.750 517.249 503.930 494.264 513.293 522.507 548.557 580.455 599.387
Railroad Safety Statistics – Annual Report 2008 – Preliminary November 13, 2009
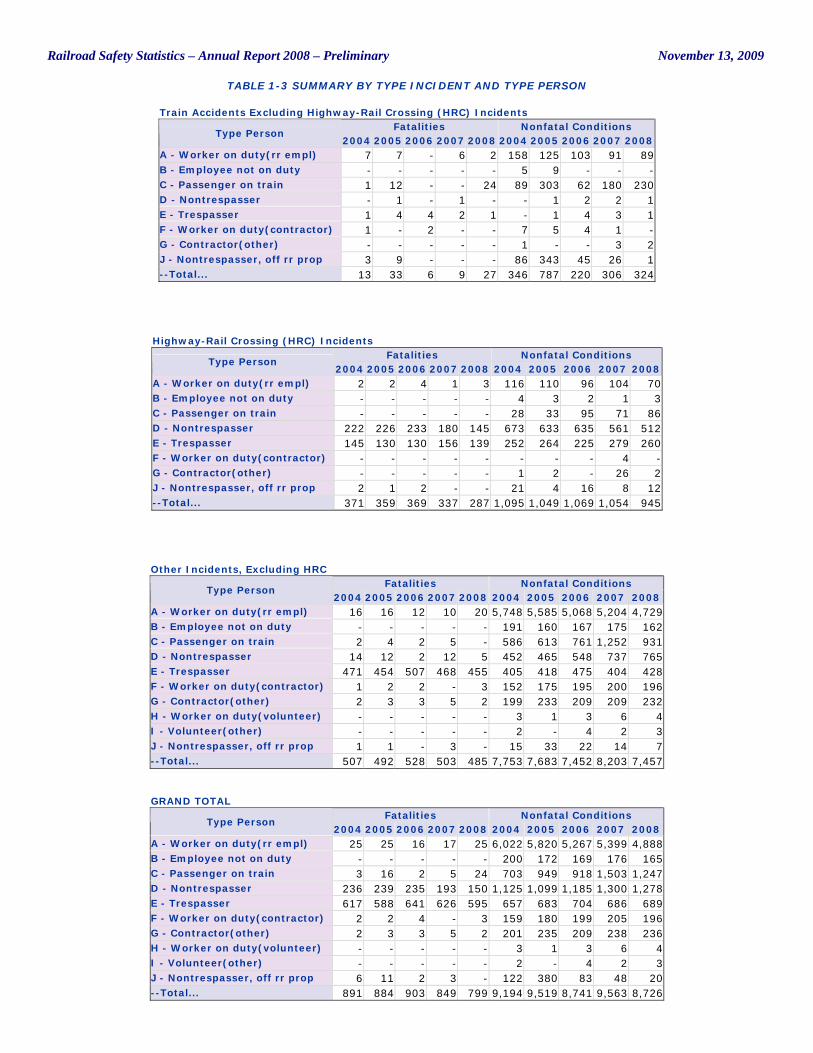
TABLE 1-3 SUMMARY BY TYPE INCIDENT AND TYPE PERSON
Train Accidents Excluding Highway-Rail Crossing (HRC) Incidents Fatalities Nonfatal Conditions
Type Person 2004 2005 2006 2007 2008 2004 2005 2006 2007 2008
A - Worker on duty(rr empl) 7 7 - 6 2 158 125 103 91 89 B - Employee not on duty - - - - - 5 9 - - - C - Passenger on train 1 12 - - 24 89 303 62 180 230 D - Nontrespasser - 1 - 1 - - 1 2 2 1 E - Trespasser 1 4 4 2 1 - 1 4 3 1 F - Worker on duty(contractor) 1 - 2 - - 7 5 4 1 - G - Contractor(other) - - - - - 1 - - 3 2 J - Nontrespasser, off rr prop 3 9 - - - 86 343 45 26 1 --Total... 13 33 6 9 27 346 787 220 306 324
Highway-Rail Crossing (HRC) Incidents Fatalities Nonfatal Conditions
Type Person 2004 2005 2006 2007 2008 2004 2005 2006 2007 2008
A - Worker on duty(rr empl) 2 2 4 1 3 116 110 96 104 70 B - Employee not on duty - - - - - 4 3 2 1 3 C - Passenger on train - - - - - 28 33 95 71 86 D - Nontrespasser 222 226 233 180 145 673 633 635 561 512 E - Trespasser 145 130 130 156 139 252 264 225 279 260 F - Worker on duty(contractor) - - - - - - - - 4 - G - Contractor(other) - - - - - 1 2 - 26 2 J - Nontrespasser, off rr prop 2 1 2 - - 21 4 16 8 12 --Total... 371 359 369 337 287 1,095 1,049 1,069 1,054 945
Other Incidents, Excluding HRC Fatalities Nonfatal Conditions
Type Person 2004 2005 2006 2007 2008 2004 2005 2006 2007 2008
A - Worker on duty(rr empl) 16 16 12 10 20 5,748 5,585 5,068 5,204 4,729 B - Employee not on duty - - - - - 191 160 167 175 162 C - Passenger on train 2 4 2 5 - 586 613 761 1,252 931 D - Nontrespasser 14 12 2 12 5 452 465 548 737 765 E - Trespasser 471 454 507 468 455 405 418 475 404 428 F - Worker on duty(contractor) 1 2 2 - 3 152 175 195 200 196 G - Contractor(other) 2 3 3 5 2 199 233 209 209 232 H - Worker on duty(volunteer) - - - - - 3 1 3 6 4 I - Volunteer(other) - - - - - 2 - 4 2 3 J - Nontrespasser, off rr prop 1 1 - 3 - 15 33 22 14 7 --Total... 507 492 528 503 485 7,753 7,683 7,452 8,203 7,457
GRAND TOTAL Fatalities Nonfatal Conditions
Type Person 2004 2005 2006 2007 2008 2004 2005 2006 2007 2008
A - Worker on duty(rr empl) 25 25 16 17 25 6,022 5,820 5,267 5,399 4,888 B - Employee not on duty - - - - - 200 172 169 176 165 C - Passenger on train 3 16 2 5 24 703 949 918 1,503 1,247 D - Nontrespasser 236 239 235 193 150 1,125 1,099 1,185 1,300 1,278 E - Trespasser 617 588 641 626 595 657 683 704 686 689 F - Worker on duty(contractor) 2 2 4 - 3 159 180 199 205 196 G - Contractor(other) 2 3 3 5 2 201 235 209 238 236 H - Worker on duty(volunteer) - - - - - 3 1 3 6 4 I - Volunteer(other) - - - - - 2 - 4 2 3 J - Nontrespasser, off rr prop 6 11 2 3 - 122 380 83 48 20 --Total... 891 884 903 849 799 9,194 9,519 8,741 9,563 8,726
Railroad Safety Statistics – Annual Report 2008 – Preliminary November 13, 2009
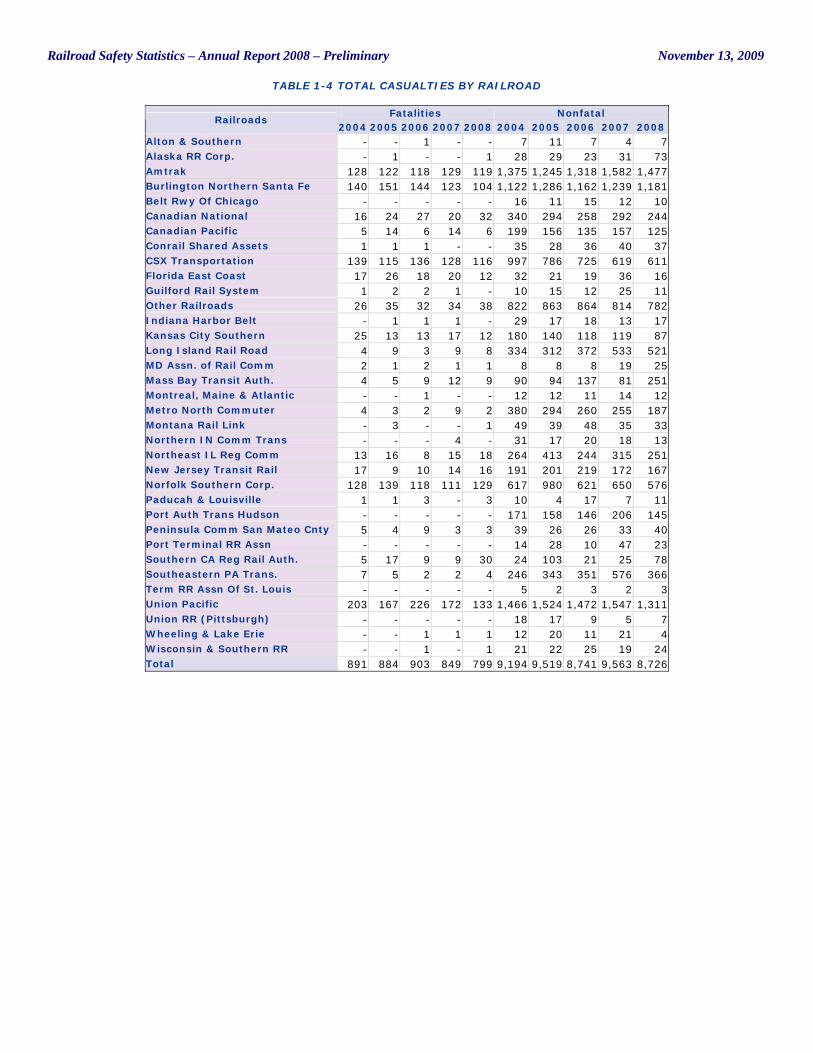
TABLE 1-4 TOTAL CASUALTIES BY RAILROAD
Fatalities Nonfatal Railroads
2004 2005 2006 2007 2008 2004 2005 2006 2007 2008 Alton & Southern - - 1 - - 7 11 7 4 7 Alaska RR Corp. - 1 - - 1 28 29 23 31 73 Amtrak 128 122 118 129 119 1,375 1,245 1,318 1,582 1,477 Burlington Northern Santa Fe 140 151 144 123 104 1,122 1,286 1,162 1,239 1,181 Belt Rwy Of Chicago - - - - - 16 11 15 12 10 Canadian National 16 24 27 20 32 340 294 258 292 244 Canadian Pacific 5 14 6 14 6 199 156 135 157 125 Conrail Shared Assets 1 1 1 - - 35 28 36 40 37 CSX Transportation 139 115 136 128 116 997 786 725 619 611 Florida East Coast 17 26 18 20 12 32 21 19 36 16 Guilford Rail System 1 2 2 1 - 10 15 12 25 11 Other Railroads 26 35 32 34 38 822 863 864 814 782 Indiana Harbor Belt - 1 1 1 - 29 17 18 13 17 Kansas City Southern 25 13 13 17 12 180 140 118 119 87 Long Island Rail Road 4 9 3 9 8 334 312 372 533 521 MD Assn. of Rail Comm 2 1 2 1 1 8 8 8 19 25 Mass Bay Transit Auth. 4 5 9 12 9 90 94 137 81 251 Montreal, Maine & Atlantic - - 1 - - 12 12 11 14 12 Metro North Commuter 4 3 2 9 2 380 294 260 255 187 Montana Rail Link - 3 - - 1 49 39 48 35 33 Northern IN Comm Trans - - - 4 - 31 17 20 18 13 Northeast IL Reg Comm 13 16 8 15 18 264 413 244 315 251 New Jersey Transit Rail 17 9 10 14 16 191 201 219 172 167 Norfolk Southern Corp. 128 139 118 111 129 617 980 621 650 576 Paducah & Louisville 1 1 3 - 3 10 4 17 7 11 Port Auth Trans Hudson - - - - - 171 158 146 206 145 Peninsula Comm San Mateo Cnty 5 4 9 3 3 39 26 26 33 40 Port Terminal RR Assn - - - - - 14 28 10 47 23 Southern CA Reg Rail Auth. 5 17 9 9 30 24 103 21 25 78 Southeastern PA Trans. 7 5 2 2 4 246 343 351 576 366 Term RR Assn Of St. Louis - - - - - 5 2 3 2 3 Union Pacific 203 167 226 172 133 1,466 1,524 1,472 1,547 1,311 Union RR (Pittsburgh) - - - - - 18 17 9 5 7 Wheeling & Lake Erie - - 1 1 1 12 20 11 21 4 Wisconsin & Southern RR - - 1 - 1 21 22 25 19 24 Total 891 884 903 849 799 9,194 9,519 8,741 9,563 8,726
Railroad Safety Statistics – Annual Report 2008 – Preliminary November 13, 2009
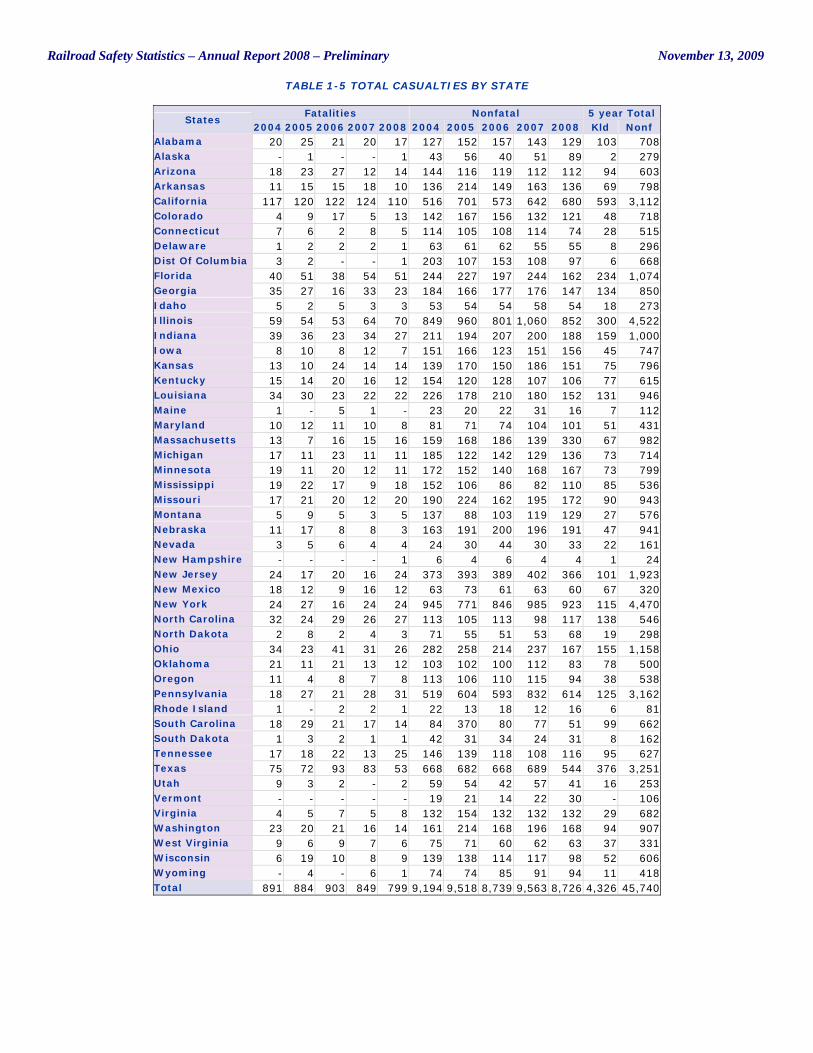
TABLE 1-5 TOTAL CASUALTIES BY STATE
Fatalities Nonfatal 5 year Total States
2004 2005 2006 2007 2008 2004 2005 2006 2007 2008 Kld Nonf Alabama 20 25 21 20 17 127 152 157 143 129 103 708 Alaska - 1 - - 1 43 56 40 51 89 2 279 Arizona 18 23 27 12 14 144 116 119 112 112 94 603 Arkansas 11 15 15 18 10 136 214 149 163 136 69 798 California 117 120 122 124 110 516 701 573 642 680 593 3,112 Colorado 4 9 17 5 13 142 167 156 132 121 48 718 Connecticut 7 6 2 8 5 114 105 108 114 74 28 515 Delaware 1 2 2 2 1 63 61 62 55 55 8 296 Dist Of Columbia 3 2 - - 1 203 107 153 108 97 6 668 Florida 40 51 38 54 51 244 227 197 244 162 234 1,074 Georgia 35 27 16 33 23 184 166 177 176 147 134 850 Idaho 5 2 5 3 3 53 54 54 58 54 18 273 Illinois 59 54 53 64 70 849 960 801 1,060 852 300 4,522 Indiana 39 36 23 34 27 211 194 207 200 188 159 1,000 Iowa 8 10 8 12 7 151 166 123 151 156 45 747 Kansas 13 10 24 14 14 139 170 150 186 151 75 796 Kentucky 15 14 20 16 12 154 120 128 107 106 77 615 Louisiana 34 30 23 22 22 226 178 210 180 152 131 946 Maine 1 - 5 1 - 23 20 22 31 16 7 112 Maryland 10 12 11 10 8 81 71 74 104 101 51 431 Massachusetts 13 7 16 15 16 159 168 186 139 330 67 982 Michigan 17 11 23 11 11 185 122 142 129 136 73 714 Minnesota 19 11 20 12 11 172 152 140 168 167 73 799 Mississippi 19 22 17 9 18 152 106 86 82 110 85 536 Missouri 17 21 20 12 20 190 224 162 195 172 90 943 Montana 5 9 5 3 5 137 88 103 119 129 27 576 Nebraska 11 17 8 8 3 163 191 200 196 191 47 941 Nevada 3 5 6 4 4 24 30 44 30 33 22 161 New Hampshire - - - - 1 6 4 6 4 4 1 24 New Jersey 24 17 20 16 24 373 393 389 402 366 101 1,923 New Mexico 18 12 9 16 12 63 73 61 63 60 67 320 New York 24 27 16 24 24 945 771 846 985 923 115 4,470 North Carolina 32 24 29 26 27 113 105 113 98 117 138 546 North Dakota 2 8 2 4 3 71 55 51 53 68 19 298 Ohio 34 23 41 31 26 282 258 214 237 167 155 1,158 Oklahoma 21 11 21 13 12 103 102 100 112 83 78 500 Oregon 11 4 8 7 8 113 106 110 115 94 38 538 Pennsylvania 18 27 21 28 31 519 604 593 832 614 125 3,162 Rhode Island 1 - 2 2 1 22 13 18 12 16 6 81 South Carolina 18 29 21 17 14 84 370 80 77 51 99 662 South Dakota 1 3 2 1 1 42 31 34 24 31 8 162 Tennessee 17 18 22 13 25 146 139 118 108 116 95 627 Texas 75 72 93 83 53 668 682 668 689 544 376 3,251 Utah 9 3 2 - 2 59 54 42 57 41 16 253 Vermont - - - - - 19 21 14 22 30 - 106 Virginia 4 5 7 5 8 132 154 132 132 132 29 682 Washington 23 20 21 16 14 161 214 168 196 168 94 907 West Virginia 9 6 9 7 6 75 71 60 62 63 37 331 Wisconsin 6 19 10 8 9 139 138 114 117 98 52 606 Wyoming - 4 - 6 1 74 74 85 91 94 11 418 Total 891 884 903 849 799 9,194 9,518 8,739 9,563 8,726 4,326 45,740
Railroad Safety Statistics – Annual Report 2008 – Preliminary November 13, 2009
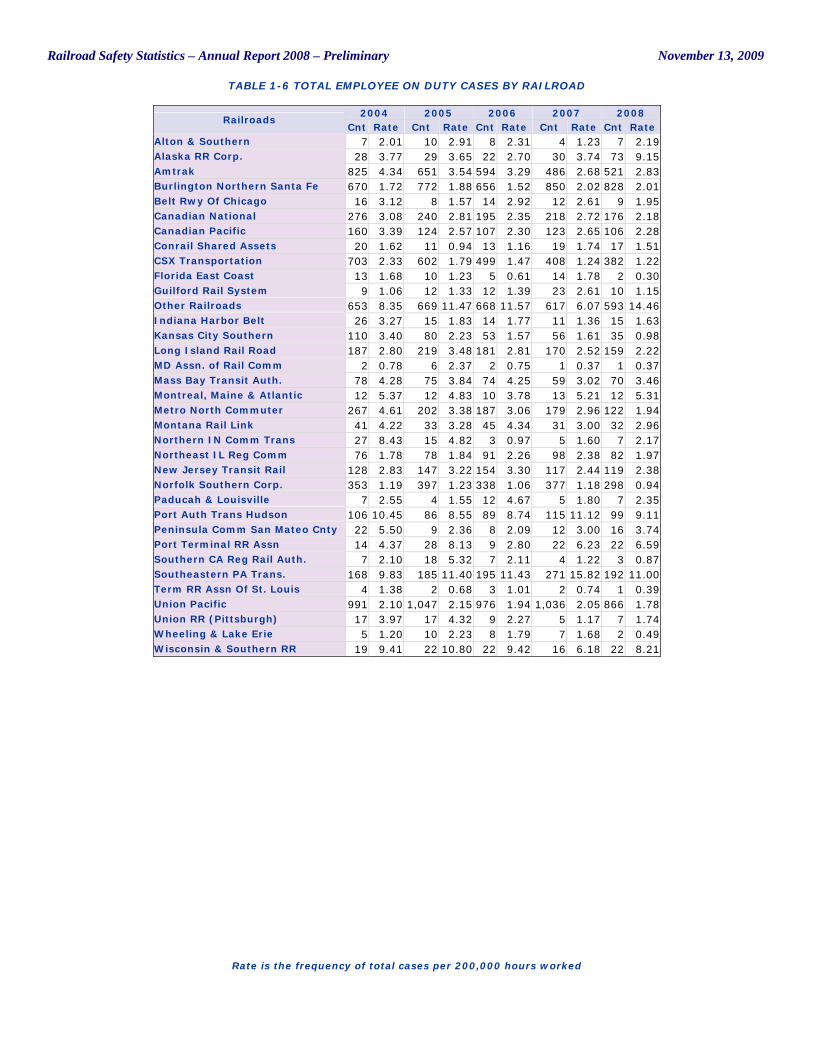
TABLE 1-6 TOTAL EMPLOYEE ON DUTY CASES BY RAILROAD
Rate is the frequency of total cases per 200,000 hours worked
2004 2005 2006 2007 2008 Railroads
Cnt Rate Cnt Rate Cnt Rate Cnt Rate Cnt Rate Alton & Southern 7 2.01 10 2.91 8 2.31 4 1.23 7 2.19 Alaska RR Corp. 28 3.77 29 3.65 22 2.70 30 3.74 73 9.15 Amtrak 825 4.34 651 3.54 594 3.29 486 2.68 521 2.83 Burlington Northern Santa Fe 670 1.72 772 1.88 656 1.52 850 2.02 828 2.01 Belt Rwy Of Chicago 16 3.12 8 1.57 14 2.92 12 2.61 9 1.95 Canadian National 276 3.08 240 2.81 195 2.35 218 2.72 176 2.18 Canadian Pacific 160 3.39 124 2.57 107 2.30 123 2.65 106 2.28 Conrail Shared Assets 20 1.62 11 0.94 13 1.16 19 1.74 17 1.51 CSX Transportation 703 2.33 602 1.79 499 1.47 408 1.24 382 1.22 Florida East Coast 13 1.68 10 1.23 5 0.61 14 1.78 2 0.30 Guilford Rail System 9 1.06 12 1.33 12 1.39 23 2.61 10 1.15 Other Railroads 653 8.35 669 11.47 668 11.57 617 6.07 593 14.46 Indiana Harbor Belt 26 3.27 15 1.83 14 1.77 11 1.36 15 1.63 Kansas City Southern 110 3.40 80 2.23 53 1.57 56 1.61 35 0.98 Long Island Rail Road 187 2.80 219 3.48 181 2.81 170 2.52 159 2.22 MD Assn. of Rail Comm 2 0.78 6 2.37 2 0.75 1 0.37 1 0.37 Mass Bay Transit Auth. 78 4.28 75 3.84 74 4.25 59 3.02 70 3.46 Montreal, Maine & Atlantic 12 5.37 12 4.83 10 3.78 13 5.21 12 5.31 Metro North Commuter 267 4.61 202 3.38 187 3.06 179 2.96 122 1.94 Montana Rail Link 41 4.22 33 3.28 45 4.34 31 3.00 32 2.96 Northern IN Comm Trans 27 8.43 15 4.82 3 0.97 5 1.60 7 2.17 Northeast IL Reg Comm 76 1.78 78 1.84 91 2.26 98 2.38 82 1.97 New Jersey Transit Rail 128 2.83 147 3.22 154 3.30 117 2.44 119 2.38 Norfolk Southern Corp. 353 1.19 397 1.23 338 1.06 377 1.18 298 0.94 Paducah & Louisville 7 2.55 4 1.55 12 4.67 5 1.80 7 2.35 Port Auth Trans Hudson 106 10.45 86 8.55 89 8.74 115 11.12 99 9.11 Peninsula Comm San Mateo Cnty 22 5.50 9 2.36 8 2.09 12 3.00 16 3.74 Port Terminal RR Assn 14 4.37 28 8.13 9 2.80 22 6.23 22 6.59 Southern CA Reg Rail Auth. 7 2.10 18 5.32 7 2.11 4 1.22 3 0.87 Southeastern PA Trans. 168 9.83 185 11.40 195 11.43 271 15.82 192 11.00 Term RR Assn Of St. Louis 4 1.38 2 0.68 3 1.01 2 0.74 1 0.39 Union Pacific 991 2.10 1,047 2.15 976 1.94 1,036 2.05 866 1.78 Union RR (Pittsburgh) 17 3.97 17 4.32 9 2.27 5 1.17 7 1.74 Wheeling & Lake Erie 5 1.20 10 2.23 8 1.79 7 1.68 2 0.49 Wisconsin & Southern RR 19 9.41 22 10.80 22 9.42 16 6.18 22 8.21

Railroad Safety Statistics – Annual Report 2008 – Preliminary November 13, 2009
TABLE 1-7 TRAIN ACCIDENTS BY RAILROAD, EXCLUDING HRC
Rate is the frequency of accidents per 1,000,000 train miles
2004 2005 2006 2007 2008 Railroads
Cnt Rate Cnt Rate Cnt Rate Cnt Rate Cnt Rate Alton & Southern 16 15.78 18 17.15 11 10.71 13 13.42 10 10.22 Alaska RR Corp. 1 0.61 2 1.15 1 0.65 1 0.66 2 1.39 Amtrak 111 2.83 112 2.96 103 2.70 84 2.12 92 2.31 Burlington Northern Santa Fe 672 3.60 676 3.49 657 3.28 625 3.29 583 3.13 Belt Rwy Of Chicago 27 49.49 23 44.39 20 39.95 14 28.91 13 27.44 Canadian National 111 4.74 83 3.63 108 4.85 110 5.20 93 4.51 Canadian Pacific 124 8.17 94 6.28 56 3.68 61 4.12 59 4.11 Conrail Shared Assets 35 11.15 42 13.62 29 9.76 40 13.29 25 8.32 CSX Transportation 536 4.86 489 4.51 390 3.60 332 3.05 305 2.88 Florida East Coast 11 4.63 15 5.81 12 4.52 11 4.65 2 0.88 Guilford Rail System 5 3.41 6 4.22 10 6.87 3 1.88 4 2.73 Other Railroads 359 47.24 362 34.07 392 39.04 367 20.30 312 35.96 Indiana Harbor Belt 30 20.44 19 12.69 14 9.69 12 8.07 13 8.87 Kansas City Southern 133 15.35 124 14.19 85 7.32 90 7.90 68 5.99 Long Island Rail Road 13 1.60 12 1.46 9 1.07 5 0.59 13 1.51 MD Assn. of Rail Comm 4 3.27 2 1.66 3 2.51 - - 3 2.50 Mass Bay Transit Auth. 1 0.26 - - 1 0.25 4 0.99 3 0.71 Montreal, Maine & Atlantic 8 16.79 3 6.09 6 13.95 7 16.32 5 12.99 Metro North Commuter 56 6.31 40 4.46 52 5.60 39 4.09 23 2.36 Montana Rail Link 14 3.72 15 3.90 22 5.37 11 2.77 27 6.72 Northern IN Comm Trans 1 1.31 - - 2 2.65 3 3.92 2 2.61 Northeast IL Reg Comm 6 0.65 6 0.65 4 0.42 10 1.04 6 0.63 New Jersey Transit Rail 48 5.44 30 3.17 34 3.57 38 3.80 29 2.71 Norfolk Southern Corp. 325 3.35 333 3.27 258 2.45 249 2.43 253 2.50 Paducah & Louisville 5 8.86 2 3.47 5 8.52 5 8.21 7 11.22 Port Auth Trans Hudson 2 0.95 3 1.38 1 0.47 7 3.45 2 0.99 Peninsula Comm San Mateo Cnty 2 1.62 3 2.17 3 2.11 2 1.40 1 0.69 Port Terminal RR Assn 14 11.32 5 3.91 7 5.47 8 6.25 3 2.34 Southern CA Reg Rail Auth. 2 0.94 8 4.05 2 0.87 - - 5 2.04 Southeastern PA Trans. 10 1.98 9 1.76 9 1.72 17 3.28 7 1.34 Term RR Assn Of St. Louis 9 14.30 17 23.94 14 20.37 8 12.23 6 9.75 Union Pacific 962 4.98 954 4.79 891 4.38 723 3.72 634 3.48 Union RR (Pittsburgh) 6 48.04 3 24.46 5 39.31 2 14.73 - - Wheeling & Lake Erie 3 3.03 14 11.95 16 12.19 12 9.39 15 14.31 Wisconsin & Southern RR 2 6.64 4 13.37 5 15.28 10 27.45 5 12.94
Railroad Safety Statistics – Annual Report 2008 – Preliminary November 13, 2009
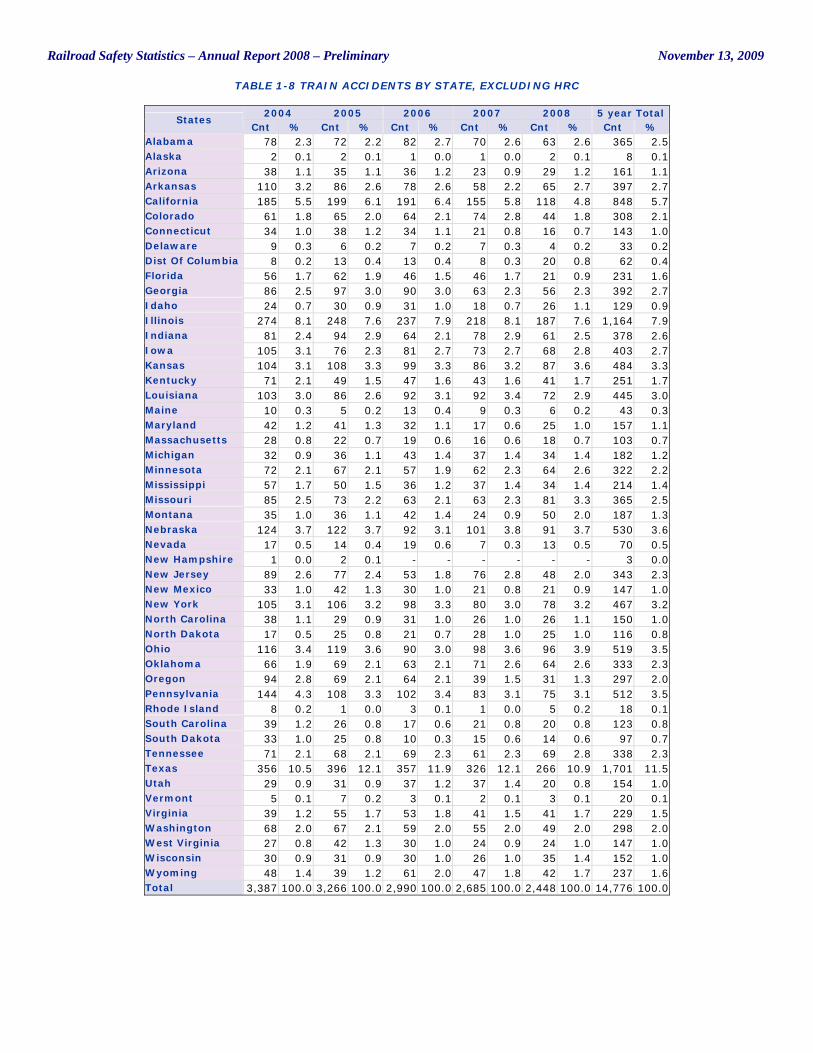
TABLE 1-8 TRAIN ACCIDENTS BY STATE, EXCLUDING HRC
2004 2005 2006 2007 2008 5 year Total States
Cnt % Cnt % Cnt % Cnt % Cnt % Cnt % Alabama 78 2.3 72 2.2 82 2.7 70 2.6 63 2.6 365 2.5 Alaska 2 0.1 2 0.1 1 0.0 1 0.0 2 0.1 8 0.1 Arizona 38 1.1 35 1.1 36 1.2 23 0.9 29 1.2 161 1.1 Arkansas 110 3.2 86 2.6 78 2.6 58 2.2 65 2.7 397 2.7 California 185 5.5 199 6.1 191 6.4 155 5.8 118 4.8 848 5.7 Colorado 61 1.8 65 2.0 64 2.1 74 2.8 44 1.8 308 2.1 Connecticut 34 1.0 38 1.2 34 1.1 21 0.8 16 0.7 143 1.0 Delaware 9 0.3 6 0.2 7 0.2 7 0.3 4 0.2 33 0.2 Dist Of Columbia 8 0.2 13 0.4 13 0.4 8 0.3 20 0.8 62 0.4 Florida 56 1.7 62 1.9 46 1.5 46 1.7 21 0.9 231 1.6 Georgia 86 2.5 97 3.0 90 3.0 63 2.3 56 2.3 392 2.7 Idaho 24 0.7 30 0.9 31 1.0 18 0.7 26 1.1 129 0.9 Illinois 274 8.1 248 7.6 237 7.9 218 8.1 187 7.6 1,164 7.9 Indiana 81 2.4 94 2.9 64 2.1 78 2.9 61 2.5 378 2.6 Iowa 105 3.1 76 2.3 81 2.7 73 2.7 68 2.8 403 2.7 Kansas 104 3.1 108 3.3 99 3.3 86 3.2 87 3.6 484 3.3 Kentucky 71 2.1 49 1.5 47 1.6 43 1.6 41 1.7 251 1.7 Louisiana 103 3.0 86 2.6 92 3.1 92 3.4 72 2.9 445 3.0 Maine 10 0.3 5 0.2 13 0.4 9 0.3 6 0.2 43 0.3 Maryland 42 1.2 41 1.3 32 1.1 17 0.6 25 1.0 157 1.1 Massachusetts 28 0.8 22 0.7 19 0.6 16 0.6 18 0.7 103 0.7 Michigan 32 0.9 36 1.1 43 1.4 37 1.4 34 1.4 182 1.2 Minnesota 72 2.1 67 2.1 57 1.9 62 2.3 64 2.6 322 2.2 Mississippi 57 1.7 50 1.5 36 1.2 37 1.4 34 1.4 214 1.4 Missouri 85 2.5 73 2.2 63 2.1 63 2.3 81 3.3 365 2.5 Montana 35 1.0 36 1.1 42 1.4 24 0.9 50 2.0 187 1.3 Nebraska 124 3.7 122 3.7 92 3.1 101 3.8 91 3.7 530 3.6 Nevada 17 0.5 14 0.4 19 0.6 7 0.3 13 0.5 70 0.5 New Hampshire 1 0.0 2 0.1 - - - - - - 3 0.0 New Jersey 89 2.6 77 2.4 53 1.8 76 2.8 48 2.0 343 2.3 New Mexico 33 1.0 42 1.3 30 1.0 21 0.8 21 0.9 147 1.0 New York 105 3.1 106 3.2 98 3.3 80 3.0 78 3.2 467 3.2 North Carolina 38 1.1 29 0.9 31 1.0 26 1.0 26 1.1 150 1.0 North Dakota 17 0.5 25 0.8 21 0.7 28 1.0 25 1.0 116 0.8 Ohio 116 3.4 119 3.6 90 3.0 98 3.6 96 3.9 519 3.5 Oklahoma 66 1.9 69 2.1 63 2.1 71 2.6 64 2.6 333 2.3 Oregon 94 2.8 69 2.1 64 2.1 39 1.5 31 1.3 297 2.0 Pennsylvania 144 4.3 108 3.3 102 3.4 83 3.1 75 3.1 512 3.5 Rhode Island 8 0.2 1 0.0 3 0.1 1 0.0 5 0.2 18 0.1 South Carolina 39 1.2 26 0.8 17 0.6 21 0.8 20 0.8 123 0.8 South Dakota 33 1.0 25 0.8 10 0.3 15 0.6 14 0.6 97 0.7 Tennessee 71 2.1 68 2.1 69 2.3 61 2.3 69 2.8 338 2.3 Texas 356 10.5 396 12.1 357 11.9 326 12.1 266 10.9 1,701 11.5 Utah 29 0.9 31 0.9 37 1.2 37 1.4 20 0.8 154 1.0 Vermont 5 0.1 7 0.2 3 0.1 2 0.1 3 0.1 20 0.1 Virginia 39 1.2 55 1.7 53 1.8 41 1.5 41 1.7 229 1.5 Washington 68 2.0 67 2.1 59 2.0 55 2.0 49 2.0 298 2.0 West Virginia 27 0.8 42 1.3 30 1.0 24 0.9 24 1.0 147 1.0 Wisconsin 30 0.9 31 0.9 30 1.0 26 1.0 35 1.4 152 1.0 Wyoming 48 1.4 39 1.2 61 2.0 47 1.8 42 1.7 237 1.6 Total 3,387 100.0 3,266 100.0 2,990 100.0 2,685 100.0 2,448 100.0 14,776 100.0
Railroad Safety Statistics – Annual Report 2008 – Preliminary November 13, 2009
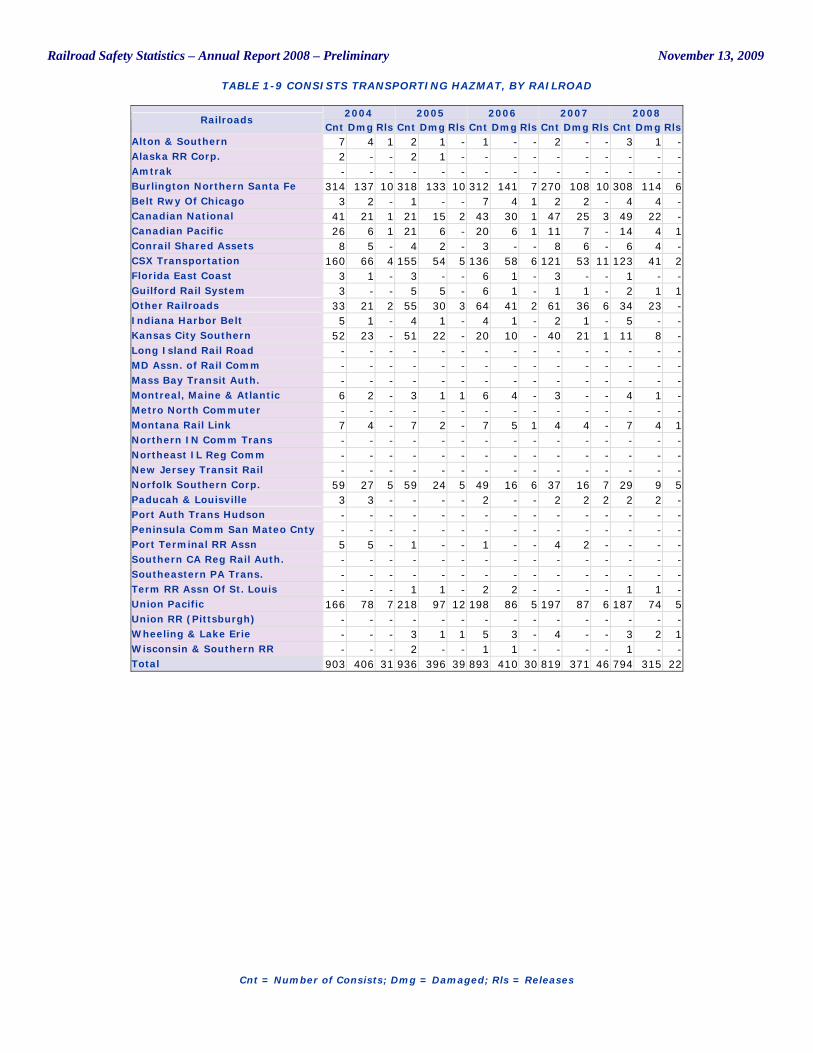
TABLE 1-9 CONSISTS TRANSPORTING HAZMAT, BY RAILROAD
Cnt = Number of Consists; Dmg = Damaged; Rls = Releases
2004 2005 2006 2007 2008 Railroads
Cnt Dmg Rls Cnt Dmg Rls Cnt Dmg Rls Cnt Dmg Rls Cnt Dmg Rls Alton & Southern 7 4 1 2 1 - 1 - - 2 - - 3 1 - Alaska RR Corp. 2 - - 2 1 - - - - - - - - - - Amtrak - - - - - - - - - - - - - - - Burlington Northern Santa Fe 314 137 10 318 133 10 312 141 7 270 108 10 308 114 6 Belt Rwy Of Chicago 3 2 - 1 - - 7 4 1 2 2 - 4 4 - Canadian National 41 21 1 21 15 2 43 30 1 47 25 3 49 22 - Canadian Pacific 26 6 1 21 6 - 20 6 1 11 7 - 14 4 1 Conrail Shared Assets 8 5 - 4 2 - 3 - - 8 6 - 6 4 - CSX Transportation 160 66 4 155 54 5 136 58 6 121 53 11 123 41 2 Florida East Coast 3 1 - 3 - - 6 1 - 3 - - 1 - - Guilford Rail System 3 - - 5 5 - 6 1 - 1 1 - 2 1 1 Other Railroads 33 21 2 55 30 3 64 41 2 61 36 6 34 23 - Indiana Harbor Belt 5 1 - 4 1 - 4 1 - 2 1 - 5 - - Kansas City Southern 52 23 - 51 22 - 20 10 - 40 21 1 11 8 - Long Island Rail Road - - - - - - - - - - - - - - - MD Assn. of Rail Comm - - - - - - - - - - - - - - - Mass Bay Transit Auth. - - - - - - - - - - - - - - - Montreal, Maine & Atlantic 6 2 - 3 1 1 6 4 - 3 - - 4 1 - Metro North Commuter - - - - - - - - - - - - - - - Montana Rail Link 7 4 - 7 2 - 7 5 1 4 4 - 7 4 1 Northern IN Comm Trans - - - - - - - - - - - - - - - Northeast IL Reg Comm - - - - - - - - - - - - - - - New Jersey Transit Rail - - - - - - - - - - - - - - - Norfolk Southern Corp. 59 27 5 59 24 5 49 16 6 37 16 7 29 9 5 Paducah & Louisville 3 3 - - - - 2 - - 2 2 2 2 2 - Port Auth Trans Hudson - - - - - - - - - - - - - - - Peninsula Comm San Mateo Cnty - - - - - - - - - - - - - - - Port Terminal RR Assn 5 5 - 1 - - 1 - - 4 2 - - - - Southern CA Reg Rail Auth. - - - - - - - - - - - - - - - Southeastern PA Trans. - - - - - - - - - - - - - - - Term RR Assn Of St. Louis - - - 1 1 - 2 2 - - - - 1 1 - Union Pacific 166 78 7 218 97 12 198 86 5 197 87 6 187 74 5 Union RR (Pittsburgh) - - - - - - - - - - - - - - - Wheeling & Lake Erie - - - 3 1 1 5 3 - 4 - - 3 2 1 Wisconsin & Southern RR - - - 2 - - 1 1 - - - - 1 - - Total 903 406 31 936 396 39 893 410 30 819 371 46 794 315 22
Railroad Safety Statistics – Annual Report 2008 – Preliminary November 13, 2009
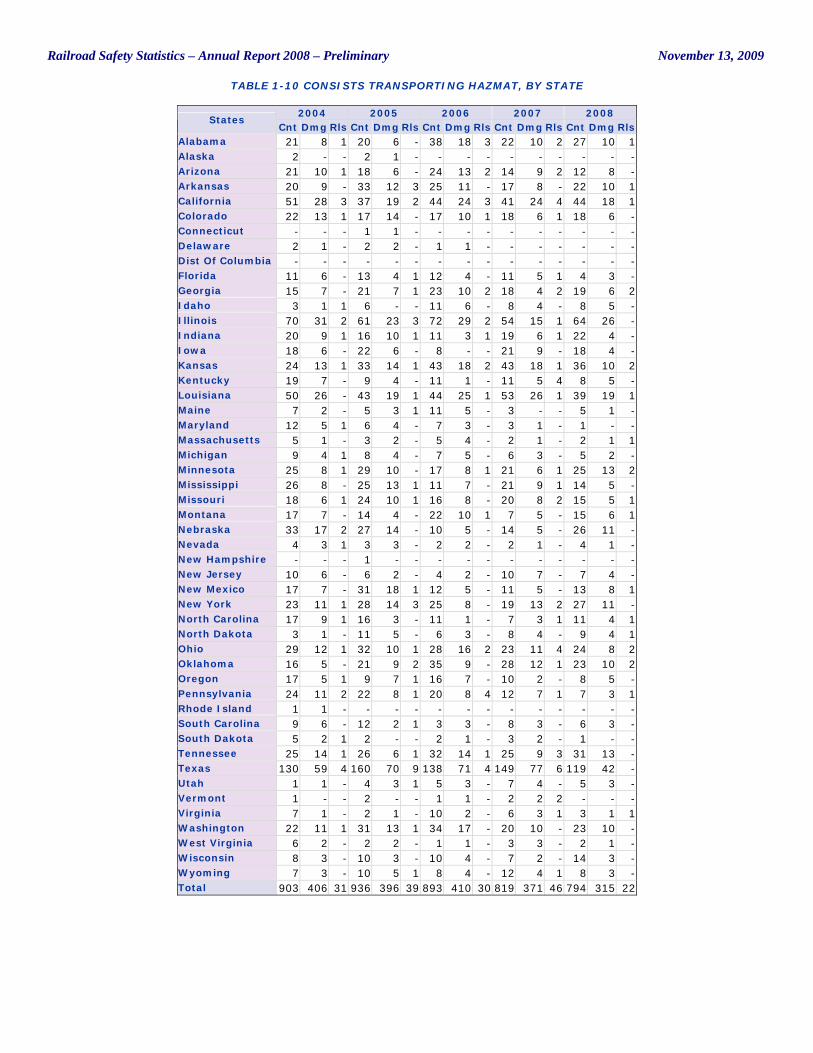
TABLE 1-10 CONSISTS TRANSPORTING HAZMAT, BY STATE
2004 2005 2006 2007 2008 States
Cnt Dmg Rls Cnt Dmg Rls Cnt Dmg Rls Cnt Dmg Rls Cnt Dmg Rls Alabama 21 8 1 20 6 - 38 18 3 22 10 2 27 10 1 Alaska 2 - - 2 1 - - - - - - - - - - Arizona 21 10 1 18 6 - 24 13 2 14 9 2 12 8 - Arkansas 20 9 - 33 12 3 25 11 - 17 8 - 22 10 1 California 51 28 3 37 19 2 44 24 3 41 24 4 44 18 1 Colorado 22 13 1 17 14 - 17 10 1 18 6 1 18 6 - Connecticut - - - 1 1 - - - - - - - - - - Delaware 2 1 - 2 2 - 1 1 - - - - - - - Dist Of Columbia - - - - - - - - - - - - - - - Florida 11 6 - 13 4 1 12 4 - 11 5 1 4 3 - Georgia 15 7 - 21 7 1 23 10 2 18 4 2 19 6 2 Idaho 3 1 1 6 - - 11 6 - 8 4 - 8 5 - Illinois 70 31 2 61 23 3 72 29 2 54 15 1 64 26 - Indiana 20 9 1 16 10 1 11 3 1 19 6 1 22 4 - Iowa 18 6 - 22 6 - 8 - - 21 9 - 18 4 - Kansas 24 13 1 33 14 1 43 18 2 43 18 1 36 10 2 Kentucky 19 7 - 9 4 - 11 1 - 11 5 4 8 5 - Louisiana 50 26 - 43 19 1 44 25 1 53 26 1 39 19 1 Maine 7 2 - 5 3 1 11 5 - 3 - - 5 1 - Maryland 12 5 1 6 4 - 7 3 - 3 1 - 1 - - Massachusetts 5 1 - 3 2 - 5 4 - 2 1 - 2 1 1 Michigan 9 4 1 8 4 - 7 5 - 6 3 - 5 2 - Minnesota 25 8 1 29 10 - 17 8 1 21 6 1 25 13 2 Mississippi 26 8 - 25 13 1 11 7 - 21 9 1 14 5 - Missouri 18 6 1 24 10 1 16 8 - 20 8 2 15 5 1 Montana 17 7 - 14 4 - 22 10 1 7 5 - 15 6 1 Nebraska 33 17 2 27 14 - 10 5 - 14 5 - 26 11 - Nevada 4 3 1 3 3 - 2 2 - 2 1 - 4 1 - New Hampshire - - - 1 - - - - - - - - - - - New Jersey 10 6 - 6 2 - 4 2 - 10 7 - 7 4 - New Mexico 17 7 - 31 18 1 12 5 - 11 5 - 13 8 1 New York 23 11 1 28 14 3 25 8 - 19 13 2 27 11 - North Carolina 17 9 1 16 3 - 11 1 - 7 3 1 11 4 1 North Dakota 3 1 - 11 5 - 6 3 - 8 4 - 9 4 1 Ohio 29 12 1 32 10 1 28 16 2 23 11 4 24 8 2 Oklahoma 16 5 - 21 9 2 35 9 - 28 12 1 23 10 2 Oregon 17 5 1 9 7 1 16 7 - 10 2 - 8 5 - Pennsylvania 24 11 2 22 8 1 20 8 4 12 7 1 7 3 1 Rhode Island 1 1 - - - - - - - - - - - - - South Carolina 9 6 - 12 2 1 3 3 - 8 3 - 6 3 - South Dakota 5 2 1 2 - - 2 1 - 3 2 - 1 - - Tennessee 25 14 1 26 6 1 32 14 1 25 9 3 31 13 - Texas 130 59 4 160 70 9 138 71 4 149 77 6 119 42 - Utah 1 1 - 4 3 1 5 3 - 7 4 - 5 3 - Vermont 1 - - 2 - - 1 1 - 2 2 2 - - - Virginia 7 1 - 2 1 - 10 2 - 6 3 1 3 1 1 Washington 22 11 1 31 13 1 34 17 - 20 10 - 23 10 - West Virginia 6 2 - 2 2 - 1 1 - 3 3 - 2 1 - Wisconsin 8 3 - 10 3 - 10 4 - 7 2 - 14 3 - Wyoming 7 3 - 10 5 1 8 4 - 12 4 1 8 3 - Total 903 406 31 936 396 39 893 410 30 819 371 46 794 315 22
Railroad Safety Statistics – Annual Report 2008 – Preliminary November 13, 2009
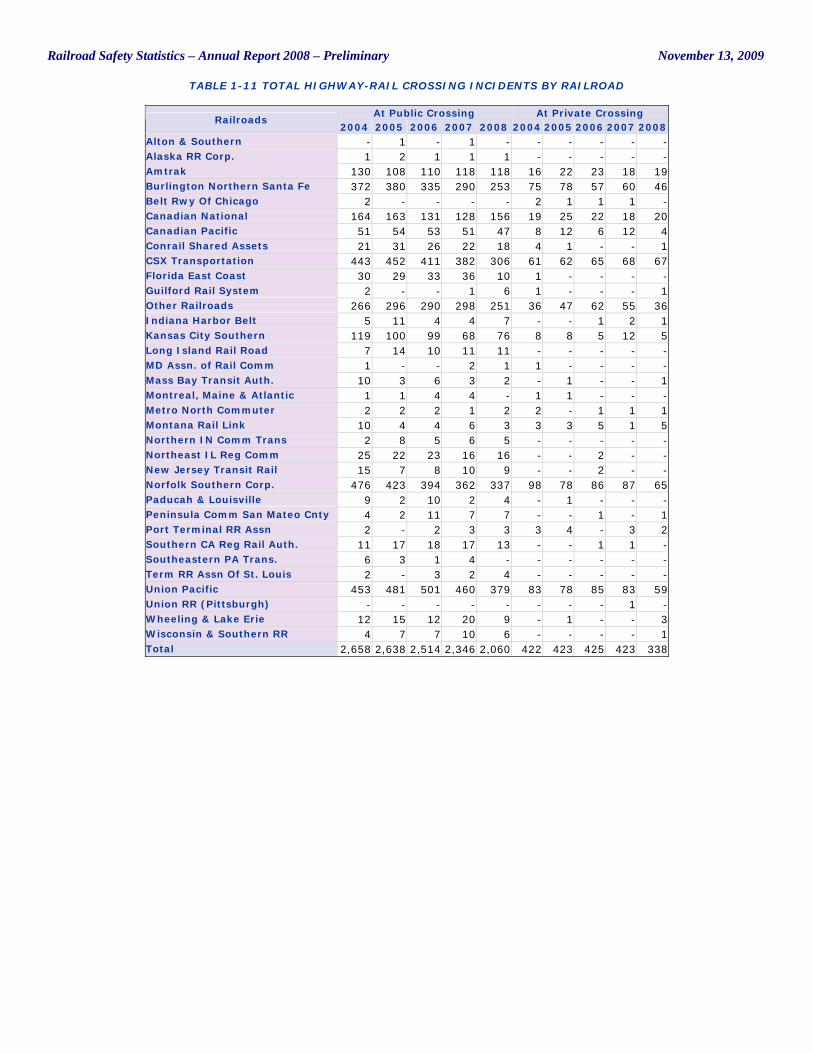
TABLE 1-11 TOTAL HIGHWAY-RAIL CROSSING INCIDENTS BY RAILROAD
At Public Crossing At Private Crossing Railroads
2004 2005 2006 2007 2008 2004 2005 2006 2007 2008 Alton & Southern - 1 - 1 - - - - - - Alaska RR Corp. 1 2 1 1 1 - - - - - Amtrak 130 108 110 118 118 16 22 23 18 19 Burlington Northern Santa Fe 372 380 335 290 253 75 78 57 60 46 Belt Rwy Of Chicago 2 - - - - 2 1 1 1 - Canadian National 164 163 131 128 156 19 25 22 18 20 Canadian Pacific 51 54 53 51 47 8 12 6 12 4 Conrail Shared Assets 21 31 26 22 18 4 1 - - 1 CSX Transportation 443 452 411 382 306 61 62 65 68 67 Florida East Coast 30 29 33 36 10 1 - - - - Guilford Rail System 2 - - 1 6 1 - - - 1 Other Railroads 266 296 290 298 251 36 47 62 55 36 Indiana Harbor Belt 5 11 4 4 7 - - 1 2 1 Kansas City Southern 119 100 99 68 76 8 8 5 12 5 Long Island Rail Road 7 14 10 11 11 - - - - - MD Assn. of Rail Comm 1 - - 2 1 1 - - - - Mass Bay Transit Auth. 10 3 6 3 2 - 1 - - 1 Montreal, Maine & Atlantic 1 1 4 4 - 1 1 - - - Metro North Commuter 2 2 2 1 2 2 - 1 1 1 Montana Rail Link 10 4 4 6 3 3 3 5 1 5 Northern IN Comm Trans 2 8 5 6 5 - - - - - Northeast IL Reg Comm 25 22 23 16 16 - - 2 - - New Jersey Transit Rail 15 7 8 10 9 - - 2 - - Norfolk Southern Corp. 476 423 394 362 337 98 78 86 87 65 Paducah & Louisville 9 2 10 2 4 - 1 - - - Peninsula Comm San Mateo Cnty 4 2 11 7 7 - - 1 - 1 Port Terminal RR Assn 2 - 2 3 3 3 4 - 3 2 Southern CA Reg Rail Auth. 11 17 18 17 13 - - 1 1 - Southeastern PA Trans. 6 3 1 4 - - - - - - Term RR Assn Of St. Louis 2 - 3 2 4 - - - - - Union Pacific 453 481 501 460 379 83 78 85 83 59 Union RR (Pittsburgh) - - - - - - - - 1 - Wheeling & Lake Erie 12 15 12 20 9 - 1 - - 3 Wisconsin & Southern RR 4 7 7 10 6 - - - - 1 Total 2,658 2,638 2,514 2,346 2,060 422 423 425 423 338
Railroad Safety Statistics – Annual Report 2008 – Preliminary November 13, 2009
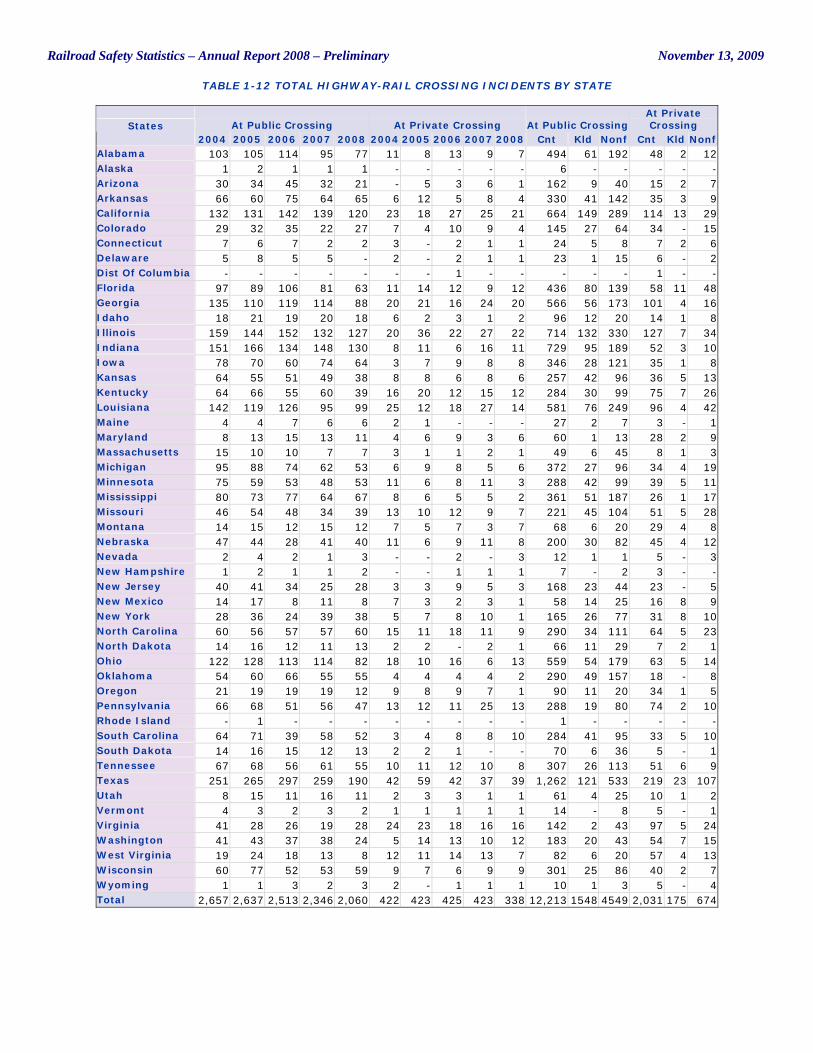
TABLE 1-12 TOTAL HIGHWAY-RAIL CROSSING INCIDENTS BY STATE
At Public Crossing At Private Crossing At Public Crossing At Private Crossing States
2004 2005 2006 2007 2008 2004 2005 2006 2007 2008 Cnt Kld Nonf Cnt Kld Nonf Alabama 103 105 114 95 77 11 8 13 9 7 494 61 192 48 2 12 Alaska 1 2 1 1 1 - - - - - 6 - - - - - Arizona 30 34 45 32 21 - 5 3 6 1 162 9 40 15 2 7 Arkansas 66 60 75 64 65 6 12 5 8 4 330 41 142 35 3 9 California 132 131 142 139 120 23 18 27 25 21 664 149 289 114 13 29 Colorado 29 32 35 22 27 7 4 10 9 4 145 27 64 34 - 15 Connecticut 7 6 7 2 2 3 - 2 1 1 24 5 8 7 2 6 Delaware 5 8 5 5 - 2 - 2 1 1 23 1 15 6 - 2 Dist Of Columbia - - - - - - - 1 - - - - - 1 - - Florida 97 89 106 81 63 11 14 12 9 12 436 80 139 58 11 48 Georgia 135 110 119 114 88 20 21 16 24 20 566 56 173 101 4 16 Idaho 18 21 19 20 18 6 2 3 1 2 96 12 20 14 1 8 Illinois 159 144 152 132 127 20 36 22 27 22 714 132 330 127 7 34 Indiana 151 166 134 148 130 8 11 6 16 11 729 95 189 52 3 10 Iowa 78 70 60 74 64 3 7 9 8 8 346 28 121 35 1 8 Kansas 64 55 51 49 38 8 8 6 8 6 257 42 96 36 5 13 Kentucky 64 66 55 60 39 16 20 12 15 12 284 30 99 75 7 26 Louisiana 142 119 126 95 99 25 12 18 27 14 581 76 249 96 4 42 Maine 4 4 7 6 6 2 1 - - - 27 2 7 3 - 1 Maryland 8 13 15 13 11 4 6 9 3 6 60 1 13 28 2 9 Massachusetts 15 10 10 7 7 3 1 1 2 1 49 6 45 8 1 3 Michigan 95 88 74 62 53 6 9 8 5 6 372 27 96 34 4 19 Minnesota 75 59 53 48 53 11 6 8 11 3 288 42 99 39 5 11 Mississippi 80 73 77 64 67 8 6 5 5 2 361 51 187 26 1 17 Missouri 46 54 48 34 39 13 10 12 9 7 221 45 104 51 5 28 Montana 14 15 12 15 12 7 5 7 3 7 68 6 20 29 4 8 Nebraska 47 44 28 41 40 11 6 9 11 8 200 30 82 45 4 12 Nevada 2 4 2 1 3 - - 2 - 3 12 1 1 5 - 3 New Hampshire 1 2 1 1 2 - - 1 1 1 7 - 2 3 - - New Jersey 40 41 34 25 28 3 3 9 5 3 168 23 44 23 - 5 New Mexico 14 17 8 11 8 7 3 2 3 1 58 14 25 16 8 9 New York 28 36 24 39 38 5 7 8 10 1 165 26 77 31 8 10 North Carolina 60 56 57 57 60 15 11 18 11 9 290 34 111 64 5 23 North Dakota 14 16 12 11 13 2 2 - 2 1 66 11 29 7 2 1 Ohio 122 128 113 114 82 18 10 16 6 13 559 54 179 63 5 14 Oklahoma 54 60 66 55 55 4 4 4 4 2 290 49 157 18 - 8 Oregon 21 19 19 19 12 9 8 9 7 1 90 11 20 34 1 5 Pennsylvania 66 68 51 56 47 13 12 11 25 13 288 19 80 74 2 10 Rhode Island - 1 - - - - - - - - 1 - - - - - South Carolina 64 71 39 58 52 3 4 8 8 10 284 41 95 33 5 10 South Dakota 14 16 15 12 13 2 2 1 - - 70 6 36 5 - 1 Tennessee 67 68 56 61 55 10 11 12 10 8 307 26 113 51 6 9 Texas 251 265 297 259 190 42 59 42 37 39 1,262 121 533 219 23 107 Utah 8 15 11 16 11 2 3 3 1 1 61 4 25 10 1 2 Vermont 4 3 2 3 2 1 1 1 1 1 14 - 8 5 - 1 Virginia 41 28 26 19 28 24 23 18 16 16 142 2 43 97 5 24 Washington 41 43 37 38 24 5 14 13 10 12 183 20 43 54 7 15 West Virginia 19 24 18 13 8 12 11 14 13 7 82 6 20 57 4 13 Wisconsin 60 77 52 53 59 9 7 6 9 9 301 25 86 40 2 7 Wyoming 1 1 3 2 3 2 - 1 1 1 10 1 3 5 - 4 Total 2,657 2,637 2,513 2,346 2,060 422 423 425 423 338 12,213 1548 4549 2,031 175 674
Railroad Safety Statistics – Annual Report 2008 – Preliminary November 13, 2009
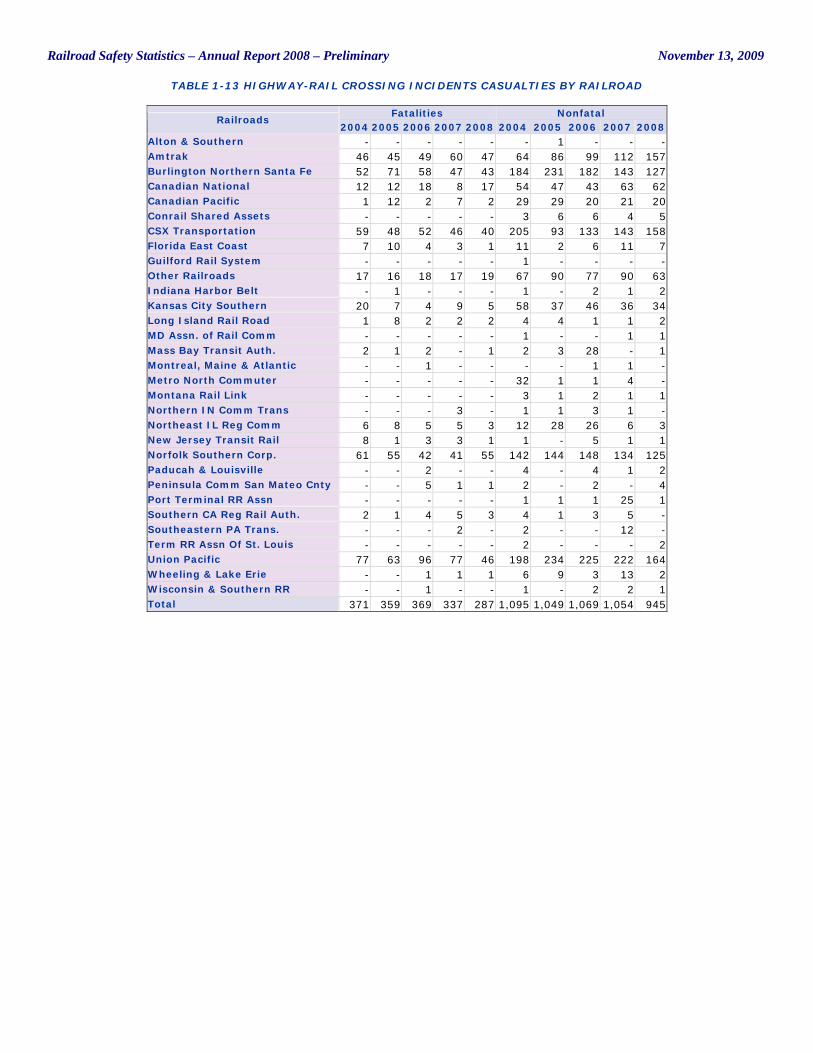
TABLE 1-13 HIGHWAY-RAIL CROSSING INCIDENTS CASUALTIES BY RAILROAD
Fatalities Nonfatal Railroads
2004 2005 2006 2007 2008 2004 2005 2006 2007 2008 Alton & Southern - - - - - - 1 - - - Amtrak 46 45 49 60 47 64 86 99 112 157 Burlington Northern Santa Fe 52 71 58 47 43 184 231 182 143 127 Canadian National 12 12 18 8 17 54 47 43 63 62 Canadian Pacific 1 12 2 7 2 29 29 20 21 20 Conrail Shared Assets - - - - - 3 6 6 4 5 CSX Transportation 59 48 52 46 40 205 93 133 143 158 Florida East Coast 7 10 4 3 1 11 2 6 11 7 Guilford Rail System - - - - - 1 - - - - Other Railroads 17 16 18 17 19 67 90 77 90 63 Indiana Harbor Belt - 1 - - - 1 - 2 1 2 Kansas City Southern 20 7 4 9 5 58 37 46 36 34 Long Island Rail Road 1 8 2 2 2 4 4 1 1 2 MD Assn. of Rail Comm - - - - - 1 - - 1 1 Mass Bay Transit Auth. 2 1 2 - 1 2 3 28 - 1 Montreal, Maine & Atlantic - - 1 - - - - 1 1 - Metro North Commuter - - - - - 32 1 1 4 - Montana Rail Link - - - - - 3 1 2 1 1 Northern IN Comm Trans - - - 3 - 1 1 3 1 - Northeast IL Reg Comm 6 8 5 5 3 12 28 26 6 3 New Jersey Transit Rail 8 1 3 3 1 1 - 5 1 1 Norfolk Southern Corp. 61 55 42 41 55 142 144 148 134 125 Paducah & Louisville - - 2 - - 4 - 4 1 2 Peninsula Comm San Mateo Cnty - - 5 1 1 2 - 2 - 4 Port Terminal RR Assn - - - - - 1 1 1 25 1 Southern CA Reg Rail Auth. 2 1 4 5 3 4 1 3 5 - Southeastern PA Trans. - - - 2 - 2 - - 12 - Term RR Assn Of St. Louis - - - - - 2 - - - 2 Union Pacific 77 63 96 77 46 198 234 225 222 164 Wheeling & Lake Erie - - 1 1 1 6 9 3 13 2 Wisconsin & Southern RR - - 1 - - 1 - 2 2 1 Total 371 359 369 337 287 1,095 1,049 1,069 1,054 945
Railroad Safety Statistics – Annual Report 2008 – Preliminary November 13, 2009
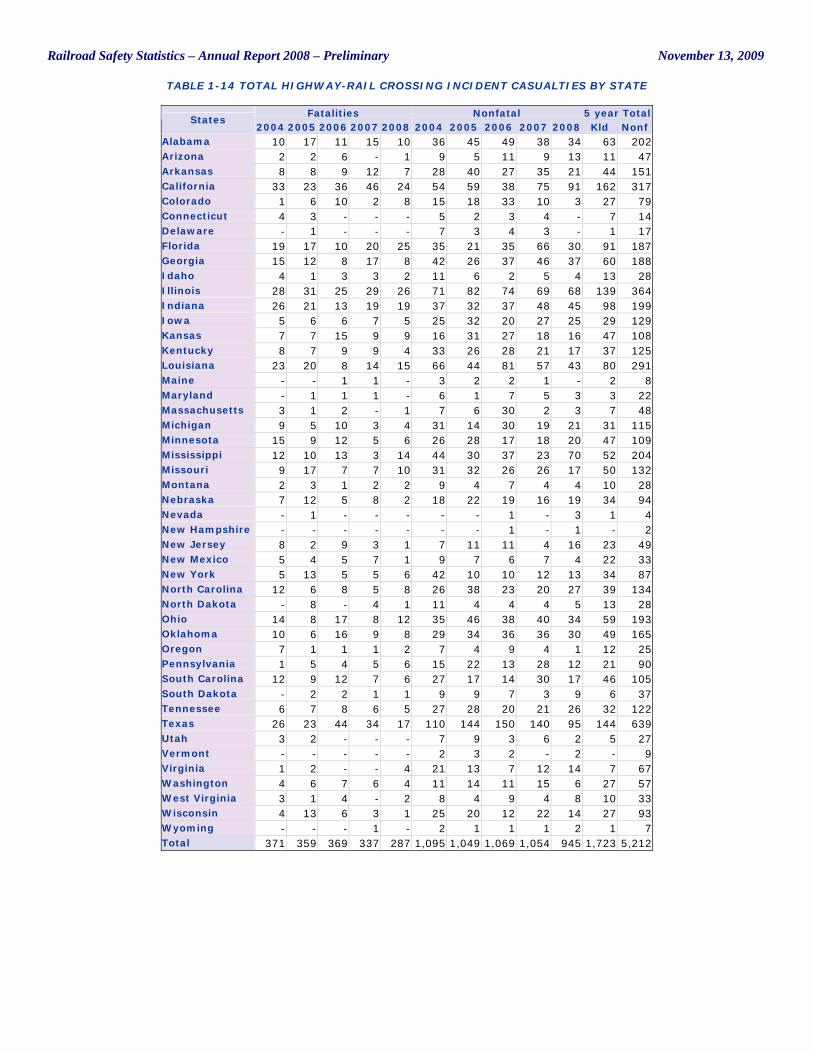
TABLE 1-14 TOTAL HIGHWAY-RAIL CROSSING INCIDENT CASUALTIES BY STATE
Fatalities Nonfatal 5 year Total States
2004 2005 2006 2007 2008 2004 2005 2006 2007 2008 Kld Nonf Alabama 10 17 11 15 10 36 45 49 38 34 63 202 Arizona 2 2 6 - 1 9 5 11 9 13 11 47 Arkansas 8 8 9 12 7 28 40 27 35 21 44 151 California 33 23 36 46 24 54 59 38 75 91 162 317 Colorado 1 6 10 2 8 15 18 33 10 3 27 79 Connecticut 4 3 - - - 5 2 3 4 - 7 14 Delaware - 1 - - - 7 3 4 3 - 1 17 Florida 19 17 10 20 25 35 21 35 66 30 91 187 Georgia 15 12 8 17 8 42 26 37 46 37 60 188 Idaho 4 1 3 3 2 11 6 2 5 4 13 28 Illinois 28 31 25 29 26 71 82 74 69 68 139 364 Indiana 26 21 13 19 19 37 32 37 48 45 98 199 Iowa 5 6 6 7 5 25 32 20 27 25 29 129 Kansas 7 7 15 9 9 16 31 27 18 16 47 108 Kentucky 8 7 9 9 4 33 26 28 21 17 37 125 Louisiana 23 20 8 14 15 66 44 81 57 43 80 291 Maine - - 1 1 - 3 2 2 1 - 2 8 Maryland - 1 1 1 - 6 1 7 5 3 3 22 Massachusetts 3 1 2 - 1 7 6 30 2 3 7 48 Michigan 9 5 10 3 4 31 14 30 19 21 31 115 Minnesota 15 9 12 5 6 26 28 17 18 20 47 109 Mississippi 12 10 13 3 14 44 30 37 23 70 52 204 Missouri 9 17 7 7 10 31 32 26 26 17 50 132 Montana 2 3 1 2 2 9 4 7 4 4 10 28 Nebraska 7 12 5 8 2 18 22 19 16 19 34 94 Nevada - 1 - - - - - 1 - 3 1 4 New Hampshire - - - - - - - 1 - 1 - 2 New Jersey 8 2 9 3 1 7 11 11 4 16 23 49 New Mexico 5 4 5 7 1 9 7 6 7 4 22 33 New York 5 13 5 5 6 42 10 10 12 13 34 87 North Carolina 12 6 8 5 8 26 38 23 20 27 39 134 North Dakota - 8 - 4 1 11 4 4 4 5 13 28 Ohio 14 8 17 8 12 35 46 38 40 34 59 193 Oklahoma 10 6 16 9 8 29 34 36 36 30 49 165 Oregon 7 1 1 1 2 7 4 9 4 1 12 25 Pennsylvania 1 5 4 5 6 15 22 13 28 12 21 90 South Carolina 12 9 12 7 6 27 17 14 30 17 46 105 South Dakota - 2 2 1 1 9 9 7 3 9 6 37 Tennessee 6 7 8 6 5 27 28 20 21 26 32 122 Texas 26 23 44 34 17 110 144 150 140 95 144 639 Utah 3 2 - - - 7 9 3 6 2 5 27 Vermont - - - - - 2 3 2 - 2 - 9 Virginia 1 2 - - 4 21 13 7 12 14 7 67 Washington 4 6 7 6 4 11 14 11 15 6 27 57 West Virginia 3 1 4 - 2 8 4 9 4 8 10 33 Wisconsin 4 13 6 3 1 25 20 12 22 14 27 93 Wyoming - - - 1 - 2 1 1 1 2 1 7 Total 371 359 369 337 287 1,095 1,049 1,069 1,054 945 1,723 5,212
Railroad Safety Statistics – Annual Report 2008 – Preliminary November 13, 2009
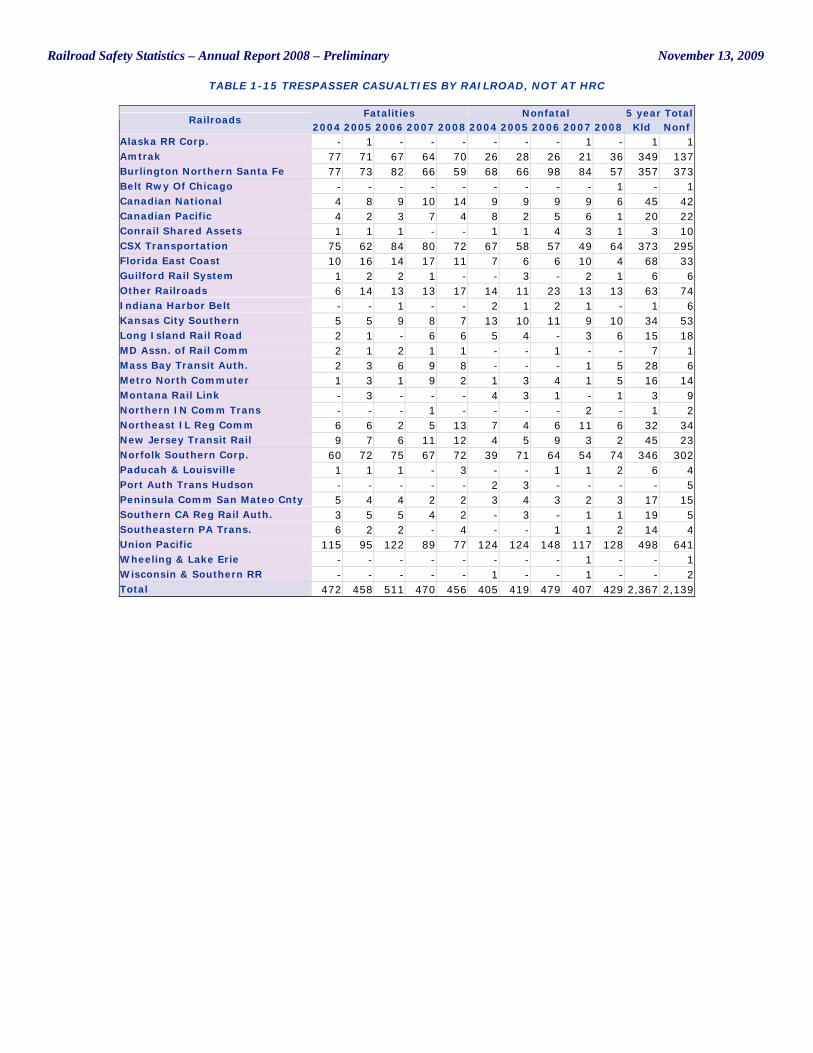
TABLE 1-15 TRESPASSER CASUALTIES BY RAILROAD, NOT AT HRC
Fatalities Nonfatal 5 year Total Railroads
2004 2005 2006 2007 2008 2004 2005 2006 2007 2008 Kld Nonf Alaska RR Corp. - 1 - - - - - - 1 - 1 1 Amtrak 77 71 67 64 70 26 28 26 21 36 349 137 Burlington Northern Santa Fe 77 73 82 66 59 68 66 98 84 57 357 373 Belt Rwy Of Chicago - - - - - - - - - 1 - 1 Canadian National 4 8 9 10 14 9 9 9 9 6 45 42 Canadian Pacific 4 2 3 7 4 8 2 5 6 1 20 22 Conrail Shared Assets 1 1 1 - - 1 1 4 3 1 3 10 CSX Transportation 75 62 84 80 72 67 58 57 49 64 373 295 Florida East Coast 10 16 14 17 11 7 6 6 10 4 68 33 Guilford Rail System 1 2 2 1 - - 3 - 2 1 6 6 Other Railroads 6 14 13 13 17 14 11 23 13 13 63 74 Indiana Harbor Belt - - 1 - - 2 1 2 1 - 1 6 Kansas City Southern 5 5 9 8 7 13 10 11 9 10 34 53 Long Island Rail Road 2 1 - 6 6 5 4 - 3 6 15 18 MD Assn. of Rail Comm 2 1 2 1 1 - - 1 - - 7 1 Mass Bay Transit Auth. 2 3 6 9 8 - - - 1 5 28 6 Metro North Commuter 1 3 1 9 2 1 3 4 1 5 16 14 Montana Rail Link - 3 - - - 4 3 1 - 1 3 9 Northern IN Comm Trans - - - 1 - - - - 2 - 1 2 Northeast IL Reg Comm 6 6 2 5 13 7 4 6 11 6 32 34 New Jersey Transit Rail 9 7 6 11 12 4 5 9 3 2 45 23 Norfolk Southern Corp. 60 72 75 67 72 39 71 64 54 74 346 302 Paducah & Louisville 1 1 1 - 3 - - 1 1 2 6 4 Port Auth Trans Hudson - - - - - 2 3 - - - - 5 Peninsula Comm San Mateo Cnty 5 4 4 2 2 3 4 3 2 3 17 15 Southern CA Reg Rail Auth. 3 5 5 4 2 - 3 - 1 1 19 5 Southeastern PA Trans. 6 2 2 - 4 - - 1 1 2 14 4 Union Pacific 115 95 122 89 77 124 124 148 117 128 498 641 Wheeling & Lake Erie - - - - - - - - 1 - - 1 Wisconsin & Southern RR - - - - - 1 - - 1 - - 2 Total 472 458 511 470 456 405 419 479 407 429 2,367 2,139
Railroad Safety Statistics – Annual Report 2008 – Preliminary November 13, 2009
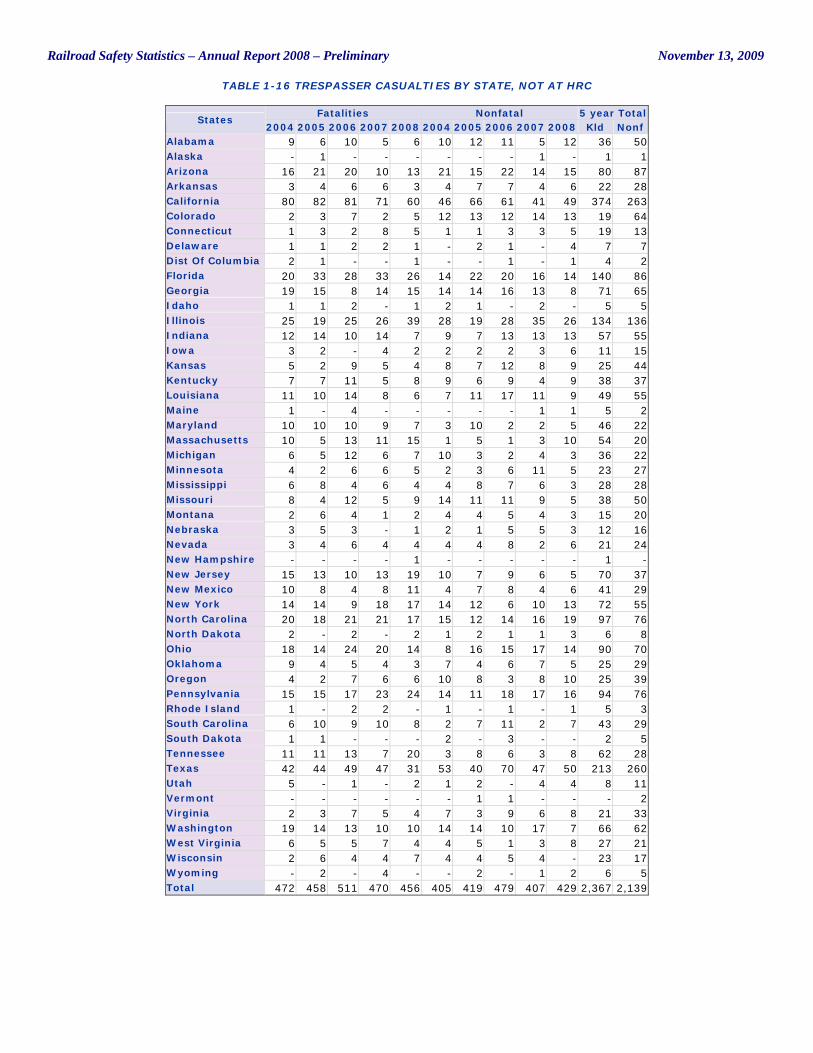
TABLE 1-16 TRESPASSER CASUALTIES BY STATE, NOT AT HRC
Fatalities Nonfatal 5 year Total States
2004 2005 2006 2007 2008 2004 2005 2006 2007 2008 Kld Nonf Alabama 9 6 10 5 6 10 12 11 5 12 36 50 Alaska - 1 - - - - - - 1 - 1 1 Arizona 16 21 20 10 13 21 15 22 14 15 80 87 Arkansas 3 4 6 6 3 4 7 7 4 6 22 28 California 80 82 81 71 60 46 66 61 41 49 374 263 Colorado 2 3 7 2 5 12 13 12 14 13 19 64 Connecticut 1 3 2 8 5 1 1 3 3 5 19 13 Delaware 1 1 2 2 1 - 2 1 - 4 7 7 Dist Of Columbia 2 1 - - 1 - - 1 - 1 4 2 Florida 20 33 28 33 26 14 22 20 16 14 140 86 Georgia 19 15 8 14 15 14 14 16 13 8 71 65 Idaho 1 1 2 - 1 2 1 - 2 - 5 5 Illinois 25 19 25 26 39 28 19 28 35 26 134 136 Indiana 12 14 10 14 7 9 7 13 13 13 57 55 Iowa 3 2 - 4 2 2 2 2 3 6 11 15 Kansas 5 2 9 5 4 8 7 12 8 9 25 44 Kentucky 7 7 11 5 8 9 6 9 4 9 38 37 Louisiana 11 10 14 8 6 7 11 17 11 9 49 55 Maine 1 - 4 - - - - - 1 1 5 2 Maryland 10 10 10 9 7 3 10 2 2 5 46 22 Massachusetts 10 5 13 11 15 1 5 1 3 10 54 20 Michigan 6 5 12 6 7 10 3 2 4 3 36 22 Minnesota 4 2 6 6 5 2 3 6 11 5 23 27 Mississippi 6 8 4 6 4 4 8 7 6 3 28 28 Missouri 8 4 12 5 9 14 11 11 9 5 38 50 Montana 2 6 4 1 2 4 4 5 4 3 15 20 Nebraska 3 5 3 - 1 2 1 5 5 3 12 16 Nevada 3 4 6 4 4 4 4 8 2 6 21 24 New Hampshire - - - - 1 - - - - - 1 - New Jersey 15 13 10 13 19 10 7 9 6 5 70 37 New Mexico 10 8 4 8 11 4 7 8 4 6 41 29 New York 14 14 9 18 17 14 12 6 10 13 72 55 North Carolina 20 18 21 21 17 15 12 14 16 19 97 76 North Dakota 2 - 2 - 2 1 2 1 1 3 6 8 Ohio 18 14 24 20 14 8 16 15 17 14 90 70 Oklahoma 9 4 5 4 3 7 4 6 7 5 25 29 Oregon 4 2 7 6 6 10 8 3 8 10 25 39 Pennsylvania 15 15 17 23 24 14 11 18 17 16 94 76 Rhode Island 1 - 2 2 - 1 - 1 - 1 5 3 South Carolina 6 10 9 10 8 2 7 11 2 7 43 29 South Dakota 1 1 - - - 2 - 3 - - 2 5 Tennessee 11 11 13 7 20 3 8 6 3 8 62 28 Texas 42 44 49 47 31 53 40 70 47 50 213 260 Utah 5 - 1 - 2 1 2 - 4 4 8 11 Vermont - - - - - - 1 1 - - - 2 Virginia 2 3 7 5 4 7 3 9 6 8 21 33 Washington 19 14 13 10 10 14 14 10 17 7 66 62 West Virginia 6 5 5 7 4 4 5 1 3 8 27 21 Wisconsin 2 6 4 4 7 4 4 5 4 - 23 17 Wyoming - 2 - 4 - - 2 - 1 2 6 5 Total 472 458 511 470 456 405 419 479 407 429 2,367 2,139
Railroad Safety Statistics – Annual Report 2008 – Preliminary November 13, 2009
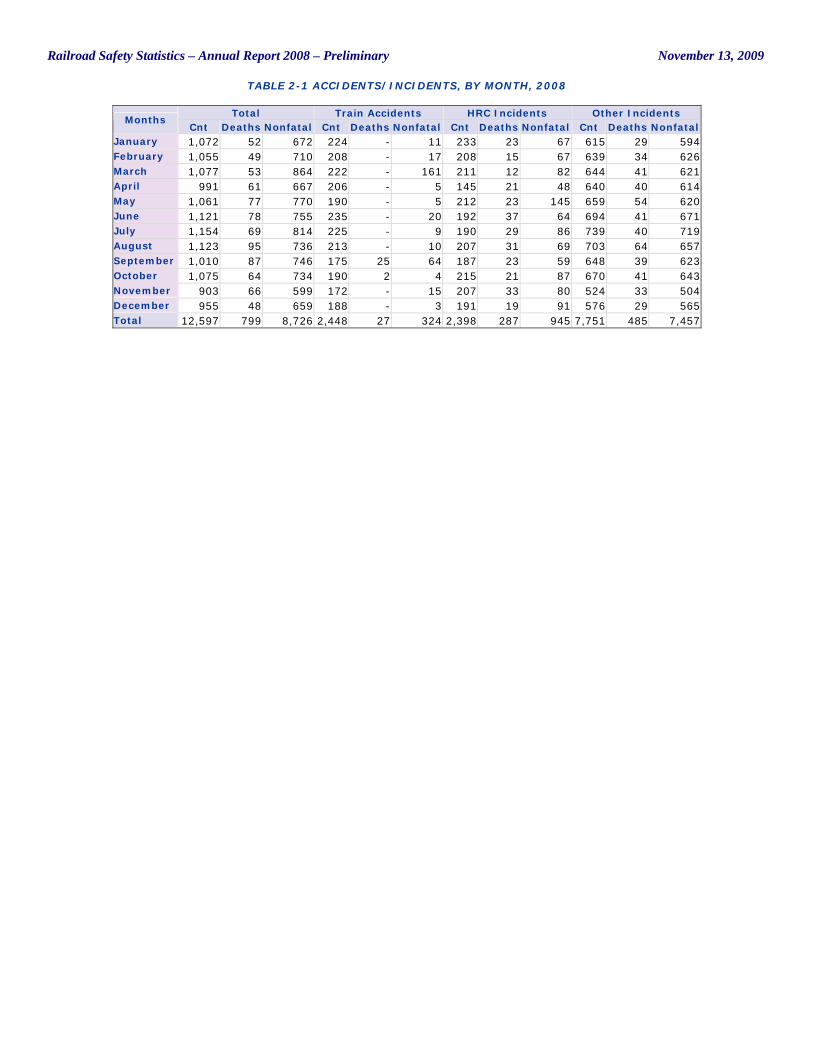
TABLE 2-1 ACCIDENTS/INCIDENTS, BY MONTH, 2008
Total Train Accidents HRC Incidents Other Incidents Months
Cnt Deaths Nonfatal Cnt Deaths Nonfatal Cnt Deaths Nonfatal Cnt Deaths Nonfatal January 1,072 52 672 224 - 11 233 23 67 615 29 594 February 1,055 49 710 208 - 17 208 15 67 639 34 626 March 1,077 53 864 222 - 161 211 12 82 644 41 621 April 991 61 667 206 - 5 145 21 48 640 40 614 May 1,061 77 770 190 - 5 212 23 145 659 54 620 June 1,121 78 755 235 - 20 192 37 64 694 41 671 July 1,154 69 814 225 - 9 190 29 86 739 40 719 August 1,123 95 736 213 - 10 207 31 69 703 64 657 September 1,010 87 746 175 25 64 187 23 59 648 39 623 October 1,075 64 734 190 2 4 215 21 87 670 41 643 November 903 66 599 172 - 15 207 33 80 524 33 504 December 955 48 659 188 - 3 191 19 91 576 29 565 Total 12,597 799 8,726 2,448 27 324 2,398 287 945 7,751 485 7,457
Railroad Safety Statistics – Annual Report 2008 – Preliminary November 13, 2009
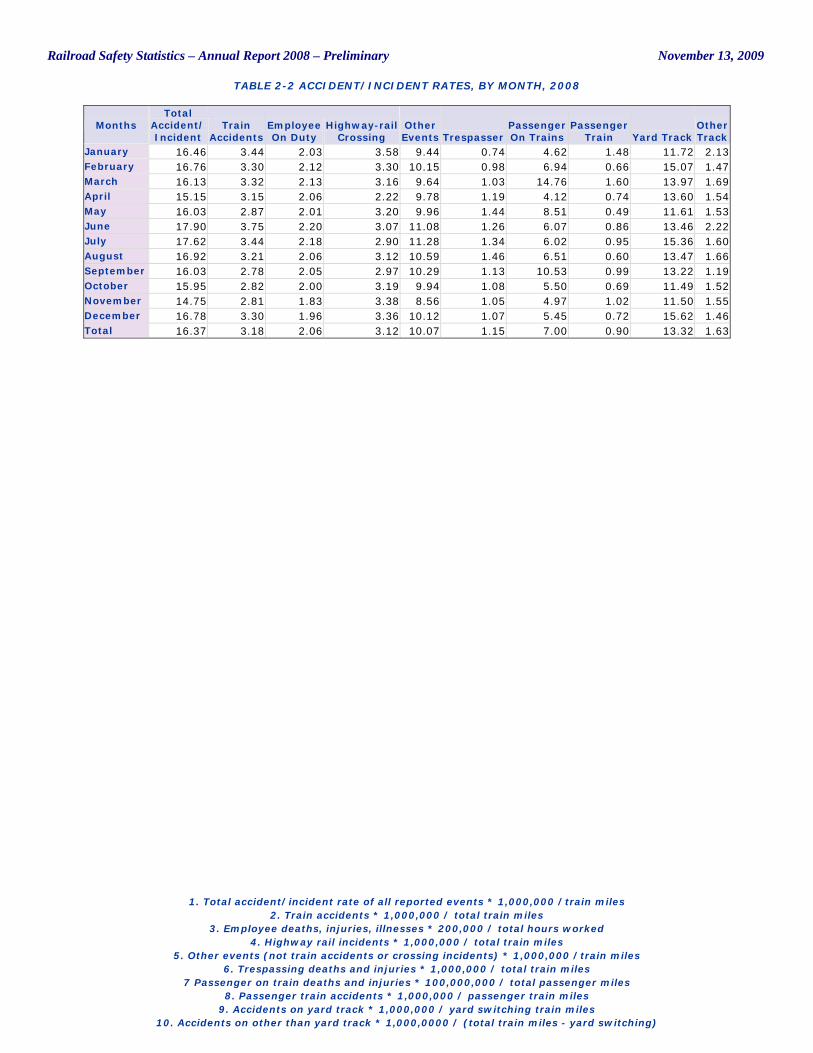
TABLE 2-2 ACCIDENT/INCIDENT RATES, BY MONTH, 2008
1. Total accident/incident rate of all reported events * 1,000,000 /train miles
2. Train accidents * 1,000,000 / total train miles 3. Employee deaths, injuries, illnesses * 200,000 / total hours worked
4. Highway rail incidents * 1,000,000 / total train miles 5. Other events (not train accidents or crossing incidents) * 1,000,000 /train miles
6. Trespassing deaths and injuries * 1,000,000 / total train miles 7 Passenger on train deaths and injuries * 100,000,000 / total passenger miles
8. Passenger train accidents * 1,000,000 / passenger train miles 9. Accidents on yard track * 1,000,000 / yard switching train miles
10. Accidents on other than yard track * 1,000,0000 / (total train miles - yard switching)
Months Total
Accident/ Incident
Train Accidents
Employee On Duty
Highway-rail Crossing
Other Events Trespasser
Passenger On Trains
Passenger Train Yard Track
Other Track
January 16.46 3.44 2.03 3.58 9.44 0.74 4.62 1.48 11.72 2.13 February 16.76 3.30 2.12 3.30 10.15 0.98 6.94 0.66 15.07 1.47 March 16.13 3.32 2.13 3.16 9.64 1.03 14.76 1.60 13.97 1.69 April 15.15 3.15 2.06 2.22 9.78 1.19 4.12 0.74 13.60 1.54 May 16.03 2.87 2.01 3.20 9.96 1.44 8.51 0.49 11.61 1.53 June 17.90 3.75 2.20 3.07 11.08 1.26 6.07 0.86 13.46 2.22 July 17.62 3.44 2.18 2.90 11.28 1.34 6.02 0.95 15.36 1.60 August 16.92 3.21 2.06 3.12 10.59 1.46 6.51 0.60 13.47 1.66 September 16.03 2.78 2.05 2.97 10.29 1.13 10.53 0.99 13.22 1.19 October 15.95 2.82 2.00 3.19 9.94 1.08 5.50 0.69 11.49 1.52 November 14.75 2.81 1.83 3.38 8.56 1.05 4.97 1.02 11.50 1.55 December 16.78 3.30 1.96 3.36 10.12 1.07 5.45 0.72 15.62 1.46 Total 16.37 3.18 2.06 3.12 10.07 1.15 7.00 0.90 13.32 1.63
Railroad Safety Statistics – Annual Report 2008 – Preliminary November 13, 2009
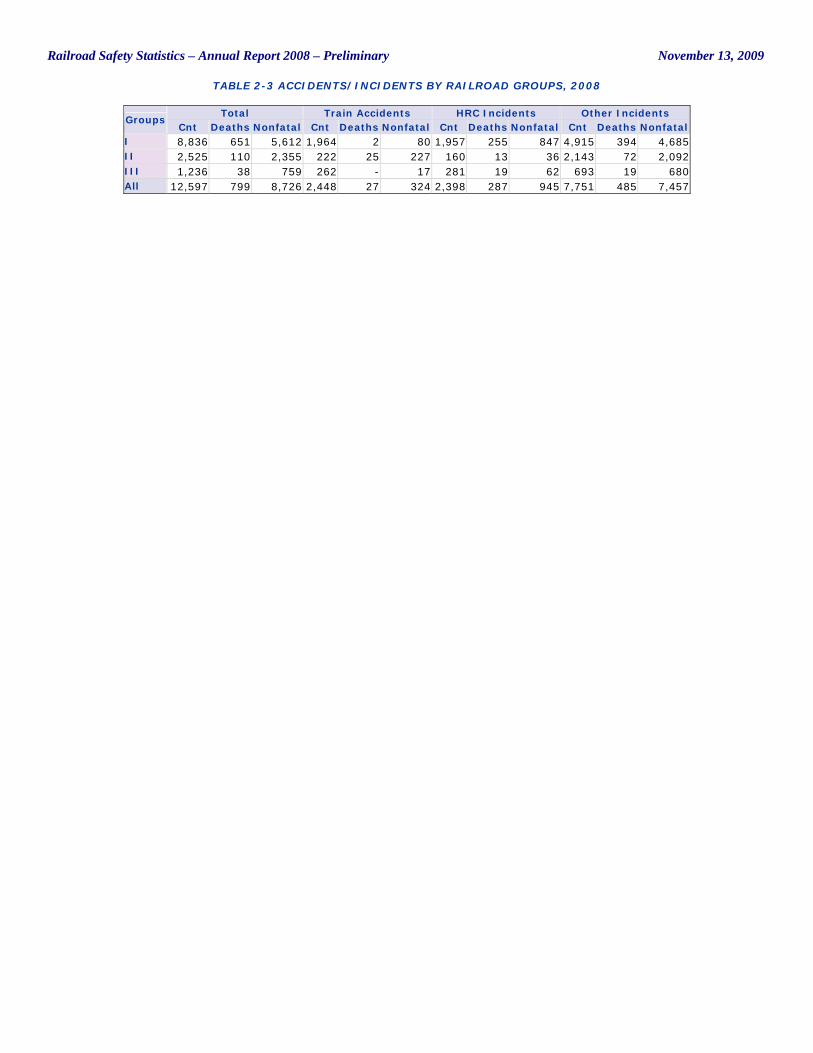
TABLE 2-3 ACCIDENTS/INCIDENTS BY RAILROAD GROUPS, 2008
Total Train Accidents HRC Incidents Other Incidents Groups
Cnt Deaths Nonfatal Cnt Deaths Nonfatal Cnt Deaths Nonfatal Cnt Deaths Nonfatal I 8,836 651 5,612 1,964 2 80 1,957 255 847 4,915 394 4,685 II 2,525 110 2,355 222 25 227 160 13 36 2,143 72 2,092 III 1,236 38 759 262 - 17 281 19 62 693 19 680 All 12,597 799 8,726 2,448 27 324 2,398 287 945 7,751 485 7,457
Railroad Safety Statistics – Annual Report 2008 – Preliminary November 13, 2009
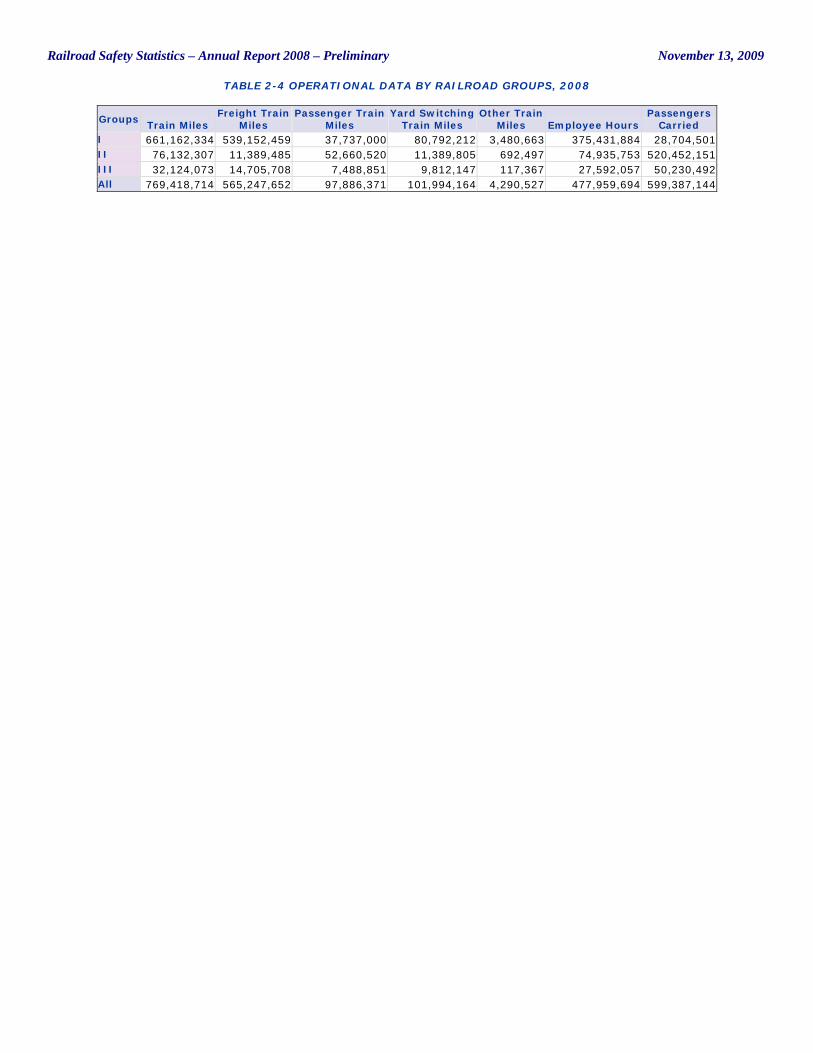
TABLE 2-4 OPERATIONAL DATA BY RAILROAD GROUPS, 2008
Groups Train Miles
Freight Train Miles
Passenger Train Miles
Yard Switching Train Miles
Other Train Miles Employee Hours
Passengers Carried
I 661,162,334 539,152,459 37,737,000 80,792,212 3,480,663 375,431,884 28,704,501 II 76,132,307 11,389,485 52,660,520 11,389,805 692,497 74,935,753 520,452,151 III 32,124,073 14,705,708 7,488,851 9,812,147 117,367 27,592,057 50,230,492 All 769,418,714 565,247,652 97,886,371 101,994,164 4,290,527 477,959,694 599,387,144
Railroad Safety Statistics – Annual Report 2008 – Preliminary November 13, 2009
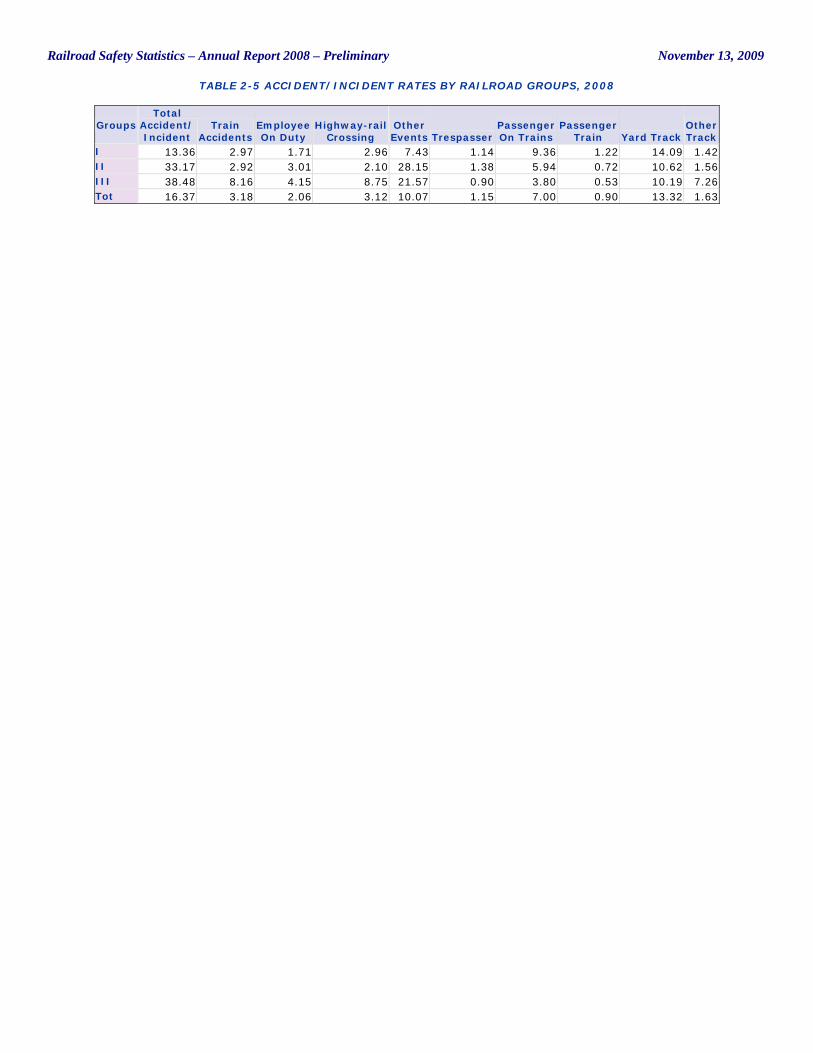
TABLE 2-5 ACCIDENT/INCIDENT RATES BY RAILROAD GROUPS, 2008
Groups Total
Accident/ Incident
Train Accidents
Employee On Duty
Highway-rail Crossing
Other Events Trespasser
Passenger On Trains
Passenger Train Yard Track
Other Track
I 13.36 2.97 1.71 2.96 7.43 1.14 9.36 1.22 14.09 1.42 II 33.17 2.92 3.01 2.10 28.15 1.38 5.94 0.72 10.62 1.56 III 38.48 8.16 4.15 8.75 21.57 0.90 3.80 0.53 10.19 7.26 Tot 16.37 3.18 2.06 3.12 10.07 1.15 7.00 0.90 13.32 1.63
Railroad Safety Statistics – Annual Report 2008 – Preliminary November 13, 2009
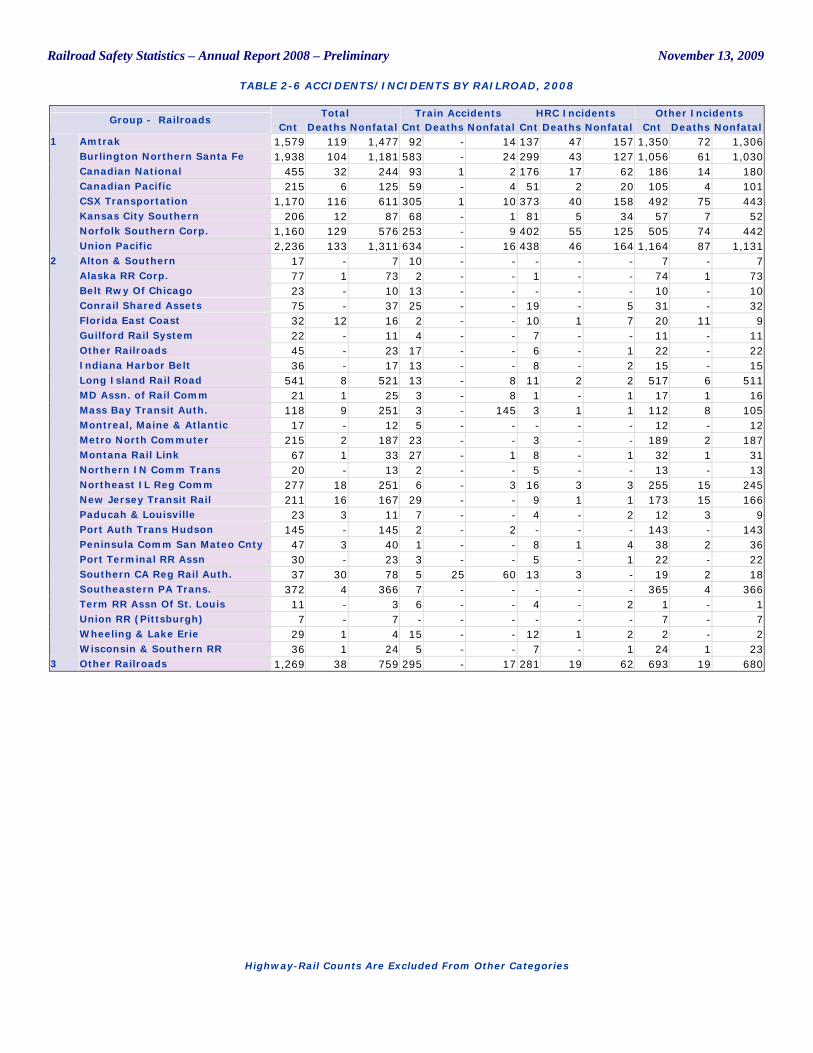
TABLE 2-6 ACCIDENTS/INCIDENTS BY RAILROAD, 2008
Highway-Rail Counts Are Excluded From Other Categories
Total Train Accidents HRC Incidents Other Incidents Group - Railroads
Cnt Deaths Nonfatal Cnt Deaths Nonfatal Cnt Deaths Nonfatal Cnt Deaths Nonfatal Amtrak 1,579 119 1,477 92 - 14 137 47 157 1,350 72 1,306 Burlington Northern Santa Fe 1,938 104 1,181 583 - 24 299 43 127 1,056 61 1,030 Canadian National 455 32 244 93 1 2 176 17 62 186 14 180 Canadian Pacific 215 6 125 59 - 4 51 2 20 105 4 101 CSX Transportation 1,170 116 611 305 1 10 373 40 158 492 75 443 Kansas City Southern 206 12 87 68 - 1 81 5 34 57 7 52 Norfolk Southern Corp. 1,160 129 576 253 - 9 402 55 125 505 74 442
1
Union Pacific 2,236 133 1,311 634 - 16 438 46 164 1,164 87 1,131 Alton & Southern 17 - 7 10 - - - - - 7 - 7 Alaska RR Corp. 77 1 73 2 - - 1 - - 74 1 73 Belt Rwy Of Chicago 23 - 10 13 - - - - - 10 - 10 Conrail Shared Assets 75 - 37 25 - - 19 - 5 31 - 32 Florida East Coast 32 12 16 2 - - 10 1 7 20 11 9 Guilford Rail System 22 - 11 4 - - 7 - - 11 - 11 Other Railroads 45 - 23 17 - - 6 - 1 22 - 22 Indiana Harbor Belt 36 - 17 13 - - 8 - 2 15 - 15 Long Island Rail Road 541 8 521 13 - 8 11 2 2 517 6 511 MD Assn. of Rail Comm 21 1 25 3 - 8 1 - 1 17 1 16 Mass Bay Transit Auth. 118 9 251 3 - 145 3 1 1 112 8 105 Montreal, Maine & Atlantic 17 - 12 5 - - - - - 12 - 12 Metro North Commuter 215 2 187 23 - - 3 - - 189 2 187 Montana Rail Link 67 1 33 27 - 1 8 - 1 32 1 31 Northern IN Comm Trans 20 - 13 2 - - 5 - - 13 - 13 Northeast IL Reg Comm 277 18 251 6 - 3 16 3 3 255 15 245 New Jersey Transit Rail 211 16 167 29 - - 9 1 1 173 15 166 Paducah & Louisville 23 3 11 7 - - 4 - 2 12 3 9 Port Auth Trans Hudson 145 - 145 2 - 2 - - - 143 - 143 Peninsula Comm San Mateo Cnty 47 3 40 1 - - 8 1 4 38 2 36 Port Terminal RR Assn 30 - 23 3 - - 5 - 1 22 - 22 Southern CA Reg Rail Auth. 37 30 78 5 25 60 13 3 - 19 2 18 Southeastern PA Trans. 372 4 366 7 - - - - - 365 4 366 Term RR Assn Of St. Louis 11 - 3 6 - - 4 - 2 1 - 1 Union RR (Pittsburgh) 7 - 7 - - - - - - 7 - 7 Wheeling & Lake Erie 29 1 4 15 - - 12 1 2 2 - 2
2
Wisconsin & Southern RR 36 1 24 5 - - 7 - 1 24 1 23 3 Other Railroads 1,269 38 759 295 - 17 281 19 62 693 19 680
Railroad Safety Statistics – Annual Report 2008 – Preliminary November 13, 2009
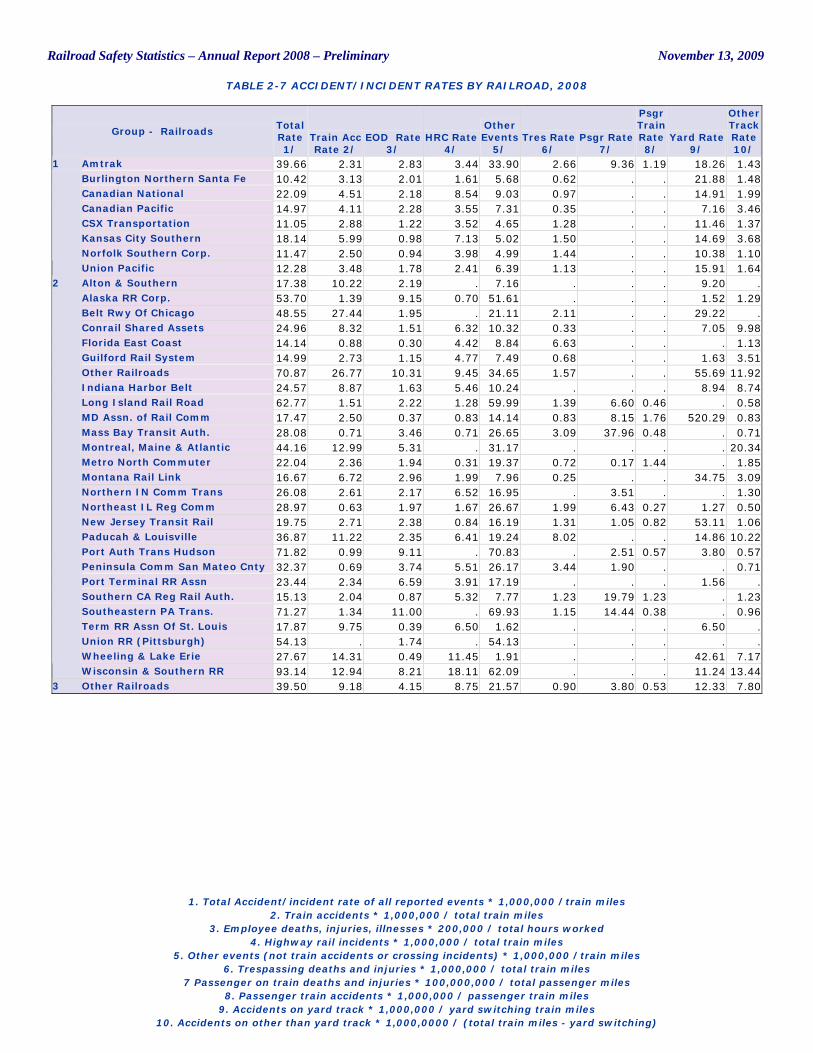
TABLE 2-7 ACCIDENT/INCIDENT RATES BY RAILROAD, 2008
1. Total Accident/incident rate of all reported events * 1,000,000 /train miles
2. Train accidents * 1,000,000 / total train miles 3. Employee deaths, injuries, illnesses * 200,000 / total hours worked
4. Highway rail incidents * 1,000,000 / total train miles 5. Other events (not train accidents or crossing incidents) * 1,000,000 /train miles
6. Trespassing deaths and injuries * 1,000,000 / total train miles 7 Passenger on train deaths and injuries * 100,000,000 / total passenger miles
8. Passenger train accidents * 1,000,000 / passenger train miles 9. Accidents on yard track * 1,000,000 / yard switching train miles
10. Accidents on other than yard track * 1,000,0000 / (total train miles - yard switching)
Group - Railroads Total Rate 1/
Train Acc Rate 2/
EOD Rate 3/
HRC Rate 4/
Other Events
5/ Tres Rate
6/ Psgr Rate
7/
Psgr Train Rate 8/
Yard Rate 9/
Other Track Rate 10/
Amtrak 39.66 2.31 2.83 3.44 33.90 2.66 9.36 1.19 18.26 1.43 Burlington Northern Santa Fe 10.42 3.13 2.01 1.61 5.68 0.62 . . 21.88 1.48 Canadian National 22.09 4.51 2.18 8.54 9.03 0.97 . . 14.91 1.99 Canadian Pacific 14.97 4.11 2.28 3.55 7.31 0.35 . . 7.16 3.46 CSX Transportation 11.05 2.88 1.22 3.52 4.65 1.28 . . 11.46 1.37 Kansas City Southern 18.14 5.99 0.98 7.13 5.02 1.50 . . 14.69 3.68 Norfolk Southern Corp. 11.47 2.50 0.94 3.98 4.99 1.44 . . 10.38 1.10
1
Union Pacific 12.28 3.48 1.78 2.41 6.39 1.13 . . 15.91 1.64 Alton & Southern 17.38 10.22 2.19 . 7.16 . . . 9.20 . Alaska RR Corp. 53.70 1.39 9.15 0.70 51.61 . . . 1.52 1.29 Belt Rwy Of Chicago 48.55 27.44 1.95 . 21.11 2.11 . . 29.22 . Conrail Shared Assets 24.96 8.32 1.51 6.32 10.32 0.33 . . 7.05 9.98 Florida East Coast 14.14 0.88 0.30 4.42 8.84 6.63 . . . 1.13 Guilford Rail System 14.99 2.73 1.15 4.77 7.49 0.68 . . 1.63 3.51 Other Railroads 70.87 26.77 10.31 9.45 34.65 1.57 . . 55.69 11.92 Indiana Harbor Belt 24.57 8.87 1.63 5.46 10.24 . . . 8.94 8.74 Long Island Rail Road 62.77 1.51 2.22 1.28 59.99 1.39 6.60 0.46 . 0.58 MD Assn. of Rail Comm 17.47 2.50 0.37 0.83 14.14 0.83 8.15 1.76 520.29 0.83 Mass Bay Transit Auth. 28.08 0.71 3.46 0.71 26.65 3.09 37.96 0.48 . 0.71 Montreal, Maine & Atlantic 44.16 12.99 5.31 . 31.17 . . . . 20.34 Metro North Commuter 22.04 2.36 1.94 0.31 19.37 0.72 0.17 1.44 . 1.85 Montana Rail Link 16.67 6.72 2.96 1.99 7.96 0.25 . . 34.75 3.09 Northern IN Comm Trans 26.08 2.61 2.17 6.52 16.95 . 3.51 . . 1.30 Northeast IL Reg Comm 28.97 0.63 1.97 1.67 26.67 1.99 6.43 0.27 1.27 0.50 New Jersey Transit Rail 19.75 2.71 2.38 0.84 16.19 1.31 1.05 0.82 53.11 1.06 Paducah & Louisville 36.87 11.22 2.35 6.41 19.24 8.02 . . 14.86 10.22 Port Auth Trans Hudson 71.82 0.99 9.11 . 70.83 . 2.51 0.57 3.80 0.57 Peninsula Comm San Mateo Cnty 32.37 0.69 3.74 5.51 26.17 3.44 1.90 . . 0.71 Port Terminal RR Assn 23.44 2.34 6.59 3.91 17.19 . . . 1.56 . Southern CA Reg Rail Auth. 15.13 2.04 0.87 5.32 7.77 1.23 19.79 1.23 . 1.23 Southeastern PA Trans. 71.27 1.34 11.00 . 69.93 1.15 14.44 0.38 . 0.96 Term RR Assn Of St. Louis 17.87 9.75 0.39 6.50 1.62 . . . 6.50 . Union RR (Pittsburgh) 54.13 . 1.74 . 54.13 . . . . . Wheeling & Lake Erie 27.67 14.31 0.49 11.45 1.91 . . . 42.61 7.17
2
Wisconsin & Southern RR 93.14 12.94 8.21 18.11 62.09 . . . 11.24 13.44 3 Other Railroads 39.50 9.18 4.15 8.75 21.57 0.90 3.80 0.53 12.33 7.80
Railroad Safety Statistics – Annual Report 2008 – Preliminary November 13, 2009
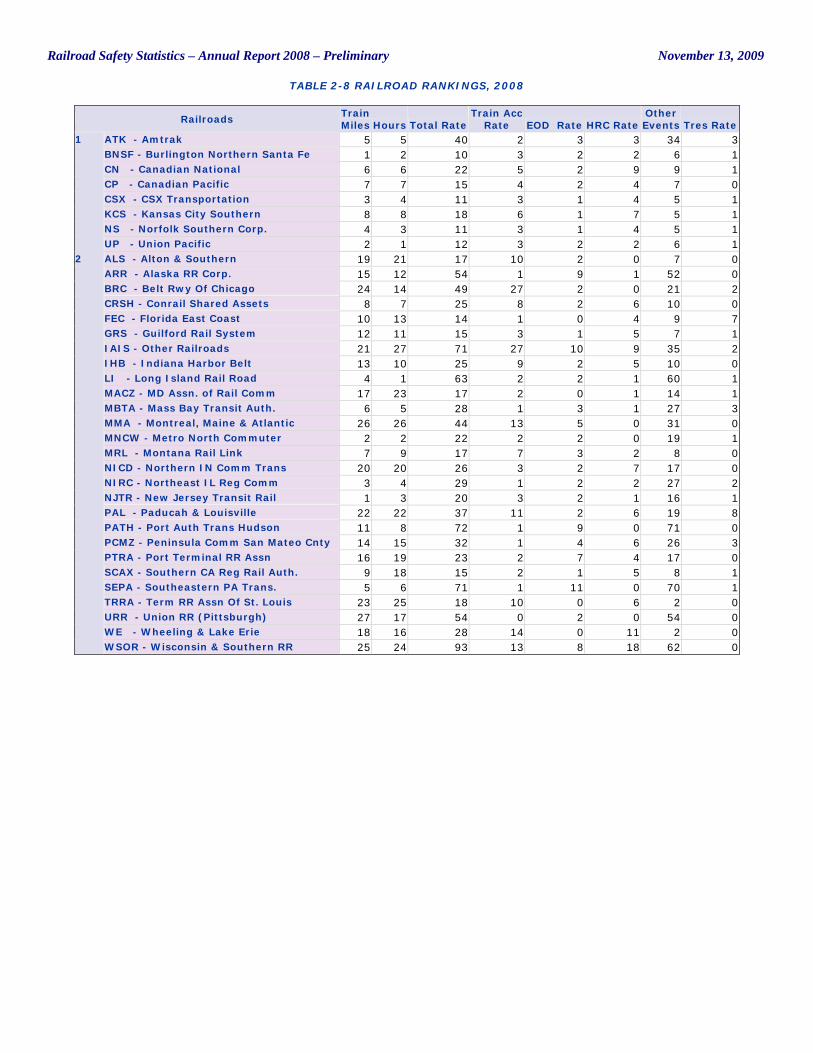
TABLE 2-8 RAILROAD RANKINGS, 2008
Railroads Train Miles Hours Total Rate
Train Acc Rate EOD Rate HRC Rate
Other Events Tres Rate
ATK - Amtrak 5 5 40 2 3 3 34 3 BNSF - Burlington Northern Santa Fe 1 2 10 3 2 2 6 1 CN - Canadian National 6 6 22 5 2 9 9 1 CP - Canadian Pacific 7 7 15 4 2 4 7 0 CSX - CSX Transportation 3 4 11 3 1 4 5 1 KCS - Kansas City Southern 8 8 18 6 1 7 5 1 NS - Norfolk Southern Corp. 4 3 11 3 1 4 5 1
1
UP - Union Pacific 2 1 12 3 2 2 6 1 ALS - Alton & Southern 19 21 17 10 2 0 7 0 ARR - Alaska RR Corp. 15 12 54 1 9 1 52 0 BRC - Belt Rwy Of Chicago 24 14 49 27 2 0 21 2 CRSH - Conrail Shared Assets 8 7 25 8 2 6 10 0 FEC - Florida East Coast 10 13 14 1 0 4 9 7 GRS - Guilford Rail System 12 11 15 3 1 5 7 1 IAIS - Other Railroads 21 27 71 27 10 9 35 2 IHB - Indiana Harbor Belt 13 10 25 9 2 5 10 0 LI - Long Island Rail Road 4 1 63 2 2 1 60 1 MACZ - MD Assn. of Rail Comm 17 23 17 2 0 1 14 1 MBTA - Mass Bay Transit Auth. 6 5 28 1 3 1 27 3 MMA - Montreal, Maine & Atlantic 26 26 44 13 5 0 31 0 MNCW - Metro North Commuter 2 2 22 2 2 0 19 1 MRL - Montana Rail Link 7 9 17 7 3 2 8 0 NICD - Northern IN Comm Trans 20 20 26 3 2 7 17 0 NIRC - Northeast IL Reg Comm 3 4 29 1 2 2 27 2 NJTR - New Jersey Transit Rail 1 3 20 3 2 1 16 1 PAL - Paducah & Louisville 22 22 37 11 2 6 19 8 PATH - Port Auth Trans Hudson 11 8 72 1 9 0 71 0 PCMZ - Peninsula Comm San Mateo Cnty 14 15 32 1 4 6 26 3 PTRA - Port Terminal RR Assn 16 19 23 2 7 4 17 0 SCAX - Southern CA Reg Rail Auth. 9 18 15 2 1 5 8 1 SEPA - Southeastern PA Trans. 5 6 71 1 11 0 70 1 TRRA - Term RR Assn Of St. Louis 23 25 18 10 0 6 2 0 URR - Union RR (Pittsburgh) 27 17 54 0 2 0 54 0 WE - Wheeling & Lake Erie 18 16 28 14 0 11 2 0
2
WSOR - Wisconsin & Southern RR 25 24 93 13 8 18 62 0
Railroad Safety Statistics – Annual Report 2008 – Preliminary November 13, 2009
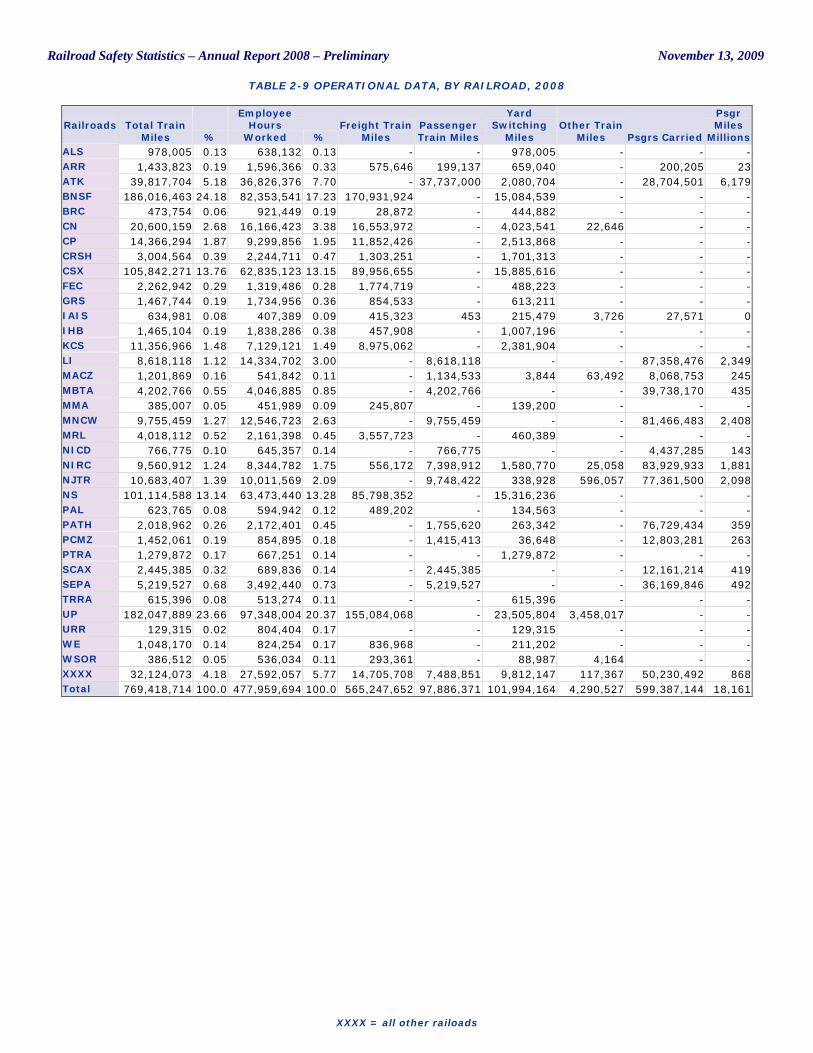
TABLE 2-9 OPERATIONAL DATA, BY RAILROAD, 2008
XXXX = all other railoads
Railroads Total Train Miles %
Employee Hours
Worked % Freight Train
Miles Passenger Train Miles
Yard Switching
Miles Other Train
Miles Psgrs Carried
Psgr Miles
Millions ALS 978,005 0.13 638,132 0.13 - - 978,005 - - - ARR 1,433,823 0.19 1,596,366 0.33 575,646 199,137 659,040 - 200,205 23 ATK 39,817,704 5.18 36,826,376 7.70 - 37,737,000 2,080,704 - 28,704,501 6,179 BNSF 186,016,463 24.18 82,353,541 17.23 170,931,924 - 15,084,539 - - - BRC 473,754 0.06 921,449 0.19 28,872 - 444,882 - - - CN 20,600,159 2.68 16,166,423 3.38 16,553,972 - 4,023,541 22,646 - - CP 14,366,294 1.87 9,299,856 1.95 11,852,426 - 2,513,868 - - - CRSH 3,004,564 0.39 2,244,711 0.47 1,303,251 - 1,701,313 - - - CSX 105,842,271 13.76 62,835,123 13.15 89,956,655 - 15,885,616 - - - FEC 2,262,942 0.29 1,319,486 0.28 1,774,719 - 488,223 - - - GRS 1,467,744 0.19 1,734,956 0.36 854,533 - 613,211 - - - IAIS 634,981 0.08 407,389 0.09 415,323 453 215,479 3,726 27,571 0 IHB 1,465,104 0.19 1,838,286 0.38 457,908 - 1,007,196 - - - KCS 11,356,966 1.48 7,129,121 1.49 8,975,062 - 2,381,904 - - - LI 8,618,118 1.12 14,334,702 3.00 - 8,618,118 - - 87,358,476 2,349 MACZ 1,201,869 0.16 541,842 0.11 - 1,134,533 3,844 63,492 8,068,753 245 MBTA 4,202,766 0.55 4,046,885 0.85 - 4,202,766 - - 39,738,170 435 MMA 385,007 0.05 451,989 0.09 245,807 - 139,200 - - - MNCW 9,755,459 1.27 12,546,723 2.63 - 9,755,459 - - 81,466,483 2,408 MRL 4,018,112 0.52 2,161,398 0.45 3,557,723 - 460,389 - - - NICD 766,775 0.10 645,357 0.14 - 766,775 - - 4,437,285 143 NIRC 9,560,912 1.24 8,344,782 1.75 556,172 7,398,912 1,580,770 25,058 83,929,933 1,881 NJTR 10,683,407 1.39 10,011,569 2.09 - 9,748,422 338,928 596,057 77,361,500 2,098 NS 101,114,588 13.14 63,473,440 13.28 85,798,352 - 15,316,236 - - - PAL 623,765 0.08 594,942 0.12 489,202 - 134,563 - - - PATH 2,018,962 0.26 2,172,401 0.45 - 1,755,620 263,342 - 76,729,434 359 PCMZ 1,452,061 0.19 854,895 0.18 - 1,415,413 36,648 - 12,803,281 263 PTRA 1,279,872 0.17 667,251 0.14 - - 1,279,872 - - - SCAX 2,445,385 0.32 689,836 0.14 - 2,445,385 - - 12,161,214 419 SEPA 5,219,527 0.68 3,492,440 0.73 - 5,219,527 - - 36,169,846 492 TRRA 615,396 0.08 513,274 0.11 - - 615,396 - - - UP 182,047,889 23.66 97,348,004 20.37 155,084,068 - 23,505,804 3,458,017 - - URR 129,315 0.02 804,404 0.17 - - 129,315 - - - WE 1,048,170 0.14 824,254 0.17 836,968 - 211,202 - - - WSOR 386,512 0.05 536,034 0.11 293,361 - 88,987 4,164 - - XXXX 32,124,073 4.18 27,592,057 5.77 14,705,708 7,488,851 9,812,147 117,367 50,230,492 868 Total 769,418,714 100.0 477,959,694 100.0 565,247,652 97,886,371 101,994,164 4,290,527 599,387,144 18,161
Railroad Safety Statistics – Annual Report 2008 – Preliminary November 13, 2009
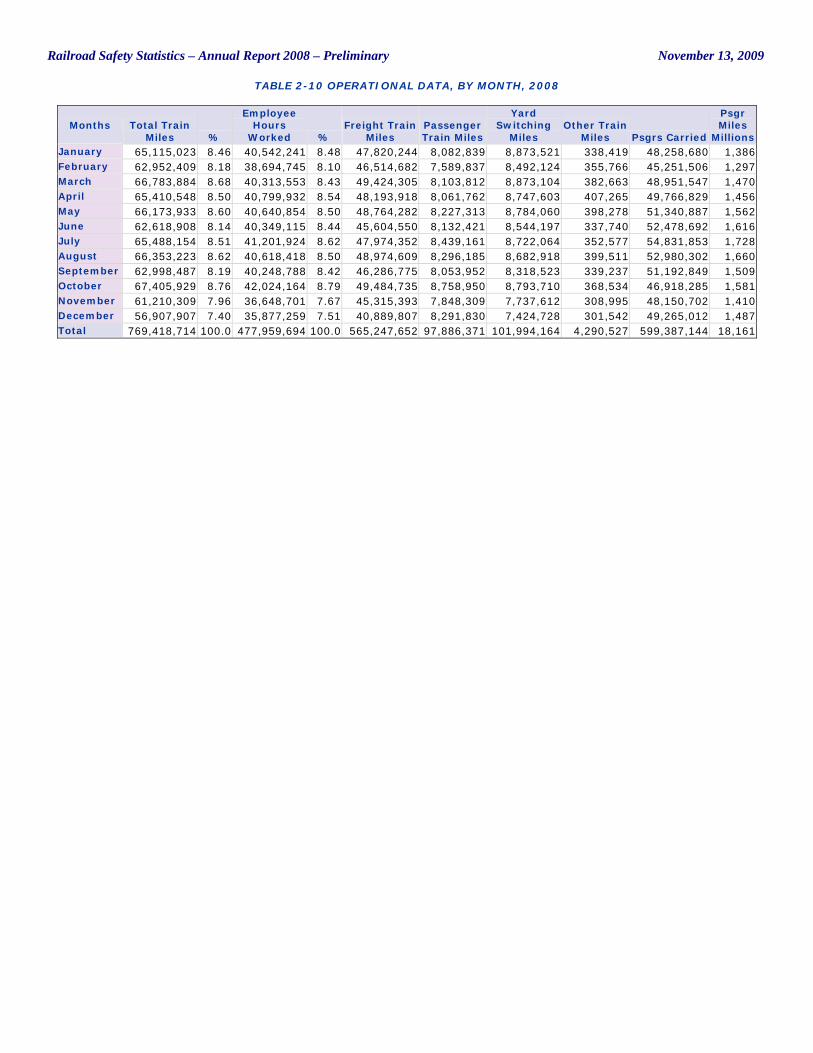
TABLE 2-10 OPERATIONAL DATA, BY MONTH, 2008
Months Total Train Miles %
Employee Hours
Worked % Freight Train
Miles Passenger Train Miles
Yard Switching
Miles Other Train
Miles Psgrs Carried
Psgr Miles
Millions January 65,115,023 8.46 40,542,241 8.48 47,820,244 8,082,839 8,873,521 338,419 48,258,680 1,386 February 62,952,409 8.18 38,694,745 8.10 46,514,682 7,589,837 8,492,124 355,766 45,251,506 1,297 March 66,783,884 8.68 40,313,553 8.43 49,424,305 8,103,812 8,873,104 382,663 48,951,547 1,470 April 65,410,548 8.50 40,799,932 8.54 48,193,918 8,061,762 8,747,603 407,265 49,766,829 1,456 May 66,173,933 8.60 40,640,854 8.50 48,764,282 8,227,313 8,784,060 398,278 51,340,887 1,562 June 62,618,908 8.14 40,349,115 8.44 45,604,550 8,132,421 8,544,197 337,740 52,478,692 1,616 July 65,488,154 8.51 41,201,924 8.62 47,974,352 8,439,161 8,722,064 352,577 54,831,853 1,728 August 66,353,223 8.62 40,618,418 8.50 48,974,609 8,296,185 8,682,918 399,511 52,980,302 1,660 September 62,998,487 8.19 40,248,788 8.42 46,286,775 8,053,952 8,318,523 339,237 51,192,849 1,509 October 67,405,929 8.76 42,024,164 8.79 49,484,735 8,758,950 8,793,710 368,534 46,918,285 1,581 November 61,210,309 7.96 36,648,701 7.67 45,315,393 7,848,309 7,737,612 308,995 48,150,702 1,410 December 56,907,907 7.40 35,877,259 7.51 40,889,807 8,291,830 7,424,728 301,542 49,265,012 1,487 Total 769,418,714 100.0 477,959,694 100.0 565,247,652 97,886,371 101,994,164 4,290,527 599,387,144 18,161
Railroad Safety Statistics – Annual Report 2008 – Preliminary November 13, 2009
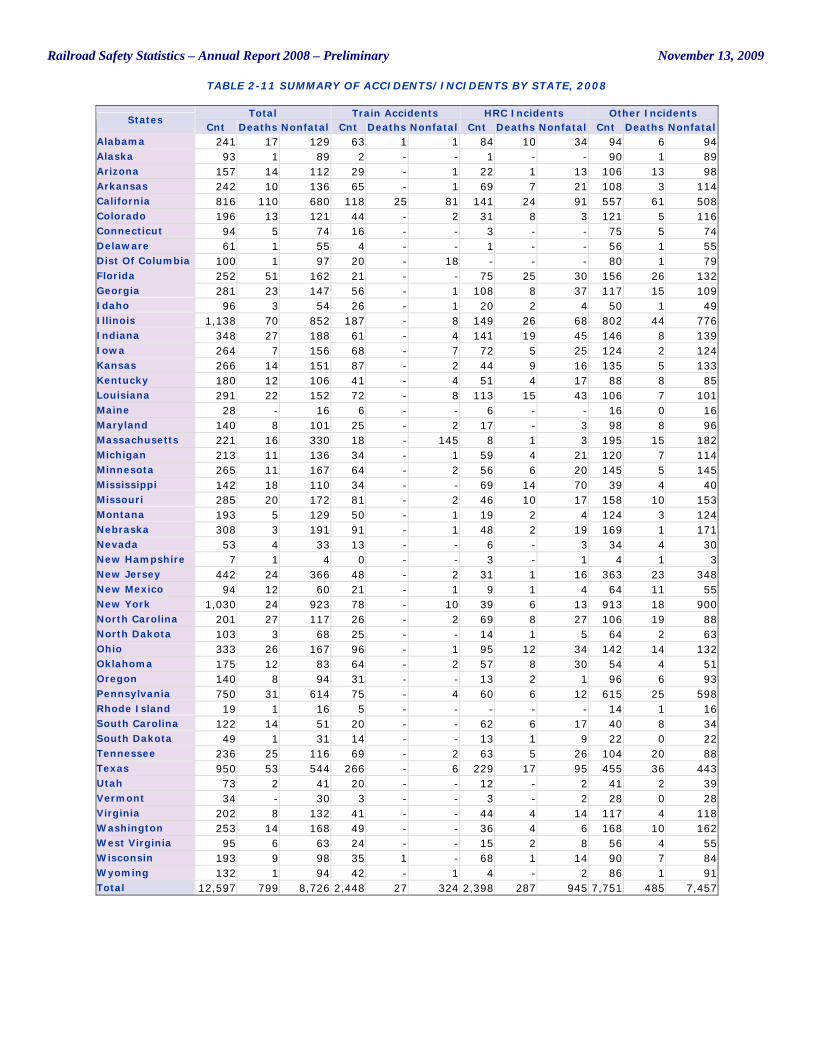
TABLE 2-11 SUMMARY OF ACCIDENTS/INCIDENTS BY STATE, 2008
Total Train Accidents HRC Incidents Other Incidents States
Cnt Deaths Nonfatal Cnt Deaths Nonfatal Cnt Deaths Nonfatal Cnt Deaths Nonfatal Alabama 241 17 129 63 1 1 84 10 34 94 6 94 Alaska 93 1 89 2 - - 1 - - 90 1 89 Arizona 157 14 112 29 - 1 22 1 13 106 13 98 Arkansas 242 10 136 65 - 1 69 7 21 108 3 114 California 816 110 680 118 25 81 141 24 91 557 61 508 Colorado 196 13 121 44 - 2 31 8 3 121 5 116 Connecticut 94 5 74 16 - - 3 - - 75 5 74 Delaware 61 1 55 4 - - 1 - - 56 1 55 Dist Of Columbia 100 1 97 20 - 18 - - - 80 1 79 Florida 252 51 162 21 - - 75 25 30 156 26 132 Georgia 281 23 147 56 - 1 108 8 37 117 15 109 Idaho 96 3 54 26 - 1 20 2 4 50 1 49 Illinois 1,138 70 852 187 - 8 149 26 68 802 44 776 Indiana 348 27 188 61 - 4 141 19 45 146 8 139 Iowa 264 7 156 68 - 7 72 5 25 124 2 124 Kansas 266 14 151 87 - 2 44 9 16 135 5 133 Kentucky 180 12 106 41 - 4 51 4 17 88 8 85 Louisiana 291 22 152 72 - 8 113 15 43 106 7 101 Maine 28 - 16 6 - - 6 - - 16 0 16 Maryland 140 8 101 25 - 2 17 - 3 98 8 96 Massachusetts 221 16 330 18 - 145 8 1 3 195 15 182 Michigan 213 11 136 34 - 1 59 4 21 120 7 114 Minnesota 265 11 167 64 - 2 56 6 20 145 5 145 Mississippi 142 18 110 34 - - 69 14 70 39 4 40 Missouri 285 20 172 81 - 2 46 10 17 158 10 153 Montana 193 5 129 50 - 1 19 2 4 124 3 124 Nebraska 308 3 191 91 - 1 48 2 19 169 1 171 Nevada 53 4 33 13 - - 6 - 3 34 4 30 New Hampshire 7 1 4 0 - - 3 - 1 4 1 3 New Jersey 442 24 366 48 - 2 31 1 16 363 23 348 New Mexico 94 12 60 21 - 1 9 1 4 64 11 55 New York 1,030 24 923 78 - 10 39 6 13 913 18 900 North Carolina 201 27 117 26 - 2 69 8 27 106 19 88 North Dakota 103 3 68 25 - - 14 1 5 64 2 63 Ohio 333 26 167 96 - 1 95 12 34 142 14 132 Oklahoma 175 12 83 64 - 2 57 8 30 54 4 51 Oregon 140 8 94 31 - - 13 2 1 96 6 93 Pennsylvania 750 31 614 75 - 4 60 6 12 615 25 598 Rhode Island 19 1 16 5 - - - - - 14 1 16 South Carolina 122 14 51 20 - - 62 6 17 40 8 34 South Dakota 49 1 31 14 - - 13 1 9 22 0 22 Tennessee 236 25 116 69 - 2 63 5 26 104 20 88 Texas 950 53 544 266 - 6 229 17 95 455 36 443 Utah 73 2 41 20 - - 12 - 2 41 2 39 Vermont 34 - 30 3 - - 3 - 2 28 0 28 Virginia 202 8 132 41 - - 44 4 14 117 4 118 Washington 253 14 168 49 - - 36 4 6 168 10 162 West Virginia 95 6 63 24 - - 15 2 8 56 4 55 Wisconsin 193 9 98 35 1 - 68 1 14 90 7 84 Wyoming 132 1 94 42 - 1 4 - 2 86 1 91 Total 12,597 799 8,726 2,448 27 324 2,398 287 945 7,751 485 7,457
Railroad Safety Statistics – Annual Report 2008 – Preliminary November 13, 2009
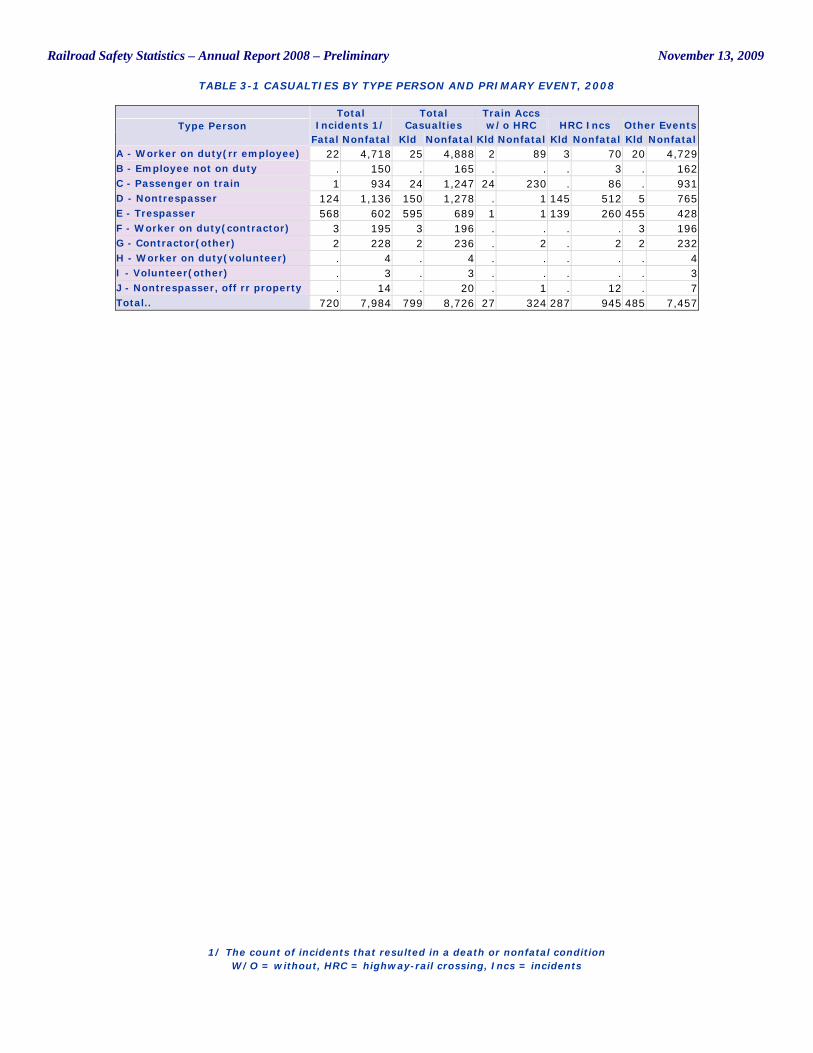
TABLE 3-1 CASUALTIES BY TYPE PERSON AND PRIMARY EVENT, 2008
1/ The count of incidents that resulted in a death or nonfatal condition
W/O = without, HRC = highway-rail crossing, Incs = incidents
Total Incidents 1/
Total Casualties
Train Accs w/o HRC HRC Incs Other Events Type Person
Fatal Nonfatal Kld Nonfatal Kld Nonfatal Kld Nonfatal Kld Nonfatal A - Worker on duty(rr employee) 22 4,718 25 4,888 2 89 3 70 20 4,729 B - Employee not on duty . 150 . 165 . . . 3 . 162 C - Passenger on train 1 934 24 1,247 24 230 . 86 . 931 D - Nontrespasser 124 1,136 150 1,278 . 1 145 512 5 765 E - Trespasser 568 602 595 689 1 1 139 260 455 428 F - Worker on duty(contractor) 3 195 3 196 . . . . 3 196 G - Contractor(other) 2 228 2 236 . 2 . 2 2 232 H - Worker on duty(volunteer) . 4 . 4 . . . . . 4 I - Volunteer(other) . 3 . 3 . . . . . 3 J - Nontrespasser, off rr property . 14 . 20 . 1 . 12 . 7 Total.. 720 7,984 799 8,726 27 324 287 945 485 7,457
Railroad Safety Statistics – Annual Report 2008 – Preliminary November 13, 2009
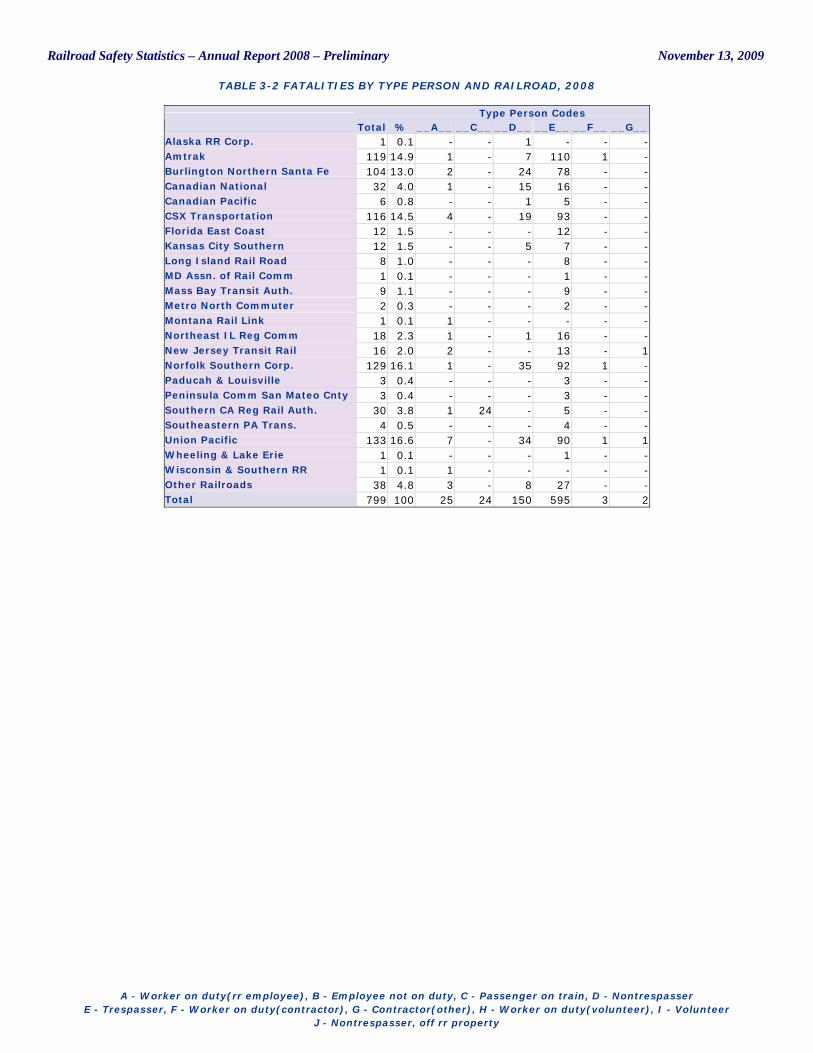
TABLE 3-2 FATALITIES BY TYPE PERSON AND RAILROAD, 2008
A - Worker on duty(rr employee), B - Employee not on duty, C - Passenger on train, D - Nontrespasser
E - Trespasser, F - Worker on duty(contractor), G - Contractor(other), H - Worker on duty(volunteer), I - Volunteer J - Nontrespasser, off rr property
Type Person Codes
Total % __A__ __C__ __D__ __E__ __F__ __G__ Alaska RR Corp. 1 0.1 - - 1 - - - Amtrak 119 14.9 1 - 7 110 1 - Burlington Northern Santa Fe 104 13.0 2 - 24 78 - - Canadian National 32 4.0 1 - 15 16 - - Canadian Pacific 6 0.8 - - 1 5 - - CSX Transportation 116 14.5 4 - 19 93 - - Florida East Coast 12 1.5 - - - 12 - - Kansas City Southern 12 1.5 - - 5 7 - - Long Island Rail Road 8 1.0 - - - 8 - - MD Assn. of Rail Comm 1 0.1 - - - 1 - - Mass Bay Transit Auth. 9 1.1 - - - 9 - - Metro North Commuter 2 0.3 - - - 2 - - Montana Rail Link 1 0.1 1 - - - - - Northeast IL Reg Comm 18 2.3 1 - 1 16 - - New Jersey Transit Rail 16 2.0 2 - - 13 - 1 Norfolk Southern Corp. 129 16.1 1 - 35 92 1 - Paducah & Louisville 3 0.4 - - - 3 - - Peninsula Comm San Mateo Cnty 3 0.4 - - - 3 - - Southern CA Reg Rail Auth. 30 3.8 1 24 - 5 - - Southeastern PA Trans. 4 0.5 - - - 4 - - Union Pacific 133 16.6 7 - 34 90 1 1 Wheeling & Lake Erie 1 0.1 - - - 1 - - Wisconsin & Southern RR 1 0.1 1 - - - - - Other Railroads 38 4.8 3 - 8 27 - - Total 799 100 25 24 150 595 3 2
Railroad Safety Statistics – Annual Report 2008 – Preliminary November 13, 2009
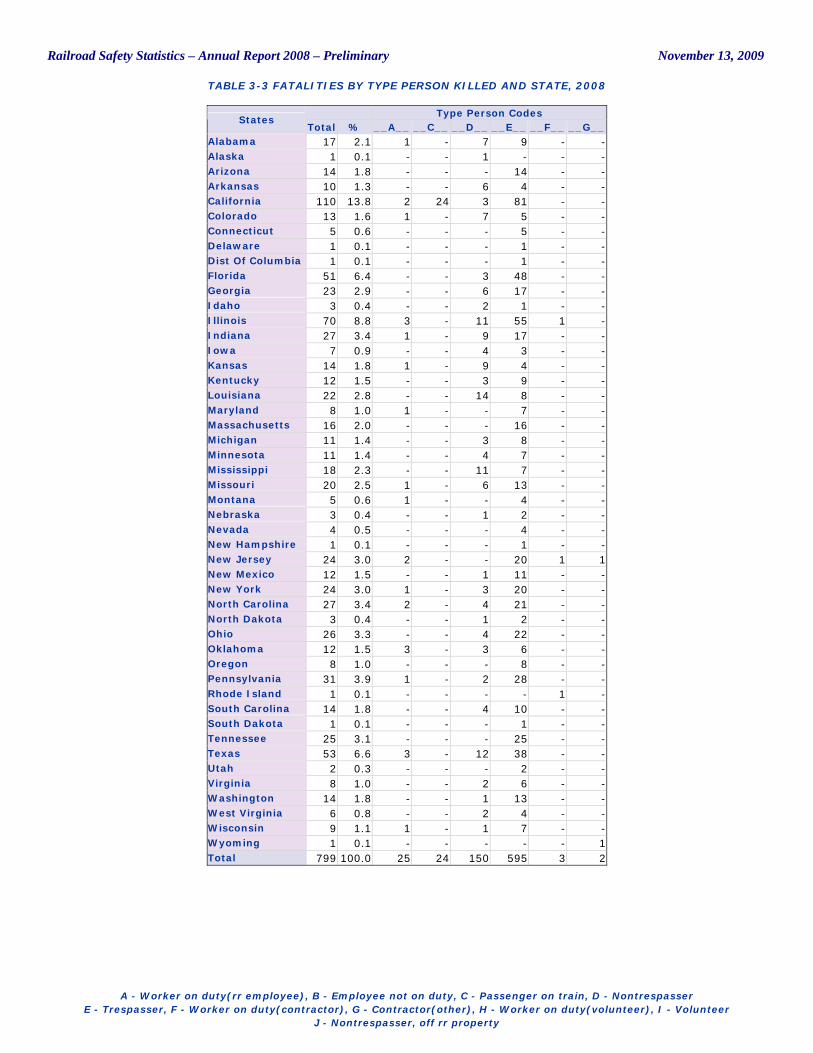
TABLE 3-3 FATALITIES BY TYPE PERSON KILLED AND STATE, 2008
A - Worker on duty(rr employee), B - Employee not on duty, C - Passenger on train, D - Nontrespasser
E - Trespasser, F - Worker on duty(contractor), G - Contractor(other), H - Worker on duty(volunteer), I - Volunteer J - Nontrespasser, off rr property
Type Person Codes States
Total % __A__ __C__ __D__ __E__ __F__ __G__ Alabama 17 2.1 1 - 7 9 - - Alaska 1 0.1 - - 1 - - - Arizona 14 1.8 - - - 14 - - Arkansas 10 1.3 - - 6 4 - - California 110 13.8 2 24 3 81 - - Colorado 13 1.6 1 - 7 5 - - Connecticut 5 0.6 - - - 5 - - Delaware 1 0.1 - - - 1 - - Dist Of Columbia 1 0.1 - - - 1 - - Florida 51 6.4 - - 3 48 - - Georgia 23 2.9 - - 6 17 - - Idaho 3 0.4 - - 2 1 - - Illinois 70 8.8 3 - 11 55 1 - Indiana 27 3.4 1 - 9 17 - - Iowa 7 0.9 - - 4 3 - - Kansas 14 1.8 1 - 9 4 - - Kentucky 12 1.5 - - 3 9 - - Louisiana 22 2.8 - - 14 8 - - Maryland 8 1.0 1 - - 7 - - Massachusetts 16 2.0 - - - 16 - - Michigan 11 1.4 - - 3 8 - - Minnesota 11 1.4 - - 4 7 - - Mississippi 18 2.3 - - 11 7 - - Missouri 20 2.5 1 - 6 13 - - Montana 5 0.6 1 - - 4 - - Nebraska 3 0.4 - - 1 2 - - Nevada 4 0.5 - - - 4 - - New Hampshire 1 0.1 - - - 1 - - New Jersey 24 3.0 2 - - 20 1 1 New Mexico 12 1.5 - - 1 11 - - New York 24 3.0 1 - 3 20 - - North Carolina 27 3.4 2 - 4 21 - - North Dakota 3 0.4 - - 1 2 - - Ohio 26 3.3 - - 4 22 - - Oklahoma 12 1.5 3 - 3 6 - - Oregon 8 1.0 - - - 8 - - Pennsylvania 31 3.9 1 - 2 28 - - Rhode Island 1 0.1 - - - - 1 - South Carolina 14 1.8 - - 4 10 - - South Dakota 1 0.1 - - - 1 - - Tennessee 25 3.1 - - - 25 - - Texas 53 6.6 3 - 12 38 - - Utah 2 0.3 - - - 2 - - Virginia 8 1.0 - - 2 6 - - Washington 14 1.8 - - 1 13 - - West Virginia 6 0.8 - - 2 4 - - Wisconsin 9 1.1 1 - 1 7 - - Wyoming 1 0.1 - - - - - 1 Total 799 100.0 25 24 150 595 3 2
Railroad Safety Statistics – Annual Report 2008 – Preliminary November 13, 2009
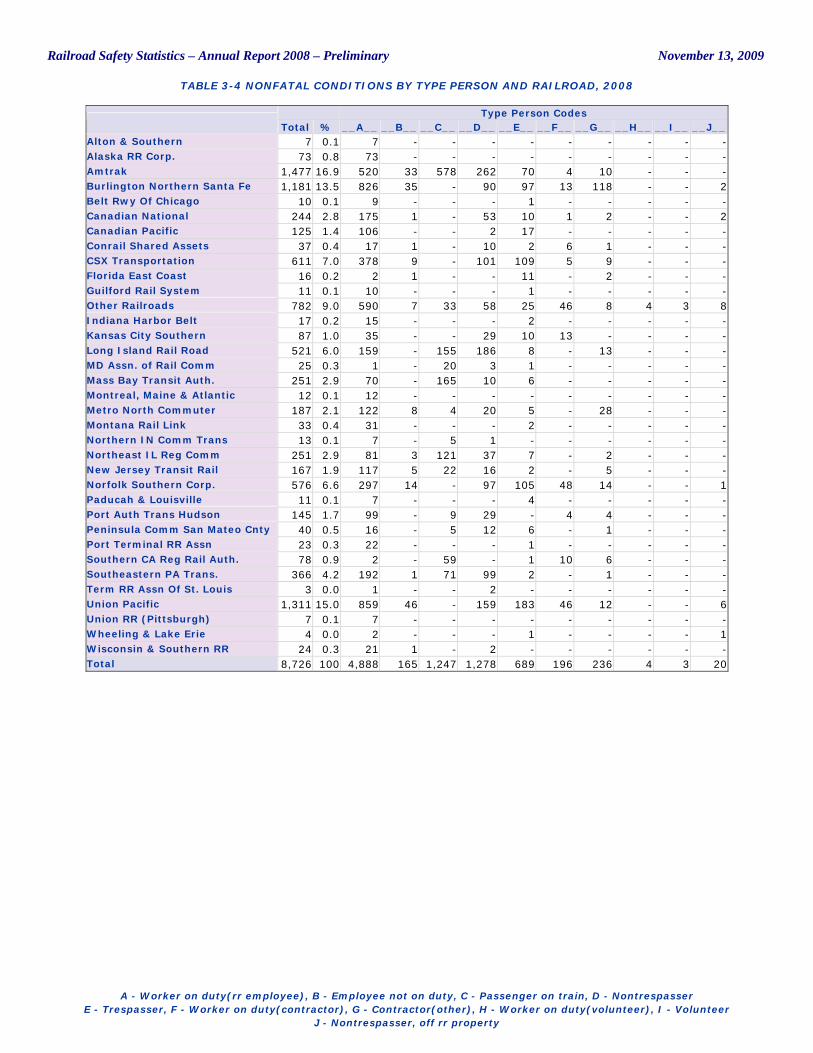
TABLE 3-4 NONFATAL CONDITIONS BY TYPE PERSON AND RAILROAD, 2008
A - Worker on duty(rr employee), B - Employee not on duty, C - Passenger on train, D - Nontrespasser
E - Trespasser, F - Worker on duty(contractor), G - Contractor(other), H - Worker on duty(volunteer), I - Volunteer J - Nontrespasser, off rr property
Type Person Codes
Total % __A__ __B__ __C__ __D__ __E__ __F__ __G__ __H__ __I__ __J__ Alton & Southern 7 0.1 7 - - - - - - - - - Alaska RR Corp. 73 0.8 73 - - - - - - - - - Amtrak 1,477 16.9 520 33 578 262 70 4 10 - - - Burlington Northern Santa Fe 1,181 13.5 826 35 - 90 97 13 118 - - 2 Belt Rwy Of Chicago 10 0.1 9 - - - 1 - - - - - Canadian National 244 2.8 175 1 - 53 10 1 2 - - 2 Canadian Pacific 125 1.4 106 - - 2 17 - - - - - Conrail Shared Assets 37 0.4 17 1 - 10 2 6 1 - - - CSX Transportation 611 7.0 378 9 - 101 109 5 9 - - - Florida East Coast 16 0.2 2 1 - - 11 - 2 - - - Guilford Rail System 11 0.1 10 - - - 1 - - - - - Other Railroads 782 9.0 590 7 33 58 25 46 8 4 3 8 Indiana Harbor Belt 17 0.2 15 - - - 2 - - - - - Kansas City Southern 87 1.0 35 - - 29 10 13 - - - - Long Island Rail Road 521 6.0 159 - 155 186 8 - 13 - - - MD Assn. of Rail Comm 25 0.3 1 - 20 3 1 - - - - - Mass Bay Transit Auth. 251 2.9 70 - 165 10 6 - - - - - Montreal, Maine & Atlantic 12 0.1 12 - - - - - - - - - Metro North Commuter 187 2.1 122 8 4 20 5 - 28 - - - Montana Rail Link 33 0.4 31 - - - 2 - - - - - Northern IN Comm Trans 13 0.1 7 - 5 1 - - - - - - Northeast IL Reg Comm 251 2.9 81 3 121 37 7 - 2 - - - New Jersey Transit Rail 167 1.9 117 5 22 16 2 - 5 - - - Norfolk Southern Corp. 576 6.6 297 14 - 97 105 48 14 - - 1 Paducah & Louisville 11 0.1 7 - - - 4 - - - - - Port Auth Trans Hudson 145 1.7 99 - 9 29 - 4 4 - - - Peninsula Comm San Mateo Cnty 40 0.5 16 - 5 12 6 - 1 - - - Port Terminal RR Assn 23 0.3 22 - - - 1 - - - - - Southern CA Reg Rail Auth. 78 0.9 2 - 59 - 1 10 6 - - - Southeastern PA Trans. 366 4.2 192 1 71 99 2 - 1 - - - Term RR Assn Of St. Louis 3 0.0 1 - - 2 - - - - - - Union Pacific 1,311 15.0 859 46 - 159 183 46 12 - - 6 Union RR (Pittsburgh) 7 0.1 7 - - - - - - - - - Wheeling & Lake Erie 4 0.0 2 - - - 1 - - - - 1 Wisconsin & Southern RR 24 0.3 21 1 - 2 - - - - - - Total 8,726 100 4,888 165 1,247 1,278 689 196 236 4 3 20
Railroad Safety Statistics – Annual Report 2008 – Preliminary November 13, 2009
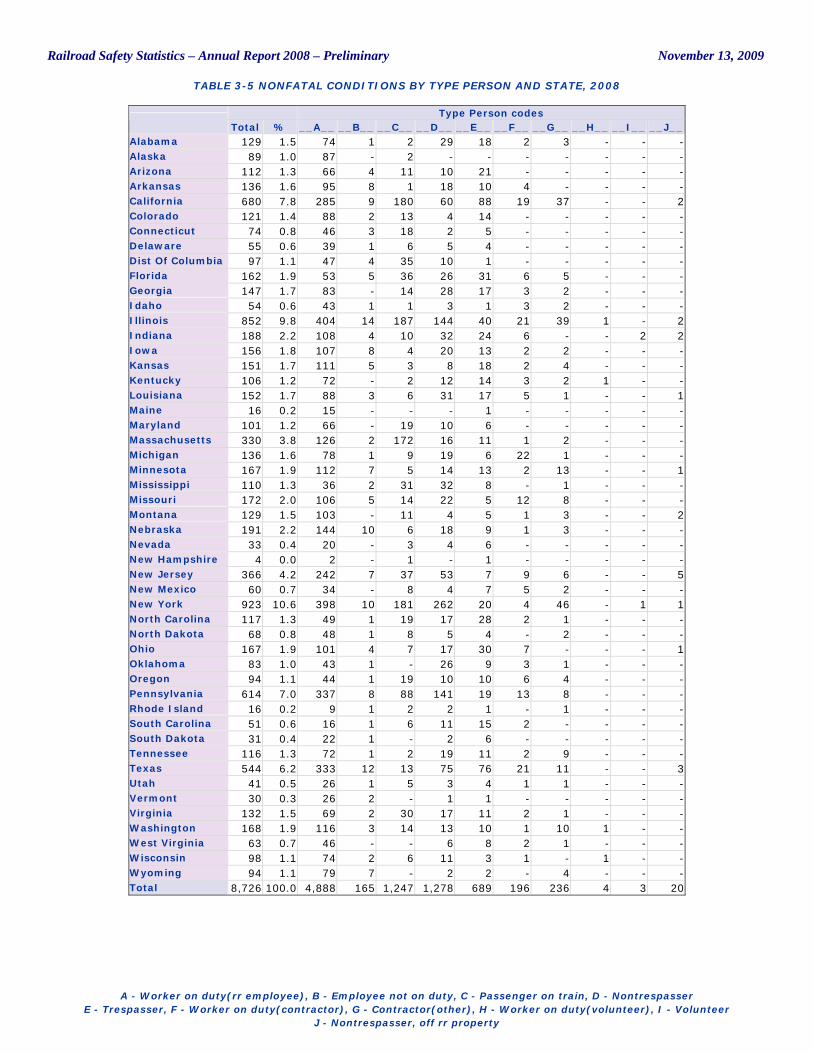
TABLE 3-5 NONFATAL CONDITIONS BY TYPE PERSON AND STATE, 2008
A - Worker on duty(rr employee), B - Employee not on duty, C - Passenger on train, D - Nontrespasser
E - Trespasser, F - Worker on duty(contractor), G - Contractor(other), H - Worker on duty(volunteer), I - Volunteer J - Nontrespasser, off rr property
Type Person codes
Total % __A__ __B__ __C__ __D__ __E__ __F__ __G__ __H__ __I__ __J__ Alabama 129 1.5 74 1 2 29 18 2 3 - - - Alaska 89 1.0 87 - 2 - - - - - - - Arizona 112 1.3 66 4 11 10 21 - - - - - Arkansas 136 1.6 95 8 1 18 10 4 - - - - California 680 7.8 285 9 180 60 88 19 37 - - 2 Colorado 121 1.4 88 2 13 4 14 - - - - - Connecticut 74 0.8 46 3 18 2 5 - - - - - Delaware 55 0.6 39 1 6 5 4 - - - - - Dist Of Columbia 97 1.1 47 4 35 10 1 - - - - - Florida 162 1.9 53 5 36 26 31 6 5 - - - Georgia 147 1.7 83 - 14 28 17 3 2 - - - Idaho 54 0.6 43 1 1 3 1 3 2 - - - Illinois 852 9.8 404 14 187 144 40 21 39 1 - 2 Indiana 188 2.2 108 4 10 32 24 6 - - 2 2 Iowa 156 1.8 107 8 4 20 13 2 2 - - - Kansas 151 1.7 111 5 3 8 18 2 4 - - - Kentucky 106 1.2 72 - 2 12 14 3 2 1 - - Louisiana 152 1.7 88 3 6 31 17 5 1 - - 1 Maine 16 0.2 15 - - - 1 - - - - - Maryland 101 1.2 66 - 19 10 6 - - - - - Massachusetts 330 3.8 126 2 172 16 11 1 2 - - - Michigan 136 1.6 78 1 9 19 6 22 1 - - - Minnesota 167 1.9 112 7 5 14 13 2 13 - - 1 Mississippi 110 1.3 36 2 31 32 8 - 1 - - - Missouri 172 2.0 106 5 14 22 5 12 8 - - - Montana 129 1.5 103 - 11 4 5 1 3 - - 2 Nebraska 191 2.2 144 10 6 18 9 1 3 - - - Nevada 33 0.4 20 - 3 4 6 - - - - - New Hampshire 4 0.0 2 - 1 - 1 - - - - - New Jersey 366 4.2 242 7 37 53 7 9 6 - - 5 New Mexico 60 0.7 34 - 8 4 7 5 2 - - - New York 923 10.6 398 10 181 262 20 4 46 - 1 1 North Carolina 117 1.3 49 1 19 17 28 2 1 - - - North Dakota 68 0.8 48 1 8 5 4 - 2 - - - Ohio 167 1.9 101 4 7 17 30 7 - - - 1 Oklahoma 83 1.0 43 1 - 26 9 3 1 - - - Oregon 94 1.1 44 1 19 10 10 6 4 - - - Pennsylvania 614 7.0 337 8 88 141 19 13 8 - - - Rhode Island 16 0.2 9 1 2 2 1 - 1 - - - South Carolina 51 0.6 16 1 6 11 15 2 - - - - South Dakota 31 0.4 22 1 - 2 6 - - - - - Tennessee 116 1.3 72 1 2 19 11 2 9 - - - Texas 544 6.2 333 12 13 75 76 21 11 - - 3 Utah 41 0.5 26 1 5 3 4 1 1 - - - Vermont 30 0.3 26 2 - 1 1 - - - - - Virginia 132 1.5 69 2 30 17 11 2 1 - - - Washington 168 1.9 116 3 14 13 10 1 10 1 - - West Virginia 63 0.7 46 - - 6 8 2 1 - - - Wisconsin 98 1.1 74 2 6 11 3 1 - 1 - - Wyoming 94 1.1 79 7 - 2 2 - 4 - - - Total 8,726 100.0 4,888 165 1,247 1,278 689 196 236 4 3 20
Railroad Safety Statistics – Annual Report 2008 – Preliminary November 13, 2009
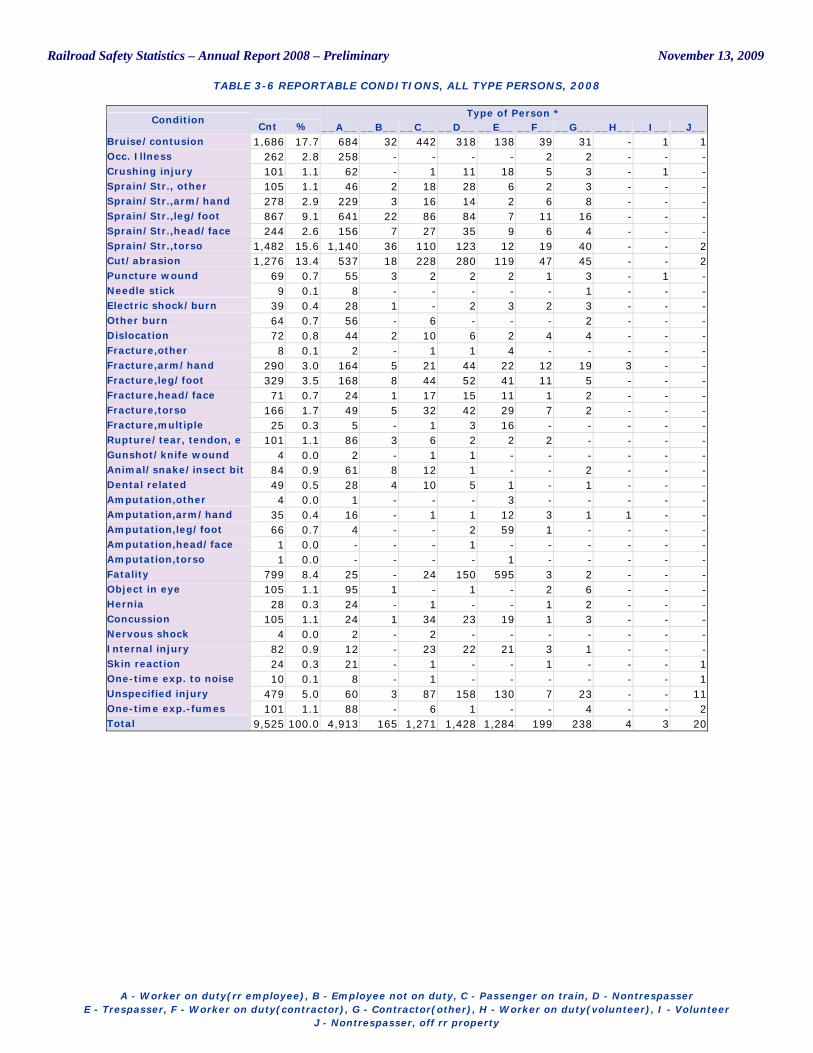
TABLE 3-6 REPORTABLE CONDITIONS, ALL TYPE PERSONS, 2008
A - Worker on duty(rr employee), B - Employee not on duty, C - Passenger on train, D - Nontrespasser
E - Trespasser, F - Worker on duty(contractor), G - Contractor(other), H - Worker on duty(volunteer), I - Volunteer J - Nontrespasser, off rr property
Type of Person * Condition
Cnt % __A__ __B__ __C__ __D__ __E__ __F__ __G__ __H__ __I__ __J__ Bruise/contusion 1,686 17.7 684 32 442 318 138 39 31 - 1 1 Occ. Illness 262 2.8 258 - - - - 2 2 - - - Crushing injury 101 1.1 62 - 1 11 18 5 3 - 1 - Sprain/Str., other 105 1.1 46 2 18 28 6 2 3 - - - Sprain/Str.,arm/hand 278 2.9 229 3 16 14 2 6 8 - - - Sprain/Str.,leg/foot 867 9.1 641 22 86 84 7 11 16 - - - Sprain/Str.,head/face 244 2.6 156 7 27 35 9 6 4 - - - Sprain/Str.,torso 1,482 15.6 1,140 36 110 123 12 19 40 - - 2 Cut/abrasion 1,276 13.4 537 18 228 280 119 47 45 - - 2 Puncture wound 69 0.7 55 3 2 2 2 1 3 - 1 - Needle stick 9 0.1 8 - - - - - 1 - - - Electric shock/burn 39 0.4 28 1 - 2 3 2 3 - - - Other burn 64 0.7 56 - 6 - - - 2 - - - Dislocation 72 0.8 44 2 10 6 2 4 4 - - - Fracture,other 8 0.1 2 - 1 1 4 - - - - - Fracture,arm/hand 290 3.0 164 5 21 44 22 12 19 3 - - Fracture,leg/foot 329 3.5 168 8 44 52 41 11 5 - - - Fracture,head/face 71 0.7 24 1 17 15 11 1 2 - - - Fracture,torso 166 1.7 49 5 32 42 29 7 2 - - - Fracture,multiple 25 0.3 5 - 1 3 16 - - - - - Rupture/tear, tendon, e 101 1.1 86 3 6 2 2 2 - - - - Gunshot/knife wound 4 0.0 2 - 1 1 - - - - - - Animal/snake/insect bit 84 0.9 61 8 12 1 - - 2 - - - Dental related 49 0.5 28 4 10 5 1 - 1 - - - Amputation,other 4 0.0 1 - - - 3 - - - - - Amputation,arm/hand 35 0.4 16 - 1 1 12 3 1 1 - - Amputation,leg/foot 66 0.7 4 - - 2 59 1 - - - - Amputation,head/face 1 0.0 - - - 1 - - - - - - Amputation,torso 1 0.0 - - - - 1 - - - - - Fatality 799 8.4 25 - 24 150 595 3 2 - - - Object in eye 105 1.1 95 1 - 1 - 2 6 - - - Hernia 28 0.3 24 - 1 - - 1 2 - - - Concussion 105 1.1 24 1 34 23 19 1 3 - - - Nervous shock 4 0.0 2 - 2 - - - - - - - Internal injury 82 0.9 12 - 23 22 21 3 1 - - - Skin reaction 24 0.3 21 - 1 - - 1 - - - 1 One-time exp. to noise 10 0.1 8 - 1 - - - - - - 1 Unspecified injury 479 5.0 60 3 87 158 130 7 23 - - 11 One-time exp.-fumes 101 1.1 88 - 6 1 - - 4 - - 2 Total 9,525 100.0 4,913 165 1,271 1,428 1,284 199 238 4 3 20
Railroad Safety Statistics – Annual Report 2008 – Preliminary November 13, 2009
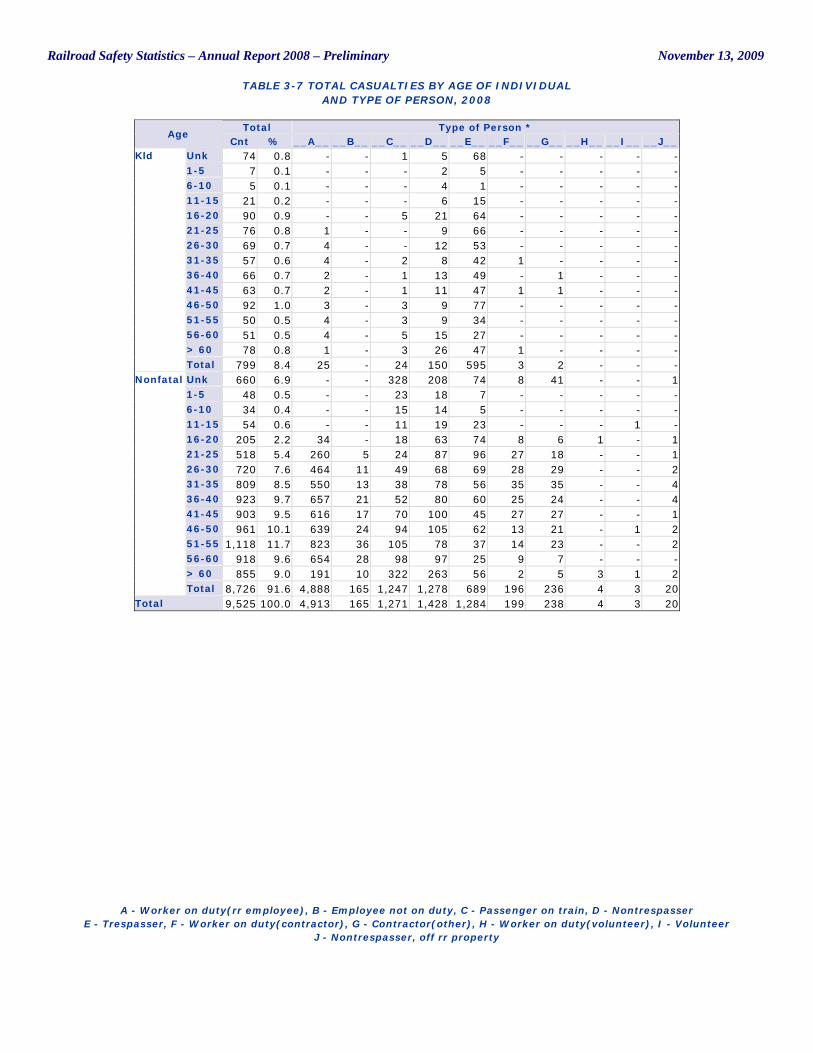
TABLE 3-7 TOTAL CASUALTIES BY AGE OF INDIVIDUAL AND TYPE OF PERSON, 2008
A - Worker on duty(rr employee), B - Employee not on duty, C - Passenger on train, D - Nontrespasser
E - Trespasser, F - Worker on duty(contractor), G - Contractor(other), H - Worker on duty(volunteer), I - Volunteer J - Nontrespasser, off rr property
Total Type of Person * Age
Cnt % __A__ __B__ __C__ __D__ __E__ __F__ __G__ __H__ __I__ __J__ Unk 74 0.8 - - 1 5 68 - - - - - 1-5 7 0.1 - - - 2 5 - - - - - 6-10 5 0.1 - - - 4 1 - - - - - 11-15 21 0.2 - - - 6 15 - - - - - 16-20 90 0.9 - - 5 21 64 - - - - - 21-25 76 0.8 1 - - 9 66 - - - - - 26-30 69 0.7 4 - - 12 53 - - - - - 31-35 57 0.6 4 - 2 8 42 1 - - - - 36-40 66 0.7 2 - 1 13 49 - 1 - - - 41-45 63 0.7 2 - 1 11 47 1 1 - - - 46-50 92 1.0 3 - 3 9 77 - - - - - 51-55 50 0.5 4 - 3 9 34 - - - - - 56-60 51 0.5 4 - 5 15 27 - - - - - > 60 78 0.8 1 - 3 26 47 1 - - - -
Kld
Total 799 8.4 25 - 24 150 595 3 2 - - - Unk 660 6.9 - - 328 208 74 8 41 - - 1 1-5 48 0.5 - - 23 18 7 - - - - - 6-10 34 0.4 - - 15 14 5 - - - - - 11-15 54 0.6 - - 11 19 23 - - - 1 - 16-20 205 2.2 34 - 18 63 74 8 6 1 - 1 21-25 518 5.4 260 5 24 87 96 27 18 - - 1 26-30 720 7.6 464 11 49 68 69 28 29 - - 2 31-35 809 8.5 550 13 38 78 56 35 35 - - 4 36-40 923 9.7 657 21 52 80 60 25 24 - - 4 41-45 903 9.5 616 17 70 100 45 27 27 - - 1 46-50 961 10.1 639 24 94 105 62 13 21 - 1 2 51-55 1,118 11.7 823 36 105 78 37 14 23 - - 2 56-60 918 9.6 654 28 98 97 25 9 7 - - - > 60 855 9.0 191 10 322 263 56 2 5 3 1 2
Nonfatal
Total 8,726 91.6 4,888 165 1,247 1,278 689 196 236 4 3 20 Total 9,525 100.0 4,913 165 1,271 1,428 1,284 199 238 4 3 20
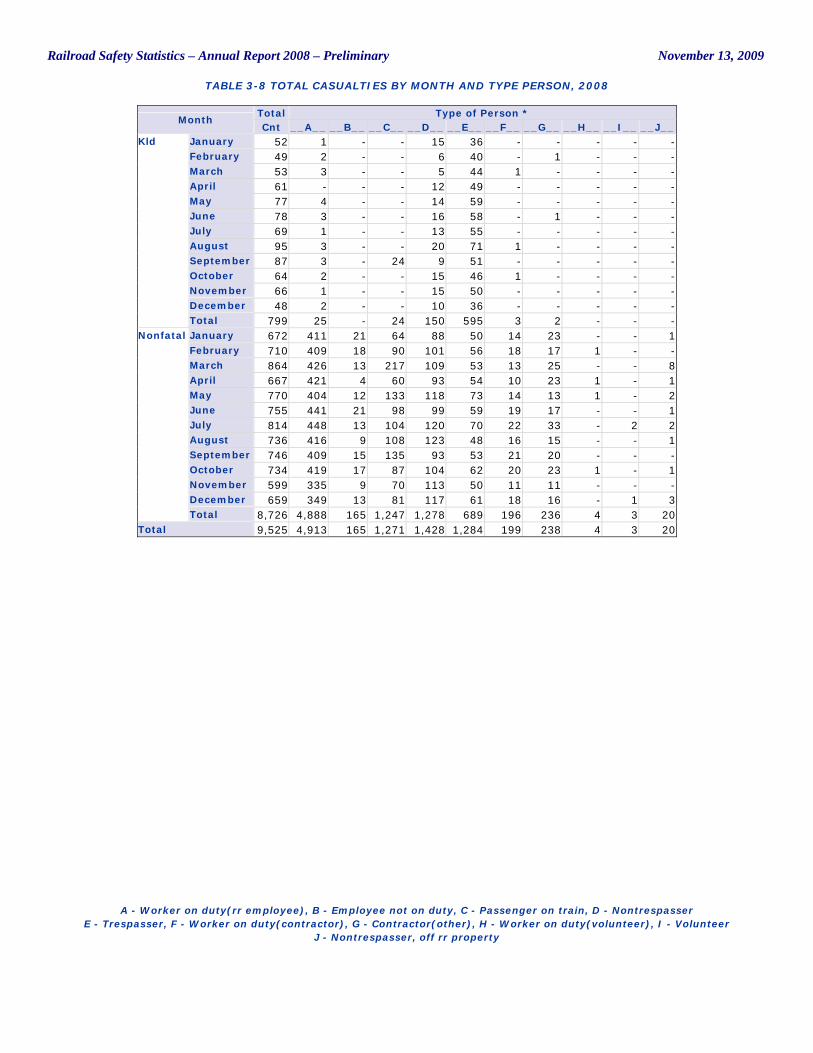
Railroad Safety Statistics – Annual Report 2008 – Preliminary November 13, 2009
TABLE 3-8 TOTAL CASUALTIES BY MONTH AND TYPE PERSON, 2008
A - Worker on duty(rr employee), B - Employee not on duty, C - Passenger on train, D - Nontrespasser
E - Trespasser, F - Worker on duty(contractor), G - Contractor(other), H - Worker on duty(volunteer), I - Volunteer J - Nontrespasser, off rr property
Total Type of Person * Month
Cnt __A__ __B__ __C__ __D__ __E__ __F__ __G__ __H__ __I__ __J__ January 52 1 - - 15 36 - - - - - February 49 2 - - 6 40 - 1 - - - March 53 3 - - 5 44 1 - - - - April 61 - - - 12 49 - - - - - May 77 4 - - 14 59 - - - - - June 78 3 - - 16 58 - 1 - - - July 69 1 - - 13 55 - - - - - August 95 3 - - 20 71 1 - - - - September 87 3 - 24 9 51 - - - - - October 64 2 - - 15 46 1 - - - - November 66 1 - - 15 50 - - - - - December 48 2 - - 10 36 - - - - -
Kld
Total 799 25 - 24 150 595 3 2 - - - January 672 411 21 64 88 50 14 23 - - 1 February 710 409 18 90 101 56 18 17 1 - - March 864 426 13 217 109 53 13 25 - - 8 April 667 421 4 60 93 54 10 23 1 - 1 May 770 404 12 133 118 73 14 13 1 - 2 June 755 441 21 98 99 59 19 17 - - 1 July 814 448 13 104 120 70 22 33 - 2 2 August 736 416 9 108 123 48 16 15 - - 1 September 746 409 15 135 93 53 21 20 - - - October 734 419 17 87 104 62 20 23 1 - 1 November 599 335 9 70 113 50 11 11 - - - December 659 349 13 81 117 61 18 16 - 1 3
Nonfatal
Total 8,726 4,888 165 1,247 1,278 689 196 236 4 3 20 Total 9,525 4,913 165 1,271 1,428 1,284 199 238 4 3 20
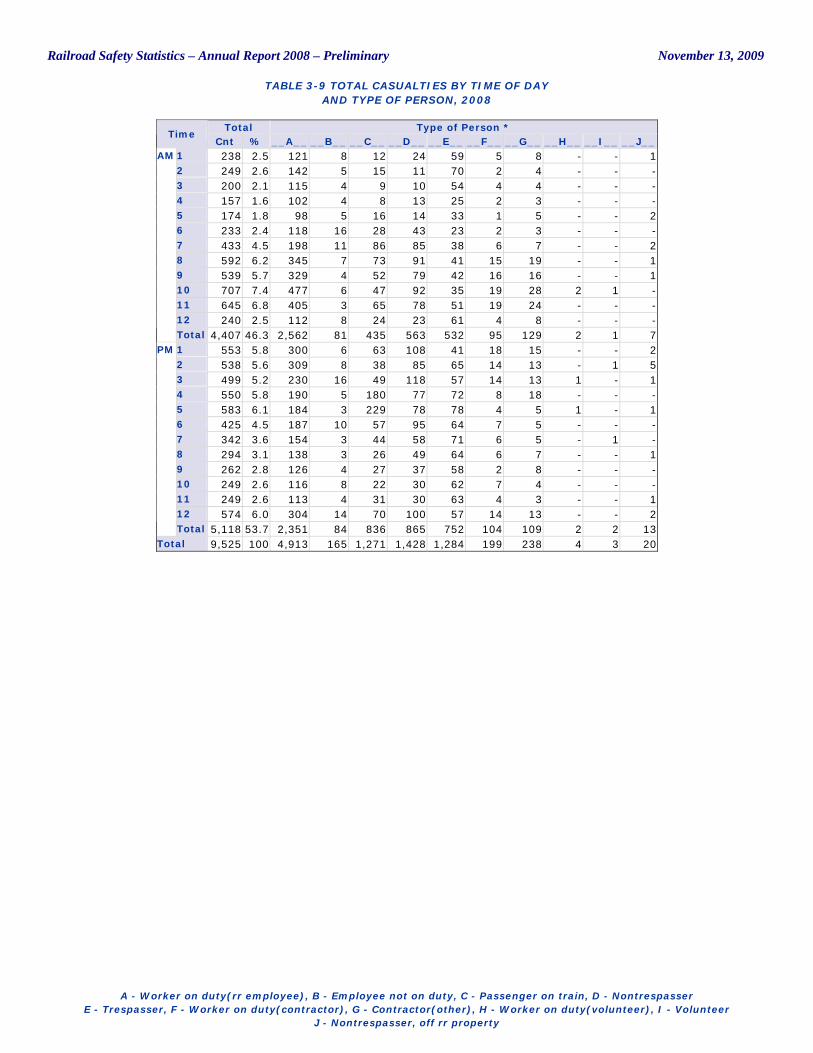
Railroad Safety Statistics – Annual Report 2008 – Preliminary November 13, 2009
TABLE 3-9 TOTAL CASUALTIES BY TIME OF DAY AND TYPE OF PERSON, 2008
A - Worker on duty(rr employee), B - Employee not on duty, C - Passenger on train, D - Nontrespasser
E - Trespasser, F - Worker on duty(contractor), G - Contractor(other), H - Worker on duty(volunteer), I - Volunteer J - Nontrespasser, off rr property
Total Type of Person * Time
Cnt % __A__ __B__ __C__ __D__ __E__ __F__ __G__ __H__ __I__ __J__ 1 238 2.5 121 8 12 24 59 5 8 - - 1 2 249 2.6 142 5 15 11 70 2 4 - - - 3 200 2.1 115 4 9 10 54 4 4 - - - 4 157 1.6 102 4 8 13 25 2 3 - - - 5 174 1.8 98 5 16 14 33 1 5 - - 2 6 233 2.4 118 16 28 43 23 2 3 - - - 7 433 4.5 198 11 86 85 38 6 7 - - 2 8 592 6.2 345 7 73 91 41 15 19 - - 1 9 539 5.7 329 4 52 79 42 16 16 - - 1 10 707 7.4 477 6 47 92 35 19 28 2 1 - 11 645 6.8 405 3 65 78 51 19 24 - - - 12 240 2.5 112 8 24 23 61 4 8 - - -
AM
Total 4,407 46.3 2,562 81 435 563 532 95 129 2 1 7 1 553 5.8 300 6 63 108 41 18 15 - - 2 2 538 5.6 309 8 38 85 65 14 13 - 1 5 3 499 5.2 230 16 49 118 57 14 13 1 - 1 4 550 5.8 190 5 180 77 72 8 18 - - - 5 583 6.1 184 3 229 78 78 4 5 1 - 1 6 425 4.5 187 10 57 95 64 7 5 - - - 7 342 3.6 154 3 44 58 71 6 5 - 1 - 8 294 3.1 138 3 26 49 64 6 7 - - 1 9 262 2.8 126 4 27 37 58 2 8 - - - 10 249 2.6 116 8 22 30 62 7 4 - - - 11 249 2.6 113 4 31 30 63 4 3 - - 1 12 574 6.0 304 14 70 100 57 14 13 - - 2
PM
Total 5,118 53.7 2,351 84 836 865 752 104 109 2 2 13 Total 9,525 100 4,913 165 1,271 1,428 1,284 199 238 4 3 20
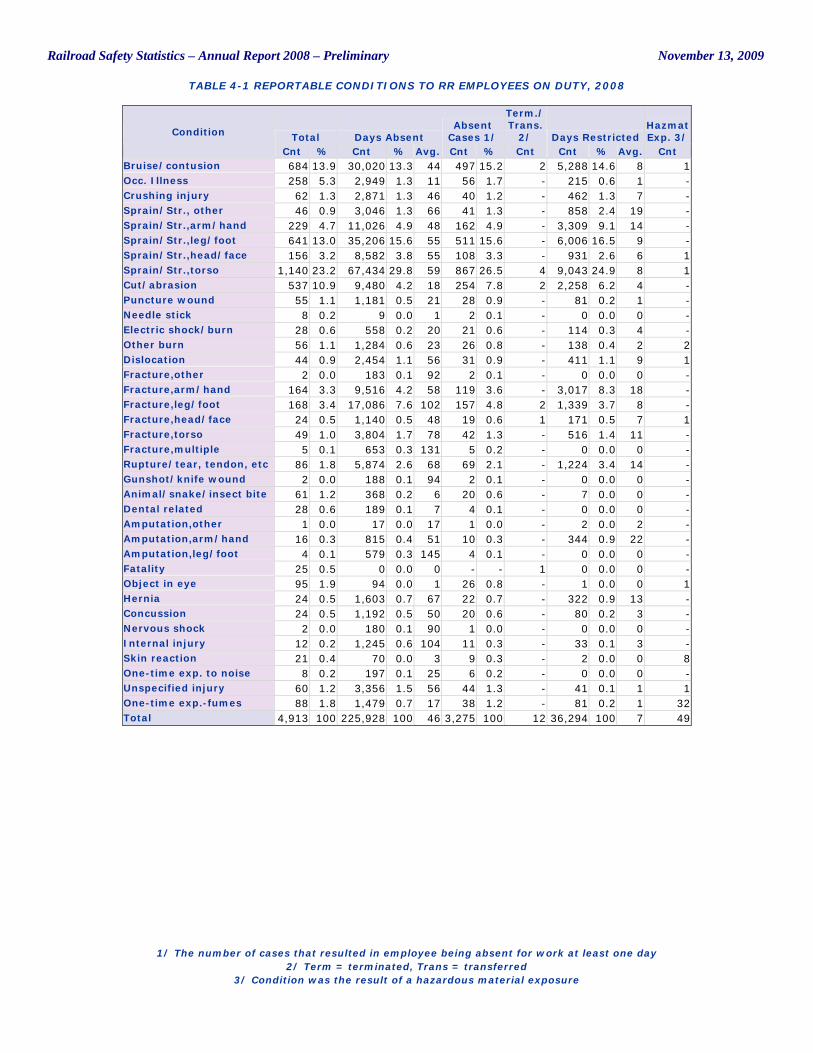
Railroad Safety Statistics – Annual Report 2008 – Preliminary November 13, 2009
TABLE 4-1 REPORTABLE CONDITIONS TO RR EMPLOYEES ON DUTY, 2008
1/ The number of cases that resulted in employee being absent for work at least one day
2/ Term = terminated, Trans = transferred 3/ Condition was the result of a hazardous material exposure
Total Days Absent Absent
Cases 1/
Term./ Trans.
2/ Days Restricted Hazmat Exp. 3/ Condition
Cnt % Cnt % Avg. Cnt % Cnt Cnt % Avg. Cnt Bruise/contusion 684 13.9 30,020 13.3 44 497 15.2 2 5,288 14.6 8 1 Occ. Illness 258 5.3 2,949 1.3 11 56 1.7 - 215 0.6 1 - Crushing injury 62 1.3 2,871 1.3 46 40 1.2 - 462 1.3 7 - Sprain/Str., other 46 0.9 3,046 1.3 66 41 1.3 - 858 2.4 19 - Sprain/Str.,arm/hand 229 4.7 11,026 4.9 48 162 4.9 - 3,309 9.1 14 - Sprain/Str.,leg/foot 641 13.0 35,206 15.6 55 511 15.6 - 6,006 16.5 9 - Sprain/Str.,head/face 156 3.2 8,582 3.8 55 108 3.3 - 931 2.6 6 1 Sprain/Str.,torso 1,140 23.2 67,434 29.8 59 867 26.5 4 9,043 24.9 8 1 Cut/abrasion 537 10.9 9,480 4.2 18 254 7.8 2 2,258 6.2 4 - Puncture wound 55 1.1 1,181 0.5 21 28 0.9 - 81 0.2 1 - Needle stick 8 0.2 9 0.0 1 2 0.1 - 0 0.0 0 - Electric shock/burn 28 0.6 558 0.2 20 21 0.6 - 114 0.3 4 - Other burn 56 1.1 1,284 0.6 23 26 0.8 - 138 0.4 2 2 Dislocation 44 0.9 2,454 1.1 56 31 0.9 - 411 1.1 9 1 Fracture,other 2 0.0 183 0.1 92 2 0.1 - 0 0.0 0 - Fracture,arm/hand 164 3.3 9,516 4.2 58 119 3.6 - 3,017 8.3 18 - Fracture,leg/foot 168 3.4 17,086 7.6 102 157 4.8 2 1,339 3.7 8 - Fracture,head/face 24 0.5 1,140 0.5 48 19 0.6 1 171 0.5 7 1 Fracture,torso 49 1.0 3,804 1.7 78 42 1.3 - 516 1.4 11 - Fracture,multiple 5 0.1 653 0.3 131 5 0.2 - 0 0.0 0 - Rupture/tear, tendon, etc 86 1.8 5,874 2.6 68 69 2.1 - 1,224 3.4 14 - Gunshot/knife wound 2 0.0 188 0.1 94 2 0.1 - 0 0.0 0 - Animal/snake/insect bite 61 1.2 368 0.2 6 20 0.6 - 7 0.0 0 - Dental related 28 0.6 189 0.1 7 4 0.1 - 0 0.0 0 - Amputation,other 1 0.0 17 0.0 17 1 0.0 - 2 0.0 2 - Amputation,arm/hand 16 0.3 815 0.4 51 10 0.3 - 344 0.9 22 - Amputation,leg/foot 4 0.1 579 0.3 145 4 0.1 - 0 0.0 0 - Fatality 25 0.5 0 0.0 0 - - 1 0 0.0 0 - Object in eye 95 1.9 94 0.0 1 26 0.8 - 1 0.0 0 1 Hernia 24 0.5 1,603 0.7 67 22 0.7 - 322 0.9 13 - Concussion 24 0.5 1,192 0.5 50 20 0.6 - 80 0.2 3 - Nervous shock 2 0.0 180 0.1 90 1 0.0 - 0 0.0 0 - Internal injury 12 0.2 1,245 0.6 104 11 0.3 - 33 0.1 3 - Skin reaction 21 0.4 70 0.0 3 9 0.3 - 2 0.0 0 8 One-time exp. to noise 8 0.2 197 0.1 25 6 0.2 - 0 0.0 0 - Unspecified injury 60 1.2 3,356 1.5 56 44 1.3 - 41 0.1 1 1 One-time exp.-fumes 88 1.8 1,479 0.7 17 38 1.2 - 81 0.2 1 32 Total 4,913 100 225,928 100 46 3,275 100 12 36,294 100 7 49
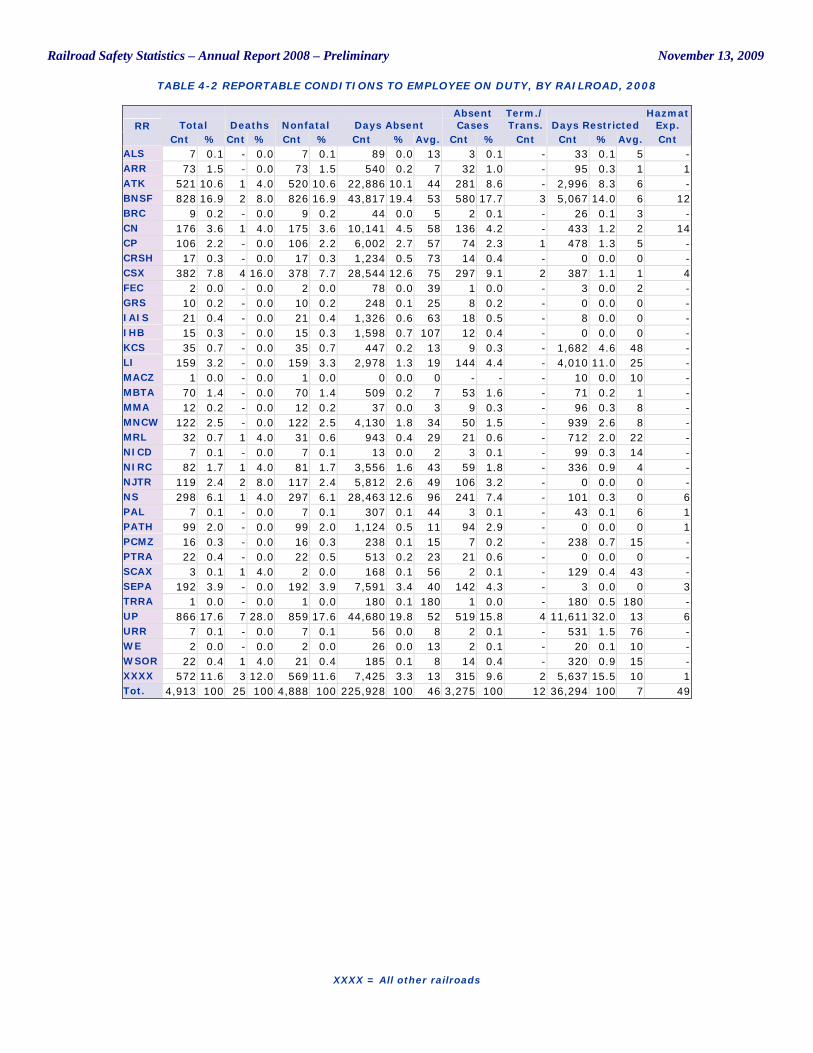
Railroad Safety Statistics – Annual Report 2008 – Preliminary November 13, 2009
TABLE 4-2 REPORTABLE CONDITIONS TO EMPLOYEE ON DUTY, BY RAILROAD, 2008
XXXX = All other railroads
Total Deaths Nonfatal Days Absent Absent Cases
Term./ Trans. Days Restricted
Hazmat Exp. RR
Cnt % Cnt % Cnt % Cnt % Avg. Cnt % Cnt Cnt % Avg. Cnt ALS 7 0.1 - 0.0 7 0.1 89 0.0 13 3 0.1 - 33 0.1 5 - ARR 73 1.5 - 0.0 73 1.5 540 0.2 7 32 1.0 - 95 0.3 1 1 ATK 521 10.6 1 4.0 520 10.6 22,886 10.1 44 281 8.6 - 2,996 8.3 6 - BNSF 828 16.9 2 8.0 826 16.9 43,817 19.4 53 580 17.7 3 5,067 14.0 6 12 BRC 9 0.2 - 0.0 9 0.2 44 0.0 5 2 0.1 - 26 0.1 3 - CN 176 3.6 1 4.0 175 3.6 10,141 4.5 58 136 4.2 - 433 1.2 2 14 CP 106 2.2 - 0.0 106 2.2 6,002 2.7 57 74 2.3 1 478 1.3 5 - CRSH 17 0.3 - 0.0 17 0.3 1,234 0.5 73 14 0.4 - 0 0.0 0 - CSX 382 7.8 4 16.0 378 7.7 28,544 12.6 75 297 9.1 2 387 1.1 1 4 FEC 2 0.0 - 0.0 2 0.0 78 0.0 39 1 0.0 - 3 0.0 2 - GRS 10 0.2 - 0.0 10 0.2 248 0.1 25 8 0.2 - 0 0.0 0 - IAIS 21 0.4 - 0.0 21 0.4 1,326 0.6 63 18 0.5 - 8 0.0 0 - IHB 15 0.3 - 0.0 15 0.3 1,598 0.7 107 12 0.4 - 0 0.0 0 - KCS 35 0.7 - 0.0 35 0.7 447 0.2 13 9 0.3 - 1,682 4.6 48 - LI 159 3.2 - 0.0 159 3.3 2,978 1.3 19 144 4.4 - 4,010 11.0 25 - MACZ 1 0.0 - 0.0 1 0.0 0 0.0 0 - - - 10 0.0 10 - MBTA 70 1.4 - 0.0 70 1.4 509 0.2 7 53 1.6 - 71 0.2 1 - MMA 12 0.2 - 0.0 12 0.2 37 0.0 3 9 0.3 - 96 0.3 8 - MNCW 122 2.5 - 0.0 122 2.5 4,130 1.8 34 50 1.5 - 939 2.6 8 - MRL 32 0.7 1 4.0 31 0.6 943 0.4 29 21 0.6 - 712 2.0 22 - NICD 7 0.1 - 0.0 7 0.1 13 0.0 2 3 0.1 - 99 0.3 14 - NIRC 82 1.7 1 4.0 81 1.7 3,556 1.6 43 59 1.8 - 336 0.9 4 - NJTR 119 2.4 2 8.0 117 2.4 5,812 2.6 49 106 3.2 - 0 0.0 0 - NS 298 6.1 1 4.0 297 6.1 28,463 12.6 96 241 7.4 - 101 0.3 0 6 PAL 7 0.1 - 0.0 7 0.1 307 0.1 44 3 0.1 - 43 0.1 6 1 PATH 99 2.0 - 0.0 99 2.0 1,124 0.5 11 94 2.9 - 0 0.0 0 1 PCMZ 16 0.3 - 0.0 16 0.3 238 0.1 15 7 0.2 - 238 0.7 15 - PTRA 22 0.4 - 0.0 22 0.5 513 0.2 23 21 0.6 - 0 0.0 0 - SCAX 3 0.1 1 4.0 2 0.0 168 0.1 56 2 0.1 - 129 0.4 43 - SEPA 192 3.9 - 0.0 192 3.9 7,591 3.4 40 142 4.3 - 3 0.0 0 3 TRRA 1 0.0 - 0.0 1 0.0 180 0.1 180 1 0.0 - 180 0.5 180 - UP 866 17.6 7 28.0 859 17.6 44,680 19.8 52 519 15.8 4 11,611 32.0 13 6 URR 7 0.1 - 0.0 7 0.1 56 0.0 8 2 0.1 - 531 1.5 76 - WE 2 0.0 - 0.0 2 0.0 26 0.0 13 2 0.1 - 20 0.1 10 - WSOR 22 0.4 1 4.0 21 0.4 185 0.1 8 14 0.4 - 320 0.9 15 - XXXX 572 11.6 3 12.0 569 11.6 7,425 3.3 13 315 9.6 2 5,637 15.5 10 1 Tot. 4,913 100 25 100 4,888 100 225,928 100 46 3,275 100 12 36,294 100 7 49
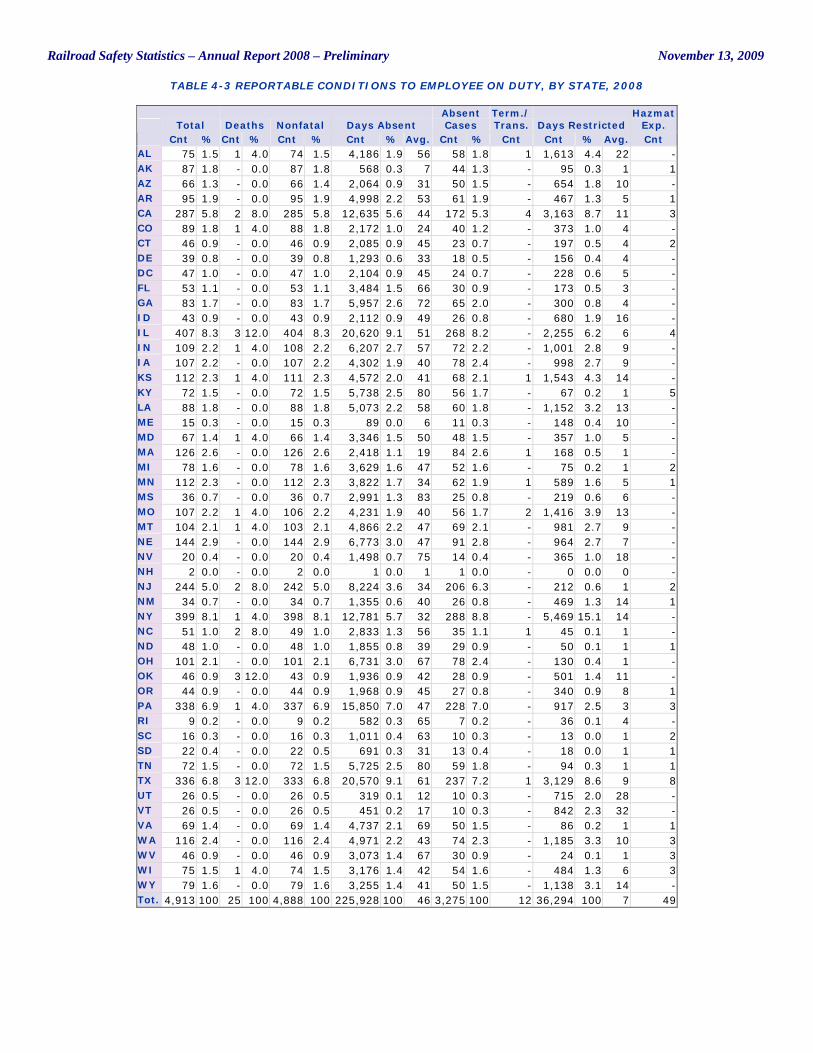
Railroad Safety Statistics – Annual Report 2008 – Preliminary November 13, 2009
TABLE 4-3 REPORTABLE CONDITIONS TO EMPLOYEE ON DUTY, BY STATE, 2008
Total Deaths Nonfatal Days Absent Absent Cases
Term./ Trans. Days Restricted
Hazmat Exp.
Cnt % Cnt % Cnt % Cnt % Avg. Cnt % Cnt Cnt % Avg. Cnt AL 75 1.5 1 4.0 74 1.5 4,186 1.9 56 58 1.8 1 1,613 4.4 22 - AK 87 1.8 - 0.0 87 1.8 568 0.3 7 44 1.3 - 95 0.3 1 1 AZ 66 1.3 - 0.0 66 1.4 2,064 0.9 31 50 1.5 - 654 1.8 10 - AR 95 1.9 - 0.0 95 1.9 4,998 2.2 53 61 1.9 - 467 1.3 5 1 CA 287 5.8 2 8.0 285 5.8 12,635 5.6 44 172 5.3 4 3,163 8.7 11 3 CO 89 1.8 1 4.0 88 1.8 2,172 1.0 24 40 1.2 - 373 1.0 4 - CT 46 0.9 - 0.0 46 0.9 2,085 0.9 45 23 0.7 - 197 0.5 4 2 DE 39 0.8 - 0.0 39 0.8 1,293 0.6 33 18 0.5 - 156 0.4 4 - DC 47 1.0 - 0.0 47 1.0 2,104 0.9 45 24 0.7 - 228 0.6 5 - FL 53 1.1 - 0.0 53 1.1 3,484 1.5 66 30 0.9 - 173 0.5 3 - GA 83 1.7 - 0.0 83 1.7 5,957 2.6 72 65 2.0 - 300 0.8 4 - ID 43 0.9 - 0.0 43 0.9 2,112 0.9 49 26 0.8 - 680 1.9 16 - IL 407 8.3 3 12.0 404 8.3 20,620 9.1 51 268 8.2 - 2,255 6.2 6 4 IN 109 2.2 1 4.0 108 2.2 6,207 2.7 57 72 2.2 - 1,001 2.8 9 - IA 107 2.2 - 0.0 107 2.2 4,302 1.9 40 78 2.4 - 998 2.7 9 - KS 112 2.3 1 4.0 111 2.3 4,572 2.0 41 68 2.1 1 1,543 4.3 14 - KY 72 1.5 - 0.0 72 1.5 5,738 2.5 80 56 1.7 - 67 0.2 1 5 LA 88 1.8 - 0.0 88 1.8 5,073 2.2 58 60 1.8 - 1,152 3.2 13 - ME 15 0.3 - 0.0 15 0.3 89 0.0 6 11 0.3 - 148 0.4 10 - MD 67 1.4 1 4.0 66 1.4 3,346 1.5 50 48 1.5 - 357 1.0 5 - MA 126 2.6 - 0.0 126 2.6 2,418 1.1 19 84 2.6 1 168 0.5 1 - MI 78 1.6 - 0.0 78 1.6 3,629 1.6 47 52 1.6 - 75 0.2 1 2 MN 112 2.3 - 0.0 112 2.3 3,822 1.7 34 62 1.9 1 589 1.6 5 1 MS 36 0.7 - 0.0 36 0.7 2,991 1.3 83 25 0.8 - 219 0.6 6 - MO 107 2.2 1 4.0 106 2.2 4,231 1.9 40 56 1.7 2 1,416 3.9 13 - MT 104 2.1 1 4.0 103 2.1 4,866 2.2 47 69 2.1 - 981 2.7 9 - NE 144 2.9 - 0.0 144 2.9 6,773 3.0 47 91 2.8 - 964 2.7 7 - NV 20 0.4 - 0.0 20 0.4 1,498 0.7 75 14 0.4 - 365 1.0 18 - NH 2 0.0 - 0.0 2 0.0 1 0.0 1 1 0.0 - 0 0.0 0 - NJ 244 5.0 2 8.0 242 5.0 8,224 3.6 34 206 6.3 - 212 0.6 1 2 NM 34 0.7 - 0.0 34 0.7 1,355 0.6 40 26 0.8 - 469 1.3 14 1 NY 399 8.1 1 4.0 398 8.1 12,781 5.7 32 288 8.8 - 5,469 15.1 14 - NC 51 1.0 2 8.0 49 1.0 2,833 1.3 56 35 1.1 1 45 0.1 1 - ND 48 1.0 - 0.0 48 1.0 1,855 0.8 39 29 0.9 - 50 0.1 1 1 OH 101 2.1 - 0.0 101 2.1 6,731 3.0 67 78 2.4 - 130 0.4 1 - OK 46 0.9 3 12.0 43 0.9 1,936 0.9 42 28 0.9 - 501 1.4 11 - OR 44 0.9 - 0.0 44 0.9 1,968 0.9 45 27 0.8 - 340 0.9 8 1 PA 338 6.9 1 4.0 337 6.9 15,850 7.0 47 228 7.0 - 917 2.5 3 3 RI 9 0.2 - 0.0 9 0.2 582 0.3 65 7 0.2 - 36 0.1 4 - SC 16 0.3 - 0.0 16 0.3 1,011 0.4 63 10 0.3 - 13 0.0 1 2 SD 22 0.4 - 0.0 22 0.5 691 0.3 31 13 0.4 - 18 0.0 1 1 TN 72 1.5 - 0.0 72 1.5 5,725 2.5 80 59 1.8 - 94 0.3 1 1 TX 336 6.8 3 12.0 333 6.8 20,570 9.1 61 237 7.2 1 3,129 8.6 9 8 UT 26 0.5 - 0.0 26 0.5 319 0.1 12 10 0.3 - 715 2.0 28 - VT 26 0.5 - 0.0 26 0.5 451 0.2 17 10 0.3 - 842 2.3 32 - VA 69 1.4 - 0.0 69 1.4 4,737 2.1 69 50 1.5 - 86 0.2 1 1 WA 116 2.4 - 0.0 116 2.4 4,971 2.2 43 74 2.3 - 1,185 3.3 10 3 WV 46 0.9 - 0.0 46 0.9 3,073 1.4 67 30 0.9 - 24 0.1 1 3 WI 75 1.5 1 4.0 74 1.5 3,176 1.4 42 54 1.6 - 484 1.3 6 3 WY 79 1.6 - 0.0 79 1.6 3,255 1.4 41 50 1.5 - 1,138 3.1 14 - Tot. 4,913 100 25 100 4,888 100 225,928 100 46 3,275 100 12 36,294 100 7 49
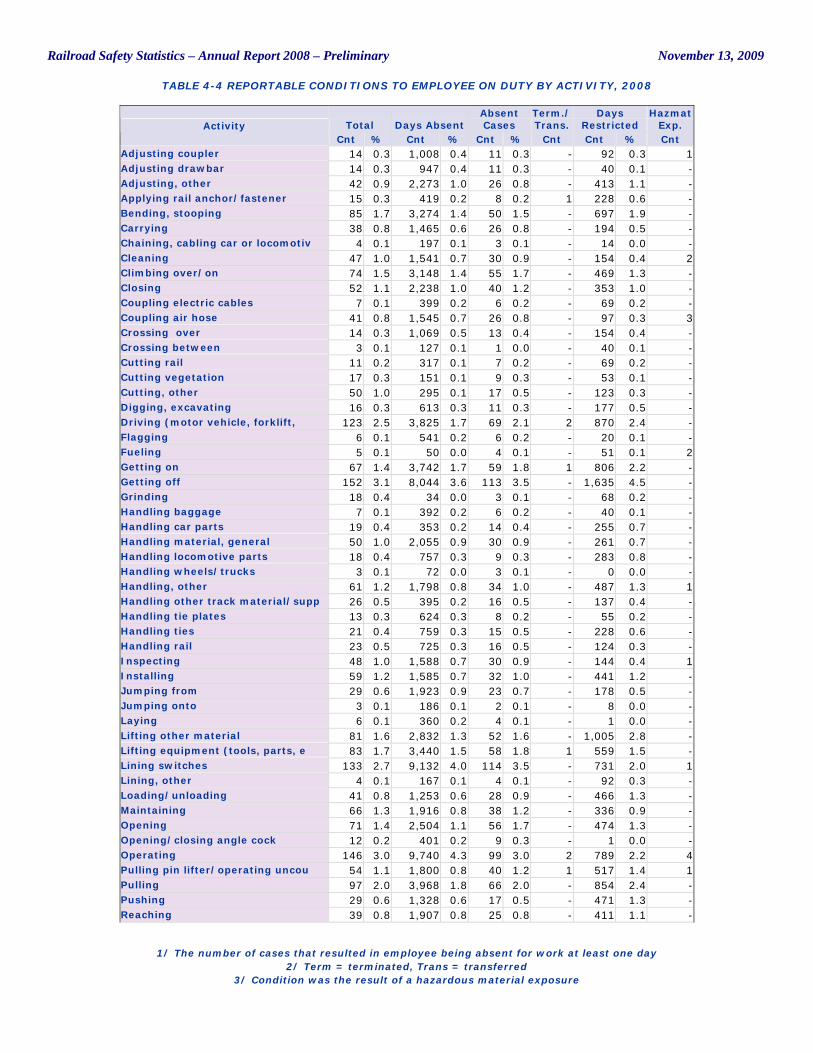
Railroad Safety Statistics – Annual Report 2008 – Preliminary November 13, 2009
TABLE 4-4 REPORTABLE CONDITIONS TO EMPLOYEE ON DUTY BY ACTIVITY, 2008
1/ The number of cases that resulted in employee being absent for work at least one day
2/ Term = terminated, Trans = transferred 3/ Condition was the result of a hazardous material exposure
Total Days Absent Absent Cases
Term./ Trans.
Days Restricted
Hazmat Exp. Activity
Cnt % Cnt % Cnt % Cnt Cnt % Cnt Adjusting coupler 14 0.3 1,008 0.4 11 0.3 - 92 0.3 1 Adjusting drawbar 14 0.3 947 0.4 11 0.3 - 40 0.1 - Adjusting, other 42 0.9 2,273 1.0 26 0.8 - 413 1.1 - Applying rail anchor/fastener 15 0.3 419 0.2 8 0.2 1 228 0.6 - Bending, stooping 85 1.7 3,274 1.4 50 1.5 - 697 1.9 - Carrying 38 0.8 1,465 0.6 26 0.8 - 194 0.5 - Chaining, cabling car or locomotiv 4 0.1 197 0.1 3 0.1 - 14 0.0 - Cleaning 47 1.0 1,541 0.7 30 0.9 - 154 0.4 2 Climbing over/on 74 1.5 3,148 1.4 55 1.7 - 469 1.3 - Closing 52 1.1 2,238 1.0 40 1.2 - 353 1.0 - Coupling electric cables 7 0.1 399 0.2 6 0.2 - 69 0.2 - Coupling air hose 41 0.8 1,545 0.7 26 0.8 - 97 0.3 3 Crossing over 14 0.3 1,069 0.5 13 0.4 - 154 0.4 - Crossing between 3 0.1 127 0.1 1 0.0 - 40 0.1 - Cutting rail 11 0.2 317 0.1 7 0.2 - 69 0.2 - Cutting vegetation 17 0.3 151 0.1 9 0.3 - 53 0.1 - Cutting, other 50 1.0 295 0.1 17 0.5 - 123 0.3 - Digging, excavating 16 0.3 613 0.3 11 0.3 - 177 0.5 - Driving (motor vehicle, forklift, 123 2.5 3,825 1.7 69 2.1 2 870 2.4 - Flagging 6 0.1 541 0.2 6 0.2 - 20 0.1 - Fueling 5 0.1 50 0.0 4 0.1 - 51 0.1 2 Getting on 67 1.4 3,742 1.7 59 1.8 1 806 2.2 - Getting off 152 3.1 8,044 3.6 113 3.5 - 1,635 4.5 - Grinding 18 0.4 34 0.0 3 0.1 - 68 0.2 - Handling baggage 7 0.1 392 0.2 6 0.2 - 40 0.1 - Handling car parts 19 0.4 353 0.2 14 0.4 - 255 0.7 - Handling material, general 50 1.0 2,055 0.9 30 0.9 - 261 0.7 - Handling locomotive parts 18 0.4 757 0.3 9 0.3 - 283 0.8 - Handling wheels/trucks 3 0.1 72 0.0 3 0.1 - 0 0.0 - Handling, other 61 1.2 1,798 0.8 34 1.0 - 487 1.3 1 Handling other track material/supp 26 0.5 395 0.2 16 0.5 - 137 0.4 - Handling tie plates 13 0.3 624 0.3 8 0.2 - 55 0.2 - Handling ties 21 0.4 759 0.3 15 0.5 - 228 0.6 - Handling rail 23 0.5 725 0.3 16 0.5 - 124 0.3 - Inspecting 48 1.0 1,588 0.7 30 0.9 - 144 0.4 1 Installing 59 1.2 1,585 0.7 32 1.0 - 441 1.2 - Jumping from 29 0.6 1,923 0.9 23 0.7 - 178 0.5 - Jumping onto 3 0.1 186 0.1 2 0.1 - 8 0.0 - Laying 6 0.1 360 0.2 4 0.1 - 1 0.0 - Lifting other material 81 1.6 2,832 1.3 52 1.6 - 1,005 2.8 - Lifting equipment (tools, parts, e 83 1.7 3,440 1.5 58 1.8 1 559 1.5 - Lining switches 133 2.7 9,132 4.0 114 3.5 - 731 2.0 1 Lining, other 4 0.1 167 0.1 4 0.1 - 92 0.3 - Loading/unloading 41 0.8 1,253 0.6 28 0.9 - 466 1.3 - Maintaining 66 1.3 1,916 0.8 38 1.2 - 336 0.9 - Opening 71 1.4 2,504 1.1 56 1.7 - 474 1.3 - Opening/closing angle cock 12 0.2 401 0.2 9 0.3 - 1 0.0 - Operating 146 3.0 9,740 4.3 99 3.0 2 789 2.2 4 Pulling pin lifter/operating uncou 54 1.1 1,800 0.8 40 1.2 1 517 1.4 1 Pulling 97 2.0 3,968 1.8 66 2.0 - 854 2.4 - Pushing 29 0.6 1,328 0.6 17 0.5 - 471 1.3 - Reaching 39 0.8 1,907 0.8 25 0.8 - 411 1.1 -
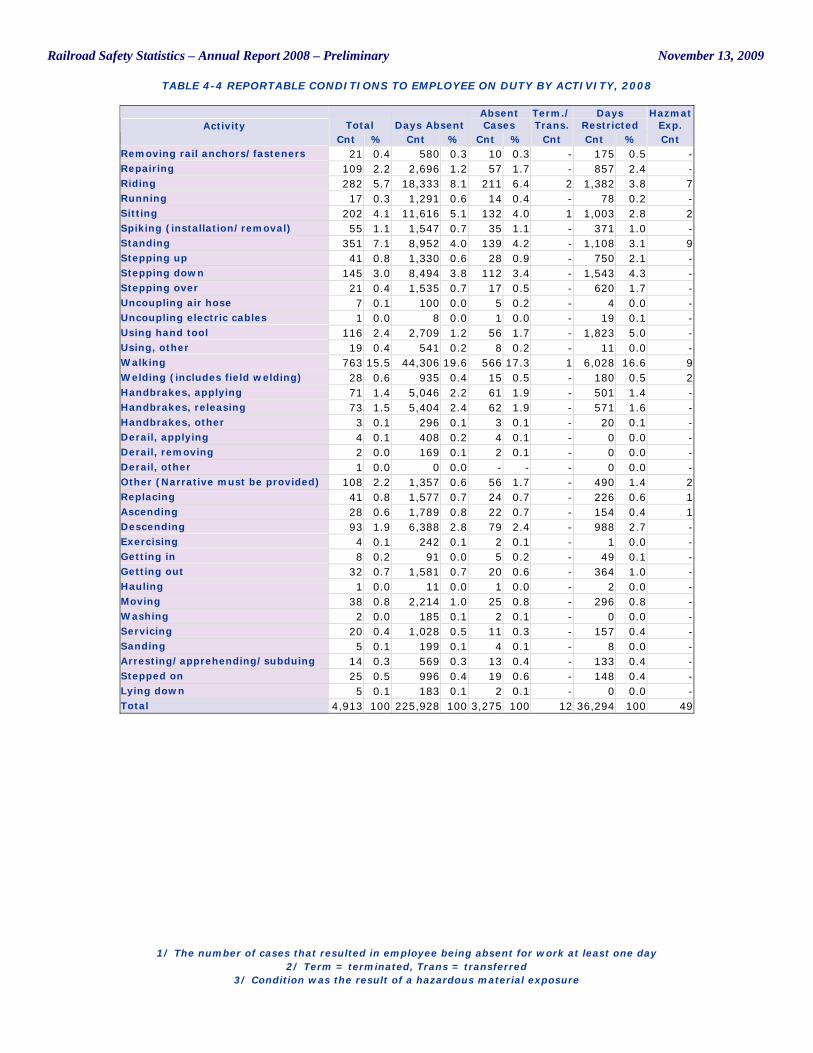
Railroad Safety Statistics – Annual Report 2008 – Preliminary November 13, 2009
TABLE 4-4 REPORTABLE CONDITIONS TO EMPLOYEE ON DUTY BY ACTIVITY, 2008
1/ The number of cases that resulted in employee being absent for work at least one day
2/ Term = terminated, Trans = transferred 3/ Condition was the result of a hazardous material exposure
Total Days Absent Absent Cases
Term./ Trans.
Days Restricted
Hazmat Exp. Activity
Cnt % Cnt % Cnt % Cnt Cnt % Cnt Removing rail anchors/fasteners 21 0.4 580 0.3 10 0.3 - 175 0.5 - Repairing 109 2.2 2,696 1.2 57 1.7 - 857 2.4 - Riding 282 5.7 18,333 8.1 211 6.4 2 1,382 3.8 7 Running 17 0.3 1,291 0.6 14 0.4 - 78 0.2 - Sitting 202 4.1 11,616 5.1 132 4.0 1 1,003 2.8 2 Spiking (installation/removal) 55 1.1 1,547 0.7 35 1.1 - 371 1.0 - Standing 351 7.1 8,952 4.0 139 4.2 - 1,108 3.1 9 Stepping up 41 0.8 1,330 0.6 28 0.9 - 750 2.1 - Stepping down 145 3.0 8,494 3.8 112 3.4 - 1,543 4.3 - Stepping over 21 0.4 1,535 0.7 17 0.5 - 620 1.7 - Uncoupling air hose 7 0.1 100 0.0 5 0.2 - 4 0.0 - Uncoupling electric cables 1 0.0 8 0.0 1 0.0 - 19 0.1 - Using hand tool 116 2.4 2,709 1.2 56 1.7 - 1,823 5.0 - Using, other 19 0.4 541 0.2 8 0.2 - 11 0.0 - Walking 763 15.5 44,306 19.6 566 17.3 1 6,028 16.6 9 Welding (includes field welding) 28 0.6 935 0.4 15 0.5 - 180 0.5 2 Handbrakes, applying 71 1.4 5,046 2.2 61 1.9 - 501 1.4 - Handbrakes, releasing 73 1.5 5,404 2.4 62 1.9 - 571 1.6 - Handbrakes, other 3 0.1 296 0.1 3 0.1 - 20 0.1 - Derail, applying 4 0.1 408 0.2 4 0.1 - 0 0.0 - Derail, removing 2 0.0 169 0.1 2 0.1 - 0 0.0 - Derail, other 1 0.0 0 0.0 - - - 0 0.0 - Other (Narrative must be provided) 108 2.2 1,357 0.6 56 1.7 - 490 1.4 2 Replacing 41 0.8 1,577 0.7 24 0.7 - 226 0.6 1 Ascending 28 0.6 1,789 0.8 22 0.7 - 154 0.4 1 Descending 93 1.9 6,388 2.8 79 2.4 - 988 2.7 - Exercising 4 0.1 242 0.1 2 0.1 - 1 0.0 - Getting in 8 0.2 91 0.0 5 0.2 - 49 0.1 - Getting out 32 0.7 1,581 0.7 20 0.6 - 364 1.0 - Hauling 1 0.0 11 0.0 1 0.0 - 2 0.0 - Moving 38 0.8 2,214 1.0 25 0.8 - 296 0.8 - Washing 2 0.0 185 0.1 2 0.1 - 0 0.0 - Servicing 20 0.4 1,028 0.5 11 0.3 - 157 0.4 - Sanding 5 0.1 199 0.1 4 0.1 - 8 0.0 - Arresting/apprehending/subduing 14 0.3 569 0.3 13 0.4 - 133 0.4 - Stepped on 25 0.5 996 0.4 19 0.6 - 148 0.4 - Lying down 5 0.1 183 0.1 2 0.1 - 0 0.0 - Total 4,913 100 225,928 100 3,275 100 12 36,294 100 49
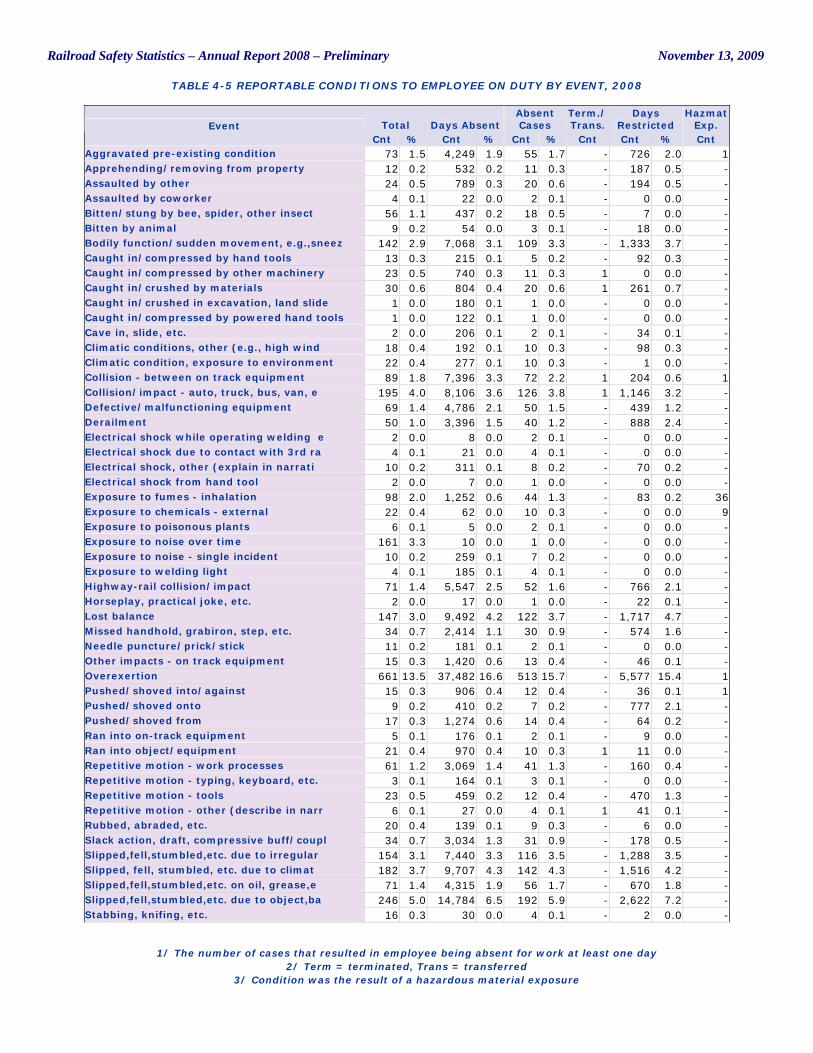
Railroad Safety Statistics – Annual Report 2008 – Preliminary November 13, 2009
TABLE 4-5 REPORTABLE CONDITIONS TO EMPLOYEE ON DUTY BY EVENT, 2008
1/ The number of cases that resulted in employee being absent for work at least one day
2/ Term = terminated, Trans = transferred 3/ Condition was the result of a hazardous material exposure
Total Days Absent Absent Cases
Term./ Trans.
Days Restricted
Hazmat Exp. Event
Cnt % Cnt % Cnt % Cnt Cnt % Cnt Aggravated pre-existing condition 73 1.5 4,249 1.9 55 1.7 - 726 2.0 1 Apprehending/removing from property 12 0.2 532 0.2 11 0.3 - 187 0.5 - Assaulted by other 24 0.5 789 0.3 20 0.6 - 194 0.5 - Assaulted by coworker 4 0.1 22 0.0 2 0.1 - 0 0.0 - Bitten/stung by bee, spider, other insect 56 1.1 437 0.2 18 0.5 - 7 0.0 - Bitten by animal 9 0.2 54 0.0 3 0.1 - 18 0.0 - Bodily function/sudden movement, e.g.,sneez 142 2.9 7,068 3.1 109 3.3 - 1,333 3.7 - Caught in/compressed by hand tools 13 0.3 215 0.1 5 0.2 - 92 0.3 - Caught in/compressed by other machinery 23 0.5 740 0.3 11 0.3 1 0 0.0 - Caught in/crushed by materials 30 0.6 804 0.4 20 0.6 1 261 0.7 - Caught in/crushed in excavation, land slide 1 0.0 180 0.1 1 0.0 - 0 0.0 - Caught in/compressed by powered hand tools 1 0.0 122 0.1 1 0.0 - 0 0.0 - Cave in, slide, etc. 2 0.0 206 0.1 2 0.1 - 34 0.1 - Climatic conditions, other (e.g., high wind 18 0.4 192 0.1 10 0.3 - 98 0.3 - Climatic condition, exposure to environment 22 0.4 277 0.1 10 0.3 - 1 0.0 - Collision - between on track equipment 89 1.8 7,396 3.3 72 2.2 1 204 0.6 1 Collision/impact - auto, truck, bus, van, e 195 4.0 8,106 3.6 126 3.8 1 1,146 3.2 - Defective/malfunctioning equipment 69 1.4 4,786 2.1 50 1.5 - 439 1.2 - Derailment 50 1.0 3,396 1.5 40 1.2 - 888 2.4 - Electrical shock while operating welding e 2 0.0 8 0.0 2 0.1 - 0 0.0 - Electrical shock due to contact with 3rd ra 4 0.1 21 0.0 4 0.1 - 0 0.0 - Electrical shock, other (explain in narrati 10 0.2 311 0.1 8 0.2 - 70 0.2 - Electrical shock from hand tool 2 0.0 7 0.0 1 0.0 - 0 0.0 - Exposure to fumes - inhalation 98 2.0 1,252 0.6 44 1.3 - 83 0.2 36 Exposure to chemicals - external 22 0.4 62 0.0 10 0.3 - 0 0.0 9 Exposure to poisonous plants 6 0.1 5 0.0 2 0.1 - 0 0.0 - Exposure to noise over time 161 3.3 10 0.0 1 0.0 - 0 0.0 - Exposure to noise - single incident 10 0.2 259 0.1 7 0.2 - 0 0.0 - Exposure to welding light 4 0.1 185 0.1 4 0.1 - 0 0.0 - Highway-rail collision/impact 71 1.4 5,547 2.5 52 1.6 - 766 2.1 - Horseplay, practical joke, etc. 2 0.0 17 0.0 1 0.0 - 22 0.1 - Lost balance 147 3.0 9,492 4.2 122 3.7 - 1,717 4.7 - Missed handhold, grabiron, step, etc. 34 0.7 2,414 1.1 30 0.9 - 574 1.6 - Needle puncture/prick/stick 11 0.2 181 0.1 2 0.1 - 0 0.0 - Other impacts - on track equipment 15 0.3 1,420 0.6 13 0.4 - 46 0.1 - Overexertion 661 13.5 37,482 16.6 513 15.7 - 5,577 15.4 1 Pushed/shoved into/against 15 0.3 906 0.4 12 0.4 - 36 0.1 1 Pushed/shoved onto 9 0.2 410 0.2 7 0.2 - 777 2.1 - Pushed/shoved from 17 0.3 1,274 0.6 14 0.4 - 64 0.2 - Ran into on-track equipment 5 0.1 176 0.1 2 0.1 - 9 0.0 - Ran into object/equipment 21 0.4 970 0.4 10 0.3 1 11 0.0 - Repetitive motion - work processes 61 1.2 3,069 1.4 41 1.3 - 160 0.4 - Repetitive motion - typing, keyboard, etc. 3 0.1 164 0.1 3 0.1 - 0 0.0 - Repetitive motion - tools 23 0.5 459 0.2 12 0.4 - 470 1.3 - Repetitive motion - other (describe in narr 6 0.1 27 0.0 4 0.1 1 41 0.1 - Rubbed, abraded, etc. 20 0.4 139 0.1 9 0.3 - 6 0.0 - Slack action, draft, compressive buff/coupl 34 0.7 3,034 1.3 31 0.9 - 178 0.5 - Slipped,fell,stumbled,etc. due to irregular 154 3.1 7,440 3.3 116 3.5 - 1,288 3.5 - Slipped, fell, stumbled, etc. due to climat 182 3.7 9,707 4.3 142 4.3 - 1,516 4.2 - Slipped,fell,stumbled,etc. on oil, grease,e 71 1.4 4,315 1.9 56 1.7 - 670 1.8 - Slipped,fell,stumbled,etc. due to object,ba 246 5.0 14,784 6.5 192 5.9 - 2,622 7.2 - Stabbing, knifing, etc. 16 0.3 30 0.0 4 0.1 - 2 0.0 -
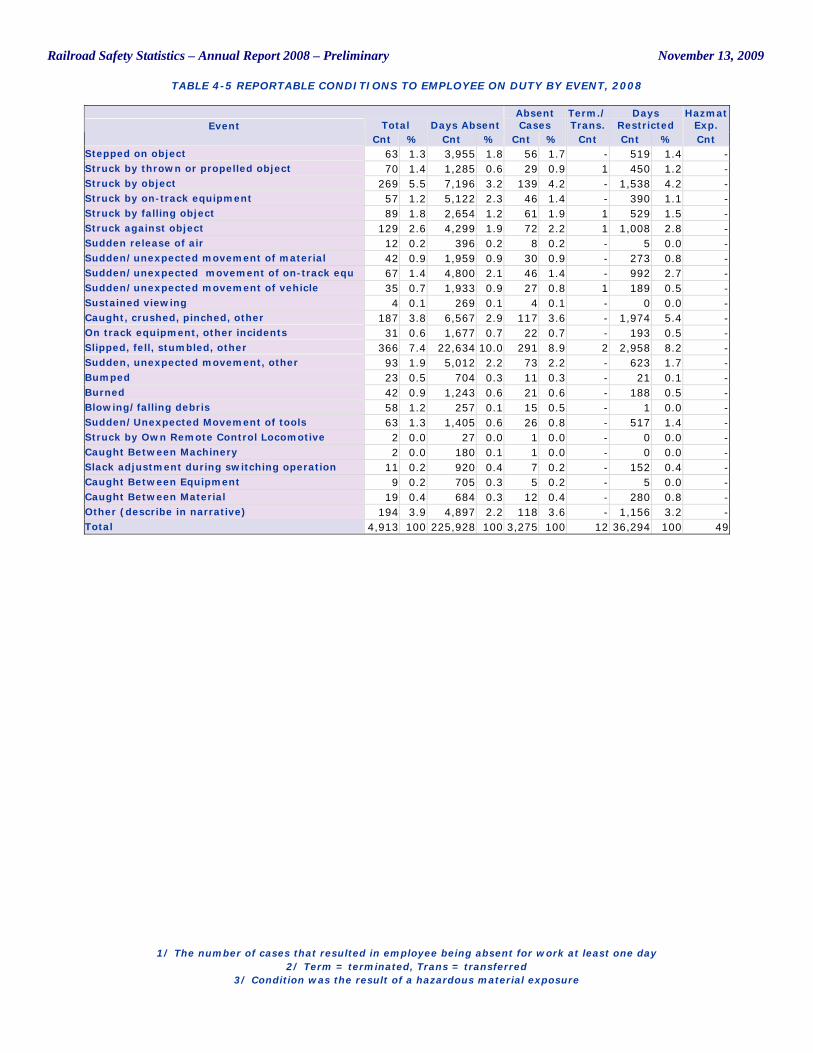
Railroad Safety Statistics – Annual Report 2008 – Preliminary November 13, 2009
TABLE 4-5 REPORTABLE CONDITIONS TO EMPLOYEE ON DUTY BY EVENT, 2008
1/ The number of cases that resulted in employee being absent for work at least one day
2/ Term = terminated, Trans = transferred 3/ Condition was the result of a hazardous material exposure
Total Days Absent Absent Cases
Term./ Trans.
Days Restricted
Hazmat Exp. Event
Cnt % Cnt % Cnt % Cnt Cnt % Cnt Stepped on object 63 1.3 3,955 1.8 56 1.7 - 519 1.4 - Struck by thrown or propelled object 70 1.4 1,285 0.6 29 0.9 1 450 1.2 - Struck by object 269 5.5 7,196 3.2 139 4.2 - 1,538 4.2 - Struck by on-track equipment 57 1.2 5,122 2.3 46 1.4 - 390 1.1 - Struck by falling object 89 1.8 2,654 1.2 61 1.9 1 529 1.5 - Struck against object 129 2.6 4,299 1.9 72 2.2 1 1,008 2.8 - Sudden release of air 12 0.2 396 0.2 8 0.2 - 5 0.0 - Sudden/unexpected movement of material 42 0.9 1,959 0.9 30 0.9 - 273 0.8 - Sudden/unexpected movement of on-track equ 67 1.4 4,800 2.1 46 1.4 - 992 2.7 - Sudden/unexpected movement of vehicle 35 0.7 1,933 0.9 27 0.8 1 189 0.5 - Sustained viewing 4 0.1 269 0.1 4 0.1 - 0 0.0 - Caught, crushed, pinched, other 187 3.8 6,567 2.9 117 3.6 - 1,974 5.4 - On track equipment, other incidents 31 0.6 1,677 0.7 22 0.7 - 193 0.5 - Slipped, fell, stumbled, other 366 7.4 22,634 10.0 291 8.9 2 2,958 8.2 - Sudden, unexpected movement, other 93 1.9 5,012 2.2 73 2.2 - 623 1.7 - Bumped 23 0.5 704 0.3 11 0.3 - 21 0.1 - Burned 42 0.9 1,243 0.6 21 0.6 - 188 0.5 - Blowing/falling debris 58 1.2 257 0.1 15 0.5 - 1 0.0 - Sudden/Unexpected Movement of tools 63 1.3 1,405 0.6 26 0.8 - 517 1.4 - Struck by Own Remote Control Locomotive 2 0.0 27 0.0 1 0.0 - 0 0.0 - Caught Between Machinery 2 0.0 180 0.1 1 0.0 - 0 0.0 - Slack adjustment during switching operation 11 0.2 920 0.4 7 0.2 - 152 0.4 - Caught Between Equipment 9 0.2 705 0.3 5 0.2 - 5 0.0 - Caught Between Material 19 0.4 684 0.3 12 0.4 - 280 0.8 - Other (describe in narrative) 194 3.9 4,897 2.2 118 3.6 - 1,156 3.2 - Total 4,913 100 225,928 100 3,275 100 12 36,294 100 49
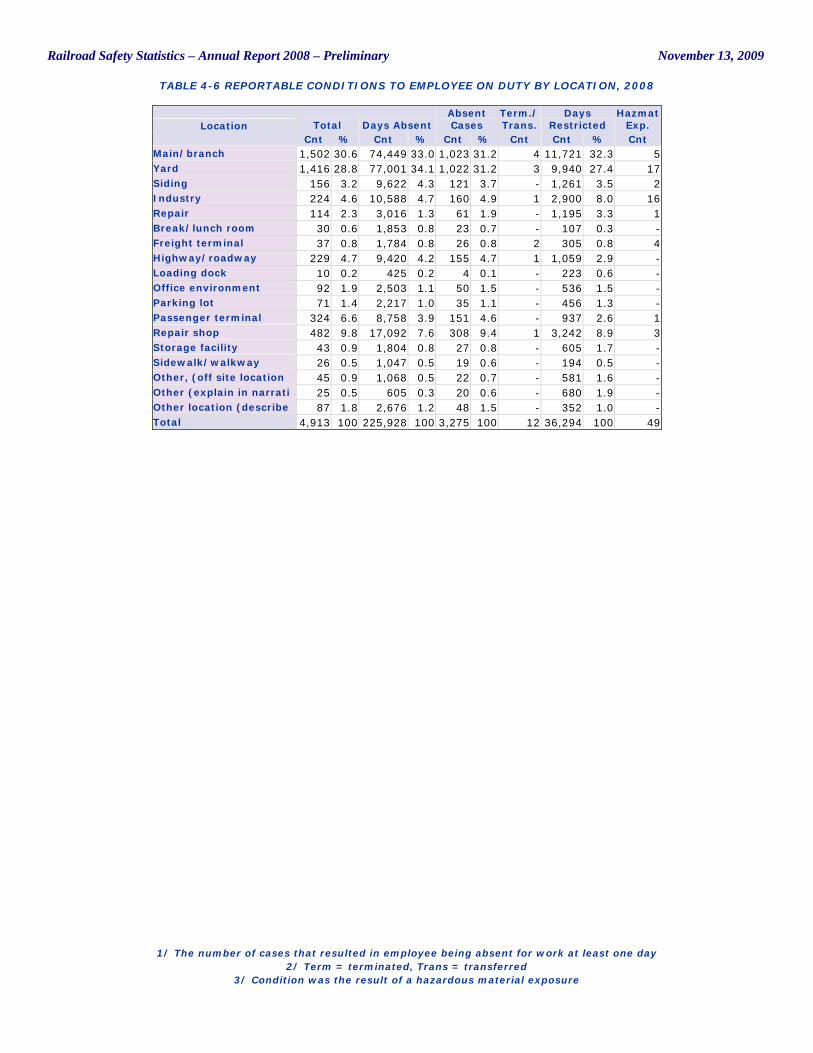
Railroad Safety Statistics – Annual Report 2008 – Preliminary November 13, 2009
TABLE 4-6 REPORTABLE CONDITIONS TO EMPLOYEE ON DUTY BY LOCATION, 2008
1/ The number of cases that resulted in employee being absent for work at least one day
2/ Term = terminated, Trans = transferred 3/ Condition was the result of a hazardous material exposure
Total Days Absent Absent Cases
Term./ Trans.
Days Restricted
Hazmat Exp. Location
Cnt % Cnt % Cnt % Cnt Cnt % Cnt Main/branch 1,502 30.6 74,449 33.0 1,023 31.2 4 11,721 32.3 5 Yard 1,416 28.8 77,001 34.1 1,022 31.2 3 9,940 27.4 17 Siding 156 3.2 9,622 4.3 121 3.7 - 1,261 3.5 2 Industry 224 4.6 10,588 4.7 160 4.9 1 2,900 8.0 16 Repair 114 2.3 3,016 1.3 61 1.9 - 1,195 3.3 1 Break/lunch room 30 0.6 1,853 0.8 23 0.7 - 107 0.3 - Freight terminal 37 0.8 1,784 0.8 26 0.8 2 305 0.8 4 Highway/roadway 229 4.7 9,420 4.2 155 4.7 1 1,059 2.9 - Loading dock 10 0.2 425 0.2 4 0.1 - 223 0.6 - Office environment 92 1.9 2,503 1.1 50 1.5 - 536 1.5 - Parking lot 71 1.4 2,217 1.0 35 1.1 - 456 1.3 - Passenger terminal 324 6.6 8,758 3.9 151 4.6 - 937 2.6 1 Repair shop 482 9.8 17,092 7.6 308 9.4 1 3,242 8.9 3 Storage facility 43 0.9 1,804 0.8 27 0.8 - 605 1.7 - Sidewalk/walkway 26 0.5 1,047 0.5 19 0.6 - 194 0.5 - Other, (off site location 45 0.9 1,068 0.5 22 0.7 - 581 1.6 - Other (explain in narrati 25 0.5 605 0.3 20 0.6 - 680 1.9 - Other location (describe 87 1.8 2,676 1.2 48 1.5 - 352 1.0 - Total 4,913 100 225,928 100 3,275 100 12 36,294 100 49
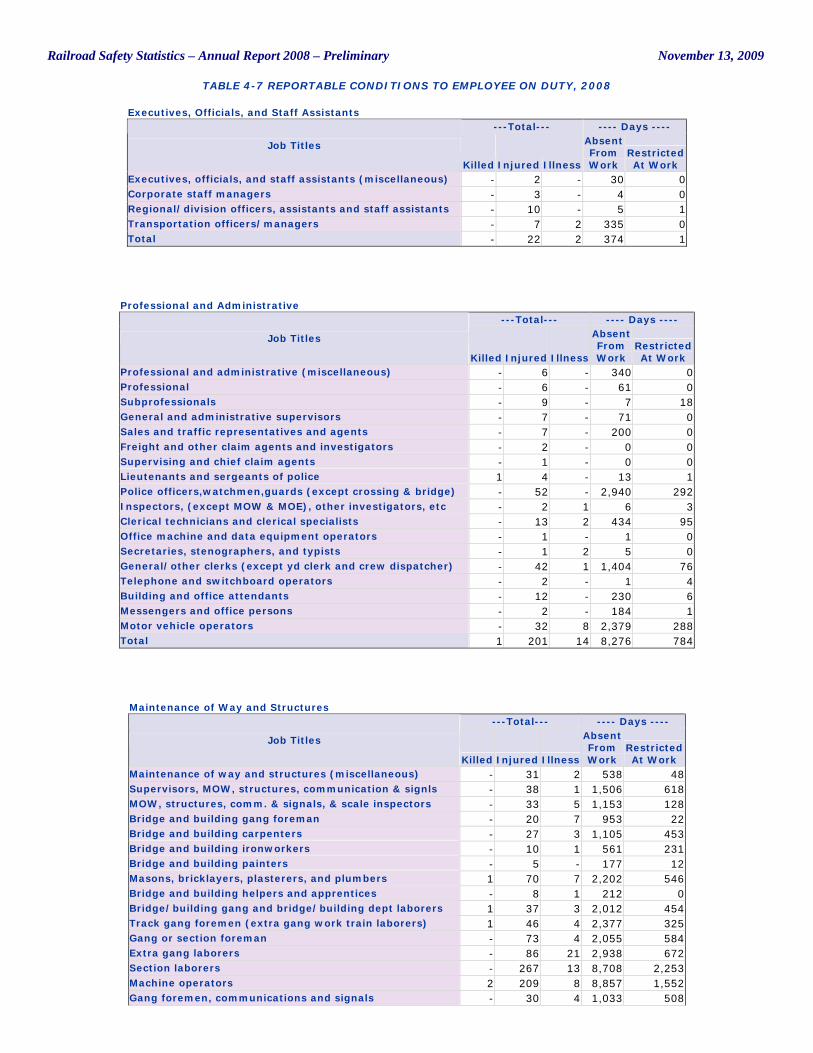
Railroad Safety Statistics – Annual Report 2008 – Preliminary November 13, 2009
TABLE 4-7 REPORTABLE CONDITIONS TO EMPLOYEE ON DUTY, 2008
Executives, Officials, and Staff Assistants ---Total--- ---- Days ----
Job Titles
Killed Injured Illness
Absent From Work
Restricted At Work
Executives, officials, and staff assistants (miscellaneous) - 2 - 30 0 Corporate staff managers - 3 - 4 0 Regional/division officers, assistants and staff assistants - 10 - 5 1 Transportation officers/managers - 7 2 335 0 Total - 22 2 374 1
Professional and Administrative ---Total--- ---- Days ----
Job Titles
Killed Injured Illness
Absent From Work
Restricted At Work
Professional and administrative (miscellaneous) - 6 - 340 0 Professional - 6 - 61 0 Subprofessionals - 9 - 7 18 General and administrative supervisors - 7 - 71 0 Sales and traffic representatives and agents - 7 - 200 0 Freight and other claim agents and investigators - 2 - 0 0 Supervising and chief claim agents - 1 - 0 0 Lieutenants and sergeants of police 1 4 - 13 1 Police officers,watchmen,guards (except crossing & bridge) - 52 - 2,940 292 Inspectors, (except MOW & MOE), other investigators, etc - 2 1 6 3 Clerical technicians and clerical specialists - 13 2 434 95 Office machine and data equipment operators - 1 - 1 0 Secretaries, stenographers, and typists - 1 2 5 0 General/other clerks (except yd clerk and crew dispatcher) - 42 1 1,404 76 Telephone and switchboard operators - 2 - 1 4 Building and office attendants - 12 - 230 6 Messengers and office persons - 2 - 184 1 Motor vehicle operators - 32 8 2,379 288 Total 1 201 14 8,276 784
Maintenance of Way and Structures ---Total--- ---- Days ----
Job Titles
Killed Injured Illness
Absent From Work
Restricted At Work
Maintenance of way and structures (miscellaneous) - 31 2 538 48 Supervisors, MOW, structures, communication & signls - 38 1 1,506 618 MOW, structures, comm. & signals, & scale inspectors - 33 5 1,153 128 Bridge and building gang foreman - 20 7 953 22 Bridge and building carpenters - 27 3 1,105 453 Bridge and building ironworkers - 10 1 561 231 Bridge and building painters - 5 - 177 12 Masons, bricklayers, plasterers, and plumbers 1 70 7 2,202 546 Bridge and building helpers and apprentices - 8 1 212 0 Bridge/building gang and bridge/building dept laborers 1 37 3 2,012 454 Track gang foremen (extra gang work train laborers) 1 46 4 2,377 325 Gang or section foreman - 73 4 2,055 584 Extra gang laborers - 86 21 2,938 672 Section laborers - 267 13 8,708 2,253 Machine operators 2 209 8 8,857 1,552 Gang foremen, communications and signals - 30 4 1,033 508
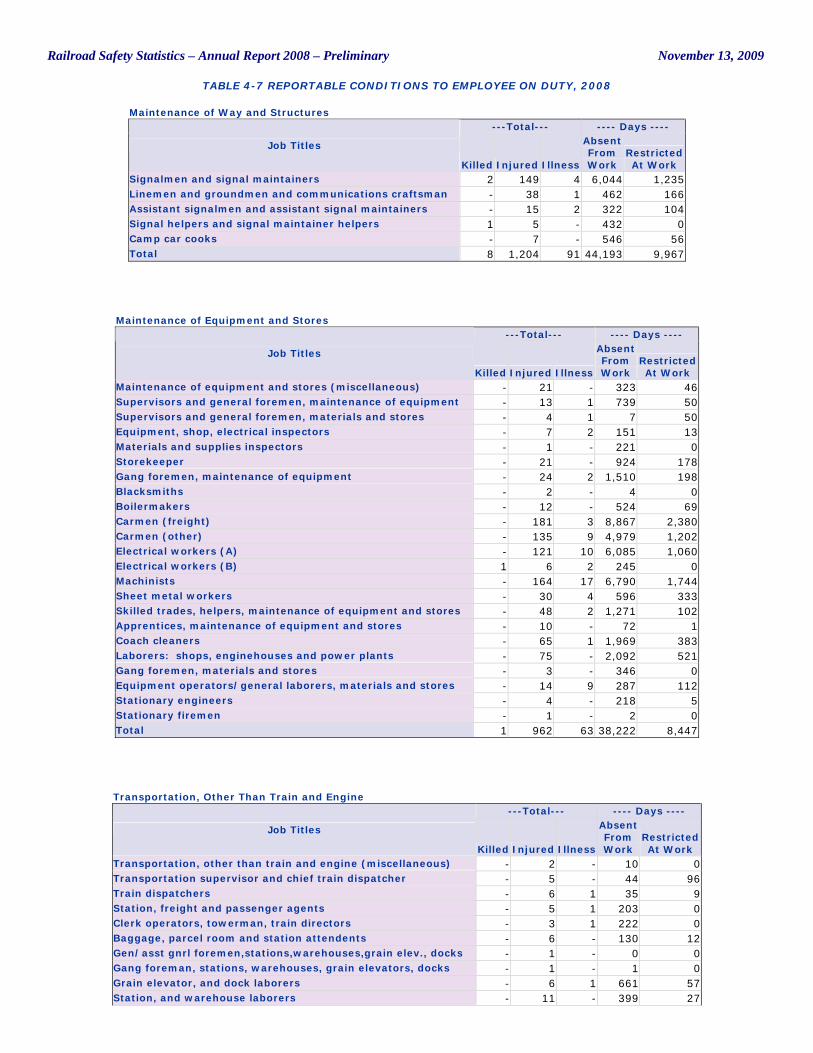
Railroad Safety Statistics – Annual Report 2008 – Preliminary November 13, 2009
TABLE 4-7 REPORTABLE CONDITIONS TO EMPLOYEE ON DUTY, 2008
Maintenance of Way and Structures ---Total--- ---- Days ----
Job Titles
Killed Injured Illness
Absent From Work
Restricted At Work
Signalmen and signal maintainers 2 149 4 6,044 1,235 Linemen and groundmen and communications craftsman - 38 1 462 166 Assistant signalmen and assistant signal maintainers - 15 2 322 104 Signal helpers and signal maintainer helpers 1 5 - 432 0 Camp car cooks - 7 - 546 56 Total 8 1,204 91 44,193 9,967
Maintenance of Equipment and Stores ---Total--- ---- Days ----
Job Titles
Killed Injured Illness
Absent From Work
Restricted At Work
Maintenance of equipment and stores (miscellaneous) - 21 - 323 46 Supervisors and general foremen, maintenance of equipment - 13 1 739 50 Supervisors and general foremen, materials and stores - 4 1 7 50 Equipment, shop, electrical inspectors - 7 2 151 13 Materials and supplies inspectors - 1 - 221 0 Storekeeper - 21 - 924 178 Gang foremen, maintenance of equipment - 24 2 1,510 198 Blacksmiths - 2 - 4 0 Boilermakers - 12 - 524 69 Carmen (freight) - 181 3 8,867 2,380 Carmen (other) - 135 9 4,979 1,202 Electrical workers (A) - 121 10 6,085 1,060 Electrical workers (B) 1 6 2 245 0 Machinists - 164 17 6,790 1,744 Sheet metal workers - 30 4 596 333 Skilled trades, helpers, maintenance of equipment and stores - 48 2 1,271 102 Apprentices, maintenance of equipment and stores - 10 - 72 1 Coach cleaners - 65 1 1,969 383 Laborers: shops, enginehouses and power plants - 75 - 2,092 521 Gang foremen, materials and stores - 3 - 346 0 Equipment operators/general laborers, materials and stores - 14 9 287 112 Stationary engineers - 4 - 218 5 Stationary firemen - 1 - 2 0 Total 1 962 63 38,222 8,447
Transportation, Other Than Train and Engine ---Total--- ---- Days ----
Job Titles
Killed Injured Illness
Absent From Work
Restricted At Work
Transportation, other than train and engine (miscellaneous) - 2 - 10 0 Transportation supervisor and chief train dispatcher - 5 - 44 96 Train dispatchers - 6 1 35 9 Station, freight and passenger agents - 5 1 203 0 Clerk operators, towerman, train directors - 3 1 222 0 Baggage, parcel room and station attendents - 6 - 130 12 Gen/asst gnrl foremen,stations,warehouses,grain elev., docks - 1 - 0 0 Gang foreman, stations, warehouses, grain elevators, docks - 1 - 1 0 Grain elevator, and dock laborers - 6 1 661 57 Station, and warehouse laborers - 11 - 399 27
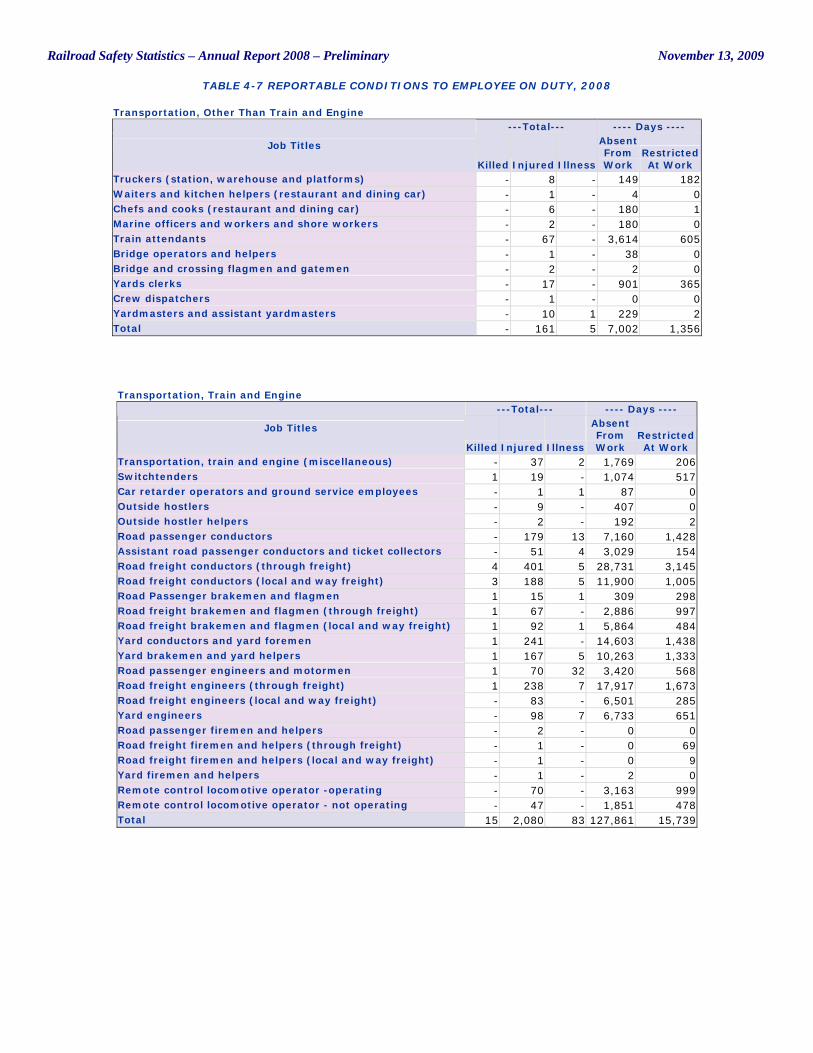
Railroad Safety Statistics – Annual Report 2008 – Preliminary November 13, 2009
TABLE 4-7 REPORTABLE CONDITIONS TO EMPLOYEE ON DUTY, 2008
Transportation, Other Than Train and Engine ---Total--- ---- Days ----
Job Titles
Killed Injured Illness
Absent From Work
Restricted At Work
Truckers (station, warehouse and platforms) - 8 - 149 182 Waiters and kitchen helpers (restaurant and dining car) - 1 - 4 0 Chefs and cooks (restaurant and dining car) - 6 - 180 1 Marine officers and workers and shore workers - 2 - 180 0 Train attendants - 67 - 3,614 605 Bridge operators and helpers - 1 - 38 0 Bridge and crossing flagmen and gatemen - 2 - 2 0 Yards clerks - 17 - 901 365 Crew dispatchers - 1 - 0 0 Yardmasters and assistant yardmasters - 10 1 229 2 Total - 161 5 7,002 1,356
Transportation, Train and Engine ---Total--- ---- Days ----
Job Titles
Killed Injured Illness
Absent From Work
Restricted At Work
Transportation, train and engine (miscellaneous) - 37 2 1,769 206 Switchtenders 1 19 - 1,074 517 Car retarder operators and ground service employees - 1 1 87 0 Outside hostlers - 9 - 407 0 Outside hostler helpers - 2 - 192 2 Road passenger conductors - 179 13 7,160 1,428 Assistant road passenger conductors and ticket collectors - 51 4 3,029 154 Road freight conductors (through freight) 4 401 5 28,731 3,145 Road freight conductors (local and way freight) 3 188 5 11,900 1,005 Road Passenger brakemen and flagmen 1 15 1 309 298 Road freight brakemen and flagmen (through freight) 1 67 - 2,886 997 Road freight brakemen and flagmen (local and way freight) 1 92 1 5,864 484 Yard conductors and yard foremen 1 241 - 14,603 1,438 Yard brakemen and yard helpers 1 167 5 10,263 1,333 Road passenger engineers and motormen 1 70 32 3,420 568 Road freight engineers (through freight) 1 238 7 17,917 1,673 Road freight engineers (local and way freight) - 83 - 6,501 285 Yard engineers - 98 7 6,733 651 Road passenger firemen and helpers - 2 - 0 0 Road freight firemen and helpers (through freight) - 1 - 0 69 Road freight firemen and helpers (local and way freight) - 1 - 0 9 Yard firemen and helpers - 1 - 2 0 Remote control locomotive operator -operating - 70 - 3,163 999 Remote control locomotive operator - not operating - 47 - 1,851 478 Total 15 2,080 83 127,861 15,739
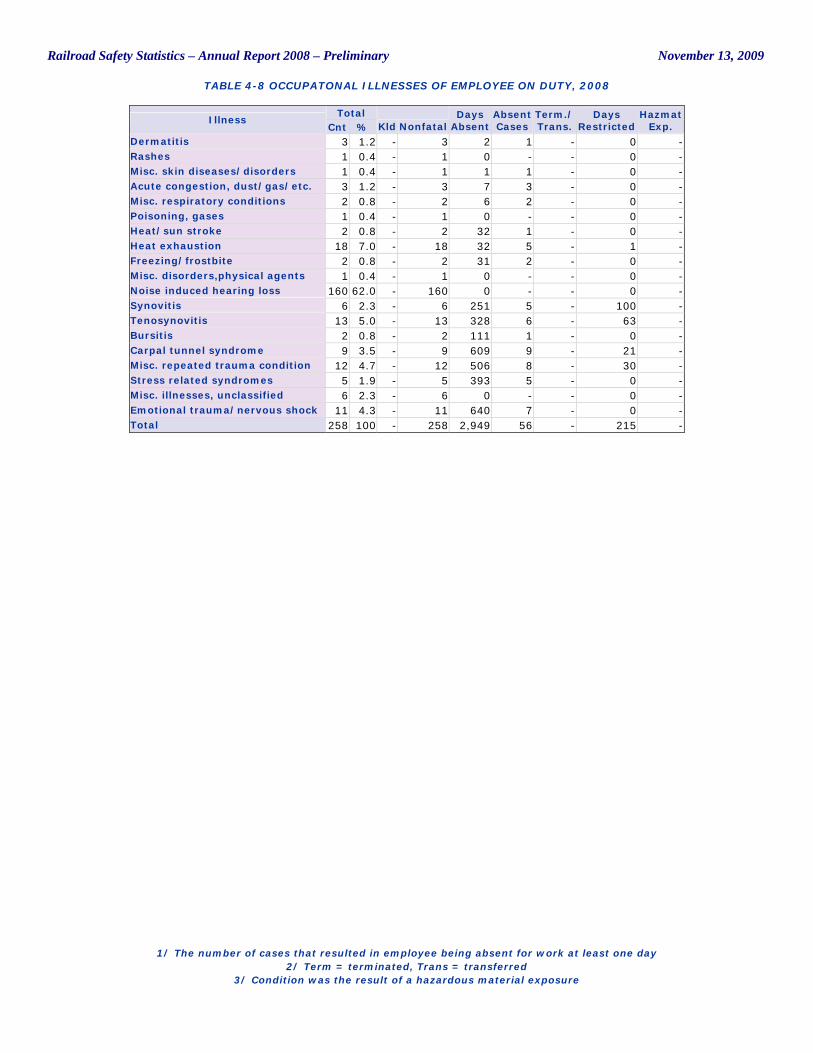
Railroad Safety Statistics – Annual Report 2008 – Preliminary November 13, 2009
TABLE 4-8 OCCUPATONAL ILLNESSES OF EMPLOYEE ON DUTY, 2008
1/ The number of cases that resulted in employee being absent for work at least one day
2/ Term = terminated, Trans = transferred 3/ Condition was the result of a hazardous material exposure
Total Illness
Cnt % Kld Nonfatal Days
Absent Absent Cases
Term./ Trans.
Days Restricted
Hazmat Exp.
Dermatitis 3 1.2 - 3 2 1 - 0 - Rashes 1 0.4 - 1 0 - - 0 - Misc. skin diseases/disorders 1 0.4 - 1 1 1 - 0 - Acute congestion, dust/gas/etc. 3 1.2 - 3 7 3 - 0 - Misc. respiratory conditions 2 0.8 - 2 6 2 - 0 - Poisoning, gases 1 0.4 - 1 0 - - 0 - Heat/sun stroke 2 0.8 - 2 32 1 - 0 - Heat exhaustion 18 7.0 - 18 32 5 - 1 - Freezing/frostbite 2 0.8 - 2 31 2 - 0 - Misc. disorders,physical agents 1 0.4 - 1 0 - - 0 - Noise induced hearing loss 160 62.0 - 160 0 - - 0 - Synovitis 6 2.3 - 6 251 5 - 100 - Tenosynovitis 13 5.0 - 13 328 6 - 63 - Bursitis 2 0.8 - 2 111 1 - 0 - Carpal tunnel syndrome 9 3.5 - 9 609 9 - 21 - Misc. repeated trauma condition 12 4.7 - 12 506 8 - 30 - Stress related syndromes 5 1.9 - 5 393 5 - 0 - Misc. illnesses, unclassified 6 2.3 - 6 0 - - 0 - Emotional trauma/nervous shock 11 4.3 - 11 640 7 - 0 - Total 258 100 - 258 2,949 56 - 215 -
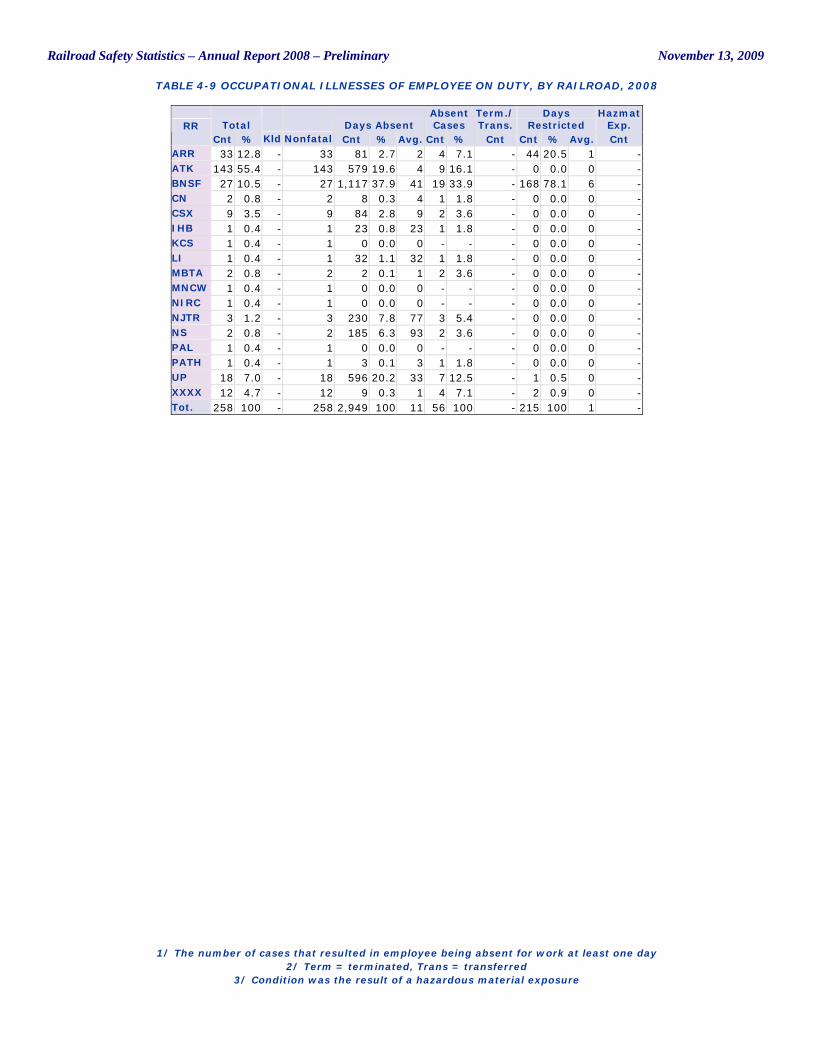
Railroad Safety Statistics – Annual Report 2008 – Preliminary November 13, 2009
TABLE 4-9 OCCUPATIONAL ILLNESSES OF EMPLOYEE ON DUTY, BY RAILROAD, 2008
1/ The number of cases that resulted in employee being absent for work at least one day
2/ Term = terminated, Trans = transferred 3/ Condition was the result of a hazardous material exposure
Total Days Absent Absent Cases
Term./ Trans.
Days Restricted
Hazmat Exp. RR
Cnt % Kld Nonfatal Cnt % Avg. Cnt % Cnt Cnt % Avg. Cnt ARR 33 12.8 - 33 81 2.7 2 4 7.1 - 44 20.5 1 - ATK 143 55.4 - 143 579 19.6 4 9 16.1 - 0 0.0 0 - BNSF 27 10.5 - 27 1,117 37.9 41 19 33.9 - 168 78.1 6 - CN 2 0.8 - 2 8 0.3 4 1 1.8 - 0 0.0 0 - CSX 9 3.5 - 9 84 2.8 9 2 3.6 - 0 0.0 0 - IHB 1 0.4 - 1 23 0.8 23 1 1.8 - 0 0.0 0 - KCS 1 0.4 - 1 0 0.0 0 - - - 0 0.0 0 - LI 1 0.4 - 1 32 1.1 32 1 1.8 - 0 0.0 0 - MBTA 2 0.8 - 2 2 0.1 1 2 3.6 - 0 0.0 0 - MNCW 1 0.4 - 1 0 0.0 0 - - - 0 0.0 0 - NIRC 1 0.4 - 1 0 0.0 0 - - - 0 0.0 0 - NJTR 3 1.2 - 3 230 7.8 77 3 5.4 - 0 0.0 0 - NS 2 0.8 - 2 185 6.3 93 2 3.6 - 0 0.0 0 - PAL 1 0.4 - 1 0 0.0 0 - - - 0 0.0 0 - PATH 1 0.4 - 1 3 0.1 3 1 1.8 - 0 0.0 0 - UP 18 7.0 - 18 596 20.2 33 7 12.5 - 1 0.5 0 - XXXX 12 4.7 - 12 9 0.3 1 4 7.1 - 2 0.9 0 - Tot. 258 100 - 258 2,949 100 11 56 100 - 215 100 1 -
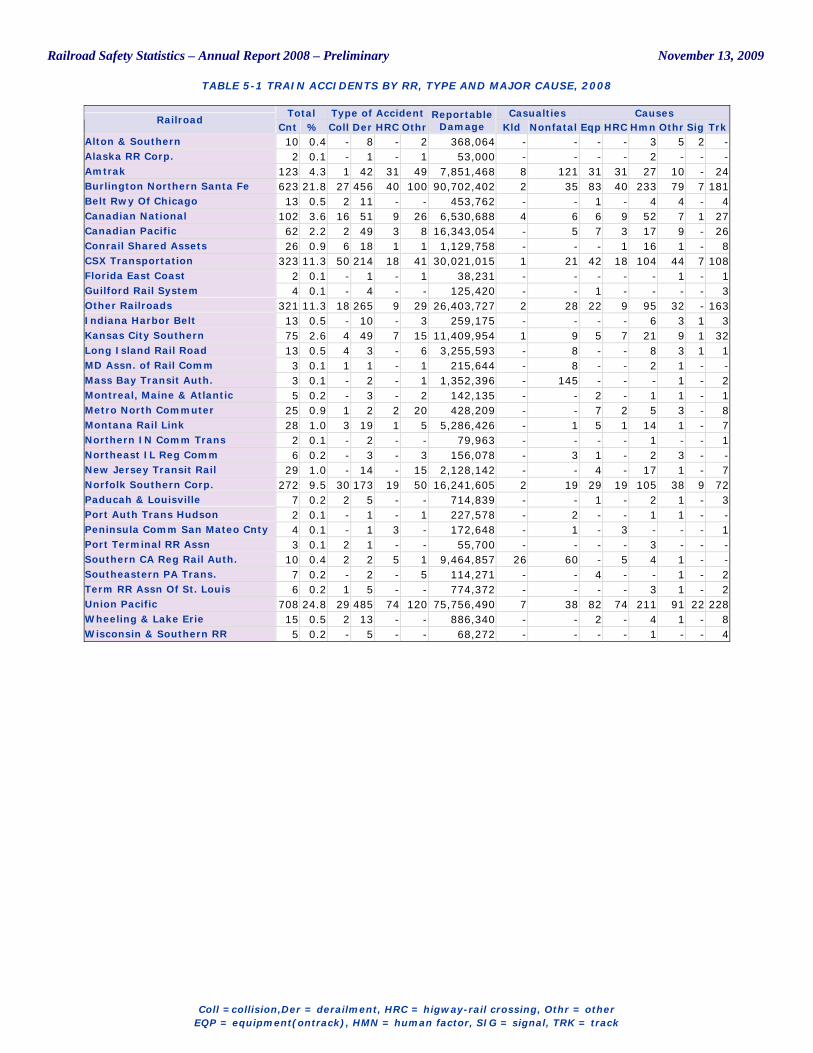
Railroad Safety Statistics – Annual Report 2008 – Preliminary November 13, 2009
TABLE 5-1 TRAIN ACCIDENTS BY RR, TYPE AND MAJOR CAUSE, 2008
Coll =collision,Der = derailment, HRC = higway-rail crossing, Othr = other
EQP = equipment(ontrack), HMN = human factor, SIG = signal, TRK = track
Total Type of Accident Casualties Causes Railroad
Cnt % Coll Der HRC Othr Reportable
Damage Kld Nonfatal Eqp HRC Hmn Othr Sig Trk Alton & Southern 10 0.4 - 8 - 2 368,064 - - - - 3 5 2 - Alaska RR Corp. 2 0.1 - 1 - 1 53,000 - - - - 2 - - - Amtrak 123 4.3 1 42 31 49 7,851,468 8 121 31 31 27 10 - 24 Burlington Northern Santa Fe 623 21.8 27 456 40 100 90,702,402 2 35 83 40 233 79 7 181 Belt Rwy Of Chicago 13 0.5 2 11 - - 453,762 - - 1 - 4 4 - 4 Canadian National 102 3.6 16 51 9 26 6,530,688 4 6 6 9 52 7 1 27 Canadian Pacific 62 2.2 2 49 3 8 16,343,054 - 5 7 3 17 9 - 26 Conrail Shared Assets 26 0.9 6 18 1 1 1,129,758 - - - 1 16 1 - 8 CSX Transportation 323 11.3 50 214 18 41 30,021,015 1 21 42 18 104 44 7 108 Florida East Coast 2 0.1 - 1 - 1 38,231 - - - - - 1 - 1 Guilford Rail System 4 0.1 - 4 - - 125,420 - - 1 - - - - 3 Other Railroads 321 11.3 18 265 9 29 26,403,727 2 28 22 9 95 32 - 163 Indiana Harbor Belt 13 0.5 - 10 - 3 259,175 - - - - 6 3 1 3 Kansas City Southern 75 2.6 4 49 7 15 11,409,954 1 9 5 7 21 9 1 32 Long Island Rail Road 13 0.5 4 3 - 6 3,255,593 - 8 - - 8 3 1 1 MD Assn. of Rail Comm 3 0.1 1 1 - 1 215,644 - 8 - - 2 1 - - Mass Bay Transit Auth. 3 0.1 - 2 - 1 1,352,396 - 145 - - - 1 - 2 Montreal, Maine & Atlantic 5 0.2 - 3 - 2 142,135 - - 2 - 1 1 - 1 Metro North Commuter 25 0.9 1 2 2 20 428,209 - - 7 2 5 3 - 8 Montana Rail Link 28 1.0 3 19 1 5 5,286,426 - 1 5 1 14 1 - 7 Northern IN Comm Trans 2 0.1 - 2 - - 79,963 - - - - 1 - - 1 Northeast IL Reg Comm 6 0.2 - 3 - 3 156,078 - 3 1 - 2 3 - - New Jersey Transit Rail 29 1.0 - 14 - 15 2,128,142 - - 4 - 17 1 - 7 Norfolk Southern Corp. 272 9.5 30 173 19 50 16,241,605 2 19 29 19 105 38 9 72 Paducah & Louisville 7 0.2 2 5 - - 714,839 - - 1 - 2 1 - 3 Port Auth Trans Hudson 2 0.1 - 1 - 1 227,578 - 2 - - 1 1 - - Peninsula Comm San Mateo Cnty 4 0.1 - 1 3 - 172,648 - 1 - 3 - - - 1 Port Terminal RR Assn 3 0.1 2 1 - - 55,700 - - - - 3 - - - Southern CA Reg Rail Auth. 10 0.4 2 2 5 1 9,464,857 26 60 - 5 4 1 - - Southeastern PA Trans. 7 0.2 - 2 - 5 114,271 - - 4 - - 1 - 2 Term RR Assn Of St. Louis 6 0.2 1 5 - - 774,372 - - - - 3 1 - 2 Union Pacific 708 24.8 29 485 74 120 75,756,490 7 38 82 74 211 91 22 228 Wheeling & Lake Erie 15 0.5 2 13 - - 886,340 - - 2 - 4 1 - 8 Wisconsin & Southern RR 5 0.2 - 5 - - 68,272 - - - - 1 - - 4
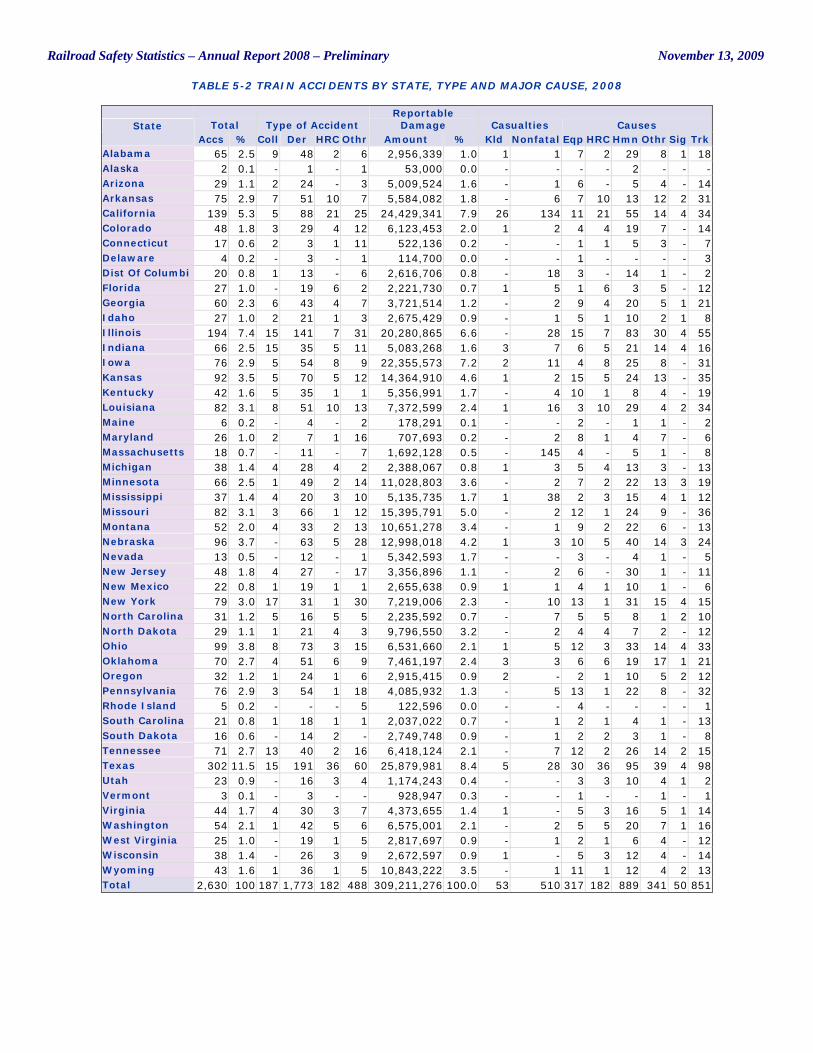
Railroad Safety Statistics – Annual Report 2008 – Preliminary November 13, 2009
TABLE 5-2 TRAIN ACCIDENTS BY STATE, TYPE AND MAJOR CAUSE, 2008
Total Type of Accident Reportable
Damage Casualties Causes State Accs % Coll Der HRC Othr Amount % Kld Nonfatal Eqp HRC Hmn Othr Sig Trk
Alabama 65 2.5 9 48 2 6 2,956,339 1.0 1 1 7 2 29 8 1 18 Alaska 2 0.1 - 1 - 1 53,000 0.0 - - - - 2 - - - Arizona 29 1.1 2 24 - 3 5,009,524 1.6 - 1 6 - 5 4 - 14 Arkansas 75 2.9 7 51 10 7 5,584,082 1.8 - 6 7 10 13 12 2 31 California 139 5.3 5 88 21 25 24,429,341 7.9 26 134 11 21 55 14 4 34 Colorado 48 1.8 3 29 4 12 6,123,453 2.0 1 2 4 4 19 7 - 14 Connecticut 17 0.6 2 3 1 11 522,136 0.2 - - 1 1 5 3 - 7 Delaware 4 0.2 - 3 - 1 114,700 0.0 - - 1 - - - - 3 Dist Of Columbi 20 0.8 1 13 - 6 2,616,706 0.8 - 18 3 - 14 1 - 2 Florida 27 1.0 - 19 6 2 2,221,730 0.7 1 5 1 6 3 5 - 12 Georgia 60 2.3 6 43 4 7 3,721,514 1.2 - 2 9 4 20 5 1 21 Idaho 27 1.0 2 21 1 3 2,675,429 0.9 - 1 5 1 10 2 1 8 Illinois 194 7.4 15 141 7 31 20,280,865 6.6 - 28 15 7 83 30 4 55 Indiana 66 2.5 15 35 5 11 5,083,268 1.6 3 7 6 5 21 14 4 16 Iowa 76 2.9 5 54 8 9 22,355,573 7.2 2 11 4 8 25 8 - 31 Kansas 92 3.5 5 70 5 12 14,364,910 4.6 1 2 15 5 24 13 - 35 Kentucky 42 1.6 5 35 1 1 5,356,991 1.7 - 4 10 1 8 4 - 19 Louisiana 82 3.1 8 51 10 13 7,372,599 2.4 1 16 3 10 29 4 2 34 Maine 6 0.2 - 4 - 2 178,291 0.1 - - 2 - 1 1 - 2 Maryland 26 1.0 2 7 1 16 707,693 0.2 - 2 8 1 4 7 - 6 Massachusetts 18 0.7 - 11 - 7 1,692,128 0.5 - 145 4 - 5 1 - 8 Michigan 38 1.4 4 28 4 2 2,388,067 0.8 1 3 5 4 13 3 - 13 Minnesota 66 2.5 1 49 2 14 11,028,803 3.6 - 2 7 2 22 13 3 19 Mississippi 37 1.4 4 20 3 10 5,135,735 1.7 1 38 2 3 15 4 1 12 Missouri 82 3.1 3 66 1 12 15,395,791 5.0 - 2 12 1 24 9 - 36 Montana 52 2.0 4 33 2 13 10,651,278 3.4 - 1 9 2 22 6 - 13 Nebraska 96 3.7 - 63 5 28 12,998,018 4.2 1 3 10 5 40 14 3 24 Nevada 13 0.5 - 12 - 1 5,342,593 1.7 - - 3 - 4 1 - 5 New Jersey 48 1.8 4 27 - 17 3,356,896 1.1 - 2 6 - 30 1 - 11 New Mexico 22 0.8 1 19 1 1 2,655,638 0.9 1 1 4 1 10 1 - 6 New York 79 3.0 17 31 1 30 7,219,006 2.3 - 10 13 1 31 15 4 15 North Carolina 31 1.2 5 16 5 5 2,235,592 0.7 - 7 5 5 8 1 2 10 North Dakota 29 1.1 1 21 4 3 9,796,550 3.2 - 2 4 4 7 2 - 12 Ohio 99 3.8 8 73 3 15 6,531,660 2.1 1 5 12 3 33 14 4 33 Oklahoma 70 2.7 4 51 6 9 7,461,197 2.4 3 3 6 6 19 17 1 21 Oregon 32 1.2 1 24 1 6 2,915,415 0.9 2 - 2 1 10 5 2 12 Pennsylvania 76 2.9 3 54 1 18 4,085,932 1.3 - 5 13 1 22 8 - 32 Rhode Island 5 0.2 - - - 5 122,596 0.0 - - 4 - - - - 1 South Carolina 21 0.8 1 18 1 1 2,037,022 0.7 - 1 2 1 4 1 - 13 South Dakota 16 0.6 - 14 2 - 2,749,748 0.9 - 1 2 2 3 1 - 8 Tennessee 71 2.7 13 40 2 16 6,418,124 2.1 - 7 12 2 26 14 2 15 Texas 302 11.5 15 191 36 60 25,879,981 8.4 5 28 30 36 95 39 4 98 Utah 23 0.9 - 16 3 4 1,174,243 0.4 - - 3 3 10 4 1 2 Vermont 3 0.1 - 3 - - 928,947 0.3 - - 1 - - 1 - 1 Virginia 44 1.7 4 30 3 7 4,373,655 1.4 1 - 5 3 16 5 1 14 Washington 54 2.1 1 42 5 6 6,575,001 2.1 - 2 5 5 20 7 1 16 West Virginia 25 1.0 - 19 1 5 2,817,697 0.9 - 1 2 1 6 4 - 12 Wisconsin 38 1.4 - 26 3 9 2,672,597 0.9 1 - 5 3 12 4 - 14 Wyoming 43 1.6 1 36 1 5 10,843,222 3.5 - 1 11 1 12 4 2 13 Total 2,630 100 187 1,773 182 488 309,211,276 100.0 53 510 317 182 889 341 50 851
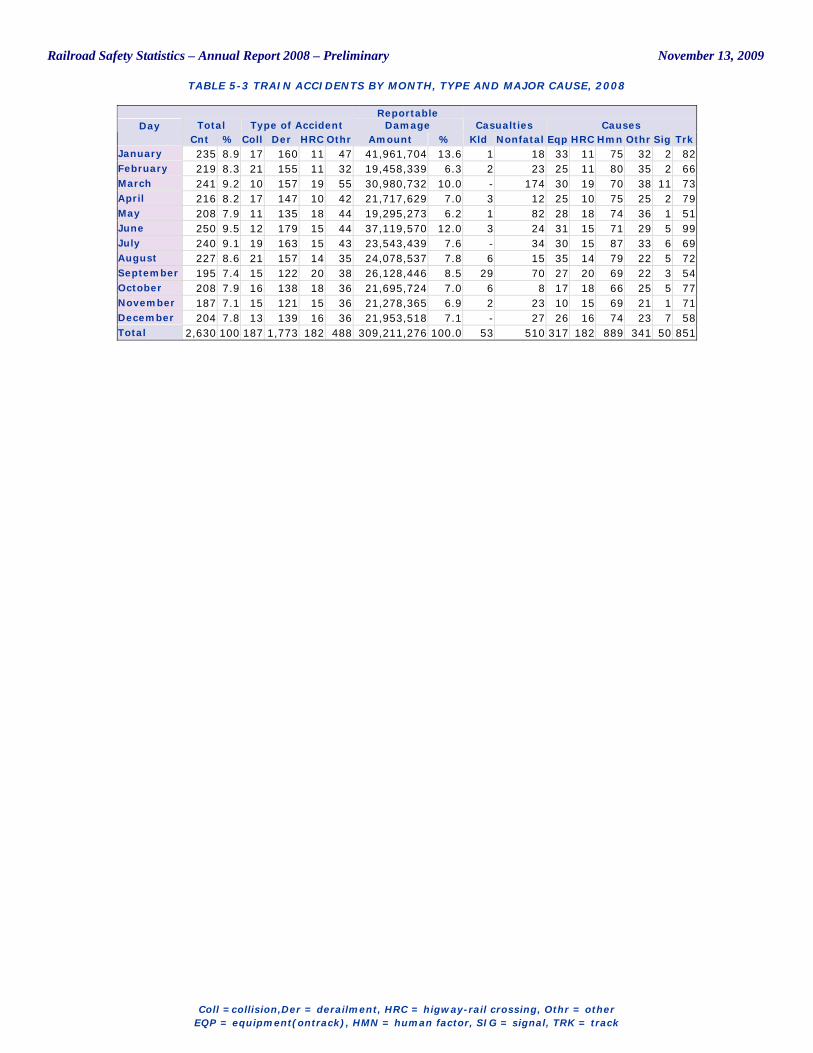
Railroad Safety Statistics – Annual Report 2008 – Preliminary November 13, 2009
TABLE 5-3 TRAIN ACCIDENTS BY MONTH, TYPE AND MAJOR CAUSE, 2008
Coll =collision,Der = derailment, HRC = higway-rail crossing, Othr = other
EQP = equipment(ontrack), HMN = human factor, SIG = signal, TRK = track
Total Type of Accident Reportable
Damage Casualties Causes Day Cnt % Coll Der HRC Othr Amount % Kld Nonfatal Eqp HRC Hmn Othr Sig Trk
January 235 8.9 17 160 11 47 41,961,704 13.6 1 18 33 11 75 32 2 82 February 219 8.3 21 155 11 32 19,458,339 6.3 2 23 25 11 80 35 2 66 March 241 9.2 10 157 19 55 30,980,732 10.0 - 174 30 19 70 38 11 73 April 216 8.2 17 147 10 42 21,717,629 7.0 3 12 25 10 75 25 2 79 May 208 7.9 11 135 18 44 19,295,273 6.2 1 82 28 18 74 36 1 51 June 250 9.5 12 179 15 44 37,119,570 12.0 3 24 31 15 71 29 5 99 July 240 9.1 19 163 15 43 23,543,439 7.6 - 34 30 15 87 33 6 69 August 227 8.6 21 157 14 35 24,078,537 7.8 6 15 35 14 79 22 5 72 September 195 7.4 15 122 20 38 26,128,446 8.5 29 70 27 20 69 22 3 54 October 208 7.9 16 138 18 36 21,695,724 7.0 6 8 17 18 66 25 5 77 November 187 7.1 15 121 15 36 21,278,365 6.9 2 23 10 15 69 21 1 71 December 204 7.8 13 139 16 36 21,953,518 7.1 - 27 26 16 74 23 7 58 Total 2,630 100 187 1,773 182 488 309,211,276 100.0 53 510 317 182 889 341 50 851
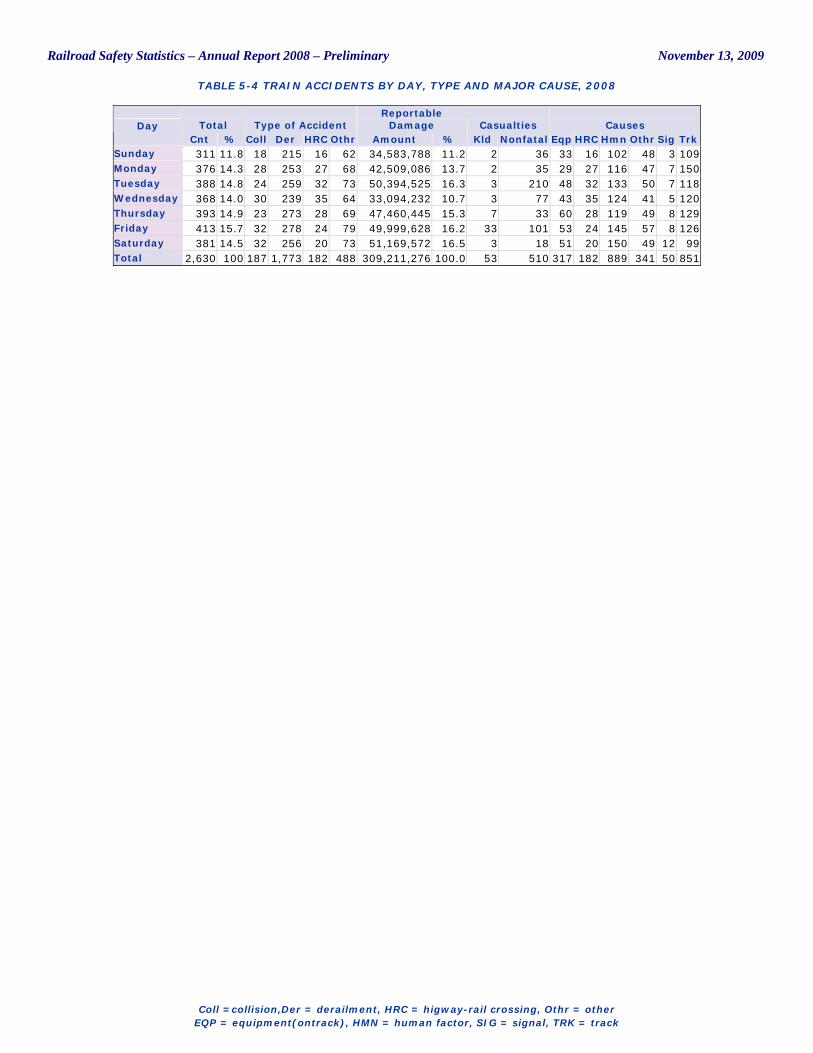
Railroad Safety Statistics – Annual Report 2008 – Preliminary November 13, 2009
TABLE 5-4 TRAIN ACCIDENTS BY DAY, TYPE AND MAJOR CAUSE, 2008
Coll =collision,Der = derailment, HRC = higway-rail crossing, Othr = other
EQP = equipment(ontrack), HMN = human factor, SIG = signal, TRK = track
Total Type of Accident Reportable
Damage Casualties Causes Day Cnt % Coll Der HRC Othr Amount % Kld Nonfatal Eqp HRC Hmn Othr Sig Trk
Sunday 311 11.8 18 215 16 62 34,583,788 11.2 2 36 33 16 102 48 3 109 Monday 376 14.3 28 253 27 68 42,509,086 13.7 2 35 29 27 116 47 7 150 Tuesday 388 14.8 24 259 32 73 50,394,525 16.3 3 210 48 32 133 50 7 118 Wednesday 368 14.0 30 239 35 64 33,094,232 10.7 3 77 43 35 124 41 5 120 Thursday 393 14.9 23 273 28 69 47,460,445 15.3 7 33 60 28 119 49 8 129 Friday 413 15.7 32 278 24 79 49,999,628 16.2 33 101 53 24 145 57 8 126 Saturday 381 14.5 32 256 20 73 51,169,572 16.5 3 18 51 20 150 49 12 99 Total 2,630 100 187 1,773 182 488 309,211,276 100.0 53 510 317 182 889 341 50 851
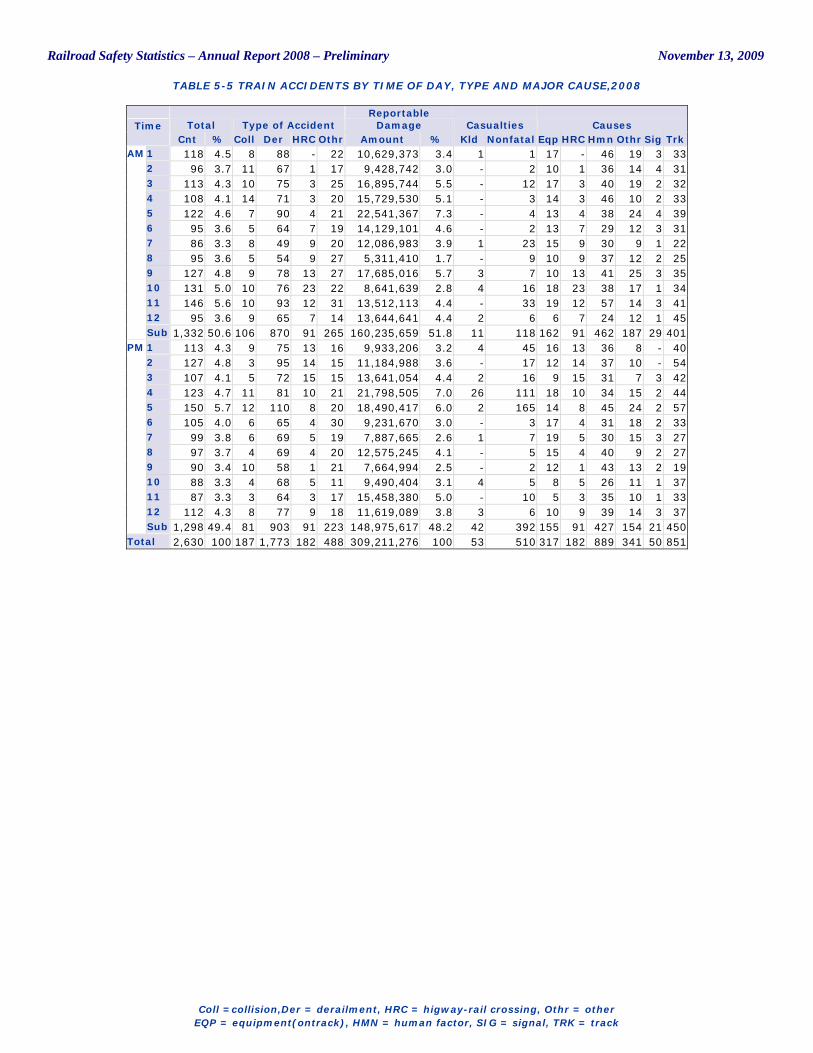
Railroad Safety Statistics – Annual Report 2008 – Preliminary November 13, 2009
TABLE 5-5 TRAIN ACCIDENTS BY TIME OF DAY, TYPE AND MAJOR CAUSE,2008
Coll =collision,Der = derailment, HRC = higway-rail crossing, Othr = other
EQP = equipment(ontrack), HMN = human factor, SIG = signal, TRK = track
Total Type of Accident Reportable
Damage Casualties Causes Time Cnt % Coll Der HRC Othr Amount % Kld Nonfatal Eqp HRC Hmn Othr Sig Trk
1 118 4.5 8 88 - 22 10,629,373 3.4 1 1 17 - 46 19 3 33 2 96 3.7 11 67 1 17 9,428,742 3.0 - 2 10 1 36 14 4 31 3 113 4.3 10 75 3 25 16,895,744 5.5 - 12 17 3 40 19 2 32 4 108 4.1 14 71 3 20 15,729,530 5.1 - 3 14 3 46 10 2 33 5 122 4.6 7 90 4 21 22,541,367 7.3 - 4 13 4 38 24 4 39 6 95 3.6 5 64 7 19 14,129,101 4.6 - 2 13 7 29 12 3 31 7 86 3.3 8 49 9 20 12,086,983 3.9 1 23 15 9 30 9 1 22 8 95 3.6 5 54 9 27 5,311,410 1.7 - 9 10 9 37 12 2 25 9 127 4.8 9 78 13 27 17,685,016 5.7 3 7 10 13 41 25 3 35 10 131 5.0 10 76 23 22 8,641,639 2.8 4 16 18 23 38 17 1 34 11 146 5.6 10 93 12 31 13,512,113 4.4 - 33 19 12 57 14 3 41 12 95 3.6 9 65 7 14 13,644,641 4.4 2 6 6 7 24 12 1 45
AM
Sub 1,332 50.6 106 870 91 265 160,235,659 51.8 11 118 162 91 462 187 29 401 1 113 4.3 9 75 13 16 9,933,206 3.2 4 45 16 13 36 8 - 40 2 127 4.8 3 95 14 15 11,184,988 3.6 - 17 12 14 37 10 - 54 3 107 4.1 5 72 15 15 13,641,054 4.4 2 16 9 15 31 7 3 42 4 123 4.7 11 81 10 21 21,798,505 7.0 26 111 18 10 34 15 2 44 5 150 5.7 12 110 8 20 18,490,417 6.0 2 165 14 8 45 24 2 57 6 105 4.0 6 65 4 30 9,231,670 3.0 - 3 17 4 31 18 2 33 7 99 3.8 6 69 5 19 7,887,665 2.6 1 7 19 5 30 15 3 27 8 97 3.7 4 69 4 20 12,575,245 4.1 - 5 15 4 40 9 2 27 9 90 3.4 10 58 1 21 7,664,994 2.5 - 2 12 1 43 13 2 19 10 88 3.3 4 68 5 11 9,490,404 3.1 4 5 8 5 26 11 1 37 11 87 3.3 3 64 3 17 15,458,380 5.0 - 10 5 3 35 10 1 33 12 112 4.3 8 77 9 18 11,619,089 3.8 3 6 10 9 39 14 3 37
PM
Sub 1,298 49.4 81 903 91 223 148,975,617 48.2 42 392 155 91 427 154 21 450 Total 2,630 100 187 1,773 182 488 309,211,276 100 53 510 317 182 889 341 50 851
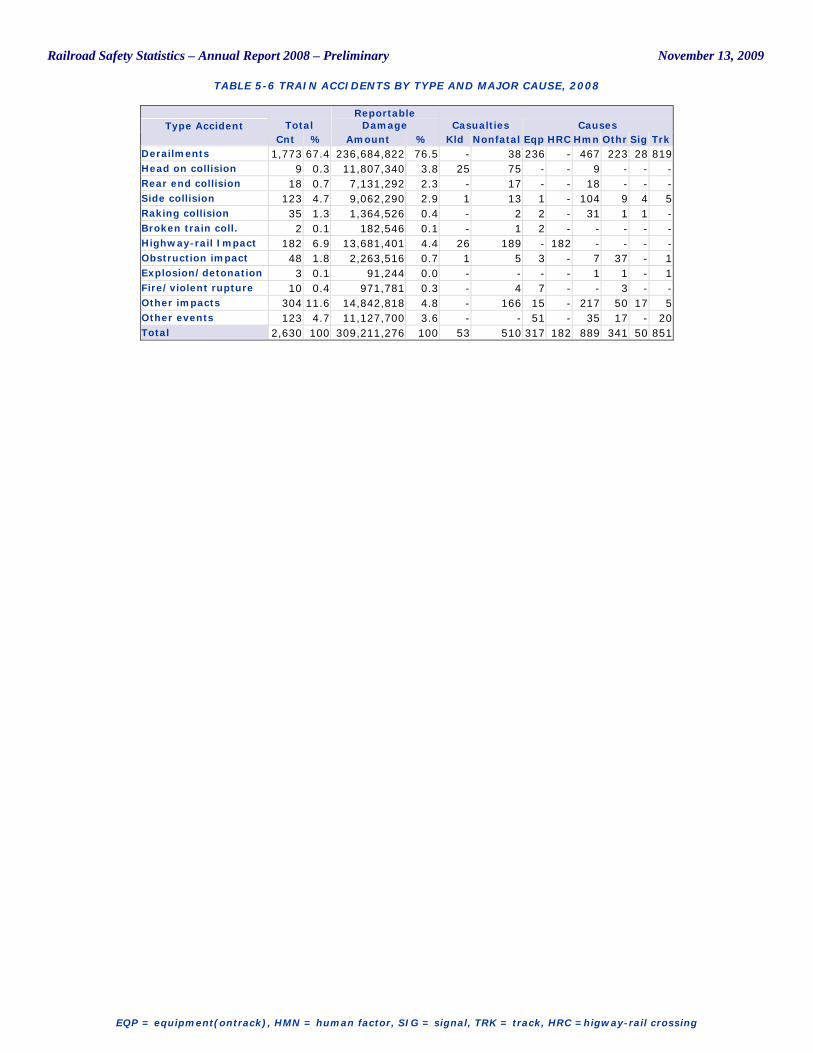
Railroad Safety Statistics – Annual Report 2008 – Preliminary November 13, 2009
TABLE 5-6 TRAIN ACCIDENTS BY TYPE AND MAJOR CAUSE, 2008
EQP = equipment(ontrack), HMN = human factor, SIG = signal, TRK = track, HRC =higway-rail crossing
Total Reportable
Damage Casualties Causes Type Accident Cnt % Amount % Kld Nonfatal Eqp HRC Hmn Othr Sig Trk
Derailments 1,773 67.4 236,684,822 76.5 - 38 236 - 467 223 28 819 Head on collision 9 0.3 11,807,340 3.8 25 75 - - 9 - - - Rear end collision 18 0.7 7,131,292 2.3 - 17 - - 18 - - - Side collision 123 4.7 9,062,290 2.9 1 13 1 - 104 9 4 5 Raking collision 35 1.3 1,364,526 0.4 - 2 2 - 31 1 1 - Broken train coll. 2 0.1 182,546 0.1 - 1 2 - - - - - Highway-rail Impact 182 6.9 13,681,401 4.4 26 189 - 182 - - - - Obstruction impact 48 1.8 2,263,516 0.7 1 5 3 - 7 37 - 1 Explosion/detonation 3 0.1 91,244 0.0 - - - - 1 1 - 1 Fire/violent rupture 10 0.4 971,781 0.3 - 4 7 - - 3 - - Other impacts 304 11.6 14,842,818 4.8 - 166 15 - 217 50 17 5 Other events 123 4.7 11,127,700 3.6 - - 51 - 35 17 - 20 Total 2,630 100 309,211,276 100 53 510 317 182 889 341 50 851
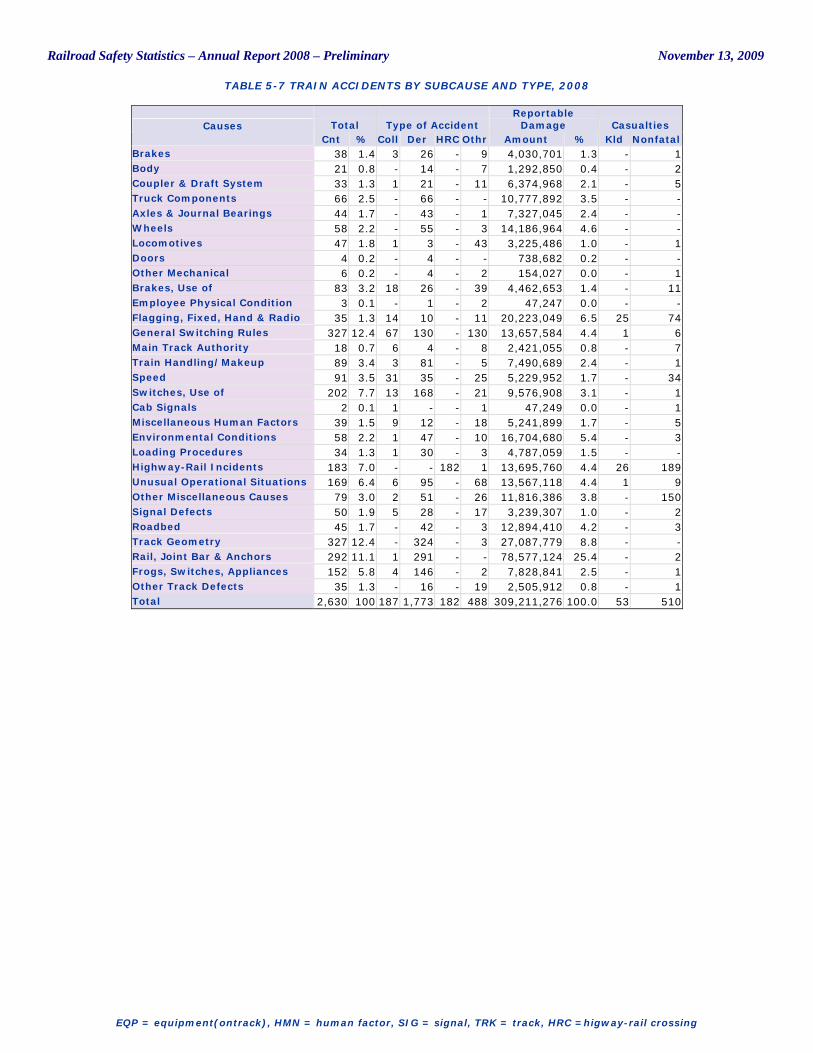
Railroad Safety Statistics – Annual Report 2008 – Preliminary November 13, 2009
TABLE 5-7 TRAIN ACCIDENTS BY SUBCAUSE AND TYPE, 2008
EQP = equipment(ontrack), HMN = human factor, SIG = signal, TRK = track, HRC =higway-rail crossing
Total Type of Accident Reportable
Damage Casualties Causes Cnt % Coll Der HRC Othr Amount % Kld Nonfatal
Brakes 38 1.4 3 26 - 9 4,030,701 1.3 - 1 Body 21 0.8 - 14 - 7 1,292,850 0.4 - 2 Coupler & Draft System 33 1.3 1 21 - 11 6,374,968 2.1 - 5 Truck Components 66 2.5 - 66 - - 10,777,892 3.5 - - Axles & Journal Bearings 44 1.7 - 43 - 1 7,327,045 2.4 - - Wheels 58 2.2 - 55 - 3 14,186,964 4.6 - - Locomotives 47 1.8 1 3 - 43 3,225,486 1.0 - 1 Doors 4 0.2 - 4 - - 738,682 0.2 - - Other Mechanical 6 0.2 - 4 - 2 154,027 0.0 - 1 Brakes, Use of 83 3.2 18 26 - 39 4,462,653 1.4 - 11 Employee Physical Condition 3 0.1 - 1 - 2 47,247 0.0 - - Flagging, Fixed, Hand & Radio 35 1.3 14 10 - 11 20,223,049 6.5 25 74 General Switching Rules 327 12.4 67 130 - 130 13,657,584 4.4 1 6 Main Track Authority 18 0.7 6 4 - 8 2,421,055 0.8 - 7 Train Handling/Makeup 89 3.4 3 81 - 5 7,490,689 2.4 - 1 Speed 91 3.5 31 35 - 25 5,229,952 1.7 - 34 Switches, Use of 202 7.7 13 168 - 21 9,576,908 3.1 - 1 Cab Signals 2 0.1 1 - - 1 47,249 0.0 - 1 Miscellaneous Human Factors 39 1.5 9 12 - 18 5,241,899 1.7 - 5 Environmental Conditions 58 2.2 1 47 - 10 16,704,680 5.4 - 3 Loading Procedures 34 1.3 1 30 - 3 4,787,059 1.5 - - Highway-Rail Incidents 183 7.0 - - 182 1 13,695,760 4.4 26 189 Unusual Operational Situations 169 6.4 6 95 - 68 13,567,118 4.4 1 9 Other Miscellaneous Causes 79 3.0 2 51 - 26 11,816,386 3.8 - 150 Signal Defects 50 1.9 5 28 - 17 3,239,307 1.0 - 2 Roadbed 45 1.7 - 42 - 3 12,894,410 4.2 - 3 Track Geometry 327 12.4 - 324 - 3 27,087,779 8.8 - - Rail, Joint Bar & Anchors 292 11.1 1 291 - - 78,577,124 25.4 - 2 Frogs, Switches, Appliances 152 5.8 4 146 - 2 7,828,841 2.5 - 1 Other Track Defects 35 1.3 - 16 - 19 2,505,912 0.8 - 1 Total 2,630 100 187 1,773 182 488 309,211,276 100.0 53 510
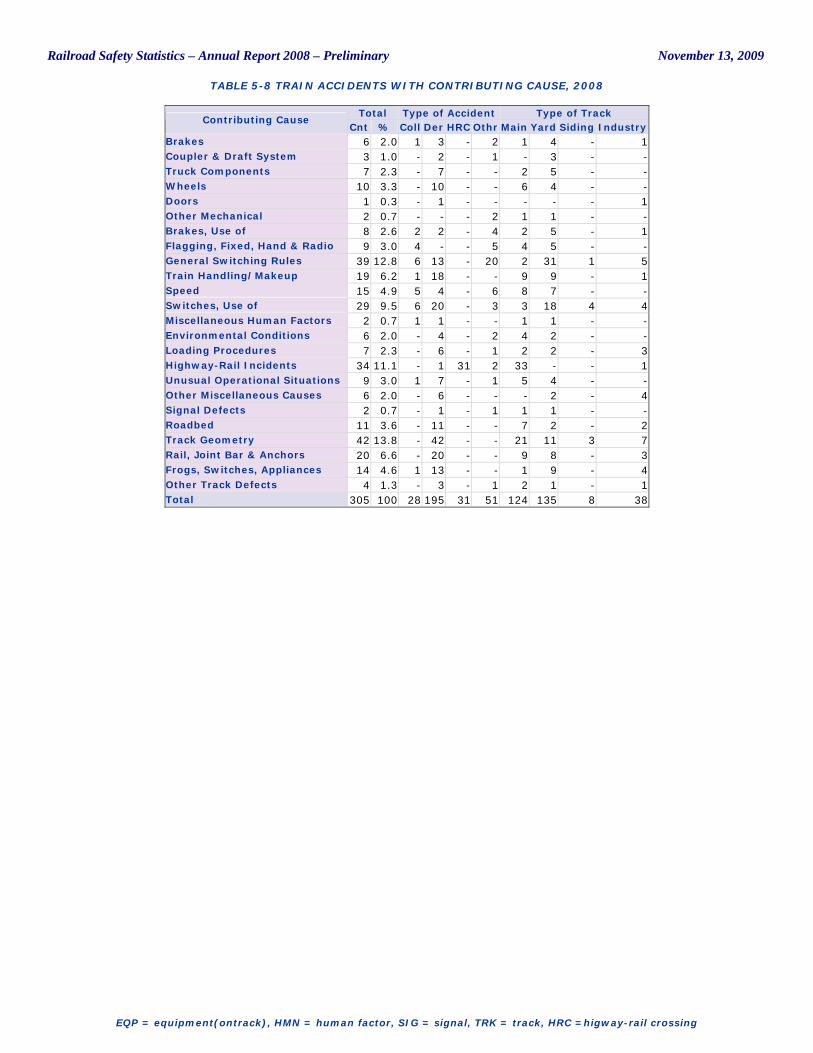
Railroad Safety Statistics – Annual Report 2008 – Preliminary November 13, 2009
TABLE 5-8 TRAIN ACCIDENTS WITH CONTRIBUTING CAUSE, 2008
EQP = equipment(ontrack), HMN = human factor, SIG = signal, TRK = track, HRC =higway-rail crossing
Total Type of Accident Type of Track Contributing Cause
Cnt % Coll Der HRC Othr Main Yard Siding Industry Brakes 6 2.0 1 3 - 2 1 4 - 1 Coupler & Draft System 3 1.0 - 2 - 1 - 3 - - Truck Components 7 2.3 - 7 - - 2 5 - - Wheels 10 3.3 - 10 - - 6 4 - - Doors 1 0.3 - 1 - - - - - 1 Other Mechanical 2 0.7 - - - 2 1 1 - - Brakes, Use of 8 2.6 2 2 - 4 2 5 - 1 Flagging, Fixed, Hand & Radio 9 3.0 4 - - 5 4 5 - - General Switching Rules 39 12.8 6 13 - 20 2 31 1 5 Train Handling/Makeup 19 6.2 1 18 - - 9 9 - 1 Speed 15 4.9 5 4 - 6 8 7 - - Switches, Use of 29 9.5 6 20 - 3 3 18 4 4 Miscellaneous Human Factors 2 0.7 1 1 - - 1 1 - - Environmental Conditions 6 2.0 - 4 - 2 4 2 - - Loading Procedures 7 2.3 - 6 - 1 2 2 - 3 Highway-Rail Incidents 34 11.1 - 1 31 2 33 - - 1 Unusual Operational Situations 9 3.0 1 7 - 1 5 4 - - Other Miscellaneous Causes 6 2.0 - 6 - - - 2 - 4 Signal Defects 2 0.7 - 1 - 1 1 1 - - Roadbed 11 3.6 - 11 - - 7 2 - 2 Track Geometry 42 13.8 - 42 - - 21 11 3 7 Rail, Joint Bar & Anchors 20 6.6 - 20 - - 9 8 - 3 Frogs, Switches, Appliances 14 4.6 1 13 - - 1 9 - 4 Other Track Defects 4 1.3 - 3 - 1 2 1 - 1 Total 305 100 28 195 31 51 124 135 8 38
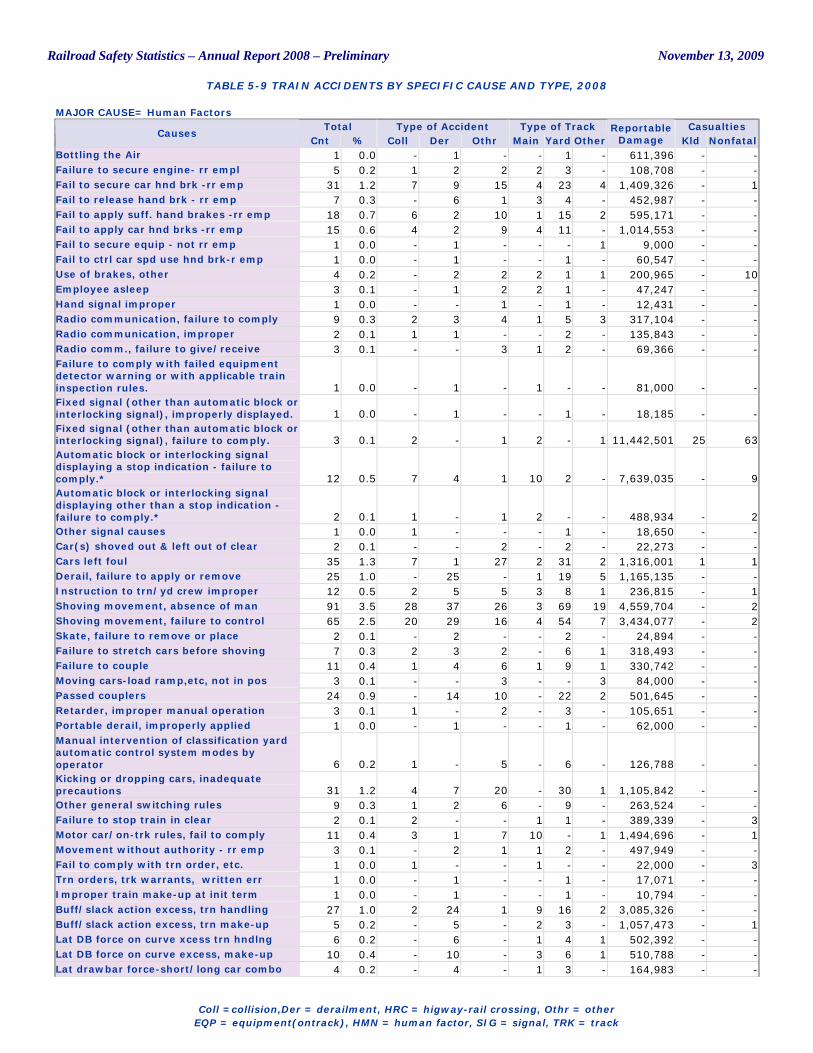
Railroad Safety Statistics – Annual Report 2008 – Preliminary November 13, 2009
TABLE 5-9 TRAIN ACCIDENTS BY SPECIFIC CAUSE AND TYPE, 2008
Coll =collision,Der = derailment, HRC = higway-rail crossing, Othr = other
EQP = equipment(ontrack), HMN = human factor, SIG = signal, TRK = track
MAJOR CAUSE= Human Factors Total Type of Accident Type of Track Casualties
Causes Cnt % Coll Der Othr Main Yard Other
Reportable Damage Kld Nonfatal
Bottling the Air 1 0.0 - 1 - - 1 - 611,396 - - Failure to secure engine- rr empl 5 0.2 1 2 2 2 3 - 108,708 - - Fail to secure car hnd brk -rr emp 31 1.2 7 9 15 4 23 4 1,409,326 - 1 Fail to release hand brk - rr emp 7 0.3 - 6 1 3 4 - 452,987 - - Fail to apply suff. hand brakes -rr emp 18 0.7 6 2 10 1 15 2 595,171 - - Fail to apply car hnd brks -rr emp 15 0.6 4 2 9 4 11 - 1,014,553 - - Fail to secure equip - not rr emp 1 0.0 - 1 - - - 1 9,000 - - Fail to ctrl car spd use hnd brk-r emp 1 0.0 - 1 - - 1 - 60,547 - - Use of brakes, other 4 0.2 - 2 2 2 1 1 200,965 - 10 Employee asleep 3 0.1 - 1 2 2 1 - 47,247 - - Hand signal improper 1 0.0 - - 1 - 1 - 12,431 - - Radio communication, failure to comply 9 0.3 2 3 4 1 5 3 317,104 - - Radio communication, improper 2 0.1 1 1 - - 2 - 135,843 - - Radio comm., failure to give/receive 3 0.1 - - 3 1 2 - 69,366 - - Failure to comply with failed equipment detector warning or with applicable train inspection rules. 1 0.0 - 1 - 1 - - 81,000 - - Fixed signal (other than automatic block or interlocking signal), improperly displayed. 1 0.0 - 1 - - 1 - 18,185 - - Fixed signal (other than automatic block or interlocking signal), failure to comply. 3 0.1 2 - 1 2 - 1 11,442,501 25 63 Automatic block or interlocking signal displaying a stop indication - failure to comply.* 12 0.5 7 4 1 10 2 - 7,639,035 - 9 Automatic block or interlocking signal displaying other than a stop indication - failure to comply.* 2 0.1 1 - 1 2 - - 488,934 - 2 Other signal causes 1 0.0 1 - - - 1 - 18,650 - - Car(s) shoved out & left out of clear 2 0.1 - - 2 - 2 - 22,273 - - Cars left foul 35 1.3 7 1 27 2 31 2 1,316,001 1 1 Derail, failure to apply or remove 25 1.0 - 25 - 1 19 5 1,165,135 - - Instruction to trn/yd crew improper 12 0.5 2 5 5 3 8 1 236,815 - 1 Shoving movement, absence of man 91 3.5 28 37 26 3 69 19 4,559,704 - 2 Shoving movement, failure to control 65 2.5 20 29 16 4 54 7 3,434,077 - 2 Skate, failure to remove or place 2 0.1 - 2 - - 2 - 24,894 - - Failure to stretch cars before shoving 7 0.3 2 3 2 - 6 1 318,493 - - Failure to couple 11 0.4 1 4 6 1 9 1 330,742 - - Moving cars-load ramp,etc, not in pos 3 0.1 - - 3 - - 3 84,000 - - Passed couplers 24 0.9 - 14 10 - 22 2 501,645 - - Retarder, improper manual operation 3 0.1 1 - 2 - 3 - 105,651 - - Portable derail, improperly applied 1 0.0 - 1 - - 1 - 62,000 - - Manual intervention of classification yard automatic control system modes by operator 6 0.2 1 - 5 - 6 - 126,788 - - Kicking or dropping cars, inadequate precautions 31 1.2 4 7 20 - 30 1 1,105,842 - - Other general switching rules 9 0.3 1 2 6 - 9 - 263,524 - - Failure to stop train in clear 2 0.1 2 - - 1 1 - 389,339 - 3 Motor car/on-trk rules, fail to comply 11 0.4 3 1 7 10 - 1 1,494,696 - 1 Movement without authority - rr emp 3 0.1 - 2 1 1 2 - 497,949 - - Fail to comply with trn order, etc. 1 0.0 1 - - 1 - - 22,000 - 3 Trn orders, trk warrants, written err 1 0.0 - 1 - - 1 - 17,071 - - Improper train make-up at init term 1 0.0 - 1 - - 1 - 10,794 - - Buff/slack action excess, trn handling 27 1.0 2 24 1 9 16 2 3,085,326 - - Buff/slack action excess, trn make-up 5 0.2 - 5 - 2 3 - 1,057,473 - 1 Lat DB force on curve xcess trn hndlng 6 0.2 - 6 - 1 4 1 502,392 - - Lat DB force on curve excess, make-up 10 0.4 - 10 - 3 6 1 510,788 - - Lat drawbar force-short/long car combo 4 0.2 - 4 - 1 3 - 164,983 - -
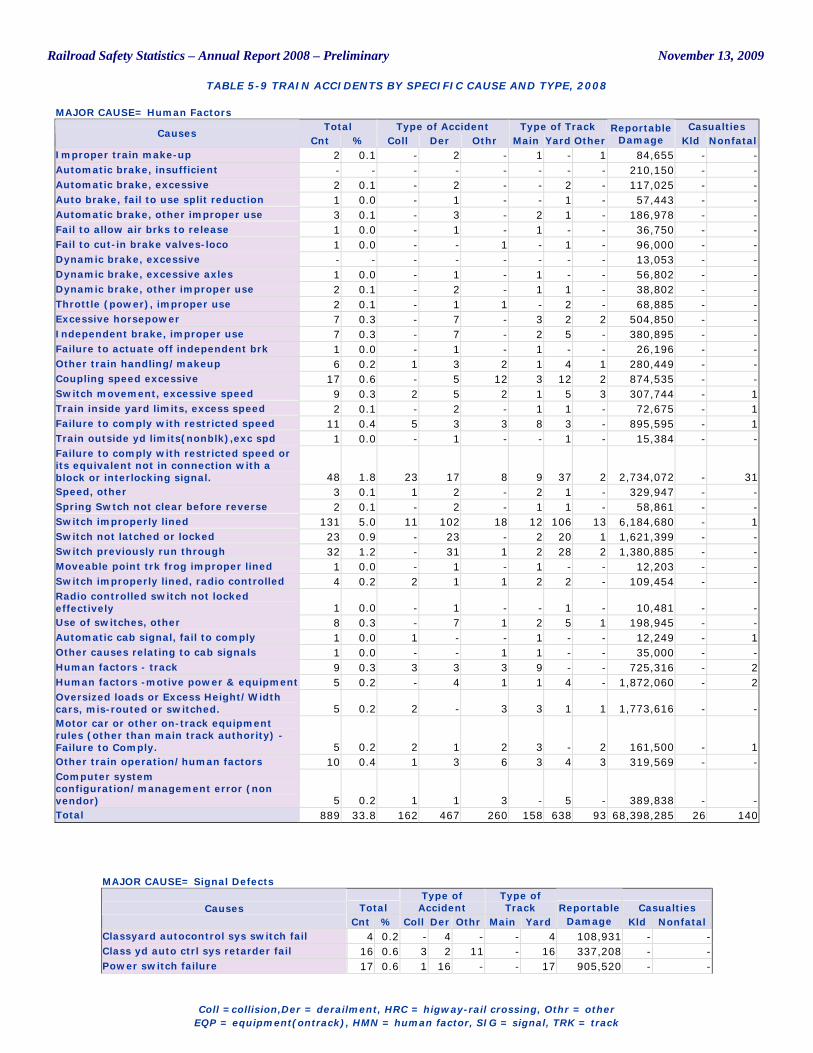
Railroad Safety Statistics – Annual Report 2008 – Preliminary November 13, 2009
TABLE 5-9 TRAIN ACCIDENTS BY SPECIFIC CAUSE AND TYPE, 2008
Coll =collision,Der = derailment, HRC = higway-rail crossing, Othr = other
EQP = equipment(ontrack), HMN = human factor, SIG = signal, TRK = track
MAJOR CAUSE= Human Factors Total Type of Accident Type of Track Casualties
Causes Cnt % Coll Der Othr Main Yard Other
Reportable Damage Kld Nonfatal
Improper train make-up 2 0.1 - 2 - 1 - 1 84,655 - - Automatic brake, insufficient - - - - - - - - 210,150 - - Automatic brake, excessive 2 0.1 - 2 - - 2 - 117,025 - - Auto brake, fail to use split reduction 1 0.0 - 1 - - 1 - 57,443 - - Automatic brake, other improper use 3 0.1 - 3 - 2 1 - 186,978 - - Fail to allow air brks to release 1 0.0 - 1 - 1 - - 36,750 - - Fail to cut-in brake valves-loco 1 0.0 - - 1 - 1 - 96,000 - - Dynamic brake, excessive - - - - - - - - 13,053 - - Dynamic brake, excessive axles 1 0.0 - 1 - 1 - - 56,802 - - Dynamic brake, other improper use 2 0.1 - 2 - 1 1 - 38,802 - - Throttle (power), improper use 2 0.1 - 1 1 - 2 - 68,885 - - Excessive horsepower 7 0.3 - 7 - 3 2 2 504,850 - - Independent brake, improper use 7 0.3 - 7 - 2 5 - 380,895 - - Failure to actuate off independent brk 1 0.0 - 1 - 1 - - 26,196 - - Other train handling/makeup 6 0.2 1 3 2 1 4 1 280,449 - - Coupling speed excessive 17 0.6 - 5 12 3 12 2 874,535 - - Switch movement, excessive speed 9 0.3 2 5 2 1 5 3 307,744 - 1 Train inside yard limits, excess speed 2 0.1 - 2 - 1 1 - 72,675 - 1 Failure to comply with restricted speed 11 0.4 5 3 3 8 3 - 895,595 - 1 Train outside yd limits(nonblk),exc spd 1 0.0 - 1 - - 1 - 15,384 - - Failure to comply with restricted speed or its equivalent not in connection with a block or interlocking signal. 48 1.8 23 17 8 9 37 2 2,734,072 - 31 Speed, other 3 0.1 1 2 - 2 1 - 329,947 - - Spring Swtch not clear before reverse 2 0.1 - 2 - 1 1 - 58,861 - - Switch improperly lined 131 5.0 11 102 18 12 106 13 6,184,680 - 1 Switch not latched or locked 23 0.9 - 23 - 2 20 1 1,621,399 - - Switch previously run through 32 1.2 - 31 1 2 28 2 1,380,885 - - Moveable point trk frog improper lined 1 0.0 - 1 - 1 - - 12,203 - - Switch improperly lined, radio controlled 4 0.2 2 1 1 2 2 - 109,454 - - Radio controlled switch not locked effectively 1 0.0 - 1 - - 1 - 10,481 - - Use of switches, other 8 0.3 - 7 1 2 5 1 198,945 - - Automatic cab signal, fail to comply 1 0.0 1 - - 1 - - 12,249 - 1 Other causes relating to cab signals 1 0.0 - - 1 1 - - 35,000 - - Human factors - track 9 0.3 3 3 3 9 - - 725,316 - 2 Human factors -motive power & equipment 5 0.2 - 4 1 1 4 - 1,872,060 - 2 Oversized loads or Excess Height/Width cars, mis-routed or switched. 5 0.2 2 - 3 3 1 1 1,773,616 - - Motor car or other on-track equipment rules (other than main track authority) - Failure to Comply. 5 0.2 2 1 2 3 - 2 161,500 - 1 Other train operation/human factors 10 0.4 1 3 6 3 4 3 319,569 - - Computer system configuration/management error (non vendor) 5 0.2 1 1 3 - 5 - 389,838 - - Total 889 33.8 162 467 260 158 638 93 68,398,285 26 140
MAJOR CAUSE= Signal Defects
Total Type of
Accident Type of Track Casualties Causes
Cnt % Coll Der Othr Main Yard Reportable
Damage Kld Nonfatal Classyard autocontrol sys switch fail 4 0.2 - 4 - - 4 108,931 - - Class yd auto ctrl sys retarder fail 16 0.6 3 2 11 - 16 337,208 - - Power switch failure 17 0.6 1 16 - - 17 905,520 - -
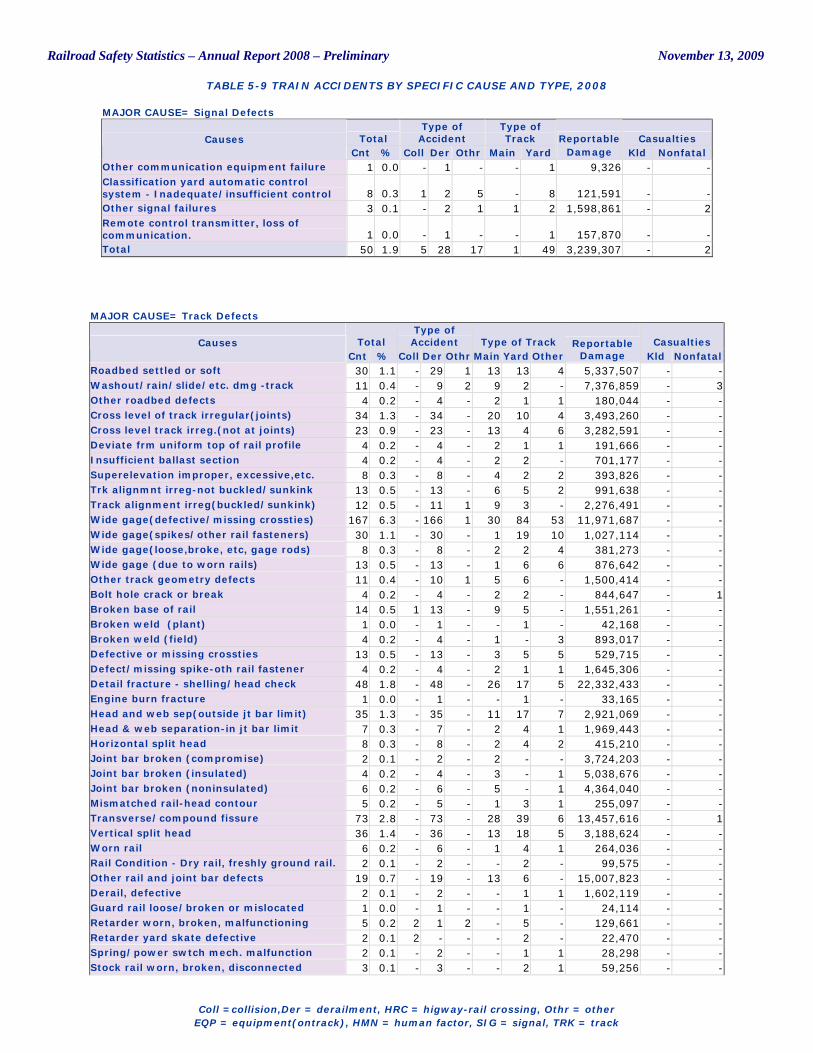
Railroad Safety Statistics – Annual Report 2008 – Preliminary November 13, 2009
TABLE 5-9 TRAIN ACCIDENTS BY SPECIFIC CAUSE AND TYPE, 2008
Coll =collision,Der = derailment, HRC = higway-rail crossing, Othr = other
EQP = equipment(ontrack), HMN = human factor, SIG = signal, TRK = track
MAJOR CAUSE= Signal Defects
Total Type of
Accident Type of Track Casualties Causes
Cnt % Coll Der Othr Main Yard Reportable
Damage Kld Nonfatal Other communication equipment failure 1 0.0 - 1 - - 1 9,326 - - Classification yard automatic control system - Inadequate/insufficient control 8 0.3 1 2 5 - 8 121,591 - - Other signal failures 3 0.1 - 2 1 1 2 1,598,861 - 2 Remote control transmitter, loss of communication. 1 0.0 - 1 - - 1 157,870 - - Total 50 1.9 5 28 17 1 49 3,239,307 - 2
MAJOR CAUSE= Track Defects
Total Type of
Accident Type of Track Casualties Causes Cnt % Coll Der Othr Main Yard Other
Reportable Damage Kld Nonfatal
Roadbed settled or soft 30 1.1 - 29 1 13 13 4 5,337,507 - - Washout/rain/slide/etc. dmg -track 11 0.4 - 9 2 9 2 - 7,376,859 - 3 Other roadbed defects 4 0.2 - 4 - 2 1 1 180,044 - - Cross level of track irregular(joints) 34 1.3 - 34 - 20 10 4 3,493,260 - - Cross level track irreg.(not at joints) 23 0.9 - 23 - 13 4 6 3,282,591 - - Deviate frm uniform top of rail profile 4 0.2 - 4 - 2 1 1 191,666 - - Insufficient ballast section 4 0.2 - 4 - 2 2 - 701,177 - - Superelevation improper, excessive,etc. 8 0.3 - 8 - 4 2 2 393,826 - - Trk alignmnt irreg-not buckled/sunkink 13 0.5 - 13 - 6 5 2 991,638 - - Track alignment irreg(buckled/sunkink) 12 0.5 - 11 1 9 3 - 2,276,491 - - Wide gage(defective/missing crossties) 167 6.3 - 166 1 30 84 53 11,971,687 - - Wide gage(spikes/other rail fasteners) 30 1.1 - 30 - 1 19 10 1,027,114 - - Wide gage(loose,broke, etc, gage rods) 8 0.3 - 8 - 2 2 4 381,273 - - Wide gage (due to worn rails) 13 0.5 - 13 - 1 6 6 876,642 - - Other track geometry defects 11 0.4 - 10 1 5 6 - 1,500,414 - - Bolt hole crack or break 4 0.2 - 4 - 2 2 - 844,647 - 1 Broken base of rail 14 0.5 1 13 - 9 5 - 1,551,261 - - Broken weld (plant) 1 0.0 - 1 - - 1 - 42,168 - - Broken weld (field) 4 0.2 - 4 - 1 - 3 893,017 - - Defective or missing crossties 13 0.5 - 13 - 3 5 5 529,715 - - Defect/missing spike-oth rail fastener 4 0.2 - 4 - 2 1 1 1,645,306 - - Detail fracture - shelling/head check 48 1.8 - 48 - 26 17 5 22,332,433 - - Engine burn fracture 1 0.0 - 1 - - 1 - 33,165 - - Head and web sep(outside jt bar limit) 35 1.3 - 35 - 11 17 7 2,921,069 - - Head & web separation-in jt bar limit 7 0.3 - 7 - 2 4 1 1,969,443 - - Horizontal split head 8 0.3 - 8 - 2 4 2 415,210 - - Joint bar broken (compromise) 2 0.1 - 2 - 2 - - 3,724,203 - - Joint bar broken (insulated) 4 0.2 - 4 - 3 - 1 5,038,676 - - Joint bar broken (noninsulated) 6 0.2 - 6 - 5 - 1 4,364,040 - - Mismatched rail-head contour 5 0.2 - 5 - 1 3 1 255,097 - - Transverse/compound fissure 73 2.8 - 73 - 28 39 6 13,457,616 - 1 Vertical split head 36 1.4 - 36 - 13 18 5 3,188,624 - - Worn rail 6 0.2 - 6 - 1 4 1 264,036 - - Rail Condition - Dry rail, freshly ground rail. 2 0.1 - 2 - - 2 - 99,575 - - Other rail and joint bar defects 19 0.7 - 19 - 13 6 - 15,007,823 - - Derail, defective 2 0.1 - 2 - - 1 1 1,602,119 - - Guard rail loose/broken or mislocated 1 0.0 - 1 - - 1 - 24,114 - - Retarder worn, broken, malfunctioning 5 0.2 2 1 2 - 5 - 129,661 - - Retarder yard skate defective 2 0.1 2 - - - 2 - 22,470 - - Spring/power swtch mech. malfunction 2 0.1 - 2 - - 1 1 28,298 - - Stock rail worn, broken, disconnected 3 0.1 - 3 - - 2 1 59,256 - -
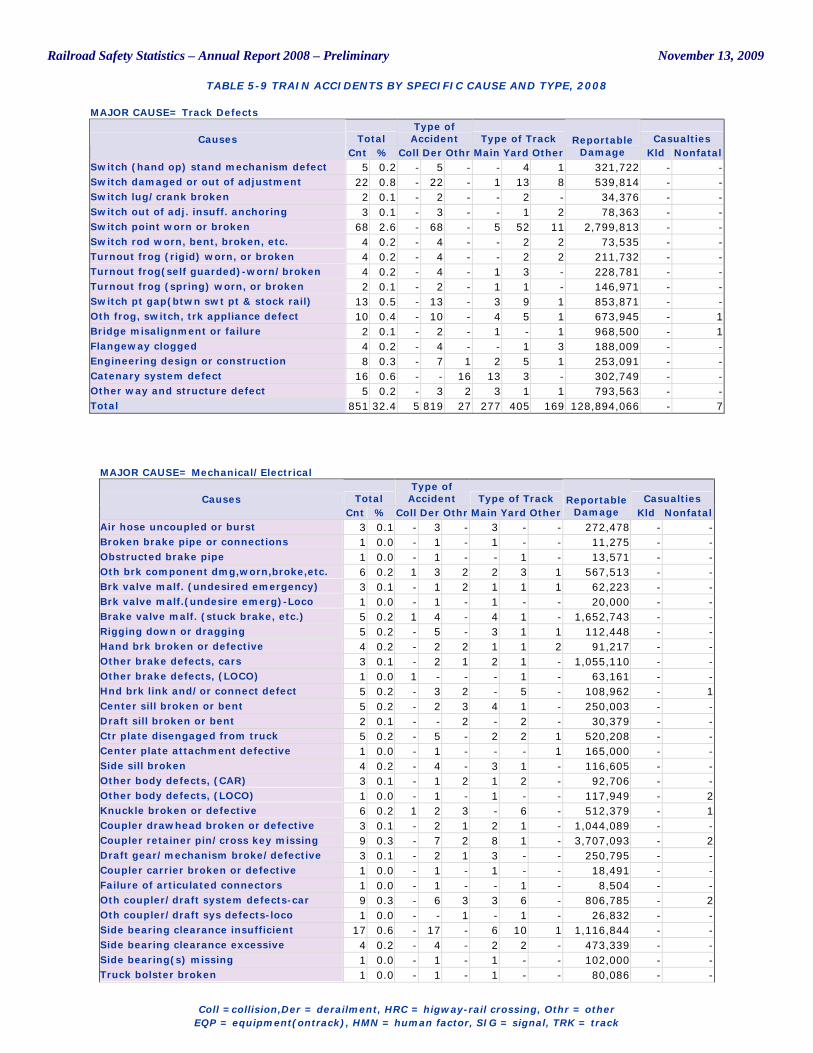
Railroad Safety Statistics – Annual Report 2008 – Preliminary November 13, 2009
TABLE 5-9 TRAIN ACCIDENTS BY SPECIFIC CAUSE AND TYPE, 2008
Coll =collision,Der = derailment, HRC = higway-rail crossing, Othr = other
EQP = equipment(ontrack), HMN = human factor, SIG = signal, TRK = track
MAJOR CAUSE= Track Defects
Total Type of
Accident Type of Track Casualties Causes Cnt % Coll Der Othr Main Yard Other
Reportable Damage Kld Nonfatal
Switch (hand op) stand mechanism defect 5 0.2 - 5 - - 4 1 321,722 - - Switch damaged or out of adjustment 22 0.8 - 22 - 1 13 8 539,814 - - Switch lug/crank broken 2 0.1 - 2 - - 2 - 34,376 - - Switch out of adj. insuff. anchoring 3 0.1 - 3 - - 1 2 78,363 - - Switch point worn or broken 68 2.6 - 68 - 5 52 11 2,799,813 - - Switch rod worn, bent, broken, etc. 4 0.2 - 4 - - 2 2 73,535 - - Turnout frog (rigid) worn, or broken 4 0.2 - 4 - - 2 2 211,732 - - Turnout frog(self guarded)-worn/broken 4 0.2 - 4 - 1 3 - 228,781 - - Turnout frog (spring) worn, or broken 2 0.1 - 2 - 1 1 - 146,971 - - Switch pt gap(btwn swt pt & stock rail) 13 0.5 - 13 - 3 9 1 853,871 - - Oth frog, switch, trk appliance defect 10 0.4 - 10 - 4 5 1 673,945 - 1 Bridge misalignment or failure 2 0.1 - 2 - 1 - 1 968,500 - 1 Flangeway clogged 4 0.2 - 4 - - 1 3 188,009 - - Engineering design or construction 8 0.3 - 7 1 2 5 1 253,091 - - Catenary system defect 16 0.6 - - 16 13 3 - 302,749 - - Other way and structure defect 5 0.2 - 3 2 3 1 1 793,563 - - Total 851 32.4 5 819 27 277 405 169 128,894,066 - 7
MAJOR CAUSE= Mechanical/Electrical
Total Type of
Accident Type of Track Casualties Causes Cnt % Coll Der Othr Main Yard Other
Reportable Damage Kld Nonfatal
Air hose uncoupled or burst 3 0.1 - 3 - 3 - - 272,478 - - Broken brake pipe or connections 1 0.0 - 1 - 1 - - 11,275 - - Obstructed brake pipe 1 0.0 - 1 - - 1 - 13,571 - - Oth brk component dmg,worn,broke,etc. 6 0.2 1 3 2 2 3 1 567,513 - - Brk valve malf. (undesired emergency) 3 0.1 - 1 2 1 1 1 62,223 - - Brk valve malf.(undesire emerg)-Loco 1 0.0 - 1 - 1 - - 20,000 - - Brake valve malf. (stuck brake, etc.) 5 0.2 1 4 - 4 1 - 1,652,743 - - Rigging down or dragging 5 0.2 - 5 - 3 1 1 112,448 - - Hand brk broken or defective 4 0.2 - 2 2 1 1 2 91,217 - - Other brake defects, cars 3 0.1 - 2 1 2 1 - 1,055,110 - - Other brake defects, (LOCO) 1 0.0 1 - - - 1 - 63,161 - - Hnd brk link and/or connect defect 5 0.2 - 3 2 - 5 - 108,962 - 1 Center sill broken or bent 5 0.2 - 2 3 4 1 - 250,003 - - Draft sill broken or bent 2 0.1 - - 2 - 2 - 30,379 - - Ctr plate disengaged from truck 5 0.2 - 5 - 2 2 1 520,208 - - Center plate attachment defective 1 0.0 - 1 - - - 1 165,000 - - Side sill broken 4 0.2 - 4 - 3 1 - 116,605 - - Other body defects, (CAR) 3 0.1 - 1 2 1 2 - 92,706 - - Other body defects, (LOCO) 1 0.0 - 1 - 1 - - 117,949 - 2 Knuckle broken or defective 6 0.2 1 2 3 - 6 - 512,379 - 1 Coupler drawhead broken or defective 3 0.1 - 2 1 2 1 - 1,044,089 - - Coupler retainer pin/cross key missing 9 0.3 - 7 2 8 1 - 3,707,093 - 2 Draft gear/mechanism broke/defective 3 0.1 - 2 1 3 - - 250,795 - - Coupler carrier broken or defective 1 0.0 - 1 - 1 - - 18,491 - - Failure of articulated connectors 1 0.0 - 1 - - 1 - 8,504 - - Oth coupler/draft system defects-car 9 0.3 - 6 3 3 6 - 806,785 - 2 Oth coupler/draft sys defects-loco 1 0.0 - - 1 - 1 - 26,832 - - Side bearing clearance insufficient 17 0.6 - 17 - 6 10 1 1,116,844 - - Side bearing clearance excessive 4 0.2 - 4 - 2 2 - 473,339 - - Side bearing(s) missing 1 0.0 - 1 - 1 - - 102,000 - - Truck bolster broken 1 0.0 - 1 - 1 - - 80,086 - -
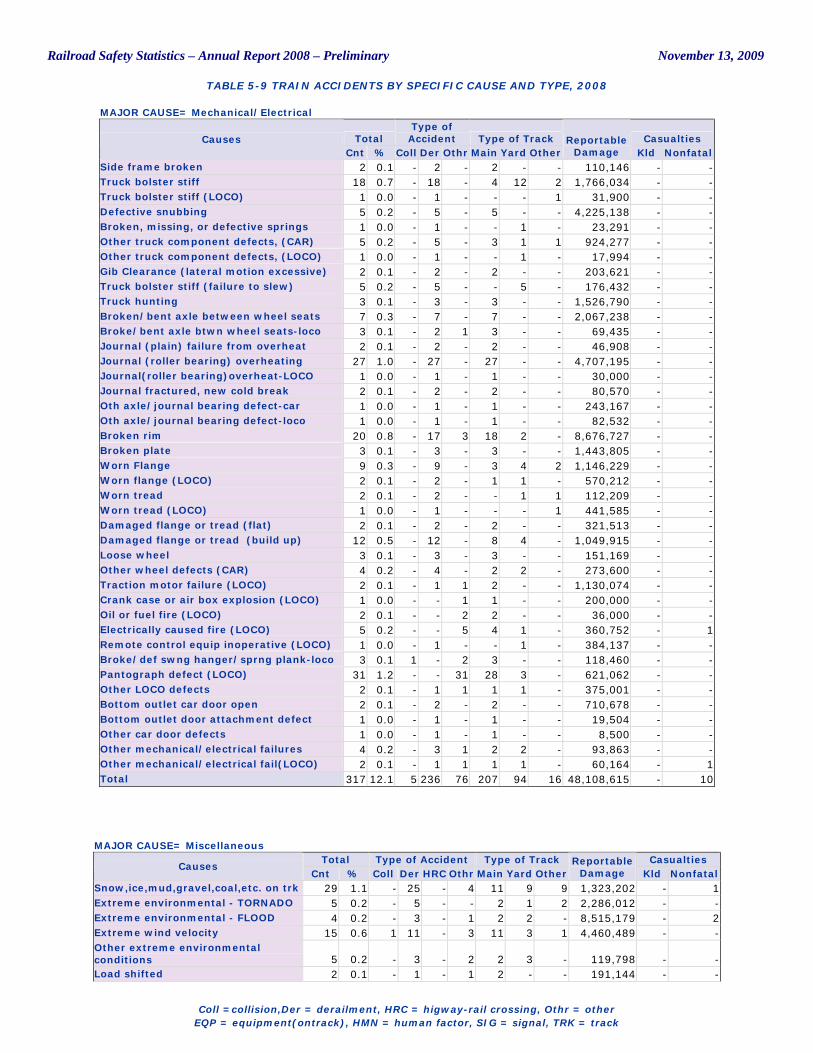
Railroad Safety Statistics – Annual Report 2008 – Preliminary November 13, 2009
TABLE 5-9 TRAIN ACCIDENTS BY SPECIFIC CAUSE AND TYPE, 2008
Coll =collision,Der = derailment, HRC = higway-rail crossing, Othr = other
EQP = equipment(ontrack), HMN = human factor, SIG = signal, TRK = track
MAJOR CAUSE= Mechanical/Electrical
Total Type of
Accident Type of Track Casualties Causes Cnt % Coll Der Othr Main Yard Other
Reportable Damage Kld Nonfatal
Side frame broken 2 0.1 - 2 - 2 - - 110,146 - - Truck bolster stiff 18 0.7 - 18 - 4 12 2 1,766,034 - - Truck bolster stiff (LOCO) 1 0.0 - 1 - - - 1 31,900 - - Defective snubbing 5 0.2 - 5 - 5 - - 4,225,138 - - Broken, missing, or defective springs 1 0.0 - 1 - - 1 - 23,291 - - Other truck component defects, (CAR) 5 0.2 - 5 - 3 1 1 924,277 - - Other truck component defects, (LOCO) 1 0.0 - 1 - - 1 - 17,994 - - Gib Clearance (lateral motion excessive) 2 0.1 - 2 - 2 - - 203,621 - - Truck bolster stiff (failure to slew) 5 0.2 - 5 - - 5 - 176,432 - - Truck hunting 3 0.1 - 3 - 3 - - 1,526,790 - - Broken/bent axle between wheel seats 7 0.3 - 7 - 7 - - 2,067,238 - - Broke/bent axle btwn wheel seats-loco 3 0.1 - 2 1 3 - - 69,435 - - Journal (plain) failure from overheat 2 0.1 - 2 - 2 - - 46,908 - - Journal (roller bearing) overheating 27 1.0 - 27 - 27 - - 4,707,195 - - Journal(roller bearing)overheat-LOCO 1 0.0 - 1 - 1 - - 30,000 - - Journal fractured, new cold break 2 0.1 - 2 - 2 - - 80,570 - - Oth axle/journal bearing defect-car 1 0.0 - 1 - 1 - - 243,167 - - Oth axle/journal bearing defect-loco 1 0.0 - 1 - 1 - - 82,532 - - Broken rim 20 0.8 - 17 3 18 2 - 8,676,727 - - Broken plate 3 0.1 - 3 - 3 - - 1,443,805 - - Worn Flange 9 0.3 - 9 - 3 4 2 1,146,229 - - Worn flange (LOCO) 2 0.1 - 2 - 1 1 - 570,212 - - Worn tread 2 0.1 - 2 - - 1 1 112,209 - - Worn tread (LOCO) 1 0.0 - 1 - - - 1 441,585 - - Damaged flange or tread (flat) 2 0.1 - 2 - 2 - - 321,513 - - Damaged flange or tread (build up) 12 0.5 - 12 - 8 4 - 1,049,915 - - Loose wheel 3 0.1 - 3 - 3 - - 151,169 - - Other wheel defects (CAR) 4 0.2 - 4 - 2 2 - 273,600 - - Traction motor failure (LOCO) 2 0.1 - 1 1 2 - - 1,130,074 - - Crank case or air box explosion (LOCO) 1 0.0 - - 1 1 - - 200,000 - - Oil or fuel fire (LOCO) 2 0.1 - - 2 2 - - 36,000 - - Electrically caused fire (LOCO) 5 0.2 - - 5 4 1 - 360,752 - 1 Remote control equip inoperative (LOCO) 1 0.0 - 1 - - 1 - 384,137 - - Broke/def swng hanger/sprng plank-loco 3 0.1 1 - 2 3 - - 118,460 - - Pantograph defect (LOCO) 31 1.2 - - 31 28 3 - 621,062 - - Other LOCO defects 2 0.1 - 1 1 1 1 - 375,001 - - Bottom outlet car door open 2 0.1 - 2 - 2 - - 710,678 - - Bottom outlet door attachment defect 1 0.0 - 1 - 1 - - 19,504 - - Other car door defects 1 0.0 - 1 - 1 - - 8,500 - - Other mechanical/electrical failures 4 0.2 - 3 1 2 2 - 93,863 - - Other mechanical/electrical fail(LOCO) 2 0.1 - 1 1 1 1 - 60,164 - 1 Total 317 12.1 5 236 76 207 94 16 48,108,615 - 10
MAJOR CAUSE= Miscellaneous Total Type of Accident Type of Track Casualties
Causes Cnt % Coll Der HRC Othr Main Yard Other
Reportable Damage Kld Nonfatal
Snow,ice,mud,gravel,coal,etc. on trk 29 1.1 - 25 - 4 11 9 9 1,323,202 - 1 Extreme environmental - TORNADO 5 0.2 - 5 - - 2 1 2 2,286,012 - - Extreme environmental - FLOOD 4 0.2 - 3 - 1 2 2 - 8,515,179 - 2 Extreme wind velocity 15 0.6 1 11 - 3 11 3 1 4,460,489 - - Other extreme environmental conditions 5 0.2 - 3 - 2 2 3 - 119,798 - - Load shifted 2 0.1 - 1 - 1 2 - - 191,144 - -
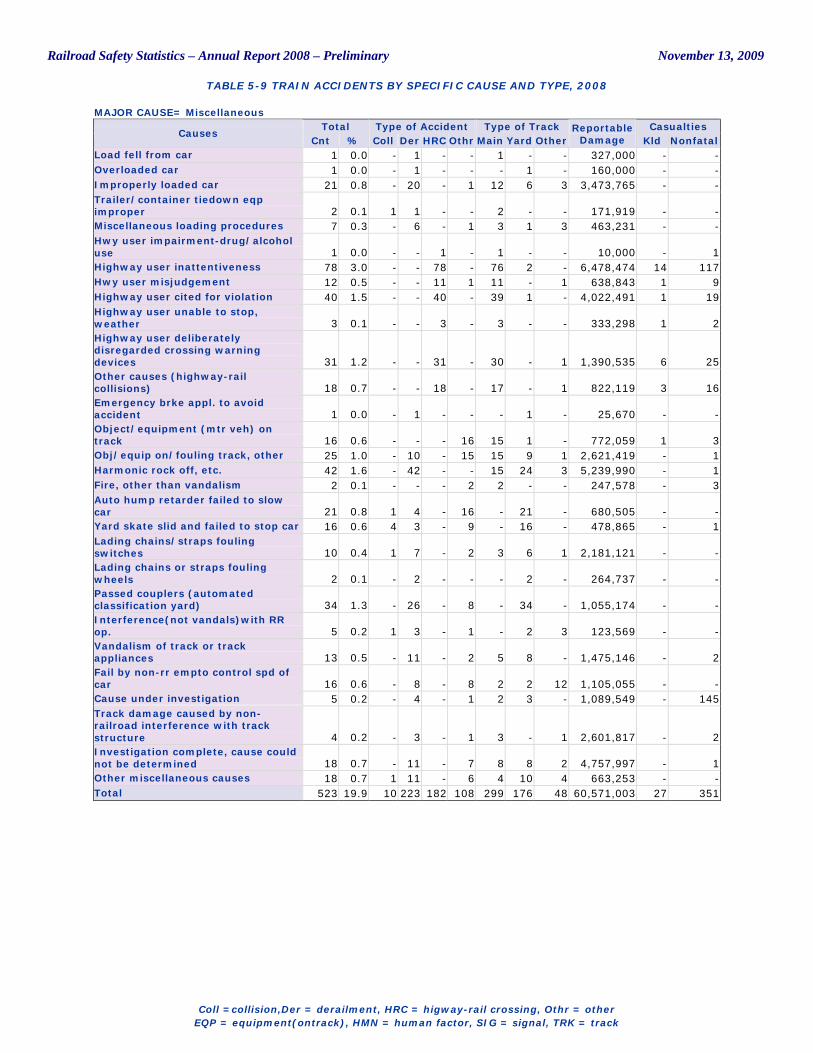
Railroad Safety Statistics – Annual Report 2008 – Preliminary November 13, 2009
TABLE 5-9 TRAIN ACCIDENTS BY SPECIFIC CAUSE AND TYPE, 2008
Coll =collision,Der = derailment, HRC = higway-rail crossing, Othr = other
EQP = equipment(ontrack), HMN = human factor, SIG = signal, TRK = track
MAJOR CAUSE= Miscellaneous Total Type of Accident Type of Track Casualties
Causes Cnt % Coll Der HRC Othr Main Yard Other
Reportable Damage Kld Nonfatal
Load fell from car 1 0.0 - 1 - - 1 - - 327,000 - - Overloaded car 1 0.0 - 1 - - - 1 - 160,000 - - Improperly loaded car 21 0.8 - 20 - 1 12 6 3 3,473,765 - - Trailer/container tiedown eqp improper 2 0.1 1 1 - - 2 - - 171,919 - - Miscellaneous loading procedures 7 0.3 - 6 - 1 3 1 3 463,231 - - Hwy user impairment-drug/alcohol use 1 0.0 - - 1 - 1 - - 10,000 - 1 Highway user inattentiveness 78 3.0 - - 78 - 76 2 - 6,478,474 14 117 Hwy user misjudgement 12 0.5 - - 11 1 11 - 1 638,843 1 9 Highway user cited for violation 40 1.5 - - 40 - 39 1 - 4,022,491 1 19 Highway user unable to stop, weather 3 0.1 - - 3 - 3 - - 333,298 1 2 Highway user deliberately disregarded crossing warning devices 31 1.2 - - 31 - 30 - 1 1,390,535 6 25 Other causes (highway-rail collisions) 18 0.7 - - 18 - 17 - 1 822,119 3 16 Emergency brke appl. to avoid accident 1 0.0 - 1 - - - 1 - 25,670 - - Object/equipment (mtr veh) on track 16 0.6 - - - 16 15 1 - 772,059 1 3 Obj/equip on/fouling track, other 25 1.0 - 10 - 15 15 9 1 2,621,419 - 1 Harmonic rock off, etc. 42 1.6 - 42 - - 15 24 3 5,239,990 - 1 Fire, other than vandalism 2 0.1 - - - 2 2 - - 247,578 - 3 Auto hump retarder failed to slow car 21 0.8 1 4 - 16 - 21 - 680,505 - - Yard skate slid and failed to stop car 16 0.6 4 3 - 9 - 16 - 478,865 - 1 Lading chains/straps fouling switches 10 0.4 1 7 - 2 3 6 1 2,181,121 - - Lading chains or straps fouling wheels 2 0.1 - 2 - - - 2 - 264,737 - - Passed couplers (automated classification yard) 34 1.3 - 26 - 8 - 34 - 1,055,174 - - Interference(not vandals)with RR op. 5 0.2 1 3 - 1 - 2 3 123,569 - - Vandalism of track or track appliances 13 0.5 - 11 - 2 5 8 - 1,475,146 - 2 Fail by non-rr empto control spd of car 16 0.6 - 8 - 8 2 2 12 1,105,055 - - Cause under investigation 5 0.2 - 4 - 1 2 3 - 1,089,549 - 145 Track damage caused by non-railroad interference with track structure 4 0.2 - 3 - 1 3 - 1 2,601,817 - 2 Investigation complete, cause could not be determined 18 0.7 - 11 - 7 8 8 2 4,757,997 - 1 Other miscellaneous causes 18 0.7 1 11 - 6 4 10 4 663,253 - - Total 523 19.9 10 223 182 108 299 176 48 60,571,003 27 351
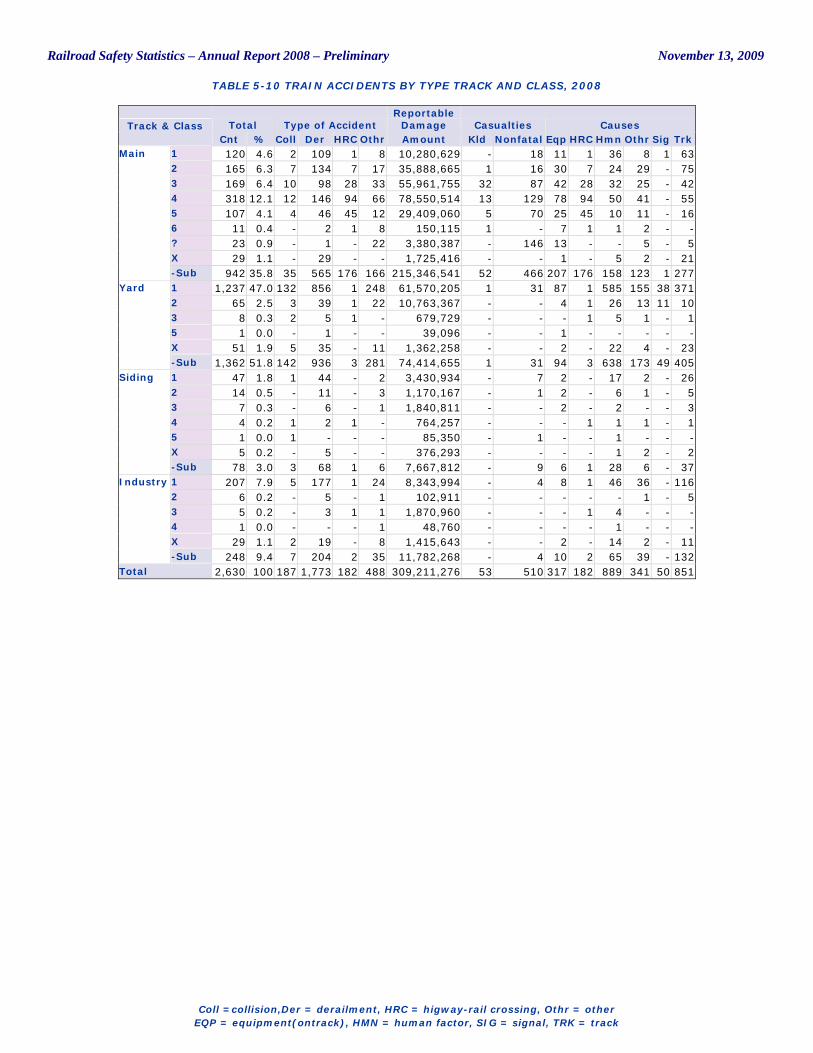
Railroad Safety Statistics – Annual Report 2008 – Preliminary November 13, 2009
TABLE 5-10 TRAIN ACCIDENTS BY TYPE TRACK AND CLASS, 2008
Coll =collision,Der = derailment, HRC = higway-rail crossing, Othr = other
EQP = equipment(ontrack), HMN = human factor, SIG = signal, TRK = track
Total Type of Accident Reportable
Damage Casualties Causes Track & Class Cnt % Coll Der HRC Othr Amount Kld Nonfatal Eqp HRC Hmn Othr Sig Trk
1 120 4.6 2 109 1 8 10,280,629 - 18 11 1 36 8 1 63 2 165 6.3 7 134 7 17 35,888,665 1 16 30 7 24 29 - 75 3 169 6.4 10 98 28 33 55,961,755 32 87 42 28 32 25 - 42 4 318 12.1 12 146 94 66 78,550,514 13 129 78 94 50 41 - 55 5 107 4.1 4 46 45 12 29,409,060 5 70 25 45 10 11 - 16 6 11 0.4 - 2 1 8 150,115 1 - 7 1 1 2 - - ? 23 0.9 - 1 - 22 3,380,387 - 146 13 - - 5 - 5 X 29 1.1 - 29 - - 1,725,416 - - 1 - 5 2 - 21
Main
-Sub 942 35.8 35 565 176 166 215,346,541 52 466 207 176 158 123 1 277 1 1,237 47.0 132 856 1 248 61,570,205 1 31 87 1 585 155 38 371 2 65 2.5 3 39 1 22 10,763,367 - - 4 1 26 13 11 10 3 8 0.3 2 5 1 - 679,729 - - - 1 5 1 - 1 5 1 0.0 - 1 - - 39,096 - - 1 - - - - - X 51 1.9 5 35 - 11 1,362,258 - - 2 - 22 4 - 23
Yard
-Sub 1,362 51.8 142 936 3 281 74,414,655 1 31 94 3 638 173 49 405 1 47 1.8 1 44 - 2 3,430,934 - 7 2 - 17 2 - 26 2 14 0.5 - 11 - 3 1,170,167 - 1 2 - 6 1 - 5 3 7 0.3 - 6 - 1 1,840,811 - - 2 - 2 - - 3 4 4 0.2 1 2 1 - 764,257 - - - 1 1 1 - 1 5 1 0.0 1 - - - 85,350 - 1 - - 1 - - - X 5 0.2 - 5 - - 376,293 - - - - 1 2 - 2
Siding
-Sub 78 3.0 3 68 1 6 7,667,812 - 9 6 1 28 6 - 37 1 207 7.9 5 177 1 24 8,343,994 - 4 8 1 46 36 - 116 2 6 0.2 - 5 - 1 102,911 - - - - - 1 - 5 3 5 0.2 - 3 1 1 1,870,960 - - - 1 4 - - - 4 1 0.0 - - - 1 48,760 - - - - 1 - - - X 29 1.1 2 19 - 8 1,415,643 - - 2 - 14 2 - 11
Industry
-Sub 248 9.4 7 204 2 35 11,782,268 - 4 10 2 65 39 - 132 Total 2,630 100 187 1,773 182 488 309,211,276 53 510 317 182 889 341 50 851
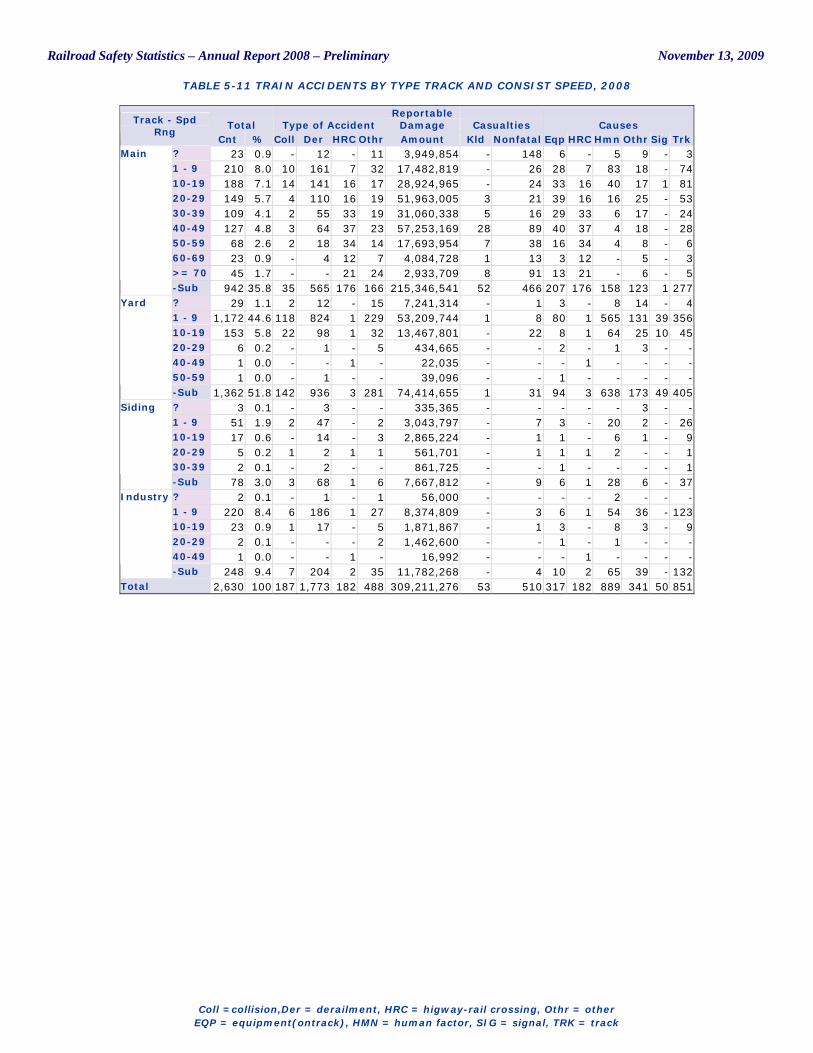
Railroad Safety Statistics – Annual Report 2008 – Preliminary November 13, 2009
TABLE 5-11 TRAIN ACCIDENTS BY TYPE TRACK AND CONSIST SPEED, 2008
Coll =collision,Der = derailment, HRC = higway-rail crossing, Othr = other
EQP = equipment(ontrack), HMN = human factor, SIG = signal, TRK = track
Total Type of Accident Reportable
Damage Casualties Causes Track - Spd Rng
Cnt % Coll Der HRC Othr Amount Kld Nonfatal Eqp HRC Hmn Othr Sig Trk ? 23 0.9 - 12 - 11 3,949,854 - 148 6 - 5 9 - 3 1 - 9 210 8.0 10 161 7 32 17,482,819 - 26 28 7 83 18 - 74 10-19 188 7.1 14 141 16 17 28,924,965 - 24 33 16 40 17 1 81 20-29 149 5.7 4 110 16 19 51,963,005 3 21 39 16 16 25 - 53 30-39 109 4.1 2 55 33 19 31,060,338 5 16 29 33 6 17 - 24 40-49 127 4.8 3 64 37 23 57,253,169 28 89 40 37 4 18 - 28 50-59 68 2.6 2 18 34 14 17,693,954 7 38 16 34 4 8 - 6 60-69 23 0.9 - 4 12 7 4,084,728 1 13 3 12 - 5 - 3 >= 70 45 1.7 - - 21 24 2,933,709 8 91 13 21 - 6 - 5
Main
-Sub 942 35.8 35 565 176 166 215,346,541 52 466 207 176 158 123 1 277 ? 29 1.1 2 12 - 15 7,241,314 - 1 3 - 8 14 - 4 1 - 9 1,172 44.6 118 824 1 229 53,209,744 1 8 80 1 565 131 39 356 10-19 153 5.8 22 98 1 32 13,467,801 - 22 8 1 64 25 10 45 20-29 6 0.2 - 1 - 5 434,665 - - 2 - 1 3 - - 40-49 1 0.0 - - 1 - 22,035 - - - 1 - - - - 50-59 1 0.0 - 1 - - 39,096 - - 1 - - - - -
Yard
-Sub 1,362 51.8 142 936 3 281 74,414,655 1 31 94 3 638 173 49 405 ? 3 0.1 - 3 - - 335,365 - - - - - 3 - - 1 - 9 51 1.9 2 47 - 2 3,043,797 - 7 3 - 20 2 - 26 10-19 17 0.6 - 14 - 3 2,865,224 - 1 1 - 6 1 - 9 20-29 5 0.2 1 2 1 1 561,701 - 1 1 1 2 - - 1 30-39 2 0.1 - 2 - - 861,725 - - 1 - - - - 1
Siding
-Sub 78 3.0 3 68 1 6 7,667,812 - 9 6 1 28 6 - 37 ? 2 0.1 - 1 - 1 56,000 - - - - 2 - - - 1 - 9 220 8.4 6 186 1 27 8,374,809 - 3 6 1 54 36 - 123 10-19 23 0.9 1 17 - 5 1,871,867 - 1 3 - 8 3 - 9 20-29 2 0.1 - - - 2 1,462,600 - - 1 - 1 - - - 40-49 1 0.0 - - 1 - 16,992 - - - 1 - - - -
Industry
-Sub 248 9.4 7 204 2 35 11,782,268 - 4 10 2 65 39 - 132 Total 2,630 100 187 1,773 182 488 309,211,276 53 510 317 182 889 341 50 851
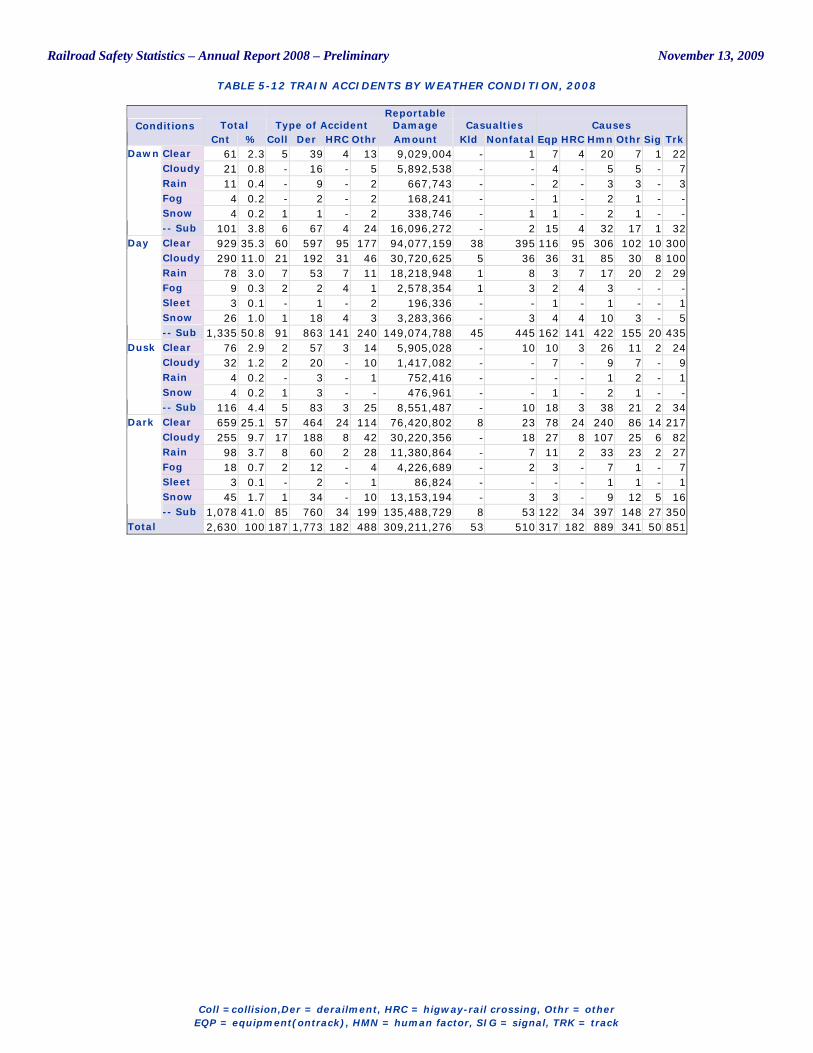
Railroad Safety Statistics – Annual Report 2008 – Preliminary November 13, 2009
TABLE 5-12 TRAIN ACCIDENTS BY WEATHER CONDITION, 2008
Coll =collision,Der = derailment, HRC = higway-rail crossing, Othr = other
EQP = equipment(ontrack), HMN = human factor, SIG = signal, TRK = track
Total Type of Accident Reportable
Damage Casualties Causes Conditions Cnt % Coll Der HRC Othr Amount Kld Nonfatal Eqp HRC Hmn Othr Sig Trk
Clear 61 2.3 5 39 4 13 9,029,004 - 1 7 4 20 7 1 22 Cloudy 21 0.8 - 16 - 5 5,892,538 - - 4 - 5 5 - 7 Rain 11 0.4 - 9 - 2 667,743 - - 2 - 3 3 - 3 Fog 4 0.2 - 2 - 2 168,241 - - 1 - 2 1 - - Snow 4 0.2 1 1 - 2 338,746 - 1 1 - 2 1 - -
Dawn
-- Sub 101 3.8 6 67 4 24 16,096,272 - 2 15 4 32 17 1 32 Clear 929 35.3 60 597 95 177 94,077,159 38 395 116 95 306 102 10 300 Cloudy 290 11.0 21 192 31 46 30,720,625 5 36 36 31 85 30 8 100 Rain 78 3.0 7 53 7 11 18,218,948 1 8 3 7 17 20 2 29 Fog 9 0.3 2 2 4 1 2,578,354 1 3 2 4 3 - - - Sleet 3 0.1 - 1 - 2 196,336 - - 1 - 1 - - 1 Snow 26 1.0 1 18 4 3 3,283,366 - 3 4 4 10 3 - 5
Day
-- Sub 1,335 50.8 91 863 141 240 149,074,788 45 445 162 141 422 155 20 435 Clear 76 2.9 2 57 3 14 5,905,028 - 10 10 3 26 11 2 24 Cloudy 32 1.2 2 20 - 10 1,417,082 - - 7 - 9 7 - 9 Rain 4 0.2 - 3 - 1 752,416 - - - - 1 2 - 1 Snow 4 0.2 1 3 - - 476,961 - - 1 - 2 1 - -
Dusk
-- Sub 116 4.4 5 83 3 25 8,551,487 - 10 18 3 38 21 2 34 Clear 659 25.1 57 464 24 114 76,420,802 8 23 78 24 240 86 14 217 Cloudy 255 9.7 17 188 8 42 30,220,356 - 18 27 8 107 25 6 82 Rain 98 3.7 8 60 2 28 11,380,864 - 7 11 2 33 23 2 27 Fog 18 0.7 2 12 - 4 4,226,689 - 2 3 - 7 1 - 7 Sleet 3 0.1 - 2 - 1 86,824 - - - - 1 1 - 1 Snow 45 1.7 1 34 - 10 13,153,194 - 3 3 - 9 12 5 16
Dark
-- Sub 1,078 41.0 85 760 34 199 135,488,729 8 53 122 34 397 148 27 350 Total 2,630 100 187 1,773 182 488 309,211,276 53 510 317 182 889 341 50 851
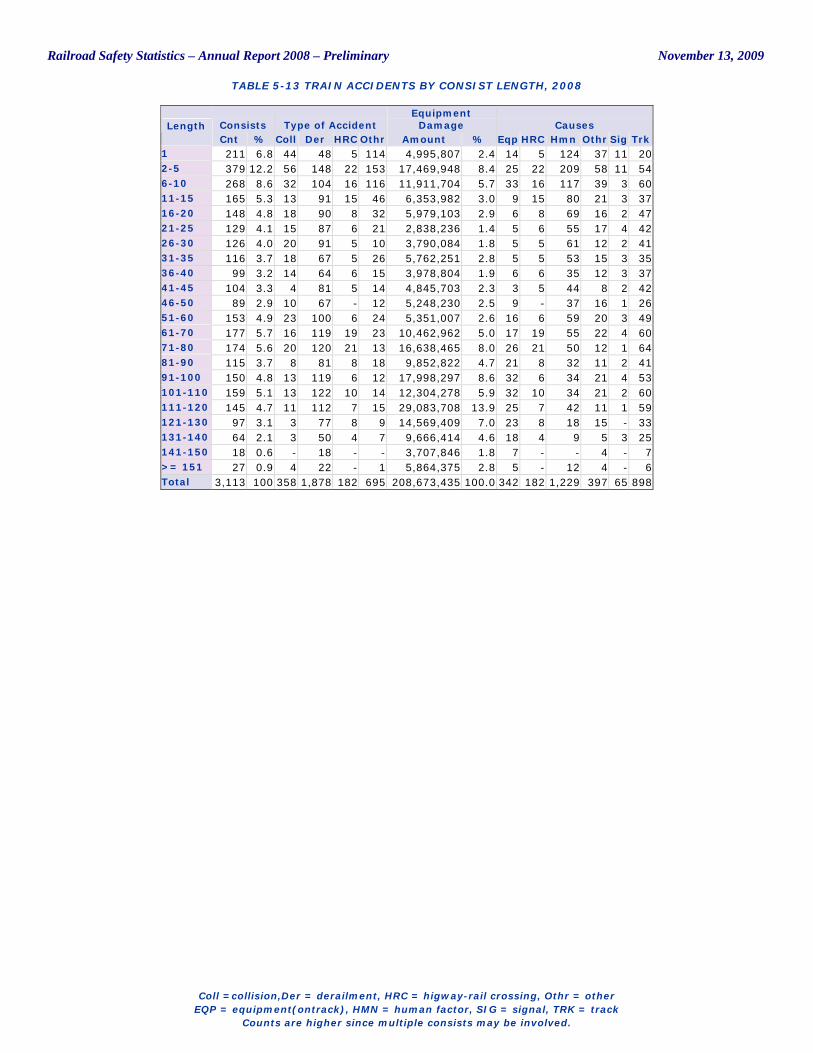
Railroad Safety Statistics – Annual Report 2008 – Preliminary November 13, 2009
TABLE 5-13 TRAIN ACCIDENTS BY CONSIST LENGTH, 2008
Coll =collision,Der = derailment, HRC = higway-rail crossing, Othr = other
EQP = equipment(ontrack), HMN = human factor, SIG = signal, TRK = track Counts are higher since multiple consists may be involved.
Consists Type of Accident Equipment
Damage Causes Length Cnt % Coll Der HRC Othr Amount % Eqp HRC Hmn Othr Sig Trk
1 211 6.8 44 48 5 114 4,995,807 2.4 14 5 124 37 11 20 2-5 379 12.2 56 148 22 153 17,469,948 8.4 25 22 209 58 11 54 6-10 268 8.6 32 104 16 116 11,911,704 5.7 33 16 117 39 3 60 11-15 165 5.3 13 91 15 46 6,353,982 3.0 9 15 80 21 3 37 16-20 148 4.8 18 90 8 32 5,979,103 2.9 6 8 69 16 2 47 21-25 129 4.1 15 87 6 21 2,838,236 1.4 5 6 55 17 4 42 26-30 126 4.0 20 91 5 10 3,790,084 1.8 5 5 61 12 2 41 31-35 116 3.7 18 67 5 26 5,762,251 2.8 5 5 53 15 3 35 36-40 99 3.2 14 64 6 15 3,978,804 1.9 6 6 35 12 3 37 41-45 104 3.3 4 81 5 14 4,845,703 2.3 3 5 44 8 2 42 46-50 89 2.9 10 67 - 12 5,248,230 2.5 9 - 37 16 1 26 51-60 153 4.9 23 100 6 24 5,351,007 2.6 16 6 59 20 3 49 61-70 177 5.7 16 119 19 23 10,462,962 5.0 17 19 55 22 4 60 71-80 174 5.6 20 120 21 13 16,638,465 8.0 26 21 50 12 1 64 81-90 115 3.7 8 81 8 18 9,852,822 4.7 21 8 32 11 2 41 91-100 150 4.8 13 119 6 12 17,998,297 8.6 32 6 34 21 4 53 101-110 159 5.1 13 122 10 14 12,304,278 5.9 32 10 34 21 2 60 111-120 145 4.7 11 112 7 15 29,083,708 13.9 25 7 42 11 1 59 121-130 97 3.1 3 77 8 9 14,569,409 7.0 23 8 18 15 - 33 131-140 64 2.1 3 50 4 7 9,666,414 4.6 18 4 9 5 3 25 141-150 18 0.6 - 18 - - 3,707,846 1.8 7 - - 4 - 7 >= 151 27 0.9 4 22 - 1 5,864,375 2.8 5 - 12 4 - 6 Total 3,113 100 358 1,878 182 695 208,673,435 100.0 342 182 1,229 397 65 898
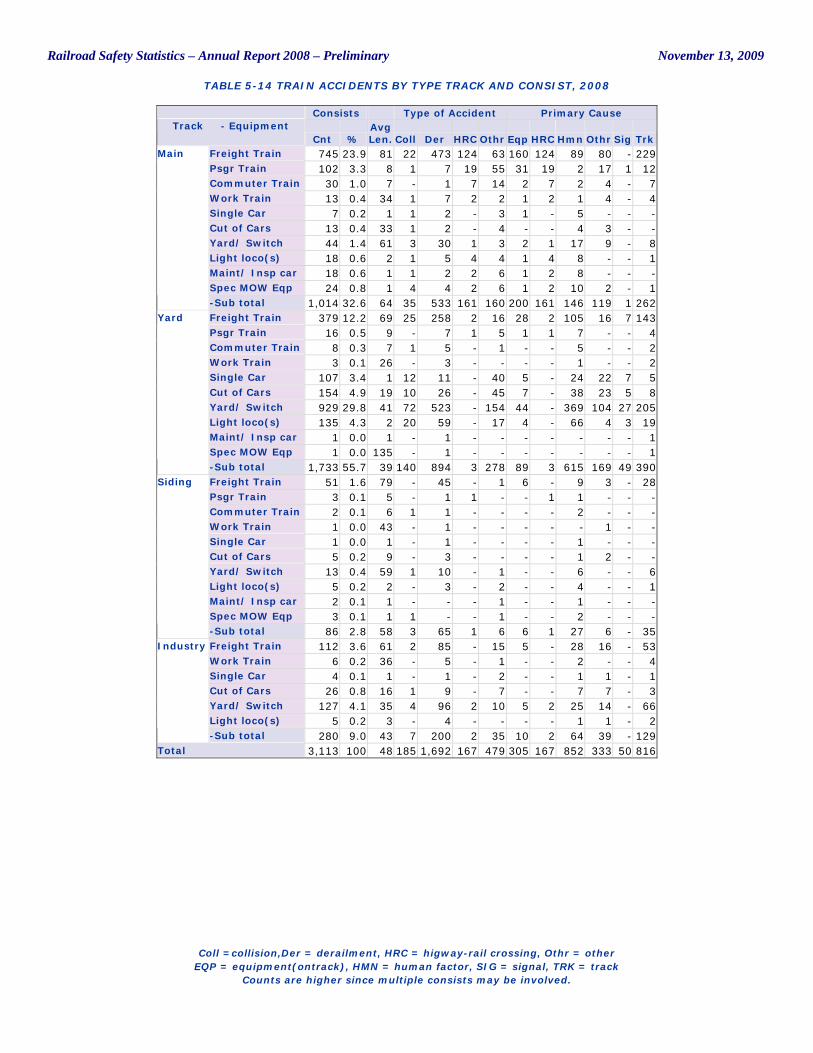
Railroad Safety Statistics – Annual Report 2008 – Preliminary November 13, 2009
TABLE 5-14 TRAIN ACCIDENTS BY TYPE TRACK AND CONSIST, 2008
Coll =collision,Der = derailment, HRC = higway-rail crossing, Othr = other
EQP = equipment(ontrack), HMN = human factor, SIG = signal, TRK = track Counts are higher since multiple consists may be involved.
Consists Type of Accident Primary Cause Track - Equipment
Cnt % Avg Len. Coll Der HRC Othr Eqp HRC Hmn Othr Sig Trk
Freight Train 745 23.9 81 22 473 124 63 160 124 89 80 - 229 Psgr Train 102 3.3 8 1 7 19 55 31 19 2 17 1 12 Commuter Train 30 1.0 7 - 1 7 14 2 7 2 4 - 7 Work Train 13 0.4 34 1 7 2 2 1 2 1 4 - 4 Single Car 7 0.2 1 1 2 - 3 1 - 5 - - - Cut of Cars 13 0.4 33 1 2 - 4 - - 4 3 - - Yard/ Switch 44 1.4 61 3 30 1 3 2 1 17 9 - 8 Light loco(s) 18 0.6 2 1 5 4 4 1 4 8 - - 1 Maint/ Insp car 18 0.6 1 1 2 2 6 1 2 8 - - - Spec MOW Eqp 24 0.8 1 4 4 2 6 1 2 10 2 - 1
Main
-Sub total 1,014 32.6 64 35 533 161 160 200 161 146 119 1 262 Freight Train 379 12.2 69 25 258 2 16 28 2 105 16 7 143 Psgr Train 16 0.5 9 - 7 1 5 1 1 7 - - 4 Commuter Train 8 0.3 7 1 5 - 1 - - 5 - - 2 Work Train 3 0.1 26 - 3 - - - - 1 - - 2 Single Car 107 3.4 1 12 11 - 40 5 - 24 22 7 5 Cut of Cars 154 4.9 19 10 26 - 45 7 - 38 23 5 8 Yard/ Switch 929 29.8 41 72 523 - 154 44 - 369 104 27 205 Light loco(s) 135 4.3 2 20 59 - 17 4 - 66 4 3 19 Maint/ Insp car 1 0.0 1 - 1 - - - - - - - 1 Spec MOW Eqp 1 0.0 135 - 1 - - - - - - - 1
Yard
-Sub total 1,733 55.7 39 140 894 3 278 89 3 615 169 49 390 Freight Train 51 1.6 79 - 45 - 1 6 - 9 3 - 28 Psgr Train 3 0.1 5 - 1 1 - - 1 1 - - - Commuter Train 2 0.1 6 1 1 - - - - 2 - - - Work Train 1 0.0 43 - 1 - - - - - 1 - - Single Car 1 0.0 1 - 1 - - - - 1 - - - Cut of Cars 5 0.2 9 - 3 - - - - 1 2 - - Yard/ Switch 13 0.4 59 1 10 - 1 - - 6 - - 6 Light loco(s) 5 0.2 2 - 3 - 2 - - 4 - - 1 Maint/ Insp car 2 0.1 1 - - - 1 - - 1 - - - Spec MOW Eqp 3 0.1 1 1 - - 1 - - 2 - - -
Siding
-Sub total 86 2.8 58 3 65 1 6 6 1 27 6 - 35 Freight Train 112 3.6 61 2 85 - 15 5 - 28 16 - 53 Work Train 6 0.2 36 - 5 - 1 - - 2 - - 4 Single Car 4 0.1 1 - 1 - 2 - - 1 1 - 1 Cut of Cars 26 0.8 16 1 9 - 7 - - 7 7 - 3 Yard/ Switch 127 4.1 35 4 96 2 10 5 2 25 14 - 66 Light loco(s) 5 0.2 3 - 4 - - - - 1 1 - 2
Industry
-Sub total 280 9.0 43 7 200 2 35 10 2 64 39 - 129 Total 3,113 100 48 185 1,692 167 479 305 167 852 333 50 816
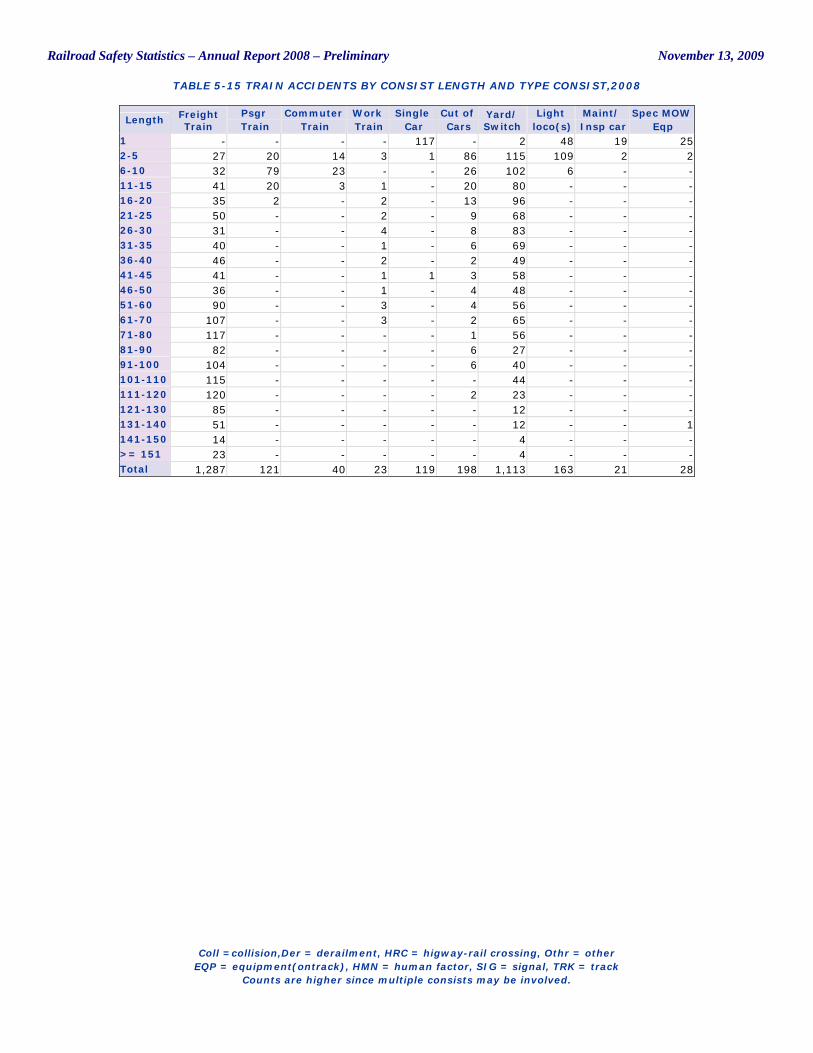
Railroad Safety Statistics – Annual Report 2008 – Preliminary November 13, 2009
TABLE 5-15 TRAIN ACCIDENTS BY CONSIST LENGTH AND TYPE CONSIST,2008
Coll =collision,Der = derailment, HRC = higway-rail crossing, Othr = other
EQP = equipment(ontrack), HMN = human factor, SIG = signal, TRK = track Counts are higher since multiple consists may be involved.
Length Freight Train
Psgr Train
Commuter Train
Work Train
Single Car
Cut of Cars
Yard/ Switch
Light loco(s)
Maint/ Insp car
Spec MOW Eqp
1 - - - - 117 - 2 48 19 25 2-5 27 20 14 3 1 86 115 109 2 2 6-10 32 79 23 - - 26 102 6 - - 11-15 41 20 3 1 - 20 80 - - - 16-20 35 2 - 2 - 13 96 - - - 21-25 50 - - 2 - 9 68 - - - 26-30 31 - - 4 - 8 83 - - - 31-35 40 - - 1 - 6 69 - - - 36-40 46 - - 2 - 2 49 - - - 41-45 41 - - 1 1 3 58 - - - 46-50 36 - - 1 - 4 48 - - - 51-60 90 - - 3 - 4 56 - - - 61-70 107 - - 3 - 2 65 - - - 71-80 117 - - - - 1 56 - - - 81-90 82 - - - - 6 27 - - - 91-100 104 - - - - 6 40 - - - 101-110 115 - - - - - 44 - - - 111-120 120 - - - - 2 23 - - - 121-130 85 - - - - - 12 - - - 131-140 51 - - - - - 12 - - 1 141-150 14 - - - - - 4 - - - >= 151 23 - - - - - 4 - - - Total 1,287 121 40 23 119 198 1,113 163 21 28
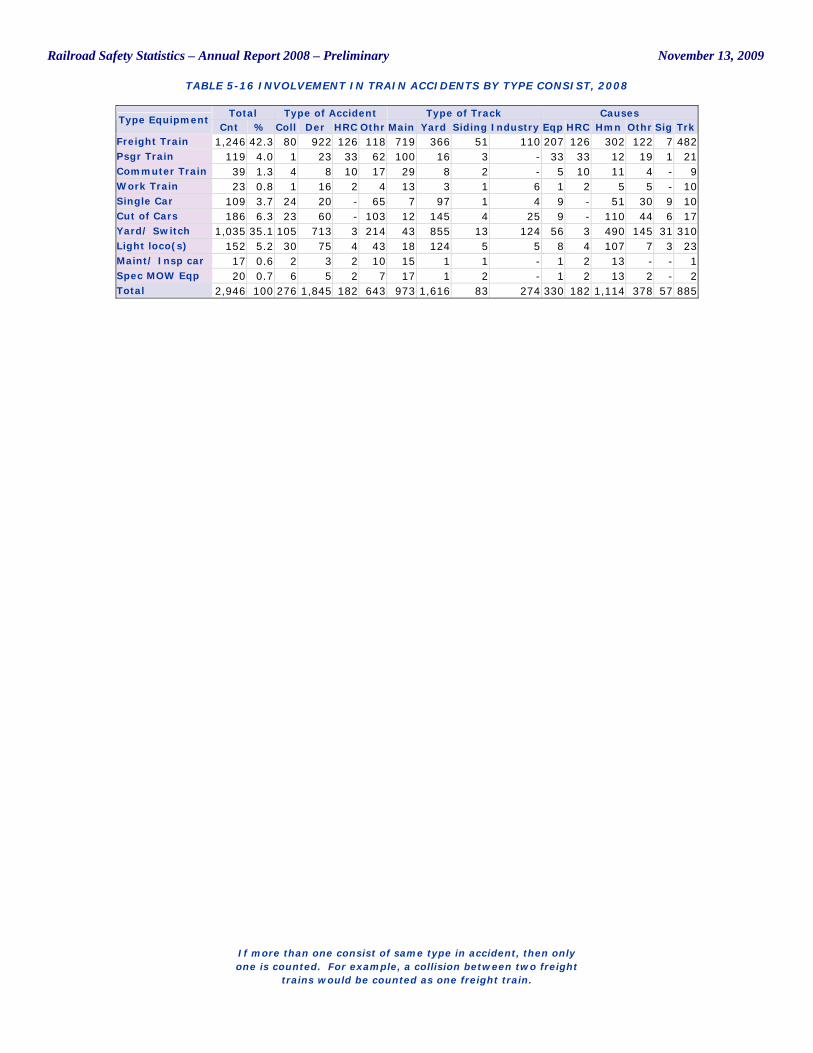
Railroad Safety Statistics – Annual Report 2008 – Preliminary November 13, 2009
TABLE 5-16 INVOLVEMENT IN TRAIN ACCIDENTS BY TYPE CONSIST, 2008
If more than one consist of same type in accident, then only one is counted. For example, a collision between two freight
trains would be counted as one freight train.
Total Type of Accident Type of Track Causes Type Equipment
Cnt % Coll Der HRC Othr Main Yard Siding Industry Eqp HRC Hmn Othr Sig Trk Freight Train 1,246 42.3 80 922 126 118 719 366 51 110 207 126 302 122 7 482 Psgr Train 119 4.0 1 23 33 62 100 16 3 - 33 33 12 19 1 21 Commuter Train 39 1.3 4 8 10 17 29 8 2 - 5 10 11 4 - 9 Work Train 23 0.8 1 16 2 4 13 3 1 6 1 2 5 5 - 10 Single Car 109 3.7 24 20 - 65 7 97 1 4 9 - 51 30 9 10 Cut of Cars 186 6.3 23 60 - 103 12 145 4 25 9 - 110 44 6 17 Yard/ Switch 1,035 35.1 105 713 3 214 43 855 13 124 56 3 490 145 31 310 Light loco(s) 152 5.2 30 75 4 43 18 124 5 5 8 4 107 7 3 23 Maint/ Insp car 17 0.6 2 3 2 10 15 1 1 - 1 2 13 - - 1 Spec MOW Eqp 20 0.7 6 5 2 7 17 1 2 - 1 2 13 2 - 2 Total 2,946 100 276 1,845 182 643 973 1,616 83 274 330 182 1,114 378 57 885
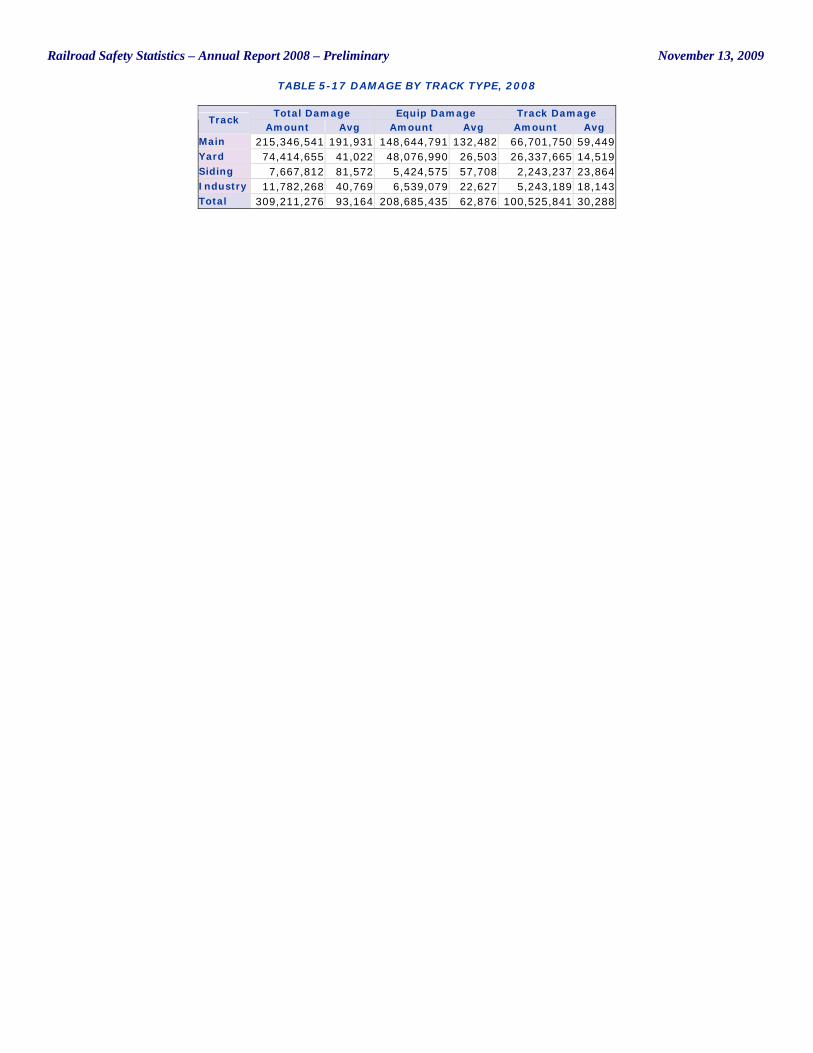
Railroad Safety Statistics – Annual Report 2008 – Preliminary November 13, 2009
TABLE 5-17 DAMAGE BY TRACK TYPE, 2008
Total Damage Equip Damage Track Damage Track
Amount Avg Amount Avg Amount Avg Main 215,346,541 191,931 148,644,791 132,482 66,701,750 59,449 Yard 74,414,655 41,022 48,076,990 26,503 26,337,665 14,519 Siding 7,667,812 81,572 5,424,575 57,708 2,243,237 23,864 Industry 11,782,268 40,769 6,539,079 22,627 5,243,189 18,143 Total 309,211,276 93,164 208,685,435 62,876 100,525,841 30,288
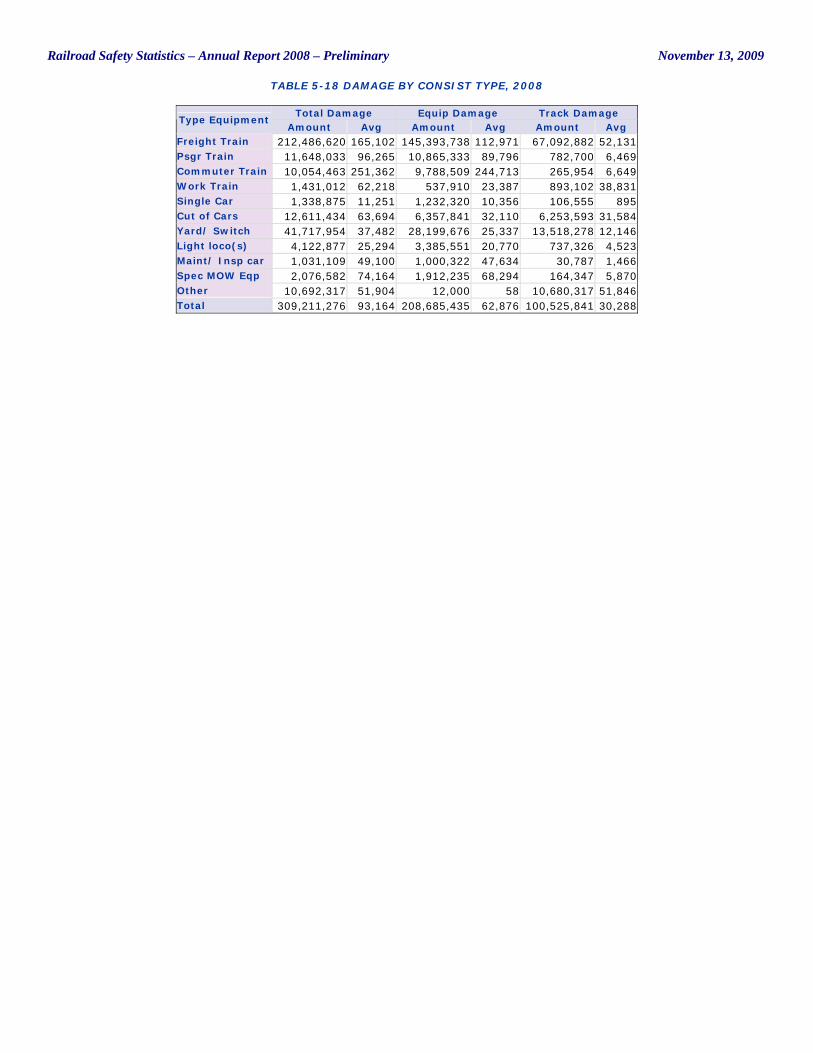
Railroad Safety Statistics – Annual Report 2008 – Preliminary November 13, 2009
TABLE 5-18 DAMAGE BY CONSIST TYPE, 2008
Total Damage Equip Damage Track Damage Type Equipment
Amount Avg Amount Avg Amount Avg Freight Train 212,486,620 165,102 145,393,738 112,971 67,092,882 52,131 Psgr Train 11,648,033 96,265 10,865,333 89,796 782,700 6,469 Commuter Train 10,054,463 251,362 9,788,509 244,713 265,954 6,649 Work Train 1,431,012 62,218 537,910 23,387 893,102 38,831 Single Car 1,338,875 11,251 1,232,320 10,356 106,555 895 Cut of Cars 12,611,434 63,694 6,357,841 32,110 6,253,593 31,584 Yard/ Switch 41,717,954 37,482 28,199,676 25,337 13,518,278 12,146 Light loco(s) 4,122,877 25,294 3,385,551 20,770 737,326 4,523 Maint/ Insp car 1,031,109 49,100 1,000,322 47,634 30,787 1,466 Spec MOW Eqp 2,076,582 74,164 1,912,235 68,294 164,347 5,870 Other 10,692,317 51,904 12,000 58 10,680,317 51,846 Total 309,211,276 93,164 208,685,435 62,876 100,525,841 30,288
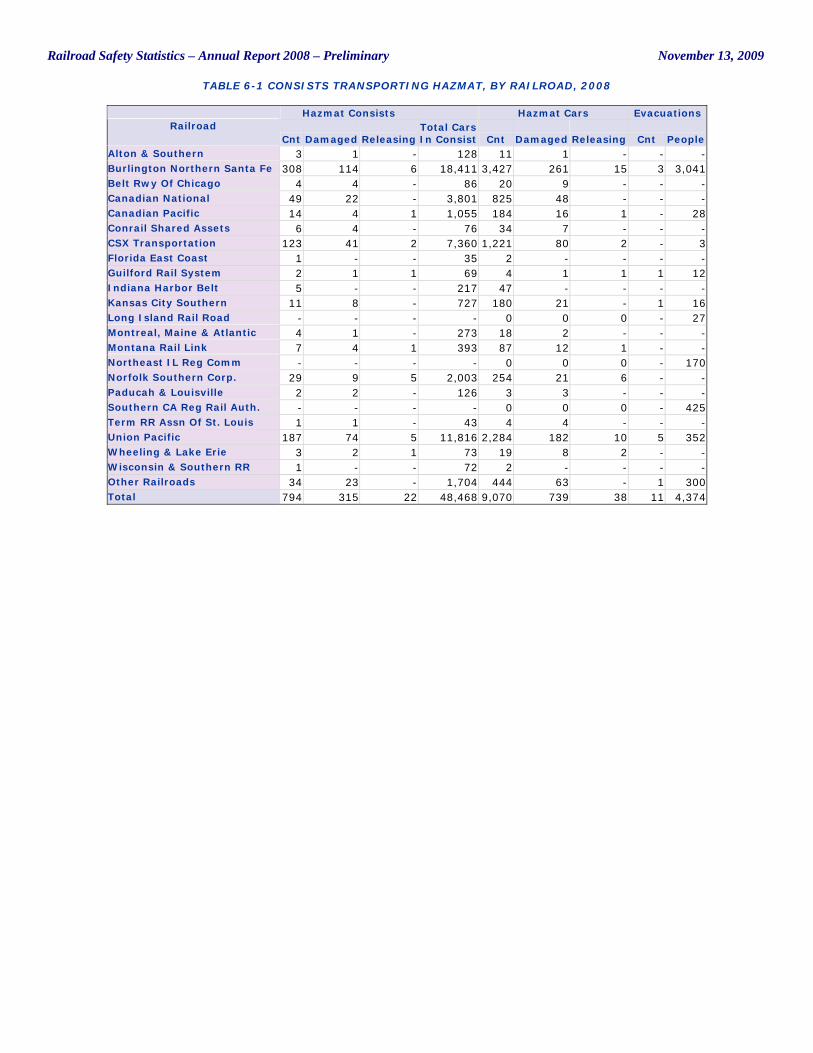
Railroad Safety Statistics – Annual Report 2008 – Preliminary November 13, 2009
TABLE 6-1 CONSISTS TRANSPORTING HAZMAT, BY RAILROAD, 2008
Hazmat Consists Hazmat Cars Evacuations Railroad
Cnt Damaged Releasing Total Cars In Consist Cnt Damaged Releasing Cnt People
Alton & Southern 3 1 - 128 11 1 - - - Burlington Northern Santa Fe 308 114 6 18,411 3,427 261 15 3 3,041 Belt Rwy Of Chicago 4 4 - 86 20 9 - - - Canadian National 49 22 - 3,801 825 48 - - - Canadian Pacific 14 4 1 1,055 184 16 1 - 28 Conrail Shared Assets 6 4 - 76 34 7 - - - CSX Transportation 123 41 2 7,360 1,221 80 2 - 3 Florida East Coast 1 - - 35 2 - - - - Guilford Rail System 2 1 1 69 4 1 1 1 12 Indiana Harbor Belt 5 - - 217 47 - - - - Kansas City Southern 11 8 - 727 180 21 - 1 16 Long Island Rail Road - - - - 0 0 0 - 27 Montreal, Maine & Atlantic 4 1 - 273 18 2 - - - Montana Rail Link 7 4 1 393 87 12 1 - - Northeast IL Reg Comm - - - - 0 0 0 - 170 Norfolk Southern Corp. 29 9 5 2,003 254 21 6 - - Paducah & Louisville 2 2 - 126 3 3 - - - Southern CA Reg Rail Auth. - - - - 0 0 0 - 425 Term RR Assn Of St. Louis 1 1 - 43 4 4 - - - Union Pacific 187 74 5 11,816 2,284 182 10 5 352 Wheeling & Lake Erie 3 2 1 73 19 8 2 - - Wisconsin & Southern RR 1 - - 72 2 - - - - Other Railroads 34 23 - 1,704 444 63 - 1 300 Total 794 315 22 48,468 9,070 739 38 11 4,374
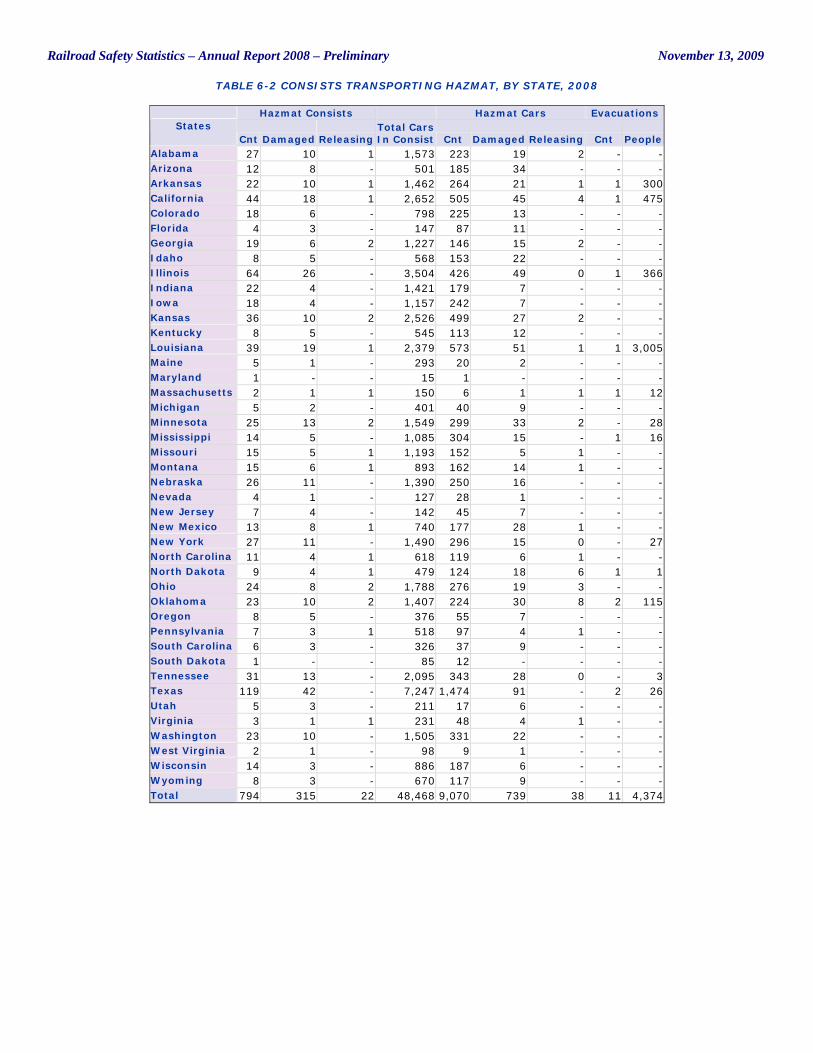
Railroad Safety Statistics – Annual Report 2008 – Preliminary November 13, 2009
TABLE 6-2 CONSISTS TRANSPORTING HAZMAT, BY STATE, 2008
Hazmat Consists Hazmat Cars Evacuations States
Cnt Damaged Releasing Total Cars In Consist Cnt Damaged Releasing Cnt People
Alabama 27 10 1 1,573 223 19 2 - - Arizona 12 8 - 501 185 34 - - - Arkansas 22 10 1 1,462 264 21 1 1 300 California 44 18 1 2,652 505 45 4 1 475 Colorado 18 6 - 798 225 13 - - - Florida 4 3 - 147 87 11 - - - Georgia 19 6 2 1,227 146 15 2 - - Idaho 8 5 - 568 153 22 - - - Illinois 64 26 - 3,504 426 49 0 1 366 Indiana 22 4 - 1,421 179 7 - - - Iowa 18 4 - 1,157 242 7 - - - Kansas 36 10 2 2,526 499 27 2 - - Kentucky 8 5 - 545 113 12 - - - Louisiana 39 19 1 2,379 573 51 1 1 3,005 Maine 5 1 - 293 20 2 - - - Maryland 1 - - 15 1 - - - - Massachusetts 2 1 1 150 6 1 1 1 12 Michigan 5 2 - 401 40 9 - - - Minnesota 25 13 2 1,549 299 33 2 - 28 Mississippi 14 5 - 1,085 304 15 - 1 16 Missouri 15 5 1 1,193 152 5 1 - - Montana 15 6 1 893 162 14 1 - - Nebraska 26 11 - 1,390 250 16 - - - Nevada 4 1 - 127 28 1 - - - New Jersey 7 4 - 142 45 7 - - - New Mexico 13 8 1 740 177 28 1 - - New York 27 11 - 1,490 296 15 0 - 27 North Carolina 11 4 1 618 119 6 1 - - North Dakota 9 4 1 479 124 18 6 1 1 Ohio 24 8 2 1,788 276 19 3 - - Oklahoma 23 10 2 1,407 224 30 8 2 115 Oregon 8 5 - 376 55 7 - - - Pennsylvania 7 3 1 518 97 4 1 - - South Carolina 6 3 - 326 37 9 - - - South Dakota 1 - - 85 12 - - - - Tennessee 31 13 - 2,095 343 28 0 - 3 Texas 119 42 - 7,247 1,474 91 - 2 26 Utah 5 3 - 211 17 6 - - - Virginia 3 1 1 231 48 4 1 - - Washington 23 10 - 1,505 331 22 - - - West Virginia 2 1 - 98 9 1 - - - Wisconsin 14 3 - 886 187 6 - - - Wyoming 8 3 - 670 117 9 - - - Total 794 315 22 48,468 9,070 739 38 11 4,374
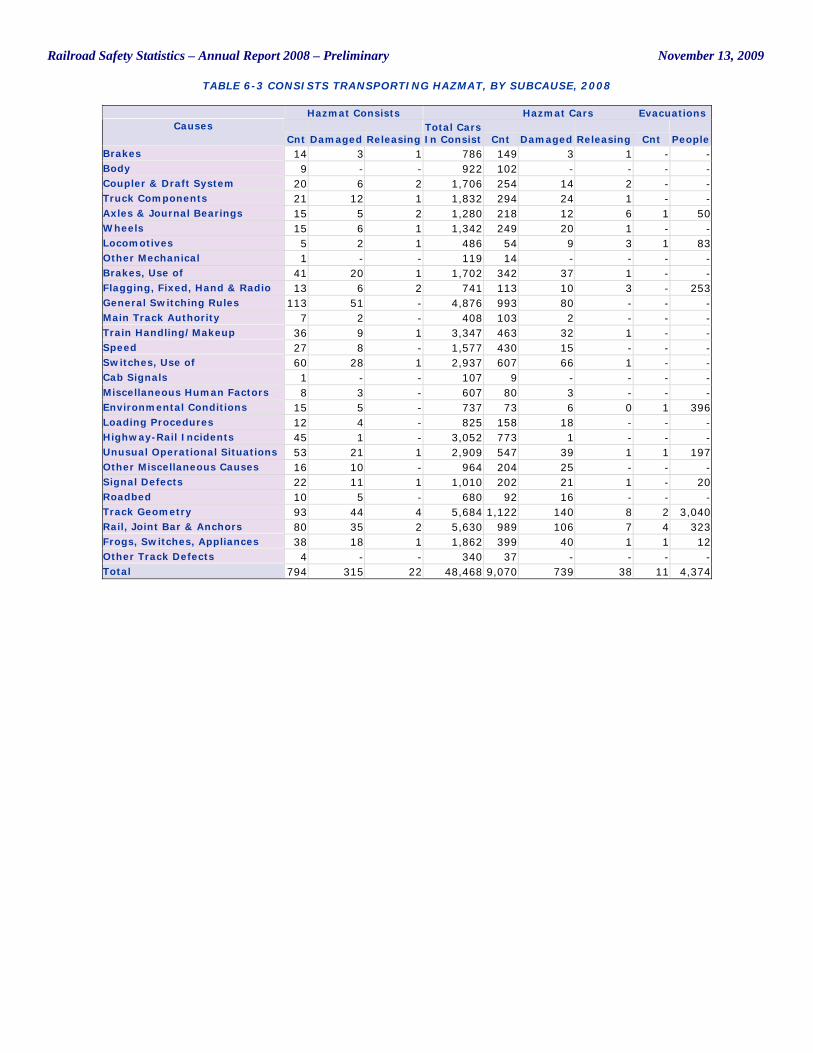
Railroad Safety Statistics – Annual Report 2008 – Preliminary November 13, 2009
TABLE 6-3 CONSISTS TRANSPORTING HAZMAT, BY SUBCAUSE, 2008
Hazmat Consists Hazmat Cars Evacuations Causes
Cnt Damaged Releasing Total Cars In Consist Cnt Damaged Releasing Cnt People
Brakes 14 3 1 786 149 3 1 - - Body 9 - - 922 102 - - - - Coupler & Draft System 20 6 2 1,706 254 14 2 - - Truck Components 21 12 1 1,832 294 24 1 - - Axles & Journal Bearings 15 5 2 1,280 218 12 6 1 50 Wheels 15 6 1 1,342 249 20 1 - - Locomotives 5 2 1 486 54 9 3 1 83 Other Mechanical 1 - - 119 14 - - - - Brakes, Use of 41 20 1 1,702 342 37 1 - - Flagging, Fixed, Hand & Radio 13 6 2 741 113 10 3 - 253 General Switching Rules 113 51 - 4,876 993 80 - - - Main Track Authority 7 2 - 408 103 2 - - - Train Handling/Makeup 36 9 1 3,347 463 32 1 - - Speed 27 8 - 1,577 430 15 - - - Switches, Use of 60 28 1 2,937 607 66 1 - - Cab Signals 1 - - 107 9 - - - - Miscellaneous Human Factors 8 3 - 607 80 3 - - - Environmental Conditions 15 5 - 737 73 6 0 1 396 Loading Procedures 12 4 - 825 158 18 - - - Highway-Rail Incidents 45 1 - 3,052 773 1 - - - Unusual Operational Situations 53 21 1 2,909 547 39 1 1 197 Other Miscellaneous Causes 16 10 - 964 204 25 - - - Signal Defects 22 11 1 1,010 202 21 1 - 20 Roadbed 10 5 - 680 92 16 - - - Track Geometry 93 44 4 5,684 1,122 140 8 2 3,040 Rail, Joint Bar & Anchors 80 35 2 5,630 989 106 7 4 323 Frogs, Switches, Appliances 38 18 1 1,862 399 40 1 1 12 Other Track Defects 4 - - 340 37 - - - - Total 794 315 22 48,468 9,070 739 38 11 4,374
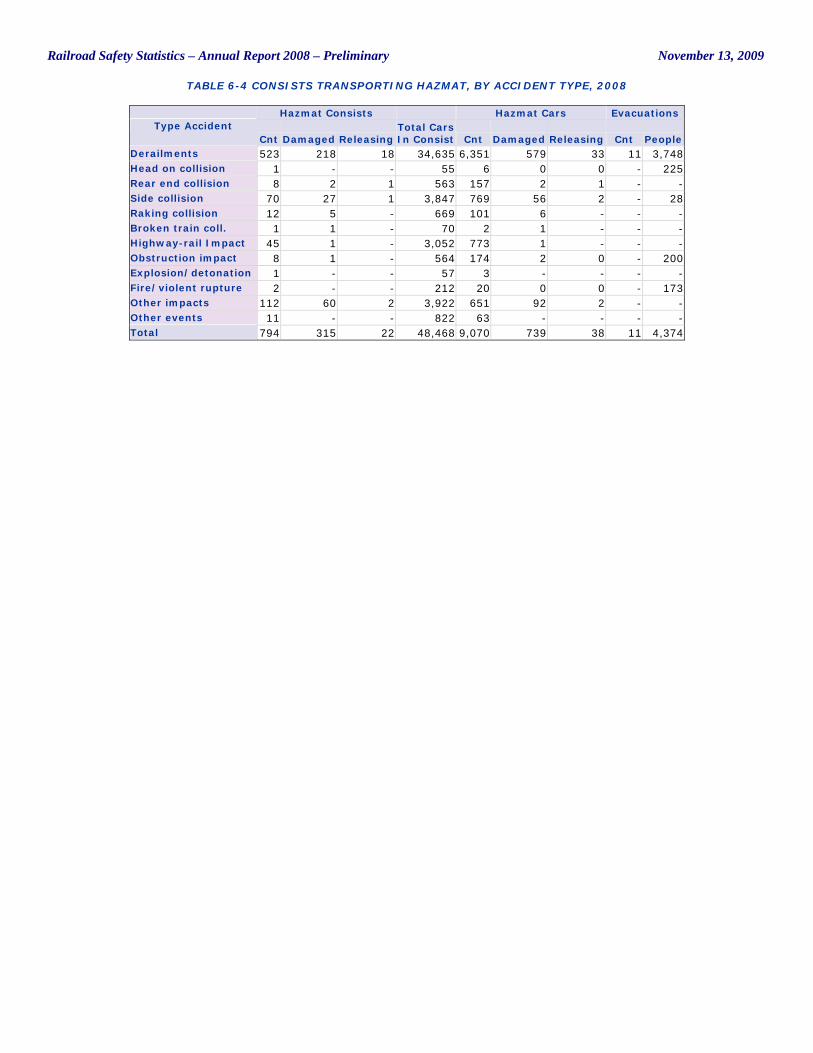
Railroad Safety Statistics – Annual Report 2008 – Preliminary November 13, 2009
TABLE 6-4 CONSISTS TRANSPORTING HAZMAT, BY ACCIDENT TYPE, 2008
Hazmat Consists Hazmat Cars Evacuations Type Accident
Cnt Damaged Releasing Total Cars In Consist Cnt Damaged Releasing Cnt People
Derailments 523 218 18 34,635 6,351 579 33 11 3,748 Head on collision 1 - - 55 6 0 0 - 225 Rear end collision 8 2 1 563 157 2 1 - - Side collision 70 27 1 3,847 769 56 2 - 28 Raking collision 12 5 - 669 101 6 - - - Broken train coll. 1 1 - 70 2 1 - - - Highway-rail Impact 45 1 - 3,052 773 1 - - - Obstruction impact 8 1 - 564 174 2 0 - 200 Explosion/detonation 1 - - 57 3 - - - - Fire/violent rupture 2 - - 212 20 0 0 - 173 Other impacts 112 60 2 3,922 651 92 2 - - Other events 11 - - 822 63 - - - - Total 794 315 22 48,468 9,070 739 38 11 4,374
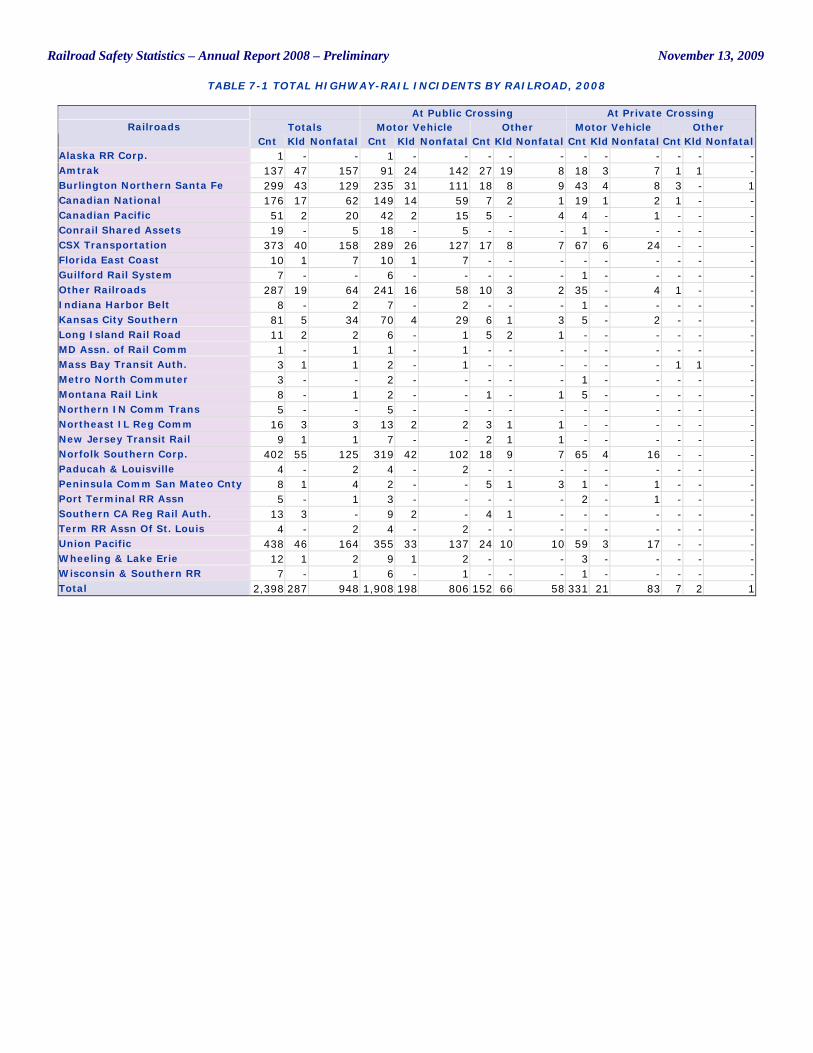
Railroad Safety Statistics – Annual Report 2008 – Preliminary November 13, 2009
TABLE 7-1 TOTAL HIGHWAY-RAIL INCIDENTS BY RAILROAD, 2008
At Public Crossing At Private Crossing Totals Motor Vehicle Other Motor Vehicle Other Railroads
Cnt Kld Nonfatal Cnt Kld Nonfatal Cnt Kld Nonfatal Cnt Kld Nonfatal Cnt Kld Nonfatal Alaska RR Corp. 1 - - 1 - - - - - - - - - - - Amtrak 137 47 157 91 24 142 27 19 8 18 3 7 1 1 - Burlington Northern Santa Fe 299 43 129 235 31 111 18 8 9 43 4 8 3 - 1 Canadian National 176 17 62 149 14 59 7 2 1 19 1 2 1 - - Canadian Pacific 51 2 20 42 2 15 5 - 4 4 - 1 - - - Conrail Shared Assets 19 - 5 18 - 5 - - - 1 - - - - - CSX Transportation 373 40 158 289 26 127 17 8 7 67 6 24 - - - Florida East Coast 10 1 7 10 1 7 - - - - - - - - - Guilford Rail System 7 - - 6 - - - - - 1 - - - - - Other Railroads 287 19 64 241 16 58 10 3 2 35 - 4 1 - - Indiana Harbor Belt 8 - 2 7 - 2 - - - 1 - - - - - Kansas City Southern 81 5 34 70 4 29 6 1 3 5 - 2 - - - Long Island Rail Road 11 2 2 6 - 1 5 2 1 - - - - - - MD Assn. of Rail Comm 1 - 1 1 - 1 - - - - - - - - - Mass Bay Transit Auth. 3 1 1 2 - 1 - - - - - - 1 1 - Metro North Commuter 3 - - 2 - - - - - 1 - - - - - Montana Rail Link 8 - 1 2 - - 1 - 1 5 - - - - - Northern IN Comm Trans 5 - - 5 - - - - - - - - - - - Northeast IL Reg Comm 16 3 3 13 2 2 3 1 1 - - - - - - New Jersey Transit Rail 9 1 1 7 - - 2 1 1 - - - - - - Norfolk Southern Corp. 402 55 125 319 42 102 18 9 7 65 4 16 - - - Paducah & Louisville 4 - 2 4 - 2 - - - - - - - - - Peninsula Comm San Mateo Cnty 8 1 4 2 - - 5 1 3 1 - 1 - - - Port Terminal RR Assn 5 - 1 3 - - - - - 2 - 1 - - - Southern CA Reg Rail Auth. 13 3 - 9 2 - 4 1 - - - - - - - Term RR Assn Of St. Louis 4 - 2 4 - 2 - - - - - - - - - Union Pacific 438 46 164 355 33 137 24 10 10 59 3 17 - - - Wheeling & Lake Erie 12 1 2 9 1 2 - - - 3 - - - - - Wisconsin & Southern RR 7 - 1 6 - 1 - - - 1 - - - - - Total 2,398 287 948 1,908 198 806 152 66 58 331 21 83 7 2 1
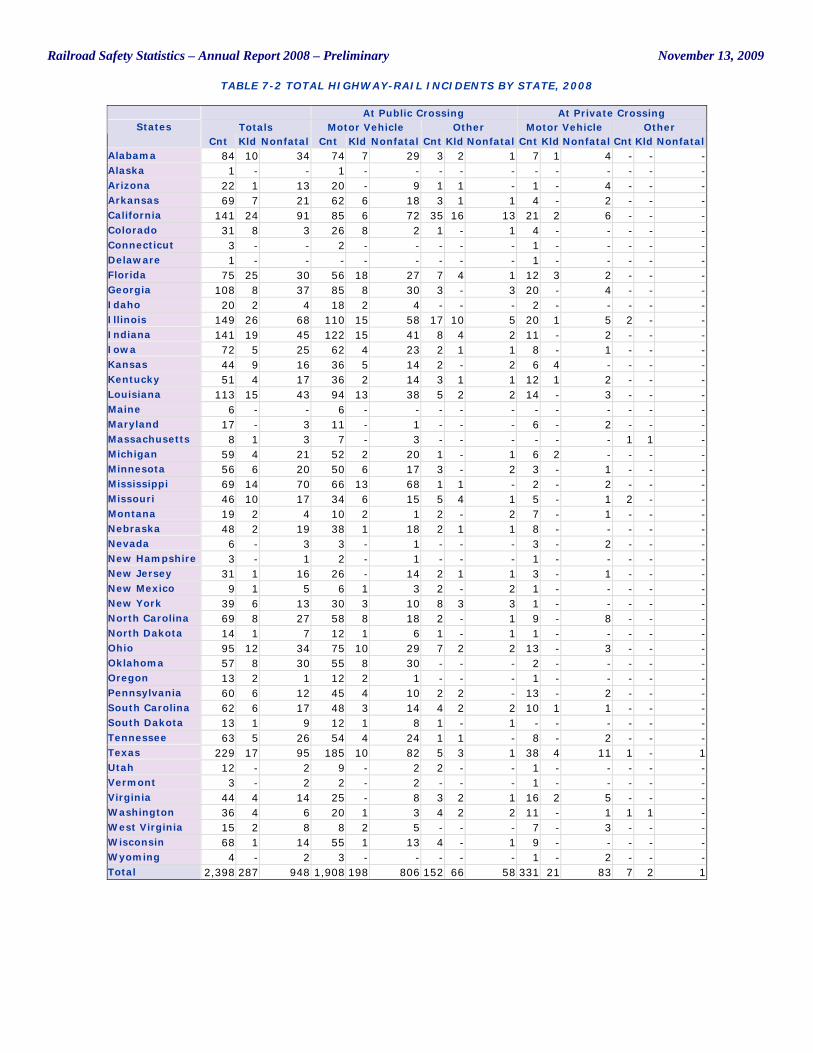
Railroad Safety Statistics – Annual Report 2008 – Preliminary November 13, 2009
TABLE 7-2 TOTAL HIGHWAY-RAIL INCIDENTS BY STATE, 2008
At Public Crossing At Private Crossing Totals Motor Vehicle Other Motor Vehicle Other States
Cnt Kld Nonfatal Cnt Kld Nonfatal Cnt Kld Nonfatal Cnt Kld Nonfatal Cnt Kld Nonfatal Alabama 84 10 34 74 7 29 3 2 1 7 1 4 - - - Alaska 1 - - 1 - - - - - - - - - - - Arizona 22 1 13 20 - 9 1 1 - 1 - 4 - - - Arkansas 69 7 21 62 6 18 3 1 1 4 - 2 - - - California 141 24 91 85 6 72 35 16 13 21 2 6 - - - Colorado 31 8 3 26 8 2 1 - 1 4 - - - - - Connecticut 3 - - 2 - - - - - 1 - - - - - Delaware 1 - - - - - - - - 1 - - - - - Florida 75 25 30 56 18 27 7 4 1 12 3 2 - - - Georgia 108 8 37 85 8 30 3 - 3 20 - 4 - - - Idaho 20 2 4 18 2 4 - - - 2 - - - - - Illinois 149 26 68 110 15 58 17 10 5 20 1 5 2 - - Indiana 141 19 45 122 15 41 8 4 2 11 - 2 - - - Iowa 72 5 25 62 4 23 2 1 1 8 - 1 - - - Kansas 44 9 16 36 5 14 2 - 2 6 4 - - - - Kentucky 51 4 17 36 2 14 3 1 1 12 1 2 - - - Louisiana 113 15 43 94 13 38 5 2 2 14 - 3 - - - Maine 6 - - 6 - - - - - - - - - - - Maryland 17 - 3 11 - 1 - - - 6 - 2 - - - Massachusetts 8 1 3 7 - 3 - - - - - - 1 1 - Michigan 59 4 21 52 2 20 1 - 1 6 2 - - - - Minnesota 56 6 20 50 6 17 3 - 2 3 - 1 - - - Mississippi 69 14 70 66 13 68 1 1 - 2 - 2 - - - Missouri 46 10 17 34 6 15 5 4 1 5 - 1 2 - - Montana 19 2 4 10 2 1 2 - 2 7 - 1 - - - Nebraska 48 2 19 38 1 18 2 1 1 8 - - - - - Nevada 6 - 3 3 - 1 - - - 3 - 2 - - - New Hampshire 3 - 1 2 - 1 - - - 1 - - - - - New Jersey 31 1 16 26 - 14 2 1 1 3 - 1 - - - New Mexico 9 1 5 6 1 3 2 - 2 1 - - - - - New York 39 6 13 30 3 10 8 3 3 1 - - - - - North Carolina 69 8 27 58 8 18 2 - 1 9 - 8 - - - North Dakota 14 1 7 12 1 6 1 - 1 1 - - - - - Ohio 95 12 34 75 10 29 7 2 2 13 - 3 - - - Oklahoma 57 8 30 55 8 30 - - - 2 - - - - - Oregon 13 2 1 12 2 1 - - - 1 - - - - - Pennsylvania 60 6 12 45 4 10 2 2 - 13 - 2 - - - South Carolina 62 6 17 48 3 14 4 2 2 10 1 1 - - - South Dakota 13 1 9 12 1 8 1 - 1 - - - - - - Tennessee 63 5 26 54 4 24 1 1 - 8 - 2 - - - Texas 229 17 95 185 10 82 5 3 1 38 4 11 1 - 1 Utah 12 - 2 9 - 2 2 - - 1 - - - - - Vermont 3 - 2 2 - 2 - - - 1 - - - - - Virginia 44 4 14 25 - 8 3 2 1 16 2 5 - - - Washington 36 4 6 20 1 3 4 2 2 11 - 1 1 1 - West Virginia 15 2 8 8 2 5 - - - 7 - 3 - - - Wisconsin 68 1 14 55 1 13 4 - 1 9 - - - - - Wyoming 4 - 2 3 - - - - - 1 - 2 - - - Total 2,398 287 948 1,908 198 806 152 66 58 331 21 83 7 2 1
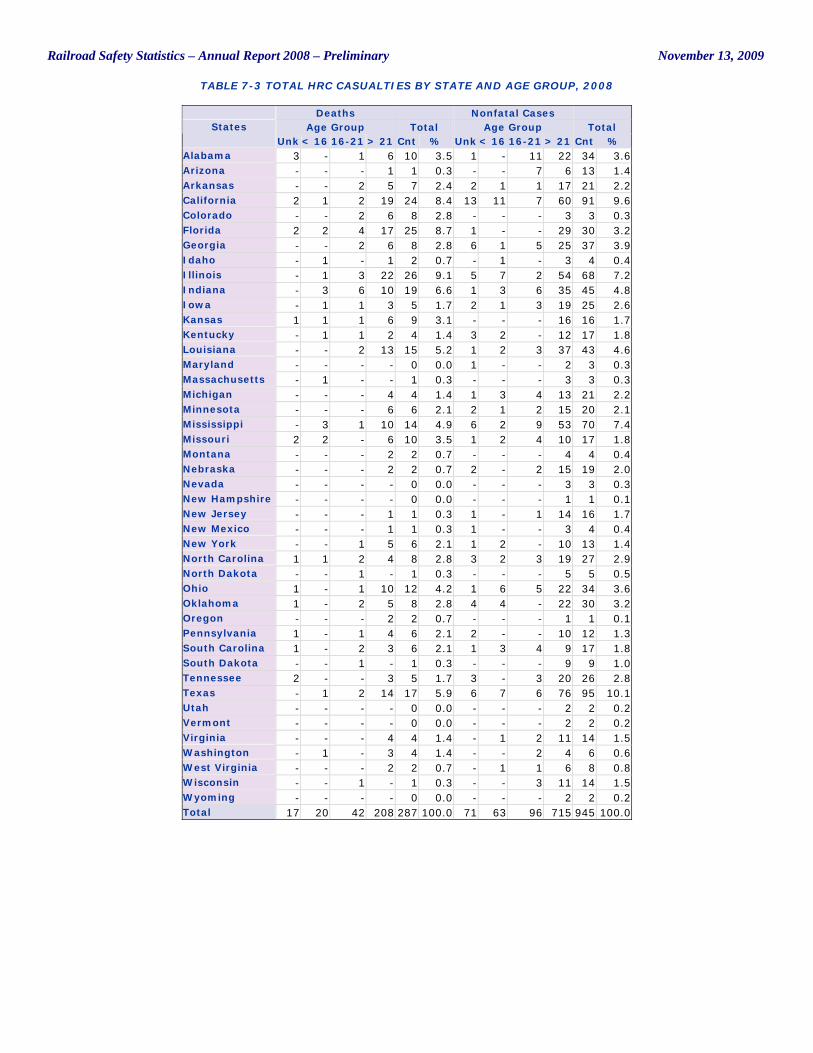
Railroad Safety Statistics – Annual Report 2008 – Preliminary November 13, 2009
TABLE 7-3 TOTAL HRC CASUALTIES BY STATE AND AGE GROUP, 2008
Deaths Nonfatal Cases Age Group Total Age Group Total States
Unk < 16 16-21 > 21 Cnt % Unk < 16 16-21 > 21 Cnt % Alabama 3 - 1 6 10 3.5 1 - 11 22 34 3.6 Arizona - - - 1 1 0.3 - - 7 6 13 1.4 Arkansas - - 2 5 7 2.4 2 1 1 17 21 2.2 California 2 1 2 19 24 8.4 13 11 7 60 91 9.6 Colorado - - 2 6 8 2.8 - - - 3 3 0.3 Florida 2 2 4 17 25 8.7 1 - - 29 30 3.2 Georgia - - 2 6 8 2.8 6 1 5 25 37 3.9 Idaho - 1 - 1 2 0.7 - 1 - 3 4 0.4 Illinois - 1 3 22 26 9.1 5 7 2 54 68 7.2 Indiana - 3 6 10 19 6.6 1 3 6 35 45 4.8 Iowa - 1 1 3 5 1.7 2 1 3 19 25 2.6 Kansas 1 1 1 6 9 3.1 - - - 16 16 1.7 Kentucky - 1 1 2 4 1.4 3 2 - 12 17 1.8 Louisiana - - 2 13 15 5.2 1 2 3 37 43 4.6 Maryland - - - - 0 0.0 1 - - 2 3 0.3 Massachusetts - 1 - - 1 0.3 - - - 3 3 0.3 Michigan - - - 4 4 1.4 1 3 4 13 21 2.2 Minnesota - - - 6 6 2.1 2 1 2 15 20 2.1 Mississippi - 3 1 10 14 4.9 6 2 9 53 70 7.4 Missouri 2 2 - 6 10 3.5 1 2 4 10 17 1.8 Montana - - - 2 2 0.7 - - - 4 4 0.4 Nebraska - - - 2 2 0.7 2 - 2 15 19 2.0 Nevada - - - - 0 0.0 - - - 3 3 0.3 New Hampshire - - - - 0 0.0 - - - 1 1 0.1 New Jersey - - - 1 1 0.3 1 - 1 14 16 1.7 New Mexico - - - 1 1 0.3 1 - - 3 4 0.4 New York - - 1 5 6 2.1 1 2 - 10 13 1.4 North Carolina 1 1 2 4 8 2.8 3 2 3 19 27 2.9 North Dakota - - 1 - 1 0.3 - - - 5 5 0.5 Ohio 1 - 1 10 12 4.2 1 6 5 22 34 3.6 Oklahoma 1 - 2 5 8 2.8 4 4 - 22 30 3.2 Oregon - - - 2 2 0.7 - - - 1 1 0.1 Pennsylvania 1 - 1 4 6 2.1 2 - - 10 12 1.3 South Carolina 1 - 2 3 6 2.1 1 3 4 9 17 1.8 South Dakota - - 1 - 1 0.3 - - - 9 9 1.0 Tennessee 2 - - 3 5 1.7 3 - 3 20 26 2.8 Texas - 1 2 14 17 5.9 6 7 6 76 95 10.1 Utah - - - - 0 0.0 - - - 2 2 0.2 Vermont - - - - 0 0.0 - - - 2 2 0.2 Virginia - - - 4 4 1.4 - 1 2 11 14 1.5 Washington - 1 - 3 4 1.4 - - 2 4 6 0.6 West Virginia - - - 2 2 0.7 - 1 1 6 8 0.8 Wisconsin - - 1 - 1 0.3 - - 3 11 14 1.5 Wyoming - - - - 0 0.0 - - - 2 2 0.2 Total 17 20 42 208 287 100.0 71 63 96 715 945 100.0
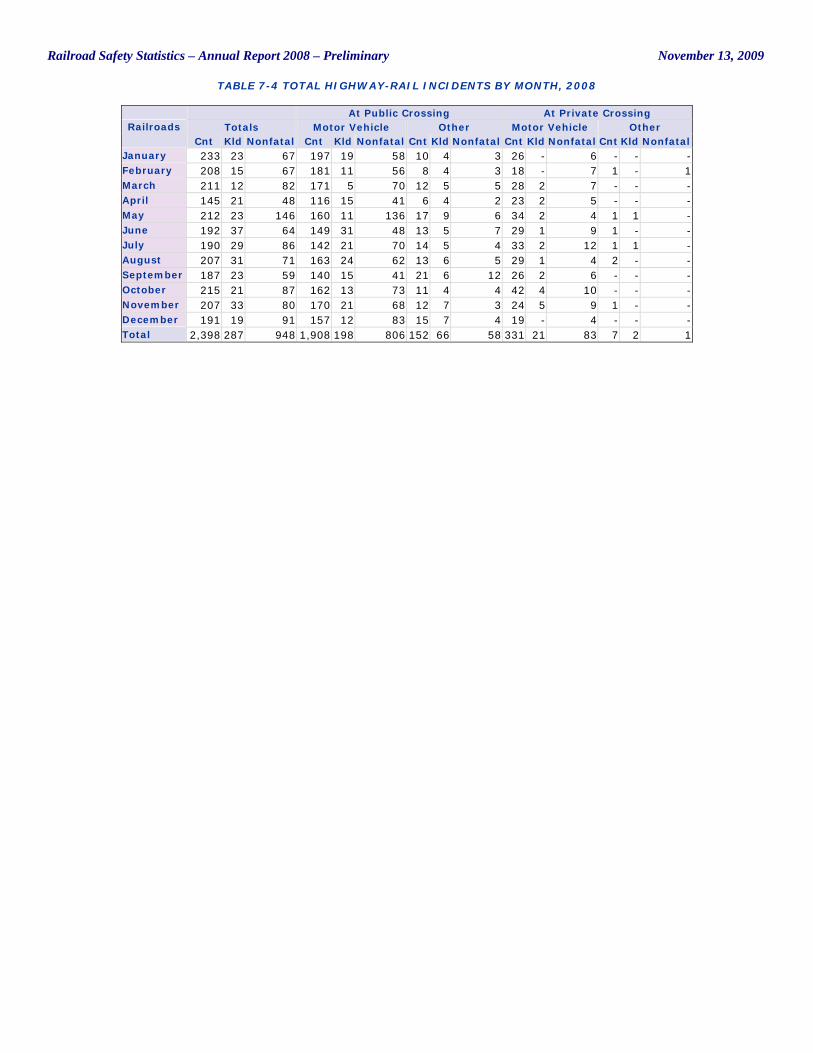
Railroad Safety Statistics – Annual Report 2008 – Preliminary November 13, 2009
TABLE 7-4 TOTAL HIGHWAY-RAIL INCIDENTS BY MONTH, 2008
At Public Crossing At Private Crossing Totals Motor Vehicle Other Motor Vehicle Other Railroads
Cnt Kld Nonfatal Cnt Kld Nonfatal Cnt Kld Nonfatal Cnt Kld Nonfatal Cnt Kld Nonfatal January 233 23 67 197 19 58 10 4 3 26 - 6 - - - February 208 15 67 181 11 56 8 4 3 18 - 7 1 - 1 March 211 12 82 171 5 70 12 5 5 28 2 7 - - - April 145 21 48 116 15 41 6 4 2 23 2 5 - - - May 212 23 146 160 11 136 17 9 6 34 2 4 1 1 - June 192 37 64 149 31 48 13 5 7 29 1 9 1 - - July 190 29 86 142 21 70 14 5 4 33 2 12 1 1 - August 207 31 71 163 24 62 13 6 5 29 1 4 2 - - September 187 23 59 140 15 41 21 6 12 26 2 6 - - - October 215 21 87 162 13 73 11 4 4 42 4 10 - - - November 207 33 80 170 21 68 12 7 3 24 5 9 1 - - December 191 19 91 157 12 83 15 7 4 19 - 4 - - - Total 2,398 287 948 1,908 198 806 152 66 58 331 21 83 7 2 1
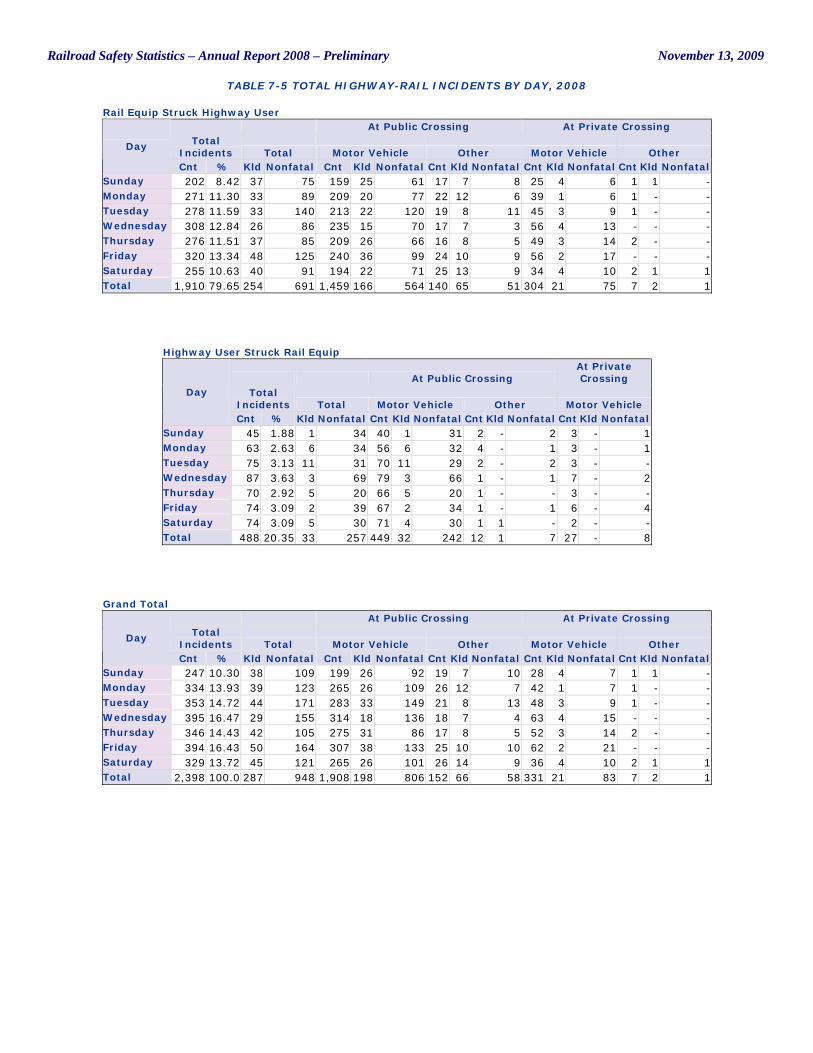
Railroad Safety Statistics – Annual Report 2008 – Preliminary November 13, 2009
TABLE 7-5 TOTAL HIGHWAY-RAIL INCIDENTS BY DAY, 2008
Rail Equip Struck Highway User At Public Crossing At Private Crossing
Total Incidents Total Motor Vehicle Other Motor Vehicle Other
Day
Cnt % Kld Nonfatal Cnt Kld Nonfatal Cnt Kld Nonfatal Cnt Kld Nonfatal Cnt Kld Nonfatal Sunday 202 8.42 37 75 159 25 61 17 7 8 25 4 6 1 1 - Monday 271 11.30 33 89 209 20 77 22 12 6 39 1 6 1 - - Tuesday 278 11.59 33 140 213 22 120 19 8 11 45 3 9 1 - - Wednesday 308 12.84 26 86 235 15 70 17 7 3 56 4 13 - - - Thursday 276 11.51 37 85 209 26 66 16 8 5 49 3 14 2 - - Friday 320 13.34 48 125 240 36 99 24 10 9 56 2 17 - - - Saturday 255 10.63 40 91 194 22 71 25 13 9 34 4 10 2 1 1 Total 1,910 79.65 254 691 1,459 166 564 140 65 51 304 21 75 7 2 1
Highway User Struck Rail Equip
At Public Crossing At Private Crossing
Total Incidents Total Motor Vehicle Other Motor Vehicle
Day
Cnt % Kld Nonfatal Cnt Kld Nonfatal Cnt Kld Nonfatal Cnt Kld Nonfatal Sunday 45 1.88 1 34 40 1 31 2 - 2 3 - 1 Monday 63 2.63 6 34 56 6 32 4 - 1 3 - 1 Tuesday 75 3.13 11 31 70 11 29 2 - 2 3 - - Wednesday 87 3.63 3 69 79 3 66 1 - 1 7 - 2 Thursday 70 2.92 5 20 66 5 20 1 - - 3 - - Friday 74 3.09 2 39 67 2 34 1 - 1 6 - 4 Saturday 74 3.09 5 30 71 4 30 1 1 - 2 - - Total 488 20.35 33 257 449 32 242 12 1 7 27 - 8
Grand Total At Public Crossing At Private Crossing
Total Incidents Total Motor Vehicle Other Motor Vehicle Other
Day
Cnt % Kld Nonfatal Cnt Kld Nonfatal Cnt Kld Nonfatal Cnt Kld Nonfatal Cnt Kld Nonfatal Sunday 247 10.30 38 109 199 26 92 19 7 10 28 4 7 1 1 - Monday 334 13.93 39 123 265 26 109 26 12 7 42 1 7 1 - - Tuesday 353 14.72 44 171 283 33 149 21 8 13 48 3 9 1 - - Wednesday 395 16.47 29 155 314 18 136 18 7 4 63 4 15 - - - Thursday 346 14.43 42 105 275 31 86 17 8 5 52 3 14 2 - - Friday 394 16.43 50 164 307 38 133 25 10 10 62 2 21 - - - Saturday 329 13.72 45 121 265 26 101 26 14 9 36 4 10 2 1 1 Total 2,398 100.0 287 948 1,908 198 806 152 66 58 331 21 83 7 2 1
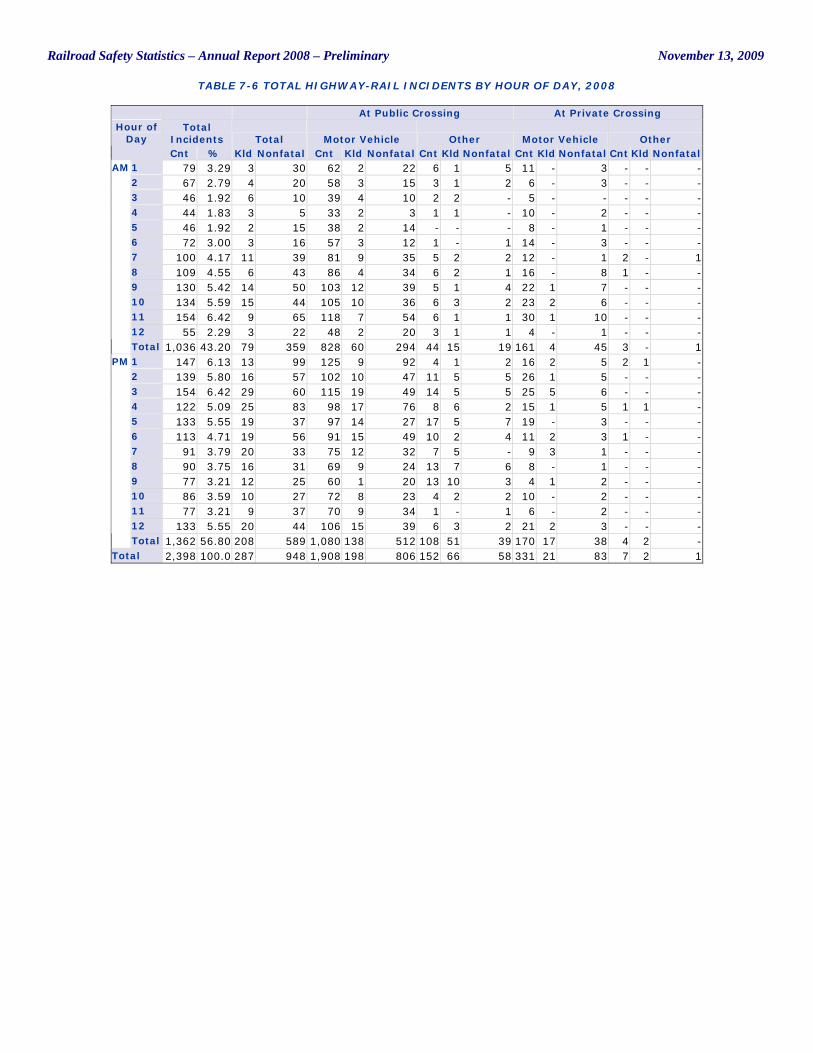
Railroad Safety Statistics – Annual Report 2008 – Preliminary November 13, 2009
TABLE 7-6 TOTAL HIGHWAY-RAIL INCIDENTS BY HOUR OF DAY, 2008
At Public Crossing At Private Crossing Total
Incidents Total Motor Vehicle Other Motor Vehicle Other Hour of
Day Cnt % Kld Nonfatal Cnt Kld Nonfatal Cnt Kld Nonfatal Cnt Kld Nonfatal Cnt Kld Nonfatal
1 79 3.29 3 30 62 2 22 6 1 5 11 - 3 - - - 2 67 2.79 4 20 58 3 15 3 1 2 6 - 3 - - - 3 46 1.92 6 10 39 4 10 2 2 - 5 - - - - - 4 44 1.83 3 5 33 2 3 1 1 - 10 - 2 - - - 5 46 1.92 2 15 38 2 14 - - - 8 - 1 - - - 6 72 3.00 3 16 57 3 12 1 - 1 14 - 3 - - - 7 100 4.17 11 39 81 9 35 5 2 2 12 - 1 2 - 1 8 109 4.55 6 43 86 4 34 6 2 1 16 - 8 1 - - 9 130 5.42 14 50 103 12 39 5 1 4 22 1 7 - - - 10 134 5.59 15 44 105 10 36 6 3 2 23 2 6 - - - 11 154 6.42 9 65 118 7 54 6 1 1 30 1 10 - - - 12 55 2.29 3 22 48 2 20 3 1 1 4 - 1 - - -
AM
Total 1,036 43.20 79 359 828 60 294 44 15 19 161 4 45 3 - 1 1 147 6.13 13 99 125 9 92 4 1 2 16 2 5 2 1 - 2 139 5.80 16 57 102 10 47 11 5 5 26 1 5 - - - 3 154 6.42 29 60 115 19 49 14 5 5 25 5 6 - - - 4 122 5.09 25 83 98 17 76 8 6 2 15 1 5 1 1 - 5 133 5.55 19 37 97 14 27 17 5 7 19 - 3 - - - 6 113 4.71 19 56 91 15 49 10 2 4 11 2 3 1 - - 7 91 3.79 20 33 75 12 32 7 5 - 9 3 1 - - - 8 90 3.75 16 31 69 9 24 13 7 6 8 - 1 - - - 9 77 3.21 12 25 60 1 20 13 10 3 4 1 2 - - - 10 86 3.59 10 27 72 8 23 4 2 2 10 - 2 - - - 11 77 3.21 9 37 70 9 34 1 - 1 6 - 2 - - - 12 133 5.55 20 44 106 15 39 6 3 2 21 2 3 - - -
PM
Total 1,362 56.80 208 589 1,080 138 512 108 51 39 170 17 38 4 2 - Total 2,398 100.0 287 948 1,908 198 806 152 66 58 331 21 83 7 2 1
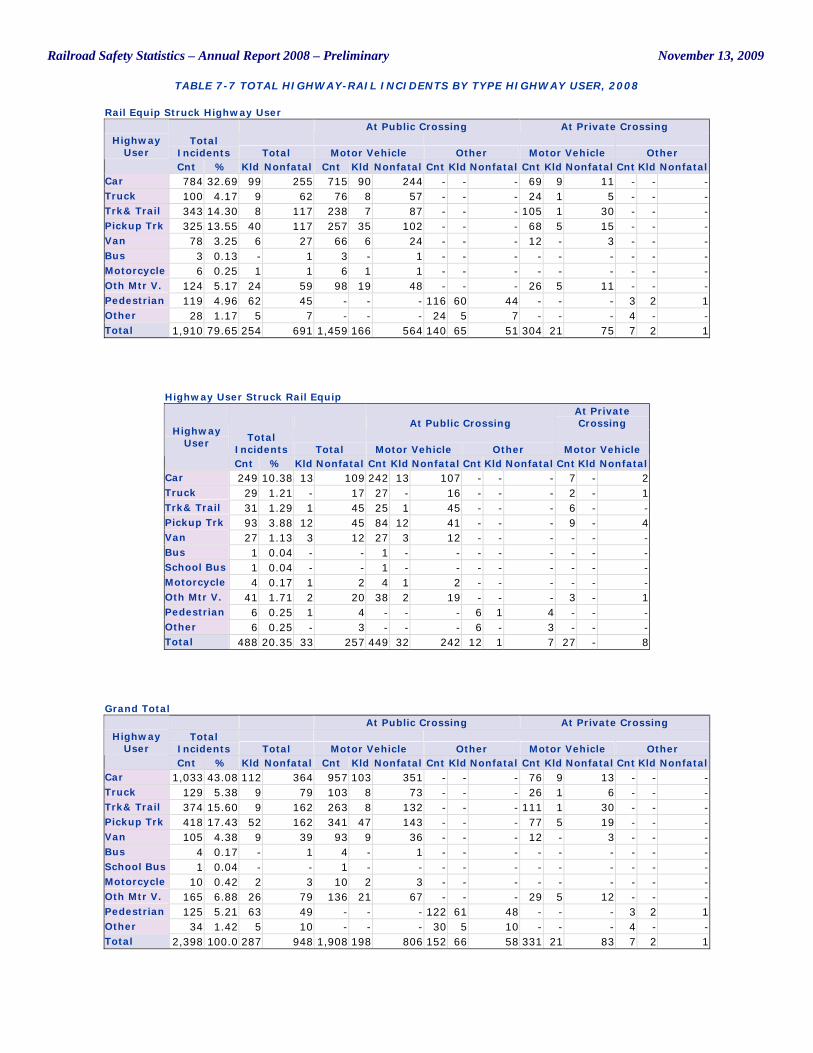
Railroad Safety Statistics – Annual Report 2008 – Preliminary November 13, 2009
TABLE 7-7 TOTAL HIGHWAY-RAIL INCIDENTS BY TYPE HIGHWAY USER, 2008
Rail Equip Struck Highway User At Public Crossing At Private Crossing
Total Incidents Total Motor Vehicle Other Motor Vehicle Other
Highway User
Cnt % Kld Nonfatal Cnt Kld Nonfatal Cnt Kld Nonfatal Cnt Kld Nonfatal Cnt Kld Nonfatal Car 784 32.69 99 255 715 90 244 - - - 69 9 11 - - - Truck 100 4.17 9 62 76 8 57 - - - 24 1 5 - - - Trk& Trail 343 14.30 8 117 238 7 87 - - - 105 1 30 - - - Pickup Trk 325 13.55 40 117 257 35 102 - - - 68 5 15 - - - Van 78 3.25 6 27 66 6 24 - - - 12 - 3 - - - Bus 3 0.13 - 1 3 - 1 - - - - - - - - - Motorcycle 6 0.25 1 1 6 1 1 - - - - - - - - - Oth Mtr V. 124 5.17 24 59 98 19 48 - - - 26 5 11 - - - Pedestrian 119 4.96 62 45 - - - 116 60 44 - - - 3 2 1 Other 28 1.17 5 7 - - - 24 5 7 - - - 4 - - Total 1,910 79.65 254 691 1,459 166 564 140 65 51 304 21 75 7 2 1
Highway User Struck Rail Equip
At Public Crossing At Private Crossing
Total Incidents Total Motor Vehicle Other Motor Vehicle
Highway User
Cnt % Kld Nonfatal Cnt Kld Nonfatal Cnt Kld Nonfatal Cnt Kld Nonfatal Car 249 10.38 13 109 242 13 107 - - - 7 - 2 Truck 29 1.21 - 17 27 - 16 - - - 2 - 1 Trk& Trail 31 1.29 1 45 25 1 45 - - - 6 - - Pickup Trk 93 3.88 12 45 84 12 41 - - - 9 - 4 Van 27 1.13 3 12 27 3 12 - - - - - - Bus 1 0.04 - - 1 - - - - - - - - School Bus 1 0.04 - - 1 - - - - - - - - Motorcycle 4 0.17 1 2 4 1 2 - - - - - - Oth Mtr V. 41 1.71 2 20 38 2 19 - - - 3 - 1 Pedestrian 6 0.25 1 4 - - - 6 1 4 - - - Other 6 0.25 - 3 - - - 6 - 3 - - - Total 488 20.35 33 257 449 32 242 12 1 7 27 - 8
Grand Total At Public Crossing At Private Crossing
Total Incidents Total Motor Vehicle Other Motor Vehicle Other
Highway User
Cnt % Kld Nonfatal Cnt Kld Nonfatal Cnt Kld Nonfatal Cnt Kld Nonfatal Cnt Kld Nonfatal Car 1,033 43.08 112 364 957 103 351 - - - 76 9 13 - - - Truck 129 5.38 9 79 103 8 73 - - - 26 1 6 - - - Trk& Trail 374 15.60 9 162 263 8 132 - - - 111 1 30 - - - Pickup Trk 418 17.43 52 162 341 47 143 - - - 77 5 19 - - - Van 105 4.38 9 39 93 9 36 - - - 12 - 3 - - - Bus 4 0.17 - 1 4 - 1 - - - - - - - - - School Bus 1 0.04 - - 1 - - - - - - - - - - - Motorcycle 10 0.42 2 3 10 2 3 - - - - - - - - - Oth Mtr V. 165 6.88 26 79 136 21 67 - - - 29 5 12 - - - Pedestrian 125 5.21 63 49 - - - 122 61 48 - - - 3 2 1 Other 34 1.42 5 10 - - - 30 5 10 - - - 4 - - Total 2,398 100.0 287 948 1,908 198 806 152 66 58 331 21 83 7 2 1
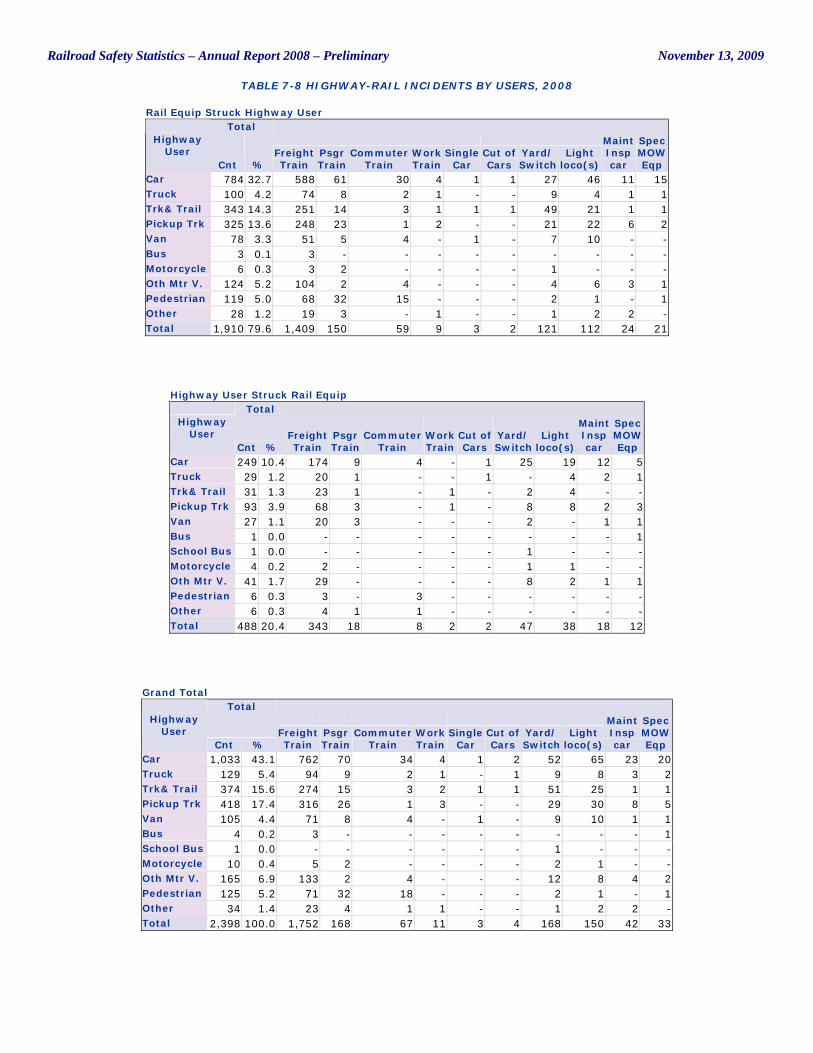
Railroad Safety Statistics – Annual Report 2008 – Preliminary November 13, 2009
TABLE 7-8 HIGHWAY-RAIL INCIDENTS BY USERS, 2008
Rail Equip Struck Highway User Total
Highway User
Cnt % Freight Train
Psgr Train
Commuter Train
Work Train
Single Car
Cut of Cars
Yard/ Switch
Light loco(s)
Maint Insp car
Spec MOW Eqp
Car 784 32.7 588 61 30 4 1 1 27 46 11 15 Truck 100 4.2 74 8 2 1 - - 9 4 1 1 Trk& Trail 343 14.3 251 14 3 1 1 1 49 21 1 1 Pickup Trk 325 13.6 248 23 1 2 - - 21 22 6 2 Van 78 3.3 51 5 4 - 1 - 7 10 - - Bus 3 0.1 3 - - - - - - - - - Motorcycle 6 0.3 3 2 - - - - 1 - - - Oth Mtr V. 124 5.2 104 2 4 - - - 4 6 3 1 Pedestrian 119 5.0 68 32 15 - - - 2 1 - 1 Other 28 1.2 19 3 - 1 - - 1 2 2 - Total 1,910 79.6 1,409 150 59 9 3 2 121 112 24 21
Highway User Struck Rail Equip Total
Highway User
Cnt % Freight Train
Psgr Train
Commuter Train
Work Train
Cut of Cars
Yard/ Switch
Light loco(s)
Maint Insp car
Spec MOW Eqp
Car 249 10.4 174 9 4 - 1 25 19 12 5 Truck 29 1.2 20 1 - - 1 - 4 2 1 Trk& Trail 31 1.3 23 1 - 1 - 2 4 - - Pickup Trk 93 3.9 68 3 - 1 - 8 8 2 3 Van 27 1.1 20 3 - - - 2 - 1 1 Bus 1 0.0 - - - - - - - - 1 School Bus 1 0.0 - - - - - 1 - - - Motorcycle 4 0.2 2 - - - - 1 1 - - Oth Mtr V. 41 1.7 29 - - - - 8 2 1 1 Pedestrian 6 0.3 3 - 3 - - - - - - Other 6 0.3 4 1 1 - - - - - - Total 488 20.4 343 18 8 2 2 47 38 18 12
Grand Total Total
Highway User
Cnt % Freight Train
Psgr Train
Commuter Train
Work Train
Single Car
Cut of Cars
Yard/ Switch
Light loco(s)
Maint Insp car
Spec MOW Eqp
Car 1,033 43.1 762 70 34 4 1 2 52 65 23 20 Truck 129 5.4 94 9 2 1 - 1 9 8 3 2 Trk& Trail 374 15.6 274 15 3 2 1 1 51 25 1 1 Pickup Trk 418 17.4 316 26 1 3 - - 29 30 8 5 Van 105 4.4 71 8 4 - 1 - 9 10 1 1 Bus 4 0.2 3 - - - - - - - - 1 School Bus 1 0.0 - - - - - - 1 - - - Motorcycle 10 0.4 5 2 - - - - 2 1 - - Oth Mtr V. 165 6.9 133 2 4 - - - 12 8 4 2 Pedestrian 125 5.2 71 32 18 - - - 2 1 - 1 Other 34 1.4 23 4 1 1 - - 1 2 2 - Total 2,398 100.0 1,752 168 67 11 3 4 168 150 42 33
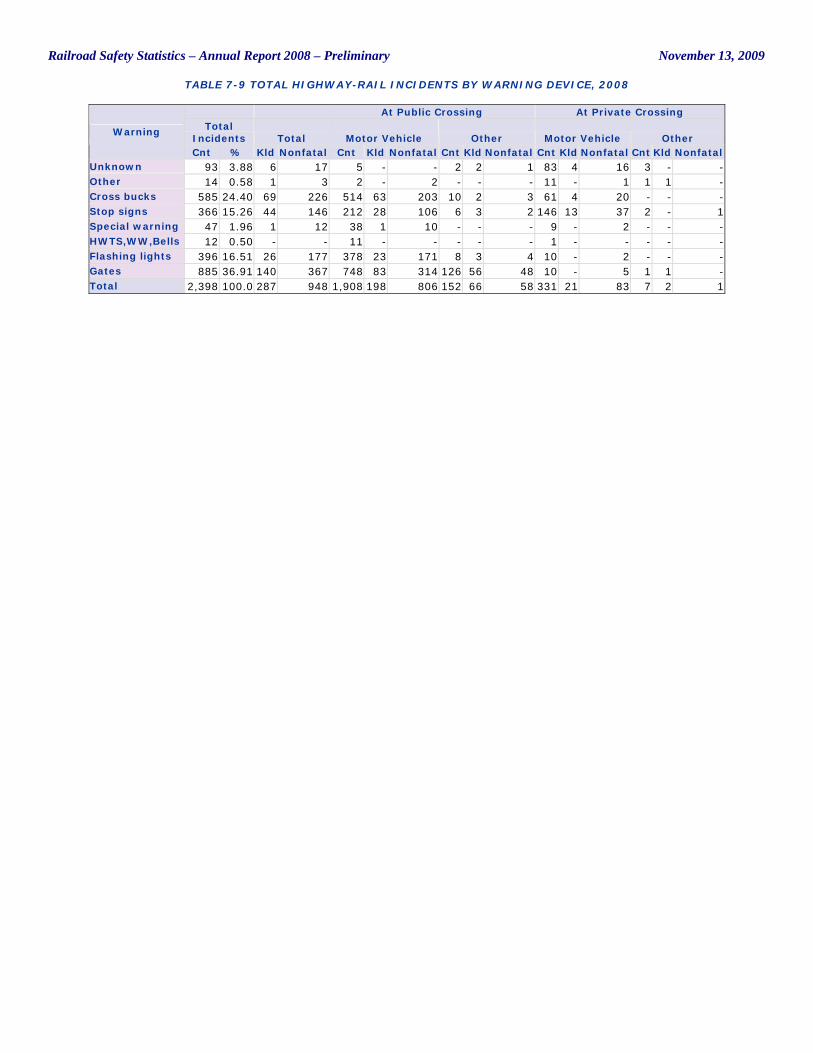
Railroad Safety Statistics – Annual Report 2008 – Preliminary November 13, 2009
TABLE 7-9 TOTAL HIGHWAY-RAIL INCIDENTS BY WARNING DEVICE, 2008
At Public Crossing At Private Crossing Total
Incidents Total Motor Vehicle Other Motor Vehicle Other Warning
Cnt % Kld Nonfatal Cnt Kld Nonfatal Cnt Kld Nonfatal Cnt Kld Nonfatal Cnt Kld Nonfatal Unknown 93 3.88 6 17 5 - - 2 2 1 83 4 16 3 - - Other 14 0.58 1 3 2 - 2 - - - 11 - 1 1 1 - Cross bucks 585 24.40 69 226 514 63 203 10 2 3 61 4 20 - - - Stop signs 366 15.26 44 146 212 28 106 6 3 2 146 13 37 2 - 1 Special warning 47 1.96 1 12 38 1 10 - - - 9 - 2 - - - HWTS,WW,Bells 12 0.50 - - 11 - - - - - 1 - - - - - Flashing lights 396 16.51 26 177 378 23 171 8 3 4 10 - 2 - - - Gates 885 36.91 140 367 748 83 314 126 56 48 10 - 5 1 1 - Total 2,398 100.0 287 948 1,908 198 806 152 66 58 331 21 83 7 2 1
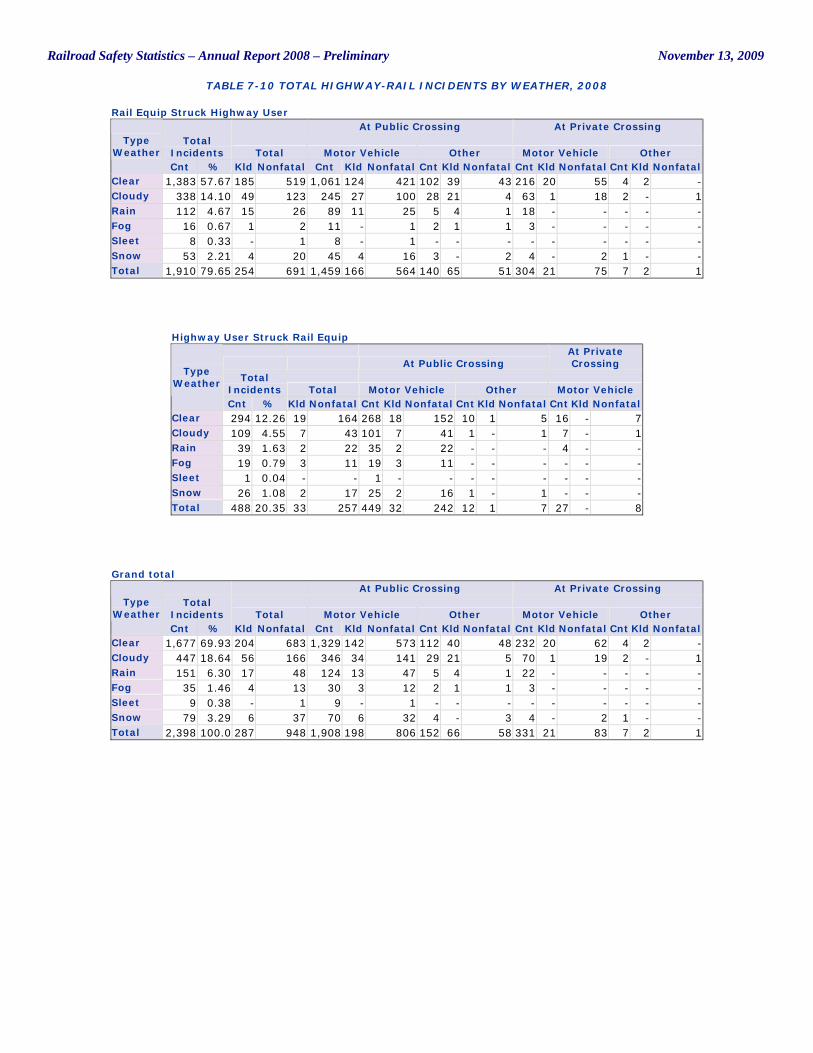
Railroad Safety Statistics – Annual Report 2008 – Preliminary November 13, 2009
TABLE 7-10 TOTAL HIGHWAY-RAIL INCIDENTS BY WEATHER, 2008
Rail Equip Struck Highway User At Public Crossing At Private Crossing
Total Incidents Total Motor Vehicle Other Motor Vehicle Other
Type Weather
Cnt % Kld Nonfatal Cnt Kld Nonfatal Cnt Kld Nonfatal Cnt Kld Nonfatal Cnt Kld Nonfatal Clear 1,383 57.67 185 519 1,061 124 421 102 39 43 216 20 55 4 2 - Cloudy 338 14.10 49 123 245 27 100 28 21 4 63 1 18 2 - 1 Rain 112 4.67 15 26 89 11 25 5 4 1 18 - - - - - Fog 16 0.67 1 2 11 - 1 2 1 1 3 - - - - - Sleet 8 0.33 - 1 8 - 1 - - - - - - - - - Snow 53 2.21 4 20 45 4 16 3 - 2 4 - 2 1 - - Total 1,910 79.65 254 691 1,459 166 564 140 65 51 304 21 75 7 2 1
Highway User Struck Rail Equip
At Public Crossing At Private Crossing
Total Incidents Total Motor Vehicle Other Motor Vehicle
Type Weather
Cnt % Kld Nonfatal Cnt Kld Nonfatal Cnt Kld Nonfatal Cnt Kld Nonfatal Clear 294 12.26 19 164 268 18 152 10 1 5 16 - 7 Cloudy 109 4.55 7 43 101 7 41 1 - 1 7 - 1 Rain 39 1.63 2 22 35 2 22 - - - 4 - - Fog 19 0.79 3 11 19 3 11 - - - - - - Sleet 1 0.04 - - 1 - - - - - - - - Snow 26 1.08 2 17 25 2 16 1 - 1 - - - Total 488 20.35 33 257 449 32 242 12 1 7 27 - 8
Grand total At Public Crossing At Private Crossing
Total Incidents Total Motor Vehicle Other Motor Vehicle Other
Type Weather
Cnt % Kld Nonfatal Cnt Kld Nonfatal Cnt Kld Nonfatal Cnt Kld Nonfatal Cnt Kld Nonfatal Clear 1,677 69.93 204 683 1,329 142 573 112 40 48 232 20 62 4 2 - Cloudy 447 18.64 56 166 346 34 141 29 21 5 70 1 19 2 - 1 Rain 151 6.30 17 48 124 13 47 5 4 1 22 - - - - - Fog 35 1.46 4 13 30 3 12 2 1 1 3 - - - - - Sleet 9 0.38 - 1 9 - 1 - - - - - - - - - Snow 79 3.29 6 37 70 6 32 4 - 3 4 - 2 1 - - Total 2,398 100.0 287 948 1,908 198 806 152 66 58 331 21 83 7 2 1
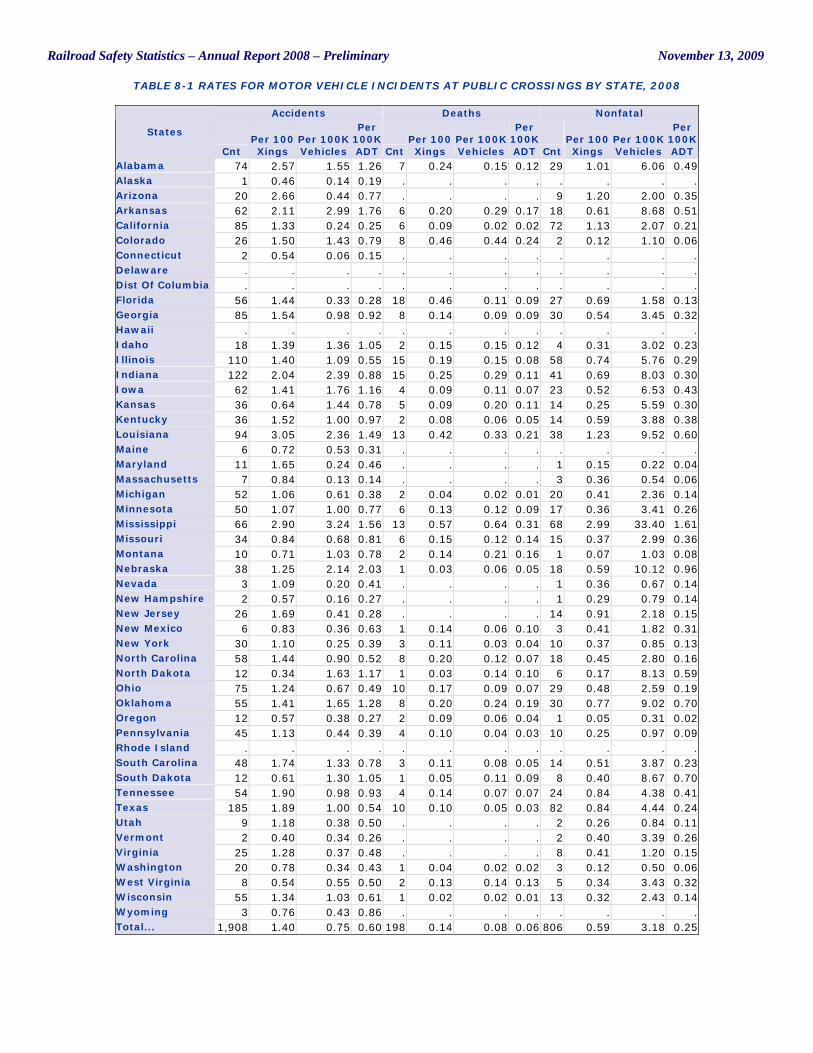
Railroad Safety Statistics – Annual Report 2008 – Preliminary November 13, 2009
TABLE 8-1 RATES FOR MOTOR VEHICLE INCIDENTS AT PUBLIC CROSSINGS BY STATE, 2008
Accidents Deaths Nonfatal
States
Cnt Per 100 Xings
Per 100K Vehicles
Per 100K ADT Cnt
Per 100 Xings
Per 100K Vehicles
Per 100K ADT Cnt
Per 100 Xings
Per 100K Vehicles
Per 100K ADT
Alabama 74 2.57 1.55 1.26 7 0.24 0.15 0.12 29 1.01 6.06 0.49 Alaska 1 0.46 0.14 0.19 . . . . . . . . Arizona 20 2.66 0.44 0.77 . . . . 9 1.20 2.00 0.35 Arkansas 62 2.11 2.99 1.76 6 0.20 0.29 0.17 18 0.61 8.68 0.51 California 85 1.33 0.24 0.25 6 0.09 0.02 0.02 72 1.13 2.07 0.21 Colorado 26 1.50 1.43 0.79 8 0.46 0.44 0.24 2 0.12 1.10 0.06 Connecticut 2 0.54 0.06 0.15 . . . . . . . . Delaware . . . . . . . . . . . . Dist Of Columbia . . . . . . . . . . . . Florida 56 1.44 0.33 0.28 18 0.46 0.11 0.09 27 0.69 1.58 0.13 Georgia 85 1.54 0.98 0.92 8 0.14 0.09 0.09 30 0.54 3.45 0.32 Hawaii . . . . . . . . . . . . Idaho 18 1.39 1.36 1.05 2 0.15 0.15 0.12 4 0.31 3.02 0.23 Illinois 110 1.40 1.09 0.55 15 0.19 0.15 0.08 58 0.74 5.76 0.29 Indiana 122 2.04 2.39 0.88 15 0.25 0.29 0.11 41 0.69 8.03 0.30 Iowa 62 1.41 1.76 1.16 4 0.09 0.11 0.07 23 0.52 6.53 0.43 Kansas 36 0.64 1.44 0.78 5 0.09 0.20 0.11 14 0.25 5.59 0.30 Kentucky 36 1.52 1.00 0.97 2 0.08 0.06 0.05 14 0.59 3.88 0.38 Louisiana 94 3.05 2.36 1.49 13 0.42 0.33 0.21 38 1.23 9.52 0.60 Maine 6 0.72 0.53 0.31 . . . . . . . . Maryland 11 1.65 0.24 0.46 . . . . 1 0.15 0.22 0.04 Massachusetts 7 0.84 0.13 0.14 . . . . 3 0.36 0.54 0.06 Michigan 52 1.06 0.61 0.38 2 0.04 0.02 0.01 20 0.41 2.36 0.14 Minnesota 50 1.07 1.00 0.77 6 0.13 0.12 0.09 17 0.36 3.41 0.26 Mississippi 66 2.90 3.24 1.56 13 0.57 0.64 0.31 68 2.99 33.40 1.61 Missouri 34 0.84 0.68 0.81 6 0.15 0.12 0.14 15 0.37 2.99 0.36 Montana 10 0.71 1.03 0.78 2 0.14 0.21 0.16 1 0.07 1.03 0.08 Nebraska 38 1.25 2.14 2.03 1 0.03 0.06 0.05 18 0.59 10.12 0.96 Nevada 3 1.09 0.20 0.41 . . . . 1 0.36 0.67 0.14 New Hampshire 2 0.57 0.16 0.27 . . . . 1 0.29 0.79 0.14 New Jersey 26 1.69 0.41 0.28 . . . . 14 0.91 2.18 0.15 New Mexico 6 0.83 0.36 0.63 1 0.14 0.06 0.10 3 0.41 1.82 0.31 New York 30 1.10 0.25 0.39 3 0.11 0.03 0.04 10 0.37 0.85 0.13 North Carolina 58 1.44 0.90 0.52 8 0.20 0.12 0.07 18 0.45 2.80 0.16 North Dakota 12 0.34 1.63 1.17 1 0.03 0.14 0.10 6 0.17 8.13 0.59 Ohio 75 1.24 0.67 0.49 10 0.17 0.09 0.07 29 0.48 2.59 0.19 Oklahoma 55 1.41 1.65 1.28 8 0.20 0.24 0.19 30 0.77 9.02 0.70 Oregon 12 0.57 0.38 0.27 2 0.09 0.06 0.04 1 0.05 0.31 0.02 Pennsylvania 45 1.13 0.44 0.39 4 0.10 0.04 0.03 10 0.25 0.97 0.09 Rhode Island . . . . . . . . . . . . South Carolina 48 1.74 1.33 0.78 3 0.11 0.08 0.05 14 0.51 3.87 0.23 South Dakota 12 0.61 1.30 1.05 1 0.05 0.11 0.09 8 0.40 8.67 0.70 Tennessee 54 1.90 0.98 0.93 4 0.14 0.07 0.07 24 0.84 4.38 0.41 Texas 185 1.89 1.00 0.54 10 0.10 0.05 0.03 82 0.84 4.44 0.24 Utah 9 1.18 0.38 0.50 . . . . 2 0.26 0.84 0.11 Vermont 2 0.40 0.34 0.26 . . . . 2 0.40 3.39 0.26 Virginia 25 1.28 0.37 0.48 . . . . 8 0.41 1.20 0.15 Washington 20 0.78 0.34 0.43 1 0.04 0.02 0.02 3 0.12 0.50 0.06 West Virginia 8 0.54 0.55 0.50 2 0.13 0.14 0.13 5 0.34 3.43 0.32 Wisconsin 55 1.34 1.03 0.61 1 0.02 0.02 0.01 13 0.32 2.43 0.14 Wyoming 3 0.76 0.43 0.86 . . . . . . . . Total... 1,908 1.40 0.75 0.60 198 0.14 0.08 0.06 806 0.59 3.18 0.25
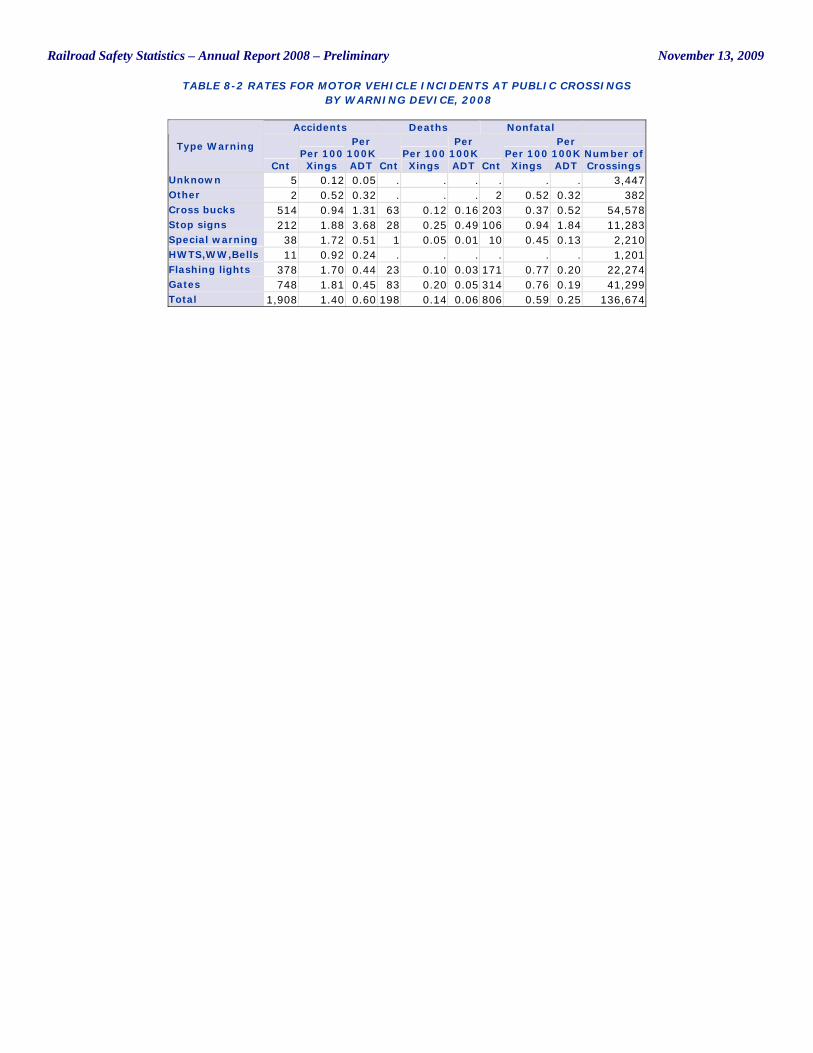
Railroad Safety Statistics – Annual Report 2008 – Preliminary November 13, 2009
TABLE 8-2 RATES FOR MOTOR VEHICLE INCIDENTS AT PUBLIC CROSSINGS BY WARNING DEVICE, 2008
Accidents Deaths Nonfatal
Type Warning
Cnt Per 100 Xings
Per 100K ADT Cnt
Per 100 Xings
Per 100K ADT Cnt
Per 100 Xings
Per 100K ADT
Number of Crossings
Unknown 5 0.12 0.05 . . . . . . 3,447 Other 2 0.52 0.32 . . . 2 0.52 0.32 382 Cross bucks 514 0.94 1.31 63 0.12 0.16 203 0.37 0.52 54,578 Stop signs 212 1.88 3.68 28 0.25 0.49 106 0.94 1.84 11,283 Special warning 38 1.72 0.51 1 0.05 0.01 10 0.45 0.13 2,210 HWTS,WW,Bells 11 0.92 0.24 . . . . . . 1,201 Flashing lights 378 1.70 0.44 23 0.10 0.03 171 0.77 0.20 22,274 Gates 748 1.81 0.45 83 0.20 0.05 314 0.76 0.19 41,299 Total 1,908 1.40 0.60 198 0.14 0.06 806 0.59 0.25 136,674
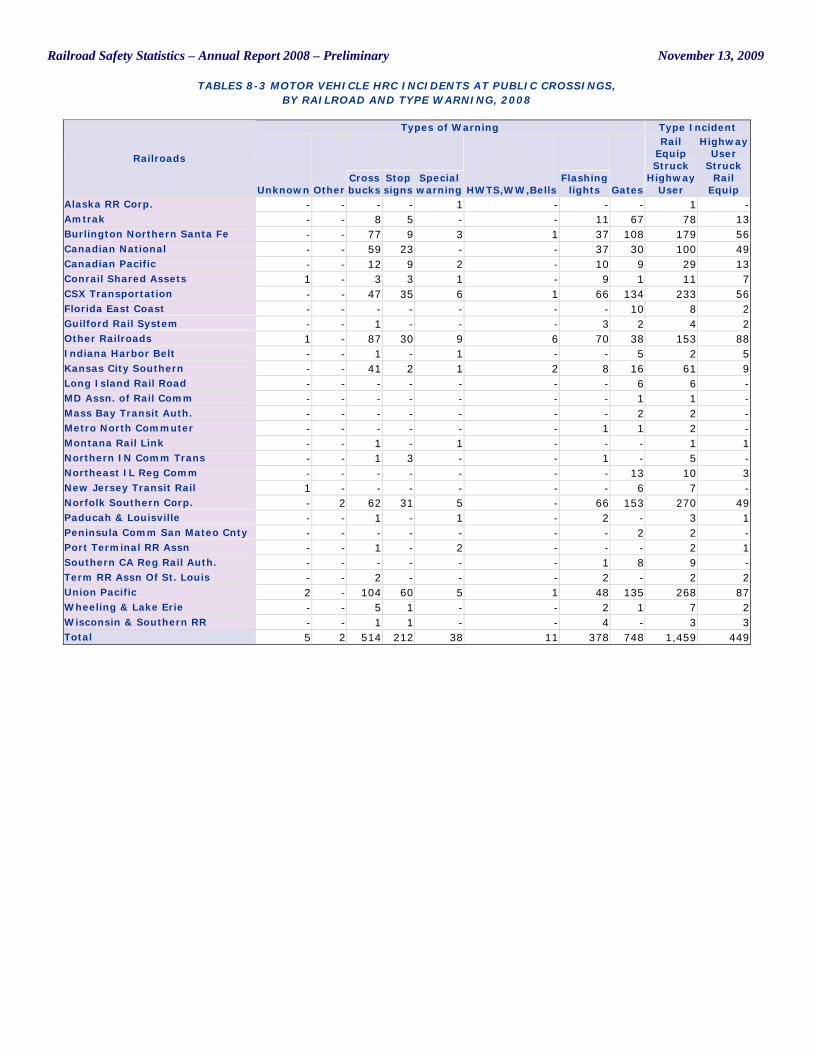
Railroad Safety Statistics – Annual Report 2008 – Preliminary November 13, 2009
TABLES 8-3 MOTOR VEHICLE HRC INCIDENTS AT PUBLIC CROSSINGS, BY RAILROAD AND TYPE WARNING, 2008
Types of Warning Type Incident
Railroads
Unknown Other Cross bucks
Stop signs
Special warning HWTS,WW,Bells
Flashing lights Gates
Rail Equip Struck
Highway User
Highway User
Struck Rail
Equip Alaska RR Corp. - - - - 1 - - - 1 - Amtrak - - 8 5 - - 11 67 78 13 Burlington Northern Santa Fe - - 77 9 3 1 37 108 179 56 Canadian National - - 59 23 - - 37 30 100 49 Canadian Pacific - - 12 9 2 - 10 9 29 13 Conrail Shared Assets 1 - 3 3 1 - 9 1 11 7 CSX Transportation - - 47 35 6 1 66 134 233 56 Florida East Coast - - - - - - - 10 8 2 Guilford Rail System - - 1 - - - 3 2 4 2 Other Railroads 1 - 87 30 9 6 70 38 153 88 Indiana Harbor Belt - - 1 - 1 - - 5 2 5 Kansas City Southern - - 41 2 1 2 8 16 61 9 Long Island Rail Road - - - - - - - 6 6 - MD Assn. of Rail Comm - - - - - - - 1 1 - Mass Bay Transit Auth. - - - - - - - 2 2 - Metro North Commuter - - - - - - 1 1 2 - Montana Rail Link - - 1 - 1 - - - 1 1 Northern IN Comm Trans - - 1 3 - - 1 - 5 - Northeast IL Reg Comm - - - - - - - 13 10 3 New Jersey Transit Rail 1 - - - - - - 6 7 - Norfolk Southern Corp. - 2 62 31 5 - 66 153 270 49 Paducah & Louisville - - 1 - 1 - 2 - 3 1 Peninsula Comm San Mateo Cnty - - - - - - - 2 2 - Port Terminal RR Assn - - 1 - 2 - - - 2 1 Southern CA Reg Rail Auth. - - - - - - 1 8 9 - Term RR Assn Of St. Louis - - 2 - - - 2 - 2 2 Union Pacific 2 - 104 60 5 1 48 135 268 87 Wheeling & Lake Erie - - 5 1 - - 2 1 7 2 Wisconsin & Southern RR - - 1 1 - - 4 - 3 3 Total 5 2 514 212 38 11 378 748 1,459 449
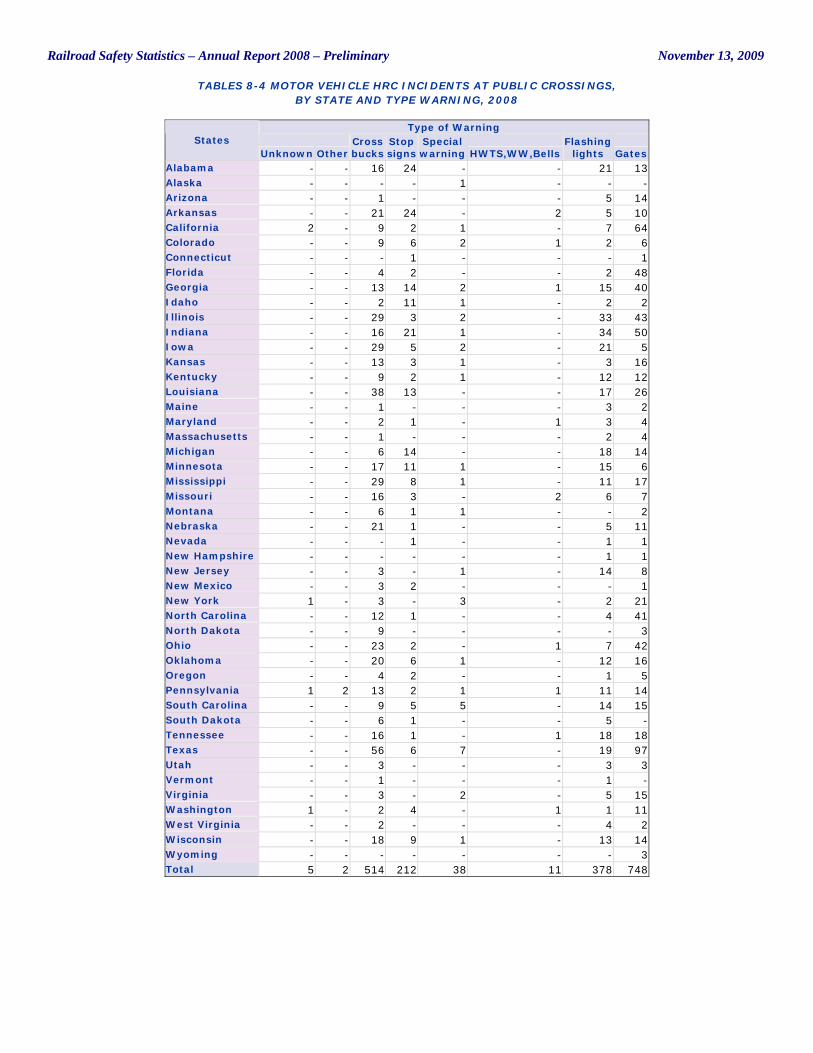
Railroad Safety Statistics – Annual Report 2008 – Preliminary November 13, 2009
TABLES 8-4 MOTOR VEHICLE HRC INCIDENTS AT PUBLIC CROSSINGS, BY STATE AND TYPE WARNING, 2008
Type of Warning States
Unknown Other Cross bucks
Stop signs
Special warning HWTS,WW,Bells
Flashing lights Gates
Alabama - - 16 24 - - 21 13 Alaska - - - - 1 - - - Arizona - - 1 - - - 5 14 Arkansas - - 21 24 - 2 5 10 California 2 - 9 2 1 - 7 64 Colorado - - 9 6 2 1 2 6 Connecticut - - - 1 - - - 1 Florida - - 4 2 - - 2 48 Georgia - - 13 14 2 1 15 40 Idaho - - 2 11 1 - 2 2 Illinois - - 29 3 2 - 33 43 Indiana - - 16 21 1 - 34 50 Iowa - - 29 5 2 - 21 5 Kansas - - 13 3 1 - 3 16 Kentucky - - 9 2 1 - 12 12 Louisiana - - 38 13 - - 17 26 Maine - - 1 - - - 3 2 Maryland - - 2 1 - 1 3 4 Massachusetts - - 1 - - - 2 4 Michigan - - 6 14 - - 18 14 Minnesota - - 17 11 1 - 15 6 Mississippi - - 29 8 1 - 11 17 Missouri - - 16 3 - 2 6 7 Montana - - 6 1 1 - - 2 Nebraska - - 21 1 - - 5 11 Nevada - - - 1 - - 1 1 New Hampshire - - - - - - 1 1 New Jersey - - 3 - 1 - 14 8 New Mexico - - 3 2 - - - 1 New York 1 - 3 - 3 - 2 21 North Carolina - - 12 1 - - 4 41 North Dakota - - 9 - - - - 3 Ohio - - 23 2 - 1 7 42 Oklahoma - - 20 6 1 - 12 16 Oregon - - 4 2 - - 1 5 Pennsylvania 1 2 13 2 1 1 11 14 South Carolina - - 9 5 5 - 14 15 South Dakota - - 6 1 - - 5 - Tennessee - - 16 1 - 1 18 18 Texas - - 56 6 7 - 19 97 Utah - - 3 - - - 3 3 Vermont - - 1 - - - 1 - Virginia - - 3 - 2 - 5 15 Washington 1 - 2 4 - 1 1 11 West Virginia - - 2 - - - 4 2 Wisconsin - - 18 9 1 - 13 14 Wyoming - - - - - - - 3 Total 5 2 514 212 38 11 378 748
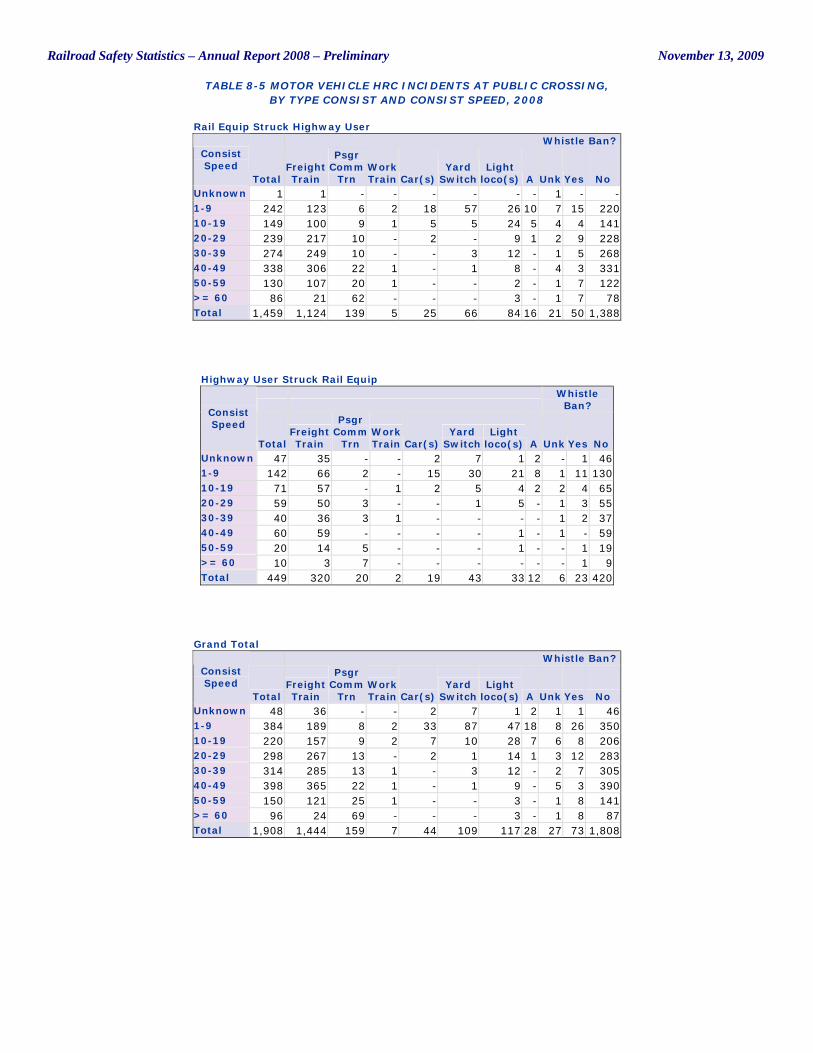
Railroad Safety Statistics – Annual Report 2008 – Preliminary November 13, 2009
TABLE 8-5 MOTOR VEHICLE HRC INCIDENTS AT PUBLIC CROSSING, BY TYPE CONSIST AND CONSIST SPEED, 2008
Rail Equip Struck Highway User Whistle Ban?
Consist Speed
Total Freight Train
Psgr Comm
Trn Work Train Car(s)
Yard Switch
Light loco(s) A Unk Yes No
Unknown 1 1 - - - - - - 1 - - 1-9 242 123 6 2 18 57 26 10 7 15 220 10-19 149 100 9 1 5 5 24 5 4 4 141 20-29 239 217 10 - 2 - 9 1 2 9 228 30-39 274 249 10 - - 3 12 - 1 5 268 40-49 338 306 22 1 - 1 8 - 4 3 331 50-59 130 107 20 1 - - 2 - 1 7 122 >= 60 86 21 62 - - - 3 - 1 7 78 Total 1,459 1,124 139 5 25 66 84 16 21 50 1,388
Highway User Struck Rail Equip
Whistle
Ban? Consist Speed
Total Freight Train
Psgr Comm
Trn Work Train Car(s)
Yard Switch
Light loco(s) A Unk Yes No
Unknown 47 35 - - 2 7 1 2 - 1 46 1-9 142 66 2 - 15 30 21 8 1 11 130 10-19 71 57 - 1 2 5 4 2 2 4 65 20-29 59 50 3 - - 1 5 - 1 3 55 30-39 40 36 3 1 - - - - 1 2 37 40-49 60 59 - - - - 1 - 1 - 59 50-59 20 14 5 - - - 1 - - 1 19 >= 60 10 3 7 - - - - - - 1 9 Total 449 320 20 2 19 43 33 12 6 23 420
Grand Total Whistle Ban?
Consist Speed
Total Freight Train
Psgr Comm
Trn Work Train Car(s)
Yard Switch
Light loco(s) A Unk Yes No
Unknown 48 36 - - 2 7 1 2 1 1 46 1-9 384 189 8 2 33 87 47 18 8 26 350 10-19 220 157 9 2 7 10 28 7 6 8 206 20-29 298 267 13 - 2 1 14 1 3 12 283 30-39 314 285 13 1 - 3 12 - 2 7 305 40-49 398 365 22 1 - 1 9 - 5 3 390 50-59 150 121 25 1 - - 3 - 1 8 141 >= 60 96 24 69 - - - 3 - 1 8 87 Total 1,908 1,444 159 7 44 109 117 28 27 73 1,808
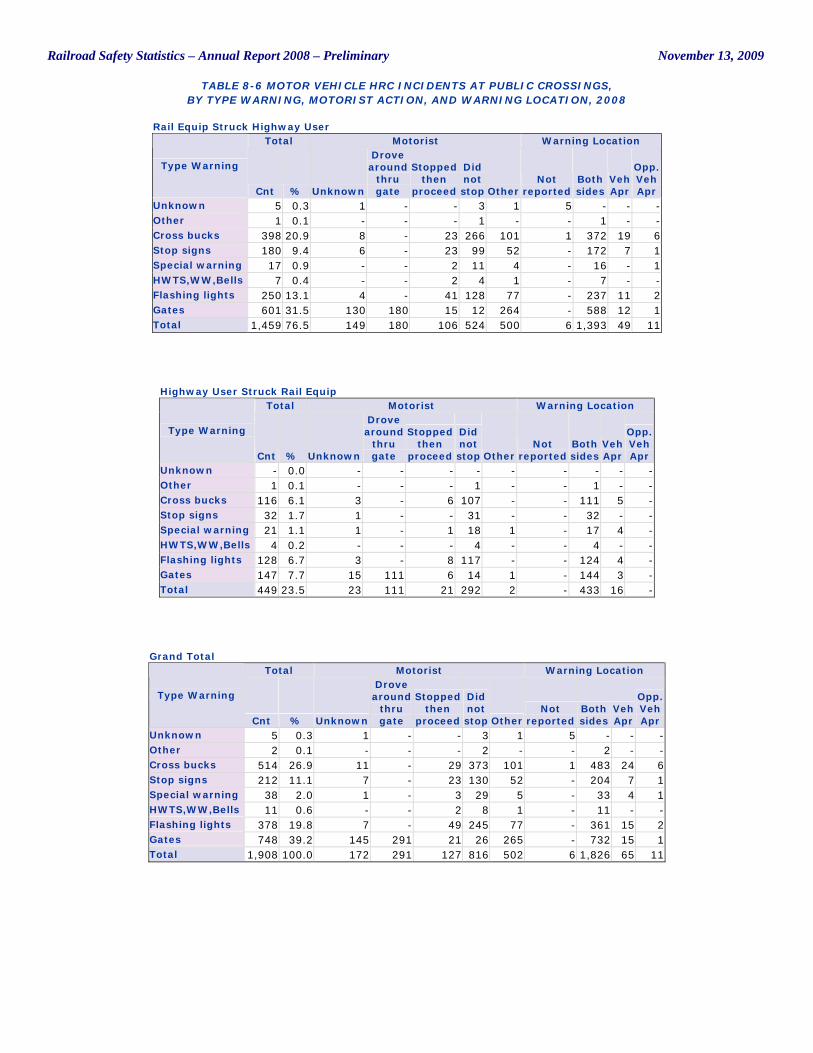
Railroad Safety Statistics – Annual Report 2008 – Preliminary November 13, 2009
TABLE 8-6 MOTOR VEHICLE HRC INCIDENTS AT PUBLIC CROSSINGS, BY TYPE WARNING, MOTORIST ACTION, AND WARNING LOCATION, 2008
Rail Equip Struck Highway User Total Motorist Warning Location
Type Warning
Cnt % Unknown
Drove around
thru gate
Stopped then
proceed
Did not stop Other
Not reported
Both sides
Veh Apr
Opp. Veh Apr
Unknown 5 0.3 1 - - 3 1 5 - - - Other 1 0.1 - - - 1 - - 1 - - Cross bucks 398 20.9 8 - 23 266 101 1 372 19 6 Stop signs 180 9.4 6 - 23 99 52 - 172 7 1 Special warning 17 0.9 - - 2 11 4 - 16 - 1 HWTS,WW,Bells 7 0.4 - - 2 4 1 - 7 - - Flashing lights 250 13.1 4 - 41 128 77 - 237 11 2 Gates 601 31.5 130 180 15 12 264 - 588 12 1 Total 1,459 76.5 149 180 106 524 500 6 1,393 49 11
Highway User Struck Rail Equip Total Motorist Warning Location
Type Warning
Cnt % Unknown
Drove around
thru gate
Stopped then
proceed
Did not stop Other
Not reported
Both sides
Veh Apr
Opp. Veh Apr
Unknown - 0.0 - - - - - - - - - Other 1 0.1 - - - 1 - - 1 - - Cross bucks 116 6.1 3 - 6 107 - - 111 5 - Stop signs 32 1.7 1 - - 31 - - 32 - - Special warning 21 1.1 1 - 1 18 1 - 17 4 - HWTS,WW,Bells 4 0.2 - - - 4 - - 4 - - Flashing lights 128 6.7 3 - 8 117 - - 124 4 - Gates 147 7.7 15 111 6 14 1 - 144 3 - Total 449 23.5 23 111 21 292 2 - 433 16 -
Grand Total Total Motorist Warning Location
Type Warning
Cnt % Unknown
Drove around
thru gate
Stopped then
proceed
Did not stop Other
Not reported
Both sides
Veh Apr
Opp. Veh Apr
Unknown 5 0.3 1 - - 3 1 5 - - - Other 2 0.1 - - - 2 - - 2 - - Cross bucks 514 26.9 11 - 29 373 101 1 483 24 6 Stop signs 212 11.1 7 - 23 130 52 - 204 7 1 Special warning 38 2.0 1 - 3 29 5 - 33 4 1 HWTS,WW,Bells 11 0.6 - - 2 8 1 - 11 - - Flashing lights 378 19.8 7 - 49 245 77 - 361 15 2 Gates 748 39.2 145 291 21 26 265 - 732 15 1 Total 1,908 100.0 172 291 127 816 502 6 1,826 65 11
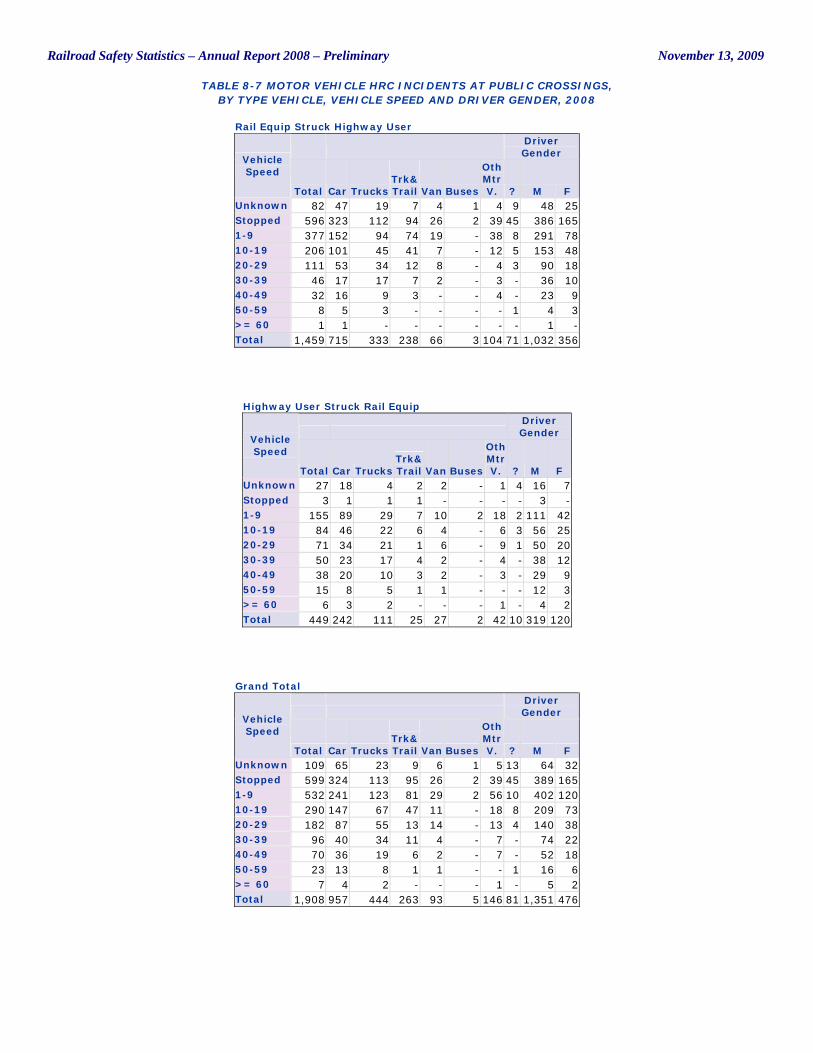
Railroad Safety Statistics – Annual Report 2008 – Preliminary November 13, 2009
TABLE 8-7 MOTOR VEHICLE HRC INCIDENTS AT PUBLIC CROSSINGS, BY TYPE VEHICLE, VEHICLE SPEED AND DRIVER GENDER, 2008
Rail Equip Struck Highway User
Driver Gender
Vehicle Speed
Total Car Trucks Trk& Trail Van Buses
Oth Mtr V. ? M F
Unknown 82 47 19 7 4 1 4 9 48 25 Stopped 596 323 112 94 26 2 39 45 386 165 1-9 377 152 94 74 19 - 38 8 291 78 10-19 206 101 45 41 7 - 12 5 153 48 20-29 111 53 34 12 8 - 4 3 90 18 30-39 46 17 17 7 2 - 3 - 36 10 40-49 32 16 9 3 - - 4 - 23 9 50-59 8 5 3 - - - - 1 4 3 >= 60 1 1 - - - - - - 1 - Total 1,459 715 333 238 66 3 104 71 1,032 356
Highway User Struck Rail Equip
Driver Gender
Vehicle Speed
Total Car Trucks Trk& Trail Van Buses
Oth Mtr V. ? M F
Unknown 27 18 4 2 2 - 1 4 16 7 Stopped 3 1 1 1 - - - - 3 - 1-9 155 89 29 7 10 2 18 2 111 42 10-19 84 46 22 6 4 - 6 3 56 25 20-29 71 34 21 1 6 - 9 1 50 20 30-39 50 23 17 4 2 - 4 - 38 12 40-49 38 20 10 3 2 - 3 - 29 9 50-59 15 8 5 1 1 - - - 12 3 >= 60 6 3 2 - - - 1 - 4 2 Total 449 242 111 25 27 2 42 10 319 120
Grand Total
Driver Gender
Vehicle Speed
Total Car Trucks Trk& Trail Van Buses
Oth Mtr V. ? M F
Unknown 109 65 23 9 6 1 5 13 64 32 Stopped 599 324 113 95 26 2 39 45 389 165 1-9 532 241 123 81 29 2 56 10 402 120 10-19 290 147 67 47 11 - 18 8 209 73 20-29 182 87 55 13 14 - 13 4 140 38 30-39 96 40 34 11 4 - 7 - 74 22 40-49 70 36 19 6 2 - 7 - 52 18 50-59 23 13 8 1 1 - - 1 16 6 >= 60 7 4 2 - - - 1 - 5 2 Total 1,908 957 444 263 93 5 146 81 1,351 476
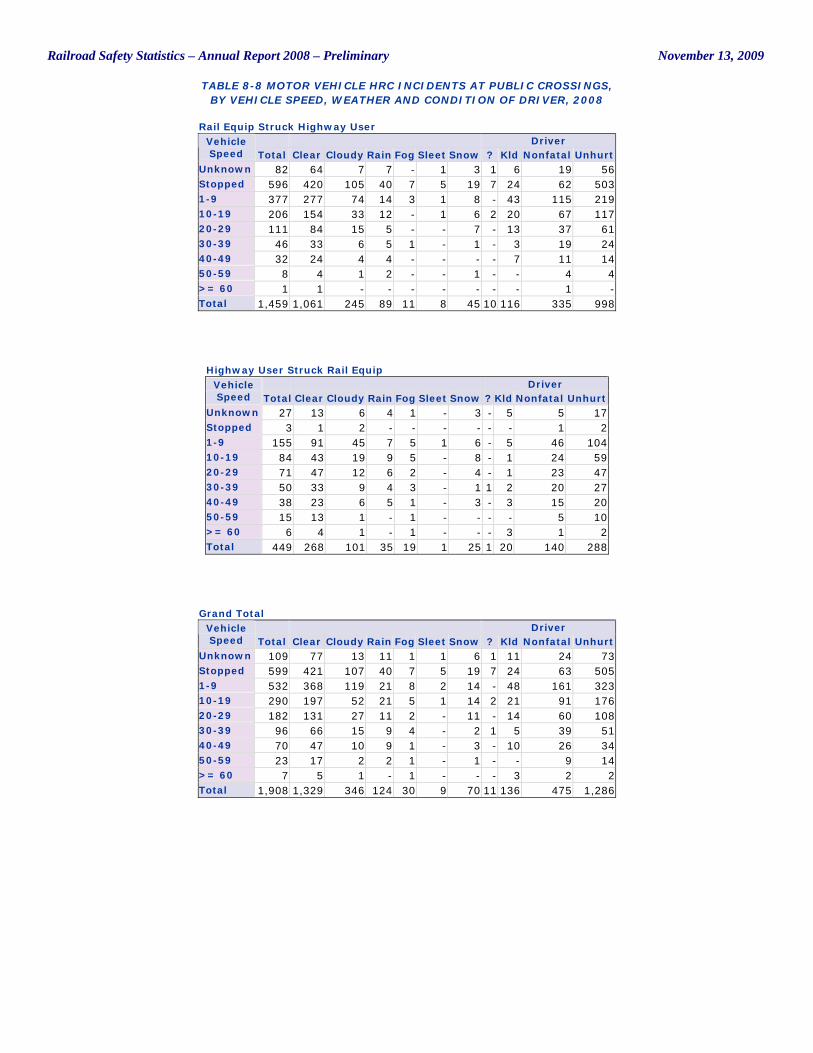
Railroad Safety Statistics – Annual Report 2008 – Preliminary November 13, 2009
TABLE 8-8 MOTOR VEHICLE HRC INCIDENTS AT PUBLIC CROSSINGS, BY VEHICLE SPEED, WEATHER AND CONDITION OF DRIVER, 2008
Rail Equip Struck Highway User Driver Vehicle
Speed Total Clear Cloudy Rain Fog Sleet Snow ? Kld Nonfatal Unhurt Unknown 82 64 7 7 - 1 3 1 6 19 56 Stopped 596 420 105 40 7 5 19 7 24 62 503 1-9 377 277 74 14 3 1 8 - 43 115 219 10-19 206 154 33 12 - 1 6 2 20 67 117 20-29 111 84 15 5 - - 7 - 13 37 61 30-39 46 33 6 5 1 - 1 - 3 19 24 40-49 32 24 4 4 - - - - 7 11 14 50-59 8 4 1 2 - - 1 - - 4 4 >= 60 1 1 - - - - - - - 1 - Total 1,459 1,061 245 89 11 8 45 10 116 335 998
Highway User Struck Rail Equip Driver Vehicle
Speed Total Clear Cloudy Rain Fog Sleet Snow ? Kld Nonfatal Unhurt Unknown 27 13 6 4 1 - 3 - 5 5 17 Stopped 3 1 2 - - - - - - 1 2 1-9 155 91 45 7 5 1 6 - 5 46 104 10-19 84 43 19 9 5 - 8 - 1 24 59 20-29 71 47 12 6 2 - 4 - 1 23 47 30-39 50 33 9 4 3 - 1 1 2 20 27 40-49 38 23 6 5 1 - 3 - 3 15 20 50-59 15 13 1 - 1 - - - - 5 10 >= 60 6 4 1 - 1 - - - 3 1 2 Total 449 268 101 35 19 1 25 1 20 140 288
Grand Total Driver Vehicle
Speed Total Clear Cloudy Rain Fog Sleet Snow ? Kld Nonfatal Unhurt Unknown 109 77 13 11 1 1 6 1 11 24 73 Stopped 599 421 107 40 7 5 19 7 24 63 505 1-9 532 368 119 21 8 2 14 - 48 161 323 10-19 290 197 52 21 5 1 14 2 21 91 176 20-29 182 131 27 11 2 - 11 - 14 60 108 30-39 96 66 15 9 4 - 2 1 5 39 51 40-49 70 47 10 9 1 - 3 - 10 26 34 50-59 23 17 2 2 1 - 1 - - 9 14 >= 60 7 5 1 - 1 - - - 3 2 2 Total 1,908 1,329 346 124 30 9 70 11 136 475 1,286
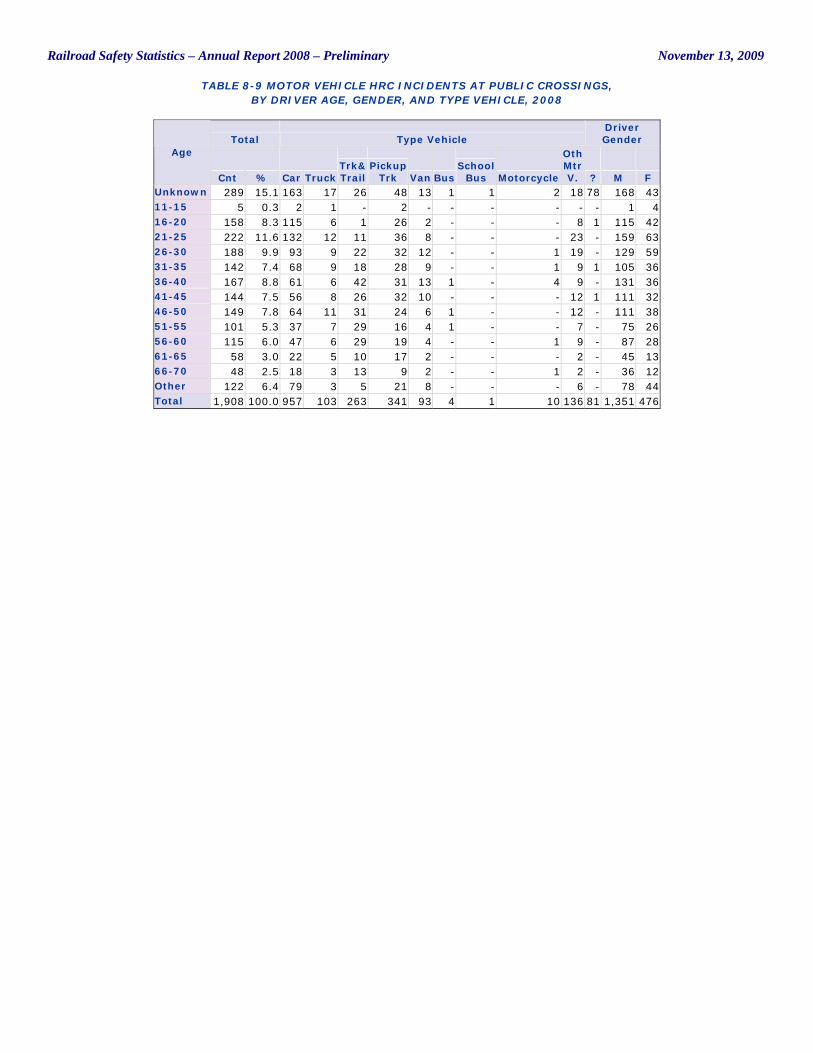
Railroad Safety Statistics – Annual Report 2008 – Preliminary November 13, 2009
TABLE 8-9 MOTOR VEHICLE HRC INCIDENTS AT PUBLIC CROSSINGS, BY DRIVER AGE, GENDER, AND TYPE VEHICLE, 2008
Total Type Vehicle Driver Gender
Age
Cnt % Car Truck Trk& Trail
Pickup Trk Van Bus
School Bus Motorcycle
Oth Mtr V. ? M F
Unknown 289 15.1 163 17 26 48 13 1 1 2 18 78 168 43 11-15 5 0.3 2 1 - 2 - - - - - - 1 4 16-20 158 8.3 115 6 1 26 2 - - - 8 1 115 42 21-25 222 11.6 132 12 11 36 8 - - - 23 - 159 63 26-30 188 9.9 93 9 22 32 12 - - 1 19 - 129 59 31-35 142 7.4 68 9 18 28 9 - - 1 9 1 105 36 36-40 167 8.8 61 6 42 31 13 1 - 4 9 - 131 36 41-45 144 7.5 56 8 26 32 10 - - - 12 1 111 32 46-50 149 7.8 64 11 31 24 6 1 - - 12 - 111 38 51-55 101 5.3 37 7 29 16 4 1 - - 7 - 75 26 56-60 115 6.0 47 6 29 19 4 - - 1 9 - 87 28 61-65 58 3.0 22 5 10 17 2 - - - 2 - 45 13 66-70 48 2.5 18 3 13 9 2 - - 1 2 - 36 12 Other 122 6.4 79 3 5 21 8 - - - 6 - 78 44 Total 1,908 100.0 957 103 263 341 93 4 1 10 136 81 1,351 476
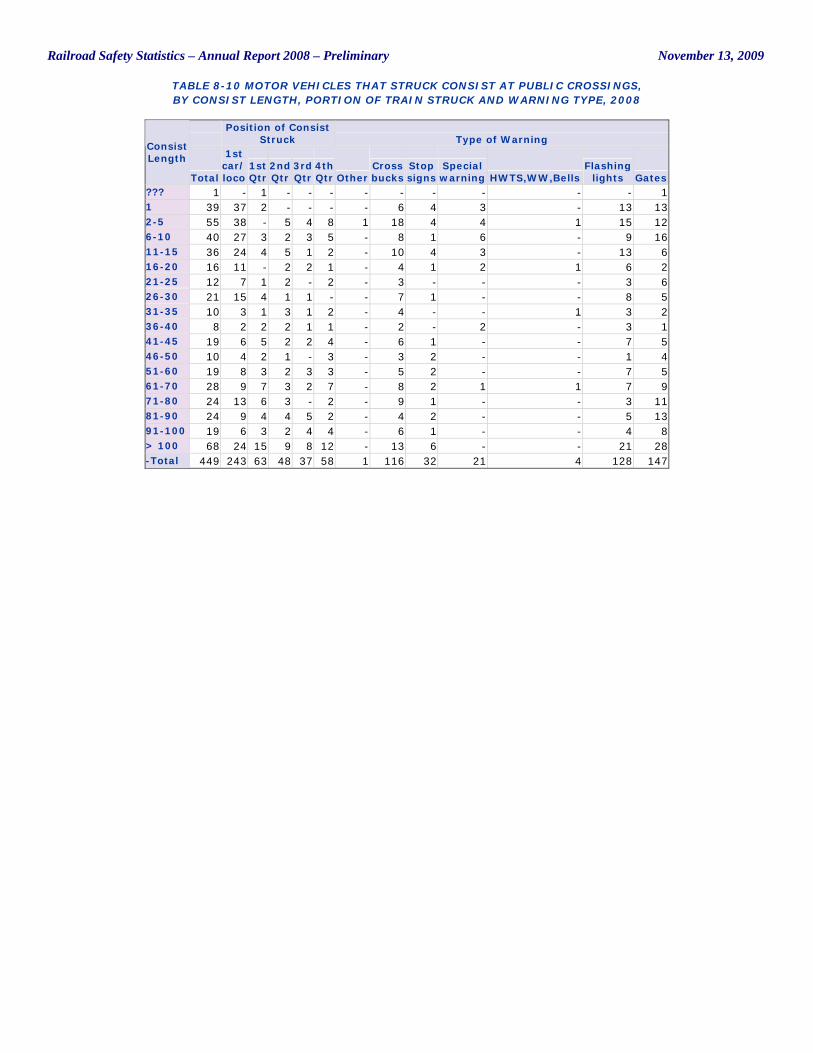
Railroad Safety Statistics – Annual Report 2008 – Preliminary November 13, 2009
TABLE 8-10 MOTOR VEHICLES THAT STRUCK CONSIST AT PUBLIC CROSSINGS, BY CONSIST LENGTH, PORTION OF TRAIN STRUCK AND WARNING TYPE, 2008
Position of Consist
Struck Type of Warning Consist Length
Total
1st car/ loco
1st Qtr
2nd Qtr
3rd Qtr
4th Qtr Other
Cross bucks
Stop signs
Special warning HWTS,WW,Bells
Flashing lights Gates
??? 1 - 1 - - - - - - - - - 1 1 39 37 2 - - - - 6 4 3 - 13 13 2-5 55 38 - 5 4 8 1 18 4 4 1 15 12 6-10 40 27 3 2 3 5 - 8 1 6 - 9 16 11-15 36 24 4 5 1 2 - 10 4 3 - 13 6 16-20 16 11 - 2 2 1 - 4 1 2 1 6 2 21-25 12 7 1 2 - 2 - 3 - - - 3 6 26-30 21 15 4 1 1 - - 7 1 - - 8 5 31-35 10 3 1 3 1 2 - 4 - - 1 3 2 36-40 8 2 2 2 1 1 - 2 - 2 - 3 1 41-45 19 6 5 2 2 4 - 6 1 - - 7 5 46-50 10 4 2 1 - 3 - 3 2 - - 1 4 51-60 19 8 3 2 3 3 - 5 2 - - 7 5 61-70 28 9 7 3 2 7 - 8 2 1 1 7 9 71-80 24 13 6 3 - 2 - 9 1 - - 3 11 81-90 24 9 4 4 5 2 - 4 2 - - 5 13 91-100 19 6 3 2 4 4 - 6 1 - - 4 8 > 100 68 24 15 9 8 12 - 13 6 - - 21 28 -Total 449 243 63 48 37 58 1 116 32 21 4 128 147
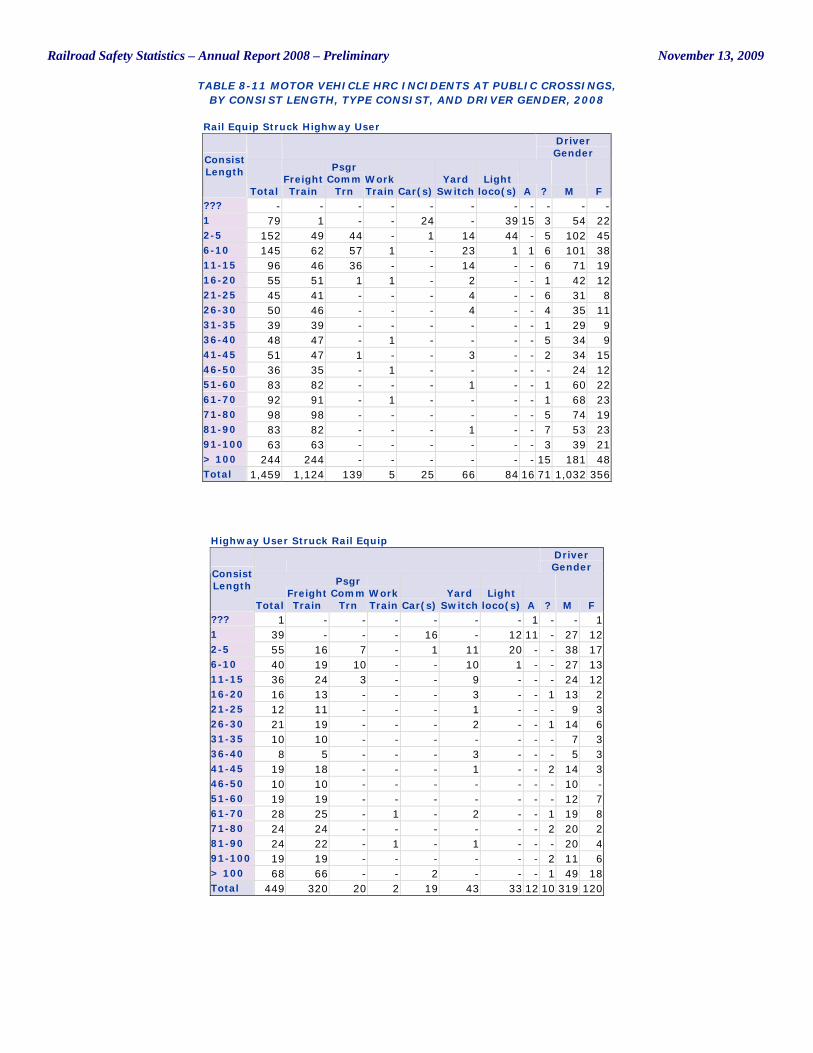
Railroad Safety Statistics – Annual Report 2008 – Preliminary November 13, 2009
TABLE 8-11 MOTOR VEHICLE HRC INCIDENTS AT PUBLIC CROSSINGS, BY CONSIST LENGTH, TYPE CONSIST, AND DRIVER GENDER, 2008
Rail Equip Struck Highway User
Driver Gender
Consist Length
Total Freight Train
Psgr Comm
Trn Work Train Car(s)
Yard Switch
Light loco(s) A ? M F
??? - - - - - - - - - - - 1 79 1 - - 24 - 39 15 3 54 22 2-5 152 49 44 - 1 14 44 - 5 102 45 6-10 145 62 57 1 - 23 1 1 6 101 38 11-15 96 46 36 - - 14 - - 6 71 19 16-20 55 51 1 1 - 2 - - 1 42 12 21-25 45 41 - - - 4 - - 6 31 8 26-30 50 46 - - - 4 - - 4 35 11 31-35 39 39 - - - - - - 1 29 9 36-40 48 47 - 1 - - - - 5 34 9 41-45 51 47 1 - - 3 - - 2 34 15 46-50 36 35 - 1 - - - - - 24 12 51-60 83 82 - - - 1 - - 1 60 22 61-70 92 91 - 1 - - - - 1 68 23 71-80 98 98 - - - - - - 5 74 19 81-90 83 82 - - - 1 - - 7 53 23 91-100 63 63 - - - - - - 3 39 21 > 100 244 244 - - - - - - 15 181 48 Total 1,459 1,124 139 5 25 66 84 16 71 1,032 356
Highway User Struck Rail Equip
Driver Gender
Consist Length
Total Freight Train
Psgr Comm
Trn Work Train Car(s)
Yard Switch
Light loco(s) A ? M F
??? 1 - - - - - - 1 - - 1 1 39 - - - 16 - 12 11 - 27 12 2-5 55 16 7 - 1 11 20 - - 38 17 6-10 40 19 10 - - 10 1 - - 27 13 11-15 36 24 3 - - 9 - - - 24 12 16-20 16 13 - - - 3 - - 1 13 2 21-25 12 11 - - - 1 - - - 9 3 26-30 21 19 - - - 2 - - 1 14 6 31-35 10 10 - - - - - - - 7 3 36-40 8 5 - - - 3 - - - 5 3 41-45 19 18 - - - 1 - - 2 14 3 46-50 10 10 - - - - - - - 10 - 51-60 19 19 - - - - - - - 12 7 61-70 28 25 - 1 - 2 - - 1 19 8 71-80 24 24 - - - - - - 2 20 2 81-90 24 22 - 1 - 1 - - - 20 4 91-100 19 19 - - - - - - 2 11 6 > 100 68 66 - - 2 - - - 1 49 18 Total 449 320 20 2 19 43 33 12 10 319 120
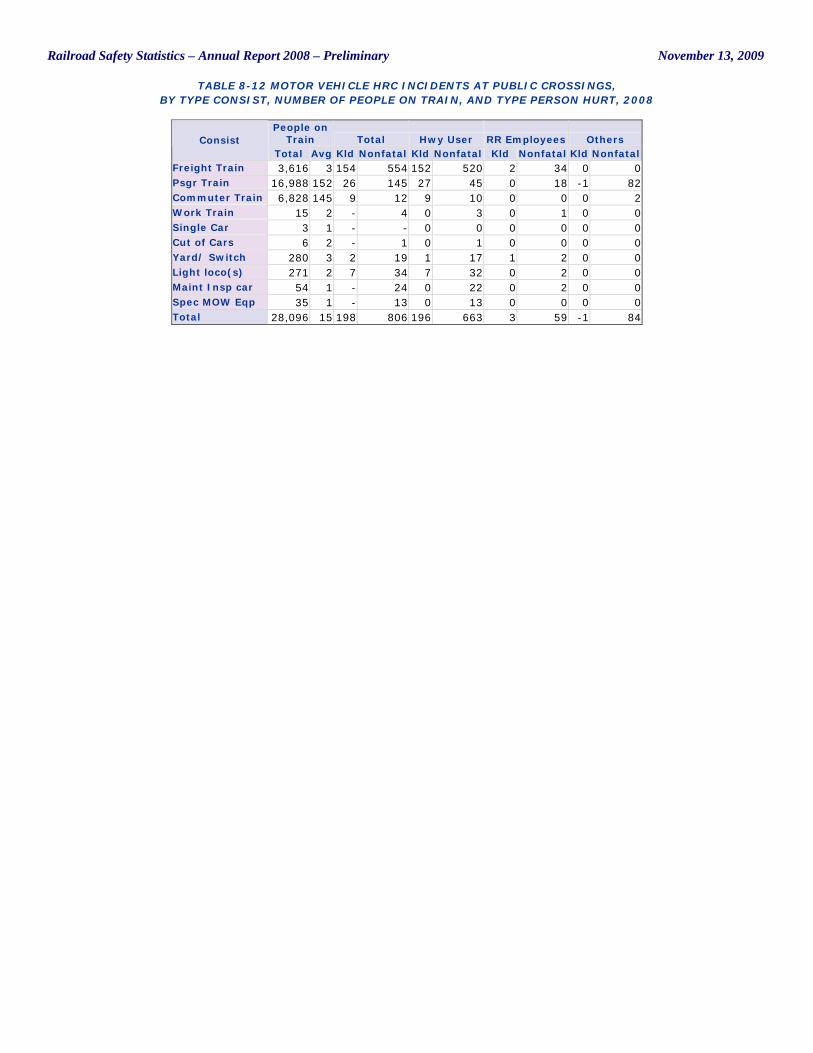
Railroad Safety Statistics – Annual Report 2008 – Preliminary November 13, 2009
TABLE 8-12 MOTOR VEHICLE HRC INCIDENTS AT PUBLIC CROSSINGS, BY TYPE CONSIST, NUMBER OF PEOPLE ON TRAIN, AND TYPE PERSON HURT, 2008
People on Train Total Hwy User RR Employees Others Consist
Total Avg Kld Nonfatal Kld Nonfatal Kld Nonfatal Kld Nonfatal Freight Train 3,616 3 154 554 152 520 2 34 0 0 Psgr Train 16,988 152 26 145 27 45 0 18 -1 82 Commuter Train 6,828 145 9 12 9 10 0 0 0 2 Work Train 15 2 - 4 0 3 0 1 0 0 Single Car 3 1 - - 0 0 0 0 0 0 Cut of Cars 6 2 - 1 0 1 0 0 0 0 Yard/ Switch 280 3 2 19 1 17 1 2 0 0 Light loco(s) 271 2 7 34 7 32 0 2 0 0 Maint Insp car 54 1 - 24 0 22 0 2 0 0 Spec MOW Eqp 35 1 - 13 0 13 0 0 0 0 Total 28,096 15 198 806 196 663 3 59 -1 84
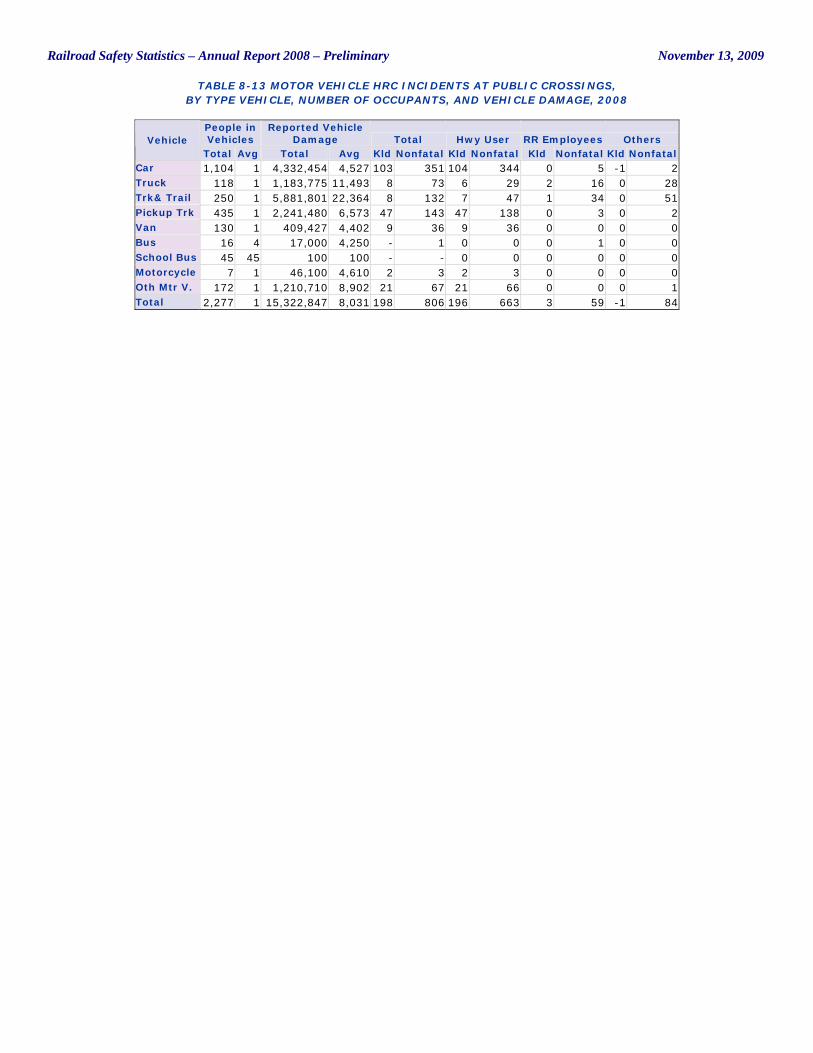
Railroad Safety Statistics – Annual Report 2008 – Preliminary November 13, 2009
TABLE 8-13 MOTOR VEHICLE HRC INCIDENTS AT PUBLIC CROSSINGS, BY TYPE VEHICLE, NUMBER OF OCCUPANTS, AND VEHICLE DAMAGE, 2008
People in Vehicles
Reported Vehicle Damage Total Hwy User RR Employees Others Vehicle
Total Avg Total Avg Kld Nonfatal Kld Nonfatal Kld Nonfatal Kld Nonfatal Car 1,104 1 4,332,454 4,527 103 351 104 344 0 5 -1 2 Truck 118 1 1,183,775 11,493 8 73 6 29 2 16 0 28 Trk& Trail 250 1 5,881,801 22,364 8 132 7 47 1 34 0 51 Pickup Trk 435 1 2,241,480 6,573 47 143 47 138 0 3 0 2 Van 130 1 409,427 4,402 9 36 9 36 0 0 0 0 Bus 16 4 17,000 4,250 - 1 0 0 0 1 0 0 School Bus 45 45 100 100 - - 0 0 0 0 0 0 Motorcycle 7 1 46,100 4,610 2 3 2 3 0 0 0 0 Oth Mtr V. 172 1 1,210,710 8,902 21 67 21 66 0 0 0 1 Total 2,277 1 15,322,847 8,031 198 806 196 663 3 59 -1 84
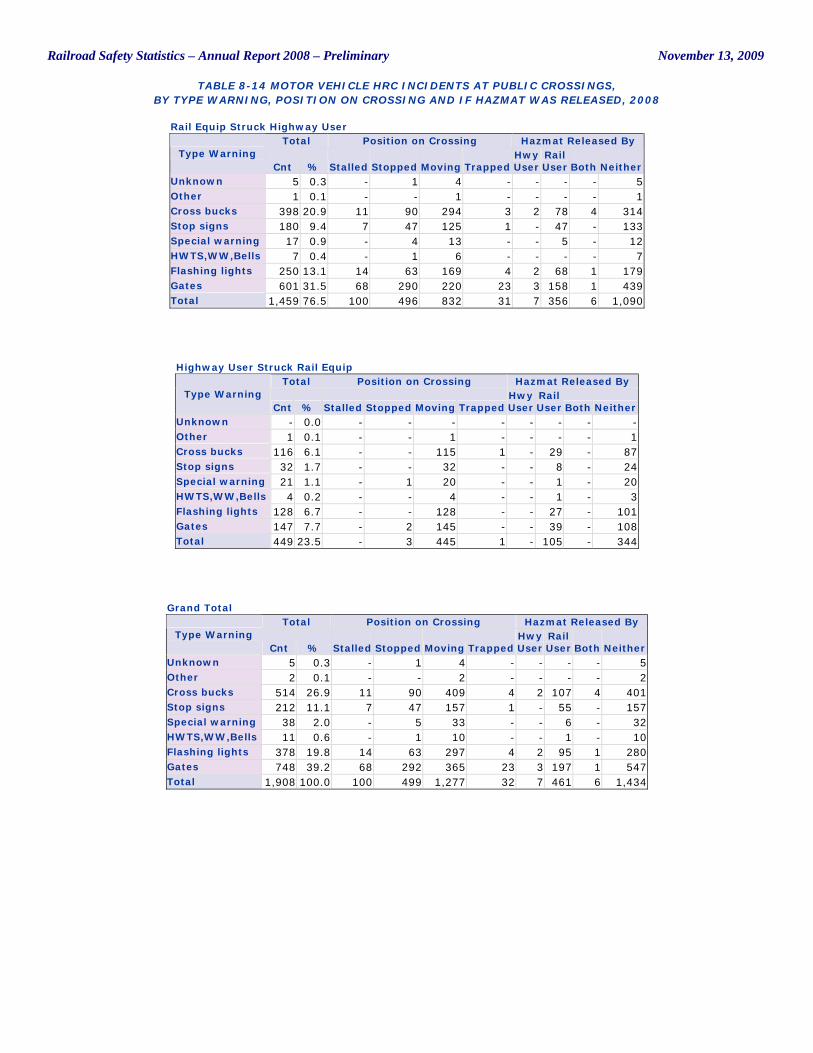
Railroad Safety Statistics – Annual Report 2008 – Preliminary November 13, 2009
TABLE 8-14 MOTOR VEHICLE HRC INCIDENTS AT PUBLIC CROSSINGS, BY TYPE WARNING, POSITION ON CROSSING AND IF HAZMAT WAS RELEASED, 2008
Rail Equip Struck Highway User Total Position on Crossing Hazmat Released By
Type Warning Cnt % Stalled Stopped Moving Trapped
Hwy User
Rail User Both Neither
Unknown 5 0.3 - 1 4 - - - - 5 Other 1 0.1 - - 1 - - - - 1 Cross bucks 398 20.9 11 90 294 3 2 78 4 314 Stop signs 180 9.4 7 47 125 1 - 47 - 133 Special warning 17 0.9 - 4 13 - - 5 - 12 HWTS,WW,Bells 7 0.4 - 1 6 - - - - 7 Flashing lights 250 13.1 14 63 169 4 2 68 1 179 Gates 601 31.5 68 290 220 23 3 158 1 439 Total 1,459 76.5 100 496 832 31 7 356 6 1,090
Highway User Struck Rail Equip Total Position on Crossing Hazmat Released By
Type Warning Cnt % Stalled Stopped Moving Trapped
Hwy User
Rail User Both Neither
Unknown - 0.0 - - - - - - - - Other 1 0.1 - - 1 - - - - 1 Cross bucks 116 6.1 - - 115 1 - 29 - 87 Stop signs 32 1.7 - - 32 - - 8 - 24 Special warning 21 1.1 - 1 20 - - 1 - 20 HWTS,WW,Bells 4 0.2 - - 4 - - 1 - 3 Flashing lights 128 6.7 - - 128 - - 27 - 101 Gates 147 7.7 - 2 145 - - 39 - 108 Total 449 23.5 - 3 445 1 - 105 - 344
Grand Total Total Position on Crossing Hazmat Released By
Type Warning Cnt % Stalled Stopped Moving Trapped
Hwy User
Rail User Both Neither
Unknown 5 0.3 - 1 4 - - - - 5 Other 2 0.1 - - 2 - - - - 2 Cross bucks 514 26.9 11 90 409 4 2 107 4 401 Stop signs 212 11.1 7 47 157 1 - 55 - 157 Special warning 38 2.0 - 5 33 - - 6 - 32 HWTS,WW,Bells 11 0.6 - 1 10 - - 1 - 10 Flashing lights 378 19.8 14 63 297 4 2 95 1 280 Gates 748 39.2 68 292 365 23 3 197 1 547 Total 1,908 100.0 100 499 1,277 32 7 461 6 1,434
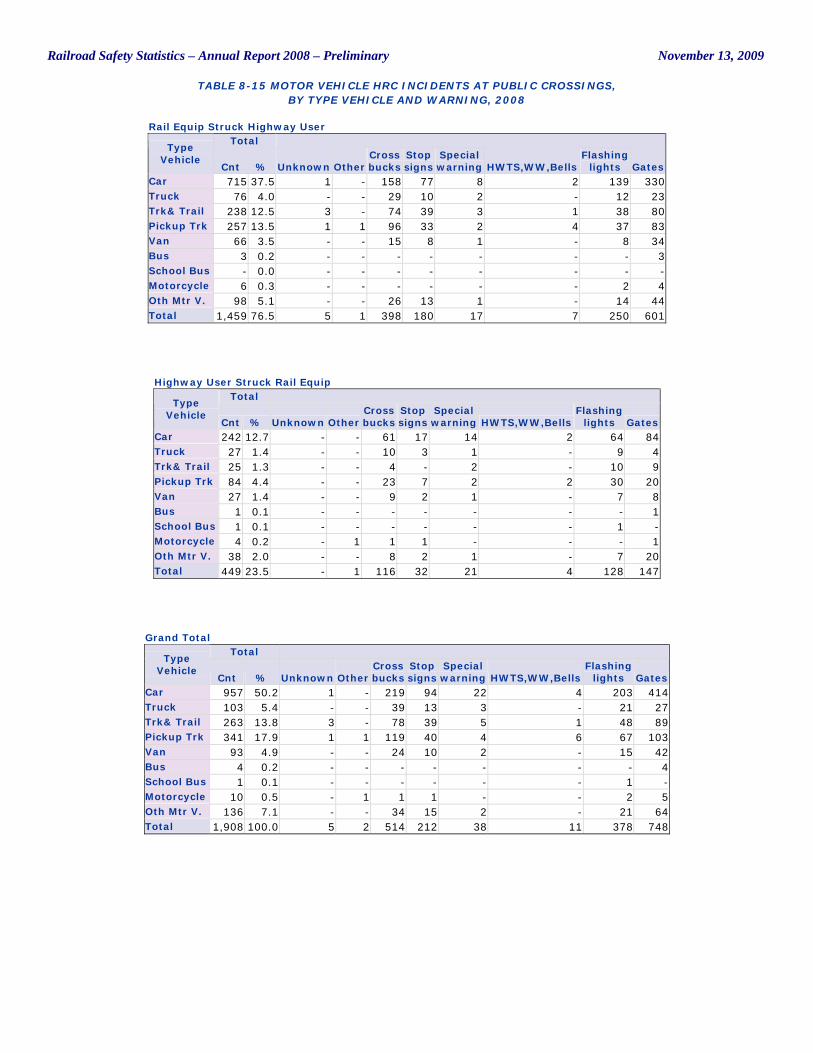
Railroad Safety Statistics – Annual Report 2008 – Preliminary November 13, 2009
TABLE 8-15 MOTOR VEHICLE HRC INCIDENTS AT PUBLIC CROSSINGS, BY TYPE VEHICLE AND WARNING, 2008
Rail Equip Struck Highway User Total
Type Vehicle
Cnt % Unknown Other Cross bucks
Stop signs
Special warning HWTS,WW,Bells
Flashing lights Gates
Car 715 37.5 1 - 158 77 8 2 139 330 Truck 76 4.0 - - 29 10 2 - 12 23 Trk& Trail 238 12.5 3 - 74 39 3 1 38 80 Pickup Trk 257 13.5 1 1 96 33 2 4 37 83 Van 66 3.5 - - 15 8 1 - 8 34 Bus 3 0.2 - - - - - - - 3 School Bus - 0.0 - - - - - - - - Motorcycle 6 0.3 - - - - - - 2 4 Oth Mtr V. 98 5.1 - - 26 13 1 - 14 44 Total 1,459 76.5 5 1 398 180 17 7 250 601
Highway User Struck Rail Equip Total
Type Vehicle
Cnt % Unknown Other Cross bucks
Stop signs
Special warning HWTS,WW,Bells
Flashing lights Gates
Car 242 12.7 - - 61 17 14 2 64 84 Truck 27 1.4 - - 10 3 1 - 9 4 Trk& Trail 25 1.3 - - 4 - 2 - 10 9 Pickup Trk 84 4.4 - - 23 7 2 2 30 20 Van 27 1.4 - - 9 2 1 - 7 8 Bus 1 0.1 - - - - - - - 1 School Bus 1 0.1 - - - - - - 1 - Motorcycle 4 0.2 - 1 1 1 - - - 1 Oth Mtr V. 38 2.0 - - 8 2 1 - 7 20 Total 449 23.5 - 1 116 32 21 4 128 147
Grand Total Total
Type Vehicle
Cnt % Unknown Other Cross bucks
Stop signs
Special warning HWTS,WW,Bells
Flashing lights Gates
Car 957 50.2 1 - 219 94 22 4 203 414 Truck 103 5.4 - - 39 13 3 - 21 27 Trk& Trail 263 13.8 3 - 78 39 5 1 48 89 Pickup Trk 341 17.9 1 1 119 40 4 6 67 103 Van 93 4.9 - - 24 10 2 - 15 42 Bus 4 0.2 - - - - - - - 4 School Bus 1 0.1 - - - - - - 1 - Motorcycle 10 0.5 - 1 1 1 - - 2 5 Oth Mtr V. 136 7.1 - - 34 15 2 - 21 64 Total 1,908 100.0 5 2 514 212 38 11 378 748
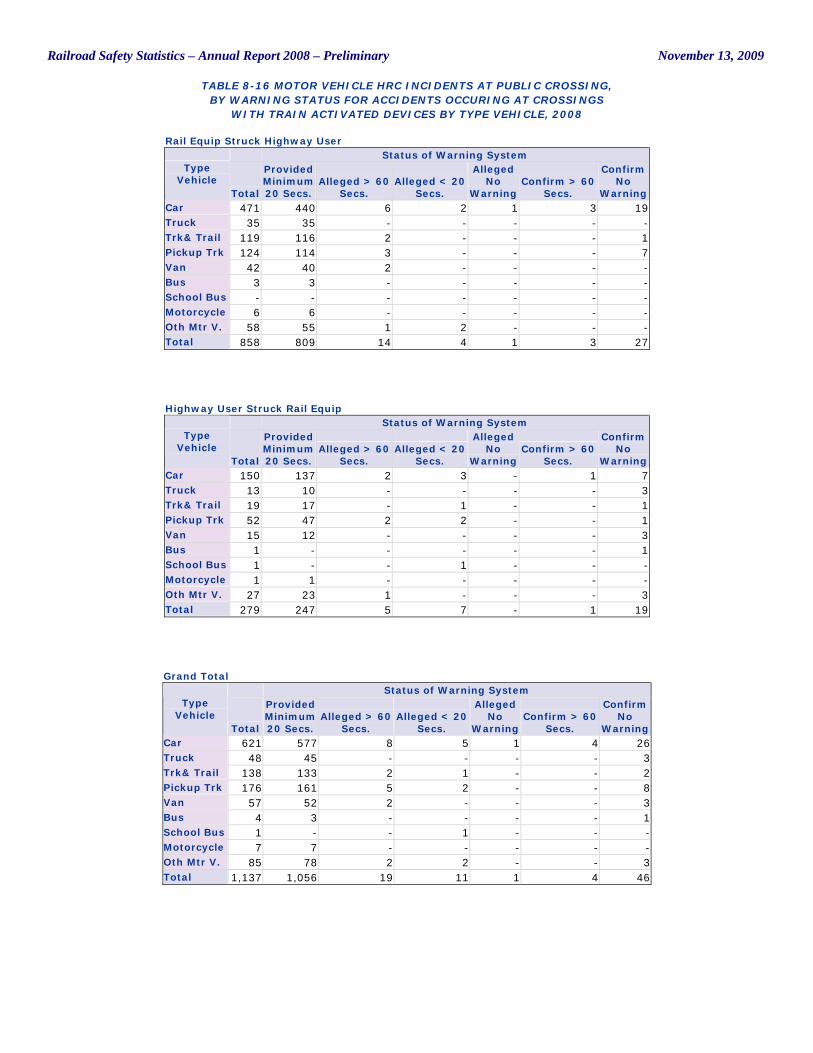
Railroad Safety Statistics – Annual Report 2008 – Preliminary November 13, 2009
TABLE 8-16 MOTOR VEHICLE HRC INCIDENTS AT PUBLIC CROSSING, BY WARNING STATUS FOR ACCIDENTS OCCURING AT CROSSINGS
WITH TRAIN ACTIVATED DEVICES BY TYPE VEHICLE, 2008
Rail Equip Struck Highway User Status of Warning System
Type Vehicle
Total
Provided Minimum 20 Secs.
Alleged > 60 Secs.
Alleged < 20 Secs.
Alleged No
Warning Confirm > 60
Secs.
Confirm No
Warning Car 471 440 6 2 1 3 19 Truck 35 35 - - - - - Trk& Trail 119 116 2 - - - 1 Pickup Trk 124 114 3 - - - 7 Van 42 40 2 - - - - Bus 3 3 - - - - - School Bus - - - - - - - Motorcycle 6 6 - - - - - Oth Mtr V. 58 55 1 2 - - - Total 858 809 14 4 1 3 27
Highway User Struck Rail Equip Status of Warning System
Type Vehicle
Total
Provided Minimum 20 Secs.
Alleged > 60 Secs.
Alleged < 20 Secs.
Alleged No
Warning Confirm > 60
Secs.
Confirm No
Warning Car 150 137 2 3 - 1 7 Truck 13 10 - - - - 3 Trk& Trail 19 17 - 1 - - 1 Pickup Trk 52 47 2 2 - - 1 Van 15 12 - - - - 3 Bus 1 - - - - - 1 School Bus 1 - - 1 - - - Motorcycle 1 1 - - - - - Oth Mtr V. 27 23 1 - - - 3 Total 279 247 5 7 - 1 19
Grand Total Status of Warning System
Type Vehicle
Total
Provided Minimum 20 Secs.
Alleged > 60 Secs.
Alleged < 20 Secs.
Alleged No
Warning Confirm > 60
Secs.
Confirm No
Warning Car 621 577 8 5 1 4 26 Truck 48 45 - - - - 3 Trk& Trail 138 133 2 1 - - 2 Pickup Trk 176 161 5 2 - - 8 Van 57 52 2 - - - 3 Bus 4 3 - - - - 1 School Bus 1 - - 1 - - - Motorcycle 7 7 - - - - - Oth Mtr V. 85 78 2 2 - - 3 Total 1,137 1,056 19 11 1 4 46
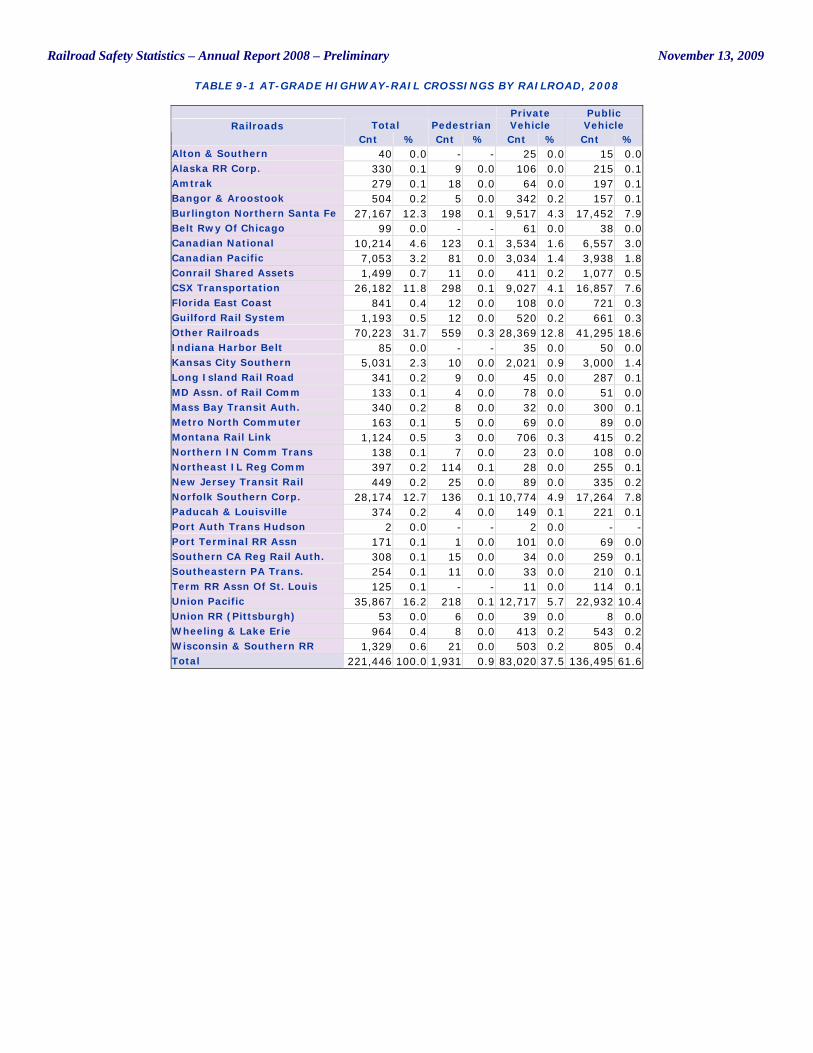
Railroad Safety Statistics – Annual Report 2008 – Preliminary November 13, 2009
TABLE 9-1 AT-GRADE HIGHWAY-RAIL CROSSINGS BY RAILROAD, 2008
Total Pedestrian Private Vehicle
Public Vehicle Railroads
Cnt % Cnt % Cnt % Cnt % Alton & Southern 40 0.0 - - 25 0.0 15 0.0 Alaska RR Corp. 330 0.1 9 0.0 106 0.0 215 0.1 Amtrak 279 0.1 18 0.0 64 0.0 197 0.1 Bangor & Aroostook 504 0.2 5 0.0 342 0.2 157 0.1 Burlington Northern Santa Fe 27,167 12.3 198 0.1 9,517 4.3 17,452 7.9 Belt Rwy Of Chicago 99 0.0 - - 61 0.0 38 0.0 Canadian National 10,214 4.6 123 0.1 3,534 1.6 6,557 3.0 Canadian Pacific 7,053 3.2 81 0.0 3,034 1.4 3,938 1.8 Conrail Shared Assets 1,499 0.7 11 0.0 411 0.2 1,077 0.5 CSX Transportation 26,182 11.8 298 0.1 9,027 4.1 16,857 7.6 Florida East Coast 841 0.4 12 0.0 108 0.0 721 0.3 Guilford Rail System 1,193 0.5 12 0.0 520 0.2 661 0.3 Other Railroads 70,223 31.7 559 0.3 28,369 12.8 41,295 18.6 Indiana Harbor Belt 85 0.0 - - 35 0.0 50 0.0 Kansas City Southern 5,031 2.3 10 0.0 2,021 0.9 3,000 1.4 Long Island Rail Road 341 0.2 9 0.0 45 0.0 287 0.1 MD Assn. of Rail Comm 133 0.1 4 0.0 78 0.0 51 0.0 Mass Bay Transit Auth. 340 0.2 8 0.0 32 0.0 300 0.1 Metro North Commuter 163 0.1 5 0.0 69 0.0 89 0.0 Montana Rail Link 1,124 0.5 3 0.0 706 0.3 415 0.2 Northern IN Comm Trans 138 0.1 7 0.0 23 0.0 108 0.0 Northeast IL Reg Comm 397 0.2 114 0.1 28 0.0 255 0.1 New Jersey Transit Rail 449 0.2 25 0.0 89 0.0 335 0.2 Norfolk Southern Corp. 28,174 12.7 136 0.1 10,774 4.9 17,264 7.8 Paducah & Louisville 374 0.2 4 0.0 149 0.1 221 0.1 Port Auth Trans Hudson 2 0.0 - - 2 0.0 - - Port Terminal RR Assn 171 0.1 1 0.0 101 0.0 69 0.0 Southern CA Reg Rail Auth. 308 0.1 15 0.0 34 0.0 259 0.1 Southeastern PA Trans. 254 0.1 11 0.0 33 0.0 210 0.1 Term RR Assn Of St. Louis 125 0.1 - - 11 0.0 114 0.1 Union Pacific 35,867 16.2 218 0.1 12,717 5.7 22,932 10.4 Union RR (Pittsburgh) 53 0.0 6 0.0 39 0.0 8 0.0 Wheeling & Lake Erie 964 0.4 8 0.0 413 0.2 543 0.2 Wisconsin & Southern RR 1,329 0.6 21 0.0 503 0.2 805 0.4 Total 221,446 100.0 1,931 0.9 83,020 37.5 136,495 61.6
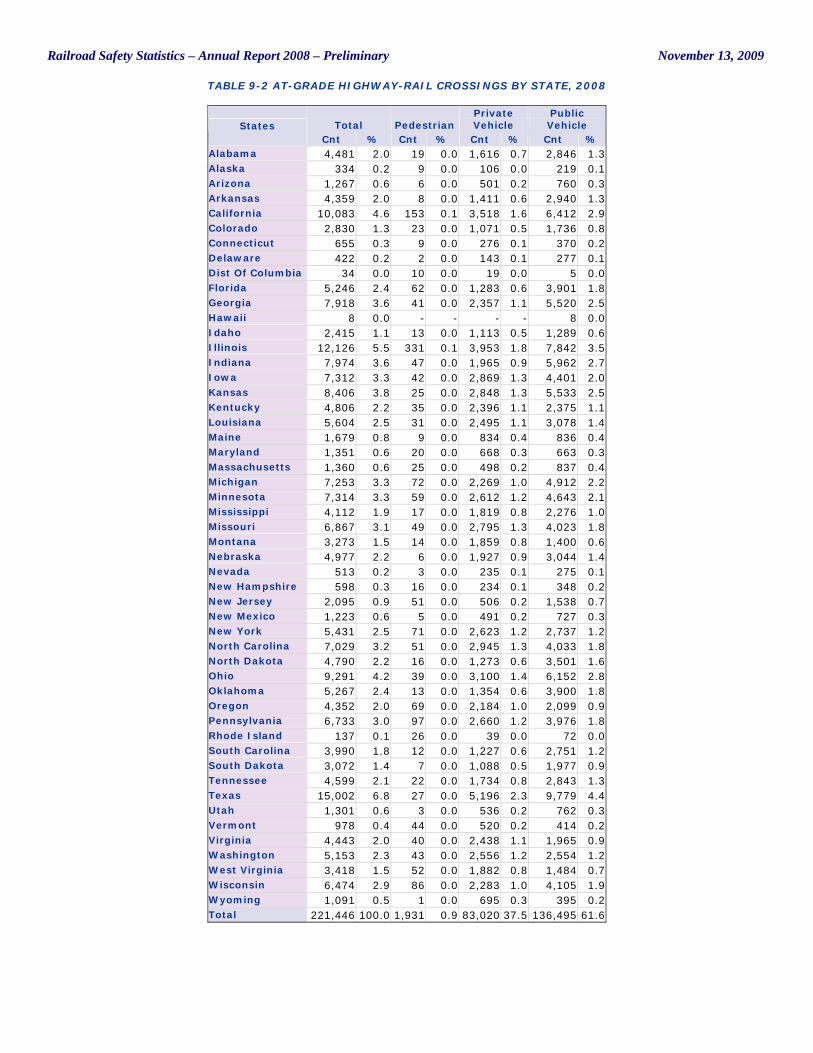
Railroad Safety Statistics – Annual Report 2008 – Preliminary November 13, 2009
TABLE 9-2 AT-GRADE HIGHWAY-RAIL CROSSINGS BY STATE, 2008
Total Pedestrian Private Vehicle
Public Vehicle States
Cnt % Cnt % Cnt % Cnt % Alabama 4,481 2.0 19 0.0 1,616 0.7 2,846 1.3 Alaska 334 0.2 9 0.0 106 0.0 219 0.1 Arizona 1,267 0.6 6 0.0 501 0.2 760 0.3 Arkansas 4,359 2.0 8 0.0 1,411 0.6 2,940 1.3 California 10,083 4.6 153 0.1 3,518 1.6 6,412 2.9 Colorado 2,830 1.3 23 0.0 1,071 0.5 1,736 0.8 Connecticut 655 0.3 9 0.0 276 0.1 370 0.2 Delaware 422 0.2 2 0.0 143 0.1 277 0.1 Dist Of Columbia 34 0.0 10 0.0 19 0.0 5 0.0 Florida 5,246 2.4 62 0.0 1,283 0.6 3,901 1.8 Georgia 7,918 3.6 41 0.0 2,357 1.1 5,520 2.5 Hawaii 8 0.0 - - - - 8 0.0 Idaho 2,415 1.1 13 0.0 1,113 0.5 1,289 0.6 Illinois 12,126 5.5 331 0.1 3,953 1.8 7,842 3.5 Indiana 7,974 3.6 47 0.0 1,965 0.9 5,962 2.7 Iowa 7,312 3.3 42 0.0 2,869 1.3 4,401 2.0 Kansas 8,406 3.8 25 0.0 2,848 1.3 5,533 2.5 Kentucky 4,806 2.2 35 0.0 2,396 1.1 2,375 1.1 Louisiana 5,604 2.5 31 0.0 2,495 1.1 3,078 1.4 Maine 1,679 0.8 9 0.0 834 0.4 836 0.4 Maryland 1,351 0.6 20 0.0 668 0.3 663 0.3 Massachusetts 1,360 0.6 25 0.0 498 0.2 837 0.4 Michigan 7,253 3.3 72 0.0 2,269 1.0 4,912 2.2 Minnesota 7,314 3.3 59 0.0 2,612 1.2 4,643 2.1 Mississippi 4,112 1.9 17 0.0 1,819 0.8 2,276 1.0 Missouri 6,867 3.1 49 0.0 2,795 1.3 4,023 1.8 Montana 3,273 1.5 14 0.0 1,859 0.8 1,400 0.6 Nebraska 4,977 2.2 6 0.0 1,927 0.9 3,044 1.4 Nevada 513 0.2 3 0.0 235 0.1 275 0.1 New Hampshire 598 0.3 16 0.0 234 0.1 348 0.2 New Jersey 2,095 0.9 51 0.0 506 0.2 1,538 0.7 New Mexico 1,223 0.6 5 0.0 491 0.2 727 0.3 New York 5,431 2.5 71 0.0 2,623 1.2 2,737 1.2 North Carolina 7,029 3.2 51 0.0 2,945 1.3 4,033 1.8 North Dakota 4,790 2.2 16 0.0 1,273 0.6 3,501 1.6 Ohio 9,291 4.2 39 0.0 3,100 1.4 6,152 2.8 Oklahoma 5,267 2.4 13 0.0 1,354 0.6 3,900 1.8 Oregon 4,352 2.0 69 0.0 2,184 1.0 2,099 0.9 Pennsylvania 6,733 3.0 97 0.0 2,660 1.2 3,976 1.8 Rhode Island 137 0.1 26 0.0 39 0.0 72 0.0 South Carolina 3,990 1.8 12 0.0 1,227 0.6 2,751 1.2 South Dakota 3,072 1.4 7 0.0 1,088 0.5 1,977 0.9 Tennessee 4,599 2.1 22 0.0 1,734 0.8 2,843 1.3 Texas 15,002 6.8 27 0.0 5,196 2.3 9,779 4.4 Utah 1,301 0.6 3 0.0 536 0.2 762 0.3 Vermont 978 0.4 44 0.0 520 0.2 414 0.2 Virginia 4,443 2.0 40 0.0 2,438 1.1 1,965 0.9 Washington 5,153 2.3 43 0.0 2,556 1.2 2,554 1.2 West Virginia 3,418 1.5 52 0.0 1,882 0.8 1,484 0.7 Wisconsin 6,474 2.9 86 0.0 2,283 1.0 4,105 1.9 Wyoming 1,091 0.5 1 0.0 695 0.3 395 0.2 Total 221,446 100.0 1,931 0.9 83,020 37.5 136,495 61.6
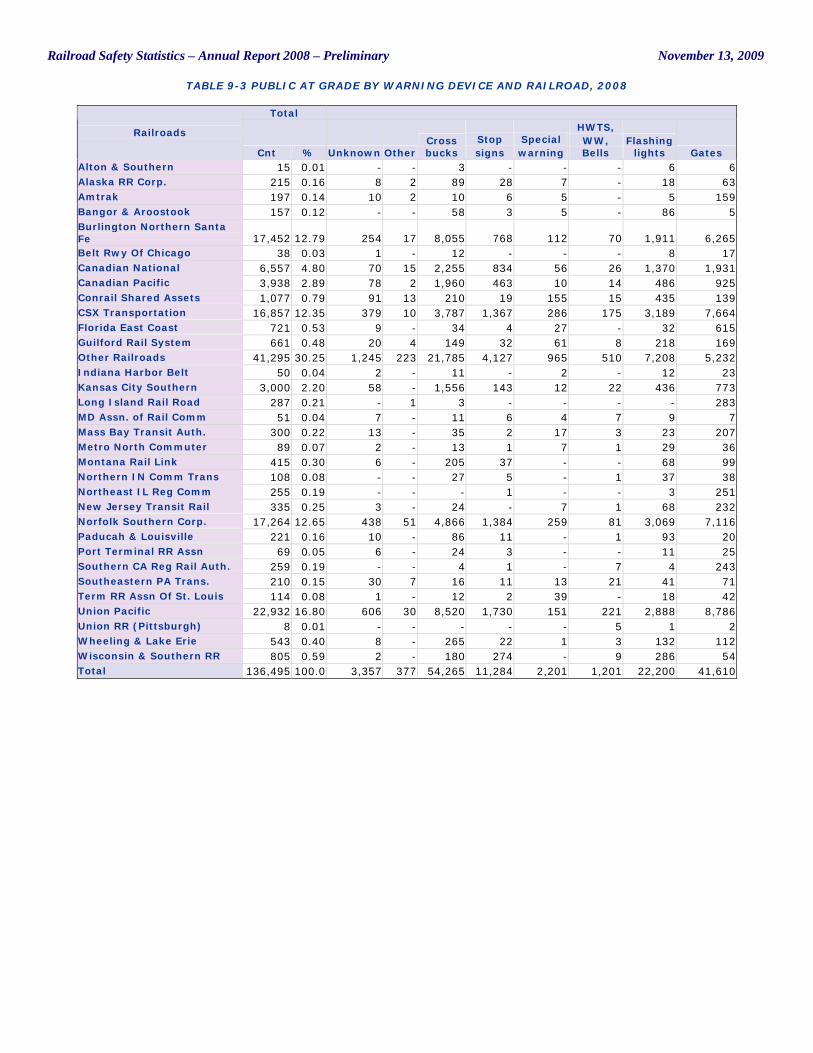
Railroad Safety Statistics – Annual Report 2008 – Preliminary November 13, 2009
TABLE 9-3 PUBLIC AT GRADE BY WARNING DEVICE AND RAILROAD, 2008
Total
Railroads
Cnt % Unknown Other Cross bucks
Stop signs
Special warning
HWTS, WW, Bells
Flashing lights Gates
Alton & Southern 15 0.01 - - 3 - - - 6 6 Alaska RR Corp. 215 0.16 8 2 89 28 7 - 18 63 Amtrak 197 0.14 10 2 10 6 5 - 5 159 Bangor & Aroostook 157 0.12 - - 58 3 5 - 86 5 Burlington Northern Santa Fe 17,452 12.79 254 17 8,055 768 112 70 1,911 6,265 Belt Rwy Of Chicago 38 0.03 1 - 12 - - - 8 17 Canadian National 6,557 4.80 70 15 2,255 834 56 26 1,370 1,931 Canadian Pacific 3,938 2.89 78 2 1,960 463 10 14 486 925 Conrail Shared Assets 1,077 0.79 91 13 210 19 155 15 435 139 CSX Transportation 16,857 12.35 379 10 3,787 1,367 286 175 3,189 7,664 Florida East Coast 721 0.53 9 - 34 4 27 - 32 615 Guilford Rail System 661 0.48 20 4 149 32 61 8 218 169 Other Railroads 41,295 30.25 1,245 223 21,785 4,127 965 510 7,208 5,232 Indiana Harbor Belt 50 0.04 2 - 11 - 2 - 12 23 Kansas City Southern 3,000 2.20 58 - 1,556 143 12 22 436 773 Long Island Rail Road 287 0.21 - 1 3 - - - - 283 MD Assn. of Rail Comm 51 0.04 7 - 11 6 4 7 9 7 Mass Bay Transit Auth. 300 0.22 13 - 35 2 17 3 23 207 Metro North Commuter 89 0.07 2 - 13 1 7 1 29 36 Montana Rail Link 415 0.30 6 - 205 37 - - 68 99 Northern IN Comm Trans 108 0.08 - - 27 5 - 1 37 38 Northeast IL Reg Comm 255 0.19 - - - 1 - - 3 251 New Jersey Transit Rail 335 0.25 3 - 24 - 7 1 68 232 Norfolk Southern Corp. 17,264 12.65 438 51 4,866 1,384 259 81 3,069 7,116 Paducah & Louisville 221 0.16 10 - 86 11 - 1 93 20 Port Terminal RR Assn 69 0.05 6 - 24 3 - - 11 25 Southern CA Reg Rail Auth. 259 0.19 - - 4 1 - 7 4 243 Southeastern PA Trans. 210 0.15 30 7 16 11 13 21 41 71 Term RR Assn Of St. Louis 114 0.08 1 - 12 2 39 - 18 42 Union Pacific 22,932 16.80 606 30 8,520 1,730 151 221 2,888 8,786 Union RR (Pittsburgh) 8 0.01 - - - - - 5 1 2 Wheeling & Lake Erie 543 0.40 8 - 265 22 1 3 132 112 Wisconsin & Southern RR 805 0.59 2 - 180 274 - 9 286 54 Total 136,495 100.0 3,357 377 54,265 11,284 2,201 1,201 22,200 41,610
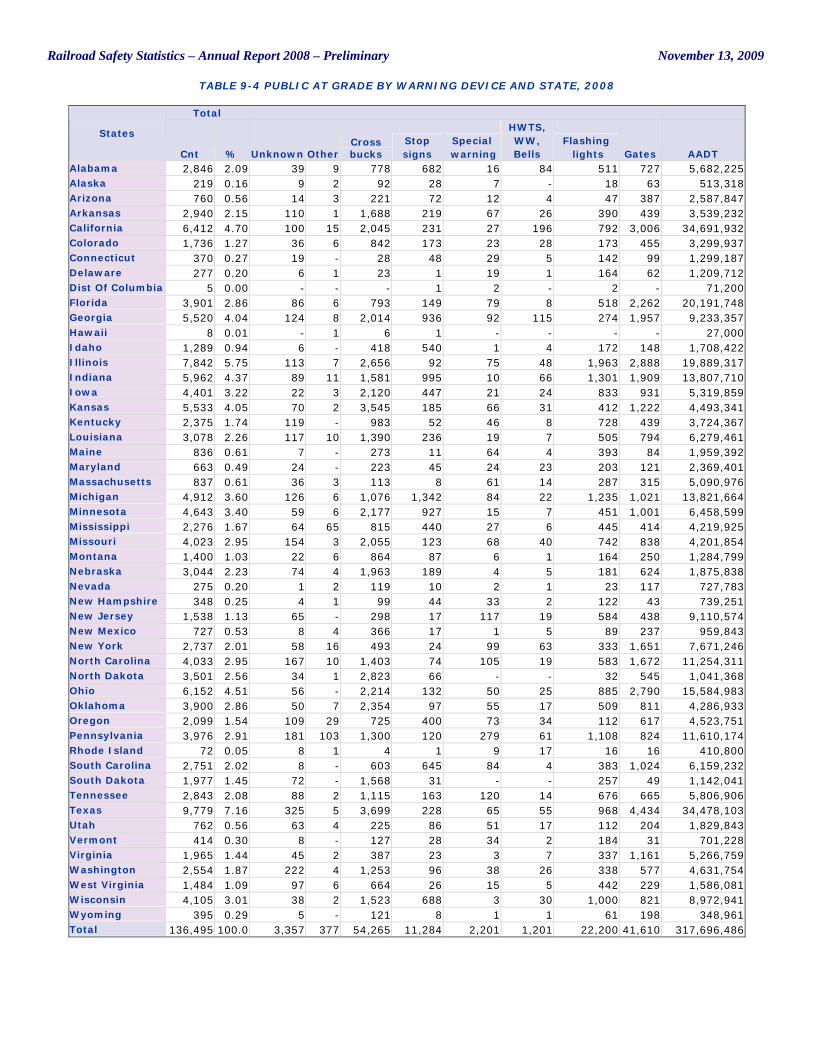
Railroad Safety Statistics – Annual Report 2008 – Preliminary November 13, 2009
TABLE 9-4 PUBLIC AT GRADE BY WARNING DEVICE AND STATE, 2008
Total
States
Cnt % Unknown Other Cross bucks
Stop signs
Special warning
HWTS, WW, Bells
Flashing lights Gates AADT
Alabama 2,846 2.09 39 9 778 682 16 84 511 727 5,682,225 Alaska 219 0.16 9 2 92 28 7 - 18 63 513,318 Arizona 760 0.56 14 3 221 72 12 4 47 387 2,587,847 Arkansas 2,940 2.15 110 1 1,688 219 67 26 390 439 3,539,232 California 6,412 4.70 100 15 2,045 231 27 196 792 3,006 34,691,932 Colorado 1,736 1.27 36 6 842 173 23 28 173 455 3,299,937 Connecticut 370 0.27 19 - 28 48 29 5 142 99 1,299,187 Delaware 277 0.20 6 1 23 1 19 1 164 62 1,209,712 Dist Of Columbia 5 0.00 - - - 1 2 - 2 - 71,200 Florida 3,901 2.86 86 6 793 149 79 8 518 2,262 20,191,748 Georgia 5,520 4.04 124 8 2,014 936 92 115 274 1,957 9,233,357 Hawaii 8 0.01 - 1 6 1 - - - - 27,000 Idaho 1,289 0.94 6 - 418 540 1 4 172 148 1,708,422 Illinois 7,842 5.75 113 7 2,656 92 75 48 1,963 2,888 19,889,317 Indiana 5,962 4.37 89 11 1,581 995 10 66 1,301 1,909 13,807,710 Iowa 4,401 3.22 22 3 2,120 447 21 24 833 931 5,319,859 Kansas 5,533 4.05 70 2 3,545 185 66 31 412 1,222 4,493,341 Kentucky 2,375 1.74 119 - 983 52 46 8 728 439 3,724,367 Louisiana 3,078 2.26 117 10 1,390 236 19 7 505 794 6,279,461 Maine 836 0.61 7 - 273 11 64 4 393 84 1,959,392 Maryland 663 0.49 24 - 223 45 24 23 203 121 2,369,401 Massachusetts 837 0.61 36 3 113 8 61 14 287 315 5,090,976 Michigan 4,912 3.60 126 6 1,076 1,342 84 22 1,235 1,021 13,821,664 Minnesota 4,643 3.40 59 6 2,177 927 15 7 451 1,001 6,458,599 Mississippi 2,276 1.67 64 65 815 440 27 6 445 414 4,219,925 Missouri 4,023 2.95 154 3 2,055 123 68 40 742 838 4,201,854 Montana 1,400 1.03 22 6 864 87 6 1 164 250 1,284,799 Nebraska 3,044 2.23 74 4 1,963 189 4 5 181 624 1,875,838 Nevada 275 0.20 1 2 119 10 2 1 23 117 727,783 New Hampshire 348 0.25 4 1 99 44 33 2 122 43 739,251 New Jersey 1,538 1.13 65 - 298 17 117 19 584 438 9,110,574 New Mexico 727 0.53 8 4 366 17 1 5 89 237 959,843 New York 2,737 2.01 58 16 493 24 99 63 333 1,651 7,671,246 North Carolina 4,033 2.95 167 10 1,403 74 105 19 583 1,672 11,254,311 North Dakota 3,501 2.56 34 1 2,823 66 - - 32 545 1,041,368 Ohio 6,152 4.51 56 - 2,214 132 50 25 885 2,790 15,584,983 Oklahoma 3,900 2.86 50 7 2,354 97 55 17 509 811 4,286,933 Oregon 2,099 1.54 109 29 725 400 73 34 112 617 4,523,751 Pennsylvania 3,976 2.91 181 103 1,300 120 279 61 1,108 824 11,610,174 Rhode Island 72 0.05 8 1 4 1 9 17 16 16 410,800 South Carolina 2,751 2.02 8 - 603 645 84 4 383 1,024 6,159,232 South Dakota 1,977 1.45 72 - 1,568 31 - - 257 49 1,142,041 Tennessee 2,843 2.08 88 2 1,115 163 120 14 676 665 5,806,906 Texas 9,779 7.16 325 5 3,699 228 65 55 968 4,434 34,478,103 Utah 762 0.56 63 4 225 86 51 17 112 204 1,829,843 Vermont 414 0.30 8 - 127 28 34 2 184 31 701,228 Virginia 1,965 1.44 45 2 387 23 3 7 337 1,161 5,266,759 Washington 2,554 1.87 222 4 1,253 96 38 26 338 577 4,631,754 West Virginia 1,484 1.09 97 6 664 26 15 5 442 229 1,586,081 Wisconsin 4,105 3.01 38 2 1,523 688 3 30 1,000 821 8,972,941 Wyoming 395 0.29 5 - 121 8 1 1 61 198 348,961 Total 136,495 100.0 3,357 377 54,265 11,284 2,201 1,201 22,200 41,610 317,696,486
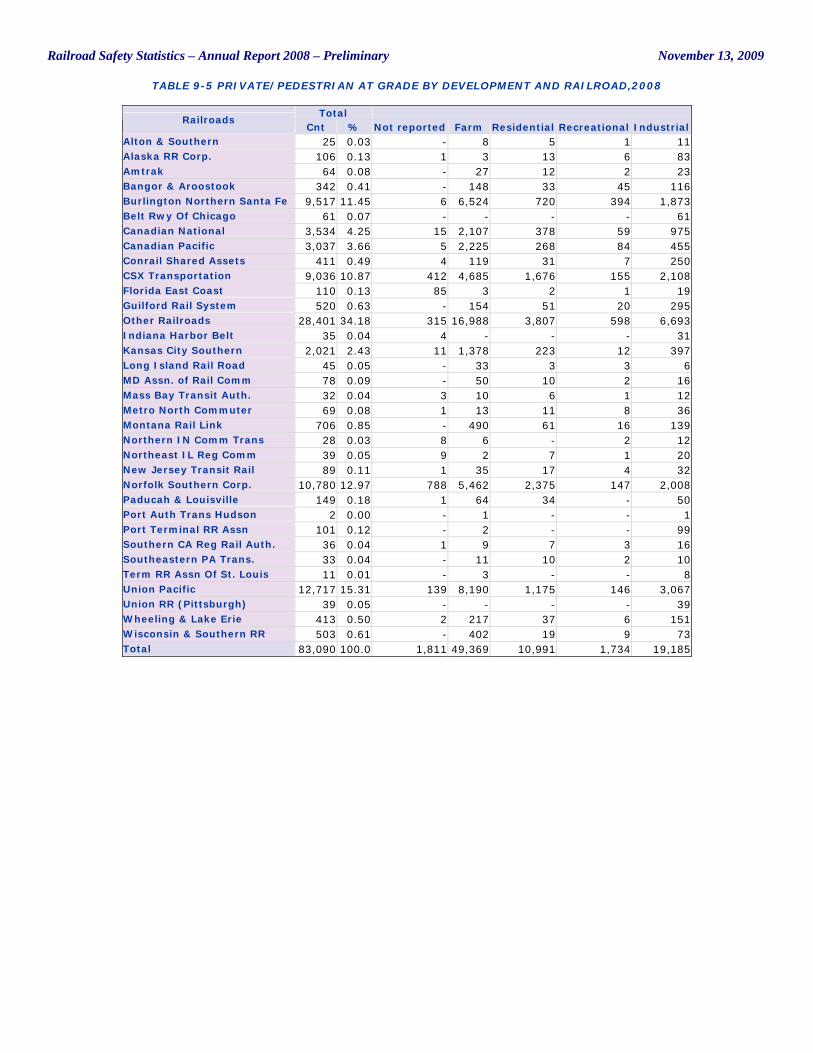
Railroad Safety Statistics – Annual Report 2008 – Preliminary November 13, 2009
TABLE 9-5 PRIVATE/PEDESTRIAN AT GRADE BY DEVELOPMENT AND RAILROAD,2008
Total Railroads
Cnt % Not reported Farm Residential Recreational Industrial Alton & Southern 25 0.03 - 8 5 1 11 Alaska RR Corp. 106 0.13 1 3 13 6 83 Amtrak 64 0.08 - 27 12 2 23 Bangor & Aroostook 342 0.41 - 148 33 45 116 Burlington Northern Santa Fe 9,517 11.45 6 6,524 720 394 1,873 Belt Rwy Of Chicago 61 0.07 - - - - 61 Canadian National 3,534 4.25 15 2,107 378 59 975 Canadian Pacific 3,037 3.66 5 2,225 268 84 455 Conrail Shared Assets 411 0.49 4 119 31 7 250 CSX Transportation 9,036 10.87 412 4,685 1,676 155 2,108 Florida East Coast 110 0.13 85 3 2 1 19 Guilford Rail System 520 0.63 - 154 51 20 295 Other Railroads 28,401 34.18 315 16,988 3,807 598 6,693 Indiana Harbor Belt 35 0.04 4 - - - 31 Kansas City Southern 2,021 2.43 11 1,378 223 12 397 Long Island Rail Road 45 0.05 - 33 3 3 6 MD Assn. of Rail Comm 78 0.09 - 50 10 2 16 Mass Bay Transit Auth. 32 0.04 3 10 6 1 12 Metro North Commuter 69 0.08 1 13 11 8 36 Montana Rail Link 706 0.85 - 490 61 16 139 Northern IN Comm Trans 28 0.03 8 6 - 2 12 Northeast IL Reg Comm 39 0.05 9 2 7 1 20 New Jersey Transit Rail 89 0.11 1 35 17 4 32 Norfolk Southern Corp. 10,780 12.97 788 5,462 2,375 147 2,008 Paducah & Louisville 149 0.18 1 64 34 - 50 Port Auth Trans Hudson 2 0.00 - 1 - - 1 Port Terminal RR Assn 101 0.12 - 2 - - 99 Southern CA Reg Rail Auth. 36 0.04 1 9 7 3 16 Southeastern PA Trans. 33 0.04 - 11 10 2 10 Term RR Assn Of St. Louis 11 0.01 - 3 - - 8 Union Pacific 12,717 15.31 139 8,190 1,175 146 3,067 Union RR (Pittsburgh) 39 0.05 - - - - 39 Wheeling & Lake Erie 413 0.50 2 217 37 6 151 Wisconsin & Southern RR 503 0.61 - 402 19 9 73 Total 83,090 100.0 1,811 49,369 10,991 1,734 19,185
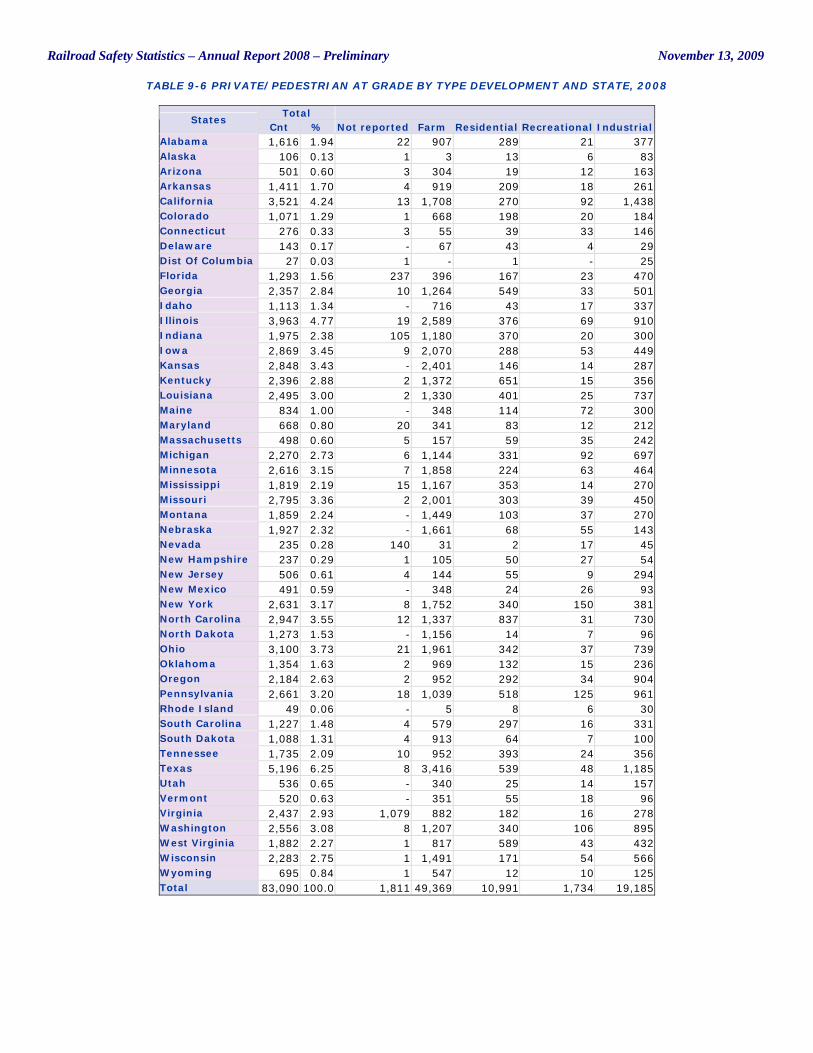
Railroad Safety Statistics – Annual Report 2008 – Preliminary November 13, 2009
TABLE 9-6 PRIVATE/PEDESTRIAN AT GRADE BY TYPE DEVELOPMENT AND STATE, 2008
Total States
Cnt % Not reported Farm Residential Recreational Industrial Alabama 1,616 1.94 22 907 289 21 377 Alaska 106 0.13 1 3 13 6 83 Arizona 501 0.60 3 304 19 12 163 Arkansas 1,411 1.70 4 919 209 18 261 California 3,521 4.24 13 1,708 270 92 1,438 Colorado 1,071 1.29 1 668 198 20 184 Connecticut 276 0.33 3 55 39 33 146 Delaware 143 0.17 - 67 43 4 29 Dist Of Columbia 27 0.03 1 - 1 - 25 Florida 1,293 1.56 237 396 167 23 470 Georgia 2,357 2.84 10 1,264 549 33 501 Idaho 1,113 1.34 - 716 43 17 337 Illinois 3,963 4.77 19 2,589 376 69 910 Indiana 1,975 2.38 105 1,180 370 20 300 Iowa 2,869 3.45 9 2,070 288 53 449 Kansas 2,848 3.43 - 2,401 146 14 287 Kentucky 2,396 2.88 2 1,372 651 15 356 Louisiana 2,495 3.00 2 1,330 401 25 737 Maine 834 1.00 - 348 114 72 300 Maryland 668 0.80 20 341 83 12 212 Massachusetts 498 0.60 5 157 59 35 242 Michigan 2,270 2.73 6 1,144 331 92 697 Minnesota 2,616 3.15 7 1,858 224 63 464 Mississippi 1,819 2.19 15 1,167 353 14 270 Missouri 2,795 3.36 2 2,001 303 39 450 Montana 1,859 2.24 - 1,449 103 37 270 Nebraska 1,927 2.32 - 1,661 68 55 143 Nevada 235 0.28 140 31 2 17 45 New Hampshire 237 0.29 1 105 50 27 54 New Jersey 506 0.61 4 144 55 9 294 New Mexico 491 0.59 - 348 24 26 93 New York 2,631 3.17 8 1,752 340 150 381 North Carolina 2,947 3.55 12 1,337 837 31 730 North Dakota 1,273 1.53 - 1,156 14 7 96 Ohio 3,100 3.73 21 1,961 342 37 739 Oklahoma 1,354 1.63 2 969 132 15 236 Oregon 2,184 2.63 2 952 292 34 904 Pennsylvania 2,661 3.20 18 1,039 518 125 961 Rhode Island 49 0.06 - 5 8 6 30 South Carolina 1,227 1.48 4 579 297 16 331 South Dakota 1,088 1.31 4 913 64 7 100 Tennessee 1,735 2.09 10 952 393 24 356 Texas 5,196 6.25 8 3,416 539 48 1,185 Utah 536 0.65 - 340 25 14 157 Vermont 520 0.63 - 351 55 18 96 Virginia 2,437 2.93 1,079 882 182 16 278 Washington 2,556 3.08 8 1,207 340 106 895 West Virginia 1,882 2.27 1 817 589 43 432 Wisconsin 2,283 2.75 1 1,491 171 54 566 Wyoming 695 0.84 1 547 12 10 125 Total 83,090 100.0 1,811 49,369 10,991 1,734 19,185
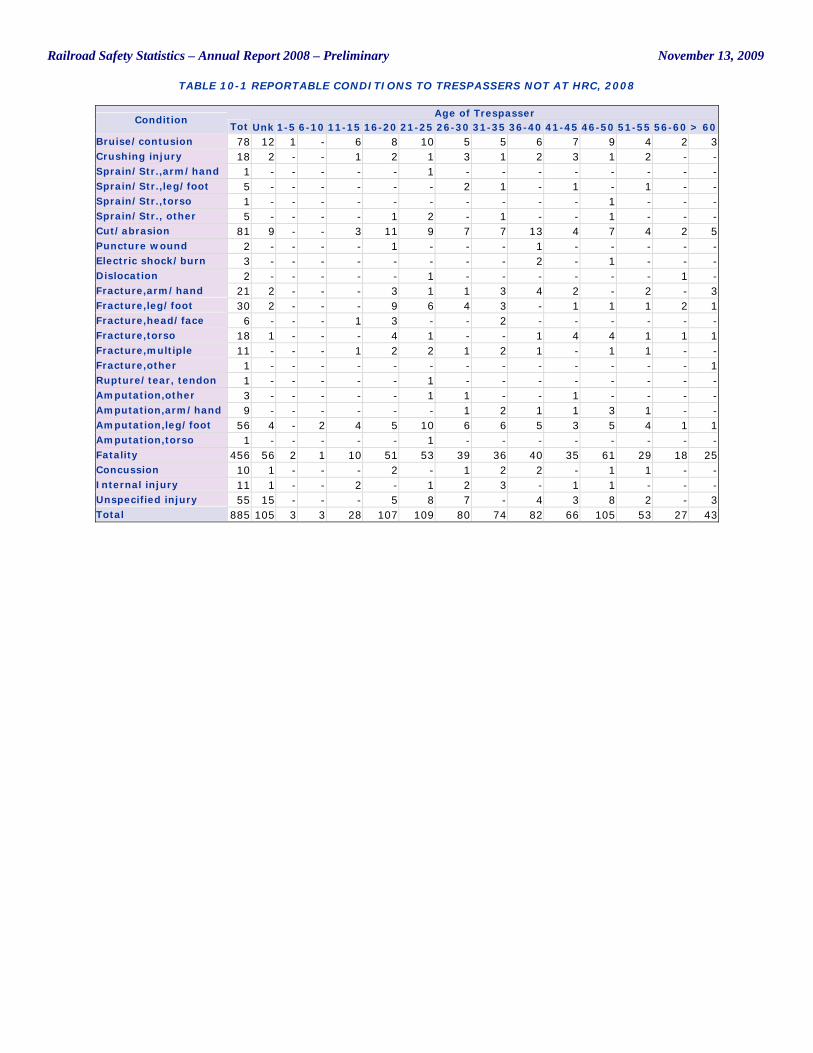
Railroad Safety Statistics – Annual Report 2008 – Preliminary November 13, 2009
TABLE 10-1 REPORTABLE CONDITIONS TO TRESPASSERS NOT AT HRC, 2008
Age of Trespasser Condition
Tot Unk 1-5 6-10 11-15 16-20 21-25 26-30 31-35 36-40 41-45 46-50 51-55 56-60 > 60 Bruise/contusion 78 12 1 - 6 8 10 5 5 6 7 9 4 2 3 Crushing injury 18 2 - - 1 2 1 3 1 2 3 1 2 - - Sprain/Str.,arm/hand 1 - - - - - 1 - - - - - - - - Sprain/Str.,leg/foot 5 - - - - - - 2 1 - 1 - 1 - - Sprain/Str.,torso 1 - - - - - - - - - - 1 - - - Sprain/Str., other 5 - - - - 1 2 - 1 - - 1 - - - Cut/abrasion 81 9 - - 3 11 9 7 7 13 4 7 4 2 5 Puncture wound 2 - - - - 1 - - - 1 - - - - - Electric shock/burn 3 - - - - - - - - 2 - 1 - - - Dislocation 2 - - - - - 1 - - - - - - 1 - Fracture,arm/hand 21 2 - - - 3 1 1 3 4 2 - 2 - 3 Fracture,leg/foot 30 2 - - - 9 6 4 3 - 1 1 1 2 1 Fracture,head/face 6 - - - 1 3 - - 2 - - - - - - Fracture,torso 18 1 - - - 4 1 - - 1 4 4 1 1 1 Fracture,multiple 11 - - - 1 2 2 1 2 1 - 1 1 - - Fracture,other 1 - - - - - - - - - - - - - 1 Rupture/tear, tendon 1 - - - - - 1 - - - - - - - - Amputation,other 3 - - - - - 1 1 - - 1 - - - - Amputation,arm/hand 9 - - - - - - 1 2 1 1 3 1 - - Amputation,leg/foot 56 4 - 2 4 5 10 6 6 5 3 5 4 1 1 Amputation,torso 1 - - - - - 1 - - - - - - - - Fatality 456 56 2 1 10 51 53 39 36 40 35 61 29 18 25 Concussion 10 1 - - - 2 - 1 2 2 - 1 1 - - Internal injury 11 1 - - 2 - 1 2 3 - 1 1 - - - Unspecified injury 55 15 - - - 5 8 7 - 4 3 8 2 - 3 Total 885 105 3 3 28 107 109 80 74 82 66 105 53 27 43
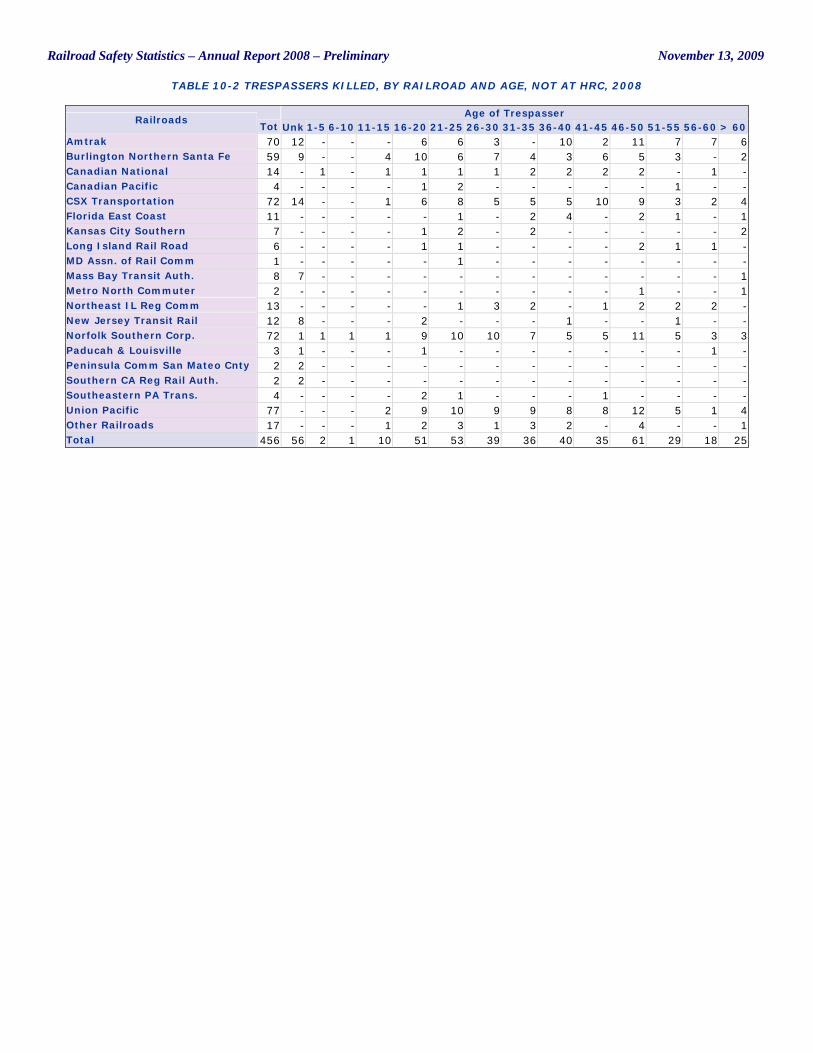
Railroad Safety Statistics – Annual Report 2008 – Preliminary November 13, 2009
TABLE 10-2 TRESPASSERS KILLED, BY RAILROAD AND AGE, NOT AT HRC, 2008
Age of Trespasser Railroads
Tot Unk 1-5 6-10 11-15 16-20 21-25 26-30 31-35 36-40 41-45 46-50 51-55 56-60 > 60 Amtrak 70 12 - - - 6 6 3 - 10 2 11 7 7 6 Burlington Northern Santa Fe 59 9 - - 4 10 6 7 4 3 6 5 3 - 2 Canadian National 14 - 1 - 1 1 1 1 2 2 2 2 - 1 - Canadian Pacific 4 - - - - 1 2 - - - - - 1 - - CSX Transportation 72 14 - - 1 6 8 5 5 5 10 9 3 2 4 Florida East Coast 11 - - - - - 1 - 2 4 - 2 1 - 1 Kansas City Southern 7 - - - - 1 2 - 2 - - - - - 2 Long Island Rail Road 6 - - - - 1 1 - - - - 2 1 1 - MD Assn. of Rail Comm 1 - - - - - 1 - - - - - - - - Mass Bay Transit Auth. 8 7 - - - - - - - - - - - - 1 Metro North Commuter 2 - - - - - - - - - - 1 - - 1 Northeast IL Reg Comm 13 - - - - - 1 3 2 - 1 2 2 2 - New Jersey Transit Rail 12 8 - - - 2 - - - 1 - - 1 - - Norfolk Southern Corp. 72 1 1 1 1 9 10 10 7 5 5 11 5 3 3 Paducah & Louisville 3 1 - - - 1 - - - - - - - 1 - Peninsula Comm San Mateo Cnty 2 2 - - - - - - - - - - - - - Southern CA Reg Rail Auth. 2 2 - - - - - - - - - - - - - Southeastern PA Trans. 4 - - - - 2 1 - - - 1 - - - - Union Pacific 77 - - - 2 9 10 9 9 8 8 12 5 1 4 Other Railroads 17 - - - 1 2 3 1 3 2 - 4 - - 1 Total 456 56 2 1 10 51 53 39 36 40 35 61 29 18 25
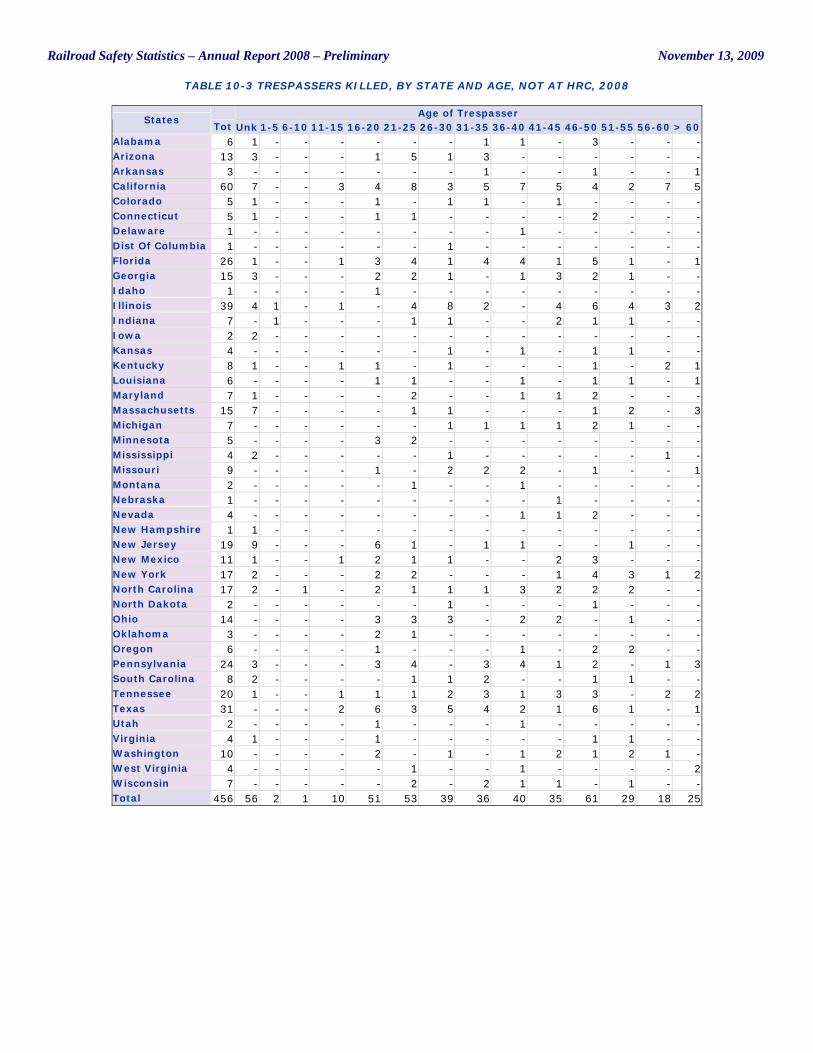
Railroad Safety Statistics – Annual Report 2008 – Preliminary November 13, 2009
TABLE 10-3 TRESPASSERS KILLED, BY STATE AND AGE, NOT AT HRC, 2008
Age of Trespasser States
Tot Unk 1-5 6-10 11-15 16-20 21-25 26-30 31-35 36-40 41-45 46-50 51-55 56-60 > 60 Alabama 6 1 - - - - - - 1 1 - 3 - - - Arizona 13 3 - - - 1 5 1 3 - - - - - - Arkansas 3 - - - - - - - 1 - - 1 - - 1 California 60 7 - - 3 4 8 3 5 7 5 4 2 7 5 Colorado 5 1 - - - 1 - 1 1 - 1 - - - - Connecticut 5 1 - - - 1 1 - - - - 2 - - - Delaware 1 - - - - - - - - 1 - - - - - Dist Of Columbia 1 - - - - - - 1 - - - - - - - Florida 26 1 - - 1 3 4 1 4 4 1 5 1 - 1 Georgia 15 3 - - - 2 2 1 - 1 3 2 1 - - Idaho 1 - - - - 1 - - - - - - - - - Illinois 39 4 1 - 1 - 4 8 2 - 4 6 4 3 2 Indiana 7 - 1 - - - 1 1 - - 2 1 1 - - Iowa 2 2 - - - - - - - - - - - - - Kansas 4 - - - - - - 1 - 1 - 1 1 - - Kentucky 8 1 - - 1 1 - 1 - - - 1 - 2 1 Louisiana 6 - - - - 1 1 - - 1 - 1 1 - 1 Maryland 7 1 - - - - 2 - - 1 1 2 - - - Massachusetts 15 7 - - - - 1 1 - - - 1 2 - 3 Michigan 7 - - - - - - 1 1 1 1 2 1 - - Minnesota 5 - - - - 3 2 - - - - - - - - Mississippi 4 2 - - - - - 1 - - - - - 1 - Missouri 9 - - - - 1 - 2 2 2 - 1 - - 1 Montana 2 - - - - - 1 - - 1 - - - - - Nebraska 1 - - - - - - - - - 1 - - - - Nevada 4 - - - - - - - - 1 1 2 - - - New Hampshire 1 1 - - - - - - - - - - - - - New Jersey 19 9 - - - 6 1 - 1 1 - - 1 - - New Mexico 11 1 - - 1 2 1 1 - - 2 3 - - - New York 17 2 - - - 2 2 - - - 1 4 3 1 2 North Carolina 17 2 - 1 - 2 1 1 1 3 2 2 2 - - North Dakota 2 - - - - - - 1 - - - 1 - - - Ohio 14 - - - - 3 3 3 - 2 2 - 1 - - Oklahoma 3 - - - - 2 1 - - - - - - - - Oregon 6 - - - - 1 - - - 1 - 2 2 - - Pennsylvania 24 3 - - - 3 4 - 3 4 1 2 - 1 3 South Carolina 8 2 - - - - 1 1 2 - - 1 1 - - Tennessee 20 1 - - 1 1 1 2 3 1 3 3 - 2 2 Texas 31 - - - 2 6 3 5 4 2 1 6 1 - 1 Utah 2 - - - - 1 - - - 1 - - - - - Virginia 4 1 - - - 1 - - - - - 1 1 - - Washington 10 - - - - 2 - 1 - 1 2 1 2 1 - West Virginia 4 - - - - - 1 - - 1 - - - - 2 Wisconsin 7 - - - - - 2 - 2 1 1 - 1 - - Total 456 56 2 1 10 51 53 39 36 40 35 61 29 18 25
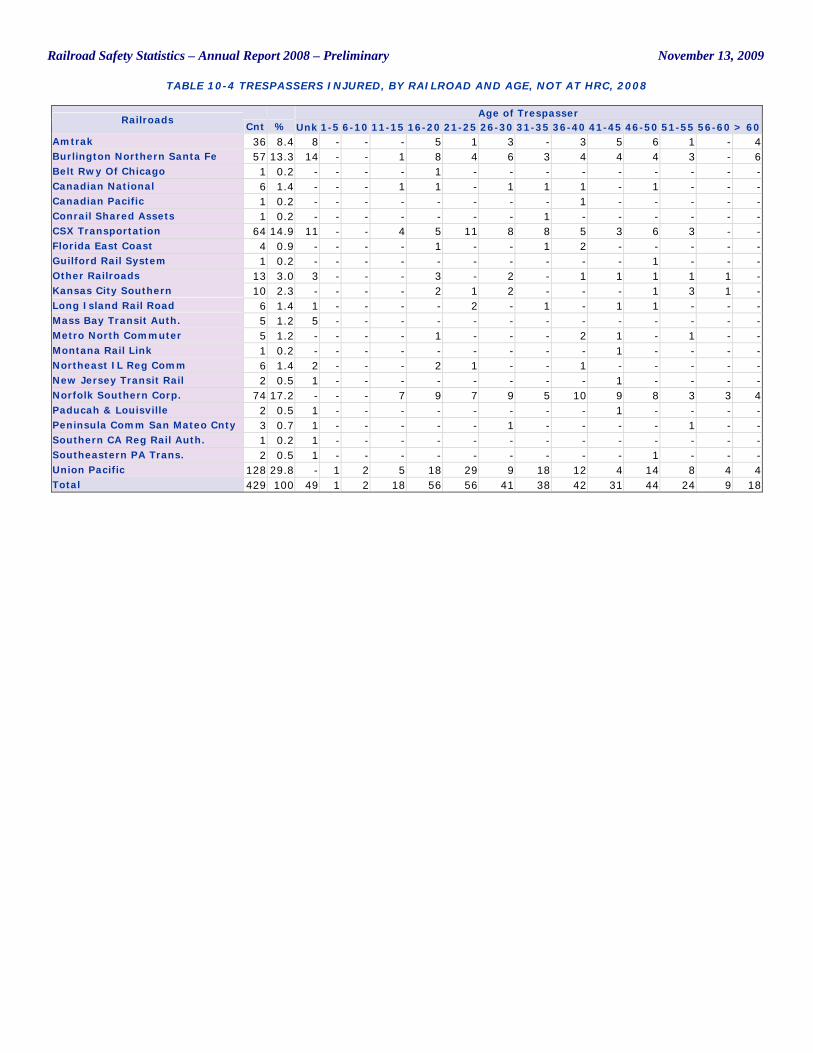
Railroad Safety Statistics – Annual Report 2008 – Preliminary November 13, 2009
TABLE 10-4 TRESPASSERS INJURED, BY RAILROAD AND AGE, NOT AT HRC, 2008
Age of Trespasser Railroads
Cnt % Unk 1-5 6-10 11-15 16-20 21-25 26-30 31-35 36-40 41-45 46-50 51-55 56-60 > 60 Amtrak 36 8.4 8 - - - 5 1 3 - 3 5 6 1 - 4 Burlington Northern Santa Fe 57 13.3 14 - - 1 8 4 6 3 4 4 4 3 - 6 Belt Rwy Of Chicago 1 0.2 - - - - 1 - - - - - - - - - Canadian National 6 1.4 - - - 1 1 - 1 1 1 - 1 - - - Canadian Pacific 1 0.2 - - - - - - - - 1 - - - - - Conrail Shared Assets 1 0.2 - - - - - - - 1 - - - - - - CSX Transportation 64 14.9 11 - - 4 5 11 8 8 5 3 6 3 - - Florida East Coast 4 0.9 - - - - 1 - - 1 2 - - - - - Guilford Rail System 1 0.2 - - - - - - - - - - 1 - - - Other Railroads 13 3.0 3 - - - 3 - 2 - 1 1 1 1 1 - Kansas City Southern 10 2.3 - - - - 2 1 2 - - - 1 3 1 - Long Island Rail Road 6 1.4 1 - - - - 2 - 1 - 1 1 - - - Mass Bay Transit Auth. 5 1.2 5 - - - - - - - - - - - - - Metro North Commuter 5 1.2 - - - - 1 - - - 2 1 - 1 - - Montana Rail Link 1 0.2 - - - - - - - - - 1 - - - - Northeast IL Reg Comm 6 1.4 2 - - - 2 1 - - 1 - - - - - New Jersey Transit Rail 2 0.5 1 - - - - - - - - 1 - - - - Norfolk Southern Corp. 74 17.2 - - - 7 9 7 9 5 10 9 8 3 3 4 Paducah & Louisville 2 0.5 1 - - - - - - - - 1 - - - - Peninsula Comm San Mateo Cnty 3 0.7 1 - - - - - 1 - - - - 1 - - Southern CA Reg Rail Auth. 1 0.2 1 - - - - - - - - - - - - - Southeastern PA Trans. 2 0.5 1 - - - - - - - - - 1 - - - Union Pacific 128 29.8 - 1 2 5 18 29 9 18 12 4 14 8 4 4 Total 429 100 49 1 2 18 56 56 41 38 42 31 44 24 9 18
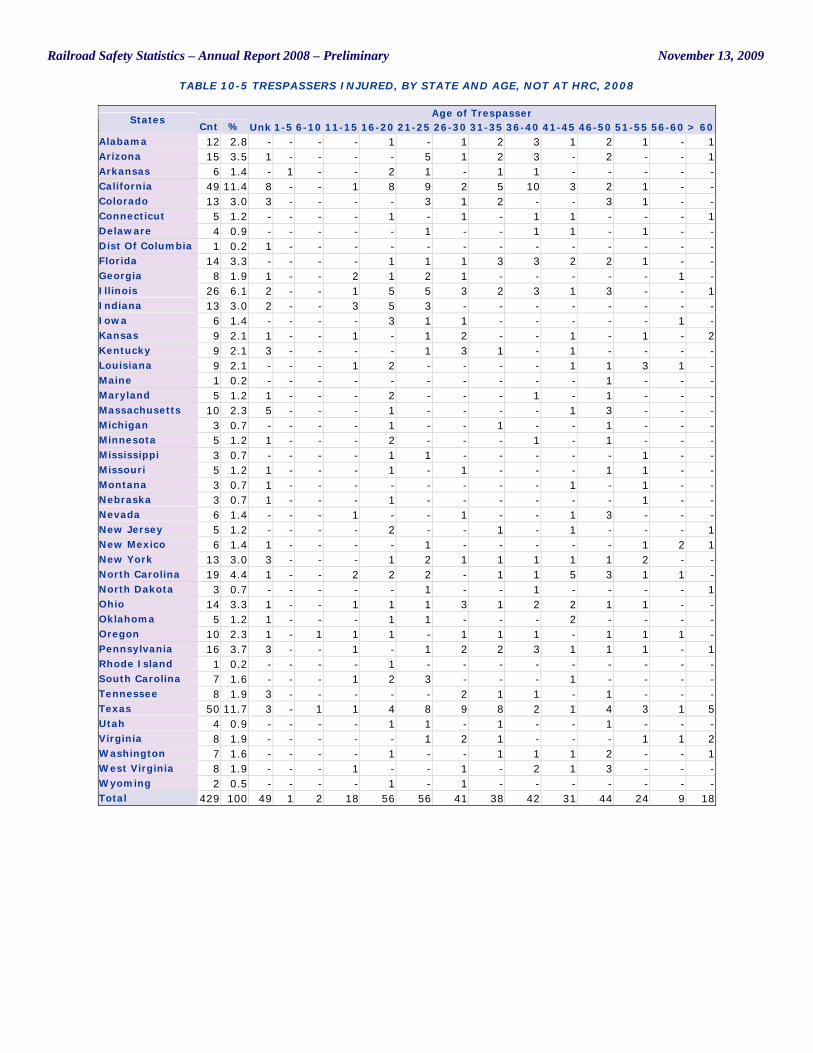
Railroad Safety Statistics – Annual Report 2008 – Preliminary November 13, 2009
TABLE 10-5 TRESPASSERS INJURED, BY STATE AND AGE, NOT AT HRC, 2008
Age of Trespasser States
Cnt % Unk 1-5 6-10 11-15 16-20 21-25 26-30 31-35 36-40 41-45 46-50 51-55 56-60 > 60 Alabama 12 2.8 - - - - 1 - 1 2 3 1 2 1 - 1 Arizona 15 3.5 1 - - - - 5 1 2 3 - 2 - - 1 Arkansas 6 1.4 - 1 - - 2 1 - 1 1 - - - - - California 49 11.4 8 - - 1 8 9 2 5 10 3 2 1 - - Colorado 13 3.0 3 - - - - 3 1 2 - - 3 1 - - Connecticut 5 1.2 - - - - 1 - 1 - 1 1 - - - 1 Delaware 4 0.9 - - - - - 1 - - 1 1 - 1 - - Dist Of Columbia 1 0.2 1 - - - - - - - - - - - - - Florida 14 3.3 - - - - 1 1 1 3 3 2 2 1 - - Georgia 8 1.9 1 - - 2 1 2 1 - - - - - 1 - Illinois 26 6.1 2 - - 1 5 5 3 2 3 1 3 - - 1 Indiana 13 3.0 2 - - 3 5 3 - - - - - - - - Iowa 6 1.4 - - - - 3 1 1 - - - - - 1 - Kansas 9 2.1 1 - - 1 - 1 2 - - 1 - 1 - 2 Kentucky 9 2.1 3 - - - - 1 3 1 - 1 - - - - Louisiana 9 2.1 - - - 1 2 - - - - 1 1 3 1 - Maine 1 0.2 - - - - - - - - - - 1 - - - Maryland 5 1.2 1 - - - 2 - - - 1 - 1 - - - Massachusetts 10 2.3 5 - - - 1 - - - - 1 3 - - - Michigan 3 0.7 - - - - 1 - - 1 - - 1 - - - Minnesota 5 1.2 1 - - - 2 - - - 1 - 1 - - - Mississippi 3 0.7 - - - - 1 1 - - - - - 1 - - Missouri 5 1.2 1 - - - 1 - 1 - - - 1 1 - - Montana 3 0.7 1 - - - - - - - - 1 - 1 - - Nebraska 3 0.7 1 - - - 1 - - - - - - 1 - - Nevada 6 1.4 - - - 1 - - 1 - - 1 3 - - - New Jersey 5 1.2 - - - - 2 - - 1 - 1 - - - 1 New Mexico 6 1.4 1 - - - - 1 - - - - - 1 2 1 New York 13 3.0 3 - - - 1 2 1 1 1 1 1 2 - - North Carolina 19 4.4 1 - - 2 2 2 - 1 1 5 3 1 1 - North Dakota 3 0.7 - - - - - 1 - - 1 - - - - 1 Ohio 14 3.3 1 - - 1 1 1 3 1 2 2 1 1 - - Oklahoma 5 1.2 1 - - - 1 1 - - - 2 - - - - Oregon 10 2.3 1 - 1 1 1 - 1 1 1 - 1 1 1 - Pennsylvania 16 3.7 3 - - 1 - 1 2 2 3 1 1 1 - 1 Rhode Island 1 0.2 - - - - 1 - - - - - - - - - South Carolina 7 1.6 - - - 1 2 3 - - - 1 - - - - Tennessee 8 1.9 3 - - - - - 2 1 1 - 1 - - - Texas 50 11.7 3 - 1 1 4 8 9 8 2 1 4 3 1 5 Utah 4 0.9 - - - - 1 1 - 1 - - 1 - - - Virginia 8 1.9 - - - - - 1 2 1 - - - 1 1 2 Washington 7 1.6 - - - - 1 - - 1 1 1 2 - - 1 West Virginia 8 1.9 - - - 1 - - 1 - 2 1 3 - - - Wyoming 2 0.5 - - - - 1 - 1 - - - - - - - Total 429 100 49 1 2 18 56 56 41 38 42 31 44 24 9 18
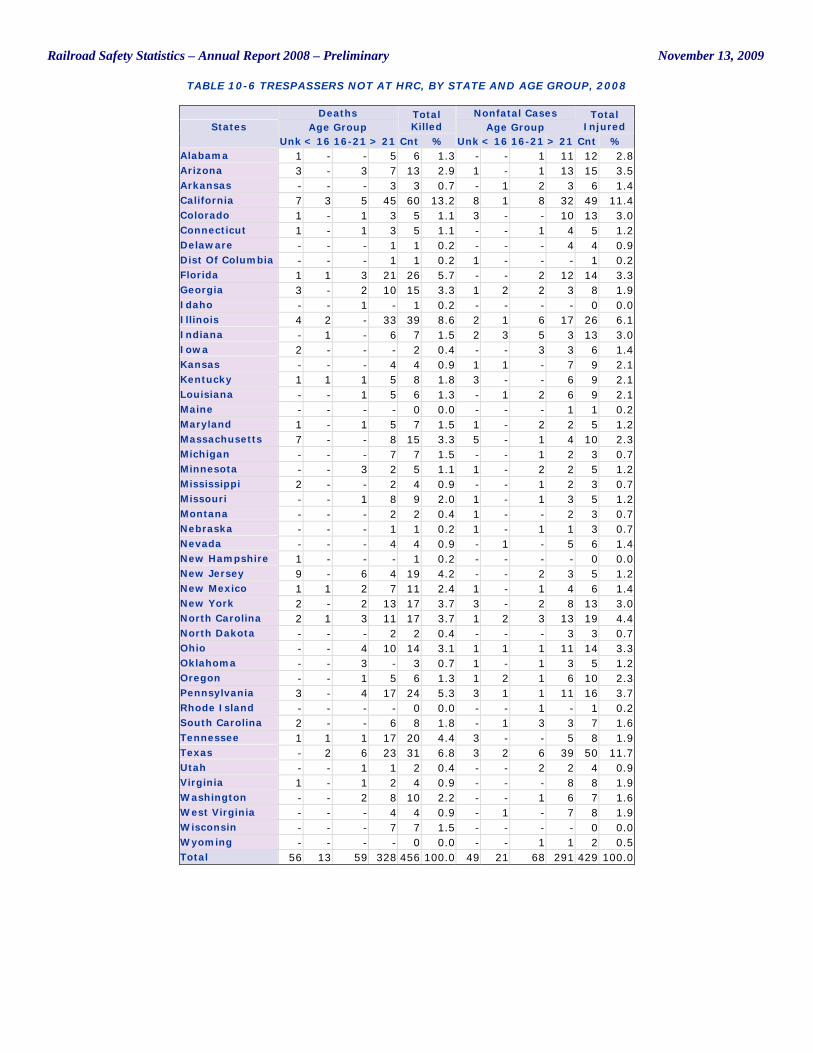
Railroad Safety Statistics – Annual Report 2008 – Preliminary November 13, 2009
TABLE 10-6 TRESPASSERS NOT AT HRC, BY STATE AND AGE GROUP, 2008
Deaths Nonfatal Cases Age Group
Total Killed Age Group
Total Injured States
Unk < 16 16-21 > 21 Cnt % Unk < 16 16-21 > 21 Cnt % Alabama 1 - - 5 6 1.3 - - 1 11 12 2.8 Arizona 3 - 3 7 13 2.9 1 - 1 13 15 3.5 Arkansas - - - 3 3 0.7 - 1 2 3 6 1.4 California 7 3 5 45 60 13.2 8 1 8 32 49 11.4 Colorado 1 - 1 3 5 1.1 3 - - 10 13 3.0 Connecticut 1 - 1 3 5 1.1 - - 1 4 5 1.2 Delaware - - - 1 1 0.2 - - - 4 4 0.9 Dist Of Columbia - - - 1 1 0.2 1 - - - 1 0.2 Florida 1 1 3 21 26 5.7 - - 2 12 14 3.3 Georgia 3 - 2 10 15 3.3 1 2 2 3 8 1.9 Idaho - - 1 - 1 0.2 - - - - 0 0.0 Illinois 4 2 - 33 39 8.6 2 1 6 17 26 6.1 Indiana - 1 - 6 7 1.5 2 3 5 3 13 3.0 Iowa 2 - - - 2 0.4 - - 3 3 6 1.4 Kansas - - - 4 4 0.9 1 1 - 7 9 2.1 Kentucky 1 1 1 5 8 1.8 3 - - 6 9 2.1 Louisiana - - 1 5 6 1.3 - 1 2 6 9 2.1 Maine - - - - 0 0.0 - - - 1 1 0.2 Maryland 1 - 1 5 7 1.5 1 - 2 2 5 1.2 Massachusetts 7 - - 8 15 3.3 5 - 1 4 10 2.3 Michigan - - - 7 7 1.5 - - 1 2 3 0.7 Minnesota - - 3 2 5 1.1 1 - 2 2 5 1.2 Mississippi 2 - - 2 4 0.9 - - 1 2 3 0.7 Missouri - - 1 8 9 2.0 1 - 1 3 5 1.2 Montana - - - 2 2 0.4 1 - - 2 3 0.7 Nebraska - - - 1 1 0.2 1 - 1 1 3 0.7 Nevada - - - 4 4 0.9 - 1 - 5 6 1.4 New Hampshire 1 - - - 1 0.2 - - - - 0 0.0 New Jersey 9 - 6 4 19 4.2 - - 2 3 5 1.2 New Mexico 1 1 2 7 11 2.4 1 - 1 4 6 1.4 New York 2 - 2 13 17 3.7 3 - 2 8 13 3.0 North Carolina 2 1 3 11 17 3.7 1 2 3 13 19 4.4 North Dakota - - - 2 2 0.4 - - - 3 3 0.7 Ohio - - 4 10 14 3.1 1 1 1 11 14 3.3 Oklahoma - - 3 - 3 0.7 1 - 1 3 5 1.2 Oregon - - 1 5 6 1.3 1 2 1 6 10 2.3 Pennsylvania 3 - 4 17 24 5.3 3 1 1 11 16 3.7 Rhode Island - - - - 0 0.0 - - 1 - 1 0.2 South Carolina 2 - - 6 8 1.8 - 1 3 3 7 1.6 Tennessee 1 1 1 17 20 4.4 3 - - 5 8 1.9 Texas - 2 6 23 31 6.8 3 2 6 39 50 11.7 Utah - - 1 1 2 0.4 - - 2 2 4 0.9 Virginia 1 - 1 2 4 0.9 - - - 8 8 1.9 Washington - - 2 8 10 2.2 - - 1 6 7 1.6 West Virginia - - - 4 4 0.9 - 1 - 7 8 1.9 Wisconsin - - - 7 7 1.5 - - - - 0 0.0 Wyoming - - - - 0 0.0 - - 1 1 2 0.5 Total 56 13 59 328 456 100.0 49 21 68 291 429 100.0
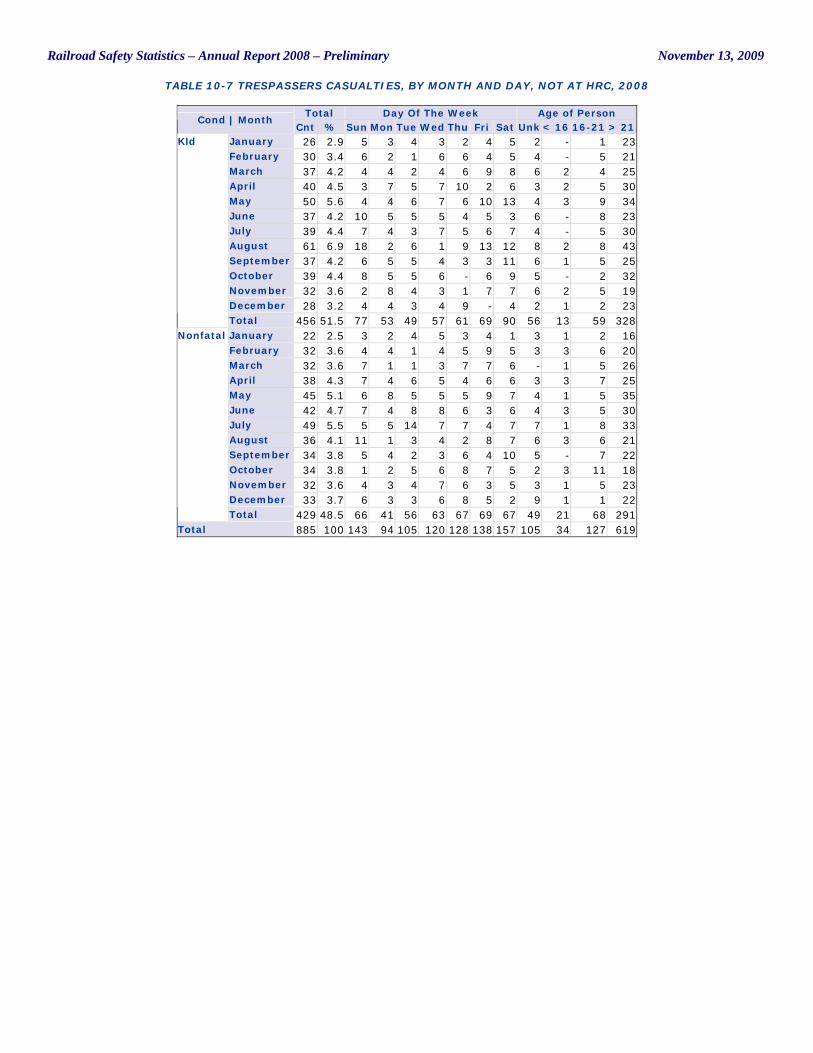
Railroad Safety Statistics – Annual Report 2008 – Preliminary November 13, 2009
TABLE 10-7 TRESPASSERS CASUALTIES, BY MONTH AND DAY, NOT AT HRC, 2008
Total Day Of The Week Age of Person Cond | Month
Cnt % Sun Mon Tue Wed Thu Fri Sat Unk < 16 16-21 > 21 January 26 2.9 5 3 4 3 2 4 5 2 - 1 23 February 30 3.4 6 2 1 6 6 4 5 4 - 5 21 March 37 4.2 4 4 2 4 6 9 8 6 2 4 25 April 40 4.5 3 7 5 7 10 2 6 3 2 5 30 May 50 5.6 4 4 6 7 6 10 13 4 3 9 34 June 37 4.2 10 5 5 5 4 5 3 6 - 8 23 July 39 4.4 7 4 3 7 5 6 7 4 - 5 30 August 61 6.9 18 2 6 1 9 13 12 8 2 8 43 September 37 4.2 6 5 5 4 3 3 11 6 1 5 25 October 39 4.4 8 5 5 6 - 6 9 5 - 2 32 November 32 3.6 2 8 4 3 1 7 7 6 2 5 19 December 28 3.2 4 4 3 4 9 - 4 2 1 2 23
Kld
Total 456 51.5 77 53 49 57 61 69 90 56 13 59 328 January 22 2.5 3 2 4 5 3 4 1 3 1 2 16 February 32 3.6 4 4 1 4 5 9 5 3 3 6 20 March 32 3.6 7 1 1 3 7 7 6 - 1 5 26 April 38 4.3 7 4 6 5 4 6 6 3 3 7 25 May 45 5.1 6 8 5 5 5 9 7 4 1 5 35 June 42 4.7 7 4 8 8 6 3 6 4 3 5 30 July 49 5.5 5 5 14 7 7 4 7 7 1 8 33 August 36 4.1 11 1 3 4 2 8 7 6 3 6 21 September 34 3.8 5 4 2 3 6 4 10 5 - 7 22 October 34 3.8 1 2 5 6 8 7 5 2 3 11 18 November 32 3.6 4 3 4 7 6 3 5 3 1 5 23 December 33 3.7 6 3 3 6 8 5 2 9 1 1 22
Nonfatal
Total 429 48.5 66 41 56 63 67 69 67 49 21 68 291 Total 885 100 143 94 105 120 128 138 157 105 34 127 619
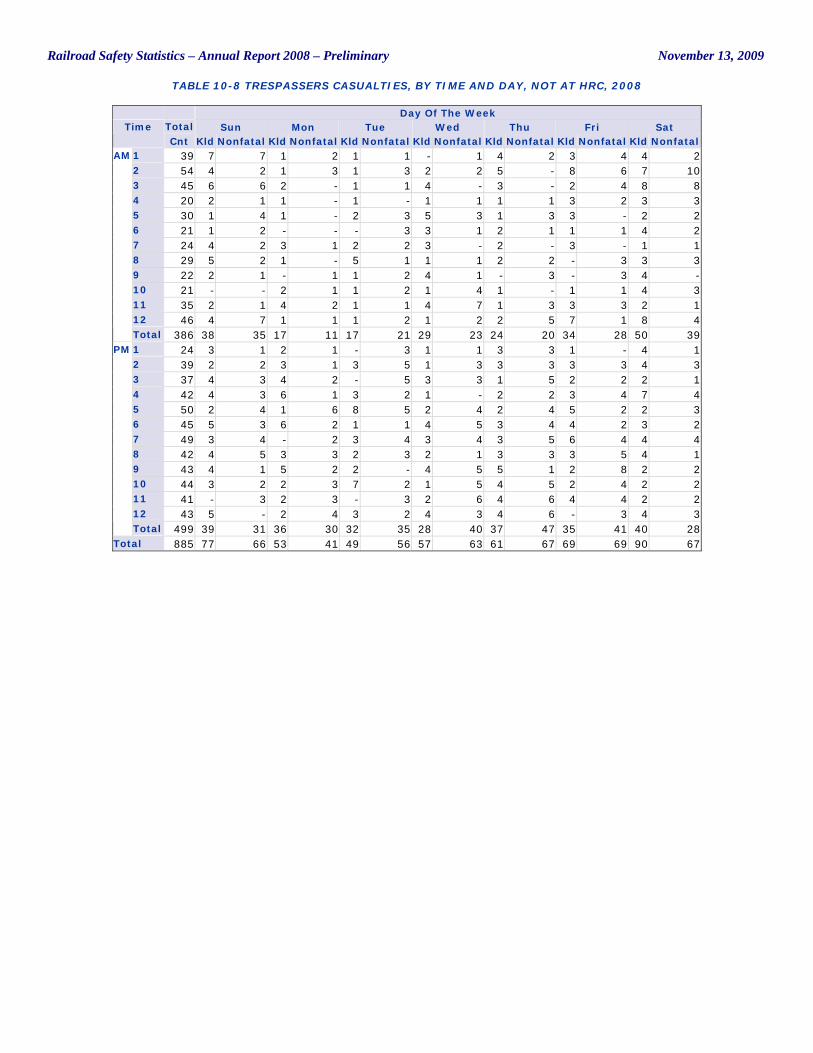
Railroad Safety Statistics – Annual Report 2008 – Preliminary November 13, 2009
TABLE 10-8 TRESPASSERS CASUALTIES, BY TIME AND DAY, NOT AT HRC, 2008
Day Of The Week Total Sun Mon Tue Wed Thu Fri Sat Time Cnt Kld Nonfatal Kld Nonfatal Kld Nonfatal Kld Nonfatal Kld Nonfatal Kld Nonfatal Kld Nonfatal
1 39 7 7 1 2 1 1 - 1 4 2 3 4 4 2 2 54 4 2 1 3 1 3 2 2 5 - 8 6 7 10 3 45 6 6 2 - 1 1 4 - 3 - 2 4 8 8 4 20 2 1 1 - 1 - 1 1 1 1 3 2 3 3 5 30 1 4 1 - 2 3 5 3 1 3 3 - 2 2 6 21 1 2 - - - 3 3 1 2 1 1 1 4 2 7 24 4 2 3 1 2 2 3 - 2 - 3 - 1 1 8 29 5 2 1 - 5 1 1 1 2 2 - 3 3 3 9 22 2 1 - 1 1 2 4 1 - 3 - 3 4 - 10 21 - - 2 1 1 2 1 4 1 - 1 1 4 3 11 35 2 1 4 2 1 1 4 7 1 3 3 3 2 1 12 46 4 7 1 1 1 2 1 2 2 5 7 1 8 4
AM
Total 386 38 35 17 11 17 21 29 23 24 20 34 28 50 39 1 24 3 1 2 1 - 3 1 1 3 3 1 - 4 1 2 39 2 2 3 1 3 5 1 3 3 3 3 3 4 3 3 37 4 3 4 2 - 5 3 3 1 5 2 2 2 1 4 42 4 3 6 1 3 2 1 - 2 2 3 4 7 4 5 50 2 4 1 6 8 5 2 4 2 4 5 2 2 3 6 45 5 3 6 2 1 1 4 5 3 4 4 2 3 2 7 49 3 4 - 2 3 4 3 4 3 5 6 4 4 4 8 42 4 5 3 3 2 3 2 1 3 3 3 5 4 1 9 43 4 1 5 2 2 - 4 5 5 1 2 8 2 2 10 44 3 2 2 3 7 2 1 5 4 5 2 4 2 2 11 41 - 3 2 3 - 3 2 6 4 6 4 4 2 2 12 43 5 - 2 4 3 2 4 3 4 6 - 3 4 3
PM
Total 499 39 31 36 30 32 35 28 40 37 47 35 41 40 28 Total 885 77 66 53 41 49 56 57 63 61 67 69 69 90 67
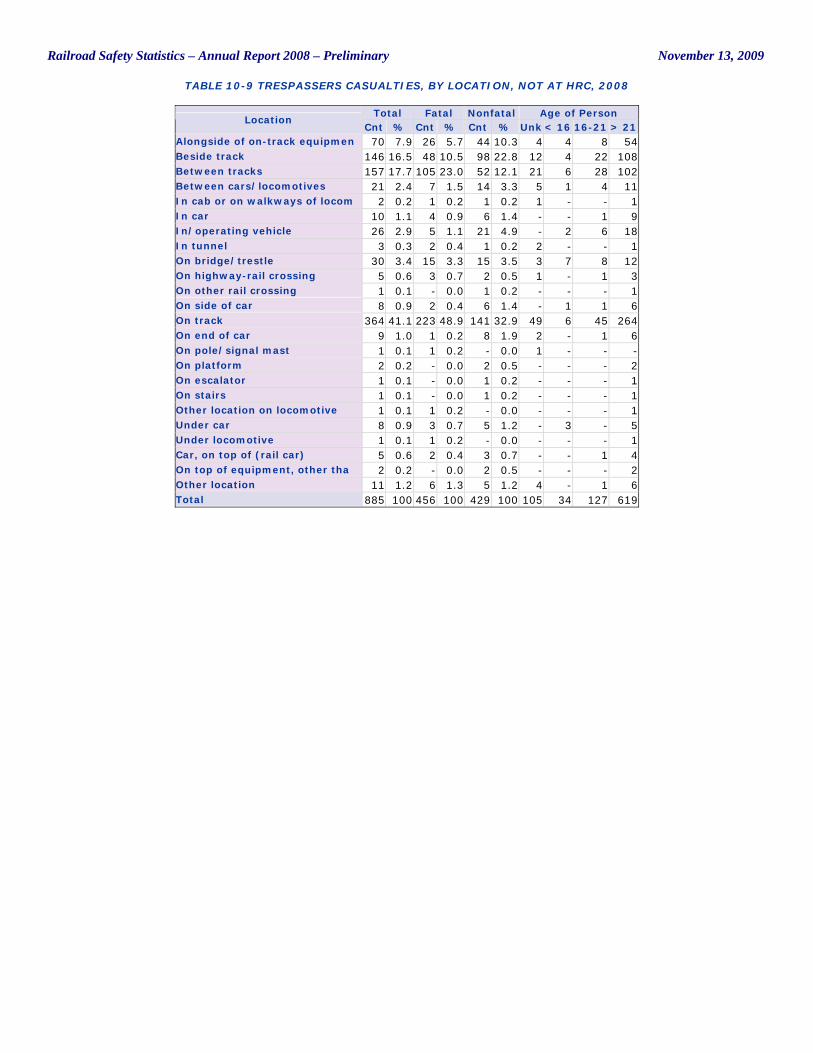
Railroad Safety Statistics – Annual Report 2008 – Preliminary November 13, 2009
TABLE 10-9 TRESPASSERS CASUALTIES, BY LOCATION, NOT AT HRC, 2008
Total Fatal Nonfatal Age of Person Location
Cnt % Cnt % Cnt % Unk < 16 16-21 > 21 Alongside of on-track equipmen 70 7.9 26 5.7 44 10.3 4 4 8 54 Beside track 146 16.5 48 10.5 98 22.8 12 4 22 108 Between tracks 157 17.7 105 23.0 52 12.1 21 6 28 102 Between cars/locomotives 21 2.4 7 1.5 14 3.3 5 1 4 11 In cab or on walkways of locom 2 0.2 1 0.2 1 0.2 1 - - 1 In car 10 1.1 4 0.9 6 1.4 - - 1 9 In/operating vehicle 26 2.9 5 1.1 21 4.9 - 2 6 18 In tunnel 3 0.3 2 0.4 1 0.2 2 - - 1 On bridge/trestle 30 3.4 15 3.3 15 3.5 3 7 8 12 On highway-rail crossing 5 0.6 3 0.7 2 0.5 1 - 1 3 On other rail crossing 1 0.1 - 0.0 1 0.2 - - - 1 On side of car 8 0.9 2 0.4 6 1.4 - 1 1 6 On track 364 41.1 223 48.9 141 32.9 49 6 45 264 On end of car 9 1.0 1 0.2 8 1.9 2 - 1 6 On pole/signal mast 1 0.1 1 0.2 - 0.0 1 - - - On platform 2 0.2 - 0.0 2 0.5 - - - 2 On escalator 1 0.1 - 0.0 1 0.2 - - - 1 On stairs 1 0.1 - 0.0 1 0.2 - - - 1 Other location on locomotive 1 0.1 1 0.2 - 0.0 - - - 1 Under car 8 0.9 3 0.7 5 1.2 - 3 - 5 Under locomotive 1 0.1 1 0.2 - 0.0 - - - 1 Car, on top of (rail car) 5 0.6 2 0.4 3 0.7 - - 1 4 On top of equipment, other tha 2 0.2 - 0.0 2 0.5 - - - 2 Other location 11 1.2 6 1.3 5 1.2 4 - 1 6 Total 885 100 456 100 429 100 105 34 127 619
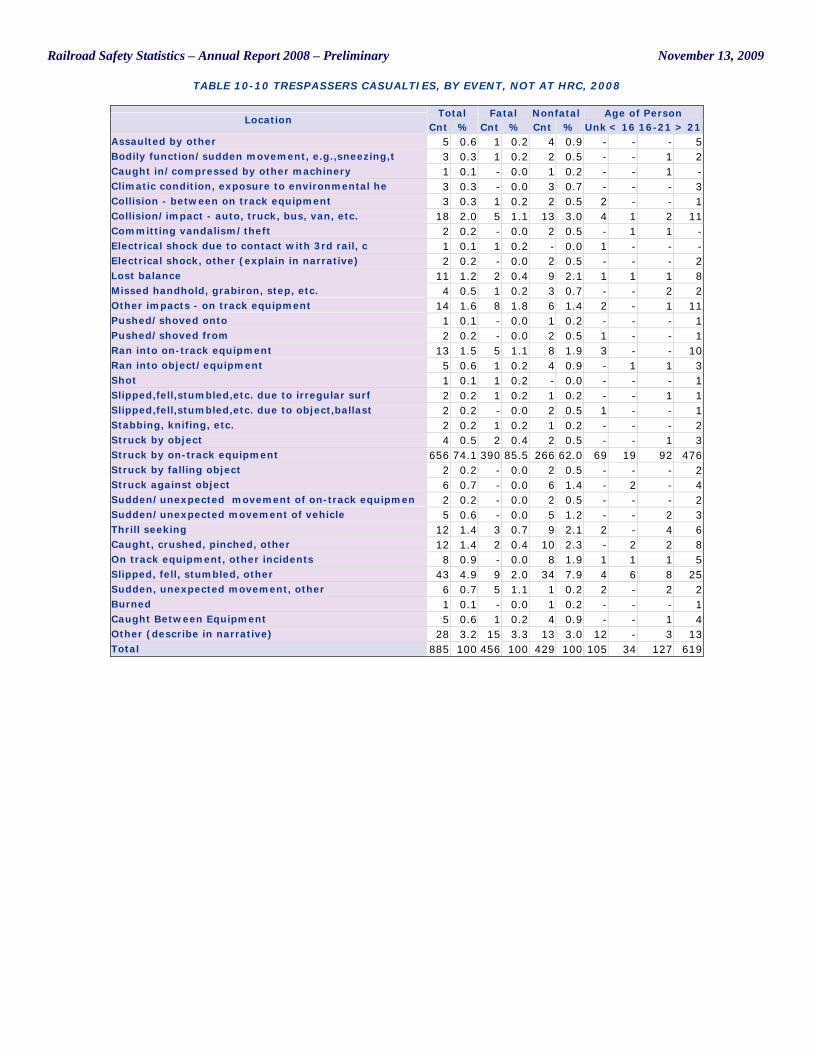
Railroad Safety Statistics – Annual Report 2008 – Preliminary November 13, 2009
TABLE 10-10 TRESPASSERS CASUALTIES, BY EVENT, NOT AT HRC, 2008
Total Fatal Nonfatal Age of Person Location
Cnt % Cnt % Cnt % Unk < 16 16-21 > 21 Assaulted by other 5 0.6 1 0.2 4 0.9 - - - 5 Bodily function/sudden movement, e.g.,sneezing,t 3 0.3 1 0.2 2 0.5 - - 1 2 Caught in/compressed by other machinery 1 0.1 - 0.0 1 0.2 - - 1 - Climatic condition, exposure to environmental he 3 0.3 - 0.0 3 0.7 - - - 3 Collision - between on track equipment 3 0.3 1 0.2 2 0.5 2 - - 1 Collision/impact - auto, truck, bus, van, etc. 18 2.0 5 1.1 13 3.0 4 1 2 11 Committing vandalism/theft 2 0.2 - 0.0 2 0.5 - 1 1 - Electrical shock due to contact with 3rd rail, c 1 0.1 1 0.2 - 0.0 1 - - - Electrical shock, other (explain in narrative) 2 0.2 - 0.0 2 0.5 - - - 2 Lost balance 11 1.2 2 0.4 9 2.1 1 1 1 8 Missed handhold, grabiron, step, etc. 4 0.5 1 0.2 3 0.7 - - 2 2 Other impacts - on track equipment 14 1.6 8 1.8 6 1.4 2 - 1 11 Pushed/shoved onto 1 0.1 - 0.0 1 0.2 - - - 1 Pushed/shoved from 2 0.2 - 0.0 2 0.5 1 - - 1 Ran into on-track equipment 13 1.5 5 1.1 8 1.9 3 - - 10 Ran into object/equipment 5 0.6 1 0.2 4 0.9 - 1 1 3 Shot 1 0.1 1 0.2 - 0.0 - - - 1 Slipped,fell,stumbled,etc. due to irregular surf 2 0.2 1 0.2 1 0.2 - - 1 1 Slipped,fell,stumbled,etc. due to object,ballast 2 0.2 - 0.0 2 0.5 1 - - 1 Stabbing, knifing, etc. 2 0.2 1 0.2 1 0.2 - - - 2 Struck by object 4 0.5 2 0.4 2 0.5 - - 1 3 Struck by on-track equipment 656 74.1 390 85.5 266 62.0 69 19 92 476 Struck by falling object 2 0.2 - 0.0 2 0.5 - - - 2 Struck against object 6 0.7 - 0.0 6 1.4 - 2 - 4 Sudden/unexpected movement of on-track equipmen 2 0.2 - 0.0 2 0.5 - - - 2 Sudden/unexpected movement of vehicle 5 0.6 - 0.0 5 1.2 - - 2 3 Thrill seeking 12 1.4 3 0.7 9 2.1 2 - 4 6 Caught, crushed, pinched, other 12 1.4 2 0.4 10 2.3 - 2 2 8 On track equipment, other incidents 8 0.9 - 0.0 8 1.9 1 1 1 5 Slipped, fell, stumbled, other 43 4.9 9 2.0 34 7.9 4 6 8 25 Sudden, unexpected movement, other 6 0.7 5 1.1 1 0.2 2 - 2 2 Burned 1 0.1 - 0.0 1 0.2 - - - 1 Caught Between Equipment 5 0.6 1 0.2 4 0.9 - - 1 4 Other (describe in narrative) 28 3.2 15 3.3 13 3.0 12 - 3 13 Total 885 100 456 100 429 100 105 34 127 619
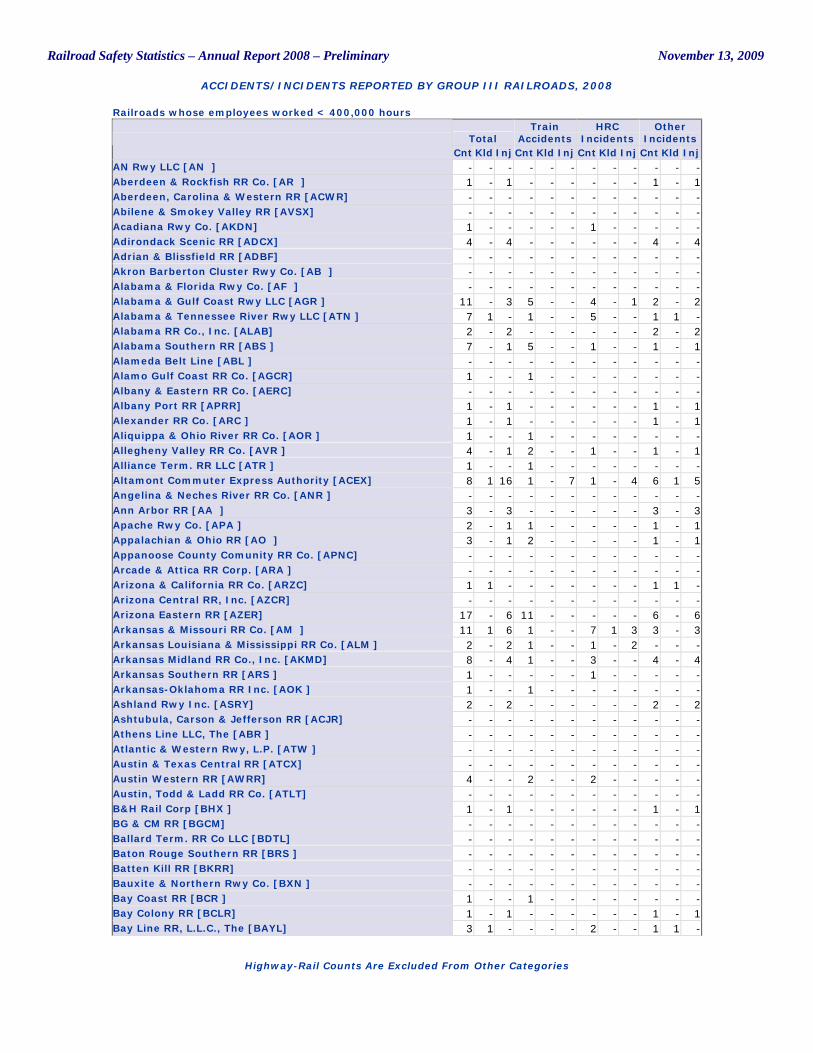
Railroad Safety Statistics – Annual Report 2008 – Preliminary November 13, 2009
ACCIDENTS/INCIDENTS REPORTED BY GROUP III RAILROADS, 2008
Highway-Rail Counts Are Excluded From Other Categories
Railroads whose employees worked < 400,000 hours
Total Train
Accidents HRC
Incidents Other
Incidents Cnt Kld Inj Cnt Kld Inj Cnt Kld Inj Cnt Kld Inj
AN Rwy LLC [AN ] - - - - - - - - - - - - Aberdeen & Rockfish RR Co. [AR ] 1 - 1 - - - - - - 1 - 1 Aberdeen, Carolina & Western RR [ACWR] - - - - - - - - - - - - Abilene & Smokey Valley RR [AVSX] - - - - - - - - - - - - Acadiana Rwy Co. [AKDN] 1 - - - - - 1 - - - - - Adirondack Scenic RR [ADCX] 4 - 4 - - - - - - 4 - 4 Adrian & Blissfield RR [ADBF] - - - - - - - - - - - - Akron Barberton Cluster Rwy Co. [AB ] - - - - - - - - - - - - Alabama & Florida Rwy Co. [AF ] - - - - - - - - - - - - Alabama & Gulf Coast Rwy LLC [AGR ] 11 - 3 5 - - 4 - 1 2 - 2 Alabama & Tennessee River Rwy LLC [ATN ] 7 1 - 1 - - 5 - - 1 1 - Alabama RR Co., Inc. [ALAB] 2 - 2 - - - - - - 2 - 2 Alabama Southern RR [ABS ] 7 - 1 5 - - 1 - - 1 - 1 Alameda Belt Line [ABL ] - - - - - - - - - - - - Alamo Gulf Coast RR Co. [AGCR] 1 - - 1 - - - - - - - - Albany & Eastern RR Co. [AERC] - - - - - - - - - - - - Albany Port RR [APRR] 1 - 1 - - - - - - 1 - 1 Alexander RR Co. [ARC ] 1 - 1 - - - - - - 1 - 1 Aliquippa & Ohio River RR Co. [AOR ] 1 - - 1 - - - - - - - - Allegheny Valley RR Co. [AVR ] 4 - 1 2 - - 1 - - 1 - 1 Alliance Term. RR LLC [ATR ] 1 - - 1 - - - - - - - - Altamont Commuter Express Authority [ACEX] 8 1 16 1 - 7 1 - 4 6 1 5 Angelina & Neches River RR Co. [ANR ] - - - - - - - - - - - - Ann Arbor RR [AA ] 3 - 3 - - - - - - 3 - 3 Apache Rwy Co. [APA ] 2 - 1 1 - - - - - 1 - 1 Appalachian & Ohio RR [AO ] 3 - 1 2 - - - - - 1 - 1 Appanoose County Comunity RR Co. [APNC] - - - - - - - - - - - - Arcade & Attica RR Corp. [ARA ] - - - - - - - - - - - - Arizona & California RR Co. [ARZC] 1 1 - - - - - - - 1 1 - Arizona Central RR, Inc. [AZCR] - - - - - - - - - - - - Arizona Eastern RR [AZER] 17 - 6 11 - - - - - 6 - 6 Arkansas & Missouri RR Co. [AM ] 11 1 6 1 - - 7 1 3 3 - 3 Arkansas Louisiana & Mississippi RR Co. [ALM ] 2 - 2 1 - - 1 - 2 - - - Arkansas Midland RR Co., Inc. [AKMD] 8 - 4 1 - - 3 - - 4 - 4 Arkansas Southern RR [ARS ] 1 - - - - - 1 - - - - - Arkansas-Oklahoma RR Inc. [AOK ] 1 - - 1 - - - - - - - - Ashland Rwy Inc. [ASRY] 2 - 2 - - - - - - 2 - 2 Ashtubula, Carson & Jefferson RR [ACJR] - - - - - - - - - - - - Athens Line LLC, The [ABR ] - - - - - - - - - - - - Atlantic & Western Rwy, L.P. [ATW ] - - - - - - - - - - - - Austin & Texas Central RR [ATCX] - - - - - - - - - - - - Austin Western RR [AWRR] 4 - - 2 - - 2 - - - - - Austin, Todd & Ladd RR Co. [ATLT] - - - - - - - - - - - - B&H Rail Corp [BHX ] 1 - 1 - - - - - - 1 - 1 BG & CM RR [BGCM] - - - - - - - - - - - - Ballard Term. RR Co LLC [BDTL] - - - - - - - - - - - - Baton Rouge Southern RR [BRS ] - - - - - - - - - - - - Batten Kill RR [BKRR] - - - - - - - - - - - - Bauxite & Northern Rwy Co. [BXN ] - - - - - - - - - - - - Bay Coast RR [BCR ] 1 - - 1 - - - - - - - - Bay Colony RR [BCLR] 1 - 1 - - - - - - 1 - 1 Bay Line RR, L.L.C., The [BAYL] 3 1 - - - - 2 - - 1 1 -
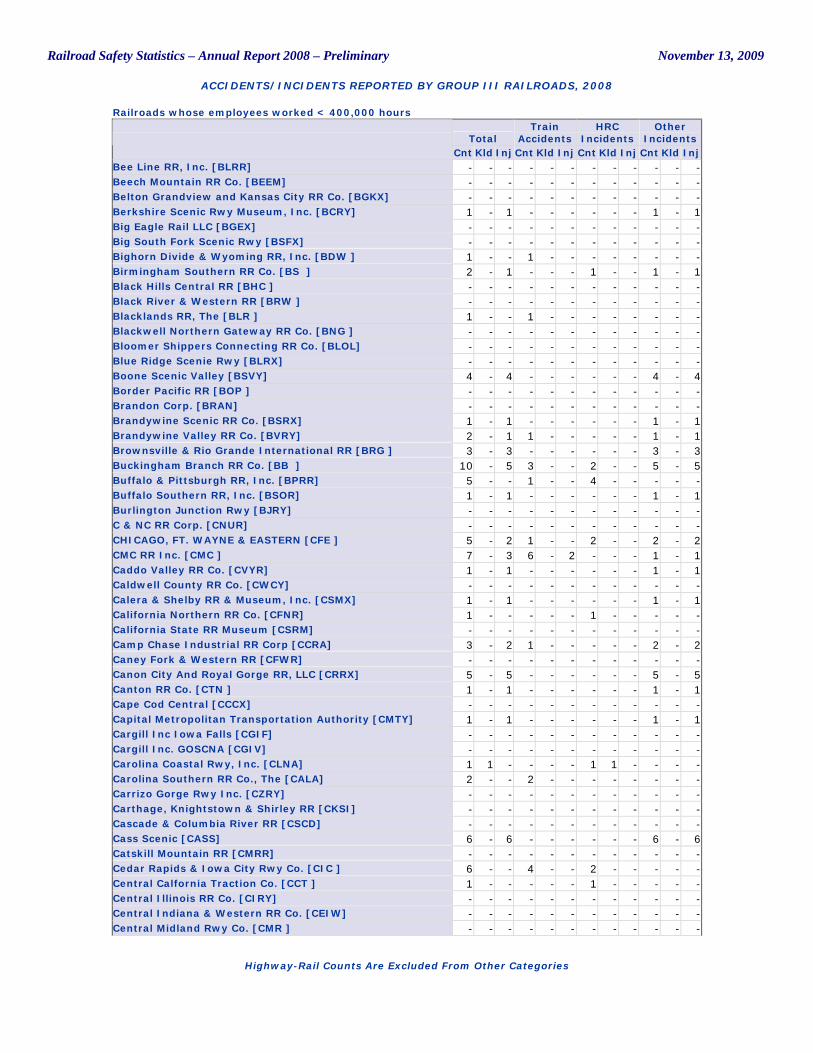
Railroad Safety Statistics – Annual Report 2008 – Preliminary November 13, 2009
ACCIDENTS/INCIDENTS REPORTED BY GROUP III RAILROADS, 2008
Highway-Rail Counts Are Excluded From Other Categories
Railroads whose employees worked < 400,000 hours
Total Train
Accidents HRC
Incidents Other
Incidents Cnt Kld Inj Cnt Kld Inj Cnt Kld Inj Cnt Kld Inj
Bee Line RR, Inc. [BLRR] - - - - - - - - - - - - Beech Mountain RR Co. [BEEM] - - - - - - - - - - - - Belton Grandview and Kansas City RR Co. [BGKX] - - - - - - - - - - - - Berkshire Scenic Rwy Museum, Inc. [BCRY] 1 - 1 - - - - - - 1 - 1 Big Eagle Rail LLC [BGEX] - - - - - - - - - - - - Big South Fork Scenic Rwy [BSFX] - - - - - - - - - - - - Bighorn Divide & Wyoming RR, Inc. [BDW ] 1 - - 1 - - - - - - - - Birmingham Southern RR Co. [BS ] 2 - 1 - - - 1 - - 1 - 1 Black Hills Central RR [BHC ] - - - - - - - - - - - - Black River & Western RR [BRW ] - - - - - - - - - - - - Blacklands RR, The [BLR ] 1 - - 1 - - - - - - - - Blackwell Northern Gateway RR Co. [BNG ] - - - - - - - - - - - - Bloomer Shippers Connecting RR Co. [BLOL] - - - - - - - - - - - - Blue Ridge Scenie Rwy [BLRX] - - - - - - - - - - - - Boone Scenic Valley [BSVY] 4 - 4 - - - - - - 4 - 4 Border Pacific RR [BOP ] - - - - - - - - - - - - Brandon Corp. [BRAN] - - - - - - - - - - - - Brandywine Scenic RR Co. [BSRX] 1 - 1 - - - - - - 1 - 1 Brandywine Valley RR Co. [BVRY] 2 - 1 1 - - - - - 1 - 1 Brownsville & Rio Grande International RR [BRG ] 3 - 3 - - - - - - 3 - 3 Buckingham Branch RR Co. [BB ] 10 - 5 3 - - 2 - - 5 - 5 Buffalo & Pittsburgh RR, Inc. [BPRR] 5 - - 1 - - 4 - - - - - Buffalo Southern RR, Inc. [BSOR] 1 - 1 - - - - - - 1 - 1 Burlington Junction Rwy [BJRY] - - - - - - - - - - - - C & NC RR Corp. [CNUR] - - - - - - - - - - - - CHICAGO, FT. WAYNE & EASTERN [CFE ] 5 - 2 1 - - 2 - - 2 - 2 CMC RR Inc. [CMC ] 7 - 3 6 - 2 - - - 1 - 1 Caddo Valley RR Co. [CVYR] 1 - 1 - - - - - - 1 - 1 Caldwell County RR Co. [CWCY] - - - - - - - - - - - - Calera & Shelby RR & Museum, Inc. [CSMX] 1 - 1 - - - - - - 1 - 1 California Northern RR Co. [CFNR] 1 - - - - - 1 - - - - - California State RR Museum [CSRM] - - - - - - - - - - - - Camp Chase Industrial RR Corp [CCRA] 3 - 2 1 - - - - - 2 - 2 Caney Fork & Western RR [CFWR] - - - - - - - - - - - - Canon City And Royal Gorge RR, LLC [CRRX] 5 - 5 - - - - - - 5 - 5 Canton RR Co. [CTN ] 1 - 1 - - - - - - 1 - 1 Cape Cod Central [CCCX] - - - - - - - - - - - - Capital Metropolitan Transportation Authority [CMTY] 1 - 1 - - - - - - 1 - 1 Cargill Inc Iowa Falls [CGIF] - - - - - - - - - - - - Cargill Inc. GOSCNA [CGIV] - - - - - - - - - - - - Carolina Coastal Rwy, Inc. [CLNA] 1 1 - - - - 1 1 - - - - Carolina Southern RR Co., The [CALA] 2 - - 2 - - - - - - - - Carrizo Gorge Rwy Inc. [CZRY] - - - - - - - - - - - - Carthage, Knightstown & Shirley RR [CKSI] - - - - - - - - - - - - Cascade & Columbia River RR [CSCD] - - - - - - - - - - - - Cass Scenic [CASS] 6 - 6 - - - - - - 6 - 6 Catskill Mountain RR [CMRR] - - - - - - - - - - - - Cedar Rapids & Iowa City Rwy Co. [CIC ] 6 - - 4 - - 2 - - - - - Central Calfornia Traction Co. [CCT ] 1 - - - - - 1 - - - - - Central Illinois RR Co. [CIRY] - - - - - - - - - - - - Central Indiana & Western RR Co. [CEIW] - - - - - - - - - - - - Central Midland Rwy Co. [CMR ] - - - - - - - - - - - -
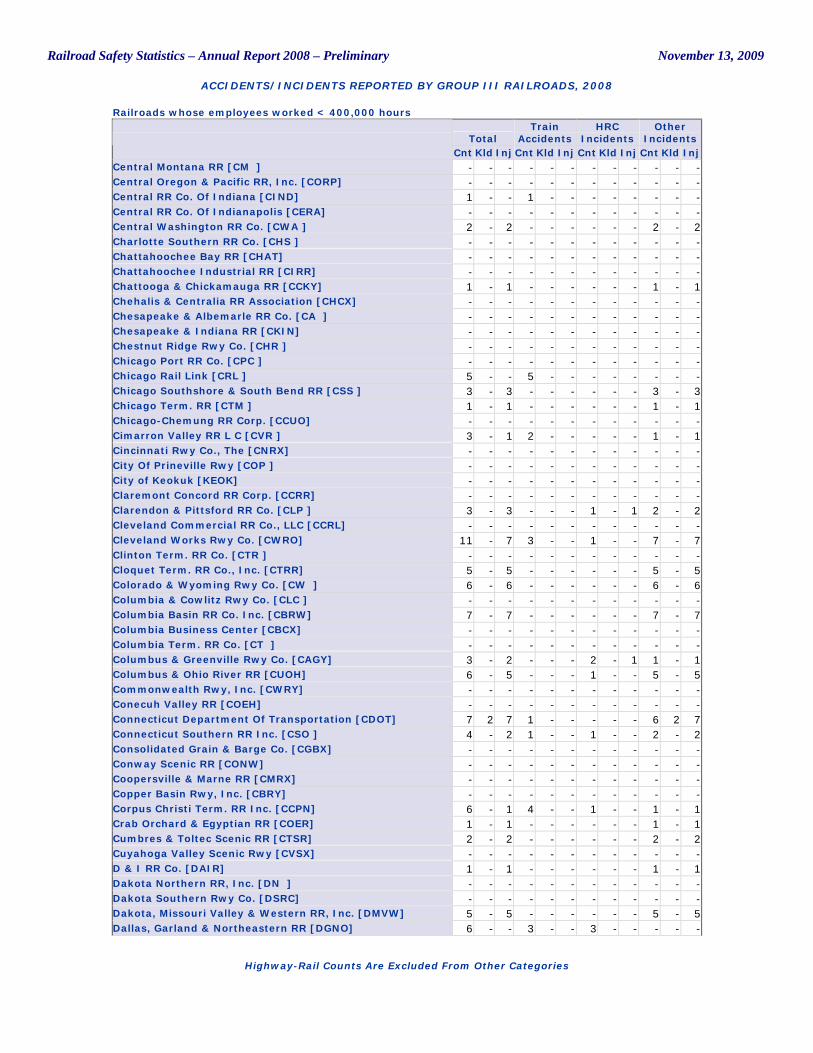
Railroad Safety Statistics – Annual Report 2008 – Preliminary November 13, 2009
ACCIDENTS/INCIDENTS REPORTED BY GROUP III RAILROADS, 2008
Highway-Rail Counts Are Excluded From Other Categories
Railroads whose employees worked < 400,000 hours
Total Train
Accidents HRC
Incidents Other
Incidents Cnt Kld Inj Cnt Kld Inj Cnt Kld Inj Cnt Kld Inj
Central Montana RR [CM ] - - - - - - - - - - - - Central Oregon & Pacific RR, Inc. [CORP] - - - - - - - - - - - - Central RR Co. Of Indiana [CIND] 1 - - 1 - - - - - - - - Central RR Co. Of Indianapolis [CERA] - - - - - - - - - - - - Central Washington RR Co. [CWA ] 2 - 2 - - - - - - 2 - 2 Charlotte Southern RR Co. [CHS ] - - - - - - - - - - - - Chattahoochee Bay RR [CHAT] - - - - - - - - - - - - Chattahoochee Industrial RR [CIRR] - - - - - - - - - - - - Chattooga & Chickamauga RR [CCKY] 1 - 1 - - - - - - 1 - 1 Chehalis & Centralia RR Association [CHCX] - - - - - - - - - - - - Chesapeake & Albemarle RR Co. [CA ] - - - - - - - - - - - - Chesapeake & Indiana RR [CKIN] - - - - - - - - - - - - Chestnut Ridge Rwy Co. [CHR ] - - - - - - - - - - - - Chicago Port RR Co. [CPC ] - - - - - - - - - - - - Chicago Rail Link [CRL ] 5 - - 5 - - - - - - - - Chicago Southshore & South Bend RR [CSS ] 3 - 3 - - - - - - 3 - 3 Chicago Term. RR [CTM ] 1 - 1 - - - - - - 1 - 1 Chicago-Chemung RR Corp. [CCUO] - - - - - - - - - - - - Cimarron Valley RR L C [CVR ] 3 - 1 2 - - - - - 1 - 1 Cincinnati Rwy Co., The [CNRX] - - - - - - - - - - - - City Of Prineville Rwy [COP ] - - - - - - - - - - - - City of Keokuk [KEOK] - - - - - - - - - - - - Claremont Concord RR Corp. [CCRR] - - - - - - - - - - - - Clarendon & Pittsford RR Co. [CLP ] 3 - 3 - - - 1 - 1 2 - 2 Cleveland Commercial RR Co., LLC [CCRL] - - - - - - - - - - - - Cleveland Works Rwy Co. [CWRO] 11 - 7 3 - - 1 - - 7 - 7 Clinton Term. RR Co. [CTR ] - - - - - - - - - - - - Cloquet Term. RR Co., Inc. [CTRR] 5 - 5 - - - - - - 5 - 5 Colorado & Wyoming Rwy Co. [CW ] 6 - 6 - - - - - - 6 - 6 Columbia & Cowlitz Rwy Co. [CLC ] - - - - - - - - - - - - Columbia Basin RR Co. Inc. [CBRW] 7 - 7 - - - - - - 7 - 7 Columbia Business Center [CBCX] - - - - - - - - - - - - Columbia Term. RR Co. [CT ] - - - - - - - - - - - - Columbus & Greenville Rwy Co. [CAGY] 3 - 2 - - - 2 - 1 1 - 1 Columbus & Ohio River RR [CUOH] 6 - 5 - - - 1 - - 5 - 5 Commonwealth Rwy, Inc. [CWRY] - - - - - - - - - - - - Conecuh Valley RR [COEH] - - - - - - - - - - - - Connecticut Department Of Transportation [CDOT] 7 2 7 1 - - - - - 6 2 7 Connecticut Southern RR Inc. [CSO ] 4 - 2 1 - - 1 - - 2 - 2 Consolidated Grain & Barge Co. [CGBX] - - - - - - - - - - - - Conway Scenic RR [CONW] - - - - - - - - - - - - Coopersville & Marne RR [CMRX] - - - - - - - - - - - - Copper Basin Rwy, Inc. [CBRY] - - - - - - - - - - - - Corpus Christi Term. RR Inc. [CCPN] 6 - 1 4 - - 1 - - 1 - 1 Crab Orchard & Egyptian RR [COER] 1 - 1 - - - - - - 1 - 1 Cumbres & Toltec Scenic RR [CTSR] 2 - 2 - - - - - - 2 - 2 Cuyahoga Valley Scenic Rwy [CVSX] - - - - - - - - - - - - D & I RR Co. [DAIR] 1 - 1 - - - - - - 1 - 1 Dakota Northern RR, Inc. [DN ] - - - - - - - - - - - - Dakota Southern Rwy Co. [DSRC] - - - - - - - - - - - - Dakota, Missouri Valley & Western RR, Inc. [DMVW] 5 - 5 - - - - - - 5 - 5 Dallas, Garland & Northeastern RR [DGNO] 6 - - 3 - - 3 - - - - -
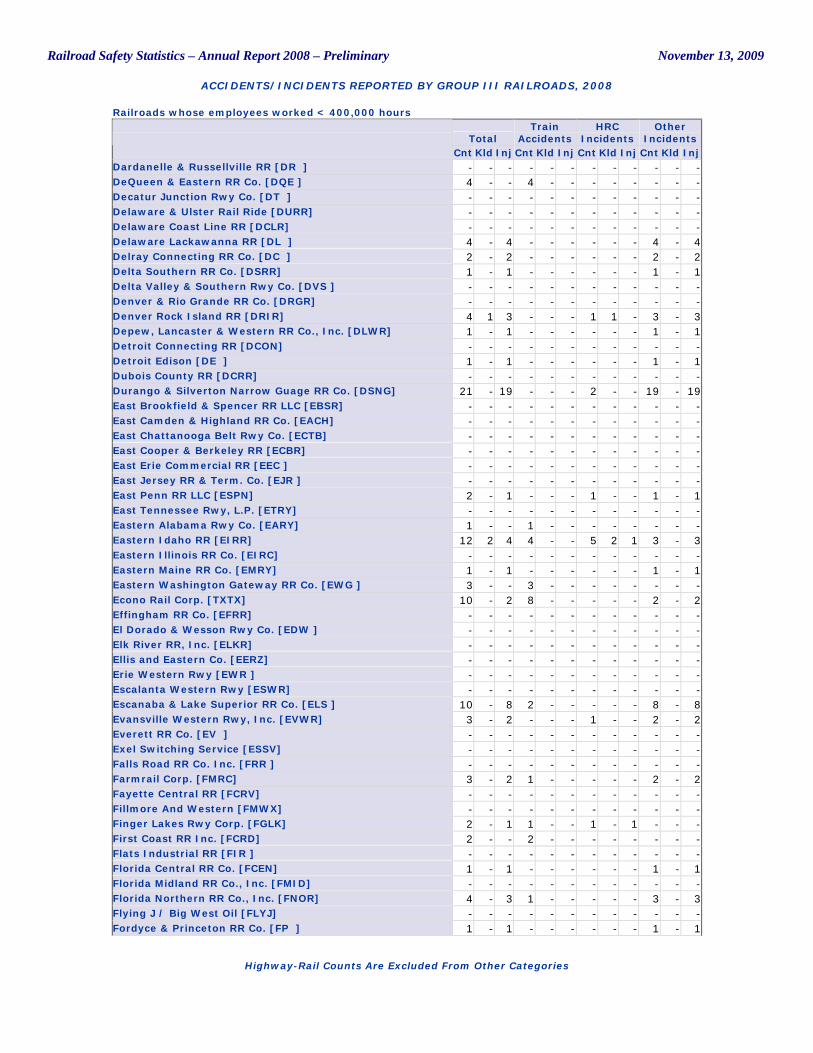
Railroad Safety Statistics – Annual Report 2008 – Preliminary November 13, 2009
ACCIDENTS/INCIDENTS REPORTED BY GROUP III RAILROADS, 2008
Highway-Rail Counts Are Excluded From Other Categories
Railroads whose employees worked < 400,000 hours
Total Train
Accidents HRC
Incidents Other
Incidents Cnt Kld Inj Cnt Kld Inj Cnt Kld Inj Cnt Kld Inj
Dardanelle & Russellville RR [DR ] - - - - - - - - - - - - DeQueen & Eastern RR Co. [DQE ] 4 - - 4 - - - - - - - - Decatur Junction Rwy Co. [DT ] - - - - - - - - - - - - Delaware & Ulster Rail Ride [DURR] - - - - - - - - - - - - Delaware Coast Line RR [DCLR] - - - - - - - - - - - - Delaware Lackawanna RR [DL ] 4 - 4 - - - - - - 4 - 4 Delray Connecting RR Co. [DC ] 2 - 2 - - - - - - 2 - 2 Delta Southern RR Co. [DSRR] 1 - 1 - - - - - - 1 - 1 Delta Valley & Southern Rwy Co. [DVS ] - - - - - - - - - - - - Denver & Rio Grande RR Co. [DRGR] - - - - - - - - - - - - Denver Rock Island RR [DRIR] 4 1 3 - - - 1 1 - 3 - 3 Depew, Lancaster & Western RR Co., Inc. [DLWR] 1 - 1 - - - - - - 1 - 1 Detroit Connecting RR [DCON] - - - - - - - - - - - - Detroit Edison [DE ] 1 - 1 - - - - - - 1 - 1 Dubois County RR [DCRR] - - - - - - - - - - - - Durango & Silverton Narrow Guage RR Co. [DSNG] 21 - 19 - - - 2 - - 19 - 19 East Brookfield & Spencer RR LLC [EBSR] - - - - - - - - - - - - East Camden & Highland RR Co. [EACH] - - - - - - - - - - - - East Chattanooga Belt Rwy Co. [ECTB] - - - - - - - - - - - - East Cooper & Berkeley RR [ECBR] - - - - - - - - - - - - East Erie Commercial RR [EEC ] - - - - - - - - - - - - East Jersey RR & Term. Co. [EJR ] - - - - - - - - - - - - East Penn RR LLC [ESPN] 2 - 1 - - - 1 - - 1 - 1 East Tennessee Rwy, L.P. [ETRY] - - - - - - - - - - - - Eastern Alabama Rwy Co. [EARY] 1 - - 1 - - - - - - - - Eastern Idaho RR [EIRR] 12 2 4 4 - - 5 2 1 3 - 3 Eastern Illinois RR Co. [EIRC] - - - - - - - - - - - - Eastern Maine RR Co. [EMRY] 1 - 1 - - - - - - 1 - 1 Eastern Washington Gateway RR Co. [EWG ] 3 - - 3 - - - - - - - - Econo Rail Corp. [TXTX] 10 - 2 8 - - - - - 2 - 2 Effingham RR Co. [EFRR] - - - - - - - - - - - - El Dorado & Wesson Rwy Co. [EDW ] - - - - - - - - - - - - Elk River RR, Inc. [ELKR] - - - - - - - - - - - - Ellis and Eastern Co. [EERZ] - - - - - - - - - - - - Erie Western Rwy [EWR ] - - - - - - - - - - - - Escalanta Western Rwy [ESWR] - - - - - - - - - - - - Escanaba & Lake Superior RR Co. [ELS ] 10 - 8 2 - - - - - 8 - 8 Evansville Western Rwy, Inc. [EVWR] 3 - 2 - - - 1 - - 2 - 2 Everett RR Co. [EV ] - - - - - - - - - - - - Exel Switching Service [ESSV] - - - - - - - - - - - - Falls Road RR Co. Inc. [FRR ] - - - - - - - - - - - - Farmrail Corp. [FMRC] 3 - 2 1 - - - - - 2 - 2 Fayette Central RR [FCRV] - - - - - - - - - - - - Fillmore And Western [FMWX] - - - - - - - - - - - - Finger Lakes Rwy Corp. [FGLK] 2 - 1 1 - - 1 - 1 - - - First Coast RR Inc. [FCRD] 2 - - 2 - - - - - - - - Flats Industrial RR [FIR ] - - - - - - - - - - - - Florida Central RR Co. [FCEN] 1 - 1 - - - - - - 1 - 1 Florida Midland RR Co., Inc. [FMID] - - - - - - - - - - - - Florida Northern RR Co., Inc. [FNOR] 4 - 3 1 - - - - - 3 - 3 Flying J / Big West Oil [FLYJ] - - - - - - - - - - - - Fordyce & Princeton RR Co. [FP ] 1 - 1 - - - - - - 1 - 1
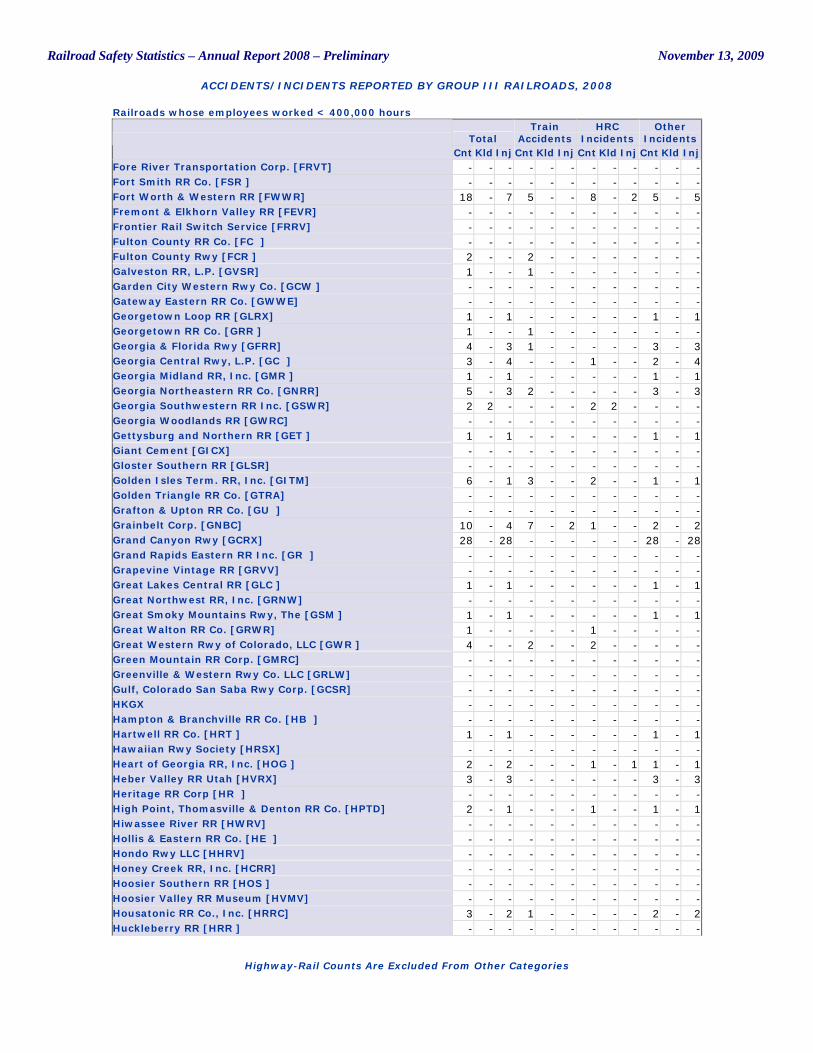
Railroad Safety Statistics – Annual Report 2008 – Preliminary November 13, 2009
ACCIDENTS/INCIDENTS REPORTED BY GROUP III RAILROADS, 2008
Highway-Rail Counts Are Excluded From Other Categories
Railroads whose employees worked < 400,000 hours
Total Train
Accidents HRC
Incidents Other
Incidents Cnt Kld Inj Cnt Kld Inj Cnt Kld Inj Cnt Kld Inj
Fore River Transportation Corp. [FRVT] - - - - - - - - - - - - Fort Smith RR Co. [FSR ] - - - - - - - - - - - - Fort Worth & Western RR [FWWR] 18 - 7 5 - - 8 - 2 5 - 5 Fremont & Elkhorn Valley RR [FEVR] - - - - - - - - - - - - Frontier Rail Switch Service [FRRV] - - - - - - - - - - - - Fulton County RR Co. [FC ] - - - - - - - - - - - - Fulton County Rwy [FCR ] 2 - - 2 - - - - - - - - Galveston RR, L.P. [GVSR] 1 - - 1 - - - - - - - - Garden City Western Rwy Co. [GCW ] - - - - - - - - - - - - Gateway Eastern RR Co. [GWWE] - - - - - - - - - - - - Georgetown Loop RR [GLRX] 1 - 1 - - - - - - 1 - 1 Georgetown RR Co. [GRR ] 1 - - 1 - - - - - - - - Georgia & Florida Rwy [GFRR] 4 - 3 1 - - - - - 3 - 3 Georgia Central Rwy, L.P. [GC ] 3 - 4 - - - 1 - - 2 - 4 Georgia Midland RR, Inc. [GMR ] 1 - 1 - - - - - - 1 - 1 Georgia Northeastern RR Co. [GNRR] 5 - 3 2 - - - - - 3 - 3 Georgia Southwestern RR Inc. [GSWR] 2 2 - - - - 2 2 - - - - Georgia Woodlands RR [GWRC] - - - - - - - - - - - - Gettysburg and Northern RR [GET ] 1 - 1 - - - - - - 1 - 1 Giant Cement [GICX] - - - - - - - - - - - - Gloster Southern RR [GLSR] - - - - - - - - - - - - Golden Isles Term. RR, Inc. [GITM] 6 - 1 3 - - 2 - - 1 - 1 Golden Triangle RR Co. [GTRA] - - - - - - - - - - - - Grafton & Upton RR Co. [GU ] - - - - - - - - - - - - Grainbelt Corp. [GNBC] 10 - 4 7 - 2 1 - - 2 - 2 Grand Canyon Rwy [GCRX] 28 - 28 - - - - - - 28 - 28 Grand Rapids Eastern RR Inc. [GR ] - - - - - - - - - - - - Grapevine Vintage RR [GRVV] - - - - - - - - - - - - Great Lakes Central RR [GLC ] 1 - 1 - - - - - - 1 - 1 Great Northwest RR, Inc. [GRNW] - - - - - - - - - - - - Great Smoky Mountains Rwy, The [GSM ] 1 - 1 - - - - - - 1 - 1 Great Walton RR Co. [GRWR] 1 - - - - - 1 - - - - - Great Western Rwy of Colorado, LLC [GWR ] 4 - - 2 - - 2 - - - - - Green Mountain RR Corp. [GMRC] - - - - - - - - - - - - Greenville & Western Rwy Co. LLC [GRLW] - - - - - - - - - - - - Gulf, Colorado San Saba Rwy Corp. [GCSR] - - - - - - - - - - - - HKGX - - - - - - - - - - - - Hampton & Branchville RR Co. [HB ] - - - - - - - - - - - - Hartwell RR Co. [HRT ] 1 - 1 - - - - - - 1 - 1 Hawaiian Rwy Society [HRSX] - - - - - - - - - - - - Heart of Georgia RR, Inc. [HOG ] 2 - 2 - - - 1 - 1 1 - 1 Heber Valley RR Utah [HVRX] 3 - 3 - - - - - - 3 - 3 Heritage RR Corp [HR ] - - - - - - - - - - - - High Point, Thomasville & Denton RR Co. [HPTD] 2 - 1 - - - 1 - - 1 - 1 Hiwassee River RR [HWRV] - - - - - - - - - - - - Hollis & Eastern RR Co. [HE ] - - - - - - - - - - - - Hondo Rwy LLC [HHRV] - - - - - - - - - - - - Honey Creek RR, Inc. [HCRR] - - - - - - - - - - - - Hoosier Southern RR [HOS ] - - - - - - - - - - - - Hoosier Valley RR Museum [HVMV] - - - - - - - - - - - - Housatonic RR Co., Inc. [HRRC] 3 - 2 1 - - - - - 2 - 2 Huckleberry RR [HRR ] - - - - - - - - - - - -
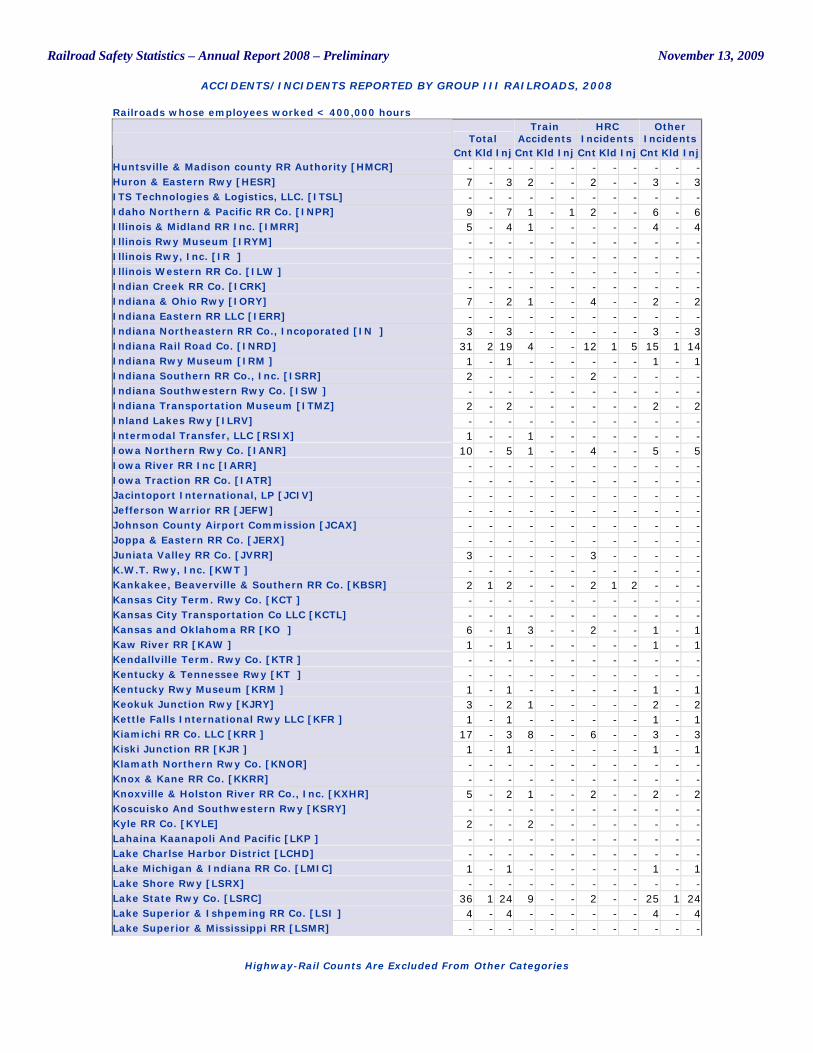
Railroad Safety Statistics – Annual Report 2008 – Preliminary November 13, 2009
ACCIDENTS/INCIDENTS REPORTED BY GROUP III RAILROADS, 2008
Highway-Rail Counts Are Excluded From Other Categories
Railroads whose employees worked < 400,000 hours
Total Train
Accidents HRC
Incidents Other
Incidents Cnt Kld Inj Cnt Kld Inj Cnt Kld Inj Cnt Kld Inj
Huntsville & Madison county RR Authority [HMCR] - - - - - - - - - - - - Huron & Eastern Rwy [HESR] 7 - 3 2 - - 2 - - 3 - 3 ITS Technologies & Logistics, LLC. [ITSL] - - - - - - - - - - - - Idaho Northern & Pacific RR Co. [INPR] 9 - 7 1 - 1 2 - - 6 - 6 Illinois & Midland RR Inc. [IMRR] 5 - 4 1 - - - - - 4 - 4 Illinois Rwy Museum [IRYM] - - - - - - - - - - - - Illinois Rwy, Inc. [IR ] - - - - - - - - - - - - Illinois Western RR Co. [ILW ] - - - - - - - - - - - - Indian Creek RR Co. [ICRK] - - - - - - - - - - - - Indiana & Ohio Rwy [IORY] 7 - 2 1 - - 4 - - 2 - 2 Indiana Eastern RR LLC [IERR] - - - - - - - - - - - - Indiana Northeastern RR Co., Incoporated [IN ] 3 - 3 - - - - - - 3 - 3 Indiana Rail Road Co. [INRD] 31 2 19 4 - - 12 1 5 15 1 14 Indiana Rwy Museum [IRM ] 1 - 1 - - - - - - 1 - 1 Indiana Southern RR Co., Inc. [ISRR] 2 - - - - - 2 - - - - - Indiana Southwestern Rwy Co. [ISW ] - - - - - - - - - - - - Indiana Transportation Museum [ITMZ] 2 - 2 - - - - - - 2 - 2 Inland Lakes Rwy [ILRV] - - - - - - - - - - - - Intermodal Transfer, LLC [RSIX] 1 - - 1 - - - - - - - - Iowa Northern Rwy Co. [IANR] 10 - 5 1 - - 4 - - 5 - 5 Iowa River RR Inc [IARR] - - - - - - - - - - - - Iowa Traction RR Co. [IATR] - - - - - - - - - - - - Jacintoport International, LP [JCIV] - - - - - - - - - - - - Jefferson Warrior RR [JEFW] - - - - - - - - - - - - Johnson County Airport Commission [JCAX] - - - - - - - - - - - - Joppa & Eastern RR Co. [JERX] - - - - - - - - - - - - Juniata Valley RR Co. [JVRR] 3 - - - - - 3 - - - - - K.W.T. Rwy, Inc. [KWT ] - - - - - - - - - - - - Kankakee, Beaverville & Southern RR Co. [KBSR] 2 1 2 - - - 2 1 2 - - - Kansas City Term. Rwy Co. [KCT ] - - - - - - - - - - - - Kansas City Transportation Co LLC [KCTL] - - - - - - - - - - - - Kansas and Oklahoma RR [KO ] 6 - 1 3 - - 2 - - 1 - 1 Kaw River RR [KAW ] 1 - 1 - - - - - - 1 - 1 Kendallville Term. Rwy Co. [KTR ] - - - - - - - - - - - - Kentucky & Tennessee Rwy [KT ] - - - - - - - - - - - - Kentucky Rwy Museum [KRM ] 1 - 1 - - - - - - 1 - 1 Keokuk Junction Rwy [KJRY] 3 - 2 1 - - - - - 2 - 2 Kettle Falls International Rwy LLC [KFR ] 1 - 1 - - - - - - 1 - 1 Kiamichi RR Co. LLC [KRR ] 17 - 3 8 - - 6 - - 3 - 3 Kiski Junction RR [KJR ] 1 - 1 - - - - - - 1 - 1 Klamath Northern Rwy Co. [KNOR] - - - - - - - - - - - - Knox & Kane RR Co. [KKRR] - - - - - - - - - - - - Knoxville & Holston River RR Co., Inc. [KXHR] 5 - 2 1 - - 2 - - 2 - 2 Koscuisko And Southwestern Rwy [KSRY] - - - - - - - - - - - - Kyle RR Co. [KYLE] 2 - - 2 - - - - - - - - Lahaina Kaanapoli And Pacific [LKP ] - - - - - - - - - - - - Lake Charlse Harbor District [LCHD] - - - - - - - - - - - - Lake Michigan & Indiana RR Co. [LMIC] 1 - 1 - - - - - - 1 - 1 Lake Shore Rwy [LSRX] - - - - - - - - - - - - Lake State Rwy Co. [LSRC] 36 1 24 9 - - 2 - - 25 1 24 Lake Superior & Ishpeming RR Co. [LSI ] 4 - 4 - - - - - - 4 - 4 Lake Superior & Mississippi RR [LSMR] - - - - - - - - - - - -
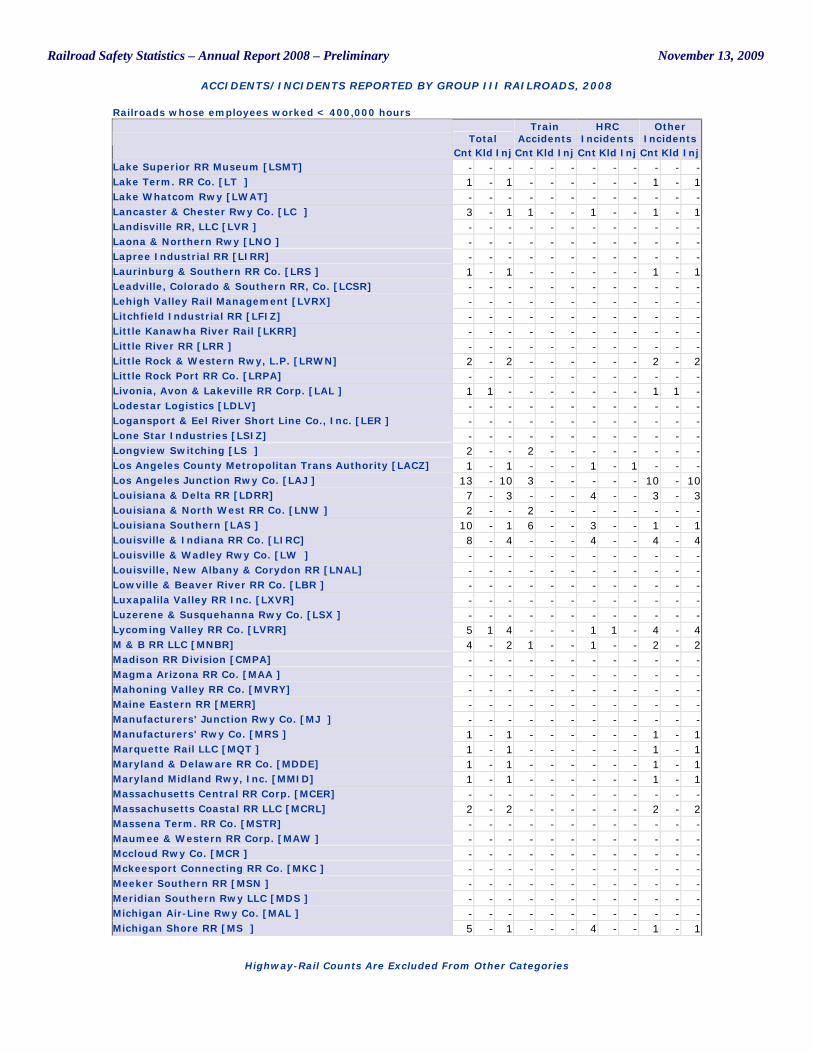
Railroad Safety Statistics – Annual Report 2008 – Preliminary November 13, 2009
ACCIDENTS/INCIDENTS REPORTED BY GROUP III RAILROADS, 2008
Highway-Rail Counts Are Excluded From Other Categories
Railroads whose employees worked < 400,000 hours
Total Train
Accidents HRC
Incidents Other
Incidents Cnt Kld Inj Cnt Kld Inj Cnt Kld Inj Cnt Kld Inj
Lake Superior RR Museum [LSMT] - - - - - - - - - - - - Lake Term. RR Co. [LT ] 1 - 1 - - - - - - 1 - 1 Lake Whatcom Rwy [LWAT] - - - - - - - - - - - - Lancaster & Chester Rwy Co. [LC ] 3 - 1 1 - - 1 - - 1 - 1 Landisville RR, LLC [LVR ] - - - - - - - - - - - - Laona & Northern Rwy [LNO ] - - - - - - - - - - - - Lapree Industrial RR [LIRR] - - - - - - - - - - - - Laurinburg & Southern RR Co. [LRS ] 1 - 1 - - - - - - 1 - 1 Leadville, Colorado & Southern RR, Co. [LCSR] - - - - - - - - - - - - Lehigh Valley Rail Management [LVRX] - - - - - - - - - - - - Litchfield Industrial RR [LFIZ] - - - - - - - - - - - - Little Kanawha River Rail [LKRR] - - - - - - - - - - - - Little River RR [LRR ] - - - - - - - - - - - - Little Rock & Western Rwy, L.P. [LRWN] 2 - 2 - - - - - - 2 - 2 Little Rock Port RR Co. [LRPA] - - - - - - - - - - - - Livonia, Avon & Lakeville RR Corp. [LAL ] 1 1 - - - - - - - 1 1 - Lodestar Logistics [LDLV] - - - - - - - - - - - - Logansport & Eel River Short Line Co., Inc. [LER ] - - - - - - - - - - - - Lone Star Industries [LSIZ] - - - - - - - - - - - - Longview Switching [LS ] 2 - - 2 - - - - - - - - Los Angeles County Metropolitan Trans Authority [LACZ] 1 - 1 - - - 1 - 1 - - - Los Angeles Junction Rwy Co. [LAJ ] 13 - 10 3 - - - - - 10 - 10 Louisiana & Delta RR [LDRR] 7 - 3 - - - 4 - - 3 - 3 Louisiana & North West RR Co. [LNW ] 2 - - 2 - - - - - - - - Louisiana Southern [LAS ] 10 - 1 6 - - 3 - - 1 - 1 Louisville & Indiana RR Co. [LIRC] 8 - 4 - - - 4 - - 4 - 4 Louisville & Wadley Rwy Co. [LW ] - - - - - - - - - - - - Louisville, New Albany & Corydon RR [LNAL] - - - - - - - - - - - - Lowville & Beaver River RR Co. [LBR ] - - - - - - - - - - - - Luxapalila Valley RR Inc. [LXVR] - - - - - - - - - - - - Luzerene & Susquehanna Rwy Co. [LSX ] - - - - - - - - - - - - Lycoming Valley RR Co. [LVRR] 5 1 4 - - - 1 1 - 4 - 4 M & B RR LLC [MNBR] 4 - 2 1 - - 1 - - 2 - 2 Madison RR Division [CMPA] - - - - - - - - - - - - Magma Arizona RR Co. [MAA ] - - - - - - - - - - - - Mahoning Valley RR Co. [MVRY] - - - - - - - - - - - - Maine Eastern RR [MERR] - - - - - - - - - - - - Manufacturers' Junction Rwy Co. [MJ ] - - - - - - - - - - - - Manufacturers' Rwy Co. [MRS ] 1 - 1 - - - - - - 1 - 1 Marquette Rail LLC [MQT ] 1 - 1 - - - - - - 1 - 1 Maryland & Delaware RR Co. [MDDE] 1 - 1 - - - - - - 1 - 1 Maryland Midland Rwy, Inc. [MMID] 1 - 1 - - - - - - 1 - 1 Massachusetts Central RR Corp. [MCER] - - - - - - - - - - - - Massachusetts Coastal RR LLC [MCRL] 2 - 2 - - - - - - 2 - 2 Massena Term. RR Co. [MSTR] - - - - - - - - - - - - Maumee & Western RR Corp. [MAW ] - - - - - - - - - - - - Mccloud Rwy Co. [MCR ] - - - - - - - - - - - - Mckeesport Connecting RR Co. [MKC ] - - - - - - - - - - - - Meeker Southern RR [MSN ] - - - - - - - - - - - - Meridian Southern Rwy LLC [MDS ] - - - - - - - - - - - - Michigan Air-Line Rwy Co. [MAL ] - - - - - - - - - - - - Michigan Shore RR [MS ] 5 - 1 - - - 4 - - 1 - 1
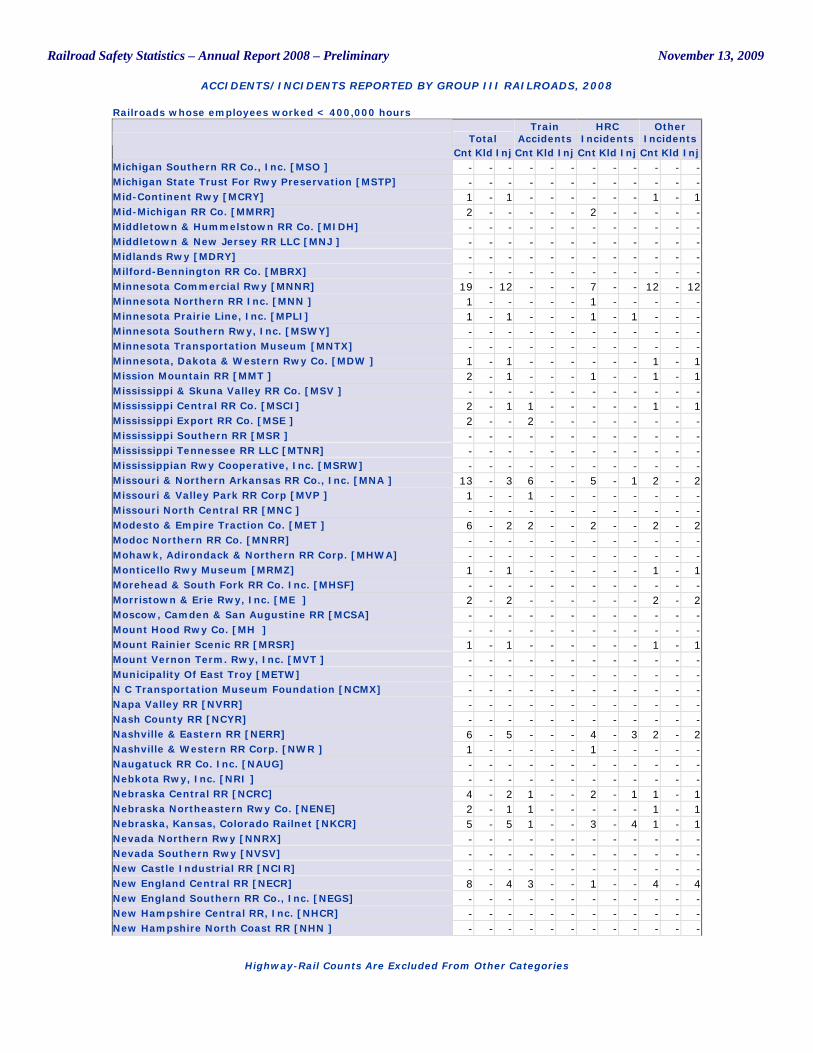
Railroad Safety Statistics – Annual Report 2008 – Preliminary November 13, 2009
ACCIDENTS/INCIDENTS REPORTED BY GROUP III RAILROADS, 2008
Highway-Rail Counts Are Excluded From Other Categories
Railroads whose employees worked < 400,000 hours
Total Train
Accidents HRC
Incidents Other
Incidents Cnt Kld Inj Cnt Kld Inj Cnt Kld Inj Cnt Kld Inj
Michigan Southern RR Co., Inc. [MSO ] - - - - - - - - - - - - Michigan State Trust For Rwy Preservation [MSTP] - - - - - - - - - - - - Mid-Continent Rwy [MCRY] 1 - 1 - - - - - - 1 - 1 Mid-Michigan RR Co. [MMRR] 2 - - - - - 2 - - - - - Middletown & Hummelstown RR Co. [MIDH] - - - - - - - - - - - - Middletown & New Jersey RR LLC [MNJ ] - - - - - - - - - - - - Midlands Rwy [MDRY] - - - - - - - - - - - - Milford-Bennington RR Co. [MBRX] - - - - - - - - - - - - Minnesota Commercial Rwy [MNNR] 19 - 12 - - - 7 - - 12 - 12 Minnesota Northern RR Inc. [MNN ] 1 - - - - - 1 - - - - - Minnesota Prairie Line, Inc. [MPLI] 1 - 1 - - - 1 - 1 - - - Minnesota Southern Rwy, Inc. [MSWY] - - - - - - - - - - - - Minnesota Transportation Museum [MNTX] - - - - - - - - - - - - Minnesota, Dakota & Western Rwy Co. [MDW ] 1 - 1 - - - - - - 1 - 1 Mission Mountain RR [MMT ] 2 - 1 - - - 1 - - 1 - 1 Mississippi & Skuna Valley RR Co. [MSV ] - - - - - - - - - - - - Mississippi Central RR Co. [MSCI] 2 - 1 1 - - - - - 1 - 1 Mississippi Export RR Co. [MSE ] 2 - - 2 - - - - - - - - Mississippi Southern RR [MSR ] - - - - - - - - - - - - Mississippi Tennessee RR LLC [MTNR] - - - - - - - - - - - - Mississippian Rwy Cooperative, Inc. [MSRW] - - - - - - - - - - - - Missouri & Northern Arkansas RR Co., Inc. [MNA ] 13 - 3 6 - - 5 - 1 2 - 2 Missouri & Valley Park RR Corp [MVP ] 1 - - 1 - - - - - - - - Missouri North Central RR [MNC ] - - - - - - - - - - - - Modesto & Empire Traction Co. [MET ] 6 - 2 2 - - 2 - - 2 - 2 Modoc Northern RR Co. [MNRR] - - - - - - - - - - - - Mohawk, Adirondack & Northern RR Corp. [MHWA] - - - - - - - - - - - - Monticello Rwy Museum [MRMZ] 1 - 1 - - - - - - 1 - 1 Morehead & South Fork RR Co. Inc. [MHSF] - - - - - - - - - - - - Morristown & Erie Rwy, Inc. [ME ] 2 - 2 - - - - - - 2 - 2 Moscow, Camden & San Augustine RR [MCSA] - - - - - - - - - - - - Mount Hood Rwy Co. [MH ] - - - - - - - - - - - - Mount Rainier Scenic RR [MRSR] 1 - 1 - - - - - - 1 - 1 Mount Vernon Term. Rwy, Inc. [MVT ] - - - - - - - - - - - - Municipality Of East Troy [METW] - - - - - - - - - - - - N C Transportation Museum Foundation [NCMX] - - - - - - - - - - - - Napa Valley RR [NVRR] - - - - - - - - - - - - Nash County RR [NCYR] - - - - - - - - - - - - Nashville & Eastern RR [NERR] 6 - 5 - - - 4 - 3 2 - 2 Nashville & Western RR Corp. [NWR ] 1 - - - - - 1 - - - - - Naugatuck RR Co. Inc. [NAUG] - - - - - - - - - - - - Nebkota Rwy, Inc. [NRI ] - - - - - - - - - - - - Nebraska Central RR [NCRC] 4 - 2 1 - - 2 - 1 1 - 1 Nebraska Northeastern Rwy Co. [NENE] 2 - 1 1 - - - - - 1 - 1 Nebraska, Kansas, Colorado Railnet [NKCR] 5 - 5 1 - - 3 - 4 1 - 1 Nevada Northern Rwy [NNRX] - - - - - - - - - - - - Nevada Southern Rwy [NVSV] - - - - - - - - - - - - New Castle Industrial RR [NCIR] - - - - - - - - - - - - New England Central RR [NECR] 8 - 4 3 - - 1 - - 4 - 4 New England Southern RR Co., Inc. [NEGS] - - - - - - - - - - - - New Hampshire Central RR, Inc. [NHCR] - - - - - - - - - - - - New Hampshire North Coast RR [NHN ] - - - - - - - - - - - -
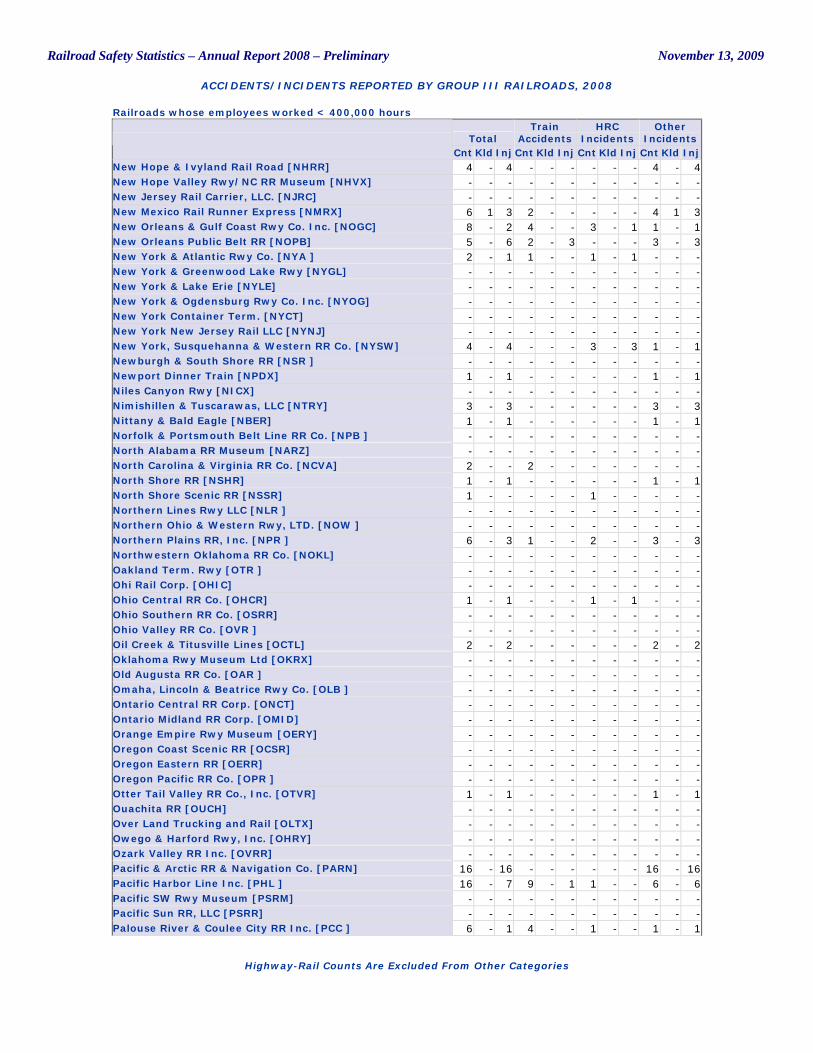
Railroad Safety Statistics – Annual Report 2008 – Preliminary November 13, 2009
ACCIDENTS/INCIDENTS REPORTED BY GROUP III RAILROADS, 2008
Highway-Rail Counts Are Excluded From Other Categories
Railroads whose employees worked < 400,000 hours
Total Train
Accidents HRC
Incidents Other
Incidents Cnt Kld Inj Cnt Kld Inj Cnt Kld Inj Cnt Kld Inj
New Hope & Ivyland Rail Road [NHRR] 4 - 4 - - - - - - 4 - 4 New Hope Valley Rwy/NC RR Museum [NHVX] - - - - - - - - - - - - New Jersey Rail Carrier, LLC. [NJRC] - - - - - - - - - - - - New Mexico Rail Runner Express [NMRX] 6 1 3 2 - - - - - 4 1 3 New Orleans & Gulf Coast Rwy Co. Inc. [NOGC] 8 - 2 4 - - 3 - 1 1 - 1 New Orleans Public Belt RR [NOPB] 5 - 6 2 - 3 - - - 3 - 3 New York & Atlantic Rwy Co. [NYA ] 2 - 1 1 - - 1 - 1 - - - New York & Greenwood Lake Rwy [NYGL] - - - - - - - - - - - - New York & Lake Erie [NYLE] - - - - - - - - - - - - New York & Ogdensburg Rwy Co. Inc. [NYOG] - - - - - - - - - - - - New York Container Term. [NYCT] - - - - - - - - - - - - New York New Jersey Rail LLC [NYNJ] - - - - - - - - - - - - New York, Susquehanna & Western RR Co. [NYSW] 4 - 4 - - - 3 - 3 1 - 1 Newburgh & South Shore RR [NSR ] - - - - - - - - - - - - Newport Dinner Train [NPDX] 1 - 1 - - - - - - 1 - 1 Niles Canyon Rwy [NICX] - - - - - - - - - - - - Nimishillen & Tuscarawas, LLC [NTRY] 3 - 3 - - - - - - 3 - 3 Nittany & Bald Eagle [NBER] 1 - 1 - - - - - - 1 - 1 Norfolk & Portsmouth Belt Line RR Co. [NPB ] - - - - - - - - - - - - North Alabama RR Museum [NARZ] - - - - - - - - - - - - North Carolina & Virginia RR Co. [NCVA] 2 - - 2 - - - - - - - - North Shore RR [NSHR] 1 - 1 - - - - - - 1 - 1 North Shore Scenic RR [NSSR] 1 - - - - - 1 - - - - - Northern Lines Rwy LLC [NLR ] - - - - - - - - - - - - Northern Ohio & Western Rwy, LTD. [NOW ] - - - - - - - - - - - - Northern Plains RR, Inc. [NPR ] 6 - 3 1 - - 2 - - 3 - 3 Northwestern Oklahoma RR Co. [NOKL] - - - - - - - - - - - - Oakland Term. Rwy [OTR ] - - - - - - - - - - - - Ohi Rail Corp. [OHIC] - - - - - - - - - - - - Ohio Central RR Co. [OHCR] 1 - 1 - - - 1 - 1 - - - Ohio Southern RR Co. [OSRR] - - - - - - - - - - - - Ohio Valley RR Co. [OVR ] - - - - - - - - - - - - Oil Creek & Titusville Lines [OCTL] 2 - 2 - - - - - - 2 - 2 Oklahoma Rwy Museum Ltd [OKRX] - - - - - - - - - - - - Old Augusta RR Co. [OAR ] - - - - - - - - - - - - Omaha, Lincoln & Beatrice Rwy Co. [OLB ] - - - - - - - - - - - - Ontario Central RR Corp. [ONCT] - - - - - - - - - - - - Ontario Midland RR Corp. [OMID] - - - - - - - - - - - - Orange Empire Rwy Museum [OERY] - - - - - - - - - - - - Oregon Coast Scenic RR [OCSR] - - - - - - - - - - - - Oregon Eastern RR [OERR] - - - - - - - - - - - - Oregon Pacific RR Co. [OPR ] - - - - - - - - - - - - Otter Tail Valley RR Co., Inc. [OTVR] 1 - 1 - - - - - - 1 - 1 Ouachita RR [OUCH] - - - - - - - - - - - - Over Land Trucking and Rail [OLTX] - - - - - - - - - - - - Owego & Harford Rwy, Inc. [OHRY] - - - - - - - - - - - - Ozark Valley RR Inc. [OVRR] - - - - - - - - - - - - Pacific & Arctic RR & Navigation Co. [PARN] 16 - 16 - - - - - - 16 - 16 Pacific Harbor Line Inc. [PHL ] 16 - 7 9 - 1 1 - - 6 - 6 Pacific SW Rwy Museum [PSRM] - - - - - - - - - - - - Pacific Sun RR, LLC [PSRR] - - - - - - - - - - - - Palouse River & Coulee City RR Inc. [PCC ] 6 - 1 4 - - 1 - - 1 - 1
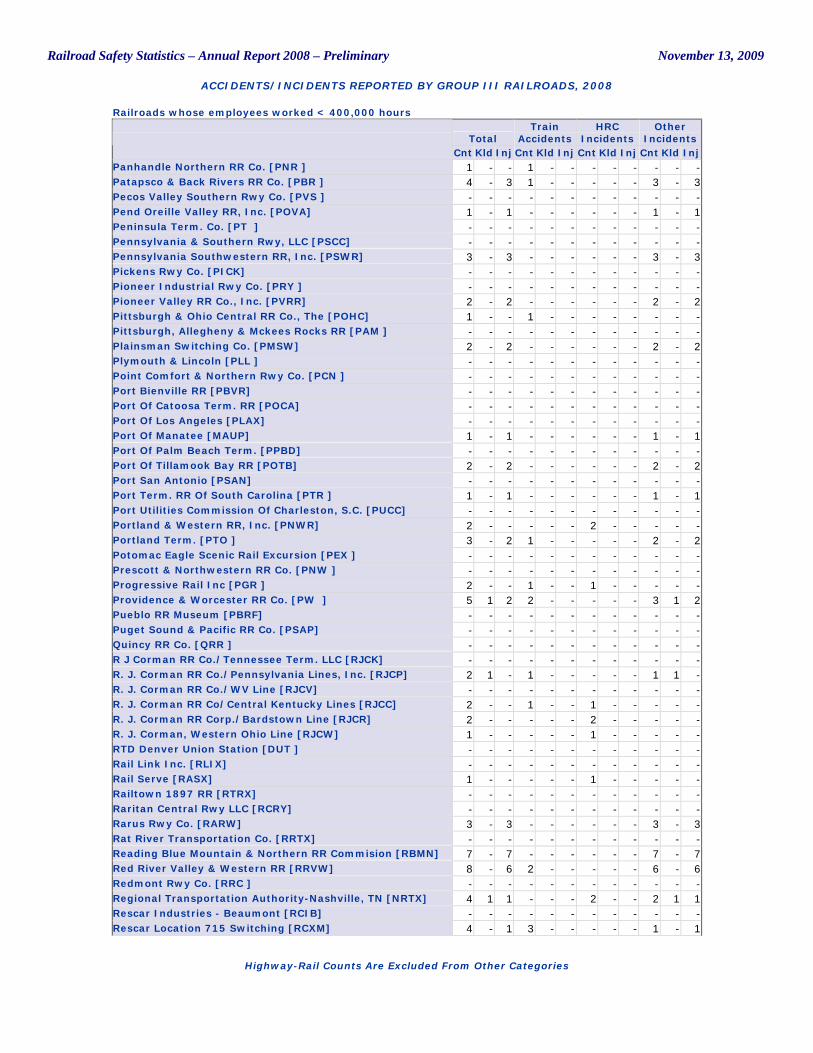
Railroad Safety Statistics – Annual Report 2008 – Preliminary November 13, 2009
ACCIDENTS/INCIDENTS REPORTED BY GROUP III RAILROADS, 2008
Highway-Rail Counts Are Excluded From Other Categories
Railroads whose employees worked < 400,000 hours
Total Train
Accidents HRC
Incidents Other
Incidents Cnt Kld Inj Cnt Kld Inj Cnt Kld Inj Cnt Kld Inj
Panhandle Northern RR Co. [PNR ] 1 - - 1 - - - - - - - - Patapsco & Back Rivers RR Co. [PBR ] 4 - 3 1 - - - - - 3 - 3 Pecos Valley Southern Rwy Co. [PVS ] - - - - - - - - - - - - Pend Oreille Valley RR, Inc. [POVA] 1 - 1 - - - - - - 1 - 1 Peninsula Term. Co. [PT ] - - - - - - - - - - - - Pennsylvania & Southern Rwy, LLC [PSCC] - - - - - - - - - - - - Pennsylvania Southwestern RR, Inc. [PSWR] 3 - 3 - - - - - - 3 - 3 Pickens Rwy Co. [PICK] - - - - - - - - - - - - Pioneer Industrial Rwy Co. [PRY ] - - - - - - - - - - - - Pioneer Valley RR Co., Inc. [PVRR] 2 - 2 - - - - - - 2 - 2 Pittsburgh & Ohio Central RR Co., The [POHC] 1 - - 1 - - - - - - - - Pittsburgh, Allegheny & Mckees Rocks RR [PAM ] - - - - - - - - - - - - Plainsman Switching Co. [PMSW] 2 - 2 - - - - - - 2 - 2 Plymouth & Lincoln [PLL ] - - - - - - - - - - - - Point Comfort & Northern Rwy Co. [PCN ] - - - - - - - - - - - - Port Bienville RR [PBVR] - - - - - - - - - - - - Port Of Catoosa Term. RR [POCA] - - - - - - - - - - - - Port Of Los Angeles [PLAX] - - - - - - - - - - - - Port Of Manatee [MAUP] 1 - 1 - - - - - - 1 - 1 Port Of Palm Beach Term. [PPBD] - - - - - - - - - - - - Port Of Tillamook Bay RR [POTB] 2 - 2 - - - - - - 2 - 2 Port San Antonio [PSAN] - - - - - - - - - - - - Port Term. RR Of South Carolina [PTR ] 1 - 1 - - - - - - 1 - 1 Port Utilities Commission Of Charleston, S.C. [PUCC] - - - - - - - - - - - - Portland & Western RR, Inc. [PNWR] 2 - - - - - 2 - - - - - Portland Term. [PTO ] 3 - 2 1 - - - - - 2 - 2 Potomac Eagle Scenic Rail Excursion [PEX ] - - - - - - - - - - - - Prescott & Northwestern RR Co. [PNW ] - - - - - - - - - - - - Progressive Rail Inc [PGR ] 2 - - 1 - - 1 - - - - - Providence & Worcester RR Co. [PW ] 5 1 2 2 - - - - - 3 1 2 Pueblo RR Museum [PBRF] - - - - - - - - - - - - Puget Sound & Pacific RR Co. [PSAP] - - - - - - - - - - - - Quincy RR Co. [QRR ] - - - - - - - - - - - - R J Corman RR Co./Tennessee Term. LLC [RJCK] - - - - - - - - - - - - R. J. Corman RR Co./Pennsylvania Lines, Inc. [RJCP] 2 1 - 1 - - - - - 1 1 - R. J. Corman RR Co./WV Line [RJCV] - - - - - - - - - - - - R. J. Corman RR Co/Central Kentucky Lines [RJCC] 2 - - 1 - - 1 - - - - - R. J. Corman RR Corp./Bardstown Line [RJCR] 2 - - - - - 2 - - - - - R. J. Corman, Western Ohio Line [RJCW] 1 - - - - - 1 - - - - - RTD Denver Union Station [DUT ] - - - - - - - - - - - - Rail Link Inc. [RLIX] - - - - - - - - - - - - Rail Serve [RASX] 1 - - - - - 1 - - - - - Railtown 1897 RR [RTRX] - - - - - - - - - - - - Raritan Central Rwy LLC [RCRY] - - - - - - - - - - - - Rarus Rwy Co. [RARW] 3 - 3 - - - - - - 3 - 3 Rat River Transportation Co. [RRTX] - - - - - - - - - - - - Reading Blue Mountain & Northern RR Commision [RBMN] 7 - 7 - - - - - - 7 - 7 Red River Valley & Western RR [RRVW] 8 - 6 2 - - - - - 6 - 6 Redmont Rwy Co. [RRC ] - - - - - - - - - - - - Regional Transportation Authority-Nashville, TN [NRTX] 4 1 1 - - - 2 - - 2 1 1 Rescar Industries - Beaumont [RCIB] - - - - - - - - - - - - Rescar Location 715 Switching [RCXM] 4 - 1 3 - - - - - 1 - 1
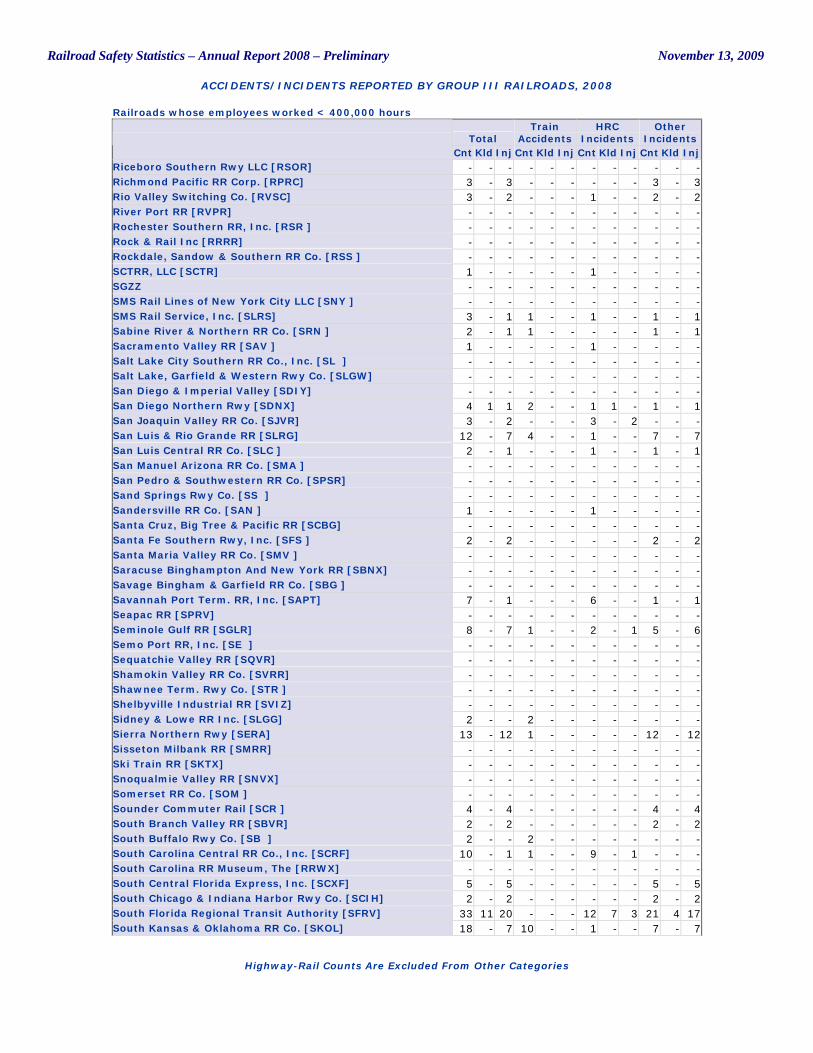
Railroad Safety Statistics – Annual Report 2008 – Preliminary November 13, 2009
ACCIDENTS/INCIDENTS REPORTED BY GROUP III RAILROADS, 2008
Highway-Rail Counts Are Excluded From Other Categories
Railroads whose employees worked < 400,000 hours
Total Train
Accidents HRC
Incidents Other
Incidents Cnt Kld Inj Cnt Kld Inj Cnt Kld Inj Cnt Kld Inj
Riceboro Southern Rwy LLC [RSOR] - - - - - - - - - - - - Richmond Pacific RR Corp. [RPRC] 3 - 3 - - - - - - 3 - 3 Rio Valley Switching Co. [RVSC] 3 - 2 - - - 1 - - 2 - 2 River Port RR [RVPR] - - - - - - - - - - - - Rochester Southern RR, Inc. [RSR ] - - - - - - - - - - - - Rock & Rail Inc [RRRR] - - - - - - - - - - - - Rockdale, Sandow & Southern RR Co. [RSS ] - - - - - - - - - - - - SCTRR, LLC [SCTR] 1 - - - - - 1 - - - - - SGZZ - - - - - - - - - - - - SMS Rail Lines of New York City LLC [SNY ] - - - - - - - - - - - - SMS Rail Service, Inc. [SLRS] 3 - 1 1 - - 1 - - 1 - 1 Sabine River & Northern RR Co. [SRN ] 2 - 1 1 - - - - - 1 - 1 Sacramento Valley RR [SAV ] 1 - - - - - 1 - - - - - Salt Lake City Southern RR Co., Inc. [SL ] - - - - - - - - - - - - Salt Lake, Garfield & Western Rwy Co. [SLGW] - - - - - - - - - - - - San Diego & Imperial Valley [SDIY] - - - - - - - - - - - - San Diego Northern Rwy [SDNX] 4 1 1 2 - - 1 1 - 1 - 1 San Joaquin Valley RR Co. [SJVR] 3 - 2 - - - 3 - 2 - - - San Luis & Rio Grande RR [SLRG] 12 - 7 4 - - 1 - - 7 - 7 San Luis Central RR Co. [SLC ] 2 - 1 - - - 1 - - 1 - 1 San Manuel Arizona RR Co. [SMA ] - - - - - - - - - - - - San Pedro & Southwestern RR Co. [SPSR] - - - - - - - - - - - - Sand Springs Rwy Co. [SS ] - - - - - - - - - - - - Sandersville RR Co. [SAN ] 1 - - - - - 1 - - - - - Santa Cruz, Big Tree & Pacific RR [SCBG] - - - - - - - - - - - - Santa Fe Southern Rwy, Inc. [SFS ] 2 - 2 - - - - - - 2 - 2 Santa Maria Valley RR Co. [SMV ] - - - - - - - - - - - - Saracuse Binghampton And New York RR [SBNX] - - - - - - - - - - - - Savage Bingham & Garfield RR Co. [SBG ] - - - - - - - - - - - - Savannah Port Term. RR, Inc. [SAPT] 7 - 1 - - - 6 - - 1 - 1 Seapac RR [SPRV] - - - - - - - - - - - - Seminole Gulf RR [SGLR] 8 - 7 1 - - 2 - 1 5 - 6 Semo Port RR, Inc. [SE ] - - - - - - - - - - - - Sequatchie Valley RR [SQVR] - - - - - - - - - - - - Shamokin Valley RR Co. [SVRR] - - - - - - - - - - - - Shawnee Term. Rwy Co. [STR ] - - - - - - - - - - - - Shelbyville Industrial RR [SVIZ] - - - - - - - - - - - - Sidney & Lowe RR Inc. [SLGG] 2 - - 2 - - - - - - - - Sierra Northern Rwy [SERA] 13 - 12 1 - - - - - 12 - 12 Sisseton Milbank RR [SMRR] - - - - - - - - - - - - Ski Train RR [SKTX] - - - - - - - - - - - - Snoqualmie Valley RR [SNVX] - - - - - - - - - - - - Somerset RR Co. [SOM ] - - - - - - - - - - - - Sounder Commuter Rail [SCR ] 4 - 4 - - - - - - 4 - 4 South Branch Valley RR [SBVR] 2 - 2 - - - - - - 2 - 2 South Buffalo Rwy Co. [SB ] 2 - - 2 - - - - - - - - South Carolina Central RR Co., Inc. [SCRF] 10 - 1 1 - - 9 - 1 - - - South Carolina RR Museum, The [RRWX] - - - - - - - - - - - - South Central Florida Express, Inc. [SCXF] 5 - 5 - - - - - - 5 - 5 South Chicago & Indiana Harbor Rwy Co. [SCIH] 2 - 2 - - - - - - 2 - 2 South Florida Regional Transit Authority [SFRV] 33 11 20 - - - 12 7 3 21 4 17 South Kansas & Oklahoma RR Co. [SKOL] 18 - 7 10 - - 1 - - 7 - 7
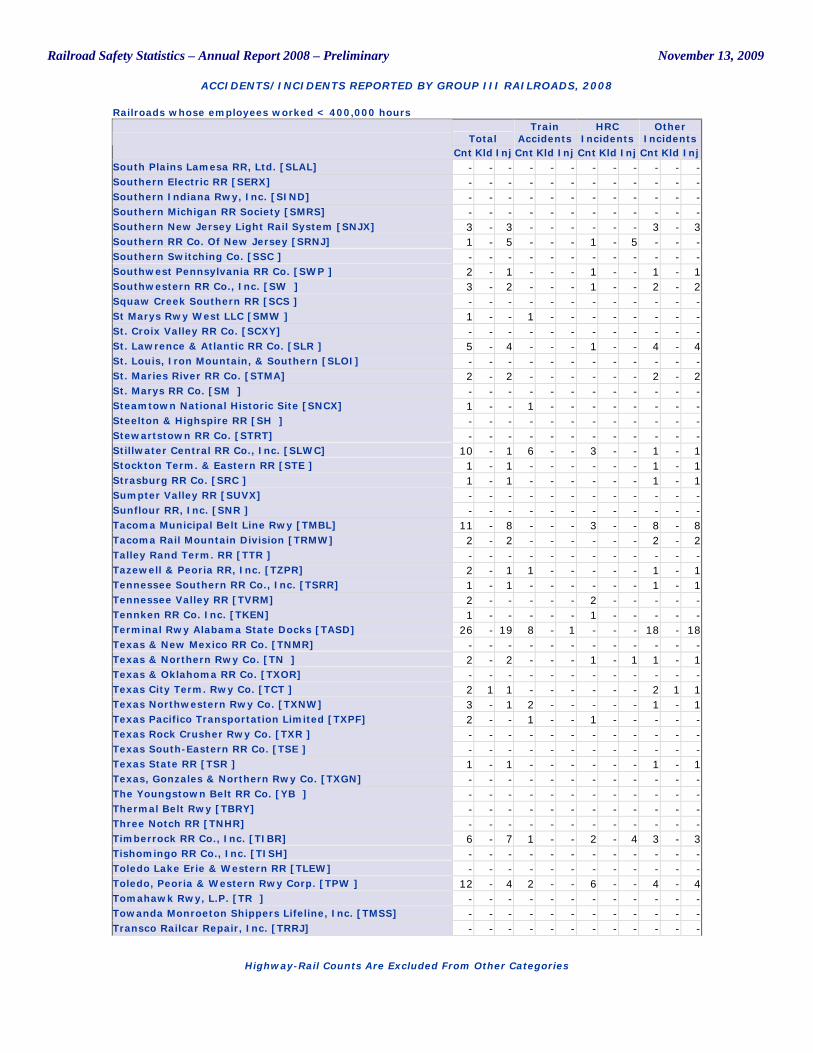
Railroad Safety Statistics – Annual Report 2008 – Preliminary November 13, 2009
ACCIDENTS/INCIDENTS REPORTED BY GROUP III RAILROADS, 2008
Highway-Rail Counts Are Excluded From Other Categories
Railroads whose employees worked < 400,000 hours
Total Train
Accidents HRC
Incidents Other
Incidents Cnt Kld Inj Cnt Kld Inj Cnt Kld Inj Cnt Kld Inj
South Plains Lamesa RR, Ltd. [SLAL] - - - - - - - - - - - - Southern Electric RR [SERX] - - - - - - - - - - - - Southern Indiana Rwy, Inc. [SIND] - - - - - - - - - - - - Southern Michigan RR Society [SMRS] - - - - - - - - - - - - Southern New Jersey Light Rail System [SNJX] 3 - 3 - - - - - - 3 - 3 Southern RR Co. Of New Jersey [SRNJ] 1 - 5 - - - 1 - 5 - - - Southern Switching Co. [SSC ] - - - - - - - - - - - - Southwest Pennsylvania RR Co. [SWP ] 2 - 1 - - - 1 - - 1 - 1 Southwestern RR Co., Inc. [SW ] 3 - 2 - - - 1 - - 2 - 2 Squaw Creek Southern RR [SCS ] - - - - - - - - - - - - St Marys Rwy West LLC [SMW ] 1 - - 1 - - - - - - - - St. Croix Valley RR Co. [SCXY] - - - - - - - - - - - - St. Lawrence & Atlantic RR Co. [SLR ] 5 - 4 - - - 1 - - 4 - 4 St. Louis, Iron Mountain, & Southern [SLOI] - - - - - - - - - - - - St. Maries River RR Co. [STMA] 2 - 2 - - - - - - 2 - 2 St. Marys RR Co. [SM ] - - - - - - - - - - - - Steamtown National Historic Site [SNCX] 1 - - 1 - - - - - - - - Steelton & Highspire RR [SH ] - - - - - - - - - - - - Stewartstown RR Co. [STRT] - - - - - - - - - - - - Stillwater Central RR Co., Inc. [SLWC] 10 - 1 6 - - 3 - - 1 - 1 Stockton Term. & Eastern RR [STE ] 1 - 1 - - - - - - 1 - 1 Strasburg RR Co. [SRC ] 1 - 1 - - - - - - 1 - 1 Sumpter Valley RR [SUVX] - - - - - - - - - - - - Sunflour RR, Inc. [SNR ] - - - - - - - - - - - - Tacoma Municipal Belt Line Rwy [TMBL] 11 - 8 - - - 3 - - 8 - 8 Tacoma Rail Mountain Division [TRMW] 2 - 2 - - - - - - 2 - 2 Talley Rand Term. RR [TTR ] - - - - - - - - - - - - Tazewell & Peoria RR, Inc. [TZPR] 2 - 1 1 - - - - - 1 - 1 Tennessee Southern RR Co., Inc. [TSRR] 1 - 1 - - - - - - 1 - 1 Tennessee Valley RR [TVRM] 2 - - - - - 2 - - - - - Tennken RR Co. Inc. [TKEN] 1 - - - - - 1 - - - - - Terminal Rwy Alabama State Docks [TASD] 26 - 19 8 - 1 - - - 18 - 18 Texas & New Mexico RR Co. [TNMR] - - - - - - - - - - - - Texas & Northern Rwy Co. [TN ] 2 - 2 - - - 1 - 1 1 - 1 Texas & Oklahoma RR Co. [TXOR] - - - - - - - - - - - - Texas City Term. Rwy Co. [TCT ] 2 1 1 - - - - - - 2 1 1 Texas Northwestern Rwy Co. [TXNW] 3 - 1 2 - - - - - 1 - 1 Texas Pacifico Transportation Limited [TXPF] 2 - - 1 - - 1 - - - - - Texas Rock Crusher Rwy Co. [TXR ] - - - - - - - - - - - - Texas South-Eastern RR Co. [TSE ] - - - - - - - - - - - - Texas State RR [TSR ] 1 - 1 - - - - - - 1 - 1 Texas, Gonzales & Northern Rwy Co. [TXGN] - - - - - - - - - - - - The Youngstown Belt RR Co. [YB ] - - - - - - - - - - - - Thermal Belt Rwy [TBRY] - - - - - - - - - - - - Three Notch RR [TNHR] - - - - - - - - - - - - Timberrock RR Co., Inc. [TIBR] 6 - 7 1 - - 2 - 4 3 - 3 Tishomingo RR Co., Inc. [TISH] - - - - - - - - - - - - Toledo Lake Erie & Western RR [TLEW] - - - - - - - - - - - - Toledo, Peoria & Western Rwy Corp. [TPW ] 12 - 4 2 - - 6 - - 4 - 4 Tomahawk Rwy, L.P. [TR ] - - - - - - - - - - - - Towanda Monroeton Shippers Lifeline, Inc. [TMSS] - - - - - - - - - - - - Transco Railcar Repair, Inc. [TRRJ] - - - - - - - - - - - -
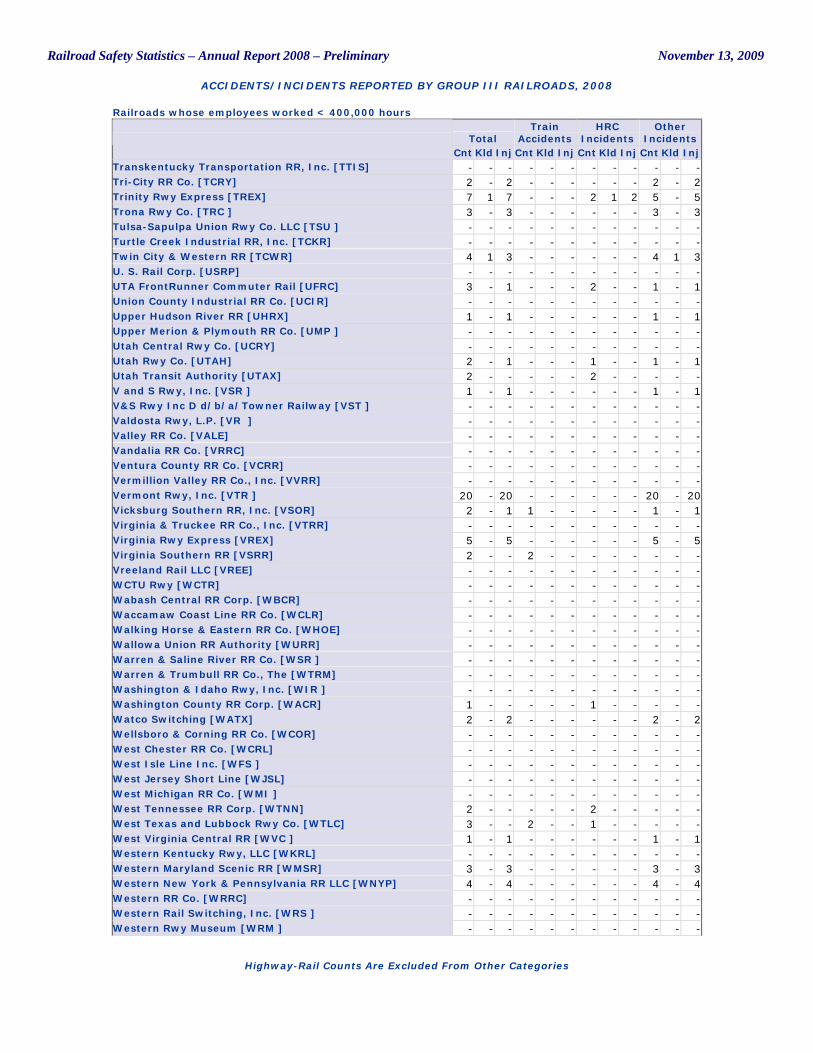
Railroad Safety Statistics – Annual Report 2008 – Preliminary November 13, 2009
ACCIDENTS/INCIDENTS REPORTED BY GROUP III RAILROADS, 2008
Highway-Rail Counts Are Excluded From Other Categories
Railroads whose employees worked < 400,000 hours
Total Train
Accidents HRC
Incidents Other
Incidents Cnt Kld Inj Cnt Kld Inj Cnt Kld Inj Cnt Kld Inj
Transkentucky Transportation RR, Inc. [TTIS] - - - - - - - - - - - - Tri-City RR Co. [TCRY] 2 - 2 - - - - - - 2 - 2 Trinity Rwy Express [TREX] 7 1 7 - - - 2 1 2 5 - 5 Trona Rwy Co. [TRC ] 3 - 3 - - - - - - 3 - 3 Tulsa-Sapulpa Union Rwy Co. LLC [TSU ] - - - - - - - - - - - - Turtle Creek Industrial RR, Inc. [TCKR] - - - - - - - - - - - - Twin City & Western RR [TCWR] 4 1 3 - - - - - - 4 1 3 U. S. Rail Corp. [USRP] - - - - - - - - - - - - UTA FrontRunner Commuter Rail [UFRC] 3 - 1 - - - 2 - - 1 - 1 Union County Industrial RR Co. [UCIR] - - - - - - - - - - - - Upper Hudson River RR [UHRX] 1 - 1 - - - - - - 1 - 1 Upper Merion & Plymouth RR Co. [UMP ] - - - - - - - - - - - - Utah Central Rwy Co. [UCRY] - - - - - - - - - - - - Utah Rwy Co. [UTAH] 2 - 1 - - - 1 - - 1 - 1 Utah Transit Authority [UTAX] 2 - - - - - 2 - - - - - V and S Rwy, Inc. [VSR ] 1 - 1 - - - - - - 1 - 1 V&S Rwy Inc D d/b/a/Towner Railway [VST ] - - - - - - - - - - - - Valdosta Rwy, L.P. [VR ] - - - - - - - - - - - - Valley RR Co. [VALE] - - - - - - - - - - - - Vandalia RR Co. [VRRC] - - - - - - - - - - - - Ventura County RR Co. [VCRR] - - - - - - - - - - - - Vermillion Valley RR Co., Inc. [VVRR] - - - - - - - - - - - - Vermont Rwy, Inc. [VTR ] 20 - 20 - - - - - - 20 - 20 Vicksburg Southern RR, Inc. [VSOR] 2 - 1 1 - - - - - 1 - 1 Virginia & Truckee RR Co., Inc. [VTRR] - - - - - - - - - - - - Virginia Rwy Express [VREX] 5 - 5 - - - - - - 5 - 5 Virginia Southern RR [VSRR] 2 - - 2 - - - - - - - - Vreeland Rail LLC [VREE] - - - - - - - - - - - - WCTU Rwy [WCTR] - - - - - - - - - - - - Wabash Central RR Corp. [WBCR] - - - - - - - - - - - - Waccamaw Coast Line RR Co. [WCLR] - - - - - - - - - - - - Walking Horse & Eastern RR Co. [WHOE] - - - - - - - - - - - - Wallowa Union RR Authority [WURR] - - - - - - - - - - - - Warren & Saline River RR Co. [WSR ] - - - - - - - - - - - - Warren & Trumbull RR Co., The [WTRM] - - - - - - - - - - - - Washington & Idaho Rwy, Inc. [WIR ] - - - - - - - - - - - - Washington County RR Corp. [WACR] 1 - - - - - 1 - - - - - Watco Switching [WATX] 2 - 2 - - - - - - 2 - 2 Wellsboro & Corning RR Co. [WCOR] - - - - - - - - - - - - West Chester RR Co. [WCRL] - - - - - - - - - - - - West Isle Line Inc. [WFS ] - - - - - - - - - - - - West Jersey Short Line [WJSL] - - - - - - - - - - - - West Michigan RR Co. [WMI ] - - - - - - - - - - - - West Tennessee RR Corp. [WTNN] 2 - - - - - 2 - - - - - West Texas and Lubbock Rwy Co. [WTLC] 3 - - 2 - - 1 - - - - - West Virginia Central RR [WVC ] 1 - 1 - - - - - - 1 - 1 Western Kentucky Rwy, LLC [WKRL] - - - - - - - - - - - - Western Maryland Scenic RR [WMSR] 3 - 3 - - - - - - 3 - 3 Western New York & Pennsylvania RR LLC [WNYP] 4 - 4 - - - - - - 4 - 4 Western RR Co. [WRRC] - - - - - - - - - - - - Western Rail Switching, Inc. [WRS ] - - - - - - - - - - - - Western Rwy Museum [WRM ] - - - - - - - - - - - -
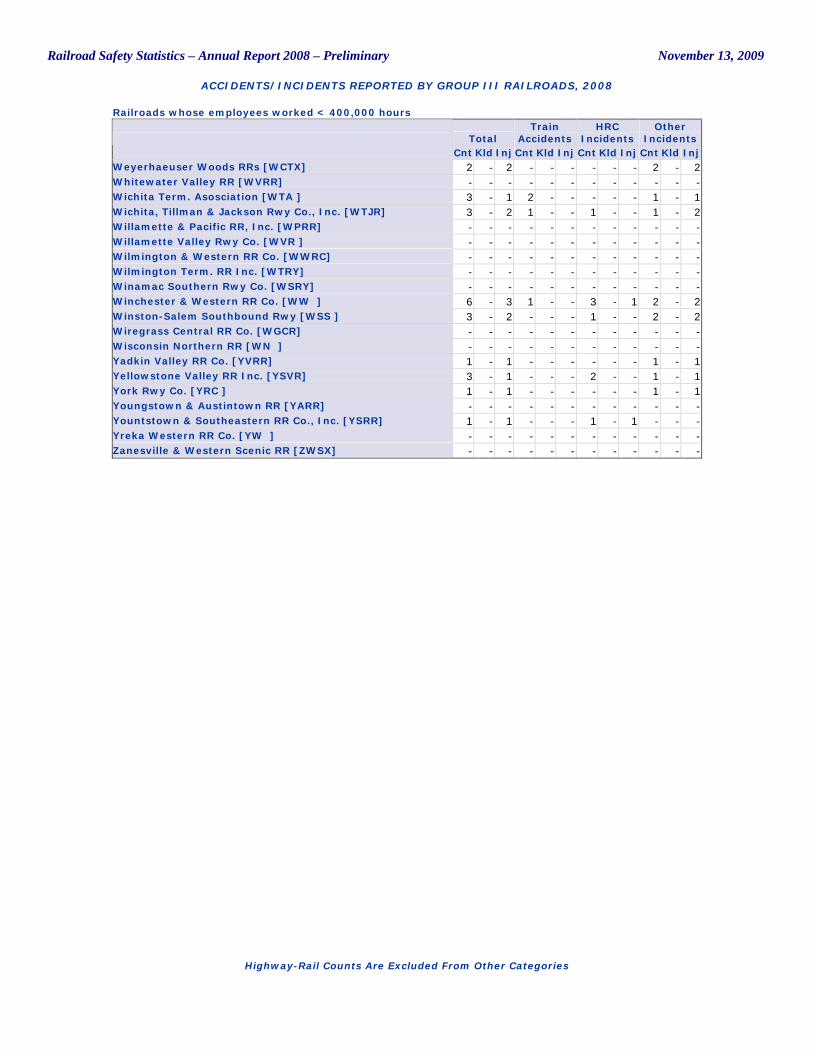
Railroad Safety Statistics – Annual Report 2008 – Preliminary November 13, 2009
ACCIDENTS/INCIDENTS REPORTED BY GROUP III RAILROADS, 2008
Highway-Rail Counts Are Excluded From Other Categories
Railroads whose employees worked < 400,000 hours
Total Train
Accidents HRC
Incidents Other
Incidents Cnt Kld Inj Cnt Kld Inj Cnt Kld Inj Cnt Kld Inj
Weyerhaeuser Woods RRs [WCTX] 2 - 2 - - - - - - 2 - 2 Whitewater Valley RR [WVRR] - - - - - - - - - - - - Wichita Term. Asosciation [WTA ] 3 - 1 2 - - - - - 1 - 1 Wichita, Tillman & Jackson Rwy Co., Inc. [WTJR] 3 - 2 1 - - 1 - - 1 - 2 Willamette & Pacific RR, Inc. [WPRR] - - - - - - - - - - - - Willamette Valley Rwy Co. [WVR ] - - - - - - - - - - - - Wilmington & Western RR Co. [WWRC] - - - - - - - - - - - - Wilmington Term. RR Inc. [WTRY] - - - - - - - - - - - - Winamac Southern Rwy Co. [WSRY] - - - - - - - - - - - - Winchester & Western RR Co. [WW ] 6 - 3 1 - - 3 - 1 2 - 2 Winston-Salem Southbound Rwy [WSS ] 3 - 2 - - - 1 - - 2 - 2 Wiregrass Central RR Co. [WGCR] - - - - - - - - - - - - Wisconsin Northern RR [WN ] - - - - - - - - - - - - Yadkin Valley RR Co. [YVRR] 1 - 1 - - - - - - 1 - 1 Yellowstone Valley RR Inc. [YSVR] 3 - 1 - - - 2 - - 1 - 1 York Rwy Co. [YRC ] 1 - 1 - - - - - - 1 - 1 Youngstown & Austintown RR [YARR] - - - - - - - - - - - - Yountstown & Southeastern RR Co., Inc. [YSRR] 1 - 1 - - - 1 - 1 - - - Yreka Western RR Co. [YW ] - - - - - - - - - - - - Zanesville & Western Scenic RR [ZWSX] - - - - - - - - - - - -
Related Documents