www.vtpi.org [email protected] 250-360-1560 Todd Litman © 2004-2012 You are welcome and encouraged to copy, distribute, share and excerpt this document and its ideas, provided the author is given attribution. Please send your corrections, comments and suggestions for improvement. Rail Transit In America A Comprehensive Evaluation of Benefits 16 January 2012 By Todd Litman Victoria Transport Policy Institute Produced with support from the American Public Transportation Association Photo: Darrell Clarke Abstract This study evaluates rail transit benefits based on a comprehensive analysis of transportation system performance in major U.S. cities. It finds that cities with large, well- established rail systems have significantly higher per capita transit ridership, lower average per capita vehicle ownership and annual mileage, less traffic congestion, lower traffic death rates, lower consumer expenditures on transportation, and higher transit service cost recovery than otherwise comparable cities with less or no rail transit service. This indicates that rail transit systems provide economic, social and environmental benefits, and these benefits tend to increase as a system expands and matures. This report discusses best practices for evaluating transit benefits. It examines criticisms of rail transit investments, finding that many are based on inaccurate analysis. A condensed version of this report was published as, "Impacts of Rail Transit on the Performance of a Transportation System," Transportation Research Record 1930 , Transportation Research Board (www.trb.org), 2005, pp. 23-29.

Welcome message from author
This document is posted to help you gain knowledge. Please leave a comment to let me know what you think about it! Share it to your friends and learn new things together.
Transcript

7/30/2019 Rail Ben
http://slidepdf.com/reader/full/rail-ben 1/67
www.vtpi.org
250-360-1560
Todd Litman © 2004-2012You are welcome and encouraged to copy, distribute, share and excerpt this document and its ideas, provided the
author is given attribution. Please send your corrections, comments and suggestions for improvement.
Rail Transit In AmericaA Comprehensive Evaluation of Benefits
16 January 2012
ByTodd Litman
Victoria Transport Policy Institute
Produced with support from theAmerican Public Transportation Association
Photo: Darrell Clarke
AbstractThis study evaluates rail transit benefits based on a comprehensive analysis oftransportation system performance in major U.S. cities. It finds that cities with large, well-established rail systems have significantly higher per capita transit ridership, loweraverage per capita vehicle ownership and annual mileage, less traffic congestion, lowertraffic death rates, lower consumer expenditures on transportation, and higher transitservice cost recovery than otherwise comparable cities with less or no rail transit service.This indicates that rail transit systems provide economic, social and environmentalbenefits, and these benefits tend to increase as a system expands and matures. Thisreport discusses best practices for evaluating transit benefits. It examines criticisms ofrail transit investments, finding that many are based on inaccurate analysis.
A condensed version of this report was published as, "Impacts of Rail Transit on the Performance of aTransportation System," Transportation Research Record 1930 , Transportation Research Board
(www.trb.org), 2005, pp. 23-29.

7/30/2019 Rail Ben
http://slidepdf.com/reader/full/rail-ben 2/67
Rail Transit In America: Comprehensive Evaluation of Benefits Victoria Transport Policy Institute
1
Contents
Executive Summary .......................................................................................................... 2 Introduction ....................................................................................................................... 5 The Analysis...................................................................................................................... 6
Increased Transit Ridership and Reduced Vehicle Travel .......................................................... 7 Congestion Impacts ................................................................................................................... 16 Cost Effectiveness ..................................................................................................................... 22 Road and Parking Cost Savings ............................................................................................... 27 Consumer Financial Impacts ..................................................................................................... 28 Safety Impacts ........................................................................................................................... 30 Energy and Emission Reductions ............................................................................................. 32 Economic Development Impacts ............................................................................................... 33 Other Benefits ........................................................................................................................... 37 Comparing Benefits and Costs ................................................................................................. 39
Rail Versus Bus Transit................................................................................................... 40 Evaluating Rail Transit Criticism ..................................................................................... 44
Washington’s War on Cars and the Suburbs ............................................................................ 45 “Urban Rail: Uses and Misuses” ............................................................................................... 46 “Great Rail Disasters” ................................................................................................................ 46 “Light Rail Boon or Boondoggle” .............................................................................................. 48
Possible Offsetting Factors ............................................................................................. 49 Increasing Rail Transit Benefits ...................................................................................... 51 Conclusions..................................................................................................................... 52 References ...................................................................................................................... 56 Acknowledgements ......................................................................................................... 66

7/30/2019 Rail Ben
http://slidepdf.com/reader/full/rail-ben 3/67
Rail Transit In America: Comprehensive Evaluation of Benefits Victoria Transport Policy Institute
2
Executive SummaryThis study investigates the impacts of rail transit on urban transportation systemperformance. For this study, U.S. cities and their urban regions were divided into threecategories:
1. Large Rail – Rail transit is a major component of the transportation system.2. Small Rail – Rail transit is a minor component of the transportation system.3. Bus Only – City has no rail transit system.
When these groups are compared, Large Rail cities are found to have significantly bettertransport system performance. Compared with Bus Only cities, Large Rail cities have:
• 400% higher per capita transit ridership (589 versus 118 annual passenger-miles).
• 887% higher transit commute mode split (13.4% versus 2.7%).
• 36% lower per capita traffic fatalities (7.5 versus 11.7 annual deaths per 100,000 residents).
• 14% lower per capita consumer expenditures on transport ($448 average annualsavings).
• 19% smaller portion of household budgets devoted to transport (12.0% versus 14.9%).
• 21% lower per capita motor vehicle mileage (1,958 fewer annual miles).
• 33% lower transit operating costs per passenger-mile (42¢ versus 63¢).
• 58% higher transit service cost recovery (38% versus 24%).
• Improved fitness and health (since most transit trips have walking or cycling links, sotransit travelers are much more likely to achieve physical activity targets than motorists).
• More money circulating in local economies (since transit users spend significantly less onvehicles and fuel, and tend to spend the savings on other goods with more local input).
Figures ES-1 and ES-2 illustrate these benefits.
Figure ES-1 Transit Ridership and Commute Mode Split Comparison
0%
100%
200%
300%
400%
500%
600%
Per Capita Ridership Commute Mode Split
R e l a t i v
e t o " B u s O n l y " C i t i e Large Rail
Small Rail
Bus Only
This graph shows the far higher rates of transit ridership and transit commute mode split in “Large
Rail” cities. The dashed line at 100% indicates “Bus Only” city values.

7/30/2019 Rail Ben
http://slidepdf.com/reader/full/rail-ben 4/67
Rail Transit In America: Comprehensive Evaluation of Benefits Victoria Transport Policy Institute
3
Figure ES-2 Transportation Performance Comparison
0%
20%
40%
60%
80%
100%
120%
140%
160%
180%
T raf fic F atalit ies T ranspo rt
Expenditures
Portion of
Income On
Transport
Vehicle
Ownership
Vehicle M ileage Transit Operating
Costs
Transit Co st
Recovery
R e l a t i v e t o " B u s O
n l y " C i t i e
Large Rail
Small Rail
Bus Only
This graph compares different categories of cities by various performance indicators. The dashed line
at 100% indicates “Bus Only” city values.
These benefits cannot be attributed entirely to rail transit. They partly reflect the largeraverage size of Large Rail cities. But taking size into account, cities with large, well-established rail transit systems still perform better in various ways than cities that lackrail systems. These benefits result from rail’s ability to help create more accessible landuse patterns and more diverse transport systems.
Figure ES-3 Congestion Costs
$0
$200
$400
$600
$800
$1,000
$1,200
0 5,000 10,000 15,000 20,000
City Population (Thousands)
A n n u a l D o l l a r s P e r C a p i t a
Large RailSmall RailBus Only
Los Angeles
New YorkChicago
Philadelphia
San Francisco
In ‘Bus Only’ and ‘Small Rail’ cities, congestion costs tend to increase with city size, as indicated
by the dashed curve. But Large Rail cities do not follow this pattern. They have substantiallylower congestion costs than comparable size cities. As a result, New York and Chicago have
about half the per capita congestion delay of Los Angeles.

7/30/2019 Rail Ben
http://slidepdf.com/reader/full/rail-ben 5/67
Rail Transit In America: Comprehensive Evaluation of Benefits Victoria Transport Policy Institute
4
Although Large Rail cities have higher congestion costs, this occurs because congestiontends to increase with city size. Taking city size into account, rail transit turns out tosignificantly reduce per capita congestion costs, as indicated in Figure ES-3. Matchedpair analysis indicates that Large Rail cities have about half the per capita congestion
costs as other comparable size cities.
U.S. rail transit services require about $12.5 billion annual public subsidy (total capitaland operating expenses minus fares), about an extra $90 per Large Rail city resident.However, economic benefits more than repay these subsidies: rail transit services areestimated to provide $19.4 billion in annual congestion cost savings, $8.0 billion inroadway cost savings, $12.1 billion in parking cost savings, $22.6 billion in consumercost savings, and $50 billion in traffic accident cost savings. Rail transit also tends toprovide economic development benefits, increasing business activity and tax revenues.It can be a catalyst for community redevelopment. Additional, potentially large benefitsinclude improved mobility for non-drivers, increased community livability and improvedpublic health.
This study critiques studies which imply that rail transit is ineffective. It finds that theiranalysis is often incomplete, inaccurate, and biased. It examines various factors thatcould offset rail transit benefits, including the possibility that transit oriented developmentis harmful to consumers, that new rail systems cannot achieve significant benefits, thatapparent benefits of rail actually reflect other factors such as city size, and that bustransit can provide equal benefits at less cost.
This study indicates that rail transit is particularly important in large, growing cities. Largecities that lack well-established rail systems are clearly disadvantaged compared withlarge cities that do in terms of congestion costs, consumer costs and accident risk. Railtransit can be a cost effective investment in growing cities, provided it is supported with
appropriate transport and land use policies. Large cities with newer and smaller railsystems have not yet achieved the full potential benefits of rail transit, but, if their railsystems continue to develop with supportive public policies, their benefits shouldincrease over time.
This analysis does not mean that every rail transit project is cost-effective, or that rail isalways better than bus or highway improvements. It attempts to provide a fair andbalanced evaluation of the advantages and disadvantages of each mode, and identifysituations in which each is most appropriate. This study concludes that rail transitprovides significant benefits, particularly if implemented with supportive transport andland use policies. In many situations, rail transit is the most cost effective way to improveurban transportation.

7/30/2019 Rail Ben
http://slidepdf.com/reader/full/rail-ben 6/67
Rail Transit In America: Comprehensive Evaluation of Benefits Victoria Transport Policy Institute
5
IntroductionDuring the last century most North American cities became increasingly automobileoriented (for this analysis automobile refers to any personal motor vehicle, including cars,light trucks, vans, SUVs and even motorcycles). Now, the majority of personal travel is by automobile, the majority of transportation resources (money and land) are devoted to
automobiles and their facilities, and many communities have automobile-dependent landuse patterns that provide poor access to non-drivers. The resulting growth in vehicletraffic creates various problems, including congestion, high road and parking facilitycosts, costs to consumers of owning and operating automobiles, traffic accidents,inadequate mobility for non-drivers, and various environmental impacts.
In recent years many experts and citizens have advocated diversifying our transportsystems. To accomplish this many cities1 are investing in public transit improvements,including rail transit system expansion. There is considerable debate over the merits of these investments. Critics argue they are inappropriate and wasteful.
This study evaluates rail transit benefits based on a comprehensive analysis of transportsystem performance in U.S. urban regions. It uses best available evaluation methods, based on guidance from leading experts and organizations (FTA 1998; Hale 2011; HLB2002; Kenworthy and Laube 2000; Kittleson & Associates 2003; Litman 2004a; MKI2003; Phillips, Karachepone and Landis 2001). This analysis takes into account various performance factors, including the amount and type of travel that occurs, congestioncosts, road and parking facility costs, consumer costs, accident rates, transit systemefficiency and cost recovery, and various other impacts. The analysis and results areconsistent with similar studies performed in other parts of the world (Kenworthy 2008).
This study compares rail and bus transit, identifies the conditions in which each is mostappropriate, discusses the role each can play in an efficient transport system, anddescribes ways of improving transit service quality to increase benefits. Althoughostensibly about rail transit, this study is really about high quality public transit thatattracts a significant amount of discretionary travel (travel that would otherwise be byautomobile) and provides a catalyst for transit oriented development (more compact,mixed, multi-modal development around transit stations), thereby leveraging reductionsin residents’ vehicle ownership and use. In theory, high quality bus transit could alsohave these leverage effects, although to date only rail systems have achieved this at aregional scale in North America.
This study also evaluates various criticisms of rail transit, including claims that it provides minimal congestion and emission reduction benefits, that it is not cost effective,and that money is better spent on roads, bus service or subsidized cars. It also examinesvarious factors that could offset rail transit benefits, including the possibility that transitoriented development is harmful to consumers, that new rail systems cannot achievesignificant benefits, that apparent benefits of rail actually reflect other factors such as citysize, and that bus transit can provide equal benefits at less cost.
• 1 The term city in this report generally refers to a major central city and its surrounding urban region.
7/30/2019 Rail Ben
http://slidepdf.com/reader/full/rail-ben 7/67
Rail Transit In America: Comprehensive Evaluation of Benefits Victoria Transport Policy Institute
6
The AnalysisThis section describes the evaluation methodologies. Analysis data are available in the “Transit Evaluation Spreadsheet” (www.vtpi.org/transit.xls). Beyond DC (www.beyonddc.com), providesmaps of these cities. The “ Millennium Cities Database” (Kenworthy and Laube 1999 and 2000) provides similar analysis of major cities throughout the world.
About two dozen U.S. cities have some sort of rail transit system, but most are small andso cannot be expected to significantly affect regional transportation performance,although they may have significant impacts on a particular corridor or district. For thisstudy, U.S. cities and their metropolitan regions are divided into three categories:
• Large Rail – Rail transit is a major component of the transportation system.• Small Rail – Rail transit is a minor component of the transportation system.• Bus Only – City has no rail transit system.
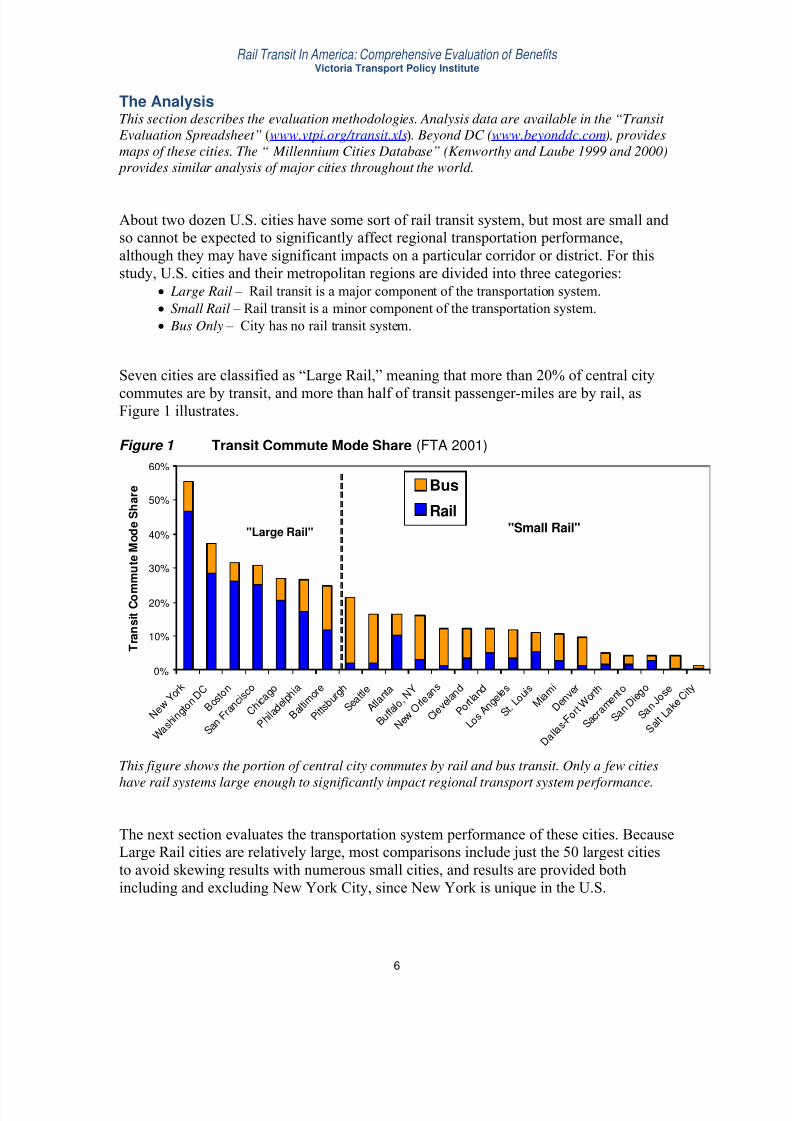
Seven cities are classified as “Large Rail,” meaning that more than 20% of central city
commutes are by transit, and more than half of transit passenger-miles are by rail, asFigure 1 illustrates.
Figure 1 Transit Commute Mode Share (FTA 2001)
0%
10%
20%
30%
40%
50%
60%
N e w Y o
r k
W a s h i n g
t o n D C
B o s t o
n
S a n F
r a n c i s
c o
C h i c a
g o
P h i l a
d e l p h
i a
B a l t i m
o r e
P i t t s b
u r g h
S e a t t l e
A t l a n t a
B u f f a l o ,
N Y
N e w O r l e a
n s
C l e v e l a n
d
P o r t l a
n d
L o s A
n g e l e
s
S t . L o u i s
M i a m
i
D e n v
e r
D a l l a
s - F o r t W
o r t h
S a c r a
m e n t o
S a n D
i e g o
S a n J
o s e
S a l t L
a k e C
i t y
T r a n s i t C o m
m u t e M o d e S h a r e
Bus
Rail
"Large Rail" "Small Rail"
This figure shows the portion of central city commutes by rail and bus transit. Only a few cities
have rail systems large enough to significantly impact regional transport system performance.
The next section evaluates the transportation system performance of these cities. BecauseLarge Rail cities are relatively large, most comparisons include just the 50 largest citiesto avoid skewing results with numerous small cities, and results are provided bothincluding and excluding New York City, since New York is unique in the U.S.

7/30/2019 Rail Ben
http://slidepdf.com/reader/full/rail-ben 8/67
Rail Transit In America: Comprehensive Evaluation of Benefits Victoria Transport Policy Institute
7
Increased Transit Ridership and Reduced Vehicle Travel
An important factor in transit evaluation is the degree to which a particular policy or program increases transit ridership and reduces overall vehicle travel, thereby reducingtraffic problems such as congestion, parking costs and accidents.
Rail transit tends to provide relatively high service quality; it is usually morecomfortable, faster (particularly if grade separated), better integrated with other modes(walkable station areas, bike storage, park-and-ride facilities, and service to intercity busstations and airports). Rail transit tends to leverage additional vehicle travel reductions bystimulating Transit Oriented Development (also called New Urbanism and Smart Growth), which consists of compact, mixed-use, multi-modal neighborhoods (TCRP2004; Dittmar and Ohland 2004). Households in such areas tend to own fewer vehicles,drive less and use alternative modes more. As a result, rail transit usually attracts moreriders within a given area, particularly discretionary riders (travelers who could drive,also called choice riders), and so tends to reduce per capita vehicle travel more than bustransit (Henry and Litman 2006; Lane 2008; CTS 2009a; Freemark 2010).
Figure 2 Alternative Travel Option (APTA 2007, Table 20)
0%
10%
20%
30%
40%
50%
Walk Drive Auto Ride Alternate
Transit
Taxi Not Make Trip Other
Rail Modes
Roadway Modes
If transit were unavailable, more than half of rail transit travelers would travel by automobile.
More than half of rail passengers would otherwise travel by automobile as a driver or passenger (either as a rideshare passenger in a vehicle that would make the trip anyway,or a special chauffeured trip that increases vehicle travel), a higher rate than bus transit.
Table 1 Mode Shifts By New Transit Users (Pratt 1999, Table 9-10)Riders Attracted By Increased Bus
FrequencyRiders Attracted By Increased Commuter
Rail FrequencyPrior Mode Percentage Prior Mode Percentage
Own Car 18-67% Own Car 64%Carpool 11-29% Carpool 17%Train 0-11% Bus 19%Taxi 0-7%Walking 0-11%
Rail improvements attract more travelers who would otherwise drive than bus improvements.

7/30/2019 Rail Ben
http://slidepdf.com/reader/full/rail-ben 9/67
Rail Transit In America: Comprehensive Evaluation of Benefits Victoria Transport Policy Institute
8
Table 2 Demand Characteristics By Transit Mode (CTS 2009a) TransitService
Definition Type of Rider How Transit isAccessed
Trip Characteristics
Light-RailTransit
Hiawatha Line fromdowntownMinneapolis to itssouthern suburbs
Mostly (62%)choice
Balanced between bus, walking, and park and ride
Home locations spreadthroughout the region; theaverage rider lives more thanthree miles from the line.
Express Bus Connects suburbs anddowntowns
Primarily choice(84%)
About half park-and-ride (48%)
Home locations clustered atthe line origin
Express Bus Express routes withcoach buses
Almost exclusivelychoice (96%)
Mostly park andride (62%)
Home locations clustered atthe line origin
Local Bus Serves urban andsuburban areas withfrequent stops
Mostly captive(52%)
Nearly all bus or walk (90%)
Home locations scatteredalong route; most riders livewithin a mile of the bus line
Rail transit tends to attract more “choice” riders (discretionary transit users who could drive).
Several studies indicate that TOD can significantly reduce per capita automobile travel(Pushkarev and Zupan 1977; Cervero, et al. 2004; Evans and Pratt 2007; Gard 2007).Residents, employees and customers in such areas tend to own fewer cars, generate fewer vehicle trips, and rely more on alternative modes than in more automobile-oriented areas(Cambridge Systematics 1994; Gard 2007; Liu 2007). These impacts can be very durable;many older urban neighborhoods that developed along streetcar lines retain transitoriented features decades after the rail transit service discontinued. Goldstein (2007)found that household located within walking distance of a rail transit stations drive 30%less on average than if located in less transit-accessible locations.
A study of California transit-oriented development travel characteristics found thatCalifornia transit station area residents are approximately five times more likely tocommute by transit than average workers in the same city (Lund, Cervero and Willson2004). Office workers within 1/2 mile of rail transit stations to have transit commuteshares averaging 19% as compared to 5% regionwide. Average transit share for residentswithin 1/2 mile of the station was 27% compared to 7% for people living between 1/2mile and 3 miles of the station.
Gard (2007) found that TOD typically increases per capita transit ridership 2-5 times andreduces vehicle trip generation 8% to 32% compared with conventional development.Automobile travel declines and public transit travel increases as households locate closer to San Francisco region rail and ferry terminals drive, as indicated in Figures 3a and 3b.
Arrington, et al. (2008), found that Transit-Oriented Developments generate much less(about half) the automobile trips as conventional, automobile-oriented development. Liu(2007) used National Household Travel Survey and Census data to measure how variousgeographic and household characteristics affect household vehicle travel and fuelconsumption. The results indicate that, holding other factors constant, households inregions with rail transit systems (including small and large systems) drive 6% fewer annual miles and consume 11% less fuel on average than otherwise comparablehouseholds in regions that lack rail.

7/30/2019 Rail Ben
http://slidepdf.com/reader/full/rail-ben 10/67
Rail Transit In America: Comprehensive Evaluation of Benefits Victoria Transport Policy Institute
9
Figures 3a and 3b Transit Accessibility Impacts on Travel (MTC 2006)
0
10
20
30
40
50
60
< 0.5
(Urban)
> 1.0
(Higher
Density
Suburb)
> 1.0
(Lower
Density
Suburb)
1.0
(Rural)
Distance in Miles from Home to Rail or
Ferry Station
D a i l y H o u s e h o l d V e h i c l e
M i l e s 42%
28%
16%
4%
0%
10%
20%
30%
40%
50%
Live & Work
< 0.5
Live > 1.0,
Work < 0.5
Live < 0.5,
Work > 0.5
Live & Work
> 0.5
Distance in Miles from Rail or Ferry Station
T r a n s i t C o m m u t e M o d e
S h a r e
Automobile travel decreases and transit commute mode split increases with proximity to railtransit and ferry stations.
In other words, rail transit reduces automobile travel in two different ways: directly whena traveler shifts a trip from automobile to rail, and indirectly when it creates moreaccessible land use and reduces automobile ownership in an area. These indirect impactscan be large. Research summarized in Table 3 indicates that each rail transit passenger-mile leverages 1.4 to 9 automobile vehicle-miles reduced (also see Neff, 1996, and Newman and Kenworthy, 1999, p. 87). This study finds similar results.
Table 3 Leverage Effect VMT Reductions From Transit (Holtzclaw 2000; ICF 2008)Study Cities Veh.-Mile Reduction Per Transit Pass.-Mile
Older Systems Newer Systems
Pushkarev-Zupan NY, Chicago, Phil, SF, Bost, Clev. 4 Newman-Kenworthy Bost., Chicago, NY, SF, DC 2.9 Newman-Kenworthy 23 Developed/country cities 3.6Holtzclaw, 1991 San Francisco and Walnut Creek 8 4Holtzclaw, 1994 San Francisco and Walnut Creek 9 1.4ICF, 2008 U.S. cities 3-4This Study 130 U.S. cities 4.0
This table summarizes results from several studies indicating that rail transit leverages indirect
vehicle travel reductions. Each transit passenger-mile represents 1.4-9.0 miles of reduced vehicle-miles. This study finds similar results.
This may partly reflect self-selection (also called sorting), the tendency of people tochoose locations based on their transport abilities and preferences (Cao, Mokhtarian andHandy 2006 & 2008; Cervero 2007). For example, households that, by necessity or preference, drive less and rely more on alternative modes are likely to choose transit-

7/30/2019 Rail Ben
http://slidepdf.com/reader/full/rail-ben 11/67
Rail Transit In America: Comprehensive Evaluation of Benefits Victoria Transport Policy Institute
10
oriented areas. Lower vehicle travel rates in TODs may simply reflect a concentration of such households rather than an overall reduction. Some observed geographic differencesin travel behavior reflect these effects (Cervero 2007, estimates up to 40%), so it isinappropriate to assume that households which move from an automobile-oriented totransit-oriented locations necessarily reduce vehicle travel to neighborhood averages.
Self-selection reduces local traffic and parking problems (a building or neighborhood willgenerate less parking demand and fewer trips if it attracts less residents who own fewer cars and drive less), but not regional traffic problems.
However, there is plenty of evidence that only a minor portion of the differences in per capita vehicle ownership and use between transit-oriented and automobile-orientedlocations results from self-selection (Cervero and Arrington 2008). That urban regionswith rail transit have significantly lower per capita vehicle-travel indicates that impactsare more than sorting between neighborhoods. Before-and-after studies also indicate thatresidents significantly reduce vehicle ownership and use after moving to transit orientedareas. Of residents moving into Portland, Oregon’s new transit oriented developments,
30% reduced their vehicle ownership and 69% increased public transit use (Podobnik 2002; Switzer 2003). The probability of a household owning a motor vehicle decreases by about a third when residents move into such neighborhoods (Hess and Ong 2002).
Bento, et al (2003) found that “rail supply has the largest effect on driving of all our sprawl and transit variables.” They concluded that a 10% increase in rail service reducesthe probability of driving 4.2% or 40 annual vehicle miles per capita (70 VMT if NewYork City is included in the analysis), compared with just a one mile reduced by a 10%increase in bus service. That study found a 3.0 elasticity of rail transit ridership withregard to transit service supply (7.0 including New York), indicating significant network effects, that is, the more complete the transit network, the more ridership it receives.
Renne (2005) found that in major U.S. metropolitan regions transit commuting declinedramatically during the last three decades (from 19.0% in 1970 to 7.1% in 2000), butmuch smaller declines in the 103 TODs within those regions (from 15.1% in 1970 to16.7% in 2000). TODs in Portland, OR and Washington D.C., which strongly promotetransit, experienced significant (58%) ridership growth. Households in TODs also ownedfewer vehicles (35.3% of TOD households own two or more vehicles compared with55.3% in regions overall), although TOD residents have higher average incomes.
Baum-Snow and Kahn (2005) found that, although transit mode share declined in mostcities between 1970 and 1990, the decline was much smaller in cities with rail transit.They found that transit commute rates declined 23% (from 30% to 23%) in “old rail”cities (cities that have well-established rail transit systems in 1970), 20% (from 8% to6%) in “new rail” cities (cities that build rail transit lines between 1970 and 1990), and60% (5% to 2%) in cities without rail. At a census tract level they found higher rates of transit ridership in residential areas near both old and new rail transit lines, than in similar areas not served by transit. In all three groups declines stopped between 1990 and 2000.

7/30/2019 Rail Ben
http://slidepdf.com/reader/full/rail-ben 12/67
Rail Transit In America: Comprehensive Evaluation of Benefits Victoria Transport Policy Institute
11
Orenco Station in Portland, Oregon is an example of Transit Oriented Development, a medium-density, mixed use, walkable neighborhood located near a rail transit station. Residents tend to
own fewer cars and drive less than they would in more automobile-oriented communities.
A key question is whether new rail systems can affect transportation and land use patternssufficiently fast enough to be considered worthwhile investments, since land use patternsgenerally change slowly. Evidence from some cities indicates they can. As describedabove, Portland has several new transit oriented neighborhoods where residents tend toown fewer cars, drive less, and use public transit more than they otherwise would. As aresult, regional transit ridership is increasing and automobile travel declining relative tothe national average, as indicated in Figures 4a and 4b.
Figure 4a & 4b Portland Transportation Trends
Figure 4a Transit Trends (APTA Data)
010,000
20,000
30,000
40,000
50,000
60,000
70,000
80,000
1995 1997 1999 2001 2003 2005 2007 A n n u a l P a s s e n g e r - M i l e s ( m i l l i o n s )
Bus
Rail
Figure 4b VTM Trends (Portland Metro data)
1516
17
18
19
20
21
22
23
24
25
1990 1993 1996 1999 2002 2005 2008
A v e r a g e D a i l y V e h i c l e - M i l e s
U.S. National
Portland City
Portland Region
Portland region rail transit ridership is growing faster than bus ridership. Per capita vehicletravel is approximately 15% below the national average. (Portland Metro data at http://library.oregonmetro.gov/files//1990-2009_dvmt-portland-us.pdf ).

7/30/2019 Rail Ben
http://slidepdf.com/reader/full/rail-ben 13/67
Rail Transit In America: Comprehensive Evaluation of Benefits Victoria Transport Policy Institute
12
Bus transit tends to have less land use development impacts and so does little to reducevehicle travel. Bus transit programs that include incentives such as parking cash-out andlocation-efficient development have greater effects, but generally less than if those policies are implemented with rail transit (VTPI 2004).
Figure 5 Per Capita Transit Travel (FTA 2001)
0
200
400
600
800
1,000
1,200
0 5,000 10,000 15,000 20,000
City Population (Thousands)
A n
n u a l T r a n s i t P a s s e n g e r - M i l e s Large Rail
Small RailBus Only
This figure shows the relationship between city size and per capita transit ridership. Transit ridership tends to increase with city size. Large Rail cities tend to be located toward the upper-left corner of the graph, indicating higher than average ridership for their size.
Per-capita transit ridership is far higher in rail transit cities, as illustrated in Figures 5 and6. Annual per capita transit passenger-miles average 589 in Large Rail cities (520excluding New York), 176 passenger-miles in Small Rail cities, and 118 passenger-milesin Bus Only cities. Although this partly reflects the tendency of transit ridership toincrease with city size, cities with rail systems tend to occupy the upper-left area of thegraph in Figure 5, indicating high ridership for their population.
Figure 6 Annual Per Capita Transit Ridership (FTA 2001)
0
100
200
300
400
500
600
Large Rail Small Rail Bus Only A n n u a l T r a n s i t P a
s s e n g e r - M i l e s
This graph compares average transit ridership between different types of cities.
7/30/2019 Rail Ben
http://slidepdf.com/reader/full/rail-ben 14/67
Rail Transit In America: Comprehensive Evaluation of Benefits Victoria Transport Policy Institute
13
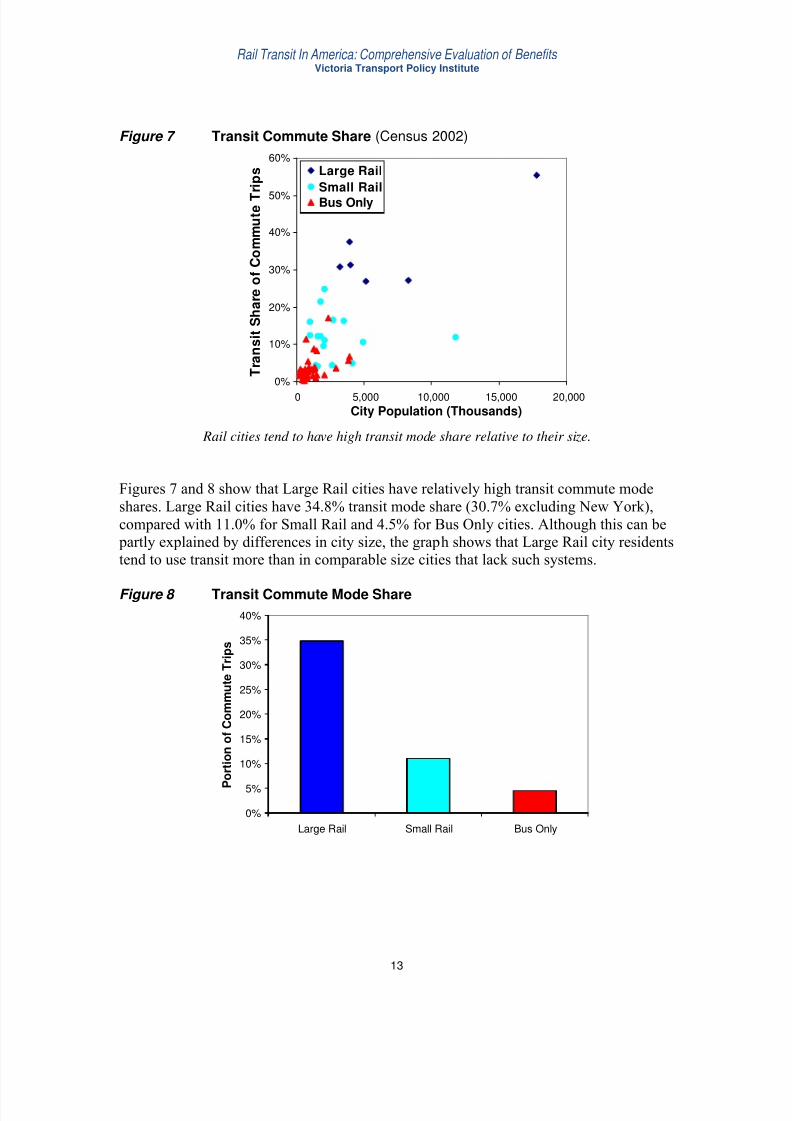
Figure 7 Transit Commute Share (Census 2002)
0%
10%
20%
30%
40%
50%
60%
0 5,000 10,000 15,000 20,000
City Population (Thousands)
T r a n s i t S h a r e o f C o m m u t e T
r i p s Large Rail
Small RailBus Only
Rail cities tend to have high transit mode share relative to their size.
Figures 7 and 8 show that Large Rail cities have relatively high transit commute modeshares. Large Rail cities have 34.8% transit mode share (30.7% excluding New York),compared with 11.0% for Small Rail and 4.5% for Bus Only cities. Although this can be partly explained by differences in city size, the graph shows that Large Rail city residentstend to use transit more than in comparable size cities that lack such systems.
Figure 8 Transit Commute Mode Share
0%
5%
10%
15%
20%
25%
30%
35%
40%
Large Rail Small Rail Bus Only
P
o r t i o n o f C o m m u t e T r i p s

7/30/2019 Rail Ben
http://slidepdf.com/reader/full/rail-ben 15/67
Rail Transit In America: Comprehensive Evaluation of Benefits Victoria Transport Policy Institute
14
Figure 9 shows that per capita vehicle ownership declines with rail transit. Large Rail cityresidents own 0.68 vehicles per capita (0.71 excluding New York), as opposed to 0.77 inSmall Rail cities, and 0.80 in Bus Only cities, as illustrated in Figure 9. This is particularly notable because Large Rail city residents have higher average incomes thanresidents of other types of cities, which generally increases vehicle ownership. This
reduction in vehicle ownership provides consumer cost savings and helps leverageadditional reductions in automobile travel beyond just the passenger-miles shifted fromdriving to transit.
Figure 9 Per Capita Vehicle Ownership (BLS 2003)
0.0
0.2
0.4
0.6
0.8
1.0
1.2
0 200 400 600 800 1,000 1,200
Per Capita Transit Passenger-Miles
M o t o r V e h i c l e s
P e r C a p i t a
Large RailSmall RailBus Only
New YorkHonolulu
Philadelphia
SF
Minneapolis
Seattle
Portland
Miami
Per-capita vehicle ownership tends to decline with increased per-capita transit ridership, and is
lower, on average, in Large Rail cities.
Figure10 Per Capita Private Vehicle Ownership
0
0.1
0.2
0.3
0.4
0.5
0.6
0.7
0.8
0.9
Large Rail Small Rail Bus Only
P r i v a
t e V e h i c l e s P e r C a p i t a
Residents of Large Rail cities tend to own fewer motor vehicles than residents of other cities.

7/30/2019 Rail Ben
http://slidepdf.com/reader/full/rail-ben 16/67
Rail Transit In America: Comprehensive Evaluation of Benefits Victoria Transport Policy Institute
15
Figure 11 shows average annual per capita vehicle mileage for various cities. Residentsof Large Rail cities drive an average of 7,548 vehicle-miles (7,840 excluding New York),residents of Small Rail cities average 8,679 vehicle-miles, and residents of Bus Onlycities average 9,506 annual vehicle-miles, as illustrated in Figure 11.
Figure 11 Average Per Capita Annual Vehicle Mileage (FHWA 2002, Table 71)
0
2,000
4,000
6,000
8,000
10,000
12,000
14,000
16,000
0 5,000 10,000 15,000 20,000
City Population (Thousands)
A n n u a
l P e r C a p i t a M o t o r V e h i c l e - M i l e s
Large RailSmall RailBus Only
Residents of Large Rail cities tend to drive significantly less than residents of other cities.
Large Rail city residents drive 12% less per year than residents of Small Rail cities, and20% less than residents of Bus Only cities. This indicates the leverage effect of rail.Residents of Large Rail cities average 470 more transit passenger-miles than Bus Only
cities, and drive 1,958 fewer vehicle-miles, a 4:1 ratio. This ratio increases to 5:1 whenthe analysis is limited to cities with more than 2 million population, indicating that citysize does not explain these differences.
Figure 12 Annual Per Capita Vehicle-Miles
0
2,000
4,000
6,000
8,000
10,000
Large Rail Small Rail Bus Only
A n n u a l V
e h i c l e - M i l e s
Residents of Large Rail cities drive about 20% less per year than residents of cities that lack railtransit, despite their higher average annual incomes which normally increases vehicle travel.
7/30/2019 Rail Ben
http://slidepdf.com/reader/full/rail-ben 17/67
Rail Transit In America: Comprehensive Evaluation of Benefits Victoria Transport Policy Institute
16
Congestion Impacts
Traffic congestion costs consist of incremental delay, stress, vehicle operating costs and pollution that a vehicle imposes on other road users. Congestion reduction is a primarytransportation improvement objective. Special care is needed to accurately evaluate
transit congestion reduction impacts (“Congestion Costs,” Litman 2009). Trafficcongestion tends to increase with city size, and since rail transit systems are generallydeveloped as cities grow large and experience severe congestion, cities with rail transittend to have worse congestion than those without. However, it is wrong to conclude thatrail transit causes congestion or that congestion problems would be as severe without rail.
Congestion is a non-linear function: once a roadway reaches capacity even a smallreduction in volumes can significantly reduce delays. For example, a 5% reduction in peak-hour traffic volumes on a road at 90% capacity can reduce delay by 20% or more.Transit can provide significant congestion reduction benefits, even if it only carries asmall portion of total regional travel, because it offers an alternative on the most
congested corridors. Reducing just a few percent of vehicles on such roads cansignificantly reduce total regional congestion costs.
Congestion reduction benefits can be difficult to evaluate because urban traffic tends tomaintain equilibrium: traffic volumes grow until congestion delays discourage additional peak-period trips. Grade-separated transit acts as a pressure-relief value, reducing the point of congestion equilibrium, as described in the box below. Although congestionnever disappears, it is far less intense than would occur if such transit did not exist.
How Transit Reduces Traffic Congestion (Litman 2006)Urban traffic congestion tends to maintain equilibrium. If congestion increases, people changedestinations, routes, travel time and modes to avoid delays, and if it declines they take additional peak- period trips. If roadway capacity increases, it will be partly filled by this latent demand (potentialadditional peak-period vehicle trips). Reducing this point of equilibrium is the only way to reducecongestion over the long run. The quality of travel alternatives has a significant effect on thisequilibrium: If alternatives are inferior, few motorists will shift mode and the level of equilibrium will be high. If travel alternatives are relatively attractive, more motorists will shift modes, resulting in alower equilibrium. Improving travel options can therefore benefit all travelers on a corridor, both thosewho shift modes and those who continue to drive. Shifts to alternative modes not only reducecongestion on a particular highway, they also reduce traffic discharged onto surface streets, providing“downstream” congestion reduction benefits.
To reduce congestion, transit must attract discretionary riders (travelers who would otherwise drive),which requires fast, comfortable, convenient and affordable service. When transit is faster than driving
a portion of travelers shift mode until congestion declines to the point that transit attracts no additionalriders. As a result, the faster and more comfortable the transit service, the faster the traffic speeds on parallel highways. This is indicated by studies which find that door-to-door travel times for motoriststend to converge with those of grade-separated transit (Mogridge 1990; Lewis and Williams 1999;Vuchic 1999), and by studies such as this one which find that congestion costs are lower in cities withgrade-separated transit systems.

7/30/2019 Rail Ben
http://slidepdf.com/reader/full/rail-ben 18/67
Rail Transit In America: Comprehensive Evaluation of Benefits Victoria Transport Policy Institute
17
To reduce traffic congestion transit services must:
• Serve a major share of major urban corridors and destinations.
• Offer high quality service (relatively convenient, fast, frequent and comfortable) that isattractive to peak-period travelers.
• Be grade separated (with bus lanes or separated rail lines), so transit travel is relativelyfast compared with driving under congested conditions.
• Be relatively affordable, with low fares and discounts targeted at peak-period travelers.
Rail travel is often slower than driving. According to the 1995 National Personal TravelSurvey, travel by light rail average 15.4 miles-per-hour (MPH), heavy rail 20.3 MPH, andcommuter rail 31.6 MPH, while automobile travel averages about 35 MPH (NPTS 1999).Travel surveys generally find that door-to-door (including walking and waiting time)transit commute take about twice as long as automobile commutes, suggesting that transitinvestments are an ineffective way of saving travel time. However, it is important to take
several factors into account when comparing transit and automobile travel speeds.
That national or regional average automobile travel speeds are higher than rail isirrelevant; what matters is their relative speeds on a particular corridor. Automobile traveltends to be slower and commute travel times higher in large cities where rail transit ismost common. For example, although automobile commute speeds average 39 mph inrural areas, they average only 33 mph in cities with more than 3 million residents (NPTS1999). Automobile travel speeds tend to be even slower on the congested urban corridorstypically served by rail transit. Even if transit is slower than driving on average, rail isfaster for specific trips because it is grade separated.
Even if transit travel takes more time measured by the clock, the additional time mayhave a lower cost to travelers than the same time spent driving because it imposes lessstress. Passengers using high-quality transit (passengers have comfortable seats andvehicles are safe, clean, reliable and quiet), can read, work and rest. Various studiesindicate that consumers place a higher cost on time spent driving than travel as a passenger, and drivers’ time costs increase as congestion becomes more intense (Li 2003;Litman 2008). Passengers’ travel time costs typically average 35% of wages, whiledrivers’ time costs 50% of wages, with a premium of 33% for Level of Service (LOS) D,67% for LOS E, and 100% for LOS F (“Travel Time,” Litman 2009).
Of course, every trip is unique. Transit is sometimes not an option, because it does not
serve a destination, travelers must carry special loads, or need a vehicle at work. Sometravelers cannot take rail because they want to smoke or have difficulty with the walkinglinks of transit trips. Some people dislike riding transit, or simply prefer driving. But thatdoes not negate the benefits of high quality transit; if available, travelers can select themode that best meets their needs and preferences. This maximizes transport systemefficiency (since shifts to transit reduce traffic and parking congestion) and consumer benefits (since it allows consumers to choose the option they prefer).

7/30/2019 Rail Ben
http://slidepdf.com/reader/full/rail-ben 19/67
Rail Transit In America: Comprehensive Evaluation of Benefits Victoria Transport Policy Institute
18
Several studies using various methodologies indicate that high quality transit tends toreduce vehicle traffic congestion on a corridor (Lewis and Williams 1999; Litman 2006)The Texas Transportation Institute’s (TTI’s) annual Urban Mobility Study providesseveral congestion indicators. Some, such as per-capita congestion delay or cost, aremore appropriate than others for evaluating transit impacts because they account for time
savings resulting from mode shifts and more accessible land use. Measured this way,Large Rail cities have substantially less congestion than comparable size cities, asillustrated in Figure 13.
Figure 13 Congestion Costs (TTI 2003)
$0
$200
$400
$600
$800
$1,000
$1,200
0 5,000 10,000 15,000 20,000
City Population (Thousands)
A n n u a l D o l l a r s
P e r C a p i t a
Large RailSmall RailBus Only
Los Angeles
New YorkChicago
Philadelphia
Miami
Dallas
San Francisco
In Bus Only and Small Rail cities, traffic congestion costs tend to increase with city size, as
indicated by the dashed curve. But Large Rail cities do not follow this pattern. They havesubstantially lower congestion costs than comparable size cities. As a result, New York and Chicago have about half the per capita congestion delay as Los Angeles.
Winston and Langer (2004) found that motorist and truck congestion delay declines in acity as rail transit mileage expands, but increases as bus transit mileage expands,apparently because bus transit attracts fewer motorists, contributes to traffic congestion,and has less positive impact on land use accessibility. Garrett (2004) found that trafficcongestion growth declined somewhat in some U.S. cities after light rail service began. InBaltimore the congestion index increased an average of 2.8% annually before light rail,
but only 1.5% annually after. In Sacramento the index grew 4.5% annually before lightrail but only 2.2% after. In St. Louis the index grew an average of 0.89% before light rail,and 0.86% after. Between 1998 and 2003, Portland’s population grew 14%, yet per capitacongestion delay did not increase, possibly due to transit improvements that significantlyincreased transit ridership (TTI 2005). Other studies find similar results (LRN 2001).

7/30/2019 Rail Ben
http://slidepdf.com/reader/full/rail-ben 20/67
Rail Transit In America: Comprehensive Evaluation of Benefits Victoria Transport Policy Institute
19
Nelson, et al (2006) used a regional transport model to estimate transit system benefits,including direct users benefits and the congestion-reduction benefits to motorists. Theyfound that rail transit generates congestion-reduction benefits that exceed subsidies.
Figure 14 Transit Congestion Cost Savings (TTI 2003)
$0
$100
$200
$300
$400
$500
0 5,000 10,000 15,000 20,000
City Population (Thousands)
P e r C a p i t a A n n u a l D o l l a r s
Large RailSmall RailBus Only
This figure illustrates per capita congestion cost savings due to transit service.
Figures 14 and 15 compare congestion cost savings provided by public transit for variouscities, as estimated by the Texas Transportation Institute. Large Rail cities have greater transit congestion reductions than other cities. Of the 50 largest cities, Large Rail citiesaverage $279 savings per capita, compared with $88 Small Rail cities, and $41 for Bus
Only cities. These savings total more than $14.0 billion in Large Rail cities, $5.4 billionin Small Rail cities, and $1.8 billion dollars in Bus Only cities (considering only the 50largest U.S. cities), indicating that rail provides $19.4 billion annual congestion costsavings. These savings approximately equal total U.S. public transit subsidies.
Figure 15 Transit Congestion Cost Savings (TTI 2003)
$0
$50
$100
$150
$200
$250
$300
Large Rail Small Rail Bus Only
P e r C a p i t a A n
n u a l D o l l a r s
Large Rail cities achieve large transit congestion cost savings.

7/30/2019 Rail Ben
http://slidepdf.com/reader/full/rail-ben 21/67
Rail Transit In America: Comprehensive Evaluation of Benefits Victoria Transport Policy Institute
20
Table 4 Congestion Delay In Six Largest U.S. CitiesLarge Rail Small Rail
City Population Congestion Delay City Population Congestion Delay
New York 17,799,861 25 Los Angeles 11,789,487 52
Chicago 8,307,904 27 Miami 4,919,036 33Philadelphia 5,149,079 17 Dallas 4,145,659 36Averages 7,814,211 23 Averages 5,213,545 40
Of the six largest U.S. cities, the three with Large Rail systems have about half the congestiondelay as the three that lack such systems.
Table 4 and Figure 16 show matched pair analysis compare per capita congestion costs of threeLarge Rail cities (New York, Chicago and Philadelphia) similar size Small Rail cities (LosAngeles, Miami and Dallas). Residents of the three Large Rail cities experienced about half congestion costs as in Small Rail cities. Similar patterns are found in developing countries such asIndia (Wilbur Smith 2008).
Figure 16 Transit Congestion Cost Savings (TTI 2003)
0
10
20
30
40
50
60
New YorkLos Angeles Chicago Dallas Philadelphia Miami
A n n u a l P e r C a p i t a D e l a y H o u r s
Large Rail
Small or No Rail
Matched-pair analysis shows that cities with large rail transit systems have significant less per capita traffic congestion delay than similar size cities that have small or no rail transit. Thissuggests that rail transit significantly reduces congestion costs.
Baum-Snow and Kahn (2005) found significantly lower average commute travel timesaround rail transit stations than in otherwise comparable areas that lack rail. They
estimate that these savings total 50,000 hours per day in Washington DC, and smaller amounts in other cities. Another indicator of transit’s congestion reduction benefits is theincreased traffic delay that occurs in rail-oriented cities when the transit system stops for any reason, such as a mechanical failure or strike. For example, Lo and Hall (2006) foundthat highway traffic speeds declined as much as 20% and rush hour duration increasedsignificantly during the 2003 Los Angeles transit strike, despite the fact that transit hasonly a 6.6% regional commute mode share. Speed reductions were particularly largealong rail transit corridors.
7/30/2019 Rail Ben
http://slidepdf.com/reader/full/rail-ben 22/67
Rail Transit In America: Comprehensive Evaluation of Benefits Victoria Transport Policy Institute
21
This leaves little doubt that rail transit reduces per capita congestion costs. However, thisdoes not mean that such cities lack congestion. In fact, congestion, measured as roadwayLevel-of-Service or average traffic speeds, is often quite intense in these cities becausethey are large and dense. However, people in these cities have travel alternatives
available on congested corridor, and tend to drive less, and so they experiencesignificantly less congestion delay each year.
Critics sometimes claim that rail transit does not reduce traffic congestion, ignoring theevidence presented in this and other studies (Litman 2006). In some cases they ignorefactors such as city size, and so conclude incorrectly that rail transit causes congestion.They often use inappropriate congestion indicators, such as the Travel Time Index, whichonly measures delay to roadway (automobile and bus) traffic, and so ignores delayreductions when people shift to transit, and from transit-oriented development thatreduces travel distances. That the travel time index actually implies that congestiondeclines if residents increase their vehicle mileage and total travel time, for example, due
to more dispersed land use if the additional driving occurs in less congested conditions.

7/30/2019 Rail Ben
http://slidepdf.com/reader/full/rail-ben 23/67
Rail Transit In America: Comprehensive Evaluation of Benefits Victoria Transport Policy Institute
22
Cost Effectiveness
Rail transit systems may appear costly due to various special factors:
• New transit projects must overcome decades of underinvestment in grade-separated transit.
• Transit must provide a high quality of service to attract discretionary riders out of their cars.
• Rail transit is generally constructed in the densest part of a city where any transportation project is costly, due to high land values, numerous design constraints, and many impacts.
• Rail transit projects often include special amenities such as community redevelopment andstreetscape improvements which provide additional benefits, besides just mobility.
• Rail transit projects include tracks, trains, stations, and sometimes parking facilities. It isinappropriate to compare rail system costs with just the cost of adding roadway capacity;comparisons should also include vehicle and parking costs needed for automobile travel.
Table 5 Typical Automobile Commute Trip Costs (Litman 2009)
Small City Medium City Large CityAverage Vehicle Costs (per vehicle-mile) 50¢ 60¢ 70¢Roadway Capacity Cost (per vehicle-mile) 15¢ 25¢ 50¢Parking (per day/per mile for 20-mile round trip) $3.00 (15¢) $6.00 (30¢) $9.00 (45¢)
Total Per Mile Costs $1.05 $1.70 $2.35
This table illustrates typical costs for an automobile commute for various size cities.
Most people never purchase a road or individual parking space and so greatly underestimatethe full cost of accommodating additional urban automobile travel, taking into accountvehicle, road and parking costs. Table 5 and Figure 17 show typical estimates of these costs.
Figure 17 Average Costs By Mode (APTA 2002; Litman 2009)
$0.00
$0.20
$0.40
$0.60
$0.80
$1.00
$1.20
$1.40
$1.60
$1.80
Bus Heavy Rail Commuter
Rail
Light Rail Automobile
- Small City
Auto -
Medium
City
Auto - Large
City
C
o s t P e r P a s s e n g e r - M i l e
Parking Costs
Roadway Costs
Vehicle Operation
This figure compares costs per passenger-mile of various modes. Rail transit costs are usually less thancombined road, vehicle and parking costs, particularly in large cities.

7/30/2019 Rail Ben
http://slidepdf.com/reader/full/rail-ben 24/67
Rail Transit In America: Comprehensive Evaluation of Benefits Victoria Transport Policy Institute
23
Critics often claim that rail transit is more costly than bus or automobile transport, butthis often reflects faulty analysis. They usually consider just a small portion of totaltransit benefits and underestimate the actual costs of accommodating additionalautomobile travel under the same conditions, taking into account the high costs of
increasing road and parking capacity on major urban corridors. When all benefits andcosts are considered, rail transit often turns out to be the most cost effective way of accommodating additional urban travel.
Claims that rail transit projects consume an excessive portion of transportation budgetsalso tend to reflect incomplete analysis. For example, of $167 billion total federal, stateand local government transportation expenditures in 2000, $104 billion was for roads,$15.9 billion for bus transit, $1.8 billion for demand-response services, and $16.7 billionfor rail. The cost of parking at destinations is estimated to total more than $200 billionannually (Litman 2009). Rail transit expenditures equal about 5% of total automobilefacility costs (roads and parking), as illustrated in Figure 18.
Figure 18 Transportation Expenditures (Litman 2009; BTS 2003, Table 3-29a)
$0
$50
$100
$150
$200
$250
$300
$350
Automobiles Transit
2 0 0 0 D o l l a r s ( B i l l i o n s )
Parking Subsidies
Roads
Demand Response
Bus
Rail
Transit subsidies represent about 19% of total government expenditures on transportationservices, less than half of which is for rail transit. Rail transit represents less than 5% of totalexpenditures on roads, parking subsidies and transit.
When a major rail transit project is under construction most of the cost is included in a particular transportation agency’s capital budget, so for a few years it appears relativelylarge. This is no different than other major investments, including highway projects and bridges, or a household’s automobile purchase, which may appear exceptionally largecompared with a single year’s budget. When averaged over a larger time period (railtransit capital investments have 20-50 year operating lives), or over several cities, transitcapital projects represent a small portion of total government transportation expenditures.

7/30/2019 Rail Ben
http://slidepdf.com/reader/full/rail-ben 25/67
Rail Transit In America: Comprehensive Evaluation of Benefits Victoria Transport Policy Institute
24
Rail systems are sometimes justified for special reasons. For example, New Orleans andSeattle have popular tourist trolley systems which have high costs per passenger-mile, because they are small and serve short trips, but are considered worthwhile investments because they contribute a special ambiance and attract visitors. Rail transit may also be justified to support growth at a particular commercial center or sport arena, since it is not
economically possible for a center to expand beyond about 10,000 employee or visitorswithout a significant portion arriving by transit, due to road and parking constraint.Because diesel buses are noisy and smelly, large bus terminals are less suitable than railstations for accommodating large numbers of transit passengers. Although rail systemsmay seem costly, a significant portion of their costs are often offset by increased propertyvalues, business activity and productivity gains (Smith and Gihring 2003).
Special care is needed when comparing automobile and transit funding. Transit is fundedto help achieve various objectives, including congestion reduction, road and parkingfacility cost savings, consumer cost savings, basic mobility for disadvantaged people,increased safety, pollution reduction and support for strategic development objectives.
For efficiency-justified funding (to reduce costs such as congestion, facility costs,accidents and pollution) transit and automobile transport can be compared usingmeasures of cost effectiveness, such as costs per passenger-mile or benefit/cost ratio, toidentify the cheapest option. In that case, there is no particular reason to subsidize atransit trip more than an automobile trip, provided all costs (including road and parkingcosts, traffic services, congestion and crash risk impacts on other road users, andenvironmental impacts) are considered.
However, for equity-justified service (providing basic mobility to disadvantaged people)there are reasons to subsidize transit more than automobile travel, because transit bearsadditional costs to accommodate people with disabilities (such as wheelchair lifts), andmany non-drivers have low incomes, so greater public subsidies are justified on equitygrounds. Since many of these people cannot drive, the alternative must include the cost of a driver, so transit costs should be compared with taxi service costs (or a combination of taxi and chauffeured automobile travel, taking into account the value of time by familymembers and friends who drive), not simply with vehicle costs.
Care is also needed when comparing different types of transit. Buses are generallycheaper to operate than trains per vehicle-mile, but trains have more capacity and so arecheaper per passenger-mile on routes with high demand. Similarly, costs per vehicle-mile or vehicle-hour tend to be higher in larger cities, due to increased congestion and higher wages, but ridership also tends to be higher, reducing costs per passenger-mile. For example, according to APTA data, bus employees earn an average of $46,139 annually inwages and benefits, compared with $81,307 for regional rail transit employees, due todifferences in job classifications and prevailing wage rates, but costs per passenger-miletend to be much lower in larger cities due to the higher load factors and efficiencies.

7/30/2019 Rail Ben
http://slidepdf.com/reader/full/rail-ben 26/67
Rail Transit In America: Comprehensive Evaluation of Benefits Victoria Transport Policy Institute
25
Figure 19 Average Operating Cost By Mode and City Category (APTA 2002)
$0.00
$0.25
$0.50
$0.75
$1.00
Large Rail Small Rail Bus Only O p e r a t i n g C o s t P e r P
a s s e n g e r - M i l e
Bus
Heavy Rail
Commuter Rail
Light Rail
Transit operating costs tend to be lower in Large Rail cities than Small Rail cities. Bus Only citieshave slightly lower bus operating costs, probably due to lower wages and less congestion.
Operating costs per transit passenger-mile are generally lower in Large Rail cities than inSmall Rail cities, and heavy and commuter rail costs are lower than light rail and buscosts, as illustrated in figures 19 and 20.
Figure 20 Operating Cost By Mode And City Category (APTA 2002)
$0.00
$0.20
$0.40
$0.60
$0.80
$1.00
$1.20
$1.40
$1.60
0 5,000 10,000 15,000 20,000
City Population (Thousands)
O p e r a t i n g C o s t P e r P a s s e n g e r - M i l e
Large Rail-Bus
Large Rail-Heavy Rail
Large Rail - Commuter
RailLarge Rail - Light Rail
Small Rail - Bus
Smarl Rail- Heavy Rail
Small Rail - CommuterRailSmall Rail - Light Rail
Large Rail transit systems tend to have lower operating costs than Small Rail systems.
Rail transit systems also tend to have greater cost recovery, that is, a larger portion of operating costs are paid by fares, as illustrated in Figure 21. Transit cost recovery(including both rail and bus services) averages 38% for Large Rail systems (36%excluding New York), 24% for Small Rail systems, and 21% for Bus Only systems.
7/30/2019 Rail Ben
http://slidepdf.com/reader/full/rail-ben 27/67
Rail Transit In America: Comprehensive Evaluation of Benefits Victoria Transport Policy Institute
26
Figure 21 Transit System Cost Recovery (FTA 2001)
0%
10%
20%
30%
40%
50%
60%
0 5,000 10,000 15,000 20,000
City Population (Thousands)
C o s t R e c o v e r y R
a t i o
Large RailSmall RailBus Only
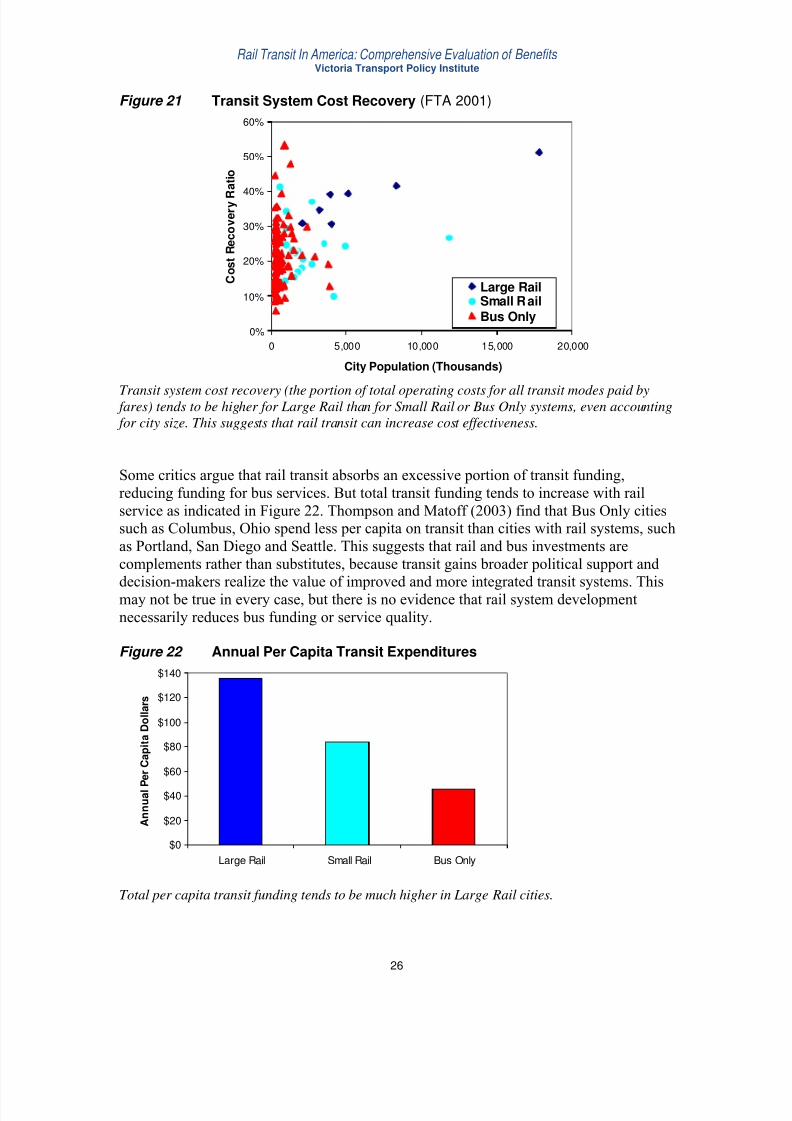
Transit system cost recovery (the portion of total operating costs for all transit modes paid by fares) tends to be higher for Large Rail than for Small Rail or Bus Only systems, even accounting for city size. This suggests that rail transit can increase cost effectiveness.
Some critics argue that rail transit absorbs an excessive portion of transit funding,reducing funding for bus services. But total transit funding tends to increase with railservice as indicated in Figure 22. Thompson and Matoff (2003) find that Bus Only citiessuch as Columbus, Ohio spend less per capita on transit than cities with rail systems, suchas Portland, San Diego and Seattle. This suggests that rail and bus investments arecomplements rather than substitutes, because transit gains broader political support and
decision-makers realize the value of improved and more integrated transit systems. Thismay not be true in every case, but there is no evidence that rail system developmentnecessarily reduces bus funding or service quality.
Figure 22 Annual Per Capita Transit Expenditures
$0
$20
$40
$60
$80
$100
$120
$140
Large Rail Small Rail Bus Only
A n n u a l P
e r C a p i t a D o l l a r s
Total per capita transit funding tends to be much higher in Large Rail cities.
7/30/2019 Rail Ben
http://slidepdf.com/reader/full/rail-ben 28/67
Rail Transit In America: Comprehensive Evaluation of Benefits Victoria Transport Policy Institute
27
Road and Parking Cost Savings
To the degree that rail transit reduces automobile ownership and use it can provide roadand parking facility cost savings (Litman 2009; Topp 2009). Reductions in vehicleownership reduce residential parking costs, and reductions in vehicle trips reduceroadway costs and parking costs at destinations. These benefits tend to be particularly
large because rail serves dense urban areas where road and parking facility costs are particularly high.
A survey of 17 transit-oriented developments (TOD) in five U.S. metropolitan areasshowed that vehicle trips per dwelling unit were substantially below what the Institute of Transportation Engineer’s Trip Generation manual estimates (Cervero and Arrington2009). During a typical weekday the surveyed TOD housing projects averaged 44%fewer vehicle trips than the manual estimates (3.754 versus 6.715), ranging from 70-90%lower for projects near downtown to 15-25% lower in low-density suburbs. Similarly, a parking and traffic generation study of Portland, Oregon transit oriented developmentsrecorded 0.73 vehicles per housing unit, about half the 1.3 value in the ITE Parking
Generation Handbook , and 0.15 to 0.29 vehicle trips per dwelling unit in the AM periodand 0.16 to 0.24 vehicle trips per dwelling in the PM period, about half the 0.34 AM and0.38 PM values in the Trip Generation Handbook (PSU ITE Student Chapter 2007).
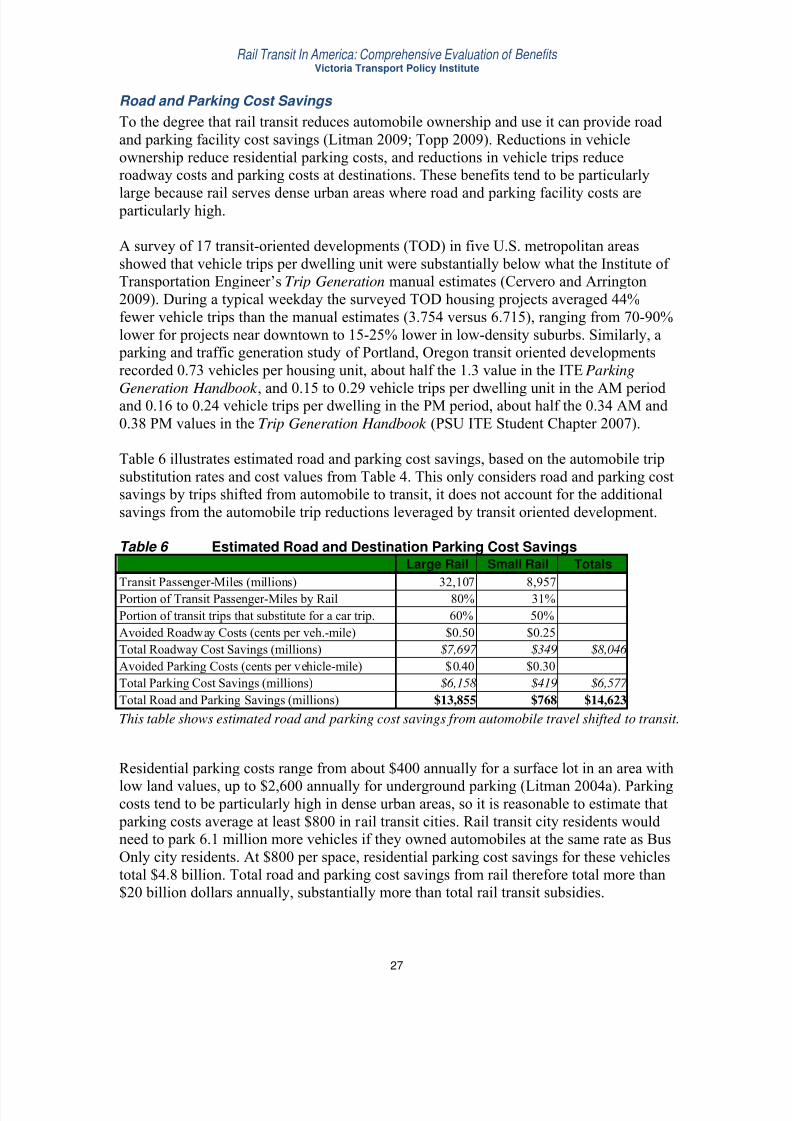
Table 6 illustrates estimated road and parking cost savings, based on the automobile tripsubstitution rates and cost values from Table 4. This only considers road and parking costsavings by trips shifted from automobile to transit, it does not account for the additionalsavings from the automobile trip reductions leveraged by transit oriented development.
Table 6 Estimated Road and Destination Parking Cost Savings Large Rail Small Rail Totals
Transit Passenger-Miles (millions) 32,107 8,957Portion of Transit Passenger-Miles by Rail 80% 31%Portion of transit trips that substitute for a car trip. 60% 50%Avoided Roadway Costs (cents per veh.-mile) $0.50 $0.25Total Roadway Cost Savings (millions) $7,697 $349 $8,046
Avoided Parking Costs (cents per vehicle-mile) $0.40 $0.30Total Parking Cost Savings (millions) $6,158 $419 $6,577
Total Road and Parking Savings (millions) $13,855 $768 $14,623
This table shows estimated road and parking cost savings from automobile travel shifted to transit.
Residential parking costs range from about $400 annually for a surface lot in an area with
low land values, up to $2,600 annually for underground parking (Litman 2004a). Parkingcosts tend to be particularly high in dense urban areas, so it is reasonable to estimate that parking costs average at least $800 in rail transit cities. Rail transit city residents wouldneed to park 6.1 million more vehicles if they owned automobiles at the same rate as BusOnly city residents. At $800 per space, residential parking cost savings for these vehiclestotal $4.8 billion. Total road and parking cost savings from rail therefore total more than$20 billion dollars annually, substantially more than total rail transit subsidies.

7/30/2019 Rail Ben
http://slidepdf.com/reader/full/rail-ben 29/67
Rail Transit In America: Comprehensive Evaluation of Benefits Victoria Transport Policy Institute
28
Consumer Financial Impacts
About 18% of total household expenditures are devoted to vehicles and transit fares(BLS, 2003). Rail transit reduces these costs. Large Rail city residents spend $2,808 onaverage on vehicles and transit ($2,803 excluding New York), compared with $3,350 in
Small Rail cities and $3,332 in Bus Only cities, despite 7% higher average incomes,which normally increases spending. Figures 23 and 24 illustrate these differences.
Figure 23 Transport Expenditures (BLS 2003)
$0
$500
$1,000
$1,500
$2,000
$2,500
$3,000
$3,500
$4,000
$4,500
0 200 400 600 800 1,000 1,200
Per-Capita Transit Passenger-Miles
A n n u a l P e r - C
a p i t a T r a n s p o r t a t i o n
E x p
e n d i t u r e s
Large RailSmall RailBus Only
Per-capita transportation expenditures tend to decline with increased transit ridership.
Large Rail city residents save $22.6 billion in total compared with what consumers spendon transportation in Bus Only cities. These savings are greater than all transit subsidies inthe U.S., indicating substantial net economic benefits.
Figure 24 Annual Per Capita Consumer Expenditures on Transportation
$0
$500
$1,000
$1,500
$2,000
$2,500
$3,000
$3,500
Large Rail Small Rail Bus Only
A n n u a l P
e r C a p i t a D o l l a r s
Large Rail city residents save about $500 annually per capita on total transportation expenses.

7/30/2019 Rail Ben
http://slidepdf.com/reader/full/rail-ben 30/67
Rail Transit In America: Comprehensive Evaluation of Benefits Victoria Transport Policy Institute
29
Figure 25 Percent Transport Expenditures (BLS 2003)
R2
= 0.2582
0%
5%
10%
15%
20%
25%
0 200 400 600 800 1,000 1,200
Per-Capita Annual Transit Passenger-Miles
P o r t i o n o f T o t a l H
o u s e h o l d
E x p e n d i t u r e s D e v o t e d t o T r a n s p o r t
LargeRail
Small
San Diego
New York
Baltimore
The portion of total household expenditures devoted to transportation (automobiles and transit)tends to decline with increased transit ridership, and is lower, on average, in Large Rail cities.
Figures 25 and 26 compare transportation as a percentage of household expenditures,which takes into account the higher wages in large cites. Large Rail city residents devote just 12.0% of their income to transportation (this does not change if New York isexcluded), compared with 15.8% in Small Rail cities, and 14.9% in Bus Only cities.International comparisons show similar patterns (Kenworthy and Laube 2000).
Figure 26 Percent Transport Expenditures
0%
2%
4%
6%
8%
10%
12%
14%
16%
18%
Large Rail Small Rail Bus Only P
o r t i o n o f H o u s e h o l d E x p e n d i t u r e s
D e v o t e d t o T r a n s p o r t a t i o n
7/30/2019 Rail Ben
http://slidepdf.com/reader/full/rail-ben 31/67
Rail Transit In America: Comprehensive Evaluation of Benefits Victoria Transport Policy Institute
30
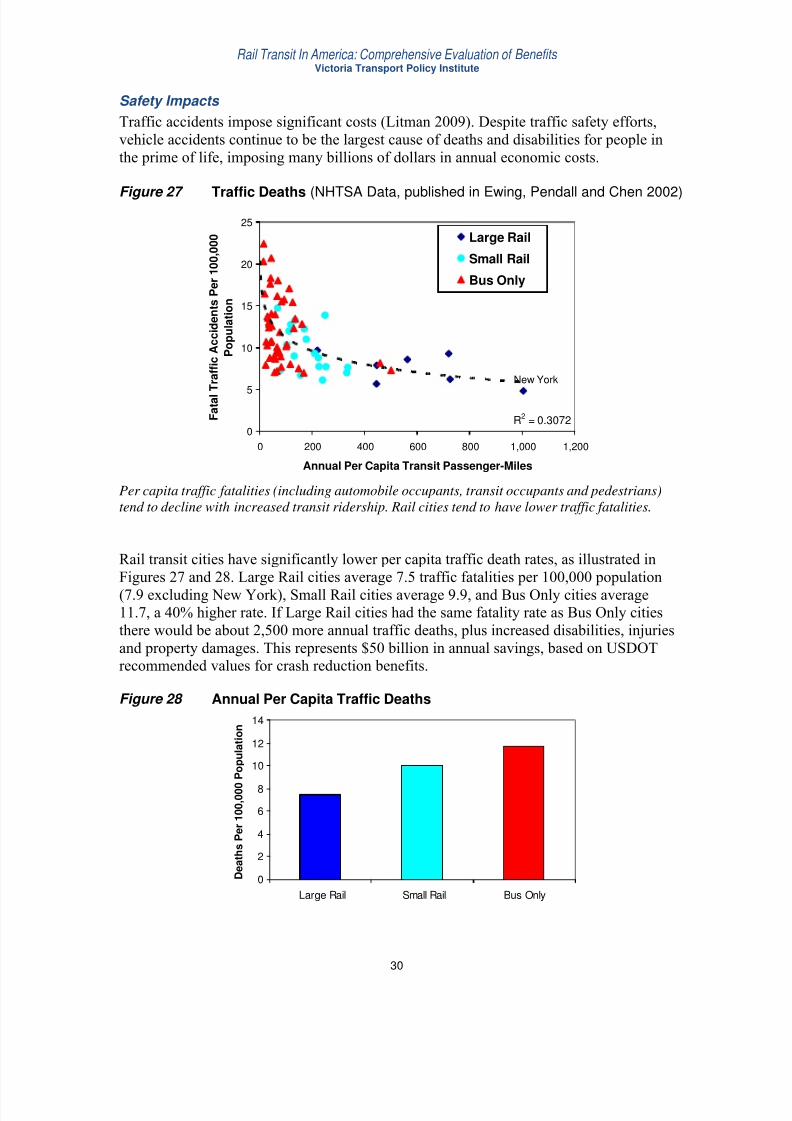
Safety Impacts
Traffic accidents impose significant costs (Litman 2009). Despite traffic safety efforts,vehicle accidents continue to be the largest cause of deaths and disabilities for people inthe prime of life, imposing many billions of dollars in annual economic costs.
Figure 27 Traffic Deaths (NHTSA Data, published in Ewing, Pendall and Chen 2002)
R2 = 0.30720
5
10
15
20
25
0 200 400 600 800 1,000 1,200
Annual Per Capita Transit Passenger-Miles
F a t a l T r a f f i c A c c i d e n t s P e r 1 0 0 , 0 0 0
P o p u l a t i o n
Large Rail
Small Rail
Bus Only
New York
Per capita traffic fatalities (including automobile occupants, transit occupants and pedestrians)tend to decline with increased transit ridership. Rail cities tend to have lower traffic fatalities.
Rail transit cities have significantly lower per capita traffic death rates, as illustrated inFigures 27 and 28. Large Rail cities average 7.5 traffic fatalities per 100,000 population(7.9 excluding New York), Small Rail cities average 9.9, and Bus Only cities average11.7, a 40% higher rate. If Large Rail cities had the same fatality rate as Bus Only citiesthere would be about 2,500 more annual traffic deaths, plus increased disabilities, injuriesand property damages. This represents $50 billion in annual savings, based on USDOTrecommended values for crash reduction benefits.
Figure 28 Annual Per Capita Traffic Deaths
0
2
4
6
8
10
12
14
Large Rail Small Rail Bus Only
D e a t h s P e r 1 0 0 , 0 0 0
P o p u l a t i o n

7/30/2019 Rail Ben
http://slidepdf.com/reader/full/rail-ben 32/67
Rail Transit In America: Comprehensive Evaluation of Benefits Victoria Transport Policy Institute
31
Figure 29 International Traffic Deaths (Kenworthy and Laube 2000)
0
5
10
15
20
25
-500 500 1,500 2,500 3,500 4,500
Annual Per Capita Transit Passenger-Miles
T r a f f i c F a t a l i t i e s P e r 1 0 0 , 0 0 0
P o p u l a t i o n
Northern EuropeSouthern EuropeUS
CanadaAustralia
International data indicate that crash rates decline with increased transit ridership.
Figure 29 shows international data which also indicate that per capita traffic fatalitiesdecline with increased transit ridership (see additional discussion in Litman and Fitzroy,2005). Table 7 shows per capita traffic fatality and injury crash rates for various modes,indicating that in the U.K., where urban rail transit systems are well established, deathsand injury rates are quite low compared with other modes.
Table 7 UK Crash Rates Per Billion Pass-Kms (Steer Davies Gleave 2005, Table 7.3)
Mode Killed Killed and InjuredMotorcycle 112 5,549Cycling 33 4,525Walking 48 2,335Private car 3 337Bus or Coach 0.1 196Heavy Rail 0.1 13Light Rail 0.00002 0.00007
British data indicate that rail transit has very low traffic fatality rates per passenger-kilometer compared with other modes.

7/30/2019 Rail Ben
http://slidepdf.com/reader/full/rail-ben 33/67
Rail Transit In America: Comprehensive Evaluation of Benefits Victoria Transport Policy Institute
32
Energy and Emission Reductions
High quality public transit can provide substantial energy conservation and emissionreduction benefits (Shapiro, Hassett and Arnold 2002; Sarzynski, Brown and Southworth2008; ICF 2008; CNT 2010). North American transit systems are not very energy
efficient because they are structured to primarily to provide basic mobility to non-drivers,often in sprawled locations. However, urban transit consumes a quarter as much energyas driving per passenger-mile (Figure 30), electric powered transit produces minimallocal air and noise emissions, and transit-oriented community residents consume lesstransport fuel due to reduced driving. Bailey (2007) found that household located within¾-mile of rail stations save 512 gallons of fuel annually due to reduced driving andinternational studies indicate that per capita energy consumption declines with moretransit use (Kenworthy and Laube 2000). In addition:
• Transit encouragement strategies that improve service efficiency (such as gradeseparation), increase load factors (such as financial incentives), increase land useaccessibility (transit-oriented development), or reduce emission rates (such as improved
engines and electric propulsion) can provide large energy savings and emission reductions.• Transit oriented development tends to reduce short vehicle trips which have high per-mile
energy consumption and emission rates due to cold starts and congested conditions. As aresult, each 1% of mileage reduced typically reduces air emissions by 2-3%.
• Rail tends to reduce emissions in densely populated areas, such as commercial centersand transit terminals, and so reduces people’s exposure to harmful emissions such as CO,toxics and particulates, compared with conventional diesel buses.
• Newer technologies are reducing emission rates. For example, newer diesel buses produce much lower emissions than in the past.
Figure 30 Lifecycle Energy Consumption, Megajoules Per Passenger-mile(Aurbach, http://pedshed.net/?p=219, based on Chester and Horvath 2008)
01
2
3
4
5
6
7
8
9
10
B u s, p e
a k
H i g h S
p e e d
R a i l
B A R T
C o m m
u t e r R
a i l
B o s t o
n L i g h
t R a i l
B o e i n
g 7 3 7
S F L i g h t R
a i l s e
d a n
S U V
p i c k u
p t r u c
k
B u s,
o f f - p e
a k
M e
g a j o u l e s P e r P a s s . -
M i l e Indirect energy
Fuel
This figure compares fuel and embodied energy (energy used for vehicle and facility constructionand maintenance) for various transport modes.

7/30/2019 Rail Ben
http://slidepdf.com/reader/full/rail-ben 34/67
Rail Transit In America: Comprehensive Evaluation of Benefits Victoria Transport Policy Institute
33
Economic Development Impacts
Economic Development refers to progress toward a community’s economic goals,including increased productivity, employment, income, business activity, investment andtax revenue. Public transit can provide economic development benefits described below, particularly rail transit because it serves large cities where cost savings and productivity
gains tend to be high (Banister and Thurstain-Goodwin 2011; Cambridge Systematics1998; Prud’homme and Lee 1998; Forkenbrock and Weisbrod 2001; MKI 2003; Hass-Klau, Crampton and Benjari 2004; Litman 2009b; Ahlfeldt and Feddersen 2010).
Transportation System Cost Savings and Efficiency Gains
As described earlier, by attracting discretionary travelers, increasing transit ridership, and providing a catalyst for more efficient land use, rail transit provides various cost savingsand efficiency gains, including congestion reduction, road and parking cost savings,consumer savings, reduced crash damages, and improved public health. These economicsavings and efficiency benefits filter through the economy as savings to consumers, businesses and governments, making a region more productive and competitive.
Shifting Consumer Expenditures
Expenditures on automobiles, fuel and roadway facilities provide relatively little regionaleconomic activity because they are capital intensive and largely imported from other areas. A study using national input-output table data found that each 1% of regionaltravel shifted from automobile to public transit increases regional income about $2.9million, resulting in 226 additional regional jobs (Miller, Robison and Lahr 1999).Similarly, at a national level, a million dollars spent on public transit services generates31.3 jobs, compared with 17.3 jobs if the same amount is spent on a typical bundle of other goods, 13.7 jobs if spent on vehicles, and 12.8 jobs if spent on fuel, as summarizedin Table 8.2 As a result, transportation policies that allow consumers to save on fuel andvehicles, or shift their expenditures from automobiles to public transit, tend to increaseregional and national employment and business activity.
Table 8 Economic Impacts per $1 Million Expenditures (Chmelynski 2008)Expense category Value Added Employment Compensation
2006 Dollars FTEs* 2006 Dollars
Auto fuel $1,139,110 12.8 $516,438Other vehicle expenses $1,088,845 13.7 $600,082Household bundles Including auto expenses $1,278,440 17.0 $625,533 Redistributed auto expenses $1,292,362 17.3 $627,465
Public transit $1,815,823 31.3 $1,591,993
In 2006, a million dollars shifted from fuel to general consumer expenditures generated 4.5
domestic jobs, and if shifted to public transit expenditures generated 18.5 jobs. These impacts arelikely to increase as oil import costs rise. (* FTE = Full-Time Equivalent employees)
• 2 The IMPLAN model includes assumptions that exaggerate the employment and business activitygenerated by fuel and vehicle expenditures, and so underestimates the economic benefits of transport costsavings. For example, it assigns gas station jobs to fuel sales, although these businesses make most of their
profits from food, cigarettes and lottery sales. The model also exaggerates the portion of vehicle inputs produced domestically and ignores for economic costs of trade deficits resulting from petroleum imports.

7/30/2019 Rail Ben
http://slidepdf.com/reader/full/rail-ben 35/67
Rail Transit In America: Comprehensive Evaluation of Benefits Victoria Transport Policy Institute
34
As described earlier, Large Rail city residents spend $448 annually less on average per capita on transportation than Bus Only city residents despite their higher incomes andlonger average commute distances, totaling $22.6 billion in savings. If each milliondollars in consumer expenditures shifted from automobile expenses to general consumer
expenditures provides an average of 8.6 jobs and $219,000 in regional income, asindicated in Table 6, rail transit provides a total of 194,114 additional jobs and $4.9 billion in additional regional income in those cities.
These impacts are likely to increase in the future as international oil prices rise, U.S. oil production declines, and vehicle production becomes more automated. Although exactimpacts are uncertain and impossible to predict with precision, between 2010 and 2020 amillion dollars shifted from fuel to general consumer expenditures is likely to generate atleast six jobs, and after 2020 at least eight jobs. This indicates that current planningdecisions can support future economic development by encouraging transport systemdiversity and efficiency so consumers can reduce their spending on vehicles and fuel. For
example, transport policies and investments that reduce U.S. per capita fuel consumption by 20% would save consumers $100-200 billion annual dollars, provide comparableindirect economic benefits, and generate 1 to 2 million domestic jobs.
Agglomeration Efficiencies
Land use density and clustering tend to provide agglomeration benefits, which can reducethe costs of providing public services and increase productivity due to improvedaccessibility and network effects (Banister and Thurstain-Goodwin 2011; Bettencourt, etal. 2007; CTOD 2011). One published study found that doubling a county-level densityindex is associated with a 6% increase in state-level productivity (Haughwout 2000).Meijers and Burger (2009) found that metropolitan region labor productivity declineswith population dispersion (a higher proportion of residents live outside urban centres),and increases with polycentric development (multiple business districts, cities and townswithin a metropolitan region, rather than a single large central business district andcentral city). This suggests that regional rail transit systems with transit orienteddevelopment around stations tend to support regional economic development byencouraging efficient polycentric land use patterns. Although these impacts are difficultto measure, they are likely to be large.
Increased Property Values
Transit oriented development tends to increase local property values due to improvedaccessibility and livability in that area (Eppli and Tu, 2000; Smith and Gihring, 2003;CTS 2009b). Transit stations often provide a catalyst for various neighborhood
improvements such as urban redevelopment, historic preservation, improved pedestrianconditions and New Urbanist design practices. A portion of these property value gainsmay be economic transfers (property value increases in one area are offset by propertyvalue reductions at other locations), but increased property values resulting fromagglomeration efficiencies, shifted consumer expenditures, transportation efficiency andcommunity redevelopment are true economic gains that increase productivity. Many businesses prefer to locate near rail stations to improve access for employees andcustomers; some employers say that employees who commute by rail are more

7/30/2019 Rail Ben
http://slidepdf.com/reader/full/rail-ben 36/67
Rail Transit In America: Comprehensive Evaluation of Benefits Victoria Transport Policy Institute
35
productive since they avoid the stress and uncertainty of driving on congested roads.Table 9 summarizes property value increases measured near rail transit stations in variousEuropean and North American cities.
Table 9 Rail Station Property Value Impacts (Hass-Klau, Cramption and Benjari 2004)City Factor Difference
Newcastle upon Tyne House prices +20%Greater Manchester Not stated +10%Portland House prices +10%Portland Gresham Residential rent >5%Strasbourg Residential rent +7%Strasbourg Office rent +10-15%Rouen Rent and houses +10%Hannover Residential rent +5%Freiburg Residential rent +3%Freiburg Office rent +15-20%Montpellier Property values Positive, no figure givenOrléans Apartment rents None-initially negative due to noise
Nantes Not stated Small increase Nantes Commercial property Higher valuesSaarbr űcken Not stated None-initially negative due to noiseBremen Office rents +50% in most cases
This table summarizes the findings of various studies concerning how rail station proximityaffects property values.
Community Redevelopment
Current development patterns tend to abandon older neighborhoods as new communitiesare built at the urban fringe. This tends to be inefficient in terms of infrastructure (roads,schools and other facilities in urban areas are underused while new facilities must be builtin suburban areas) and in terms of social capital (many older neighborhoods have uniquecultures, traditions and human relationships). This results, in part, from growingautomobile traffic through older neighborhoods caused by urban fringe residents. Railtransit can provide a catalyst for urban redevelopment and help reduce automobile trafficvolumes through urban areas. A unique transit service can be a popular tourist activity,help create community identity, which stimulates economic development.
Summary of Economic Productivity Gains
As a result of these various economic benefits, per capita productivity tends to increasewith public transit use, as illustrated in Figure 31. Of course, other factors besides public
transit contribute to this relationship: per capita transit ridership tends to increase withcity size, density and fuel price, and declines with increased per capita automobile travel,all of which tend to increase per capita GDP (Litman 2009b), but high quality publictransit supports these other factors, and so contributes to economic developmentindirectly.

7/30/2019 Rail Ben
http://slidepdf.com/reader/full/rail-ben 37/67
Rail Transit In America: Comprehensive Evaluation of Benefits Victoria Transport Policy Institute
36
Figure 31 GDP Versus Transit Ridership (Litman 2009b)
R2 = 0.3286
$0
$10,000
$20,000
$30,000
$40,000
$50,000
$60,000
$70,000
$80,000
$90,000
0 200 400 600 800 1,000 1,200
Annual Per Capita Transit Passenger-Miles
P e r C a p i t a A n n u a l G D P
Large Rail
Small Rail
Bus Only
New York
GDP tends to increase with per capita transit travel. This probably reflect a combination of economic savings and benefits from reduced vehicle travel which reduces economic costs, and more compact, accessible land use which supports agglomeration efficiencies.
The report, Transit and Regional Economic Development (CTOD 2011) found thatcertain high-skill “knowledge-based” industries (professional, scientific, information
services, finance, and insurance sectors) tend to concentrate in higher density regionalcommercial centers. Transit-oriented commercial centers are gaining jobs, especially inhigh-skill sectors like knowledge-based industries, although their share of total regionalemployment has declined for most industrial sectors during the last few decades. The portion of total jobs easily accessed by public transit tends to increase with rail and BRTsystems, indicating that developing such systems improves overall transit accessibility.
Other studies indicate significant economic development benefits from rail transit. EDRG(2007) used quantitative analysis to estimate that the current Chicago region transit plan provides an estimated 21% annual return on investments, an enhanced plan would provide a 34% return, and adopting Transit-Oriented Development, as proposed in the
region’s official comprehensive plan, would increase the annual return to 61%. Failure tomaintain the transit system will harm the region’s commuters and the economy, estimatedat over $2 billion annually.

7/30/2019 Rail Ben
http://slidepdf.com/reader/full/rail-ben 38/67
Rail Transit In America: Comprehensive Evaluation of Benefits Victoria Transport Policy Institute
37
Other Benefits
Transit in general, and rail transit in particular, can provide important but difficult tomeasure benefits (Forkenbrock and Weisbrod 2001). These are described briefly below.
Improved Mobility For Non-Drivers
Automobile-dependent transport and land use patterns disadvantages non-drivers. Transitimprovements and transit oriented development increase mobility and accessibilityoptions for non-drivers. Since non-drivers tend to be physically, economically andsocially disadvantaged compared with drivers, this increases equity, in addition toreducing costs and increasing economic productivity.
For example, a study investigated how construction of Minneapolis’s Hiawatha light railline affects low-wage workers’ job access (CTS 2010). After the rail line was completedthe number of low-wage jobs accessible by 30 minutes of peak period transit travelincreased by 14,000 jobs in station areas and 4,000 jobs in areas with direct light-rail busconnections. This resulted from a combination of improved transit networks, and a
concentration of low-wage workers and jobs moving to light-rail station areas.
Avoided Chauffeuring
Chauffeuring refers to additional automobile travel specifically to carry a passenger. Itexcludes ridesharing, which means additional passengers in a vehicle that would bemaking a trip anyway. Some motorists spend a significant amount of time chauffeuringchildren to school and sports activities, family members to jobs, and elderly relatives onerrands. Such trips can be particularly inefficient if they require drivers to make an emptyreturn trip, so a five-mile passenger trip produces ten miles of total vehicle travel. Driverssometimes enjoy chauffeuring, for example, when it gives busy family members or friends time to visit. However, chauffeuring can be an undesirable burden, for example,
when it conflicts with other important activities. Quality transit service and transitoriented development allows drivers to avoid undesirable chauffeuring trips.
Option Value
Transit services provide option value, referring to the value people place on having aservice available regardless of whether they currently use it (ECONorthwest and PBQD2002). Transit provides basic mobility when needed, such as when a personal vehicle hasa mechanical failure or a disaster limits automobile travel.
Community Livability
Community Livability refers to the environmental and social quality of an area as perceived by residents, employees, customers and visitors. Rail transit and transit-oriented development can help improve community livability in several ways, includingurban redevelopment, reduced vehicle traffic, reduced air and noise pollution, improved pedestrian facilities, and greater flexibility in parking requirements and street design.This provides direct benefits to residents, increases property values and can increaseretail and tourist activity in an area.

7/30/2019 Rail Ben
http://slidepdf.com/reader/full/rail-ben 39/67
Rail Transit In America: Comprehensive Evaluation of Benefits Victoria Transport Policy Institute
38
Improved Public Health
Since most transit trips involve walking or cycling links, and transit orienteddevelopment improves walking and cycling conditions, it tends to improve public health(Litman 2010b). Researchers from the University of Pennsylvania, Drexel University andthe RAND Corporation found that construction of a light-rail transit (LRT) systemincreased physical activity (walking) and reduced users weight and obesity rates(MacDonald, et al. 2010). Specifically, before-and-after surveys of Charlotte, NorthCarolina LRT passengers found that body mass index declined an average of 1.18 kg/m2compared to non-LRT users in the same area over a 12-18 month period, equivalent to aloss of 6.45 lbs for a person who is 5'5. LRT users were also 81% less likely to becomeobese over time.
Figure 32 Transit And Walk/Bike Commute Mode Split (FTA 2001)
R2
= 0.1427
0.0%
1.0%
2.0%
3.0%
4.0%
5.0%
6.0%
7.0%
8.0%
0 200 400 600 800 1000 1200
Annual Transit Passenger Miles Per Capita
W a l k / B i k e C o m m u t e M o
d e S p l i t
Transit and nonmotorized travel are complementary. As per capita transit travel increases sodoes walking and cycling.
Commuting by transit also tends to be less stressful than by car and so improves physicaland mental health (Wener, Evans and Boately 2005).

7/30/2019 Rail Ben
http://slidepdf.com/reader/full/rail-ben 40/67
Rail Transit In America: Comprehensive Evaluation of Benefits Victoria Transport Policy Institute
39
Comparing Benefits and Costs
Table 10 summarizes U.S. transit service expenditures and revenues. Rail subsidies(operating and capital expenses minus fare revenues) totaled $12.5 billion in 2002,averaging about $140 per capita when divided among the 90 million residents of cities
with rail transit systems, compared with $13.8 billion bus transit subsides, whichaverages about $50 per capita when divided among 278 million U.S. residents. Thisindicates that the incremental cost of rail transit is about $90 annually per capita.
Table 10 U.S. Transit Expenses and Revenues By Mode (APTA, 2002)Bus Trolley
BusDemand
ResponseTotal Bus Heavy
RailCommuter
RailLightRail
Rail Total
Capital Expenses (m) $3,028 $188 $173 $3,389 $4,564 $2,371 $1,723 $8,659
Operating Expenses (m) $12,586 $187 $1,636 $14,408 $4,268 $2,995 $778 $8,041
Total Expenses (m) $15,613 $374 $1,809 $17,797 $8,832 $5,366 $2,502 $16,699
Fare Revenues (m) $3,731 $60 $185 $3,976 $2,493 $1,449 $226 $4,167
Subsidy (Total Exp. - Fares) $11,882 $315 $1,624 $13,821 $6,339 $3,917 $2,276 $12,532
Percent Subsidy 76% 84% 90% 83% 72% 73% 91% 79%
m=million
This compares with $67.7 billon in estimated monetized (measuring in monetary units) benefits identified in this study, as summarized in Table 11. This indicates that,considering just impacts suitable for monetization, economic benefits greatly exceedsubsidies. Rail transit provides additional benefits unsuited to monetization, includingeconomic development, improved mobility for non-drivers, community livability andimproved public health. People who do not currently use rail transit benefit from reducedtraffic and parking congestion, and other benefits dispersed through the economy.
Table 11 Rail Transit Monetized BenefitsCost Savings Billions
Congestion cost savings $19.4Consumer transportation cost savings $22.6Roadway Cost Savings $8.0Destination Parking Cost Savings $7.3Residential Parking Cost Savings $4.8Accident cost savings $50.0
Totals $112
Other researchers using comprehensive analysis find similar results. Nelson, et al (2006)
used a regional transport model to estimate the benefits of the local transit system totransit users and the congestion-reduction benefits to motorists. They found that railtransit generates congestion-reduction benefits that exceed rail subsidies, the combined benefits of rail and bus transit easily exceed local transit subsidies generally, and thelowest-income group receives a disproportionately low share of the transit benefits, bothin absolute terms and as a share of total income.

7/30/2019 Rail Ben
http://slidepdf.com/reader/full/rail-ben 41/67
Rail Transit In America: Comprehensive Evaluation of Benefits Victoria Transport Policy Institute
40
Rail Versus Bus TransitThere is considerable debate over the relative merits of bus and rail transit (Hass-Klau, et al.2003; Pascall 2001; GAO 2001; Thompson and Matoff 2003; Balaker 2004; Litman 2004a; Henry and Litman 2006; Hidalgo and Carrigan 2010). Some key issues are discussed here.
Rail transit tends to provide better service quality that attracts more riders, particularlydiscretionary users (Tennyson 1988; Pratt 1999; FTA 2002; Currie 2005). For example, afree bus line to downtown Tacoma, Washington attracted less than 500 daily riders, butwhen it was replaced with a light rail line, ridership increased to more than 2,400 a day. Rail can carry more passengers per vehicle which reduces labor costs, requires less land per peak passenger-trip, and causes less noise and air pollution compared with diesel buses. As a result, rail is more suitable for high-density areas. Rail transit is considered a prestige service that gains more public support, and provides a catalyst for urbanredevelopment and more compact, multi-modal development patterns. Voters are oftenmore willing to support funding for rail than for bus service. Transit-oriented land use patterns can increase property values and economic productivity by improvingaccessibility, reducing costs, improving livability and providing economies of
agglomeration. In some cases, increased property values offset most or all transit subsidycosts. This does not generally occur with bus service.
A study by Schumann (2005) compares transit system performance in two similar sizecities. The Sacramento Regional Transit District began building a Light Rail Transitsystem in 1985, while the Central Ohio Transit Authority failed in its efforts establish asimilar system in Columbus, Ohio and so only offers bus transit. During the following 17years, transit service and ridership increased significantly in Sacramento but declined inColumbus, while operating costs per passenger-mile increased much more in Columbusthan in Sacramento, as indicated in the table below.
Table 12 Columbus and Sacramento Transit Performance (Schumann 2005)1985 2002 Change
CO SA SA/CO CO SA SA/CO CO SA
County Population (000) 914 903 99% 1,084 1,302 120% 19% 44%
Unlinked trips (000) 25,889 16,051 62% 16,246 26,610 164% -37% 66%Trips per capita 28.3 17.8 63% 15.0 20.4 136% -47% 15%Passenger miles (000) 121,408 93,473 77% 66,760 119,008 178% -45% 27%Passenger miles per capita 132.8 103.5 78% 61.6 91.4 148% -54% -12%Transit vehicles 343 217 63% 298 250 84% -13 15Revenue vehicle miles 9,098 8,569 94 8,994 9,866 110% -1% 15%Operating expenses ($000) $33,310 $25,681 77% $62,877 $82,477 131% 89% 221%Constant operating expenses
(2002 $000) $55,694 $42,939 77%
$62,877 $82,477 131% 113% 192%Constant operating expenses per passenger-mile 2002$ $0.46 $0.46 100% $0.94 $0.69 74% 205% 151%CO = Columbus; SA = Sacramento; SA/CO = Sacramento/Columbus; 1985 to 2002 consumer price indexchange = 1.672.

7/30/2019 Rail Ben
http://slidepdf.com/reader/full/rail-ben 42/67
Rail Transit In America: Comprehensive Evaluation of Benefits Victoria Transport Policy Institute
41
In addition, voters appear more willing to support dedicated funding for transit systemsthat include rail transit service. In 1988, a year after the first rail line began operations,Sacramento country voters approved a referendum which provided sales tax funding tooperate and expand the transit system. The article’s author argues that Sacramento’s firstrail “starter” line gained public support for continual transit service improvements. Out of
four Columbus area transit funding referenda between 1986 and 1995, only one passed.As a result of funding shortfalls the transit system has raised fares and reduced service,which helps explain the decline in transit ridership. The author argues that, had Columbushad a rail line in the 1980s there would probably have been more support for publictransit funding, leading to a more attractive system and higher ridership now.
Figure 33 Transit Ridership Changes – 1996 to 2003 (Henry and Litman 2006)
0%
5%
10%
15%
20%
25%
30%
Boardings Passenger-Miles
P e r c e n t C h a n g e Bus & Rail
Bus Only
Between 1996 and 2003 total transit use increased much faster in cities that have new or expanded rail service than in cities that only expanded bus service.
Henry and Litman (2006) used U.S. Federal Transit Administration data to comparetransit system performance in U.S. urban areas that expanded rail systems with those thatonly expanded bus systems. The analysis indicates that cities which expanded railsystems significantly outperformed cities that only expanded bus systems in terms of ridership and operating cost efficiency, as summarized in figures 33 and 34.
Figure 34 Change in Operating Costs Per Passenger-Mile (Henry and Litman 2006)
-10%
0%
10%
20%
30%
40%
50%
Current Dollars Constant Dollars
P e r c e n t C h a n g e
Bus & Rail
Bus Only
Between 1996 and 2003 real operating costs per passenger-mile declined in cities that have newor expanded rail service, but increased in cities that only expanded bus service.

7/30/2019 Rail Ben
http://slidepdf.com/reader/full/rail-ben 43/67
Rail Transit In America: Comprehensive Evaluation of Benefits Victoria Transport Policy Institute
42
However, BRT systems have proven successful at attracting riders and stimulatingtransit-oriented development (Hidalgo and Carrigan 2010) In a detailed analysis Bruun(2005) found that in a typical case, both Light Rail Transit (LRT) and Bus Rapid Transit(BRT) have lower operating costs per passenger-space-kilometer during base periodsthan regular buses. For trunk line capacities below about 1,600 spaces-per-hour, BRT
tends to be cheapest, while above 2,000 spaces-per-hour BRT headways become so shortthat traffic signal priority becomes ineffective, reducing service efficiency and increasingunit costs. The marginal cost of adding off-peak service is lowest for LRT, higher for BRT, and highest for regular buses.
Key differences between bus and rail transit are summarized on the next page. Each ismost appropriate in particular situations. Bus is best serving areas with more disperseddestinations and lower demand. Rail is best serving corridors where destinations areconcentrated, such as large commercial centers and mixed-use urban villages, or as acatalyst to create more accessible, multi-modal communities. Rail tends to attract moreriders within a given area, but buses can cover larger areas. Both become more efficient
and effective at achieving planning objectives if implemented with supportive policiesthat improve service quality, create supportive land use patterns and encourage ridership.
Bus Transit Rail Transit
Flexibility. Bus routes can change andexpand when needed, for example, if aroadway is closed, or if destinations or demand changes.
Requires no special facilities. Buses can useexisting roadways, and general traffic lanescan be converted into a busway.
More suitable for dispersed land use, and socan serve a greater rider catchment area.
Several routes can converge onto onebusway, reducing the need for transfers. For example, buses that start at several suburbancommunities can all use a busway to a citycenter.
Lower capital costs.
Is used more by transit dependent people, so bus service improvements provide greater equity benefits.
Greater demand. Rail tends to attract more discretionaryriders than buses.
Greater comfort, including larger seats with more legroom,more space per passenger, and smother and quieter ride.
More voter support for rail than for bus improvements.
Greater maximum capacity. Rail requires less space and ismore cost effective on high volume routes.
Greater travel speed and reliability, where rail transit is gradeseparated.
More positive land use impacts. Rail tends to be a catalyst for more accessible development patterns.
Increased property values near transit stations.
Less air and noise pollution, particularly if electric powered.
Rails stations tend to be more pleasant than bus stations, sorail is more appropriate where many transit vehiclescongregate.
Rail transit can be compared to a better quality automobile: it costs more initially but provides higher quality service and greater long-run value. As consumers become wealthier and accustomed to higher quality goods it is reasonable that they should demand featuressuch as more leg-room, comfortable seats, smoother and quieter ride (and therefore better ability to read, converse, and rest), and greater travel speed associated with grade-separatedservice. The preference of rail over bus can be considered an expression of consumer sovereignty, that is, people’s willingness to pay extra for the amenities they prefer.

7/30/2019 Rail Ben
http://slidepdf.com/reader/full/rail-ben 44/67
Rail Transit In America: Comprehensive Evaluation of Benefits Victoria Transport Policy Institute
43
This is not to degrade bus transit. Rail and bus are complementary; rail is only appropriateon major corridors and relies on bus transit as feeder service. Bus systems can be designedwith many of the attributes that attract discretionary travelers (grade separation, attractivevehicles, attractive stations that provide a catalyst for transit oriented development), and so
can provide congestion, accident and emission reduction benefits. Many of the transitencouragement strategies encourage bus as well as rail ridership.
Hiawatha Ridership exceeds ProjectionsLaurie Blake, “Light-Rail Ridership: A Love Story,” Minneapolis Star Tribune(www.startribune.com/stories/462/5724628.html), November 14, 2005
When his carpool collapses for a day, John Healy has no qualms about riding light rail to work indowntown Minneapolis. “It seems a little more predictable and regular than the bus,” he said...there isalways another one coming.” Healy is a new breed of transit rider – willing to take trains, but rarely, if ever, climbing aboard a bus. A 2004 survey found that 40% of Hiawatha’s riders are like Healy – not busriders before train service began. This preference for rail largely explains why the Hiawatha ridership is
exceeding projections. Preconstruction predictions did not factor in positive attitudes toward the train. TheHiawatha ridership is 65% higher than predicted. In October, an estimated 742,000 riders used the line.
Rail’s smooth ride and consistent schedule make it appealing to riders who would not consider the bus.The permanence of the track and the frequency of service make it easy to use without knowing a schedule.Within one year, light rail has emerged as the single busiest transit line in the metro area.
What Converts LikeThe train made a transit convert of Jennifer Johnson of south Minneapolis, who said she and her husbandnever went downtown before the rail line opened. Now they go twice a month on the Hiawatha. “It’squick, it’s clean, it’s safe and little kids love the train,” said Johnson, who had her child in tow. Flightattendant Cara Cobb, from Detroit, said it was the quick, direct rail service that prompted her to take the
train from the Minneapolis-St. Paul Airport to the Mall of America during a break from work. “It wascheap and it was fun and we didn’t have to wait long,” she said. Had she ever taken a bus to the mall?Cobb shrugged. “I don’t know where you get a bus at the airport.”
Burnsville retiree Warren Nordley drove to Bloomington to catch the train to a University of Minnesotaclass. “I personally enjoy it,” he said. “I feel it is a much more pleasant way to go than the bus. The bigopen windows – it’s just a more pleasant feeling. And you are totally immune to the traffic.” Nordley saidhe believes that men in general find the bus “beneath their dignity – it’s just not classy enough.” As atransit advocate, he prefers the train, but “either bus or train are far superior to driving your car.”
Repercussions for the FutureThe Metropolitan Council based its rail-rider predictions on bus-rider behavior. Wary of overstated
ridership, the FTA discouraged even a 25% padding for rail preference, said Natalio Diaz, Counciltransportation planning director. “Now we have real numbers from observed behavior,” Diaz said. “About40% of the riders are people who were not using the bus. That is a huge amount.”
Officials have spent more than a year correcting the metro area’s forecasting methods to better reflectrail’s appeal. This change could be important for ridership predictions on a proposed central corridor railline along University Avenue linking St. Paul and Minneapolis. An upcoming environmental impactstatement will compare the pros and cons of a rail line with bus rapid transit. Ridership will be central tothat comparison and a key part of the choice between rail or bus, Diaz said.

7/30/2019 Rail Ben
http://slidepdf.com/reader/full/rail-ben 45/67
Rail Transit In America: Comprehensive Evaluation of Benefits Victoria Transport Policy Institute
44
Evaluating Rail Transit CriticismThis section evaluates common rail transit criticisms. For more information see, “Evaluating Rail Transit Criticism” (Litman 2004c), “The First Casualty of a Non-Existent War” (Litman2011) and CFTE (2005).
Rail transit is not appropriate in every situation, and even the best transit program can beimproved. Rail transit supporters should therefore welcome legitimate criticism to helpidentify possible problems and opportunities for improvement. However, some types of criticism are not helpful, because they misrepresent issues and reflect inaccurate analysis.It is therefore helpful to examine and evaluate rail transit criticisms to identify legitimateissues and concerns, and to recognize errors and misrepresentations.
A good research document provides readers with the information they need to make aninformed assessment, including an overview of issues and information sources,discussion of various perspectives and evaluation methods, and information that bothsupports and contradicts (if any exists) the authors conclusions (Litman, 2004b). Manytransit studies do this, providing accurate and useful analysis.
But some critics provide inaccurate information and biased analysis intended to presentrail transit in a negative light. They fail to use best practices for accurate transitevaluation. They ignoring other perspectives, and suppress data that contradict their arguments. These critics tend to consider a relatively limited set of transit impacts, assummarized in Table 13. As a result, they tend to understate the full benefits of transit.
Table 13 Impacts Considered and Overlooked (Litman 2004a)Usually Considered Often Overlooked
Financial costs to governments
Vehicle operating costs (fuel, tolls, tire wear)Travel time (reduced congestion)Per-mile crash risk Project construction environmental impacts
Downstream congestion impacts
Impacts on non-motorized travelParking costsVehicle ownership costs (depreciation, insurance, etc.)Project construction traffic delaysImpacts of generated trafficIndirect environmental impactsStrategic land use impactsImpacts on transportation diversity (particularlymobility for non-drivers)Equity impactsPer-capita crash risk Impacts on physical activity and public health
Older transportation evaluation models tended to focus on a limited set of impacts, which tends
to undervalue transit services and improvements.
Specific examples of rail transit criticism are examined in the following pages.

7/30/2019 Rail Ben
http://slidepdf.com/reader/full/rail-ben 46/67
Rail Transit In America: Comprehensive Evaluation of Benefits Victoria Transport Policy Institute
45
Washington’s War on Cars and the Suburbs
A paper by Wendell Cox (2010) titled, Washington’s War on Cars and the Suburbs:Secretary LaHood’s False Claims on Roads and Transit criticizes USDOT transitinvestment plans, arguing that rail transit benefits are unproven and exaggerated. It
criticizes this report, the source of many of the Secretary’s claims. Cox’s criticismsviolate basic principles of good scholarship and debate (Litman 2004b). His criticisms arecritiqued below and in more detail in Litman (2011). The table below summarizes hisconclusions (first two columns), and my critique (right column).
Table 6 Critique of Cox’s Conclusions (Litman 2011)Issue Cox’s Criticism My Critique
Vehicle travelimpacts
Public transit, particularly new railsystems, cannot attract motorists
Numerous studies indicate that high quality transit doesattract discretionary travelers, and with supportive landuse policies will leverage additional VMT reductions.Cox’s evidence is weak and ignores leverage effects.
Costefficiency Public transit has excessive costs anddeclining cost efficiency (increasing cents per passenger-mile).
High quality transit has high construction but lower operating costs than basic transit, and provides many benefits which offset any additional costs. Coxexaggerates transit costs and ignores many benefits.
Consumer preferences
Most people prefer automobile travel andautomobile-dependent communities.
Many people cannot drive and current demographic andeconomic trends are increasing demand for alternativemodes and transit-oriented development. Providing highquality public transit responds to this demand.
Economic benefits
Purported benefits are minuscule andunachievable, and offset by additionaltransit service costs.
Cox only considers a small portion of transit economic benefits. Subsequent analysis indicates even greater benefits than originally estimated.
Energy
savings
USDOE data indicate small differences
between auto and transit energy use.Future cars will be even more efficient.
Cox ignores new research on lifecycle energy
consumption and the energy savings provided by vehicletravel reductions. He ignores future transit energyefficiency improvements.
Congestioncost savings
Work trip travel times are longer in large-rail metropolitan areas.
Many studies indicate that high quality, grade separatedtransit reduces congestion costs.
Consumer transportationcost savings
Transportation (and housing) costs arehigher, not lower, in large railmetropolitan areas.
Many studies indicate that high quality transit provideslarge consumer savings, particularly for lower-incomehouseholds. Cox uses data that ignore these impacts.
Road and parkingsavings
The estimates are invalid because they are based upon automobile driver attractionrates far beyond the levels indicated by
experience.
Multiple data sources indicate that 50-80% of rail tripssubstitute for driving, and transit-oriented developmentreduces per capita vehicle ownership and use, providing
road and parking facility cost savings.Accident costsavings
Purported savings are insufficient to deter households from using cars to achieveimportant economic and other benefits.
This is a non-sequitur. Only if high quality transit serviceis available can people choose it, and experienceindicates they will. Safety benefits are large and provideanother justification for high quality transit.
The two left columns are from Cox’s paper. The right column is my critique. Cox misrepresents issuesand data, ignores impact categories, and relies largely on his own studies that lack peer review.

7/30/2019 Rail Ben
http://slidepdf.com/reader/full/rail-ben 47/67
Rail Transit In America: Comprehensive Evaluation of Benefits Victoria Transport Policy Institute
46
“Urban Rail: Uses and Misuses” (Cox 2000 and 2010)
Wendell Cox makes the following claims in a policy statement titled Urban Rail: Usesand Misuses. Responses to his claims are in italics.
• Virtually no traffic congestion reduction has occurred as a result of building new urban rail
systems. As this report shows, cities with well-established rail transit have substantially lower per capita traffic congestion delay than cities with smaller or no rail system. Cities with new or expanding rail transit systems often experience reductions in vehicle ownership and usealong rail corridors, attributed to a combination of transit improvements and transit-oriented development (see box).
Transit Improvements Help Reduce Vehicle Ownership and Use (www.translink.bc.ca)In 2004 the city of Vancouver recorded a small decline in the number of automobiles registered in thecity, and a reduction in downtown automobile trips, reversing a growth trend between 1994 and 2003.Small decreases were also recorded in some nearby suburbs, and others saw a reduction in the growthrate. Experts conclude that this results from increased transit services and a growing preference for
urban lifestyle. “There are some fundamental changes going on,” says David Baxter of the researchfirm Urban Futures. “It’s increasingly possible to live in Vancouver without a motor vehicle.”
Commuters are increasingly selecting alternative modes. Transit ridership rose by 9.5% in the first half of this year compared to the same period last year, and was 24.6% higher than 2002. Bus tripsincreased by 11.1%, and rail trips increased by 5.4%. A customer survey found that that 42% of riderson the SkyTrain, 49% on the West Coast Express, 35% on the 99B bus route and 25% on the 98Broute switched from commuting by car. “The numbers show that demand for public transit continuesto grow in response to the significant expansion of services.”
• Virtually any public benefit that has been achieved through urban rail could have been
achieved for considerably less by other strategies. As this study shows, rail provides unique benefits. Rail transit reduces per capita congestiondelays, traffic fatalities, consumer costs, and transit operating costs, increases transit servicecost recovery, and provide other benefits. This occurs because rail tends to attract morediscretionary riders than buses, does not require the ability to drive like a privateautomobile, avoids congestion if grade separated, and helps increase land use accessibility.
• Where the automobile has become the dominant form of transport, and where urban areas have become decentralized and highly suburbanized, there are simply not a sufficient number of people going to the same place at the same time to justify urban rail. As a result, it is typicallyless expensive to provide a new car for each new rider than to build an urban rail system. Many people are moving back into cities, and many suburbs are becoming more urbanized. If
a travel corridor has enough travel demand to create significant congestion there is oftenenough demand to justify some form of grade-separated transit. Claims that it is cheaper to provide a new car rather than build an urban rail system overlook significant costs, includingthe costs of roadway capacity and parking facilities at destinations, and the costs of increased traffic congestion, traffic accidents and pollution emissions. It also ignores the fact that many transit users cannot or should not drive, and other benefits of rail transit.

7/30/2019 Rail Ben
http://slidepdf.com/reader/full/rail-ben 48/67
Rail Transit In America: Comprehensive Evaluation of Benefits Victoria Transport Policy Institute
47
“Great Rail Disasters” (O’Toole 2004)
Great Rail Disasters argues that rail transit is ineffective at improving transportationsystem performance and wasteful. Other rail critics, such as Balaker (2004), have citiedO’Toole’s study heavily. Great Rail Disasters uses a thirteen-component index created by the author to evaluate rail transit system performance. This analysis framework
appears to be carefully designed to portray rail transit in a negative way. The reportcontains several fundamental omissions and misrepresentations. Major errors include:
• Failing to differentiate between cities with relatively large, well-established rail systems andthose with smaller and newer systems that cannot be expected to have significant impacts onregional transportation performance.
• Lack of with-and-without analysis. There are virtually no comparisons between cities thathave rail and those that do not. It is therefore impossible to identify rail transit impacts.
• Evaluating congestion impacts based on “Travel Time Index” values. Of the variouscongestion indicators this is one of the least appropriate for evaluating grade-separatedtransit, since it only considers delays to road vehicles, ignoring benefits to people who shift totransit, and from vehicle traffic reductions due to more accessible land use.
• Failing to compare individual cities and national trends. During the time period used for analysis, from 1970 to 2000, transit ridership and mode split declined nationally, so a lower rate of decline could be considered successful compared with most other cities.
• Failing to account for additional factors that affect transportation and urban developmentconditions, such as city size, changes in population and employment.
• Ignoring and understating significant costs of automobile travel. Vehicle expenses areincluded when calculating transit costs, but vehicle and parking expenses are ignored whencalculating automobile costs.
• Exaggerating transit development costs. Claims, such as “Regions that emphasize rail transittypically spend 30 to 80 percent of their transportation capital budgets on transit” areunverified and generally only true for certain regions and years, not when costs are averagedover larger areas and times.
• Presenting outdated data as current, including examples from the 1960s through early 80’s,and airport ridership data from 1990.
• Ignoring other benefits of rail transit, such as parking cost savings, consumer cost savings andincreased property values in areas with rail transit systems.
• Failing to reference documents that reflect current best practices in transit evaluation, such asECONorthwest and PBQD (2002) or Litman (2004) or provide any information showingalternative perspectives.
Great Rail Disasters’ bias is revealed in its analysis of Portland, Oregon. According tomany of its own indicators Portland’s rail system is successful, with increasing transitridership and commute mode split. Still, O’Toole concludes that Portland’s rail system isharmful because it involves transit-oriented development, which he claims is harmful toconsumers. Yet, there is plenty of evidence that many consumers want to live in transit-oriented communities (Reconnecting America 2004).

7/30/2019 Rail Ben
http://slidepdf.com/reader/full/rail-ben 49/67
Rail Transit In America: Comprehensive Evaluation of Benefits Victoria Transport Policy Institute
48
“Light Rail Boon or Boondoggle” (Castelazo and Garrett 2004)
An article by Molly D. Castelazo and Thomas A. Garrett (“Light Rail: Boon or Boondoggle” 2004) argues that light rail investments are inefficient. Their analysiscontains several critical errors. They ignore many costs of automobile transportation,including roadway costs, consumer costs, downstream congestion, parking facility costs,
accident costs and pollution impacts. They use average cost values that underestimate theactual costs of accommodating increased automobile traffic in dense urban areas. Theyclaim that light rail is more costly than automobile or bus transport, based on a nationalcost value of 54.4¢ per passenger-mile for light rail, although the actual cost in St. Louisis just 27¢, which is lower than either automobile or bus costs. They claim that light railonly provides short-term congestion and pollution reduction benefits, which is untrue,and indicates that they are unfamiliar with the issues.
Castelazo and Garrett argue that it would be cheaper to provide low-income motoristswith a car than light rail transit service. This overlooks several important points.
• First, transit is subsidized for several reasons besides providing mobility to lower-income
travelers. Only a small portion of transit subsidies could efficiently or equitably be shifted toany one of these objectives.
• Second, many transit riders cannot or should not drive. Subsidized cars would not solve their mobility problems, and would tend to increase higher-risk driving.
• Third, substituting car ownership for transit service is more expensive than they claim.Eliminating scheduled transit service would force riders who cannot drive to use demand-response or taxi services, which have far higher costs than simply driving a car.
• Fourth, increased vehicle traffic on busy urban corridors would significantly increase trafficcongestion, road and parking costs, accidents, pollution and other external costs. Castelazoand Garrett underestimate these costs. In footnote 3 they calculate that giving 7,700 vehicles
to current rail users would only increase regional congestion by 0.5%. But rail users commuteon the city’s most congested corridors, so congestion impacts will be proportionately large.The Texas Transportation Institute calculates that St. Louis traffic congestion costs totaled$738 million in 2001. If 7,700 additional downtown automobile commuters increasescongestion 2.5-5.0%, this represents $18 to $37 million in additional annual congestion costs.
• Fifth, there are substantial practical problems subsiding cars. Castelazo and Garrettapparently assume that the 7,700 rail transit riders they identify as being unable to afford acar are a distinct, identifiable group. In fact, they consist of a much larger group, many of whom only use transit occasionally. As a result, it would be necessary to offer a much larger number of households a part-time car, with provisions that account for constant changes intheir mobility needs and abilities. Like any subsidy program, it would face substantialadministrative costs and require complex rules to determine who receives how much subsidy
in a fair and effective way. It would create perverse incentives, rewarding poverty andautomobile dependency.
• Finally, as described earlier, rail transit can provide a catalyst for mixed-use, walkable urbanvillages and residential neighborhoods where it is possible to live and participate in normalactivities without needing a car, which is particularly beneficial to non-drivers.

7/30/2019 Rail Ben
http://slidepdf.com/reader/full/rail-ben 50/67
Rail Transit In America: Comprehensive Evaluation of Benefits Victoria Transport Policy Institute
49
Possible Offsetting Factors
This study indicates that rail transit can provide various economic, social andenvironmental benefits, which in total significantly exceed rail system costs. It is worthinvestigating whether additional factors may offset these benefits, making rail transitharmful overall as some critics claim. Four possible factors are discussed below.
First, it is possible that these benefits are offset by disadvantages from reduced drivingand transit oriented development. This would be true if automobile travel and sprawlwere truly superior and universally preferred by consumers, but there is considerableevidence that at the margin (compared with current travel and land use patterns) many people would prefer to drive less, rely more on other modes, and live in more accessible,multi-modal communities (Litman 2009c; PPIC 2002). This demand is likely to increasedue to shifting demographics and consumer preferences (Reconnecting America 2004).
A second possible counter-argument is that the superior performance of cities with railtransit is not caused by the rail service, but is simply an association resulting from other
factors, such as these city’s age or size. Some evidence supports this, since the cities withthe best performance are old and large (New York, Chicago, Boston and Philadelphia).This argument implies that, although older cities with rail transit systems may have moreefficient land use patterns that provide various benefits, it is impossible to create suchland use patterns now, so new rail systems or expanding smaller rail systems may fail toachieve significant benefits, at least for many decades.
Figure 35 U.S. and Portland Transit Travel Trends (APTA & FHWA Data)
100%
150%
200%
250%
300%
1995 1996 1997 1998 1999 2000 2001 2002
C h a n g e F r o m
1 9 9 5
Portland -RailPortland -
BusUS - Rail
Portland rail transit ridership is growing much faster than national trends.
However, there are indications that new rail transit services can have desirable effects if implemented with supportive policies. For example, transit ridership has grownsignificantly in Portland in response to the city’s rail system expansion, as indicated inFigure 35. Greater growth rates occur on particular corridors and in neighborhoodsserved by rail, as described earlier in this report. This suggests that significant positiveimpacts are possible, and the debate can shift from whether new rail systems can achieve planning objectives, to how to best accomplish this (discussed in the next section).

7/30/2019 Rail Ben
http://slidepdf.com/reader/full/rail-ben 51/67
Rail Transit In America: Comprehensive Evaluation of Benefits Victoria Transport Policy Institute
50
Table 14 investigates the influence of city size on transportation system performance,using matched pair analysis of cities of comparable size with and without major railtransit systems. In nearly all cases, Large Rail performs better than Small Rail of comparable size (no large cities are classified as Bus Only). This indicates that rail transitsystems really do provide performance benefits. The magnitude of these benefits suggests
that rail is particularly important in large or growing cities.Table 14 Matched Pair Comparison Of Six Large U.S. Cities
City Category Population TransitRidership
CongestionCosts
TrafficFatalities
ConsumerCosts
CostEfficiency
Per capitaPass.-Miles
Avg. Per-capitacongestion costs
Deaths per100,000 pop.
Per capitaexpenditures
Transit CostRecovery
Chicago Large Rail 8,307,904 447 515 7.9 $2,824 42%Los Angeles Small Rail 11,789,487 227 1005 7.8 $3,165 27%
Difference -42% 49% -95% 2% -12% 35%
Philadelphia Large Rail 5,149,079 720 330 9.3 $2,395 39%Miami Small Rail 4,919,036 136 625 13.3 $2,720 25%
Difference 4% 81% -89% -43% -14% 38%
Boston Large Rail 4,032,484 445 560 5.7 $2,897 31%Dallas Small Rail 4,145,659 113 710 12.0 $3,723 10%
Difference -3% 75% -27% -111% -28% 67%
This table compares the three largest Large Rail and the three largest Small Rail cities. Large Rail cities perform significantly better in nearly every category.
A third counter-argument is that bus transit could provide equal benefits as rail at a lower cost. This does not appear to be the case. Rail offers greater benefits due to its ability toattract more discretionary travelers and provide a catalyst for more efficient land use.Costs per passenger-mile are often lower for rail than bus transit, and unit costs for all
forms of transit tend to be lower in cities with large, well-established rail systems. Thisindicates that in appropriate conditions, rail can be the more cost effective transit option.
Of course, there are plenty of situations in which rail transit is not cost effective due toinadequate demand, unusually high construction costs, or a lack of integration withtransportation and land use policies, and other transit options should be selected. Railtransit projects should not be implemented simply for prestige or to obtain federal funds(Dittmar 1997). Rail transit should only be implemented in urban areas that desire to become more multi-modal, and are willing to make an adequate commitment.
Although it is important to consider these arguments and perspectives when evaluating
rail transit, there is no evidence that they eliminate rail transit benefits. On the contrary,even when these factors are taken into account, existing rail transit systems clearly provide significant net benefits, and new rail transit services can provide net benefits if they are properly planned, with features to optimize service quality, attract ridership andcreate supportive land use, such as those described in the next section.

7/30/2019 Rail Ben
http://slidepdf.com/reader/full/rail-ben 52/67
Rail Transit In America: Comprehensive Evaluation of Benefits Victoria Transport Policy Institute
51
Increasing Rail Transit BenefitsRail transit is sometimes criticized for poor service or low ridership. These concerns canoften be addressed by implementing various strategies that improve service and increaseridership, many of which are justified on other grounds such as fairness, consumer benefits and cost savings. Examples are described below.
• Service Improvements. There are various ways to make rail transit faster, moreconvenient and more comfortable, and therefore more attractive to travelers.
• Parking Management . Parking management includes parking “cash out” (employees whoreceive free parking can choose cash or a transit subsidy instead), “unbundling” (rentersonly pay for the amount of parking they actually want), and more flexible parkingrequirements. These strategies often increase transit ridership by 10-30%.
• Commute Trip Reduction (CTR) Programs. CTR programs give commuters resources andincentives to reduce their automobile trips. They typically include financial incentives(parking cash out and transit allowances), transit promotion, parking management,flextime and guaranteed ride home services. Such programs typically reduce 10-40%automobile commute trip among affected employees, about a third of which shift to
transit.• Nonmotorized Improvements. Walking and cycling are important travel modes in their
own right, and provide access to public transit. In many situations nonmotorizedimprovements may increase transit ridership 10-40% over what would otherwise occur.
• Marketing and User Information. Improved route schedules and maps, wayfindinginformation, webpages and marketing programs can often increase transit use by 10-25%.
• Transit Oriented Development (TOD) refers to residential and commercial areas designedto maximize access by public transit and nonmotorized modes. This means thatdevelopment is clustered in an areas with high level of transit service, and good walkingand cycling conditions. Residents of TODs typically use transit 25-50% more than
residents of otherwise comparable communities.• Transit Fare Innovations. Smart cards make transit use more convenient and allow transit
agencies to offer new discounts, such as lower rates during off-peak periods, for specialgroups and for bulk ticket purchase.
• Campus and School Transport Management Programs. These programs improve traveloptions and reduce trips at schools and campus facilities. This often includes free or discounted transit passes to students and sometimes staff (called a “UPASS”). Such programs often increase transit ridership 30-100% among affected groups.
• Road Pricing Reforms. Congestion pricing, distance-based fees and Pay-As-You-Drivevehicle insurance are justified on equity and efficiency grounds, and can increase transitridership.
Rail transit experiences significant economies of scale and network effects, that is, thelarger the system, the more useful it is, the more ridership it attracts, the more it will beintegrated into overall transportation and land use patterns, and so the more total benefitsit will provide.

7/30/2019 Rail Ben
http://slidepdf.com/reader/full/rail-ben 53/67
Rail Transit In America: Comprehensive Evaluation of Benefits Victoria Transport Policy Institute
52
ConclusionsThere is an important and interesting debate over the value of rail transit compared withother transportation options. To accurately assess rail transit benefits it is necessary to usea comprehensive analysis framework. This study applies the best current practices for evaluating rail transit benefits.
Table 15 Transportation Performance ComparisonDefinition Large
RailSmallRail
BusOnly
Ridership Annual Passenger-Miles Per Capita 589 176 118Commute Mode Split Portion of Commute Trips By Transit 13.4% 5.2% 2.7%
Vehicle Mileage Per Capita Average Vehicle-Mileage 7,548 8,679 9,506Vehicle Ownership Average Vehicles Per Capita 0.68 0.77 0.80
Traffic Safety Traffic Deaths Per 100,000 Population 7.5 10.0 11.7Congestion Per Capita Annual Hours of Congestion Delay 28 24 20
Transport Expenditures Avg. Annual Consumer Expenditures on Transport $2,808 $3,350 $3,255Portion of Income Average Portion of Income Devoted to Transportation 12.0% 15.8% 14.9%
Operating Costs Transit Operating Costs Per Passenger-Mile $0.42 $0.63 $0.63
Transit Cost Recovery Portion of Transit System Costs Covered By Fares 38% 23% 24%This table summarizes the results of this study. “Large Rail” cities outperform “Small Rail” and “BusOnly” cities in all except congestion delays. When city size is taken into account, Large Rail citiesoutperform by this factor too.
For this study, U.S. cities were divided into Large Rail (rail serves a significant portion of local travel), Small Rail (rail serves a minor portion of local travel), and Bus Only (cityhas no rail transit system). This analysis indicates that Large Rail cities have significantlysuperior transport system performance, as summarized in Table 15 and illustrated infigures 36 and 37.
Figure 36 Transit Ridership and Commute Mode Split Comparison
0%
100%
200%
300%
400%
500%
600%
Per Capita Ridership Commute Mode Split
R e l a t i v e t o " B u s O n l y " C i t i e s
Large Rail
Small Rail
Bus Only
This graph shows the far higher rates of transit ridership and transit commute mode split in “Large
Rail” cities. The dashed line at 100% indicates “Bus Only” city values.

7/30/2019 Rail Ben
http://slidepdf.com/reader/full/rail-ben 54/67
Rail Transit In America: Comprehensive Evaluation of Benefits Victoria Transport Policy Institute
53
Figure 37 Transportation Performance Comparison
0%
20%
40%
60%
80%
100%
120%
140%
160%
180%
Traff ic Fatali ties Transport
Expenditures
Portion of Income
On Transport
Vehicle
Ownership
Vehicle Mileage T ransi t
Operating Costs
Transit Cost
Recovery
R e l a t i v e t o " B u s O n l y "
C i t i e
Large Rail
Small Rail
Bus Only
This graph compares different categories of cities by various performance indicators. The dashed line
at 100% indicates “Bus Only” city values.
Compared with Bus Only cities, Large Rail cities have:
• Four times the per capita transit ridership.
• A fifth lower per capita vehicle mileage.
• 30-50% lower per capita congestion costs.
• A third lower per-capita traffic fatality rates.
• 20% smaller portion of household budgets devoted to transport, saving about $500annually per capita.
• A third lower transit operating costs.
• 58% higher transit service cost recovery.
• Improved fitness and health (since most transit trips have walking or cycling links, sotransit travelers are much more likely to achieve physical activity targets than motorists).
• Increased money circulating in local economies (since transit travelers spend significantlyless on imported vehicles and fuel, leaving more money to spend on other goods whichtend to have more local input).
• More efficient land use and higher property values.
• Improved environmental performance.
Some critics have argued (apparently without bothering to analyze the data) that theseimpacts and benefits are dominated by New York City, and so are unachievable in mostcommunities (Cox 2010). Table 16 and Figure 38 show these analysis results includingand excluding New York City. This indicates that the critics are wrong. Excluding NewYork City has only a small effect on most analysis results.
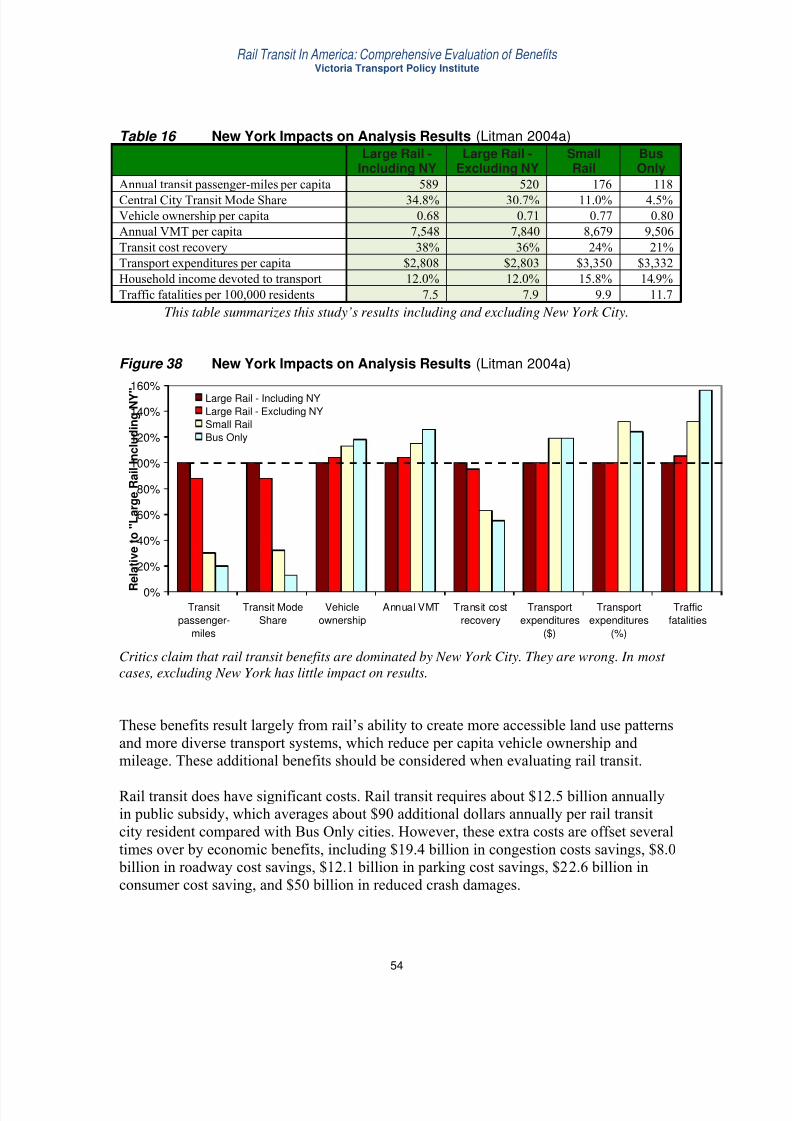
7/30/2019 Rail Ben
http://slidepdf.com/reader/full/rail-ben 55/67
Rail Transit In America: Comprehensive Evaluation of Benefits Victoria Transport Policy Institute
54
Table 16 New York Impacts on Analysis Results (Litman 2004a)Large Rail -
Including NYLarge Rail -
Excluding NYSmallRail
BusOnly
Annual transit passenger-miles per capita 589 520 176 118
Central City Transit Mode Share 34.8% 30.7% 11.0% 4.5%Vehicle ownership per capita 0.68 0.71 0.77 0.80Annual VMT per capita 7,548 7,840 8,679 9,506Transit cost recovery 38% 36% 24% 21%Transport expenditures per capita $2,808 $2,803 $3,350 $3,332Household income devoted to transport 12.0% 12.0% 15.8% 14.9%Traffic fatalities per 100,000 residents 7.5 7.9 9.9 11.7
This table summarizes this study’s results including and excluding New York City.
Figure 38 New York Impacts on Analysis Results (Litman 2004a)
0%
20%
40%
60%
80%
100%
120%
140%
160%
Transit
passenger-
miles
Transit Mode
Share
Vehicle
ownership
Annual VMT Transit cost
recovery
Transport
expenditures
($)
Transport
expenditures
(%)
Traffic
fatalities
R
e l a t i v e t o " L a r g e R a i l I n c l u d i n g N Y " Large Rail - Including NY
Large Rail - Excluding NY
Small Rail
Bus Only
Critics claim that rail transit benefits are dominated by New York City. They are wrong. In most cases, excluding New York has little impact on results.
These benefits result largely from rail’s ability to create more accessible land use patternsand more diverse transport systems, which reduce per capita vehicle ownership andmileage. These additional benefits should be considered when evaluating rail transit.
Rail transit does have significant costs. Rail transit requires about $12.5 billion annuallyin public subsidy, which averages about $90 additional dollars annually per rail transitcity resident compared with Bus Only cities. However, these extra costs are offset severaltimes over by economic benefits, including $19.4 billion in congestion costs savings, $8.0 billion in roadway cost savings, $12.1 billion in parking cost savings, $22.6 billion inconsumer cost saving, and $50 billion in reduced crash damages.
7/30/2019 Rail Ben
http://slidepdf.com/reader/full/rail-ben 56/67
Rail Transit In America: Comprehensive Evaluation of Benefits Victoria Transport Policy Institute
55
From a household’s perspective, rail transit provides a positive return on investment(Litman 2010). Direct transportation cost savings average about $450 annually per capita.Rail transit tends to increase regional employment, business activity and productivity. Itcan contribute to urban redevelopment. Property values increase near rail stations.Quality transit improves mobility for non-drivers, reduces chauffeuring responsibilities
for drivers, improves community livability and improves public health.When critics conclude that rail transit is ineffective and wasteful, the failure is often intheir analysis. Either from ignorance or intention, critics fail to use best practices for transit evaluation. Their statistical analysis tends to be flawed and biased. They ignoremany benefits of rail transit, and understate the full costs of travel by other modes under the same conditions. They use inaccurate information. These errors and omissions violate basic evaluation principles and significantly distort results. Critics claim that rail transitsupport is limited to “Pork Lovers, Auto Haters, and Nostalgia Buffs.” This is untrue.There are many reasons to favor rail development, and community support tends toincrease after rail systems are established, indicating that users consider them successful.
This analysis indicates that rail transit is particularly important in large, growing cities.Large cities with well established rail systems are clearly advantaged in terms of congestion costs, consumer costs and traffic crash rates compared with cities that lack such systems. Cities with newer and smaller systems have not yet achieved the fullimpacts, but, if these rail systems continue to develop, their benefits should increase for decades, and so are a valuable legacy for the future.
Critics raise some valid issues. In particular, rail transit service has high fixed costs, andmany benefits depend on reducing car travel, so it is important to attract riders, particularly travelers who would otherwise drive. This requires quality services thatrespond to user preferences, and are implemented with support strategies such as rider incentives and transit-oriented development. Rail systems experience significanteconomies of scale and network effects: the more complete the system the more it helpsachieve transportation and land use planning objectives. For this reason, often the bestresponse to criticism is to expand and increase support for rail systems.
This study compares bus and rail transit and discusses their appropriate applications. Thisis not a debate over which is best overall, since each has an important role to play in thenation’s transportation system. It is up to individual communities to determine thecombination of transit options that best meets its needs. This study does not suggest thatrail service should be provided everywhere. However, on major corridors where road and parking facilities are costly to construct and transit demand is high, rail transit can be themost cost effective and overall beneficial way to improve urban transportation.
7/30/2019 Rail Ben
http://slidepdf.com/reader/full/rail-ben 57/67
Rail Transit In America: Comprehensive Evaluation of Benefits Victoria Transport Policy Institute
56
ReferencesThe analysis in this report is based on techniques and data sources described in “EvaluatingPublic Transit Benefits and Costs: Best Practices Guidebook” (Litman, 2004a, at http://www.vtpi.org/tranben.pdf ). Specific data and analysis are from the “Transit PerformanceSpreadsheet,” available at www.vtpi.org/transit.xls.
Gabriel Ahlfeld and Arne Feddersen(2010), From Periphery To Core: Economic Adjustments To High-Speed Rail, Working Paper, London School of Economics, presented at the German EconomicAssociation; at www2.lse.ac.uk/newsAndMedia/news/archives/2010/09/highspeedrail.aspx.
APTA (1990), Off Track: Response of the American Public Transit Association and the Transit Industry to the UMTA Report “Urban Rail Transit Projects: Forecast Versus Actual Ridershipand Costs,” American Public Transit Association (www.apta.com).
APTA (annual reports), Transit Statistics: Statistics By Transit Agency, American Public TransitAssociation (www.apta.com/research/stats/agency/index.cfm).
APTA (2007), A Profile of Public Transportation Passenger Demographics and Travel Characteristics Reported in On-Board Surveys, American Public Transportation Association (www.apta.com); atwww.apta.com/resources/statistics/Documents/transit_passenger_characteristics_text_5_29_2007.pdf .
G.B. Arrington, et al. (2008), Effects of TOD on Housing, Parking, and Travel, Report 128,Transit Cooperative Research Program (www.trb.org/CRP/TCRP); athttp://onlinepubs.trb.org/onlinepubs/tcrp/tcrp_rpt_128.pdf .
G.B. Arrington and Kimi Iboshi Sloop (2010), “New Transit Cooperative Research ProgramResearch Confirms Transit-Oriented Developments Produce Fewer Auto Trips,” ITE Journal (www.ite.org), Vol. 79, No. 6, June, pp. 26-29.
Linda Bailey (2007), Public Transportation and Petroleum Savings in the U.S.: Reducing Dependence on Oil, ICF International for the American Public Transportation Association(www.apta.com); atwww.apta.com/research/info/online/documents/apta_public_transportation_fuel_savings_final_010807.pdf .
Ted Balaker (2004), Past Performance Vs. Future Hopes: Will Urban Rail Improve Mobility In North Carolina?, Policy Study 321, Reason Public Policy Foundation (www.rppi.org/ps321.pdf ).
David Banister and Mark Thurstain-Goodwin (2011), “Quantification Of The Non-TransportBenefits Resulting From Rail Investment,” Journal of Transport Geography, Vol. 19, Is. 2,March, pp. 212-223; earlier version at www.tsu.ox.ac.uk/pubs/1029-banister.pdf .
Nathaniel Baum-Snow and Matthew E. Kahn (2005), The Effects of Urban Rail Transit Expansions: Evidence from Sixteen Cities, 1970 to 2000, Brookings Papers on Urban Affairs(www.econ.brown.edu/fac/Nathaniel_Baum-Snow/brook_final.pdf ).
Eric Beaton (2006), The Impacts of Commuter Rail in Greater Boston, Rappaport Institute for Greater Boston, Kennedy School of Government, Harvard University (www.ksg.harvard.edu); atwww.ksg.harvard.edu/rappaport/downloads/policybriefs/commuter_rail.pdf .
7/30/2019 Rail Ben
http://slidepdf.com/reader/full/rail-ben 58/67
Rail Transit In America: Comprehensive Evaluation of Benefits Victoria Transport Policy Institute
57
Antonio M. Bento, Maureen L. Cropper, Ahmed Mushfiq Mobarak and Katja Vinha (2005), The Impact of Urban Spatial Structure on Travel Demand in the United States, World Bank GroupWorking Paper 2007, World Bank (http://econ.worldbank.org/files/24989_wps3007.pdf ), 2003.Also published in Review of Economics and Statistics (http://mitpress.mit.edu), Vol. 87, Issue 3,August, pp. 466 – 478.
Luís Bettencourt, José Lobo, Dirk Helbing, Christian Kühnert, and Geoffrey West (2007),“Growth, Innovation, Scaling, and the Pace of Life in Cities,” Proceedings of the National Academy of Sciences 104, no. 17 (www.pnas.org/content/104/17/7301.abstract).
Beyond DC (www.beyonddc.com/features/compare.html) includes maps of U.S. cities withinformation on various features, including whether they have rail transit service.
BLS (annual reports), Consumer Expenditure Survey, Bureau of Labor Statistics (www.bls.gov).
Jeffrey Brown and Gregory L. Thompson (2009), The Influence of Service Planning Decisions on Rail Transit Success or Failure, Mineta Transportation Institute (www.transweb.sjsu.edu); atwww.transweb.sjsu.edu/MTIportal/research/publications/documents/ServicePlanningDecisions%20(with%20covers).pdf .
BTS (annual reports), National Transportation Statistics, Bureau of Transportation Statistics(www.bts.gov/publications/national_transportation_statistics).
Cambridge Systematics (1998), Economic Impact Analysis of Transit Investments: Guidebook for Practioners, Report 35, Transit Cooperative Research Program, TRB (www.trb.org).
Xinyu Cao, Susan L. Handy and Patricia L. Mokhtarian (2006), “The Influences Of The BuiltEnvironment And Residential Self-Selection On Pedestrian Behavior,” Transportation (www.springerlink.com), Vol. 33, No. 1, pp. 1 – 20.
Xinyu Cao, Patricia L. Mokhtarian and Susan L. Handy (2008), Examining The Impacts of
Residential Self-Selection on Travel Behavior: Methodologies and Empirical Findings, Instituteof Transportation Studies, University of California, Davis, Research Report UCD-ITS-RR-08-25;at http://pubs.its.ucdavis.edu/publication_detail.php?id=1194; also Report CTS 08-24, Center for Transportation Studies, University of Minnesota (www.cts.umn.edu); atwww.cts.umn.edu/Publications/ResearchReports/reportdetail.html?id=1684.
Molly D. Castelazo and Thomas A. Garrett (2004), “Light Rail: Boon or Boondoggle,” The Regional Economist (www.stlouisfed.org/publications/re/2004/c/pages/light_rail.html).
Census (Various Years), American Community Survey, U.S. Census Bureau (www.census.gov).
Robert Cervero (2007), “Transit Oriented Development’s Ridership Bonus: A Product Of Self
Selection And Public Policies,” Environment and Planning, Vol. A, No. 39, pp. 2068-2085; atwww.uctc.net/papers/765.pdf .
Robert Cervero and G. B. Arrington (2008), “Vehicle Trip Reduction Impacts of Transit-OrientedHousing,” Journal of Public Transportation, Vol. 11, No. 3, pp. 1-17; atwww.nctr.usf.edu/jpt/pdf/JPT11-3.pdf .
Mikhail Chester and Arpad Horvath (2008), Environmental Life-cycle Assessment of Passenger Transportation: A Detailed Methodology for Energy, Greenhouse Gas and Criteria Pollutant

7/30/2019 Rail Ben
http://slidepdf.com/reader/full/rail-ben 59/67
Rail Transit In America: Comprehensive Evaluation of Benefits Victoria Transport Policy Institute
58
Inventories of Automobiles, Buses, Light Rail, Heavy Rail and Air v.2, UC Berkeley Center for Future Urban Transport, (www.its.berkeley.edu/volvocenter/), Paper vwp-2008-2; atwww.sustainable-transportation.comand http://escholarship.org/uc/item/7n29n303#page-36.
CFTE (2003), CFTE O’Toole Response, Center for Transportation Excellence (www.cfte.org); atwww.cfte.org/critics/O'Toole%20response.pdf .
CFTE (2005), Building Communities Through Public Transportation: A Guide for SuccessfulTransit Initiatives, Center for Transportation Excellence, for the Public TransportationPartnership for Tomorrow (www.cfte.org/Building_Communities.pdf ).
Comptroller and Auditor General, Improving Public Transport in England Through Light Rail,UK National Audit Office (www.nao.org.uk/pn/03-04/0304518.htm), April 2004.
Harry Chmelynski (2008), National Economic Impacts per $1 Million Household Expenditures(2006); Spreadsheet Based On IMPLAN Input-Output Model, Jack Faucett Associates(www.jfaucett.com).
Wendell Cox (2010), Washington’s War on Cars and the Suburbs: Secretary LaHoods FalseClaims on Roads and Transit , Reason Foundation (www.heritage.org); atwww.heritage.org/Research/Reports/2010/06/Washingtons-War-on-Cars-and-the-Suburbs-Secretary-LaHoods-False-Claims-on-Roads-and-Transit.
CNT (2010), Transit-Oriented Development and the Potential for VMT-related Greenhouse Gas Emissions Reduction, Center for Neighborhood Technology (www.cnt.org); atwww.cnt.org/repository/TOD-Potential-GHG-Emissions-Growth.FINAL.pdf .
CTOD (2011), Transit and Regional Economic Development , Center for Transit OrientedDevelopment (www.ctod.org/portal); athttp://reconnectingamerica.org/assets/Uploads/TransitandRegionalED2011.pdf .
CTS (2009a), Understanding the Impacts of Transitways: Demographic and Behavioral Differences between Hiawatha Light-Rail and Other Transit Riders, Transitway ImpactsResearch Program (TIRP), Center for Transportation Studies, University of Minnesota(www.cts.umn.edu/Research/Featured/Transitways).
CTS (2009b), Understanding the Impacts of Transitways: The Hiawatha Line: Impacts on Land Use and Residential Housing Value, Transitway Impacts Research Program (TIRP), Center for Transportation Studies, University of Minnesota(www.cts.umn.edu/Research/Featured/Transitways).
CTS (2010), How Light-Rail Transit Improves Job Access for Low-Wage Workers, Transitway
Impacts Research Program (TIRP), Center for Transportation Studies, University of Minnesota(www.cts.umn.edu/Research/Featured/Transitways).
Graham Currie (2005), “The Demand Performance of Bus Rapid Transit,” Journal of PublicTransportation, Vol.8, No.1 (www.nctr.usf.edu/jpt/pdf/JPT%208-1%20Currie.pdf ), pp. 41-55.
Graham Currie (2006), “Bus Transit Oriented Development — Strengths and Challenges Relativeto Rail,” Journal of Public Transportation, Vol. 9 No. 4, pp. 1-21; atwww.nctr.usf.edu/jpt/pdf/JPT%209-4%20Currie.pdf .

7/30/2019 Rail Ben
http://slidepdf.com/reader/full/rail-ben 60/67
Rail Transit In America: Comprehensive Evaluation of Benefits Victoria Transport Policy Institute
59
EDRG (2007), Time is Money: The Economic Benefits of Transit Investment , EconomicDevelopment Research Group for the Chicago RTA(www.chicagometropolis2020.org/documents/TimeisMoney.pdf ).
Hank Dittmar (1997), Is Rail Transit Right For Your Community? Asking the Right Questions;
Measuring the Benefits, Surface Transportation Policy Project (www.transact.org/report.asp).
Hank Dittmar and Gloria Ohland (2004), The New Transit Town: Best Practices In Transit-Oriented Development , Island Press (www.islandpress.org).
Mark Eppli and Charles C. Tu (2000), Valuing the New Urbanism; The Impact of New Urbanismon Prices of Single-Family Homes, Urban Land Institute (www.uli.org).
ECONorthwest and PBQD (2002), Estimating the Benefits and Costs of Public Transit Projects,TCRP Report 78, TRB (www.trb.org); athttp://gulliver.trb.org/publications/tcrp/tcrp78/index.htm.
John E. Evans and Richard H. Pratt (2007), Transit Oriented Development; Chapter 17, Travel Response To Transportation System Changes, TCRP Report 95, Transportation Research Board(www.trb.org); at www.trb.org/TRBNet/ProjectDisplay.asp?ProjectID=1034.
Reid Ewing, Rolf Pendall and Don Chen (2002), Measuring Sprawl and Its Impacts, SmartGrowth America (www.smartgrowthamerica.org); atwww.smartgrowthamerica.org/sprawlindex/MeasuringSprawl.PDF.
FHWA (2002), “Miles and Daily Vehicle-Miles of Travel,” Highway Statistics, Table 71, FederalHighway Administration (www.fhwa.dot.gov/policy/ohim/hs02/re.htm).
David J. Forkenbrock and Glen E. Weisbrod (2001), Guidebook for Assessing the Social and
Economic Effects of Transportation Projects, NCHRP Report 456, TRB (www.trb.org).
Yonah Freemark (2010), Transit Mode Share Trends Looking Steady; Rail Appears to Encourage Non-Automobile Commutes, The Transport Politic (www.thetransportpolitic.com); atwww.thetransportpolitic.com/2010/10/13/transit-mode-share-trends-looking-steady-rail-appears-to-encourage-non-automobile-commutes.
FTA (1998), Transit Economic Requirements Model (TERM), Federal Transit Administration(www.fta.dot.gov).
FTA (2001), National Transit Summaries and Trends, Federal Transit Administration(www.ntdprogram.com).
FTA (2002), Transit Performance Monitoring System (TPMS) Results, American Public TransitAssociation (www.apta.com) and the Federal Transit Administration(www.fta.dot.gov/transit_data_info/reports_publications/reports/16031_ENG_HTML.htm).
GAO (2001), Mass Transit; Bus Rapid Transit Shows Promise, U.S. General Accounting Office,GAO-O1-984 (www.gao.gov/new.items/d01984.pdf ).
7/30/2019 Rail Ben
http://slidepdf.com/reader/full/rail-ben 61/67
Rail Transit In America: Comprehensive Evaluation of Benefits Victoria Transport Policy Institute
60
John Gard (2007), “Innovative Intermodal Solutions for Urban Transportation Paper Award:Quantifying Transit-Oriented Development’s Ability To Change Travel Behavior,” ITE Journal (www.ite.org), Vol. 77, No. 11, November, pp. 42-46.
Thomas A. Garrett and Molly D. Castelazo (2004), Light Rail Transit in America: Policy Issuesand Prospects for Economic Development , Federal Reserve Bank of St. Louis
(www.stlouisfed.org).
David Goldstein (2007), Saving Energy, Growing Jobs: How Environmental Protection Promotes Economic Growth, Profitability, Innovation, and Competition, Bay Tree Publishers(www.baytreepublish.com); summary at www.cee1.org/resrc/news/07-02nl/09D_goldstein.html.
Chris A. Hale (2011), “New Approaches To Strategic Urban Transport Assessment,” AustralianPlanner , Vol. 48/3, 173-182; abstract at http://dx.doi.org/10.1080/07293682.2011.592505.
Carmen Hass-Klau, et al. (2003), Bus Or Light Rail: Making The Right Choice, Environment andTransport Planning, Brighton Press (www.etphassklau.co.uk ).
Carmen Hass-Klau, Graham Crampton and Rabia Benjari (2004), Economic Impact of Light Rail:The Results Of 15 Urban Areas In France, Germany, UK and North America, Environmental &Transport Planning (http://etphassklau.co.uk ).
Andrew F. Haughwout (2000), “The Paradox of Infrastructure Investment,” Brookings Review (www.brookings.edu), Summer 2000, pp. 40-43.
Lyndon Henry and Todd Litman (2006), Evaluating New Start Transit Program Performance:Comparing Rail And Bus, Victoria Transport Policy Institute (www.vtpi.org); atwww.vtpi.org/bus_rail.pdf .
Daniel Hess and Paul Ong (2001), Traditional Neighborhoods and Auto Ownership, Ralph &
Goldy Lewis Center for Regional Policy Studies(www.sppsr.ucla.edu/lewis/WorkingPapers.html).
Dario Hidalgo and Aileen Carrigan (2010), Modernizing Public Transportation: Lessons Learned From Major Bus Improvements In Latin America And Asia, EMBARQ (www.embarq.org); atwww.embarq.org/sites/default/files/EMB2010_BRTREPORT.pdf .
HLB (2002), Economic Study to Establish A Cost-Benefit Framework For The Evaluation of Various Types of Transit Investments, Transport Canada (www.tc.gc.ca).
John Holtzclaw (2000), Does A Mile In A Car Equal A Mile On A Train? Exploring PublicTransit’s Effectiveness In Reducing Driving, The Sierra Club,
(www.sierraclub.org/sprawl/articles/reducedriving.asp).
ICCMA (12998), Why Smart Growth: A Primer , International City/County ManagementAssociation, Smart Growth Network and USEPA (www.epa.gov/smartgrowth).
ICF (2008), The Broader Connection between Public Transportation, Energy Conservation and Greenhouse Gas Reduction, American Public Transportation Association (www.apta.com); atwww.apta.com/resources/reportsandpublications/Documents/land_use.pdf .

7/30/2019 Rail Ben
http://slidepdf.com/reader/full/rail-ben 62/67
Rail Transit In America: Comprehensive Evaluation of Benefits Victoria Transport Policy Institute
61
ICF (2010), Current Practices in Greenhouse Gas Emissions Savings from Transit: A Synthesisof Transit Practice, TCRP 84, TRB (www.trb.org); athttp://onlinepubs.trb.org/onlinepubs/tcrp/tcrp_syn_84.pdf .
ITE (2003), Smart Growth Transportation Guidelines, Smart Growth Task Force, Institute of Transportation Engineers (www.ite.org).
Jeff Kenworthy (2008), “An International Review of The Significance of Rail in DevelopingMore Sustainable Urban Transport Systems in Higher Income Cities,” World Transport Policy &Practice, Vol. 14, No. 2 (www.eco-logica.co.uk ); at www.eco-logica.co.uk/pdf/wtpp14.2.pdf .
Jeffrey Kenworthy and Felix Laube (2000), Millennium Cities Database For SustainableTransport , Institute for Sustainability and Technology Policy, Distributed by the InternationalUnion of Public Transport (www.uitp.com); also see Newman and Kenworthy (1999), and JeffreyKenworthy and Felix Laube (2000), The Role Of Light Rail In Urban Transport Systems:Winning Back Cities From The Automobile, 5th Light Rail Conference, UITP (www.uitp.com).
Kittleson & Associates (2003), Guidebook for Developing a Transit Performance-Measurement
System, TCRP Web Document 88, Transit Cooperative Research Program, TRB (www.trb.org);at http://gulliver.trb.org/publications/tcrp/tcrp_report_88/intro.pdf .
Bradley W. Lane (2008), “Significant Characteristics Of The Urban Rail Renaissance In TheUnited States: A Discriminant Analysis,” Transportation Research A, Vol. 42, Issue 2(www.elsevier.com/locate/tra), pp. 279-295.
David Lewis and Fred Williams (1999), Policy and Planning as Public Choice, Ashgate(www.ashgate.com); atwww.fta.dot.gov/documents/Policy_and_Planning_as_Public_Choice.pdf .
Yuen-wah Li (2003), “Evaluating the Urban Commute Experience: A Time Perception
Approach,” Journal of Public Transportation, Vol. 6, No. 4, pp. 41-67; atwww.nctr.usf.edu/jpt/pdf/JPT%206-4%20Li.pdf .
Todd Litman (2002), Light Rail Economic Opportunity Study, Island Tranformations(www.islandtransformations.org).
Todd Litman (2002), Evaluating Transportation Land Use Impacts, Victoria Transport PolicyInstitute (www.vtpi.org).
Todd Litman (2003a), “Measuring Transportation: Traffic, Mobility and Accessibility,” ITE Journal (www.ite.org), Vol. 73, No. 10, October 2003, pp. 28-32; at www.vtpi.org/measure.pdf .
Todd Litman (2003b), Evaluating Criticism of Smart Growth, Victoria Transport Policy Institute(www.vtpi.org).
Todd Litman (2004a), Evaluating Public Transit Benefits and Costs: Best Practices Guidebook ,VTPI (www.vtpi.org); at www.vtpi.org/tranben.pdf .
Todd Litman (2004b), Evaluating Research Quality: Guidelines for Scholarship, VictoriaTransport Policy Institute (www.vtpi.org); at www.vtpi.org/resqual.pdf .

7/30/2019 Rail Ben
http://slidepdf.com/reader/full/rail-ben 63/67
Rail Transit In America: Comprehensive Evaluation of Benefits Victoria Transport Policy Institute
62
Todd Litman (2004c), Evaluating Rail Transit Criticism, Victoria Transport Policy Institute(www.vtpi.org); at www.vtpi.org/railcrit.pdf .
Todd Litman (2005), Land Use Impacts on Transportation, Victoria Transport Policy Institute(www.vtpi.org); at www.vtpi.org/landtravel.pdf .
Todd Litman (2006), Smart Congestion Reductions II: Reevaluating The Role Of Public Transit For Improving Urban Transportation, Victoria Transport Policy Institute (www.vtpi.org); atwww.vtpi.org/cong_reliefII.pdf ; summarized in “Evaluating Rail Transit Benefits: A Comment,”Transport Policy, Vol. 14, No. 1 (www.elsevier.com/locate/tranpol), January 2007, pp. 94-97.
Todd Litman (2007), “Evaluating Rail Transit Benefits: A Comment,” Transport Policy, Vol. 14, No. 1 (www.elsevier.com/locate/tranpol), January 2007, pp. 94-97.
Todd Litman (2008), “Valuing Transit Service Quality Improvements,” Journal of PublicTransportation, Vol. 11, No. 2, Spring 2008, pp. 43-64; at www.nctr.usf.edu/jpt/pdf/JPT11-2Litman.pdf . Also see Build for Comfort, Not Just Speed: Valuing Service Quality Impacts InTransport Planning at www.vtpi.org/quality.pdf .
Todd Litman (2009), Transportation Cost and Benefit Analysis Guidebook , Victoria TransportPolicy Institute (www.vtpi.org/tca).
Todd Litman (2009b), Evaluating Transportation Economic Development Impacts, VictoriaTransport Policy Institute (www.vtpi.org); at www.vtpi.org/econ_dev.pdf .
Todd Litman (2009c), Where We Want To Be: Home Location Preferences And Their Implications For Smart Growth, Victoria Transport Policy Institute (www.vtpi.org); atwww.vtpi.org/sgcp.pdf .
Todd Litman (2010a), Raise My Taxes, Please! Evaluating Household Savings From High
Quality Public Transit Service, VTPI (www.vtpi.org); at www.vtpi.org/raisetaxes.pdf .
Todd Litman (2010b), Evaluating Public Transportation Health Benefits, American PublicTransportation Association (www.apta.com); atwww.apta.com/mediacenter/pressreleases/2010/Pages/100811_Public%20Health%20Benefits.aspx.
Todd Litman (2011), The First Casualty of a Non-Existent War: Evaluating Claims of Unjustified Restrictions on Automobile Use, and a Critique of 'Washingtons War On Cars And The Suburbs' ,Victoria Transport Policy Institute (www.vtpi.org); at www.vtpi.org/carwars.pdf .
Todd Litman and Steve Fitzroy (2005), Safe Travels: Evaluating Mobility Management Safety Benefits, Victoria Transport Policy Institute (www.vtpi.org); at www.vtpi.org/safetrav.pdf .
Helen Fei Liu (2007), Vehicle CO2 Emissions and the Compactness of Residential Development ,HousingEconomics.com; atwww.nahb.org/fileUpload_details.aspx?contentTypeID=3&contentID=86266&subContentID=125229.
Shih-Che Lo and Randolph W. Hall (2006), “Effects of the Los Angeles Transit Strike OnHighway Congestion,” Transportation Research A, Vol. 40, No. 10(www.elsevier.com/locate/tra), December 2006, pp. 903-917.

7/30/2019 Rail Ben
http://slidepdf.com/reader/full/rail-ben 64/67
Rail Transit In America: Comprehensive Evaluation of Benefits Victoria Transport Policy Institute
63
LRN (2001), Study: Rail Transit May Slow Growth in Traffic Congestion, Light Rail Progress,Light Rail Now (www.lightrailnow.org/facts/fa_00017.htm).
Hollie M. Lund, Robert Cervero and Richard W. Willson (2004), Travel Characteristics of Transit-Oriented Development in California, Caltrans Statewide Planning Studies; atwww.csupomona.edu/~rwwillson/tod/Pictures/TOD2.pdf .
John M. MacDonald, Robert J. Stokes, Deborah A. Cohen, Aaron Kofner and Greg K. Ridgeway(2010), “The Effect of Light Rail Transit on Body Mass Index and Physical Activity,” American Journal of Preventive Medicine, Vol. 39, No. 2, pp. 105-112; at www.ajpm-online.net/article/S0749-3797(10)00297-7/abstract.
Jon Miller, Henry Robison & Michael Lahr (1999), Estimating Important Transportation-Related Regional Economic Relationships in Bexar County, Texas, VIA Transit (www.viainfo.net).
MKI (2003), Transit Means Business – The Economic Case for Public Transit in Canada,Canadian Urban Transit Association (www.cutaactu.ca).
Martin Mogridge (1990), Travel in Towns: Jam Yesterday, Jam today, and Jam Tomorrow?,Macmillan.
John Neff (1996), “Travel Distance Substitution Rates Between Automobile Users and TransitPatrons,” Papers and Proceedings of the Applied Geography Conferences, Vol. 19.
Peter Nelson, Andrew Baglino, Winston Harrington, Elena Safirova and Abram Lipman (2006),Transit in Washington, D.C.: Current Benefits and Optimal Level of Provision, Resources for theFuture (www.rff.org/rff/Documents/RFF-DP-06-21.pdf ).
Peter Newman and Jeffrey Kenworthy (1999), Sustainability and Cities; Overcoming Automobile Dependency, Island Press (www.islandpress.org).
NPTS (1999), Summary of Travel Trends, National Personal Transportation Survey, Bureau of Transportation Statistics, (http://npts.ornl.gov/npts/1995/Doc/trends_report.pdf ).
Randal O’Toole (2004), Great Rail Disasters; The Impact Of Rail Transit On Urban Livability,Reason Public Policy Institute (www.rppi.org), 2004. A nearly identical report was subsequentlyreleased by the Texas Public Policy Foundation (www.texaspolicy.com).
Glenn Pascall (2001), The Rail Transit Debate; An Assessment Of The Arguments, DiscoveryInstitute (www.discovery.org).
Rhonda Phillips (2001), John Karachepone and Bruce Landis, Multi-Modal Quality of Service
Project , Florida DOT (www.dot.state.fl.us/Planning/systems/sm/los/FinalMultiModal.pdf ).
Bruce Podobnik (2002), The Social and Environmental Achievements of New Urbanism: Evidence from Orenco Station, Department of SociologyLewis and Clark College (www.lclark.edu/~podobnik/orenco02.pdf ).
PPIC (2002), Special Survey on Land Use: Part of the Growth, Land Use and Environment Series, Public Policy Institute of California (www.ppic.org).

7/30/2019 Rail Ben
http://slidepdf.com/reader/full/rail-ben 65/67
Rail Transit In America: Comprehensive Evaluation of Benefits Victoria Transport Policy Institute
64
Richard H. Pratt (1999), Traveler Response to Transportation System Changes, Interim Handbook , TCRP Web Document 12 (www.trb.org), DOT-FH-11-9579.
Rémy Prud’homme and Chang-Woon Lee (1998), “Size, Sprawl, Speed and the Efficiency of Cities,” Observatoire de l’Économic et des Institutions Locals; atwww.rprudhomme.com/resources/Prud$27homme+$26+Lee+1999.pdf .
PSU ITE Student Chapter (2007), Parking and Mode Split Study for Transit Oriented Development: Pearl District, Portland, OR, Institute of Transportation Engineers(www.westernite.org/datacollectionfund/2007/PSU_report.pdf ).
Reconnecting America (2004), Hidden In Plain Sight: Capturing The Demand For Housing Near Transit , Center for Transit-Oriented Development; Reconnecting America(www.reconnectingamerica.org) for the Federal Transit Administration (www.fta.dot.gov); atwww.reconnectingamerica.org/pdfs/Ctod_report.pdf .
John L. Renne (2005), Transit-Oriented Development: Measuring Benefits, Analyzing Trends, And Evaluating Policy, Dissertation, Rutgers State University.
Elizabeth Ridlington and Gigi Kellet (2003), Rail Transit Works: Light Rail Success Stories from Across the Country, MaryPIRG Foundation (www.marypirg.org).
Andrea Sarzynski, Marilyn A. Brown and Frank Southworth (2008), Shrinking the CarbonFootprint of Metropolitan America: Energy Security, Energy Security, Transportation, GlobalWarming, Climate Change, Brookings Institution (www.brookings.edu); atwww.brookings.edu/reports/2008/05_carbon_footprint_sarzynski.aspx.
John Schumann (2005), “Assessing Transit Changes in Columbus, Ohio, and Sacramento,California: Progress and Survival in Two State Capitals, 1995-2002,” Transportation Research Record 1930, TRB (www.trb.org), pp. 62-67.
Robert J. Shapiro, Kevin a. Hassett, and Frank S. Arnold (2002), Conserving Energy and Preserving the Environment: The Role of Public Transportation, American Public TransportationAssociation (www.apta.com).
Jeffery J. Smith and Thomas A. Gihring (2003), Financing Transit Systems Through ValueCapture: An Annotated Bibliography, Geonomy Society (www.progress.org/geonomy); atwww.vtpi.org/smith.pdf .
Steer Davies Gleave (2005), What Light Rail Can Do For Cities: A Review of the Evidence, UK Passenger Transport Executive Committee (www.pteg.net); atwww.eukn.org/unitedkingdom/themes/Urban_Policy/Transport_and_infrastructure/Public_transp
ort/Trams_and_light_rail/Light-rail-and-cities_1001.html.
Carl Switzer (2003), The Center Commons, Portland State University research, presented at theRail~volution Conference (www.railvolution.com), Atlanta, September 11-14, 2003.
TCRP (2004), Transit-Oriented Development in the United States: Experiences, Challenges, and Prospects, Report 102, Transit Cooperative Research Program, TRB (www.trb.org).

7/30/2019 Rail Ben
http://slidepdf.com/reader/full/rail-ben 66/67
Rail Transit In America: Comprehensive Evaluation of Benefits Victoria Transport Policy Institute
65
Edson L. Tennyson (1998), “Impact on Transit Patronage of Cessation or Inauguration of RailService,” Transportation Research Record 1221, Transportation Research Board (www.trb.org), pp. 59-78; at www.publictransit.us/ptlibrary/supplydemand/TRB1221.pdf .
Greg L. Thompson and Tom G. Matoff (2003), “Keeping Up with the Joneses: Planning for Transit in Decentralizing Regions,” Journal of the American Planning Association Vol. 69, No. 3,
Summer, pp. 296-312.
Christopher A. Topp (2009), Arapahoe County Parking Utilization Study Concerning ResidentialTransit Oriented Development , School of Public Affairs, University of Colorado Denver; atwww.vtpi.org/topp_parking.pdf .
TRL (2004), The Demand for Public Transit: A Practical Guide, Transportation ResearchLaboratory, Report TRL 593 (www.trl.co.uk ); at www.demandforpublictransport.co.uk .
TTI (annual reports), Urban Mobility Study, Texas Transportation Institute(http://mobility.tamu.edu/ums).
VTPI (2004), Online TDM Encyclopedia, Victoria Transport Policy Institute (www.vtpi.org).
Vukan R. Vuchic (1999), Transportation For Livable Cities, Center for Urban Policy Research,CRPR Press (www.policy.rutgers.edu/cupr ).
Vukan Vuchic (2005), Urban Transit: Operations, Planning and Economics, John Wiley & Sons(www.wiley.com).
Richard Wener, Gary W. Evans and Pier Boately (2005), “Commuting Stress:Psychophysiological Effects of the Trip and Spillover Into the Workplace,” Transportation Research Record 1924, TRB (www.trb.org), pp. 112-117. Also see Richard Wener, Gary W.Evans and Jerome Lutin, Leave The Driving To Them: Comparing Stress Of Car And Train
Commuters, APTA, www.apta.com/passenger_transport/thisweek/documents/driving_stress.pdf .
Paul M. Weyrich and William S. Lind (2001), Twelve Anti-Transit Myths: A ConservativeCritique, Free Congress Research and Education Foundation and APTA (www.apta.com).
Wilbur Smith (2008), Traffic & Transportation Policies and Strategies in Urban Areas in India,Ministry of Urban Development (www.urbanindia.nic.in); athttp://urbanindia.nic.in/moud/programme/ut/Traffic_transportation.pdf .
Clifford Winston and Ashley Langer (2004), The Effect of Government Highway Spending on Road Users’ Congestion Costs, Brookings Institute (www.brookings.edu).
Lloyd Wright (2006), Bus Rapid Transit Planning Guide, Institute for Transportation andDevelopment Policy (www.itdp.org) and the Sustainable Transport: A Sourcebook for Policy-makers in Developing Cities, published by the Sustainable Urban Transport Project – Asia(www.sutp-asia.org), Deutsche Gesellschaft fur Technische Zusammenarbeit (www.gtz.de), andthe Institute of Transportation and Development Policy.

7/30/2019 Rail Ben
http://slidepdf.com/reader/full/rail-ben 67/67
Related Documents