Submitted by Rahman Rahman Huq Auditors' Report and Financial Statements of Janata Bank Limited & its Subsidiaries as at and for the year ended 31 December 2012 Dhanmondi, Dhaka-1209 Chartered Accountants Dhaka-1212 Aziz Halim Khair Choudhury Chartered Accountants Building No. 2 (3 rd & 4 th Floors) House No. 79, Road No. 12/A 9, Mohakhali C/A (11 th & 12 th Floors)

Welcome message from author
This document is posted to help you gain knowledge. Please leave a comment to let me know what you think about it! Share it to your friends and learn new things together.
Transcript
Submitted by
Rahman Rahman Huq
Auditors' Report and Financial Statements
of
Janata Bank Limited & its Subsidiaries
as at and for the year ended 31 December 2012
Dhanmondi, Dhaka-1209
Chartered Accountants
Dhaka-1212
Aziz Halim Khair Choudhury
Chartered Accountants
Building No. 2 (3rd
& 4th
Floors)
House No. 79, Road No. 12/A
9, Mohakhali C/A (11th
& 12th
Floors)
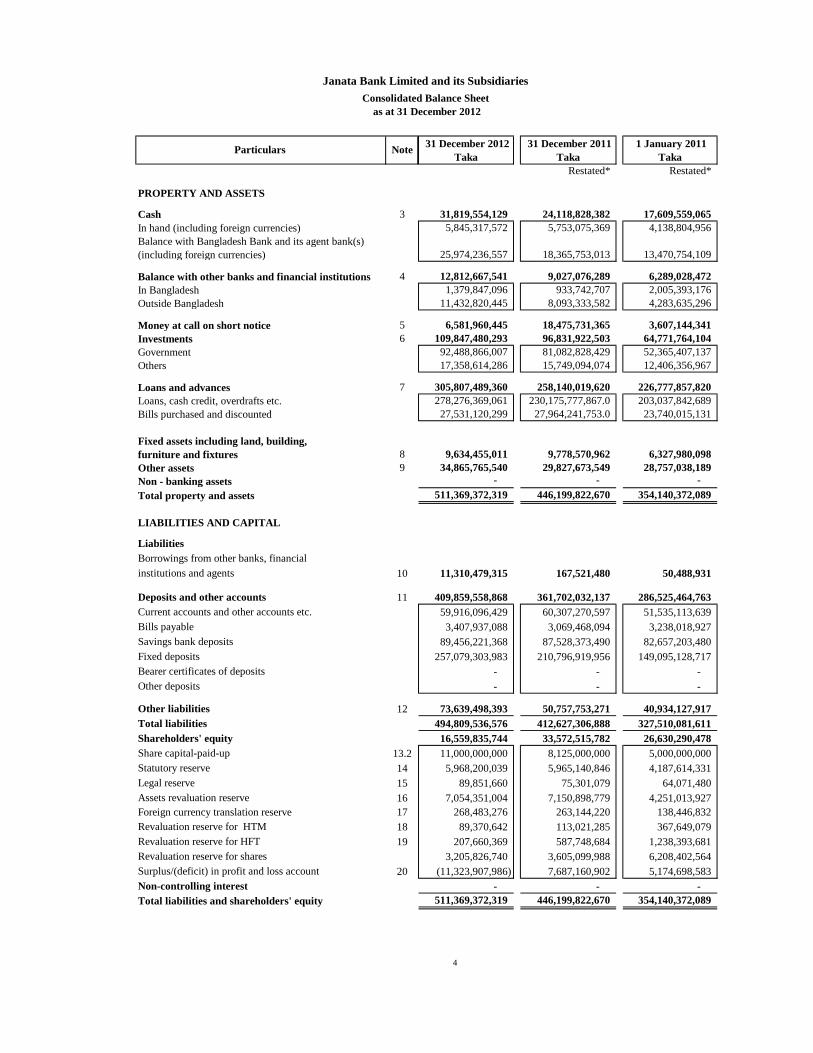
Restated* Restated*
PROPERTY AND ASSETS
Cash 3 31,819,554,129 24,118,828,382 17,609,559,065
In hand (including foreign currencies) 5,845,317,572 5,753,075,369 4,138,804,956
Balance with Bangladesh Bank and its agent bank(s)
(including foreign currencies) 25,974,236,557 18,365,753,013 13,470,754,109
Balance with other banks and financial institutions 4 12,812,667,541 9,027,076,289 6,289,028,472
In Bangladesh 1,379,847,096 933,742,707 2,005,393,176
Outside Bangladesh 11,432,820,445 8,093,333,582 4,283,635,296
Money at call on short notice 5 6,581,960,445 18,475,731,365 3,607,144,341
Investments 6 109,847,480,293 96,831,922,503 64,771,764,104
Government 92,488,866,007 81,082,828,429 52,365,407,137
Others 17,358,614,286 15,749,094,074 12,406,356,967
Loans and advances 7 305,807,489,360 258,140,019,620 226,777,857,820
Loans, cash credit, overdrafts etc. 278,276,369,061 230,175,777,867.0 203,037,842,689
Bills purchased and discounted 27,531,120,299 27,964,241,753.0 23,740,015,131
Fixed assets including land, building,
furniture and fixtures 8 9,634,455,011 9,778,570,962 6,327,980,098
Other assets 9 34,865,765,540 29,827,673,549 28,757,038,189
Non - banking assets - - -
Total property and assets 511,369,372,319 446,199,822,670 354,140,372,089
LIABILITIES AND CAPITAL
Liabilities
Borrowings from other banks, financial
institutions and agents 10 11,310,479,315 167,521,480 50,488,931
Deposits and other accounts 11 409,859,558,868 361,702,032,137 286,525,464,763
Current accounts and other accounts etc. 59,916,096,429 60,307,270,597 51,535,113,639
Bills payable 3,407,937,088 3,069,468,094 3,238,018,927
Savings bank deposits 89,456,221,368 87,528,373,490 82,657,203,480
Fixed deposits 257,079,303,983 210,796,919,956 149,095,128,717
Bearer certificates of deposits - - -
Other deposits - - -
Other liabilities 12 73,639,498,393 50,757,753,271 40,934,127,917
Total liabilities 494,809,536,576 412,627,306,888 327,510,081,611
Shareholders' equity 16,559,835,744 33,572,515,782 26,630,290,478
Share capital-paid-up 13.2 11,000,000,000 8,125,000,000 5,000,000,000
Statutory reserve 14 5,968,200,039 5,965,140,846 4,187,614,331
Legal reserve 15 89,851,660 75,301,079 64,071,480
Assets revaluation reserve 16 7,054,351,004 7,150,898,779 4,251,013,927
Foreign currency translation reserve 17 268,483,276 263,144,220 138,446,832
Revaluation reserve for HTM 18 89,370,642 113,021,285 367,649,079
Revaluation reserve for HFT 19 207,660,369 587,748,684 1,238,393,681
Revaluation reserve for shares 3,205,826,740 3,605,099,988 6,208,402,564
Surplus/(deficit) in profit and loss account 20 (11,323,907,986) 7,687,160,902 5,174,698,583
Non-controlling interest - - -
Total liabilities and shareholders' equity 511,369,372,319 446,199,822,670 354,140,372,089
Janata Bank Limited and its Subsidiaries
Consolidated Balance Sheet
as at 31 December 2012
1 January 2011
Taka NoteParticulars
31 December 2012
Taka
31 December 2011
Taka
4
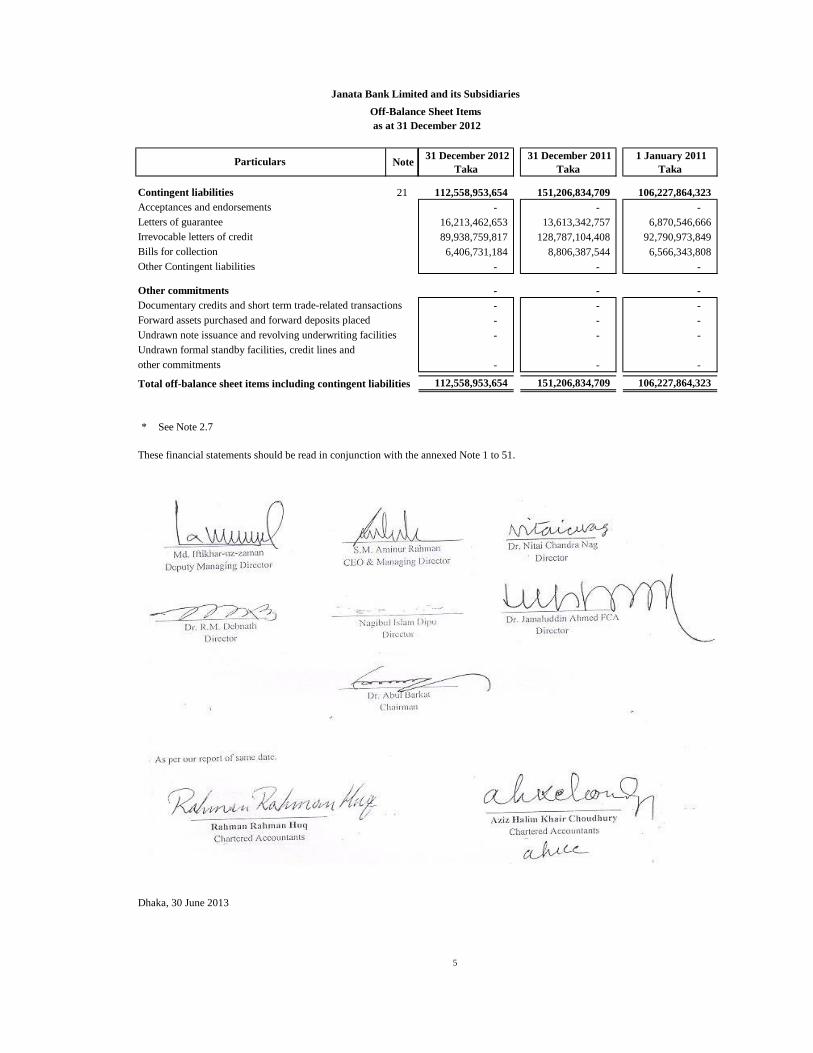
Contingent liabilities 21 112,558,953,654 151,206,834,709 106,227,864,323
Acceptances and endorsements - - -
Letters of guarantee 16,213,462,653 13,613,342,757 6,870,546,666
Irrevocable letters of credit 89,938,759,817 128,787,104,408 92,790,973,849
Bills for collection 6,406,731,184 8,806,387,544 6,566,343,808
Other Contingent liabilities - - -
Other commitments - - -
Documentary credits and short term trade-related transactions - - -
Forward assets purchased and forward deposits placed - - -
Undrawn note issuance and revolving underwriting facilities - - -
Undrawn formal standby facilities, credit lines and
other commitments - - -
Total off-balance sheet items including contingent liabilities 112,558,953,654 151,206,834,709 106,227,864,323
* See Note 2.7
These financial statements should be read in conjunction with the annexed Note 1 to 51.
Sd/-
Dr. Nitai Chandra Nag
Director
Sd/- Sd/- Sd/-
______________________ ________________________
Dr. Jamaluddin Ahmed FCA
Director
Sd/-
________________________
Dr. Abul Barkat
Chairman
See annexed auditors' report to the shareholders of date.
Sd/- Sd/-
___________________________ ___________________________
Rahman Rahman Huq Aziz Halim Khair Choudhury
Chartered Accountants Chartered Accountants
Dhaka, 30 June 2013
Janata Bank Limited and its Subsidiaries
Off-Balance Sheet Items
as at 31 December 2012
1 January 2011
Taka
__________________________
S.M. Aminur Rahman
Director
Nagibul Islam Dipu
Director
Md. Iftikhar-uz-zaman
Deputy Managing Director CEO & Managing Director
Dr. R.M. Debnath
Particulars Note 31 December 2012
Taka
31 December 2011
Taka
_________Sd/-_____________________Sd/-______________
5
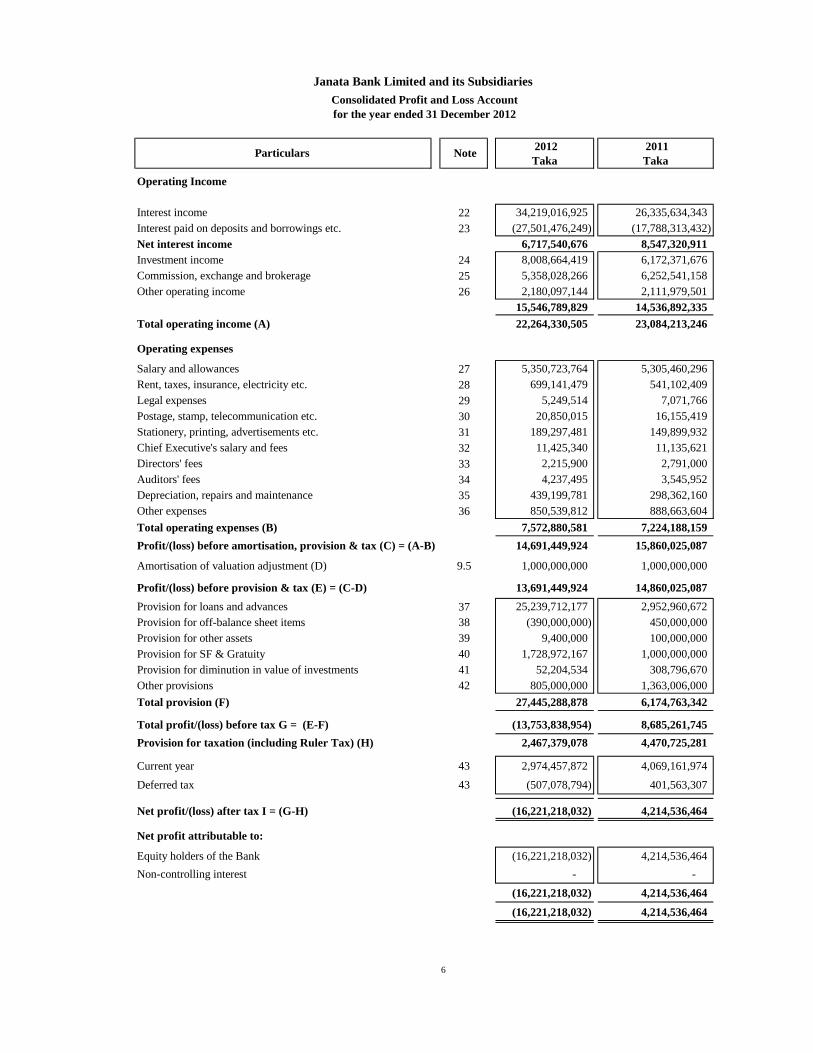
Operating Income
Interest income 22 34,219,016,925 26,335,634,343
Interest paid on deposits and borrowings etc. 23 (27,501,476,249) (17,788,313,432)
Net interest income 6,717,540,676 8,547,320,911
Investment income 24 8,008,664,419 6,172,371,676
Commission, exchange and brokerage 25 5,358,028,266 6,252,541,158
Other operating income 26 2,180,097,144 2,111,979,501
15,546,789,829 14,536,892,335
Total operating income (A) 22,264,330,505 23,084,213,246
Operating expenses
Salary and allowances 27 5,350,723,764 5,305,460,296
Rent, taxes, insurance, electricity etc. 28 699,141,479 541,102,409
Legal expenses 29 5,249,514 7,071,766
Postage, stamp, telecommunication etc. 30 20,850,015 16,155,419
Stationery, printing, advertisements etc. 31 189,297,481 149,899,932
Chief Executive's salary and fees 32 11,425,340 11,135,621
Directors' fees 33 2,215,900 2,791,000
Auditors' fees 34 4,237,495 3,545,952
Depreciation, repairs and maintenance 35 439,199,781 298,362,160
Other expenses 36 850,539,812 888,663,604
Total operating expenses (B) 7,572,880,581 7,224,188,159
Profit/(loss) before amortisation, provision & tax (C) = (A-B) 14,691,449,924 15,860,025,087
Amortisation of valuation adjustment (D) 9.5 1,000,000,000 1,000,000,000
Profit/(loss) before provision & tax (E) = (C-D) 13,691,449,924 14,860,025,087
Provision for loans and advances 37 25,239,712,177 2,952,960,672
Provision for off-balance sheet items 38 (390,000,000) 450,000,000
Provision for other assets 39 9,400,000 100,000,000
Provision for SF & Gratuity 40 1,728,972,167 1,000,000,000
Provision for diminution in value of investments 41 52,204,534 308,796,670
Other provisions 42 805,000,000 1,363,006,000
Total provision (F) 27,445,288,878 6,174,763,342
Total profit/(loss) before tax G = (E-F) (13,753,838,954) 8,685,261,745
Provision for taxation (including Ruler Tax) (H) 2,467,379,078 4,470,725,281
Current year 43 2,974,457,872 4,069,161,974
Deferred tax 43 (507,078,794) 401,563,307
Net profit/(loss) after tax I = (G-H) (16,221,218,032) 4,214,536,464
Net profit attributable to:
Equity holders of the Bank (16,221,218,032) 4,214,536,464
Non-controlling interest - -
(16,221,218,032) 4,214,536,464
(16,221,218,032) 4,214,536,464
Janata Bank Limited and its Subsidiaries
Consolidated Profit and Loss Account
for the year ended 31 December 2012
Particulars Note 2012
Taka
2011
Taka
6
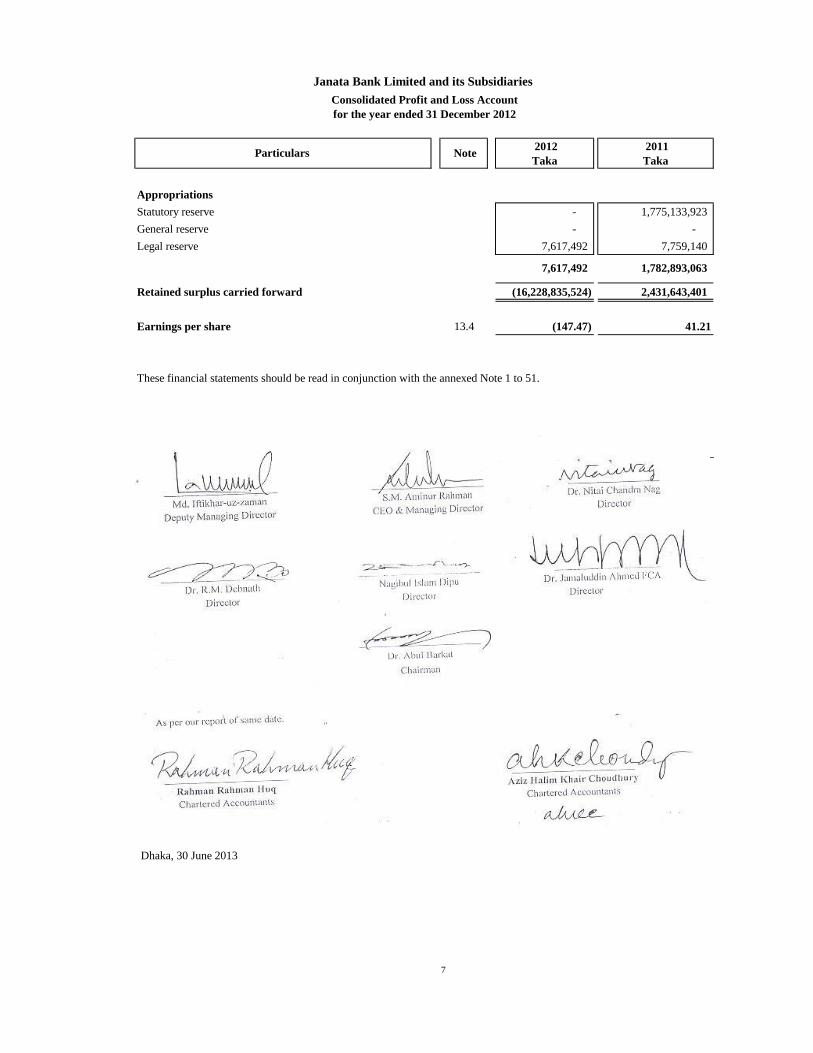
Janata Bank Limited and its Subsidiaries
Consolidated Profit and Loss Account
for the year ended 31 December 2012
Particulars Note 2012
Taka
2011
Taka
Appropriations
Statutory reserve - 1,775,133,923
General reserve - -
Legal reserve 7,617,492 7,759,140
7,617,492 1,782,893,063
Retained surplus carried forward (16,228,835,524) 2,431,643,401
Earnings per share 13.4 (147.47) 41.21
These financial statements should be read in conjunction with the annexed Note 1 to 51.
_________Sd/-_________
Dr. Nitai Chandra Nag
Director
Sd/-________________________ _________Sd/-____________
Nagibul Islam Dipu Dr. Jamaluddin Ahmed FCA
Director Director
____________Sd/-____________
Dr. Abul Barkat
Chairman
See annexed auditors' report to the shareholders of date.
Dhaka, 30 June 2013
Chartered Accountants Chartered Accountants
__________Sd/-______________ ___________Sd/-_____________
Rahman Rahman Huq Aziz Halim Khair Choudhury
Dr. R.M. Debnath
Director
__________Sd/-____________
Md. Iftikhar-uz-zaman S.M. Aminur Rahman
Deputy Managing Director
________Sd/-______________
CEO & Managing Director
____________Sd/-____________
7
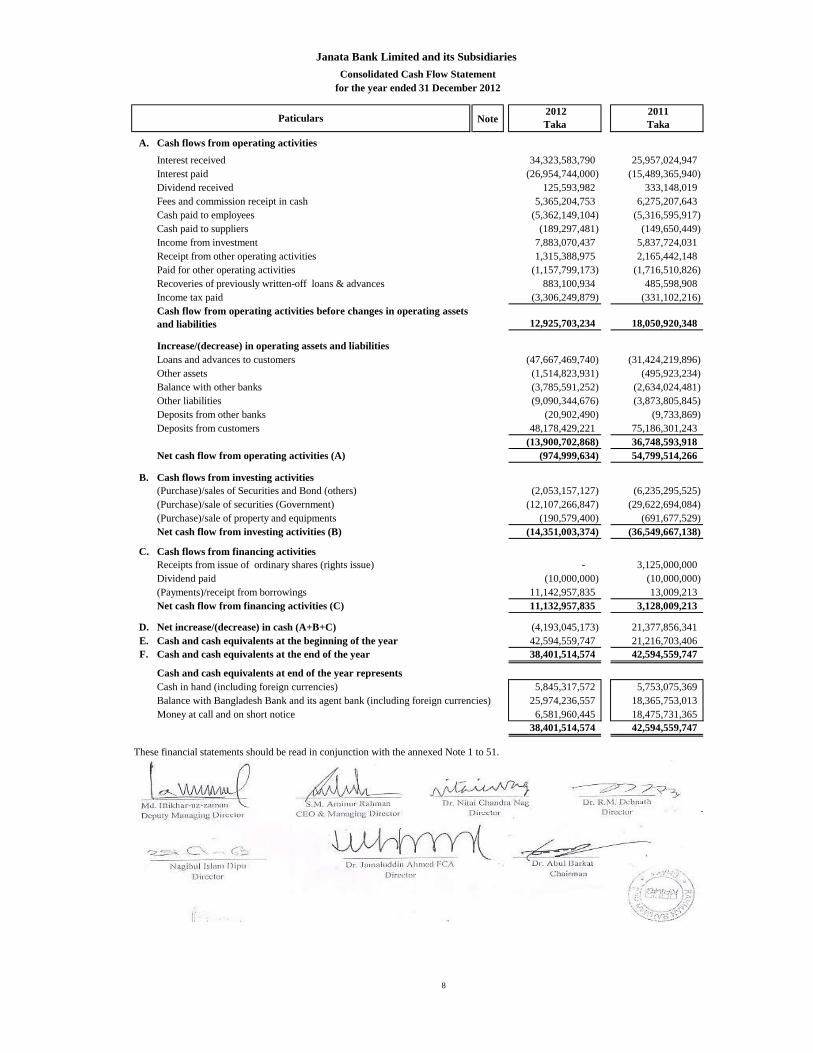
Note 2012
Taka
2011
Taka
A. Cash flows from operating activities
Interest received 34,323,583,790 25,957,024,947
Interest paid (26,954,744,000) (15,489,365,940)
Dividend received 125,593,982 333,148,019
Fees and commission receipt in cash 5,365,204,753 6,275,207,643
Cash paid to employees (5,362,149,104) (5,316,595,917)
Cash paid to suppliers (189,297,481) (149,650,449)
Income from investment 7,883,070,437 5,837,724,031
Receipt from other operating activities 1,315,388,975 2,165,442,148
Paid for other operating activities (1,157,799,173) (1,716,510,826)
Recoveries of previously written-off loans & advances 883,100,934 485,598,908
Income tax paid (3,306,249,879) (331,102,216)
12,925,703,234 18,050,920,348
Increase/(decrease) in operating assets and liabilities
Loans and advances to customers (47,667,469,740) (31,424,219,896)
Other assets (1,514,823,931) (495,923,234)
Balance with other banks (3,785,591,252) (2,634,024,481)
Other liabilities (9,090,344,676) (3,873,805,845)
Deposits from other banks (20,902,490) (9,733,869)
Deposits from customers 48,178,429,221 75,186,301,243
(13,900,702,868) 36,748,593,918
Net cash flow from operating activities (A) (974,999,634) 54,799,514,266
B. Cash flows from investing activities
(Purchase)/sales of Securities and Bond (others) (2,053,157,127) (6,235,295,525)
(Purchase)/sale of securities (Government) (12,107,266,847) (29,622,694,084)
(Purchase)/sale of property and equipments (190,579,400) (691,677,529)
Net cash flow from investing activities (B) (14,351,003,374) (36,549,667,138)
C. Cash flows from financing activities
Receipts from issue of ordinary shares (rights issue) - 3,125,000,000
Dividend paid (10,000,000) (10,000,000)
(Payments)/receipt from borrowings 11,142,957,835 13,009,213
Net cash flow from financing activities (C) 11,132,957,835 3,128,009,213
D. Net increase/(decrease) in cash (A+B+C) (4,193,045,173) 21,377,856,341
E. Cash and cash equivalents at the beginning of the year 42,594,559,747 21,216,703,406
F. Cash and cash equivalents at the end of the year 38,401,514,574 42,594,559,747
Cash and cash equivalents at end of the year represents
Cash in hand (including foreign currencies) 5,845,317,572 5,753,075,369
Balance with Bangladesh Bank and its agent bank (including foreign currencies) 25,974,236,557 18,365,753,013
Money at call and on short notice 6,581,960,445 18,475,731,365
38,401,514,574 42,594,559,747
These financial statements should be read in conjunction with the annexed Note 1 to 51.
___________Sd/-___________ ____________________Sd/- ________Sd/-________
Md. Iftikhar-uz-zaman S.M. Aminur Rahman Dr. Nitai Chandra Nag Dr. R.M. Debnath
Deputy Managing Director CEO & Managing Director Director Director
_________Sd/-_________
Dr. Abul Barkat
ChairmanDirector
Dr. Jamaluddin Ahmed FCA
____________Sd/-____________
Nagibul Islam Dipu
Janata Bank Limited and its Subsidiaries
Consolidated Cash Flow Statement
for the year ended 31 December 2012
Cash flow from operating activities before changes in operating assets
and liabilities
Paticulars
Director
___________Sd/-_____________
__________Sd/-____________
8
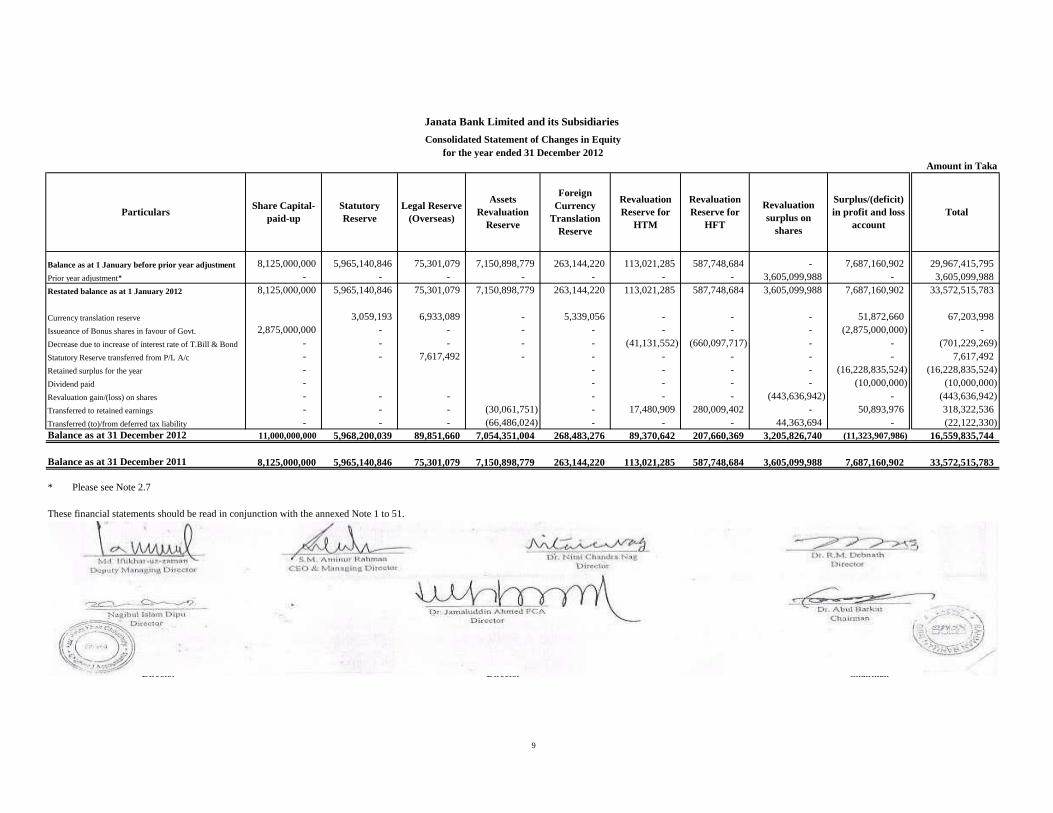
Balance as at 1 January before prior year adjustment 8,125,000,000 5,965,140,846 75,301,079 7,150,898,779 263,144,220 113,021,285 587,748,684 - 7,687,160,902 29,967,415,795
Prior year adjustment* - - - - - - - 3,605,099,988 - 3,605,099,988
Restated balance as at 1 January 2012 8,125,000,000 5,965,140,846 75,301,079 7,150,898,779 263,144,220 113,021,285 587,748,684 3,605,099,988 7,687,160,902 33,572,515,783
Currency translation reserve 3,059,193 6,933,089 - 5,339,056 - - - 51,872,660 67,203,998
Issueance of Bonus shares in favour of Govt. 2,875,000,000 - - - - - - - (2,875,000,000) -
Decrease due to increase of interest rate of T.Bill & Bond - - - - - (41,131,552) (660,097,717) - - (701,229,269)
Statutory Reserve transferred from P/L A/c - - 7,617,492 - - - - - - 7,617,492
Retained surplus for the year - - - - - (16,228,835,524) (16,228,835,524)
Dividend paid - - - - - (10,000,000) (10,000,000)
Revaluation gain/(loss) on shares - - - - - - (443,636,942) - (443,636,942)
Transferred to retained earnings - - - (30,061,751) - 17,480,909 280,009,402 - 50,893,976 318,322,536
Transferred (to)/from deferred tax liability - - - (66,486,024) - - - 44,363,694 - (22,122,330)
11,000,000,000 5,968,200,039 89,851,660 7,054,351,004 268,483,276 89,370,642 207,660,369 3,205,826,740 (11,323,907,986) 16,559,835,744
8,125,000,000 5,965,140,846 75,301,079 7,150,898,779 263,144,220 113,021,285 587,748,684 3,605,099,988 7,687,160,902 33,572,515,783
* Please see Note 2.7
These financial statements should be read in conjunction with the annexed Note 1 to 51.
____________Sd/-____________ ___________Sd/-_____________ __________Sd/-______________ ____________Sd/-____________
Md. Iftikhar-uz-zaman S.M. Aminur Rahman Dr. R.M. Debnath
Deputy Managing Director CEO & Managing Director Director
___________Sd/-_____________ ___________Sd/-_____________ ____________Sd/-____________
Nagibul Islam Dipu Dr. Jamaluddin Ahmed FCA Dr. Abul Barkat
Director Chairman
Total
Surplus/(deficit)
in profit and loss
account
Revaluation
Reserve for
HTM
Statutory
Reserve
Revaluation
Reserve for
HFT
Balance as at 31 December 2011
Foreign
Currency
Translation
Reserve
Balance as at 31 December 2012
Dr.Nitai Chandra Nag
Legal Reserve
(Overseas)
Assets
Revaluation
Reserve
Director
Director
Janata Bank Limited and its Subsidiaries
Consolidated Statement of Changes in Equity
for the year ended 31 December 2012
ParticularsShare Capital-
paid-up
Revaluation
surplus on
shares
Amount in Taka
9
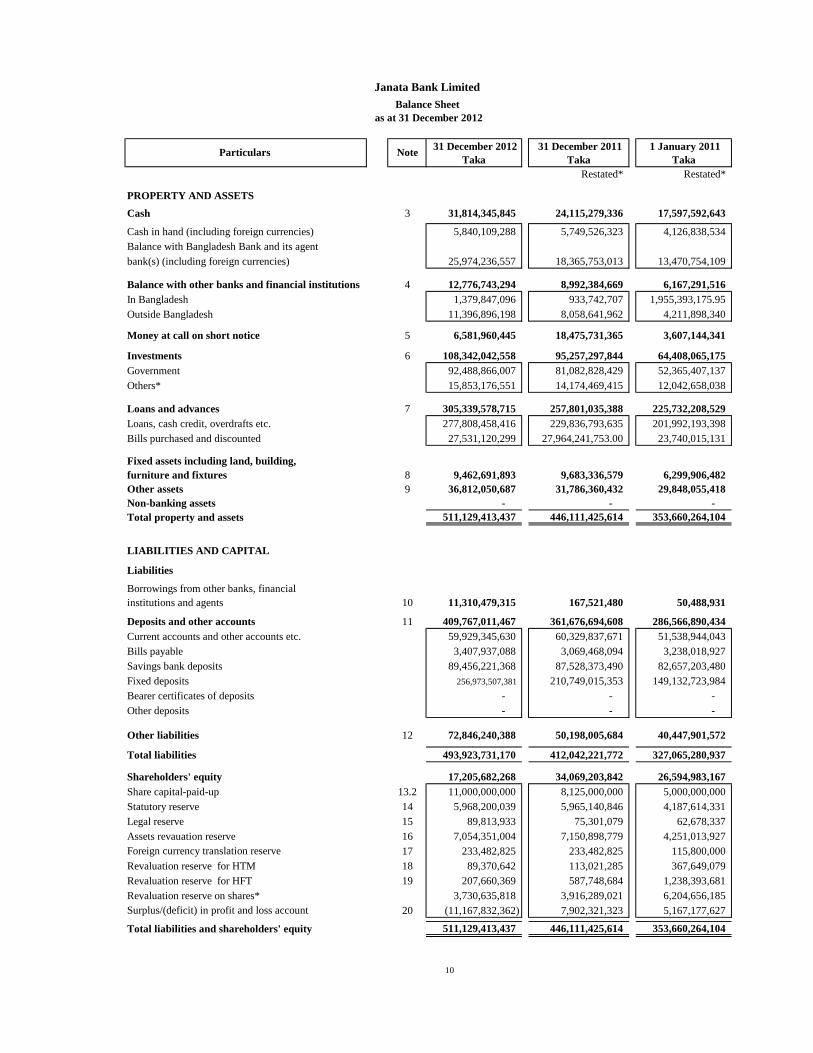
Restated* Restated*
PROPERTY AND ASSETS
Cash 3 31,814,345,845 24,115,279,336 17,597,592,643
Cash in hand (including foreign currencies) 5,840,109,288 5,749,526,323 4,126,838,534
Balance with Bangladesh Bank and its agent
bank(s) (including foreign currencies) 25,974,236,557 18,365,753,013 13,470,754,109
Balance with other banks and financial institutions 4 12,776,743,294 8,992,384,669 6,167,291,516
In Bangladesh 1,379,847,096 933,742,707 1,955,393,175.95
Outside Bangladesh 11,396,896,198 8,058,641,962 4,211,898,340
Money at call on short notice 5 6,581,960,445 18,475,731,365 3,607,144,341
Investments 6 108,342,042,558 95,257,297,844 64,408,065,175
Government 92,488,866,007 81,082,828,429 52,365,407,137
Others* 15,853,176,551 14,174,469,415 12,042,658,038
Loans and advances 7 305,339,578,715 257,801,035,388 225,732,208,529
Loans, cash credit, overdrafts etc. 277,808,458,416 229,836,793,635 201,992,193,398
Bills purchased and discounted 27,531,120,299 27,964,241,753.00 23,740,015,131
Fixed assets including land, building,
furniture and fixtures 8 9,462,691,893 9,683,336,579 6,299,906,482
Other assets 9 36,812,050,687 31,786,360,432 29,848,055,418
Non-banking assets - - -
Total property and assets 511,129,413,437 446,111,425,614 353,660,264,104
LIABILITIES AND CAPITAL
Liabilities
Borrowings from other banks, financial
institutions and agents 10 11,310,479,315 167,521,480 50,488,931
Deposits and other accounts 11 409,767,011,467 361,676,694,608 286,566,890,434
Current accounts and other accounts etc. 59,929,345,630 60,329,837,671 51,538,944,043
Bills payable 3,407,937,088 3,069,468,094 3,238,018,927
Savings bank deposits 89,456,221,368 87,528,373,490 82,657,203,480
Fixed deposits 256,973,507,381 210,749,015,353 149,132,723,984
Bearer certificates of deposits - - -
Other deposits - - -
Other liabilities 12 72,846,240,388 50,198,005,684 40,447,901,572
Total liabilities 493,923,731,170 412,042,221,772 327,065,280,937
Shareholders' equity 17,205,682,268 34,069,203,842 26,594,983,167
Share capital-paid-up 13.2 11,000,000,000 8,125,000,000 5,000,000,000
Statutory reserve 14 5,968,200,039 5,965,140,846 4,187,614,331
Legal reserve 15 89,813,933 75,301,079 62,678,337
Assets revauation reserve 16 7,054,351,004 7,150,898,779 4,251,013,927
Foreign currency translation reserve 17 233,482,825 233,482,825 115,800,000
Revaluation reserve for HTM 18 89,370,642 113,021,285 367,649,079
Revaluation reserve for HFT 19 207,660,369 587,748,684 1,238,393,681
Revaluation reserve on shares* 3,730,635,818 3,916,289,021 6,204,656,185
Surplus/(deficit) in profit and loss account 20 (11,167,832,362) 7,902,321,323 5,167,177,627
Total liabilities and shareholders' equity 511,129,413,437 446,111,425,614 353,660,264,104
as at 31 December 2012
1 January 2011
Taka Particulars Note
31 December 2012
Taka
31 December 2011
Taka
Janata Bank Limited
Balance Sheet
10
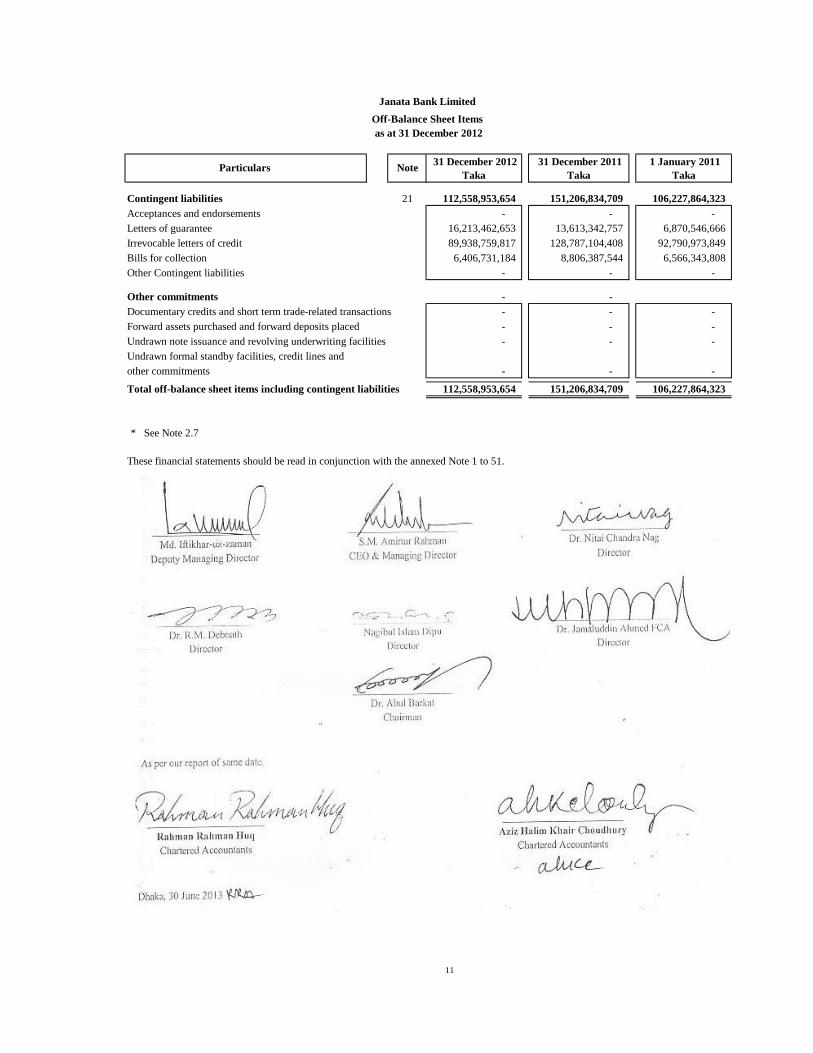
Contingent liabilities 21 112,558,953,654 151,206,834,709 106,227,864,323
Acceptances and endorsements - - -
Letters of guarantee 16,213,462,653 13,613,342,757 6,870,546,666
Irrevocable letters of credit 89,938,759,817 128,787,104,408 92,790,973,849
Bills for collection 6,406,731,184 8,806,387,544 6,566,343,808
Other Contingent liabilities - - -
Other commitments - -
Documentary credits and short term trade-related transactions - - -
Forward assets purchased and forward deposits placed - - -
Undrawn note issuance and revolving underwriting facilities - - -
Undrawn formal standby facilities, credit lines and
other commitments - - -
Total off-balance sheet items including contingent liabilities 112,558,953,654 151,206,834,709 106,227,864,323
* See Note 2.7
These financial statements should be read in conjunction with the annexed Note 1 to 51.
__________Sd/-___________ __________Sd/-____________ Sd/-_____________________
Md. Iftikhar- uz- zaman S.M. Aminur Rahman Dr.Nitai Chandra Nag
Deputy Managing Director CEO & Managing Director Director
__________Sd/-_________ _________Sd/-___________ Sd/-_______________________
Dr. R.M. Debnath Nagibul Islam Dipu Dr. Jamaluddin Ahmed FCA
Director Director Director
__________Sd/-__________
Dr. Abul Barkat
Chairman
See annexed auditors' report to the shareholders of date.
___________Sd/-____________ ___________Sd/-_____________
Rahman Rahman Huq Aziz Halim Khair Choudhury
Chartered Accountants Chartered Accountants
Dhaka, 30 June 2013
Particulars Note 31 December 2011
Taka
Janata Bank Limited
Off-Balance Sheet Items
as at 31 December 2012
1 January 2011
Taka
31 December 2012
Taka
11
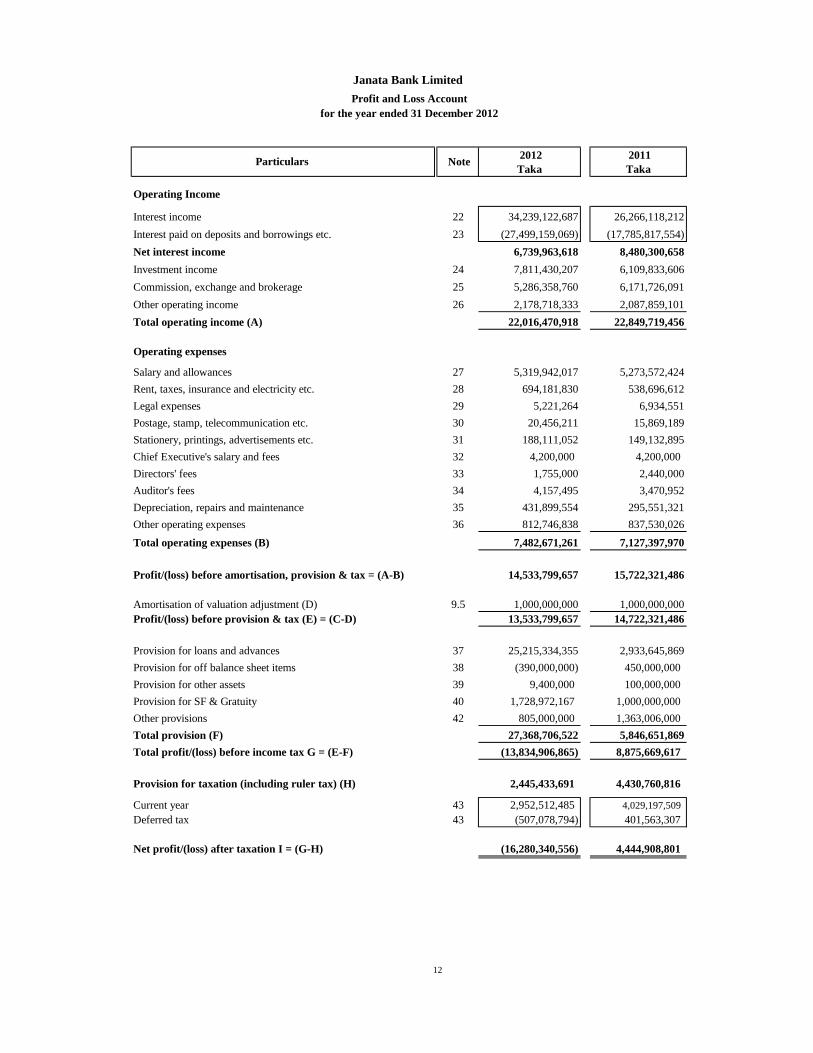
Operating Income
Interest income 22 34,239,122,687 26,266,118,212
Interest paid on deposits and borrowings etc. 23 (27,499,159,069) (17,785,817,554)
Net interest income 6,739,963,618 8,480,300,658
Investment income 24 7,811,430,207 6,109,833,606
Commission, exchange and brokerage 25 5,286,358,760 6,171,726,091
Other operating income 26 2,178,718,333 2,087,859,101
Total operating income (A) 22,016,470,918 22,849,719,456
Operating expenses
Salary and allowances 27 5,319,942,017 5,273,572,424
Rent, taxes, insurance and electricity etc. 28 694,181,830 538,696,612
Legal expenses 29 5,221,264 6,934,551
Postage, stamp, telecommunication etc. 30 20,456,211 15,869,189
Stationery, printings, advertisements etc. 31 188,111,052 149,132,895
Chief Executive's salary and fees 32 4,200,000 4,200,000
Directors' fees 33 1,755,000 2,440,000
Auditor's fees 34 4,157,495 3,470,952
Depreciation, repairs and maintenance 35 431,899,554 295,551,321
Other operating expenses 36 812,746,838 837,530,026
Total operating expenses (B) 7,482,671,261 7,127,397,970
Profit/(loss) before amortisation, provision & tax = (A-B) 14,533,799,657 15,722,321,486
Amortisation of valuation adjustment (D) 9.5 1,000,000,000 1,000,000,000
Profit/(loss) before provision & tax (E) = (C-D) 13,533,799,657 14,722,321,486
Provision for loans and advances 37 25,215,334,355 2,933,645,869
Provision for off balance sheet items 38 (390,000,000) 450,000,000
Provision for other assets 39 9,400,000 100,000,000
Provision for SF & Gratuity 40 1,728,972,167 1,000,000,000
Other provisions 42 805,000,000 1,363,006,000
Total provision (F) 27,368,706,522 5,846,651,869
Total profit/(loss) before income tax G = (E-F) (13,834,906,865) 8,875,669,617
Provision for taxation (including ruler tax) (H) 2,445,433,691 4,430,760,816
Current year 43 2,952,512,485 4,029,197,509
Deferred tax 43 (507,078,794) 401,563,307
Net profit/(loss) after taxation I = (G-H) (16,280,340,556) 4,444,908,801
Janata Bank Limited
Profit and Loss Account
for the year ended 31 December 2012
Note 2012
Taka
2011
Taka Particulars
12
Janata Bank Limited
Profit and Loss Account
for the year ended 31 December 2012
Note 2012
Taka
2011
Taka Particulars
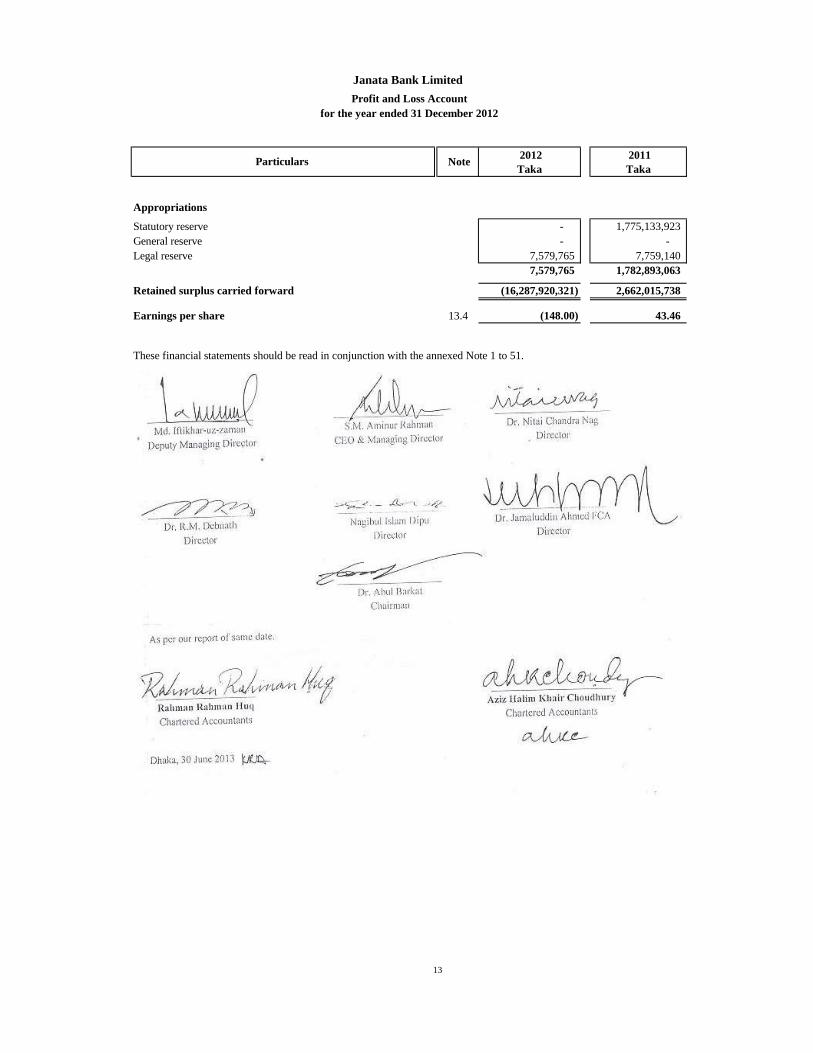
Appropriations
Statutory reserve - 1,775,133,923
General reserve - -
Legal reserve 7,579,765 7,759,140
7,579,765 1,782,893,063
(16,287,920,321) 2,662,015,738
13.4 (148.00) 43.46
These financial statements should be read in conjunction with the annexed Note 1 to 51.
_____________________Sd/- _________Sd/-_____________ ___________Sd/-____________
Md. Iftikhar- uz- zaman S.M. Aminur Rahman Dr. Nitai Chandra Nag
Deputy Managing Director CEO & Managing Director Director
_____________________Sd/- ___________Sd/-__________ __________Sd/-___________
Dr. R.M. Debnath Nagibul Islam Dipu Dr. Jamaluddin Ahmed FCA
Director Director Director
___________Sd/-__________
Dr. Abul Barkat
Chairman
See annexed auditors' report to the shareholders of date.
Dhaka, 30 June 2013
Earnings per share
Retained surplus carried forward
Chartered Accountants
____________Sd/-____________
Aziz Halim Khair Choudhury
Chartered Accountants
________Sd/-____________
Rahman Rahman Huq
13
Note 2012
Taka
2011
Taka
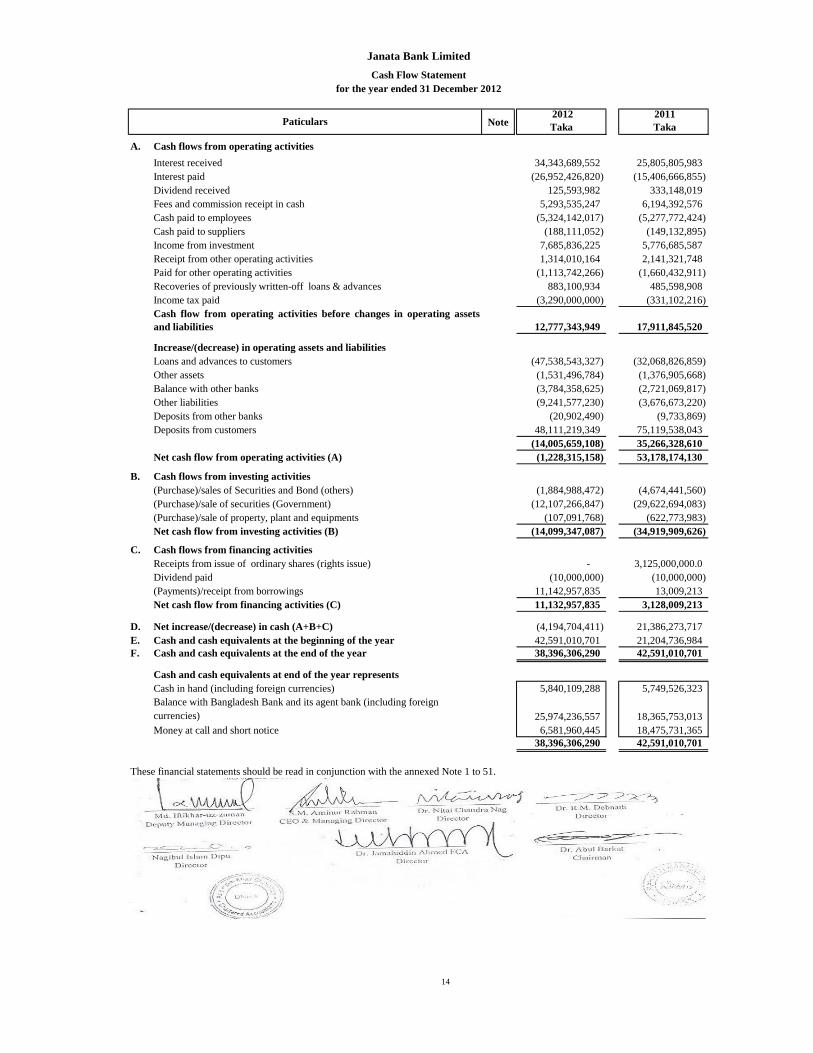
A. Cash flows from operating activities
Interest received 34,343,689,552 25,805,805,983
Interest paid (26,952,426,820) (15,406,666,855)
Dividend received 125,593,982 333,148,019
Fees and commission receipt in cash 5,293,535,247 6,194,392,576
Cash paid to employees (5,324,142,017) (5,277,772,424)
Cash paid to suppliers (188,111,052) (149,132,895)
Income from investment 7,685,836,225 5,776,685,587
Receipt from other operating activities 1,314,010,164 2,141,321,748
Paid for other operating activities (1,113,742,266) (1,660,432,911)
Recoveries of previously written-off loans & advances 883,100,934 485,598,908
Income tax paid (3,290,000,000) (331,102,216)
12,777,343,949 17,911,845,520
Increase/(decrease) in operating assets and liabilities
Loans and advances to customers (47,538,543,327) (32,068,826,859)
Other assets (1,531,496,784) (1,376,905,668)
Balance with other banks (3,784,358,625) (2,721,069,817)
Other liabilities (9,241,577,230) (3,676,673,220)
Deposits from other banks (20,902,490) (9,733,869)
Deposits from customers 48,111,219,349 75,119,538,043
(14,005,659,108) 35,266,328,610
Net cash flow from operating activities (A) (1,228,315,158) 53,178,174,130
B. Cash flows from investing activities
(Purchase)/sales of Securities and Bond (others) (1,884,988,472) (4,674,441,560)
(Purchase)/sale of securities (Government) (12,107,266,847) (29,622,694,083)
(Purchase)/sale of property, plant and equipments (107,091,768) (622,773,983)
Net cash flow from investing activities (B) (14,099,347,087) (34,919,909,626)
C. Cash flows from financing activities
Receipts from issue of ordinary shares (rights issue) - 3,125,000,000.0
Dividend paid (10,000,000) (10,000,000)
(Payments)/receipt from borrowings 11,142,957,835 13,009,213
Net cash flow from financing activities (C) 11,132,957,835 3,128,009,213
D. Net increase/(decrease) in cash (A+B+C) (4,194,704,411) 21,386,273,717
E. Cash and cash equivalents at the beginning of the year 42,591,010,701 21,204,736,984
F. Cash and cash equivalents at the end of the year 38,396,306,290 42,591,010,701
Cash and cash equivalents at end of the year represents
Cash in hand (including foreign currencies) 5,840,109,288 5,749,526,323
25,974,236,557 18,365,753,013
Money at call and short notice 6,581,960,445 18,475,731,365
38,396,306,290 42,591,010,701
These financial statements should be read in conjunction with the annexed Note 1 to 51.
_________Sd/-__________ __________Sd/-_________ ___________Sd/-___________
S.M. Aminur Rahman Dr. Nitai Chandra Nag Dr. R.M. Debnath
CEO & Managing Director Director Director
___________Sd/-___________
Dr. Abul Barkat
Chairman
Balance with Bangladesh Bank and its agent bank (including foreign
currencies)
Deputy Managing Director
__________Sd/-____________
Janata Bank Limited
Cash Flow Statement
for the year ended 31 December 2012
Paticulars
Cash flow from operating activities before changes in operating assets
and liabilities
Md. Iftikhar- uz- zaman
Director
Nagibul Islam Dipu
Director
__________Sd/-____________
Dr. Jamaluddin Ahmed FCA
_________Sd/-__________
14
Revaluation
reserve on sharessurplus
on shares
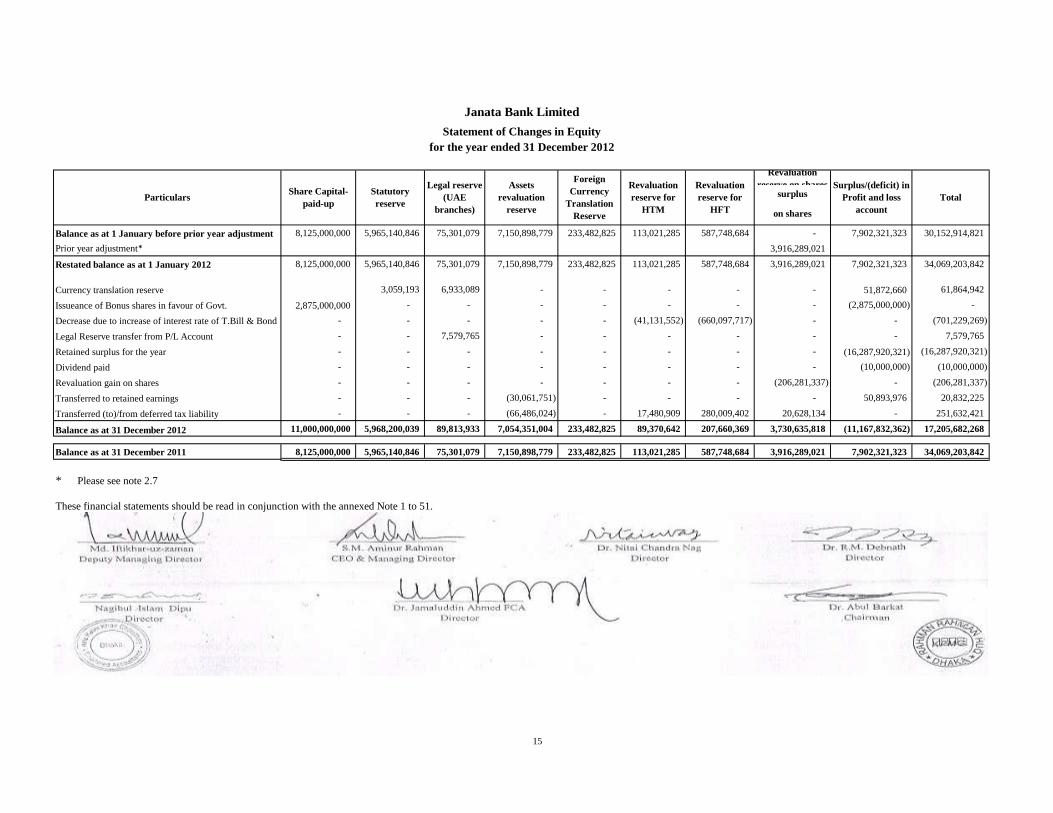
Balance as at 1 January before prior year adjustment 8,125,000,000 5,965,140,846 75,301,079 7,150,898,779 233,482,825 113,021,285 587,748,684 - 7,902,321,323 30,152,914,821
Prior year adjustment* 3,916,289,021
Restated balance as at 1 January 2012 8,125,000,000 5,965,140,846 75,301,079 7,150,898,779 233,482,825 113,021,285 587,748,684 3,916,289,021 7,902,321,323 34,069,203,842
Currency translation reserve 3,059,193 6,933,089 - - - - - 51,872,660 61,864,942
Issueance of Bonus shares in favour of Govt. 2,875,000,000 - - - - - - - (2,875,000,000) -
Decrease due to increase of interest rate of T.Bill & Bond - - - - - (41,131,552) (660,097,717) - - (701,229,269)
Legal Reserve transfer from P/L Account - - 7,579,765 - - - - - - 7,579,765
Retained surplus for the year - - - - - - - - (16,287,920,321) (16,287,920,321)
Dividend paid - - - - - - - - (10,000,000) (10,000,000)
Revaluation gain on shares - - - - - - - (206,281,337) - (206,281,337)
Transferred to retained earnings - - - (30,061,751) - - - - 50,893,976 20,832,225
Transferred (to)/from deferred tax liability - - - (66,486,024) - 17,480,909 280,009,402 20,628,134 - 251,632,421
11,000,000,000 5,968,200,039 89,813,933 7,054,351,004 233,482,825 89,370,642 207,660,369 3,730,635,818 (11,167,832,362) 17,205,682,268
8,125,000,000 5,965,140,846 75,301,079 7,150,898,779 233,482,825 113,021,285 587,748,684 3,916,289,021 7,902,321,323 34,069,203,842
* Please see note 2.7
These financial statements should be read in conjunction with the annexed Note 1 to 51.
____________Sd/-__________ __________Sd/-______________ ___________Sd/-______________
S.M. Aminur Rahman Dr. Nitai Chandra Nag Dr. R.M. Debnath
CEO & Managing Director Director Director
____________Sd/-_____________
Dr. Abul Barkat
Chairman
for the year ended 31 December 2012
Janata Bank Limited
Statement of Changes in Equity
Assets
revaluation
reserve
Revaluation
reserve for
HTM
Total
Director
Revaluation
reserve for
HFT
Foreign
Currency
Translation
Reserve
Particulars
Director
_________Sd/-_____________
Dr. Jamaluddin Ahmed FCA
_________Sd/-_____________
__________Sd/-____________
Nagibul Islam Dipu
Md. Iftikhar-uz-zaman
Deputy Managing Director
Balance as at 31 December 2011
Balance as at 31 December 2012
Surplus/(deficit) in
Profit and loss
account
Legal reserve
(UAE
branches)
Share Capital-
paid-up
Statutory
reserve
15
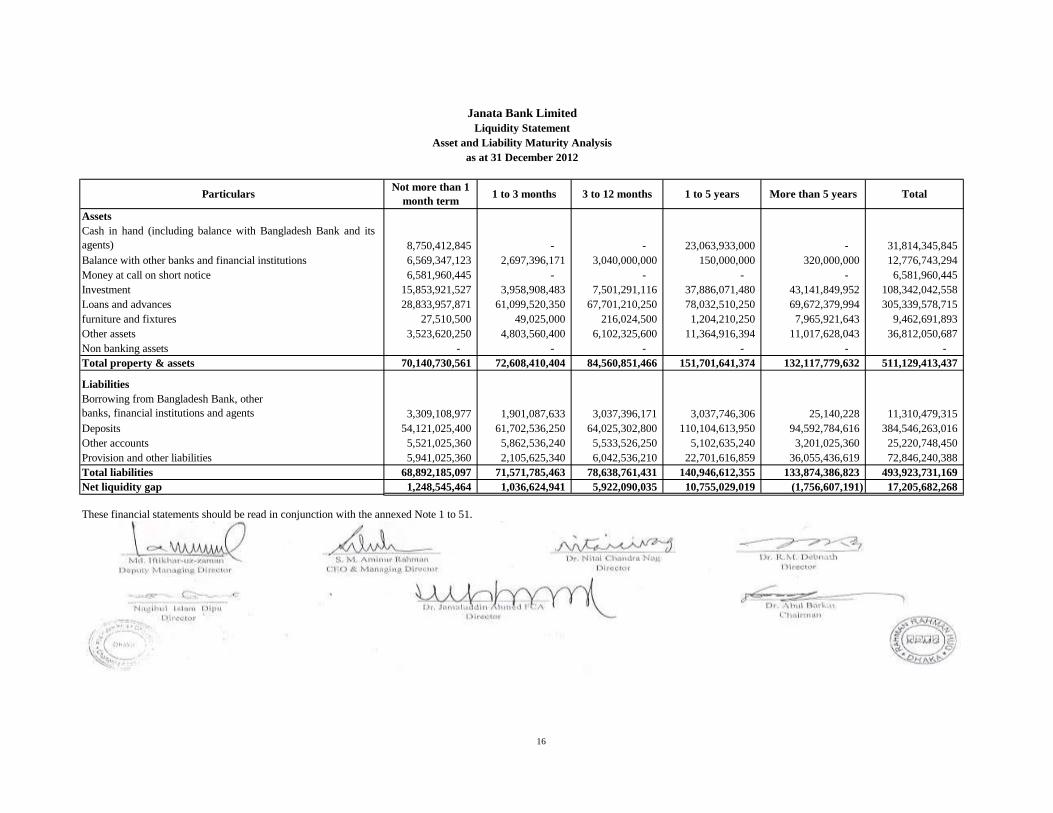
Assets
8,750,412,845 - - 23,063,933,000 - 31,814,345,845
Balance with other banks and financial institutions 6,569,347,123 2,697,396,171 3,040,000,000 150,000,000 320,000,000 12,776,743,294
Money at call on short notice 6,581,960,445 - - - - 6,581,960,445
Investment 15,853,921,527 3,958,908,483 7,501,291,116 37,886,071,480 43,141,849,952 108,342,042,558
Loans and advances 28,833,957,871 61,099,520,350 67,701,210,250 78,032,510,250 69,672,379,994 305,339,578,715
furniture and fixtures 27,510,500 49,025,000 216,024,500 1,204,210,250 7,965,921,643 9,462,691,893
Other assets 3,523,620,250 4,803,560,400 6,102,325,600 11,364,916,394 11,017,628,043 36,812,050,687
Non banking assets - - - - - -
Total property & assets 70,140,730,561 72,608,410,404 84,560,851,466 151,701,641,374 132,117,779,632 511,129,413,437
Liabilities
3,309,108,977 1,901,087,633 3,037,396,171 3,037,746,306 25,140,228 11,310,479,315
Deposits 54,121,025,400 61,702,536,250 64,025,302,800 110,104,613,950 94,592,784,616 384,546,263,016
Other accounts 5,521,025,360 5,862,536,240 5,533,526,250 5,102,635,240 3,201,025,360 25,220,748,450
Provision and other liabilities 5,941,025,360 2,105,625,340 6,042,536,210 22,701,616,859 36,055,436,619 72,846,240,388
Total liabilities 68,892,185,097 71,571,785,463 78,638,761,431 140,946,612,355 133,874,386,823 493,923,731,169
Net liquidity gap 1,248,545,464 1,036,624,941 5,922,090,035 10,755,029,019 (1,756,607,191) 17,205,682,268
These financial statements should be read in conjunction with the annexed Note 1 to 51.
Sd/- _________Sd/-_______________ _________Sd/-______________
S.M. Aminur Rahman Dr. Nitai Chandra Nag Dr. R.M. Debnath
CEO & Managing Director Director Director
Sd/- Sd/- Sd/-____________________
Dr. Abul Barkat
ChairmanDirector
_________________________
________Sd/-_____________
Md. Iftikhar-uz-zaman
Director
Deputy Managing Director
3 to 12 months1 to 3 months
Borrowing from Bangladesh Bank, other
banks, financial institutions and agents
Not more than 1
month term1 to 5 years
Cash in hand (including balance with Bangladesh Bank and its
agents)
TotalMore than 5 years
Nagibul Islam Dipu Dr. Jamaluddin Ahmed FCA
___________________
Janata Bank Limited
Liquidity Statement
Asset and Liability Maturity Analysis
as at 31 December 2012
Particulars
16
1 The bank and its activities
1.1
1.2
1.3 Subsidiaries of the bank
(i) Janata Exchange Company Srl, Italy
(ii) Janata Capital and Investment Limited, Dhaka
Janata Exchange Company Srl. Italy was incorporated on 18 January 2002 vide Ministry of Finance letter #
Ag/Awe/e¨vswKs/kv-7/wewea-12(2) 2000 dated 3 January 2001 and letter # Ag/Awe/e¨vswKs/kv-7/12(2)2000/164 dated 27 June
2001 with 100% ownership of Janata Bank Limited having authorised capital of ITL 1.00 Billion and its paid-up
capital is 600,000 EURO.
Janata Bank Limited is a state owned commercial Bank incorporated on 21 May 2007 under the Companies Act 1994
as a public limited company and governed by the Banking Companies Act 1991. Janata Bank Limited took over the
businesses, assets, liabilities, right, power, privilege and obligation of erstwhile Janata Bank through a vendor
agreement signed between the People's Republic of Bangladesh and Janata Bank Limited on 15 November 2007 with a
retrospective effect from 1 July 2007. The bank has 888 branches including four overseas branches and two 100%
owned subsidiaries named as Janata Exchange Company Srl, Italy and Janata Capital and Investment Limited, Dhaka.
Bangladesh Bank issued license on 31 May 2007 in the name of Janata Bank Limited to conduct the banking business.
Nature of business
The Bank provides all kinds of commercial banking services to its customers including accepting deposits, extending
loans & advances, discounting & purchasing bills, remittance, money transfer, foreign exchange transaction, guarantee,
commitments etc. The principal activities of its subsidiary Janata Exchange Company Srl. Italy (JEC) is to carry on the
remittance of hard-earned foreign currency to Bangladesh. Another subsidiary company Janata Capital and Investment
Limited, Dhaka is to act as issue manager, share underwriter and portfolio manager. The Bank has opened an NRB
branch at Motijheel, Dhaka to render exclusive service to non resident Bangladeshis.
Janata Bank Limited has two 100% owned subsidiaries named Janata Exchange Company Srl. Italy and Janata Capital
and Investment Limited, Dhaka, Bangladesh.
Janata Capital and Investment Limited Dhaka incorporated on 13 April 2010 vide incorporation certificate no. C-
83898/10 issued by the Registrar of Joint Stock Companies and Firms (RJSC) with 100% ownership of Janata Bank
Limited having Taka 5,000 million authorised capital and its paid-up capital is Taka 2,000 million. The company starts
its operations from 26 September 2010 and its main functions are issue management, underwriting and portfolio
management.
Janata Bank Limited
Notes to the consolidated and separate financial statements
as at and for the year ended 31 December 2012
Reporting entity
Apart from Rome Branch, JEC, Italy has another Branch in Milan, Italy, which was established vide MOF‟s approval
Letter # Ag/Awe/e¨vswKs bxt/kv-1 /12 /(2)/200/ 3/352 dated 24 November 2002.
17
2 Basis of preparation and significant accounting policies
2.1 Basis of preparation
2.2 Statement of Compliance
i)
ii)
iii)
The consolidated financial statements of the Group and the financial statements of the Bank as at and for the year
ended 31 December 2012 have been prepared under the historical cost convention except investments and in
accordance with the "First Schedule" (section 38) of the Banking Companies Act 1991, as amended by Bangladesh
Bank (the Central Bank of Bangladesh) through BRPD Circular No. 14 dated 25 June 2003, other Bangladesh Bank
Circulars, Bangladesh Financial Reporting Standards (BFRSs), the Companies Act 1994, the Securities and Exchange
Rules 1987 and other laws and rules applicable in Bangladesh. In case any requirement of provisions and circulars
issued by Bangladesh Bank differs with those of other regulatory authorities, the provisions and circulars issued by
Bangladesh Bank shall prevail.
Investments in shares and securities
Considering Note 2.1, the Group and the Bank has departed from those contradictory requirements of BFRSs in order
to comply with the rules and regulations of Bangladesh Bank which are disclosed below:
Bangladesh Bank:
As per BRPD Circular no. 14 dated 25 June 2003 investments in quoted shares and unquoted shares are revalued at the
year end at market price and as per book value of last audited balance sheet respectively. Provision should be made for
any loss arising from diminution in value of investments.
Bangladesh Bank:
According to DOS Circular no. 5 dated 26 May 2008 and subsequent clarification in DOS Circular no. 5 dated 28
January 2009, loss on revaluation of Government securities (T-bill / T-bond) which are categorised as held for trading
should be charged through Profit and Loss Account, but any gain on such revaluation should be recorded under
Revaluation Reserve Account. However, at the year end if there is any revaluation gain for any particular held for
trading T-bills/T-bonds, such gain can be used to the extent of any revaluation loss for that particular held for trading T-
bills/T-bonds.
T-bills designated as held to maturity are measured at amortised cost method but interest income / gain should be
recognised through reserve.
BFRS:
As per requirements of BAS 39 'Financial Instruments: Recognition and Measurement' investments in shares and
securities generally falls either under "at fair value through Profit and Loss Account" or under "available for sale"
where any change in the fair value at the year end is taken to Profit and Loss Account or Revaluation Reserve Account
respectively.
BFRS:
As per requirement of BAS 39, T-bills and T-bonds fall under the category of “held for trading” and “held to maturity”
where any change in the fair value of held for trading is recognised in Profit and Loss Account, and amortised cost
method is applicable for held to maturity using an effective interest rate.
Revaluation gain/loss on Government securities
Provision on loans and advances
BFRS:
As per BAS 39 an entity should start the impairment assessment by considering whether objective evidence of
impairment exists for financial assets that are individually significant. For financial assets which are not individually
significant, the assessment can be performed on an individual or collective (portfolio) basis.
18
iv) Other comprehensive income
v) Financial instruments - presentation and disclosure
vi) REPO transactions
vii) Financial guarantees
BFRS:
When an entity sells a financial asset and simultaneously enters into an agreement to repurchase the asset (or a similar
asset) at a fixed price on a future date (REPO or stock lending), the arrangement is accounted for as a deposit, and the
underlying asset continues to be recognised in the entity‟s financial statements. This transaction will be treated as loan
and the difference between selling price and repurchase price will be treated as interest expense.
Bangladesh Bank:
Bangladesh Bank has issued templates for financial statements which will strictly be followed by all banks. The
templates of financial statements issued by Bangladesh Bank do not include Other Comprehensive Income; and the
elements of Other Comprehensive Income are also not allowed to be included in a Single Comprehensive Income (OCI)
Statement. As such the company does not prepare the Other Comprehensive Income statement. However elements of
OCI, if any, are shown in the statement of changes in equity.
Bangladesh Bank:
As per BRPD Circular no. 14 dated 23 September 2012 a general provision at 0.25% to 5% under different categories
of unclassified loans (good/standard loans) has to be maintained regardless of objective evidence of impairment. Also
provision for sub-standard loan, doubtful loans and bad losses has to be provided at 20%, 50% and 100% respectively
for loans and advances whereby the classification of loans and advances depend on the duration of overdue period in
months. Furthermore, a general provision at the rate of 1% should be provided for all off-balance sheet exposures.
Provision will be on the total exposure and amount of cash margin or value of eligible collateral will not be deducted
while computing off balance sheet exposure. Such provision policies are not specifically in line with those prescribed
by BAS 39.
BFRS:
As per BAS 39 financial guarantees are contracts that require an entity to make specified payments to reimburse the
holder for a loss it incurs because a specified debtor fails to make payment when due in accordance with the terms of a
debt instrument. Financial guarantee liabilities are recognised initially at their fair value, and the initial fair value is
amortised over the life of the financial guarantee. The financial guarantee liability is subsequently carried at the higher
of this amortised amount and the present value of any expected payment when a payment under the guarantee has
become probable. Financial guarantees are included within other liabilities.
Bangladesh Bank:
As per BRPD 14, financial guarantees such as L/C, L/G will be treated as off balance sheet items. No liability is
recognised for the guarantee except the cash margin.
Bangladesh Bank:
As per BRPD guidelines, when a bank sells a financial asset and simultaneously enters into an agreement to repurchase
the asset (or a similar asset) at a fixed price on a future date (REPO or stock lending), the arrangement is accounted for
as a normal sales transactions and the financial assets are derecognised in the seller‟s book and recognised in the
buyer‟s book.
In several cases Bangladesh Bank guidelines categorise, recognise, measure and present financial instruments
differently from those prescribed in BAS 39. As such some disclosure and presentation requirements of BFRS 7
'Financial Instruments: Disclosures' and BAS 32 'Financial Instruments: Presentation' cannot be made in the
accounts.
BFRS:
As per BAS 1 'Presentation of Financial Statements', Other Comprehensive Income is a component of financial
statements or the elements of Other Comprehensive Income are to be included in a Single Comprehensive Income
(OCI) Statement.
19
viii) Cash and cash equivalents
ix) Non banking assets
x) Cash flow statement
xi) Balance with Bangladesh Bank (CRR):
xii) Off balance sheet items
xiii) Disclosure of appropriation of profit
Bangladesh Bank:
As per BRPD 14, cash flow is a mixture of direct and indirect method.
BFRS:
Balance with Bangladesh Bank should be treated as other assets as it is not available for use in day to day operations as
per BAS 7.
BFRS:
Cash flow statement can be prepared either in direct method or in indirect method. The presentation is selected to
present these cash flows in a manner that is most appropriate for the business or industry. The method selected is
applied consistently.
Bangladesh Bank:
As per BRPD 14, an appropriation of profit should be disclosed in the face of the Profit and Loss Account.
Bangladesh Bank:
As per BRPD 14, off balance sheet items e.g. L/C, L/G must be disclosed separately in the face of the balance sheet.
BFRS:
There is no concept of off balance sheet items in any BFRS; hence there is no requirement of disclosure of off balance
sheet items.
BFRS:
Cash and cash equivalents items should be reported as cash item as per BAS 7 'Statement of Cash Flows'.
Bangladesh Bank:
Balance with Bangladesh Bank is treated as cash and cash equivalents.
Bangladesh Bank:
Some cash and cash equivalent items such as „money at call and on short notice‟, Treasury bills, Prize bond are not
shown as cash and cash equivalent. Money at call and on short notice is shown as face item in balance sheet, and
Treasury bills, Prize bonds are shown in Investment.
BFRS:
No indication of non banking assets is found in any BFRSs.
BFRS:
There is no requirement to show appropriation of profit in the face of the statement of comprehensive income.
Bangladesh Bank:
As per BRPD 14, there must exist a face item named Non-banking asset.
20
xiv) Loans and advance net of provision
2.3 Basis of measurement
-
-
-
-
2.4
2.5 Functional and presentation currency
Investment in shares of listed companies
[Also refer to Note-2.37 Compliance of Bangladesh Accounting Standards (BASs) and Bangladesh Financial
Reporting Standards (BFRSs)]
Government Treasury Bills and Bonds designated as 'Held to Maturity (HTM)' and Re-measured
Government Treasury Bond at present value using amortisation concept
Basis of consolidation
Government Treasury Bills and Bonds designated as 'Held for Trading (HFT)' at present value using marking
to market concept with gain crediting to revaluation reserve.
BFRS:
Loans and advances should be presented net of provisions.
Bangladesh Bank:
As per BRPD 14, provision on loans and advances are presented separately as liability and cannot be netted off against
loans and advances.
The financial statements of the Bank have been prepared on the historical cost basis except for the following material
items:
The consolidated financial statements include the financial statements of Janata Bank Limited and its two subsidiaries
named Janata Capital and Investment Limited, Dhaka and Janata Exchange Company Srl. Italy made up to the end of
the financial year. The Consolidated financial statements have been prepared in accordance with Bangladesh
Accounting Standards BAS-27 'Consolidated and Separate Financial Statements' . These Consolidated financial
statements are prepared to a common financial year ended 31 December 2012.
Zero Coupon Bond at present value using amortisation concept.
Transactions eliminated on consolidation
Subsidiaries
Subsidiaries are entities controlled by the group. The financial statements of subsidiaries are included in the
Consolidated Financial Statements from the date that control commences until the date the control ceases.
Intra-group balances and transactions and any unrealised income and expenses arising from intra-group transactions are
eliminated in preparing the Consolidated Financial Statements. Unrealised gains arising from transactions with equity
accounted investees are eliminated against the investment to the extent of the group's interest in the investee. Unrealised
losses are eliminated in the same way as unrealised gains, but only to the extent there is no evidence of impairment.
These consolidated financial statements of the Group and the financial statements of the Bank are presented in Taka
which is the Bank's functional currency. Except as otherwise indicated, financial information have been rounded off to
the nearest Taka.
21
2.6 Use of estimates and judgments
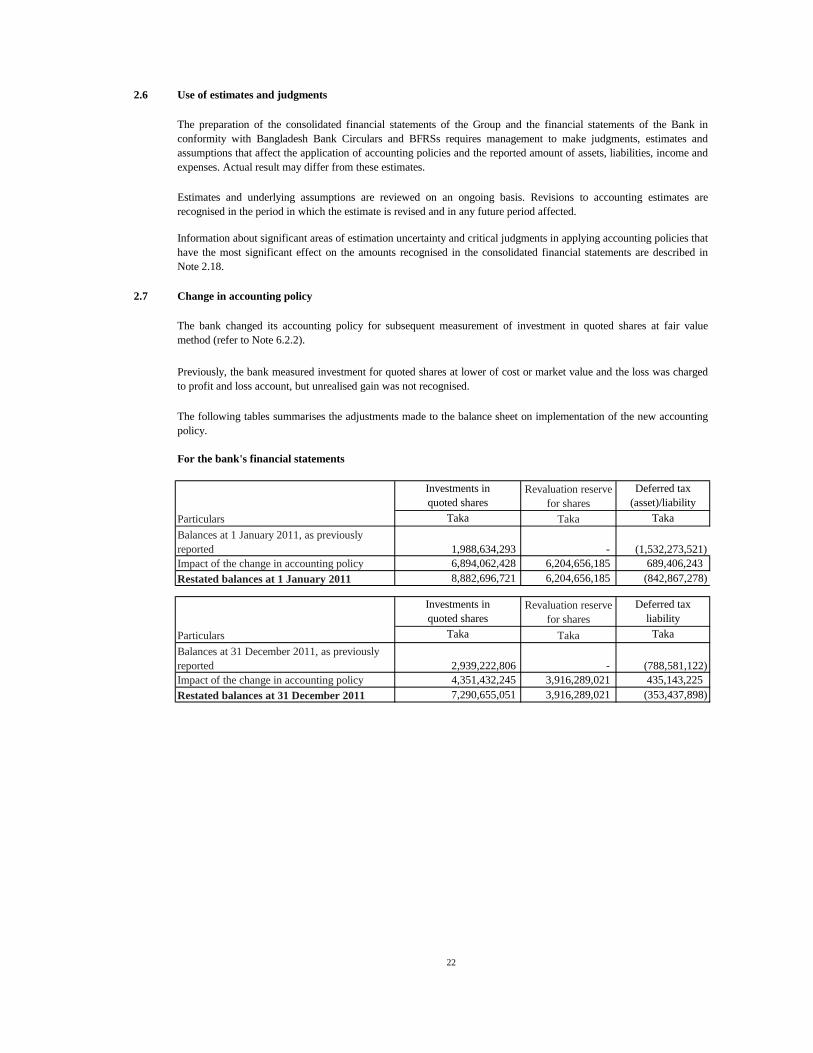
2.7 Change in accounting policy
For the bank's financial statements
Deferred tax
(asset)/liability
Taka
Impact of the change in accounting policy 689,406,243
Restated balances at 1 January 2011 (842,867,278)
Deferred tax
liability
Taka
Impact of the change in accounting policy 435,143,225
Restated balances at 31 December 2011 (353,437,898)
Taka TakaParticulars
Particulars Taka Taka
1,988,634,293
Estimates and underlying assumptions are reviewed on an ongoing basis. Revisions to accounting estimates are
recognised in the period in which the estimate is revised and in any future period affected.
Information about significant areas of estimation uncertainty and critical judgments in applying accounting policies that
have the most significant effect on the amounts recognised in the consolidated financial statements are described in
Note 2.18.
The bank changed its accounting policy for subsequent measurement of investment in quoted shares at fair value
method (refer to Note 6.2.2).
2,939,222,806 -
6,204,656,185
The following tables summarises the adjustments made to the balance sheet on implementation of the new accounting
policy.
Investments in
quoted shares
Revaluation reserve
for shares
-
6,204,656,185
Revaluation reserve
for shares
Previously, the bank measured investment for quoted shares at lower of cost or market value and the loss was charged
to profit and loss account, but unrealised gain was not recognised.
The preparation of the consolidated financial statements of the Group and the financial statements of the Bank in
conformity with Bangladesh Bank Circulars and BFRSs requires management to make judgments, estimates and
assumptions that affect the application of accounting policies and the reported amount of assets, liabilities, income and
expenses. Actual result may differ from these estimates.
(1,532,273,521)
Balances at 1 January 2011, as previously
reported
(788,581,122)
Investments in
quoted shares
Balances at 31 December 2011, as previously
reported
6,894,062,428
8,882,696,721
4,351,432,245 3,916,289,021
7,290,655,051 3,916,289,021
22
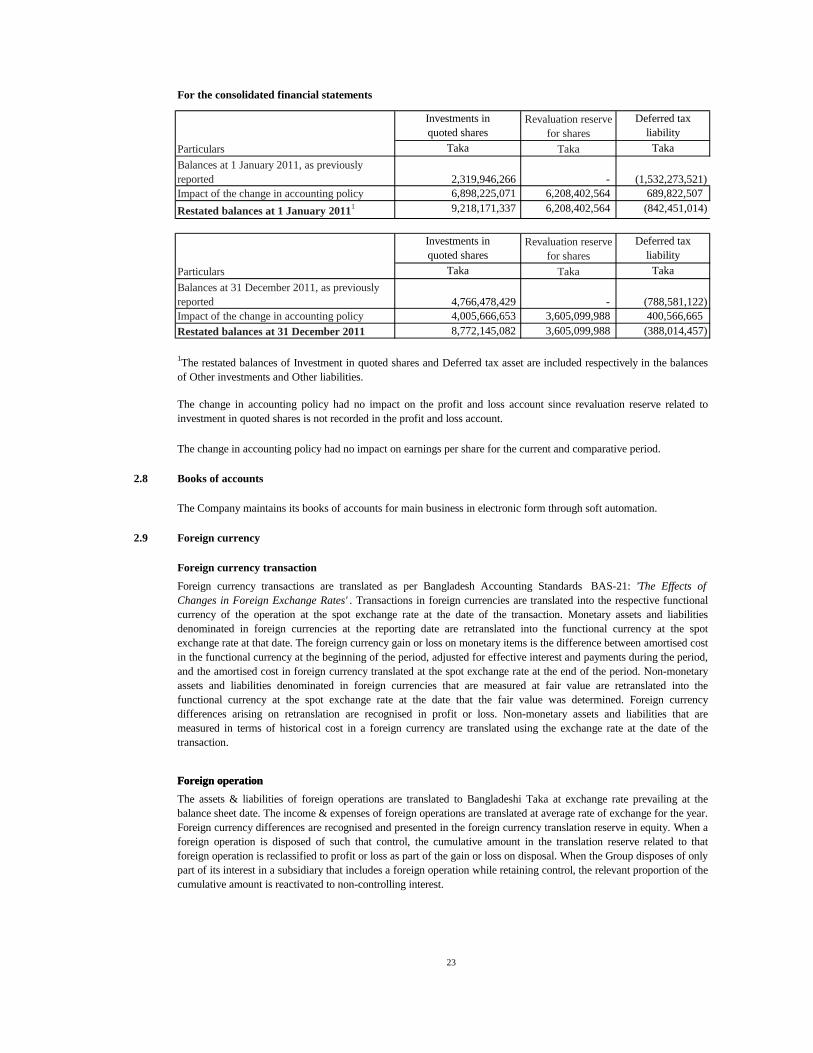
For the consolidated financial statements
Deferred tax
liability
Taka
Impact of the change in accounting policy 689,822,507
Restated balances at 1 January 20111 (842,451,014)
Deferred tax
liability
Taka
Impact of the change in accounting policy 400,566,665
Restated balances at 31 December 2011 (388,014,457)
2.8
2.9 Foreign currency
Foreign currency transaction
1The restated balances of Investment in quoted shares and Deferred tax asset are included respectively in the balances
of Other investments and Other liabilities.
Particulars
Investments in
quoted shares
The Company maintains its books of accounts for main business in electronic form through soft automation.
Foreign currency transactions are translated as per Bangladesh Accounting Standards BAS-21: 'The Effects of
Changes in Foreign Exchange Rates' . Transactions in foreign currencies are translated into the respective functional
currency of the operation at the spot exchange rate at the date of the transaction. Monetary assets and liabilities
denominated in foreign currencies at the reporting date are retranslated into the functional currency at the spot
exchange rate at that date. The foreign currency gain or loss on monetary items is the difference between amortised cost
in the functional currency at the beginning of the period, adjusted for effective interest and payments during the period,
and the amortised cost in foreign currency translated at the spot exchange rate at the end of the period. Non-monetary
assets and liabilities denominated in foreign currencies that are measured at fair value are retranslated into the
functional currency at the spot exchange rate at the date that the fair value was determined. Foreign currency
differences arising on retranslation are recognised in profit or loss. Non-monetary assets and liabilities that are
measured in terms of historical cost in a foreign currency are translated using the exchange rate at the date of the
transaction.
Foreign operation
The change in accounting policy had no impact on the profit and loss account since revaluation reserve related to
investment in quoted shares is not recorded in the profit and loss account.
Taka
Balances at 31 December 2011, as previously
reported
Foreign operation
Books of accounts
The assets & liabilities of foreign operations are translated to Bangladeshi Taka at exchange rate prevailing at the
balance sheet date. The income & expenses of foreign operations are translated at average rate of exchange for the year.
Foreign currency differences are recognised and presented in the foreign currency translation reserve in equity. When a
foreign operation is disposed of such that control, the cumulative amount in the translation reserve related to that
foreign operation is reclassified to profit or loss as part of the gain or loss on disposal. When the Group disposes of only
part of its interest in a subsidiary that includes a foreign operation while retaining control, the relevant proportion of the
cumulative amount is reactivated to non-controlling interest.
The change in accounting policy had no impact on earnings per share for the current and comparative period.
-
Particulars Taka
Revaluation reserve
for shares
Balances at 1 January 2011, as previously
reported 2,319,946,266 (1,532,273,521)
6,898,225,071 6,208,402,564
9,218,171,337 6,208,402,564
(788,581,122)
Taka Taka
-
4,005,666,653 3,605,099,988
8,772,145,082 3,605,099,988
Investments in
quoted shares
Revaluation reserve
for shares
4,766,478,429
23
2.10 Reporting period
2.11 Cash Flow Statement
2.12 Statement of changes in equity
2.13 Liquidity statement (Asset and Liability Maturity Analysis)
a)
b) Investments on the basis of their residual maturity term;
c) Loans and advances on the basis of their repayment/maturity schedule;
d) Fixed assets on the basis of their useful lives;
e) Other assets on the basis of their adjustment;
f) Borrowings from other banks and financial institutions, as per their maturity/repayment term;
g) Deposits and other accounts on the basis of their maturity term and behavioral past trend;
h) Other long term liability on the basis of their maturity term;
i) Provisions and other liabilities on the basis of their settlement;
2.14 Significant accounting policies
2.15 Cash and cash equivalents
2.16 Investments
The statement of changes in equity reflects information about increase or decrease in net assets or wealth. Statement of
changes in equity has been prepared in accordance with Bangladesh Accounting Standards BAS-1: 'Presentation of
Financial Statements' and relevant guidelines of Bangladesh Bank.
The accounting period of the bank has been determined to be from 1 January to 31 December each year and is followed
consistently.
The liquidity statement has been prepared in accordance with remaining maturity grouping of Assets and Liabilities as
of the close of the year as per following bases;
Balance with other banks and financial institutions, money at call and on short notice etc. on the basis of
their maturity term;
The accounting policy set out below have been applied consistently to all periods presented in this consolidated
financial statements and those of the bank and have been applied consistently by the group entities excepts as explain in
Note 2.2.
Cash and cash equivalents include notes and coins on hand, unrestricted balances held with Bangladesh Bank and its
agent bank, balance with other banks and financial institutions, money at call on short notice and prize bond.
All investments are initially recognised at cost, including acquisition charges associated with the investment. Premiums
are amortised and discount accredited, using the effective or historical yield method. Accounting treatment of
government treasury bills and bonds (categorised as HFT or/and HTM) is made following Bangladesh Bank DOS
circular letter no. 5, dated 26 May 2008 and as amended on 28 January 2009.
Cash Flow Statements has been prepared in accordance with Bangladesh Accounting Standards BAS-7: ' Statement of
Cash Flows' and under the guideline of Bangladesh Bank BRPD Circular No.14 dated 25 June 2003 issued by the
Banking Regulation & Policy Department of Bangladesh Bank. The Statement shows the structure of changes in cash
and cash equivalents during the financial year.
24
(i) Held to Maturity (HTM)
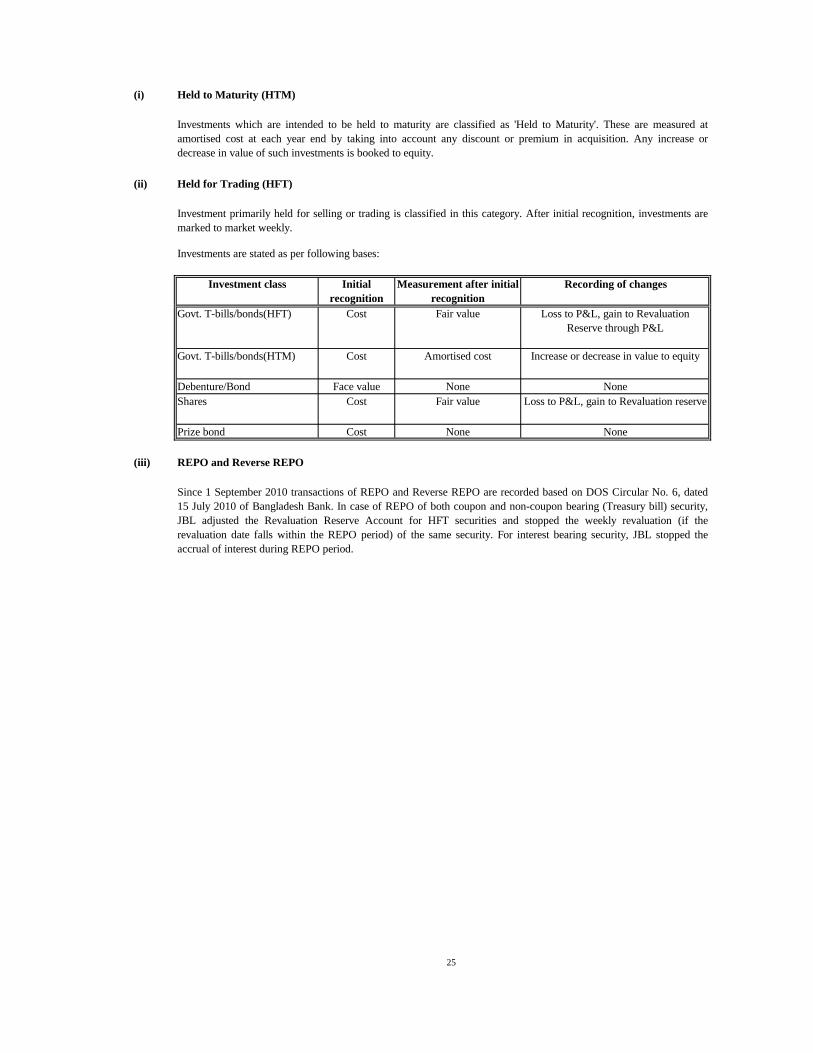
(ii) Held for Trading (HFT)
Investments are stated as per following bases:
(iii) REPO and Reverse REPO
Loss to P&L, gain to Revaluation reserve
None
Measurement after initial
recognition
Recording of changes
Investments which are intended to be held to maturity are classified as 'Held to Maturity'. These are measured at
amortised cost at each year end by taking into account any discount or premium in acquisition. Any increase or
decrease in value of such investments is booked to equity.
Cost Loss to P&L, gain to Revaluation
Reserve through P&L
Fair value
Amortised cost Increase or decrease in value to equity
NoneFace value
Cost
Investment primarily held for selling or trading is classified in this category. After initial recognition, investments are
marked to market weekly.
Investment class Initial
recognition
Govt. T-bills/bonds(HFT)
Since 1 September 2010 transactions of REPO and Reverse REPO are recorded based on DOS Circular No. 6, dated
15 July 2010 of Bangladesh Bank. In case of REPO of both coupon and non-coupon bearing (Treasury bill) security,
JBL adjusted the Revaluation Reserve Account for HFT securities and stopped the weekly revaluation (if the
revaluation date falls within the REPO period) of the same security. For interest bearing security, JBL stopped the
accrual of interest during REPO period.
Prize bond Cost None
Govt. T-bills/bonds(HTM)
None
Fair valueShares
Debenture/Bond
Cost
25
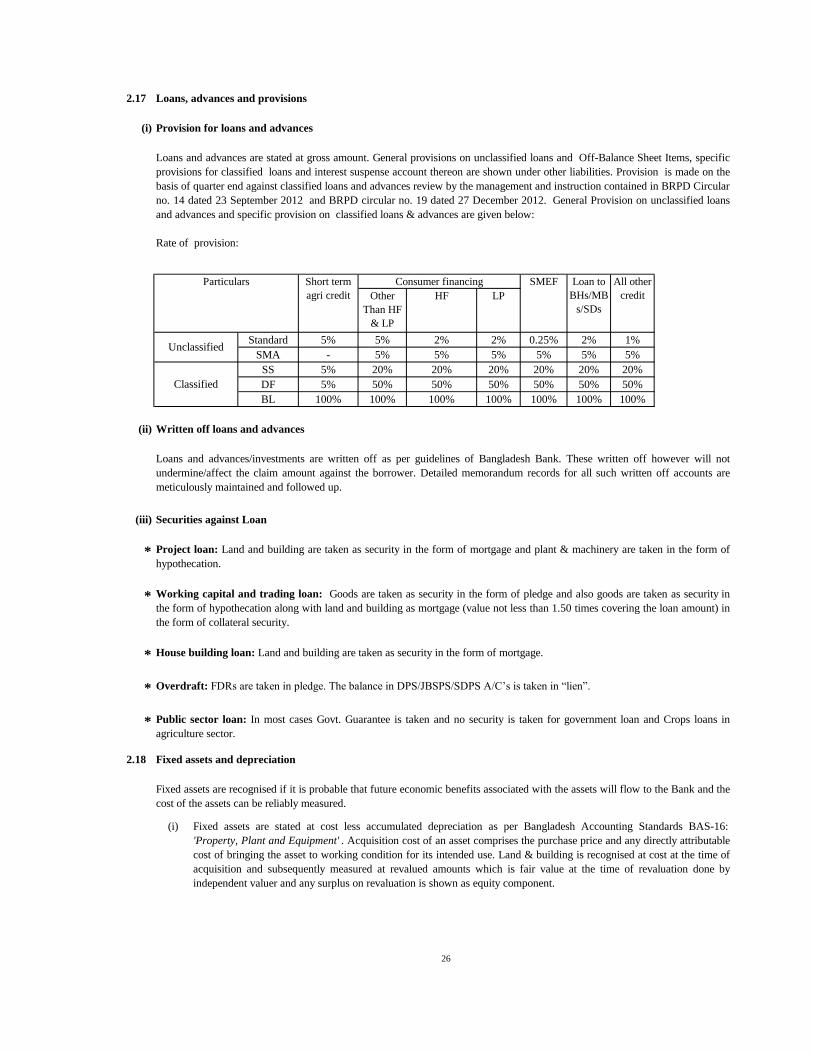
2.17 Loans, advances and provisions
(i)
Other
Than HF
& LP
HF LP
5% 5% 2% 2% 0.25% 2% 1%
- 5% 5% 5% 5% 5% 5%
5% 20% 20% 20% 20% 20% 20%
5% 50% 50% 50% 50% 50% 50%
100% 100% 100% 100% 100% 100% 100%
(ii)
(iii) Securities against Loan
*
*
*
* Overdraft: FDRs are taken in pledge. The balance in DPS/JBSPS/SDPS A/C’s is taken in “lien”.
*
2.18 Fixed assets and depreciation
(i)
Provision for loans and advances
Loans and advances are stated at gross amount. General provisions on unclassified loans and Off-Balance Sheet Items, specific
provisions for classified loans and interest suspense account thereon are shown under other liabilities. Provision is made on the
basis of quarter end against classified loans and advances review by the management and instruction contained in BRPD Circular
no. 14 dated 23 September 2012 and BRPD circular no. 19 dated 27 December 2012. General Provision on unclassified loans
and advances and specific provision on classified loans & advances are given below:
Rate of provision:
Short term
agri credit
SMEF Loan to
BHs/MB
s/SDs
All other
credit
Particulars Consumer financing
Unclassified
Classified
Standard
SMA
Written off loans and advances
Loans and advances/investments are written off as per guidelines of Bangladesh Bank. These written off however will not
undermine/affect the claim amount against the borrower. Detailed memorandum records for all such written off accounts are
meticulously maintained and followed up.
Project loan: Land and building are taken as security in the form of mortgage and plant & machinery are taken in the form of
hypothecation.
Working capital and trading loan: Goods are taken as security in the form of pledge and also goods are taken as security in
the form of hypothecation along with land and building as mortgage (value not less than 1.50 times covering the loan amount) in
the form of collateral security.
House building loan: Land and building are taken as security in the form of mortgage.
Public sector loan: In most cases Govt. Guarantee is taken and no security is taken for government loan and Crops loans in
agriculture sector.
Fixed assets are recognised if it is probable that future economic benefits associated with the assets will flow to the Bank and the
cost of the assets can be reliably measured.
Fixed assets are stated at cost less accumulated depreciation as per Bangladesh Accounting Standards BAS-16:
'Property, Plant and Equipment' . Acquisition cost of an asset comprises the purchase price and any directly attributable
cost of bringing the asset to working condition for its intended use. Land & building is recognised at cost at the time of
acquisition and subsequently measured at revalued amounts which is fair value at the time of revaluation done by
independent valuer and any surplus on revaluation is shown as equity component.
SS
DF
BL
26
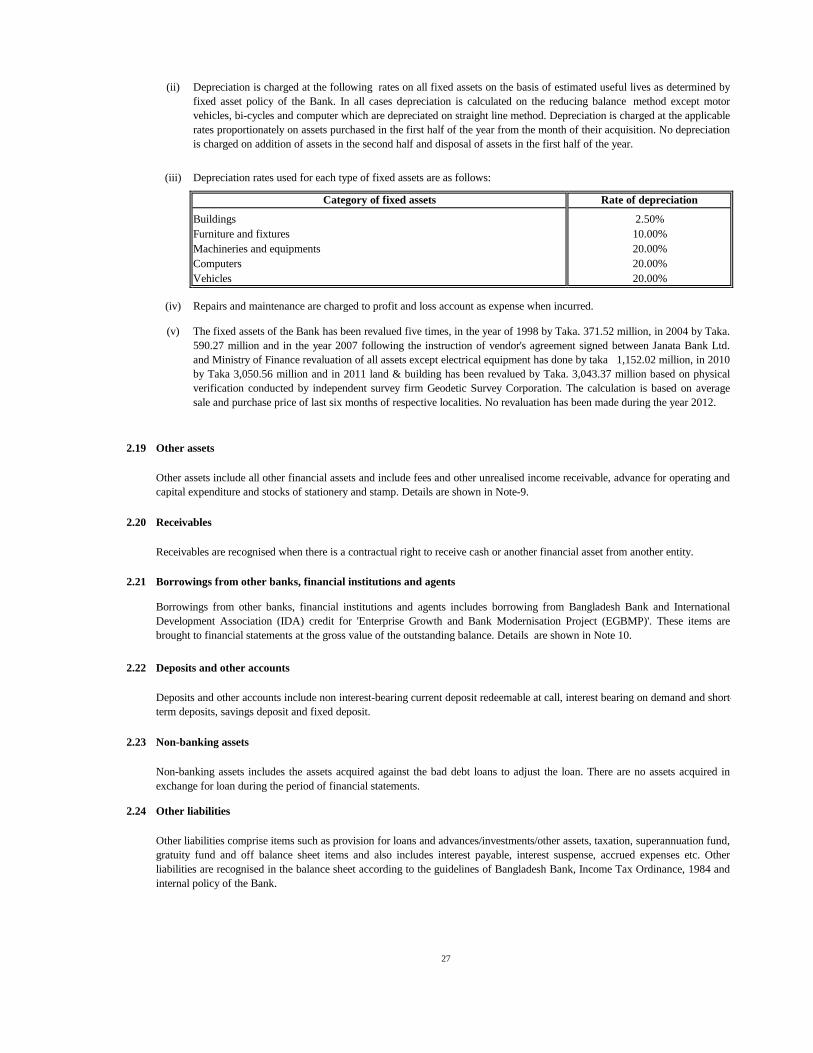
(ii)
(iii) Depreciation rates used for each type of fixed assets are as follows:
Buildings
Furniture and fixtures
Machineries and equipments
Computers
Vehicles
(iv) Repairs and maintenance are charged to profit and loss account as expense when incurred.
(v)
2.19
2.20
2.21 Borrowings from other banks, financial institutions and agents
2.22 Deposits and other accounts
2.23
2.24 Other liabilities
Depreciation is charged at the following rates on all fixed assets on the basis of estimated useful lives as determined by
fixed asset policy of the Bank. In all cases depreciation is calculated on the reducing balance method except motor
vehicles, bi-cycles and computer which are depreciated on straight line method. Depreciation is charged at the applicable
rates proportionately on assets purchased in the first half of the year from the month of their acquisition. No depreciation
is charged on addition of assets in the second half and disposal of assets in the first half of the year.
20.00%
The fixed assets of the Bank has been revalued five times, in the year of 1998 by Taka. 371.52 million, in 2004 by Taka.
590.27 million and in the year 2007 following the instruction of vendor's agreement signed between Janata Bank Ltd.
and Ministry of Finance revaluation of all assets except electrical equipment has done by taka 1,152.02 million, in 2010
by Taka 3,050.56 million and in 2011 land & building has been revalued by Taka. 3,043.37 million based on physical
verification conducted by independent survey firm Geodetic Survey Corporation. The calculation is based on average
sale and purchase price of last six months of respective localities. No revaluation has been made during the year 2012.
Other assets
Other assets include all other financial assets and include fees and other unrealised income receivable, advance for operating and
capital expenditure and stocks of stationery and stamp. Details are shown in Note-9.
Category of fixed assets Rate of depreciation
2.50%
10.00%
Receivables
Receivables are recognised when there is a contractual right to receive cash or another financial asset from another entity.
Borrowings from other banks, financial institutions and agents includes borrowing from Bangladesh Bank and International
Development Association (IDA) credit for 'Enterprise Growth and Bank Modernisation Project (EGBMP)'. These items are
brought to financial statements at the gross value of the outstanding balance. Details are shown in Note 10.
Deposits and other accounts include non interest-bearing current deposit redeemable at call, interest bearing on demand and short-
term deposits, savings deposit and fixed deposit.
Non-banking assets
20.00%
20.00%
Non-banking assets includes the assets acquired against the bad debt loans to adjust the loan. There are no assets acquired in
exchange for loan during the period of financial statements.
Other liabilities comprise items such as provision for loans and advances/investments/other assets, taxation, superannuation fund,
gratuity fund and off balance sheet items and also includes interest payable, interest suspense, accrued expenses etc. Other
liabilities are recognised in the balance sheet according to the guidelines of Bangladesh Bank, Income Tax Ordinance, 1984 and
internal policy of the Bank.
27
2.25
2.26
(i)
(ii)
2.27 Provision for taxation
(i) Current year tax
(ii) Deferred tax
●
●
●
Statutory reserve
As per the Banking Companies Act 1991 (Section-24) it is required for the bank to transfer 20% of its current year's profit before
tax to reserve until such reserve equals to its paid up capital. Since the Bank has not earned any profit during the year ended 31
December 2012, no such transfer has been made.
Revaluation reserve
Assets Revaluation Reserve
When an asset's carrying amount is increased as a result of a revaluation, the increase amount should be credited directly to
equity under the heading of revaluation surplus/ reserve as per Bangladesh Accounting Standards BAS-16: 'Property, Plant and
Equipment' . The tax effects on revaluation gain are measured and recognised in the financial statements as per Bangladesh
Accounting Standards BAS-12: 'Income Taxes'.
Revaluation Reserve for HTM & HFT
All HTM securities are amortised at the year end and any increase or decrease of such investment is booked to equity. In case of
HFT revaluation, decrease in the present value is recognised in the profit and loss account and any increase is booked to
Revaluation Reserve Account through Profit and Loss Account as per Bangladesh Bank DOS circular no. 5, dated 28 January
2009.
Provision for current income tax has been made @ 42.5% as prescribed in the Finance Act, 2012 of the profit made by the Bank
considering major taxable allowances and disallowances.
Deferred Tax is calculated on the taxable/deductible temporary differences between tax base and carrying value of assets and
liabilities as required by Bangladesh Accounting Standards BAS-12: 'Income Taxes'. Deferred tax is not recognised for the
following temporary differences:
temporary differences on the initial recognition of assets or liabilities in a transaction that is not a business combination
and that affects neither accounting nor taxable profit or loss;
Deferred tax is measured at the tax rates that are expected to be applied to the temporary differences when they reverse, based on
the laws that have been enacted or substantively enacted by the reporting date.
temporary differences related to investments in subsidiaries to the extent that it is probable that they will not reverse in
the foreseeable future; and
temporary differences arising on the initial recognition of goodwill.
Deferred tax assets and liabilities are offset if there is a legally enforceable right to offset current tax liabilities against current tax
assets, and they relate to income taxes levied by the same tax authority on the same taxable entity, or on different tax entities, but
they intend to settle current tax liabilities and assets on a net basis or their tax assets and liabilities will be realised
simultaneously.
A deferred tax asset is recognised for unused tax losses, tax credits and deductible temporary differences to the extent that it is
probable that future taxable profits will be available against which they can be utilised. Deferred tax assets are reviewed at each
reporting date and are reduced to the extent that it is no longer probable that the related tax benefit will be realised.
Deferred tax relating to unrealised surplus on revaluation of held to maturity (HTM) securities and land and buildings are
recognised directly in revaluation reserve as a part of equity and is subsequently recognised in profit and loss account on maturity
of the security and disposal of land and buildings.
28
2.28
2.28.1
(a) Contributory Provident Fund (CPF) scheme
1. Employees’ contribution 10%
2. Bank’s contribution 10%
3. This fund is operated by a Board comprising twelve (12) trustees.
4
(b)
i) Superannuation fund
ii) General Provident Fund (GPF)
iii)
2.28.2 Other employee benefits
(a) Leave encashment
(b) Death relief grant scheme
(c) Benevolent Fund
Employee Benefits
Retirement Benefits
The bank operates two alternative retirement benefit schemes for its permanent employees, elements of which are as follows:
Gratuity: Employees enjoying contributory provident fund facilities are entitled gratuity for 2 months last basic pay
drawn for each completed year of service subject to completion of minimum 10 years of service. The scheme is operated
on cash basis.
General pension fund scheme
The Bank operates Pension Scheme. The Bank was paying 40% of basic salary of each employee in each month w.e.f.
2004 to 30 June 2009 to the Superannuation Fund for payment of pension to the retiring employees. The paying rate has
been reduced to 25% of basic salary of each employee in each month from 1 July 2009. Again the rate of contribution to
Superannuation Fund has been increased to 40% with effect from 1 October 2012.
Employees opted for pensions are also contributing 10%-30% as per their desire to GPF which is also operated by the
same Trustee Board as CPF. The Bank does not contribute any amount against these employees to GPF.
Pension and Gratuity benefit
Pension and Gratuity benefit payable as at 31 December 2012 calculated by the management has been provided in the
books of accounts.
The Officer/Staff who has opted for Pension and General Provident Fund, will be entitled to leave encashment facilities upto
twelve months at the time of retirement as per letter No. MF/FD/Reg-2/leave–16/84/9 dated 21 January 1985 of Finance
Division, Ministry of Finance, Govt. of Bangladesh. But if a staff (not officer) has enjoyed /will enjoy leave encashment facilities
before retirement, he will be provided with the rest amount after deduction of the amount enjoyed earlier, as per letter No. MF/B
& 1/Banking/2/1/80/101 dated 31 May 1980 of previous Banking & Investment Division, Ministry of Finance, and Government
of Bangladesh. The leave encashment benefit is paid to the incumbent debiting 'Expenditure A/C Leave Encashment Code No.-
1217'. Therefore, No fund is created for this scheme.
The Bank operates a death relief scheme since 1 January 1991, which replaced the previous group insurance scheme. The
scheme is applicable to all employees of the bank and payments out of this fund are made to the successors of the employees on
their death as per rate prescribed in the scheme.
Benevolent fund was initiated in 1986 and is funded by the monthly subscription of executives/officer/staff, sale proceeds of old
news papers, income from investment and grant from Bank’s operating profit. Expenditures from these funds are scholarship,
award to the children of employee for securing good result in the public examination and university levels, marriage assistance
and contribution to family members when any employee expires.
29
2.29 Provision for Nostro Accounts
2.30 Provision for Off-Balance Sheet Items
2.31
A contingent liability is -
*
* the amount of the obligation cannot be measured with sufficient reliability.
2.32 Revenue recognition
(i) Interest income
(ii) Fees and commission income
According to the guideline of Foreign Exchange Policy Department of Bangladesh Bank, Circular No. FEOD (FEMO)/01/2005-
677 dated 13 September 2005, Bank has made adequate provision this year regarding the un-reconciled debit balance as at
Balance Sheet date.
In compliance with Bangladesh Bank guidelines Off-Balance Sheet items have been disclosed under contingent liabilities. As per
BRPD Circular No.10; dated: 18 September 2007, the bank is required to maintain provision @ 1% against Off-Balance Sheet
items.
Contingent liabilities and Contingent assets
Any possible obligation that arises form the past events and the existence of which will be confirmed only by the occurrence or
non-occurrence of one or more uncertain future events not wholly within the control of the Bank; or any present obligation that
arises from past events but is not recognised because:
it is not probable that an outflow of resources embodying economic benefits will be required to settle the obligation; or
Contingent liabilities are not recognised but disclosed in the financial statements unless the possibility of an outflow of resources
embodying economic benefits is reliably estimated.
Contingent assets are not recognised in the financial statements as this may results in the recognition of income which may never
be realised.
The revenue during the year has been recognised following all conditions of revenue recognitions as prescribed by Bangladesh
Accounting Standards BAS-18: 'Revenue'.
Fees and commission income arises on services provided by the Bank and recognised on a cash receipt basis. Commission
charged to customers on letters of credit and letters of guarantee are credited to income at the time of effecting the transactions.
Interest on loans and advances is calculated on daily product basis and accrued at the end of each month, but charged to
customers' accounts on quarterly basis. In terms of the provisions of the Bangladesh Accounting Standards BAS-18: 'Revenue' ,
the interest income is recognised on accrual basis. Up to 30 September 2012 interest on unclassified [excluding Special
Mentioned Account (SMA)] loans and advances have been accounted for as income on accrual basis, interest on classified loans
and advances (including SMA) has been credited to interest suspense account with actual receipt of interest therefrom having
credited to income as and when received as per instruction of Bangladesh Bank. However, as per BRPD circular no: 14 dated 23
September 2012 interest on SMA loans are recorded as interest income on accrual basis from 1 October 2012 and all other things
remained the same.
30
(iii) Dividend income
(iv) Interest paid on borrowings and deposits
(v) Interest income from investments
(vi) Management and other expenses
2.33 Earnings per share
2.34 Reconciliation of books and account
2.35 Offsetting
2.36 Credit Rating of the Bank
ST-2
ST-2
Dividend income is recognised when the right to receive income is established. Usually this is the ex dividend date for equity
securities. Dividends are presented in investment income.
Interest paid on Borrowings and Deposits are calculated on 360 days in a year and recognised on accrual basis.
Income on investments is recognised on accrual basis. Investment income includes discount on treasury bills, interest on treasury
bonds and fixed deposit with other banks. Capital gain on investments in shares is also included in investment income. Capital
gain is recognised when it is realised.
Expenses incurred by the Bank are recognised on actual and accrual basis.
Earnings per share (EPS) has been computed by dividing the profit after tax (PAT) by the weighted average number of ordinary
shares outstanding as at 31 December 2012 as per Bangladesh Accounting Standards (BAS)-33: 'Earnings per Share' .
Books of account in regard to inter-bank (in Bangladesh and outside Bangladesh) as well as inter-branches are reconciled at
regular intervals to keep the unreconciled balances within non material level.
Details of un-reconciled entries of Inter Branch Transaction Accounts (IBTA) as at 31 December 2012 are given in Note 12.2.
Financial assets and liabilities are offset and the net amount is presented in the balance sheet when there is a legally enforceable
right to offset the recognised amount and there is an intention to settle on a net basis, or realise asset and settle the liability
simultaneously.
As per the BRPD circular no. 6 dated 5 July 2006, the Bank has done its credit rating by Credit Rating Information and Services
Limited (CRISL) based on the financial statements of Janata Bank Limited dated 31 December 2011. The following ratings had
been awarded:
Particulars Bases of information
(as on or period)
Long
term
Short
term
On the basis Govt.
support
Entity Rating 31 December 2011 A+ AAA in long run & ST1
in short run
Entity Rating 31 December 2010 A+ AAA in long run & ST1
in short run
Income and expenses are presented on a net basis only when permitted under BFRSs, or for gains and losses arising from a group
of similar transactions such as in the Group’s trading activity.
31
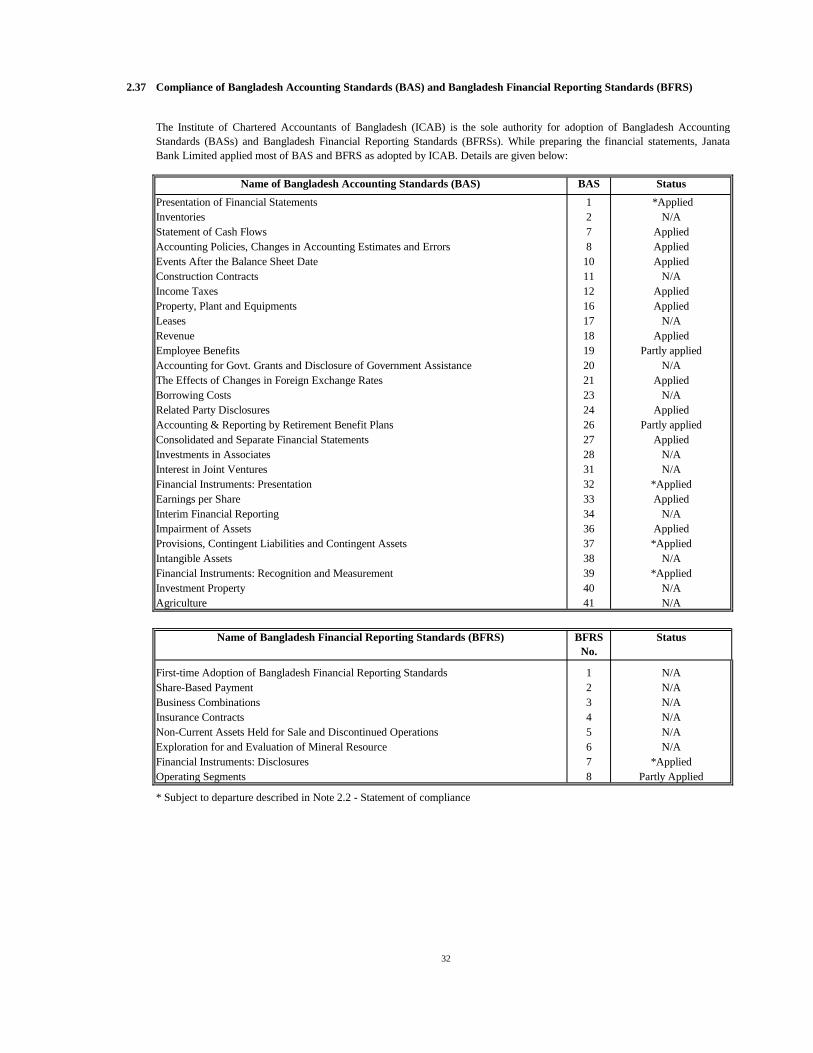
2.37
1
2
7
8
10
11
12
16
17
18
19
20
21
23
24
26
27
28
31
32
33
34
36
37
38
39
40
41
BFRS
No.
1
2
3
4
5
6
7
8
Compliance of Bangladesh Accounting Standards (BAS) and Bangladesh Financial Reporting Standards (BFRS)
The Institute of Chartered Accountants of Bangladesh (ICAB) is the sole authority for adoption of Bangladesh Accounting
Standards (BASs) and Bangladesh Financial Reporting Standards (BFRSs). While preparing the financial statements, Janata
Bank Limited applied most of BAS and BFRS as adopted by ICAB. Details are given below:
Name of Bangladesh Accounting Standards (BAS) BAS
No.
Status
Presentation of Financial Statements *Applied
Inventories N/A
Statement of Cash Flows Applied
Accounting Policies, Changes in Accounting Estimates and Errors Applied
Events After the Balance Sheet Date Applied
Construction Contracts N/A
Income Taxes Applied
Property, Plant and Equipments Applied
Leases N/A
Revenue Applied
Employee Benefits Partly applied
Accounting for Govt. Grants and Disclosure of Government Assistance N/A
The Effects of Changes in Foreign Exchange Rates Applied
Borrowing Costs N/A
Related Party Disclosures Applied
Accounting & Reporting by Retirement Benefit Plans Partly applied
Consolidated and Separate Financial Statements Applied
Investments in Associates N/A
Interest in Joint Ventures N/A
Financial Instruments: Presentation *Applied
Earnings per Share Applied
Interim Financial Reporting N/A
Impairment of Assets Applied
Provisions, Contingent Liabilities and Contingent Assets *Applied
Intangible Assets N/A
Financial Instruments: Recognition and Measurement *Applied
Investment Property N/A
Agriculture N/A
Name of Bangladesh Financial Reporting Standards (BFRS) Status
First-time Adoption of Bangladesh Financial Reporting Standards N/A
Share-Based Payment N/A
Business Combinations N/A
Insurance Contracts N/A
Non-Current Assets Held for Sale and Discontinued Operations N/A
Exploration for and Evaluation of Mineral Resource N/A
Financial Instruments: Disclosures *Applied
Operating Segments Partly Applied
* Subject to departure described in Note 2.2 - Statement of compliance
32
2.38 Risk Management
(i) Credit Risk Management
(ii) Foreign Exchange Risk Management
(iii) Assets- Liability Risk Management
(iv) Money Laundering Prevention Risk Management
(v) Internal Control and Compliance Risk Management
(vi) Guidelines on Information and Communication Technology
(i) Credit Risk Management
(ii) Foreign Exchange Risk Management
The possibility of losses, financial or otherwise is defined as risk. The risks are inherent in banking business in the context of
recovery of credit, maintaining liquidity market and operational affect. It is responsibility of the management to identify measure
and mitigate the risks. The risk management of the Bank covers 6 (six) core risk areas in the banking business and issued
necessary guidelines as under to control and minimise the affected loss:-
Janata Bank Limited has developed separate guidelines for each of above risk oriented areas to manage its own core risks.
Credit risk is the risk to a financial institution’s earning and capital when an obligor or a third party does not comply with the
terms and conditions of the loan and fail to meet its obligations to the bank. It is a potential loss arising from the failure of a
counter party to perform as per contractual agreement with the bank, basically failure in repayment. Managing Credit risk of the
Bank in an efficient manner has become one of the most crucial tasks for the management. Given the fast changing, dynamic
global economy, implementation of Basel-II and the increasing pressure of globalization and liberalization it is essential that
banks have robust credit risk management policies and procedures that are sensitive and responsive to this changes.
The Bank ensures to adopt the following risk assessment procedures before approving sanction of any credit facility. The risk
assessment procedures include borrower risk analysis, financial analysis, industrial appraisal, historical performance of the
customer, security against credit facility etc. The assessment initiated from the branch level, counter checking & cross checking
done by the controlling office in accordance with business and sanctioning power.
The proposals belongs to the authority of head office, are reviewed by the concerned credit department in term of credit policies,
risk grading, business and management quality and then reviewed by the credit committee. Thereafter placed to board with their
recommendation or otherwise rejected of deemed not to be feasible.
Apart from customer department, a separate risk management department has been created to mitigate the various types of credit
risk in determining single borrower/large loan limit; the instructions of regulatory bodies are strictly followed.
Foreign exchange risk is a risk that a bank may suffer losses as a result of adverse movements in foreign exchange rates. This
risk is associated with the transactions involved in import, export, remittance and foreign currency in hand and bank.
To mitigate the risk involved in foreign exchange business, the foreign exchange dealing operation in Janata Bank limited is
performed through Dealing Room (Front Office), Mid Office and Back Office. The dealers manage market risks, avoid adverse
exchange fluctuation, look for better investment of funds, maintain sound liquidity and protect the Bank from any unforeseen
loss in the situation of any market volatility .The Mid Office and Back Office are assigned the responsibility of related support
functions. Dealing room is restricted for all excepting dealers and authorised executives.
The dealing room is equipped with modern facilities i.e. Reuters’s information, SWIFT, receptors monitor, telephone, voice
recorder etc. Moreover stop/loss limit, trading limit, over night limit is given by the concerned authorities. The daily blotter and
mark to market revaluation report is placed to management for their review.
33
(iii) Asset-Liability Risk Management
(iv) Money Laundering Risk Management
(i)
(ii)
(v) Internal Control and Compliance Risk Management
Asset- Liability Risk is comprised of two components, (i) Liquidity Risk, and (ii) Interest Rate Risk.
(a) Liquidity Risk
Liquidity risk is defined as a potential loss arising from the Bank’s inability to meet its contractual obligations & financial
commitments, whenever due.
Liquidity risk is managed in accordance with a framework of asset liability management guideline, liquidity policies, contracts,
and limits approved by ALCO of the Bank. These policies are established to control, limit and to ensure that the Bank maintains
well diversified sources of funding as well as sufficient liquidity to meet all of its contractual obligations when due. The Bank
meet the liquidity crisis by taking call loan, short term deposit from other banks & financial institutions and sale of securities on
repurchase agreement (REPO).
(b) Interest Rate Risk
Interest rate risk is the risk of loss in the Bank’s interest margin or net equity value arising from changes in interest rates and their
implied volatility. Janata Bank Limited has established an Asset Liabilities Committee (ALCO) to screen out and determine the
maximum risk exposure regarding liquidity requirement of the Bank, mismatch in the maturity of assets and liabilities, deposit
lending ratio and growth, capital adequacy, pricing strategy and the way to meet the liquidity crisis in any adverse situation.
Money Laundering means any offence under the law which is set out in section no. 2 of the Money Laundering Prevention Act,
2009 (Act no. 8 of 2009). The offences are as under:
Properties acquired or earned directly or indirectly through illegal means;
Illegal transfer, conversion, concealment of location or assistance in the above act of the properties acquired or earned
directly or indirectly through legal or illegal means."
The Bank has formulated the polices and procedures under the provision of Money Laundering Act and in consideration of all
control points suggested by Bangladesh Bank to control laundering of money earned illegally which is harmful for the economy
of the country. The Board and the management are fully committed to prevent money laundering and terrorist financing.
To mitigate the money laundering risk, monthly CTR/ STR reports are provided to Bangladesh Bank, introduced KYC report
mentioning the transaction profile, proper address, valid source of income etc. which are verified at the time of opening any kind
of Account. Employees are provided training regularly on how to identify a suspicious transaction and what is the role of bank
management to report in this regard.
Internal control is a process to control overall activities of the Bank through establishing policies, procedures, observance of
instructions of regulatory authorities with a view to avoid any possible loss from the lack of corporate governance.
To mitigate the operational risk, the Bank ensured effective internal control systems for all of its operational activities by
intensifying the internal audit function, comprehensive and risk based inspection in all branches and Head Office. The
Compliance Division ensures the settlement of objections or irregularities mentioned in the audit reports under a strong
monitoring process of the Management Committee (MANCOM). Besides there is a division named Vigilance Department under
the direct supervision of CEO and MD to act at any sudden occurrence of loss or irregularities.
The Bank with the support of an Expert Team, has undertaken a program for up grading its Standard Operating Procedures
(SOP) in the area of credit, audit, information technology and accounts as per international best practices.
34
(vi) Guidelines on Information and Communication Technology
2.39
2.40 Audit Committee Disclosures
Sl.
no.
i) Dr. Jamaluddin Ahmed FCA
ii) Dr. R M Debnath
iii) Mr. Nagibul Islam Dipu
iv)
* Reviewed Annual audit plan of internal audit 2012.
*
*
*
*
*
*
*
Janata Bank Limited follows the guideline stated in BRPD circular no. 14 dated 23 October 2005 regarding 'Guidelines on
Information and Communication Technology' for scheduled Banks. IT management deals with IT policy documentation, internal
IT audit, training etc. The objective of IT management is to achieve the highest levels of technology service quality by minimum
operational risk. Physical security involves providing environmental safeguards as well as controlling physical access to
equipment and data. IT department has controls over Password, User ID maintenance, input control, network security, virus
protection, internet and e-mail. Data centre has been set up and disaster recovery plan has been formulated as part of Business
Continuity Planning (BCP).
Related party disclosures
As per Bangladesh Accounting Standards BAS-24: 'Related Party Disclosures' , parties are considered to be related if one of the
parties has the ability to control the other party or exercise significant influence over the other party in making financial and
operating decisions. The Company carried out transactions in the ordinary course of business on an arm’s length basis at
commercial rates with its related parties. Related party disclosures have been given in Note 50.
Asper policy directives as well as compliance with the BRPD Circular No. 12 dated 23 December 2002 of Bangladesh Bank, an
audit committee of the board of Janata Bank Limited was constituted by the Board of Directors in its 773rd meeting held on 30
December 2002 and thereafter lastly reconstituted in the 246th board meeting of Janata Bank Limited held on 24 December
2012. The audit committee comprises of four members including chairman who are competent and professionally skilled and
also the director of the board. The company secretary act as a secretary of the audit committee. The name and status of the
member of the audit committee are stated as follows:
Name Status with the committee
Chairman
Member
Member
Mr. Md. Abu Naser Member
During the year 2012, the Audit Committee of the Board conducted 11 (Eleven) meetings in which the following important
issues were reviewed/discussed among with others:
Reviewed the reconciliation position of Inter branch transaction accounts and advised the bank management to take
necessary steps to reconcile the unreconciled entries immediately.
Reviewed the draft audit report and financial statements for the year ended 31 December 2011 of the bank prior to
submission to the board for approval under the guideline of Basel-II and other regulatory requirements with necessary
amendments.
Reviewed External Audit plan 2012.
Reviewed the liquidity position of the bank in monthly basis.
Reviewed the overall performance of audit conducted by different departments and compliance thereof and advised the
management to take effective means to improve audit performance.
Reviewed management report 2011 conducted by external auditors and suggested some ammendments and then place
before the the board for approval.
Reviewed revised budget of 2012 and proposed budget of 2013 and recommended the same to be placed before the
board with suggested ammendments.
35
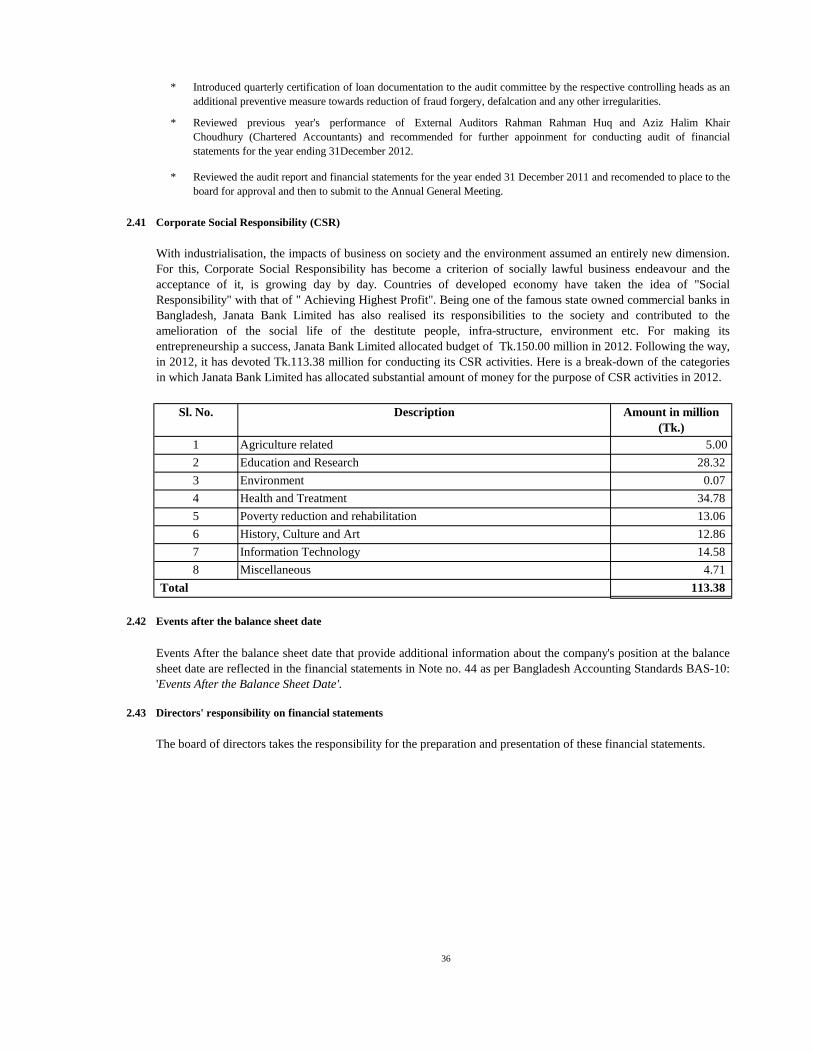
*
*
*
2.41 Corporate Social Responsibility (CSR)
2.42 Events after the balance sheet date
2.43 Directors' responsibility on financial statements
With industrialisation, the impacts of business on society and the environment assumed an entirely new dimension.
For this, Corporate Social Responsibility has become a criterion of socially lawful business endeavour and the
acceptance of it, is growing day by day. Countries of developed economy have taken the idea of "Social
Responsibility" with that of " Achieving Highest Profit". Being one of the famous state owned commercial banks in
Bangladesh, Janata Bank Limited has also realised its responsibilities to the society and contributed to the
amelioration of the social life of the destitute people, infra-structure, environment etc. For making its
entrepreneurship a success, Janata Bank Limited allocated budget of Tk.150.00 million in 2012. Following the way,
in 2012, it has devoted Tk.113.38 million for conducting its CSR activities. Here is a break-down of the categories
in which Janata Bank Limited has allocated substantial amount of money for the purpose of CSR activities in 2012.
Sl. No. Description Amount in million
(Tk.)
Introduced quarterly certification of loan documentation to the audit committee by the respective controlling heads as an
additional preventive measure towards reduction of fraud forgery, defalcation and any other irregularities.
Reviewed previous year's performance of External Auditors Rahman Rahman Huq and Aziz Halim Khair
Choudhury (Chartered Accountants) and recommended for further appoinment for conducting audit of financial
statements for the year ending 31December 2012.
Reviewed the audit report and financial statements for the year ended 31 December 2011 and recomended to place to the
board for approval and then to submit to the Annual General Meeting.
1 Agriculture related 5.00
2 Education and Research 28.32
3 Environment 0.07
4 Health and Treatment 34.78
5 Poverty reduction and rehabilitation 13.06
6 History, Culture and Art 12.86
7 Information Technology 14.58
8 Miscellaneous 4.71
Total 113.38
Events After the balance sheet date that provide additional information about the company's position at the balance
sheet date are reflected in the financial statements in Note no. 44 as per Bangladesh Accounting Standards BAS-10:
'Events After the Balance Sheet Date'.
The board of directors takes the responsibility for the preparation and presentation of these financial statements.
36
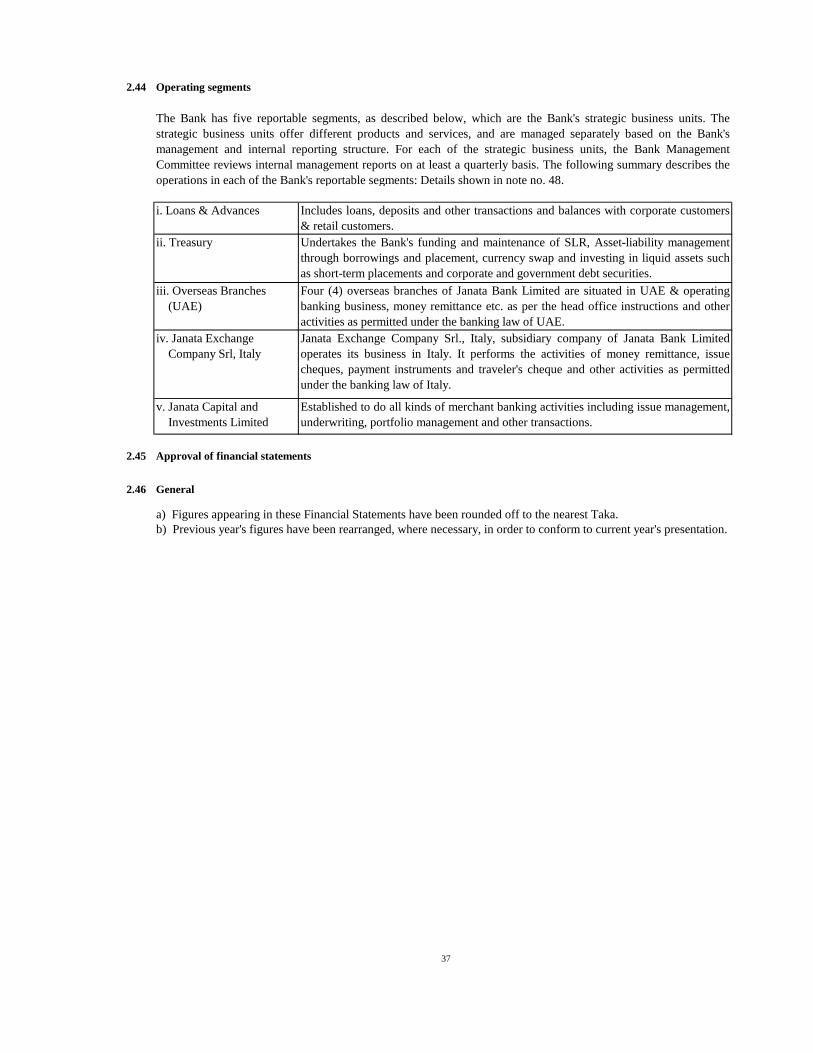
2.44 Operating segments
2.45 Approval of financial statements
2.46 General
a) Figures appearing in these Financial Statements have been rounded off to the nearest Taka.
b) Previous year's figures have been rearranged, where necessary, in order to conform to current year's presentation.
v. Janata Capital and
Investments Limited
Established to do all kinds of merchant banking activities including issue management,
underwriting, portfolio management and other transactions.
Janata Exchange Company Srl., Italy, subsidiary company of Janata Bank Limited
operates its business in Italy. It performs the activities of money remittance, issue
cheques, payment instruments and traveler's cheque and other activities as permitted
under the banking law of Italy.
The Bank has five reportable segments, as described below, which are the Bank's strategic business units. The
strategic business units offer different products and services, and are managed separately based on the Bank's
management and internal reporting structure. For each of the strategic business units, the Bank Management
Committee reviews internal management reports on at least a quarterly basis. The following summary describes the
operations in each of the Bank's reportable segments: Details shown in note no. 48.
i. Loans & Advances Includes loans, deposits and other transactions and balances with corporate customers
& retail customers.
ii. Treasury Undertakes the Bank's funding and maintenance of SLR, Asset-liability management
through borrowings and placement, currency swap and investing in liquid assets such
as short-term placements and corporate and government debt securities.
iii. Overseas Branches
(UAE)
Four (4) overseas branches of Janata Bank Limited are situated in UAE & operating
banking business, money remittance etc. as per the head office instructions and other
activities as permitted under the banking law of UAE.
iv. Janata Exchange
Company Srl, Italy
37
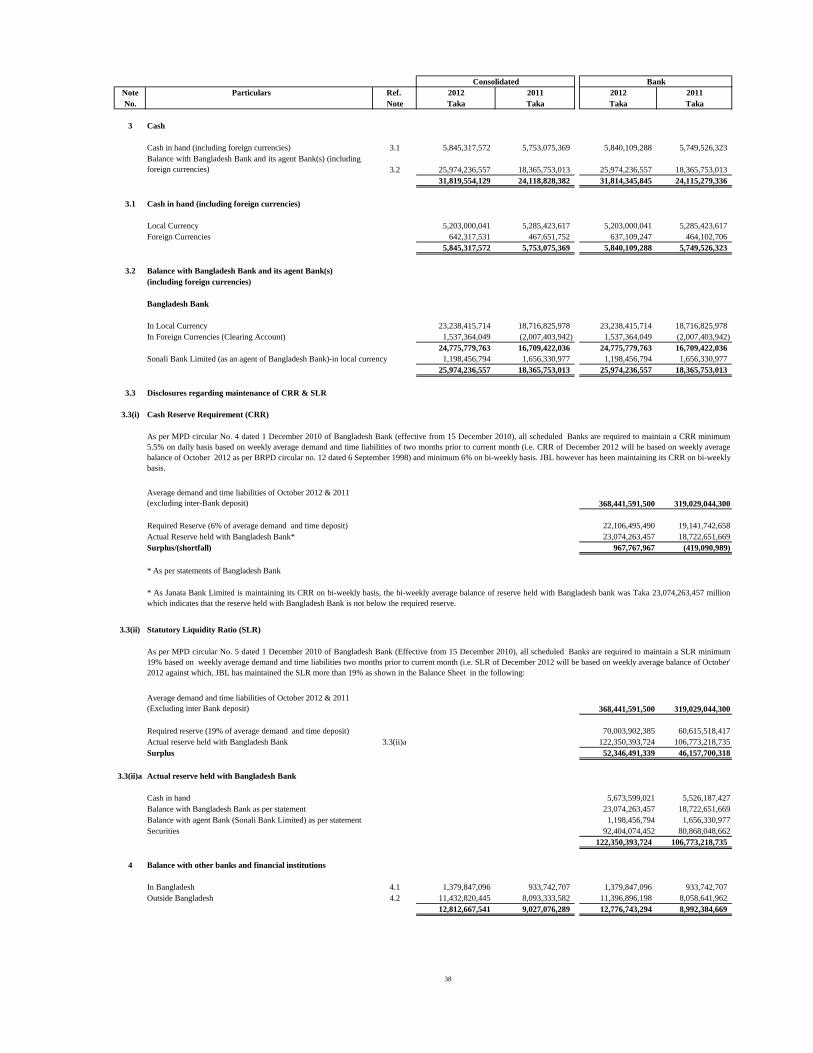
Note Particulars Ref. 2012 2011 2012 2011
No. Note Taka Taka Taka Taka
3 Cash
Cash in hand (including foreign currencies) 3.1 5,845,317,572 5,753,075,369 5,840,109,288 5,749,526,323
3.2 25,974,236,557 18,365,753,013 25,974,236,557 18,365,753,013
31,819,554,129 24,118,828,382 31,814,345,845 24,115,279,336
3.1 Cash in hand (including foreign currencies)
Local Currency 5,203,000,041 5,285,423,617 5,203,000,041 5,285,423,617
Foreign Currencies 642,317,531 467,651,752 637,109,247 464,102,706
5,845,317,572 5,753,075,369 5,840,109,288 5,749,526,323
3.2 Balance with Bangladesh Bank and its agent Bank(s)
(including foreign currencies)
Bangladesh Bank
In Local Currency 23,238,415,714 18,716,825,978 23,238,415,714 18,716,825,978
In Foreign Currencies (Clearing Account) 1,537,364,049 (2,007,403,942) 1,537,364,049 (2,007,403,942)
24,775,779,763 16,709,422,036 24,775,779,763 16,709,422,036
Sonali Bank Limited (as an agent of Bangladesh Bank)-in local currency 1,198,456,794 1,656,330,977 1,198,456,794 1,656,330,977
25,974,236,557 18,365,753,013 25,974,236,557 18,365,753,013
3.3 Disclosures regarding maintenance of CRR & SLR
3.3(i)
368,441,591,500 319,029,044,300
22,106,495,490 19,141,742,658
23,074,263,457 18,722,651,669
967,767,967 (419,090,989)
* As per statements of Bangladesh Bank
3.3(ii)
368,441,591,500 319,029,044,300
70,003,902,385 60,615,518,417
3.3(ii)a 122,350,393,724 106,773,218,735
52,346,491,339 46,157,700,318
3.3(ii)a
5,673,599,021 5,526,187,427
23,074,263,457 18,722,651,669
1,198,456,794 1,656,330,977
92,404,074,452 80,868,048,662
122,350,393,724 106,773,218,735
4 Balance with other banks and financial institutions
In Bangladesh 4.1 1,379,847,096 933,742,707 1,379,847,096 933,742,707
Outside Bangladesh 4.2 11,432,820,445 8,093,333,582 11,396,896,198 8,058,641,962
12,812,667,541 9,027,076,289 12,776,743,294 8,992,384,669
Consolidated Bank
Required Reserve (6% of average demand and time deposit)
Surplus
Actual reserve held with Bangladesh Bank
As per MPD circular No. 4 dated 1 December 2010 of Bangladesh Bank (effective from 15 December 2010), all scheduled Banks are required to maintain a CRR minimum
5.5% on daily basis based on weekly average demand and time liabilities of two months prior to current month (i.e. CRR of December 2012 will be based on weekly average
balance of October 2012 as per BRPD circular no. 12 dated 6 September 1998) and minimum 6% on bi-weekly basis. JBL however has been maintaining its CRR on bi-weekly
basis.
As per MPD circular No. 5 dated 1 December 2010 of Bangladesh Bank (Effective from 15 December 2010), all scheduled Banks are required to maintain a SLR minimum
19% based on weekly average demand and time liabilities two months prior to current month (i.e. SLR of December 2012 will be based on weekly average balance of October'
2012 against which, JBL has maintained the SLR more than 19% as shown in the Balance Sheet in the following:
Balance with Bangladesh Bank and its agent Bank(s) (including
foreign currencies)
Average demand and time liabilities of October 2012 & 2011
(excluding inter-Bank deposit)
Average demand and time liabilities of October 2012 & 2011
(Excluding inter Bank deposit)
* As Janata Bank Limited is maintaining its CRR on bi-weekly basis, the bi-weekly average balance of reserve held with Bangladesh bank was Taka 23,074,263,457 million
which indicates that the reserve held with Bangladesh Bank is not below the required reserve.
Actual reserve held with Bangladesh Bank
Cash Reserve Requirement (CRR)
Surplus/(shortfall)
Required reserve (19% of average demand and time deposit)
Balance with Bangladesh Bank as per statement
Actual Reserve held with Bangladesh Bank*
Cash in hand
Balance with agent Bank (Sonali Bank Limited) as per statement
Statutory Liquidity Ratio (SLR)
Securities
38
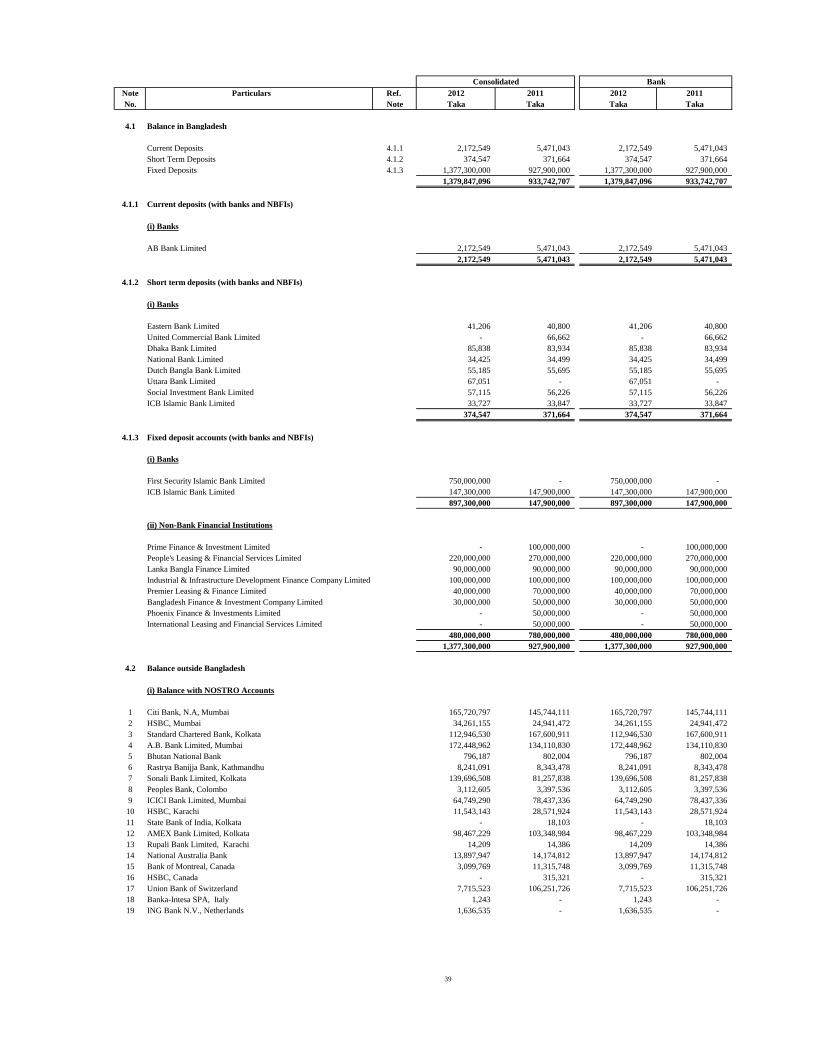
Note Particulars Ref. 2012 2011 2012 2011
No. Note Taka Taka Taka Taka
4.1 Balance in Bangladesh
Current Deposits 4.1.1 2,172,549 5,471,043 2,172,549 5,471,043
Short Term Deposits 4.1.2 374,547 371,664 374,547 371,664
Fixed Deposits 4.1.3 1,377,300,000 927,900,000 1,377,300,000 927,900,000
1,379,847,096 933,742,707 1,379,847,096 933,742,707
4.1.1 Current deposits (with banks and NBFIs)
(i) Banks
AB Bank Limited 2,172,549 5,471,043 2,172,549 5,471,043
2,172,549 5,471,043 2,172,549 5,471,043
4.1.2 Short term deposits (with banks and NBFIs)
(i) Banks
Eastern Bank Limited 41,206 40,800 41,206 40,800
United Commercial Bank Limited - 66,662 - 66,662
Dhaka Bank Limited 85,838 83,934 85,838 83,934
National Bank Limited 34,425 34,499 34,425 34,499
Dutch Bangla Bank Limited 55,185 55,695 55,185 55,695
Uttara Bank Limited 67,051 - 67,051 -
Social Investment Bank Limited 57,115 56,226 57,115 56,226
ICB Islamic Bank Limited 33,727 33,847 33,727 33,847
374,547 371,664 374,547 371,664
4.1.3 Fixed deposit accounts (with banks and NBFIs)
(i) Banks
First Security Islamic Bank Limited 750,000,000 - 750,000,000 -
ICB Islamic Bank Limited 147,300,000 147,900,000 147,300,000 147,900,000
897,300,000 147,900,000 897,300,000 147,900,000
(ii) Non-Bank Financial Institutions
Prime Finance & Investment Limited - 100,000,000 - 100,000,000
People's Leasing & Financial Services Limited 220,000,000 270,000,000 220,000,000 270,000,000
Lanka Bangla Finance Limited 90,000,000 90,000,000 90,000,000 90,000,000
Industrial & Infrastructure Development Finance Company Limited 100,000,000 100,000,000 100,000,000 100,000,000
Premier Leasing & Finance Limited 40,000,000 70,000,000 40,000,000 70,000,000
Bangladesh Finance & Investment Company Limited 30,000,000 50,000,000 30,000,000 50,000,000
Phoenix Finance & Investments Limited - 50,000,000 - 50,000,000
International Leasing and Financial Services Limited - 50,000,000 - 50,000,000
480,000,000 780,000,000 480,000,000 780,000,000
1,377,300,000 927,900,000 1,377,300,000 927,900,000
4.2 Balance outside Bangladesh
(i) Balance with NOSTRO Accounts
1 Citi Bank, N.A, Mumbai 165,720,797 145,744,111 165,720,797 145,744,111
2 HSBC, Mumbai 34,261,155 24,941,472 34,261,155 24,941,472
3 Standard Chartered Bank, Kolkata 112,946,530 167,600,911 112,946,530 167,600,911
4 A.B. Bank Limited, Mumbai 172,448,962 134,110,830 172,448,962 134,110,830
5 Bhutan National Bank 796,187 802,004 796,187 802,004
6 Rastrya Banijja Bank, Kathmandhu 8,241,091 8,343,478 8,241,091 8,343,478
7 Sonali Bank Limited, Kolkata 139,696,508 81,257,838 139,696,508 81,257,838
8 Peoples Bank, Colombo 3,112,605 3,397,536 3,112,605 3,397,536
9 ICICI Bank Limited, Mumbai 64,749,290 78,437,336 64,749,290 78,437,336
10 HSBC, Karachi 11,543,143 28,571,924 11,543,143 28,571,924
11 State Bank of India, Kolkata - 18,103 - 18,103
12 AMEX Bank Limited, Kolkata 98,467,229 103,348,984 98,467,229 103,348,984
13 Rupali Bank Limited, Karachi 14,209 14,386 14,209 14,386
14 National Australia Bank 13,897,947 14,174,812 13,897,947 14,174,812
15 Bank of Montreal, Canada 3,099,769 11,315,748 3,099,769 11,315,748
16 HSBC, Canada - 315,321 - 315,321
17 Union Bank of Switzerland 7,715,523 106,251,726 7,715,523 106,251,726
18 Banka-Intesa SPA, Italy 1,243 - 1,243 -
19 ING Bank N.V., Netherlands 1,636,535 - 1,636,535 -
BankConsolidated
39
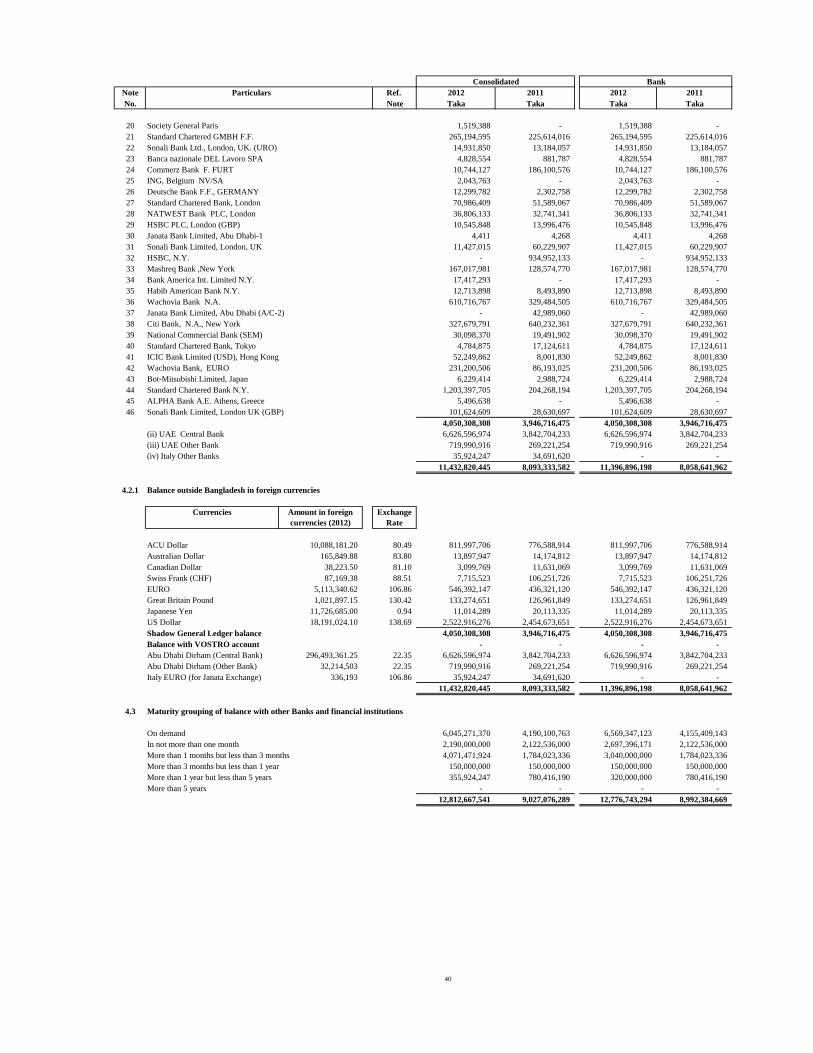
Note Particulars Ref. 2012 2011 2012 2011
No. Note Taka Taka Taka Taka
20 Society General Paris 1,519,388 - 1,519,388 -
21 Standard Chartered GMBH F.F. 265,194,595 225,614,016 265,194,595 225,614,016
22 Sonali Bank Ltd., London, UK. (URO) 14,931,850 13,184,057 14,931,850 13,184,057
23 Banca nazionale DEL Lavoro SPA 4,828,554 881,787 4,828,554 881,787
24 Commerz Bank F. FURT 10,744,127 186,100,576 10,744,127 186,100,576
25 ING, Belgium NV/SA 2,043,763 - 2,043,763 -
26 Deutsche Bank F.F., GERMANY 12,299,782 2,302,758 12,299,782 2,302,758
27 Standard Chartered Bank, London 70,986,409 51,589,067 70,986,409 51,589,067
28 NATWEST Bank PLC, London 36,806,133 32,741,341 36,806,133 32,741,341
29 HSBC PLC, London (GBP) 10,545,848 13,996,476 10,545,848 13,996,476
30 Janata Bank Limited, Abu Dhabi-1 4,411 4,268 4,411 4,268
31 Sonali Bank Limited, London, UK 11,427,015 60,229,907 11,427,015 60,229,907
32 HSBC, N.Y. - 934,952,133 - 934,952,133
33 Mashreq Bank ,New York 167,017,981 128,574,770 167,017,981 128,574,770
34 Bank America Int. Limited N.Y. 17,417,293 - 17,417,293 -
35 Habib American Bank N.Y. 12,713,898 8,493,890 12,713,898 8,493,890
36 Wachovia Bank N.A. 610,716,767 329,484,505 610,716,767 329,484,505
37 Janata Bank Limited, Abu Dhabi (A/C-2) - 42,989,060 - 42,989,060
38 Citi Bank, N.A., New York 327,679,791 640,232,361 327,679,791 640,232,361
39 National Commercial Bank (SEM) 30,098,370 19,491,902 30,098,370 19,491,902
40 Standard Chartered Bank, Tokyo 4,784,875 17,124,611 4,784,875 17,124,611
41 ICIC Bank Limited (USD), Hong Kong 52,249,862 8,001,830 52,249,862 8,001,830
42 Wachovia Bank, EURO 231,200,506 86,193,025 231,200,506 86,193,025
43 Bot-Mitsubishi Limited, Japan 6,229,414 2,988,724 6,229,414 2,988,724
44 Standard Chartered Bank N.Y. 1,203,397,705 204,268,194 1,203,397,705 204,268,194
45 ALPHA Bank A.E. Athens, Greece 5,496,638 - 5,496,638 -
46 Sonali Bank Limited, London UK (GBP) 101,624,609 28,630,697 101,624,609 28,630,697
4,050,308,308 3,946,716,475 4,050,308,308 3,946,716,475
(ii) UAE Central Bank 6,626,596,974 3,842,704,233 6,626,596,974 3,842,704,233
(iii) UAE Other Bank 719,990,916 269,221,254 719,990,916 269,221,254
(iv) Italy Other Banks 35,924,247 34,691,620 - -
11,432,820,445 8,093,333,582 11,396,896,198 8,058,641,962
4.2.1 Balance outside Bangladesh in foreign currencies
ACU Dollar 10,088,181.20 811,997,706 776,588,914 811,997,706 776,588,914
Australian Dollar 165,849.88 13,897,947 14,174,812 13,897,947 14,174,812
Canadian Dollar 38,223.50 3,099,769 11,631,069 3,099,769 11,631,069
Swiss Frank (CHF) 87,169.38 7,715,523 106,251,726 7,715,523 106,251,726
EURO 5,113,340.62 546,392,147 436,321,120 546,392,147 436,321,120
Great Britain Pound 1,021,897.15 133,274,651 126,961,849 133,274,651 126,961,849
Japanese Yen 11,726,685.00 11,014,289 20,113,335 11,014,289 20,113,335
US Dollar 18,191,024.10 2,522,916,276 2,454,673,651 2,522,916,276 2,454,673,651
Shadow General Ledger balance 4,050,308,308 3,946,716,475 4,050,308,308 3,946,716,475
Balance with VOSTRO account - - - -
Abu Dhabi Dirham (Central Bank) 296,493,361.25 6,626,596,974 3,842,704,233 6,626,596,974 3,842,704,233
Abu Dhabi Dirham (Other Bank) 32,214,503 719,990,916 269,221,254 719,990,916 269,221,254
Italy EURO (for Janata Exchange) 336,193 106.86 35,924,247 34,691,620 - -
11,432,820,445 8,093,333,582 11,396,896,198 8,058,641,962
4.3
On demand 6,045,271,370 4,190,100,763 6,569,347,123 4,155,409,143
In not more than one month 2,190,000,000 2,122,536,000 2,697,396,171 2,122,536,000
More than 1 months but less than 3 months 4,071,471,924 1,784,023,336 3,040,000,000 1,784,023,336
More than 3 months but less than 1 year 150,000,000 150,000,000 150,000,000 150,000,000
More than 1 year but less than 5 years 355,924,247 780,416,190 320,000,000 780,416,190
More than 5 years - - - -
12,812,667,541 9,027,076,289 12,776,743,294 8,992,384,669
22.35
Maturity grouping of balance with other Banks and financial institutions
0.94
88.51
81.10
Consolidated Bank
83.80
Exchange
Rate
106.86
130.42
138.69
22.35
Currencies Amount in foreign
currencies (2012)
80.49
40
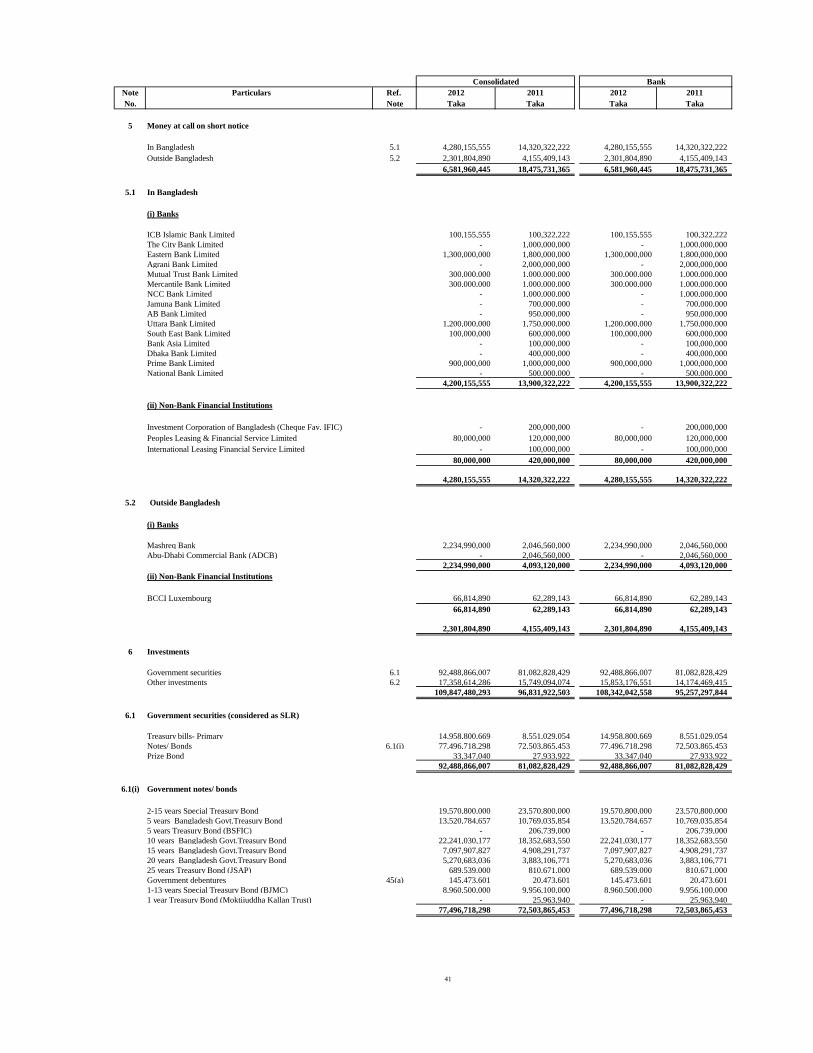
Note Particulars Ref. 2012 2011 2012 2011
No. Note Taka Taka Taka Taka
5 Money at call on short notice
In Bangladesh 5.1 4,280,155,555 14,320,322,222 4,280,155,555 14,320,322,222
Outside Bangladesh 5.2 2,301,804,890 4,155,409,143 2,301,804,890 4,155,409,143
6,581,960,445 18,475,731,365 6,581,960,445 18,475,731,365
5.1 In Bangladesh
(i) Banks
ICB Islamic Bank Limited 100,155,555 100,322,222 100,155,555 100,322,222
The City Bank Limited - 1,000,000,000 - 1,000,000,000
Eastern Bank Limited 1,300,000,000 1,800,000,000 1,300,000,000 1,800,000,000
Agrani Bank Limited - 2,000,000,000 - 2,000,000,000
Mutual Trust Bank Limited 300,000,000 1,000,000,000 300,000,000 1,000,000,000
Mercantile Bank Limited 300,000,000 1,000,000,000 300,000,000 1,000,000,000
NCC Bank Limited - 1,000,000,000 - 1,000,000,000
Jamuna Bank Limited - 700,000,000 - 700,000,000
AB Bank Limited - 950,000,000 - 950,000,000
Uttara Bank Limited 1,200,000,000 1,750,000,000 1,200,000,000 1,750,000,000
South East Bank Limited 100,000,000 600,000,000 100,000,000 600,000,000
Bank Asia Limited - 100,000,000 - 100,000,000
Dhaka Bank Limited - 400,000,000 - 400,000,000
Prime Bank Limited 900,000,000 1,000,000,000 900,000,000 1,000,000,000
National Bank Limited - 500,000,000 - 500,000,000
4,200,155,555 13,900,322,222 4,200,155,555 13,900,322,222
(ii) Non-Bank Financial Institutions
Investment Corporation of Bangladesh (Cheque Fav. IFIC) - 200,000,000 - 200,000,000
Peoples Leasing & Financial Service Limited 80,000,000 120,000,000 80,000,000 120,000,000
International Leasing Financial Service Limited - 100,000,000 - 100,000,000
80,000,000 420,000,000 80,000,000 420,000,000
4,280,155,555 14,320,322,222 4,280,155,555 14,320,322,222
5.2 Outside Bangladesh
(i) Banks
Mashreq Bank 2,234,990,000 2,046,560,000 2,234,990,000 2,046,560,000
Abu-Dhabi Commercial Bank (ADCB) - 2,046,560,000 - 2,046,560,000
2,234,990,000 4,093,120,000 2,234,990,000 4,093,120,000
(ii) Non-Bank Financial Institutions
BCCI Luxembourg 66,814,890 62,289,143 66,814,890 62,289,143
66,814,890 62,289,143 66,814,890 62,289,143
2,301,804,890 4,155,409,143 2,301,804,890 4,155,409,143
6 Investments
Government securities 6.1 92,488,866,007 81,082,828,429 92,488,866,007 81,082,828,429
Other investments 6.2 17,358,614,286 15,749,094,074 15,853,176,551 14,174,469,415
109,847,480,293 96,831,922,503 108,342,042,558 95,257,297,844
6.1 Government securities (considered as SLR)
Treasury bills- Primary 14,958,800,669 8,551,029,054 14,958,800,669 8,551,029,054
Notes/ Bonds 6.1(i) 77,496,718,298 72,503,865,453 77,496,718,298 72,503,865,453
Prize Bond 33,347,040 27,933,922 33,347,040 27,933,922
92,488,866,007 81,082,828,429 92,488,866,007 81,082,828,429
6.1(i) Government notes/ bonds
2-15 years Special Treasury Bond 19,570,800,000 23,570,800,000 19,570,800,000 23,570,800,000
5 years Bangladesh Govt.Treasury Bond 13,520,784,657 10,769,035,854 13,520,784,657 10,769,035,854
5 years Treasury Bond (BSFIC) - 206,739,000 - 206,739,000
10 years Bangladesh Govt.Treasury Bond 22,241,030,177 18,352,683,550 22,241,030,177 18,352,683,550
15 years Bangladesh Govt.Treasury Bond 7,097,907,827 4,908,291,737 7,097,907,827 4,908,291,737
20 years Bangladesh Govt.Treasury Bond 5,270,683,036 3,883,106,771 5,270,683,036 3,883,106,771
25 years Treasury Bond (JSAP) 689,539,000 810,671,000 689,539,000 810,671,000
Government debentures 45(a) 145,473,601 20,473,601 145,473,601 20,473,601
1-13 years Special Treasury Bond (BJMC) 8,960,500,000 9,956,100,000 8,960,500,000 9,956,100,000
1 year Treasury Bond (Moktijuddha Kallan Trust) - 25,963,940 - 25,963,940
77,496,718,298 72,503,865,453 77,496,718,298 72,503,865,453
Consolidated Bank
41
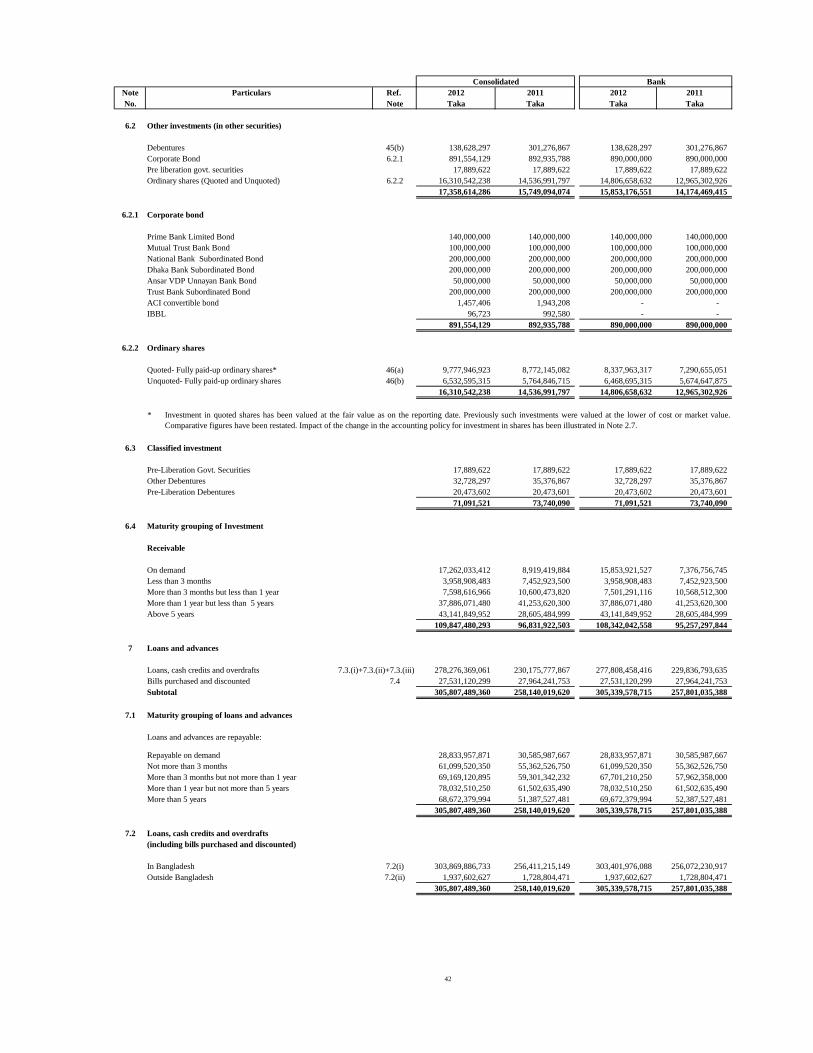
Note Particulars Ref. 2012 2011 2012 2011
No. Note Taka Taka Taka Taka
6.2 Other investments (in other securities)
Debentures 45(b) 138,628,297 301,276,867 138,628,297 301,276,867
Corporate Bond 6.2.1 891,554,129 892,935,788 890,000,000 890,000,000
Pre liberation govt. securities 17,889,622 17,889,622 17,889,622 17,889,622
Ordinary shares (Quoted and Unquoted) 6.2.2 16,310,542,238 14,536,991,797 14,806,658,632 12,965,302,926
17,358,614,286 15,749,094,074 15,853,176,551 14,174,469,415
6.2.1 Corporate bond
Prime Bank Limited Bond 140,000,000 140,000,000 140,000,000 140,000,000
Mutual Trust Bank Bond 100,000,000 100,000,000 100,000,000 100,000,000
National Bank Subordinated Bond 200,000,000 200,000,000 200,000,000 200,000,000
Dhaka Bank Subordinated Bond 200,000,000 200,000,000 200,000,000 200,000,000
Ansar VDP Unnayan Bank Bond 50,000,000 50,000,000 50,000,000 50,000,000
Trust Bank Subordinated Bond 200,000,000 200,000,000 200,000,000 200,000,000
ACI convertible bond 1,457,406 1,943,208 - -
IBBL 96,723 992,580 - -
891,554,129 892,935,788 890,000,000 890,000,000
6.2.2 Ordinary shares
Quoted- Fully paid-up ordinary shares* 46(a) 9,777,946,923 8,772,145,082 8,337,963,317 7,290,655,051
Unquoted- Fully paid-up ordinary shares 46(b) 6,532,595,315 5,764,846,715 6,468,695,315 5,674,647,875
16,310,542,238 14,536,991,797 14,806,658,632 12,965,302,926
*
6.3 Classified investment
Pre-Liberation Govt. Securities 17,889,622 17,889,622 17,889,622 17,889,622
Other Debentures 32,728,297 35,376,867 32,728,297 35,376,867
Pre-Liberation Debentures 20,473,602 20,473,601 20,473,602 20,473,601
71,091,521 73,740,090 71,091,521 73,740,090
6.4 Maturity grouping of Investment
Receivable
On demand 17,262,033,412 8,919,419,884 15,853,921,527 7,376,756,745
Less than 3 months 3,958,908,483 7,452,923,500 3,958,908,483 7,452,923,500
More than 3 months but less than 1 year 7,598,616,966 10,600,473,820 7,501,291,116 10,568,512,300
More than 1 year but less than 5 years 37,886,071,480 41,253,620,300 37,886,071,480 41,253,620,300
Above 5 years 43,141,849,952 28,605,484,999 43,141,849,952 28,605,484,999
109,847,480,293 96,831,922,503 108,342,042,558 95,257,297,844
7 Loans and advances
Loans, cash credits and overdrafts 7.3.(i)+7.3.(ii)+7.3.(iii) 278,276,369,061 230,175,777,867 277,808,458,416 229,836,793,635
Bills purchased and discounted 7.4 27,531,120,299 27,964,241,753 27,531,120,299 27,964,241,753
Subtotal 305,807,489,360 258,140,019,620 305,339,578,715 257,801,035,388
7.1 Maturity grouping of loans and advances
Loans and advances are repayable:
Repayable on demand 28,833,957,871 30,585,987,667 28,833,957,871 30,585,987,667
Not more than 3 months 61,099,520,350 55,362,526,750 61,099,520,350 55,362,526,750
More than 3 months but not more than 1 year 69,169,120,895 59,301,342,232 67,701,210,250 57,962,358,000
More than 1 year but not more than 5 years 78,032,510,250 61,502,635,490 78,032,510,250 61,502,635,490
More than 5 years 68,672,379,994 51,387,527,481 69,672,379,994 52,387,527,481
305,807,489,360 258,140,019,620 305,339,578,715 257,801,035,388
7.2
In Bangladesh 7.2(i) 303,869,886,733 256,411,215,149 303,401,976,088 256,072,230,917
Outside Bangladesh 7.2(ii) 1,937,602,627 1,728,804,471 1,937,602,627 1,728,804,471
305,807,489,360 258,140,019,620 305,339,578,715 257,801,035,388
(including bills purchased and discounted)
BankConsolidated
Investment in quoted shares has been valued at the fair value as on the reporting date. Previously such investments were valued at the lower of cost or market value.
Comparative figures have been restated. Impact of the change in the accounting policy for investment in shares has been illustrated in Note 2.7.
Loans, cash credits and overdrafts
42
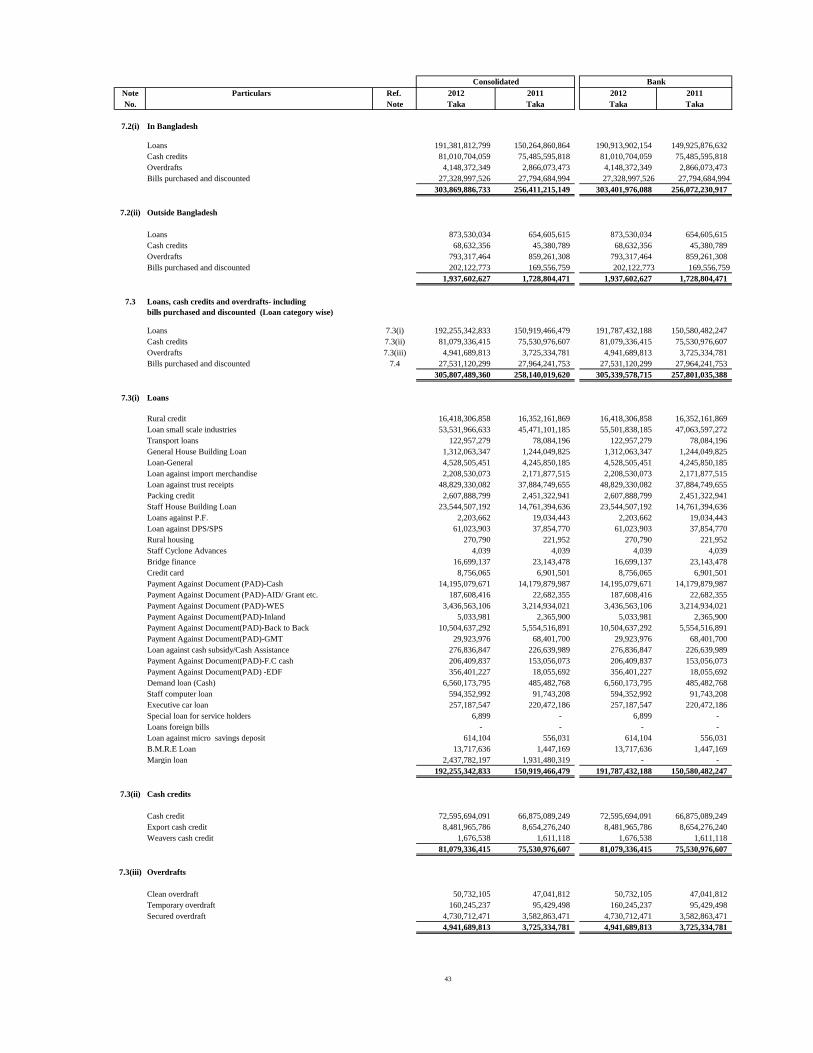
Note Particulars Ref. 2012 2011 2012 2011
No. Note Taka Taka Taka Taka
7.2(i) In Bangladesh
Loans 191,381,812,799 150,264,860,864 190,913,902,154 149,925,876,632
Cash credits 81,010,704,059 75,485,595,818 81,010,704,059 75,485,595,818
Overdrafts 4,148,372,349 2,866,073,473 4,148,372,349 2,866,073,473
Bills purchased and discounted 27,328,997,526 27,794,684,994 27,328,997,526 27,794,684,994
303,869,886,733 256,411,215,149 303,401,976,088 256,072,230,917
7.2(ii) Outside Bangladesh
Loans 873,530,034 654,605,615 873,530,034 654,605,615
Cash credits 68,632,356 45,380,789 68,632,356 45,380,789
Overdrafts 793,317,464 859,261,308 793,317,464 859,261,308
Bills purchased and discounted 202,122,773 169,556,759 202,122,773 169,556,759
1,937,602,627 1,728,804,471 1,937,602,627 1,728,804,471
7.3
Loans 7.3(i) 192,255,342,833 150,919,466,479 191,787,432,188 150,580,482,247
Cash credits 7.3(ii) 81,079,336,415 75,530,976,607 81,079,336,415 75,530,976,607
Overdrafts 7.3(iii) 4,941,689,813 3,725,334,781 4,941,689,813 3,725,334,781
Bills purchased and discounted 7.4 27,531,120,299 27,964,241,753 27,531,120,299 27,964,241,753
305,807,489,360 258,140,019,620 305,339,578,715 257,801,035,388
7.3(i) Loans
Rural credit 16,418,306,858 16,352,161,869 16,418,306,858 16,352,161,869
Loan small scale industries 53,531,966,633 45,471,101,185 55,501,838,185 47,063,597,272
Transport loans 122,957,279 78,084,196 122,957,279 78,084,196
General House Building Loan 1,312,063,347 1,244,049,825 1,312,063,347 1,244,049,825
Loan-General 4,528,505,451 4,245,850,185 4,528,505,451 4,245,850,185
Loan against import merchandise 2,208,530,073 2,171,877,515 2,208,530,073 2,171,877,515
Loan against trust receipts 48,829,330,082 37,884,749,655 48,829,330,082 37,884,749,655
Packing credit 2,607,888,799 2,451,322,941 2,607,888,799 2,451,322,941
Staff House Building Loan 23,544,507,192 14,761,394,636 23,544,507,192 14,761,394,636
Loans against P.F. 2,203,662 19,034,443 2,203,662 19,034,443
Loan against DPS/SPS 61,023,903 37,854,770 61,023,903 37,854,770
Rural housing 270,790 221,952 270,790 221,952
Staff Cyclone Advances 4,039 4,039 4,039 4,039
Bridge finance 16,699,137 23,143,478 16,699,137 23,143,478
Credit card 8,756,065 6,901,501 8,756,065 6,901,501
Payment Against Document (PAD)-Cash 14,195,079,671 14,179,879,987 14,195,079,671 14,179,879,987
Payment Against Document (PAD)-AID/ Grant etc. 187,608,416 22,682,355 187,608,416 22,682,355
Payment Against Document (PAD)-WES 3,436,563,106 3,214,934,021 3,436,563,106 3,214,934,021
Payment Against Document(PAD)-Inland 5,033,981 2,365,900 5,033,981 2,365,900
Payment Against Document(PAD)-Back to Back 10,504,637,292 5,554,516,891 10,504,637,292 5,554,516,891
Payment Against Document(PAD)-GMT 29,923,976 68,401,700 29,923,976 68,401,700
Loan against cash subsidy/Cash Assistance 276,836,847 226,639,989 276,836,847 226,639,989
Payment Against Document(PAD)-F.C cash 206,409,837 153,056,073 206,409,837 153,056,073
Payment Against Document(PAD) -EDF 356,401,227 18,055,692 356,401,227 18,055,692
Demand loan (Cash) 6,560,173,795 485,482,768 6,560,173,795 485,482,768
Staff computer loan 594,352,992 91,743,208 594,352,992 91,743,208
Executive car loan 257,187,547 220,472,186 257,187,547 220,472,186
Special loan for service holders 6,899 - 6,899 -
Loans foreign bills - - - -
Loan against micro savings deposit 614,104 556,031 614,104 556,031
B.M.R.E Loan 13,717,636 1,447,169 13,717,636 1,447,169
Margin loan 2,437,782,197 1,931,480,319 - -
192,255,342,833 150,919,466,479 191,787,432,188 150,580,482,247
7.3(ii) Cash credits
Cash credit 72,595,694,091 66,875,089,249 72,595,694,091 66,875,089,249
Export cash credit 8,481,965,786 8,654,276,240 8,481,965,786 8,654,276,240
Weavers cash credit 1,676,538 1,611,118 1,676,538 1,611,118
81,079,336,415 75,530,976,607 81,079,336,415 75,530,976,607
7.3(iii) Overdrafts
Clean overdraft 50,732,105 47,041,812 50,732,105 47,041,812
Temporary overdraft 160,245,237 95,429,498 160,245,237 95,429,498
Secured overdraft 4,730,712,471 3,582,863,471 4,730,712,471 3,582,863,471
4,941,689,813 3,725,334,781 4,941,689,813 3,725,334,781
Consolidated Bank
Loans, cash credits and overdrafts- including
bills purchased and discounted (Loan category wise)
43
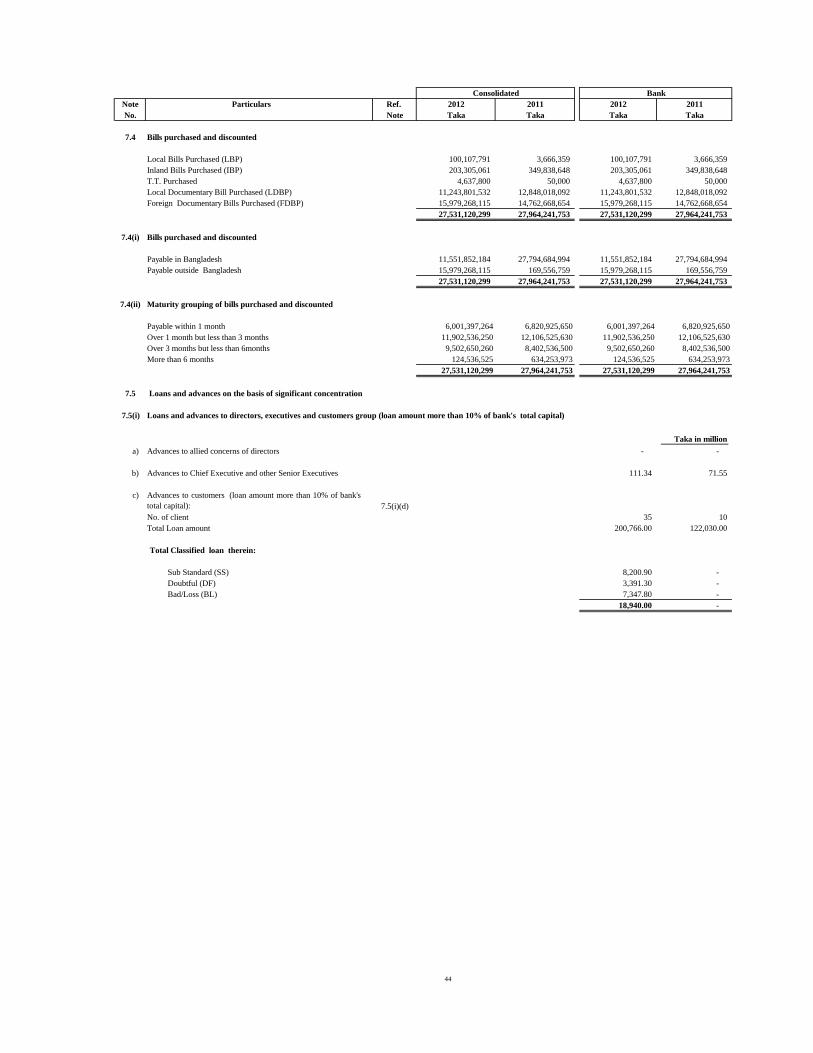
Note Particulars Ref. 2012 2011 2012 2011
No. Note Taka Taka Taka Taka
7.4 Bills purchased and discounted
Local Bills Purchased (LBP) 100,107,791 3,666,359 100,107,791 3,666,359
Inland Bills Purchased (IBP) 203,305,061 349,838,648 203,305,061 349,838,648
T.T. Purchased 4,637,800 50,000 4,637,800 50,000
Local Documentary Bill Purchased (LDBP) 11,243,801,532 12,848,018,092 11,243,801,532 12,848,018,092
Foreign Documentary Bills Purchased (FDBP) 15,979,268,115 14,762,668,654 15,979,268,115 14,762,668,654
27,531,120,299 27,964,241,753 27,531,120,299 27,964,241,753
7.4(i) Bills purchased and discounted
Payable in Bangladesh 11,551,852,184 27,794,684,994 11,551,852,184 27,794,684,994
Payable outside Bangladesh 15,979,268,115 169,556,759 15,979,268,115 169,556,759
27,531,120,299 27,964,241,753 27,531,120,299 27,964,241,753
7.4(ii) Maturity grouping of bills purchased and discounted
Payable within 1 month 6,001,397,264 6,820,925,650 6,001,397,264 6,820,925,650
Over 1 month but less than 3 months 11,902,536,250 12,106,525,630 11,902,536,250 12,106,525,630
Over 3 months but less than 6months 9,502,650,260 8,402,536,500 9,502,650,260 8,402,536,500
More than 6 months 124,536,525 634,253,973 124,536,525 634,253,973
27,531,120,299 27,964,241,753 27,531,120,299 27,964,241,753
7.5 Loans and advances on the basis of significant concentration
7.5(i)
Taka in million
a) Advances to allied concerns of directors - -
b) Advances to Chief Executive and other Senior Executives 111.34 71.55
c)
7.5(i)(d)
No. of client 35 10
Total Loan amount 200,766.00 122,030.00
Total Classified loan therein:
Sub Standard (SS) 8,200.90 -
Doubtful (DF) 3,391.30 -
Bad/Loss (BL) 7,347.80 -
18,940.00 -
Consolidated Bank
Loans and advances to directors, executives and customers group (loan amount more than 10% of bank's total capital)
Advances to customers (loan amount more than 10% of bank's
total capital):
44
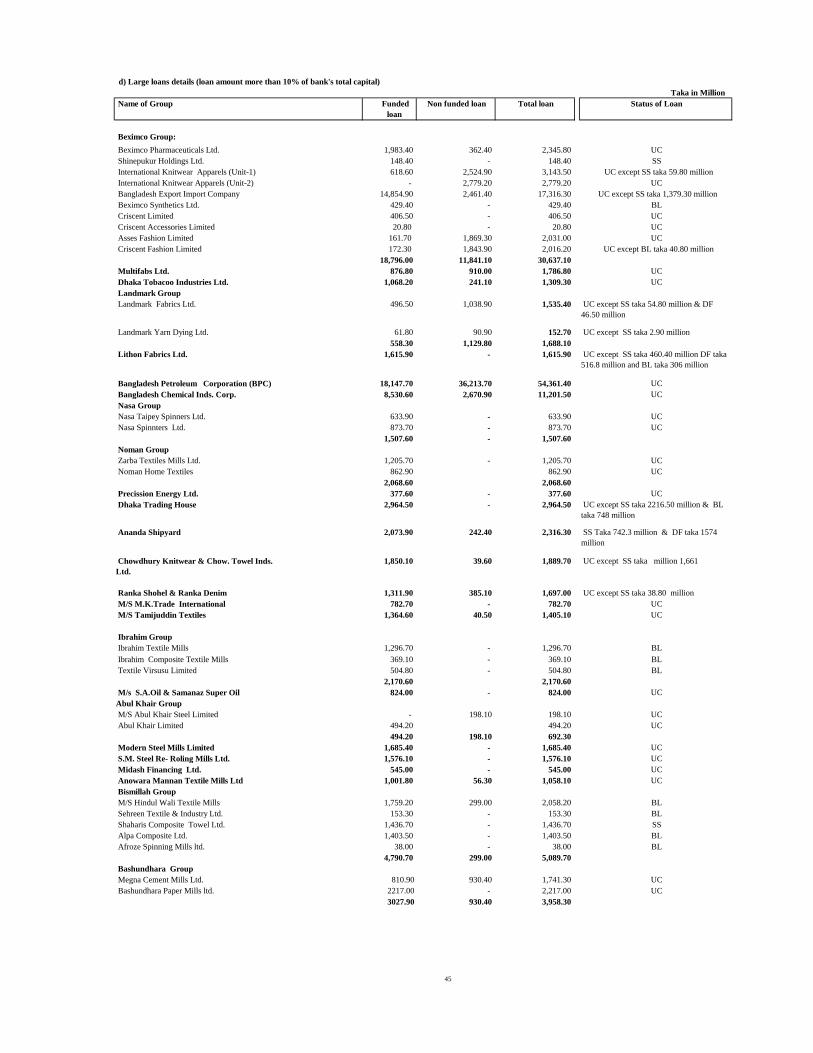
d) Large loans details (loan amount more than 10% of bank's total capital)
1,983.40 362.40 2,345.80
148.40 - 148.40
618.60 2,524.90 3,143.50
- 2,779.20 2,779.20
14,854.90 2,461.40 17,316.30
429.40 - 429.40
406.50 - 406.50
20.80 - 20.80
161.70 1,869.30 2,031.00
172.30 1,843.90 2,016.20
11,841.10 30,637.10
876.80 910.00 1,786.80
1,068.20 241.10 1,309.30
496.50 1,038.90 1,535.40
61.80 90.90 152.70
558.30 1,129.80 1,688.10
1,615.90 - 1,615.90
36,213.70 54,361.40
8,530.60 2,670.90 11,201.50
633.90 - 633.90
873.70 - 873.70
1,507.60 - 1,507.60
1,205.70 - 1,205.70
862.90 862.90
2,068.60 2,068.60
377.60 - 377.60
2,964.50 - 2,964.50
2,073.90 242.40 2,316.30
1,850.10 39.60 1,889.70
1,311.90 385.10 1,697.00
782.70 - 782.70
1,364.60 40.50 1,405.10
1,296.70 - 1,296.70
369.10 - 369.10
504.80 - 504.80
2,170.60 2,170.60
824.00 - 824.00
- 198.10 198.10
494.20 494.20
494.20 198.10 692.30
1,685.40 - 1,685.40
1,576.10 - 1,576.10
545.00 - 545.00
1,001.80 56.30 1,058.10
1,759.20 299.00 2,058.20
153.30 - 153.30
1,436.70 - 1,436.70
1,403.50 - 1,403.50
38.00 - 38.00
4,790.70 299.00 5,089.70
810.90 930.40 1,741.30
2217.00 - 2,217.00
3027.90 930.40 3,958.30
BL
Sehreen Textile & Industry Ltd. BL
Shaharis Composite Towel Ltd. SS
Alpa Composite Ltd.
Afroze Spinning Mills ltd.
UC
UC
UC
Bashundhara Group
Megna Cement Mills Ltd.
Bashundhara Paper Mills ltd.
BL
Modern Steel Mills Limited
S.M. Steel Re- Roling Mills Ltd.
Midash Financing Ltd.
Anowara Mannan Textile Mills Ltd
Bismillah Group
M/S Hindul Wali Textile Mills
Textile Virsusu Limited BL
M/s S.A.Oil & Samanaz Super Oil
Abul Khair Group
M/S Abul Khair Steel Limited
Abul Khair Limited
UC
UC
UC
M/S Tamijuddin Textiles
Ibrahim Textile Mills BL
Ibrahim Composite Textile Mills BL
UC
Ibrahim Group
Chowdhury Knitwear & Chow. Towel Inds.
Ltd.
UC except SS taka million 1,661
Ranka Shohel & Ranka Denim UC except SS taka 38.80 million
M/S M.K.Trade International
UC
UC
UC
UC
UC
Dhaka Trading House UC except SS taka 2216.50 million & BL
taka 748 million
Ananda Shipyard SS Taka 742.3 million & DF taka 1574
million
UC
UC
UC
Nasa Taipey Spinners Ltd.
Nasa Spinnters Ltd.
Noman Group
Zarba Textiles Mills Ltd.
Noman Home Textiles
Precission Energy Ltd.
18,796.00
UC except SS taka 2.90 million
Bangladesh Petroleum Corporation (BPC) UC
Bangladesh Chemical Inds. Corp.
Nasa Group
18,147.70
Dhaka Tobacoo Industries Ltd.
Landmark Group
Landmark Fabrics Ltd.
Landmark Yarn Dying Ltd.
Lithon Fabrics Ltd. UC except SS taka 460.40 million DF taka
516.8 million and BL taka 306 million
UC except SS taka 54.80 million & DF
46.50 million
UC except SS taka 1,379.30 million
Criscent Limited
Criscent Accessories Limited
Asses Fashion Limited
Criscent Fashion Limited
Beximco Synthetics Ltd. BL
UC except BL taka 40.80 million
UC except SS taka 59.80 million
Beximco Group:
Beximco Pharmaceuticals Ltd.
Shinepukur Holdings Ltd.
International Knitwear Apparels (Unit-1)
International Knitwear Apparels (Unit-2)
Name of Group Funded
loan
Non funded loan
Multifabs Ltd.
Status of Loan
UC
SS
UC
UC
UC
Bangladesh Export Import Company
Taka in Million
Total loan
UC
UC
UC
UC
BL
UC
45
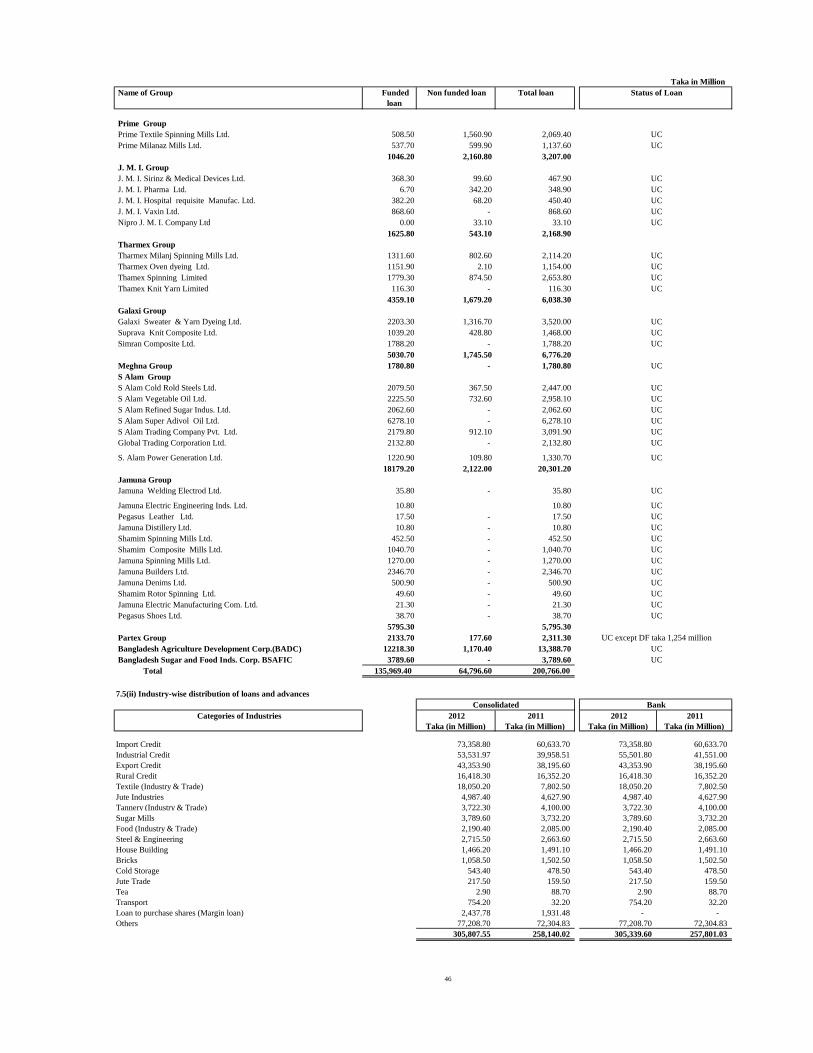
508.50 1,560.90 2,069.40
537.70 599.90 1,137.60
1046.20 2,160.80 3,207.00
368.30 99.60 467.90
6.70 342.20 348.90
382.20 68.20 450.40
868.60 - 868.60
0.00 33.10 33.10
1625.80 543.10 2,168.90
1311.60 802.60 2,114.20
1151.90 2.10 1,154.00
1779.30 874.50 2,653.80
116.30 - 116.30
4359.10 1,679.20 6,038.30
2203.30 1,316.70 3,520.00
1039.20 428.80 1,468.00
1788.20 - 1,788.20
5030.70 1,745.50 6,776.20
1780.80 - 1,780.80
2079.50 367.50 2,447.00
2225.50 732.60 2,958.10
2062.60 - 2,062.60
6278.10 - 6,278.10
2179.80 912.10 3,091.90
2132.80 - 2,132.80
1220.90 109.80 1,330.70
18179.20 2,122.00 20,301.20
35.80 - 35.80
10.80 10.80
17.50 - 17.50
10.80 - 10.80
452.50 - 452.50
1040.70 - 1,040.70
1270.00 - 1,270.00
2346.70 - 2,346.70
500.90 - 500.90
49.60 - 49.60
21.30 - 21.30
38.70 - 38.70
5795.30 5,795.30
2133.70 177.60 2,311.30
12218.30 1,170.40 13,388.70
3789.60 - 3,789.60
64,796.60 200,766.00
7.5(ii) Industry-wise distribution of loans and advances
2012
Taka (in Million)
2011
Taka (in Million)
2012
Taka (in Million)
2011
Taka (in Million)
Import Credit 73,358.80 60,633.70 73,358.80 60,633.70
Industrial Credit 53,531.97 39,958.51 55,501.80 41,551.00
Export Credit 43,353.90 38,195.60 43,353.90 38,195.60
Rural Credit 16,418.30 16,352.20 16,418.30 16,352.20
Textile (Industry & Trade) 18,050.20 7,802.50 18,050.20 7,802.50
Jute Industries 4,987.40 4,627.90 4,987.40 4,627.90
Tannery (Industry & Trade) 3,722.30 4,100.00 3,722.30 4,100.00
Sugar Mills 3,789.60 3,732.20 3,789.60 3,732.20
Food (Industry & Trade) 2,190.40 2,085.00 2,190.40 2,085.00
Steel & Engineering 2,715.50 2,663.60 2,715.50 2,663.60
House Building 1,466.20 1,491.10 1,466.20 1,491.10
Bricks 1,058.50 1,502.50 1,058.50 1,502.50
Cold Storage 543.40 478.50 543.40 478.50
Jute Trade 217.50 159.50 217.50 159.50
Tea 2.90 88.70 2.90 88.70
Transport 754.20 32.20 754.20 32.20
Loan to purchase shares (Margin loan) 2,437.78 1,931.48 - -
Others 77,208.70 72,304.83 77,208.70 72,304.83
305,807.55 258,140.02 305,339.60 257,801.03
Jamuna Spinning Mills Ltd.
Jamuna Builders Ltd.
Taka in Million
Name of Group Funded
loan
Non funded loan
S Alam Cold Rold Steels Ltd.
S Alam Vegetable Oil Ltd.
135,969.40
Jamuna Electric Manufacturing Com. Ltd.
Pegasus Shoes Ltd.
Partex Group
Bangladesh Agriculture Development Corp.(BADC)
Bangladesh Sugar and Food Inds. Corp. BSAFIC
Total
Shamim Rotor Spinning Ltd.
S. Alam Power Generation Ltd.
Jamuna Group
Jamuna Welding Electrod Ltd.
Jamuna Electric Engineering Inds. Ltd.
Pegasus Leather Ltd.
Jamuna Distillery Ltd.
Shamim Spinning Mills Ltd.
Shamim Composite Mills Ltd.
Jamuna Denims Ltd.
S Alam Refined Sugar Indus. Ltd.
S Alam Super Adivol Oil Ltd.
S Alam Trading Company Pvt. Ltd.
Global Trading Corporation Ltd.
Galaxi Group
Galaxi Sweater & Yarn Dyeing Ltd.
Suprava Knit Composite Ltd.
Simran Composite Ltd.
Meghna Group
S Alam Group
J. M. I. Vaxin Ltd.
Nipro J. M. I. Company Ltd
Tharmex Milanj Spinning Mills Ltd.
Tharmex Oven dyeing Ltd.
Thamex Spinning Limited
Thamex Knit Yarn Limited
Tharmex Group
Prime Textile Spinning Mills Ltd.
Prime Milanaz Mills Ltd.
J. M. I. Group
J. M. I. Sirinz & Medical Devices Ltd.
J. M. I. Pharma Ltd.
J. M. I. Hospital requisite Manufac. Ltd.
Prime Group
Total loan Status of Loan
Bank
Categories of Industries
Consolidated
UC
UC
UC
UC
UC
UC
UC
UC
UC
UC
UC
UC
UC
UC
UC
UC
UC
UC
UC
UC
UC
UC
UC
UC
UC
UC
UC
UC
UC
UC
UC
UC
UC except DF taka 1,254 million
UC
UC
UC
UC
46
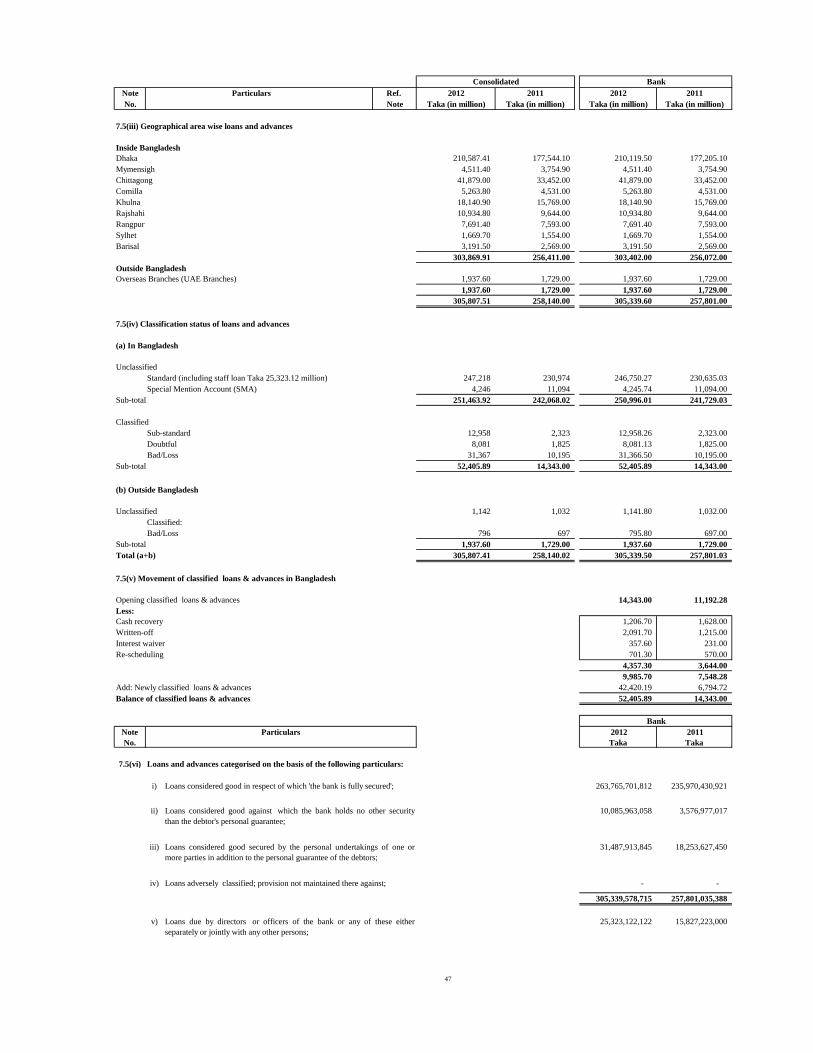
Note Particulars Ref. 2012 2011 2012 2011
No. Note Taka (in million) Taka (in million) Taka (in million) Taka (in million)
7.5(iii) Geographical area wise loans and advances
Inside Bangladesh
Dhaka 210,587.41 177,544.10 210,119.50 177,205.10
Mymensigh 4,511.40 3,754.90 4,511.40 3,754.90
Chittagong 41,879.00 33,452.00 41,879.00 33,452.00
Comilla 5,263.80 4,531.00 5,263.80 4,531.00
Khulna 18,140.90 15,769.00 18,140.90 15,769.00
Rajshahi 10,934.80 9,644.00 10,934.80 9,644.00
Rangpur 7,691.40 7,593.00 7,691.40 7,593.00
Sylhet 1,669.70 1,554.00 1,669.70 1,554.00
Barisal 3,191.50 2,569.00 3,191.50 2,569.00
303,869.91 256,411.00 303,402.00 256,072.00
Outside Bangladesh
Overseas Branches (UAE Branches) 1,937.60 1,729.00 1,937.60 1,729.00
1,937.60 1,729.00 1,937.60 1,729.00
305,807.51 258,140.00 305,339.60 257,801.00
7.5(iv) Classification status of loans and advances
(a) In Bangladesh
Unclassified
Standard (including staff loan Taka 25,323.12 million) 247,218 230,974 246,750.27 230,635.03
Special Mention Account (SMA) 4,246 11,094 4,245.74 11,094.00
Sub-total 251,463.92 242,068.02 250,996.01 241,729.03
Classified
Sub-standard 12,958 2,323 12,958.26 2,323.00
Doubtful 8,081 1,825 8,081.13 1,825.00
Bad/Loss 31,367 10,195 31,366.50 10,195.00
Sub-total 52,405.89 14,343.00 52,405.89 14,343.00
(b) Outside Bangladesh
Unclassified 1,142 1,032 1,141.80 1,032.00
Classified:
Bad/Loss 796 697 795.80 697.00
Sub-total 1,937.60 1,729.00 1,937.60 1,729.00
Total (a+b) 305,807.41 258,140.02 305,339.50 257,801.03
7.5(v) Movement of classified loans & advances in Bangladesh
Opening classified loans & advances 14,343.00 11,192.28
Less:
Cash recovery 1,206.70 1,628.00
Written-off 2,091.70 1,215.00
Interest waiver 357.60 231.00
Re-scheduling 701.30 570.00
4,357.30 3,644.00
9,985.70 7,548.28
Add: Newly classified loans & advances 42,420.19 6,794.72
Balance of classified loans & advances 52,405.89 14,343.00
Note
No.
2012
Taka
2011
Taka
7.5(vi)
i) 263,765,701,812 235,970,430,921
ii) 10,085,963,058 3,576,977,017
iii) 31,487,913,845 18,253,627,450
iv) - -
305,339,578,715 257,801,035,388
v) 25,323,122,122 15,827,223,000
BankConsolidated
Particulars
Loans and advances categorised on the basis of the following particulars:
Loans considered good in respect of which 'the bank is fully secured';
Loans considered good against which the bank holds no other security
than the debtor's personal guarantee;
Bank
Loans considered good secured by the personal undertakings of one or
more parties in addition to the personal guarantee of the debtors;
Loans adversely classified; provision not maintained there against;
Loans due by directors or officers of the bank or any of these either
separately or jointly with any other persons;
47
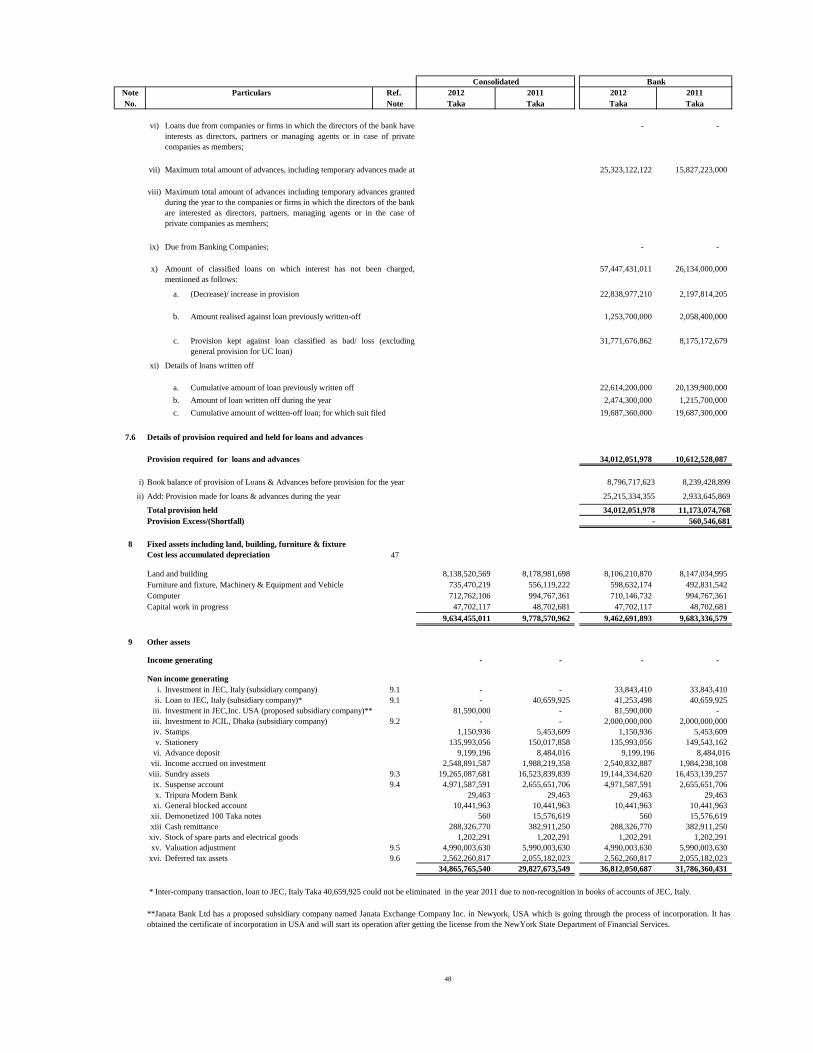
Note Particulars Ref. 2012 2011 2012 2011
No. Note Taka Taka Taka Taka
vi) - -
vii) 25,323,122,122 15,827,223,000
viii)
ix) - -
x) 57,447,431,011 26,134,000,000
a. (Decrease)/ increase in provision 22,838,977,210 2,197,814,205
b. Amount realised against loan previously written-off 1,253,700,000 2,058,400,000
c. 31,771,676,862 8,175,172,679
xi) Details of loans written off
a. Cumulative amount of loan previously written off 22,614,200,000 20,139,900,000
b. Amount of loan written off during the year 2,474,300,000 1,215,700,000
c. Cumulative amount of written-off loan; for which suit filed 19,687,360,000 19,687,300,000
7.6 Details of provision required and held for loans and advances
Provision required for loans and advances 34,012,051,978 10,612,528,087
i) 8,796,717,623 8,239,428,899
ii) 25,215,334,355 2,933,645,869
34,012,051,978 11,173,074,768
Provision Excess/(Shortfall) - 560,546,681
8
47
Land and building 8,138,520,569 8,178,981,698 8,106,210,870 8,147,034,995
735,470,219 556,119,222 598,632,174 492,831,542
Computer 712,762,106 994,767,361 710,146,732 994,767,361
Capital work in progress 47,702,117 48,702,681 47,702,117 48,702,681
9,634,455,011 9,778,570,962 9,462,691,893 9,683,336,579
9 Other assets
Income generating - - - -
Non income generating
i. Investment in JEC, Italy (subsidiary company) 9.1 - - 33,843,410 33,843,410
ii. Loan to JEC, Italy (subsidiary company)* 9.1 - 40,659,925 41,253,498 40,659,925
iii. Investment in JEC,Inc. USA (proposed subsidiary company)** 81,590,000 - 81,590,000 -
iii. Investment to JCIL, Dhaka (subsidiary company) 9.2 - - 2,000,000,000 2,000,000,000
iv. Stamps 1,150,936 5,453,609 1,150,936 5,453,609
v. Stationery 135,993,056 150,017,858 135,993,056 149,543,162
vi. Advance deposit 9,199,196 8,484,016 9,199,196 8,484,016
vii. Income accrued on investment 2,548,891,587 1,988,219,358 2,540,832,887 1,984,238,108
viii. Sundry assets 9.3 19,265,087,681 16,523,839,839 19,144,334,620 16,453,139,257
ix. Suspense account 9.4 4,971,587,591 2,655,651,706 4,971,587,591 2,655,651,706
x. Tripura Modern Bank 29,463 29,463 29,463 29,463
xi. General blocked account 10,441,963 10,441,963 10,441,963 10,441,963
xii. Demonetized 100 Taka notes 560 15,576,619 560 15,576,619
xiii Cash remittance 288,326,770 382,911,250 288,326,770 382,911,250
xiv. Stock of spare parts and electrical goods 1,202,291 1,202,291 1,202,291 1,202,291
xv. Valuation adjustment 9.5 4,990,003,630 5,990,003,630 4,990,003,630 5,990,003,630
xvi. Deferred tax assets 9.6 2,562,260,817 2,055,182,023 2,562,260,817 2,055,182,023
34,865,765,540 29,827,673,549 36,812,050,687 31,786,360,431
Bank
Total provision held
Due from Banking Companies;
Amount of classified loans on which interest has not been charged,
mentioned as follows:
**Janata Bank Ltd has a proposed subsidiary company named Janata Exchange Company Inc. in Newyork, USA which is going through the process of incorporation. It has
obtained the certificate of incorporation in USA and will start its operation after getting the license from the NewYork State Department of Financial Services.
* Inter-company transaction, loan to JEC, Italy Taka 40,659,925 could not be eliminated in the year 2011 due to non-recognition in books of accounts of JEC, Italy.
Add: Provision made for loans & advances during the year
Furniture and fixture, Machinery & Equipment and Vehicle
Book balance of provision of Loans & Advances before provision for the year
Fixed assets including land, building, furniture & fixture
Cost less accumulated depreciation
Maximum total amount of advances, including temporary advances made at
Maximum total amount of advances including temporary advances granted
during the year to the companies or firms in which the directors of the bank
are interested as directors, partners, managing agents or in the case of
private companies as members;
Loans due from companies or firms in which the directors of the bank have
interests as directors, partners or managing agents or in case of private
companies as members;
Provision kept against loan classified as bad/ loss (excluding
general provision for UC loan)
Consolidated
48
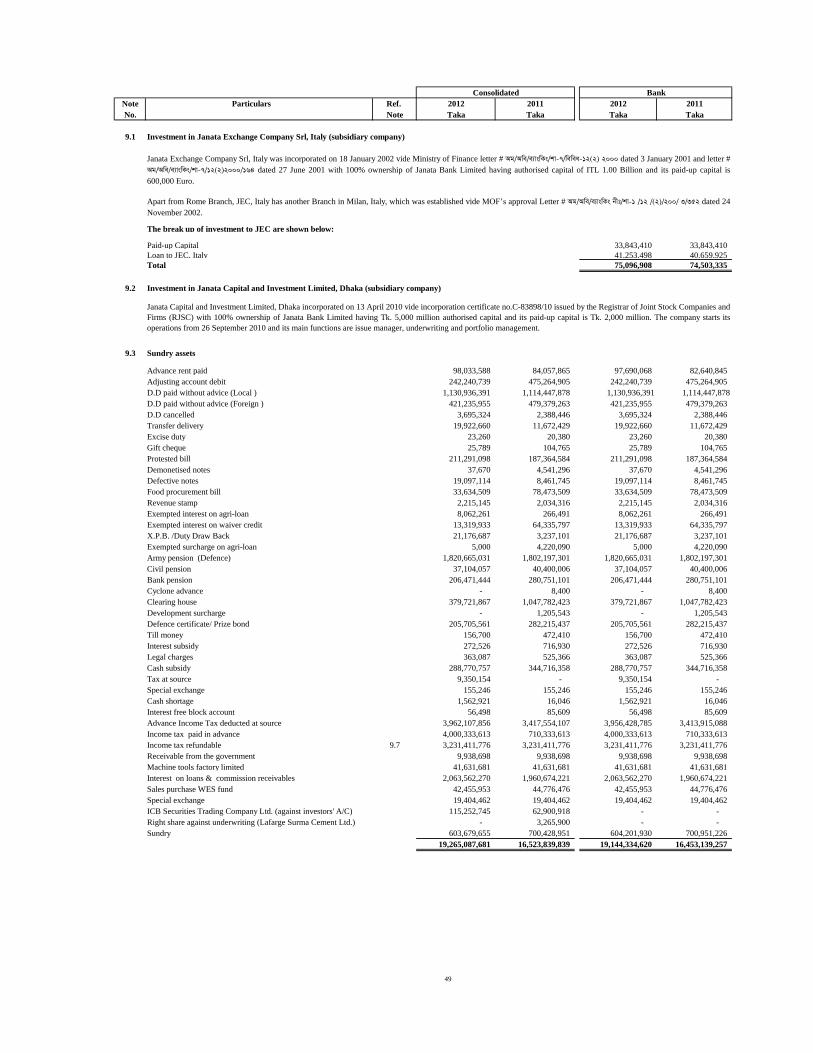
Note Particulars Ref. 2012 2011 2012 2011
No. Note Taka Taka Taka Taka
9.1 Investment in Janata Exchange Company Srl, Italy (subsidiary company)
The break up of investment to JEC are shown below:
Paid-up Capital 33,843,410 33,843,410
Loan to JEC, Italy 41,253,498 40,659,925
Total 75,096,908 74,503,335
9.2 Investment in Janata Capital and Investment Limited, Dhaka (subsidiary company)
9.3 Sundry assets
Advance rent paid 98,033,588 84,057,865 97,690,068 82,640,845
Adjusting account debit 242,240,739 475,264,905 242,240,739 475,264,905
D.D paid without advice (Local ) 1,130,936,391 1,114,447,878 1,130,936,391 1,114,447,878
D.D paid without advice (Foreign ) 421,235,955 479,379,263 421,235,955 479,379,263
D.D cancelled 3,695,324 2,388,446 3,695,324 2,388,446
Transfer delivery 19,922,660 11,672,429 19,922,660 11,672,429
Excise duty 23,260 20,380 23,260 20,380
Gift cheque 25,789 104,765 25,789 104,765
Protested bill 211,291,098 187,364,584 211,291,098 187,364,584
Demonetised notes 37,670 4,541,296 37,670 4,541,296
Defective notes 19,097,114 8,461,745 19,097,114 8,461,745
Food procurement bill 33,634,509 78,473,509 33,634,509 78,473,509
Revenue stamp 2,215,145 2,034,316 2,215,145 2,034,316
Exempted interest on agri-loan 8,062,261 266,491 8,062,261 266,491
Exempted interest on waiver credit 13,319,933 64,335,797 13,319,933 64,335,797
X.P.B. /Duty Draw Back 21,176,687 3,237,101 21,176,687 3,237,101
Exempted surcharge on agri-loan 5,000 4,220,090 5,000 4,220,090
Army pension (Defence) 1,820,665,031 1,802,197,301 1,820,665,031 1,802,197,301
Civil pension 37,104,057 40,400,006 37,104,057 40,400,006
Bank pension 206,471,444 280,751,101 206,471,444 280,751,101
Cyclone advance - 8,400 - 8,400
Clearing house 379,721,867 1,047,782,423 379,721,867 1,047,782,423
Development surcharge - 1,205,543 - 1,205,543
Defence certificate/ Prize bond 205,705,561 282,215,437 205,705,561 282,215,437
Till money 156,700 472,410 156,700 472,410
Interest subsidy 272,526 716,930 272,526 716,930
Legal charges 363,087 525,366 363,087 525,366
Cash subsidy 288,770,757 344,716,358 288,770,757 344,716,358
Tax at source 9,350,154 - 9,350,154 -
Special exchange 155,246 155,246 155,246 155,246
Cash shortage 1,562,921 16,046 1,562,921 16,046
Interest free block account 56,498 85,609 56,498 85,609
Advance Income Tax deducted at source 3,962,107,856 3,417,554,107 3,956,428,785 3,413,915,088
Income tax paid in advance 4,000,333,613 710,333,613 4,000,333,613 710,333,613
Income tax refundable 9.7 3,231,411,776 3,231,411,776 3,231,411,776 3,231,411,776
Receivable from the government 9,938,698 9,938,698 9,938,698 9,938,698
Machine tools factory limited 41,631,681 41,631,681 41,631,681 41,631,681
Interest on loans & commission receivables 2,063,562,270 1,960,674,221 2,063,562,270 1,960,674,221
Sales purchase WES fund 42,455,953 44,776,476 42,455,953 44,776,476
Special exchange 19,404,462 19,404,462 19,404,462 19,404,462
ICB Securities Trading Company Ltd. (against investors' A/C) 115,252,745 62,900,918 - -
Right share against underwriting (Lafarge Surma Cement Ltd.) - 3,265,900 - -
Sundry 603,679,655 700,428,951 604,201,930 700,951,226
19,265,087,681 16,523,839,839 19,144,334,620 16,453,139,257
Janata Capital and Investment Limited, Dhaka incorporated on 13 April 2010 vide incorporation certificate no.C-83898/10 issued by the Registrar of Joint Stock Companies and
Firms (RJSC) with 100% ownership of Janata Bank Limited having Tk. 5,000 million authorised capital and its paid-up capital is Tk. 2,000 million. The company starts its
operations from 26 September 2010 and its main functions are issue manager, underwriting and portfolio management.
Consolidated
Janata Exchange Company Srl, Italy was incorporated on 18 January 2002 vide Ministry of Finance letter # Ag/Awe/e¨vswKs/kv-7/wewea-12(2) 2000 dated 3 January 2001 and letter #
Ag/Awe/e¨vswKs/kv-7/12(2)2000/164 dated 27 June 2001 with 100% ownership of Janata Bank Limited having authorised capital of ITL 1.00 Billion and its paid-up capital is
600,000 Euro.
Apart from Rome Branch, JEC, Italy has another Branch in Milan, Italy, which was established vide MOF’s approval Letter # Ag/Awe/e¨vswKs bxt/kv-1 /12 /(2)/200/ 3/352 dated 24
November 2002.
Bank
49
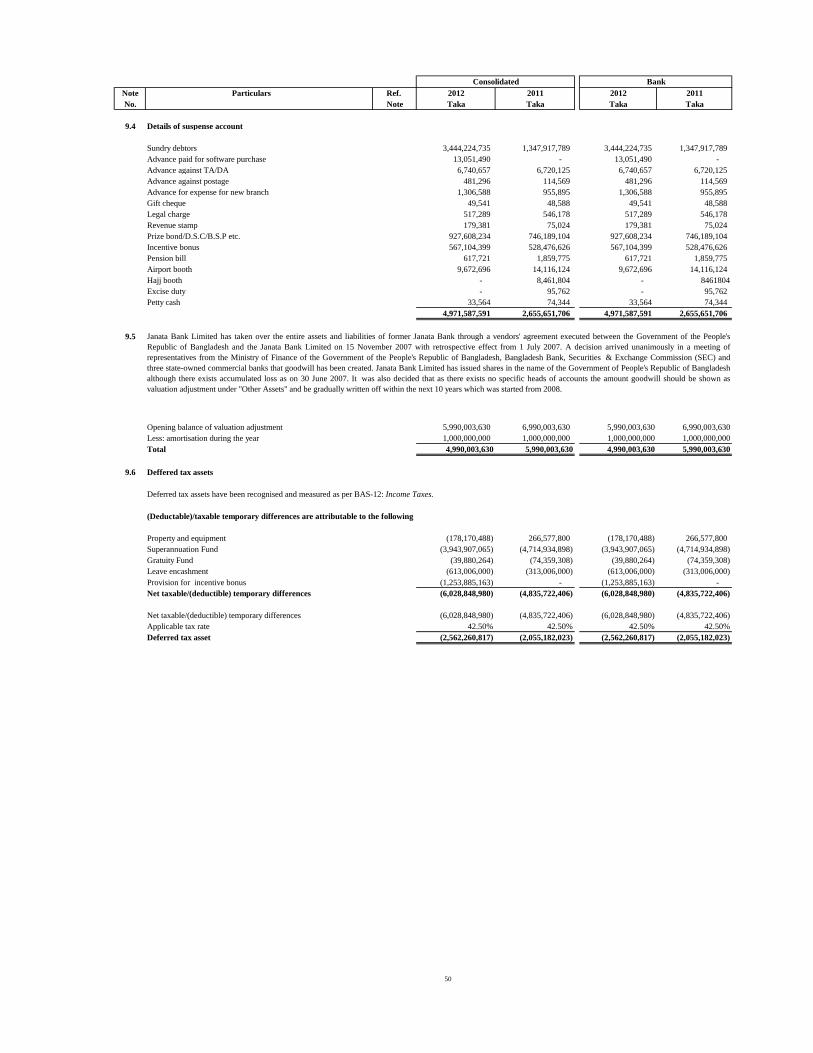
Note Particulars Ref. 2012 2011 2012 2011
No. Note Taka Taka Taka Taka
9.4 Details of suspense account
Sundry debtors 3,444,224,735 1,347,917,789 3,444,224,735 1,347,917,789
Advance paid for software purchase 13,051,490 - 13,051,490 -
Advance against TA/DA 6,740,657 6,720,125 6,740,657 6,720,125
Advance against postage 481,296 114,569 481,296 114,569
Advance for expense for new branch 1,306,588 955,895 1,306,588 955,895
Gift cheque 49,541 48,588 49,541 48,588
Legal charge 517,289 546,178 517,289 546,178
Revenue stamp 179,381 75,024 179,381 75,024
Prize bond/D.S.C/B.S.P etc. 927,608,234 746,189,104 927,608,234 746,189,104
Incentive bonus 567,104,399 528,476,626 567,104,399 528,476,626
Pension bill 617,721 1,859,775 617,721 1,859,775
Airport booth 9,672,696 14,116,124 9,672,696 14,116,124
Hajj booth - 8,461,804 - 8461804
Excise duty - 95,762 - 95,762
Petty cash 33,564 74,344 33,564 74,344
4,971,587,591 2,655,651,706 4,971,587,591 2,655,651,706
9.5
Opening balance of valuation adjustment 5,990,003,630 6,990,003,630 5,990,003,630 6,990,003,630
1,000,000,000 1,000,000,000 1,000,000,000 1,000,000,000
4,990,003,630 5,990,003,630 4,990,003,630 5,990,003,630
9.6
Deferred tax assets have been recognised and measured as per BAS-12: Income Taxes.
(178,170,488) 266,577,800 (178,170,488) 266,577,800
Superannuation Fund (3,943,907,065) (4,714,934,898) (3,943,907,065) (4,714,934,898)
Gratuity Fund (39,880,264) (74,359,308) (39,880,264) (74,359,308)
Leave encashment (613,006,000) (313,006,000) (613,006,000) (313,006,000)
Provision for incentive bonus (1,253,885,163) - (1,253,885,163) -
Net taxable/(deductible) temporary differences (6,028,848,980) (4,835,722,406) (6,028,848,980) (4,835,722,406)
Net taxable/(deductible) temporary differences (6,028,848,980) (4,835,722,406) (6,028,848,980) (4,835,722,406)
Applicable tax rate 42.50% 42.50% 42.50% 42.50%
Deferred tax asset (2,562,260,817) (2,055,182,023) (2,562,260,817) (2,055,182,023)
Deffered tax assets
Janata Bank Limited has taken over the entire assets and liabilities of former Janata Bank through a vendors' agreement executed between the Government of the People's
Republic of Bangladesh and the Janata Bank Limited on 15 November 2007 with retrospective effect from 1 July 2007. A decision arrived unanimously in a meeting of
representatives from the Ministry of Finance of the Government of the People's Republic of Bangladesh, Bangladesh Bank, Securities & Exchange Commission (SEC) and
three state-owned commercial banks that goodwill has been created. Janata Bank Limited has issued shares in the name of the Government of People's Republic of Bangladesh
although there exists accumulated loss as on 30 June 2007. It was also decided that as there exists no specific heads of accounts the amount goodwill should be shown as
valuation adjustment under "Other Assets" and be gradually written off within the next 10 years which was started from 2008.
Total
(Deductable)/taxable temporary differences are attributable to the following
Less: amortisation during the year
Bank
Property and equipment
Consolidated
50
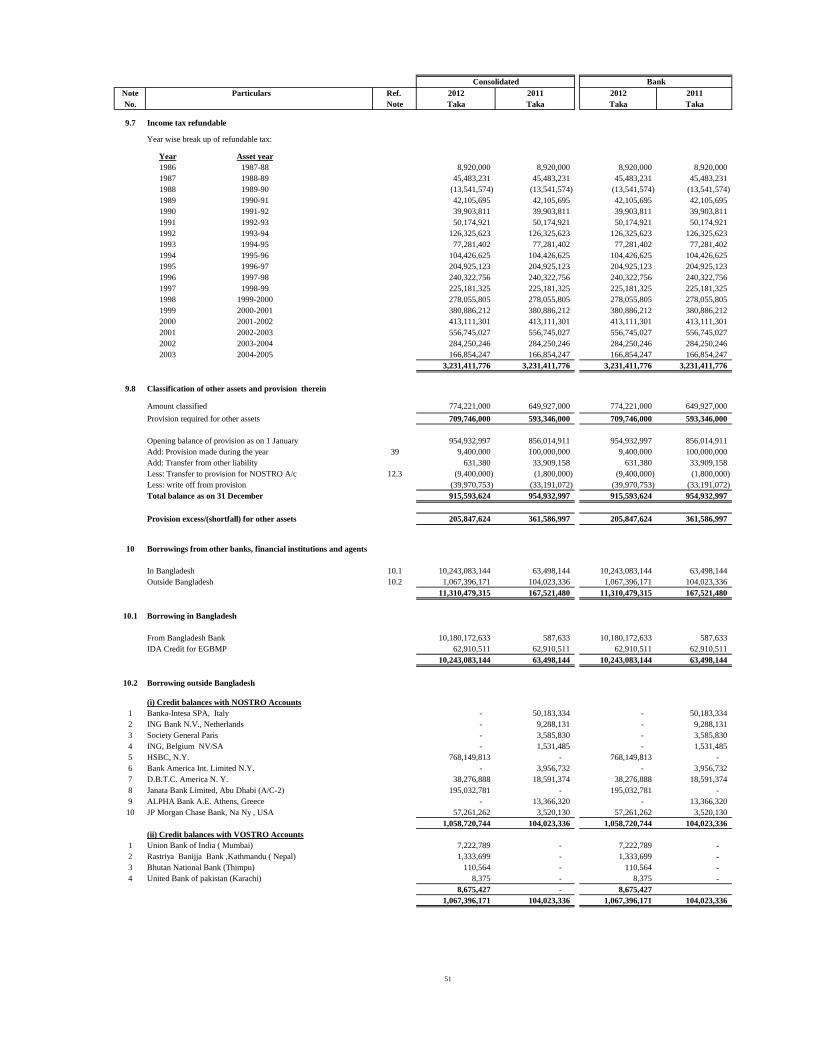
Note Particulars Ref. 2012 2011 2012 2011
No. Note Taka Taka Taka Taka
9.7 Income tax refundable
Year wise break up of refundable tax:
8,920,000 8,920,000 8,920,000 8,920,000
45,483,231 45,483,231 45,483,231 45,483,231
(13,541,574) (13,541,574) (13,541,574) (13,541,574)
42,105,695 42,105,695 42,105,695 42,105,695
39,903,811 39,903,811 39,903,811 39,903,811
50,174,921 50,174,921 50,174,921 50,174,921
126,325,623 126,325,623 126,325,623 126,325,623
77,281,402 77,281,402 77,281,402 77,281,402
104,426,625 104,426,625 104,426,625 104,426,625
204,925,123 204,925,123 204,925,123 204,925,123
240,322,756 240,322,756 240,322,756 240,322,756
225,181,325 225,181,325 225,181,325 225,181,325
278,055,805 278,055,805 278,055,805 278,055,805
380,886,212 380,886,212 380,886,212 380,886,212
413,111,301 413,111,301 413,111,301 413,111,301
556,745,027 556,745,027 556,745,027 556,745,027
284,250,246 284,250,246 284,250,246 284,250,246
166,854,247 166,854,247 166,854,247 166,854,247
3,231,411,776 3,231,411,776 3,231,411,776 3,231,411,776
9.8 Classification of other assets and provision therein
Amount classified 774,221,000 649,927,000 774,221,000 649,927,000
Provision required for other assets 709,746,000 593,346,000 709,746,000 593,346,000
Opening balance of provision as on 1 January 954,932,997 856,014,911 954,932,997 856,014,911
Add: Provision made during the year 39 9,400,000 100,000,000 9,400,000 100,000,000
Add: Transfer from other liability 631,380 33,909,158 631,380 33,909,158
Less: Transfer to provision for NOSTRO A/c 12.3 (9,400,000) (1,800,000) (9,400,000) (1,800,000)
Less: write off from provision (39,970,753) (33,191,072) (39,970,753) (33,191,072)
Total balance as on 31 December 915,593,624 954,932,997 915,593,624 954,932,997
Provision excess/(shortfall) for other assets 205,847,624 361,586,997 205,847,624 361,586,997
10
10.1 10,243,083,144 63,498,144 10,243,083,144 63,498,144
Outside Bangladesh 10.2 1,067,396,171 104,023,336 1,067,396,171 104,023,336
11,310,479,315 167,521,480 11,310,479,315 167,521,480
10.1 Borrowing in Bangladesh
From Bangladesh Bank 10,180,172,633 587,633 10,180,172,633 587,633
IDA Credit for EGBMP 62,910,511 62,910,511 62,910,511 62,910,511
10,243,083,144 63,498,144 10,243,083,144 63,498,144
10.2 Borrowing outside Bangladesh
(i) Credit balances with NOSTRO Accounts
1 Banka-Intesa SPA, Italy - 50,183,334 - 50,183,334
2 ING Bank N.V., Netherlands - 9,288,131 - 9,288,131
3 Society General Paris - 3,585,830 - 3,585,830
4 ING, Belgium NV/SA - 1,531,485 - 1,531,485
5 HSBC, N.Y. 768,149,813 - 768,149,813 -
6 Bank America Int. Limited N.Y. - 3,956,732 - 3,956,732
7 D.B.T.C. America N. Y. 38,276,888 18,591,374 38,276,888 18,591,374
8 Janata Bank Limited, Abu Dhabi (A/C-2) 195,032,781 - 195,032,781 -
9 ALPHA Bank A.E. Athens, Greece - 13,366,320 - 13,366,320
10 JP Morgan Chase Bank, Na Ny , USA 57,261,262 3,520,130 57,261,262 3,520,130
1,058,720,744 104,023,336 1,058,720,744 104,023,336
(ii) Credit balances with VOSTRO Accounts
1 Union Bank of India ( Mumbai) 7,222,789 - 7,222,789 -
2 Rastriya Banijja Bank ,Kathmandu ( Nepal) 1,333,699 - 1,333,699 -
3 Bhutan National Bank (Thimpu) 110,564 - 110,564 -
4 United Bank of pakistan (Karachi) 8,375 - 8,375 -
8,675,427 - 8,675,427
1,067,396,171 104,023,336 1,067,396,171 104,023,336
Borrowings from other banks, financial institutions and agents
2003-2004
1998
2003
2001-2002
1999-2000
2002
In Bangladesh
2004-2005
1994-951993
1996
1997
1993-94
2001 2002-2003
1992
1999 2000-2001
1990-91
1991-921990
1996-971995
BankConsolidated
1998-99
1997-98
Year
1995-96
2000
1994
Asset year
1987-88
1988-891987
1986
1988
1989
1991
1989-90
1992-93
51
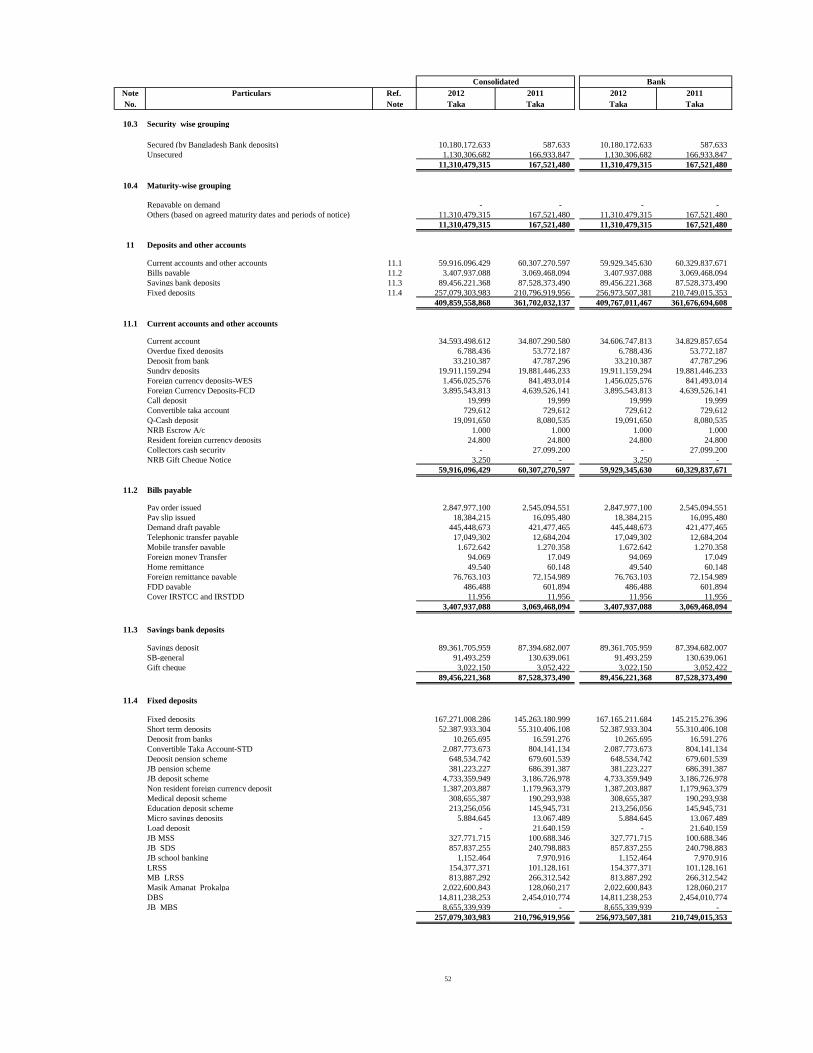
Note Particulars Ref. 2012 2011 2012 2011
No. Note Taka Taka Taka Taka
10.3 Security wise grouping
Secured (by Bangladesh Bank deposits) 10,180,172,633 587,633 10,180,172,633 587,633
Unsecured 1,130,306,682 166,933,847 1,130,306,682 166,933,847
11,310,479,315 167,521,480 11,310,479,315 167,521,480
10.4 Maturity-wise grouping
Repayable on demand - - - -
11,310,479,315 167,521,480 11,310,479,315 167,521,480
11,310,479,315 167,521,480 11,310,479,315 167,521,480
11 Deposits and other accounts
11.1 59,916,096,429 60,307,270,597 59,929,345,630 60,329,837,671
Bills payable 11.2 3,407,937,088 3,069,468,094 3,407,937,088 3,069,468,094
Savings bank deposits 11.3 89,456,221,368 87,528,373,490 89,456,221,368 87,528,373,490
Fixed deposits 11.4 257,079,303,983 210,796,919,956 256,973,507,381 210,749,015,353
409,859,558,868 361,702,032,137 409,767,011,467 361,676,694,608
11.1 Current accounts and other accounts
Current account 34,593,498,612 34,807,290,580 34,606,747,813 34,829,857,654
Overdue fixed deposits 6,788,436 53,772,187 6,788,436 53,772,187
Deposit from bank 33,210,387 47,787,296 33,210,387 47,787,296
Sundry deposits 19,911,159,294 19,881,446,233 19,911,159,294 19,881,446,233
Foreign currency deposits-WES 1,456,025,576 841,493,014 1,456,025,576 841,493,014
Foreign Currency Deposits-FCD 3,895,543,813 4,639,526,141 3,895,543,813 4,639,526,141
Call deposit 19,999 19,999 19,999 19,999
Convertible taka account 729,612 729,612 729,612 729,612
Q-Cash deposit 19,091,650 8,080,535 19,091,650 8,080,535
NRB Escrow A/c 1,000 1,000 1,000 1,000
Resident foreign currency deposits 24,800 24,800 24,800 24,800
Collectors cash security - 27,099,200 - 27,099,200
NRB Gift Cheque Notice 3,250 - 3,250 -
59,916,096,429 60,307,270,597 59,929,345,630 60,329,837,671
11.2 Bills payable
Pay order issued 2,847,977,100 2,545,094,551 2,847,977,100 2,545,094,551
Pay slip issued 18,384,215 16,095,480 18,384,215 16,095,480
Demand draft payable 445,448,673 421,477,465 445,448,673 421,477,465
Telephonic transfer payable 17,049,302 12,684,204 17,049,302 12,684,204
Mobile transfer payable 1,672,642 1,270,358 1,672,642 1,270,358
Foreign money Transfer 94,069 17,049 94,069 17,049
Home remittance 49,540 60,148 49,540 60,148
Foreign remittance payable 76,763,103 72,154,989 76,763,103 72,154,989
FDD payable 486,488 601,894 486,488 601,894
Cover IRSTCC and IRSTDD 11,956 11,956 11,956 11,956
3,407,937,088 3,069,468,094 3,407,937,088 3,069,468,094
11.3 Savings bank deposits
Savings deposit 89,361,705,959 87,394,682,007 89,361,705,959 87,394,682,007
SB-general 91,493,259 130,639,061 91,493,259 130,639,061
Gift cheque 3,022,150 3,052,422 3,022,150 3,052,422
89,456,221,368 87,528,373,490 89,456,221,368 87,528,373,490
11.4 Fixed deposits
Fixed deposits 167,271,008,286 145,263,180,999 167,165,211,684 145,215,276,396
Short term deposits 52,387,933,304 55,310,406,108 52,387,933,304 55,310,406,108
Deposit from banks 10,265,695 16,591,276 10,265,695 16,591,276
Convertible Taka Account-STD 2,087,773,673 804,141,134 2,087,773,673 804,141,134
Deposit pension scheme 648,534,742 679,601,539 648,534,742 679,601,539
JB pension scheme 381,223,227 686,391,387 381,223,227 686,391,387
JB deposit scheme 4,733,359,949 3,186,726,978 4,733,359,949 3,186,726,978
Non resident foreign currency deposit 1,387,203,887 1,179,963,379 1,387,203,887 1,179,963,379
Medical deposit scheme 308,655,387 190,293,938 308,655,387 190,293,938
Education deposit scheme 213,256,056 145,945,731 213,256,056 145,945,731
Micro savings deposits 5,884,645 13,067,489 5,884,645 13,067,489
Load deposit - 21,640,159 - 21,640,159
JB MSS 327,771,715 100,688,346 327,771,715 100,688,346
JB SDS 857,837,255 240,798,883 857,837,255 240,798,883
JB school banking 1,152,464 7,970,916 1,152,464 7,970,916
LRSS 154,377,371 101,128,161 154,377,371 101,128,161
MB LRSS 813,887,292 266,312,542 813,887,292 266,312,542
Masik Amanat Prokalpa 2,022,600,843 128,060,217 2,022,600,843 128,060,217
DBS 14,811,238,253 2,454,010,774 14,811,238,253 2,454,010,774
JB MBS 8,655,339,939 - 8,655,339,939 -
257,079,303,983 210,796,919,956 256,973,507,381 210,749,015,353
BankConsolidated
Current accounts and other accounts
Others (based on agreed maturity dates and periods of notice)
52
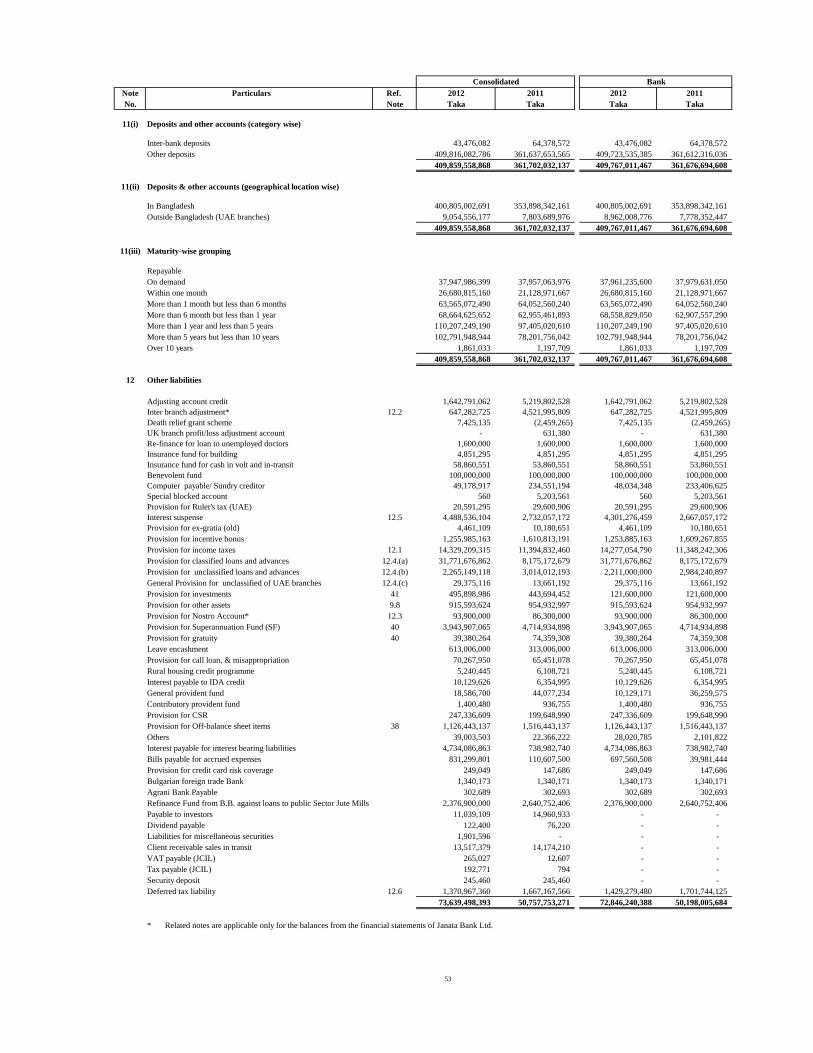
Note Particulars Ref. 2012 2011 2012 2011
No. Note Taka Taka Taka Taka
11(i) Deposits and other accounts (category wise)
Inter-bank deposits 43,476,082 64,378,572 43,476,082 64,378,572
Other deposits 409,816,082,786 361,637,653,565 409,723,535,385 361,612,316,036
409,859,558,868 361,702,032,137 409,767,011,467 361,676,694,608
11(ii) Deposits & other accounts (geographical location wise)
In Bangladesh 400,805,002,691 353,898,342,161 400,805,002,691 353,898,342,161
Outside Bangladesh (UAE branches) 9,054,556,177 7,803,689,976 8,962,008,776 7,778,352,447
409,859,558,868 361,702,032,137 409,767,011,467 361,676,694,608
11(iii) Maturity-wise grouping
Repayable
On demand 37,947,986,399 37,957,063,976 37,961,235,600 37,979,631,050
Within one month 26,680,815,160 21,128,971,667 26,680,815,160 21,128,971,667
More than 1 month but less than 6 months 63,565,072,490 64,052,560,240 63,565,072,490 64,052,560,240
More than 6 month but less than 1 year 68,664,625,652 62,955,461,893 68,558,829,050 62,907,557,290
More than 1 year and less than 5 years 110,207,249,190 97,405,020,610 110,207,249,190 97,405,020,610
More than 5 years but less than 10 years 102,791,948,944 78,201,756,042 102,791,948,944 78,201,756,042
Over 10 years 1,861,033 1,197,709 1,861,033 1,197,709
409,859,558,868 361,702,032,137 409,767,011,467 361,676,694,608
12 Other liabilities
Adjusting account credit 1,642,791,062 5,219,802,528 1,642,791,062 5,219,802,528
Inter branch adjustment* 12.2 647,282,725 4,521,995,809 647,282,725 4,521,995,809
Death relief grant scheme 7,425,135 (2,459,265) 7,425,135 (2,459,265)
UK branch profit/loss adjustment account - 631,380 - 631,380
Re-finance for loan to unemployed doctors 1,600,000 1,600,000 1,600,000 1,600,000
Insurance fund for building 4,851,295 4,851,295 4,851,295 4,851,295
Insurance fund for cash in volt and in-transit 58,860,551 53,860,551 58,860,551 53,860,551
Benevolent fund 100,000,000 100,000,000 100,000,000 100,000,000
Computer payable/ Sundry creditor 49,178,917 234,551,194 48,034,348 233,406,625
Special blocked account 560 5,203,561 560 5,203,561
Provision for Ruler's tax (UAE) 20,591,295 29,600,906 20,591,295 29,600,906
Interest suspense 12.5 4,488,536,104 2,732,057,172 4,301,276,459 2,667,057,172
Provision for ex-gratia (old) 4,461,109 10,180,651 4,461,109 10,180,651
Provision for incentive bonus 1,255,985,163 1,610,813,191 1,253,885,163 1,609,267,855
Provision for income taxes 12.1 14,329,209,315 11,394,832,460 14,277,054,790 11,348,242,306
Provision for classified loans and advances 12.4.(a) 31,771,676,862 8,175,172,679 31,771,676,862 8,175,172,679
Provision for unclassified loans and advances 12.4.(b) 2,265,149,118 3,014,012,193 2,211,000,000 2,984,240,897
General Provision for unclassified of UAE branches 12.4.(c) 29,375,116 13,661,192 29,375,116 13,661,192
41 495,898,986 443,694,452 121,600,000 121,600,000
Provision for other assets 9.8 915,593,624 954,932,997 915,593,624 954,932,997
Provision for Nostro Account* 12.3 93,900,000 86,300,000 93,900,000 86,300,000
Provision for Superannuation Fund (SF) 40 3,943,907,065 4,714,934,898 3,943,907,065 4,714,934,898
Provision for gratuity 40 39,380,264 74,359,308 39,380,264 74,359,308
Leave encashment 613,006,000 313,006,000 613,006,000 313,006,000
70,267,950 65,451,078 70,267,950 65,451,078
Rural housing credit programme 5,240,445 6,108,721 5,240,445 6,108,721
10,129,626 6,354,995 10,129,626 6,354,995
General provident fund 18,586,700 44,077,234 10,129,171 36,259,575
Contributory provident fund 1,400,480 936,755 1,400,480 936,755
Provision for CSR 247,336,609 199,648,990 247,336,609 199,648,990
Provision for Off-balance sheet items 38 1,126,443,137 1,516,443,137 1,126,443,137 1,516,443,137
Others 39,003,503 22,366,222 28,020,785 2,101,822
Interest payable for interest bearing liabilities 4,734,086,863 738,982,740 4,734,086,863 738,982,740
Bills payable for accrued expenses 831,299,801 110,607,500 697,560,508 39,981,444
Provision for credit card risk coverage 249,049 147,686 249,049 147,686
Bulgarian foreign trade Bank 1,340,173 1,340,171 1,340,173 1,340,171
Agrani Bank Payable 302,689 302,693 302,689 302,693
Refinance Fund from B.B. against loans to public Sector Jute Mills 2,376,900,000 2,640,752,406 2,376,900,000 2,640,752,406
Payable to investors 11,039,109 14,960,933 - -
Dividend payable 122,400 76,220 - -
Liabilities for miscellaneous securities 1,901,596 - - -
Client receivable sales in transit 13,517,379 14,174,210 - -
VAT payable (JCIL) 265,027 12,607 - -
Tax payable (JCIL) 192,771 794 - -
Security deposit 245,460 245,460 - -
Deferred tax liability 12.6 1,370,967,360 1,667,167,566 1,429,279,480 1,701,744,125
73,639,498,393 50,757,753,271 72,846,240,388 50,198,005,684
* Related notes are applicable only for the balances from the financial statements of Janata Bank Ltd.
Consolidated Bank
Interest payable to IDA credit
Provision for call loan, & misappropriation
Provision for investments
53
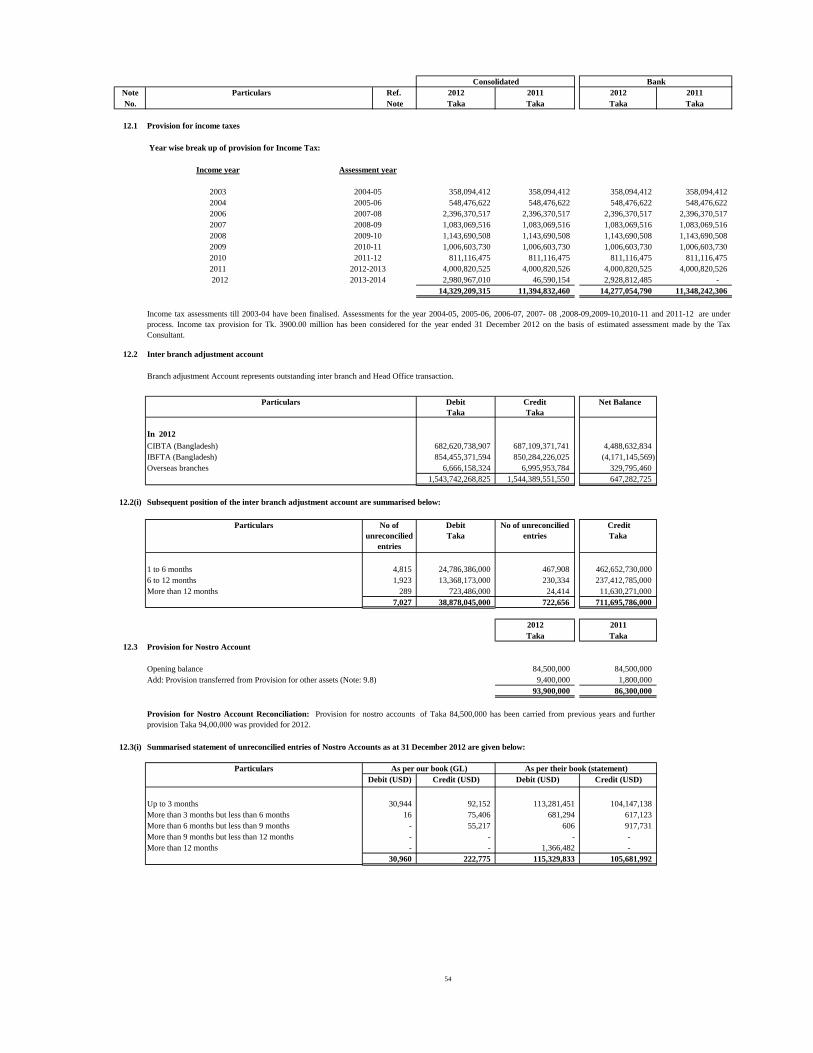
Note Particulars Ref. 2012 2011 2012 2011
No. Note Taka Taka Taka Taka
12.1
Year wise break up of provision for Income Tax:
Assessment year
2004-05 358,094,412 358,094,412 358,094,412 358,094,412
2005-06 548,476,622 548,476,622 548,476,622 548,476,622
2007-08 2,396,370,517 2,396,370,517 2,396,370,517 2,396,370,517
2008-09 1,083,069,516 1,083,069,516 1,083,069,516 1,083,069,516
2009-10 1,143,690,508 1,143,690,508 1,143,690,508 1,143,690,508
2010-11 1,006,603,730 1,006,603,730 1,006,603,730 1,006,603,730
2011-12 811,116,475 811,116,475 811,116,475 811,116,475
2012-2013 4,000,820,525 4,000,820,526 4,000,820,525 4,000,820,526
2012 2013-2014 2,980,967,010 46,590,154 2,928,812,485 -
14,329,209,315 11,394,832,460 14,277,054,790 11,348,242,306
12.2 Inter branch adjustment account
Branch adjustment Account represents outstanding inter branch and Head Office transaction.
Debit
Taka
Credit
Taka
Net Balance
In 2012
682,620,738,907 687,109,371,741 4,488,632,834
IBFTA (Bangladesh) 854,455,371,594 850,284,226,025 (4,171,145,569)
Overseas branches 6,666,158,324 6,995,953,784 329,795,460
1,543,742,268,825 1,544,389,551,550 647,282,725
12.2(i)
1 to 6 months 24,786,386,000 467,908 462,652,730,000
13,368,173,000 230,334 237,412,785,000
More than 12 months 723,486,000 24,414 11,630,271,000
38,878,045,000 722,656 711,695,786,000
2012 2011
Taka Taka
12.3 Provision for Nostro Account
Opening balance 84,500,000 84,500,000
Add: Provision transferred from Provision for other assets (Note: 9.8) 9,400,000 1,800,000
93,900,000 86,300,000
12.3(i) Summarised statement of unreconcilied entries of Nostro Accounts as at 31 December 2012 are given below:
Credit (USD) Credit (USD)
Up to 3 months 92,152 104,147,138
More than 3 months but less than 6 months 75,406 617,123
More than 6 months but less than 9 months 55,217 917,731
More than 9 months but less than 12 months - -
More than 12 months - -
222,775 105,681,992
Debit (USD)
115,329,833
2003
Particulars
681,294
606
Income tax assessments till 2003-04 have been finalised. Assessments for the year 2004-05, 2005-06, 2006-07, 2007- 08 ,2008-09,2009-10,2010-11 and 2011-12 are under
process. Income tax provision for Tk. 3900.00 million has been considered for the year ended 31 December 2012 on the basis of estimated assessment made by the Tax
Consultant.
1,923
Subsequent position of the inter branch adjustment account are summarised below:
Debit
Taka
No of unreconcilied
entries
No of
unreconcilied
entries
Provision for Nostro Account Reconciliation: Provision for nostro accounts of Taka 84,500,000 has been carried from previous years and further
provision Taka 94,00,000 was provided for 2012.
-
Particulars
-
-
113,281,451 30,944
As per our book (GL)
16
-
289
7,027
Credit
Taka
Particulars
Consolidated
6 to 12 months
Debit (USD)
As per their book (statement)
CIBTA (Bangladesh)
Bank
2011
2008
2009
2004
Income year
2010
Provision for income taxes
2006
2007
4,815
1,366,482
30,960
54
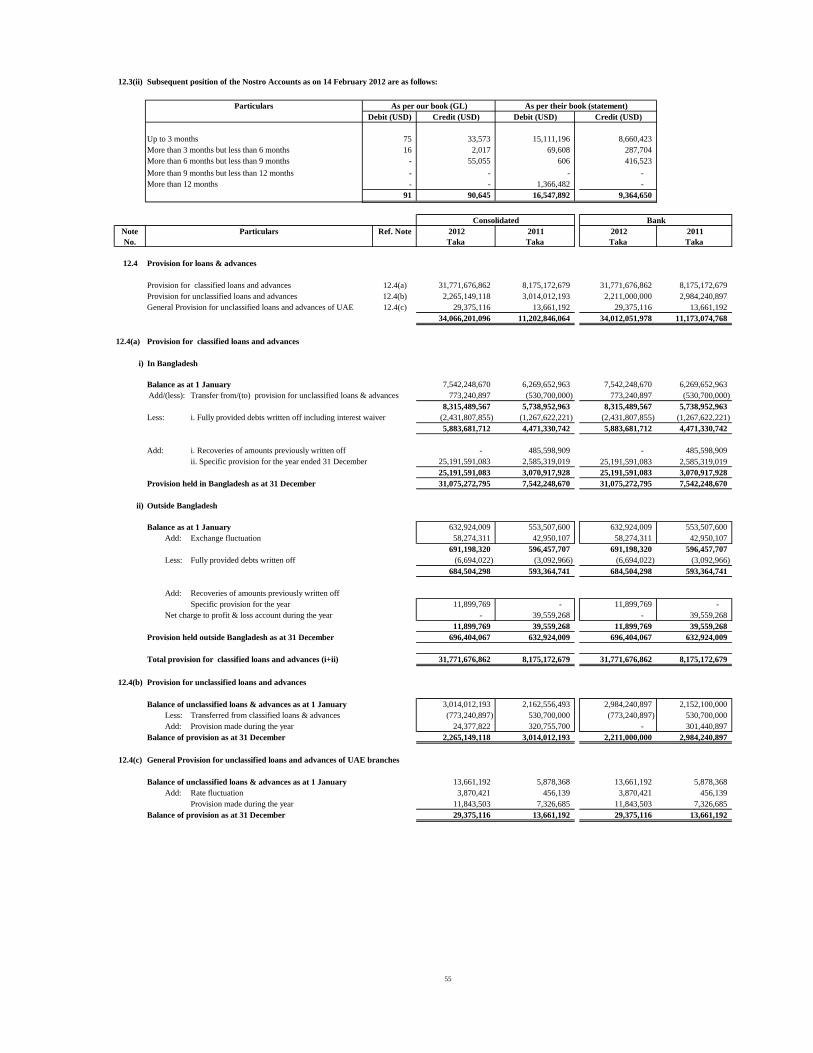
12.3(ii) Subsequent position of the Nostro Accounts as on 14 February 2012 are as follows:
Credit (USD) Debit (USD) Credit (USD)
Up to 3 months 33,573 15,111,196 8,660,423
More than 3 months but less than 6 months 2,017 69,608 287,704
More than 6 months but less than 9 months 55,055 606 416,523
More than 9 months but less than 12 months - - -
More than 12 months - 1,366,482 -
90,645 16,547,892 9,364,650
Note
No.
Ref. Note 2012
Taka
2011
Taka
2012
Taka
2011
Taka
12.4
12.4(a) 31,771,676,862 8,175,172,679 31,771,676,862 8,175,172,679
12.4(b) 2,265,149,118 3,014,012,193 2,211,000,000 2,984,240,897
12.4(c) 29,375,116 13,661,192 29,375,116 13,661,192
34,066,201,096 11,202,846,064 34,012,051,978 11,173,074,768
12.4(a)
i)
Balance as at 1 January 7,542,248,670 6,269,652,963 7,542,248,670 6,269,652,963
Add/(less): Transfer from/(to) provision for unclassified loans & advances 773,240,897 (530,700,000) 773,240,897 (530,700,000)
8,315,489,567 5,738,952,963 8,315,489,567 5,738,952,963
Less: i. Fully provided debts written off including interest waiver (2,431,807,855) (1,267,622,221) (2,431,807,855) (1,267,622,221)
5,883,681,712 4,471,330,742 5,883,681,712 4,471,330,742
Add: i. Recoveries of amounts previously written off - 485,598,909 - 485,598,909
ii. Specific provision for the year ended 31 December 25,191,591,083 2,585,319,019 25,191,591,083 2,585,319,019
25,191,591,083 3,070,917,928 25,191,591,083 3,070,917,928
Provision held in Bangladesh as at 31 December 31,075,272,795 7,542,248,670 31,075,272,795 7,542,248,670
ii) Outside Bangladesh
Balance as at 1 January 632,924,009 553,507,600 632,924,009 553,507,600
Add: Exchange fluctuation 58,274,311 42,950,107 58,274,311 42,950,107
691,198,320 596,457,707 691,198,320 596,457,707
Less: Fully provided debts written off (6,694,022) (3,092,966) (6,694,022) (3,092,966)
684,504,298 593,364,741 684,504,298 593,364,741
Add: Recoveries of amounts previously written off
Specific provision for the year 11,899,769 - 11,899,769 -
Net charge to profit & loss account during the year - 39,559,268 - 39,559,268
11,899,769 39,559,268 11,899,769 39,559,268
Provision held outside Bangladesh as at 31 December 696,404,067 632,924,009 696,404,067 632,924,009
Total provision for classified loans and advances (i+ii) 31,771,676,862 8,175,172,679 31,771,676,862 8,175,172,679
12.4(b) Provision for unclassified loans and advances
Balance of unclassified loans & advances as at 1 January 3,014,012,193 2,162,556,493 2,984,240,897 2,152,100,000
Less: Transferred from classified loans & advances (773,240,897) 530,700,000 (773,240,897) 530,700,000
Add: Provision made during the year 24,377,822 320,755,700 - 301,440,897
Balance of provision as at 31 December 2,265,149,118 3,014,012,193 2,211,000,000 2,984,240,897
12.4(c) General Provision for unclassified loans and advances of UAE branches
Balance of unclassified loans & advances as at 1 January 13,661,192 5,878,368 13,661,192 5,878,368
Add: Rate fluctuation 3,870,421 456,139 3,870,421 456,139
Provision made during the year 11,843,503 7,326,685 11,843,503 7,326,685
Balance of provision as at 31 December 29,375,116 13,661,192 29,375,116 13,661,192
-
As per their book (statement)
In Bangladesh
General Provision for unclassified loans and advances of UAE
75
Provision for loans & advances
Provision for classified loans and advances
Particulars
16
-
Debit (USD)
Particulars
Consolidated Bank
Provision for unclassified loans and advances
-
91
Provision for classified loans and advances
As per our book (GL)
55
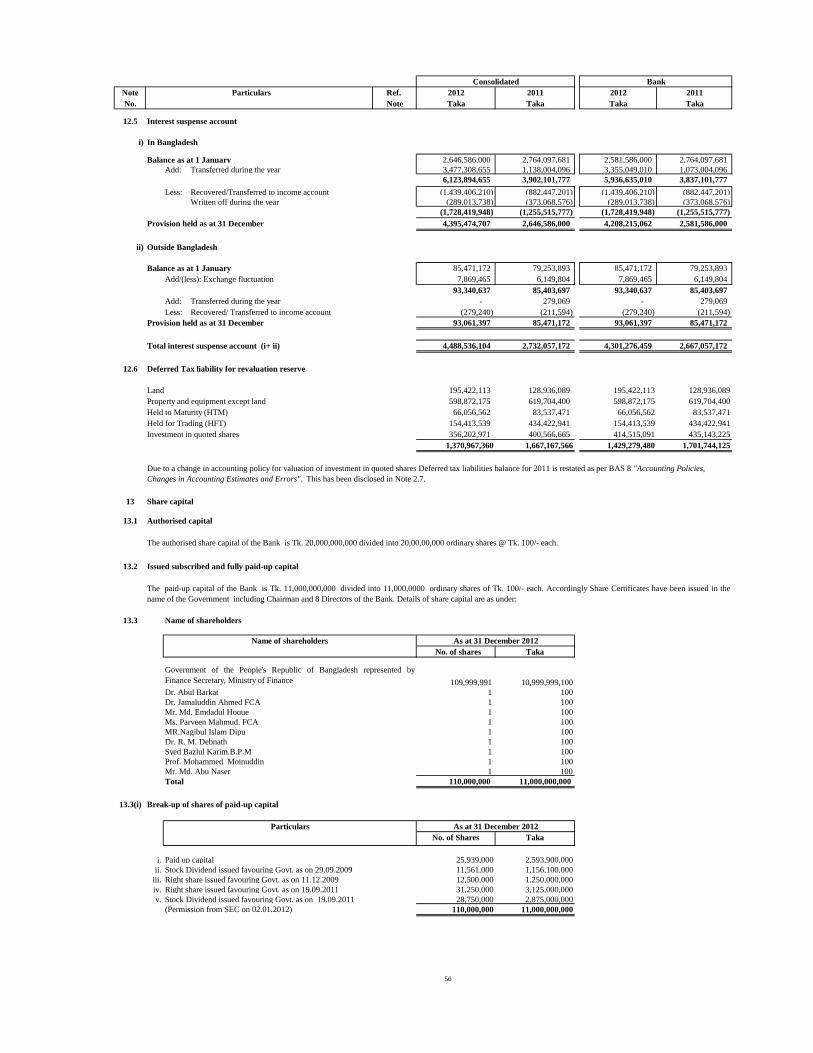
Note Particulars Ref. 2012 2011 2012 2011
No. Note Taka Taka Taka Taka
12.5 Interest suspense account
i) In Bangladesh
Balance as at 1 January 2,646,586,000 2,764,097,681 2,581,586,000 2,764,097,681
Add: Transferred during the year 3,477,308,655 1,138,004,096 3,355,049,010 1,073,004,096
6,123,894,655 3,902,101,777 5,936,635,010 3,837,101,777
Less: Recovered/Transferred to income account (1,439,406,210) (882,447,201) (1,439,406,210) (882,447,201)
Written off during the year (289,013,738) (373,068,576) (289,013,738) (373,068,576)
(1,728,419,948) (1,255,515,777) (1,728,419,948) (1,255,515,777)
Provision held as at 31 December 4,395,474,707 2,646,586,000 4,208,215,062 2,581,586,000
ii) Outside Bangladesh
Balance as at 1 January 85,471,172 79,253,893 85,471,172 79,253,893
Add/(less): Exchange fluctuation 7,869,465 6,149,804 7,869,465 6,149,804
93,340,637 85,403,697 93,340,637 85,403,697
Add: Transferred during the year - 279,069 - 279,069
Less: Recovered/ Transferred to income account (279,240) (211,594) (279,240) (211,594)
Provision held as at 31 December 93,061,397 85,471,172 93,061,397 85,471,172
Total interest suspense account (i+ ii) 4,488,536,104 2,732,057,172 4,301,276,459 2,667,057,172
12.6
195,422,113 128,936,089 195,422,113 128,936,089
598,872,175 619,704,400 598,872,175 619,704,400
66,056,562 83,537,471 66,056,562 83,537,471
154,413,539 434,422,941 154,413,539 434,422,941
356,202,971 400,566,665 414,515,091 435,143,225
1,370,967,360 1,667,167,566 1,429,279,480 1,701,744,125
13 Share capital
13.1 Authorised capital
The authorised share capital of the Bank is Tk. 20,000,000,000 divided into 20,00,00,000 ordinary shares @ Tk. 100/- each.
13.2 Issued subscribed and fully paid-up capital
13.3 Name of shareholders
No. of shares Taka
109,999,991 10,999,999,100
1 100
1 100
Mr. Md. Emdadul Hoque 1 100
Ms. Parveen Mahmud. FCA 1 100
1 100
Dr. R. M. Debnath 1 100
Syed Bazlul Karim.B.P.M 1 100
Prof. Mohammed Moinuddin 1 100
Mr. Md. Abu Naser 1 100
Total 110,000,000 11,000,000,000
13.3(i) Break-up of shares of paid-up capital
No. of Shares Taka
i. Paid up capital 25,939,000 2,593,900,000
ii. Stock Dividend issued favouring Govt. as on 29.09.2009 11,561,000 1,156,100,000
iii. Right share issued favouring Govt. as on 11.12.2009 12,500,000 1,250,000,000
iv. Right share issued favouring Govt. as on 19.09.2011 31,250,000 3,125,000,000
v. Stock Dividend issued favouring Govt. as on 19.09.2011 28,750,000 2,875,000,000
(Permission from SEC on 02.01.2012) 110,000,000 11,000,000,000
As at 31 December 2012
Consolidated Bank
Investment in quoted shares
Due to a change in accounting policy for valuation of investment in quoted shares Deferred tax liabilities balance for 2011 is restated as per BAS 8 "Accounting Policies,
Changes in Accounting Estimates and Errors". This has been disclosed in Note 2.7.
Particulars
Name of shareholders
MR.Nagibul Islam Dipu
As at 31 December 2012
Government of the People's Republic of Bangladesh represented by
Finance Secretary, Ministry of Finance
Dr. Abul Barkat
Dr. Jamaluddin Ahmed FCA
The paid-up capital of the Bank is Tk. 11,000,000,000 divided into 11,000,0000 ordinary shares of Tk. 100/- each. Accordingly Share Certificates have been issued in the
name of the Government including Chairman and 8 Directors of the Bank. Details of share capital are as under:
Held to Maturity (HTM)
Held for Trading (HFT)
Property and equipment except land
Land
Deferred Tax liability for revaluation reserve
56
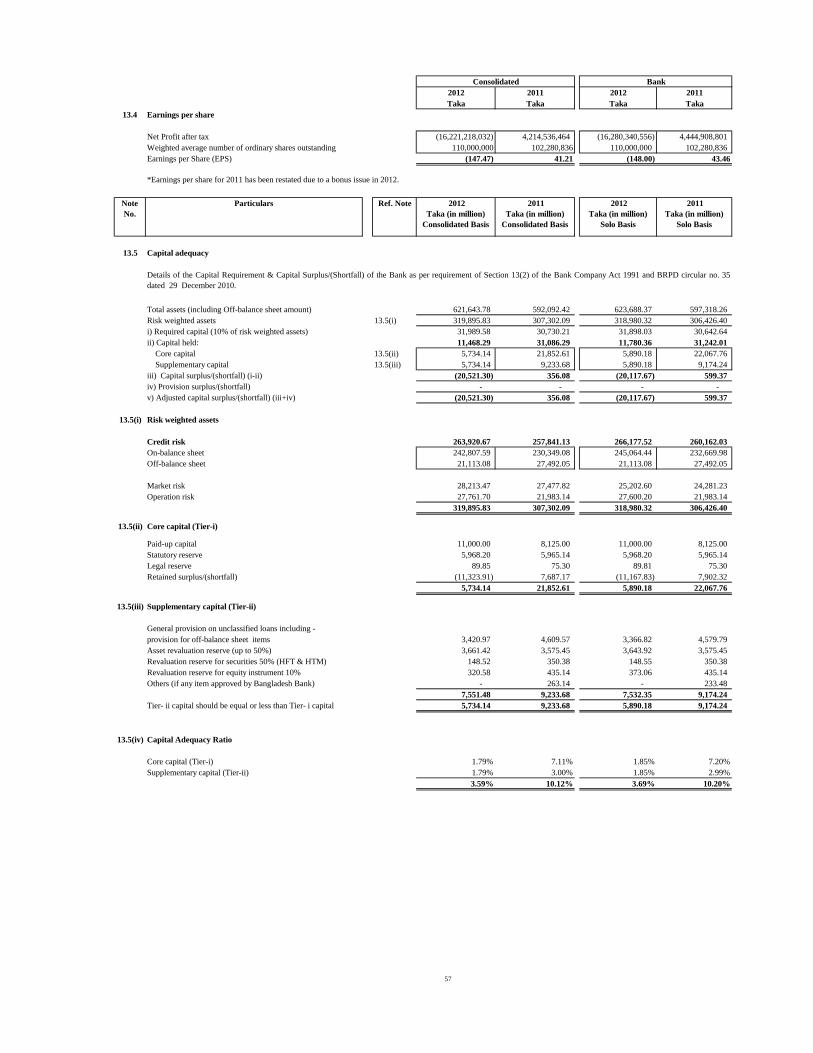
2012 2011 2012 2011
Taka Taka Taka Taka
13.4 Earnings per share
Net Profit after tax (16,221,218,032) 4,214,536,464 (16,280,340,556) 4,444,908,801
Weighted average number of ordinary shares outstanding 110,000,000 102,280,836 110,000,000 102,280,836
Earnings per Share (EPS) (147.47) 41.21 (148.00) 43.46
*Earnings per share for 2011 has been restated due to a bonus issue in 2012.
Note
No.
Ref. Note 2012
Taka (in million)
Consolidated Basis
2011
Taka (in million)
Consolidated Basis
2012
Taka (in million)
Solo Basis
2011
Taka (in million)
Solo Basis
13.5 Capital adequacy
Total assets (including Off-balance sheet amount) 621,643.78 592,092.42 623,688.37 597,318.26
Risk weighted assets 13.5(i) 319,895.83 307,302.09 318,980.32 306,426.40
i) Required capital (10% of risk weighted assets) 31,989.58 30,730.21 31,898.03 30,642.64
ii) Capital held: 11,468.29 31,086.29 11,780.36 31,242.01
Core capital 13.5(ii) 5,734.14 21,852.61 5,890.18 22,067.76
Supplementary capital 13.5(iii) 5,734.14 9,233.68 5,890.18 9,174.24
iii) Capital surplus/(shortfall) (i-ii) (20,521.30) 356.08 (20,117.67) 599.37
iv) Provision surplus/(shortfall) - - - -
v) Adjusted capital surplus/(shortfall) (iii+iv) (20,521.30) 356.08 (20,117.67) 599.37
13.5(i) Risk weighted assets
Credit risk 263,920.67 257,841.13 266,177.52 260,162.03
On-balance sheet 242,807.59 230,349.08 245,064.44 232,669.98
Off-balance sheet 21,113.08 27,492.05 21,113.08 27,492.05
Market risk 28,213.47 27,477.82 25,202.60 24,281.23
Operation risk 27,761.70 21,983.14 27,600.20 21,983.14
319,895.83 307,302.09 318,980.32 306,426.40
13.5(ii) Core capital (Tier-i)
Paid-up capital 11,000.00 8,125.00 11,000.00 8,125.00
Statutory reserve 5,968.20 5,965.14 5,968.20 5,965.14
Legal reserve 89.85 75.30 89.81 75.30
Retained surplus/(shortfall) (11,323.91) 7,687.17 (11,167.83) 7,902.32
5,734.14 21,852.61 5,890.18 22,067.76
13.5(iii) Supplementary capital (Tier-ii)
General provision on unclassified loans including -
provision for off-balance sheet items 3,420.97 4,609.57 3,366.82 4,579.79
Asset revaluation reserve (up to 50%) 3,661.42 3,575.45 3,643.92 3,575.45
Revaluation reserve for securities 50% (HFT & HTM) 148.52 350.38 148.55 350.38
Revaluation reserve for equity instrument 10% 320.58 435.14 373.06 435.14
Others (if any item approved by Bangladesh Bank) - 263.14 - 233.48
7,551.48 9,233.68 7,532.35 9,174.24
Tier- ii capital should be equal or less than Tier- i capital 5,734.14 9,233.68 5,890.18 9,174.24
13.5(iv) Capital Adequacy Ratio
Core capital (Tier-i) 1.79% 7.11% 1.85% 7.20%
Supplementary capital (Tier-ii) 1.79% 3.00% 1.85% 2.99%
3.59% 10.12% 3.69% 10.20%
Consolidated Bank
Details of the Capital Requirement & Capital Surplus/(Shortfall) of the Bank as per requirement of Section 13(2) of the Bank Company Act 1991 and BRPD circular no. 35
dated 29 December 2010.
Particulars
57
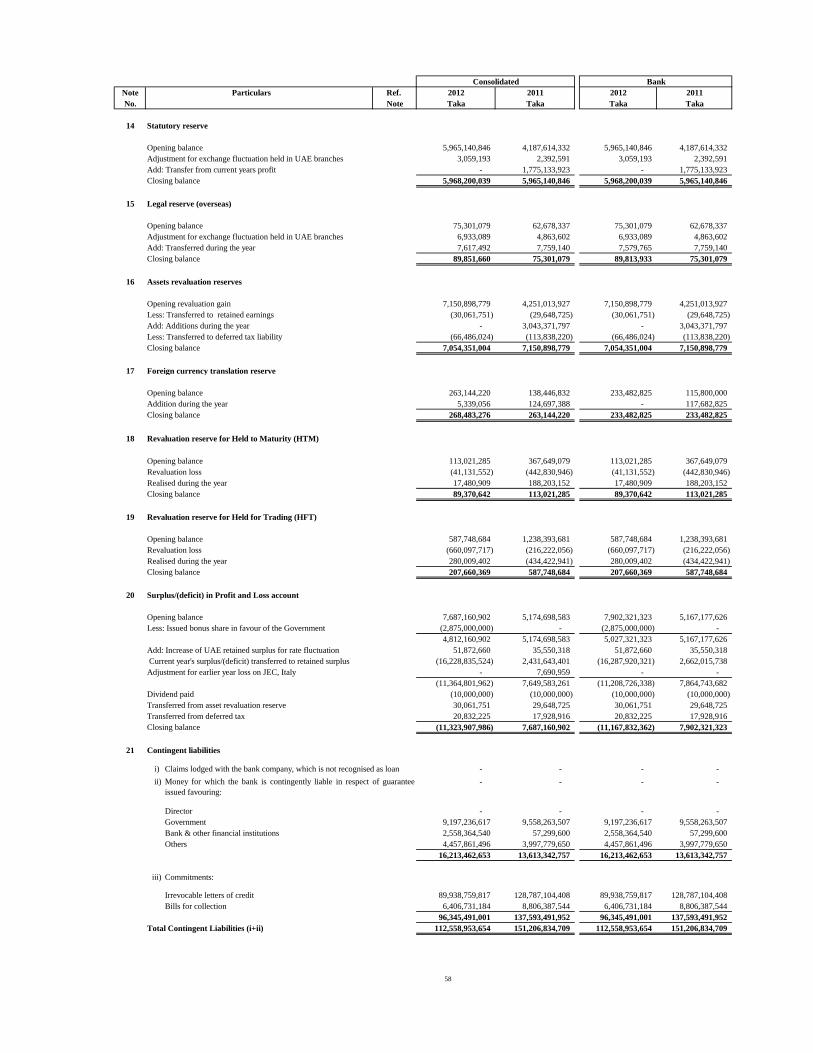
Note Particulars Ref. 2012 2011 2012 2011
No. Note Taka Taka Taka Taka
14 Statutory reserve
Opening balance 5,965,140,846 4,187,614,332 5,965,140,846 4,187,614,332
Adjustment for exchange fluctuation held in UAE branches 3,059,193 2,392,591 3,059,193 2,392,591
Add: Transfer from current years profit - 1,775,133,923 - 1,775,133,923
Closing balance 5,968,200,039 5,965,140,846 5,968,200,039 5,965,140,846
15 Legal reserve (overseas)
Opening balance 75,301,079 62,678,337 75,301,079 62,678,337
Adjustment for exchange fluctuation held in UAE branches 6,933,089 4,863,602 6,933,089 4,863,602
Add: Transferred during the year 7,617,492 7,759,140 7,579,765 7,759,140
Closing balance 89,851,660 75,301,079 89,813,933 75,301,079
16 Assets revaluation reserves
Opening revaluation gain 7,150,898,779 4,251,013,927 7,150,898,779 4,251,013,927
Less: Transferred to retained earnings (30,061,751) (29,648,725) (30,061,751) (29,648,725)
Add: Additions during the year - 3,043,371,797 - 3,043,371,797
Less: Transferred to deferred tax liability (66,486,024) (113,838,220) (66,486,024) (113,838,220)
Closing balance 7,054,351,004 7,150,898,779 7,054,351,004 7,150,898,779
17 Foreign currency translation reserve
Opening balance 263,144,220 138,446,832 233,482,825 115,800,000
Addition during the year 5,339,056 124,697,388 - 117,682,825
Closing balance 268,483,276 263,144,220 233,482,825 233,482,825
18 Revaluation reserve for Held to Maturity (HTM)
Opening balance 113,021,285 367,649,079 113,021,285 367,649,079
Revaluation loss (41,131,552) (442,830,946) (41,131,552) (442,830,946)
Realised during the year 17,480,909 188,203,152 17,480,909 188,203,152
Closing balance 89,370,642 113,021,285 89,370,642 113,021,285
19 Revaluation reserve for Held for Trading (HFT)
Opening balance 587,748,684 1,238,393,681 587,748,684 1,238,393,681
Revaluation loss (660,097,717) (216,222,056) (660,097,717) (216,222,056)
Realised during the year 280,009,402 (434,422,941) 280,009,402 (434,422,941)
Closing balance 207,660,369 587,748,684 207,660,369 587,748,684
20
Opening balance 7,687,160,902 5,174,698,583 7,902,321,323 5,167,177,626
Less: Issued bonus share in favour of the Government (2,875,000,000) - (2,875,000,000) -
4,812,160,902 5,174,698,583 5,027,321,323 5,167,177,626
Add: Increase of UAE retained surplus for rate fluctuation 51,872,660 35,550,318 51,872,660 35,550,318
Current year's surplus/(deficit) transferred to retained surplus (16,228,835,524) 2,431,643,401 (16,287,920,321) 2,662,015,738
Adjustment for earlier year loss on JEC, Italy - 7,690,959 - -
(11,364,801,962) 7,649,583,261 (11,208,726,338) 7,864,743,682
Dividend paid (10,000,000) (10,000,000) (10,000,000) (10,000,000)
Transferred from asset revaluation reserve 30,061,751 29,648,725 30,061,751 29,648,725
Transferred from deferred tax 20,832,225 17,928,916 20,832,225 17,928,916
Closing balance (11,323,907,986) 7,687,160,902 (11,167,832,362) 7,902,321,323
21 Contingent liabilities
i) Claims lodged with the bank company, which is not recognised as loan - - - -
ii) - - - -
Director - - - -
Government 9,197,236,617 9,558,263,507 9,197,236,617 9,558,263,507
Bank & other financial institutions 2,558,364,540 57,299,600 2,558,364,540 57,299,600
Others 4,457,861,496 3,997,779,650 4,457,861,496 3,997,779,650
16,213,462,653 13,613,342,757 16,213,462,653 13,613,342,757
iii) Commitments:
Irrevocable letters of credit 89,938,759,817 128,787,104,408 89,938,759,817 128,787,104,408
Bills for collection 6,406,731,184 8,806,387,544 6,406,731,184 8,806,387,544
96,345,491,001 137,593,491,952 96,345,491,001 137,593,491,952
Total Contingent Liabilities (i+ii) 112,558,953,654 151,206,834,709 112,558,953,654 151,206,834,709
Consolidated
Money for which the bank is contingently liable in respect of guarantee
issued favouring:
Surplus/(deficit) in Profit and Loss account
Bank
58
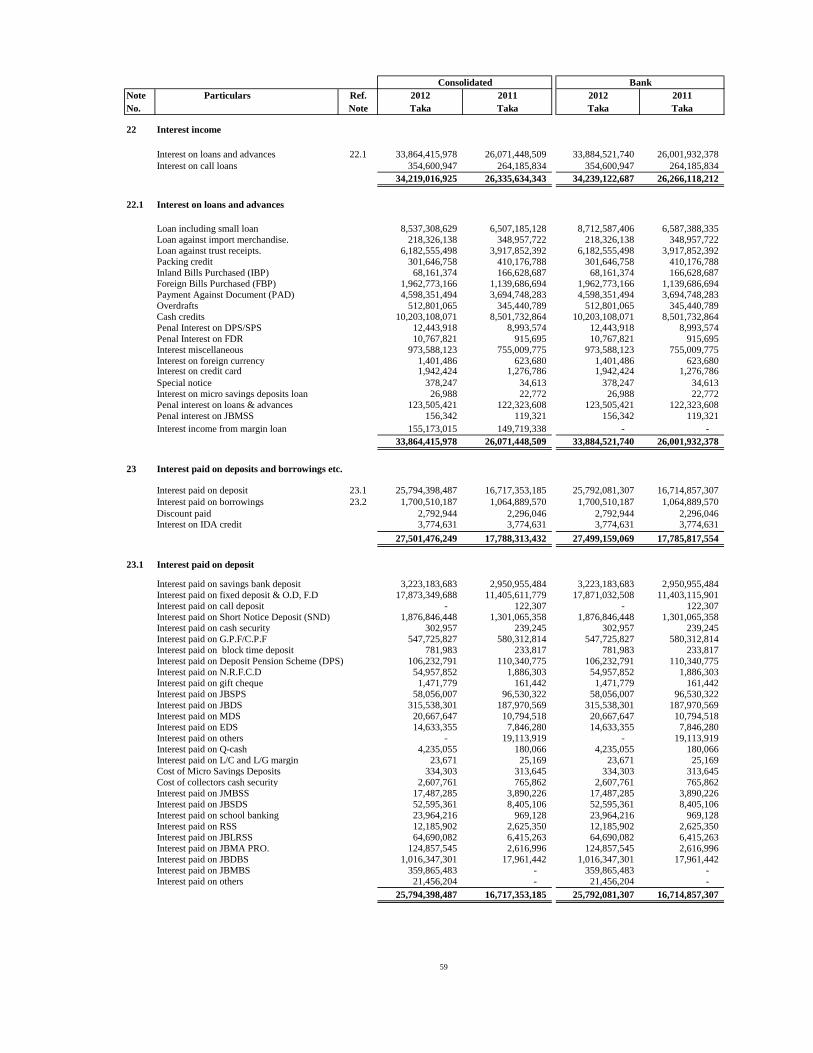
Note Particulars Ref. 2012 2011 2012 2011
No. Note Taka Taka Taka Taka
22 Interest income
Interest on loans and advances 22.1 33,864,415,978 26,071,448,509 33,884,521,740 26,001,932,378
Interest on call loans 354,600,947 264,185,834 354,600,947 264,185,834
34,219,016,925 26,335,634,343 34,239,122,687 26,266,118,212
22.1 Interest on loans and advances
Loan including small loan 8,537,308,629 6,507,185,128 8,712,587,406 6,587,388,335 Loan against import merchandise. 218,326,138 348,957,722 218,326,138 348,957,722 Loan against trust receipts. 6,182,555,498 3,917,852,392 6,182,555,498 3,917,852,392 Packing credit 301,646,758 410,176,788 301,646,758 410,176,788 Inland Bills Purchased (IBP) 68,161,374 166,628,687 68,161,374 166,628,687 Foreign Bills Purchased (FBP) 1,962,773,166 1,139,686,694 1,962,773,166 1,139,686,694 Payment Against Document (PAD) 4,598,351,494 3,694,748,283 4,598,351,494 3,694,748,283 Overdrafts 512,801,065 345,440,789 512,801,065 345,440,789 Cash credits 10,203,108,071 8,501,732,864 10,203,108,071 8,501,732,864 Penal Interest on DPS/SPS 12,443,918 8,993,574 12,443,918 8,993,574 Penal Interest on FDR 10,767,821 915,695 10,767,821 915,695 Interest miscellaneous 973,588,123 755,009,775 973,588,123 755,009,775 Interest on foreign currency 1,401,486 623,680 1,401,486 623,680 Interest on credit card 1,942,424 1,276,786 1,942,424 1,276,786
Special notice 378,247 34,613 378,247 34,613 Interest on micro savings deposits loan 26,988 22,772 26,988 22,772 Penal interest on loans & advances 123,505,421 122,323,608 123,505,421 122,323,608 Penal interest on JBMSS 156,342 119,321 156,342 119,321
Interest income from margin loan 155,173,015 149,719,338 - -
33,864,415,978 26,071,448,509 33,884,521,740 26,001,932,378
23 Interest paid on deposits and borrowings etc.
Interest paid on deposit 23.1 25,794,398,487 16,717,353,185 25,792,081,307 16,714,857,307
Interest paid on borrowings 23.2 1,700,510,187 1,064,889,570 1,700,510,187 1,064,889,570
Discount paid 2,792,944 2,296,046 2,792,944 2,296,046 Interest on IDA credit 3,774,631 3,774,631 3,774,631 3,774,631
27,501,476,249 17,788,313,432 27,499,159,069 17,785,817,554
23.1 Interest paid on deposit
Interest paid on savings bank deposit 3,223,183,683 2,950,955,484 3,223,183,683 2,950,955,484 Interest paid on fixed deposit & O.D, F.D 17,873,349,688 11,405,611,779 17,871,032,508 11,403,115,901 Interest paid on call deposit - 122,307 - 122,307 Interest paid on Short Notice Deposit (SND) 1,876,846,448 1,301,065,358 1,876,846,448 1,301,065,358 Interest paid on cash security 302,957 239,245 302,957 239,245 Interest paid on G.P.F/C.P.F 547,725,827 580,312,814 547,725,827 580,312,814 Interest paid on block time deposit 781,983 233,817 781,983 233,817 Interest paid on Deposit Pension Scheme (DPS) 106,232,791 110,340,775 106,232,791 110,340,775 Interest paid on N.R.F.C.D 54,957,852 1,886,303 54,957,852 1,886,303 Interest paid on gift cheque 1,471,779 161,442 1,471,779 161,442 Interest paid on JBSPS 58,056,007 96,530,322 58,056,007 96,530,322 Interest paid on JBDS 315,538,301 187,970,569 315,538,301 187,970,569 Interest paid on MDS 20,667,647 10,794,518 20,667,647 10,794,518 Interest paid on EDS 14,633,355 7,846,280 14,633,355 7,846,280 Interest paid on others - 19,113,919 - 19,113,919 Interest paid on Q-cash 4,235,055 180,066 4,235,055 180,066 Interest paid on L/C and L/G margin 23,671 25,169 23,671 25,169 Cost of Micro Savings Deposits 334,303 313,645 334,303 313,645 Cost of collectors cash security 2,607,761 765,862 2,607,761 765,862 Interest paid on JMBSS 17,487,285 3,890,226 17,487,285 3,890,226 Interest paid on JBSDS 52,595,361 8,405,106 52,595,361 8,405,106 Interest paid on school banking 23,964,216 969,128 23,964,216 969,128 Interest paid on RSS 12,185,902 2,625,350 12,185,902 2,625,350 Interest paid on JBLRSS 64,690,082 6,415,263 64,690,082 6,415,263 Interest paid on JBMA PRO. 124,857,545 2,616,996 124,857,545 2,616,996 Interest paid on JBDBS 1,016,347,301 17,961,442 1,016,347,301 17,961,442 Interest paid on JBMBS 359,865,483 - 359,865,483 - Interest paid on others 21,456,204 - 21,456,204 -
25,794,398,487 16,717,353,185 25,792,081,307 16,714,857,307
Consolidated Bank
59
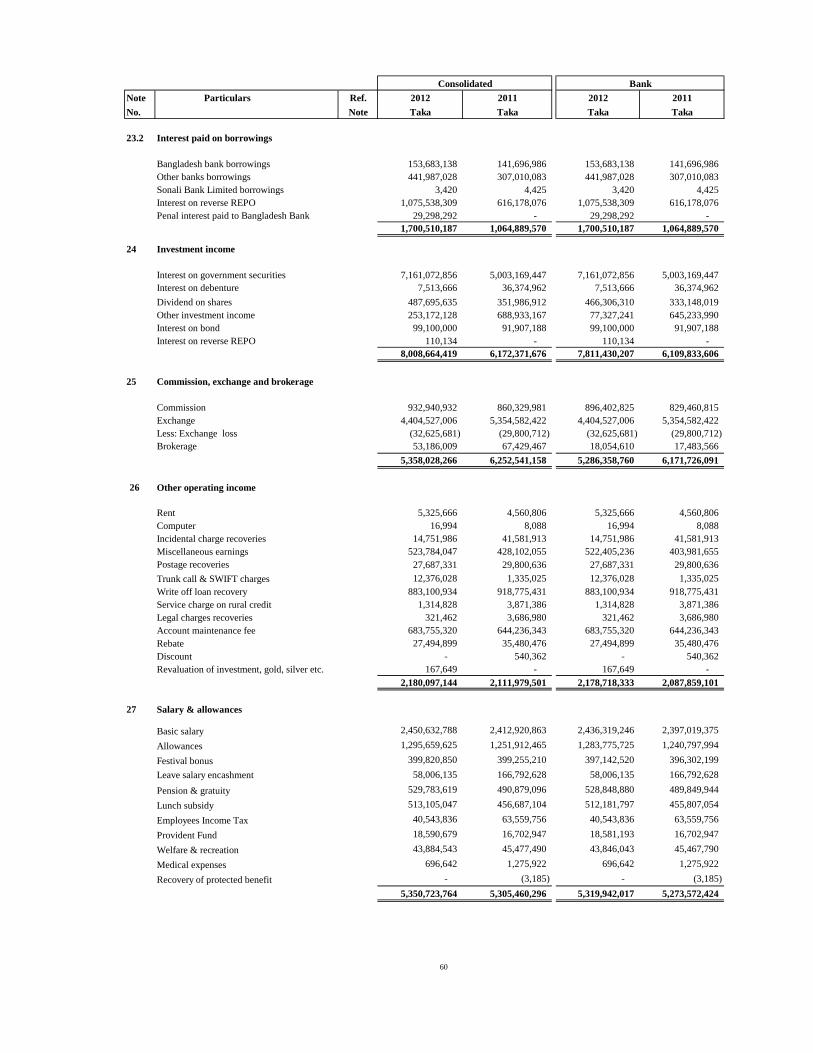
Note Particulars Ref. 2012 2011 2012 2011
No. Note Taka Taka Taka Taka
23.2 Interest paid on borrowings
Bangladesh bank borrowings 153,683,138 141,696,986 153,683,138 141,696,986
Other banks borrowings 441,987,028 307,010,083 441,987,028 307,010,083
Sonali Bank Limited borrowings 3,420 4,425 3,420 4,425
Interest on reverse REPO 1,075,538,309 616,178,076 1,075,538,309 616,178,076
Penal interest paid to Bangladesh Bank 29,298,292 - 29,298,292 -
1,700,510,187 1,064,889,570 1,700,510,187 1,064,889,570
24 Investment income
Interest on government securities 7,161,072,856 5,003,169,447 7,161,072,856 5,003,169,447
Interest on debenture 7,513,666 36,374,962 7,513,666 36,374,962
Dividend on shares 487,695,635 351,986,912 466,306,310 333,148,019
Other investment income 253,172,128 688,933,167 77,327,241 645,233,990
Interest on bond 99,100,000 91,907,188 99,100,000 91,907,188
Interest on reverse REPO 110,134 - 110,134 -
8,008,664,419 6,172,371,676 7,811,430,207 6,109,833,606
25 Commission, exchange and brokerage
Commission 932,940,932 860,329,981 896,402,825 829,460,815
Exchange 4,404,527,006 5,354,582,422 4,404,527,006 5,354,582,422
Less: Exchange loss (32,625,681) (29,800,712) (32,625,681) (29,800,712)
Brokerage 53,186,009 67,429,467 18,054,610 17,483,566
5,358,028,266 6,252,541,158 5,286,358,760 6,171,726,091
26 Other operating income
Rent 5,325,666 4,560,806 5,325,666 4,560,806
Computer 16,994 8,088 16,994 8,088
Incidental charge recoveries 14,751,986 41,581,913 14,751,986 41,581,913
Miscellaneous earnings 523,784,047 428,102,055 522,405,236 403,981,655
Postage recoveries 27,687,331 29,800,636 27,687,331 29,800,636
Trunk call & SWIFT charges 12,376,028 1,335,025 12,376,028 1,335,025
Write off loan recovery 883,100,934 918,775,431 883,100,934 918,775,431
Service charge on rural credit 1,314,828 3,871,386 1,314,828 3,871,386
Legal charges recoveries 321,462 3,686,980 321,462 3,686,980
Account maintenance fee 683,755,320 644,236,343 683,755,320 644,236,343
Rebate 27,494,899 35,480,476 27,494,899 35,480,476
Discount - 540,362 - 540,362
Revaluation of investment, gold, silver etc. 167,649 - 167,649 -
2,180,097,144 2,111,979,501 2,178,718,333 2,087,859,101
27 Salary & allowances
Basic salary 2,450,632,788 2,412,920,863 2,436,319,246 2,397,019,375
Allowances 1,295,659,625 1,251,912,465 1,283,775,725 1,240,797,994
Festival bonus 399,820,850 399,255,210 397,142,520 396,302,199
Leave salary encashment 58,006,135 166,792,628 58,006,135 166,792,628
Pension & gratuity 529,783,619 490,879,096 528,848,880 489,849,944
Lunch subsidy 513,105,047 456,687,104 512,181,797 455,807,054
Employees Income Tax 40,543,836 63,559,756 40,543,836 63,559,756
Provident Fund 18,590,679 16,702,947 18,581,193 16,702,947
Welfare & recreation 43,884,543 45,477,490 43,846,043 45,467,790
Medical expenses 696,642 1,275,922 696,642 1,275,922
Recovery of protected benefit - (3,185) - (3,185)
5,350,723,764 5,305,460,296 5,319,942,017 5,273,572,424
Consolidated Bank
60
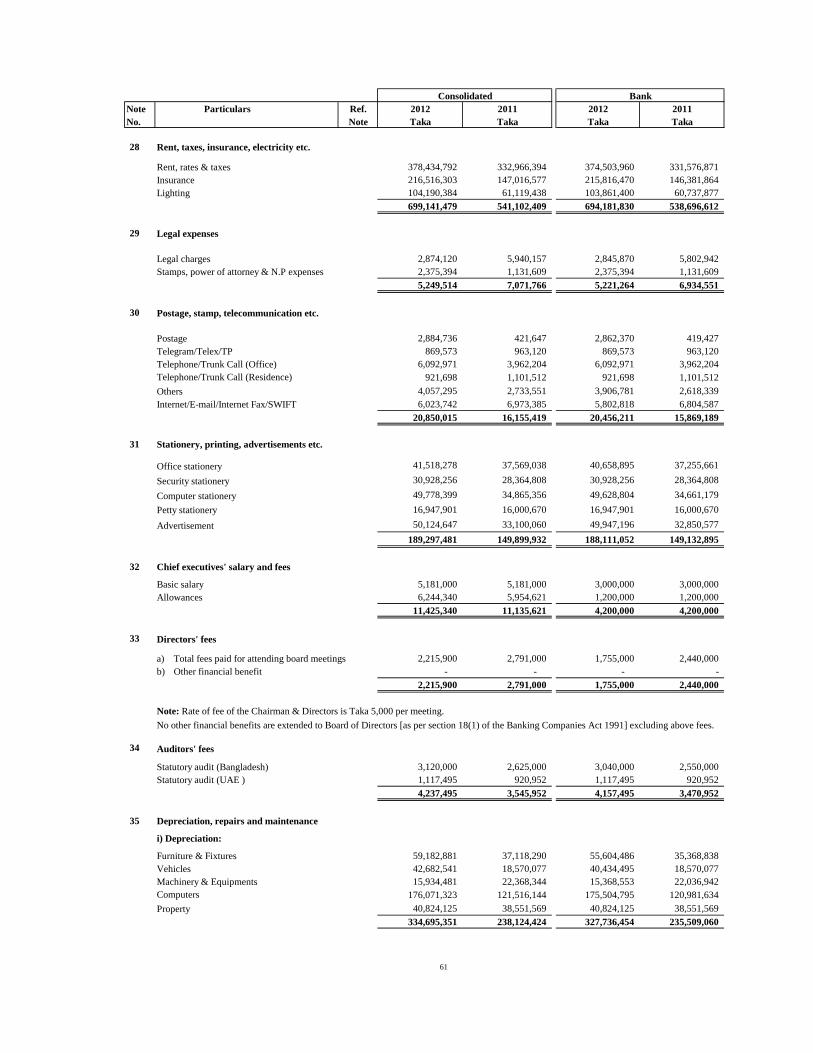
Note Particulars Ref. 2012 2011 2012 2011
No. Note Taka Taka Taka Taka
28 Rent, taxes, insurance, electricity etc.
Rent, rates & taxes 378,434,792 332,966,394 374,503,960 331,576,871
Insurance 216,516,303 147,016,577 215,816,470 146,381,864
Lighting 104,190,384 61,119,438 103,861,400 60,737,877
699,141,479 541,102,409 694,181,830 538,696,612
29 Legal expenses
Legal charges 2,874,120 5,940,157 2,845,870 5,802,942
Stamps, power of attorney & N.P expenses 2,375,394 1,131,609 2,375,394 1,131,609
5,249,514 7,071,766 5,221,264 6,934,551
30 Postage, stamp, telecommunication etc.
Postage 2,884,736 421,647 2,862,370 419,427
Telegram/Telex/TP 869,573 963,120 869,573 963,120
Telephone/Trunk Call (Office) 6,092,971 3,962,204 6,092,971 3,962,204
Telephone/Trunk Call (Residence) 921,698 1,101,512 921,698 1,101,512
Others 4,057,295 2,733,551 3,906,781 2,618,339
Internet/E-mail/Internet Fax/SWIFT 6,023,742 6,973,385 5,802,818 6,804,587
20,850,015 16,155,419 20,456,211 15,869,189
31 Stationery, printing, advertisements etc.
Office stationery 41,518,278 37,569,038 40,658,895 37,255,661
Security stationery 30,928,256 28,364,808 30,928,256 28,364,808
Computer stationery 49,778,399 34,865,356 49,628,804 34,661,179
Petty stationery 16,947,901 16,000,670 16,947,901 16,000,670
Advertisement 50,124,647 33,100,060 49,947,196 32,850,577
189,297,481 149,899,932 188,111,052 149,132,895
32 Chief executives' salary and fees
Basic salary 5,181,000 5,181,000 3,000,000 3,000,000
Allowances 6,244,340 5,954,621 1,200,000 1,200,000
11,425,340 11,135,621 4,200,000 4,200,000
33 Directors' fees
a) Total fees paid for attending board meetings 2,215,900 2,791,000 1,755,000 2,440,000
b) Other financial benefit - - - -
2,215,900 2,791,000 1,755,000 2,440,000
Note: Rate of fee of the Chairman & Directors is Taka 5,000 per meeting.
No other financial benefits are extended to Board of Directors [as per section 18(1) of the Banking Companies Act 1991] excluding above fees.
34 Auditors' fees
Statutory audit (Bangladesh) 3,120,000 2,625,000 3,040,000 2,550,000
Statutory audit (UAE ) 1,117,495 920,952 1,117,495 920,952
4,237,495 3,545,952 4,157,495 3,470,952
35 Depreciation, repairs and maintenance
i) Depreciation:
Furniture & Fixtures 59,182,881 37,118,290 55,604,486 35,368,838
Vehicles 42,682,541 18,570,077 40,434,495 18,570,077
Machinery & Equipments 15,934,481 22,368,344 15,368,553 22,036,942
Computers 176,071,323 121,516,144 175,504,795 120,981,634
Property 40,824,125 38,551,569 40,824,125 38,551,569
334,695,351 238,124,424 327,736,454 235,509,060
Consolidated Bank
61
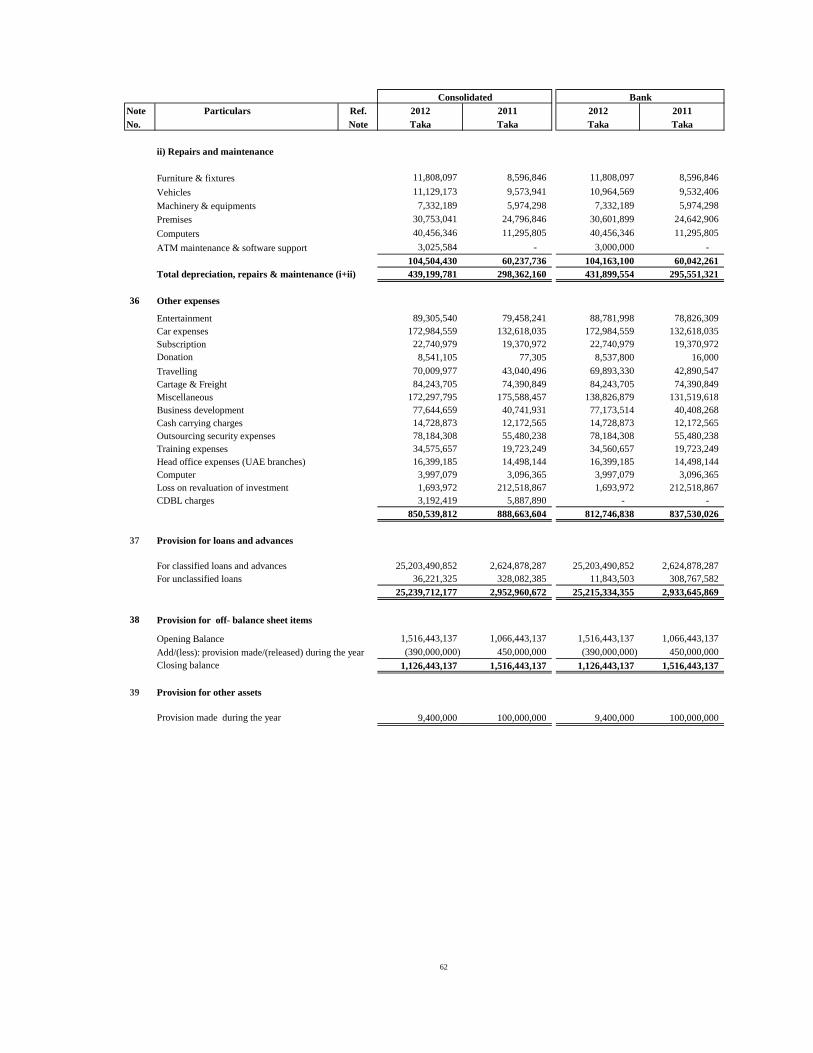
Note Particulars Ref. 2012 2011 2012 2011
No. Note Taka Taka Taka Taka
ii) Repairs and maintenance
Furniture & fixtures 11,808,097 8,596,846 11,808,097 8,596,846
Vehicles 11,129,173 9,573,941 10,964,569 9,532,406
Machinery & equipments 7,332,189 5,974,298 7,332,189 5,974,298
Premises 30,753,041 24,796,846 30,601,899 24,642,906
Computers 40,456,346 11,295,805 40,456,346 11,295,805
ATM maintenance & software support 3,025,584 - 3,000,000 -
104,504,430 60,237,736 104,163,100 60,042,261
Total depreciation, repairs & maintenance (i+ii) 439,199,781 298,362,160 431,899,554 295,551,321
36 Other expenses
Entertainment 89,305,540 79,458,241 88,781,998 78,826,309
Car expenses 172,984,559 132,618,035 172,984,559 132,618,035
Subscription 22,740,979 19,370,972 22,740,979 19,370,972
Donation 8,541,105 77,305 8,537,800 16,000
Travelling 70,009,977 43,040,496 69,893,330 42,890,547
Cartage & Freight 84,243,705 74,390,849 84,243,705 74,390,849
Miscellaneous 172,297,795 175,588,457 138,826,879 131,519,618
Business development 77,644,659 40,741,931 77,173,514 40,408,268
Cash carrying charges 14,728,873 12,172,565 14,728,873 12,172,565
Outsourcing security expenses 78,184,308 55,480,238 78,184,308 55,480,238
Training expenses 34,575,657 19,723,249 34,560,657 19,723,249
Head office expenses (UAE branches) 16,399,185 14,498,144 16,399,185 14,498,144
Computer 3,997,079 3,096,365 3,997,079 3,096,365
Loss on revaluation of investment 1,693,972 212,518,867 1,693,972 212,518,867
CDBL charges 3,192,419 5,887,890 - -
850,539,812 888,663,604 812,746,838 837,530,026
37 Provision for loans and advances
For classified loans and advances 25,203,490,852 2,624,878,287 25,203,490,852 2,624,878,287
For unclassified loans 36,221,325 328,082,385 11,843,503 308,767,582
25,239,712,177 2,952,960,672 25,215,334,355 2,933,645,869
38 Provision for off- balance sheet items
Opening Balance 1,516,443,137 1,066,443,137 1,516,443,137 1,066,443,137
Add/(less): provision made/(released) during the year (390,000,000) 450,000,000 (390,000,000) 450,000,000
Closing balance 1,126,443,137 1,516,443,137 1,126,443,137 1,516,443,137
39 Provision for other assets
Provision made during the year 9,400,000 100,000,000 9,400,000 100,000,000
Consolidated Bank
62
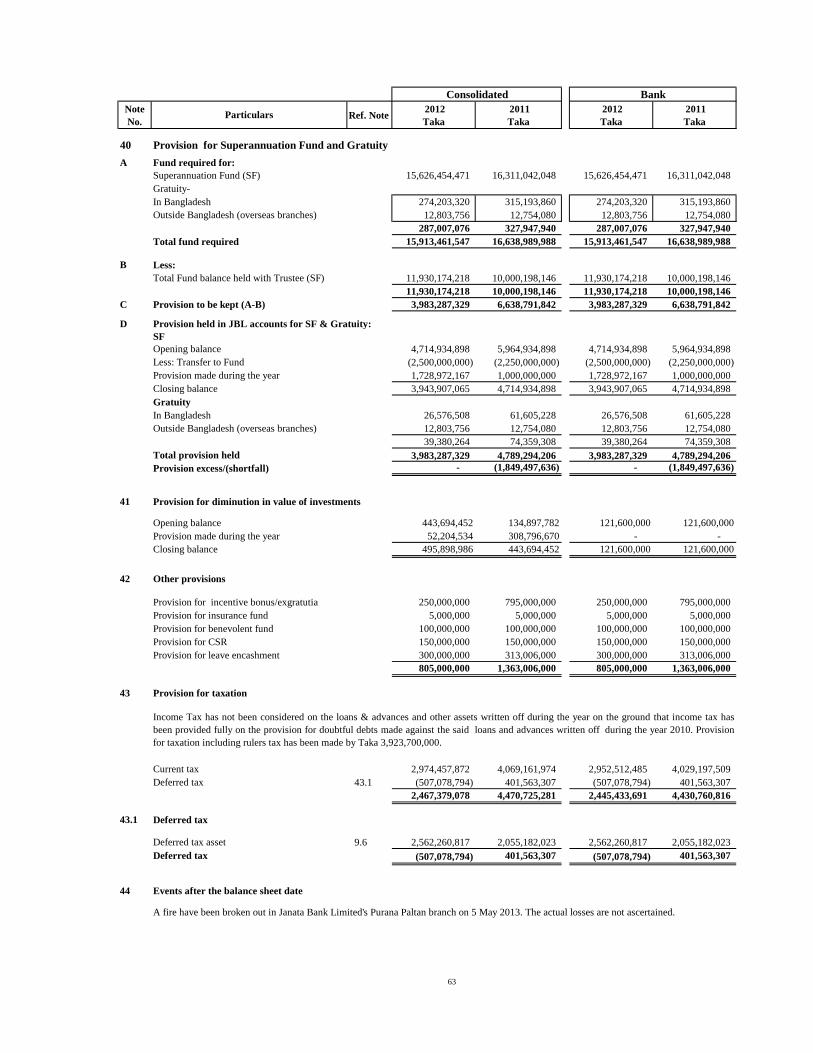
Note
No.Ref. Note
2012
Taka
2011
Taka
2012
Taka
2011
Taka
40 Provision for Superannuation Fund and Gratuity
A
15,626,454,471 16,311,042,048 15,626,454,471 16,311,042,048
274,203,320 315,193,860 274,203,320 315,193,860
12,803,756 12,754,080 12,803,756 12,754,080
287,007,076 327,947,940 287,007,076 327,947,940
15,913,461,547 16,638,989,988 15,913,461,547 16,638,989,988
B
11,930,174,218 10,000,198,146 11,930,174,218 10,000,198,146
11,930,174,218 10,000,198,146 11,930,174,218 10,000,198,146
C 3,983,287,329 6,638,791,842 3,983,287,329 6,638,791,842
D
SF
4,714,934,898 5,964,934,898 4,714,934,898 5,964,934,898
Less: Transfer to Fund (2,500,000,000) (2,250,000,000) (2,500,000,000) (2,250,000,000)
1,728,972,167 1,000,000,000 1,728,972,167 1,000,000,000
Closing balance 3,943,907,065 4,714,934,898 3,943,907,065 4,714,934,898
26,576,508 61,605,228 26,576,508 61,605,228
12,803,756 12,754,080 12,803,756 12,754,080
39,380,264 74,359,308 39,380,264 74,359,308
3,983,287,329 4,789,294,206 3,983,287,329 4,789,294,206
- (1,849,497,636) - (1,849,497,636)
41 Provision for diminution in value of investments
Opening balance 443,694,452 134,897,782 121,600,000 121,600,000
Provision made during the year 52,204,534 308,796,670 - -
Closing balance 495,898,986 443,694,452 121,600,000 121,600,000
42 Other provisions
Provision for incentive bonus/exgratutia 250,000,000 795,000,000 250,000,000 795,000,000
Provision for insurance fund 5,000,000 5,000,000 5,000,000 5,000,000
Provision for benevolent fund 100,000,000 100,000,000 100,000,000 100,000,000
Provision for CSR 150,000,000 150,000,000 150,000,000 150,000,000
Provision for leave encashment 300,000,000 313,006,000 300,000,000 313,006,000
805,000,000 1,363,006,000 805,000,000 1,363,006,000
43 Provision for taxation
Current tax 2,974,457,872 4,069,161,974 2,952,512,485 4,029,197,509
Deferred tax 43.1 (507,078,794) 401,563,307 (507,078,794) 401,563,307
2,467,379,078 4,470,725,281 2,445,433,691 4,430,760,816
43.1 Deferred tax
Deferred tax asset 9.6 2,562,260,817 2,055,182,023 2,562,260,817 2,055,182,023
Deferred tax (507,078,794) 401,563,307 (507,078,794) 401,563,307
44 Events after the balance sheet date
A fire have been broken out in Janata Bank Limited's Purana Paltan branch on 5 May 2013. The actual losses are not ascertained.
Outside Bangladesh (overseas branches)
Fund required for:
Opening balance
In Bangladesh
Outside Bangladesh (overseas branches)
Provision held in JBL accounts for SF & Gratuity:
BankConsolidated
Total Fund balance held with Trustee (SF)
Less:
Provision made during the year
Particulars
In Bangladesh
Total fund required
Superannuation Fund (SF)
Gratuity-
Income Tax has not been considered on the loans & advances and other assets written off during the year on the ground that income tax has
been provided fully on the provision for doubtful debts made against the said loans and advances written off during the year 2010. Provision
for taxation including rulers tax has been made by Taka 3,923,700,000.
Total provision held
Provision to be kept (A-B)
Gratuity
Provision excess/(shortfall)
63
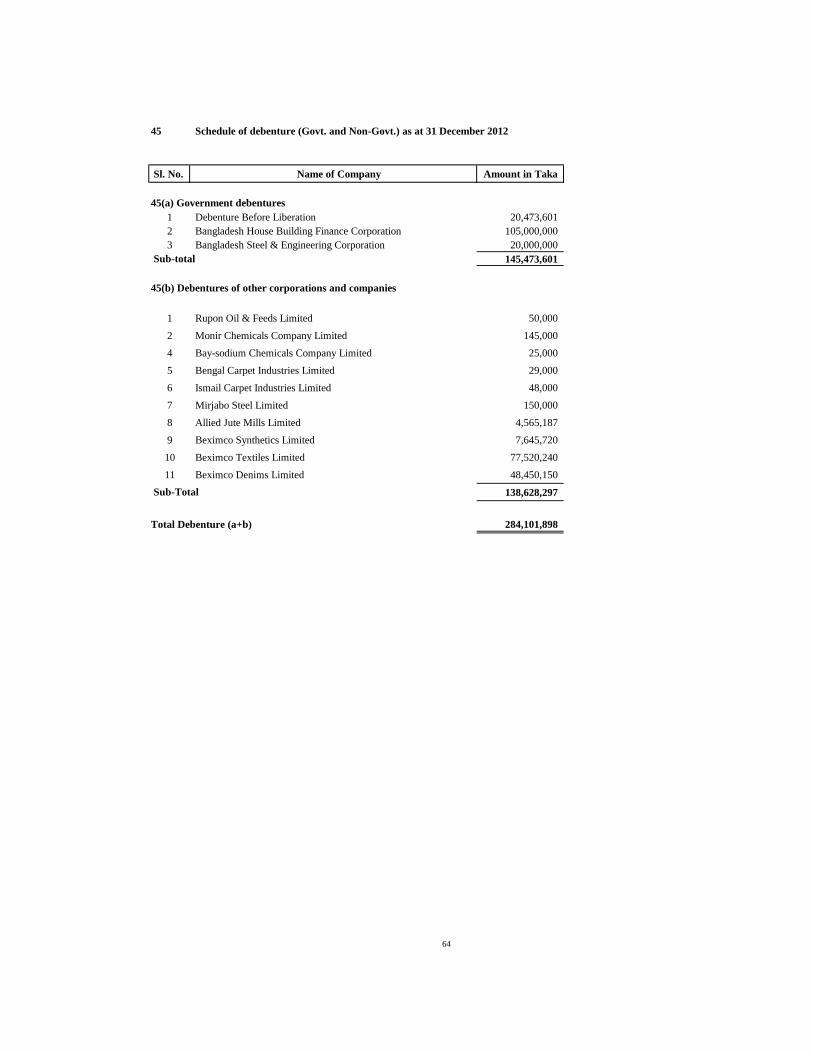
45 Schedule of debenture (Govt. and Non-Govt.) as at 31 December 2012
Sl. No. Name of Company Amount in Taka
1 Debenture Before Liberation 20,473,601
2 Bangladesh House Building Finance Corporation 105,000,000
3 Bangladesh Steel & Engineering Corporation 20,000,000
145,473,601
1 Rupon Oil & Feeds Limited 50,000
2 Monir Chemicals Company Limited 145,000
4 Bay-sodium Chemicals Company Limited 25,000
5 Bengal Carpet Industries Limited 29,000
6 Ismail Carpet Industries Limited 48,000
7 Mirjabo Steel Limited 150,000
8 Allied Jute Mills Limited 4,565,187
9 Beximco Synthetics Limited 7,645,720
10 Beximco Textiles Limited 77,520,240
11 Beximco Denims Limited 48,450,150
138,628,297
284,101,898
Sub-Total
Total Debenture (a+b)
45(b) Debentures of other corporations and companies
45(a) Government debentures
Sub-total
64
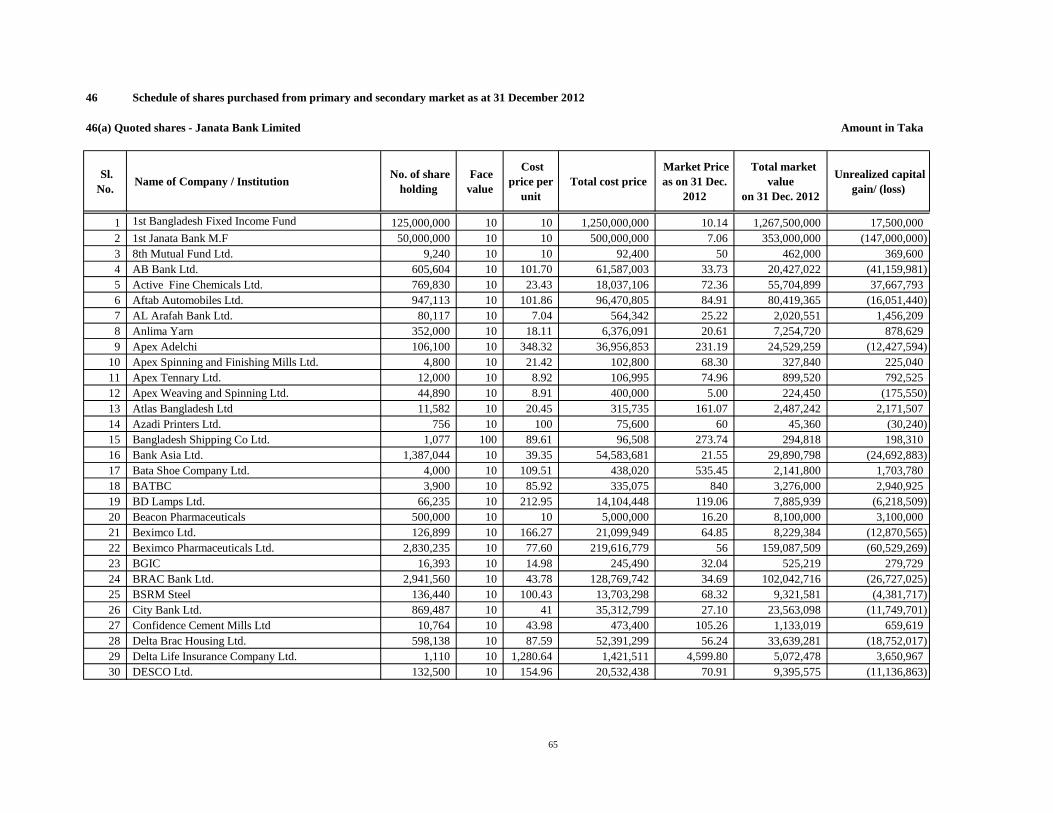
46 Schedule of shares purchased from primary and secondary market as at 31 December 2012
Sl.
No. Name of Company / Institution
No. of share
holding
Face
value
Cost
price per
unit
Total cost price
Market Price
as on 31 Dec.
2012
Total market
value
on 31 Dec. 2012
Unrealized capital
gain/ (loss)
1 1st Bangladesh Fixed Income Fund 125,000,000 10 10 1,250,000,000 10.14 1,267,500,000 17,500,000
2 1st Janata Bank M.F 50,000,000 10 10 500,000,000 7.06 353,000,000 (147,000,000)
3 8th Mutual Fund Ltd. 9,240 10 10 92,400 50 462,000 369,600
4 AB Bank Ltd. 605,604 10 101.70 61,587,003 33.73 20,427,022 (41,159,981)
5 Active Fine Chemicals Ltd. 769,830 10 23.43 18,037,106 72.36 55,704,899 37,667,793
6 Aftab Automobiles Ltd. 947,113 10 101.86 96,470,805 84.91 80,419,365 (16,051,440)
7 AL Arafah Bank Ltd. 80,117 10 7.04 564,342 25.22 2,020,551 1,456,209
8 Anlima Yarn 352,000 10 18.11 6,376,091 20.61 7,254,720 878,629
9 Apex Adelchi 106,100 10 348.32 36,956,853 231.19 24,529,259 (12,427,594)
10 Apex Spinning and Finishing Mills Ltd. 4,800 10 21.42 102,800 68.30 327,840 225,040
11 Apex Tennary Ltd. 12,000 10 8.92 106,995 74.96 899,520 792,525
12 Apex Weaving and Spinning Ltd. 44,890 10 8.91 400,000 5.00 224,450 (175,550)
13 Atlas Bangladesh Ltd 11,582 10 20.45 315,735 161.07 2,487,242 2,171,507
14 Azadi Printers Ltd. 756 10 100 75,600 60 45,360 (30,240)
15 Bangladesh Shipping Co Ltd. 1,077 100 89.61 96,508 273.74 294,818 198,310
16 Bank Asia Ltd. 1,387,044 10 39.35 54,583,681 21.55 29,890,798 (24,692,883)
17 Bata Shoe Company Ltd. 4,000 10 109.51 438,020 535.45 2,141,800 1,703,780
18 BATBC 3,900 10 85.92 335,075 840 3,276,000 2,940,925
19 BD Lamps Ltd. 66,235 10 212.95 14,104,448 119.06 7,885,939 (6,218,509)
20 Beacon Pharmaceuticals 500,000 10 10 5,000,000 16.20 8,100,000 3,100,000
21 Beximco Ltd. 126,899 10 166.27 21,099,949 64.85 8,229,384 (12,870,565)
22 Beximco Pharmaceuticals Ltd. 2,830,235 10 77.60 219,616,779 56 159,087,509 (60,529,269)
23 BGIC 16,393 10 14.98 245,490 32.04 525,219 279,729
24 BRAC Bank Ltd. 2,941,560 10 43.78 128,769,742 34.69 102,042,716 (26,727,025)
25 BSRM Steel 136,440 10 100.43 13,703,298 68.32 9,321,581 (4,381,717)
26 City Bank Ltd. 869,487 10 41 35,312,799 27.10 23,563,098 (11,749,701)
27 Confidence Cement Mills Ltd 10,764 10 43.98 473,400 105.26 1,133,019 659,619
28 Delta Brac Housing Ltd. 598,138 10 87.59 52,391,299 56.24 33,639,281 (18,752,017)
29 Delta Life Insurance Company Ltd. 1,110 10 1,280.64 1,421,511 4,599.80 5,072,478 3,650,967
30 DESCO Ltd. 132,500 10 154.96 20,532,438 70.91 9,395,575 (11,136,863)
Amount in Taka46(a) Quoted shares - Janata Bank Limited
65
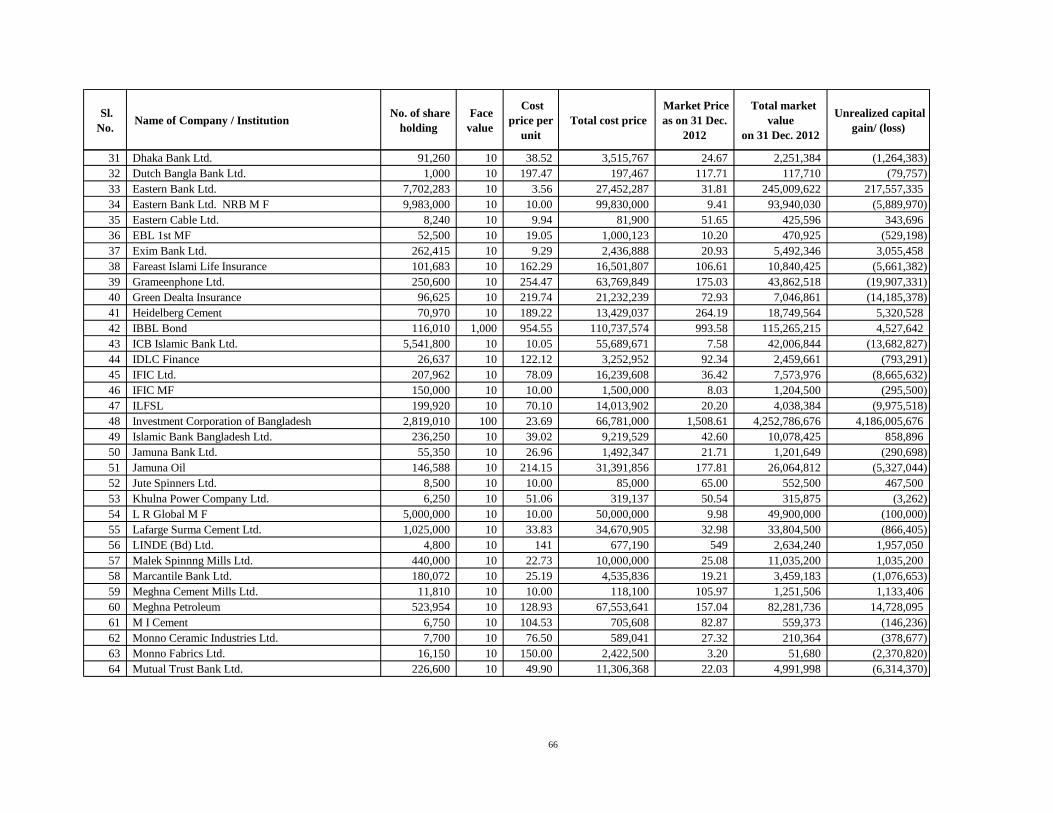
Sl.
No. Name of Company / Institution
No. of share
holding
Face
value
Cost
price per
unit
Total cost price
Market Price
as on 31 Dec.
2012
Total market
value
on 31 Dec. 2012
Unrealized capital
gain/ (loss)
31 Dhaka Bank Ltd. 91,260 10 38.52 3,515,767 24.67 2,251,384 (1,264,383)
32 Dutch Bangla Bank Ltd. 1,000 10 197.47 197,467 117.71 117,710 (79,757)
33 Eastern Bank Ltd. 7,702,283 10 3.56 27,452,287 31.81 245,009,622 217,557,335
34 Eastern Bank Ltd. NRB M F 9,983,000 10 10.00 99,830,000 9.41 93,940,030 (5,889,970)
35 Eastern Cable Ltd. 8,240 10 9.94 81,900 51.65 425,596 343,696
36 EBL 1st MF 52,500 10 19.05 1,000,123 10.20 470,925 (529,198)
37 Exim Bank Ltd. 262,415 10 9.29 2,436,888 20.93 5,492,346 3,055,458
38 Fareast Islami Life Insurance 101,683 10 162.29 16,501,807 106.61 10,840,425 (5,661,382)
39 Grameenphone Ltd. 250,600 10 254.47 63,769,849 175.03 43,862,518 (19,907,331)
40 Green Dealta Insurance 96,625 10 219.74 21,232,239 72.93 7,046,861 (14,185,378)
41 Heidelberg Cement 70,970 10 189.22 13,429,037 264.19 18,749,564 5,320,528
42 IBBL Bond 116,010 1,000 954.55 110,737,574 993.58 115,265,215 4,527,642
43 ICB Islamic Bank Ltd. 5,541,800 10 10.05 55,689,671 7.58 42,006,844 (13,682,827)
44 IDLC Finance 26,637 10 122.12 3,252,952 92.34 2,459,661 (793,291)
45 IFIC Ltd. 207,962 10 78.09 16,239,608 36.42 7,573,976 (8,665,632)
46 IFIC MF 150,000 10 10.00 1,500,000 8.03 1,204,500 (295,500)
47 ILFSL 199,920 10 70.10 14,013,902 20.20 4,038,384 (9,975,518)
48 Investment Corporation of Bangladesh 2,819,010 100 23.69 66,781,000 1,508.61 4,252,786,676 4,186,005,676
49 Islamic Bank Bangladesh Ltd. 236,250 10 39.02 9,219,529 42.60 10,078,425 858,896
50 Jamuna Bank Ltd. 55,350 10 26.96 1,492,347 21.71 1,201,649 (290,698)
51 Jamuna Oil 146,588 10 214.15 31,391,856 177.81 26,064,812 (5,327,044)
52 Jute Spinners Ltd. 8,500 10 10.00 85,000 65.00 552,500 467,500
53 Khulna Power Company Ltd. 6,250 10 51.06 319,137 50.54 315,875 (3,262)
54 L R Global M F 5,000,000 10 10.00 50,000,000 9.98 49,900,000 (100,000)
55 Lafarge Surma Cement Ltd. 1,025,000 10 33.83 34,670,905 32.98 33,804,500 (866,405)
56 LINDE (Bd) Ltd. 4,800 10 141 677,190 549 2,634,240 1,957,050
57 Malek Spinnng Mills Ltd. 440,000 10 22.73 10,000,000 25.08 11,035,200 1,035,200
58 Marcantile Bank Ltd. 180,072 10 25.19 4,535,836 19.21 3,459,183 (1,076,653)
59 Meghna Cement Mills Ltd. 11,810 10 10.00 118,100 105.97 1,251,506 1,133,406
60 Meghna Petroleum 523,954 10 128.93 67,553,641 157.04 82,281,736 14,728,095
61 M I Cement 6,750 10 104.53 705,608 82.87 559,373 (146,236)
62 Monno Ceramic Industries Ltd. 7,700 10 76.50 589,041 27.32 210,364 (378,677)
63 Monno Fabrics Ltd. 16,150 10 150.00 2,422,500 3.20 51,680 (2,370,820)
64 Mutual Trust Bank Ltd. 226,600 10 49.90 11,306,368 22.03 4,991,998 (6,314,370)
66
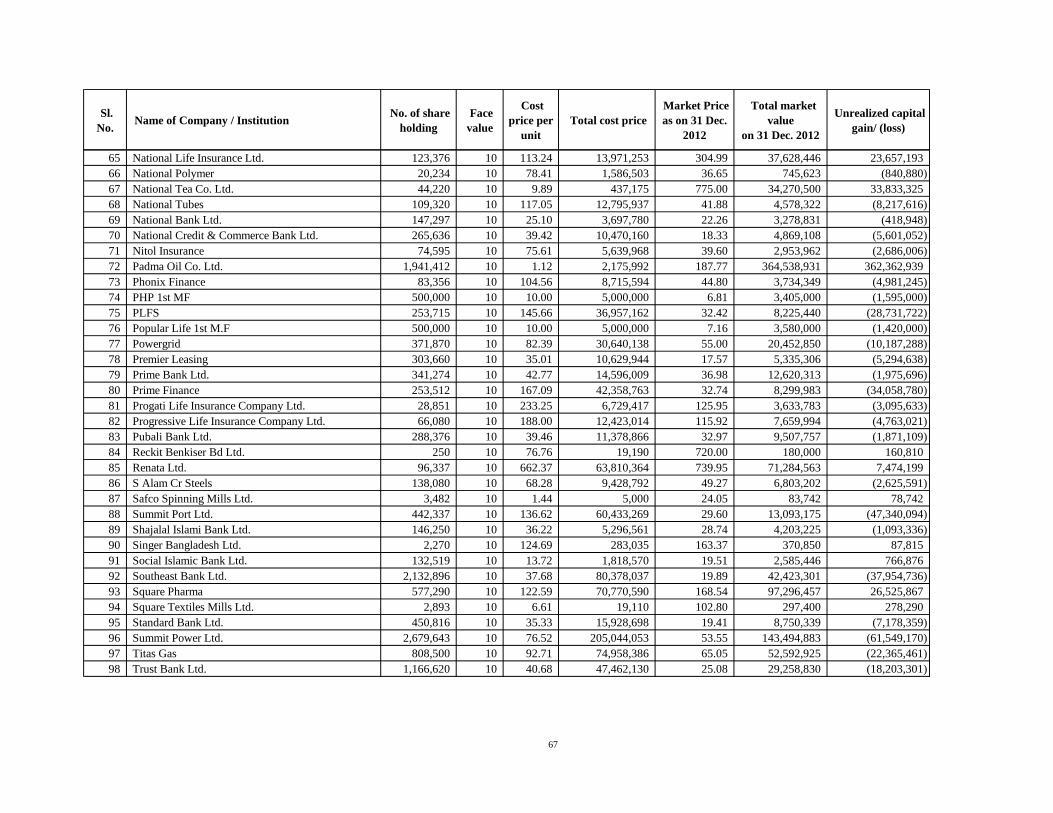
Sl.
No. Name of Company / Institution
No. of share
holding
Face
value
Cost
price per
unit
Total cost price
Market Price
as on 31 Dec.
2012
Total market
value
on 31 Dec. 2012
Unrealized capital
gain/ (loss)
65 National Life Insurance Ltd. 123,376 10 113.24 13,971,253 304.99 37,628,446 23,657,193
66 National Polymer 20,234 10 78.41 1,586,503 36.65 745,623 (840,880)
67 National Tea Co. Ltd. 44,220 10 9.89 437,175 775.00 34,270,500 33,833,325
68 National Tubes 109,320 10 117.05 12,795,937 41.88 4,578,322 (8,217,616)
69 National Bank Ltd. 147,297 10 25.10 3,697,780 22.26 3,278,831 (418,948)
70 National Credit & Commerce Bank Ltd. 265,636 10 39.42 10,470,160 18.33 4,869,108 (5,601,052)
71 Nitol Insurance 74,595 10 75.61 5,639,968 39.60 2,953,962 (2,686,006)
72 Padma Oil Co. Ltd. 1,941,412 10 1.12 2,175,992 187.77 364,538,931 362,362,939
73 Phonix Finance 83,356 10 104.56 8,715,594 44.80 3,734,349 (4,981,245)
74 PHP 1st MF 500,000 10 10.00 5,000,000 6.81 3,405,000 (1,595,000)
75 PLFS 253,715 10 145.66 36,957,162 32.42 8,225,440 (28,731,722)
76 Popular Life 1st M.F 500,000 10 10.00 5,000,000 7.16 3,580,000 (1,420,000)
77 Powergrid 371,870 10 82.39 30,640,138 55.00 20,452,850 (10,187,288)
78 Premier Leasing 303,660 10 35.01 10,629,944 17.57 5,335,306 (5,294,638)
79 Prime Bank Ltd. 341,274 10 42.77 14,596,009 36.98 12,620,313 (1,975,696)
80 Prime Finance 253,512 10 167.09 42,358,763 32.74 8,299,983 (34,058,780)
81 Progati Life Insurance Company Ltd. 28,851 10 233.25 6,729,417 125.95 3,633,783 (3,095,633)
82 Progressive Life Insurance Company Ltd. 66,080 10 188.00 12,423,014 115.92 7,659,994 (4,763,021)
83 Pubali Bank Ltd. 288,376 10 39.46 11,378,866 32.97 9,507,757 (1,871,109)
84 Reckit Benkiser Bd Ltd. 250 10 76.76 19,190 720.00 180,000 160,810
85 Renata Ltd. 96,337 10 662.37 63,810,364 739.95 71,284,563 7,474,199
86 S Alam Cr Steels 138,080 10 68.28 9,428,792 49.27 6,803,202 (2,625,591)
87 Safco Spinning Mills Ltd. 3,482 10 1.44 5,000 24.05 83,742 78,742
88 Summit Port Ltd. 442,337 10 136.62 60,433,269 29.60 13,093,175 (47,340,094)
89 Shajalal Islami Bank Ltd. 146,250 10 36.22 5,296,561 28.74 4,203,225 (1,093,336)
90 Singer Bangladesh Ltd. 2,270 10 124.69 283,035 163.37 370,850 87,815
91 Social Islamic Bank Ltd. 132,519 10 13.72 1,818,570 19.51 2,585,446 766,876
92 Southeast Bank Ltd. 2,132,896 10 37.68 80,378,037 19.89 42,423,301 (37,954,736)
93 Square Pharma 577,290 10 122.59 70,770,590 168.54 97,296,457 26,525,867
94 Square Textiles Mills Ltd. 2,893 10 6.61 19,110 102.80 297,400 278,290
95 Standard Bank Ltd. 450,816 10 35.33 15,928,698 19.41 8,750,339 (7,178,359)
96 Summit Power Ltd. 2,679,643 10 76.52 205,044,053 53.55 143,494,883 (61,549,170)
97 Titas Gas 808,500 10 92.71 74,958,386 65.05 52,592,925 (22,365,461)
98 Trust Bank Ltd. 1,166,620 10 40.68 47,462,130 25.08 29,258,830 (18,203,301)
67
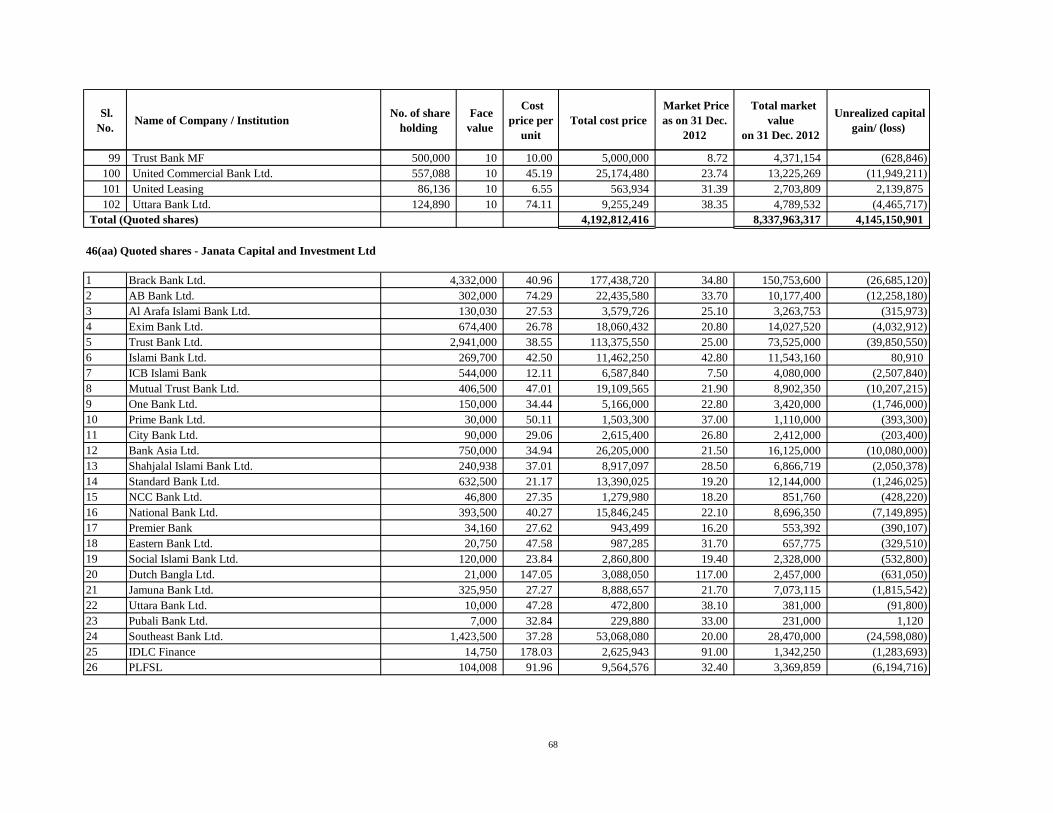
Sl.
No. Name of Company / Institution
No. of share
holding
Face
value
Cost
price per
unit
Total cost price
Market Price
as on 31 Dec.
2012
Total market
value
on 31 Dec. 2012
Unrealized capital
gain/ (loss)
99 Trust Bank MF 500,000 10 10.00 5,000,000 8.72 4,371,154 (628,846)
100 United Commercial Bank Ltd. 557,088 10 45.19 25,174,480 23.74 13,225,269 (11,949,211)
101 United Leasing 86,136 10 6.55 563,934 31.39 2,703,809 2,139,875
102 Uttara Bank Ltd. 124,890 10 74.11 9,255,249 38.35 4,789,532 (4,465,717)
4,192,812,416 8,337,963,317 4,145,150,901
1 Brack Bank Ltd. 40.96 177,438,720 34.80 150,753,600 (26,685,120)
2 AB Bank Ltd. 74.29 22,435,580 33.70 10,177,400 (12,258,180)
3 Al Arafa Islami Bank Ltd. 27.53 3,579,726 25.10 3,263,753 (315,973)
4 Exim Bank Ltd. 26.78 18,060,432 20.80 14,027,520 (4,032,912)
5 Trust Bank Ltd. 38.55 113,375,550 25.00 73,525,000 (39,850,550)
6 Islami Bank Ltd. 42.50 11,462,250 42.80 11,543,160 80,910
7 ICB Islami Bank 12.11 6,587,840 7.50 4,080,000 (2,507,840)
8 Mutual Trust Bank Ltd. 47.01 19,109,565 21.90 8,902,350 (10,207,215)
9 One Bank Ltd. 34.44 5,166,000 22.80 3,420,000 (1,746,000)
10 Prime Bank Ltd. 50.11 1,503,300 37.00 1,110,000 (393,300)
11 City Bank Ltd. 29.06 2,615,400 26.80 2,412,000 (203,400)
12 Bank Asia Ltd. 34.94 26,205,000 21.50 16,125,000 (10,080,000)
13 Shahjalal Islami Bank Ltd. 37.01 8,917,097 28.50 6,866,719 (2,050,378)
14 Standard Bank Ltd. 21.17 13,390,025 19.20 12,144,000 (1,246,025)
15 NCC Bank Ltd. 27.35 1,279,980 18.20 851,760 (428,220)
16 National Bank Ltd. 40.27 15,846,245 22.10 8,696,350 (7,149,895)
17 Premier Bank 27.62 943,499 16.20 553,392 (390,107)
18 Eastern Bank Ltd. 47.58 987,285 31.70 657,775 (329,510)
19 Social Islami Bank Ltd. 23.84 2,860,800 19.40 2,328,000 (532,800)
20 Dutch Bangla Ltd. 147.05 3,088,050 117.00 2,457,000 (631,050)
21 Jamuna Bank Ltd. 27.27 8,888,657 21.70 7,073,115 (1,815,542)
22 Uttara Bank Ltd. 47.28 472,800 38.10 381,000 (91,800)
23 Pubali Bank Ltd. 32.84 229,880 33.00 231,000 1,120
24 Southeast Bank Ltd. 37.28 53,068,080 20.00 28,470,000 (24,598,080)
25 IDLC Finance 178.03 2,625,943 91.00 1,342,250 (1,283,693)
26 PLFSL 91.96 9,564,576 32.40 3,369,859 (6,194,716)
10,000
7,000
1,423,500
14,750
104,008
393,500
34,160
20,750
120,000
21,000
325,950
30,000
90,000
750,000
240,938
632,500
46,800
674,400
2,941,000
269,700
544,000
406,500
150,000
Total (Quoted shares)
46(aa) Quoted shares - Janata Capital and Investment Ltd
4,332,000
302,000
130,030
68
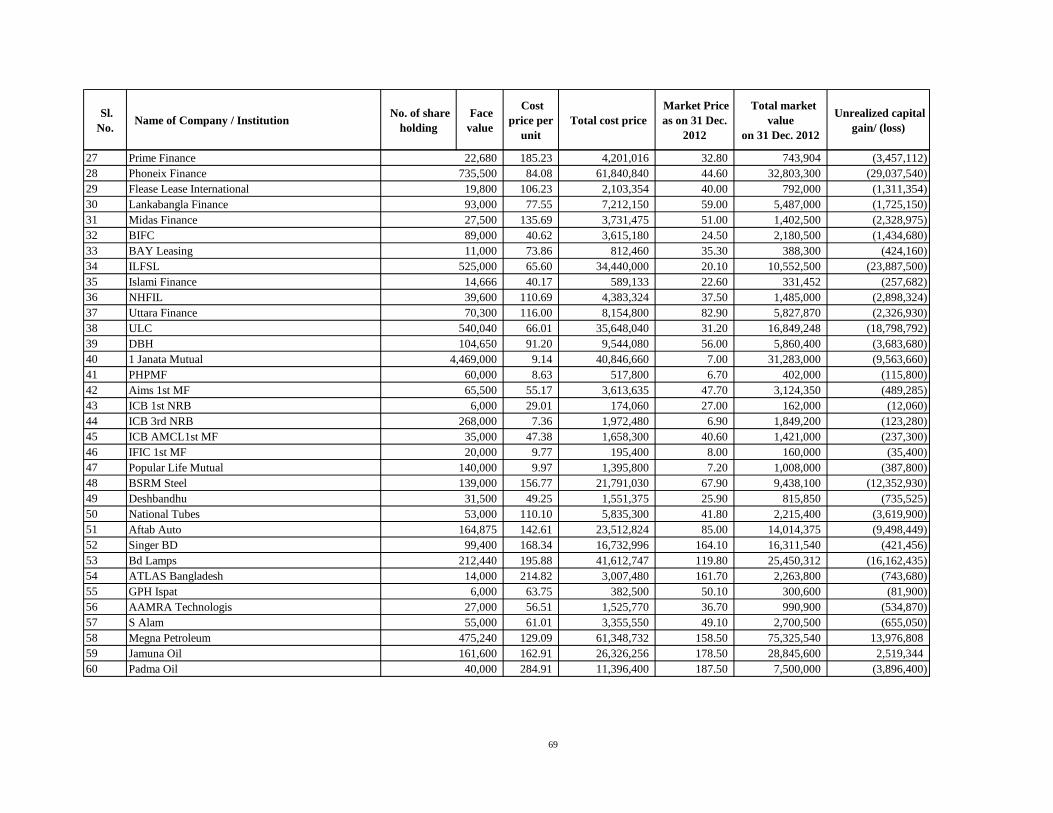
Sl.
No. Name of Company / Institution
No. of share
holding
Face
value
Cost
price per
unit
Total cost price
Market Price
as on 31 Dec.
2012
Total market
value
on 31 Dec. 2012
Unrealized capital
gain/ (loss)
27 Prime Finance 185.23 4,201,016 32.80 743,904 (3,457,112)
28 Phoneix Finance 84.08 61,840,840 44.60 32,803,300 (29,037,540)
29 Flease Lease International 106.23 2,103,354 40.00 792,000 (1,311,354)
30 Lankabangla Finance 77.55 7,212,150 59.00 5,487,000 (1,725,150)
31 Midas Finance 135.69 3,731,475 51.00 1,402,500 (2,328,975)
32 BIFC 40.62 3,615,180 24.50 2,180,500 (1,434,680)
33 BAY Leasing 73.86 812,460 35.30 388,300 (424,160)
34 ILFSL 65.60 34,440,000 20.10 10,552,500 (23,887,500)
35 Islami Finance 40.17 589,133 22.60 331,452 (257,682)
36 NHFIL 110.69 4,383,324 37.50 1,485,000 (2,898,324)
37 Uttara Finance 116.00 8,154,800 82.90 5,827,870 (2,326,930)
38 ULC 66.01 35,648,040 31.20 16,849,248 (18,798,792)
39 DBH 91.20 9,544,080 56.00 5,860,400 (3,683,680)
40 1 Janata Mutual 9.14 40,846,660 7.00 31,283,000 (9,563,660)
41 PHPMF 8.63 517,800 6.70 402,000 (115,800)
42 Aims 1st MF 55.17 3,613,635 47.70 3,124,350 (489,285)
43 ICB 1st NRB 29.01 174,060 27.00 162,000 (12,060)
44 ICB 3rd NRB 7.36 1,972,480 6.90 1,849,200 (123,280)
45 ICB AMCL1st MF 47.38 1,658,300 40.60 1,421,000 (237,300)
46 IFIC 1st MF 9.77 195,400 8.00 160,000 (35,400)
47 Popular Life Mutual 9.97 1,395,800 7.20 1,008,000 (387,800)
48 BSRM Steel 156.77 21,791,030 67.90 9,438,100 (12,352,930)
49 Deshbandhu 49.25 1,551,375 25.90 815,850 (735,525)
50 National Tubes 110.10 5,835,300 41.80 2,215,400 (3,619,900)
51 Aftab Auto 142.61 23,512,824 85.00 14,014,375 (9,498,449)
52 Singer BD 168.34 16,732,996 164.10 16,311,540 (421,456)
53 Bd Lamps 195.88 41,612,747 119.80 25,450,312 (16,162,435)
54 ATLAS Bangladesh 214.82 3,007,480 161.70 2,263,800 (743,680)
55 GPH Ispat 63.75 382,500 50.10 300,600 (81,900)
56 AAMRA Technologis 56.51 1,525,770 36.70 990,900 (534,870)
57 S Alam 61.01 3,355,550 49.10 2,700,500 (655,050)
58 Megna Petroleum 129.09 61,348,732 158.50 75,325,540 13,976,808
59 Jamuna Oil 162.91 26,326,256 178.50 28,845,600 2,519,344
60 Padma Oil 284.91 11,396,400 187.50 7,500,000 (3,896,400)
475,240
161,600
40,000
99,400
212,440
14,000
6,000
27,000
55,000
20,000
140,000
139,000
31,500
53,000
164,875
4,469,000
60,000
65,500
6,000
268,000
35,000
525,000
14,666
39,600
70,300
540,040
104,650
735,500
19,800
93,000
27,500
89,000
11,000
22,680
69
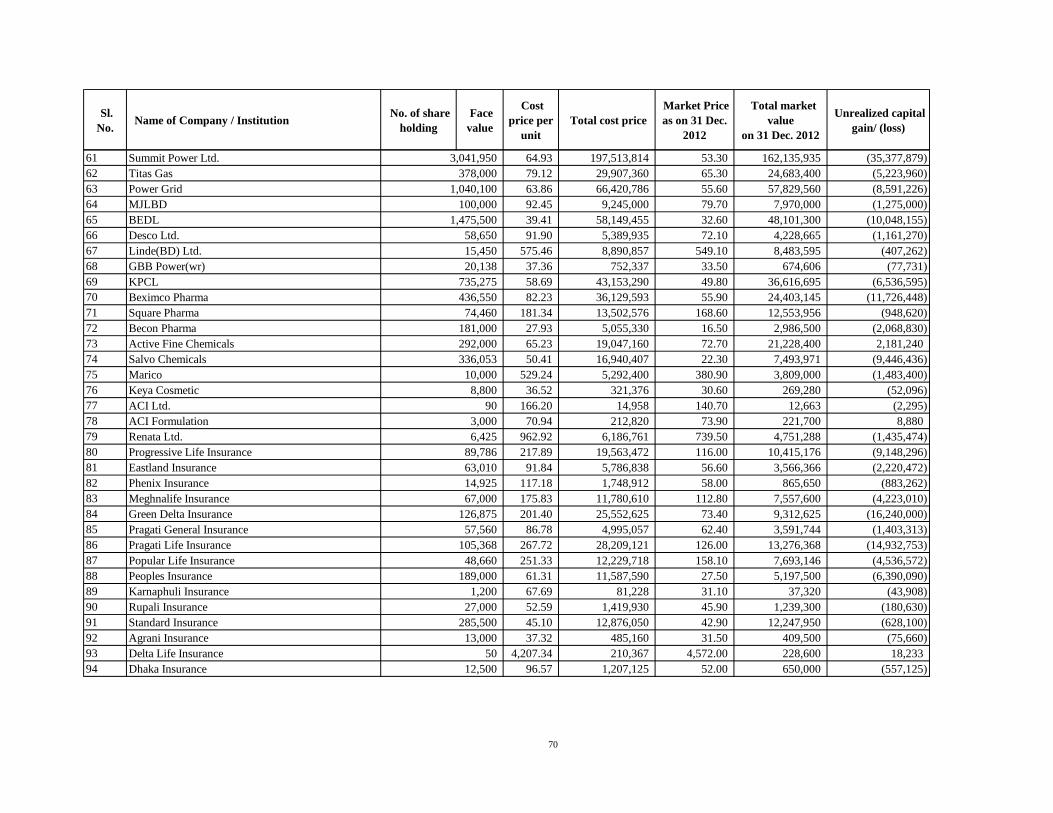
Sl.
No. Name of Company / Institution
No. of share
holding
Face
value
Cost
price per
unit
Total cost price
Market Price
as on 31 Dec.
2012
Total market
value
on 31 Dec. 2012
Unrealized capital
gain/ (loss)
61 Summit Power Ltd. 64.93 197,513,814 53.30 162,135,935 (35,377,879)
62 Titas Gas 79.12 29,907,360 65.30 24,683,400 (5,223,960)
63 Power Grid 63.86 66,420,786 55.60 57,829,560 (8,591,226)
64 MJLBD 92.45 9,245,000 79.70 7,970,000 (1,275,000)
65 BEDL 39.41 58,149,455 32.60 48,101,300 (10,048,155)
66 Desco Ltd. 91.90 5,389,935 72.10 4,228,665 (1,161,270)
67 Linde(BD) Ltd. 575.46 8,890,857 549.10 8,483,595 (407,262)
68 GBB Power(wr) 37.36 752,337 33.50 674,606 (77,731)
69 KPCL 58.69 43,153,290 49.80 36,616,695 (6,536,595)
70 Beximco Pharma 82.23 36,129,593 55.90 24,403,145 (11,726,448)
71 Square Pharma 181.34 13,502,576 168.60 12,553,956 (948,620)
72 Becon Pharma 27.93 5,055,330 16.50 2,986,500 (2,068,830)
73 Active Fine Chemicals 65.23 19,047,160 72.70 21,228,400 2,181,240
74 Salvo Chemicals 50.41 16,940,407 22.30 7,493,971 (9,446,436)
75 Marico 529.24 5,292,400 380.90 3,809,000 (1,483,400)
76 Keya Cosmetic 36.52 321,376 30.60 269,280 (52,096)
77 ACI Ltd. 166.20 14,958 140.70 12,663 (2,295)
78 ACI Formulation 70.94 212,820 73.90 221,700 8,880
79 Renata Ltd. 962.92 6,186,761 739.50 4,751,288 (1,435,474)
80 Progressive Life Insurance 217.89 19,563,472 116.00 10,415,176 (9,148,296)
81 Eastland Insurance 91.84 5,786,838 56.60 3,566,366 (2,220,472)
82 Phenix Insurance 117.18 1,748,912 58.00 865,650 (883,262)
83 Meghnalife Insurance 175.83 11,780,610 112.80 7,557,600 (4,223,010)
84 Green Delta Insurance 201.40 25,552,625 73.40 9,312,625 (16,240,000)
85 Pragati General Insurance 86.78 4,995,057 62.40 3,591,744 (1,403,313)
86 Pragati Life Insurance 267.72 28,209,121 126.00 13,276,368 (14,932,753)
87 Popular Life Insurance 251.33 12,229,718 158.10 7,693,146 (4,536,572)
88 Peoples Insurance 61.31 11,587,590 27.50 5,197,500 (6,390,090)
89 Karnaphuli Insurance 67.69 81,228 31.10 37,320 (43,908)
90 Rupali Insurance 52.59 1,419,930 45.90 1,239,300 (180,630)
91 Standard Insurance 45.10 12,876,050 42.90 12,247,950 (628,100)
92 Agrani Insurance 37.32 485,160 31.50 409,500 (75,660)
93 Delta Life Insurance 4,207.34 210,367 4,572.00 228,600 18,233
94 Dhaka Insurance 96.57 1,207,125 52.00 650,000 (557,125) 12,500
189,000
1,200
27,000
285,500
13,000
50
14,925
67,000
126,875
57,560
105,368
48,660
8,800
90
3,000
6,425
89,786
63,010
436,550
74,460
181,000
292,000
336,053
10,000
100,000
1,475,500
58,650
15,450
20,138
735,275
3,041,950
378,000
1,040,100
70
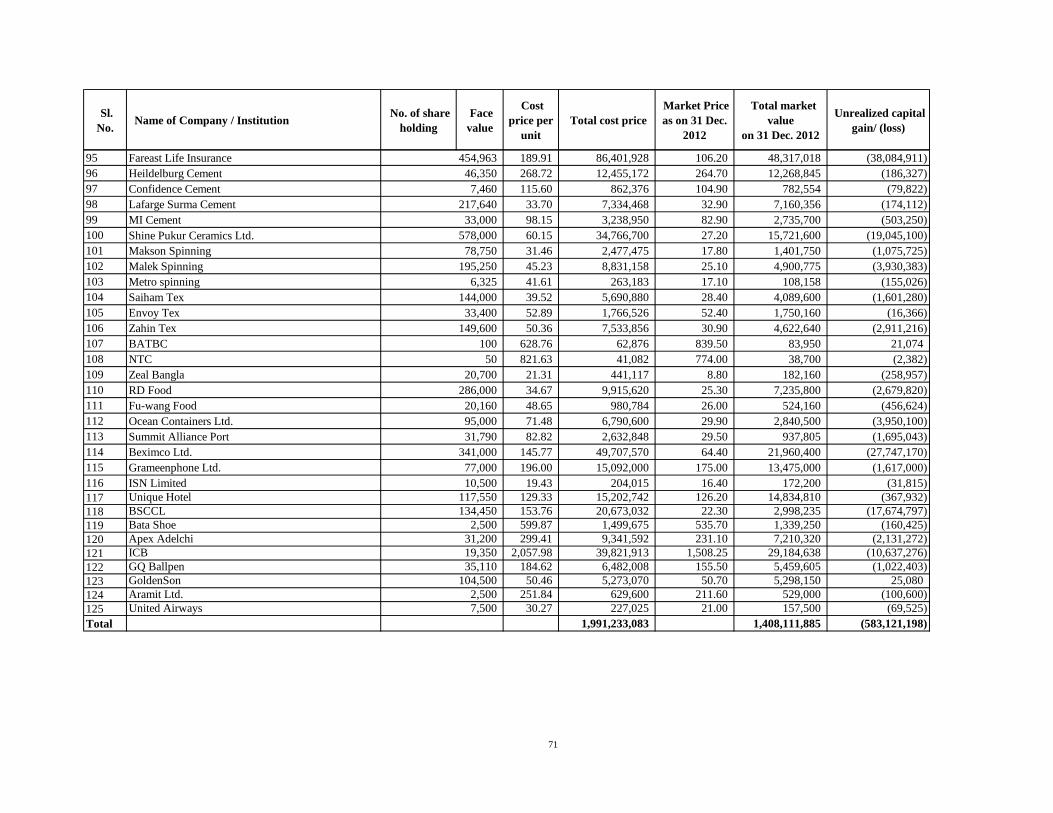
Sl.
No. Name of Company / Institution
No. of share
holding
Face
value
Cost
price per
unit
Total cost price
Market Price
as on 31 Dec.
2012
Total market
value
on 31 Dec. 2012
Unrealized capital
gain/ (loss)
95 Fareast Life Insurance 189.91 86,401,928 106.20 48,317,018 (38,084,911)
96 Heildelburg Cement 268.72 12,455,172 264.70 12,268,845 (186,327)
97 Confidence Cement 115.60 862,376 104.90 782,554 (79,822)
98 Lafarge Surma Cement 33.70 7,334,468 32.90 7,160,356 (174,112)
99 MI Cement 98.15 3,238,950 82.90 2,735,700 (503,250)
100 Shine Pukur Ceramics Ltd. 60.15 34,766,700 27.20 15,721,600 (19,045,100)
101 Makson Spinning 31.46 2,477,475 17.80 1,401,750 (1,075,725)
102 Malek Spinning 45.23 8,831,158 25.10 4,900,775 (3,930,383)
103 Metro spinning 41.61 263,183 17.10 108,158 (155,026)
104 Saiham Tex 39.52 5,690,880 28.40 4,089,600 (1,601,280)
105 Envoy Tex 52.89 1,766,526 52.40 1,750,160 (16,366)
106 Zahin Tex 50.36 7,533,856 30.90 4,622,640 (2,911,216)
107 BATBC 628.76 62,876 839.50 83,950 21,074
108 NTC 821.63 41,082 774.00 38,700 (2,382)
109 Zeal Bangla 21.31 441,117 8.80 182,160 (258,957)
110 RD Food 34.67 9,915,620 25.30 7,235,800 (2,679,820)
111 Fu-wang Food 48.65 980,784 26.00 524,160 (456,624)
112 Ocean Containers Ltd. 71.48 6,790,600 29.90 2,840,500 (3,950,100)
113 Summit Alliance Port 82.82 2,632,848 29.50 937,805 (1,695,043)
114 Beximco Ltd. 145.77 49,707,570 64.40 21,960,400 (27,747,170)
115 Grameenphone Ltd. 196.00 15,092,000 175.00 13,475,000 (1,617,000)
116 ISN Limited 19.43 204,015 16.40 172,200 (31,815)
117 Unique Hotel 129.33 15,202,742 126.20 14,834,810 (367,932)
118 BSCCL 153.76 20,673,032 22.30 2,998,235 (17,674,797)
119 Bata Shoe 599.87 1,499,675 535.70 1,339,250 (160,425)
120 Apex Adelchi 299.41 9,341,592 231.10 7,210,320 (2,131,272)
121 ICB 2,057.98 39,821,913 1,508.25 29,184,638 (10,637,276)
122 GQ Ballpen 184.62 6,482,008 155.50 5,459,605 (1,022,403)
123 GoldenSon 50.46 5,273,070 50.70 5,298,150 25,080
124 Aramit Ltd. 251.84 629,600 211.60 529,000 (100,600)
125 United Airways 30.27 227,025 21.00 157,500 (69,525)
Total 1,991,233,083 1,408,111,885 (583,121,198)
35,110
104,500
2,500
7,500
134,450
2,500
31,200
19,350
95,000
31,790
341,000
77,000
10,500
117,550
149,600
100
50
20,700
286,000
20,160
578,000
78,750
195,250
6,325
144,000
33,400
454,963
46,350
7,460
217,640
33,000
71
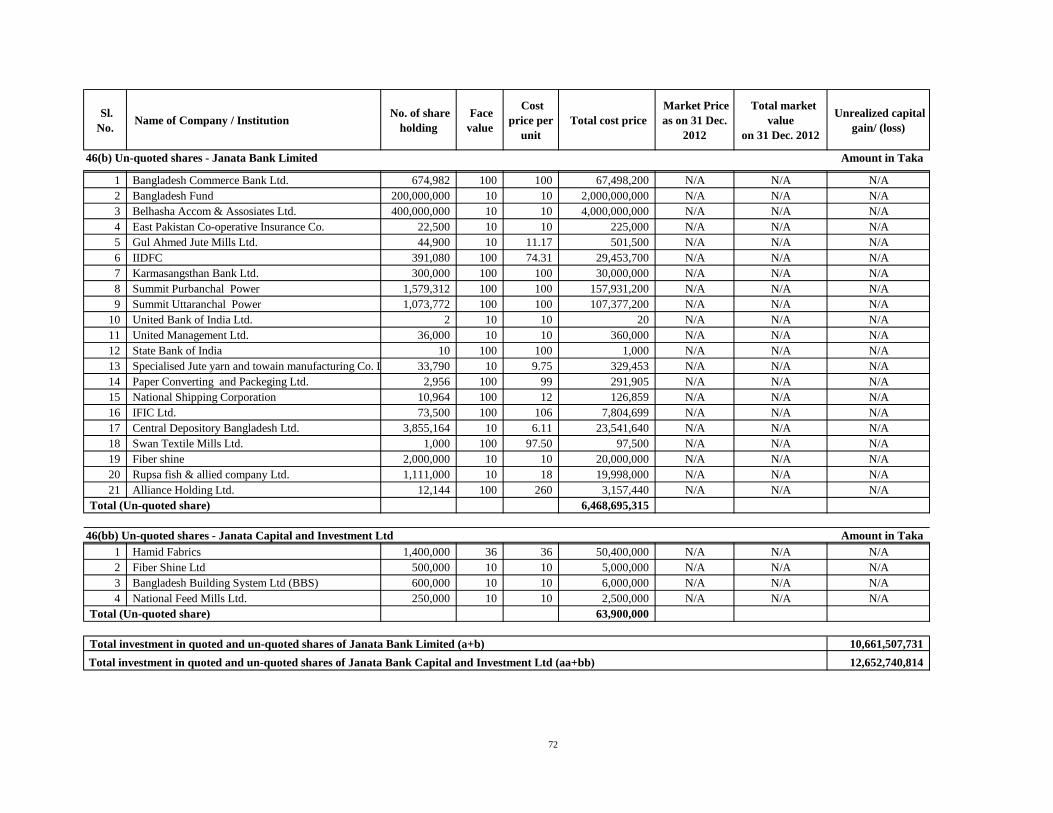
Sl.
No. Name of Company / Institution
No. of share
holding
Face
value
Cost
price per
unit
Total cost price
Market Price
as on 31 Dec.
2012
Total market
value
on 31 Dec. 2012
Unrealized capital
gain/ (loss)
1 Bangladesh Commerce Bank Ltd. 674,982 100 100 67,498,200 N/A N/A N/A
2 Bangladesh Fund 200,000,000 10 10 2,000,000,000 N/A N/A N/A
3 Belhasha Accom & Assosiates Ltd. 400,000,000 10 10 4,000,000,000 N/A N/A N/A
4 East Pakistan Co-operative Insurance Co. 22,500 10 10 225,000 N/A N/A N/A
5 Gul Ahmed Jute Mills Ltd. 44,900 10 11.17 501,500 N/A N/A N/A
6 IIDFC 391,080 100 74.31 29,453,700 N/A N/A N/A
7 Karmasangsthan Bank Ltd. 300,000 100 100 30,000,000 N/A N/A N/A
8 Summit Purbanchal Power 1,579,312 100 100 157,931,200 N/A N/A N/A
9 Summit Uttaranchal Power 1,073,772 100 100 107,377,200 N/A N/A N/A
10 United Bank of India Ltd. 2 10 10 20 N/A N/A N/A
11 United Management Ltd. 36,000 10 10 360,000 N/A N/A N/A
12 State Bank of India 10 100 100 1,000 N/A N/A N/A
13 Specialised Jute yarn and towain manufacturing Co. Ltd. 33,790 10 9.75 329,453 N/A N/A N/A
14 Paper Converting and Packeging Ltd. 2,956 100 99 291,905 N/A N/A N/A
15 National Shipping Corporation 10,964 100 12 126,859 N/A N/A N/A
16 IFIC Ltd. 73,500 100 106 7,804,699 N/A N/A N/A
17 Central Depository Bangladesh Ltd. 3,855,164 10 6.11 23,541,640 N/A N/A N/A
18 Swan Textile Mills Ltd. 1,000 100 97.50 97,500 N/A N/A N/A
19 Fiber shine 2,000,000 10 10 20,000,000 N/A N/A N/A
20 Rupsa fish & allied company Ltd. 1,111,000 10 18 19,998,000 N/A N/A N/A
21 Alliance Holding Ltd. 12,144 100 260 3,157,440 N/A N/A N/A
6,468,695,315
1 Hamid Fabrics 1,400,000 36 36 50,400,000 N/A N/A N/A
2 Fiber Shine Ltd 500,000 10 10 5,000,000 N/A N/A N/A
3 Bangladesh Building System Ltd (BBS) 600,000 10 10 6,000,000 N/A N/A N/A
4 National Feed Mills Ltd. 250,000 10 10 2,500,000 N/A N/A N/A
63,900,000
10,661,507,731
12,652,740,814
Total investment in quoted and un-quoted shares of Janata Bank Limited (a+b)
Total investment in quoted and un-quoted shares of Janata Bank Capital and Investment Ltd (aa+bb)
Total (Un-quoted share)
Total (Un-quoted share)
46(bb) Un-quoted shares - Janata Capital and Investment Ltd Amount in Taka
46(b) Un-quoted shares - Janata Bank Limited Amount in Taka
72
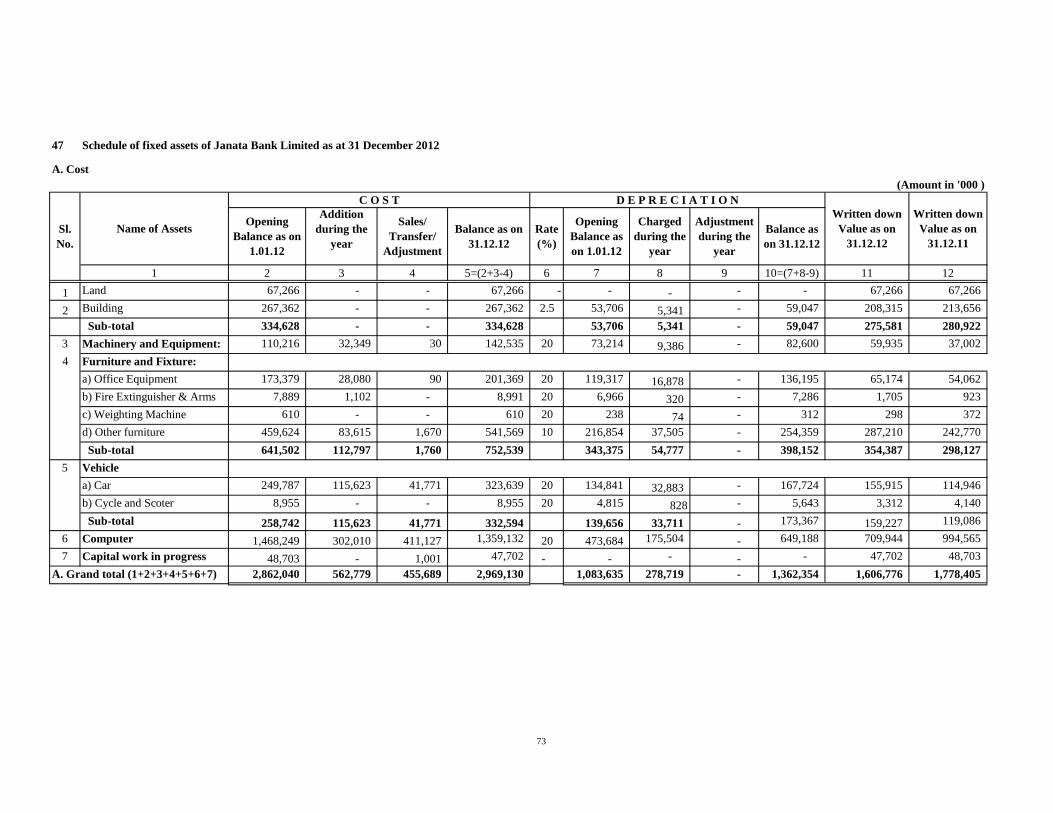
47 Schedule of fixed assets of Janata Bank Limited as at 31 December 2012
A. Cost
(Amount in '000 )
1 2 3 4 5=(2+3-4) 6 7 8 9 10=(7+8-9) 11 12
1 Land 67,266 - - 67,266 - - - - - 67,266 67,266
2 Building 267,362 - - 267,362 2.5 53,706 5,341 - 59,047 208,315 213,656
Sub-total 334,628 - - 334,628 53,706 5,341 - 59,047 275,581 280,922
3 Machinery and Equipment: 110,216 32,349 30 142,535 20 73,214 9,386 - 82,600 59,935 37,002
4 Furniture and Fixture:
a) Office Equipment 173,379 28,080 90 201,369 20 119,317 16,878 - 136,195 65,174 54,062
b) Fire Extinguisher & Arms 7,889 1,102 - 8,991 20 6,966 320 - 7,286 1,705 923
c) Weighting Machine 610 - - 610 20 238 74 - 312 298 372
d) Other furniture 459,624 83,615 1,670 541,569 10 216,854 37,505 - 254,359 287,210 242,770
Sub-total 641,502 112,797 1,760 752,539 343,375 54,777 - 398,152 354,387 298,127
Vehicle
a) Car 249,787 115,623 41,771 323,639 20 134,841 32,883 - 167,724 155,915 114,946
b) Cycle and Scoter 8,955 - - 8,955 20 4,815 828 - 5,643 3,312 4,140
Sub-total 258,742 115,623 41,771 332,594 139,656 33,711 - 173,367 159,227 119,086
6 Computer 1,468,249 302,010 411,127 1,359,132 20 473,684 175,504 - 649,188 709,944 994,565
7 Capital work in progress 48,703 - 1,001 47,702 - - - - - 47,702 48,703
2,862,040 562,779 455,689 2,969,130 1,083,635 278,719 - 1,362,354 1,606,776 1,778,405
Adjustment
during the
year
Opening
Balance as
on 1.01.12
Sales/
Transfer/
Adjustment
Balance as on
31.12.12
Rate
(%)
Addition
during the
year
Charged
during the
year
Written down
Value as on
31.12.12
Written down
Value as on
31.12.11
Opening
Balance as on
1.01.12
Sl.
No.
Name of Assets
C O S T D E P R E C I A T I O N
Balance as
on 31.12.12
5
A. Grand total (1+2+3+4+5+6+7)
73
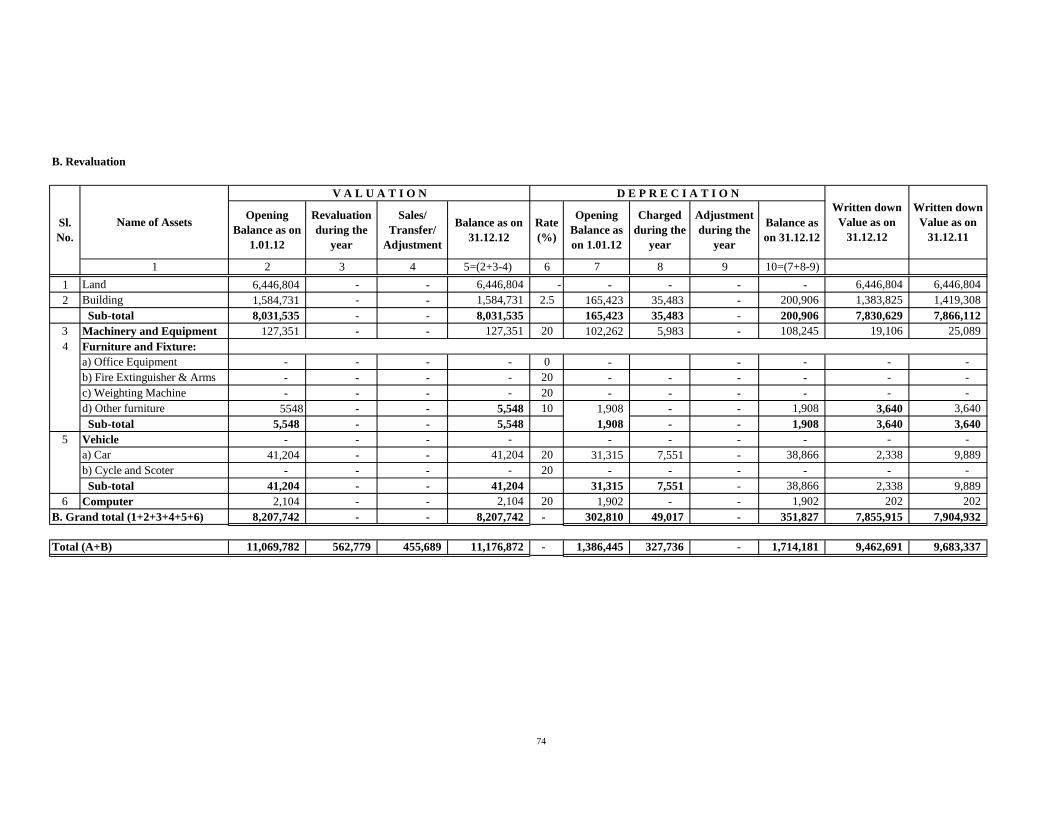
1 2 3 4 5=(2+3-4) 6 7 8 9 10=(7+8-9)
1 Land 6,446,804 - - 6,446,804 - - - - - 6,446,804 6,446,804
2 Building 1,584,731 - - 1,584,731 2.5 165,423 35,483 - 200,906 1,383,825 1,419,308
Sub-total 8,031,535 - - 8,031,535 165,423 35,483 - 200,906 7,830,629 7,866,112
3 Machinery and Equipment 127,351 - - 127,351 20 102,262 5,983 - 108,245 19,106 25,089
4 Furniture and Fixture:
a) Office Equipment - - - - 0 - - - - -
b) Fire Extinguisher & Arms - - - - 20 - - - - - -
c) Weighting Machine - - - - 20 - - - - - -
d) Other furniture 5548 - - 5,548 10 1,908 - - 1,908 3,640 3,640
Sub-total 5,548 - - 5,548 1,908 - - 1,908 3,640 3,640
Vehicle - - - - - - - - - -
a) Car 41,204 - - 41,204 20 31,315 7,551 - 38,866 2,338 9,889
b) Cycle and Scoter - - - - 20 - - - - - -
Sub-total 41,204 - - 41,204 31,315 7,551 - 38,866 2,338 9,889
6 Computer 2,104 - - 2,104 20 1,902 - - 1,902 202 202
8,207,742 - - 8,207,742 - 302,810 49,017 - 351,827 7,855,915 7,904,932
11,069,782 562,779 455,689 11,176,872 - 1,386,445 327,736 - 1,714,181 9,462,691 9,683,337
Revaluation
during the
year
Sales/
Transfer/
Adjustment
B. Revaluation
Sl.
No.
Name of Assets
V A L U A T I O N D E P R E C I A T I O N
Written down
Value as on
31.12.12
Charged
during the
year
Adjustment
during the
year
Balance as
on 31.12.12
Total (A+B)
B. Grand total (1+2+3+4+5+6)
5
Written down
Value as on
31.12.11
Balance as on
31.12.12
Rate
(%)
Opening
Balance as
on 1.01.12
Opening
Balance as on
1.01.12
74
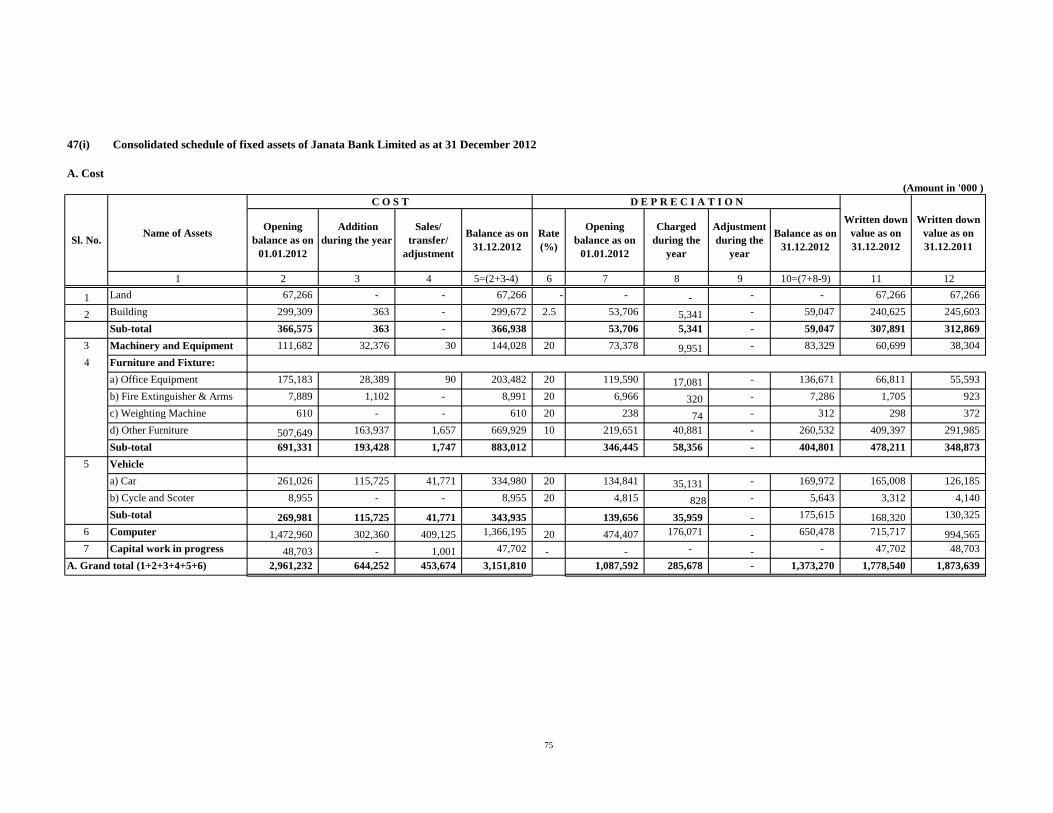
47(i) Consolidated schedule of fixed assets of Janata Bank Limited as at 31 December 2012
A. Cost
(Amount in '000 )
1 2 3 4 5=(2+3-4) 6 7 8 9 10=(7+8-9) 11 12
1 Land 67,266 - - 67,266 - - - - - 67,266 67,266
2 Building 299,309 363 - 299,672 2.5 53,706 5,341 - 59,047 240,625 245,603
Sub-total 366,575 363 - 366,938 53,706 5,341 - 59,047 307,891 312,869
3 Machinery and Equipment 111,682 32,376 30 144,028 20 73,378 9,951 - 83,329 60,699 38,304
4 Furniture and Fixture:
a) Office Equipment 175,183 28,389 90 203,482 20 119,590 17,081 - 136,671 66,811 55,593
b) Fire Extinguisher & Arms 7,889 1,102 - 8,991 20 6,966 320 - 7,286 1,705 923
c) Weighting Machine 610 - - 610 20 238 74 - 312 298 372
d) Other Furniture 507,649 163,937 1,657 669,929 10 219,651 40,881 - 260,532 409,397 291,985
Sub-total 691,331 193,428 1,747 883,012 346,445 58,356 - 404,801 478,211 348,873
Vehicle
a) Car 261,026 115,725 41,771 334,980 20 134,841 35,131 - 169,972 165,008 126,185
b) Cycle and Scoter 8,955 - - 8,955 20 4,815 828 - 5,643 3,312 4,140
Sub-total 269,981 115,725 41,771 343,935 139,656 35,959 - 175,615 168,320 130,325
6 Computer 1,472,960 302,360 409,125 1,366,195 20 474,407 176,071 - 650,478 715,717 994,565
7 Capital work in progress 48,703 - 1,001 47,702 - - - - - 47,702 48,703
2,961,232 644,252 453,674 3,151,810 1,087,592 285,678 - 1,373,270 1,778,540 1,873,639
5
Opening
balance as on
01.01.2012
D E P R E C I A T I O N
Written down
value as on
31.12.2012
Addition
during the year
Charged
during the
year
Sales/
transfer/
adjustment
Balance as on
31.12.2012
Adjustment
during the
year
Balance as on
31.12.2012
A. Grand total (1+2+3+4+5+6)
Written down
value as on
31.12.2011
Opening
balance as on
01.01.2012
Sl. No.Name of Assets
C O S T
Rate
(%)
75
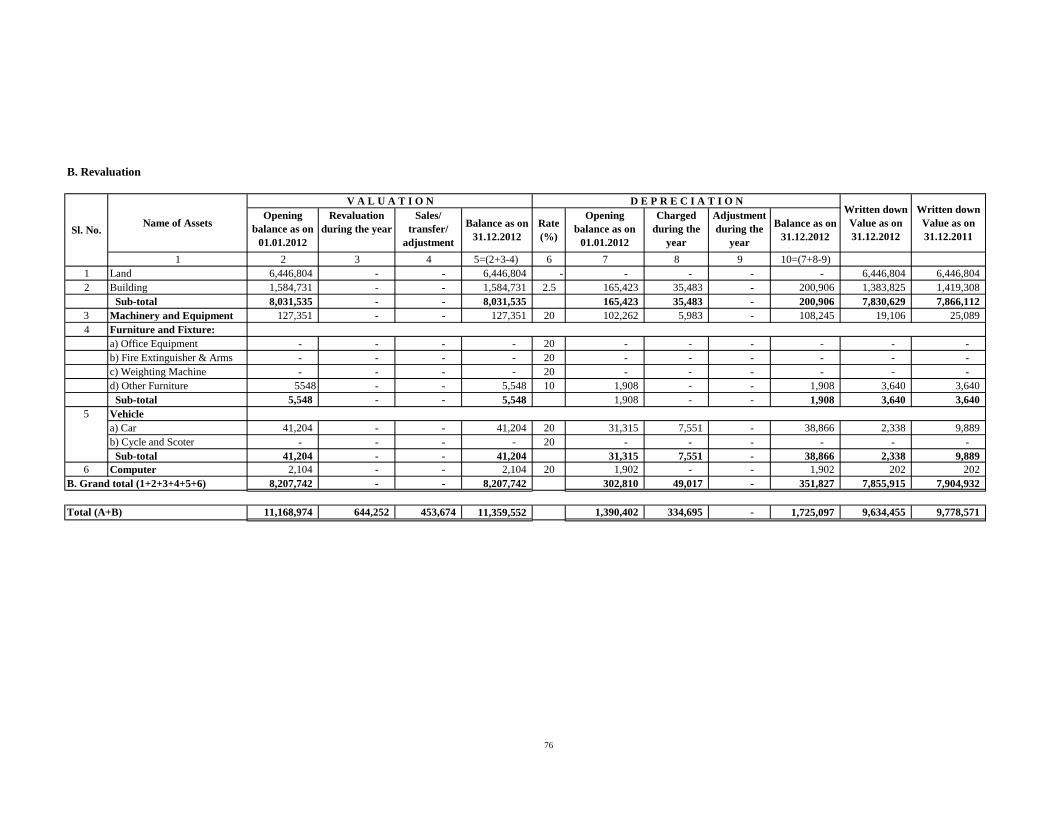
B. Revaluation
1 2 3 4 5=(2+3-4) 6 7 8 9 10=(7+8-9)
1 Land 6,446,804 - - 6,446,804 - - - - - 6,446,804 6,446,804
2 Building 1,584,731 - - 1,584,731 2.5 165,423 35,483 - 200,906 1,383,825 1,419,308
Sub-total 8,031,535 - - 8,031,535 165,423 35,483 - 200,906 7,830,629 7,866,112
3 Machinery and Equipment 127,351 - - 127,351 20 102,262 5,983 - 108,245 19,106 25,089
4 Furniture and Fixture:
a) Office Equipment - - - - 20 - - - - - -
b) Fire Extinguisher & Arms - - - - 20 - - - - - -
c) Weighting Machine - - - - 20 - - - - - -
d) Other Furniture 5548 - - 5,548 10 1,908 - - 1,908 3,640 3,640
Sub-total 5,548 - - 5,548 1,908 - - 1,908 3,640 3,640
Vehicle
a) Car 41,204 - - 41,204 20 31,315 7,551 - 38,866 2,338 9,889
b) Cycle and Scoter - - - - 20 - - - - - -
Sub-total 41,204 - - 41,204 31,315 7,551 - 38,866 2,338 9,889
6 Computer 2,104 - - 2,104 20 1,902 - - 1,902 202 202
8,207,742 - - 8,207,742 302,810 49,017 - 351,827 7,855,915 7,904,932
11,168,974 644,252 453,674 11,359,552 1,390,402 334,695 - 1,725,097 9,634,455 9,778,571
5
Name of AssetsCharged
during the
year
V A L U A T I O N
Balance as on
31.12.2012Sl. No.
Rate
(%)
Written down
Value as on
31.12.2011
Opening
balance as on
01.01.2012
Revaluation
during the year
Sales/
transfer/
adjustment
Balance as on
31.12.2012
Opening
balance as on
01.01.2012
Written down
Value as on
31.12.2012
Adjustment
during the
year
D E P R E C I A T I O N
Total (A+B)
B. Grand total (1+2+3+4+5+6)
76
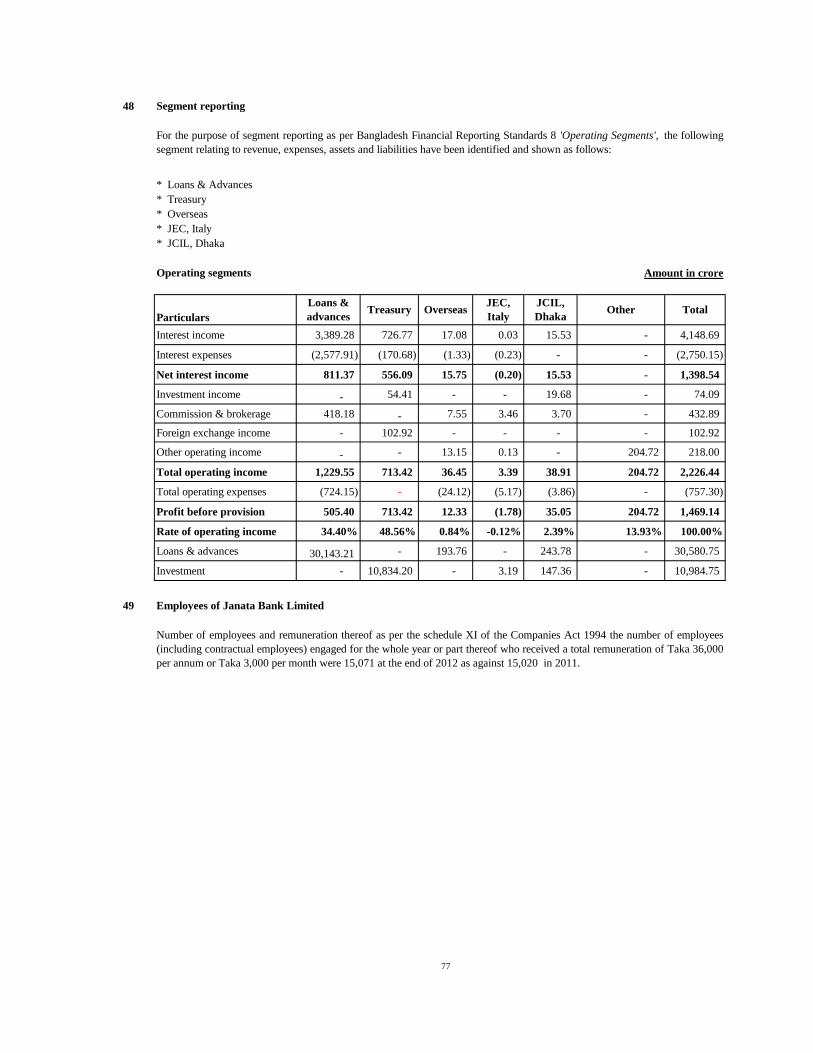
48 Segment reporting
Operating segments
Particulars
Interest income 3,389.28 726.77 17.08 0.03 15.53 - 4,148.69
Interest expenses (2,577.91) (170.68) (1.33) (0.23) - - (2,750.15)
Net interest income 811.37 556.09 15.75 (0.20) 15.53 - 1,398.54
Investment income - 54.41 - - 19.68 - 74.09
Commission & brokerage 418.18 - 7.55 3.46 3.70 - 432.89
Foreign exchange income - 102.92 - - - - 102.92
Other operating income - - 13.15 0.13 - 204.72 218.00
Total operating income 1,229.55 713.42 36.45 3.39 38.91 204.72 2,226.44
Total operating expenses (724.15) - (24.12) (5.17) (3.86) - (757.30)
Profit before provision 505.40 713.42 12.33 (1.78) 35.05 204.72 1,469.14
Rate of operating income 34.40% 48.56% 0.84% -0.12% 2.39% 13.93% 100.00%
Loans & advances 30,143.21 - 193.76 - 243.78 - 30,580.75
Investment - 10,834.20 - 3.19 147.36 - 10,984.75
49 Employees of Janata Bank Limited
Number of employees and remuneration thereof as per the schedule XI of the Companies Act 1994 the number of employees
(including contractual employees) engaged for the whole year or part thereof who received a total remuneration of Taka 36,000
per annum or Taka 3,000 per month were 15,071 at the end of 2012 as against 15,020 in 2011.
* Overseas
Other
* JEC, Italy
JEC,
Italy
JCIL,
Dhaka
Amount in crore
For the purpose of segment reporting as per Bangladesh Financial Reporting Standards 8 'Operating Segments', the following
segment relating to revenue, expenses, assets and liabilities have been identified and shown as follows:
* Loans & Advances
Loans &
advances
* Treasury
Treasury
* JCIL, Dhaka
Overseas Total
77
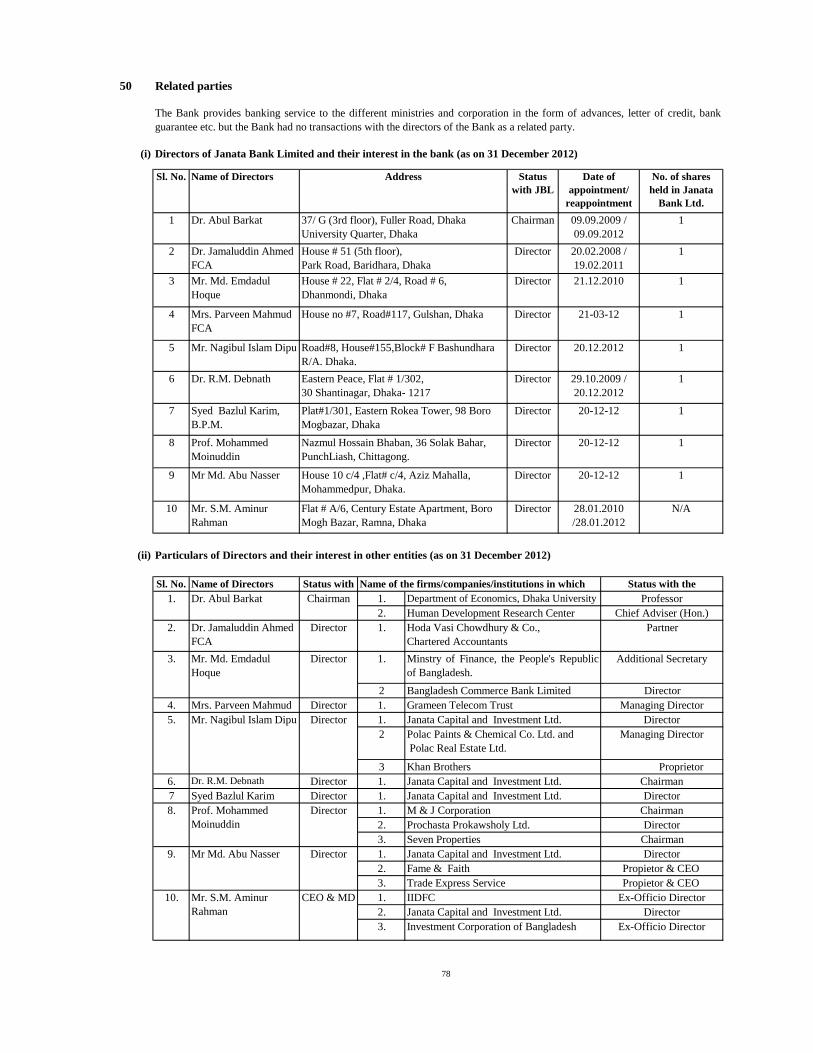
50 Related parties
(i)
Sl. No. No. of shares
held in Janata
Bank Ltd.
1 1
2 1
3 Director 1
4 Director 1
5 Director 1
6 Director 1
7 Director 1
8 Director 1
9 Director 1
10 Director N/A
(ii)
Sl. No. Name of Directors Status with
JBL 1.
2.
2. Director 1.
1.
2
4. Director 1.
Director 1.
2
3 Proprietor
6. Director 1.
7 Director 1.
1.
2.
3.
1.
2.
3.
1.
2.
10. Mr. S.M. Aminur
Rahman
CEO & MD IIDFC Ex-Officio Director
Janata Capital and Investment Ltd. Director
3. Investment Corporation of Bangladesh Ex-Officio Director
Chairman
9. Mr Md. Abu Nasser Director Janata Capital and Investment Ltd. Director
Fame & Faith Propietor & CEO
Trade Express Service Propietor & CEO
8. Prof. Mohammed
Moinuddin
Director M & J Corporation Chairman
Prochasta Prokawsholy Ltd. Director
Seven Properties
Dr. R.M. Debnath Janata Capital and Investment Ltd. Chairman
Syed Bazlul Karim Janata Capital and Investment Ltd. Director
Bangladesh Commerce Bank Limited Director
5. Mr. Nagibul Islam Dipu Janata Capital and Investment Ltd. Director
Polac Paints & Chemical Co. Ltd. and
Polac Real Estate Ltd.
Managing Director
Khan Brothers
Department of Economics, Dhaka University Professor
Mrs. Parveen Mahmud Grameen Telecom Trust Managing Director
3. Mr. Md. Emdadul
Hoque
Director Minstry of Finance, the People's Republic
of Bangladesh.
Additional Secretary
28.01.2010
/28.01.2012
Dr. Jamaluddin Ahmed
FCA
Hoda Vasi Chowdhury & Co.,
Chartered Accountants
Partner
Name of the firms/companies/institutions in which Status with the
Particulars of Directors and their interest in other entities (as on 31 December 2012)
1. Dr. Abul Barkat Chairman
Prof. Mohammed
Moinuddin
Nazmul Hossain Bhaban, 36 Solak Bahar,
PunchLiash, Chittagong.
20-12-12
Human Development Research Center Chief Adviser (Hon.)
Mr Md. Abu Nasser House 10 c/4 ,Flat# c/4, Aziz Mahalla,
Mohammedpur, Dhaka.
20-12-12
Mr. S.M. Aminur
Rahman
Flat # A/6, Century Estate Apartment, Boro
Mogh Bazar, Ramna, Dhaka
Dr. R.M. Debnath Eastern Peace, Flat # 1/302,
30 Shantinagar, Dhaka- 1217
29.10.2009 /
20.12.2012
Syed Bazlul Karim,
B.P.M.
Plat#1/301, Eastern Rokea Tower, 98 Boro
Mogbazar, Dhaka
20-12-12
Mrs. Parveen Mahmud
FCA
House no #7, Road#117, Gulshan, Dhaka 21-03-12
Mr. Nagibul Islam Dipu Road#8, House#155,Block# F Bashundhara
R/A. Dhaka.
20.12.2012
Dr. Jamaluddin Ahmed
FCA
House # 51 (5th floor),
Park Road, Baridhara, Dhaka
Director 20.02.2008 /
19.02.2011
Mr. Md. Emdadul
Hoque
House # 22, Flat # 2/4, Road # 6,
Dhanmondi, Dhaka
21.12.2010
The Bank provides banking service to the different ministries and corporation in the form of advances, letter of credit, bank
guarantee etc. but the Bank had no transactions with the directors of the Bank as a related party.
Directors of Janata Bank Limited and their interest in the bank (as on 31 December 2012)
Address Status
with JBL
Date of
appointment/
reappointment
Dr. Abul Barkat 37/ G (3rd floor), Fuller Road, Dhaka
University Quarter, Dhaka
Chairman 09.09.2009 /
09.09.2012
Name of Directors
78
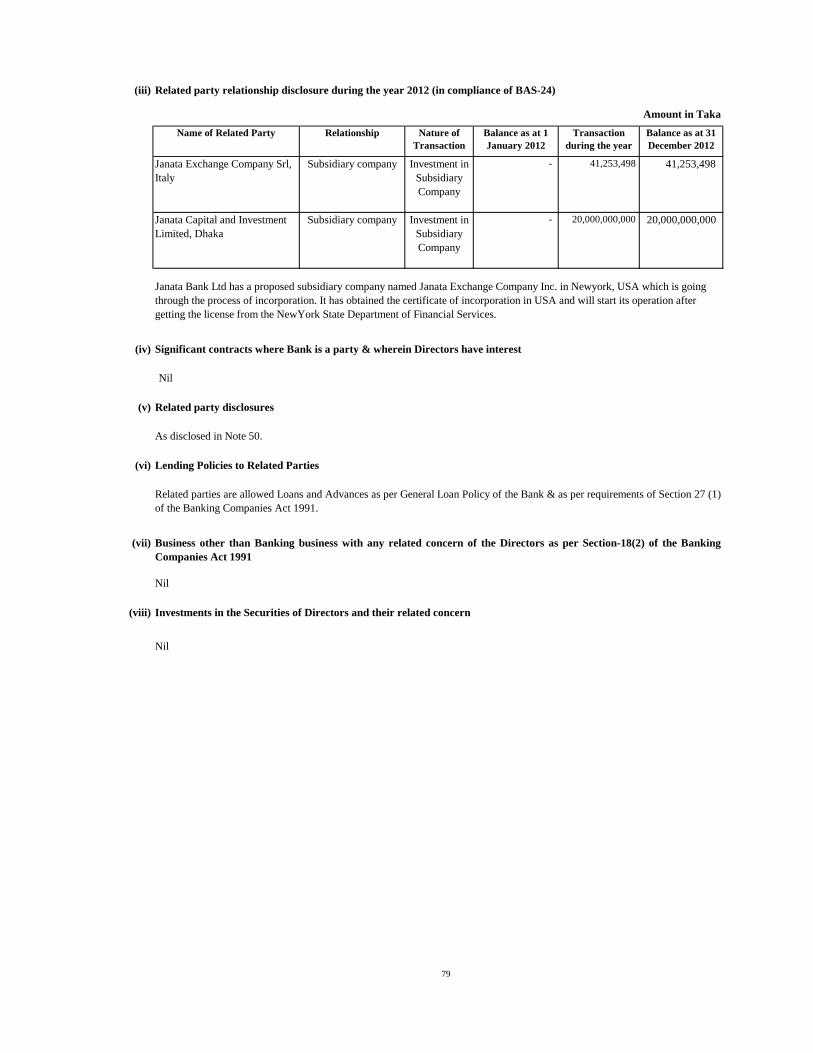
(iii) Related party relationship disclosure during the year 2012 (in compliance of BAS-24)
Nature of
Transaction
Balance as at 31
December 2012
Investment in
Subsidiary
Company
41,253,498
Investment in
Subsidiary
Company
20,000,000,000
(iv)
(v) Related party disclosures
As disclosed in Note 50.
(vi)
(vii)
Nil
(viii)
Lending Policies to Related Parties
Related parties are allowed Loans and Advances as per General Loan Policy of the Bank & as per requirements of Section 27 (1)
of the Banking Companies Act 1991.
Business other than Banking business with any related concern of the Directors as per Section-18(2) of the Banking
Companies Act 1991
Investments in the Securities of Directors and their related concern
Nil
Janata Bank Ltd has a proposed subsidiary company named Janata Exchange Company Inc. in Newyork, USA which is going
through the process of incorporation. It has obtained the certificate of incorporation in USA and will start its operation after
getting the license from the NewYork State Department of Financial Services.
Significant contracts where Bank is a party & wherein Directors have interest
Nil
Janata Capital and Investment
Limited, Dhaka
Subsidiary company - 20,000,000,000
Amount in Taka
Name of Related Party Relationship Balance as at 1
January 2012
Transaction
during the year
Janata Exchange Company Srl,
Italy
Subsidiary company - 41,253,498
79
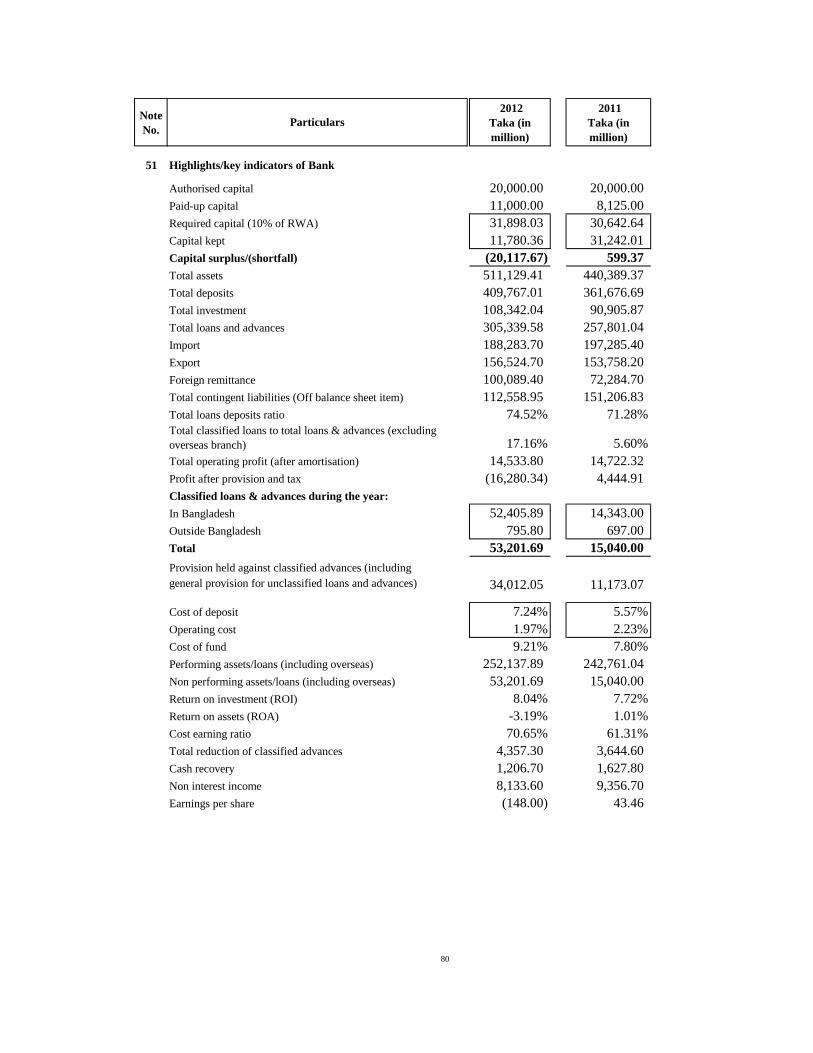
Note
No.
2012
Taka (in
million)
2011
Taka (in
million)
51 Highlights/key indicators of Bank
Authorised capital 20,000.00 20,000.00
Paid-up capital 11,000.00 8,125.00
Required capital (10% of RWA) 31,898.03 30,642.64
Capital kept 11,780.36 31,242.01
Capital surplus/(shortfall) (20,117.67) 599.37
Total assets 511,129.41 440,389.37
Total deposits 409,767.01 361,676.69
Total investment 108,342.04 90,905.87
Total loans and advances 305,339.58 257,801.04
Import 188,283.70 197,285.40
Export 156,524.70 153,758.20
Foreign remittance 100,089.40 72,284.70
Total contingent liabilities (Off balance sheet item) 112,558.95 151,206.83
Total loans deposits ratio 74.52% 71.28%
17.16% 5.60%
Total operating profit (after amortisation) 14,533.80 14,722.32
Profit after provision and tax (16,280.34) 4,444.91
Classified loans & advances during the year:
In Bangladesh 52,405.89 14,343.00
Outside Bangladesh 795.80 697.00
Total 53,201.69 15,040.00
Provision held against classified advances (including
general provision for unclassified loans and advances) 34,012.05 11,173.07
Cost of deposit 7.24% 5.57%
Operating cost 1.97% 2.23%
Cost of fund 9.21% 7.80%
Performing assets/loans (including overseas) 252,137.89 242,761.04
Non performing assets/loans (including overseas) 53,201.69 15,040.00
Return on investment (ROI) 8.04% 7.72%
Return on assets (ROA) -3.19% 1.01%
Cost earning ratio 70.65% 61.31%
Total reduction of classified advances 4,357.30 3,644.60
Cash recovery 1,206.70 1,627.80
Non interest income 8,133.60 9,356.70
Earnings per share (148.00) 43.46
Total classified loans to total loans & advances (excluding
overseas branch)
Particulars
80
Related Documents