Determination of Concentration of Heavy Elements in Ghubaysh (Guiera Senegalensis) using X-Ray Technique Rahma Ibrahim Altaybe Ibrahim Postgraduate Diploma in Physics, University of Gezira (2017) B. Sc. Education in Physics and Mathematics, University of Gezira (2014) A Dissertation Submitted to the University of Gezira in Partial Fulfillment of the Requirements for the Award of the Degree of Master of Science in Physics Department of Electronics Engineering Faculty of Engineering and Technology May/ 2021

Welcome message from author
This document is posted to help you gain knowledge. Please leave a comment to let me know what you think about it! Share it to your friends and learn new things together.
Transcript
Determination of Concentration of Heavy Elements in
Ghubaysh (Guiera Senegalensis) using X-Ray Technique
Rahma Ibrahim Altaybe Ibrahim
Postgraduate Diploma in Physics, University of Gezira (2017)
B. Sc. Education in Physics and Mathematics, University of Gezira
(2014)
A Dissertation
Submitted to the University of Gezira in Partial Fulfillment of the
Requirements for the Award of the Degree of Master of Science
in
Physics
Department of Electronics Engineering
Faculty of Engineering and Technology
May/ 2021
ii
Determination of Concentration of Heavy Elements in
Ghubaysh (Guiera Senegalensis) using X-Ray Technique
Rahma Ibrahim Altaybe Ibrahim
Supervision Committee:
Name Position Signature
Dr. Hasabalrasoul Gesmallah Ismail Main supervisor ……………
Prof. Mubarak Dirar Abdullah Co-supervisor ……….…...
Date: May / 2021
iii
Determination of Concentration of Heavy Elements in
Ghubaysh (Guiera Senegalensis) using X-Ray Technique
Rahma Ibrahim Altaybe Ibrahim
Examination Committee:
Name Position Signature
Dr. Hasabalrasoul Gesmallah Ismail Chairperson ….………..
Dr. Hashim Mohammed Ali Altaieb External Examiner ….………..
Dr. Mortada Mohammed Abdulwahab Internal Examiner .…………..
Date of Examination: 02 /05 / 2021
iv
Declaration
I hereby declare that this dissertation is my own original work, and
wherever contributions of others are involved. Every effort is made to
indicate this clearly with references and acknowledgment. The result
embodied in this dissertation has not submitted to any other University or
Academic Institution for the award of any scientific degree.
Name : Rahma Ibrahim Altaybe Ibrahim
Signature : ……………………..
Place and Date: El-Hasahisa locality, Gazira State, Sudan

v
Dedication
I dedicate my research to:
To my dear Parents Alia AL Safi and Ibrahim Mamon Alhlbawe
To my the spirit of my grandmother, Amna Tidjani
To my dear Uncle M-Haron, Amera, Salwa Zobedi and Azza
To my brothers Nasr Alden, Jmal and Mohammed
To my sisters Alaa, Mawda and Isra Amir
To The people of Abu Zabad, especially El- Tijani Abu family ,
EL-Deif family, Al-siddig Kram, tem work electricity and alhaj
Adm
To everyone who taught me a letter or developed a value inside me
My friends and specially… Israa - Ghada – Roaa - Sara - Riham - Ikram -
Shula - Ahd - Aya - Islam – Shaima – Amena - Hoeam – Doaa – Zohl –
And – Soaad - Rawia and Hiba
To Classmates in various stages, and I specialize in batch "32" in
Mathematics Physics - Faculty of Education, Rafaa - University
of Gezira
To colleagues (Education El- hasahiesa) and specially... Postgraduate Studies Office Dr. Salwa, Dr. Abo maali, Fawzia,
Dr. Abdurazig, Dr. Azza, Dr. M-Bakhet, alrisala and zahra.
The researcher

vi
Acknowledgements First and foremost, praises and thanks to the God,
the Almighty, for His showers of blessings throughout my
research work to complete the research successfully.
and may the blessings and peace of Allah be upon the most
honored of messengers our master Muhammad and upon all his
family and companions, It is therefore my greatest pleasure to
express my gratitude to them all in this acknowledgement, First
of all, I would like to convey my deepest gratitude to my
supervisors: Dr. Hasabalrasoul Gesmallah Ismail Hamza and
Prof. Mubarak Dirar Abd-alla Yagoub for their generous
guidance, encouragement and support from the start until the end
of my study. My warm gratitude goes to, an engineer: Mohamed
Abdullah Mohamed Noraldeen in Sudan petroleum technical
center (ptc), Special thanks to all the senior staff, Department of
Electronics Engineering and Department of Physics and
Mathematics at Gezira University, and all the teachers' they
taught us all these years.
vii
Determination of Concentration of Heavy Elements in Ghubaysh
(Guiera Senegalensis) using X-Ray Technique
Rahma Ibrahim Altaybe Ibrahim
Abstract
The X-ray technique is considered one of the most widespread and useful
methods for the determination of presence and quantity of the elements in a given
substance Ghubaysh (Guiera senegalensis) is a flowering plant genus in the family
Combretaceae. is the only species in the genus, found in Tropical Africa in dry areas
from Senegal to Sudan, It is used in folk medicine in the areas of its presence. The aim
of this study is to determine the elements contained in the leaves Ghubaysh and to be
suitable for therapeutic uses in the areas of its presence, using the fluorinated X-ray as
one of the spectrum analysis (X-Met 5000). Collect 10 samples of Ghubaysh (Guiera
senegalensis) bushes from three areas in West Kordofan (Zaklouna, northwest of the
Abu Zabad station transmutation power electricityand Um drouta) in Abu Zabad City.
Measurements were made Ten Ghubaysh samples by using the X-MET5000 device at a
five (5) seconds intervals. The results of reveal that there was a great variation in the
concentration of the studied elements (Fe, W, Cr, Ni, Cu, Zn, Pb, Mn, Mo, V, Ti, Co,
Nb) in the study areas. the highest concentration was that of iron (Fe). It ranges between
(0.45 mg/g) in Zaklouna and (86.21 mg/g) in Um drouta, depending on the nature of the
geographical location and the human activities spread throughout the study area. While
there was no concentration recorded for the elements in six samples in three areas
studied there elements was (Pb, Zn, Ti, Co, Nb). In there are other four samples studied
areas, the highest concentration was that of lead (Pb) Which ranges between (1.25
mg/g) in Zaklouna and (0.08 mg/g) in Um drouta, And the concentration of Zinc (Zn)
ranged between (0.43 mg/g) in Zaklouna and (0.01 mg/g) in Um drouta, The
concentration of Titanium (Ti) was (0.11 mg/g), and that of Cobalt (Co) was (0.90
mg/g), and that of Niobium (Nb) was (0.25 mg/g), The study confirms that the plant
has not degree of toxicity and it is safe to be used medicinally. This study recommends
that further studies be made spectrophotometeorically to confirm the safe use of plant.
viii
تقنية األشعة بإستخدام (Guiera Senegalensis)تركيز العناصر الثقيلة في الغبيش تحديد
السينية.
رحوة إبراهين الطيب إبراهين
هلخص الدراسة
ذعرثش ذمح األشعح انسح احذج ي أكصش انطشق ارشاسا فائذج نرحذذ ظد كح
ثاخ انغثش ثاخ ي عائهح انكيثشراخ انع انحذ ف انعاصش ف يادج يعح،
، سرخذو ف انعس، انظد ف إفشما االسرائح ف اناطك انعافح ي انسغال إن انسدا
ثاخ . ذفد انذساسح نهرعشف عه انعاصش انظدج ف أساق طة انشعث ف ياطك ذاظذان
فهسج كأحذ طشق ذحهم رتاسرخذاو األشعح انسح ان انعالظح نالسرخذاياخكا صانحح انغثش
( siu0e G0e0s a0eGuGعاخ ي شعشاخ انغثش ) 10ذى ظع ، (X-0005 5000انطف )
أو دسذح( ، ي شالز ياطك ف الح غشب كشدفا )صلهح، شال غشب يحطح كشتاء أت صتذ
ف لد خسح XMET5000تذح أت صتذ. ذى إظشاء انماساخ نعشش عاخ تاسرخذاو ظاص
ف كم يشج. ذصهد انذساسح إن عذج رائط أا: ذثاا كثشا ف ذشكض انعاصش ظدشا
ف ياطك (Fe،W ،Cr ،Ni ،Cu ،Zn ،Pb، Mn ،Mo، V ،Ti ،Co ،Nbنذسسح )ا
يم/ض( ف صلها 0.45يا ت ) ذشكض( تهغ Feحس كا أعه ذشكض نعصش انحذذ ) ،انذساسح
رنك حسة طثعح انلع انعغشاف انفعاناخ انثششح انرششج ف أو دسذ، يم/ض( 16.21 )
، تا نى كأاع األشعاس انراظذج ف انشع تعذا ع انهشاخ انذساسحعه طل يطمح
ف ف سرح عاخ تا سعها ( Zn ،Pb ،Ti ،Co ،Nbسعم انعاص أ ذشكض نعاصش )
ف صلها ( يم/ض1.25)( ف انذ يا ت pbأعه ذشكض نعصش انشصاص )كا أستعح ياطك
ف صلها ( يم/ض0.43)( ف انذ يا ت Zn، انضك )ف أو دسذ ض(يم/0.01 )
( كا Coيم/ض(، انكتاند )0.11كا ) (Ti، ذشكض انرراو )يم/ض( ف أو دسذ0.01)
ؤكذ أ انثاخ نس ن دسظح سح أ يم/ض(، يا 0.25كا ) (Nb) انتويم/ض(، 5..0)
نهثاذاخ انطف انضئ يماسع تانكشفذص انذساسح . طثا اسرخذاييضاس عذ
نرشتح ظزس ساق انطمح نرحذذ انضاس انفائذ، دساسح انعاصش انصمهح انظدج ف ذهك
يماسح ت انرشاكض نرحذذ أا أفذ نالسرخذاو. تزس انثاخ يع عم
ix
Table of Contents
No Subject Page
1 Declaration IV
2 Dedication V
3 Acknowledgment VI
4 Abstract English VII
5 Abstract Arabic VIII
6 Table of Contents IX
7 List of Tables XII
8 List of Figures XIII
CHAPTER ONE: Introduction
1.1 Overview 1
1.2 Research Problem 2
1.3 Aim of the Work 2
1.4 Materials and Method 2
1.5 Lay out of Thesis 3
CHAPTER TWO: Literature Review
2.1 Introduction 4
2.2 Physics of X-Rays 4
2.3 Generation and Properties of X-Rays 5
2.4 Electromagnetic Radiation 5
2.5 Properties of X-Rays 8
2.6 X-Rays and White Radiation 9
2.7 The Origin of X-Rays 10
2.8 X-ray Sources 11
2.9 Type of X-ray 13
2.10 Soft X-rays 13
x
2.11 Hard X-rays 13
2.12 X-ray wavelength and energy scales 14
2.13 Theory of absorption of X-Rays and X-ray Emission Spectroscopy 14
2.14 The Continuous Spectrum 16
2.15 Discrete Spectrum 17
2.16 X - Ray machine and its uses 17
2.17 Digital X-Ray 18
2.18 Uses of the X – Ray 19
2.19 X-ray absorption spectroscopy (XAS) 19
2.20 X-Ray Detection 20
2.21 History of X-Ray Fluorescence 20
2.22 X-Ray Fluorescence 21
2.23 Guiera senegalensis (Ghubaysh) plant 21
2.23.1 Family 21
2.23.2 Local Names 21
2.23.3 Description 22
2.23.4 Ecology 22
2.24 Elements of Interest 22
2.25 The Individual Elements 22
2.25.1 Iron (Fe) 22
2.25.2 Lead (Pb) 24
2.25.3 Manganese (Mn) 27
2.25.4 Chromium (Cr) 29
2.25.5 Nickel (Ni) 32
2.25.6 Zinc (Zn) 34
2.25.7 Molybdenum (Mo) 35
2.25.8 Copper (Cu) 36
2.25.9 Tungsten (W) 36
2.25.10 Vanadium (V) 37
2.25.11 Titanium (Ti) 37
2.25.12 Cobalt (Co) 37
2.25.13 Niobium (Nb) 38
2.26 Previous studies: 38
2.26.1 Ethno botanical survey and phytochemical studies of Guiera senegalensis Lam.
In mubi local Government of Adamawa State
38
2.26.2 Guiera senegalensis (Gs) is a well-known traditional medicinal plant in Africa 39
xi
2.26.3 Introduction: Guiera senegalensis J. F. Gmel 39
2.26.4 Phytochemical and pharmacological study of roots and leaves of Guiera
senegalensis J.F. Gmel (Combretaceae)
40
CHAPTER THREE: Materials and Methods
3.1 Introduction 41
3.2 Material 41
3.3 Study area 42
3.3.1 Description of the study area 42
3.3.2 Location map of the Study 42
3.4 The method of work 42
3.4.1 The first step 42
3.4.2 The second step: X-MET5000 43
3.5 Description X-MET5000 43
3.5.1 High Speed on-site Measurement 45
3.5.2 Rugged and Reliable tool for analysis 45
3.5.3 High Performance 45
3.6 Sample Preparation 46
CHAPTER FOUR: Results and Discussion
4.1 Introduction 47
4.2 Results 47
4.3 Discussion 57
CHAPTER FIVE: Conclusions and Recommendations
5.1 Conclusion 59
5.2 Recommendations 60
References 61
xii
List of Tables
No Table Page
2.1 Energy and names of various wavelength range 7
4.2.1 The concentration of elements in the sample (A1) 47
4.2.2 The concentration of elements in the sample (A2) 48
4.2.3 The concentration of elements in the sample (A3) 49
4.2.4 The concentration of elements in the sample (A4) 50
4.2.5 The concentration of elements in the sample (A5) 51
4.2.6 The concentration of elements in the sample (A6) 52
4.2.7 The concentration of elements in the sample (A7) 53
4.2.8 The concentration of elements in the sample (A8) 54
4.2.9 The concentration of elements in the sample (A9) 55
4.2.10 The concentration of elements in the sample (A10) 56
xiii
List of Figures
No Figures Page
2.1 The electromagnetic spectrum. The boundaries between regions are arbitrary, since
no sharp upper or lower limits can be assigned. (B.D. Cullity S.R. Stock, 2014)
6
2.2 Schematic diagram of a sealed crystallographic X-ray tube. The target anode is
provided with a means of rotation, so as to aid the dissipation of heat generated by
the electron impact on the target and to prolong the life of the target
9
2.3 Variation of intensity with wavelength for an X-ray tube, for three different
operating voltages; as V increases, the maximum wavelength in the continuous
spectrum moves to shorter wavelengths
10
2.4 A pictorial representation of X-ray using a generic atom and generic energy levels.
This picture uses the Bohr model of atomic structure and is not to scale.
11
2.5 Principle of the X-ray tube 12
2.6 Variation with wavelength of the linear absorption coefficient m for nickel; the
discontinuity at approximately 1.4886 A ° corresponds with the L absorption edge
of the element
16
3.1 Guiera senegalensis in Abu Zabad locality of Western Kordufan, Sudan. 41
3.2 Location map of the study area 42
3.3 The leaves and then dried at room temperature for a few days to ensure complete
dryness and stored in plastic boxes illustrated in Abu Zabad City
42
3.4 X-MET5000 45
3.5 Color touch screen display visible 45
3.6 Element ranges of X- Met 5000 and X- Met 5100
(Oxford instrument, 2009
46
3.7 X-MET5000 46
4.1 The concentration of the sample (A1) 47
4.2 The concentration of the sample (A2) 48
4.3 The concentration of the sample (A3) 49
4.4 The concentration of the sample (A4) 50
4.5 The concentration of the sample (A5) 51
4.6 The concentration of the sample (A6) 52
4.7 The concentration of the sample (A7) 53
4.8 The concentration of the sample (A8) 54
4.9 The concentration of the sample (A9) 55
4.10 The concentration of the sample (A10) 56
1
CHAPTER ONE CHAPTER ONE
INTRODUCTION
1.1 Overview
Plants are the backbone of all life on earth and essential resource for human
well-being. Through photosynthesis, plant provide all the food we eat which comes to
us either directly or indirectly, air (oxygen) is brought by plants, as a byproduct of
photosynthesis(Abubaker et al,2000). Several traditional medicinal plants, including
Guiera senegalensis (Gs), a shrub that grows well in sub-Saharan Africa and Sudan
(Hill, 1952), have been candidates for research because of their perceived medicinal
properties. Evaluation of compounds such as, tannins, alkaloids, flavonoids saponins,
terpenoids and phenols have been used as a method of screening of medicinal plants
(Sule and Mohammed, 2006). Guiera Senegalensis has been used in Western
Kourdofan of Sudan and elsewhere in traditional medicine as a cure for infections and
wounds (Alshafei et al, 2016; El-Gazali et al, 1994) In the Sudan, Guiera Senegalensis
is locally known as Ghubaysh of which the leaves extract and the roots powder are used
for treatment of a variety and diseases and wounds, respectively. In a companion paper
(El-Gazali et al, 1994). Guiera Senegalensis, very well known in its native area,
generally occurs as a shrub that can grow to a height of 3 to 5 m according to habitat. Its
stem presents numerous knots that send out branches. The ash-grey stem and branches
have fibrous or pubescent bark and bear opposing, short petiolated oval leaves,
sometimes mucronate, sometimes even cordate at their base, about 2 to 4 cm long by 1
to 2 cm wide. These grey-green leaves, darker on their upper surface, display black
spots on their lower surface and are slightly downy on both sides. These features lend
the plant an overall silver green colour that is conspicuous in brush land (Silva et
al,2008). Flowering occurs almost throughout the year, when it is leafy. Often blooms
twice a year, during the dry season and the rainy season. Each flower has a calcinal tube
ovoid, welded to the ovary. This tube is topped by a bellflower blade with 5 teeth
screened black and persistent points to fruiting. The stamens are 10 on two rows of 5,
all inserted on the calyx. The ovary has a single box containing 4 to 6 eggs (Koumaré ,
1986).
X-rays with energies ranging from about 100 eV to 10MeV are classified as
electromagnetic waves, which are only different from the radio waves, light, and
gamma rays in wavelength and energy. X-rays show wave nature with wavelength
2
ranging from about 10 to 10-3
nm. According to the quantum theory, the
electromagnetic wave can be treated as particles called photons or light quanta. The
essential characteristics of photons such as energy, momentum, e tc.( Yoshio Waseda et
al,2011)
The heavy elements and there isotopes are mainly produced by thes process and
ther process and to less extent by the p-process. They trace back the chemical evolution
of the galaxy, thus they represent alink to the lowred shift universe (Mounib, 2018).
1.2 Research problem
Recently chemical drugs are known to have severe side effects. Several bacteria and
other organizims that cause human diseases, show resistance to chemical drugs. This
requires knowing the effective ingredients of natural herbs. One of them is guier
senegalensis.
Highlighting the importance of Sudanese plants in general and those of western
Sudan, especially Guiera Senegalensis (Ghubaysh) plant needs very sensitive new
techniques.
1.3 Aim of the Work
This study aims at using the fluorinated X-ray as one of the spectrum analysis to
measure concentration of heavy elements in Guiera senegalensis (Ghubaysh) natural
plants used in the Traditional medicine in the western Sudan.
To determination of characteristics that could be a reference to the researchers and
showing the importance of this plant to be used in a wider range around the world
and heavy elements of extract of Guiera Senegalensis, using the fluorinated X-ray as
one of the spectrum analysis (X-Meet 5000).
These elements obtained show the effective ingredients that exist in this herb and
comparing it to the permissible and internationally agreed limits.
1.4 Materials and Method
Collect 10 samples of Guiera senegalensis (Ghubaysh) bushes from three areas in West
Kordofan (Zaklouna, northwest of the Abu Dhabid power station and Um drouta ) in
Abu Zabad locality. Some samples of the plant.
Measurements were made for leaves Guiera Senegalensis (Ghubaysh) samples in the
X-ray spectrometer by using the X-MET5000.

3
1.5 Lay out of thesis
This is research include five chapters. Chapter one is the introduction, while chapter two
is the background and literature review while chapter three is concerned with material
and methods. Chapter four is devoted for results and discussion and chapter five is
conclusion and recommendation.
4
CHAPTER TWO
LITERATURE REVIEW
2.1 Introduction
This chapter consists of the theoretical background of Physics of X-Rays, the
X-Ray Fluorescence, Guiera senegalensis (Ghubaysh) plant, the Elements of Interest
and previous studies.
2.2 Physics of X-Rays
The discovery of X-rays by Wilhelm Röntgen in 1885 opened a whole new field
of research that quickly sparked numerous applications that nowadays are indispensable
in many fields like medical diagnostics, industrial quality control or security. X-rays
penetrate matter much better than visible light and can be used to get an image of the
inside of samples without the need for mechanical slicing or opening. For the most part,
today’s imaging systems use the same experimental setup that Röntgen used in his
laboratory: a source, based on accelerated electrons hitting a target, emits X-rays which
then travel through the sample and are detected in a plane downstream. Image contrast
is created by the absorption of photons in the sample and the resulting local intensity
decrease on the detector. This yields excellent results when large differences in
absorption coefficients are present in the sample, like bones in soft tissue. When little
absorption is present, e.g. in very thin structures or material composed of light elements,
the achieved contrast is limited. Materials with similar absorption coefficients are
hardly distinguished in X-ray radiography; this is a major drawback especially in
medical imaging, because the tissue that forms the inner organs, muscles and body fat is
mainly composed of light elements and there is little difference in the absorption
coefficients of different tissue types. This limitation can be overcome when using not
the absorption, but the phase shift that X-rays undergo inside the sample. Both
properties are described by the complex refractive index , where δ describes
the phase shift and β the absorption. For light materials, δ can be three orders of
magnitude larger than β, which means that a strong phase signal can be present even in
cases of very faint absorption. (Ismail 2019; Frieder Johannes Koch, 2017)
5
2.3 Generation and Properties of X-Rays
X-rays are an electromagnetic radiation of short wavelength, and can be
produced by the sudden deceleration of rapidly moving electrons at a target material. If
an electron falls through a potential difference of V volt, it acquires an energy eV
electron-volt (eV), where e is the charge on an electron. This energy may be expressed
as quanta of X-rays of wavelength λ, where each quantum is given by
eVhc (2.1)
h being the Planck constant and c the speed of light in vacuum. Substitution of
numerical values into (2.1) leads to
V4.12 (2.2)
Where V is measured in kilovolt and l is given in Angstrom units (A°). The wavelength
range of X-rays is approximately 0.1–100A°, but for the purposes of practical X-ray
crystallography, the range used is restricted to 0.7–2.5 A°.( Ismail 2019; Mark Ladd
Rex Palmer ,2013)
Since x-rays are produced whenever high-speed electrons collide with a metal
target, any x-ray tube must contain (a) a source of electrons, (b) a high accelerating
voltage, and (c) a metal target. Furthermore, since most of the kinetic energy of the
electrons is converted into heat in the target, the latter is almost always water cooled to
prevent its melting.
All x-ray tubes contain two electrodes, an anode (the metal target) maintained, with few
exceptions, at ground potential, and a cathode, maintained at a high negative potential,
normally of the order of 30,000 to 50,000 volts for diffraction work. X-ray tubes may be
divided into two basic types, according to the way in which electrons are provided: gas
tubes, in which electrons are produced by the ionization of a small quantity of gas
(residual air in a partly evacuated tube), and filament tubes, in which the source of
electrons is a hot filament. (Ismail 2019; B.D. Cullity S.R. Stock, 2014)
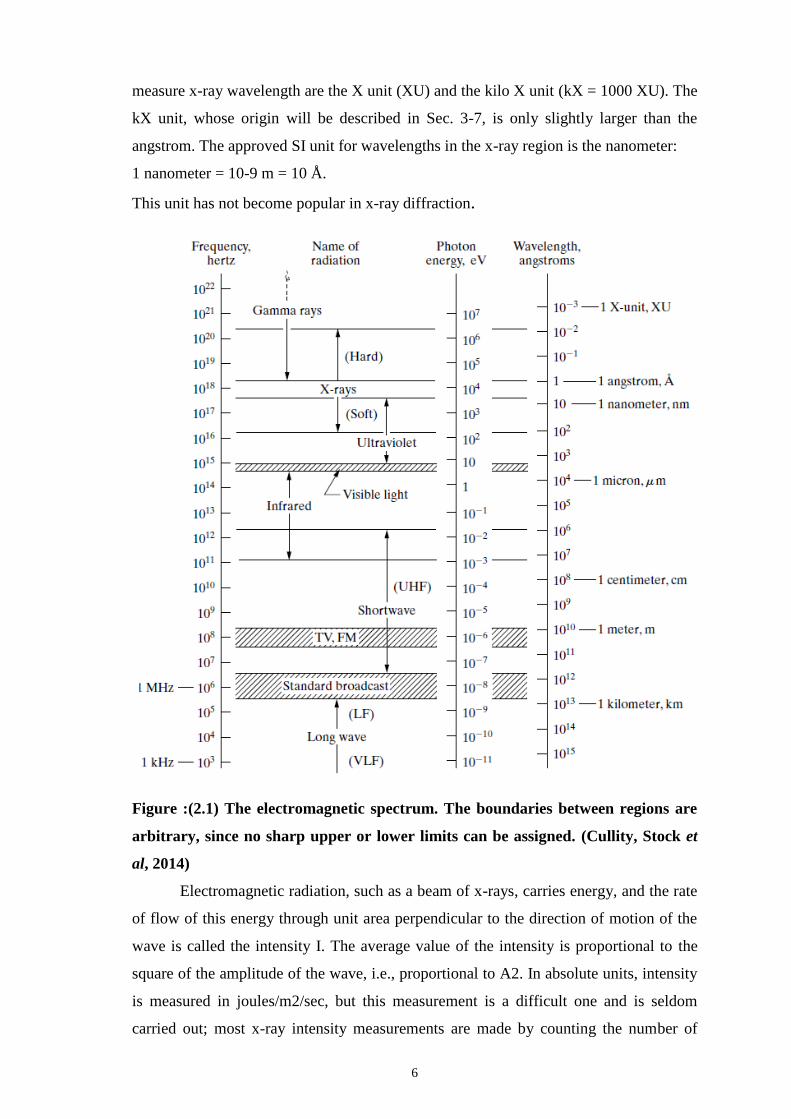
2.4 Electromagnetic Radiation
X-rays are electromagnetic radiation of exactly the same nature as light but of
very much shorter wavelength. The unit of measurement in the x-ray region is the
angstrom (Å), equal to 10-10 m, and x-rays used in diffraction have wavelengths lying
approximately in the range 0.5-2.5 Å, whereas the wavelength of visible light is of the
order of 6000 Å. X-rays therefore occupy the region between gamma and ultraviolet
rays in the complete electromagnetic spectrum(Fig2. 1). Other units sometimes used to
6
measure x-ray wavelength are the X unit (XU) and the kilo X unit (kX = 1000 XU). The
kX unit, whose origin will be described in Sec. 3-7, is only slightly larger than the
angstrom. The approved SI unit for wavelengths in the x-ray region is the nanometer:
1 nanometer = 10-9 m = 10 Å.
This unit has not become popular in x-ray diffraction.
Figure :(2.1) The electromagnetic spectrum. The boundaries between regions are
arbitrary, since no sharp upper or lower limits can be assigned. (Cullity, Stock et
al, 2014)
Electromagnetic radiation, such as a beam of x-rays, carries energy, and the rate
of flow of this energy through unit area perpendicular to the direction of motion of the
wave is called the intensity I. The average value of the intensity is proportional to the
square of the amplitude of the wave, i.e., proportional to A2. In absolute units, intensity
is measured in joules/m2/sec, but this measurement is a difficult one and is seldom
carried out; most x-ray intensity measurements are made by counting the number of
7
photons incident on a detector or by measuring the degree of blackening of
photographic film exposed to the x-ray beam. (Ismail 2019; Cullity et al,2014)
X rays are electromagnetic radiation. All X-rays represent a very energetic
portion of the electromagnetic spectrum and have short wavelengths of about 0.1 to 100
angstroms (Å). They are bounded by ultraviolet light at long wavelengths and gamma
rays at short wavelengths X-rays in the range from 50 to 100 Å are termed soft X-rays
because they have lower energies and are easily absorbed. (Ismail 2019; Moussa
Bounakhla &Mouni Tahri, 2000and Reinhold Schlotz et al,2006).
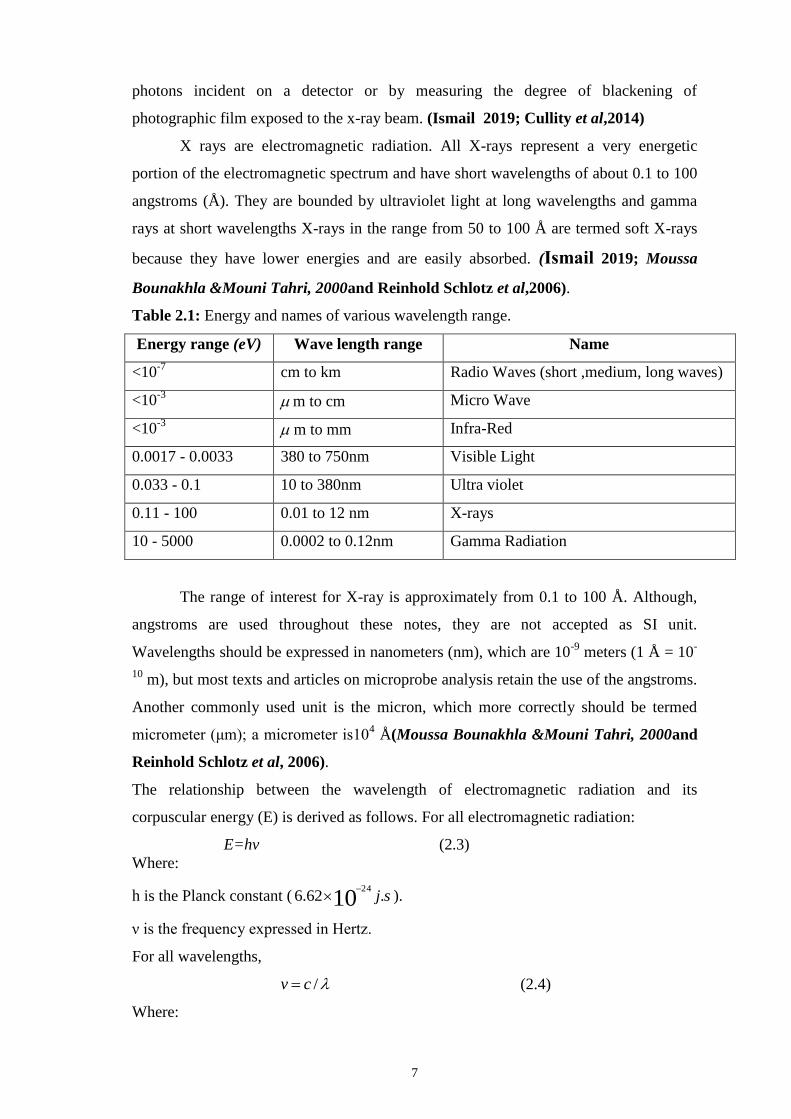
Table 2.1: Energy and names of various wavelength range.
Energy range (eV) Wave length range Name
<10-7
cm to km Radio Waves (short ,medium, long waves)
<10-3
m to cm Micro Wave
<10-3
m to mm Infra-Red
0.0017 - 0.0033 380 to 750nm Visible Light
0.033 - 0.1 10 to 380nm Ultra violet
0.11 - 100 0.01 to 12 nm X-rays
10 - 5000 0.0002 to 0.12nm Gamma Radiation
The range of interest for X-ray is approximately from 0.1 to 100 Å. Although,
angstroms are used throughout these notes, they are not accepted as SI unit.
Wavelengths should be expressed in nanometers (nm), which are 10-9
meters (1 Å = 10-
10 m), but most texts and articles on microprobe analysis retain the use of the angstroms.
Another commonly used unit is the micron, which more correctly should be termed
micrometer (μm); a micrometer is104 Å(Moussa Bounakhla &Mouni Tahri, 2000and
Reinhold Schlotz et al, 2006).
The relationship between the wavelength of electromagnetic radiation and its
corpuscular energy (E) is derived as follows. For all electromagnetic radiation:
E=hv (2.3)
Where:
h is the Planck constant ( sj.62.6 1024
).
ν is the frequency expressed in Hertz.
For all wavelengths,
/cv (2.4)
Where:
8
c = speed of light ( sm /99782.2 108
).
λ= wavelength (Å).
Thus:
/98636.1/ 1024
hcE (2.5)
Where E is in Joule and λ in meters.
The conversion to angstroms and electron volts ( jouleeV 1019
602.11 ) yields the
Duane-Hunt equation:
)/(396.12)(0
AeVE (2.6)
Note the inversion relationship. Short wavelengths correspond to high energies
and long wavelengths to low energies. Energies for the range of X-ray wavelengths are
124 k eV (0.1Å) to 124 eV (100 Å). The magnitudes of X-ray energies suggested to
early workers that X-rays are produced from within an atom. Those produced from a
material consist of two distinct superimposed components: continuum (or white)
radiation, which has a continuous distribution of intensities over all wavelengths, and
characteristic radiation, which occurs as a peak of variable intensity at discrete
wavelengths (Moussa and Mouni 2000).
2.5 Properties of X-Rays
A general summary of the properties of X-rays is presented below:
Invisible;
Propagate with velocity of light (3.108 m/s).
Unaffected by electrical and magnetic fields;
Differentially absorbed in passing through matter of varying composition,
density and thickness;
Reflected, diffracted, refracted and polarized;
Capable of ionizing gases;
Capable of affecting electrical properties of solids and liquids;
Capable of blackening a photographic plate;
Able to liberate photoelectron. And recoils electrons;
Emitted in a continuous spectrum;
Emitted also with a line spectrum characteristic of the chemical element;
Found to have absorption spectra characteristic of the chemical element X-Rays
and White Radiation
9
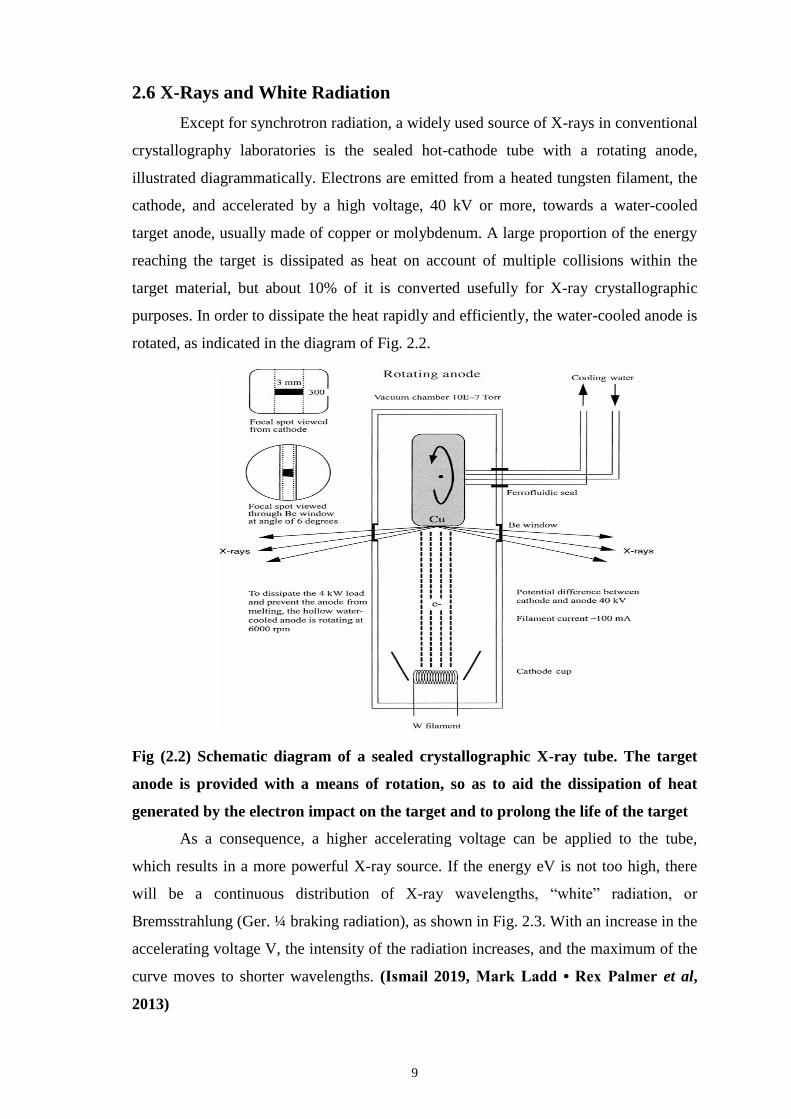
2.6 X-Rays and White Radiation
Except for synchrotron radiation, a widely used source of X-rays in conventional
crystallography laboratories is the sealed hot-cathode tube with a rotating anode,
illustrated diagrammatically. Electrons are emitted from a heated tungsten filament, the
cathode, and accelerated by a high voltage, 40 kV or more, towards a water-cooled
target anode, usually made of copper or molybdenum. A large proportion of the energy
reaching the target is dissipated as heat on account of multiple collisions within the
target material, but about 10% of it is converted usefully for X-ray crystallographic
purposes. In order to dissipate the heat rapidly and efficiently, the water-cooled anode is
rotated, as indicated in the diagram of Fig. 2.2.
Fig (2.2) Schematic diagram of a sealed crystallographic X-ray tube. The target
anode is provided with a means of rotation, so as to aid the dissipation of heat
generated by the electron impact on the target and to prolong the life of the target
As a consequence, a higher accelerating voltage can be applied to the tube,
which results in a more powerful X-ray source. If the energy eV is not too high, there
will be a continuous distribution of X-ray wavelengths, ―white‖ radiation, or
Bremsstrahlung (Ger. ¼ braking radiation), as shown in Fig. 2.3. With an increase in the
accelerating voltage V, the intensity of the radiation increases, and the maximum of the
curve moves to shorter wavelengths. (Ismail 2019, Mark Ladd • Rex Palmer et al,
2013)
10
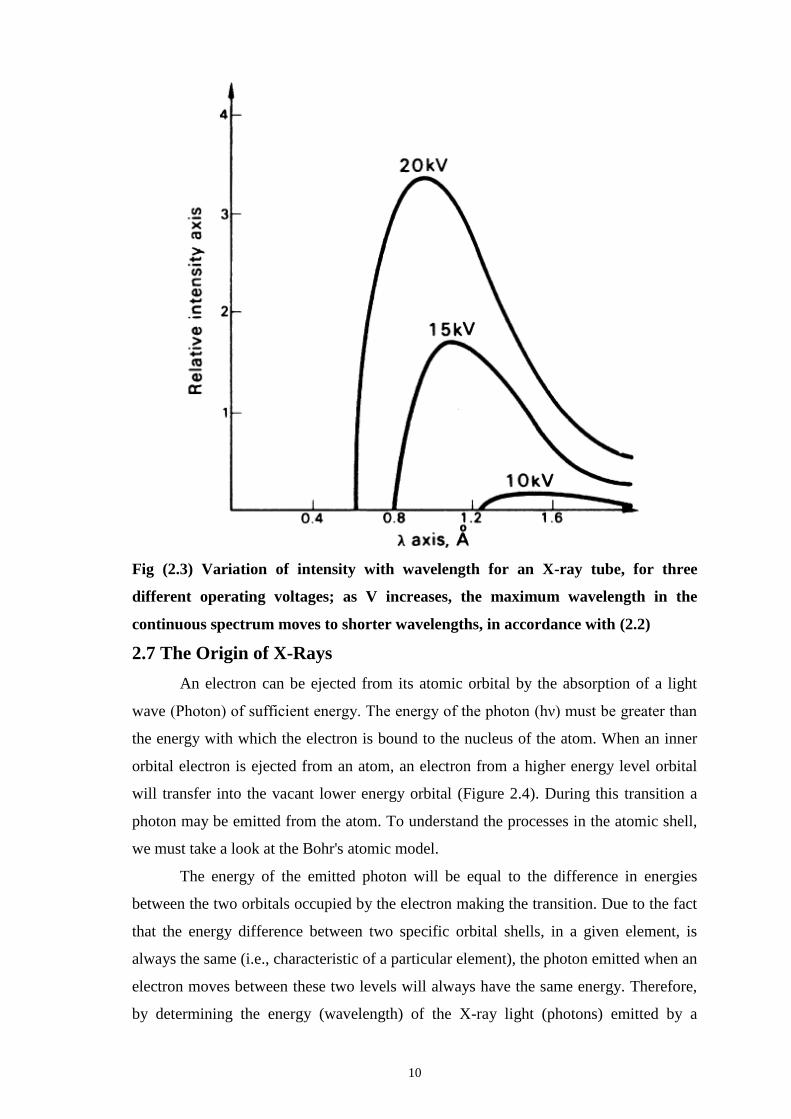
Fig (2.3) Variation of intensity with wavelength for an X-ray tube, for three
different operating voltages; as V increases, the maximum wavelength in the
continuous spectrum moves to shorter wavelengths, in accordance with (2.2)
2.7 The Origin of X-Rays
An electron can be ejected from its atomic orbital by the absorption of a light
wave (Photon) of sufficient energy. The energy of the photon (hν) must be greater than
the energy with which the electron is bound to the nucleus of the atom. When an inner
orbital electron is ejected from an atom, an electron from a higher energy level orbital
will transfer into the vacant lower energy orbital (Figure 2.4). During this transition a
photon may be emitted from the atom. To understand the processes in the atomic shell,
we must take a look at the Bohr's atomic model.
The energy of the emitted photon will be equal to the difference in energies
between the two orbitals occupied by the electron making the transition. Due to the fact
that the energy difference between two specific orbital shells, in a given element, is
always the same (i.e., characteristic of a particular element), the photon emitted when an
electron moves between these two levels will always have the same energy. Therefore,
by determining the energy (wavelength) of the X-ray light (photons) emitted by a
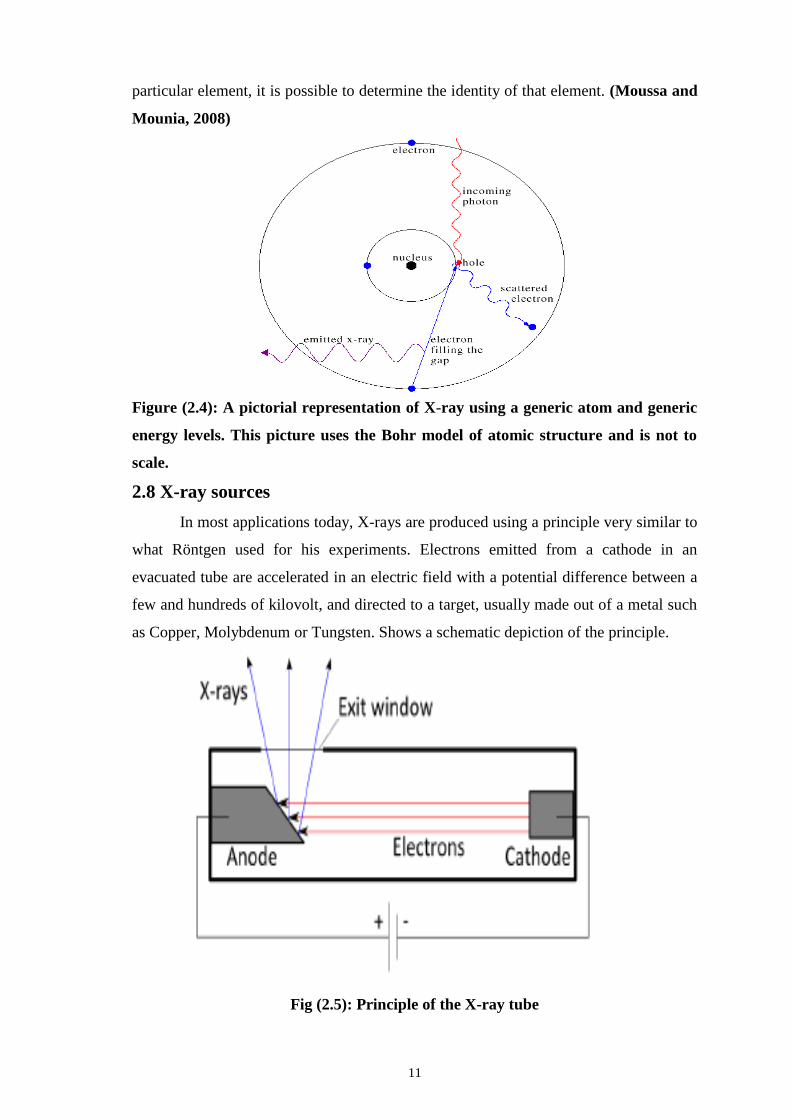
11
particular element, it is possible to determine the identity of that element. (Moussa and
Mounia, 2008)
Figure (2.4): A pictorial representation of X-ray using a generic atom and generic
energy levels. This picture uses the Bohr model of atomic structure and is not to
scale.
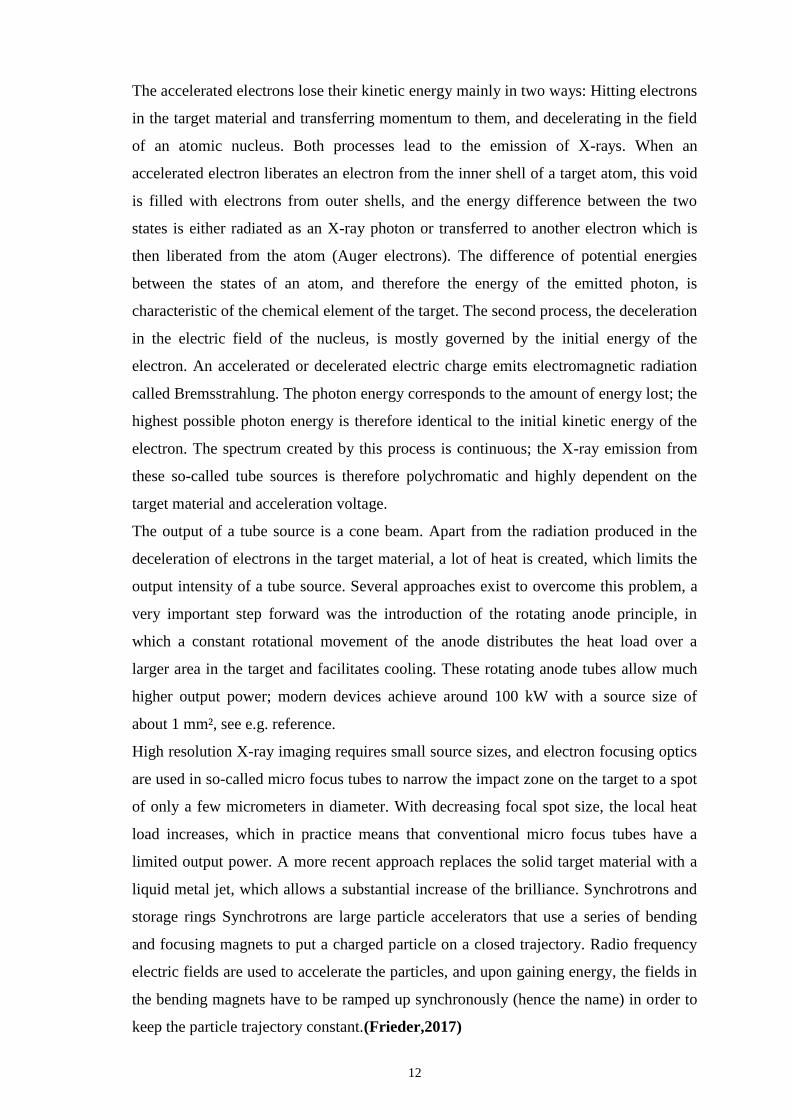
2.8 X-ray sources
In most applications today, X-rays are produced using a principle very similar to
what Röntgen used for his experiments. Electrons emitted from a cathode in an
evacuated tube are accelerated in an electric field with a potential difference between a
few and hundreds of kilovolt, and directed to a target, usually made out of a metal such
as Copper, Molybdenum or Tungsten. Shows a schematic depiction of the principle.
Fig (2.5): Principle of the X-ray tube
12
The accelerated electrons lose their kinetic energy mainly in two ways: Hitting electrons
in the target material and transferring momentum to them, and decelerating in the field
of an atomic nucleus. Both processes lead to the emission of X-rays. When an
accelerated electron liberates an electron from the inner shell of a target atom, this void
is filled with electrons from outer shells, and the energy difference between the two
states is either radiated as an X-ray photon or transferred to another electron which is
then liberated from the atom (Auger electrons). The difference of potential energies
between the states of an atom, and therefore the energy of the emitted photon, is
characteristic of the chemical element of the target. The second process, the deceleration
in the electric field of the nucleus, is mostly governed by the initial energy of the
electron. An accelerated or decelerated electric charge emits electromagnetic radiation
called Bremsstrahlung. The photon energy corresponds to the amount of energy lost; the
highest possible photon energy is therefore identical to the initial kinetic energy of the
electron. The spectrum created by this process is continuous; the X-ray emission from
these so-called tube sources is therefore polychromatic and highly dependent on the
target material and acceleration voltage.
The output of a tube source is a cone beam. Apart from the radiation produced in the
deceleration of electrons in the target material, a lot of heat is created, which limits the
output intensity of a tube source. Several approaches exist to overcome this problem, a
very important step forward was the introduction of the rotating anode principle, in
which a constant rotational movement of the anode distributes the heat load over a
larger area in the target and facilitates cooling. These rotating anode tubes allow much
higher output power; modern devices achieve around 100 kW with a source size of
about 1 mm², see e.g. reference.
High resolution X-ray imaging requires small source sizes, and electron focusing optics
are used in so-called micro focus tubes to narrow the impact zone on the target to a spot
of only a few micrometers in diameter. With decreasing focal spot size, the local heat
load increases, which in practice means that conventional micro focus tubes have a
limited output power. A more recent approach replaces the solid target material with a
liquid metal jet, which allows a substantial increase of the brilliance. Synchrotrons and
storage rings Synchrotrons are large particle accelerators that use a series of bending
and focusing magnets to put a charged particle on a closed trajectory. Radio frequency
electric fields are used to accelerate the particles, and upon gaining energy, the fields in
the bending magnets have to be ramped up synchronously (hence the name) in order to
keep the particle trajectory constant.(Frieder,2017)
13
The change of direction in a magnetic field is an acceleration of the charged
particle and thus gives rise to the emission of electromagnetic radiation. With electrons
at relativistic speed, this effect provides the possibility to create intense X-ray beams
that are called synchrotron radiation. The ANKA (Ångströmquelle Karlsruhe)
synchrotron in Karlsruhe is an example for an accelerator specifically built to create
synchrotron radiation; other examples are the European Synchrotron Radiation Facility
(ESRF) in France, Spring-8 in Japan or the Advanced Photon Source in the USA. The
radiation used for experiments at these facilities is referred to as synchrotron radiation
for historical reasons, although it is usually not produced in a synchrotron, but in a
storage ring. Storage rings have a similar layout as synchrotrons, but operate at constant
energy and thus require acceleration of the particle to the final energy prior to injection,
which is usually done with a series of linear acceleration and a booster synchrotron.
(Ismail 2019 and Koch ,2017)
2.9 Type of X-ray
There are two types of X-rays, according to their photon energy. The photon energy is
given by the formula E = hν where E is the energy in Joules, h is Planck's constant and
ν is the frequency of the photon. The frequency of the photon (ν) can also be obtained
from the equation c = λν where c is the speed of light (~3.0 × 10⁸ m/s) and λ is the
photon's wavelength. Because Planck's constant is small ( ~6.62 × 10⁻³⁴
Joule-seconds),
it is typically more convenient to work in electron-Volts (eV) where one eV is about
1.602 × 10⁻¹⁹
Joule. For example, visible light photons with wavelengths between
700nm and 400nm have energies between 1.77 eV and 3.1 eV respectively (Mitr,
Sarah et al, 2012).
2.10 Soft X-rays
These x-rays are defined by having photon energies below 10keV. They have less
energy than the hard x-rays, therefore they have longer wavelength. Soft X-rays are
used in radiography to take pictures of bones and internal organs. Because of their lower
energy, they do not cause much damage to tissues, unless they are repeated too often
(Roobottom CA, et al, 2010).
2.11 Hard X-rays
Hard X-rays have photon energies above 10 KeVThey have shorter wavelength than the
soft x-rays. These X-rays are used in radiotherapy, a treatment for cancer. Due to their
higher energy, they destroy molecules within specific cells, thus destroying tissue.
14
Another use for these X-rays is in airport security scanners to examine baggage (Hall
and Brenner et al, 2008).
2.12 X-ray wavelength and energy scales
The X-ray or Röntgen region of the electromagnetic spectrum starts at ca. 10 nm
and extends towards the shorter wavelengths. The energies of X-ray photons are of the
same order of magnitude as the binding levels of inner shell electrons (K, L, M …
levels) and therefore can be used to excite and/or probe these atomic levels. The
wavelength λ of an X-ray photon is inversely related to its energy E according to:
)(/24.1)( KeVEnm (2.7)
Where 1 eV is the kinetic energy of an electron that has been accelerated over a voltage
difference of 1 V (1eV = 1.602 10-19 J). Accordingly, the X-ray energy range starts at
100 eV and continues towards higher energies. X-ray analysis methods most commonly
employ radiation in the 1-50 keV (1 - 0.02 nm) range (G. Gauglitz.etal, 2003 and
Reinhold Schlotz et al ,2006).
2.13 Theory of absorption of X-Rays and X-ray Emission Spectroscopy
X-ray spectroscopic techniques such as X-ray photoelectron spectroscopy
(XPS), energy-dispersive X-ray spectroscopy (EDX), X-ray diffraction (XRD), small
angle X-ray scattering (SAXS), X-ray emission spectroscopy (XES), and X-ray
absorption spectroscopy are available, each with different advantages and
disadvantages. The focus of this thesis will be onto XAS and the related XES as well as
onto combinations of those two, the resonant inelastic X-ray scattering (RIXS) and
variations thereof. To perform valuable X-ray spectroscopic experiments an intense and
tunable X-ray source is indispensable, which leads to the need for synchrotron radiation
sources that are by now available all over the world. The electrons inside the
synchrotron ring are forced to travel with constant velocity and on a circular trajectory
for what reason they emit X-rays. These X-rays are - depending on the synchrotron ring
- within the energy range from 0.1 to 100 keV, i.e. wavelength from 100 down to 0.1 Å,
almost covering the hole range of atomic core level binding energies and interatomic
distances, respectively. (Timna-Josua Kühn ,2011)
All materials absorb X-rays, and the transmitted intensity is attenuated according
to an exponential law:
)exp(0 tII (2.8)
15
I0 and I are, respectively, the incident and transmitted intensities; m is the linear
absorption coefficient of the material, and t is the path length for X-rays through the
material.
Here, the proportional factor µ is called linear absorption coefficient, which is
dependent on the wavelength of X-rays, the physical state (gas, liquid, and solid) or
density of the substance, and its unit is usually inverse of distance. However, since the
linear absorption coefficient µ proportional to density, (µ /) becomes unique value of
the substance, independent upon the state of the substance. The quantity of (µ /) is
called the mass absorption coefficient and the specific values for characteristic X-rays
frequently-used are compiled. Equation (2.8) can be re-written as (2.9) in terms of the
mass absorption coefficient.
xII )(exp0 (2.9)
Mass absorption coefficient of the sample of interest containing two or more
elements can be estimated from (2.10) using the bulk density, and weight ratio of wj
for each element j. (Yoshio Waseda et al, 2011)
jj
jwww
12
2
1
1 ... (2.10)
The absorption of X-rays increases with the atomic numbers of the elements in
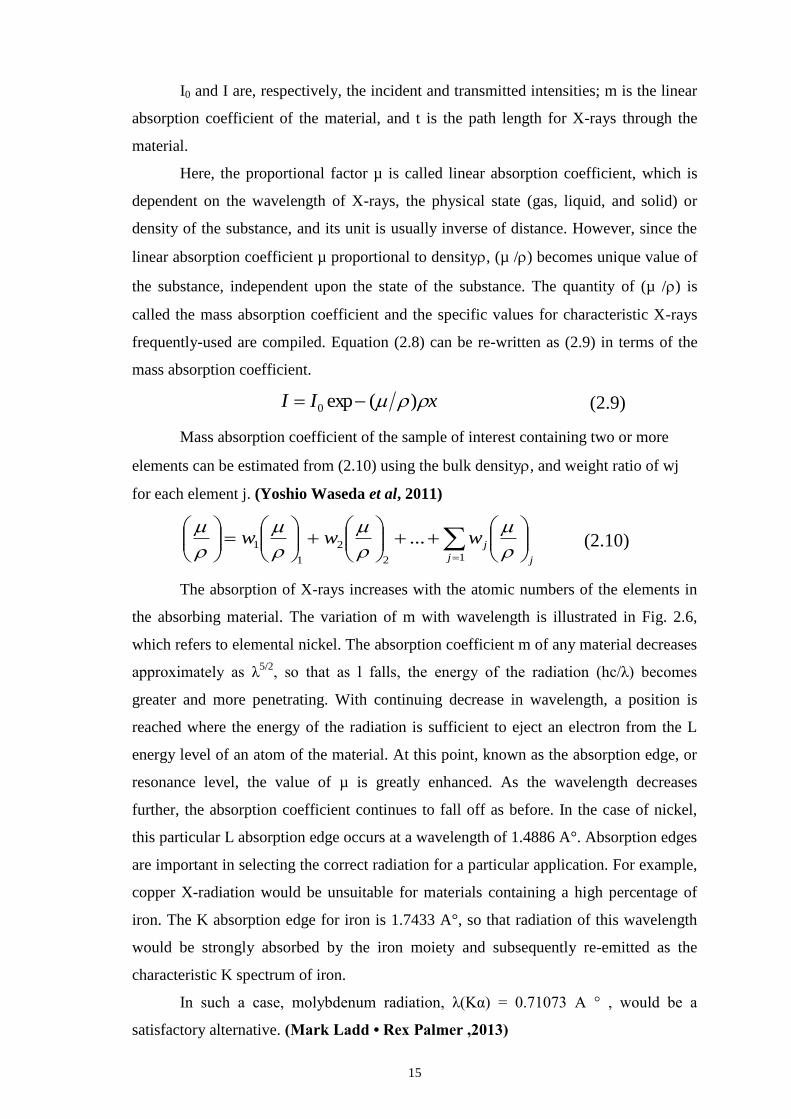
the absorbing material. The variation of m with wavelength is illustrated in Fig. 2.6,
which refers to elemental nickel. The absorption coefficient m of any material decreases
approximately as λ5/2
, so that as l falls, the energy of the radiation (hc/λ) becomes
greater and more penetrating. With continuing decrease in wavelength, a position is
reached where the energy of the radiation is sufficient to eject an electron from the L
energy level of an atom of the material. At this point, known as the absorption edge, or
resonance level, the value of µ is greatly enhanced. As the wavelength decreases
further, the absorption coefficient continues to fall off as before. In the case of nickel,
this particular L absorption edge occurs at a wavelength of 1.4886 A°. Absorption edges
are important in selecting the correct radiation for a particular application. For example,
copper X-radiation would be unsuitable for materials containing a high percentage of
iron. The K absorption edge for iron is 1.7433 A°, so that radiation of this wavelength
would be strongly absorbed by the iron moiety and subsequently re-emitted as the
characteristic K spectrum of iron.
In such a case, molybdenum radiation, λ(Kα) = 0.71073 A ° , would be a
satisfactory alternative. (Mark Ladd • Rex Palmer ,2013)
16
Fig (2.6) Variation with wavelength of the linear absorption coefficient m for
nickel; the discontinuity at approximately 1.4886 A ° corresponds with the L
absorption edge of the element
2.14 The Continuous Spectrum
The largest number of electrons colliding with the target of the x-ray tube does
not experience head-on collision collisions with the target atoms. Rather, they are
involved in partial collisions resulting in the loss of a portion of the kinetic energy of
these electrons, resulting in a slow sluggish movement. The energy pulse of the X-ray
and the energy bond appear as heat. Kramer's Equation:
)( EEKZI mE (2.11)
Where IE is the density of photons with energy E, Z Atomic number of target material,
Em is the maximum energy of the electron, K static.
The maximum potential of the bremsstrahlung photon is the falling photon energy.
Kilo-electron Volt (KeV) is the equivalent of the applied voltage Kilovolts peak (KVp)
but the density of these photons is zero, as derived from the previous equation, i.e. IE =
0 when E = Em (Ismail 2019).
The unfiltered energy spectrum is clearly modified whenever photons experience self-
filtering (absorption from the target, tube wall glass or glass prelim window). The
Inherent Filter in the normal X-ray tube is often equivalent to about 0.5-1 mm of
aluminum. Filtering adds additional spectrum adjustments. This filtering affects low-
energy photons but has little impact on the high-energy photons of the spectrum.
17
The purpose of this filter is to increase the number of high-energy photons by absorbing
low-energy photons. The higher the filter, the more powerful the beam will be, in the
sense that it reaches a higher medium energy and the penetration force increases. So
adding a filter is one way to improve the penetration capacity of the beam. Another way
is to increase the voltage exerted on the tube. Since the total density of the beam
decreases with increased filtration and increases with voltage, the choice between filter
and voltage applied to the tube must be balanced to obtain reasonable penetration
capacity and acceptable density (Ismail 2019).
The shape of the X-ray energy spectrum is only the result of the alternating voltage
exerted on the tube and the multiple interactions of the braking radiation through the
target material and the filter in the beam. Even if the x-ray tube's power increases with
constant voltage, the X-ray will remain heterogeneous in energy due to multiple braking
processes that produce different energies for the photons.
Because x-rays contain a spectral distribution of energy based on both voltage and
filtering, it is difficult to describe and characterize beam quality in terms of energy,
penetration capacity, or beam strength of Beam Hardening. But generally there are
several philosophies to find an average X-ray energy and can currently accept that they
are approximately two-thirds of the maximum energy or KVp (Aseel aleumr, et al,
2012).
2.15 Discrete Spectrum
A separate spectrum arises from individual interactions with the electron of the
atom, where the falling electron can remove another electron from its orbit. The atom of
one of its electrons can dispose of its energy by firing an X-ray photon by dropping an
electron from another orbit in the existing space (Abdalla Mohamed alzeer, et al,
2015).
2.16 X - Ray machine and its uses
The simplified principle of X-ray device in general. The main part of this device
is the x-ray tube, which is a glass tube, which is a thin metal thread that is heated by an
electric current, where cathode. This heat expels an electron from the surface of the
helipad. While the elevator is the positively charged .tungsten is a flat disk of tungsten
(Ismail 2019, mohammed saleh metwally, et al, 2015).
A high voltage difference between the elevator and the airstrip is applied. The
electrons extracted from the helipad move at a high speed towards the elevator. When
an electron strikes a tungsten atom on the elevator, it releases an electron with a low
18
energy level from that atom. This electron replaces another electron of the same atom,
this process results in the release of excess energy in the shape of a high-energy photon,
an X-ray photon. Free electrons can generate photons without colliding atoms. The
nuclei of the atoms can attract the accelerated electrons as they cause the electrons to
slow down and change their paths. Thus, the electron emits at this surplus state its
energy in the form of x-ray photons.
The collision of the electrons in the elevator results in high heat, so a motor is used to
rotate the elevator and protect it from fusion (Mohammed saleh metwally, et al, 2015).
The internal structure of the x-ray tube is surrounded by a thick lead film that prevents
x-ray dispersion in different directions. This cover contains a small window that allows
the x-ray photons to emerge in a narrow package through a series of filters. Before
falling on the patient's body on the other side of the patient's body is an X-ray camera
which uses the same technology used in films. But the difference here is that those who
will incite chemical reactions on the film are X-rays and not visible light. In Digital X-
Ray the CDCD we will talk about later uses an electronic sense element instead of films
the regions of the film that have been exposed to large amounts of dark rays appear
between the areas that were less exposed to the rays. This explains why the bones
appear on the film white as they absorbed the falling rays and the rays reach the film
while the soft tissues appear black or gray because the radiation did not absorb and
therefore increased amounts of these rays to the film (Naveed Ahmed,2008).
2.17 Digital X-Ray
The Digital X-Ray is different from conventional x-ray systems with image
capture and processing. These devices do not contain conventional films but have an
electronic display section consisting mainly of a component called CCD or Charge
Couple Device .It is a matrix with a large number of light sensitive elements of about 30
microvolt and its accuracy reaches 1024X 1024 Pixel. The component element is
CCD.To convert the photovoltaic X-ray photons into an electrical signal. These photons
generate an electrical charge on each element of the matrix according to photon energy.
This signal is then manipulated by the computer to obtain an image displayed on the
monitor.
This component is the cornerstone of digital photography, whether it is by conventional
cameras or medical imaging the CCD element (Ismail 2019).
19
2.18 Uses of the X - Ray
X-rays are widely used to make radiographic images of bones and internal
organs. Doctors benefit from radiotherapy in detecting anomalies and diseases, such as
broken bones or lung diseases, inside the patient's body. Dentists use x-rays to detect
empty spaces and teeth (Ismail 2019).
2.19 X-ray absorption spectroscopy (XAS)
XAS is a widely-used technique for determining the local geometric and
electronic structure of matter. It is applicable to any states of matter, i.e. solid, liquid or
gaseous, as no particular long range order is necessary. It is element-specific, since the
X-ray energy is tunable to an arbitrary edge of the element of interest. XAS is used in
very different scientific fields including molecular and condensed matter physics,
materials science and engineering, chemistry, earth science, and biology. The strong
sensitivity to first neighbors makes XAS the tool of choice, in particular, for
coordination chemistry and chemistry of catalysts and other nanostructures.
In a XAS experiment the X-ray energy is tuned by using a crystal
monochromatic through an edge of the element of interest of the to be investigated
material. These edges, arising from the ejection of deep bound core electrons, are
labelled K, L, M, etc., which corresponds to the principal quantum number n = 1, 2, 3,
... of the main electron shell. The respective knocked out electrons are labelled 1s,
2(s,p), 3(s,p,d), etc., whereas the second (azimuthal) quantum number (s, p, d, ...)
denotes the orbital angular momentum l = 1, 2, 3, ..., n − 1. To characterize the orbitals
and corresponding electrons completely, the magnetic quantum numbers ml = −l, ..., l
(projection of the orbital angular momentum) and ms = ±1/2 (projection of the intrinsic
angular momentum, the spin s) are needed. From the Pauli Exclusion Principle that
states that no two electrons within one atom can have the same set of quantum numbers
n, l, ml and ms it follows furthermore: Each main shell n can contain electrons.
l
m
n
l l
nl1
21
1
2122 (2.12)
However, in reality the angular momenta l and s are coupled due to the spin-orbit
interaction, so that another quantum number j (the total angular momentum) is adequate
to fully describe an electron state. It is the vectorial sum of l and s and can take the
following range of values: |l − s| ≤ j ≤ l + s, which results in 2 j + 1 electron states for
each j. Since the electron spin s has the fixed value 1/2, j can take the values, e.g., for n
= 1, 2. (Timna-Josua Kühn ,2011)
20
2.20 X-Ray Detection
Once a sample has been excited to fluorescence, a detector is used to convert X-
rays into electronic signals which can be used to determine energy and intensity
(number of X-rays) emitted from the sample. There are two types of detectors
commonly used, the proportional counter used in WXRF and the semiconductor
detector. The former is rarely used in archaeological applications (Ismail 2019,
Lundblad et al. 2008).
2.21 History of X-Ray Fluorescence:
This chapter consists of theoretical background of history of X-ray fluorescence, basic
Principle of the X-ray fluorescence process and previous studies.
The history of X-ray fluorescence dates back to the accidental discovery of X-rays
in1895 by the German physicist Wilhelm Conrad Roentgen. While studying cathode
rays in a high-voltage, gaseous-discharge tube, Roentgen observed that even though the
experimental tube was encased in a black cardboard box the barium- platinocyanide
screen, which was lying adjacent to the experiment, emitted fluorescent light whenever
the tube was in operation.
Roentgen's discovery of X-rays and their possible use in analytical chemistry went
unnoticed until 1913. In 1913, H.G.J. Mosley showed the relationship between atomic
number (Z) and the reciprocal of the wavelength (1/λ) for each spectral series of
emission lines for each element. Today this relationship is expressed as:
2sZac (2.2.1)
Where:
a is a proportionality constant,
S is a constant dependent on a periodic series.
Although the earliest commercial XRF devices used simple air path conditions,
machines were soon developed utilizing helium or vacuum paths, permitting the
detection of lighter elements. In the 1960’s, XRF devices began to use lithium fluoride
crystals for diffraction and chromium or rhodium target X-ray tubes to excite longer
wavelengths. This development was quickly followed by that of multichannel
spectrometers for the simultaneous measurement of many elements. By the mid 60’s
computer controlled XRF devices were coming into use. In 1970, the lithium drifted
silicon detector (Si(Li)) was created, providing very high resolution and X-ray photon
separation without the use of an analyzing crystal.
21
2.22 X-Ray Fluorescence
The working principle of XRF analysis is the measurement of wavelength or energy and
intensity of the characteristic X-ray photons emitted from the sample. This allows the
identification of the elements present in the analyte and the determination of their mass
or concentration. All the information for the analysis is stored in the measured
spectrum, which is a line spectrum with all characteristic lines superimposed above a
certain fluctuating background.
Other interaction processes, mainly the elastic and inelastic scattering of the primary
radiation on sample and substrate, induce the background.
X-Ray Fluorescence (XRF) is used to study the elemental composition of materials.
Generally the photons are absorbed by the material by photoelectric effect produces
vacancies in the inner electron shells of the atoms of material, followed bv the emission
of characteristic x-rays of the elements present. (Eric Lifshin, Oct, 1999).
Measurement of the spectrum of the emitted characteristic fluorescence radiation is
performed using wavelength-dispersive (WD) and energy-dispersive (ED))
spectrometers. In wavelength-dispersive X-ray fluorescence analysis (WDXRF). The
result is an intensity spectrum of the characteristic lines versus wavelength measured
with a Bragg single crystal as dispersion medium while counting the photons with a
Geiger Muller, a proportional or scintillation counter. In energy-dispersive X-ray
fluorescence analysis (EDXRF), a solid-state detector is used to count the photons,
simultaneously sorting them according to energy and storing the result in a multichannel
memory. The result is X-ray energy vs. intensity spectrum. The range of detectable
elements ranges from Be (Z = 4) for the light elements and goes up to U (Z = 92) on the
high atomic number Z side. (Gunter Gauglitz . et al. 2003).
The peaks in x-rays spectrum indicate what kind of chemical elements arc present,
while the number of counts (the area under the peaks) is related to the number of the
atoms in the sample, allowing the quantitative measurements to be made. Moreover, the
method gives information about the elements present in the sample irrespective of their
state of chemical combinations or the phases in which they exit (EricLifshin, Oct,
1999).
2.23 Guiera senegalensis (Ghubaysh) plant:
2.23.1 Family: Combretaceae.
2.23.2 Local Names: Arabic (Ghubaysh), latin (guiera senegalensis).
22
2.23.3 Description: (Ghubaysh)is a shrub of savannah region of West and Central
Africa. Its leaves are commonly used in traditional medicine in gastrointestinal
disorders, respiratory infections and malaria. (Semi-)evergreen shrub up to (3–5) m tall,
with spindly bole or many branched; theparts covered with black dots; bark fibrous.
Leaves (almost) opposite, simple and entire; stipules absent; petiole 2–5 mm long,
short-hairy; ovate to orbicular, 3–5.5 cm × 2–3 cm, base rounded to almost cordate.
2.23.4 Ecology: (Ghubaysh) occurs in shrub savanna, tree savanna and fallow land,
from sea-level up to 1000 m altitude. (Ghubaysh) occurs on all types of soil but mainly
on dry sandy or degraded soils, sometimes in areas which are, temporarily, flooded.
(Wegdan, 2018)
2.24 Elements of Interest
The first step to setting up a XRF analysis is determining the elements of interest. If a
sample or rock type has never been analyzed for every conceivable element, the odds
are high that it contains something that we might not expect. Some samples come into a
laboratory as complete unknowns, such as obsidian artifacts from a region unfamiliar to
analysts in the lab. For example, many of the rhyolite centers that produced obsidian in
the Rift Valley in East Africa contain relatively high concentrations of Zn, much higher
than obsidian in the rest of the world (Negash and Shackley, 2006; Negash et al.,
2006).Zinc becomes one of the best discriminating elements in the region, particularly
those sources in Ethiopia and to a certain extent the Near East, but has little utility in
other regions.
If a sample is not well characterized, it is a good idea to perform a qualitative
examination of the material using three or more acquisition conditions, designed to
cover high, medium, and low energy ranges. Qualitative acquisition conditions will be
covered below. Alternatively, a multivariate statistical analysis such as principal
components analysis can isolate those elements of interest that are best discriminators in
the region (Glascock et al, 1998).
2.25 The Individual Elements:
2.25.1 Iron (Fe)
Iron has several vital functions in the body. It serves as a carrier of oxygen to the
tissues from the lungs by red blood cell hemoglobin, as a transport medium for electrons
within cells, and as an integrated part of important enzyme systems in various tissues.
The physiology of iron has been extensively reviewed Most of the iron in the body is
present in the erythrocytes as hemoglobin, a molecule composed of four units, each
23
containing one heme group and one protein chain. The structure of hemoglobin allows it
to be fully loaded with oxygen in the lungs and partially unloaded in the tissues (e.g., in
the muscles). The iron-containing oxygen storage protein in the muscles, myoglobin, is
similar in structure to hemoglobin but has only one hemo unit and one globin chain.
Several iron-containing enzymes, the cytochromes, also have one hemo group and one
globin protein chain. These enzymes act as electron carriers within the cell and their
structures do not permit reversible loading and unloading of oxygen. Their role in the
oxidative metabolism is to transfer energy within the cell and specifically in the
mitochondria. Include the synthesis of steroid hormones and bile acids; detoxification of
foreign substances in the liver; and signal controlling in some neurotransmitters, such as
the dopamine and serotonin systems in the brain. Iron is reversibly stored within the
liver as ferritin and hemosiderin whereas it is transported between different
compartments in the body by the protein transferrin. The primary function of
hemoglobin (Hb) is to transport oxygen. Since oxygen is not very soluble in water (the
major constituent of blood), an oxygen transport protein must be used to allow oxygen
to be 'soluble'. Hemoglobin (Hb) is the oxygen transport protein used in the blood of
vertebrates. It is composed of 4 polypeptide chain, each of which contains one iron ion.
The iron is the site of oxygen binding; each iron can bind one O2molecule thus each
hemoglobin molecule is capable of binding a total to four (4) O2molecules. In humans,
the average hemoglobin concentration is 16 g/100 ml. This means that there are
approximately 150,500,000,000,000,000,000 hemoglobin molecules in 100 ml of whole
blood. How many possible binding sites for oxygen are contained in 100 ml of blood?
How many O2molecules can be carried by 100 ml of blood if the hemoglobin is
completely saturated (meaning every possible binding site is filled) with oxygen? It is
important that you remember that the purpose of Hb is to pick up oxygen at the lungs
and to deliver it to the tissues. (C.P.Gupta,2014)
Iron is the most abundant metal, and is be lived to be the tenth most abundant element
in the universe. Iron is a metal extracted from iron are, and is hardly ever found in the
free (elemental) state. Iron is the most used of all the metals, comprising 95 percent of
all the metal tonnage produced worldwide. Its combination of low cost and high
strength make it indispensable, especially in applications like automobiles. The hulls of
large ships, and structural components for buildings. Steel is the besk known alloy of
iron. Iron is essential to all organisms, except for a few bacteria. Iron binds avidly to
virtually all biomolecules so it will a there nonspecifically to cell membranes, nucleic
acids, proteins etc. iron distribution is heavily regulated in mammals. The iron absorbed
24
from the duodenum binds to transferring, and carried by blood it reaches different it
cells. It is strongly advised not to let the chemical enter into the environment because it
persist in the environment. Excess iron in the body causes liver and kidney damage
(haemochromatosis) some iron compounds are suspected carcinogens, (Ismail 2019,
Greaney, 2005).
Effects on humans
Iron is an essential element in human nutrition. Estimates of the minimum daily
requirement for iron depend on age, sex, physiological status, and iron bioavailability
and range from about 10 to 50 mg/day (12).
The average lethal dose of iron is 200–250 mg/kg of body weight, but death has
occurred following the ingestion of doses as low as 40 mg/kg of body weight (6).
Autopsies have shown hemorrhagic necrosis and sloughing of areas of mucosa in the
stomach with extension into the sub mucosa. Chronic iron overload results primarily
from a genetic disorder (hemochromatosis) characterized by increased iron absorption
and from diseases that require frequent transfusions (10). Adults have often taken iron
supplements for extended periods without deleterious effects (10), and an intake of 0.4–
1 mg/kg of body weight per day is unlikely to cause adverse effects in healthy persons
(19). (World Health Organization, 2003)
2. 25.2 Lead (Pb)
Lead is a ubiquitous pollutant in the ecosystem. On a global scale the
combustion of alkyl lead additives in motor fuels accounts for the major part of all lead
emissions into the atmosphere, thus influencing all compartments of the environment.
This has been hypothesized from mass balance studies (1) and has been confirmed by
the changes in environmental lead levels subsequent to the reductions in worldwide use
of alkyl leads in petrol since the early 1980s. Point sources, such as primary or
secondary lead smelters, may create local pollution problems. The level of
contamination of the surrounding air and soil depends on the amount of lead emitted,
the height of the stack, the presence of fugitive sources, topography and other local
features. In addition, the refining and manufacture of lead-containing compounds and
goods and refuse incineration also give rise to lead emissions. Since coal, like many
minerals, rocks and sediments, usually contains low concentrations of lead, a number of
other industrial activities such as iron and steel production, copper smelting and coal
combustion must be regarded as additional sources of lead emissions into the
atmosphere. (WHO, 2001)
25
Lead (Pb), with atomic number 82, atomic weight 207.19 and a specific gravity of
11.34, is a bluish or silvery-grey metal with a melting point of 327.5 °C and a boiling
point at atmospheric pressure of 1740 °C. It has four naturally occurring isotopes with
atomic weights 208, 206, 207 and 204 (in decreasing order of abundance). The isotopic
ratios may differ for different mineral sources, and this property has been exploited in
non-radioactive tracer studies to investigate environmental and metabolic pathways of
lead. Despite the fact that lead has four electrons on its valence shell, its typical
oxidation state is +2 rather than +4, since only two of the four electrons ionize easily.
Apart from nitrate, chlorate and, to a much lesser degree, chloride, most of the inorganic
salts of lead (II) have poor solubility in water. Stable organic lead compounds, such as
tetraethyl lead and tetraethyl lead, are formed by direct binding of lead to a carbon
atom. These compounds are colorless liquids with boiling points of 110 °C and 200 °C,
respectively. They are decomposed at boiling point as well as by ultraviolet light and
trace chemicals in air, such as halogens, acids and oxidizing agents. Owing to their use
as fuel additives for anti-knock purposes, they are sources of environmental lead
Nevertheless; their environmental impact has fallen during the past 15 years in most
industrialized countries owing to legislation aimed at reducing and replacing lead in
petrol. Sources Lead is a ubiquitous pollutant in the ecosystem. On a global scale the
combustion of alkyl lead additives in motor fuels accounts for the major part of all lead
emissions into the atmosphere, thus influencing all compartments of the environment.
This has been hypothesized from mass balance studies (1) and has been confirmed by
the changes in environmental lead levels subsequent to the reductions in worldwide use
of alkyl leads in petrol since the early 1980s. Point sources, such as primary or
secondary lead smelters, may create local pollution problems. The level of
contamination of the surrounding air and soil depends on the amount of lead emitted,
the height of the stack, the presence of fugitive sources, topography and other local
features. In addition, the refining and manufacture of lead-containing compounds and
goods and refuse incineration also give rise to lead emissions. Since coal, like many
minerals, rocks and sediments, usually contains low concentrations of lead, a number of
other industrial activities such as iron and steel production, copper smelting and coal
combustion must be regarded as additional sources of lead emissions into the
atmosphere. The presence of lead water-pipes in old houses can be an important source
of lead exposure for humans, particularly in areas with soft water. In certain areas, lead-
containing paint in old. (WHO Regional Office for Europe, Copenhagen, Denmark,
2001)
26
Most of the studies looking for a possible link between lead exposure and cancer
have focused on workers with high levels of occupational (work-related) exposure to
inorganic lead. People with heavy workplace exposures to lead have been found to have
blood lead concentrations many times higher than the average blood lead concentration
in the general population. Several studies have looked for a link between exposure to
lead in the workplace (mainly among battery workers and smelter workers) and lung
cancer. Some of these studies have found a small increase in lung cancer risk. However,
most of these studies were limited in that they didn't take into account other factors that
might affect lung cancer risk, such as smoking or exposures to arsenic or other heavy
metals that typically also occur along with lead exposures in industrial settings. Some
studies looking at blood lead levels in the general population have also found a small
increased risk of lung cancer in people with higher lead levels. Several of these same
workplace studies also looked at stomach cancer risk. Most of the studies found an
increased risk of stomach cancer with higher lead exposure. Although it is unlikely
these results would be affected by smoking or arsenic exposure, the studies didn’t take
into account other factors that could also have affected stomach cancer risk. Studies
have also looked at possible links between workplace exposures to lead and other
cancers, including cancers of the brain, kidney, bladder, colon, and rectum. The results
of these studies have been mixed. Some studies have found links, while others have not.
The link between lead exposure and cancer is clearly a concern, and more research is
needed to better define the possible link between lead exposure and a number of
cancers. (Manju Mahurpawar ,2015)
Effects on humans
Toxicological effects
As far as long-term, low-level lead exposure is concerned, the following effects have to
be considered in relation to the general population:
1. Effects on haem biosynthesis;
2. Effects on the nervous system;
3. Effects on blood pressure and cardiovascular effects, and
4. Effects on kidney function.
The present discussion is, therefore, limited to these aspects of lead toxicity.
(WHO, 2001)
27
2. 25.3 Manganese (Mn)
Manganese (Mn) is the twelfth most abundant element in the earth's crust and is
naturally present in rocks, soil, water, and food. Mn is an essential element for humans,
animals, and plants, and is required for growth, development, and maintenance of
health. There are inorganic and organic Mn compounds, with the inorganic forms
being the most common in the environment. Uses of Mn include:
(i) Iron and steel production;
(ii) Manufacture of dry cell batteries;
(iii) Production of potassium permanganate and other Mn chemicals;
(iv) Oxidant in the production of hydroquinone;
(v) Manufacture of glass;
(vi) Textile bleaching;
(vii) Oxidizing agent for electrode coating in welding rods;
(viii) Matches and fireworks;
(ix) Tanning of leather1.
Organic compounds of Mn are present in the fuel additive,
methylcyclopentadienyl manganese tricarbonyl (MMT), fungicides (e.g., mane band
mannose), and in contrast agents used in magnetic resonance imaging. Mn is naturally
present in food, with the highest concentrations typically found in nuts, cereals,
legumes, fruits, vegetables, grains, and tea - it is also present at low levels in drinking
water. Typical, daily intakes range from 2-9 mg/day for adults and approximately
3-5 per cent is absorbed from the gastrointestinal tract3. Absorption of Mn from the
diet occurs in the divalent and tetravalent state.
Manganese balance studies and excretion data indicate that low gastrointestinal
absorption and rapid elimination of Mn limits the toxicity of the Mn following the
ingestion of high doses. Chronic inhalation exposure to relatively high levels of
Mn has been associated with adverse neurological effects and a few studies have
reported the same following the ingestion of high levels or chronic exposure to
Mn in drinking water. Clinical Mn neurotoxicity has been reported in patients
receiving long-term parenteral nutrition and in patients with chronic liver dysfunction or
28
renal failure, as a result of their inability to eliminate and clear Mn from the blood. The
primary anthropogenic sources of Mn in ambient air include emission of Mn from
industrial sources such as ferroalloy production plants, iron and steel foundries, power
plants, and coke ovens and entrainment of soils containing Mn. The background levels
of Mn in rural and urban areas without point sources of Mn range from about 0.005-
0.07 μg Mn/m3, while average ambient air levels of Mn near industrial sources
range from 0.13-0.3 μg Mn/m3,4,5. Exposure to Mn from the erosion of soil is the
most important natural source of Mn in the ambient air, but little data are available to
estimate the contribution of Mn in ambient air from this source. Higher inhalation
exposures may be experienced in occupational settings such as Mn mines,
foundries, smelters, and battery manufacturing facilities.( Ismail 2019)
Manganese (Mn) is an element widely distributed in the earth’s crust. It is
considered to be the twelfth most abundant element and the fifth most abundant metal.
Manganese does not occur naturally in a pure state; oxides, carbonates and silicates are
the most important manganese-containing minerals. The most common manganese
mineral is pyrolusite (MnO2), usually mined in sedimentary deposits by open-cast
techniques. Manganese occurs in most iron ores. Its content in coal ranges from 6 μg/g
to 100 μg/g; it is also present in crude oil, but at substantially lower concentrations.
Manganese is mainly used in metallurgical processes, as a deoxidizing and
desulfurizing additive and as an alloying constituent. It is also used in the production of
dry-cell batteries, in chemical manufacturing, in the manufacture of glass, in the leather
and textile industries, and as a fertilizer. Organic carbonyl compounds of manganese are
used as fuel-oil additives, smoke inhibitors and anti-knock additives in petrol.
Crustal manganese enters the atmosphere by a number of natural and anthropogenic
processes, which include the suspension of road dusts by vehicles and wind erosion and
the suspension of soils, particularly in agricultural, construction and quarrying activities.
The resulting mechanically generated aerosols consist primarily of coarse particles ≥ 2.5
μm mass median aerodynamic diameter (MMAD). (Who .2000)
Manganese is a very common compound that can be found everywhere on earth.
Manganese is one out of three toxic essential trace elements, which means that it is not
only necessary for humans to survive, but it is also toxic a thigh concentration.
Manganese effects occur mainly in the respiratory trace and in the brain. Manganese
compounds exist naturally in the environment as solids is the soils and small particles in
the water. Manganese particles in air are present in dust particles. These usually settle to
earth within a few days. Humans enhance manganese concentrations in the air by
29
industrial activities and through burning fossil fuels. For animals manganese is an
essential compound of over thirty – six enzymes that are used for the carbohydrate,
protein and fat metabolism. In plant manganese ions are transported to the leaves after
uptake from soils. This causes disturbances in plant mechanisms. Manganese can cause
both toxicity and deficiency symptoms in plants. When the pH of the soil is low
manganese deficiencies are more common, (Ismail 2019, Greaney, 2005).
Effects on humans
Several epidemiological studies of workers have provided consistent evidence
indicating that neurotoxicity is associated with low-level occupational manganese
exposure. Conducted a cross-sectional study of neurobehavioral and other endpoints in
Belgian workers. A group of 92 male alkaline battery plant workers exposed to MnO2
dust were compared to a matched control group of 101 male workers without industrial
manganese exposure. The geometric mean occupational-lifetime integrated respirable
dust concentration was 793 μg manganese per m3·years (range: 40 – 4433). The
equivalent value for total dust was 3505 mg manganese per m3·years (range: 191–27
465). The monitored concentrations were considered representative of the usual
exposures of the workers because work practices had not changed during the preceding
15 years of the plant’s operation. Because the respirable fraction (5-μm MMAD) is
more representative of the toxicologically significant particles (i.e. the smaller inhaled
particles that deposit predominantly in the lower respiratory tract), the respirable dust
measurements were considered to be more accurate than total dust as an indicator of
exposure in relation to the observed health effects. The manganese-exposed workers
performed significantly worse than matched controls on several measures of
neurobehavioral function, particularly eye-hand coordination, hand steadiness and
visual reaction time. (Who .2000)
2. 25.4 Chromium (Cr)
Elemental chromium (Cr) was discovered in crocoite (PbCrO4) by
Vaquelin in 1798 (Barceloux, 1999). Carcinogenic effects of hexavalent Cr were
discovered towards the end of the 19th century, when nose tumours in workers handling
chromium pigments in Scotland were described. In the 1930s, case studies focusing on
lung cancer incidence in workers handling Cr were published and lung cancer was
recognized as an occupational disease in these workers in Germany during 1936
(Teleky, 1936). Since then, Cr has been studied especially as a mineral with toxic effect
on the organism. +
. (A. PECHOVA, L. PAVLATA, 2007)
30
Chromium (Cr) is a grey, hard metal most commonly found in the
trivalent state in nature. Hexavalent (chromium (VI)) compounds are also
found in small quantities. Chromite (FeOCr2O3) is the only ore containing a
significant amount of chromium. The ore has not been found in the pure form; its
highest grade contains about 55% chromic oxide .In Europe, ferrochromium is
produced mainly in Finland, France, Italy, Norway, Sweden and former
Yugoslavia. Potassium chromate is produced mainly in Germany, Italy,
Switzerland and the United Kingdom. Sodium chromate and dichromate are
now among the most important chromium products, and are used chiefly
for manufacturing chromic acid, chromium pigments, in leather tanning and for
corrosion control. Chromium levels in soil vary according to area and the
degree of contamination from anthropogenic chromium sources. Tests on
soils have shown chromium concentrations ranging from 1 to 1000 mg/kg,
with an average concentration ranging from 14 to about 70 mg/kg .
Chromium(VI) in soil can be rapidly reduced to chromium(III) by organic
matter. As chromium is almost ubiquitous in nature, chromium in the air
may originate from wind erosion of shale's, clay and many other kinds of soil. In
countries where chromite is mined, production processes may constitute a major
source of airborne chromium. In Europe, endpoint production of chromium
compounds is probably the most important source of chromium in air.
Occurrence in air Information on concentrations of total and spectated chromium
in the atmosphere is limited. Measurements carried out above the North
Atlantic, north of latitude 30° north, several thousands of kilometers from
major land masses, showed concentrations of chromium of 0.07–1.1 ng/m3.
The concentrations above the South Pole were slightly lower. (WHO Regional Office
for Europe, Copenhagen, Denmark, 2001)
Methods for adequate analysis of Cr in biological material have not been
developed until recently. This is why there has been relatively little data on Cr content
in different body tissues and fluids. The blood concentrations of Cr reported in literature
have come down with the gradual improvement of instrumentation. Levels of chromium
ranging between 1 and 40 μg/l had been claimed until. 1978 was a turning point of a
kind since electro thermic atomic absorption spectrophotometry started to be used,
making Cr content analysis more accurate, which got reflected in the lower Cr
concentrations detected in biological samples. Claim that the concentrations are 0.035–
0.04 μg/l and 0.120–0.34 μg/l for the blood serum of a healthy population and full
31
blood, respectively. There is a greater difference between full blood and blood serum
according to, who reported 0.058–0.388 μg/l of Cr in the blood serum of a healthy
population and 0.120–0.673 μg/l of Cr in full blood. Anderson et al. (1985) have found
the basal serum concentration of Cr in adults to be 0.13 ± 0.02 μg/l, followed by a
significant increase to 0.38 ± 0.02 μg/l after 3 months of Cr supplementation, but
despite this, they do not regard serum concentrations of Cr as a good indicator of the Cr
nutritional status. Concentrations of Cr in the blood of cattle with respect to the Cr
content in pasture plants in a region characterized by an increased Cr stress level’s
blood levels detected in this trial ranged from 9 to 92 μg/l, depending on the Cr content
in the plants. Found the Cr blood concentrations in dairy cows during the perinatal
period to be 3–5 μg/l while supplementation with 10 mg Cr per animal/day had no
effect on the Cr concentrations in blood.
The concentration of Cr in full blood is approximately 2–3 times higher than the
Cr concentration in plasma. Plasmatic Cr concentrations reflect the exposure to both
Cr3+
and Cr6+
while intracellular concentration reflects the exposure to Cr6+
, this is
because only Cr6+
has the capacity to penetrate into erythrocytes. The low concentration
of Cr in erythrocytes also testifies to the fact that the Cr6+
concentration has not
significantly surpassed the reduction capability of blood plasma for Cr6+
. (A.
PECHOVA, L. PAVLATA, 2007)
Effects on humans
Toxicological effects
Chrome ulcers, corrosive reactions on the nasal septum, acute irritative
dermatitis and allergic eczematous dermatitis have been recorded among subjects
exposed to chromium (VI) compounds (1,4). Ulcerations or perforations of the nasal
septum were reported in two-thirds of subjects following inhalation exposure to
chromium (VI) (as chromic acid) resulting from exposure at peak concentrations of
more than 20 μg/m3 (39). The data available in published reports do not suggest any
dose–response relationship between local exposure to chromium (VI) compounds and
the development of septal ulceration of the nose. Mancuso & Hueper (40) described a
spotty, moderately severe but not nodular pneumoconiosis in chromate workers.
(WHO, 2001)
32
2. 25.5 Nickel (Ni)
Nickel is a metal that is widely distributed in the earth's crust (soil and rocks),
air and water. Nickel can combine with other elements including sulphur, chlorine and
oxygen to form water soluble and insoluble nickel compounds. Nickel compounds are
mostly crystals or powders at room temperature. Nickel is used to produce stainless
steel and other alloys. Nickel alloys are used in coins, jeweler, household appliances
and electrical equipment. Nickel compounds are also used in the production of nickel-
cadmium batteries.
Human activities including combustion of coal and oil, municipal incineration, steel and
other nickel alloy production and electroplating all release nickel into the environment.
Volcanoes and forest fires also release nickel into the environment. people may be
exposed to nickel by ingesting food that is contaminated with nickel or by
cigarette smoking. People may also be exposed to low levels of nickel by
inhaling air contaminated with nickel or by ingesting nickel contaminated water.
Skin contact with products that contain nickel (e.g. jewelry, stainless steel and coins)
can lead to trace amounts released from such products. Nickel contact
dermatitis was often seen in individuals who wore nickel containing jewelry in
the past, but stringent controls are now in place to ensure that this no longer a
significant route of exposure. Workers employed in industries that produce, process
or use nickel may be exposed to higher levels of nickel than the general population.
He presence of nickel in the environment does not always lead to exposure.
Clearly, in order for it to cause any adverse health affects you must come into contact
with it. You may be exposed by breathing, eating, or drinking the substance or by
skin contact. Following exposure to any chemical, the adverse health affects you may
encounter depend on several factors, including the amount to which you are
exposed (dose), the way you are exposed, the duration of exposure, the form of
the chemical and if you were exposed to any other chemicals. Inhalation of nickel
or nickel compounds for a short period of time may cause sore throat and hoarseness.
Ingestion of nickel compounds may cause nausea, vomiting, abdominal pain and
diarrhea. Skin exposure to nickel or its compounds can lead to skin irritation
and allergic contact dermatitis (an immunological reaction leading to skin
sensitization expressed as a reddening/rash on the skin). Nickel contact
dermatitis was often seen in individuals who wore nickel containing jewelry in the
past, but stringent controls are now in place to ensure that this is no longer a significant
route of exposure.( Ismail 2019, CRCE, PHE ,2009)
33
Nickel is a compound that occurs in the environment only at very low levels.
Humans use nickel for many different applications. The most common application of
nickel is the use as an ingredient of steal and other metal products. It can be found in
common metal products such as jewelry. Foodstuffs naturally contain small amounts of
nickel. Chocolate and fats are known to contain severely high quantities. Nickel uptake
will boost when people eat large quantities of vegetables from polluted soils. Plants are
known to accumulate nickel and as a result the nickel uptake from vegetables will be
eminent. Smokers have a higher nickel uptake through their lungs. Finally, nickel can
be found in detergents. Humans may be exposed to nickel by breathing air, drinking
water, eating food or smoking cigarettes. Skin contact with nickel-contaminated soil or
water may also result in nickel exposure. In small quantities nickel is essential, but
when the uptake is too high it can be a danger to human health. An uptake of too large
quantities of nickel has the following consequences: Higher chances of development of
lung cancer, nose cancer, larynx cancer and prostate cancer Sickness and dizziness after
exposure to nickel gas Respiratory failure, Lung embolism, Birth defects, Asthma and
chronic bronchitis, Allergic reactions such as skin rashes, mainly from jewelry, Heart
disorders. Nickel fumes are respiratory irritants and may cause pneumonitis. Exposure
to nickel and its compounds may result in the development of a dermatitis known as
―nickel itch‖ in sensitized individuals. The first symptom is usually itching, which
occurs up to 7 days before skin eruption occurs. The primary skin eruption is
erythematous, or follicular, which may be followed by skin ulceration. Nickel
sensitivity, once acquired, appears to persist indefinitely. (Manju Mahurpawar ,2015)
The largest deposits of Ni are to be found in the oceanic manganese nodules,
which contain about I % Ni. The greatest part of the production of Ni is used in the steel
industry and for the production of alloys. Organ nickel compounds play an important
role in a number of polymerization processes. Physiologically Ni is one of the trace
elements; the human body contains about 10 mg. Little is known about the biological
role that Ni plays, but it appears to participate in carbohydrate metabolism; the
concentration in serum and urine is around 0.5 µg/L. Inhalable dusts or aerosols of Ni
metal or compounds, such as are produced during production and processing, are
classified as hazardous substances and are carcinogenic. Nickel is thus an important
element in the areas of toxicology and industrial hygiene. (Bcrnhard and
Michael,2005)
Nickel is a compound that occurs in the environment only at very low levels and is
essential in small dross but it can be dangerous when the maximum tolerable amounts
34
are exceeded. This can cause various kinds of cancer on different sites within the bodies
of animals, mainly of those that live near refineries. The most common application of
nickel is an ingredient of steal and other metal products. Nickel is released into the air
by power plants and trash incinerators and will settle the ground or fall down after
reactions with precipitin. Is usually takes a long time for nickel to be removed from air
(Ismail 2019, Greaney,2005).
Effects on humans
Toxicological effects
Severe lung damage has been recorded following acute inhalation exposure to nickel
carbonyl. Reversible renal effects (in workers), allergic dermatitis (most prevalent in
women), and mucosal irritation and asthma (in workers) have been reported following
exposure to inorganic nickel compounds (5). Renal effects and dermatitis presumably
relate both to nickel uptake by both inhalation and ingestion, in addition to cutaneous
contact for dermatitis.Allergic skin reactions to nickel (dermatitis) have been
documented both in nickel workers and in the general population. However, the
significance of nickel as a cause of occupationally-induced skin reaction is decreasing.
In contrast, there is evidence that nickel is increasingly a major allergen in the general
population, especially in women. About 2% of males and 11% of females show a
positive skin reaction to patch testing with nickel sulfate. Ear-piercing considerably
increases the risk of nickel sensitization (34). (Who .2000)
2. 25.6 Zinc (Zn)
Zinc the periodic table of the elements, zinc can be found in group IIb, together
with the two toxic metals cadmium and mercury. Nevertheless, zinc is considered to be
relatively non-toxic to humans. This is reflected by a comparison of the LD50 of the
sulfate salts in rats. According to the Toxnet database of the U.S. National Library of
Medicine, the oral LD50 for zinc is close to 3 g/kg body weight, more than 10-fold
higher than cadmium and 50-fold higher than mercury. (Laura, Lothar and
Hajo,2010)
Zinc is found in a wide variety of foods. You can get recommended amounts of
zinc by eating a variety of foods including the following: Oysters, which are the best
source of zinc. Red meat, poultry, seafood such as crab and lobsters, and fortified
breakfast cereals, which are also good sources of zinc.• Beans, nuts, whole grains, and
dairy products, which provide some zinc.
35
Zinc is present in almost all multivitamin/mineral dietary supplements. It is also
available alone or combined with calcium, magnesium or other ingredients in dietary
supplements. Dietary supplements can have several different forms of zinc including
zinc gluconate, zinc sulfate and zinc acetate. It is not clear whether one form is better
than the others.
Zinc is also found in some oral over-the-counter products, including those
labeled as homeopathic medications for colds. Use of nasal sprays and gels that contain
zinc has been associated with the loss of the sense of smell, in some cases long-lasting
or permanent. Currently, these safety concerns have not been found to be associated
with oral products containing zinc, such as cold lozenges.
Zinc is also present in some denture adhesive creams. Using large amounts of
these products, well beyond recommended levels, could lead to excessive zinc intake
and copper deficiency. This can cause neurological problems, including numbness and
weakness in the arms and legs. (National Institute of Health, 2016)
2. 25.7 Molybdenum (Mo)
Mo is an essential micronutrient, but the physiological requirement for this element is
relatively low. Plants take up Mo mainly as molybdate ions, and its absorption is
proportional to its concentration in the soil solution. Although there is no direct
evidence, there is a suggestion of the active uptake of Mo (Kabata and Pendias 2000)
General discretions is Physicochemical properties the physicochemical properties of
molybdenum are summarized below. Property Value Melting point 2610 °C Boiling
point 5560 °C Density 10.2 g/cm3Vapour pressure 0.133 kPa at 3102 °C Water
solubility Insoluble 1.2 Organoleptic properties Ammonium molybdate imparts a
slightly astringent taste to water at concentrations above about 10 mg of molybdenum
per litre. 1.3 Major uses Molybdenum is used in the manufacture of special steels, in
electrical contacts, spark plugs, X-ray tubes, filaments, screens and grids for radio
valves, and in the production of tungsten, glass-to-metal seals, non-ferrous alloys and
pigments. Molybdenum disulfide has unique properties as a lubricant additive.
Molybdenum compounds are used in agriculture either for the direct treatment of seeds
or in the formulation of fertilizers to prevent molybdenum deficiency (World Health
Organization 2011).
36
2. 25.8 Copper (Cu)
Copper is a naturally occurring metal in soil that can also be introduced by human
activities. Mining activities, metal production, wood production, phosphate fertilizer
production and use of agrichemicals in horticultural soils are human – influenced
sources of copper in agricultural soils most copper compounds complexes strongly with
organic matter. Water – soluble species pose a threat to the environment.(Kabata and
Pendies, 2000).
Very extensive studies have been made on the forms and behavior of Cu in plants. All
findings described in a number of outstanding textbooks can be summarized as follows:
1. Cu is mainly complexed with organic compounds of low molecular weight and with
proteins.
2. Cu occurs in the compounds with no known functions as well as in enzymes having
vital functions in plant metabolism.
3.Cu plays a significant role in several physiological processes—photosynthesis,
respiration, carbohydrate distribution, N reduction and fixation, protein metabolism, and
cell wall metabolism.
4. Cu influences water permeability of xylem vessels and thus controls water
relationships.
5. Cu controls the production of DNA and RNA, and its deficiency greatly inhibits the
reproduction of plants (reduced seed production, pollen sterility).
6. Cu is involved in the mechanisms of disease resistance. This resistance of plants to
fungal diseases is likely to be related to an adequate Cu supply. There is also evidence
that plants with enriched Cu concentrations are susceptible to some diseases. These
phenomena may indicate that the role of Cu in disease resistance is an indirect one
(Kabata and Pendias, 2000)
2. 25.9 Tungsten (W)
Tungsten is a naturally occurring element that exists in the form of minerals, but
typically not as a pure metal (ATSDR 2005). The color of tungsten may range from
white for the pure metal to steel-gray for the metal with impurities (NIOSH 2016).
There are more than 20 known tungsten-bearing minerals (ATSDR 2005). Wolframite
([FeMn]WO4) and Scheelite (CaWO4) are two common, commercially-mined minerals
that contain tungsten (ATSDR 2005; Koutsospyros et al, 2006). Natural tungsten is
composed of five stable isotopes. There are 28 artificial radioactive isotopes, which
37
have short half-lives ranging from less than a second to 121 days (ATSDR 2005; Audi
et al, 2003).
Tungsten in plants was either taken up by the plant or was attached to the plant as a
component of the soil. Although very limited data are available, exposure to tungsten
from air, drinking water, and food is expected to be insignificant. In certain workplaces,
you can be exposed to levels of tungsten in air that are higher than background levels
((NTIS), 2005).
2. 25.10 Vanadium (V)
The evidence that V is essential for the growth of higher plants is not yet conclusive,
while the essentiality of this element for alga species is unquestionable and V is known
to stimulate photosynthesis in these organisms(Kabata and Pendias, 2000)
Nutritional studies have shown that vanadium Its deficiency may result in growth
reduction, impairment of reproduction and disturbances in lipid metabolism. Vanadium
is also essential for soil nitrogen-fixing microorganisms. It may play a significant role in
human nutrition. Biochemical, physiological and pharmacological properties of
vanadium compounds have been reviewed. It has been suggested that vanadium may be
a regulatory agent for enzymatic activities in mammalian tissues. Vanadium is a potent
inhibitor of many enzymes, while it stimulates adenylate cyclase. It has been shown to
inhibit cholesterol biosynthesis and lower plasma cholesterol levels. Vanadium can also
directly influence glucose metabolism in vitro and may play a role in its regulation.
Lipid peroxidation of rat lung extracts, liver microsomes and mitochondria was induced
by sulfite and accelerated by the presence of vanadium compounds. Vanadium may play
a physiological role as part of a control on levels of the endogenous antioxidant,
glutathione. This may also be important with respect to toxic interactions of chemicals
(WHO 2000)
2. 25.11 Titanium (Ti)
Titanium is one of the most common in the earth's crust (ninth in abundance 0.6% by
mass); it occurs in a number of minerals as well as in living system and natural bodies
of water. Titanium is used widely in the chemical industry. (Kabata and Pendies,
2000).
2. 25.12 cobalt (Co)
Numerous studies have been made of plant uptake of Co from soils, and it has been
shown that enrichment of the soil with Co has led to increased levels of this metal in
plants. Co is also easily taken up by leaves through the cuticle; therefore, foliar
38
applications of Co in solution are known. In nature, although plant species range widely
in their content of Co, toxicity symptoms are not often observed. When a high Co level
is readily available, in polluted soil in particular, it can seriously affect plant growth and
metabolic functions to be effective in the correction of Co deficiency. (Kabata and
Pendias 2000)
2. 25.13 Niobium (Nb)
Niobium, also known as columbium, is a chemical element with the symbol Nb
(formerly Cb) and atomic number 41. Niobium is a light grey, crystalline, and
ductile transition metal. Pure niobium has a Mohs hardness rating similar to that of
pure titanium (G.V. Samsonov, 2015).
2.26 Previous studies:
There are no intensive studies that handled the physic characteristics of Guiera
Senegalensis (Gabeysh) plant, but some studies have discussed the uses of its extract in
the medical uses.
2.26.1 ETHNOBOTANICAL SURVEY AND PHYTOCHEMICAL
STUDIES OF GUIERA SENEGALENSIS LAM. IN MUBI LOCAL
GOVERNMENT OF ADAMAWA STATE
The Sudano-Sahelian species Guiera senegalensis is a small shrub found mainly
in West Africa. It is well known in the Sahel, where it grows gregariously, and forming
abundant single-species colonies on fallow clay or sandy soils. Six (6) traditional
medical practitioners were interviewed from different location in the study area (Mubi
North and Mubi South L.G.A). The ethnobotanical survey revealed that various plant
parts can be used to relief various sickness (Malaria, Fever, Dental absesse, e.t.c.) With
the leaves (8) being the most frequently used part. New uses of plant part by traditional
medical practitioners were recorded especially the use of decocted leaves to relief
abdominal pains and migraines. Phytochemical analysis of most used part of the plant
were carried out which revealed the presences of some major classes of secondary
metabolites, namely; anthraquinones, terpenoids, saponins, alkaloids, flavonoids, tanins
and cardiotrnic and cyanogenic glycosides. Further investigation should be carried out
to extract the active component in Guiera senegalensis which will serve as a potential
medicine for the phytotherapeutic arsenal (Zakawa et al, 2018).
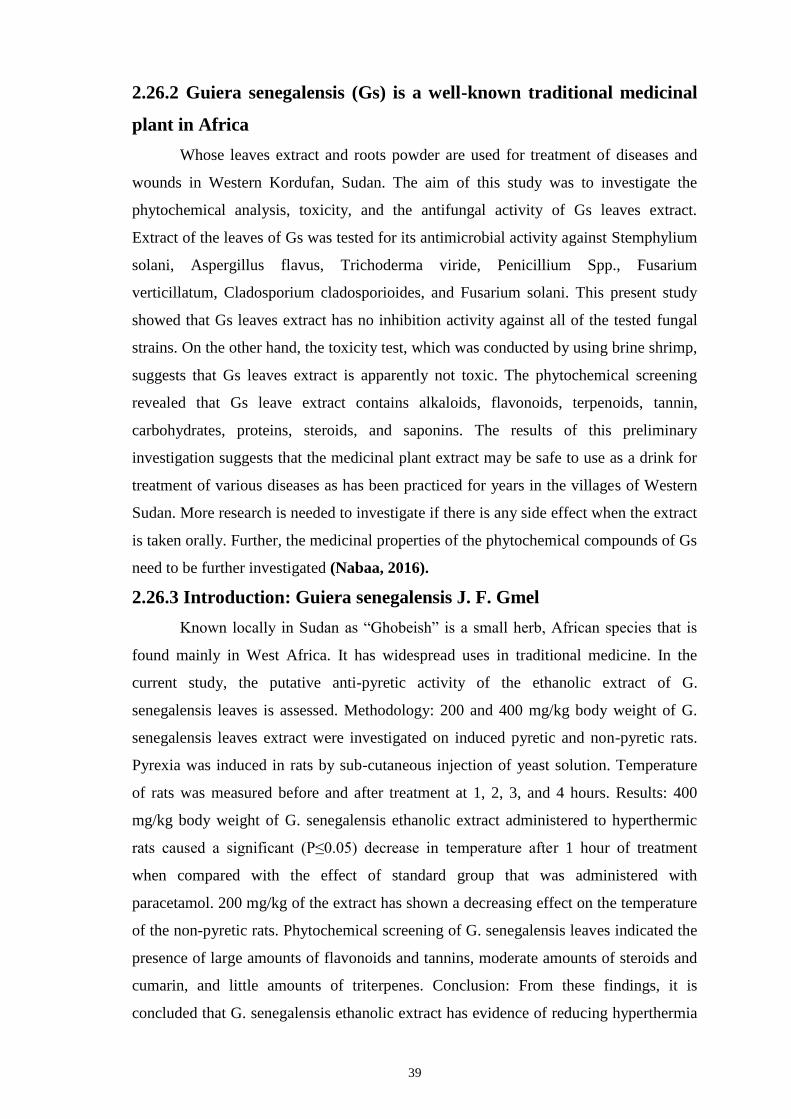
39
2.26.2 Guiera senegalensis (Gs) is a well-known traditional medicinal
plant in Africa
Whose leaves extract and roots powder are used for treatment of diseases and
wounds in Western Kordufan, Sudan. The aim of this study was to investigate the
phytochemical analysis, toxicity, and the antifungal activity of Gs leaves extract.
Extract of the leaves of Gs was tested for its antimicrobial activity against Stemphylium
solani, Aspergillus flavus, Trichoderma viride, Penicillium Spp., Fusarium
verticillatum, Cladosporium cladosporioides, and Fusarium solani. This present study
showed that Gs leaves extract has no inhibition activity against all of the tested fungal
strains. On the other hand, the toxicity test, which was conducted by using brine shrimp,
suggests that Gs leaves extract is apparently not toxic. The phytochemical screening
revealed that Gs leave extract contains alkaloids, flavonoids, terpenoids, tannin,
carbohydrates, proteins, steroids, and saponins. The results of this preliminary
investigation suggests that the medicinal plant extract may be safe to use as a drink for
treatment of various diseases as has been practiced for years in the villages of Western
Sudan. More research is needed to investigate if there is any side effect when the extract
is taken orally. Further, the medicinal properties of the phytochemical compounds of Gs
need to be further investigated (Nabaa, 2016).
2.26.3 Introduction: Guiera senegalensis J. F. Gmel
Known locally in Sudan as ―Ghobeish‖ is a small herb, African species that is
found mainly in West Africa. It has widespread uses in traditional medicine. In the
current study, the putative anti-pyretic activity of the ethanolic extract of G.
senegalensis leaves is assessed. Methodology: 200 and 400 mg/kg body weight of G.
senegalensis leaves extract were investigated on induced pyretic and non-pyretic rats.
Pyrexia was induced in rats by sub-cutaneous injection of yeast solution. Temperature
of rats was measured before and after treatment at 1, 2, 3, and 4 hours. Results: 400
mg/kg body weight of G. senegalensis ethanolic extract administered to hyperthermic
rats caused a significant (P≤0.05) decrease in temperature after 1 hour of treatment
when compared with the effect of standard group that was administered with
paracetamol. 200 mg/kg of the extract has shown a decreasing effect on the temperature
of the non-pyretic rats. Phytochemical screening of G. senegalensis leaves indicated the
presence of large amounts of flavonoids and tannins, moderate amounts of steroids and
cumarin, and little amounts of triterpenes. Conclusion: From these findings, it is
concluded that G. senegalensis ethanolic extract has evidence of reducing hyperthermia
40
in experimental animals and this effect may be correlated to other biological activities
of this medicinal plant (Reem, 2018).
2.26.4 Phytochemical and pharmacological study of roots and leaves of
Guiera senegalensis J.F. Gmel (Combretaceae)
The chemical composition of total alkaloids from leaves and roots of Guiera
senegalensis was investigated. Three beta-carboline alkaloids were purified: in addition
to harman and tetrahydroharman, known in roots and leaves, harmalan (dihydroharman)
was isolated for the first time from roots of Guiera senegalensis. Guieranone A, a
naphthyl butanone, was also purified from leaves and roots. The in vitro antiplasmodial
activity and the cytotoxicity of extracts and pure compounds were evaluated. Each total
alkaloid extract and beta-carboline alkaloids presented an interesting antiplasmodial
activity associated with a low cytotoxicity. Harmalan was less active than harman and
tetrahydroharman. Guieranone A showed a strong antiplasmodial activity associated
with a high cytotoxicity toward human monocytes. Its cytotoxicity was performed
against two cancer cell lines and normal skin fibroblasts in order to study its anticancer
potential: Guieranone A presented a strong cytotoxicity against each cell strains.
Finally, we evaluated the potent synergistic antimalarial interaction between Guiera
senegalensis and two plants commonly associated in traditional remedies: Mitragyna
inermis and Pavetta crassipes. Three associations evaluated were additive. A synergistic
effect was shown between total alkaloids extracted from leaves of Guiera senegalensis
and those of Mitragyna inermis. This result justified the traditional use of the plants in
combination to treat malaria (Julien Fiot et al, 2006).
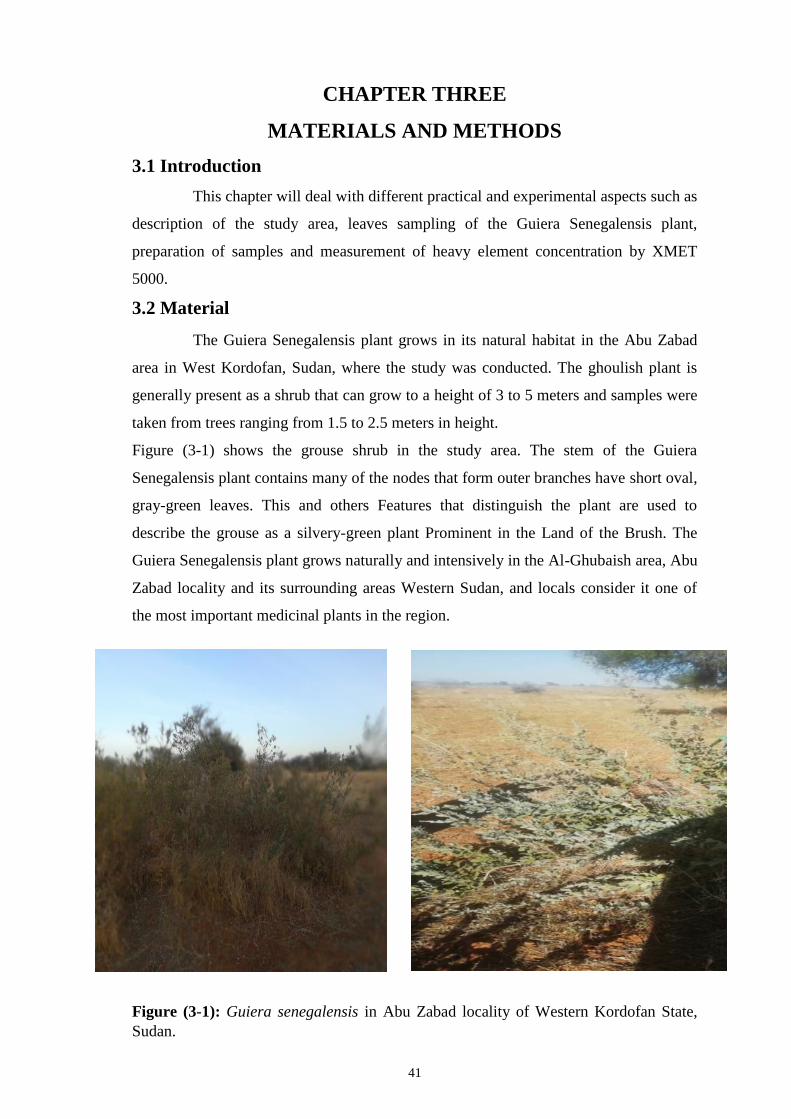
41
CHAPTER THREE
MATERIALS AND METHODS
3.1 Introduction
This chapter will deal with different practical and experimental aspects such as
description of the study area, leaves sampling of the Guiera Senegalensis plant,
preparation of samples and measurement of heavy element concentration by XMET
5000.
3.2 Material
The Guiera Senegalensis plant grows in its natural habitat in the Abu Zabad
area in West Kordofan, Sudan, where the study was conducted. The ghoulish plant is
generally present as a shrub that can grow to a height of 3 to 5 meters and samples were
taken from trees ranging from 1.5 to 2.5 meters in height.
Figure (3-1) shows the grouse shrub in the study area. The stem of the Guiera
Senegalensis plant contains many of the nodes that form outer branches have short oval,
gray-green leaves. This and others Features that distinguish the plant are used to
describe the grouse as a silvery-green plant Prominent in the Land of the Brush. The
Guiera Senegalensis plant grows naturally and intensively in the Al-Ghubaish area, Abu
Zabad locality and its surrounding areas Western Sudan, and locals consider it one of
the most important medicinal plants in the region.
Figure (3-1): Guiera senegalensis in Abu Zabad locality of Western Kordofan State,
Sudan.
42
3.3 Study area:
3.3.1 description of the study area:
The city of Abu Zabad is located in the state of West Kordofan, and it is about 166
kilometers southwest of the city of Al Ubayyid, the capital of the state of North
Kordofan. The locality of Abu Zabad includes five administrators, and it is located
between the two circles of width 20-29 and between longitudes 16-19. show as fig(3.2) .
3.3.2 location map of the study area:
Figure (3.2) location map of the study area
3.4 The method of work
3.4.1The first step:
Ten samples were collected from three different sites randomly at three areas in West
Kordofan (Zaklouna, northwest of the Abu Zabad station transmutation power
electricity and Um Drouta) in Abu Zabad City. The sample was taken from the leaves
and then dried at room temperature for a few days to ensure complete dryness and
stored in plastic boxes illustrated in Figure (3.3), identified with symbols (A1, A2, A3, A4,
A5, A6, A7, A8, A9, A10), and then transferred to the technical oil laboratory to be prepared
by the XMET5000 device.
Figure (3.3) the leaves and then dried at room temperature for a few days to
ensure complete dryness and stored in plastic boxes illustrated in Abu Zabad City
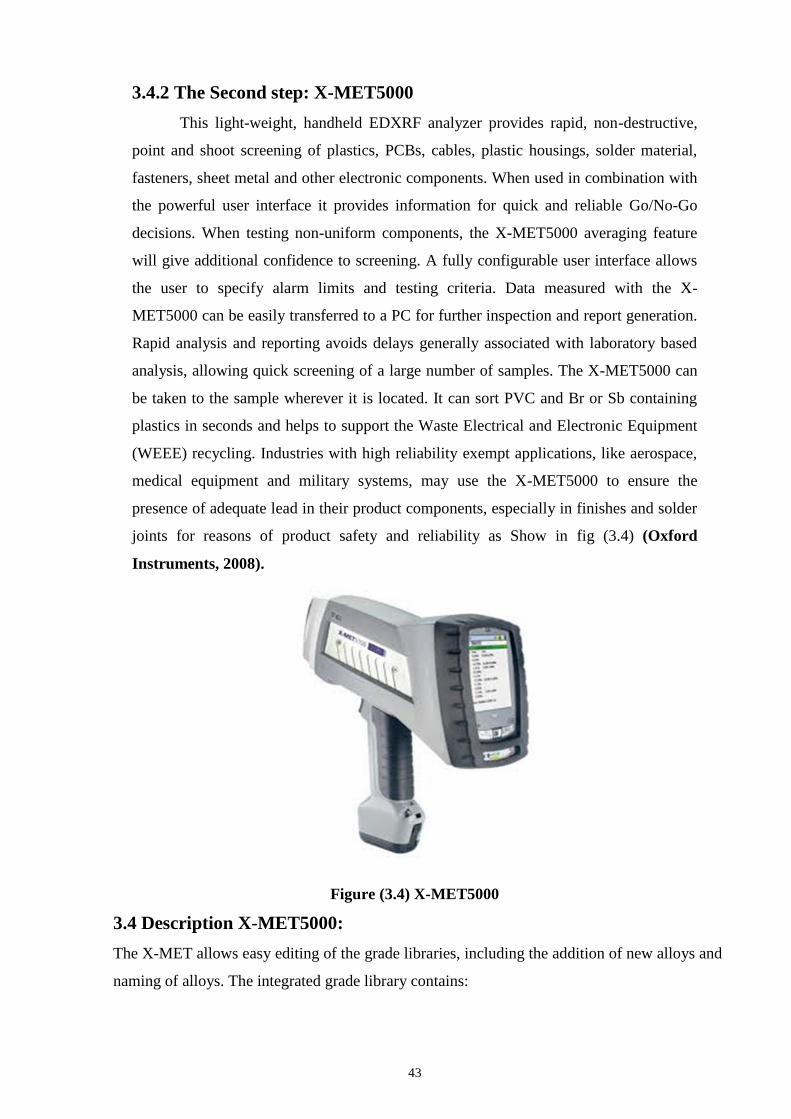
43
3.4.2 The Second step: X-MET5000
This light-weight, handheld EDXRF analyzer provides rapid, non-destructive,
point and shoot screening of plastics, PCBs, cables, plastic housings, solder material,
fasteners, sheet metal and other electronic components. When used in combination with
the powerful user interface it provides information for quick and reliable Go/No-Go
decisions. When testing non-uniform components, the X-MET5000 averaging feature
will give additional confidence to screening. A fully configurable user interface allows
the user to specify alarm limits and testing criteria. Data measured with the X-
MET5000 can be easily transferred to a PC for further inspection and report generation.
Rapid analysis and reporting avoids delays generally associated with laboratory based
analysis, allowing quick screening of a large number of samples. The X-MET5000 can
be taken to the sample wherever it is located. It can sort PVC and Br or Sb containing
plastics in seconds and helps to support the Waste Electrical and Electronic Equipment
(WEEE) recycling. Industries with high reliability exempt applications, like aerospace,
medical equipment and military systems, may use the X-MET5000 to ensure the
presence of adequate lead in their product components, especially in finishes and solder
joints for reasons of product safety and reliability as Show in fig (3.4) (Oxford
Instruments, 2008).
Figure (3.4) X-MET5000
3.4 Description X-MET5000:
The X-MET allows easy editing of the grade libraries, including the addition of new alloys and
naming of alloys. The integrated grade library contains:
44
Nickel Alloys, Stainless Steels, Cobalt Alloys, Low Alloy Steel, Tool Steels, Copper Alloys,
Titanium Alloys, Zirconium Alloys, Aluminum Alloys. The X-MET is capable of storing
thousands of grade identifications and it’s easy to add new elements or to create a custom
library. The top of the range X-MET5100 combines Oxford Instruments’ groundbreaking
Silicon Drift Detector (SDD) with a powerful 45kV X-ray tube. This cutting edge technology
delivers a five times faster measurement speed, much better detection limits and significant
accuracy improvement over conventional systems. Isn’t it time you used X-MET to improve
your productivity?
Engineered for high performance and reliability, this hand-held XRF, analyser combines
Oxford Instruments’ patented Penta PIN® detector technology offering guaranteed fast
analysis and lower limits of detection for all elements of interest.
X-MET5000 portable X-ray detector was used to measurement and investigates the samples
was taken from study area. The X-MET5000 is hand-held EDXRF analyzer provides rapid,
non-destructive, point and shoots screening of plastics, PCBs, cables, plastic housings, solder
material, fasteners, sheet metal and other electronic components. When used in combination
with the powerful user interface it provides information for quick and reliable Go/No-Go
decisions. When testing non-uniform components, the X-MET5000 averaging feature will give
additional confidence to screening. A fully configurable user interface allows the user to
specify alarm limits and testing criteria. Data measured with the X-MET5000 can be easily
transferred to a PC for further inspection and report generation. Rapid analysis and reporting
avoids delays generally associated with laboratory based analysis, allowing quick screening of
a large number of samples. The X-MET5000 can be taken to the sample wherever it is located.
It can also be used as a quick, on-site, quality control tool to analyze other elements such as
Sn, Ag, Cu, Sb, Bi, etc., in solder and Cl, Ca, Sb, Ni, Sr, Zn, As and Ba in plastics and
components. It can sort PVC and Br or Sb containing plastics in seconds and helps to support
the Waste Electrical and Electronic Equipment (WEEE) recycling. Industries with high
reliability exempt applications, like aerospace, medical equipment and military systems, may
use the X-MET5000 to ensure the presence of adequate lead in their product components,
especially in finishes and solder joints for reasons of product safety and reliability. The X-
MET5000 can be taken to the sample wherever it is located. It can sort PVC and Br or Sb
containing plastics in seconds and helps to support the Waste Electrical and Electronic
Equipment (WEEE) recycling. Industries with high reliability exempt applications, like
aerospace, medical equipment and military systems, may use the X-MET5000 to ensure the
presence of adequate lead in their product components, especially in finishes and solder joints
for reasons of product safety and reliability (Oxford Instruments, 2008).
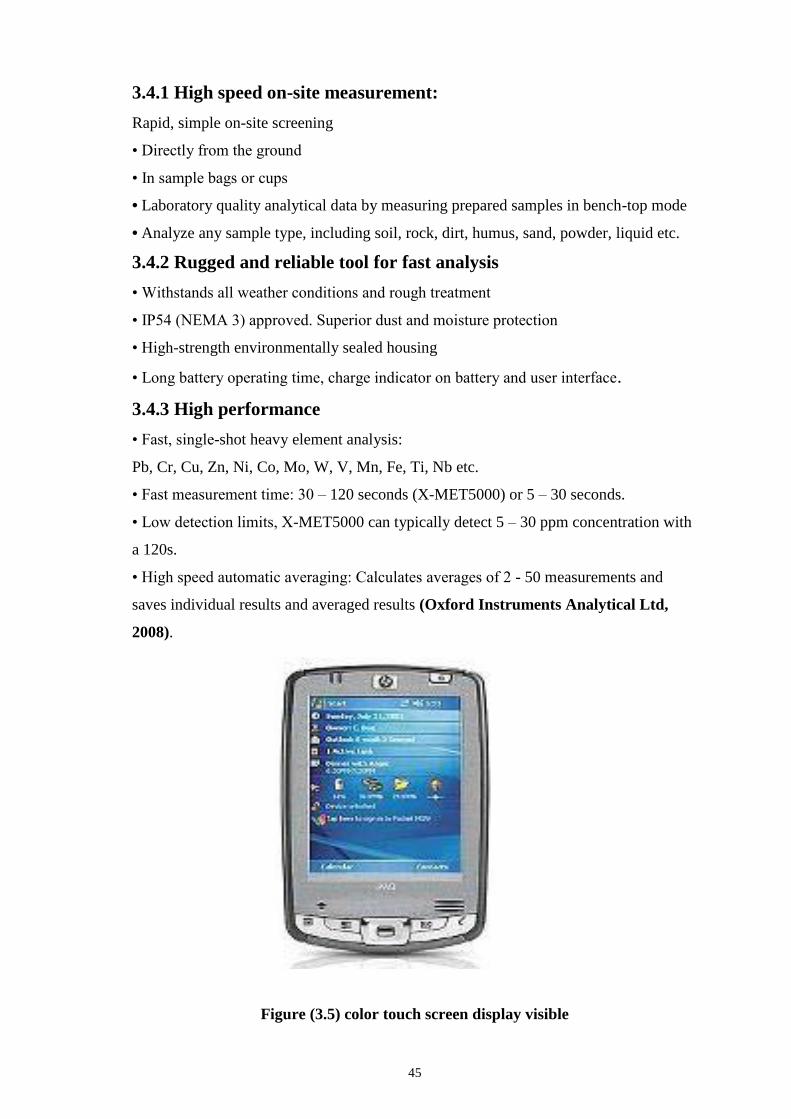
45
3.4.1 High speed on-site measurement:
Rapid, simple on-site screening
• Directly from the ground
• In sample bags or cups
• Laboratory quality analytical data by measuring prepared samples in bench-top mode
• Analyze any sample type, including soil, rock, dirt, humus, sand, powder, liquid etc.
3.4.2 Rugged and reliable tool for fast analysis
• Withstands all weather conditions and rough treatment
• IP54 (NEMA 3) approved. Superior dust and moisture protection
• High-strength environmentally sealed housing
• Long battery operating time, charge indicator on battery and user interface.
3.4.3 High performance
• Fast, single-shot heavy element analysis:
Pb, Cr, Cu, Zn, Ni, Co, Mo, W, V, Mn, Fe, Ti, Nb etc.
• Fast measurement time: 30 – 120 seconds (X-MET5000) or 5 – 30 seconds.
• Low detection limits, X-MET5000 can typically detect 5 – 30 ppm concentration with
a 120s.
• High speed automatic averaging: Calculates averages of 2 - 50 measurements and
saves individual results and averaged results (Oxford Instruments Analytical Ltd,
2008).
Figure (3.5) color touch screen display visible
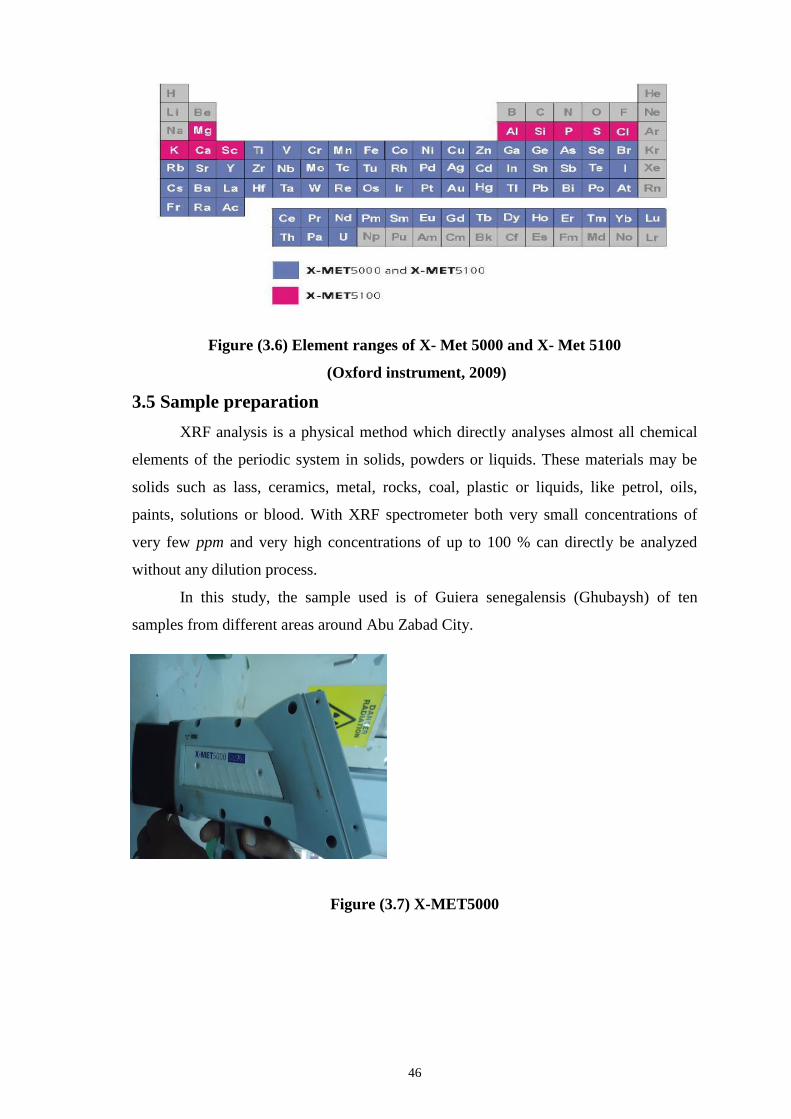
46
Figure (3.6) Element ranges of X- Met 5000 and X- Met 5100
(Oxford instrument, 2009)
3.5 Sample preparation
XRF analysis is a physical method which directly analyses almost all chemical
elements of the periodic system in solids, powders or liquids. These materials may be
solids such as lass, ceramics, metal, rocks, coal, plastic or liquids, like petrol, oils,
paints, solutions or blood. With XRF spectrometer both very small concentrations of
very few ppm and very high concentrations of up to 100 % can directly be analyzed
without any dilution process.
In this study, the sample used is of Guiera senegalensis (Ghubaysh) of ten
samples from different areas around Abu Zabad City.
Figure (3.7) X-MET5000
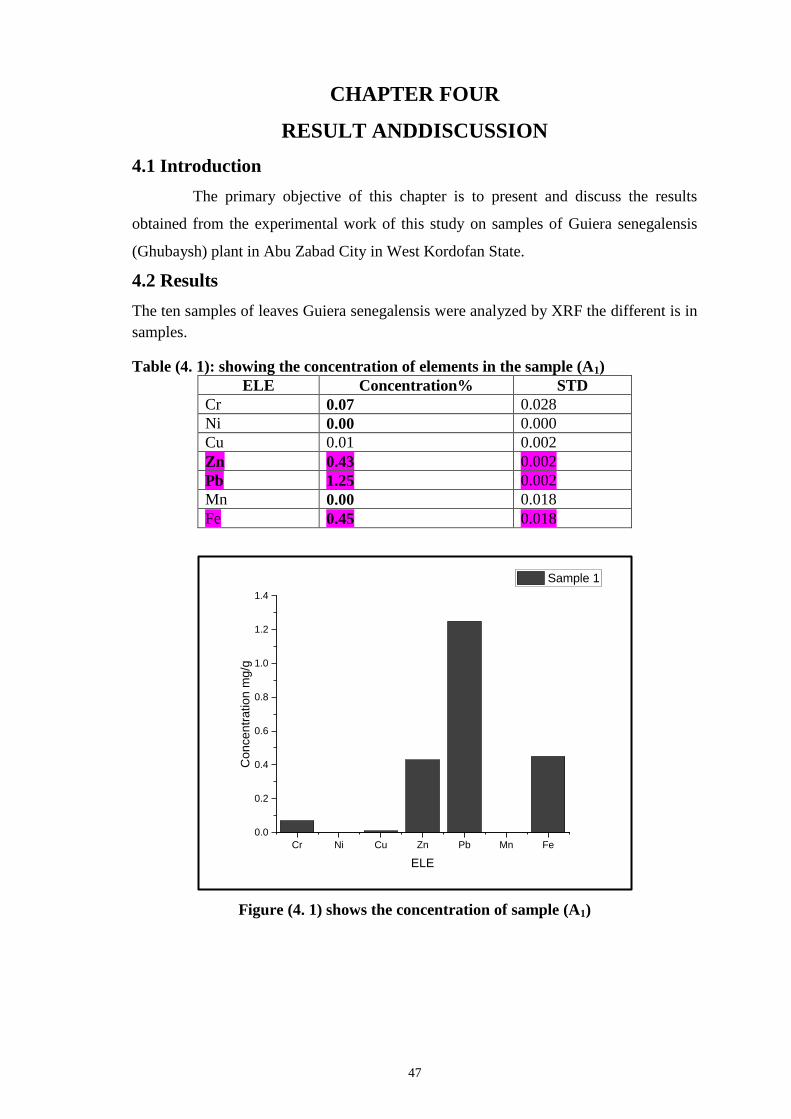
47
CHAPTER FOUR
RESULT ANDDISCUSSION
4.1 Introduction
The primary objective of this chapter is to present and discuss the results
obtained from the experimental work of this study on samples of Guiera senegalensis
(Ghubaysh) plant in Abu Zabad City in West Kordofan State.
4.2 Results
The ten samples of leaves Guiera senegalensis were analyzed by XRF the different is in
samples.
Table (4. 1): showing the concentration of elements in the sample (A1)
ELE Concentration% STD
Cr 0.07 0.028
Ni 0.00 0.000
Cu 0.01 0.002
Zn 0.43 0.002
Pb 1.25 0.002
Mn 0.00 0.018
Fe 0.45 0.018
Figure (4. 1) shows the concentration of sample (A1)
Cr Ni Cu Zn Pb Mn Fe
0.0
0.2
0.4
0.6
0.8
1.0
1.2
1.4
Co
ncen
tra
tion
mg
/g
ELE
Sample 1
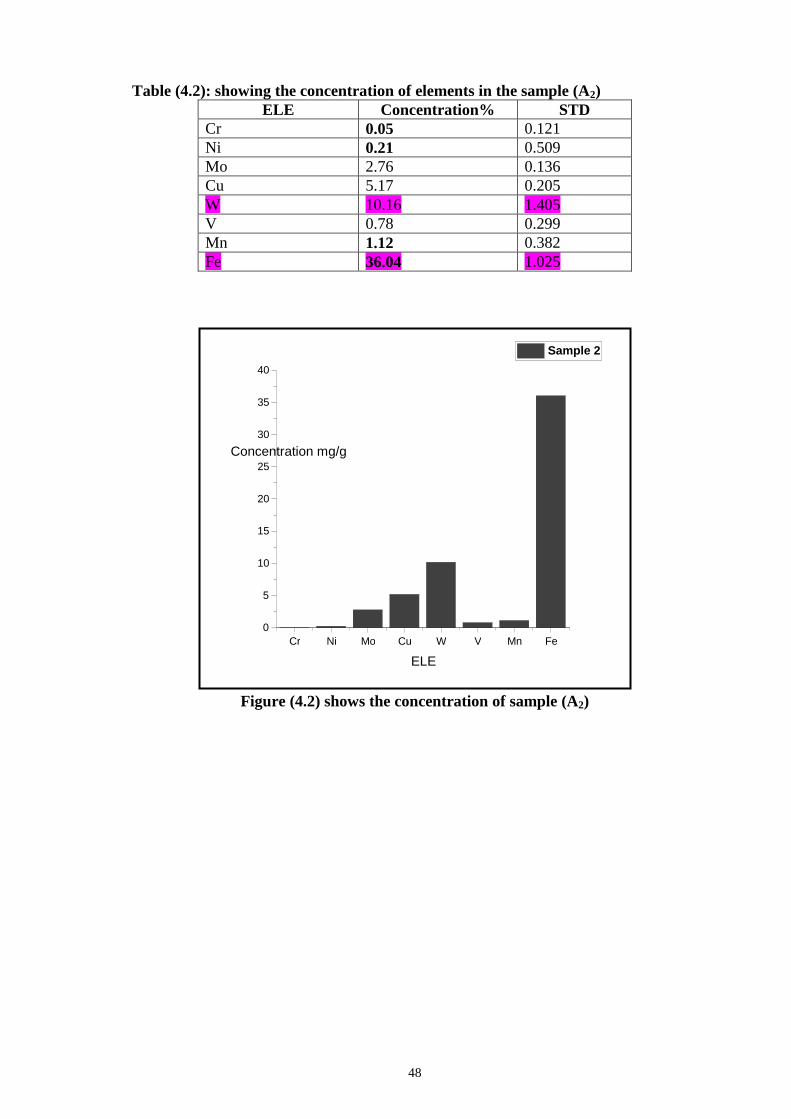
48
Table (4.2): showing the concentration of elements in the sample (A2)
ELE Concentration% STD
Cr 0.05 0.121
Ni 0.21 0.509
Mo 2.76 0.136
Cu 5.17 0.205
W 10.16 1.405
V 0.78 0.299
Mn 1.12 0.382
Fe 36.04 1.025
Figure (4.2) shows the concentration of sample (A2)
Cr Ni Mo Cu W V Mn Fe 0
5
10
15
20
25
30
35
40
Concentration mg/g
ELE
Sample 2
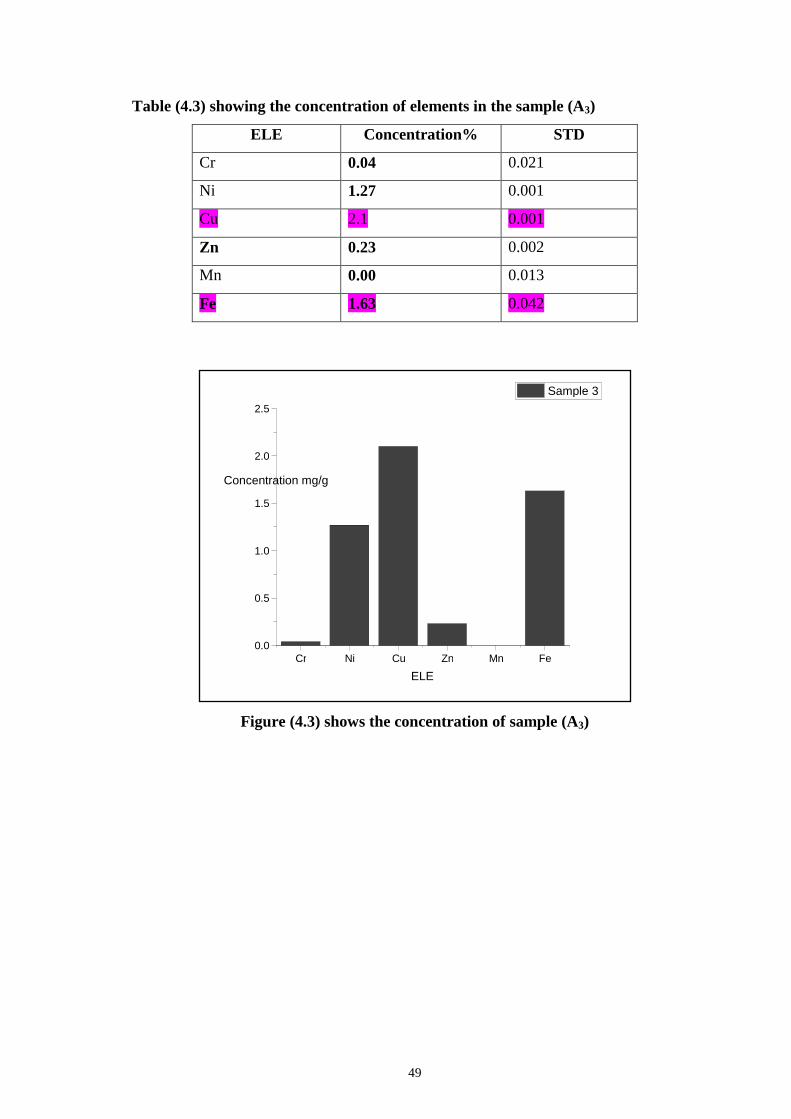
49
Table (4.3) showing the concentration of elements in the sample (A3)
ELE Concentration% STD
Cr 0.04 0.021
Ni 1.27 0.001
Cu 2.1 0.001
Zn 0.23 0.002
Mn 0.00 0.013
Fe 1.63 0.042
Figure (4.3) shows the concentration of sample (A3)
Cr Ni Cu Zn Mn Fe 0.0
0.5
1.0
1.5
2.0
2.5
Concentration mg/g
ELE
Sample 3
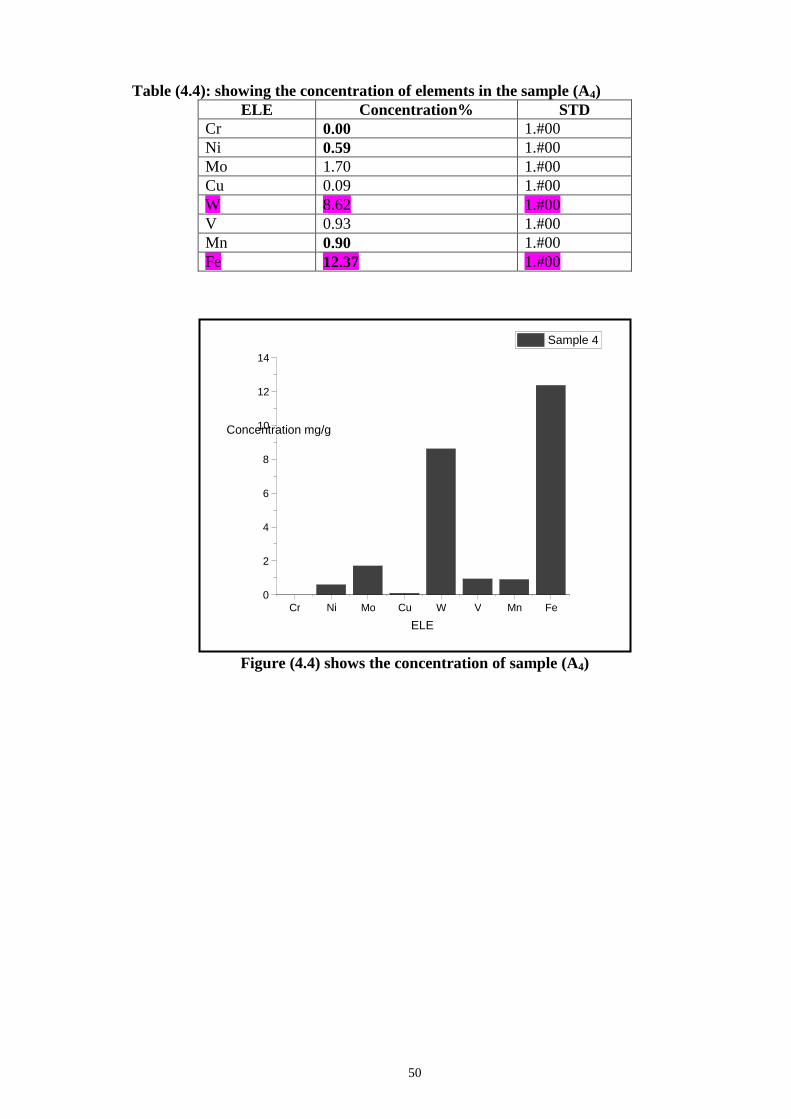
50
Table (4.4): showing the concentration of elements in the sample (A4)
ELE Concentration% STD
Cr 0.00 1.#00
Ni 0.59 1.#00
Mo 1.70 1.#00
Cu 0.09 1.#00
W 8.62 1.#00
V 0.93 1.#00
Mn 0.90 1.#00
Fe 12.37 1.#00
Figure (4.4) shows the concentration of sample (A4)
Cr Ni Mo Cu W V Mn Fe 0
2
4
6
8
10
12
14
Concentration mg/g
ELE
Sample 4
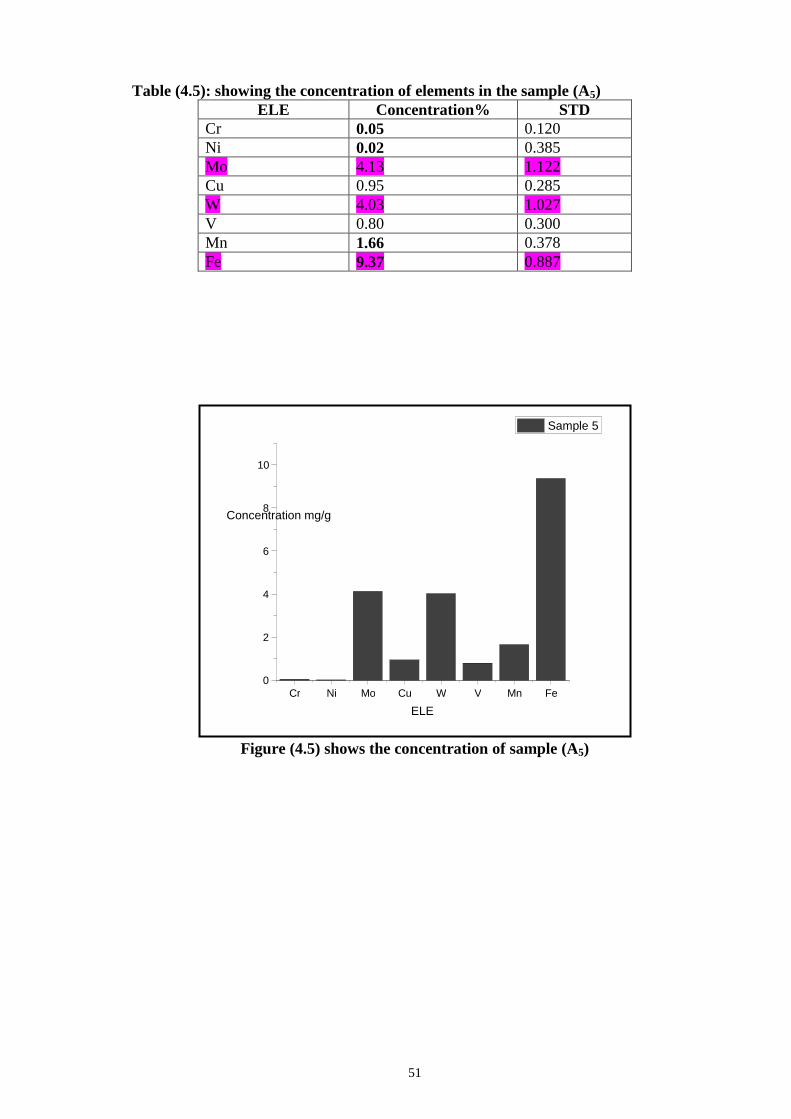
51
Table (4.5): showing the concentration of elements in the sample (A5)
ELE Concentration% STD
Cr 0.05 0.120
Ni 0.02 0.385
Mo 4.13 1.122
Cu 0.95 0.285
W 4.03 1.027
V 0.80 0.300
Mn 1.66 0.378
Fe 9.37 0.887
Figure (4.5) shows the concentration of sample (A5)
Cr Ni Mo Cu W V Mn Fe 0
2
4
6
8
10
Concentration mg/g
ELE
Sample 5
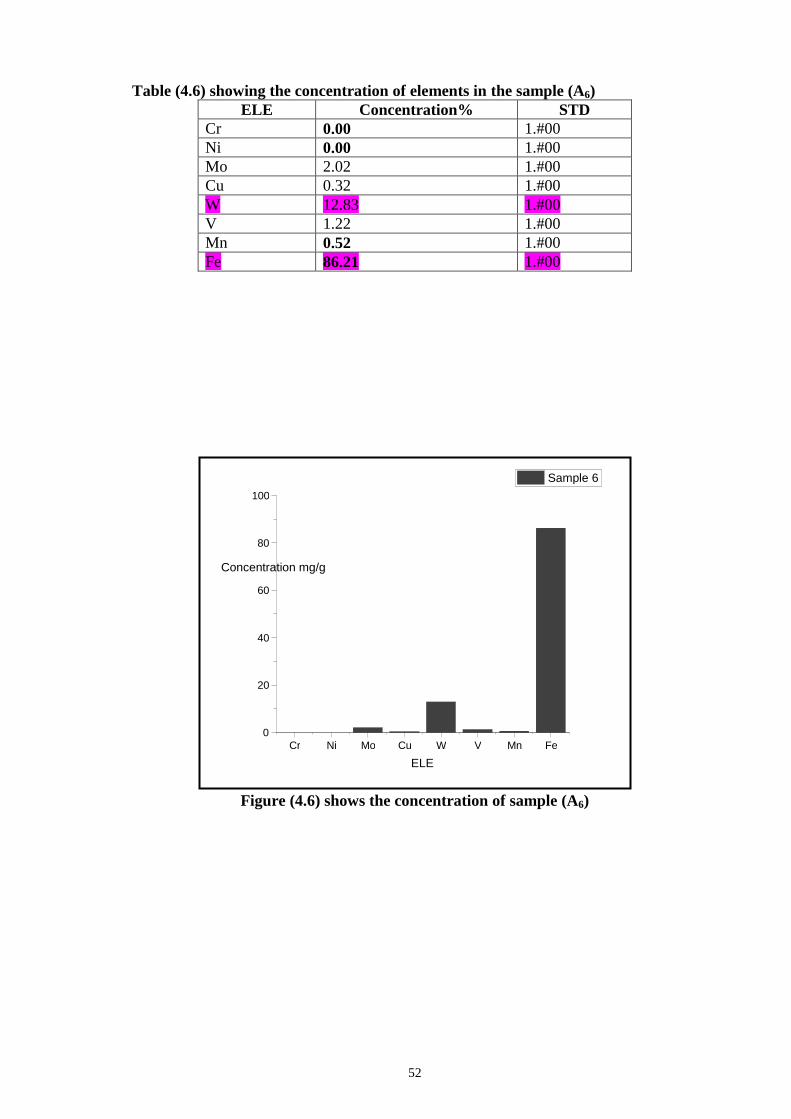
52
Table (4.6) showing the concentration of elements in the sample (A6)
ELE Concentration% STD
Cr 0.00 1.#00
Ni 0.00 1.#00
Mo 2.02 1.#00
Cu 0.32 1.#00
W 12.83 1.#00
V 1.22 1.#00
Mn 0.52 1.#00
Fe 86.21 1.#00
Figure (4.6) shows the concentration of sample (A6)
Cr Ni Mo Cu W V Mn Fe 0
20
40
60
80
100
Concentration mg/g
ELE
Sample 6
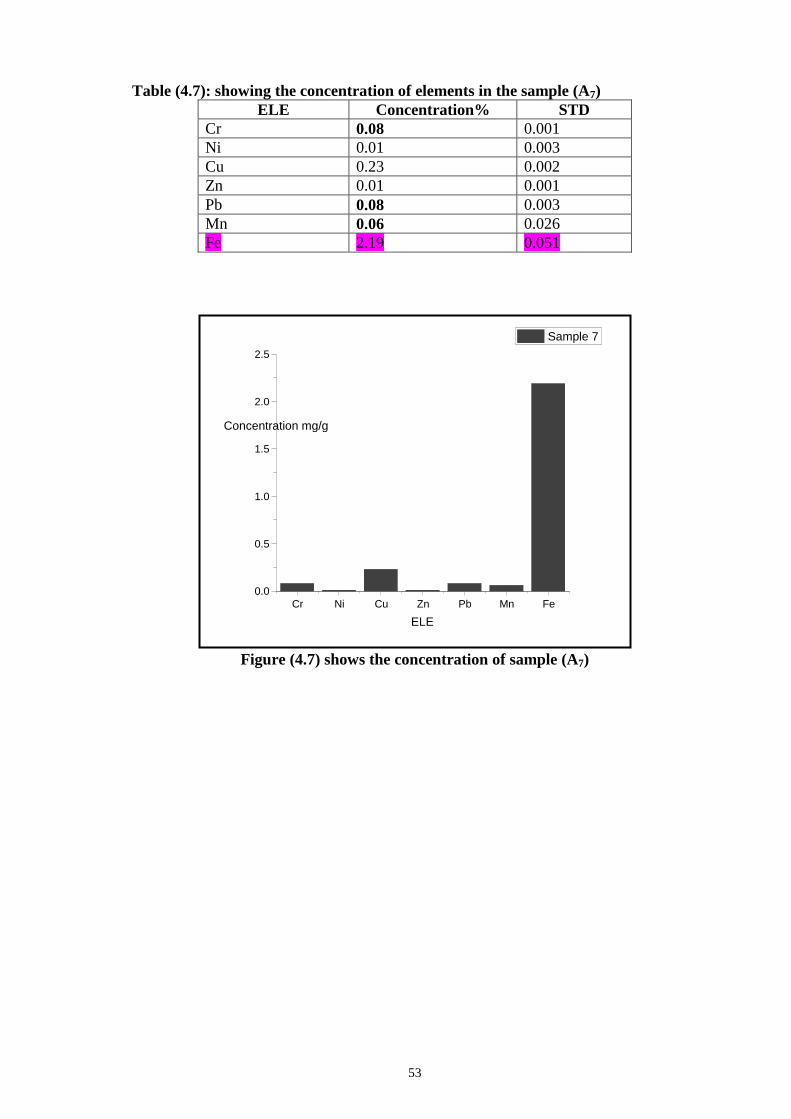
53
Table (4.7): showing the concentration of elements in the sample (A7)
ELE Concentration% STD
Cr 0.08 0.001
Ni 0.01 0.003
Cu 0.23 0.002
Zn 0.01 0.001
Pb 0.08 0.003
Mn 0.06 0.026
Fe 2.19 0.051
Figure (4.7) shows the concentration of sample (A7)
Cr Ni Cu Zn Pb Mn Fe 0.0
0.5
1.0
1.5
2.0
2.5
Concentration mg/g
ELE
Sample 7
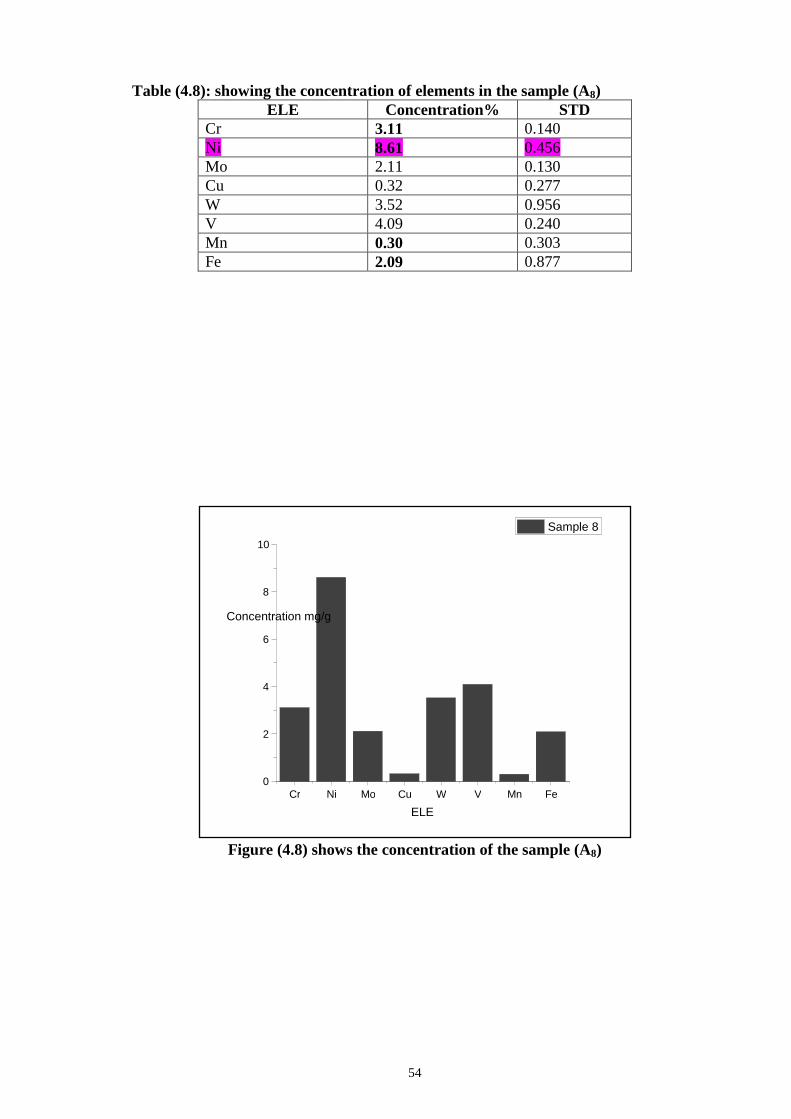
54
Table (4.8): showing the concentration of elements in the sample (A8)
ELE Concentration% STD
Cr 3.11 0.140
Ni 8.61 0.456
Mo 2.11 0.130
Cu 0.32 0.277
W 3.52 0.956
V 4.09 0.240
Mn 0.30 0.303
Fe 2.09 0.877
Figure (4.8) shows the concentration of the sample (A8)
Cr Ni Mo Cu W V Mn Fe 0
2
4
6
8
10
Concentration mg/g
ELE
Sample 8
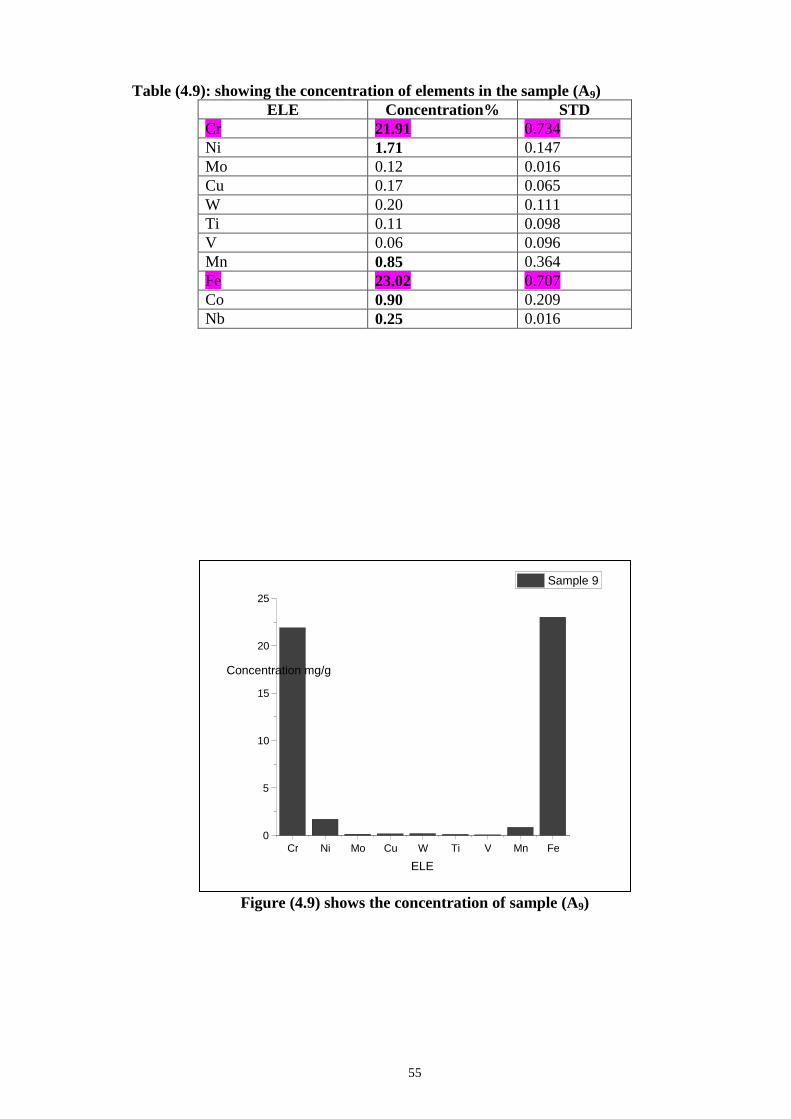
55
Table (4.9): showing the concentration of elements in the sample (A9)
ELE Concentration% STD
Cr 21.91 0.734
Ni 1.71 0.147
Mo 0.12 0.016
Cu 0.17 0.065
W 0.20 0.111
Ti 0.11 0.098
V 0.06 0.096
Mn 0.85 0.364
Fe 23.02 0.707
Co 0.90 0.209
Nb 0.25 0.016
Figure (4.9) shows the concentration of sample (A9)
Cr Ni Mo Cu W Ti V Mn Fe 0
5
10
15
20
25
Concentration mg/g
ELE
Sample 9
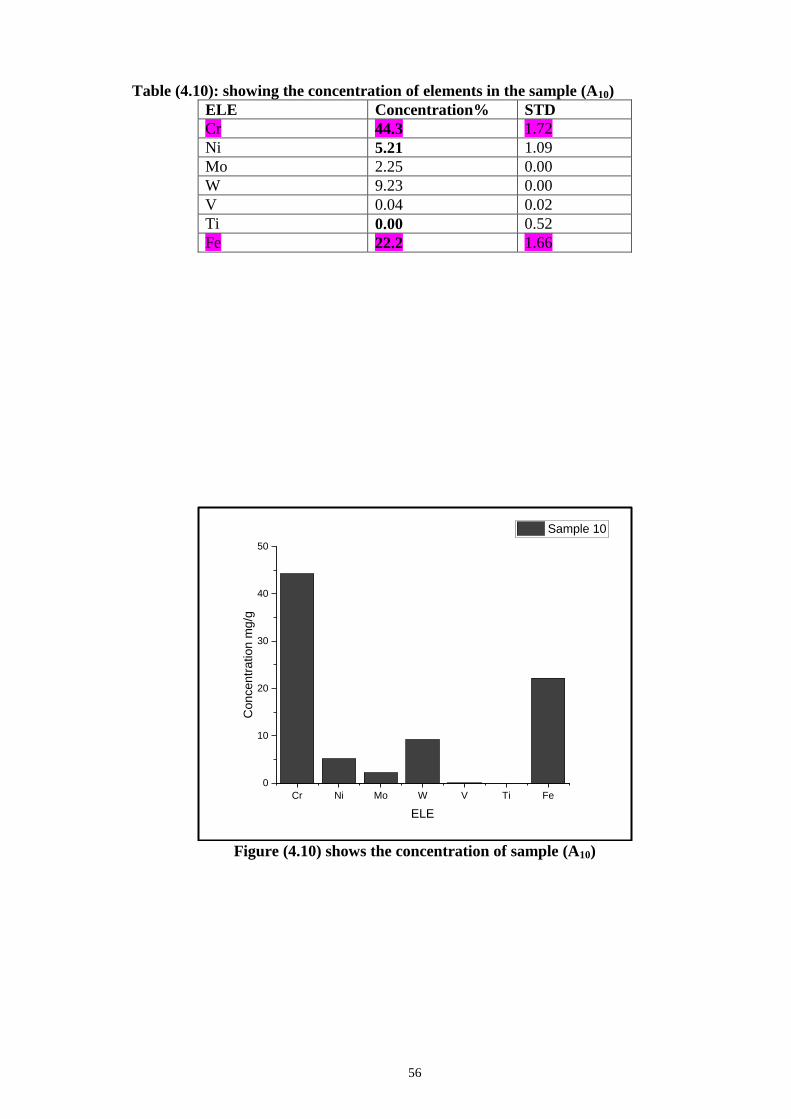
56
Table (4.10): showing the concentration of elements in the sample (A10)
ELE Concentration% STD
Cr 44.3 1.72
Ni 5.21 1.09
Mo 2.25 0.00
W 9.23 0.00
V 0.04 0.02
Ti 0.00 0.52
Fe 22.2 1.66
Figure (4.10) shows the concentration of sample (A10)
Cr Ni Mo W V Ti Fe
0
10
20
30
40
50
Co
ncen
tra
tion
mg
/g
ELE
Sample 10
57
4.3 Discussion:
In this work different samples were giving and all data for these samples are
listed in tables and plotted in figures, while for the samples results will be presents the
measured values of concentration element.
plant leaves samples (A1) collected from Zaklouna village in Abu Zabad city
were analyses by X-MET5000, was reported in table (4.1) and plotted in figure (4.1)
.Hence, the result of concentration of (Pb, Fe, Zn, Cr, Cu, Mn) was to be (Avg STD)
(1.25 0.002, 0.45 0.018, 0.43 0.002, 0.07 0.028, 0.01 , 0.00 0.018%)
respectively . Upper comparing the results, the concentration of (Pb, Fe and Zn) was
higher than other element; the reason could be referenced to geological setting. Sample
(A2) collected from Zaklouna Village in Abu Zabad City, was reported in table (4.2)
and plotted in figure (4.2) results the high concentration of (Fe,W) to be founded
(36.04 1.025, 10.16 1.405%) were the low concentration of (Cu, Mo, Mn, V, Ni,
Cr) were (5.17, 2.76, 1.12, 0.78, 0.21, 0.05 0.205, 0.136, 0.382, 0.2999, 0.509,
0.121%) respectively. For sample (A3) collected from north west of the Abu Zabad
station transmutation power electricityin Abu Zabad City, was reported in table (4.3)
and plotted in figure (4.3) shows the high concentration of (Cu, Fe, Ni) was to be (2.1
0.001, 1.63 0.042, 1.27 0.001 %), on the other hand the low concentrations of the
(Zn, Cr, Mn) were to be (0.23, 0.04, 0.00 0.002, 0.021, 0.013%) respectively. Father
more for sample (A4) collected from north west of the Abu Zabad station transmutation
power electricity in Abu Zabad City, was reported in table (4.4) and plotted in figure
(4.4) .Hence, the result of high concentration of (Fe, W and Mo) to be (12.37 1.#00,
8.62 1.#00, 1.70 1.#00%) respectively, and the low concentrations of the (V, Mn, Ni,
Cu, Cr) ( 0.93, 0.90, 0.59, 0.09, 0.00 1.#00, 1.#00, 1.#00, 1.#00, 1.#00, 1.#00%)
respectively. Sample (A5) collected from north west of the Abu Zabad station
transmutation power electricity in Abu Zabad City, was reported in table (4.5) and
plotted in figure (4.5) results the high concentration of (Fe ,Mo and W) to be founded
(9.37 0.887 ,4.13 1.122 ,4.03 1.027%) were the low concentration of (Mn, Cu, V,
Cr, Ni) were (1.66, 0.95, 0.80, 0.05, 0.02 0.378, 0.285, 0.300, 0.120, 0.385%)
respectively. For sample (A6) collected from Um drouta samples in Abu Zabad City,
was reported in table (4.6) and plotted in figure (4.6) were to be the high
concentration of (Fe, W) was (86.21 1.#00,12.83 1.#00%) and the low
concentration of (Mo, V, Mn, Cu, Cr, Ni) were (2.02, 1.22, 0.52, 0.32, 0.00, 0.00
1.#00, 1.#00, 1.#00, 1.#00, 1.#00, 1.#00%) respectively. On the other had the sample
58
(A7) collected from Um drouta samples in Abu Zabad City, was reported in table (4.7)
and plotted in figure (4.7) were results the high concentration of (Fe) to be founded
(2.19 0.051%) were the low concentration of (Cu, Pb, Cr, Mn, Ni, Zn) were (0.23,
0.08, 0.08, 0.06, 0.01, 0.01 0.002, 0.003, 0.001, 0.026, 0.003, 0.001%) respectively.
Sample (A8) collected from Um drouta samples in Abu Zabad City, was reported in
table (4.8) and plotted in figure (4.8) results the high concentration of (Ni) to be
founded (8.61 0.456%) were the low concentration of (V, W, Cr, Mo, Fe, Cu, Mn)
were (4.09, 3.52, 3.11, 2.11, 2.09, 0.32, 0.30 0.240, 0.956, 0.140, 0.130, 0.877,
0.277, 0.303%) respectively, sample (A9) collected from Um drouta samples in Abu
Zabad City, was reported in table (4.9) and plotted in figure (4.9) results the high
concentration of (Fe, Cr) to be founded (23.02 0.707, 21.91 0.734%) were the low
concentration of (Ni, Co, Mn, Nb, W, Cu, Mo, Ti, V) were (1.71, 0.90, 0.85, 0.25, 0.20,
0.17, 0.12, 0.11, 0.06 0.147, 0.209, 0.364, 0.016, 0.111, 0.065, 0.016, 0.098, 0.096%)
respectively. And sample (A10) collected from Um drouta samples in Abu Zabad City,
was reported in table (4.10) and plotted in figure (4.10) results the high concentration
of (Cr, Fe) to be founded (44.3 1.72, 22.2 1.66%) were the low concentration of
(W, Ni, Mo, V, Ti) were (9.23, 5.21, 2.25, 0.04, 0.00 0.00, 1.09, 0.00, 0.02, 0.52%)
respectively.
The results reported there are varieties in concentration of element from sample to
sample, this is attributed to the types of plants cultivated in those orchards, the
geological nature of the region.
59
CHAPTER FIVE
CONCLUSIONS AND RECOMMENDATION
5.1 Conclusion
This study can do for elements in (Zaklouna, northwest of the Abu Zabad station
transmutation power electricity and Um drouta ) in Abu Zabad City, West Kordofan.
Devices as X MET 5000 which work on the principle of small and easy to use
and metallic items appear in a single measurement. Three different groups of Ghubaish
were analyzed according to regions (Zaklouna - north west of the Abu Zabad station
transmutation power electricity - Um drouta ) were (A1, A2 – A3, A4, A5 – A6, A7, A8,
A9, A10) respectively, were analyzed using x- ray fluorescence. The comparison was
done between these samples, a greet differences were found between this samples.
This great variation in the concentration of the studied elements (Fe, W, Cr,
Ni, Cu, Zn, Pb, Mn, Mo, V, Ti, Co, Nb) in the study areas. the highest concentration
was that of iron (Fe). It ranges between (0.45 mg/g ± 0.018%) in Zaklouna and (86.21
mg/g ± 1. #00%) in Um drouta, depending on the nature of the geographical location
and the human activities spread throughout the study area. While there was no
concentration recorded for the elements in six samples in three areas studied there
elements was (Pb, Zn, Ti, Co, Nb). In there are other four samples studied areas, the
highest concentration was that of lead (Pb) Which ranges between (1.25 mg/g ±
0.002%) in Zaklouna and (0.08 mg/g ± 0.003%) in Um drouta, And the concentration of
Zinc (Zn) ranged between (0.43 mg/g ± 0.002%) in Zaklouna and (0.01 mg/g ± 0.001%)
in Um drouta, The concentration of Titanium (Ti) was (0.11 mg/g ± 0.098%), and that
of Cobalt (Co) was (0.90 mg/g ± 0.209%), and that of Niobium (Nb) was (0.25 mg/g ±
0.016%), The confirms that the plant has any degree of toxicity and it is Safe to be used
medicinally
60
5.2 Recommendation
The study recommended examining the concentration of elements in the
Ghubaysh plant by using different methods of spectrophotometry using other X-ray
devices that read a greater number of elements.
Based on the results obtained in this study, the study recommended that samples be
evaluated and measured at the study site by means of more X-ray line force detection
and spectrophotometers. Use X MET 5000 on other plants in this area to confirm the
concentrations of these elements. With a variety of sample selection methods.
61
References:
Abubakar, M.S, Sule M.I, Pateh U.U, Abdurahman E.M, Haruna A.K and
Jahun B.M(2000): In vitro snake venom detoxifying action of the leaf extract of
Guiera senegalensis.. Ethnopharmacol; 63(3): 253-257.
Agency for Toxic Substances and Disease Registry (ATSDR). (2005)
―Toxicological Profile for Tungsten.‖ www.atsdr.cdc.gov/toxprofiles/tp186.pdf
Alshafei1 Kamal Nabaa, Ahmed Mohamed Shadia and Nour Abdelfattah
(2016): Preliminary Observations on the Uses of Guiera International Journal of
Applied and Pure Science and Agriculture (IJAPSA) Senegalensis as a Traditional
Medicinal Plants in Western Kordufan, Sudan, 02(05).
Audi, G., Bersillon, O., Blachot, J., and A.H. Wapstra. (2003). ―The NUBASE
evaluation of nuclear and decay properties.‖ Nuclear Physics. A (729): 3-128.
B.D. Cullity S.R. Stock,(2014) Elements of X-Ray Diffraction ,Third Edition, ©
Pearson Education Limited , Printed in the United States of America, ISBN 10: 1-
292-04054-8.
Bcrnhard We1z and Michael Spcrling, (2005) Atomic Absorption Spectrometry
Third, Completely Revised Edition
C.P.Gupta,(2014) Role of Iron (Fe) in Body. IOSR Journal of Applied Chemistry
(IOSR-JACe-ISSN: 2278-5736. 7(11): 38-46.
CRCE, PHE ,(2009) Nickel General Information, Prepared by the Toxicology
Department ,public health England , Version 1.
El-Gazali GEB, El-Tohami MS, El-Egami AAB (1994): Medicinal Plants of the
Sudan: Medicinal Plants of the White Nile Province. Medicinal and Aromatic Plant
Research Institute, Khartoum Sudan.
Eric Lifshin , (Oct 1999), X-ray characterization of materials, WILEY-VCH Verlag
GmbH, D-69469 Weinheim Federal Republic of Germany, ISBN 3-527- 29657-3.
Frieder Johannes Koch (2017) X-ray optics made by X-ray lithography, KIT
Scientific Publishing is a registered trademark of Karlsruhe Institute of
Technology.,ISSN 1869-5183.
Frieder Johannes Koch (2017) X-ray optics made by X-ray lithography, KIT
Scientific Publishing is a registered trademark of Karlsruhe Institute of
Technology.,ISSN 1869-5183.
G. Gauglitz, T. Vo-Dinh, (Eds.), Wiley-VCH, (2003), Handbook of Spectroscopy‖
ISBN 3-527-29782-0, 1000 pp. and partly on Chapter 4 of "Non-destructive
62
Microanalysis of Cultural Heritage Materials", Koen H.A Janssens. R.E. Van
Grieken (Eds.), Elsevier, Amsterdam, The Netherlands, 2004 - 800 p. - ISBN 0-444-
50738-8.
G.V. Samsonov, ed. (2015). "Mechanical Properties of the Elements". Handbook of
the physicochemical properties of the elements. New York, USA: IFI-Plenum.
pp. 387–446. doi:10.1007/978-1-4684-6066-7_7. ISBN 978-1-4684-6066-7.
Archived from the original on 2 April 2015
Glascock, etal., (1998), A systematic approach to obsidian source characterization.
In M.S. Shackley (Ed.), Archaeological obsidian studies: method and theory, (15–
66). Advances in archaeological and museum studies 3. New York: Springer/
Plenum Press.
Greaney ,k.M.(2005). An assessment of heavy metal conaimination in the marine
sediments of las perlas archipelago ,golf of Panama .school of life science Heriot –
watt university ,edinburg: 60-63
Ismail Hasabalrasoul.(2019). Using X-ray Spectrometer (XMET5000) to Identify
Blood Species. University of Al-butan
Hassan Reem, Barakat Edress Tayseer, ELnour Omer Rehab, Hassb Elrasoul
Hanaa (2019): Potential Anti-pyretic Activity of Guiera senegalensis Leaves, Vol.
2 No. 1: Journal of Advanced Research in Pharmaceutical Sciences and
Pharmacology Interventions.
Hill AF (1952): Economic Botany. A textbook of useful plants and plant products.
New York: McGraw-Hill Book Company Inc.
Julien Fiot, Souleymane Sanon, Nadine Azas, Val´erie Mahioua, Olivia Jansen,
Luc Angenot, Guy Balansard, Evelyne Ollivier (2006): Phytochemical and
pharmacological study of roots and leaves of Guiera senegalensis J.F. Gmel
(Combretaceae) , © 2006 Elsevier Ireland Ltd, Journal of Ethnopharmacology 106
(2006) 173–178.
Kabata ,A and Pendias ,H. (2000) .Trace elements in soils and plants printed in the
Koumaré M (1986): Contribution à l’étude pharmacologique du Guiera
senegalensis Lam, Combretaceae. Thèse de Doctorat en pharmacie, Toulouse –
France.
Koutsospyros, A., Braida, W., Christodoulatos, C., Dermatas, D., and N.
Strigul. (2006). ―A Review of Tungsten: From Environmental Obscurity to
Scrutiny.‖ Journal of Hazardous Materials. 136: 1-19.
63
Laura M. Plum, Lothar Rink and Hajo Haase ,(2010) The Essential Toxin:
Impact of Zinc on Human Health, Int. J. Environ. Res. Public Health 2010, 7, 1342-
1365; doi:10.3390/ijerph7041342, ISSN 1660-4601 www.mdpi.com/journal/ijerph .
Lundblad, S. P., Mills, P. R., & Hon, K. (2008). Analyzing archaeological basalt
using nondestructive energy-dispersive X-ray fluorescence (EDXRF): Effects of
post-depositional chemical weathering and sample size on analytical precision.
Archaeometry, 50, 1–11.
Manju Mahurpawar (2015) EFFECTS OF HEAVY METALS ON HUMAN
HEALTH , Http://www.granthaalayah.com ©International Journal of Research
GRANTHAALAYAH. ISSN- 2350-0530(O) ISSN- 2394-3629(P).
Manju Mahurpawar (2015) EFFECTS OF HEAVY METALS ON HUMAN
HEALTH , Http://www.granthaalayah.com ©International Journal of Research
GRANTHAALAYAH. ISSN- 2350-0530(O) ISSN- 2394-3629(P).
Mark Ladd • Rex Palmer (2013) Structure Determination by X-ray
Crystallography, Fifth Edition, # Springer Science+Business Media New York
,ISBN 978-1-4614-3956-1.
Mark Ladd • Rex Palmer (2013) Structure Determination by X-ray
Crystallography, Fifth Edition, # Springer Science+Business Media New York
,ISBN 978-1-4614-3956-1.
Mitroff, Sarah (2012). "Tribogenics' Incredible Shrinking X-Ray
Machines". Wired Business. Retrieved 2 February 2012, US.
Moore, D. P., Mechanisms of micronutrient uptake by plants, in Micronutrients in
Agriculture, Mortvedt, J. J., Giordano, P. M., and Lindsay, W. L., Eds., Soil Science
Society of America, Madison,
Mounib (2018): Heavy Element Nucleosynthesis EPJ Web of Conferences 184,
01007 (2018)
Moussa Bounakhla & Mounia Tahri (2008) X-Ray Fluorescence Analytical
Techniques.
MoussaBounakhla&MouniaTahri (2000), Handbook of X-Ray Fluorescence
Analytical Techniques.
National Institute of Health (2016) ZINC FACT SHEET FOR CONSUMERS,
For more information on this and other supplements, please visit our Web site
at: http://ods.od.nih.gov or e-mail us at [email protected] ,Updated: February 17,
2016
64
National Technical Information Service (NTIS): (2005). 5285 Port Royal Road
Springfield, VA 22161 Phone: 1-800-553-6847 or 1-703-605-6000 Web site:
http://www.ntis.gov/.
Negash, A. and Shackley, M.S., (2006),Geochemical provenance of obsidian
artefacts from the MSA site of Porc Epic, Ethiopia. Archaeometry 48, 1–12.
Negash, A., Shackley, M.S. and Alene, M., (2006), Source provenance of obsidian
artifacts from the Early Stone Age (ESA) site of MelkaKonture, Ethiopia. Journal of
Archaeological Science 33, 1647–1650.
NIOSH. (2016). NIOSH Pocket Guide to Chemical Hazards:
Tungsten.www.cdc.gov/niosh/npg/npgd0645.html
Oxford Instruments Analytical Ltd, (2008). All rights reserved. www.oxford-
instruments.com.
Oxford Instruments Analytical Ltd, (2009). All rights reserved. www.oxford-
instruments.com.
Oxford X-MET5000 XRF.Copyright © ONIH 2019.
PECHOVA, L. PAVLATA(2007) Chromium as an essential nutrient: a review,
Veterinarni Medicina, 52, 2007 (1): 1–18.
Reinhold Schlotz , Stefan Uhlig (2006), Introduction to X-Ray Fluorescence
(XRF),This guide was first published in West Germany,Bruker AXS GmbH
Roobottom C.A, Mitchell G, Morgan-Hughes G (2010). "Radiation-reduction
strategies in cardiac computed tomographic angiography". ClinRadiol 65 (11):
Silva O, Serrano R, Gomes ET (2008): Botanical characterization of Guiera
senegalensis leaves. Microscopy and Microanalysis. Official journal of microscopy
society of America; 14(5):398-404.
Sule MS, Mohammed SY (2006): Toxicological studies on the leaves of Guiera
senegalensis and Psidium guajava in rats. Biol Environ Sci J Trop 3: 81-83.
Timna-Josua Kühn (2011) Characterization of metallic nanoparticles by high-
resolution X-ray absorption and X-ray emission spectroscopy.
United States 83-15083:60-75.
WHO Regional Office for Europe, Copenhagen, Denmark, (2001),chapter 7. Air
Quality Guidelines - Second Edition.
WHO Regional Office for Europe, Copenhagen, Denmark,( 2001) Air Quality
Guidelines - Second Edition
WI, 1972, 17.
65
World Health Organization ( 2003)Iron in Drinking-water, 2nd ed. Vol. 2. Health
criteria and other supporting information. World Health Organization,
Yoshio Waseda , Eiichiro Matsubara,Kozo Shinoda (2011)X-Ray Diffraction
Crystallography. c Springer-Verlag Berlin Heidelberg, ISBN 978-3-642-16634-1.
Zakawa N. N, Akesa T. M., Timon D., Yusuf C. S., Magga B. and Jacob G. F
(2018): ETHNOBOTANICAL SURVEY AND PHYTOCHEMICAL STUDIES OF
GUIERA SENEGALENSIS LAM. IN MUBI LOCAL GOVERNMENT OF
ADAMAWA STATE, World Journal of Pharmaceutical Research, Vol 7, Issue 14,
2018, www.wjpr.net.
Related Documents