On behalf of Defence Infrastructure Organisation Project Ref: 40608/5503 | Rev: - | Date: June 2018 Office Address: Waterloo House, Victoria Square, Birmingham B2 5TB T: +44 (0)121 633 2900 E: [email protected] RAF Halton Transport & Movement

Welcome message from author
This document is posted to help you gain knowledge. Please leave a comment to let me know what you think about it! Share it to your friends and learn new things together.
Transcript

On behalf of Defence Infrastructure Organisation
Project Ref: 40608/5503 | Rev: - | Date: June 2018
Office Address: Waterloo House, Victoria Square, Birmingham B2 5TB T: +44 (0)121 633 2900 E: [email protected]
RAF Halton Transport & Movement
Transport & Movement
RAF Halton
\\pba.int\bir\Projects\40608 - RAF Halton, Buckinghamshire\Reports\Transport\Updated\40608 RAF Halton -Transport & Movement June 2018 issue.docx
ii
Document Control Sheet
Project Name: RAF Halton
Project Ref: 40608/5503
Report Title: Transport & Movement
Doc Ref: 001
Date: June 2018
Name Position Signature Date
Prepared by: Olivia Thomas Apprentice
Transport Planner June 2018
Reviewed by: Marc Rennie Associate June 2018
Approved by: Daniel Griffiths Senior Associate June 2018
For and on behalf of Peter Brett Associates LLP
Revision Date Description Prepared Reviewed Approved
This report has been prepared by Peter Brett Associates LLP (‘PBA’) on behalf of its client to whom this report is addressed (‘Client’) in connection with the project described in this report and takes into account the Client's particular instructions and requirements. This report was prepared in accordance with the professional services appointment under which PBA was appointed by its Client. This report is not intended for and should not be relied on by any third party (i.e. parties other than the Client). PBA accepts no duty or responsibility (including in negligence) to any party other than the Client and disclaims all liability of any nature whatsoever to any such party in respect of this report.
© Peter Brett Associates LLP 2018
Transport & Movement
RAF Halton
\\pba.int\bir\Projects\40608 - RAF Halton, Buckinghamshire\Reports\Transport\Updated\40608 RAF Halton -Transport & Movement June 2018 issue.docx
iii
Contents
1 Introduction ................................................................................................................................. 1
Background ................................................................................................................... 1
RAF Halton .................................................................................................................... 1
Purpose of this report .................................................................................................... 2
Structure of this report ................................................................................................... 3
2 Site context .................................................................................................................................. 4
Introduction .................................................................................................................... 4
Site location ................................................................................................................... 4
Site population ............................................................................................................... 4
Site arrival and departure profiles ................................................................................. 4
3 Local transport network ............................................................................................................. 6
Introduction .................................................................................................................... 6
Road network ................................................................................................................ 6
Pedestrian and cycle network ....................................................................................... 7
Public transport provision .............................................................................................. 7
Road safety review ........................................................................................................ 8
Summary ..................................................................................................................... 10
4 Development opportunity ......................................................................................................... 11
Introduction .................................................................................................................. 11
Development concept .................................................................................................. 11
Access and connectivity to sustainable transport provision ........................................ 11
Trip generation ............................................................................................................ 12
5 Future considerations............................................................................................................... 14
Introduction .................................................................................................................. 14
Scoping the Transport Assessment ............................................................................ 14
Modelling ..................................................................................................................... 14
The Aylesbury Model ................................................................................................... 15
Oxford to Cambridge Expressway ............................................................................... 15
6 Impacts from surrounding developments .............................................................................. 18
Introduction .................................................................................................................. 18
Hampden Fields .......................................................................................................... 18
Woodlands ................................................................................................................... 19
Land at Aston Clinton Road ........................................................................................ 22
7 Summary and conclusion ........................................................................................................ 24
Summary ..................................................................................................................... 24
Conclusion ................................................................................................................... 25
Transport & Movement
RAF Halton
\\pba.int\bir\Projects\40608 - RAF Halton, Buckinghamshire\Reports\Transport\Updated\40608 RAF Halton -Transport & Movement June 2018 issue.docx
iv
Figures
Figure 3.4: PIC Data ................................................................................................................................ 9
Figure 5.1 – Existing strategic road and rail routes (Source: Oxford to Cambridge Expressway Strategic Study Stage 3 Report) ............................................................................................................ 16
Figure 5.2 – Short Listed Expressway Options (Source: Oxford to Cambridge Expressway Strategic Study Stage 3 Report) ........................................................................................................................... 17
Figure 6.1 -Surrounding developments ................................................................................................. 18
Tables
Table 2.1: RAF Halton population ........................................................................................................... 5
Table 4.1: Potential vehicle trip rates (mixed private/affordable housing) ............................................ 13
Table 4.2: Potential vehicle trip generation of residential development ................................................ 13
Appendices
Appendix A Figures
Appendix B Highway authority correspondence
Appendix C TRICS output

Transport & Movement
RAF Halton
\\pba.int\bir\Projects\40608 - RAF Halton, Buckinghamshire\Reports\Transport\Updated\40608 RAF Halton -Transport & Movement June 2018 issue.docx
v
Transport & Movement
RAF Halton
\\pba.int\bir\Projects\40608 - RAF Halton, Buckinghamshire\Reports\Transport\Updated\40608 RAF Halton -Transport & Movement June 2018 issue.docx
1
1 Introduction
Background
1.1.1 The Defence Infrastructure Organisation (DIO) is part of the Ministry of Defence (MOD), building, maintaining and servicing the infrastructure needed to support defence.
1.1.2 The DIO is responsible for enabling defence people to live, work, train and deploy at home and overseas and the vision for the DIO is to equip defence with a significantly smaller, more efficient, better quality estate.
1.1.3 A better defence estate for the Royal Air Force (RAF) is described in the MOD publication A Better Defence Estate. The RAF element of the Strategy is designed to deliver on the Strategic Defence and Security Review 2015 intent to rationalise the Air estate. In particular, the MOD is working to create greater harmony for the Whole Force through estate optimisation, in the long term, and increase opportunities for continuity in employment and domestic arrangements for families of Service Personnel.
1.1.4 The current planning intent for disposal changes to the future RAF basing laydown includes the proposed disposal of RAF Halton (the site), which has a disposal date of 2022.
1.1.5 As part of the disposal process, the DIO (as the legal landowner) is seeking to promote the allocation of RAF Halton (Site Ref: HAL003 of the Local Plan) as a strategic housing-led mixed used allocation in the emerging Vale of Aylesbury Local Plan.
RAF Halton
Background
1.2.1 RAF Halton was identified for closure on 7th November 2016 as part of the Ministry of Defence (‘MOD’) and DIO ‘A Better Defence Estate’ programme. The programme sets out plans to achieve a more efficient, modern and capability focused defence estate. The document established that those sites released from operational requirements should deliver 55,000 homes as part of the Government’s wider housing policy. The document identifies that the disposal date for RAF Halton is 2022 and the site will be available for development from then on.
1.2.2 RAF Halton has an important role to play in delivering the Government’s surplus housing land agenda and making more land available for homes in the right places. At RAF Halton the Government is seeking to maximise the contribution from brownfield and surplus public land. The site has a critical role in delivering the wider DIO’s estate optimisation programme.
1.2.3 Moreover, RAF Halton sits within the Cambridge – Milton Keynes – Oxford corridor. The National Infrastructure Commission has published a report entitled ‘Partnering for Prosperity: A new deal for the Cambridge-Milton Keynes-Oxford Arc’. The Commission identifies opportunities to create well-designed, well-connected new communities and deliver one million new homes and jobs in the area by 2050.
1.2.4 RAF Halton is situated within the administrative boundary of Aylesbury Vale District Council. In January 2017, Aylesbury was awarded ‘Garden Town’ status. Garden Town status provides the opportunity to develop Aylesbury and the surrounding area in a sustainable manner. A long term masterplan for the town will be developed looking at improving transport links and green infrastructure.
Transport & Movement
RAF Halton
\\pba.int\bir\Projects\40608 - RAF Halton, Buckinghamshire\Reports\Transport\Updated\40608 RAF Halton -Transport & Movement June 2018 issue.docx
2
Development opportunity
1.2.5 The 82ha site of RAF Halton (site allocation HAL003) is allocated for around1,000 homes during the Plan period and associated infrastructure, services and facilities including a primary school, new local centre, new access routes if needed and new green infrastructure.
1.2.6 In addition, the proposals should comply with the following criteria:
a. Provision of land for 1,000 dwellings during this plan period at a density that takes account of the existing curtilage of the buildings on the site, and that of the adjacent settlement character and identity if appropriate.
b. Be planned using a landscape-led approach, taking account of the character and setting of the Chilterns AONB
c. Provision of junction improvements onto the B4009 Upper Icknield Way
d. Provision for public transport into Wendover and to surrounding areas
e. Establishment of and safeguarding for a network of cycling and walking links
f. Provision of green infrastructure to link to other new development areas and the wider countryside
g. Provision of land, buildings and car parking for a combined primary school including playing field provision
h. Provision of land, buildings and car parking for a new local centre including community hall.
1.2.7 It is important to note that the transport evidence base (in the form of the Buckinghamshire Countywide Model) produced by Jacobs, on behalf of AVDC, is considered sufficient for the Local Plan Examination and has the support of Buckinghamshire County council, as highway authority (see Appendix B). Therefore, the principle of providing 1,000 dwellings on the site is established.
1.2.8 A masterplan Supplementary Planning Document (‘SPD’) will be produced for the allocation site. The redevelopment of RAF Halton will have regard to and be accordance with this masterplan SPD and the policies for the delivery of Aylesbury Garden Town.
1.2.9 It is recognised that further refinement to the Model will be required as the site is taken forward as a SPD in continued partnership with the highway authority.
Purpose of this report
1.3.1 A Consultant Team has been commissioned by DIO to produce an evidence base and masterplan to support and underpin the site allocation (D-HAL003) within the Proposed Submission Vale of Aylesbury Local Plan 2013-2033 (‘VALP’). Through this process, DIO and the principal consultant team have engaged with officers of Aylesbury Vale District Council, Buckinghamshire County Council (as highway authority) and other statutory consultees.
1.3.2 Peter Brett Associates LLP (PBA), has been appointed to provide this report on Transport & Movement in support of the sites allocation in the emerging Vale of Aylesbury Local Plan and with due consideration of national and local planning policy.
Transport & Movement
RAF Halton
\\pba.int\bir\Projects\40608 - RAF Halton, Buckinghamshire\Reports\Transport\Updated\40608 RAF Halton -Transport & Movement June 2018 issue.docx
3
Structure of this report
1.4.1 This report is structured as follows:
� Section 2 describes the location of RAF Halton, the population of the Station and their typical arrival departure profile.
� Section 3 describes the local road network and the available pedestrian, cycle, bus and rail provision in the vicinity of the site. This section also presents a review of road safety at the London Road/Tring Hill/Upper Icknield Way Junction and on Upper Icknield Way (B4009), between London Road and Chestnut Avenue.
� Section 4 describes the concept for development of the site, the opportunities for accessing the site and improving connectivity to sustainable transport provision and the potential vehicle trip generation of the site
� Section 5 highlights specific transport requirements that will need to be considered when taking the site forward for development.
� Section 6 provides information that is available regarding the surrounding development sites in Aylesbury and their potential impact on the local road network.
� Section 7 summaries this report and draws relevant conclusions.
Transport & Movement
RAF Halton
\\pba.int\bir\Projects\40608 - RAF Halton, Buckinghamshire\Reports\Transport\Updated\40608 RAF Halton -Transport & Movement June 2018 issue.docx
4
2 Site context
Introduction
2.1.1 This section describes the location of RAF Halton, the population of the Station and their typical arrival departure profile.
Site location
2.2.1 Situated approximately 7km to the southwest of Aylesbury and 2.5km northeast of Wendover, the site covers an area of approximately 205.5ha and, inter alia, comprises the airfield, a mix of buildings, landscaped areas and woodlands and the Grade II* listed Halton House and grounds.
Site population
2.3.1 RAF Halton is a station of No 22 (Training) Group and part of the Directorate of Recruitment and Initial Training.
2.3.2 The primary role of the Station is to contribute to the operational effectiveness of the Armed Forces by the timely provision of trained military and civilian personnel to the correct standard and within resource.
2.3.3 RAF Halton also has several lodger units covering specialities ranging from air activity to defence media operations. As such, RAF Halton is home to personnel from all three Services, foreign military, contractors and civilians.
Site arrival and departure profiles
Military
2.4.1 Recruit Training Squadron (RTS) recruits follow a course of 10 weeks and live on site. Car ownership whilst on RTS training is low.
2.4.2 Airmens Command Squadron (ACS) and Specialist Training Squadron (STS) courses are estimated to have a higher level of car ownership.
2.4.3 The majority of military staff work five days per week and RTS staff are required to work weekends and extended weeks during periods of their course.
Civilians
2.4.4 The majority of civilians work five days per week between the hours of 9am and 5pm.
2.4.5 SERCO staff, comprising 97 of the 395 civilians employed at the Station, work the following standard hours:
� Monday to Thursday (8am-5pm); and
� Friday (8am-4pm).
2.4.6 Sodexo catering staff, comprising 144 of the 395 civilians employed at the Station, are required to maintain mess functions over the weekend.
Transport & Movement
RAF Halton
\\pba.int\bir\Projects\40608 - RAF Halton, Buckinghamshire\Reports\Transport\Updated\40608 RAF Halton -Transport & Movement June 2018 issue.docx
5
Summary
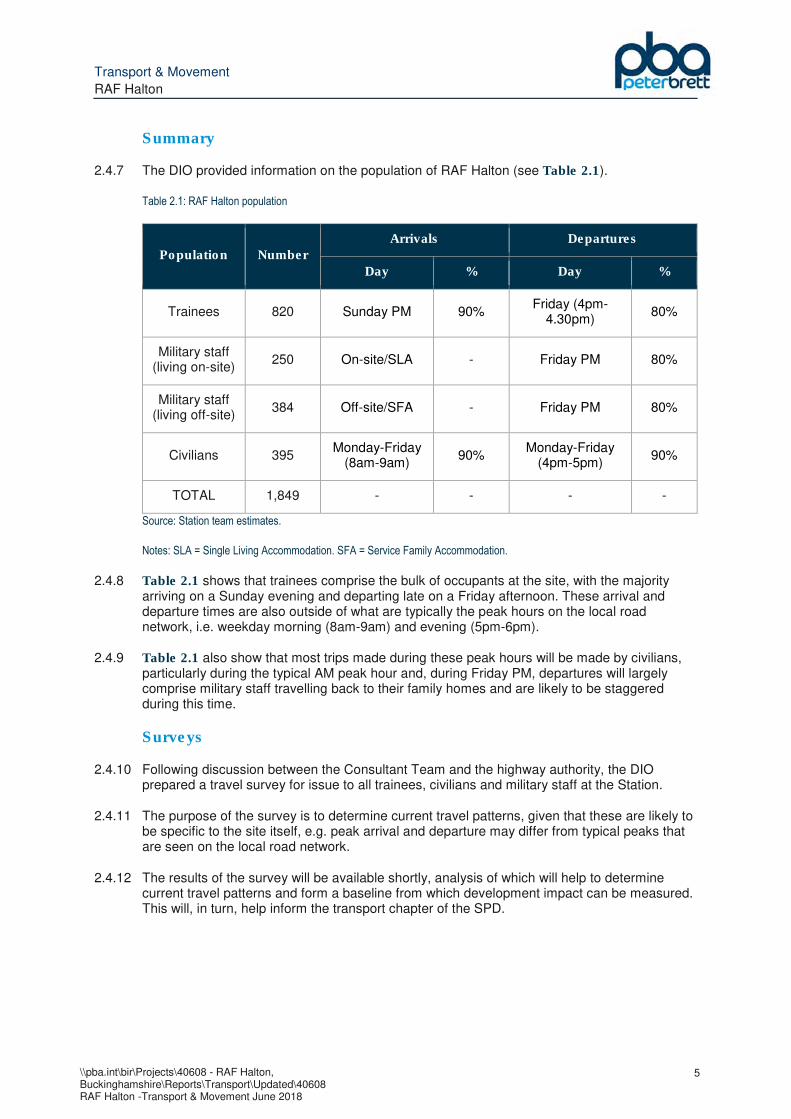
2.4.7 The DIO provided information on the population of RAF Halton (see Table 2.1).
Table 2.1: RAF Halton population
Population Number
Arrivals Departures
Day % Day %
Trainees 820 Sunday PM 90% Friday (4pm-
4.30pm) 80%
Military staff (living on-site)
250 On-site/SLA - Friday PM 80%
Military staff (living off-site)
384 Off-site/SFA - Friday PM 80%
Civilians 395 Monday-Friday
(8am-9am) 90%
Monday-Friday (4pm-5pm)
90%
TOTAL 1,849 - - - -
Source: Station team estimates.
Notes: SLA = Single Living Accommodation. SFA = Service Family Accommodation.
2.4.8 Table 2.1 shows that trainees comprise the bulk of occupants at the site, with the majority arriving on a Sunday evening and departing late on a Friday afternoon. These arrival and departure times are also outside of what are typically the peak hours on the local road network, i.e. weekday morning (8am-9am) and evening (5pm-6pm).
2.4.9 Table 2.1 also show that most trips made during these peak hours will be made by civilians, particularly during the typical AM peak hour and, during Friday PM, departures will largely comprise military staff travelling back to their family homes and are likely to be staggered during this time.
Surveys
2.4.10 Following discussion between the Consultant Team and the highway authority, the DIO prepared a travel survey for issue to all trainees, civilians and military staff at the Station.
2.4.11 The purpose of the survey is to determine current travel patterns, given that these are likely to be specific to the site itself, e.g. peak arrival and departure may differ from typical peaks that are seen on the local road network.
2.4.12 The results of the survey will be available shortly, analysis of which will help to determine current travel patterns and form a baseline from which development impact can be measured. This will, in turn, help inform the transport chapter of the SPD.
Transport & Movement
RAF Halton
\\pba.int\bir\Projects\40608 - RAF Halton, Buckinghamshire\Reports\Transport\Updated\40608 RAF Halton -Transport & Movement June 2018 issue.docx
6
3 Local transport network
Introduction
3.1.1 This section describes the local road network and the available pedestrian, cycle, bus and rail provision in the vicinity of the site. This section also presents a review of road safety at the London Road/Tring Hill/Upper Icknield Way Junction and on Upper Icknield Way (B4009), between London Road and Chestnut Avenue.
Road network
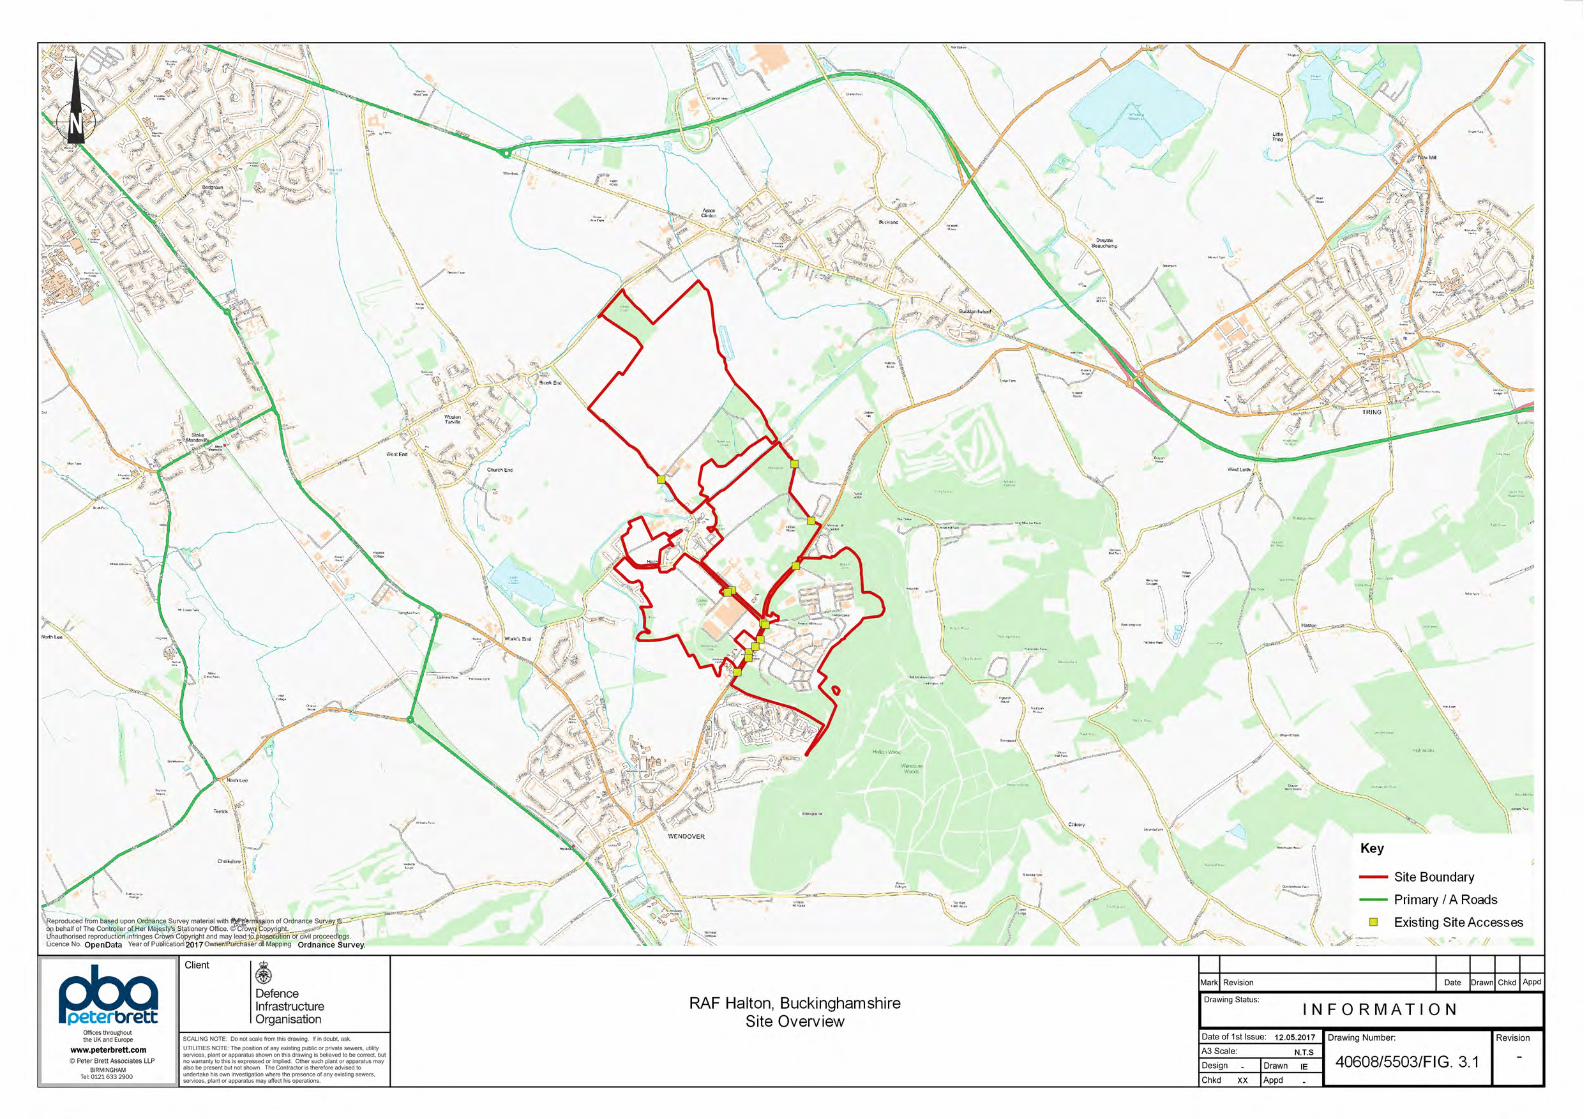
3.2.1 The site lies to the south of the A41 and to the north of the A413 (see Figure 3.1). The A41 facilitates travel to Aylesbury in the northbound direction and London and associated destinations in the southbound direction. The A41 meets the M25 London Orbital Motorway at Junction 20, approximately 25km from the site.
3.2.2 The A413 also connects to Aylesbury in the northbound direction through to Amersham and High Wycombe in the southbound direction. The A413 also facilitates access to the M40 which serves travel to Oxford, Banbury and Birmingham to the north, and London to the south.
3.2.3 The site is currently accessed via a number of locations off the B4009 and Chestnut Avenue within a central access corridor.
3.2.4 Upper Icknield Way (B4009) and Chestnut Avenue both bisect the site at a staggered junction and are the connecting roads to the majority of the sites accesses. Both are single carriageway roads that are subject to 30mph speed limits and with carriageway widths of approximately 6.5m.
3.2.5 Following discussions with the highway authority, the following surveys have been commissioned:
� Parking accumulation surveys at the town centre and Wendover rail station car parks: undertaken over the two consecutive days of the MCC surveys between the hours of 6am-7pm.
� Automatic traffic counts (ATC): undertaken over a 7 day, 24hour period with mid-week check from Monday 25 June-Sunday 1 July at the following locations:
- Halton Village.
- Halton Lane.
- Chestnut Avenue.
- Upper Icknield Way (B4009).
- Aylesbury Road (B4009).
- High Street, Wendover.
� Manual classified counts (MCC) and queue lengths: undertaken on Wednesday 27 and Thursday 28 June 2018 between the hours of 7am-10am and 4pm-7pm at the following locations:
- Tring Hill/A41.
Transport & Movement
RAF Halton
\\pba.int\bir\Projects\40608 - RAF Halton, Buckinghamshire\Reports\Transport\Updated\40608 RAF Halton -Transport & Movement June 2018 issue.docx
7
- Tring Hill/Upper Icknield Way.
- Upper Icknield Way/Chestnut Avenue.
- 2 x B4009/Tring Road roundabouts.
- Tring Road/Manor Road.
- Tring Road/Aylesbury Road/High Street.
- London Road/A413.
- Pound Street/South Street/High Street.
- Aylesbury Road/Wharf Road.
- Wendover Road/A413.
Pedestrian and cycle network
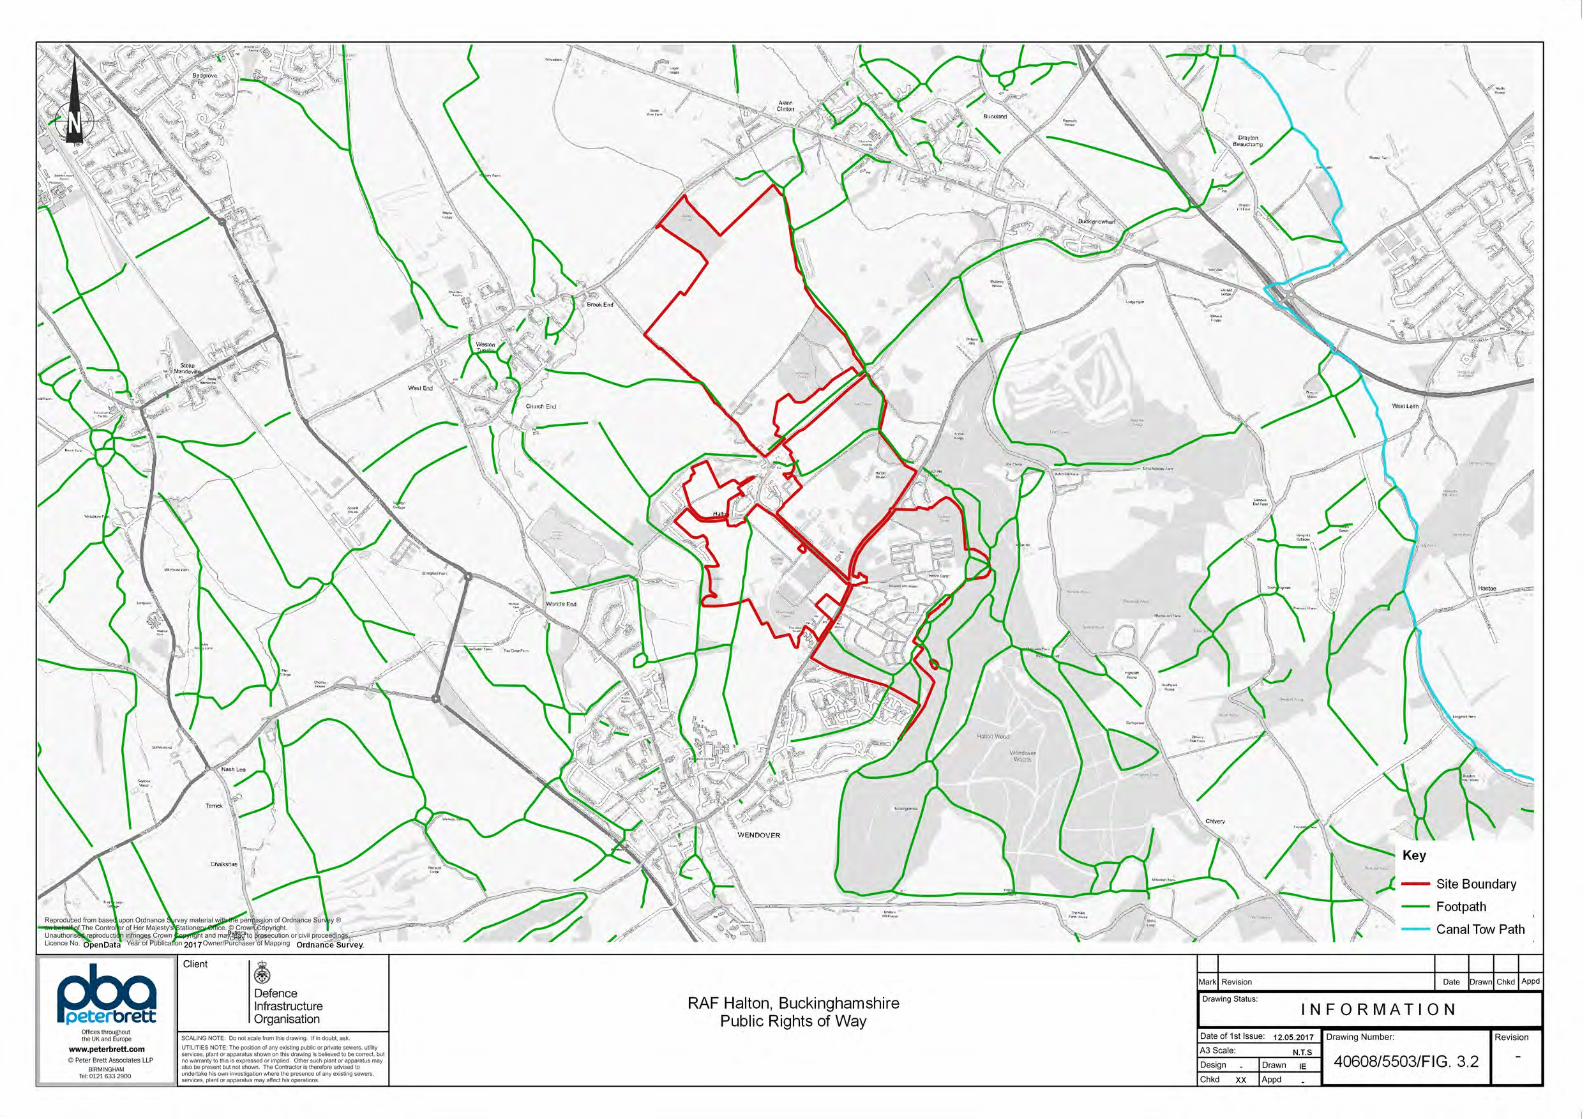
3.3.1 There is a good level of pedestrian provision in the vicinity of the site (see Figure 3.2). Local roads have accompanying footways with a width of at least 1.8m, are continuous, with good surfacing, drainage and street lighting present.
3.3.2 The walking environment also benefits from an extensive network of Public Rights of Way (PRoW) with a mix of footpaths, bridleways and canal tow paths often offering a traffic free route to local destinations.
3.3.3 A subway is also located within this access corridor, providing a route for pedestrians and cyclists underneath the B4009.
3.3.4 A shared pedestrian/cycle route runs along the B4009 that ties-in with local cycle routes in Wendover.
3.3.5 Furthermore, Regional Route 30 (which forms part of the National Cycle Network as an on-road route) runs from Wendover to the southeast connecting through to Chesham and Amersham.
Public transport provision
Bus provision
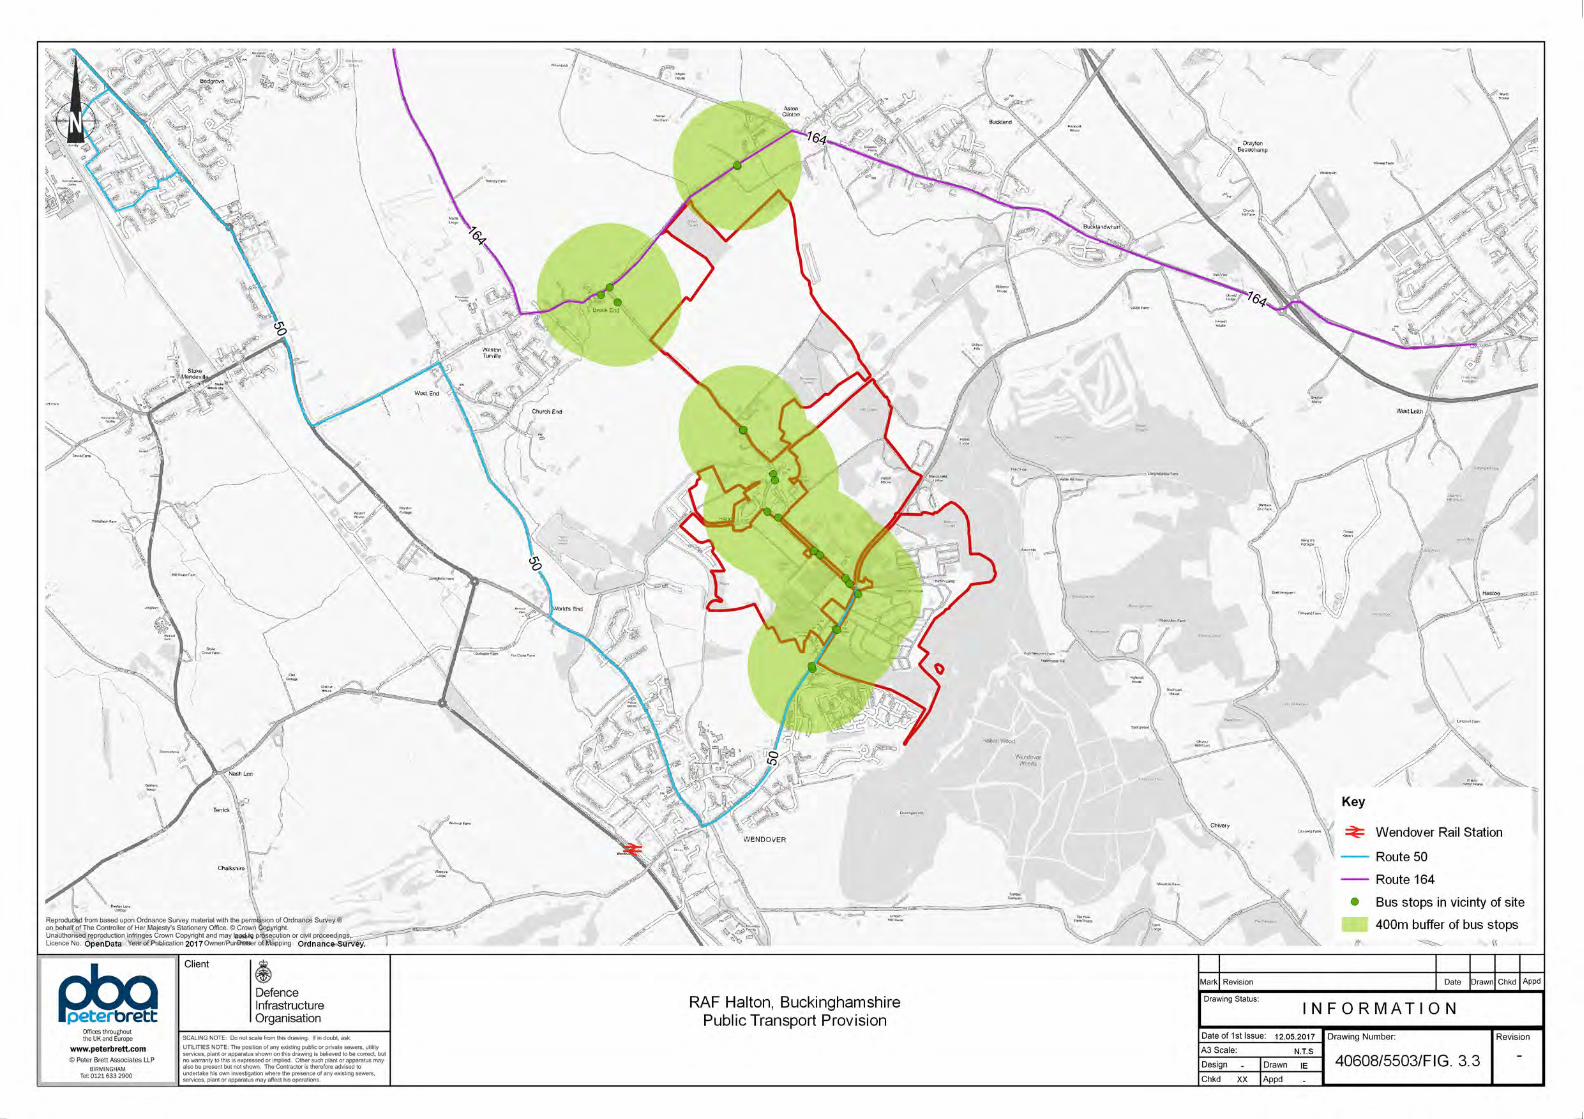
3.4.1 As Figure 3.3 illustrates, although bus stops are located along Chestnut Avenue, no services were identified that route along it.
3.4.2 The nearest bus services are the number 50 and 61, located south of the site, and the number 164, located to the north of the site. The primary bus service is the number 50 service which runs frequently every 20-30 minutes along a route between Aylesbury and Halton via Wendover. This service can be caught from stops located along Upper Icknield Way.
3.4.3 Bus route 61 can be caught on Upper Icknield Way adjacent to Chestnut Avenue and provides a route for Aylesbury to Dunstable, Toddernhoe and Eaton Bray and runs every two hours. Bus route 164 runs through Aston Clinton along Weston Road and can be caught from stops located on Weston Road, adjacent to the junction with Halton Village. Bus number 164 connects Aylesbury and Cheddington and runs every two hours with an additional service in the peak hours during school term times. Bus service 500 runs between Alyesbury and
Transport & Movement
RAF Halton
\\pba.int\bir\Projects\40608 - RAF Halton, Buckinghamshire\Reports\Transport\Updated\40608 RAF Halton -Transport & Movement June 2018 issue.docx
8
Watford and runs twice an hour in peak hours of day. However, it should be noted that the assumed catchment of the bus stops would not extend beyond the boundary of the site.
Rail provision
3.4.4 Wendover Rail Station is the closest rail station to the site, approximately 2.75km to the southwest, and provides 183 car parking spaces and storage for 104 bicycles. The rail station also provides step-free access with the availability of lifts and ramps for those with limited mobility.
3.4.5 The number 50 bus service calls at a stop approximately 600m walking distance from Wendover Rail Station.
3.4.6 The rail services at Wendover run between Aylesbury and London Marylebone every 30 minutes in either direction with journey durations of approximately 15 minutes and 55 minutes, respectively. This makes this station conveniently placed for both general commuter and longer rail journeys.
Road safety review
Introduction
3.5.1 Road safety data for the local road network was obtained in April 2018 from Buckinghamshire County Council for the latest available five-year period between April 2013 and March 2018 for the agreed assessment area.
3.5.2 The data covers the following areas:
� London Road / Tring Hill / Upper Icknield Way Junction; and
� The Upper Icknield Way (B4009) between London Rd and Chestnut Avenue.
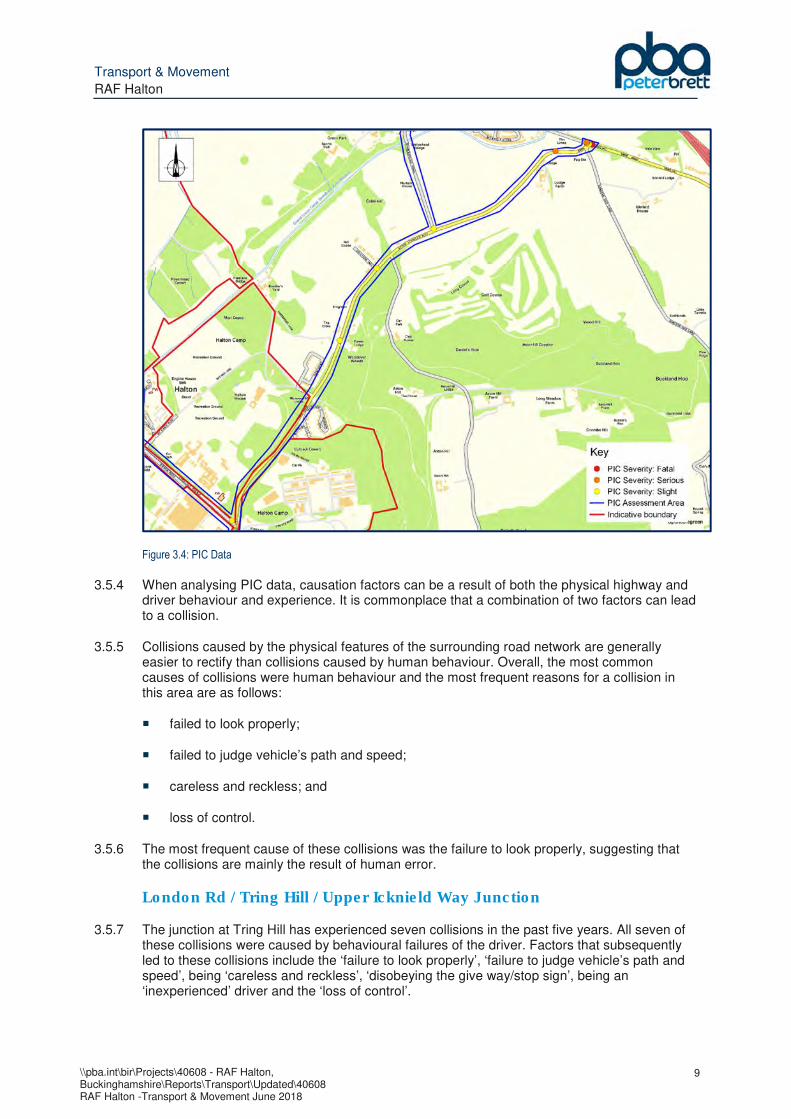
3.5.3 There was a total of 38 recorded PICs in this area during the five years specified. Figure 3.4 below depicts the distribution of injuries across the assessment area.
Transport & Movement
RAF Halton
\\pba.int\bir\Projects\40608 - RAF Halton, Buckinghamshire\Reports\Transport\Updated\40608 RAF Halton -Transport & Movement June 2018 issue.docx
9
Figure 3.4: PIC Data
3.5.4 When analysing PIC data, causation factors can be a result of both the physical highway and driver behaviour and experience. It is commonplace that a combination of two factors can lead to a collision.
3.5.5 Collisions caused by the physical features of the surrounding road network are generally easier to rectify than collisions caused by human behaviour. Overall, the most common causes of collisions were human behaviour and the most frequent reasons for a collision in this area are as follows:
� failed to look properly;
� failed to judge vehicle’s path and speed;
� careless and reckless; and
� loss of control.
3.5.6 The most frequent cause of these collisions was the failure to look properly, suggesting that the collisions are mainly the result of human error.
London Rd / Tring Hill / Upper Icknield Way Junction
3.5.7 The junction at Tring Hill has experienced seven collisions in the past five years. All seven of these collisions were caused by behavioural failures of the driver. Factors that subsequently led to these collisions include the ‘failure to look properly’, ‘failure to judge vehicle’s path and speed’, being ‘careless and reckless’, ‘disobeying the give way/stop sign’, being an ‘inexperienced’ driver and the ‘loss of control’.
Transport & Movement
RAF Halton
\\pba.int\bir\Projects\40608 - RAF Halton, Buckinghamshire\Reports\Transport\Updated\40608 RAF Halton -Transport & Movement June 2018 issue.docx
10
3.5.8 There were three slight injuries, three serious injuries and one fatal injury. The fatal injury was a result of a cyclist losing control of the bike and subsequently colliding into a vehicle.
Upper Icknield Way (B4009) between London Rd and Chestnut Avenue
3.5.9 The Upper Icknield Way between London Road and Chestnut Avenue has experienced five collisions in the past five years. Four of the collisions were caused by human errors whilst driving.
3.5.10 The sources of these errors included ‘careless and reckless’ driving, ‘poor turn manoeuvre’, being a ‘uncertain and nervous’ driver and ‘illness and disability’. However, road works during 2014 between Chestnut Avenue and Chiltern Way caused a slight injury as a result of defective traffic signals. However, as these traffic signals were temporary, these are no longer a safety concern on Upper Icknield Road.
3.5.11 Overall, there were four slight injuries and one serious injury. The serious injury was a consequence of the driver’s medical episode.
Summary
3.6.1 Its situation, along the B4009 and Chestnut Avenue corridors, means RAF Halton is ideally located to take advantage of these routes, given the number of existing points of access along them.
3.6.2 The A41 and A413 are easily accessible, from which access to Aylesbury and destinations further afield, such as Amersham, is also achievable.
3.6.3 There is an extensive PRoW network in the vicinity of the site, in addition to a subway and a shared pedestrian/cycle route that ties in with local cycle routes in Wendover.
3.6.4 There is an absence of bus provision along Chestnut Avenue, although bus service 50 does operate along the southern half of the B4009 and enables access to Wendover Rail Station.
3.6.5 The PIC assessment suggests that driver error is the main cause of incidents occurring on Upper Icknield Road and the junction that connects to Tring Hill.
3.6.6 Therefore, development would present an opportunity to improve bus service provision along the key corridors of the B4009 and Chestnut Avenue and tie-in with the wider provision. This is explored further in Section 4.
Transport & Movement
RAF Halton
\\pba.int\bir\Projects\40608 - RAF Halton, Buckinghamshire\Reports\Transport\Updated\40608 RAF Halton -Transport & Movement June 2018 issue.docx
11
4 Development opportunity
Introduction
4.1.1 This section describes the concept for development of the site, the opportunities for accessing the site and improving connectivity to sustainable transport provision and the potential vehicle trip generation of the site.
4.1.2 It is important to note that the site is considered by AVDC as a development opportunity, given its allocation in the Local Plan. Furthermore, the transport evidence base (in the form of the Buckinghamshire Countywide Model) produced by Jacobs, on behalf of AVDC, is considered sufficient for the Local Plan Examination and has the support of Buckinghamshire County council, as highway authority. Therefore, the principle of providing 1,000 dwellings on the site is established.
Development concept
4.2.1 The concept masterplan for RAF Halton is currently being developed and will be progressed towards its adoption as an SPD.
4.2.2 The scale of potential development at RAF Halton will create a new local centre with on-site facilities. Although the site will be connected to the local road network, the development of a new community and associated facilities and services will allow for person trips to remain internal to the development.
Access and connectivity to sustainable transport provision
4.3.1 The B4009/Chestnut Avenue is an established corridor for access and egress by vehicles generated by RAF Halton. It is proposed, as part of the concept masterplan, that this existing access provision is maintained as a result of development, where feasible, and that measures will be established to improve access and distribute traffic via a number of alternative access points on to the local road network.
4.3.2 An initial access strategy has been developed for the site which follows these broad principles:
� Reduction in the number of vehicular accesses off the Upper Icknield Way (B4009).
� Potential use of Chestnut Avenue and Swann Road for a cycle/bus access only boulevard.
� Creation of a vibrant and inclusive environment around Chestnut Avenue/ Upper Icknield Way to reinforce the ‘local centre’.
� Provision for buses within the site would provide a service within the preferred walking distance to a bus stop of up to 400m for single high-frequency routes (i.e. every 12 minutes or better). To achieve this, the existing service on the B4009 would need to be extended into the site or a new service(s) provided. Provision of cycle stands at some bus stops also assists in encouraging links between these two modes of travel.
� Access to the nearest rail station (at Wendover) is beyond the recommended walking distance but is within a normal cycling distance (of up to 5km), which presents an opportunity to reinforce local cycle facilities. It may be possible to widen the footway provided on the northern side of the B4009 to 3m or 3.5m between the site and Wendover to promote this connection.
Transport & Movement
RAF Halton
\\pba.int\bir\Projects\40608 - RAF Halton, Buckinghamshire\Reports\Transport\Updated\40608 RAF Halton -Transport & Movement June 2018 issue.docx
12
� A series of direct links on-site, using wayfinding techniques, would encourage the use of all sustainable modes of travel. The public footways should be retained in their existing location. Should this not be possible, a Footpath Diversion Order would be necessary.
4.3.3 These are only initial comments in recognition that the masterplan is not yet fully developed. However, achieving suitable access via a number of points, promoting sustainable transport modes and reducing speed limits are three of the main transport issues that have been raised and which the masterplan seeks to address.
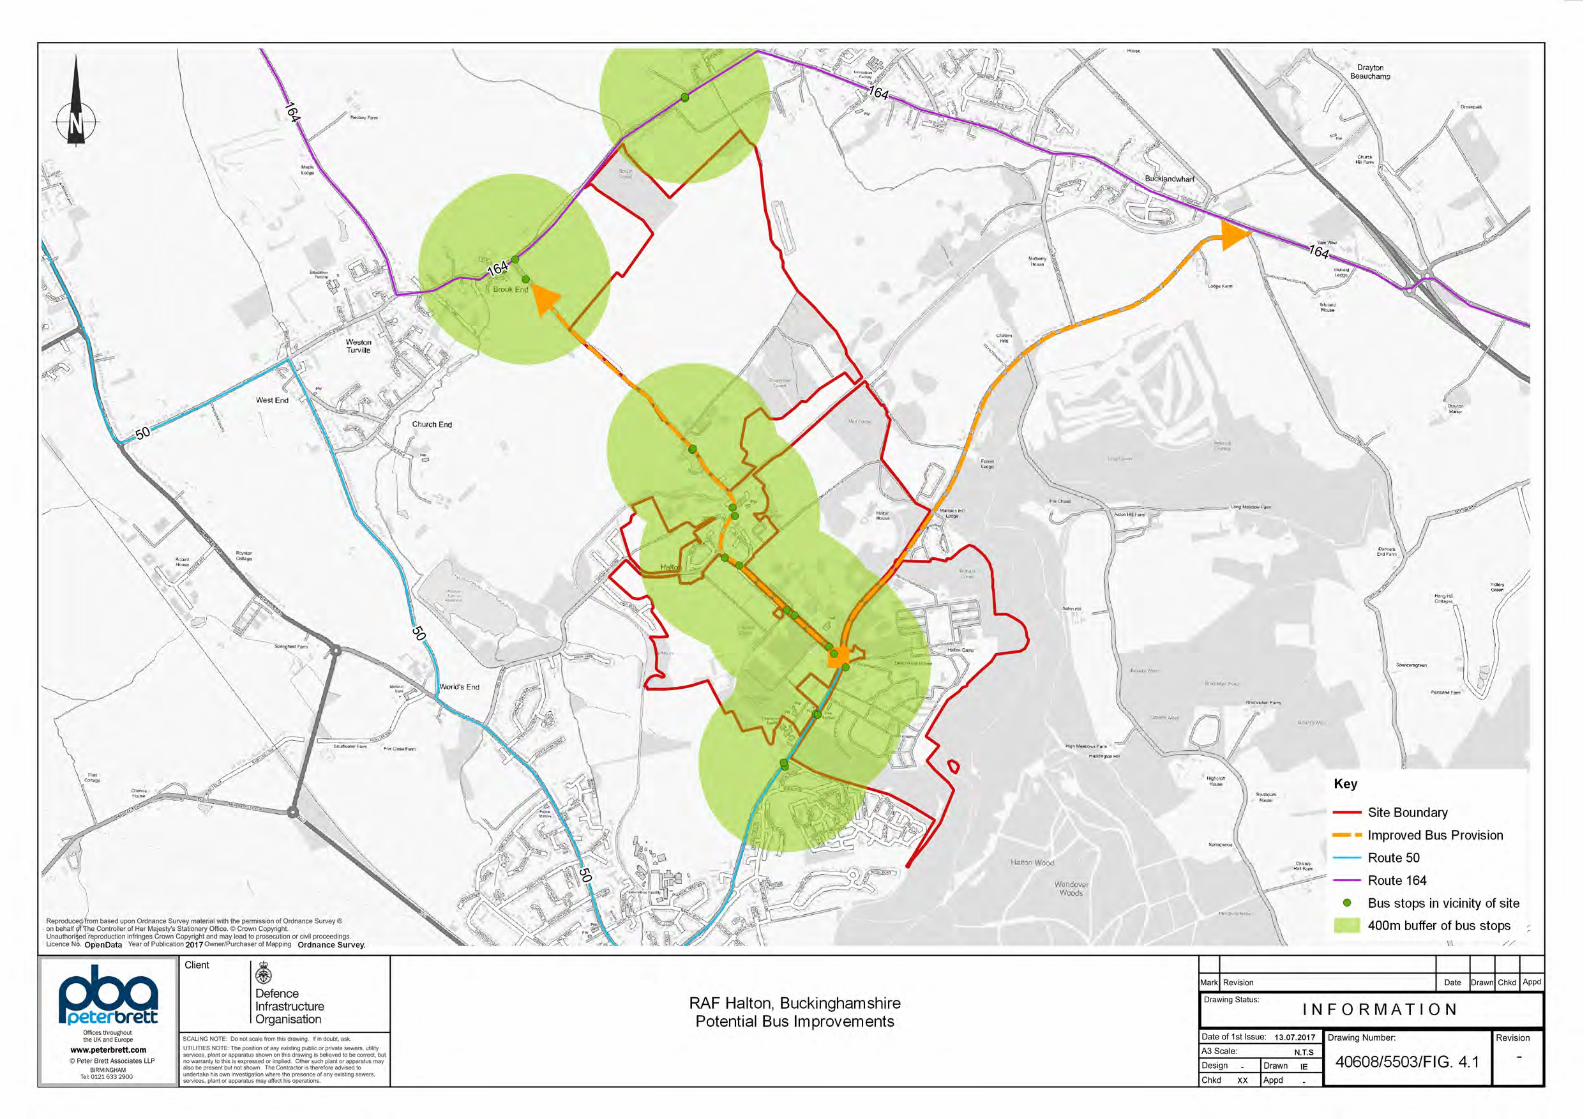
4.3.4 Bus stops are present along Chestnut Avenue, a key route in the local area, but with no bus provision. Therefore, it is considered that development would present an opportunity to improve existing bus services 50 and 164 via Chestnut Avenue and the B4009 and enable a link to be established with Wendover Rail Station and onward to Aylesbury (see Figure 4.1).
4.3.5 The B4009 and Chestnut Avenue bisect the site. Therefore, to ensure severance (the separation of people from places and other people) is not created by the B4009 and Chestnut Avenue, pedestrian and cycle linkages between development plots will be explored in order to tie-in with, and enhance, existing provision. Indeed, development would enable improved pedestrian and cycle connectivity in the wider area, particularly along the towpath of the disused Wendover arm of the Grand Union Canal. This would provide an excellent route between the site and Wendover as it is recognised that this is an important pedestrian/cycle corridor.
4.3.6 It is considered that, as part of any development on the site, a more local service be provided with the potential to tie-in with Wendover, Princes Risborough and Tring railway stations. The potential would also exist for using a demand responsive service like Arriva Click for future residents.
Trip generation
4.4.1 TRICS1 has been interrogated in order to estimate the volume of vehicle trips that could be generated by residential development at the site.
4.4.2 Given that a variety of housing types, and sizes, is necessary to meet the needs of the housing market the most appropriate category in TRICS from which to derive vehicle trip rates for residential development, at this stage, is the Mixed Private/Affordable Housing sub land use category. This will provide an indication of potential vehicle trip generation, which would be considered in greater detail as the site is taken forward for development.
4.4.3 The Mixed Private/Affordable Housing sub land use category covers housing developments where fewer than 75% of units are privately owned and fewer than 75% of units are non-privately owned. Non-privately owned units may be council rented or housing association rented/part-owned.
4.4.4 In order to ensure the vehicle trip rates used are robust and represent similar locational characteristics to the site, e.g. accessibility of the site to bus provision, the following filters have been applied:
� Included surveys of sites in England (excluding Greater London);
� Included surveys conducted on weekdays; and
1 TRICS (Trip Rate Information Computer System) is a database system comprising records of developments across a range of land use categories, from which an analysis of individual or selected sets of survey counts from these developments can be undertaken in order to produce trip rate information appropriate to development.
Transport & Movement
RAF Halton
\\pba.int\bir\Projects\40608 - RAF Halton, Buckinghamshire\Reports\Transport\Updated\40608 RAF Halton -Transport & Movement June 2018 issue.docx
13
� Included surveys that have a Travel Plan.
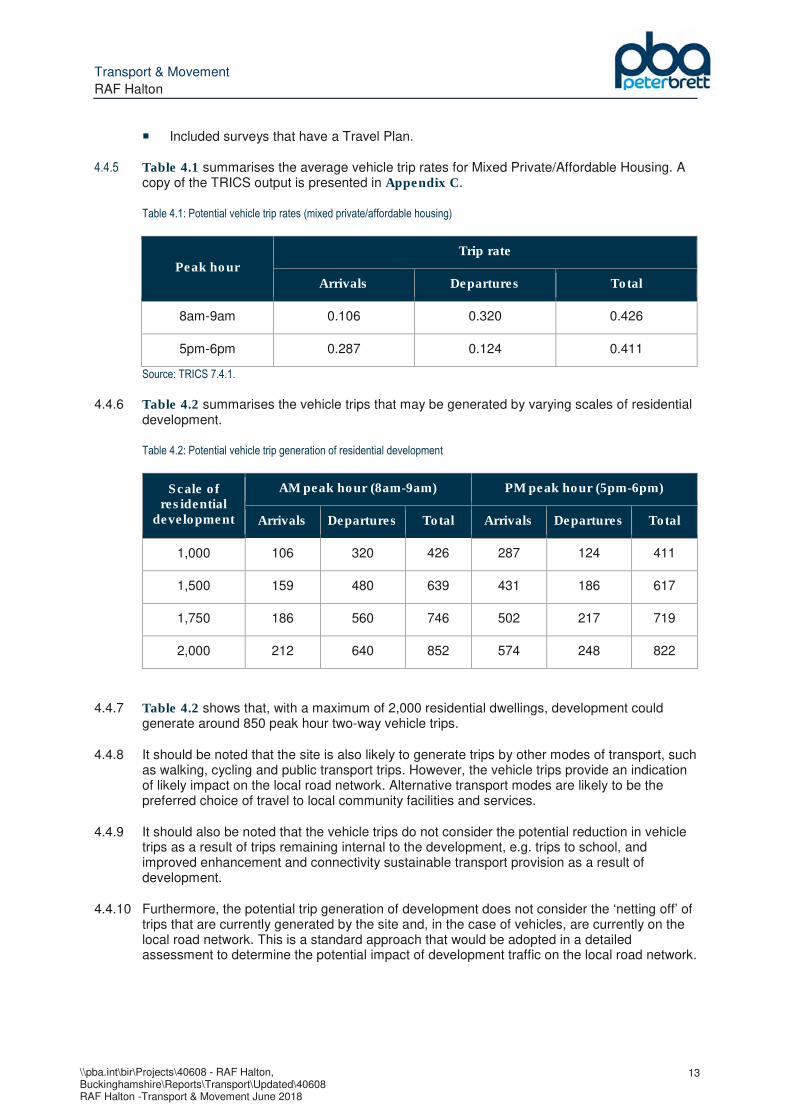
4.4.5 Table 4.1 summarises the average vehicle trip rates for Mixed Private/Affordable Housing. A copy of the TRICS output is presented in Appendix C.
Table 4.1: Potential vehicle trip rates (mixed private/affordable housing)
Peak hour
Trip rate
Arrivals Departures Total
8am-9am 0.106 0.320 0.426
5pm-6pm 0.287 0.124 0.411
Source: TRICS 7.4.1.
4.4.6 Table 4.2 summarises the vehicle trips that may be generated by varying scales of residential development.
Table 4.2: Potential vehicle trip generation of residential development
Scale of residential
development
AM peak hour (8am-9am) PM peak hour (5pm-6pm)
Arrivals Departures Total Arrivals Departures Total
1,000 106 320 426 287 124 411
1,500 159 480 639 431 186 617
1,750 186 560 746 502 217 719
2,000 212 640 852 574 248 822
4.4.7 Table 4.2 shows that, with a maximum of 2,000 residential dwellings, development could generate around 850 peak hour two-way vehicle trips.
4.4.8 It should be noted that the site is also likely to generate trips by other modes of transport, such as walking, cycling and public transport trips. However, the vehicle trips provide an indication of likely impact on the local road network. Alternative transport modes are likely to be the preferred choice of travel to local community facilities and services.
4.4.9 It should also be noted that the vehicle trips do not consider the potential reduction in vehicle trips as a result of trips remaining internal to the development, e.g. trips to school, and improved enhancement and connectivity sustainable transport provision as a result of development.
4.4.10 Furthermore, the potential trip generation of development does not consider the ‘netting off’ of trips that are currently generated by the site and, in the case of vehicles, are currently on the local road network. This is a standard approach that would be adopted in a detailed assessment to determine the potential impact of development traffic on the local road network.

Transport & Movement
RAF Halton
\\pba.int\bir\Projects\40608 - RAF Halton, Buckinghamshire\Reports\Transport\Updated\40608 RAF Halton -Transport & Movement June 2018 issue.docx
14
5 Future considerations
Introduction
5.1.1 This section highlights specific transport requirements that will need to be considered when taking the site forward for development.
Scoping the Transport Assessment
5.2.1 In line with Planning Practice Guidance (PPG), the scale, scope and level of detail required of a Transport Assessment (TA), in support of an application for development on the site, would be established as early as possible in the development management process, given that this could positively influence the overall nature or the detailed design of the development going forward.
5.2.2 Key issues that would be considered include:
� the planning context of the development proposal;
� appropriate study parameters (i.e. area, scope and duration);
� assessment of public transport, walking/cycling and road network capacity;
� trip generation and distribution methodologies;
� measures to promote sustainable travel, e.g. travel planning;
� safety implications; and
� mitigation measures (where applicable), including scope and implementation strategy.
5.2.3 The highway authority has indicated that, as the site is taken forward for development, there will be a need to consider the cumulative effects arising from other strategic development sites, including Hampden Fields, Woodlands, Land at Aston Clinton Road, Stoke Mandeville by-pass and by-pass extension between the A4010 and A413. All of which will be covered by the Aylesbury Model.
Modelling
Buckinghamshire Countywide Model
5.3.1 A countywide modelling exercise has been undertaken jointly with Buckinghamshire County Council and the District Councils in Buckinghamshire to provide a high-level overview of the traffic impacts of planned growth across the County as part of the AVDC local plan evidence base. This will provide an indication of what traffic impacts may be on the local area and act as a starting point for what mitigation may be required.
5.3.2 Consultants Jacobs were commissioned to assess the transport impact of the emerging local plan proposals for the districts within Buckinghamshire, comprising Aylesbury Vale, Chiltern, South Bucks and Wycombe.
5.3.3 The first phase of work primarily focuses on the identification of transport related issues in the Aylesbury Vale area to inform the development of potential mitigation options. There are three scenarios for Aylesbury Vale:
Transport & Movement
RAF Halton
\\pba.int\bir\Projects\40608 - RAF Halton, Buckinghamshire\Reports\Transport\Updated\40608 RAF Halton -Transport & Movement June 2018 issue.docx
15
� a "Do- Minimum" (DM) model run (essentially a base line reference case);
� a "Do Something" (DS1) forecast scenarios which includes a new settlement location at Haddenham; and
� a "Do Something" (DS2) forecast scenarios which includes a new settlement location at Winslow.
5.3.4 In testing final local plan spatial allocations, AVDC added 1,000 houses at RAF Halton to be modelled for the local plan period, following confirmation of the sites disposal. It should be noted that this is not intended as a definitive statement on the development capacity of the site, which will be subject to more detailed review once the modelling results have been confirmed, but it does demonstrate that the principle of 1,000 new homes on the site can be accommodated.
5.3.5 Going forward, the highway authority has indicated that it will be necessary to test development scenarios using the strategic model for Aylesbury.
The Aylesbury Model
5.4.1 It should be noted that there are extensive committed developments that will need to be considered including Aston Clinton, Weston Turville and Aylesbury. The only way that these, and associated infrastructure, can be adequately captured in a cumulative assessment is through the use of the Aylesbury Model.
5.4.2 Buckinghamshire County Council operates a strategic model that has been developed to represent specific local network conditions within Aylesbury and will provide traffic flows and turning counts for 2034.
5.4.3 The Aylesbury Model is derived from the County Model and is calibrated and validated to a higher level. All significant developments that could impact on the Aylesbury town network are required to use the Aylesbury Model as a starting basis for the assessment of detailed impacts.
5.4.4 The Model has been built utilising PTV Vissim software and is WEBTAG compliant. It is based on recent traffic data and considered to be representative of contemporary traffic conditions.
5.4.5 The Model is intended to be used for assessing the traffic impact of highway schemes and new land-use development and has recently been extended to cover Halton and Wendover. In order to support the SPD submission and any forthcoming application for development at RAF Halton, the Model will be used to test the potential impact of development.
5.4.6 Continuing liaison with the highway authority will enable the data required, e.g. trip rates, to test development scenarios on the site to be established.
Oxford to Cambridge Expressway
5.5.1 The Department for Transport’s first Road Investment Strategy (RIS 1) outlines the long-term programme for major roads at a national level. The government agreed to establish the RIS 1 in 2013, committing funding of £15.2 billion over a five-year period.
5.5.2 One key outcome of RIS 1 was the identification of the potential link existing roads to create an Oxford to Cambridge Expressway, which would create a high-quality east-west link between Oxford and Cambridge, via Bedford and Milton Keynes.
5.5.3 Going forward, it is important to note the potential benefits that this road could bring to Aylesbury and its surrounds.
Transport & Movement
RAF Halton
\\pba.int\bir\Projects\40608 - RAF Halton, Buckinghamshire\Reports\Transport\Updated\40608 RAF Halton -Transport & Movement June 2018 issue.docx
16
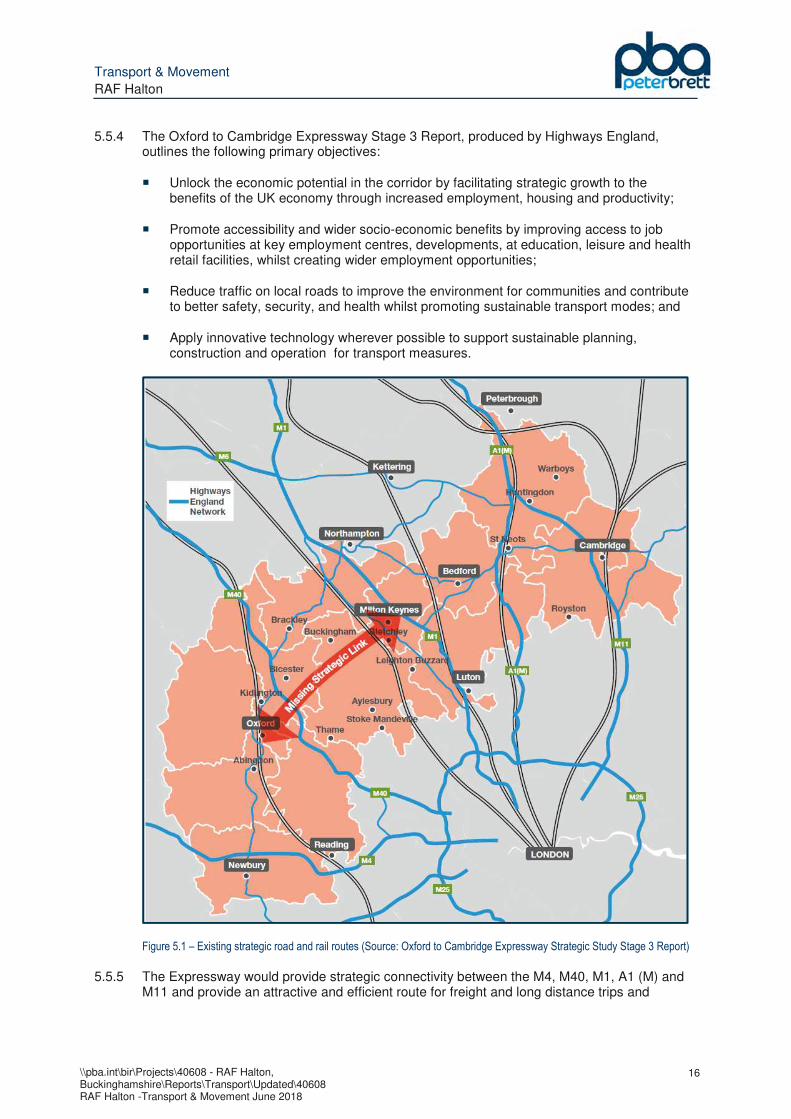
5.5.4 The Oxford to Cambridge Expressway Stage 3 Report, produced by Highways England, outlines the following primary objectives:
� Unlock the economic potential in the corridor by facilitating strategic growth to the benefits of the UK economy through increased employment, housing and productivity;
� Promote accessibility and wider socio-economic benefits by improving access to job opportunities at key employment centres, developments, at education, leisure and health retail facilities, whilst creating wider employment opportunities;
� Reduce traffic on local roads to improve the environment for communities and contribute to better safety, security, and health whilst promoting sustainable transport modes; and
� Apply innovative technology wherever possible to support sustainable planning, construction and operation for transport measures.
Figure 5.1 – Existing strategic road and rail routes (Source: Oxford to Cambridge Expressway Strategic Study Stage 3 Report)
5.5.5 The Expressway would provide strategic connectivity between the M4, M40, M1, A1 (M) and M11 and provide an attractive and efficient route for freight and long distance trips and
Transport & Movement
RAF Halton
\\pba.int\bir\Projects\40608 - RAF Halton, Buckinghamshire\Reports\Transport\Updated\40608 RAF Halton -Transport & Movement June 2018 issue.docx
17
enhanced connectivity between key local and regional growth areas including the Knowledge Spine, Milton Keynes and Cambridge Business and Science Parks.
5.5.6 The Expressway would complement East West Rail and support the continued growth and attractiveness of the corridor as a place to live and work, providing network resilience and improved local, regional and strategic connectivity.
5.5.7 Investment into the Expressway, and EWR, could also accelerate the delivery of strategic housing sites. The development of the Expressway ties in with the objectives of the Buckinghamshire Local Transport Plan which supports the LTP’s notion of creating ‘efficient and effective transport provision’ and ‘reliable road travel’ which subsequently helps improves the connectivity of local developments.
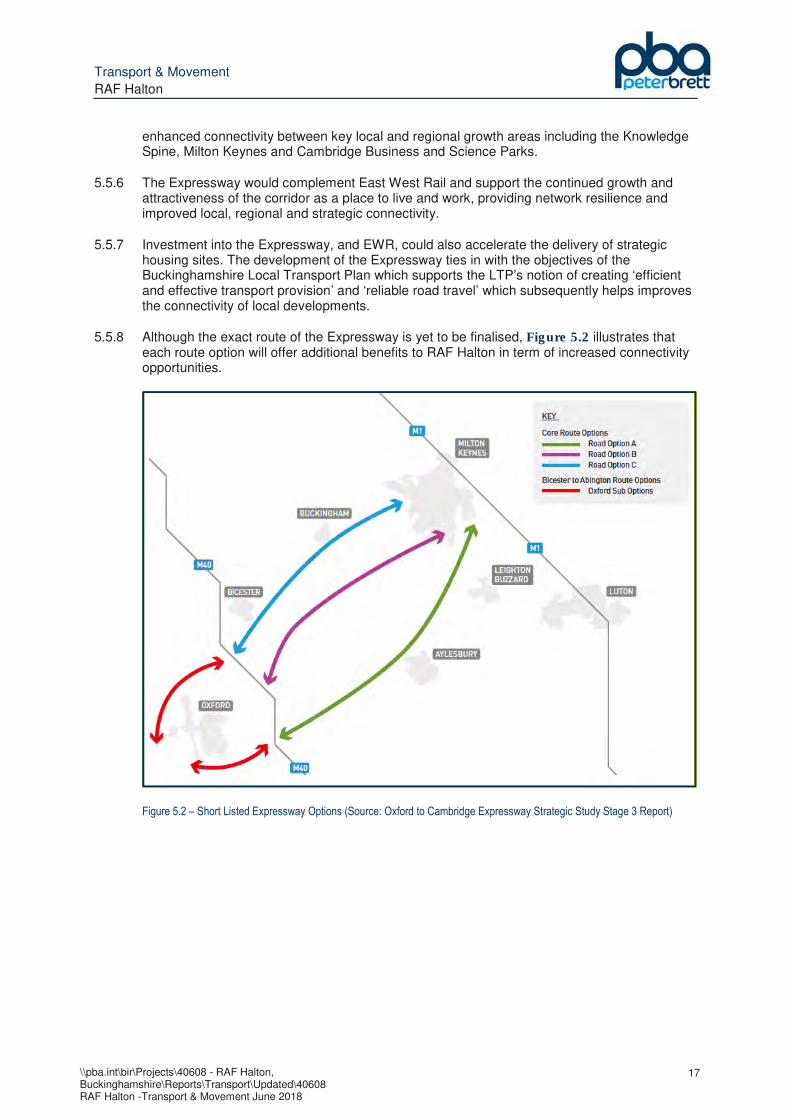
5.5.8 Although the exact route of the Expressway is yet to be finalised, Figure 5.2 illustrates that each route option will offer additional benefits to RAF Halton in term of increased connectivity opportunities.
Figure 5.2 – Short Listed Expressway Options (Source: Oxford to Cambridge Expressway Strategic Study Stage 3 Report)
Transport & Movement
RAF Halton
\\pba.int\bir\Projects\40608 - RAF Halton, Buckinghamshire\Reports\Transport\Updated\40608 RAF Halton -Transport & Movement June 2018 issue.docx
18
6 Impacts from surrounding developments
Introduction
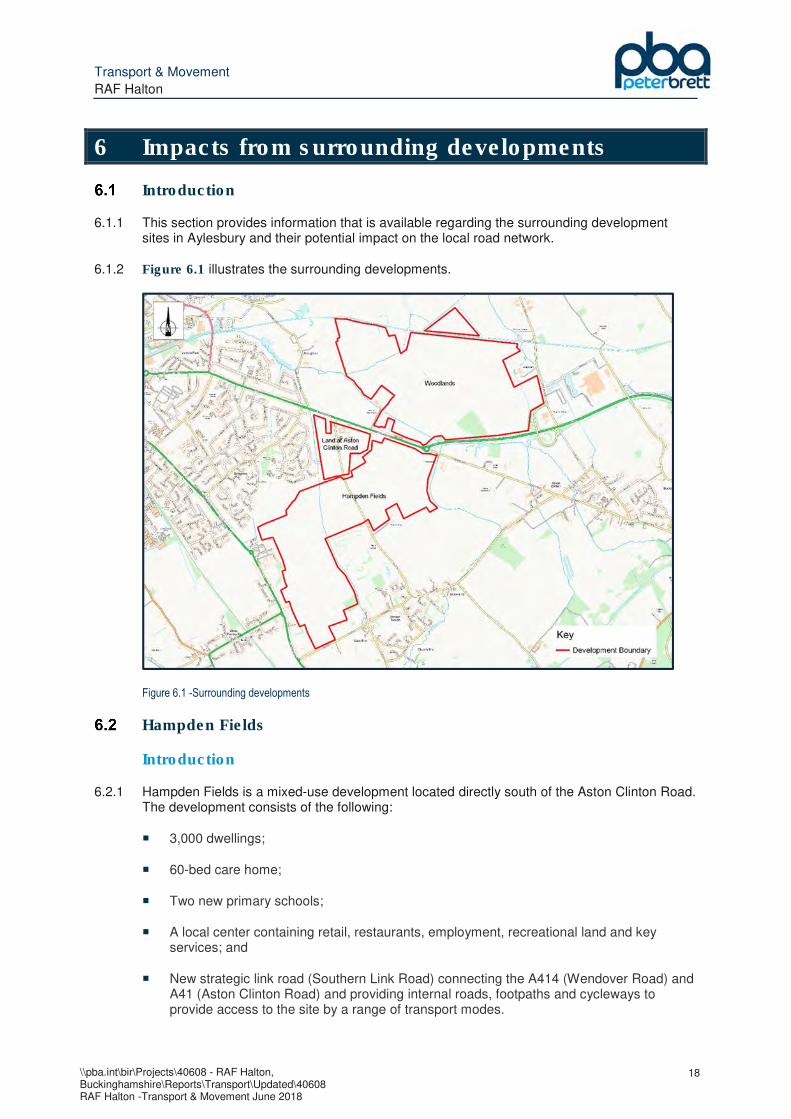
6.1.1 This section provides information that is available regarding the surrounding development sites in Aylesbury and their potential impact on the local road network.
6.1.2 Figure 6.1 illustrates the surrounding developments.
Figure 6.1 -Surrounding developments
Hampden Fields
Introduction
6.2.1 Hampden Fields is a mixed-use development located directly south of the Aston Clinton Road. The development consists of the following:
� 3,000 dwellings;
� 60-bed care home;
� Two new primary schools;
� A local center containing retail, restaurants, employment, recreational land and key services; and
� New strategic link road (Southern Link Road) connecting the A414 (Wendover Road) and A41 (Aston Clinton Road) and providing internal roads, footpaths and cycleways to provide access to the site by a range of transport modes.
Transport & Movement
RAF Halton
\\pba.int\bir\Projects\40608 - RAF Halton, Buckinghamshire\Reports\Transport\Updated\40608 RAF Halton -Transport & Movement June 2018 issue.docx
19
Trip generation
6.2.2 Forecasts from TEMPRO were extracted to ascertain the total number or origin/destination trips associated with the Aylesbury zone. It is forecasted that the total residential trips rates for Hampden Fields will be 0.38 in the AM Peak per dwelling and 0.53 per dwelling in the PM Peak.
6.2.3 A comparative residential trip generation rate was used for both Woodlands and Hampton. In the AM Peak Hour Woodlands produced 0.734 two way vehicle trip rate per dwelling and 0.38 for Hampden Fields. In the PM Peak Hour Woodlands produced 0.759 two-way vehicle trip rate per dwelling and 0.53 for Hampton Fields.
Mitigation proposals
6.2.4 This section sets out the proposed mitigation and includes the following:
� The Eastern Link Road (ELR) is currently under construction as a part of the Kingsbrook development which connects with the A418 and Bierton;
� The Stocklake Link Road (Rural) is currently under construction and link with the ELR (North) to the A4157 Oakfield Road;
� The Stocklake Link Road (Urban) is currently under construction and links to the A4167 to the A418 Sapphire Way in the town centre;
� The ELR South will connect to the ELR North to the A41 near the western end of the Aston Clinton Bypass that is going serve the Woodlands development; and
� The ELR south will follow an alignment through the Hampden Fields development and link the A41 near the western end of the Aston Clinton bypass, to the A413 Wendover Road.
� A proposed access onto the A413 Wendover Road will be created through a new three-arm signal controlled junction, in conjunction with an additional lane flaring on both A413 Wendover Road approaches. The junction will be located between Camborne Avenue and Silver Birch Way.
� A connection from the SLR to the A41 Aston Clinton Road and the A41 Woodlands roundabout.
� The junction of the north-south Marroway Link with the B4544 Marroway supports the principle of a reversal of priority, whereby the eastern B4544 Marroway approach would become a minor arm, while its eastern section would provide a continuation of the Marroway link.
� In the interest of maintaining local access along New Road, while dissuading through movements for other users, the configuration of the local centre inside Hampden Fields has considered the introduction of a diversion for New Road so that it meets at a crossroads away from (east of) its existing alignment.
Woodlands
Introduction
6.3.1 Aylesbury Woodlands is a mixed-use development located to the north of the A41 Aston Clinton Road, to the west of College Road North and to the south of the Grand Union Canal. The development will consist of the following:
Transport & Movement
RAF Halton
\\pba.int\bir\Projects\40608 - RAF Halton, Buckinghamshire\Reports\Transport\Updated\40608 RAF Halton -Transport & Movement June 2018 issue.docx
20
� 102,800 sq m employment (B1/B2/B8);
� 1,100 dwellings (C3);
� 60 residential extra care units (C2)
� Mixed-use local centre of up to 4,000 sq m (A1/A2/A5/D1)
� 5,700 sq m hotel and Conference Centre (C1)
� 3,500 sq m Leisure facilities (A1/A3/A4)
� 16 ha for sports village and pitches
� Athletes Accommodation (10 x 8 apartments);
� 2 ha for a primary school (D1); and
� A strategic link road connecting with the ELR (N) and the A41 Aston Clinton Road and providing transport infrastructure that provides access to the site by a range of transport modes.
Trip generation
6.3.2 The gross vehicular trip generation for each zone was calculated with reference to 85th percentile vehicular trip rates extracted from the TRICS database with the exception of the vehicular trip rates for the B8 warehousing uses where an observed count of a B8 site in Bedfordshire was used. In total, the entire development is projected to produce 2,765 two-way trips in the AM Peak and 2,958 in the PM Peak.
Assessment
� The impact of the Proposed Development is positive overall, reducing the overall delays across Aylesbury through the provision of the ELR(S), providing the missing connection between the A418 and the A41.
� Traffic volumes are reduced on parallel routes to the ELR(S) such as Burcott Lane and Broughton Lane and there are also reductions around the inner ring road in Aylesbury. There are also reductions overall at the Walton Gyratory.
� Traffic volumes in Aylesbury Town Centre reduce in general with the exception of the Cambridge Street / Upper Hundred Way / New Street junction and the A418 Bierton Road / A418 Park Street / Cambridge Street junction where flows increase, potentially as vehicles reassign across the town centre.
� Traffic volumes increase on the ELR(N) and Stocklake Link (rural and urban) and trips are also attracted from further west in the model to use the ELR from the A418 and travel via Bedgrove, increasing traffic volumes along these links.
� The forecast traffic volumes along the ELR indicate that a single carriageway provides sufficient reserve capacity for the forecast year flows in 2034.
� The A41 immediately west of the A41 / Aston Clinton Road Roundabout experiences significant growth in traffic volumes between 2014 and 2034 even before the addition of the Proposed Development. The addition of the Proposed Development indicates that some enhancement to capacity of the link to the west of the roundabout would be required to provide sufficient capacity for the forecast year traffic flows.
Transport & Movement
RAF Halton
\\pba.int\bir\Projects\40608 - RAF Halton, Buckinghamshire\Reports\Transport\Updated\40608 RAF Halton -Transport & Movement June 2018 issue.docx
21
� Traffic volumes are forecast to increase through the local villages (Aston Clinton and Weston Turville) as vehicles from the A41 route south to the A413, exacerbating an existing issue.
� Whilst forecast traffic volumes increase through Bierton following the implementation of the Proposed Development, the forecast volumes are lower than currently observed. This indicates the ELR and the traffic calming in Bierton would help improve traffic conditions experienced in Bierton in the forecast year.
Junction Capacity assessment
6.3.3 A junction capacity assessment was undertaken in the transport assessment and under the 2034 Do Something scenario the following junctions are considered to operate with residual levels are delays which could be deemed severe:
� College Road North / A41 Westbound Overbridge Junction
� A41 Westbound / B4009 / Overbridge Roundabout
� A41 Eastbound / B488 / B4635 Roundabout
� A41 / Bedgrove / Broughton Lane Junction
� A41 / Aston Clinton MDA / New Road Signalised Junction
� A4157 / Stocklake Junction
� Tringford Road / Bulbourne Road / Wingrave Road / Icknield Way Roundabout
Cumulative assessment
6.3.4 Within the Transport Assessment for Woodlands, a cumulative assessment which incorporates both the Aylesbury Woodlands and Hampden Fields developments was produced. The results of this cumulative assessment are summarised below:
� The completion of the ELR and the South-Eastern Link Road through Hampden Fields will significantly reduce the traffic volumes on the A41 towards Aylesbury and reduces the volumes of vehicles travelling through Weston Turville;
� Of the junctions which experienced capacity issues in the 2034 Do Minimum and 2034 Do Something scenarios, the completion of both Aylesbury Woodlands and Hampden Fields improves conditions in these locations, particularly at:
- the A41 / Bedgrove / Broughton Lane signalised junction
- the A41 / Aston Clinton MDA / New Road signalised junctions;
- Tringford Road / Bulbourne Road / Wingrave Road / Icknield Way Roundabout; and
- the Walton Gyratory.
� Conditions at the following junctions are largely unchanged or worsen with Hampden Fields and still require the implementation of physical mitigation:
- College Road North / Westbound Slips junction;
- A41 Westbound /Tring Roundabout;
Transport & Movement
RAF Halton
\\pba.int\bir\Projects\40608 - RAF Halton, Buckinghamshire\Reports\Transport\Updated\40608 RAF Halton -Transport & Movement June 2018 issue.docx
22
- A41 Eastbound / B488 / B4009 Roundabout; and
- A4157 / Stocklake Signalised Junction.
� There are traffic flow increases on the A413 in both directions during the AM and PM peaks to the south of the A413 / Hampden Fields Link Road junction, on the ELR through Aylesbury Woodlands, through the Land East of Aylesbury (Kingsbrook) development, on the A41 east of the Proposed Development, and on Aylesbury Road eastbound in the PM peak and westbound in the PM peak.
6.3.5 From the junction capacity assessment from the Woodlands Transport Assessment concludes that ‘in the AM peak the levels of delay per vehicle experienced across the strategic transport model are lower with both developments than without both developments. In the PM peak levels of delay are higher, but this is due to the modelling of the timings at the A41 / Aston Clinton MDA / New Road junction which through detailed assessment suggest this can be addressed through re-optimisation of the signal timings to reflect the change in travel patterns’.
Mitigation proposals
6.3.6 This section sets out the proposed mitigation and includes the following:
� Traffic calming in Aston Clinton, Weston Turville and on Broughton Lane
� Improvements to capacity at the following junctions:
- College Road North / A41 Westbound Overbridge Junction;
- A41 / Bedgrove / Broughton Lane Junction;
- A41 / Aston Clinton MDA / New Road Junction;
- Stocklake / Oakfield Road Signalised Junction;
- A41 Westbound / B4009 Roundabout;
- A41 Eastbound / B488 / B4009 Roundabout; and
- Tringford Road / Bulbourne Road / Wingrave Road / Icknield Way Roundabout.
� Interim capacity improvements on A41 to the west of the A41 / Aston Clinton Road Roundabout
� Road Safety
Land at Aston Clinton Road
Introduction
6.4.1 Land South of Aston Clinton Road is residential development for up to 120 dwellings located Weston Turville, 3.25 east of Aylesbury town centre.
Trip generation
6.4.2 The forecast vehicular trips associated with this proposed residential development were derived used the TRICS database and were calculated for weekday AM and PM peak hours
Transport & Movement
RAF Halton
\\pba.int\bir\Projects\40608 - RAF Halton, Buckinghamshire\Reports\Transport\Updated\40608 RAF Halton -Transport & Movement June 2018 issue.docx
23
only. The results suggest that the proposed development will create 68 two-way vehicle trips during the weekday AM peak and 78 two-way trips during the PM peak.
Traffic Impact Assessment
6.4.3 The Transport Assessment produced by Cotswold Transport Planning Ltd suggests that traffic impact from the development will be modest and state that ‘the analysis of the proposed site access junction and the off-site highway junctions demonstrate that the local highway network will operate efficiently when planned transport infrastructure, which will be provided as part of Hampden Fields and the Woodlands development, are provided. Prior to this infrastructure being delivered, the development proposal will add a modest number of new vehicle trips to an already congested corridor, although the residual impacts of these trips are not considered to be severe’.
Transport & Movement
RAF Halton
\\pba.int\bir\Projects\40608 - RAF Halton, Buckinghamshire\Reports\Transport\Updated\40608 RAF Halton -Transport & Movement June 2018 issue.docx
24
7 Summary and conclusion
Summary
7.1.1 Peter Brett Associates LLP (PBA), working in collaboration with JLL, has been appointed by the Defence Infrastructure Organisation (DIO) to provide a report on Transport & Movement in support of the sites allocation in the emerging Vale of Aylesbury Local Plan and with due consideration of national and local planning policy.
7.1.2 Primarily operating as a training facility, RAF Halton is home to personnel from all three Services, foreign military, contractors and civilians and, therefore, arrivals and departures are fluid and do not confirm with typical peak periods on the local road network. Most trips made during these peak hours will be made by civilians, particularly during the typical AM peak hour, with Friday PM departures largely comprising military staff travelling back to their family homes. Travel surveys of all site users will help determine current travel patterns and form a baseline from which development impact can be measured. This will, in turn, help inform the transport chapter of the SPD.
7.1.3 The RAF Halton site allocation, which is supported by the highway authority, is for a residential-led mixed use development
7.1.4 A masterplan Supplementary Planning Document (‘SPD’) will be produced for the site. The redevelopment of RAF Halton will have regard to and be accordance with this masterplan SPD and the policies for the delivery of Aylesbury Garden Town.
7.1.5 The scale of potential development at RAF Halton will create a new local centre with on-site facilities. Although the site will be connected to the local road network, the development of a new community and associated facilities and services will allow for person trips to remain internal to the development.
7.1.6 The site is also likely to generate trips by other modes of transport, such as walking, cycling and public transport trips. However, the vehicle trips provide an indication of likely impact on the local road network. Alternative transport modes are likely to be the preferred choice of travel to local community facilities and services.
7.1.7 The B4009/Chestnut Avenue is an established corridor for access and egress by vehicles generated by RAF Halton. It is proposed, as part of the concept masterplan, that this existing access provision is maintained as a result of development, where feasible, and that measures will be established to improve access and distribute traffic via a number of alternative access points on to the local road network.
7.1.8 Achieving suitable access via a number of points, promoting sustainable transport modes and reducing speed limits are three of the main transport issues that have been raised and which the masterplan seeks to address.
7.1.9 Bus stops are present along Chestnut Avenue, a key route in the local area, but with no bus provision. Therefore, it is considered that development would present an opportunity to improve existing bus services 50 and 164 via Chestnut Avenue and the B4009 and enable a link to be established with Wendover Rail Station and onward to Aylesbury (see Figure 4.1).
7.1.10 The B4009 and Chestnut Avenue bisect the site. Therefore, to ensure severance (the separation of people from places and other people) is not created by the B4009 and Chestnut Avenue, pedestrian and cycle linkages between development plots will be explored in order to tie-in with, and enhance, existing provision. Indeed, development would enable improved pedestrian and cycle connectivity in the wider area, particularly along the towpath of the disused Wendover arm of the Grand Union Canal. This would provide an excellent route
Transport & Movement
RAF Halton
\\pba.int\bir\Projects\40608 - RAF Halton, Buckinghamshire\Reports\Transport\Updated\40608 RAF Halton -Transport & Movement June 2018 issue.docx
25
between the site and Wendover as it is recognised that this is an important pedestrian/cycle corridor.
7.1.11 It is considered that, as part of any development on the site, a more local service be provided with the potential to tie-in with Wendover, Princes Risborough and Tring railway stations. The potential would also exist for using a demand responsive service like Arriva Click for future residents.
7.1.12 The Aylesbury Model will be used to test development scenarios and will cover all significant developments that could impact on the Aylesbury town network are required to use the Aylesbury Model as a starting basis for the assessment of detailed impacts. Continuing liaison with the highway authority will enable the data required, e.g. trip rates, to test development scenarios on the site to be established.
7.1.13 What is key to note is the fact that 1,000 dwellings have been included in the Countywide model and the principle established that the local transport network can accommodate the allocated scale of development.
Conclusion
7.2.1 At the heart of the National Planning Policy Framework (NPPF) is a presumption in favour of sustainable development which can, in part, be delivered by promoting sustainable transport.
7.2.2 One of the core land-use planning principles, described in the NPPF, is that planning should actively manage patterns of growth to make the fullest possible use of public transport, walking and cycling, and focus significant development in locations which are, or can be made, sustainable. Indeed, encouraging new developments in accessible locations allows a better uptake of sustainable transport modes.
7.2.3 The site is located where the potential to reduce the need to travel by private car and encourage the use of sustainable transport alternatives, backed up by appropriate mitigating measures, can be achieved.
7.2.4 Furthermore, the site is situated where opportunities exist to integrate with strategic transport infrastructure and development proposals, which will help to maximise its sustainable development potential.

Transport & Movement
RAF Halton
\\pba.int\bir\Projects\40608 - RAF Halton, Buckinghamshire\Reports\Transport\Updated\40608 RAF Halton -Transport & Movement June 2018 issue.docx
Appendix A Figures

Transport & Movement
RAF Halton
\\pba.int\bir\Projects\40608 - RAF Halton, Buckinghamshire\Reports\Transport\Updated\40608 RAF Halton -Transport & Movement June 2018 issue.docx
Appendix B Highway authority correspondence
1
Marc Rennie
From: Urry, Christine <[email protected]>
Sent: 29 May 2018 11:05
To: Marc Rennie
Cc: Hearn, Sarah; Winkels, Suzanne
Subject: RE: RAF Halton
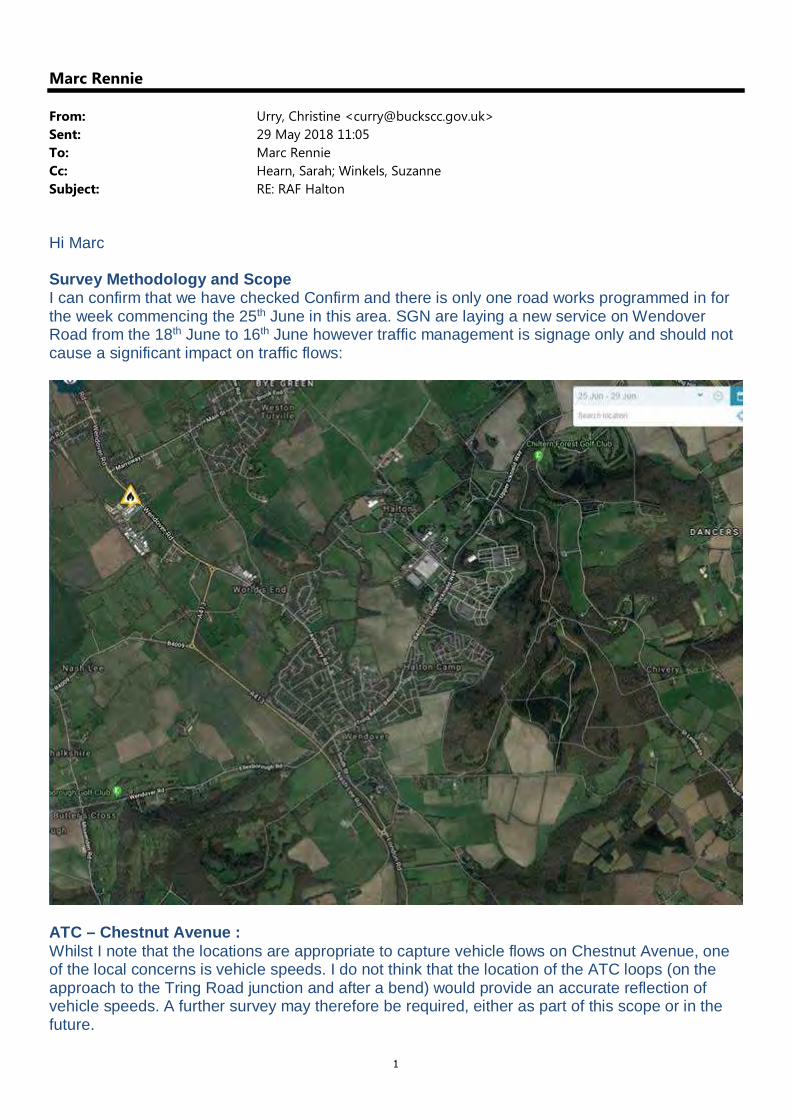
Hi Marc Survey Methodology and Scope I can confirm that we have checked Confirm and there is only one road works programmed in for the week commencing the 25th June in this area. SGN are laying a new service on Wendover Road from the 18th June to 16th June however traffic management is signage only and should not cause a significant impact on traffic flows:
ATC – Chestnut Avenue : Whilst I note that the locations are appropriate to capture vehicle flows on Chestnut Avenue, one of the local concerns is vehicle speeds. I do not think that the location of the ATC loops (on the approach to the Tring Road junction and after a bend) would provide an accurate reflection of vehicle speeds. A further survey may therefore be required, either as part of this scope or in the future.
2
I can confirm that I am happy with the scope of the surveys, in accordance with my email dated 9th May. It should however be noted that further supplementary surveys may be required once the requisite strategic modelling has been undertaken and the impacts of the proposal are better understood. Queue Length Surveys: I note that only 1 camera is proposed on each arm. I do not have any objections in principle, providing that this is sufficient to capture the end of the queue. If the queue goes out of site, then you may need to undertake the surveys again. Local Plan Examination As you are aware we are in a position where the DIO have formally objected to the Local Plan based on the housing numbers. The transport evidence base produced by Jacobs on behalf of AVDC and supported by the County Council is considered sufficient for the Local Plan Examination. I am unclear what evidence base you are looking to submit as part of the EiP? As you can appreciate we could not support any work, which is contrary to the principles as set out in the Local Plan in terms of scale. If you are seeking to provide further justification to support the 1,000 house allocation then I can discuss this with our transport strategy team whom are leading on the EiP. Kind Regards Chrissy Christine Urry Head of Highways Development Management Transport Economy Environment Tel: 01494 475355 Mobile: 07714345733 E-mail: [email protected] Buckinghamshire County Council, County Hall, Walton Street, Aylesbury, Bucks, HP20 1UA Visit our Website: www.buckscc.gov.uk From: Marc Rennie [mailto:[email protected]]
Sent: 28 May 2018 21:59 To: Urry, Christine Cc: Hearn, Sarah; Winkels, Suzanne
Subject: RE: RAF Halton
Hi Christine, Sorry I missed you at the workshop on Friday as I was on leave. However, I think we both know the extent of work that is required for the SPD. You have the information I have provided on the surveys, methodologies etc. What I would be keen to know is what, if anything, could we provide/use in advance of the EiP? In my view, even if we got some ATC data in the next couple of weeks, this wouldn’t provide much of an evidence base rather just a summary of existing traffic flows on the road links we are surveying; flows which you will already have? An evidence base requires some form of testing and, given the Aylesbury Model does not have Halton and Wendover included yet, I’m not sure what else we can provide? I would welcome your thoughts. Many thanks
3
Marc
Marc Rennie MRTPI MCIHT Associate Transport Planner For and on behalf of Peter Brett Associates LLP - Birmingham
t 01217968278
m 07469119201
w peterbrett.com
From: Marc Rennie
Sent: 24 May 2018 11:19
To: Urry, Christine <[email protected]>
Cc: [email protected]; [email protected]; Olivia Thomas <[email protected]>; Hearn,
Sarah <[email protected]>; Winkels, Suzanne <[email protected]>
Subject: RE: RAF Halton
Hi Christine and team, We have manged to get surveys booked in for the week commencing 25th June. This is the earliest date that the survey companies we approached could begin. I attach plans showing the locations of the:
• Parking accumulation surveys in Wendover (these will be undertaken over the two consecutive days of the turning counts between the hours of 6am-7pm).
• Automatic traffic counts (these will be undertaken over a 7 day, 24hour period with mid-week check); and • Junction turning counts (these will be undertaken over two consecutive weekdays between the hours of 7am-
10am and 4pm-7pm). I believe these meet all your requirements and would appreciate it if you could confirm your acceptance of the locations, durations, timings and methodologies. Many thanks, Marc
Marc Rennie MRTPI MCIHT Associate Transport Planner For and on behalf of Peter Brett Associates LLP - Birmingham
t 01217968278
m 07469119201
w peterbrett.com
4
From: Marc Rennie
Sent: 23 May 2018 12:30
To: Urry, Christine <[email protected]>
Cc: [email protected]; [email protected]; Olivia Thomas <[email protected]>; Hearn,
Sarah <[email protected]>; Winkels, Suzanne <[email protected]>
Subject: RE: RAF Halton
Hi Christine, Many thanks for this. As you’ve requested more locations to be surveyed since our meeting I am having to wait on dates for when the survey companies can fit these in. I will get back to you with these as soon as I find out from them. In the meantime, the methodology for the surveys will be broadly as follows: Methodology - Car park accumulation surveys Standard practice is to video record in/out movements on site using high-level High Definition micro cameras attached to street furniture. Enumerators will undertake the analysis manually in the office. Vehicles will be classified into 7 classifications: (Pedal cycles, Motor cycles, Cars, LGV, OGV1, OGV2, Bus & Coaches). All count data will be summarised in 15 minute intervals by movement with period totals. The number of spaces in the car park will be counted prior to the survey starting. A count of the total number of vehicles occupying the car park will also be taken before and after the surveys. This will enable the accumulation graph to be produced. The data would be presented by email in Excel format. Methodology – Traffic Counts Standard practice is to video record traffic movements on site using high-level High Definition micro cameras attached to street furniture. Enumerators will undertake the analysis manually in the office. Vehicles will be classified into 7 classifications: (Pedal cycles, Motor cycles, Cars, LGV, OGV1, OGV2, Bus & Coaches). All count data will be summarised in 15 minute intervals by movement with period totals. Methodology- Queue length Surveys Queues are recorded using video cameras, usually 1 per arm unless stated otherwise. Queues will be recorded in in vehicle length meters, once every 5min. Methodology - ATC Data is bi-directional for speed (5 mph bins) and class in 15, 30 & 60min intervals. The ARX classification scheme is used. ATC data would report classified counts in 10 classes, in addition vehicle speeds would be reported and the 85%ile and would be supplied. All ATC data would be reported in MS Excel format and will include location plans detailing exact ATC installation locations. Kind regards, Marc
Marc Rennie MRTPI MCIHT Associate Transport Planner For and on behalf of Peter Brett Associates LLP - Birmingham
t 01217968278
m 07469119201
w peterbrett.com

5
From: Urry, Christine [mailto:[email protected]]
Sent: 09 May 2018 12:45
To: Marc Rennie <[email protected]>
Cc: [email protected]; [email protected]; Olivia Thomas <[email protected]>; Hearn,
Sarah <[email protected]>; Winkels, Suzanne <[email protected]>
Subject: RE: RAF Halton
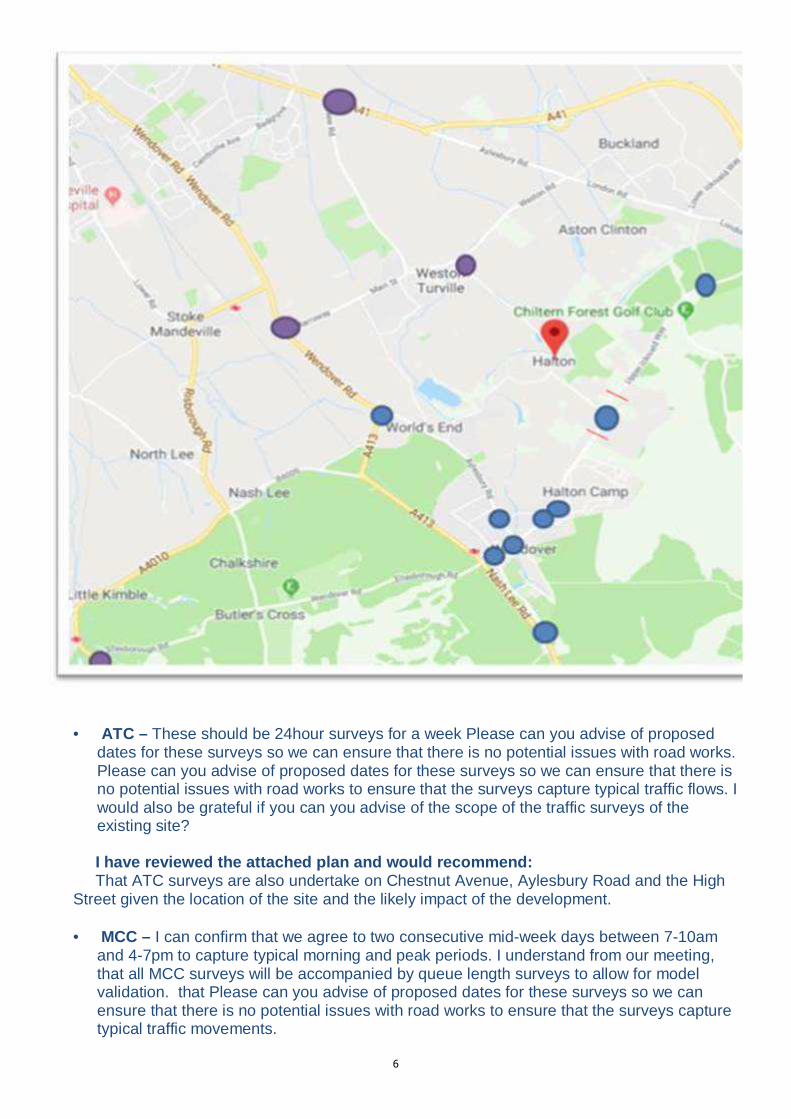
Hi Marc As discussed at our last meeting, please find attached the Aylesbury Model network and zoning plan. The network is black and the zone boundaries are green. In the network there are some development zones that don’t have zone boundaries defined (and don’t show up on the map) however these are unlikely to affect current work in Halton. As advised the Aylesbury Model Validation Report is not available at this stage, as Jacobs are in the process of completing the model update. The model is due to be available for use in the summer. Once the LMVR is available, I will share this with you. Survey Scope: Please find attached a plan showing survey locations, as discussed at our meeting. It should be noted that the scope of survey locations may need to be widened once the requisite strategic modelling has been undertaken and the impacts of the proposal are better understood:
6
• ATC – These should be 24hour surveys for a week Please can you advise of proposed dates for these surveys so we can ensure that there is no potential issues with road works. Please can you advise of proposed dates for these surveys so we can ensure that there is no potential issues with road works to ensure that the surveys capture typical traffic flows. I would also be grateful if you can you advise of the scope of the traffic surveys of the existing site?
I have reviewed the attached plan and would recommend: That ATC surveys are also undertake on Chestnut Avenue, Aylesbury Road and the High Street given the location of the site and the likely impact of the development.
• MCC – I can confirm that we agree to two consecutive mid-week days between 7-10am
and 4-7pm to capture typical morning and peak periods. I understand from our meeting, that all MCC surveys will be accompanied by queue length surveys to allow for model validation. that Please can you advise of proposed dates for these surveys so we can ensure that there is no potential issues with road works to ensure that the surveys capture typical traffic movements.
7
I have reviewed the attached plan and I would recommend including the following junctions: Aylesbury Road/ Wharf Road (this is due to the location of the schools in Wendover and
the fact that this is generally used as a rat run to avoid congestion at the clock tower roundabout).
• Parking Surveys – this covers all public car parks within Wendover. Please can you advise of the proposed methodology for the parking surveys and whether this will also cover cycle parking at the train station? We are aware of town/station car parking on the local road network (in particular Tring Hill on the approach to the roundabout). It may be worth collecting data on this at the same time as you are undertaking queue length surveys at the junction.
• Travel Survey – I am content with the scope of the travel survey, which is to be used to understand person (multimodal) trips alongside traffic survey data of the existing use. I note that you are unable to provide the raw data due to personnel security, as such can you consider how this can best be displayed and analysed e.g. postcode isochrones?
Committed Developments:
• Hampden Fields – All information is available on the planning portal (16/00424/AOP ). I would recommend that you review the trip rates for this development, as a comparable of a strategic site and I will send you the relevant information from the technical assessment to assist.
• Woodlands – All information is available on the planning portal (16/01040/AOP). I would recommend that you review the trip rates for this development, as a comparable of a strategic site and I will send you the relevant information from the technical assessment to assist.
• Stoke Mandeville By-Pass – this was not a formal planning application and was approved as part of the HS2 Hybrid Bill. The Stoke Mandeville bypass was included in the Hampden Fields and Woodlands strategic modelling as a committed scheme.
• South East Aylesbury Link Road – this is a DfT retained scheme and a planning application is due in the summer (once the Aylesbury model update has been completed). The SEALR has been included as a scenario in the Hampden Fields and Woodlands Strategic modelling.
It should be noted that the Aylesbury model used for the purposes of assessing Hampden Fields and Woodlands planning applications did not extend to cover Wendover and Halton. All committed developments will be included in the updated Aylesbury model. I will forward our assessment of the technical note beginning of next week once I have reviewed the TRICs site selection. I will also include a draft Planning Performance Agreement, for your input and comment. Kind Regards Chrissy Christine Urry Head of Highways Development Management Transport Economy Environment Tel: 01494 475355 Mobile: 07714345733 E-mail: [email protected] Buckinghamshire County Council, County Hall, Walton Street, Aylesbury, Bucks, HP20 1UA
8
Visit our Website: www.buckscc.gov.uk From: Marc Rennie [mailto:[email protected]]
Sent: 02 May 2018 14:55 To: Urry, Christine; Winkels, Suzanne
Cc: [email protected]; [email protected]; Olivia Thomas Subject: RAF Halton
Hi Christine and Suzanne, Following our meeting, please find attached plans highlighting where surveys are required. The MCCs (including queue lengths) would be undertaken between 7am-10am and 4pm-7pm on 2 consecutive midweek days to capture typical morning and evening peak periods. The ATCs would be down for a week. I also attach a copy of the Travel Survey that we intend to issue to civilians, military personal and trainees at the Base. I would appreciate if you could confirm your acceptance, or amendments, to these so that we can proceed. As discussed, we would be most grateful if you provide us with:
• Aylesbury Model network plan • Aylesbury Model zoning plan • Aylesbury Model Validation Report • The plan you tabled at the meeting that showed the survey locations and potential future survey locations
(the purple coloured junctions) • Chiltern Rail contacts
In addition, I would be most grateful if you could provide us with any other thoughts you had on the Reps document we provided to you and any transport/TA links to the following schemes:
• Hampden Fields • Stoke Mandeville Bypass • A4010 and A414 by-pass extension
Many thanks, Marc Marc Rennie MRTPI MCIHT Associate Transport Planner For and on behalf of Peter Brett Associates LLP - Birmingham
t 01217968278
m 07469119201
w peterbrett.com
This email and any attachments are confidential and protected by copyright. If you receive it in error, please notify
us immediately and remove it from your system. Peter Brett Associates LLP (PBA) is a limited liability partnership
registered in England and Wales. The terms Partner and Member refer to a member of PBA and a list is open for
inspection at its registered office. Registered no: OC334398. VAT no: GB115143456. Registered office: Caversham
Bridge House, Waterman Place, Reading, RG1 8DN. T: +44 (0) 0118 950 0761, Email [email protected].

9
Buckinghamshire County Council Visit our Web Site : http://www.buckscc.gov.uk Buckinghamshire County Council Email Disclaimer This Email, and any attachments, may contain Protected or Restricted information and is intended solely for the individual to whom it is addressed. It may contain sensitive or protectively marked material and should be handled accordingly. If this Email has been misdirected, please notify the author or [email protected] immediately. If you are not the intended recipient you must not disclose, distribute, copy, print or rely on any of the information contained in it or attached, and all copies must be deleted immediately. Whilst we take reasonable steps to try to identify any software viruses, any attachments to this Email may nevertheless contain viruses which our anti-virus software has failed to identify. You should therefore carry out your own anti-virus checks before opening any documents. Buckinghamshire County Council will not accept any liability for damage caused by computer viruses emanating from any attachment or other document supplied with this email. All GCSx traffic may be subject to recording and / or monitoring in accordance with relevant legislation. The views expressed in this email are not necessarily those of Buckinghamshire County Council unless explicitly stated. This footnote also confirms that this email has been swept for content and for the presence of computer viruses.
-----------------------------------------------------------------------------------------------------------
This message has been scanned for viruses by Websense
_
This email and any attachments to it are intended only for the party to whom they are addressed. They may contain
confidential and, or privileged information. If receive this in error, please notify the sender immediately and
delete/destroy any digital and paper copies. Any review, re-transmission, dissemination or other use of, or taking
action in reliance upon, this message by persons or entities other than the intended recipient is prohibited. Peter
Brett Associates LLP (PBA) is a limited liability partnership registered in England and Wales with registered number
OC334398 (VAT no. GB115143456) and registered office at Caversham Bridge House, Waterman Place, Reading, RG1
8DN. T: +44 (0) 0118 950 0761. Email [email protected]. The terms 'Partner' and 'Member' refer to a member of
PBA and a list is open for inspection at its registered office. For viewing PBA's privacy notice, please visit
www.peterbrett.com.

Transport & Movement
RAF Halton
\\pba.int\bir\Projects\40608 - RAF Halton, Buckinghamshire\Reports\Transport\Updated\40608 RAF Halton -Transport & Movement June 2018 issue.docx
Appendix C TRICS output
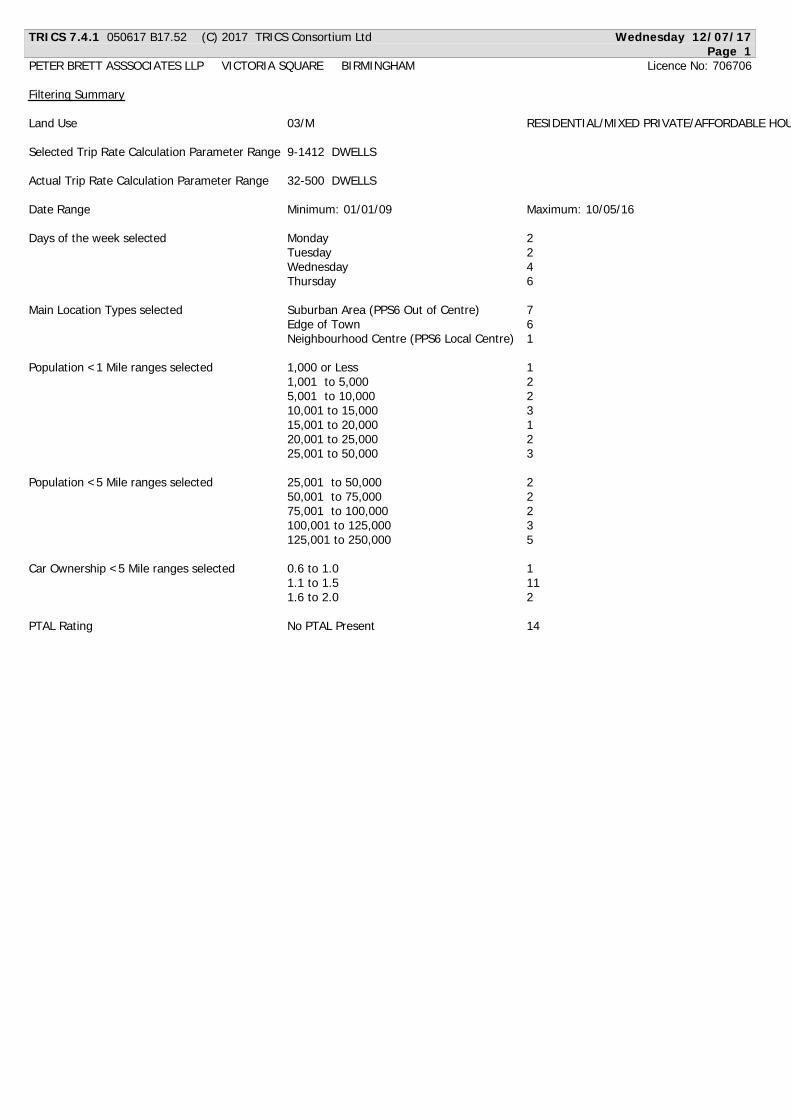
TRICS 7.4.1 050617 B17.52 (C) 2017 TRICS Consortium Ltd Wednesday 12/07/17
Page 1
PETER BRETT ASSSOCIATES LLP VICTORIA SQUARE BIRMINGHAM Licence No: 706706
Filtering Summary
Land Use 03/M RESIDENTIAL/MIXED PRIVATE/AFFORDABLE HOUSING
Selected Trip Rate Calculation Parameter Range 9-1412 DWELLS
Actual Trip Rate Calculation Parameter Range 32-500 DWELLS
Date Range Minimum: 01/01/09 Maximum: 10/05/16
Days of the week selected Monday 2
Tuesday 2
Wednesday 4
Thursday 6
Main Location Types selected Suburban Area (PPS6 Out of Centre) 7
Edge of Town 6
Neighbourhood Centre (PPS6 Local Centre) 1
Population <1 Mile ranges selected 1,000 or Less 1
1,001 to 5,000 2
5,001 to 10,000 2
10,001 to 15,000 3
15,001 to 20,000 1
20,001 to 25,000 2
25,001 to 50,000 3
Population <5 Mile ranges selected 25,001 to 50,000 2
50,001 to 75,000 2
75,001 to 100,000 2
100,001 to 125,000 3
125,001 to 250,000 5
Car Ownership <5 Mile ranges selected 0.6 to 1.0 1
1.1 to 1.5 11
1.6 to 2.0 2
PTAL Rating No PTAL Present 14
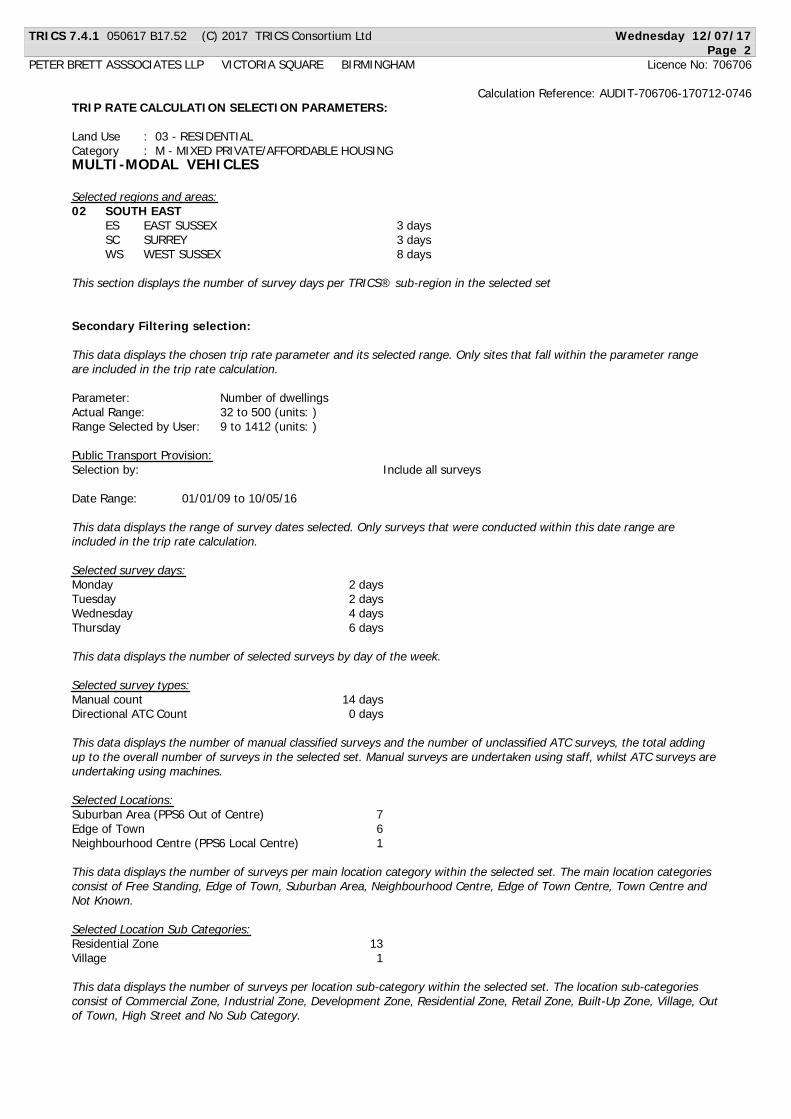
TRICS 7.4.1 050617 B17.52 (C) 2017 TRICS Consortium Ltd Wednesday 12/07/17
Page 2
PETER BRETT ASSSOCIATES LLP VICTORIA SQUARE BIRMINGHAM Licence No: 706706
Calculation Reference: AUDIT-706706-170712-0746
TRIP RATE CALCULATION SELECTION PARAMETERS:
Land Use : 03 - RESIDENTIAL
Category : M - MIXED PRIVATE/AFFORDABLE HOUSING
MULTI-MODAL VEHICLES
Selected regions and areas:
02 SOUTH EAST
ES EAST SUSSEX 3 days
SC SURREY 3 days
WS WEST SUSSEX 8 days
This section displays the number of survey days per TRICS® sub-region in the selected set
Secondary Filtering selection:
This data displays the chosen trip rate parameter and its selected range. Only sites that fall within the parameter range
are included in the trip rate calculation.
Parameter: Number of dwellings
Actual Range: 32 to 500 (units: )
Range Selected by User: 9 to 1412 (units: )
Public Transport Provision:
Selection by: Include all surveys
Date Range: 01/01/09 to 10/05/16
This data displays the range of survey dates selected. Only surveys that were conducted within this date range are
included in the trip rate calculation.
Selected survey days:
Monday 2 days
Tuesday 2 days
Wednesday 4 days
Thursday 6 days
This data displays the number of selected surveys by day of the week.
Selected survey types:
Manual count 14 days
Directional ATC Count 0 days
This data displays the number of manual classified surveys and the number of unclassified ATC surveys, the total adding
up to the overall number of surveys in the selected set. Manual surveys are undertaken using staff, whilst ATC surveys are
undertaking using machines.
Selected Locations:
Suburban Area (PPS6 Out of Centre) 7
Edge of Town 6
Neighbourhood Centre (PPS6 Local Centre) 1
This data displays the number of surveys per main location category within the selected set. The main location categories
consist of Free Standing, Edge of Town, Suburban Area, Neighbourhood Centre, Edge of Town Centre, Town Centre and
Not Known.
Selected Location Sub Categories:
Residential Zone 13
Village 1
This data displays the number of surveys per location sub-category within the selected set. The location sub-categories
consist of Commercial Zone, Industrial Zone, Development Zone, Residential Zone, Retail Zone, Built-Up Zone, Village, Out
of Town, High Street and No Sub Category.
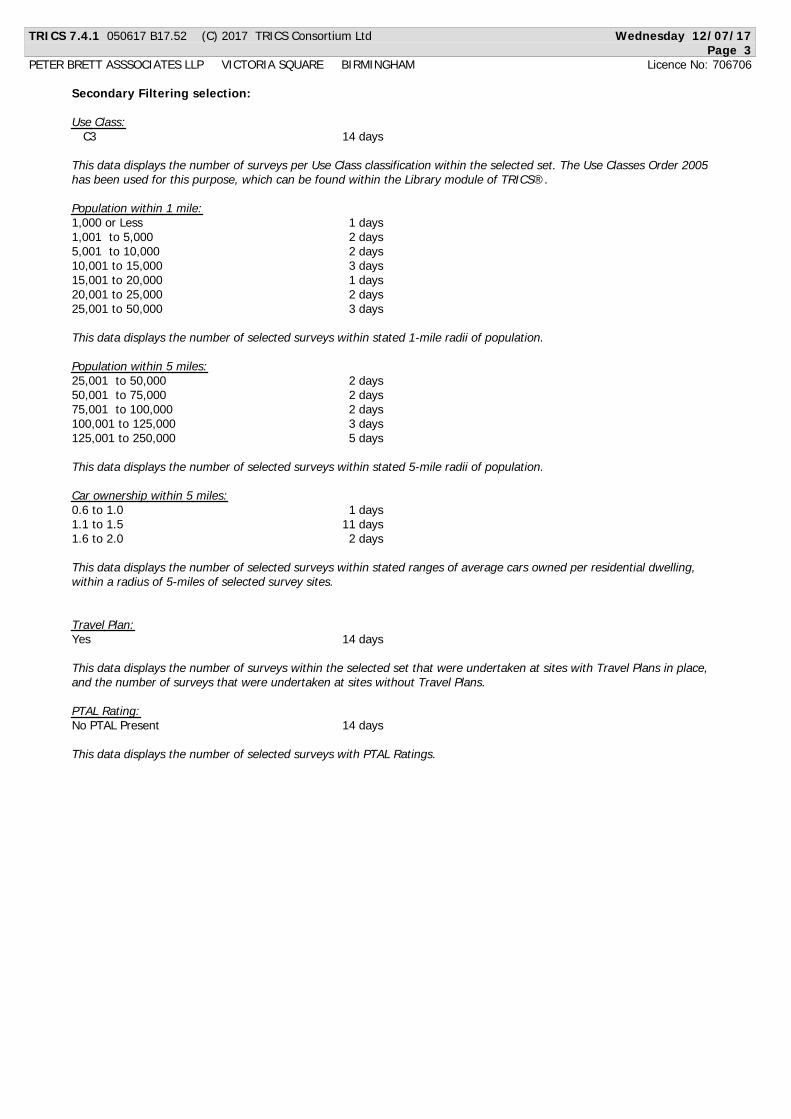
TRICS 7.4.1 050617 B17.52 (C) 2017 TRICS Consortium Ltd Wednesday 12/07/17
Page 3
PETER BRETT ASSSOCIATES LLP VICTORIA SQUARE BIRMINGHAM Licence No: 706706
Secondary Filtering selection:
Use Class:
C 3 14 days
This data displays the number of surveys per Use Class classification within the selected set. The Use Classes Order 2005
has been used for this purpose, which can be found within the Library module of TRICS®.
Population within 1 mile:
1,000 or Less 1 days
1,001 to 5,000 2 days
5,001 to 10,000 2 days
10,001 to 15,000 3 days
15,001 to 20,000 1 days
20,001 to 25,000 2 days
25,001 to 50,000 3 days
This data displays the number of selected surveys within stated 1-mile radii of population.
Population within 5 miles:
25,001 to 50,000 2 days
50,001 to 75,000 2 days
75,001 to 100,000 2 days
100,001 to 125,000 3 days
125,001 to 250,000 5 days
This data displays the number of selected surveys within stated 5-mile radii of population.
Car ownership within 5 miles:
0.6 to 1.0 1 days
1.1 to 1.5 11 days
1.6 to 2.0 2 days
This data displays the number of selected surveys within stated ranges of average cars owned per residential dwelling,
within a radius of 5-miles of selected survey sites.
Travel Plan:
Yes 14 days
This data displays the number of surveys within the selected set that were undertaken at sites with Travel Plans in place,
and the number of surveys that were undertaken at sites without Travel Plans.
PTAL Rating:
No PTAL Present 14 days
This data displays the number of selected surveys with PTAL Ratings.
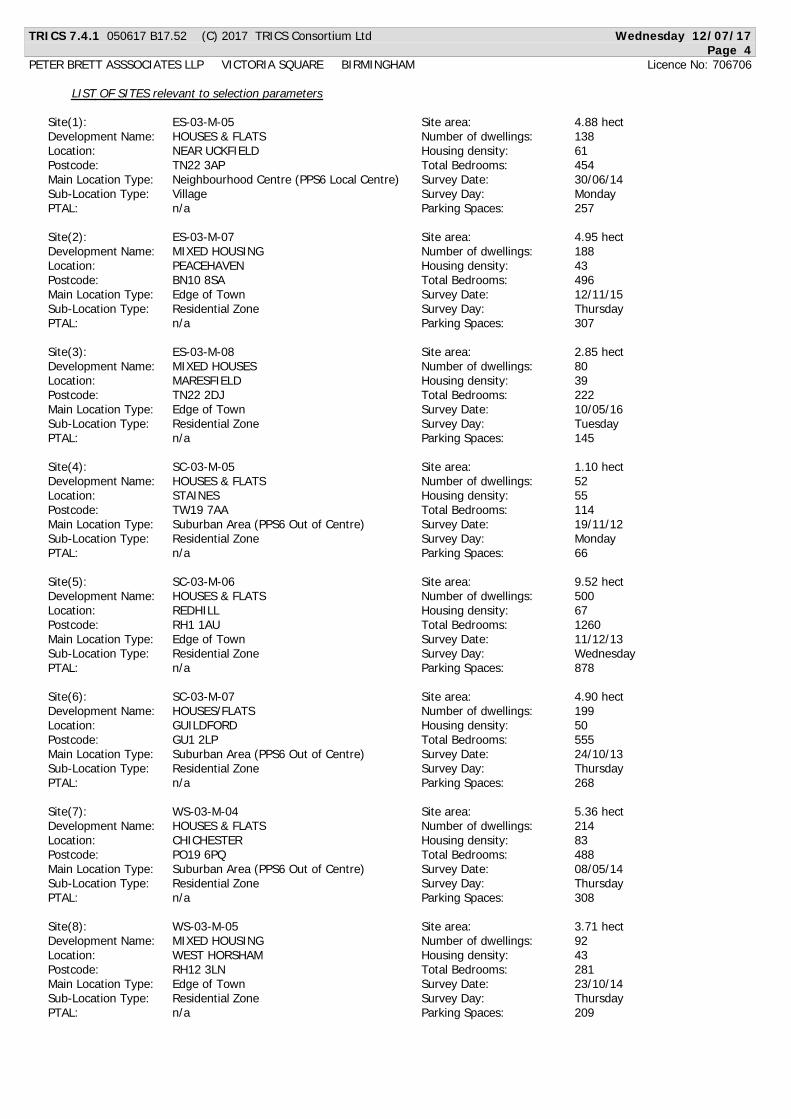
TRICS 7.4.1 050617 B17.52 (C) 2017 TRICS Consortium Ltd Wednesday 12/07/17
Page 4
PETER BRETT ASSSOCIATES LLP VICTORIA SQUARE BIRMINGHAM Licence No: 706706
LIST OF SITES relevant to selection parameters
Site(1): ES-03-M-05 Site area: 4.88 hect
Development Name: HOUSES & FLATS Number of dwellings: 1 3 8
Location: NEAR UCKFIELD Housing density: 6 1
Postcode: TN22 3AP Total Bedrooms: 4 5 4
Main Location Type: Neighbourhood Centre (PPS6 Local Centre) Survey Date: 30/06/14
Sub-Location Type: Village Survey Day: Monday
PTAL: n/a Parking Spaces: 257
Site(2): ES-03-M-07 Site area: 4.95 hect
Development Name: MIXED HOUSING Number of dwellings: 1 8 8
Location: PEACEHAVEN Housing density: 4 3
Postcode: BN10 8SA Total Bedrooms: 4 9 6
Main Location Type: Edge of Town Survey Date: 12/11/15
Sub-Location Type: Residential Zone Survey Day: Thursday
PTAL: n/a Parking Spaces: 307
Site(3): ES-03-M-08 Site area: 2.85 hect
Development Name: MIXED HOUSES Number of dwellings: 8 0
Location: MARESFIELD Housing density: 3 9
Postcode: TN22 2DJ Total Bedrooms: 2 2 2
Main Location Type: Edge of Town Survey Date: 10/05/16
Sub-Location Type: Residential Zone Survey Day: Tuesday
PTAL: n/a Parking Spaces: 145
Site(4): SC-03-M-05 Site area: 1.10 hect
Development Name: HOUSES & FLATS Number of dwellings: 5 2
Location: STAINES Housing density: 5 5
Postcode: TW19 7AA Total Bedrooms: 1 1 4
Main Location Type: Suburban Area (PPS6 Out of Centre) Survey Date: 19/11/12
Sub-Location Type: Residential Zone Survey Day: Monday
PTAL: n/a Parking Spaces: 66
Site(5): SC-03-M-06 Site area: 9.52 hect
Development Name: HOUSES & FLATS Number of dwellings: 5 0 0
Location: REDHILL Housing density: 6 7
Postcode: RH1 1AU Total Bedrooms: 1 2 6 0
Main Location Type: Edge of Town Survey Date: 11/12/13
Sub-Location Type: Residential Zone Survey Day: Wednesday
PTAL: n/a Parking Spaces: 878
Site(6): SC-03-M-07 Site area: 4.90 hect
Development Name: HOUSES/FLATS Number of dwellings: 1 9 9
Location: GUILDFORD Housing density: 5 0
Postcode: GU1 2LP Total Bedrooms: 5 5 5
Main Location Type: Suburban Area (PPS6 Out of Centre) Survey Date: 24/10/13
Sub-Location Type: Residential Zone Survey Day: Thursday
PTAL: n/a Parking Spaces: 268
Site(7): WS-03-M-04 Site area: 5.36 hect
Development Name: HOUSES & FLATS Number of dwellings: 2 1 4
Location: CHICHESTER Housing density: 8 3
Postcode: PO19 6PQ Total Bedrooms: 4 8 8
Main Location Type: Suburban Area (PPS6 Out of Centre) Survey Date: 08/05/14
Sub-Location Type: Residential Zone Survey Day: Thursday
PTAL: n/a Parking Spaces: 308
Site(8): WS-03-M-05 Site area: 3.71 hect
Development Name: MIXED HOUSING Number of dwellings: 9 2
Location: WEST HORSHAM Housing density: 4 3
Postcode: RH12 3LN Total Bedrooms: 2 8 1
Main Location Type: Edge of Town Survey Date: 23/10/14
Sub-Location Type: Residential Zone Survey Day: Thursday
PTAL: n/a Parking Spaces: 209
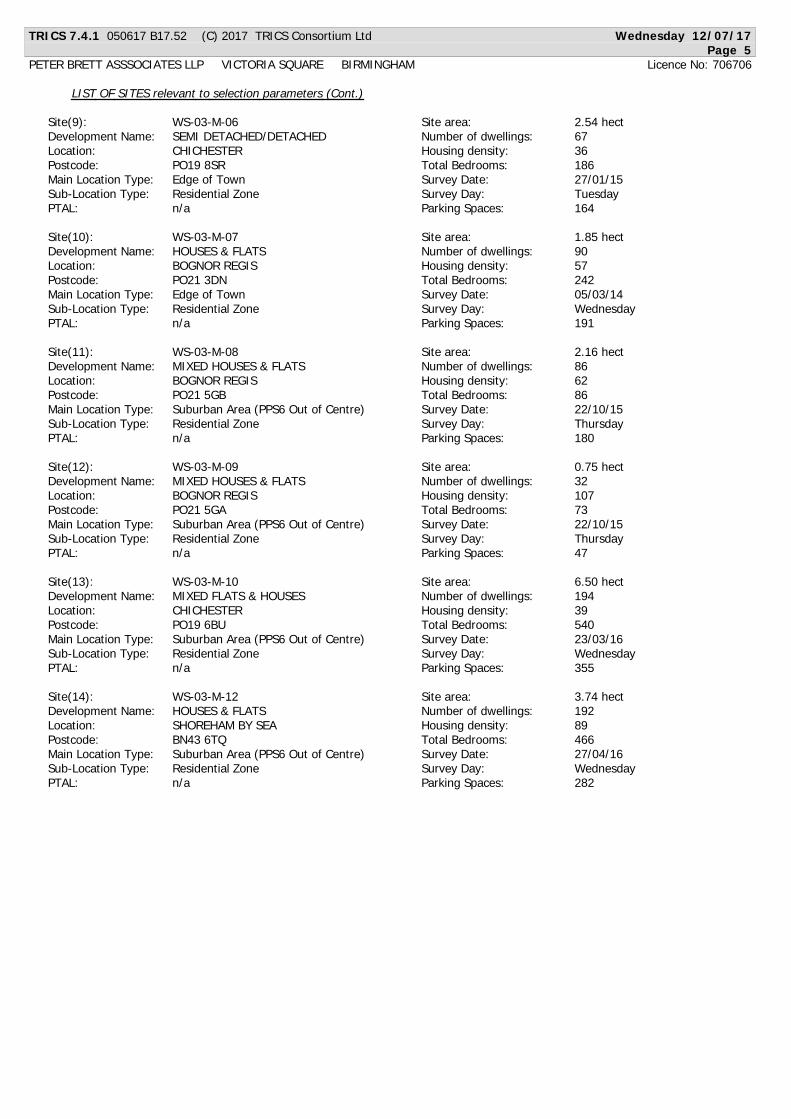
TRICS 7.4.1 050617 B17.52 (C) 2017 TRICS Consortium Ltd Wednesday 12/07/17
Page 5
PETER BRETT ASSSOCIATES LLP VICTORIA SQUARE BIRMINGHAM Licence No: 706706
LIST OF SITES relevant to selection parameters (Cont.)
Site(9): WS-03-M-06 Site area: 2.54 hect
Development Name: SEMI DETACHED/DETACHED Number of dwellings: 6 7
Location: CHICHESTER Housing density: 3 6
Postcode: PO19 8SR Total Bedrooms: 1 8 6
Main Location Type: Edge of Town Survey Date: 27/01/15
Sub-Location Type: Residential Zone Survey Day: Tuesday
PTAL: n/a Parking Spaces: 164
Site(10): WS-03-M-07 Site area: 1.85 hect
Development Name: HOUSES & FLATS Number of dwellings: 9 0
Location: BOGNOR REGIS Housing density: 5 7
Postcode: PO21 3DN Total Bedrooms: 2 4 2
Main Location Type: Edge of Town Survey Date: 05/03/14
Sub-Location Type: Residential Zone Survey Day: Wednesday
PTAL: n/a Parking Spaces: 191
Site(11): WS-03-M-08 Site area: 2.16 hect
Development Name: MIXED HOUSES & FLATS Number of dwellings: 8 6
Location: BOGNOR REGIS Housing density: 6 2
Postcode: PO21 5GB Total Bedrooms: 8 6
Main Location Type: Suburban Area (PPS6 Out of Centre) Survey Date: 22/10/15
Sub-Location Type: Residential Zone Survey Day: Thursday
PTAL: n/a Parking Spaces: 180
Site(12): WS-03-M-09 Site area: 0.75 hect
Development Name: MIXED HOUSES & FLATS Number of dwellings: 3 2
Location: BOGNOR REGIS Housing density: 1 0 7
Postcode: PO21 5GA Total Bedrooms: 7 3
Main Location Type: Suburban Area (PPS6 Out of Centre) Survey Date: 22/10/15
Sub-Location Type: Residential Zone Survey Day: Thursday
PTAL: n/a Parking Spaces: 47
Site(13): WS-03-M-10 Site area: 6.50 hect
Development Name: MIXED FLATS & HOUSES Number of dwellings: 1 9 4
Location: CHICHESTER Housing density: 3 9
Postcode: PO19 6BU Total Bedrooms: 5 4 0
Main Location Type: Suburban Area (PPS6 Out of Centre) Survey Date: 23/03/16
Sub-Location Type: Residential Zone Survey Day: Wednesday
PTAL: n/a Parking Spaces: 355
Site(14): WS-03-M-12 Site area: 3.74 hect
Development Name: HOUSES & FLATS Number of dwellings: 1 9 2
Location: SHOREHAM BY SEA Housing density: 8 9
Postcode: BN43 6TQ Total Bedrooms: 4 6 6
Main Location Type: Suburban Area (PPS6 Out of Centre) Survey Date: 27/04/16
Sub-Location Type: Residential Zone Survey Day: Wednesday
PTAL: n/a Parking Spaces: 282
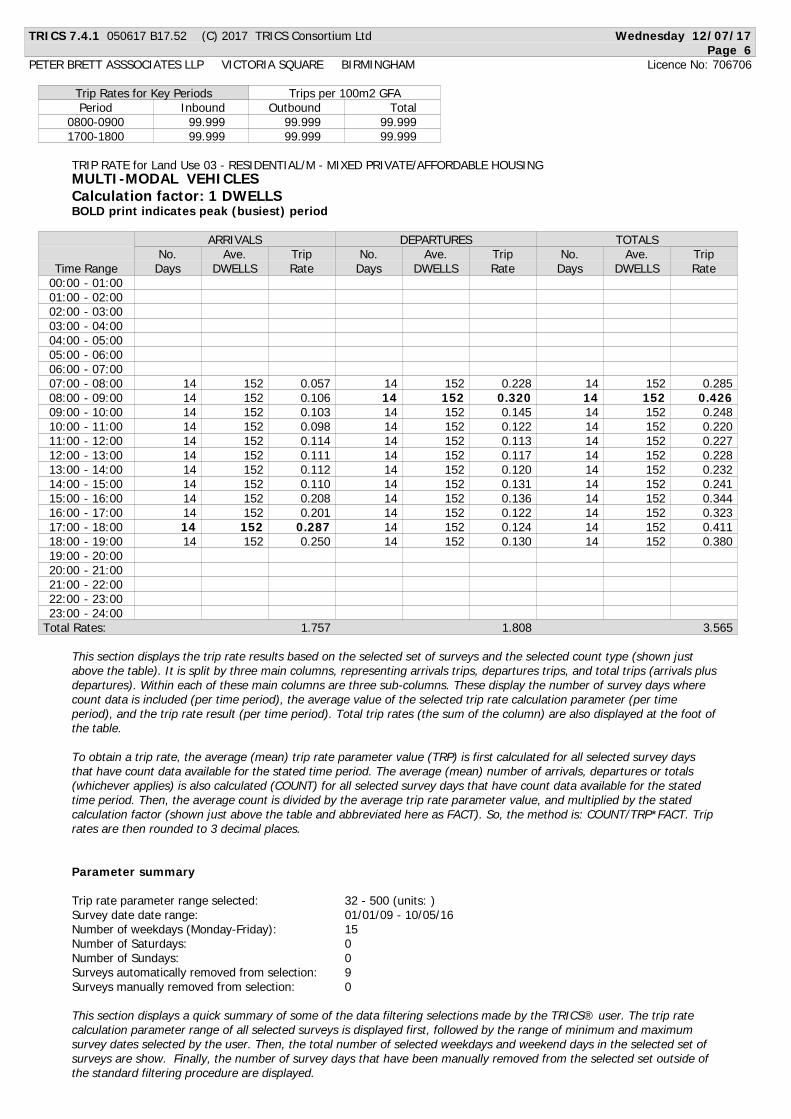
TRICS 7.4.1 050617 B17.52 (C) 2017 TRICS Consortium Ltd Wednesday 12/07/17
Page 6
PETER BRETT ASSSOCIATES LLP VICTORIA SQUARE BIRMINGHAM Licence No: 706706
Trip Rates for Key Periods Trips per 100m2 GFA
Period Inbound Outbound Total
0800-0900 99.999 99.999 99.999
1700-1800 99.999 99.999 99.999
TRIP RATE for Land Use 03 - RESIDENTIAL/M - MIXED PRIVATE/AFFORDABLE HOUSING
MULTI-MODAL VEHICLES
Calculation factor: 1 DWELLS
BOLD print indicates peak (busiest) period
ARRIVALS DEPARTURES TOTALS
No. Ave. Trip No. Ave. Trip No. Ave. Trip
Time Range Days DWELLS Rate Days DWELLS Rate Days DWELLS Rate
00:00 - 01:00
01:00 - 02:00
02:00 - 03:00
03:00 - 04:00
04:00 - 05:00
05:00 - 06:00
06:00 - 07:00
14 152 0.057 14 152 0.228 14 152 0.28507:00 - 08:00
14 152 0.106 14 152 0.320 14 152 0.42608:00 - 09:00
14 152 0.103 14 152 0.145 14 152 0.24809:00 - 10:00
14 152 0.098 14 152 0.122 14 152 0.22010:00 - 11:00
14 152 0.114 14 152 0.113 14 152 0.22711:00 - 12:00
14 152 0.111 14 152 0.117 14 152 0.22812:00 - 13:00
14 152 0.112 14 152 0.120 14 152 0.23213:00 - 14:00
14 152 0.110 14 152 0.131 14 152 0.24114:00 - 15:00
14 152 0.208 14 152 0.136 14 152 0.34415:00 - 16:00
14 152 0.201 14 152 0.122 14 152 0.32316:00 - 17:00
14 152 0.287 14 152 0.124 14 152 0.41117:00 - 18:00
14 152 0.250 14 152 0.130 14 152 0.38018:00 - 19:00
19:00 - 20:00
20:00 - 21:00
21:00 - 22:00
22:00 - 23:00
23:00 - 24:00
Total Rates: 1.757 1.808 3.565
This section displays the trip rate results based on the selected set of surveys and the selected count type (shown just
above the table). It is split by three main columns, representing arrivals trips, departures trips, and total trips (arrivals plus
departures). Within each of these main columns are three sub-columns. These display the number of survey days where
count data is included (per time period), the average value of the selected trip rate calculation parameter (per time
period), and the trip rate result (per time period). Total trip rates (the sum of the column) are also displayed at the foot of
the table.
To obtain a trip rate, the average (mean) trip rate parameter value (TRP) is first calculated for all selected survey days
that have count data available for the stated time period. The average (mean) number of arrivals, departures or totals
(whichever applies) is also calculated (COUNT) for all selected survey days that have count data available for the stated
time period. Then, the average count is divided by the average trip rate parameter value, and multiplied by the stated
calculation factor (shown just above the table and abbreviated here as FACT). So, the method is: COUNT/TRP*FACT. Trip
rates are then rounded to 3 decimal places.
Parameter summary
Trip rate parameter range selected: 32 - 500 (units: )
Survey date date range: 01/01/09 - 10/05/16
Number of weekdays (Monday-Friday): 15
Number of Saturdays: 0
Number of Sundays: 0
Surveys automatically removed from selection: 9
Surveys manually removed from selection: 0
This section displays a quick summary of some of the data filtering selections made by the TRICS® user. The trip rate
calculation parameter range of all selected surveys is displayed first, followed by the range of minimum and maximum
survey dates selected by the user. Then, the total number of selected weekdays and weekend days in the selected set of
surveys are show. Finally, the number of survey days that have been manually removed from the selected set outside of
the standard filtering procedure are displayed.
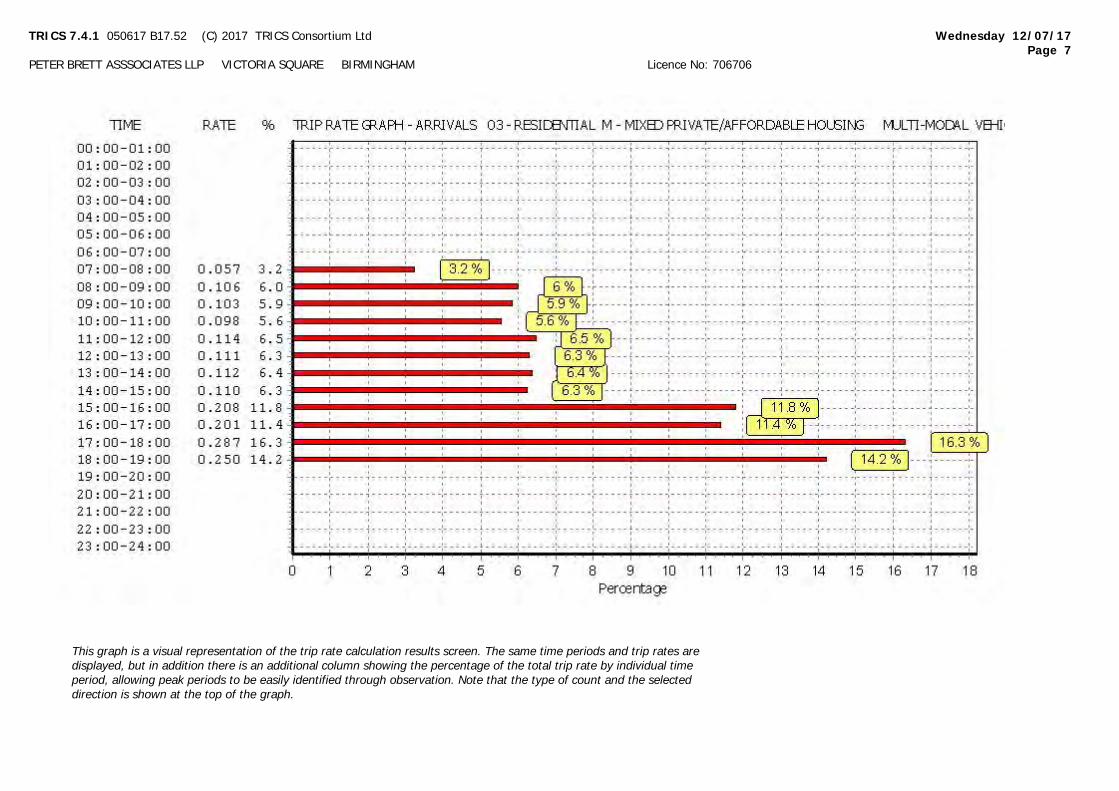
TRICS 7.4.1 050617 B17.52 (C) 2017 TRICS Consortium Ltd Wednesday 12/07/17
Page 7
PETER BRETT ASSSOCIATES LLP VICTORIA SQUARE BIRMINGHAM Licence No: 706706
This graph is a visual representation of the trip rate calculation results screen. The same time periods and trip rates are
displayed, but in addition there is an additional column showing the percentage of the total trip rate by individual time
period, allowing peak periods to be easily identified through observation. Note that the type of count and the selected
direction is shown at the top of the graph.
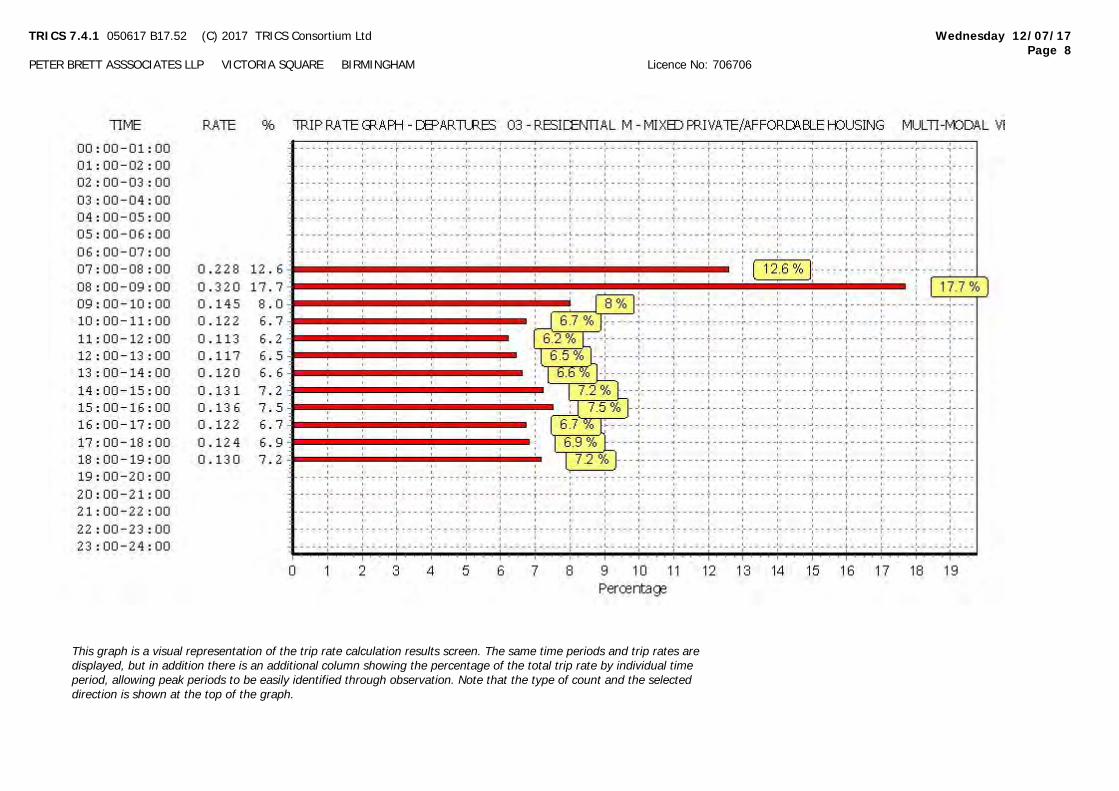
TRICS 7.4.1 050617 B17.52 (C) 2017 TRICS Consortium Ltd Wednesday 12/07/17
Page 8
PETER BRETT ASSSOCIATES LLP VICTORIA SQUARE BIRMINGHAM Licence No: 706706
This graph is a visual representation of the trip rate calculation results screen. The same time periods and trip rates are
displayed, but in addition there is an additional column showing the percentage of the total trip rate by individual time
period, allowing peak periods to be easily identified through observation. Note that the type of count and the selected
direction is shown at the top of the graph.
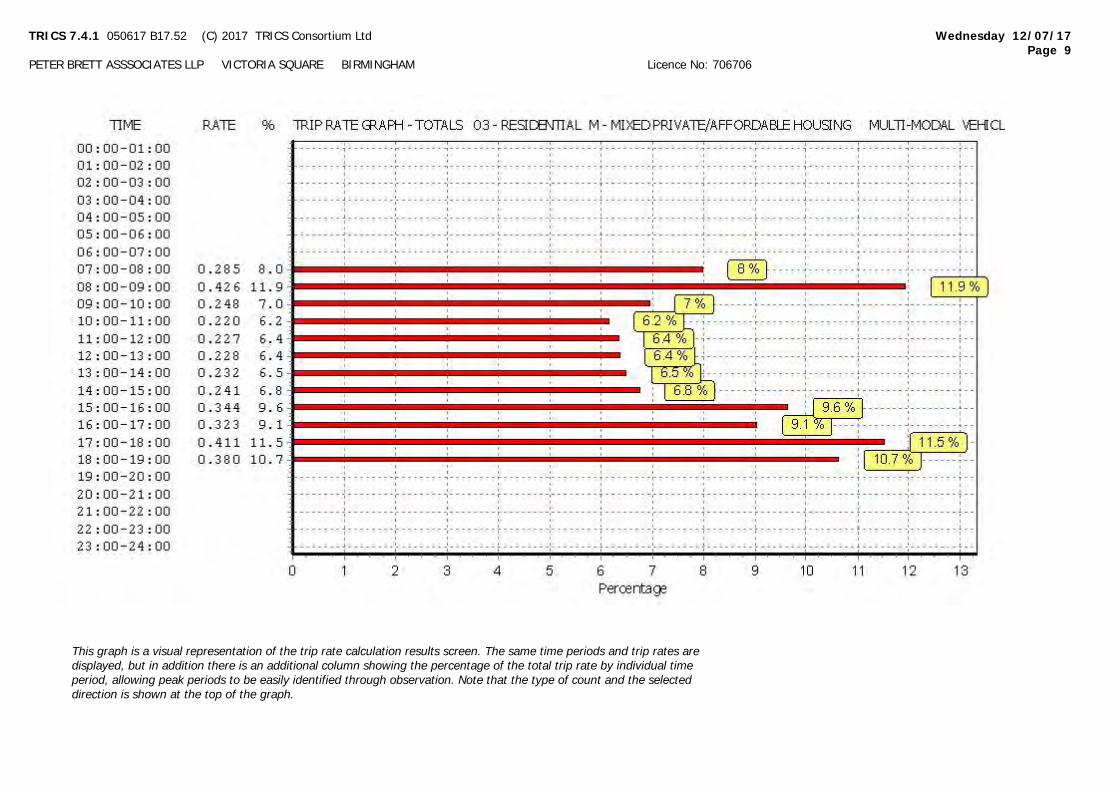
TRICS 7.4.1 050617 B17.52 (C) 2017 TRICS Consortium Ltd Wednesday 12/07/17
Page 9
PETER BRETT ASSSOCIATES LLP VICTORIA SQUARE BIRMINGHAM Licence No: 706706
This graph is a visual representation of the trip rate calculation results screen. The same time periods and trip rates are
displayed, but in addition there is an additional column showing the percentage of the total trip rate by individual time
period, allowing peak periods to be easily identified through observation. Note that the type of count and the selected
direction is shown at the top of the graph.

TRICS 7.4.1 050617 B17.52 (C) 2017 TRICS Consortium Ltd Wednesday 12/07/17
Page 10
PETER BRETT ASSSOCIATES LLP VICTORIA SQUARE BIRMINGHAM Licence No: 706706
TRIP RATE for Land Use 03 - RESIDENTIAL/M - MIXED PRIVATE/AFFORDABLE HOUSING
MULTI-MODAL TAXIS
Calculation factor: 1 DWELLS
BOLD print indicates peak (busiest) period
ARRIVALS DEPARTURES TOTALS
No. Ave. Trip No. Ave. Trip No. Ave. Trip
Time Range Days DWELLS Rate Days DWELLS Rate Days DWELLS Rate
00:00 - 01:00
01:00 - 02:00
02:00 - 03:00
03:00 - 04:00
04:00 - 05:00
05:00 - 06:00
06:00 - 07:00
14 152 0.002 14 152 0.001 14 152 0.00307:00 - 08:00
14 152 0.005 14 152 0.005 14 152 0.01008:00 - 09:00
14 152 0.003 14 152 0.003 14 152 0.00609:00 - 10:00
14 152 0.002 14 152 0.002 14 152 0.00410:00 - 11:00
14 152 0.003 14 152 0.003 14 152 0.00611:00 - 12:00
14 152 0.001 14 152 0.002 14 152 0.00312:00 - 13:00
14 152 0.003 14 152 0.001 14 152 0.00413:00 - 14:00
14 152 0.002 14 152 0.002 14 152 0.00414:00 - 15:00
14 152 0.008 14 152 0.009 14 152 0.01715:00 - 16:00
14 152 0.002 14 152 0.002 14 152 0.00416:00 - 17:00
14 152 0.003 14 152 0.002 14 152 0.00517:00 - 18:00
14 152 0.002 14 152 0.003 14 152 0.00518:00 - 19:00
19:00 - 20:00
20:00 - 21:00
21:00 - 22:00
22:00 - 23:00
23:00 - 24:00
Total Rates: 0.036 0.035 0.071
This section displays the trip rate results based on the selected set of surveys and the selected count type (shown just
above the table). It is split by three main columns, representing arrivals trips, departures trips, and total trips (arrivals plus
departures). Within each of these main columns are three sub-columns. These display the number of survey days where
count data is included (per time period), the average value of the selected trip rate calculation parameter (per time
period), and the trip rate result (per time period). Total trip rates (the sum of the column) are also displayed at the foot of
the table.
To obtain a trip rate, the average (mean) trip rate parameter value (TRP) is first calculated for all selected survey days
that have count data available for the stated time period. The average (mean) number of arrivals, departures or totals
(whichever applies) is also calculated (COUNT) for all selected survey days that have count data available for the stated
time period. Then, the average count is divided by the average trip rate parameter value, and multiplied by the stated
calculation factor (shown just above the table and abbreviated here as FACT). So, the method is: COUNT/TRP*FACT. Trip
rates are then rounded to 3 decimal places.
Parameter summary
Trip rate parameter range selected: 32 - 500 (units: )
Survey date date range: 01/01/09 - 10/05/16
Number of weekdays (Monday-Friday): 15
Number of Saturdays: 0
Number of Sundays: 0
Surveys automatically removed from selection: 9
Surveys manually removed from selection: 0
This section displays a quick summary of some of the data filtering selections made by the TRICS® user. The trip rate
calculation parameter range of all selected surveys is displayed first, followed by the range of minimum and maximum
survey dates selected by the user. Then, the total number of selected weekdays and weekend days in the selected set of
surveys are show. Finally, the number of survey days that have been manually removed from the selected set outside of
the standard filtering procedure are displayed.
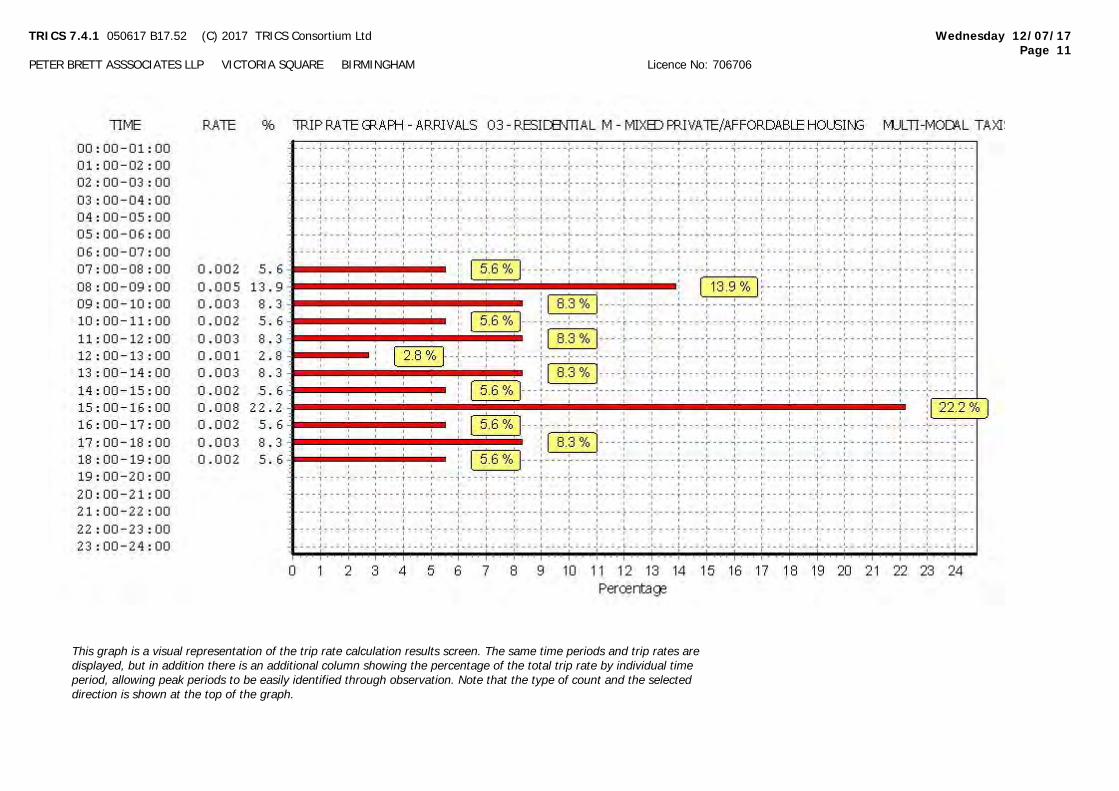
TRICS 7.4.1 050617 B17.52 (C) 2017 TRICS Consortium Ltd Wednesday 12/07/17
Page 11
PETER BRETT ASSSOCIATES LLP VICTORIA SQUARE BIRMINGHAM Licence No: 706706
This graph is a visual representation of the trip rate calculation results screen. The same time periods and trip rates are
displayed, but in addition there is an additional column showing the percentage of the total trip rate by individual time
period, allowing peak periods to be easily identified through observation. Note that the type of count and the selected
direction is shown at the top of the graph.
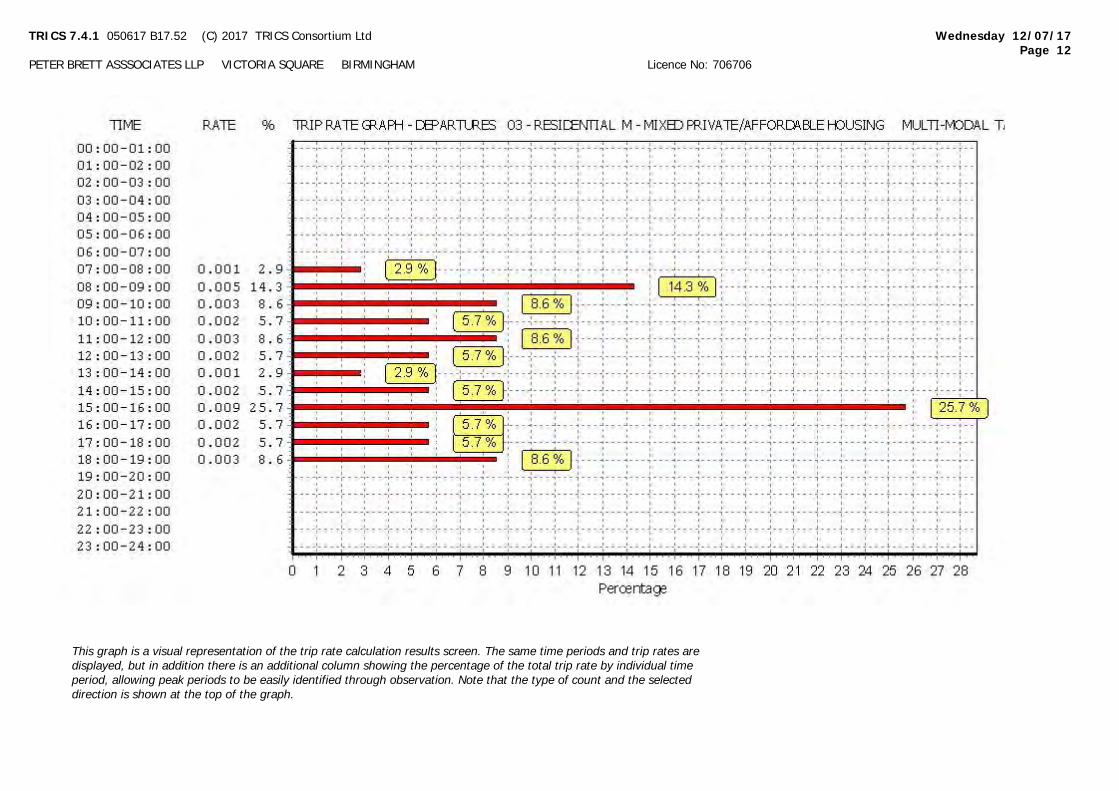
TRICS 7.4.1 050617 B17.52 (C) 2017 TRICS Consortium Ltd Wednesday 12/07/17
Page 12
PETER BRETT ASSSOCIATES LLP VICTORIA SQUARE BIRMINGHAM Licence No: 706706
This graph is a visual representation of the trip rate calculation results screen. The same time periods and trip rates are
displayed, but in addition there is an additional column showing the percentage of the total trip rate by individual time
period, allowing peak periods to be easily identified through observation. Note that the type of count and the selected
direction is shown at the top of the graph.
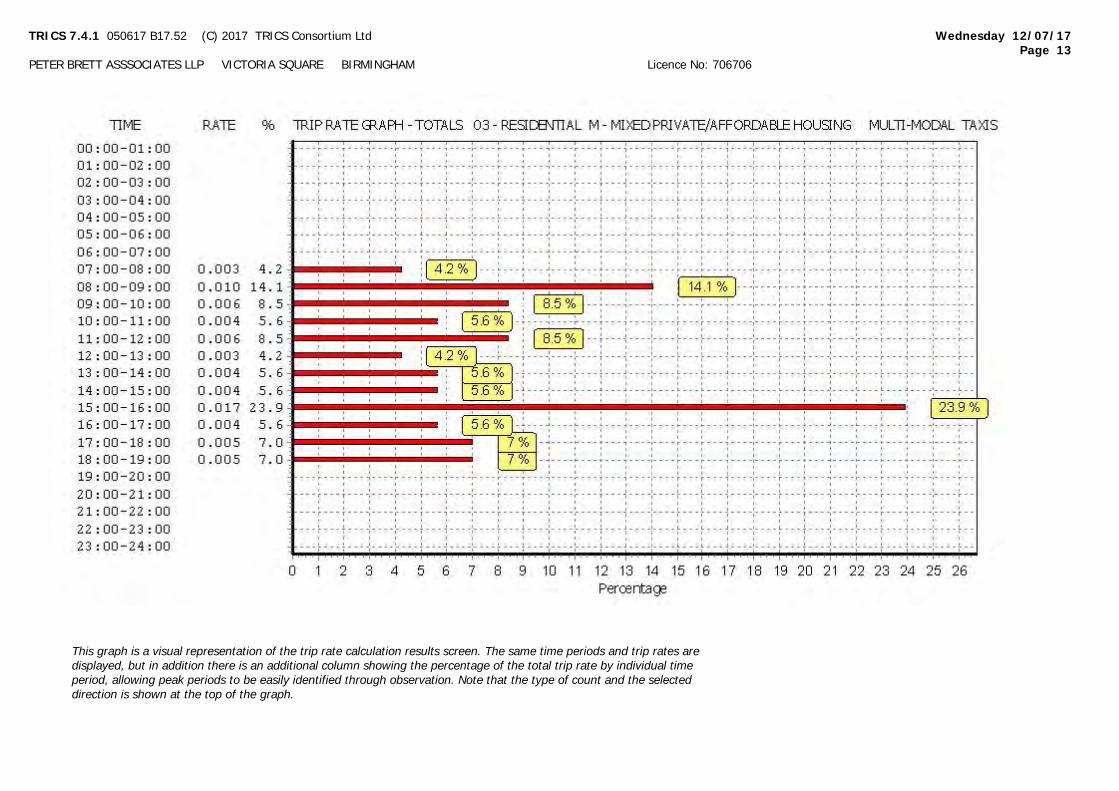
TRICS 7.4.1 050617 B17.52 (C) 2017 TRICS Consortium Ltd Wednesday 12/07/17
Page 13
PETER BRETT ASSSOCIATES LLP VICTORIA SQUARE BIRMINGHAM Licence No: 706706
This graph is a visual representation of the trip rate calculation results screen. The same time periods and trip rates are
displayed, but in addition there is an additional column showing the percentage of the total trip rate by individual time
period, allowing peak periods to be easily identified through observation. Note that the type of count and the selected
direction is shown at the top of the graph.

TRICS 7.4.1 050617 B17.52 (C) 2017 TRICS Consortium Ltd Wednesday 12/07/17
Page 14
PETER BRETT ASSSOCIATES LLP VICTORIA SQUARE BIRMINGHAM Licence No: 706706
TRIP RATE for Land Use 03 - RESIDENTIAL/M - MIXED PRIVATE/AFFORDABLE HOUSING
MULTI-MODAL OGVS
Calculation factor: 1 DWELLS
BOLD print indicates peak (busiest) period
ARRIVALS DEPARTURES TOTALS
No. Ave. Trip No. Ave. Trip No. Ave. Trip
Time Range Days DWELLS Rate Days DWELLS Rate Days DWELLS Rate
00:00 - 01:00
01:00 - 02:00
02:00 - 03:00
03:00 - 04:00
04:00 - 05:00
05:00 - 06:00
06:00 - 07:00
14 152 0.001 14 152 0.001 14 152 0.00207:00 - 08:00
14 152 0.000 14 152 0.000 14 152 0.00008:00 - 09:00
14 152 0.002 14 152 0.002 14 152 0.00409:00 - 10:00
14 152 0.003 14 152 0.003 14 152 0.00610:00 - 11:00
14 152 0.001 14 152 0.001 14 152 0.00211:00 - 12:00
14 152 0.003 14 152 0.001 14 152 0.00412:00 - 13:00
14 152 0.000 14 152 0.002 14 152 0.00213:00 - 14:00
14 152 0.001 14 152 0.001 14 152 0.00214:00 - 15:00
14 152 0.001 14 152 0.001 14 152 0.00215:00 - 16:00
14 152 0.001 14 152 0.001 14 152 0.00216:00 - 17:00
14 152 0.000 14 152 0.000 14 152 0.00017:00 - 18:00
14 152 0.000 14 152 0.000 14 152 0.00018:00 - 19:00
19:00 - 20:00
20:00 - 21:00
21:00 - 22:00
22:00 - 23:00
23:00 - 24:00
Total Rates: 0.013 0.013 0.026
This section displays the trip rate results based on the selected set of surveys and the selected count type (shown just
above the table). It is split by three main columns, representing arrivals trips, departures trips, and total trips (arrivals plus
departures). Within each of these main columns are three sub-columns. These display the number of survey days where
count data is included (per time period), the average value of the selected trip rate calculation parameter (per time
period), and the trip rate result (per time period). Total trip rates (the sum of the column) are also displayed at the foot of
the table.
To obtain a trip rate, the average (mean) trip rate parameter value (TRP) is first calculated for all selected survey days
that have count data available for the stated time period. The average (mean) number of arrivals, departures or totals
(whichever applies) is also calculated (COUNT) for all selected survey days that have count data available for the stated
time period. Then, the average count is divided by the average trip rate parameter value, and multiplied by the stated
calculation factor (shown just above the table and abbreviated here as FACT). So, the method is: COUNT/TRP*FACT. Trip
rates are then rounded to 3 decimal places.
Parameter summary
Trip rate parameter range selected: 32 - 500 (units: )
Survey date date range: 01/01/09 - 10/05/16
Number of weekdays (Monday-Friday): 15
Number of Saturdays: 0
Number of Sundays: 0
Surveys automatically removed from selection: 9
Surveys manually removed from selection: 0
This section displays a quick summary of some of the data filtering selections made by the TRICS® user. The trip rate
calculation parameter range of all selected surveys is displayed first, followed by the range of minimum and maximum
survey dates selected by the user. Then, the total number of selected weekdays and weekend days in the selected set of
surveys are show. Finally, the number of survey days that have been manually removed from the selected set outside of
the standard filtering procedure are displayed.
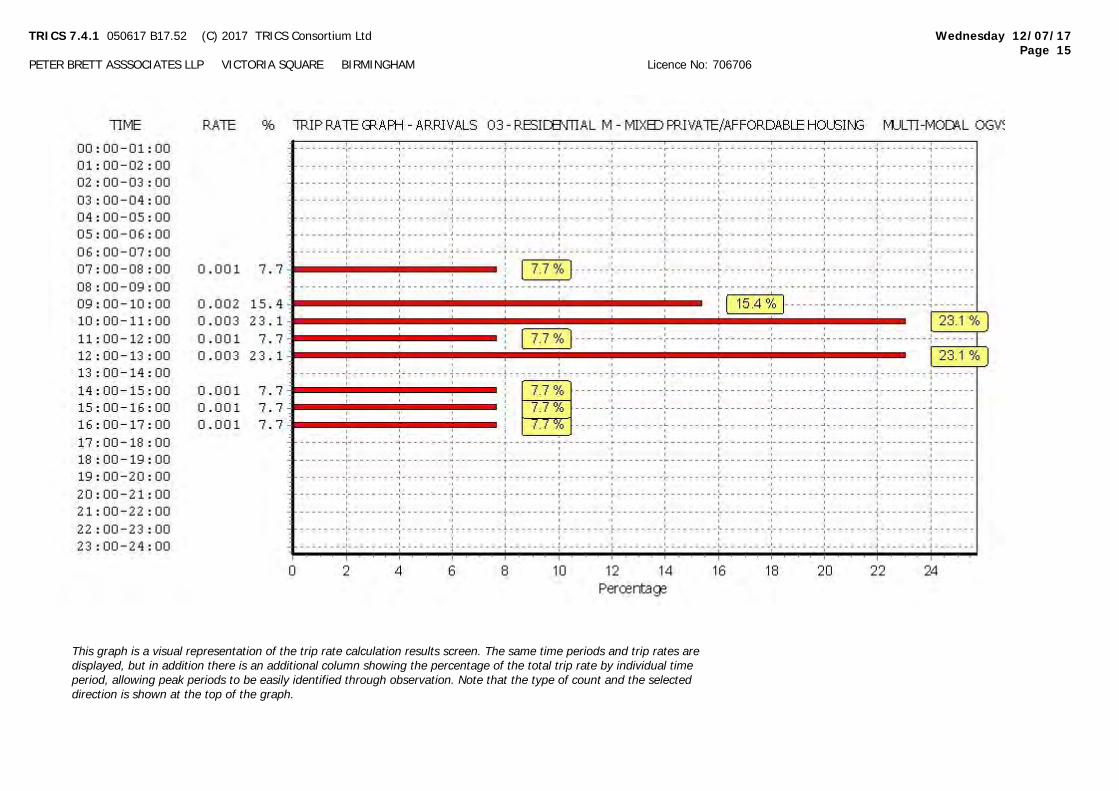
TRICS 7.4.1 050617 B17.52 (C) 2017 TRICS Consortium Ltd Wednesday 12/07/17
Page 15
PETER BRETT ASSSOCIATES LLP VICTORIA SQUARE BIRMINGHAM Licence No: 706706
This graph is a visual representation of the trip rate calculation results screen. The same time periods and trip rates are
displayed, but in addition there is an additional column showing the percentage of the total trip rate by individual time
period, allowing peak periods to be easily identified through observation. Note that the type of count and the selected
direction is shown at the top of the graph.
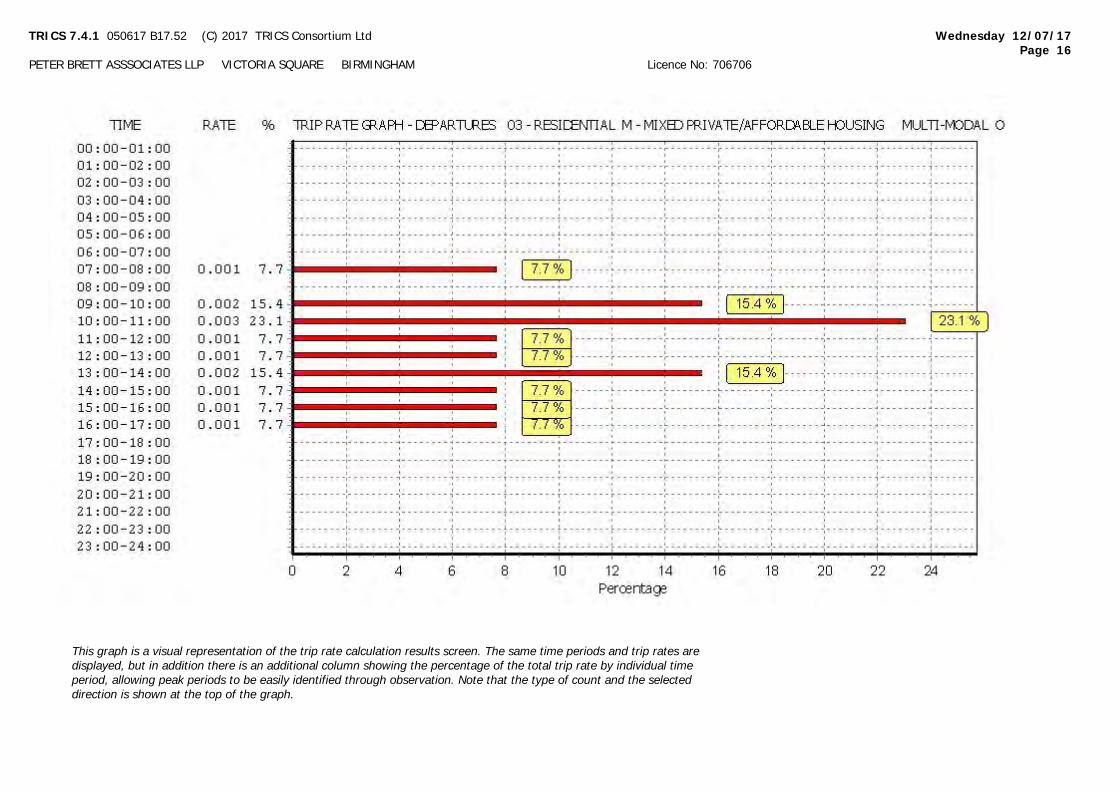
TRICS 7.4.1 050617 B17.52 (C) 2017 TRICS Consortium Ltd Wednesday 12/07/17
Page 16
PETER BRETT ASSSOCIATES LLP VICTORIA SQUARE BIRMINGHAM Licence No: 706706
This graph is a visual representation of the trip rate calculation results screen. The same time periods and trip rates are
displayed, but in addition there is an additional column showing the percentage of the total trip rate by individual time
period, allowing peak periods to be easily identified through observation. Note that the type of count and the selected
direction is shown at the top of the graph.
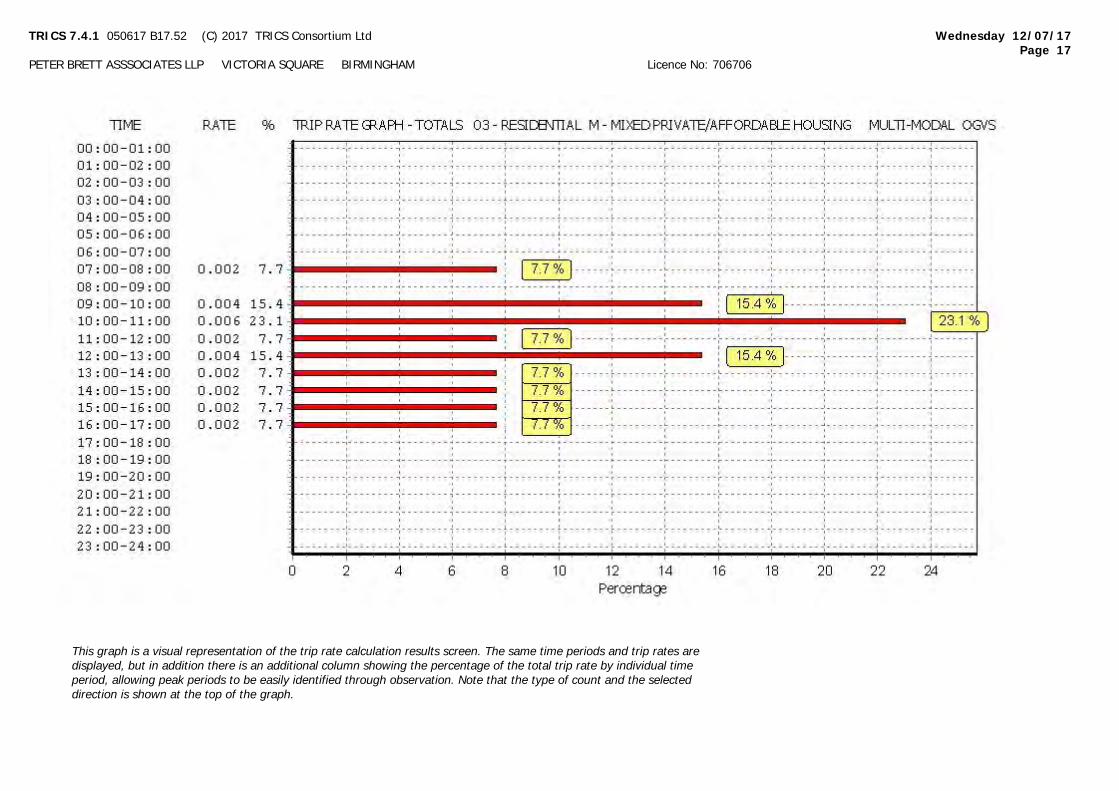
TRICS 7.4.1 050617 B17.52 (C) 2017 TRICS Consortium Ltd Wednesday 12/07/17
Page 17
PETER BRETT ASSSOCIATES LLP VICTORIA SQUARE BIRMINGHAM Licence No: 706706
This graph is a visual representation of the trip rate calculation results screen. The same time periods and trip rates are
displayed, but in addition there is an additional column showing the percentage of the total trip rate by individual time
period, allowing peak periods to be easily identified through observation. Note that the type of count and the selected
direction is shown at the top of the graph.
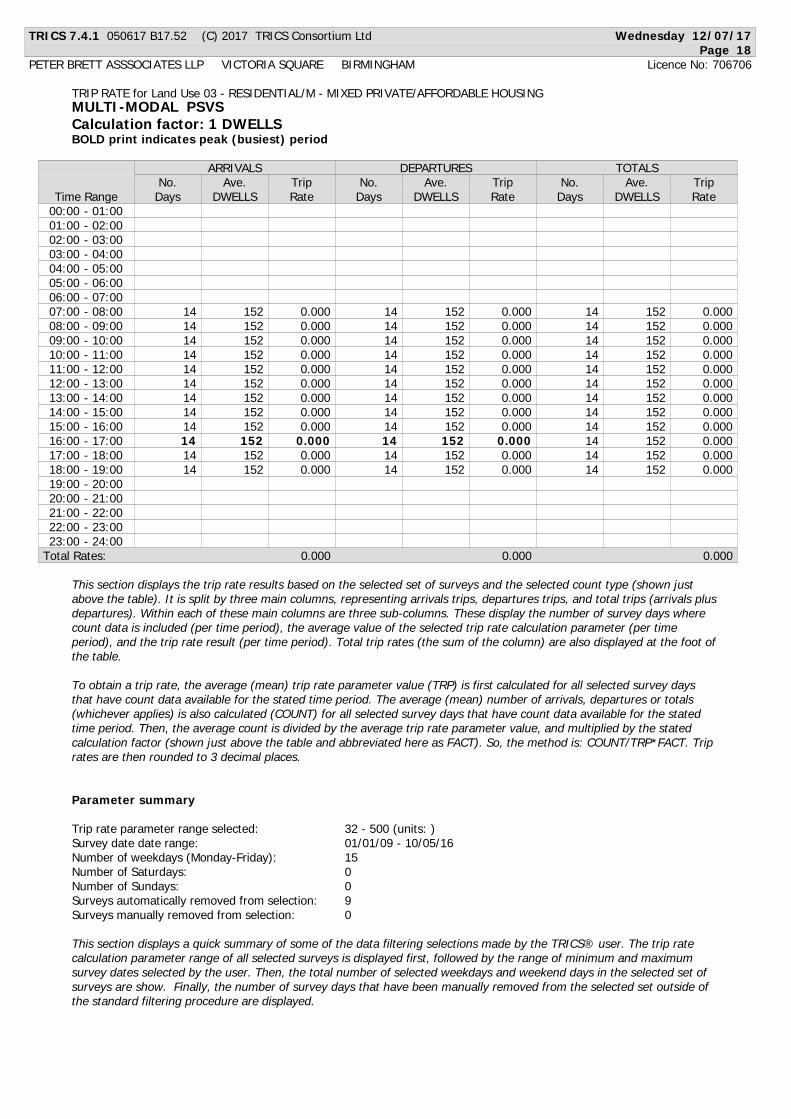
TRICS 7.4.1 050617 B17.52 (C) 2017 TRICS Consortium Ltd Wednesday 12/07/17
Page 18
PETER BRETT ASSSOCIATES LLP VICTORIA SQUARE BIRMINGHAM Licence No: 706706
TRIP RATE for Land Use 03 - RESIDENTIAL/M - MIXED PRIVATE/AFFORDABLE HOUSING
MULTI-MODAL PSVS
Calculation factor: 1 DWELLS
BOLD print indicates peak (busiest) period
ARRIVALS DEPARTURES TOTALS
No. Ave. Trip No. Ave. Trip No. Ave. Trip
Time Range Days DWELLS Rate Days DWELLS Rate Days DWELLS Rate
00:00 - 01:00
01:00 - 02:00
02:00 - 03:00
03:00 - 04:00
04:00 - 05:00
05:00 - 06:00
06:00 - 07:00
14 152 0.000 14 152 0.000 14 152 0.00007:00 - 08:00
14 152 0.000 14 152 0.000 14 152 0.00008:00 - 09:00
14 152 0.000 14 152 0.000 14 152 0.00009:00 - 10:00
14 152 0.000 14 152 0.000 14 152 0.00010:00 - 11:00
14 152 0.000 14 152 0.000 14 152 0.00011:00 - 12:00
14 152 0.000 14 152 0.000 14 152 0.00012:00 - 13:00
14 152 0.000 14 152 0.000 14 152 0.00013:00 - 14:00
14 152 0.000 14 152 0.000 14 152 0.00014:00 - 15:00
14 152 0.000 14 152 0.000 14 152 0.00015:00 - 16:00
14 152 0.000 14 152 0.000 14 152 0.00016:00 - 17:00
14 152 0.000 14 152 0.000 14 152 0.00017:00 - 18:00
14 152 0.000 14 152 0.000 14 152 0.00018:00 - 19:00
19:00 - 20:00
20:00 - 21:00
21:00 - 22:00
22:00 - 23:00
23:00 - 24:00
Total Rates: 0.000 0.000 0.000
This section displays the trip rate results based on the selected set of surveys and the selected count type (shown just
above the table). It is split by three main columns, representing arrivals trips, departures trips, and total trips (arrivals plus
departures). Within each of these main columns are three sub-columns. These display the number of survey days where
count data is included (per time period), the average value of the selected trip rate calculation parameter (per time
period), and the trip rate result (per time period). Total trip rates (the sum of the column) are also displayed at the foot of
the table.
To obtain a trip rate, the average (mean) trip rate parameter value (TRP) is first calculated for all selected survey days
that have count data available for the stated time period. The average (mean) number of arrivals, departures or totals
(whichever applies) is also calculated (COUNT) for all selected survey days that have count data available for the stated
time period. Then, the average count is divided by the average trip rate parameter value, and multiplied by the stated
calculation factor (shown just above the table and abbreviated here as FACT). So, the method is: COUNT/TRP*FACT. Trip
rates are then rounded to 3 decimal places.
Parameter summary
Trip rate parameter range selected: 32 - 500 (units: )
Survey date date range: 01/01/09 - 10/05/16
Number of weekdays (Monday-Friday): 15
Number of Saturdays: 0
Number of Sundays: 0
Surveys automatically removed from selection: 9
Surveys manually removed from selection: 0
This section displays a quick summary of some of the data filtering selections made by the TRICS® user. The trip rate
calculation parameter range of all selected surveys is displayed first, followed by the range of minimum and maximum
survey dates selected by the user. Then, the total number of selected weekdays and weekend days in the selected set of
surveys are show. Finally, the number of survey days that have been manually removed from the selected set outside of
the standard filtering procedure are displayed.

TRICS 7.4.1 050617 B17.52 (C) 2017 TRICS Consortium Ltd Wednesday 12/07/17
Page 19
PETER BRETT ASSSOCIATES LLP VICTORIA SQUARE BIRMINGHAM Licence No: 706706
This graph is a visual representation of the trip rate calculation results screen. The same time periods and trip rates are
displayed, but in addition there is an additional column showing the percentage of the total trip rate by individual time
period, allowing peak periods to be easily identified through observation. Note that the type of count and the selected
direction is shown at the top of the graph.
TRICS 7.4.1 050617 B17.52 (C) 2017 TRICS Consortium Ltd Wednesday 12/07/17
Page 20
PETER BRETT ASSSOCIATES LLP VICTORIA SQUARE BIRMINGHAM Licence No: 706706
This graph is a visual representation of the trip rate calculation results screen. The same time periods and trip rates are
displayed, but in addition there is an additional column showing the percentage of the total trip rate by individual time
period, allowing peak periods to be easily identified through observation. Note that the type of count and the selected
direction is shown at the top of the graph.

TRICS 7.4.1 050617 B17.52 (C) 2017 TRICS Consortium Ltd Wednesday 12/07/17
Page 21
PETER BRETT ASSSOCIATES LLP VICTORIA SQUARE BIRMINGHAM Licence No: 706706
This graph is a visual representation of the trip rate calculation results screen. The same time periods and trip rates are
displayed, but in addition there is an additional column showing the percentage of the total trip rate by individual time
period, allowing peak periods to be easily identified through observation. Note that the type of count and the selected
direction is shown at the top of the graph.

TRICS 7.4.1 050617 B17.52 (C) 2017 TRICS Consortium Ltd Wednesday 12/07/17
Page 22
PETER BRETT ASSSOCIATES LLP VICTORIA SQUARE BIRMINGHAM Licence No: 706706
TRIP RATE for Land Use 03 - RESIDENTIAL/M - MIXED PRIVATE/AFFORDABLE HOUSING
MULTI-MODAL CYCLISTS
Calculation factor: 1 DWELLS
BOLD print indicates peak (busiest) period
ARRIVALS DEPARTURES TOTALS
No. Ave. Trip No. Ave. Trip No. Ave. Trip
Time Range Days DWELLS Rate Days DWELLS Rate Days DWELLS Rate
00:00 - 01:00
01:00 - 02:00
02:00 - 03:00
03:00 - 04:00
04:00 - 05:00
05:00 - 06:00
06:00 - 07:00
14 152 0.003 14 152 0.009 14 152 0.01207:00 - 08:00
14 152 0.004 14 152 0.015 14 152 0.01908:00 - 09:00
14 152 0.005 14 152 0.007 14 152 0.01209:00 - 10:00
14 152 0.001 14 152 0.003 14 152 0.00410:00 - 11:00
14 152 0.001 14 152 0.004 14 152 0.00511:00 - 12:00
14 152 0.005 14 152 0.002 14 152 0.00712:00 - 13:00
14 152 0.003 14 152 0.002 14 152 0.00513:00 - 14:00
14 152 0.002 14 152 0.003 14 152 0.00514:00 - 15:00
14 152 0.010 14 152 0.002 14 152 0.01215:00 - 16:00
14 152 0.010 14 152 0.007 14 152 0.01716:00 - 17:00
14 152 0.015 14 152 0.009 14 152 0.02417:00 - 18:00
14 152 0.006 14 152 0.002 14 152 0.00818:00 - 19:00
19:00 - 20:00
20:00 - 21:00
21:00 - 22:00
22:00 - 23:00
23:00 - 24:00
Total Rates: 0.065 0.065 0.130
This section displays the trip rate results based on the selected set of surveys and the selected count type (shown just
above the table). It is split by three main columns, representing arrivals trips, departures trips, and total trips (arrivals plus
departures). Within each of these main columns are three sub-columns. These display the number of survey days where
count data is included (per time period), the average value of the selected trip rate calculation parameter (per time
period), and the trip rate result (per time period). Total trip rates (the sum of the column) are also displayed at the foot of
the table.
To obtain a trip rate, the average (mean) trip rate parameter value (TRP) is first calculated for all selected survey days
that have count data available for the stated time period. The average (mean) number of arrivals, departures or totals
(whichever applies) is also calculated (COUNT) for all selected survey days that have count data available for the stated
time period. Then, the average count is divided by the average trip rate parameter value, and multiplied by the stated
calculation factor (shown just above the table and abbreviated here as FACT). So, the method is: COUNT/TRP*FACT. Trip
rates are then rounded to 3 decimal places.
Parameter summary
Trip rate parameter range selected: 32 - 500 (units: )
Survey date date range: 01/01/09 - 10/05/16
Number of weekdays (Monday-Friday): 15
Number of Saturdays: 0
Number of Sundays: 0
Surveys automatically removed from selection: 9
Surveys manually removed from selection: 0
This section displays a quick summary of some of the data filtering selections made by the TRICS® user. The trip rate
calculation parameter range of all selected surveys is displayed first, followed by the range of minimum and maximum
survey dates selected by the user. Then, the total number of selected weekdays and weekend days in the selected set of
surveys are show. Finally, the number of survey days that have been manually removed from the selected set outside of
the standard filtering procedure are displayed.
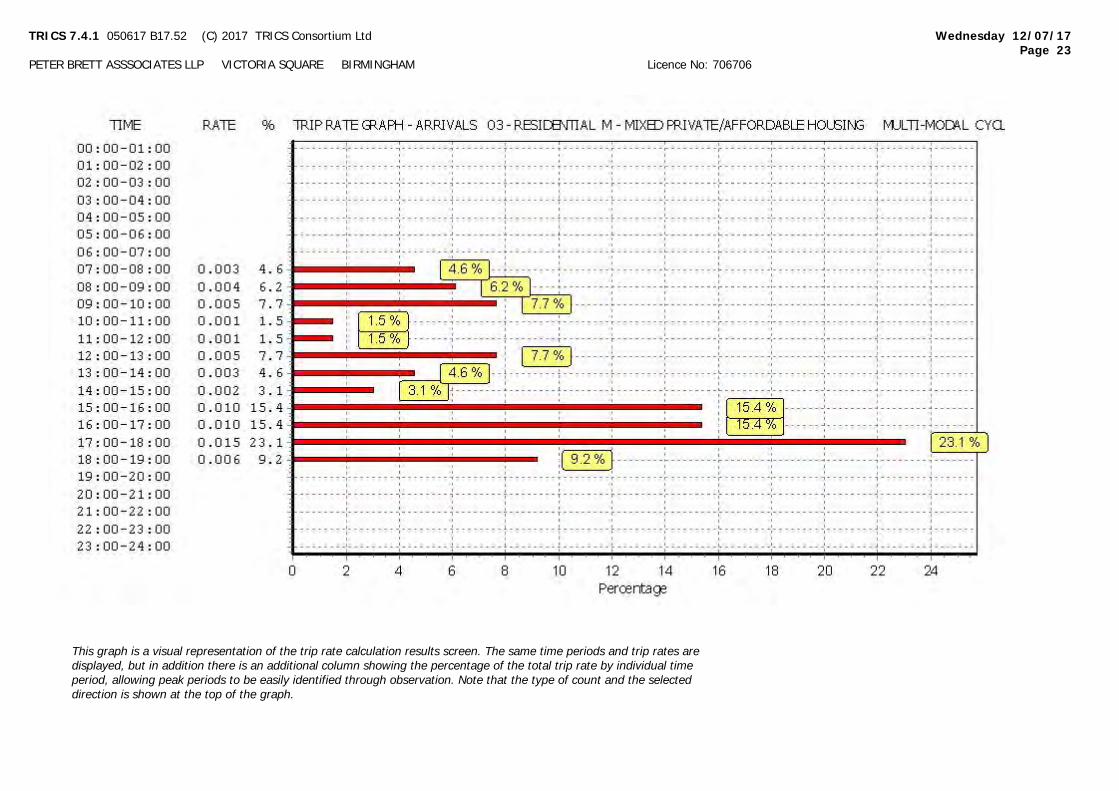
TRICS 7.4.1 050617 B17.52 (C) 2017 TRICS Consortium Ltd Wednesday 12/07/17
Page 23
PETER BRETT ASSSOCIATES LLP VICTORIA SQUARE BIRMINGHAM Licence No: 706706
This graph is a visual representation of the trip rate calculation results screen. The same time periods and trip rates are
displayed, but in addition there is an additional column showing the percentage of the total trip rate by individual time
period, allowing peak periods to be easily identified through observation. Note that the type of count and the selected
direction is shown at the top of the graph.
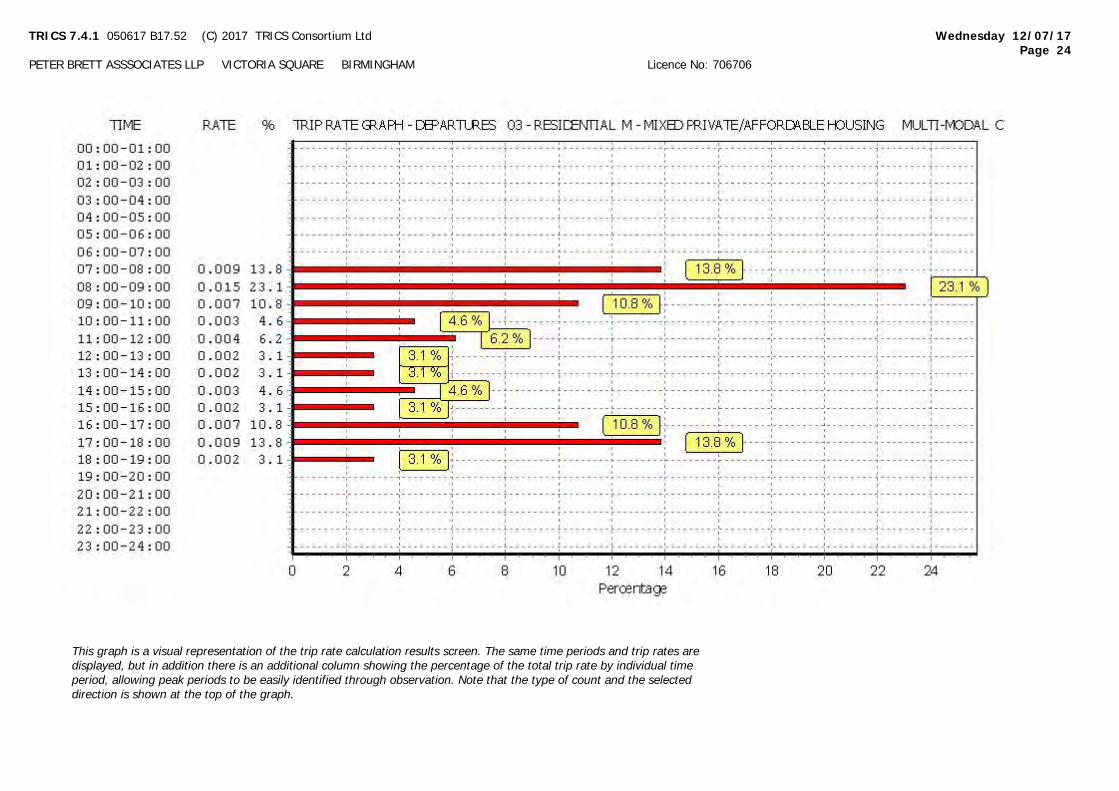
TRICS 7.4.1 050617 B17.52 (C) 2017 TRICS Consortium Ltd Wednesday 12/07/17
Page 24
PETER BRETT ASSSOCIATES LLP VICTORIA SQUARE BIRMINGHAM Licence No: 706706
This graph is a visual representation of the trip rate calculation results screen. The same time periods and trip rates are
displayed, but in addition there is an additional column showing the percentage of the total trip rate by individual time
period, allowing peak periods to be easily identified through observation. Note that the type of count and the selected
direction is shown at the top of the graph.
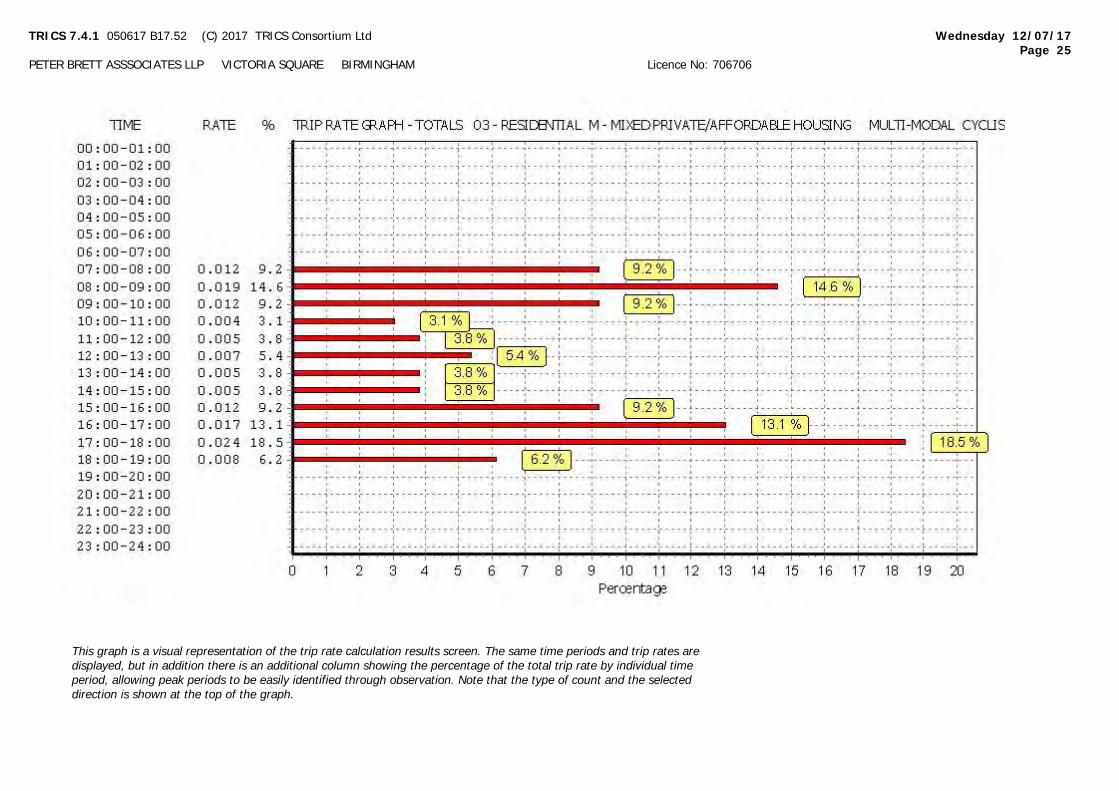
TRICS 7.4.1 050617 B17.52 (C) 2017 TRICS Consortium Ltd Wednesday 12/07/17
Page 25
PETER BRETT ASSSOCIATES LLP VICTORIA SQUARE BIRMINGHAM Licence No: 706706
This graph is a visual representation of the trip rate calculation results screen. The same time periods and trip rates are
displayed, but in addition there is an additional column showing the percentage of the total trip rate by individual time
period, allowing peak periods to be easily identified through observation. Note that the type of count and the selected
direction is shown at the top of the graph.

TRICS 7.4.1 050617 B17.52 (C) 2017 TRICS Consortium Ltd Wednesday 12/07/17
Page 26
PETER BRETT ASSSOCIATES LLP VICTORIA SQUARE BIRMINGHAM Licence No: 706706
TRIP RATE for Land Use 03 - RESIDENTIAL/M - MIXED PRIVATE/AFFORDABLE HOUSING
MULTI-MODAL VEHICLE OCCUPANTS
Calculation factor: 1 DWELLS
BOLD print indicates peak (busiest) period
ARRIVALS DEPARTURES TOTALS
No. Ave. Trip No. Ave. Trip No. Ave. Trip
Time Range Days DWELLS Rate Days DWELLS Rate Days DWELLS Rate
00:00 - 01:00
01:00 - 02:00
02:00 - 03:00
03:00 - 04:00
04:00 - 05:00
05:00 - 06:00
06:00 - 07:00
14 152 0.067 14 152 0.300 14 152 0.36707:00 - 08:00
14 152 0.124 14 152 0.503 14 152 0.62708:00 - 09:00
14 152 0.125 14 152 0.191 14 152 0.31609:00 - 10:00
14 152 0.117 14 152 0.150 14 152 0.26710:00 - 11:00
14 152 0.138 14 152 0.145 14 152 0.28311:00 - 12:00
14 152 0.140 14 152 0.150 14 152 0.29012:00 - 13:00
14 152 0.143 14 152 0.147 14 152 0.29013:00 - 14:00
14 152 0.141 14 152 0.170 14 152 0.31114:00 - 15:00
14 152 0.347 14 152 0.180 14 152 0.52715:00 - 16:00
14 152 0.281 14 152 0.159 14 152 0.44016:00 - 17:00
14 152 0.371 14 152 0.158 14 152 0.52917:00 - 18:00
14 152 0.322 14 152 0.157 14 152 0.47918:00 - 19:00
19:00 - 20:00
20:00 - 21:00
21:00 - 22:00
22:00 - 23:00
23:00 - 24:00
Total Rates: 2.316 2.410 4.726
This section displays the trip rate results based on the selected set of surveys and the selected count type (shown just
above the table). It is split by three main columns, representing arrivals trips, departures trips, and total trips (arrivals plus
departures). Within each of these main columns are three sub-columns. These display the number of survey days where
count data is included (per time period), the average value of the selected trip rate calculation parameter (per time
period), and the trip rate result (per time period). Total trip rates (the sum of the column) are also displayed at the foot of
the table.
To obtain a trip rate, the average (mean) trip rate parameter value (TRP) is first calculated for all selected survey days
that have count data available for the stated time period. The average (mean) number of arrivals, departures or totals
(whichever applies) is also calculated (COUNT) for all selected survey days that have count data available for the stated
time period. Then, the average count is divided by the average trip rate parameter value, and multiplied by the stated
calculation factor (shown just above the table and abbreviated here as FACT). So, the method is: COUNT/TRP*FACT. Trip
rates are then rounded to 3 decimal places.
Parameter summary
Trip rate parameter range selected: 32 - 500 (units: )
Survey date date range: 01/01/09 - 10/05/16
Number of weekdays (Monday-Friday): 15
Number of Saturdays: 0
Number of Sundays: 0
Surveys automatically removed from selection: 9
Surveys manually removed from selection: 0
This section displays a quick summary of some of the data filtering selections made by the TRICS® user. The trip rate
calculation parameter range of all selected surveys is displayed first, followed by the range of minimum and maximum
survey dates selected by the user. Then, the total number of selected weekdays and weekend days in the selected set of
surveys are show. Finally, the number of survey days that have been manually removed from the selected set outside of
the standard filtering procedure are displayed.
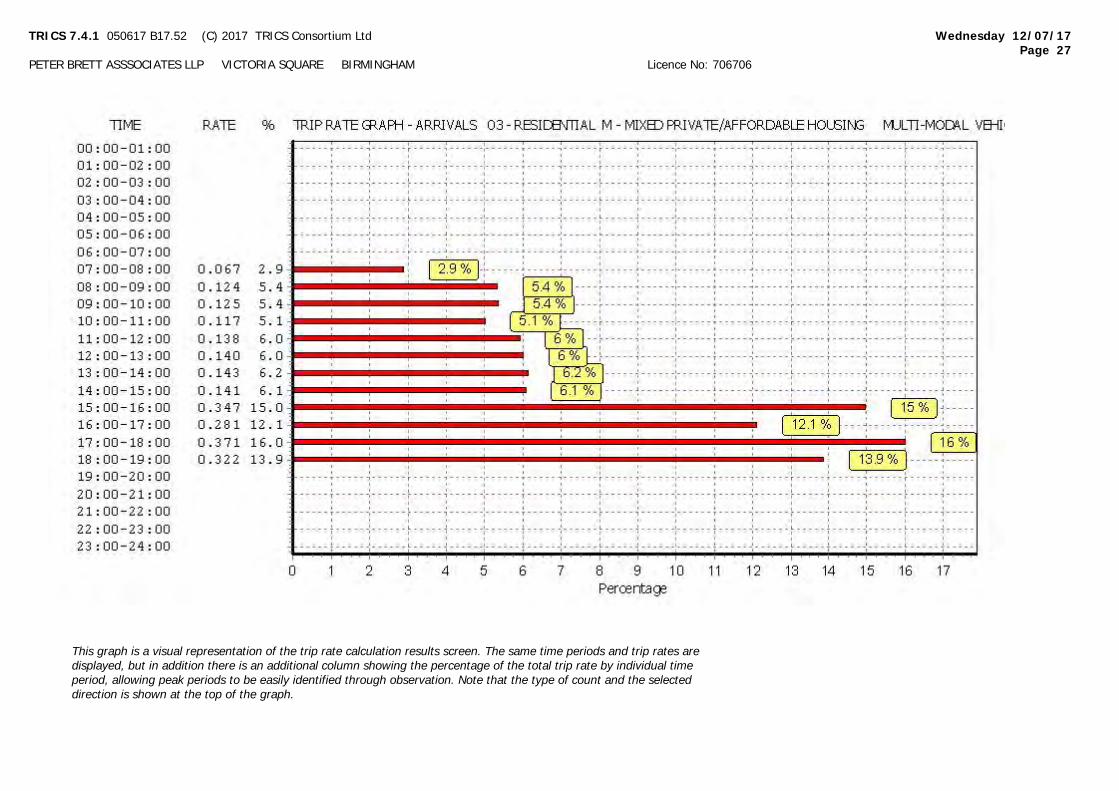
TRICS 7.4.1 050617 B17.52 (C) 2017 TRICS Consortium Ltd Wednesday 12/07/17
Page 27
PETER BRETT ASSSOCIATES LLP VICTORIA SQUARE BIRMINGHAM Licence No: 706706
This graph is a visual representation of the trip rate calculation results screen. The same time periods and trip rates are
displayed, but in addition there is an additional column showing the percentage of the total trip rate by individual time
period, allowing peak periods to be easily identified through observation. Note that the type of count and the selected
direction is shown at the top of the graph.
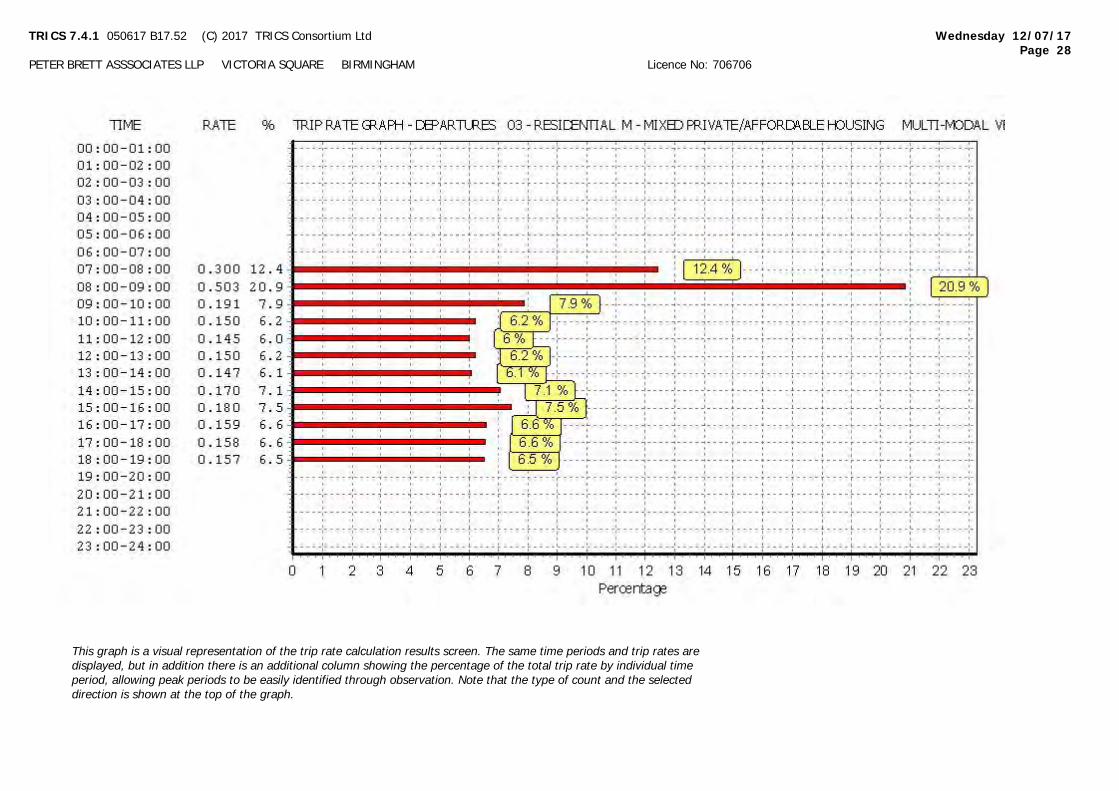
TRICS 7.4.1 050617 B17.52 (C) 2017 TRICS Consortium Ltd Wednesday 12/07/17
Page 28
PETER BRETT ASSSOCIATES LLP VICTORIA SQUARE BIRMINGHAM Licence No: 706706
This graph is a visual representation of the trip rate calculation results screen. The same time periods and trip rates are
displayed, but in addition there is an additional column showing the percentage of the total trip rate by individual time
period, allowing peak periods to be easily identified through observation. Note that the type of count and the selected
direction is shown at the top of the graph.
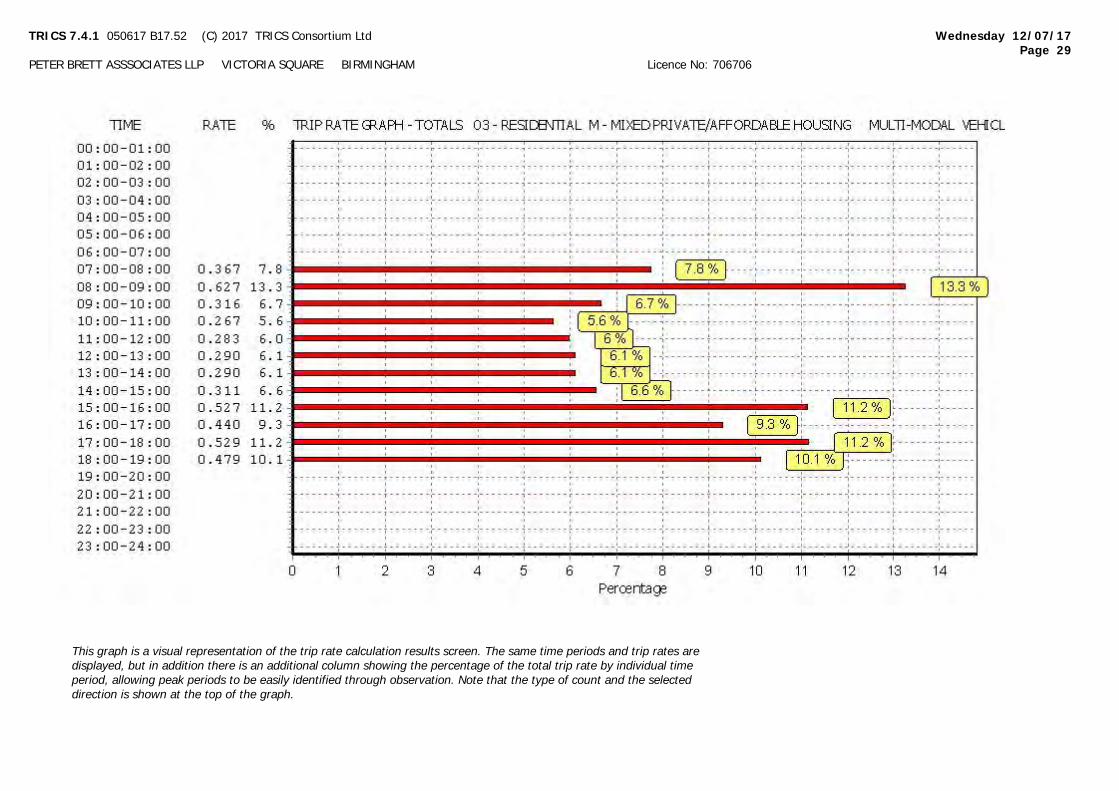
TRICS 7.4.1 050617 B17.52 (C) 2017 TRICS Consortium Ltd Wednesday 12/07/17
Page 29
PETER BRETT ASSSOCIATES LLP VICTORIA SQUARE BIRMINGHAM Licence No: 706706
This graph is a visual representation of the trip rate calculation results screen. The same time periods and trip rates are
displayed, but in addition there is an additional column showing the percentage of the total trip rate by individual time
period, allowing peak periods to be easily identified through observation. Note that the type of count and the selected
direction is shown at the top of the graph.

TRICS 7.4.1 050617 B17.52 (C) 2017 TRICS Consortium Ltd Wednesday 12/07/17
Page 30
PETER BRETT ASSSOCIATES LLP VICTORIA SQUARE BIRMINGHAM Licence No: 706706
TRIP RATE for Land Use 03 - RESIDENTIAL/M - MIXED PRIVATE/AFFORDABLE HOUSING
MULTI-MODAL PEDESTRIANS
Calculation factor: 1 DWELLS
BOLD print indicates peak (busiest) period
ARRIVALS DEPARTURES TOTALS
No. Ave. Trip No. Ave. Trip No. Ave. Trip
Time Range Days DWELLS Rate Days DWELLS Rate Days DWELLS Rate
00:00 - 01:00
01:00 - 02:00
02:00 - 03:00
03:00 - 04:00
04:00 - 05:00
05:00 - 06:00
06:00 - 07:00
14 152 0.022 14 152 0.058 14 152 0.08007:00 - 08:00
14 152 0.033 14 152 0.178 14 152 0.21108:00 - 09:00
14 152 0.055 14 152 0.052 14 152 0.10709:00 - 10:00
14 152 0.036 14 152 0.039 14 152 0.07510:00 - 11:00
14 152 0.034 14 152 0.039 14 152 0.07311:00 - 12:00
14 152 0.042 14 152 0.033 14 152 0.07512:00 - 13:00
14 152 0.035 14 152 0.039 14 152 0.07413:00 - 14:00
14 152 0.040 14 152 0.058 14 152 0.09814:00 - 15:00
14 152 0.150 14 152 0.058 14 152 0.20815:00 - 16:00
14 152 0.096 14 152 0.041 14 152 0.13716:00 - 17:00
14 152 0.098 14 152 0.049 14 152 0.14717:00 - 18:00
14 152 0.063 14 152 0.047 14 152 0.11018:00 - 19:00
19:00 - 20:00
20:00 - 21:00
21:00 - 22:00
22:00 - 23:00
23:00 - 24:00
Total Rates: 0.704 0.691 1.395
This section displays the trip rate results based on the selected set of surveys and the selected count type (shown just
above the table). It is split by three main columns, representing arrivals trips, departures trips, and total trips (arrivals plus
departures). Within each of these main columns are three sub-columns. These display the number of survey days where
count data is included (per time period), the average value of the selected trip rate calculation parameter (per time
period), and the trip rate result (per time period). Total trip rates (the sum of the column) are also displayed at the foot of
the table.
To obtain a trip rate, the average (mean) trip rate parameter value (TRP) is first calculated for all selected survey days
that have count data available for the stated time period. The average (mean) number of arrivals, departures or totals
(whichever applies) is also calculated (COUNT) for all selected survey days that have count data available for the stated
time period. Then, the average count is divided by the average trip rate parameter value, and multiplied by the stated
calculation factor (shown just above the table and abbreviated here as FACT). So, the method is: COUNT/TRP*FACT. Trip
rates are then rounded to 3 decimal places.
Parameter summary
Trip rate parameter range selected: 32 - 500 (units: )
Survey date date range: 01/01/09 - 10/05/16
Number of weekdays (Monday-Friday): 15
Number of Saturdays: 0
Number of Sundays: 0
Surveys automatically removed from selection: 9
Surveys manually removed from selection: 0
This section displays a quick summary of some of the data filtering selections made by the TRICS® user. The trip rate
calculation parameter range of all selected surveys is displayed first, followed by the range of minimum and maximum
survey dates selected by the user. Then, the total number of selected weekdays and weekend days in the selected set of
surveys are show. Finally, the number of survey days that have been manually removed from the selected set outside of
the standard filtering procedure are displayed.
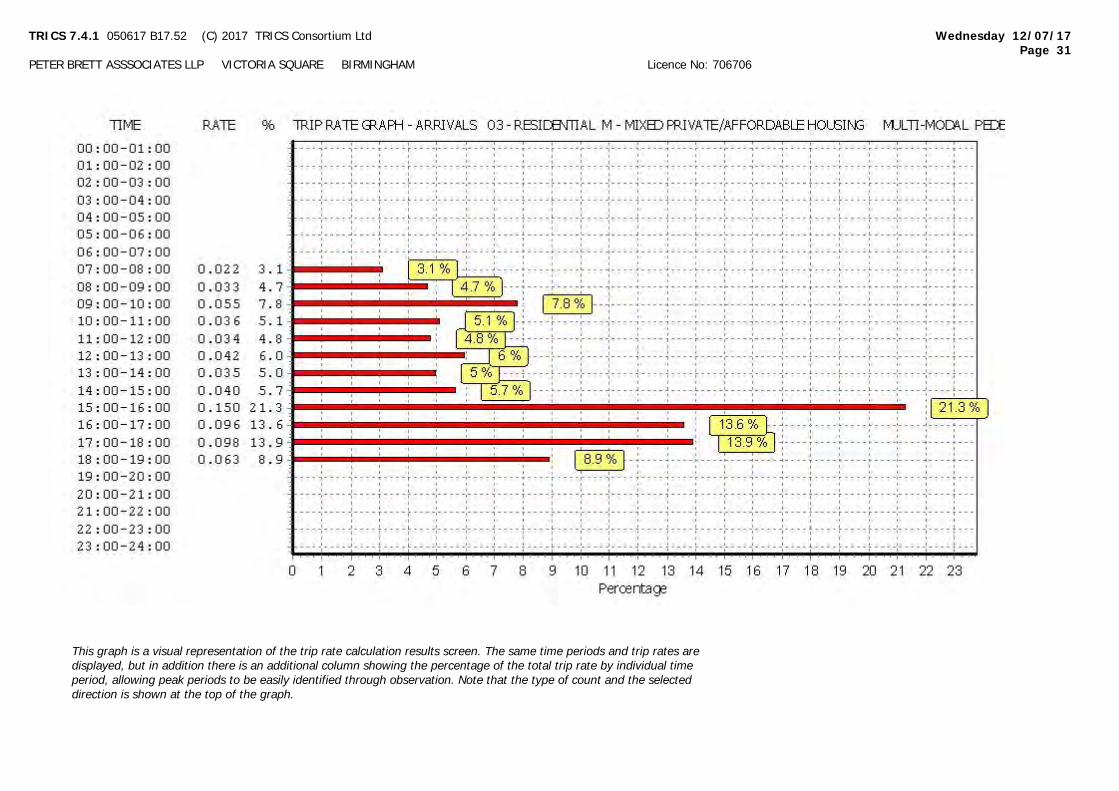
TRICS 7.4.1 050617 B17.52 (C) 2017 TRICS Consortium Ltd Wednesday 12/07/17
Page 31
PETER BRETT ASSSOCIATES LLP VICTORIA SQUARE BIRMINGHAM Licence No: 706706
This graph is a visual representation of the trip rate calculation results screen. The same time periods and trip rates are
displayed, but in addition there is an additional column showing the percentage of the total trip rate by individual time
period, allowing peak periods to be easily identified through observation. Note that the type of count and the selected
direction is shown at the top of the graph.
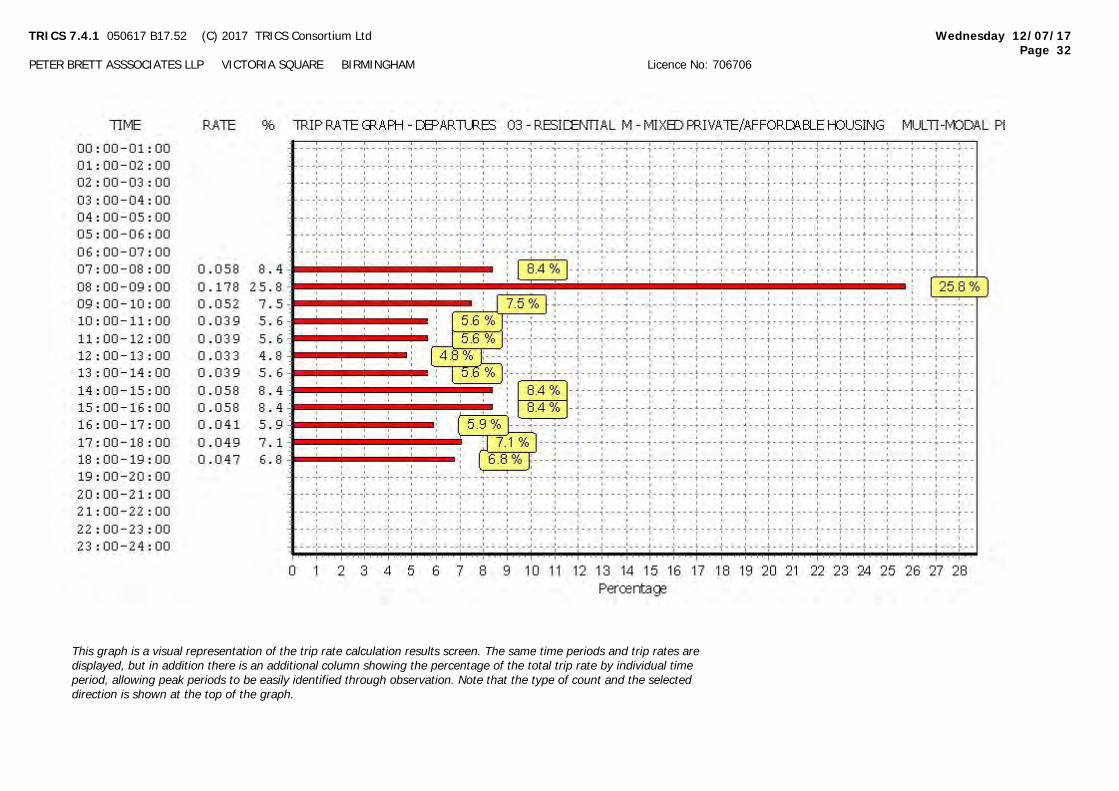
TRICS 7.4.1 050617 B17.52 (C) 2017 TRICS Consortium Ltd Wednesday 12/07/17
Page 32
PETER BRETT ASSSOCIATES LLP VICTORIA SQUARE BIRMINGHAM Licence No: 706706
This graph is a visual representation of the trip rate calculation results screen. The same time periods and trip rates are
displayed, but in addition there is an additional column showing the percentage of the total trip rate by individual time
period, allowing peak periods to be easily identified through observation. Note that the type of count and the selected
direction is shown at the top of the graph.
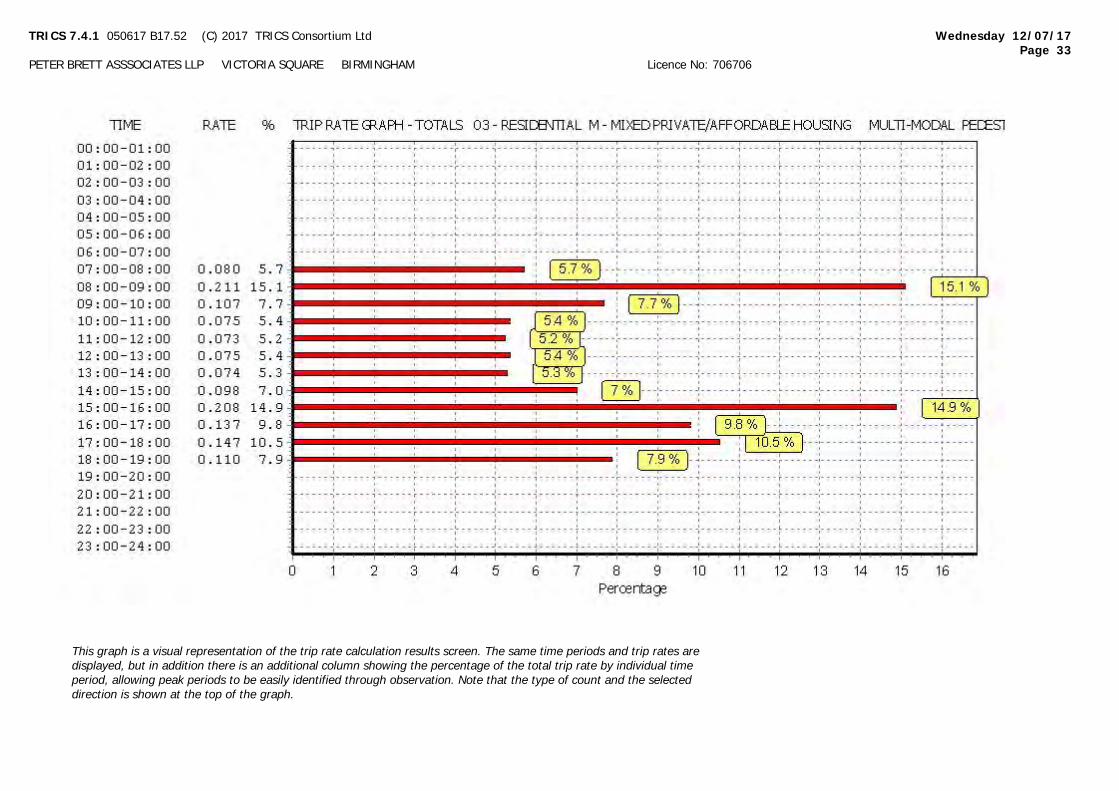
TRICS 7.4.1 050617 B17.52 (C) 2017 TRICS Consortium Ltd Wednesday 12/07/17
Page 33
PETER BRETT ASSSOCIATES LLP VICTORIA SQUARE BIRMINGHAM Licence No: 706706
This graph is a visual representation of the trip rate calculation results screen. The same time periods and trip rates are
displayed, but in addition there is an additional column showing the percentage of the total trip rate by individual time
period, allowing peak periods to be easily identified through observation. Note that the type of count and the selected
direction is shown at the top of the graph.

TRICS 7.4.1 050617 B17.52 (C) 2017 TRICS Consortium Ltd Wednesday 12/07/17
Page 34
PETER BRETT ASSSOCIATES LLP VICTORIA SQUARE BIRMINGHAM Licence No: 706706
TRIP RATE for Land Use 03 - RESIDENTIAL/M - MIXED PRIVATE/AFFORDABLE HOUSING
MULTI-MODAL BUS/TRAM PASSENGERS
Calculation factor: 1 DWELLS
BOLD print indicates peak (busiest) period
ARRIVALS DEPARTURES TOTALS
No. Ave. Trip No. Ave. Trip No. Ave. Trip
Time Range Days DWELLS Rate Days DWELLS Rate Days DWELLS Rate
00:00 - 01:00
01:00 - 02:00
02:00 - 03:00
03:00 - 04:00
04:00 - 05:00
05:00 - 06:00
06:00 - 07:00
14 152 0.003 14 152 0.032 14 152 0.03507:00 - 08:00
14 152 0.002 14 152 0.041 14 152 0.04308:00 - 09:00
14 152 0.003 14 152 0.009 14 152 0.01209:00 - 10:00
14 152 0.000 14 152 0.004 14 152 0.00410:00 - 11:00
14 152 0.003 14 152 0.005 14 152 0.00811:00 - 12:00
14 152 0.006 14 152 0.003 14 152 0.00912:00 - 13:00
14 152 0.003 14 152 0.006 14 152 0.00913:00 - 14:00
14 152 0.006 14 152 0.006 14 152 0.01214:00 - 15:00
14 152 0.023 14 152 0.003 14 152 0.02615:00 - 16:00
14 152 0.024 14 152 0.003 14 152 0.02716:00 - 17:00
14 152 0.023 14 152 0.001 14 152 0.02417:00 - 18:00
14 152 0.009 14 152 0.002 14 152 0.01118:00 - 19:00
19:00 - 20:00
20:00 - 21:00
21:00 - 22:00
22:00 - 23:00
23:00 - 24:00
Total Rates: 0.105 0.115 0.220
This section displays the trip rate results based on the selected set of surveys and the selected count type (shown just
above the table). It is split by three main columns, representing arrivals trips, departures trips, and total trips (arrivals plus
departures). Within each of these main columns are three sub-columns. These display the number of survey days where
count data is included (per time period), the average value of the selected trip rate calculation parameter (per time
period), and the trip rate result (per time period). Total trip rates (the sum of the column) are also displayed at the foot of
the table.
To obtain a trip rate, the average (mean) trip rate parameter value (TRP) is first calculated for all selected survey days
that have count data available for the stated time period. The average (mean) number of arrivals, departures or totals
(whichever applies) is also calculated (COUNT) for all selected survey days that have count data available for the stated
time period. Then, the average count is divided by the average trip rate parameter value, and multiplied by the stated
calculation factor (shown just above the table and abbreviated here as FACT). So, the method is: COUNT/TRP*FACT. Trip
rates are then rounded to 3 decimal places.
Parameter summary
Trip rate parameter range selected: 32 - 500 (units: )
Survey date date range: 01/01/09 - 10/05/16
Number of weekdays (Monday-Friday): 15
Number of Saturdays: 0
Number of Sundays: 0
Surveys automatically removed from selection: 9
Surveys manually removed from selection: 0
This section displays a quick summary of some of the data filtering selections made by the TRICS® user. The trip rate
calculation parameter range of all selected surveys is displayed first, followed by the range of minimum and maximum
survey dates selected by the user. Then, the total number of selected weekdays and weekend days in the selected set of
surveys are show. Finally, the number of survey days that have been manually removed from the selected set outside of
the standard filtering procedure are displayed.
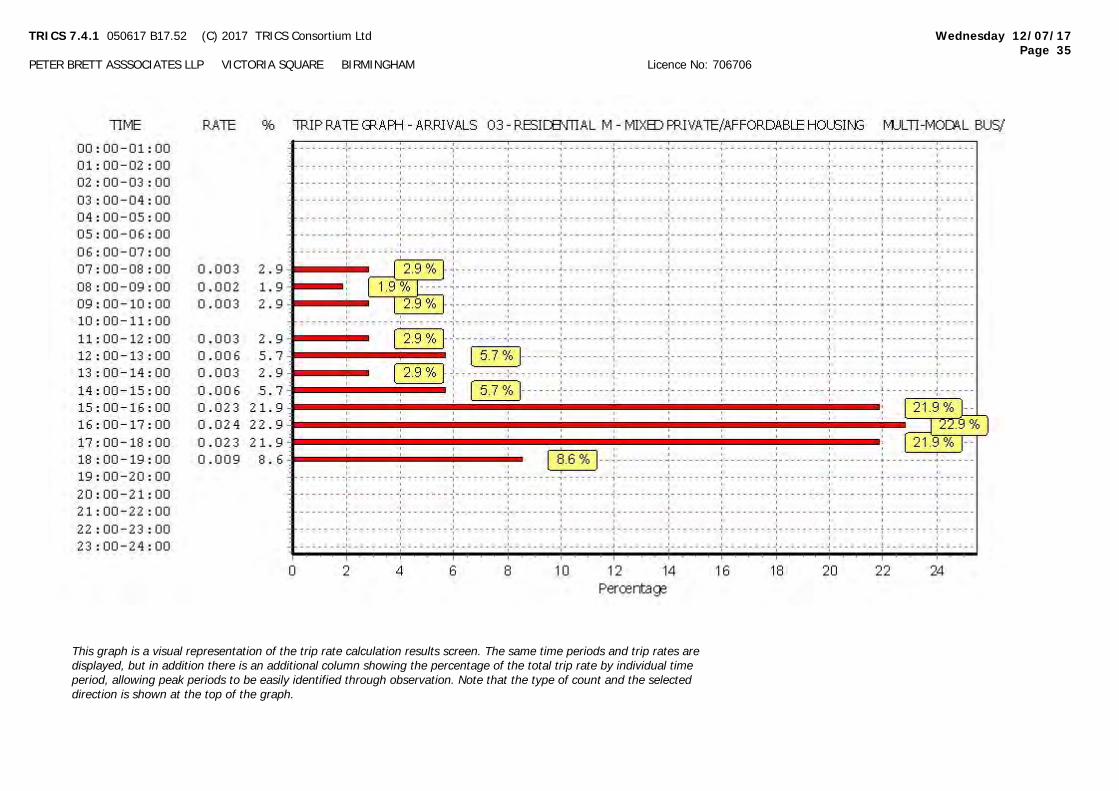
TRICS 7.4.1 050617 B17.52 (C) 2017 TRICS Consortium Ltd Wednesday 12/07/17
Page 35
PETER BRETT ASSSOCIATES LLP VICTORIA SQUARE BIRMINGHAM Licence No: 706706
This graph is a visual representation of the trip rate calculation results screen. The same time periods and trip rates are
displayed, but in addition there is an additional column showing the percentage of the total trip rate by individual time
period, allowing peak periods to be easily identified through observation. Note that the type of count and the selected
direction is shown at the top of the graph.
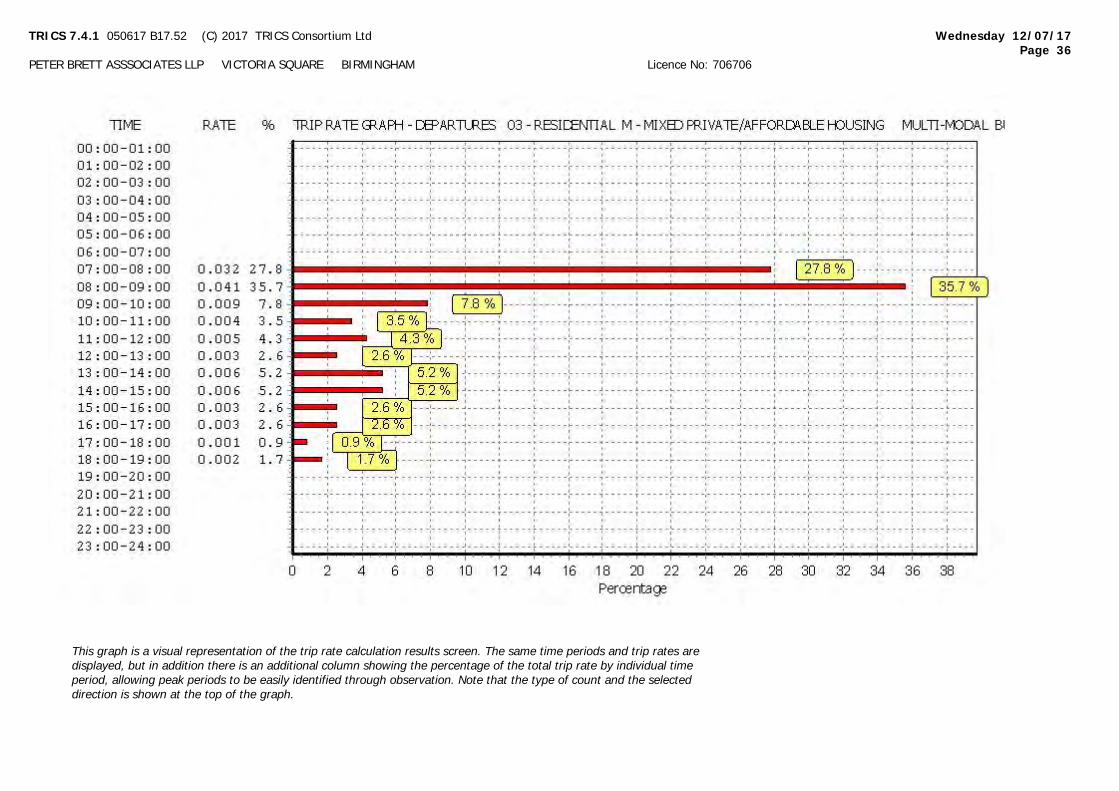
TRICS 7.4.1 050617 B17.52 (C) 2017 TRICS Consortium Ltd Wednesday 12/07/17
Page 36
PETER BRETT ASSSOCIATES LLP VICTORIA SQUARE BIRMINGHAM Licence No: 706706
This graph is a visual representation of the trip rate calculation results screen. The same time periods and trip rates are
displayed, but in addition there is an additional column showing the percentage of the total trip rate by individual time
period, allowing peak periods to be easily identified through observation. Note that the type of count and the selected
direction is shown at the top of the graph.
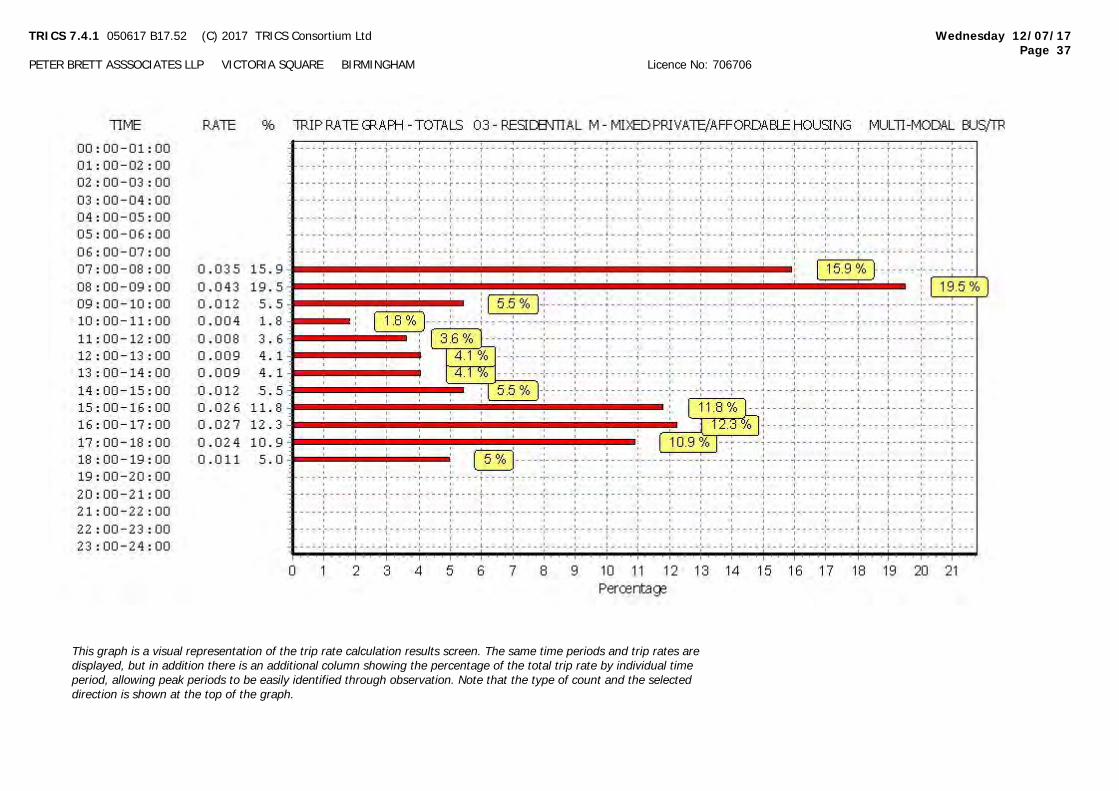
TRICS 7.4.1 050617 B17.52 (C) 2017 TRICS Consortium Ltd Wednesday 12/07/17
Page 37
PETER BRETT ASSSOCIATES LLP VICTORIA SQUARE BIRMINGHAM Licence No: 706706
This graph is a visual representation of the trip rate calculation results screen. The same time periods and trip rates are
displayed, but in addition there is an additional column showing the percentage of the total trip rate by individual time
period, allowing peak periods to be easily identified through observation. Note that the type of count and the selected
direction is shown at the top of the graph.

TRICS 7.4.1 050617 B17.52 (C) 2017 TRICS Consortium Ltd Wednesday 12/07/17
Page 38
PETER BRETT ASSSOCIATES LLP VICTORIA SQUARE BIRMINGHAM Licence No: 706706
TRIP RATE for Land Use 03 - RESIDENTIAL/M - MIXED PRIVATE/AFFORDABLE HOUSING
MULTI-MODAL TOTAL RAIL PASSENGERS
Calculation factor: 1 DWELLS
BOLD print indicates peak (busiest) period
ARRIVALS DEPARTURES TOTALS
No. Ave. Trip No. Ave. Trip No. Ave. Trip
Time Range Days DWELLS Rate Days DWELLS Rate Days DWELLS Rate
00:00 - 01:00
01:00 - 02:00
02:00 - 03:00
03:00 - 04:00
04:00 - 05:00
05:00 - 06:00
06:00 - 07:00
14 152 0.000 14 152 0.009 14 152 0.00907:00 - 08:00
14 152 0.000 14 152 0.016 14 152 0.01608:00 - 09:00
14 152 0.000 14 152 0.006 14 152 0.00609:00 - 10:00
14 152 0.000 14 152 0.002 14 152 0.00210:00 - 11:00
14 152 0.000 14 152 0.001 14 152 0.00111:00 - 12:00
14 152 0.000 14 152 0.000 14 152 0.00012:00 - 13:00
14 152 0.001 14 152 0.001 14 152 0.00213:00 - 14:00
14 152 0.005 14 152 0.001 14 152 0.00614:00 - 15:00
14 152 0.004 14 152 0.000 14 152 0.00415:00 - 16:00
14 152 0.008 14 152 0.000 14 152 0.00816:00 - 17:00
14 152 0.013 14 152 0.001 14 152 0.01417:00 - 18:00
14 152 0.007 14 152 0.000 14 152 0.00718:00 - 19:00
19:00 - 20:00
20:00 - 21:00
21:00 - 22:00
22:00 - 23:00
23:00 - 24:00
Total Rates: 0.038 0.037 0.075
This section displays the trip rate results based on the selected set of surveys and the selected count type (shown just
above the table). It is split by three main columns, representing arrivals trips, departures trips, and total trips (arrivals plus
departures). Within each of these main columns are three sub-columns. These display the number of survey days where
count data is included (per time period), the average value of the selected trip rate calculation parameter (per time
period), and the trip rate result (per time period). Total trip rates (the sum of the column) are also displayed at the foot of
the table.
To obtain a trip rate, the average (mean) trip rate parameter value (TRP) is first calculated for all selected survey days
that have count data available for the stated time period. The average (mean) number of arrivals, departures or totals
(whichever applies) is also calculated (COUNT) for all selected survey days that have count data available for the stated
time period. Then, the average count is divided by the average trip rate parameter value, and multiplied by the stated
calculation factor (shown just above the table and abbreviated here as FACT). So, the method is: COUNT/TRP*FACT. Trip
rates are then rounded to 3 decimal places.
Parameter summary
Trip rate parameter range selected: 32 - 500 (units: )
Survey date date range: 01/01/09 - 10/05/16
Number of weekdays (Monday-Friday): 15
Number of Saturdays: 0
Number of Sundays: 0
Surveys automatically removed from selection: 9
Surveys manually removed from selection: 0
This section displays a quick summary of some of the data filtering selections made by the TRICS® user. The trip rate
calculation parameter range of all selected surveys is displayed first, followed by the range of minimum and maximum
survey dates selected by the user. Then, the total number of selected weekdays and weekend days in the selected set of
surveys are show. Finally, the number of survey days that have been manually removed from the selected set outside of
the standard filtering procedure are displayed.
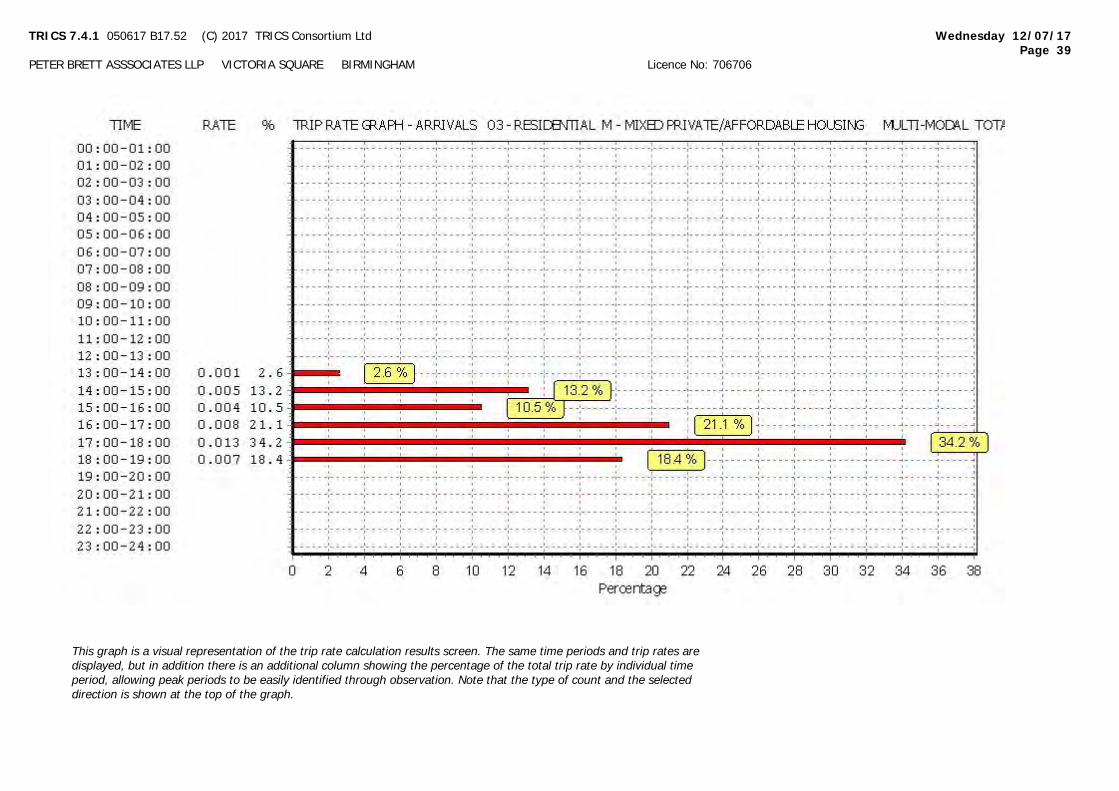
TRICS 7.4.1 050617 B17.52 (C) 2017 TRICS Consortium Ltd Wednesday 12/07/17
Page 39
PETER BRETT ASSSOCIATES LLP VICTORIA SQUARE BIRMINGHAM Licence No: 706706
This graph is a visual representation of the trip rate calculation results screen. The same time periods and trip rates are
displayed, but in addition there is an additional column showing the percentage of the total trip rate by individual time
period, allowing peak periods to be easily identified through observation. Note that the type of count and the selected
direction is shown at the top of the graph.
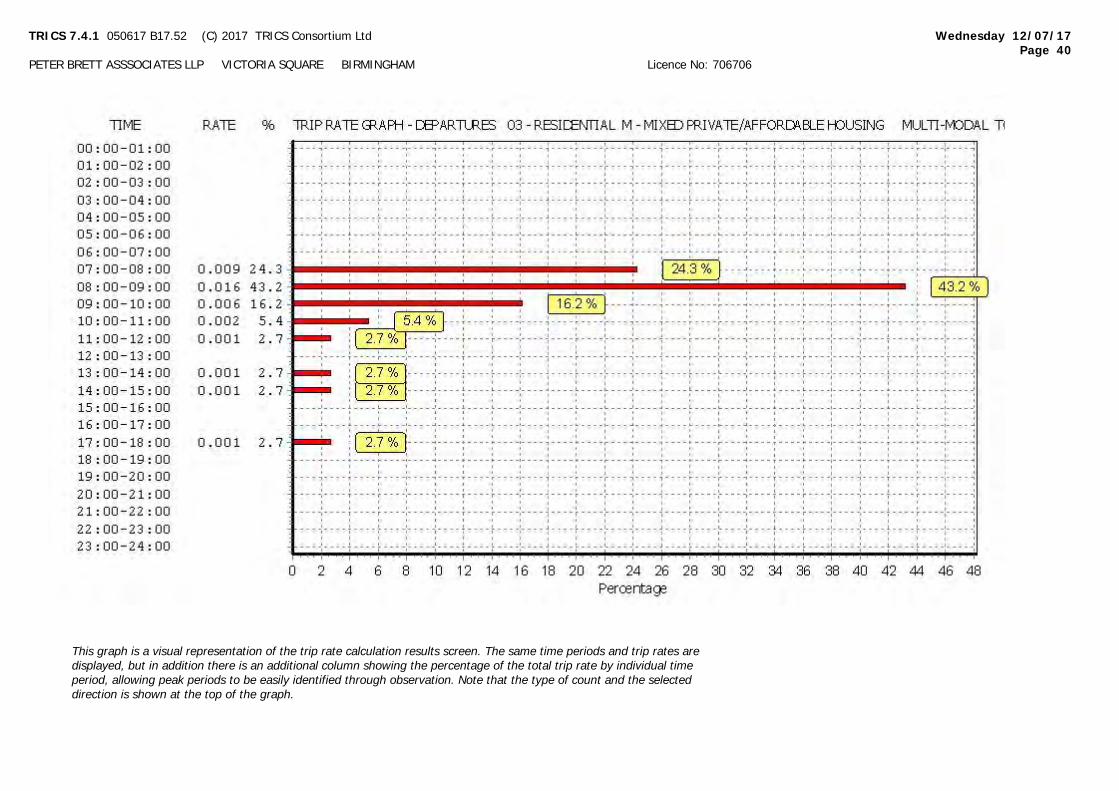
TRICS 7.4.1 050617 B17.52 (C) 2017 TRICS Consortium Ltd Wednesday 12/07/17
Page 40
PETER BRETT ASSSOCIATES LLP VICTORIA SQUARE BIRMINGHAM Licence No: 706706
This graph is a visual representation of the trip rate calculation results screen. The same time periods and trip rates are
displayed, but in addition there is an additional column showing the percentage of the total trip rate by individual time
period, allowing peak periods to be easily identified through observation. Note that the type of count and the selected
direction is shown at the top of the graph.
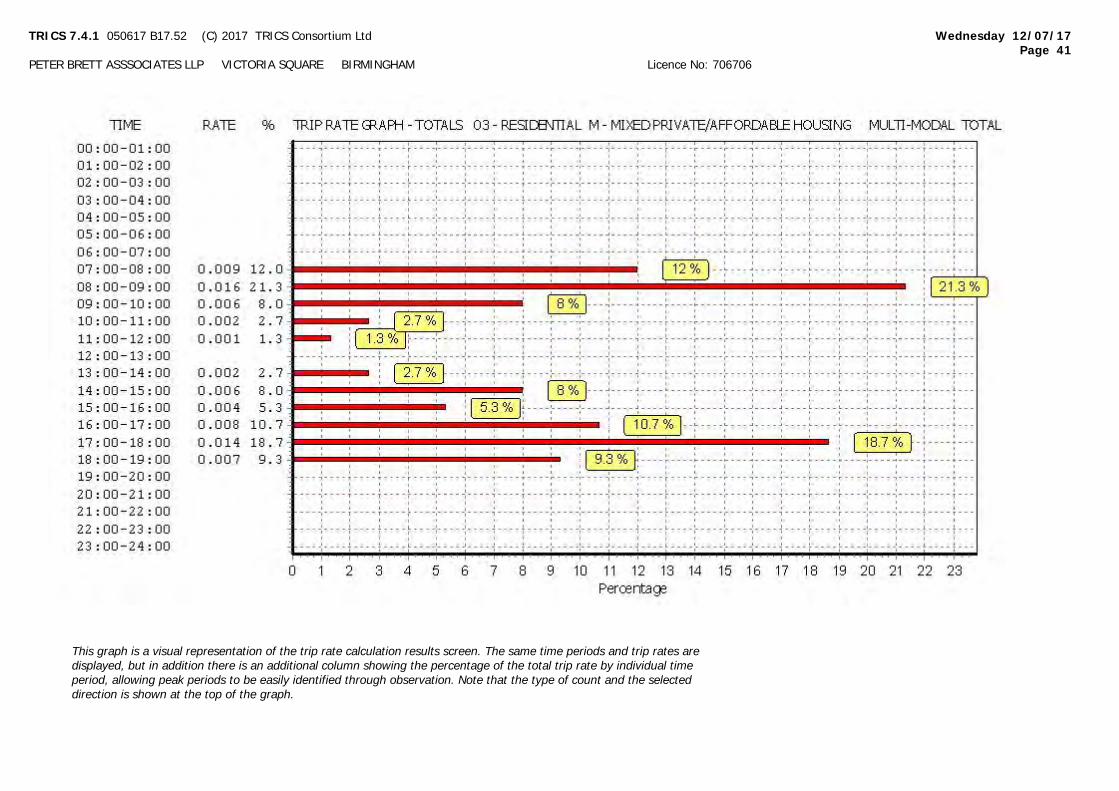
TRICS 7.4.1 050617 B17.52 (C) 2017 TRICS Consortium Ltd Wednesday 12/07/17
Page 41
PETER BRETT ASSSOCIATES LLP VICTORIA SQUARE BIRMINGHAM Licence No: 706706
This graph is a visual representation of the trip rate calculation results screen. The same time periods and trip rates are
displayed, but in addition there is an additional column showing the percentage of the total trip rate by individual time
period, allowing peak periods to be easily identified through observation. Note that the type of count and the selected
direction is shown at the top of the graph.

TRICS 7.4.1 050617 B17.52 (C) 2017 TRICS Consortium Ltd Wednesday 12/07/17
Page 42
PETER BRETT ASSSOCIATES LLP VICTORIA SQUARE BIRMINGHAM Licence No: 706706
TRIP RATE for Land Use 03 - RESIDENTIAL/M - MIXED PRIVATE/AFFORDABLE HOUSING
MULTI-MODAL COACH PASSENGERS
Calculation factor: 1 DWELLS
BOLD print indicates peak (busiest) period
ARRIVALS DEPARTURES TOTALS
No. Ave. Trip No. Ave. Trip No. Ave. Trip
Time Range Days DWELLS Rate Days DWELLS Rate Days DWELLS Rate
00:00 - 01:00
01:00 - 02:00
02:00 - 03:00
03:00 - 04:00
04:00 - 05:00
05:00 - 06:00
06:00 - 07:00
14 152 0.000 14 152 0.000 14 152 0.00007:00 - 08:00
14 152 0.000 14 152 0.000 14 152 0.00008:00 - 09:00
14 152 0.000 14 152 0.000 14 152 0.00009:00 - 10:00
14 152 0.000 14 152 0.000 14 152 0.00010:00 - 11:00
14 152 0.000 14 152 0.000 14 152 0.00011:00 - 12:00
14 152 0.000 14 152 0.000 14 152 0.00012:00 - 13:00
14 152 0.000 14 152 0.000 14 152 0.00013:00 - 14:00
14 152 0.000 14 152 0.000 14 152 0.00014:00 - 15:00
14 152 0.000 14 152 0.000 14 152 0.00015:00 - 16:00
14 152 0.000 14 152 0.000 14 152 0.00016:00 - 17:00
14 152 0.000 14 152 0.000 14 152 0.00017:00 - 18:00
14 152 0.000 14 152 0.000 14 152 0.00018:00 - 19:00
19:00 - 20:00
20:00 - 21:00
21:00 - 22:00
22:00 - 23:00
23:00 - 24:00
Total Rates: 0.000 0.000 0.000
This section displays the trip rate results based on the selected set of surveys and the selected count type (shown just
above the table). It is split by three main columns, representing arrivals trips, departures trips, and total trips (arrivals plus
departures). Within each of these main columns are three sub-columns. These display the number of survey days where
count data is included (per time period), the average value of the selected trip rate calculation parameter (per time
period), and the trip rate result (per time period). Total trip rates (the sum of the column) are also displayed at the foot of
the table.
To obtain a trip rate, the average (mean) trip rate parameter value (TRP) is first calculated for all selected survey days
that have count data available for the stated time period. The average (mean) number of arrivals, departures or totals
(whichever applies) is also calculated (COUNT) for all selected survey days that have count data available for the stated
time period. Then, the average count is divided by the average trip rate parameter value, and multiplied by the stated
calculation factor (shown just above the table and abbreviated here as FACT). So, the method is: COUNT/TRP*FACT. Trip
rates are then rounded to 3 decimal places.
Parameter summary
Trip rate parameter range selected: 32 - 500 (units: )
Survey date date range: 01/01/09 - 10/05/16
Number of weekdays (Monday-Friday): 15
Number of Saturdays: 0
Number of Sundays: 0
Surveys automatically removed from selection: 9
Surveys manually removed from selection: 0
This section displays a quick summary of some of the data filtering selections made by the TRICS® user. The trip rate
calculation parameter range of all selected surveys is displayed first, followed by the range of minimum and maximum
survey dates selected by the user. Then, the total number of selected weekdays and weekend days in the selected set of
surveys are show. Finally, the number of survey days that have been manually removed from the selected set outside of
the standard filtering procedure are displayed.
TRICS 7.4.1 050617 B17.52 (C) 2017 TRICS Consortium Ltd Wednesday 12/07/17
Page 43
PETER BRETT ASSSOCIATES LLP VICTORIA SQUARE BIRMINGHAM Licence No: 706706
This graph is a visual representation of the trip rate calculation results screen. The same time periods and trip rates are
displayed, but in addition there is an additional column showing the percentage of the total trip rate by individual time
period, allowing peak periods to be easily identified through observation. Note that the type of count and the selected
direction is shown at the top of the graph.
TRICS 7.4.1 050617 B17.52 (C) 2017 TRICS Consortium Ltd Wednesday 12/07/17
Page 44
PETER BRETT ASSSOCIATES LLP VICTORIA SQUARE BIRMINGHAM Licence No: 706706
This graph is a visual representation of the trip rate calculation results screen. The same time periods and trip rates are
displayed, but in addition there is an additional column showing the percentage of the total trip rate by individual time
period, allowing peak periods to be easily identified through observation. Note that the type of count and the selected
direction is shown at the top of the graph.
TRICS 7.4.1 050617 B17.52 (C) 2017 TRICS Consortium Ltd Wednesday 12/07/17
Page 45
PETER BRETT ASSSOCIATES LLP VICTORIA SQUARE BIRMINGHAM Licence No: 706706
This graph is a visual representation of the trip rate calculation results screen. The same time periods and trip rates are
displayed, but in addition there is an additional column showing the percentage of the total trip rate by individual time
period, allowing peak periods to be easily identified through observation. Note that the type of count and the selected
direction is shown at the top of the graph.

TRICS 7.4.1 050617 B17.52 (C) 2017 TRICS Consortium Ltd Wednesday 12/07/17
Page 46
PETER BRETT ASSSOCIATES LLP VICTORIA SQUARE BIRMINGHAM Licence No: 706706
TRIP RATE for Land Use 03 - RESIDENTIAL/M - MIXED PRIVATE/AFFORDABLE HOUSING
MULTI-MODAL PUBLIC TRANSPORT USERS
Calculation factor: 1 DWELLS
BOLD print indicates peak (busiest) period
ARRIVALS DEPARTURES TOTALS
No. Ave. Trip No. Ave. Trip No. Ave. Trip
Time Range Days DWELLS Rate Days DWELLS Rate Days DWELLS Rate
00:00 - 01:00
01:00 - 02:00
02:00 - 03:00
03:00 - 04:00
04:00 - 05:00
05:00 - 06:00
06:00 - 07:00
14 152 0.004 14 152 0.041 14 152 0.04507:00 - 08:00
14 152 0.003 14 152 0.056 14 152 0.05908:00 - 09:00
14 152 0.003 14 152 0.015 14 152 0.01809:00 - 10:00
14 152 0.000 14 152 0.006 14 152 0.00610:00 - 11:00
14 152 0.003 14 152 0.006 14 152 0.00911:00 - 12:00
14 152 0.006 14 152 0.003 14 152 0.00912:00 - 13:00
14 152 0.004 14 152 0.007 14 152 0.01113:00 - 14:00
14 152 0.010 14 152 0.007 14 152 0.01714:00 - 15:00
14 152 0.027 14 152 0.003 14 152 0.03015:00 - 16:00
14 152 0.033 14 152 0.003 14 152 0.03616:00 - 17:00
14 152 0.036 14 152 0.002 14 152 0.03817:00 - 18:00
14 152 0.016 14 152 0.002 14 152 0.01818:00 - 19:00
19:00 - 20:00
20:00 - 21:00
21:00 - 22:00
22:00 - 23:00
23:00 - 24:00
Total Rates: 0.145 0.151 0.296
This section displays the trip rate results based on the selected set of surveys and the selected count type (shown just
above the table). It is split by three main columns, representing arrivals trips, departures trips, and total trips (arrivals plus
departures). Within each of these main columns are three sub-columns. These display the number of survey days where
count data is included (per time period), the average value of the selected trip rate calculation parameter (per time
period), and the trip rate result (per time period). Total trip rates (the sum of the column) are also displayed at the foot of
the table.
To obtain a trip rate, the average (mean) trip rate parameter value (TRP) is first calculated for all selected survey days
that have count data available for the stated time period. The average (mean) number of arrivals, departures or totals
(whichever applies) is also calculated (COUNT) for all selected survey days that have count data available for the stated
time period. Then, the average count is divided by the average trip rate parameter value, and multiplied by the stated
calculation factor (shown just above the table and abbreviated here as FACT). So, the method is: COUNT/TRP*FACT. Trip
rates are then rounded to 3 decimal places.
Parameter summary
Trip rate parameter range selected: 32 - 500 (units: )
Survey date date range: 01/01/09 - 10/05/16
Number of weekdays (Monday-Friday): 15
Number of Saturdays: 0
Number of Sundays: 0
Surveys automatically removed from selection: 9
Surveys manually removed from selection: 0
This section displays a quick summary of some of the data filtering selections made by the TRICS® user. The trip rate
calculation parameter range of all selected surveys is displayed first, followed by the range of minimum and maximum
survey dates selected by the user. Then, the total number of selected weekdays and weekend days in the selected set of
surveys are show. Finally, the number of survey days that have been manually removed from the selected set outside of
the standard filtering procedure are displayed.
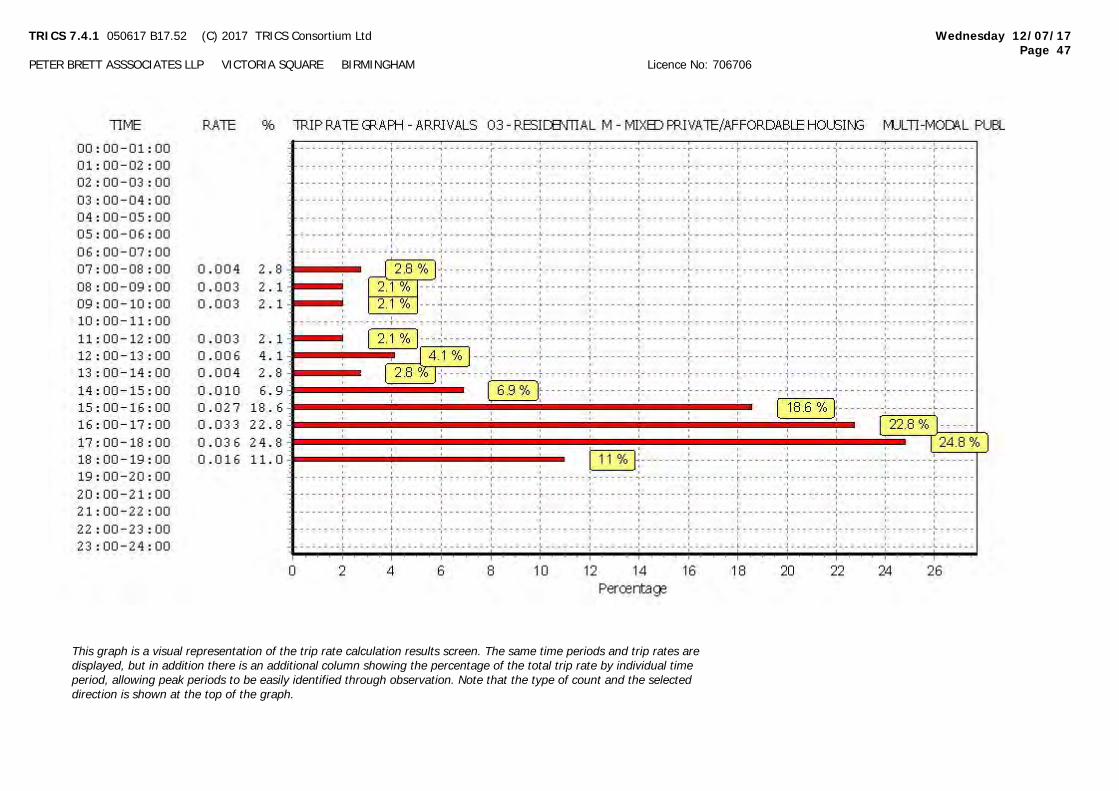
TRICS 7.4.1 050617 B17.52 (C) 2017 TRICS Consortium Ltd Wednesday 12/07/17
Page 47
PETER BRETT ASSSOCIATES LLP VICTORIA SQUARE BIRMINGHAM Licence No: 706706
This graph is a visual representation of the trip rate calculation results screen. The same time periods and trip rates are
displayed, but in addition there is an additional column showing the percentage of the total trip rate by individual time
period, allowing peak periods to be easily identified through observation. Note that the type of count and the selected
direction is shown at the top of the graph.
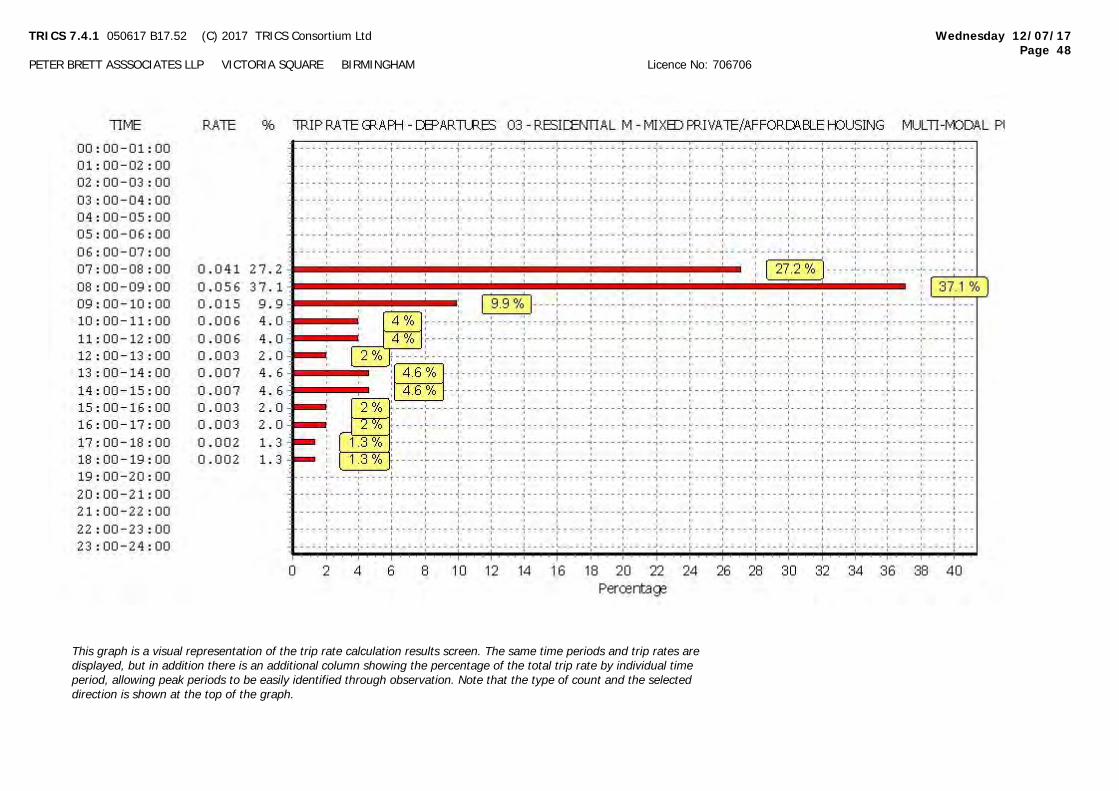
TRICS 7.4.1 050617 B17.52 (C) 2017 TRICS Consortium Ltd Wednesday 12/07/17
Page 48
PETER BRETT ASSSOCIATES LLP VICTORIA SQUARE BIRMINGHAM Licence No: 706706
This graph is a visual representation of the trip rate calculation results screen. The same time periods and trip rates are
displayed, but in addition there is an additional column showing the percentage of the total trip rate by individual time
period, allowing peak periods to be easily identified through observation. Note that the type of count and the selected
direction is shown at the top of the graph.

TRICS 7.4.1 050617 B17.52 (C) 2017 TRICS Consortium Ltd Wednesday 12/07/17
Page 49
PETER BRETT ASSSOCIATES LLP VICTORIA SQUARE BIRMINGHAM Licence No: 706706
This graph is a visual representation of the trip rate calculation results screen. The same time periods and trip rates are
displayed, but in addition there is an additional column showing the percentage of the total trip rate by individual time
period, allowing peak periods to be easily identified through observation. Note that the type of count and the selected
direction is shown at the top of the graph.
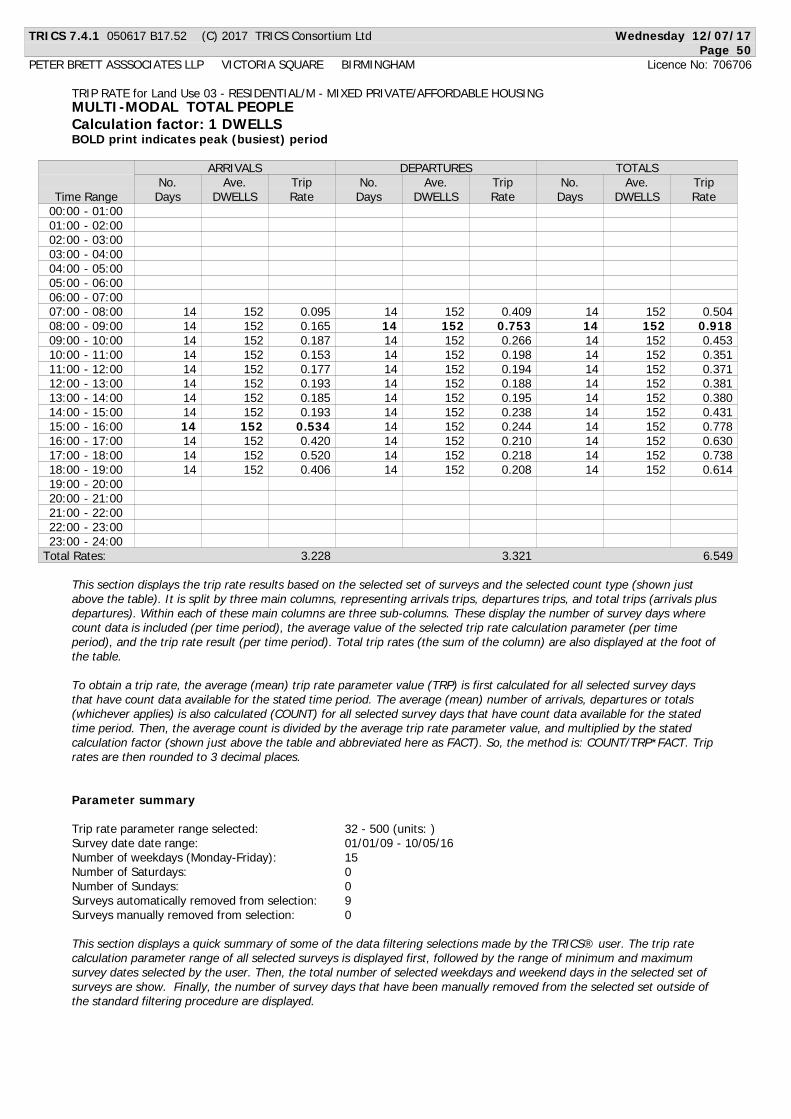
TRICS 7.4.1 050617 B17.52 (C) 2017 TRICS Consortium Ltd Wednesday 12/07/17
Page 50
PETER BRETT ASSSOCIATES LLP VICTORIA SQUARE BIRMINGHAM Licence No: 706706
TRIP RATE for Land Use 03 - RESIDENTIAL/M - MIXED PRIVATE/AFFORDABLE HOUSING
MULTI-MODAL TOTAL PEOPLE
Calculation factor: 1 DWELLS
BOLD print indicates peak (busiest) period
ARRIVALS DEPARTURES TOTALS
No. Ave. Trip No. Ave. Trip No. Ave. Trip
Time Range Days DWELLS Rate Days DWELLS Rate Days DWELLS Rate
00:00 - 01:00
01:00 - 02:00
02:00 - 03:00
03:00 - 04:00
04:00 - 05:00
05:00 - 06:00
06:00 - 07:00
14 152 0.095 14 152 0.409 14 152 0.50407:00 - 08:00
14 152 0.165 14 152 0.753 14 152 0.91808:00 - 09:00
14 152 0.187 14 152 0.266 14 152 0.45309:00 - 10:00
14 152 0.153 14 152 0.198 14 152 0.35110:00 - 11:00
14 152 0.177 14 152 0.194 14 152 0.37111:00 - 12:00
14 152 0.193 14 152 0.188 14 152 0.38112:00 - 13:00
14 152 0.185 14 152 0.195 14 152 0.38013:00 - 14:00
14 152 0.193 14 152 0.238 14 152 0.43114:00 - 15:00
14 152 0.534 14 152 0.244 14 152 0.77815:00 - 16:00
14 152 0.420 14 152 0.210 14 152 0.63016:00 - 17:00
14 152 0.520 14 152 0.218 14 152 0.73817:00 - 18:00
14 152 0.406 14 152 0.208 14 152 0.61418:00 - 19:00
19:00 - 20:00
20:00 - 21:00
21:00 - 22:00
22:00 - 23:00
23:00 - 24:00
Total Rates: 3.228 3.321 6.549
This section displays the trip rate results based on the selected set of surveys and the selected count type (shown just
above the table). It is split by three main columns, representing arrivals trips, departures trips, and total trips (arrivals plus
departures). Within each of these main columns are three sub-columns. These display the number of survey days where
count data is included (per time period), the average value of the selected trip rate calculation parameter (per time
period), and the trip rate result (per time period). Total trip rates (the sum of the column) are also displayed at the foot of
the table.
To obtain a trip rate, the average (mean) trip rate parameter value (TRP) is first calculated for all selected survey days
that have count data available for the stated time period. The average (mean) number of arrivals, departures or totals
(whichever applies) is also calculated (COUNT) for all selected survey days that have count data available for the stated
time period. Then, the average count is divided by the average trip rate parameter value, and multiplied by the stated
calculation factor (shown just above the table and abbreviated here as FACT). So, the method is: COUNT/TRP*FACT. Trip
rates are then rounded to 3 decimal places.
Parameter summary
Trip rate parameter range selected: 32 - 500 (units: )
Survey date date range: 01/01/09 - 10/05/16
Number of weekdays (Monday-Friday): 15
Number of Saturdays: 0
Number of Sundays: 0
Surveys automatically removed from selection: 9
Surveys manually removed from selection: 0
This section displays a quick summary of some of the data filtering selections made by the TRICS® user. The trip rate
calculation parameter range of all selected surveys is displayed first, followed by the range of minimum and maximum
survey dates selected by the user. Then, the total number of selected weekdays and weekend days in the selected set of
surveys are show. Finally, the number of survey days that have been manually removed from the selected set outside of
the standard filtering procedure are displayed.
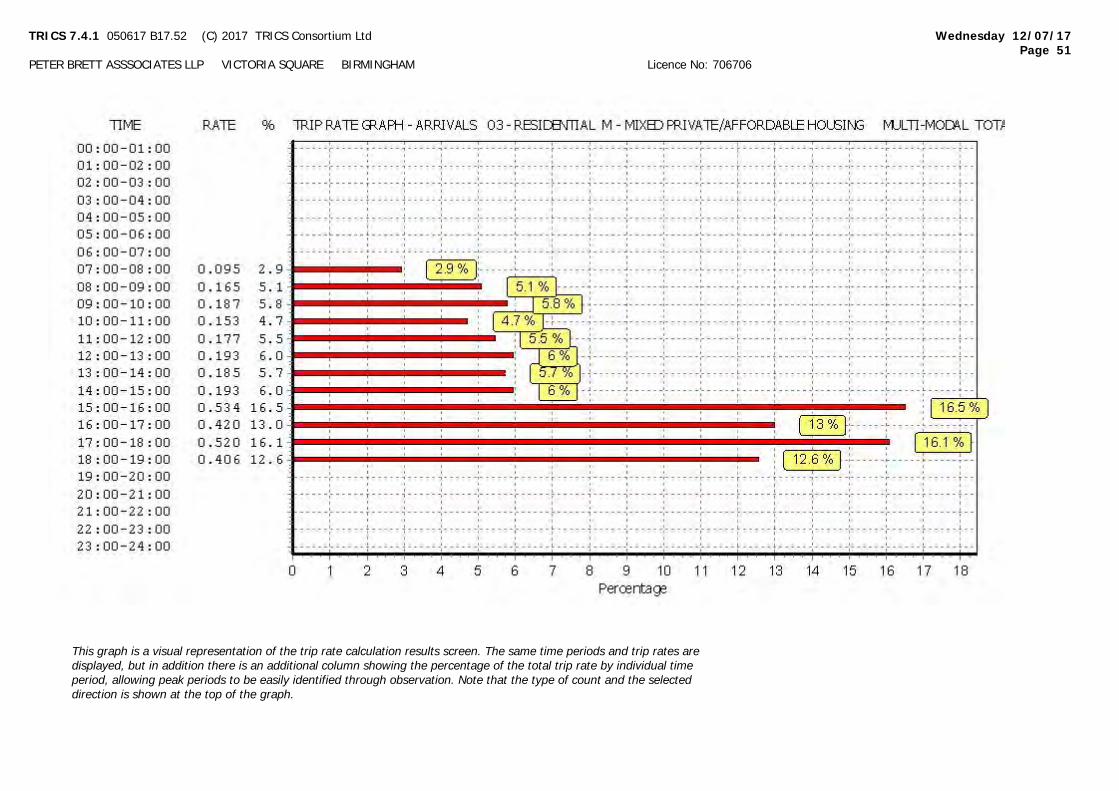
TRICS 7.4.1 050617 B17.52 (C) 2017 TRICS Consortium Ltd Wednesday 12/07/17
Page 51
PETER BRETT ASSSOCIATES LLP VICTORIA SQUARE BIRMINGHAM Licence No: 706706
This graph is a visual representation of the trip rate calculation results screen. The same time periods and trip rates are
displayed, but in addition there is an additional column showing the percentage of the total trip rate by individual time
period, allowing peak periods to be easily identified through observation. Note that the type of count and the selected
direction is shown at the top of the graph.
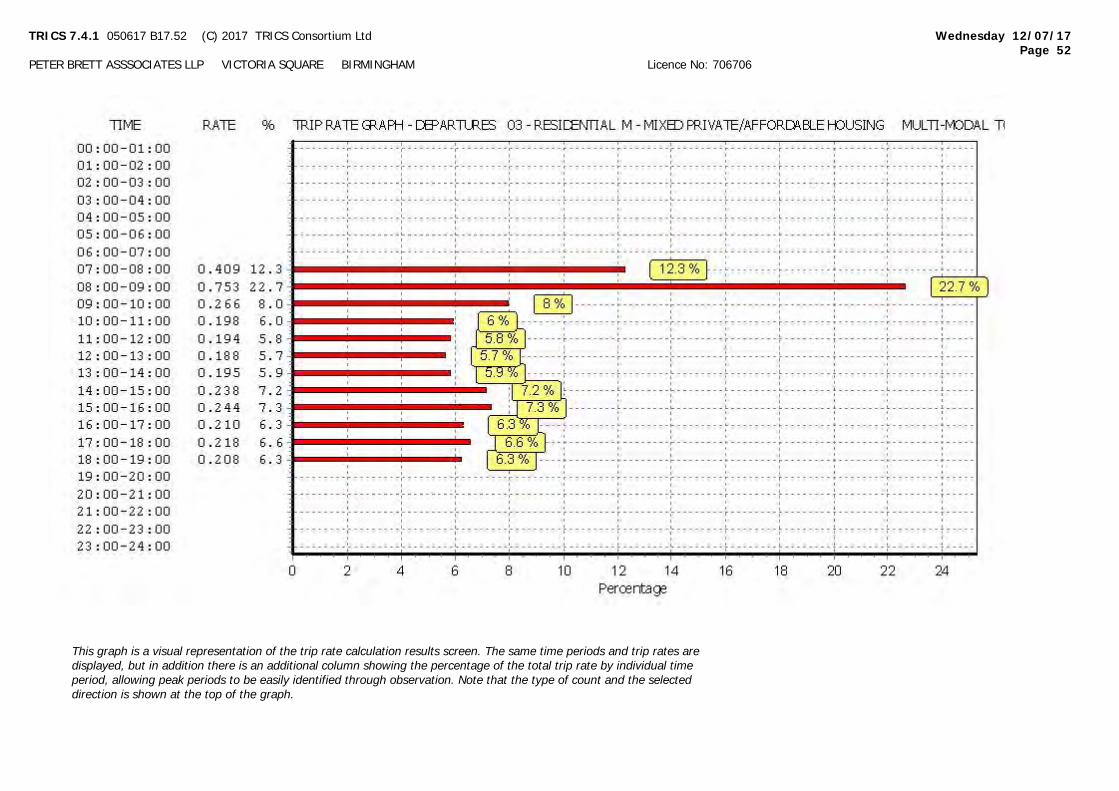
TRICS 7.4.1 050617 B17.52 (C) 2017 TRICS Consortium Ltd Wednesday 12/07/17
Page 52
PETER BRETT ASSSOCIATES LLP VICTORIA SQUARE BIRMINGHAM Licence No: 706706
This graph is a visual representation of the trip rate calculation results screen. The same time periods and trip rates are
displayed, but in addition there is an additional column showing the percentage of the total trip rate by individual time
period, allowing peak periods to be easily identified through observation. Note that the type of count and the selected
direction is shown at the top of the graph.
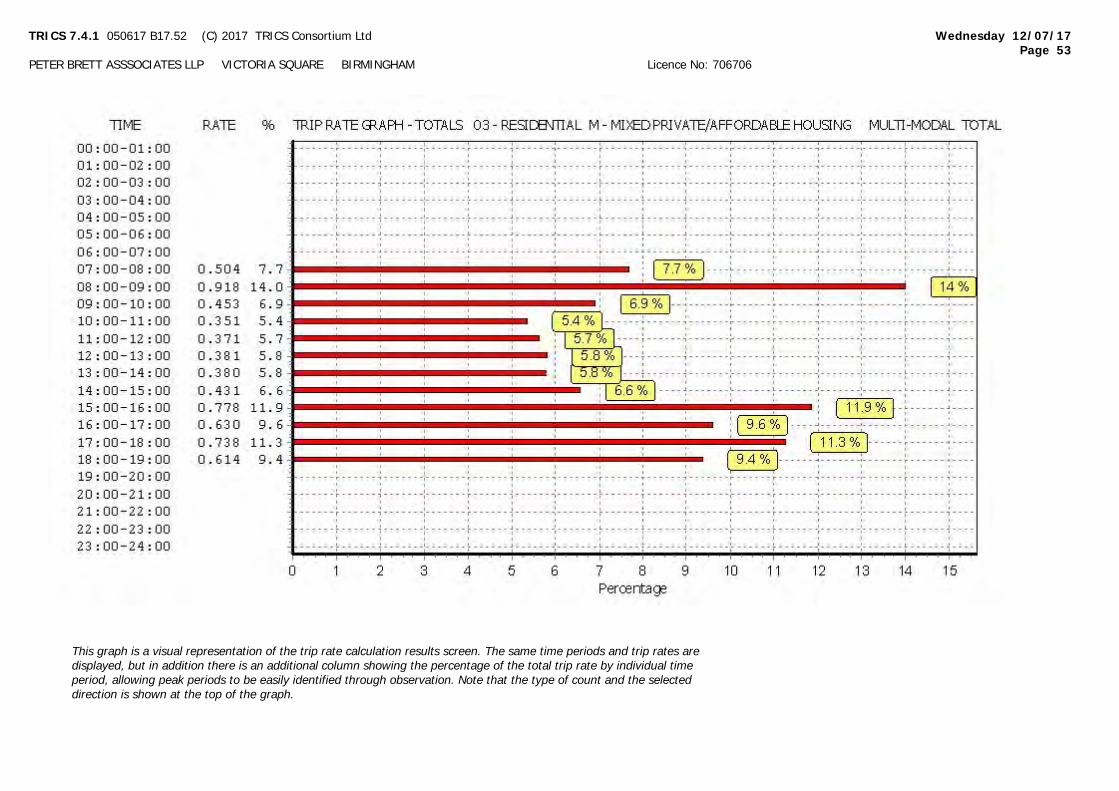
TRICS 7.4.1 050617 B17.52 (C) 2017 TRICS Consortium Ltd Wednesday 12/07/17
Page 53
PETER BRETT ASSSOCIATES LLP VICTORIA SQUARE BIRMINGHAM Licence No: 706706
This graph is a visual representation of the trip rate calculation results screen. The same time periods and trip rates are
displayed, but in addition there is an additional column showing the percentage of the total trip rate by individual time
period, allowing peak periods to be easily identified through observation. Note that the type of count and the selected
direction is shown at the top of the graph.
Related Documents