Article Radiosity from Individual Urban Landscape Elements Measured Using a Modified Low-Cost Temperature Sensor Jane Loveday 1, * , Grant K. Loveday 2 , Joshua J. Byrne 1 , Boon-lay Ong 3 and Gregory M. Morrison 1 1 School of Design and the Built Environment, Curtin University Sustainability Policy Institute, Curtin University, Bentley 6102, Australia; [email protected] (J.J.B.); [email protected] (G.M.M.) 2 Independent Researcher, Booragoon 6154, Australia; [email protected] 3 School of Design and the Built Environment, Curtin University, Bentley 6102, Australia; [email protected] * Correspondence: [email protected]; Tel.: +61-8-9266-9030 Received: 19 December 2019; Accepted: 11 March 2020; Published: 23 March 2020 Abstract: Loss of green space in our suburban environment is contributing to increased urban heat. The material properties of surface treatments or landscape elements (LEs) are a determining factor in the amount, timing, and type of radiation present in the local environment. Landscape designers can use this information to better design for urban heat management, as emitted and reflected radiation (radiosity) from LEs can affect pedestrians via heat stress and glare and affect energy usage in buildings and houses if the landscape sky view factor is low. Low-cost black painted iButton temperature sensors were successfully used as radiometers to concurrently measure the daytime radiosity from 19 LEs samples located on an oval in the warm temperate climate of Perth, (Australia). Normalisation against gloss white paint on polystyrene removed the effect of varying weather conditions. Each LE had the same normalised average radiosity (DR av ) between seasons (within ±5%), meaning the relative radiosity of new LEs can be measured on any day. White and lighter coloured LEs had the highest DR av and would have the most detrimental effect on nearby objects. Plants and moist LEs had the least DR av and would be most beneficial for managing local daytime urban heat. Measuring relative radiosity with iButtons presents a new way to examine the effect of LEs on the urban environment. Keywords: radiant energy; iButtons; thermochrons; urban heat; landscape design 1. Introduction The urban heat island (UHI) effect is the increased night-time ambient temperatures in urban areas when compared with nearby rural areas [1]. Superimposed on this are the increasing ambient temperatures due to global warming, causing particular concern in urban areas. One of the main drivers of the UHI is land use change and the replacement of vegetation with hardscape such as concrete, asphalt and pavers [2–5]. The landscapes surrounding buildings and houses in the urban and suburban environment may thus play an important role in subsequently managing this accumulated heat. Landscapes can consist of a number of different individual surface treatments defined here as landscape elements (LEs), such as turf grass, concrete paving, crushed rock, mulch, trees, and shrubs. The amount and timing of urban heat is influenced by the material properties of these LEs, in particular albedo, moisture availability, surface roughness, and thermal inertia [1,6]. On reaching the surface of the LE, a portion of the solar radiation is reflected (albedo) and the remainder is absorbed. The surface Urban Sci. 2020, 4, 14; doi:10.3390/urbansci4010014 www.mdpi.com/journal/urbansci

Welcome message from author
This document is posted to help you gain knowledge. Please leave a comment to let me know what you think about it! Share it to your friends and learn new things together.
Transcript

Article
Radiosity from Individual Urban Landscape ElementsMeasured Using a Modified Low-CostTemperature Sensor
Jane Loveday 1,* , Grant K. Loveday 2, Joshua J. Byrne 1, Boon-lay Ong 3 andGregory M. Morrison 1
1 School of Design and the Built Environment, Curtin University Sustainability Policy Institute,Curtin University, Bentley 6102, Australia; [email protected] (J.J.B.);[email protected] (G.M.M.)
2 Independent Researcher, Booragoon 6154, Australia; [email protected] School of Design and the Built Environment, Curtin University, Bentley 6102, Australia;
[email protected]* Correspondence: [email protected]; Tel.: +61-8-9266-9030
Received: 19 December 2019; Accepted: 11 March 2020; Published: 23 March 2020�����������������
Abstract: Loss of green space in our suburban environment is contributing to increased urbanheat. The material properties of surface treatments or landscape elements (LEs) are a determiningfactor in the amount, timing, and type of radiation present in the local environment. Landscapedesigners can use this information to better design for urban heat management, as emitted andreflected radiation (radiosity) from LEs can affect pedestrians via heat stress and glare and affectenergy usage in buildings and houses if the landscape sky view factor is low. Low-cost black paintediButton temperature sensors were successfully used as radiometers to concurrently measure thedaytime radiosity from 19 LEs samples located on an oval in the warm temperate climate of Perth,(Australia). Normalisation against gloss white paint on polystyrene removed the effect of varyingweather conditions. Each LE had the same normalised average radiosity (DRav) between seasons(within ±5%), meaning the relative radiosity of new LEs can be measured on any day. White andlighter coloured LEs had the highest DRav and would have the most detrimental effect on nearbyobjects. Plants and moist LEs had the least DRav and would be most beneficial for managing localdaytime urban heat. Measuring relative radiosity with iButtons presents a new way to examine theeffect of LEs on the urban environment.
Keywords: radiant energy; iButtons; thermochrons; urban heat; landscape design
1. Introduction
The urban heat island (UHI) effect is the increased night−time ambient temperatures in urbanareas when compared with nearby rural areas [1]. Superimposed on this are the increasing ambienttemperatures due to global warming, causing particular concern in urban areas. One of the main driversof the UHI is land use change and the replacement of vegetation with hardscape such as concrete,asphalt and pavers [2–5]. The landscapes surrounding buildings and houses in the urban and suburbanenvironment may thus play an important role in subsequently managing this accumulated heat.
Landscapes can consist of a number of different individual surface treatments defined here aslandscape elements (LEs), such as turf grass, concrete paving, crushed rock, mulch, trees, and shrubs.The amount and timing of urban heat is influenced by the material properties of these LEs, in particularalbedo, moisture availability, surface roughness, and thermal inertia [1,6]. On reaching the surface ofthe LE, a portion of the solar radiation is reflected (albedo) and the remainder is absorbed. The surface
Urban Sci. 2020, 4, 14; doi:10.3390/urbansci4010014 www.mdpi.com/journal/urbansci
Urban Sci. 2020, 4, 14 2 of 47
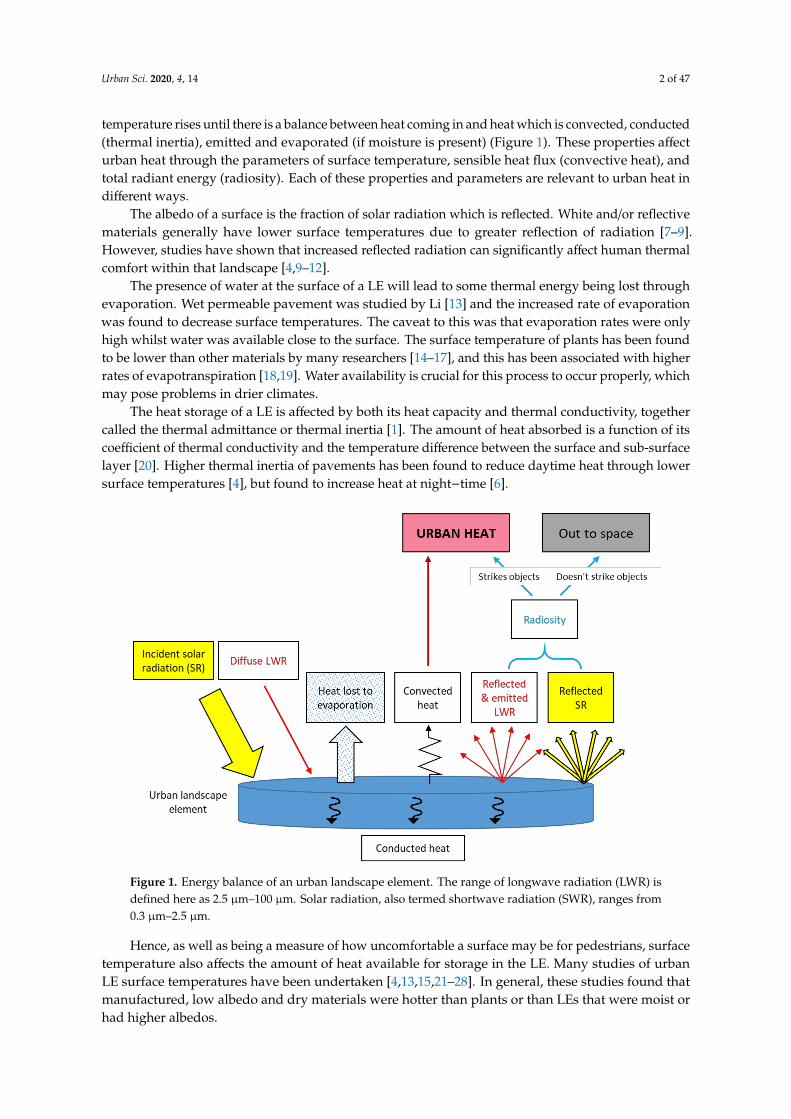
temperature rises until there is a balance between heat coming in and heat which is convected, conducted(thermal inertia), emitted and evaporated (if moisture is present) (Figure 1). These properties affecturban heat through the parameters of surface temperature, sensible heat flux (convective heat), andtotal radiant energy (radiosity). Each of these properties and parameters are relevant to urban heat indifferent ways.
The albedo of a surface is the fraction of solar radiation which is reflected. White and/or reflectivematerials generally have lower surface temperatures due to greater reflection of radiation [7–9].However, studies have shown that increased reflected radiation can significantly affect human thermalcomfort within that landscape [4,9–12].
The presence of water at the surface of a LE will lead to some thermal energy being lost throughevaporation. Wet permeable pavement was studied by Li [13] and the increased rate of evaporationwas found to decrease surface temperatures. The caveat to this was that evaporation rates were onlyhigh whilst water was available close to the surface. The surface temperature of plants has been foundto be lower than other materials by many researchers [14–17], and this has been associated with higherrates of evapotranspiration [18,19]. Water availability is crucial for this process to occur properly, whichmay pose problems in drier climates.
The heat storage of a LE is affected by both its heat capacity and thermal conductivity, togethercalled the thermal admittance or thermal inertia [1]. The amount of heat absorbed is a function of itscoefficient of thermal conductivity and the temperature difference between the surface and sub-surfacelayer [20]. Higher thermal inertia of pavements has been found to reduce daytime heat through lowersurface temperatures [4], but found to increase heat at night−time [6].
Figure 1. Energy balance of an urban landscape element. The range of longwave radiation (LWR) isdefined here as 2.5 µm–100 µm. Solar radiation, also termed shortwave radiation (SWR), ranges from0.3 µm–2.5 µm.
Hence, as well as being a measure of how uncomfortable a surface may be for pedestrians, surfacetemperature also affects the amount of heat available for storage in the LE. Many studies of urbanLE surface temperatures have been undertaken [4,13,15,21–28]. In general, these studies found thatmanufactured, low albedo and dry materials were hotter than plants or than LEs that were moist orhad higher albedos.

Urban Sci. 2020, 4, 14 3 of 47
Surface temperature also directly affects the amount of heat convected into the air from that surface.From Newton’s law of cooling for convection, the amount of convected heat is proportional to thedifference between the surface and ambient temperatures, and is also proportional to the coefficient ofconvection for that surface [29]. The coefficient of convection comprises natural and forced components.When wind speed increases, the convection increases due to the forced convection component. Largeareas of a LE with a high surface temperature in urban spaces thus have the potential to significantlyincrease urban heat.
Longwave radiation (LWR) is emitted from all bodies at temperatures above absolute zero. The higherthe surface temperature of a LE, the greater the amount of emitted LWR through the application ofStefan–Boltzmann’s law [20]. The amount of emitted LWR is also dependent on the emissivity (ε) of thebody, a measure of how effective that body is at emitting heat (0 for a perfect reflector, 1 for a perfectemitter). The emissivity of most LEs is very high, ranging from ~0.76 to ~0.96, with the exception of shinymetals, which can be as low as 0.04 [30], and it varies depending on material surface properties [31].
The radiosity from a LE is the combination of this emitted LWR as well as the reflected solarradiation (Figure 1). Whilst radiosity from LEs does not directly heat the air, it can increase urbanheat by striking nearby objects, causing them to increase in temperature [12]. The radiosity of LEshas previously been measured using commercial net radiometers over in situ LEs [12,32], or overspecifically constructed LE samples [33]. Other researchers have used pyranometers in conjunctionwith surface temperature sensors to effectively determine the radiosity over constructed samples [15,34].As these instruments are relatively expensive, measurements were usually made of one or two LEs ata time, by either alternately facing the instrument towards the LE and then to the sky in the case ofa pyranometer, or by leaving the net radiometer above one or two LEs for a period of time, beforemoving on to the next. This process drastically reduces the number of measurable LEs. Furthermore,the radiosity of smaller LEs cannot be measured using these instruments, as with a diameter of ~ 0.1 m,the shadow cast by the instrument becomes significant, especially as the height above the LE needs tobe lowered to increase the amount of radiation received from the LE compared with the surroundings.
Diurnal variations in radiosity are important, as the thermal properties of LEs lead to energybeing released back to the surroundings at different times. The timing of this energy release couldimpact how and when landscapes are used by people. Seasonal variation of radiosity could also beimportant but does not appear to have been well studied. Li [13], however, measured the albedo andsurface temperature of concrete, asphalt and pavers across seasons. Whilst these factors were notcombined into a single radiosity measurement, the surface temperature was found to be higher insummer, but the albedo did not change with season.
To address the glare of high albedo materials whilst retaining the benefits of cooler surfacetemperatures, new materials named cool-coloured materials have been engineered. These increase thereflectance of solar radiation in the near-infrared (NIR) band, offering non-white colours which reflecta significant amount of solar radiation. A laboratory study by Xie et al. [35] found that increased NIRreflectance reduced surface temperatures, while Kyriakodis and Santamouris [36] found the applicationof these materials to roofs, roads and pavements also reduced surface temperatures when comparedwith conventional materials (although cool asphalt reflectance halved after deposition of tyre rubberover time). However, although reduced glare for pedestrians is a major benefit of these materials,the effect of the reflected NIR on people and buildings has not been investigated. Hence, as newmaterials are developed, radiosity testing will be required in the laboratory, but more importantly inthe field, where other objects and weathering will influence their radiosity.
Measurement of the radiosity from different LEs will help identify those which would have themost impact on heat management. To reduce the influence of fluctuations in weather conditions onthe relative radiosity of different LEs in the field, they should be measured concurrently. Taking athermal image to find surface temperature is a fairly simple process; however, measuring, and thenre-locating, a single radiometer above each LE for each measurement is neither practical, nor timeefficient. Furthermore, the high cost of a radiometer and its associated data logger is a barrier to the

Urban Sci. 2020, 4, 14 4 of 47
purchase of multiple units. Unlike other studies of radiosity, a reference material of white paintedpolystyrene was used in this research to take into account the effects of changing weather conditions(ambient temperature, wind speed and sky temperature).
Akbari et al. [37] developed a standardised procedure for ranking roofing materials according toboth their emitted heat and their solar reflectivity, called the Solar Reflectance Index (SRI). It is generatedby measuring a material under two controlled laboratory measurement procedures of reflectance [38]and emittance [39], and calculates SRI based on one assumed set of standard ambient conditions and aconvective coefficient for the material. This method could be used for LEs; however, it does not takeinto account diurnally and seasonally varying ambient temperatures and solar radiation. The assumedconvective coefficient would not be applicable to more massive or rough surfaces as are found in LEsas opposed to roofing materials. However, if the reflected and emitted radiant energy from LEs couldbe measured concurrently and diurnally using a single instrument in the field, then this may provide asimpler and more efficient way of assessing LEs under real world conditions.
Aoki and Mizutani [40] used a low-cost instrument to investigate the vertical distribution ofreflected SWR from three different LEs. They constructed a polystyrene post consisting of numerousthin matte black painted aluminium plates mounted at set intervals and monitored the plates’ surfacetemperatures using thermocouples. A similar principle to this has been explored in this paper by usingsmall modified temperature sensors or thermochrons called iButtons [41] to detect radiation acrossboth the visible and thermal spectra. The purpose of this paper was to investigate a low-cost (~AU$50)temperature sensor for use as a radiometer, and to use multiple units concurrently to measure theradiosity from a number of different LEs typically used in Perth urban and suburban areas. Small LEswere tested across the four seasons, whilst larger, ground coupled LEs were tested in summer. LEswere ranked in order of summer radiosity and the implications of the LEs material properties on thisranking are discussed.
2. Materials and Methods
Obtaining sufficient measurement accuracy in outdoor urban environments is challenging due tovariable weather conditions and interactions between intended measurement materials and surroundingobjects such as buildings, vehicles and pedestrians. However, the benefit of measuring in the outdoorenvironment is the ability to capture the response of the tested LEs to the natural varying diurnal solarradiation (SR) across seasons. Using samples of LEs is beneficial, as they can be placed in an open areawith a high sky view factor (SVF) [42] in order to minimise the radiative interference from surroundingobjects. The LEs would be exposed to full SR throughout the day. In this study, measurements wereperformed on samples of LEs located outdoors under a high SVF.
This study consisted of two phases. The first study (phase 1) tested LEs which were smaller insize and placed directly on to the turf grass on the oval. These were measured across each of the fourseasons. The second study (phase 2) used larger LEs which were coupled to the ground through a bedof sand placed on the turf grass. Due to their size and subsequent increase in cost, only a subset of thephase 1 LEs were used in phase 2. These were measured in summer only. Loveday et al. [28] indicatedthat the size and coupling of the LEs to the ground affected the quantity of thermal radiation. Hence,the purpose of phase 2 was to investigate the effect of these factors on radiosity. LEs were comparedwith each other to determine a relative radiosity ranking.
2.1. Study Design Phase 1 (Small LEs)
2.1.1. Materials
Aluminium foil, white painted polystyrene (WPP), black painted cardboard on polystyrene and19 different LEs (see Table 1) were positioned in the centre of a turf grassed oval at the BooragoonPrimary School in Perth, Western Australia (coordinates: −32.035918◦, 115.826655◦). Perth has atemperate climate with a dry summer, classified as Csa under the Köppen–Geiger climate classification

Urban Sci. 2020, 4, 14 5 of 47
system [43]. The foil was first crumpled and then straightened out (but not smoothed) and mountedshiny side up on a flat wooden board. This provided a diffuse reflector with a reflectivity as closeto 1.0 as possible and was used to measure reflected sky temperature (as per the reflector methodused in [44]). The black and white painted polystyrene were used as reference materials, with thepolystyrene insulating these from the ground. Most LEs were placed directly onto the turf grass(Figure 2). These were the red, sandstone, and grey pavers, both concrete slabs, artificial turf grass,all of the shade cloths, the decking, and the limestone block. Some LEs were placed onto a whitepolypropylene (PP) bag on the turf grass. These were the white and polished black stones, and themoist soil. The remaining LEs (soil, asphalt, mulch, and white and grey sand), were also placed ontoa PP bag but were then placed within a low-sided plastic crate which allowed the samples to betransported between seasons whilst retaining the same surface area and depth of the LE. The artificialgrass was set up in two ways to observe if there were any differences related to the installation method.One sample of artificial grass was placed directly onto the oval grass, while a second sample was firstlaid onto a bed of crushed rock and the surface sprinkled with white sand, as per a typical installationprocedure, and then placed on to a PP bag within a plastic crate. To prevent them from blowingaway, all light mass LEs (artificial grass, shade cloths, WPP and BPP), as well as the edges of anyPP (including the PP in the plastic crates), were pinned to the ground using four small metal tentpegs. The pegs were hammered straight into the ground next to the LEs, with the short end of the pegunobtrusively holding down each of the four corners of the LE or PP. The turf grass on the oval wasPennisetum clandestinum, (the common name being kikuyu), and was managed and irrigated. LEs werespaced between 200 and 600 mm apart to reduce their effect on each other. To prevent any interferencefrom the public, safety tape was erected around the site.
Ideally, all the LEs would have the same surface area in order to minimise confounding factors.In reality, both the standard sizes of the each LE type, and the way they were constructed for thetest work, varied (Table 1). The different shapes were accounted for by calculation of view factors,described in Section 2.3.4.
Small wireless temperature sensors called Themochron iButtons (Maxim Integrated, San Jose,CA, USA) [42], capable of logging data over long time periods, were used as low-cost radiometers bypainting one surface with matt black paint [45]. These painted sensors measure 17 mm in diameterand are 6 mm high (Figure 3a). The undercoat was a spray of matt black (brand Fiddly Bits), with atopcoat of Rust Guard satin black spray (brand White Knight), applied to give a visibly darker finish.The types of iButtons used were the DS1921G low temperature (−40 to +85 ◦C, accuracy ±1.0 ◦C), andthe DS1922T, high temperature (0 to +125 ◦C, accuracy ±0.5 ◦C) thermochrons. The response time of theiButtons is given as 130 s, although validation studies performed by van Marken Lichtenbelt et al. [46],albeit on the DS1291H (range 15–45 ◦C), indicated a better accuracy and response time in practicethan given by the manufacturer (on average 0.09 ◦C less than a standard thermometer, and a responseof only 19 s). The black paint of the iButton is expected to absorb both longwave radiation (LWR)and short-wave radiation (SWR), with absorptivities of 0.88 [30] and 0.95 [47], respectively. It willalso respond to convected heat from the LE, although this depends on its proximity to the LE and thestrength of the wind currents.
Table 1. Description of landscape elements (LEs) used in the phase 1 seasonal test.
LE Name Description Overall Dimensions of LE (mm)
Artificial turf grass Tuff Turf Grass Mat 20 mm pile, green/naturalbrown curl 1000 × 1000, height 20
Artificial turf grass (laid) As above but laid on crushed rock ~50 mm thick.Top surface was then sprinkled with white sand. 410 × 560 × 50
Asphalt Westbuild asphalt pack (half a 20 kg bag,) 290 × 340 × 50
Concrete slab (×40 mm) Grey concrete slab 460 × 350 × 38
Concrete slab (×80 mm) 2 × Grey concrete slab 38 mm thick 450 × 550 × 76

Urban Sci. 2020, 4, 14 6 of 47
Table 1. Cont.
LE Name Description Overall Dimensions of LE (mm)
Crushed rock (white) Tuscan path 20 mm–25 mm snow white quartzpebbles 20 kg 440 × 440 × 60
DeckingTimberlink Australia 70 mm × 19 mm treated pine,
no finish, (5 lengths mounted on 2 pine joists,height 70 mm)
360 × 1070 × 19
Limestone block Flat edge 500 × 250 × 150
Pine bark mulch Richgro pinebark (half a 40 L bag) 580 × 550 × 80
Pavers (grey) Tuscan Path bluestone paver 400 × 400 × 40
Pavers (red) 6 × Ezi-Pave Burnished Red (Midland Brick)232 mm × 153 mm × 50 mm 450 × 460 × 50
Pavers (sandstone) Tuscan Path sandstone paver 400 × 400 × 40
Polished stones (black) Tuscan path polished black pebbles stone (half a15 kg bag) 550 × 500 × 75
Sand (grey) Residential garden bed sample 450 diameter, depth 50
Sand (white) Westbuild white, washed sand, (half of a 20 kg bag) 450 diameter, depth 50
Shade cloth (black) Coolaroo black 70%, folded into four layers 500 × 560
Shade cloth (cream) Coolaroo sandstone 70%, folded into four layers 470 × 530
Shade cloth (white) Hortshade white 50%, folded into four layers 470 × 530
Soil (dry) Hortico garden soil (half a 25 L bag) 500 × 500 × 50
Soil (moist) Hortico garden soil (half a 25 L bag) 410 × 780 × 50
Turf grass (kikuyu) Pennisetum clandestinum, managed and irrigated ~1000 × ~2500
White painted polystyrene Gloss white, exterior water based, 4 seasons,(British Paints) on a polystyrene base 560 × 460 × 35
Black painted card onpolystyrene
Flat black, exterior water based, 4 seasons, (BritishPaints) painted black cardboard on polystyrene 460 × 410 × 35
Figure 2. Phase 1 LEs showing the low-sided plastic crates and the polypropylene bags used to containsome LEs.

Urban Sci. 2020, 4, 14 7 of 47
Each LE had a black painted iButton mounted in a polystyrene block (described in [45]), suspended0.2 m above it, protruding 0.15 m towards the centre of the LE from the middle of one edge of the LE(Figure 3b). The top side of the polystyrene was covered in aluminium foil to reduce solar heat gain tothe iButton. A thermal imaging camera (Testo 876, Testo Pty. Ltd, Croydon South, Australia) withrange of 8–14 µm and accuracy ±2 ◦C was used to take images from directly above each LE from aheight of approximately 1 m.
Figure 3. iButtons during measurements: (a) black painted iButton in a polystyrene block;and (b) iButton in a polystyrene block covered in aluminium foil, measuring above the grey pavers LE.
2.1.2. Field Measurement Conditions
Measurements were performed over one day during each of the four seasons: 9th April 2017(autumn); 24th August 2017 (winter); 5th October 2017 (spring); and 9th January 2018 (summer).Measurements commenced a few hours before sunrise and continued until a few hours after sunset.The chosen days had no visible cloud cover and had average wind speed for that time of year.Weather parameters logged every 600 s were accessed via a nearby weather station at MurdochUniversity [48], 3.6 km away. Conditions were close to the Bureau of Meteorology averages for themeasured months. LEs were placed on the oval the day previous to each test day in order to equilibrateto outdoor conditions.
The sampling rate of each iButton was set to 600 s by connecting it to a computer through a USBinterface (LinkUSBi, Maxim Integrated, San Jose, CA, USA) and using the manufacturer’s software(OneWireViewer, Maxim Integrated, San Jose, CA, USA). Thermal images were taken every half an hour.
2.2. Study Design Phase 2 (Larger, Ground-Coupled LEs)
2.2.1. Materials
The LEs used for phase 2 are described in Table 2. They were all the same product type as thoseused in the seasonal measurements, except for decking and artificial turf grass, where the originaltypes were unavailable. Although the same product types were purchased for the other LEs, therewere some dissimilarities in colour and size between some of the phase 1 and phase 2 LEs, particularlyfor the more natural materials such as crushed white rocks, pine bark mulch and the soils. The newartificial grass was a slightly darker colour, whilst the new decking was a different shade of brown(Figure 4). In addition, an annual non-native ground cover of petunias (Petunias × hybrida) and somenative saltbush seedlings (Atriplex nummularia) were tested as a comparison to turf grass. The groundcover (petunias) were in 100 mm pots closely packed together to give nearly 100% coverage of thesand. The saltbush seedlings were in 50 × 50 mm containers within seedling trays and similarly closely
Urban Sci. 2020, 4, 14 8 of 47
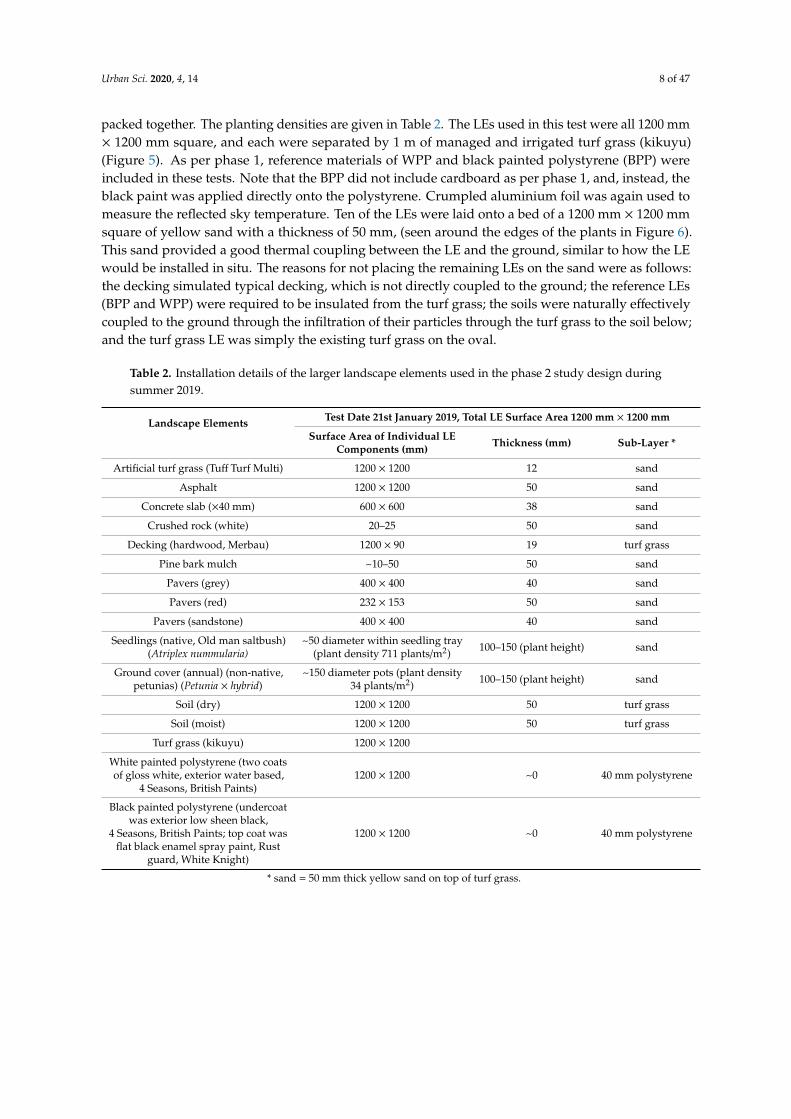
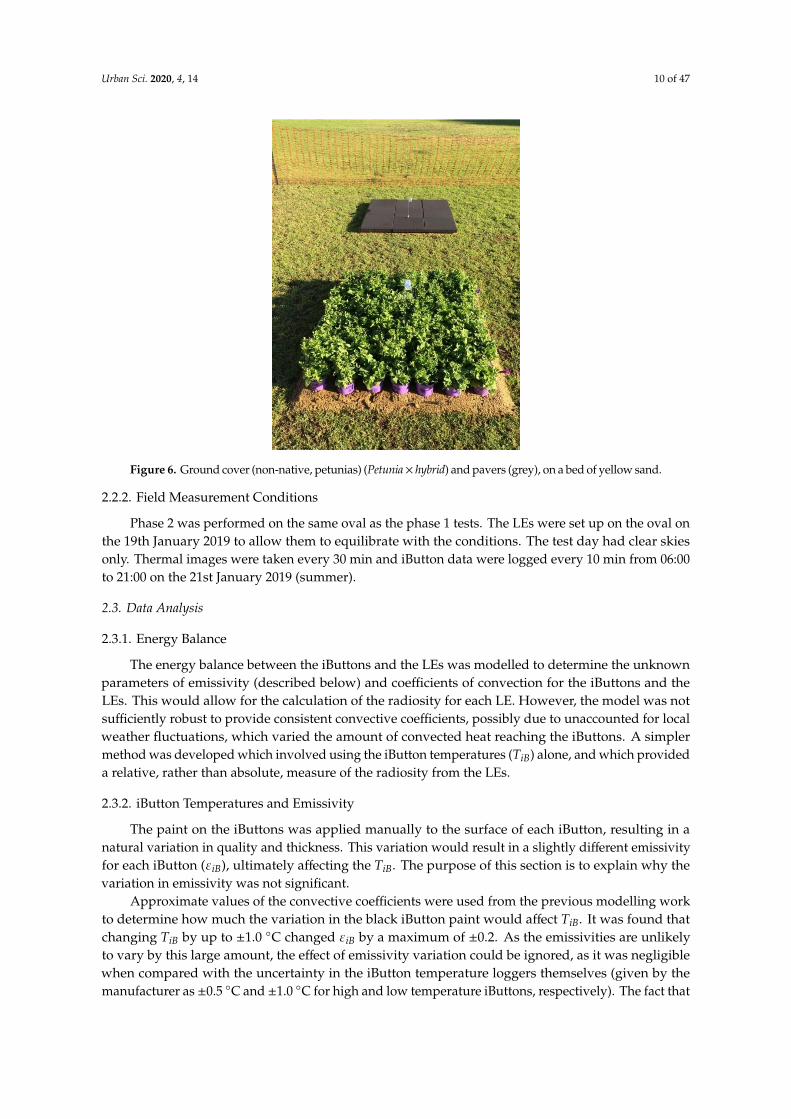
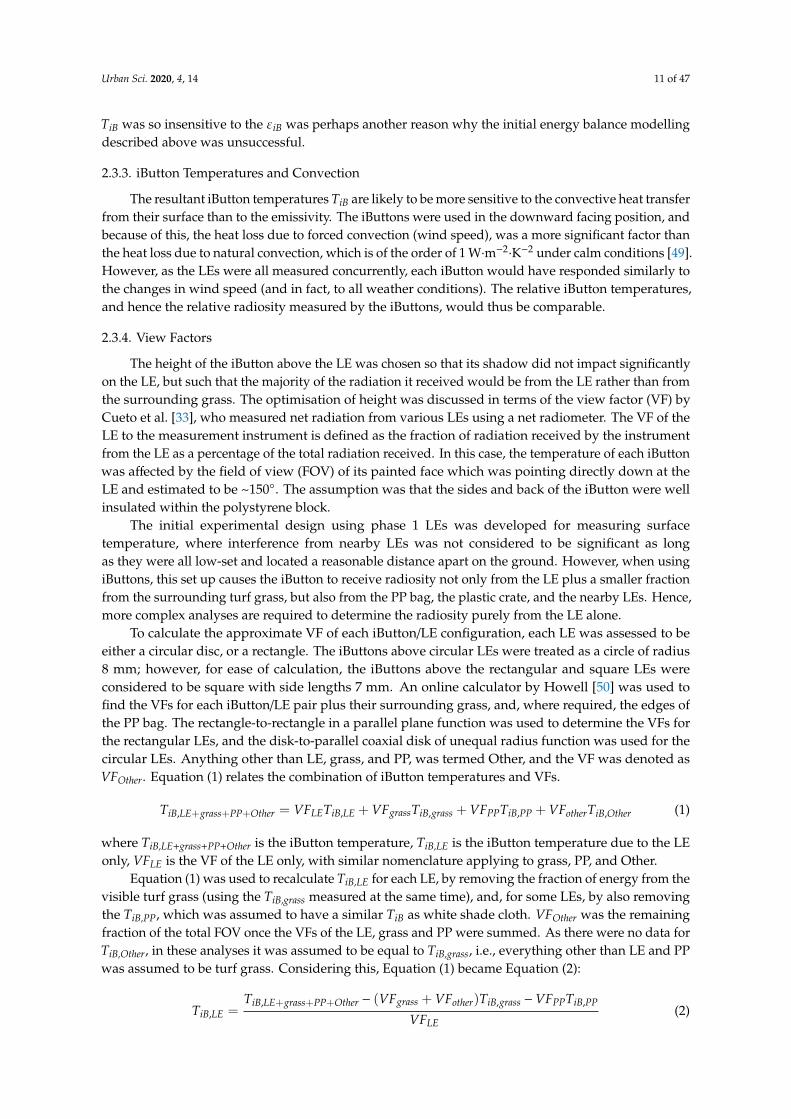
packed together. The planting densities are given in Table 2. The LEs used in this test were all 1200 mm× 1200 mm square, and each were separated by 1 m of managed and irrigated turf grass (kikuyu)(Figure 5). As per phase 1, reference materials of WPP and black painted polystyrene (BPP) wereincluded in these tests. Note that the BPP did not include cardboard as per phase 1, and, instead, theblack paint was applied directly onto the polystyrene. Crumpled aluminium foil was again used tomeasure the reflected sky temperature. Ten of the LEs were laid onto a bed of a 1200 mm × 1200 mmsquare of yellow sand with a thickness of 50 mm, (seen around the edges of the plants in Figure 6).This sand provided a good thermal coupling between the LE and the ground, similar to how the LEwould be installed in situ. The reasons for not placing the remaining LEs on the sand were as follows:the decking simulated typical decking, which is not directly coupled to the ground; the reference LEs(BPP and WPP) were required to be insulated from the turf grass; the soils were naturally effectivelycoupled to the ground through the infiltration of their particles through the turf grass to the soil below;and the turf grass LE was simply the existing turf grass on the oval.
Table 2. Installation details of the larger landscape elements used in the phase 2 study design duringsummer 2019.
Landscape Elements Test Date 21st January 2019, Total LE Surface Area 1200 mm × 1200 mm
Surface Area of Individual LEComponents (mm) Thickness (mm) Sub-Layer *
Artificial turf grass (Tuff Turf Multi) 1200 × 1200 12 sand
Asphalt 1200 × 1200 50 sand
Concrete slab (×40 mm) 600 × 600 38 sand
Crushed rock (white) 20–25 50 sand
Decking (hardwood, Merbau) 1200 × 90 19 turf grass
Pine bark mulch ~10–50 50 sand
Pavers (grey) 400 × 400 40 sand
Pavers (red) 232 × 153 50 sand
Pavers (sandstone) 400 × 400 40 sand
Seedlings (native, Old man saltbush)(Atriplex nummularia)
~50 diameter within seedling tray(plant density 711 plants/m2) 100–150 (plant height) sand
Ground cover (annual) (non-native,petunias) (Petunia × hybrid)
~150 diameter pots (plant density34 plants/m2) 100–150 (plant height) sand
Soil (dry) 1200 × 1200 50 turf grass
Soil (moist) 1200 × 1200 50 turf grass
Turf grass (kikuyu) 1200 × 1200
White painted polystyrene (two coatsof gloss white, exterior water based,
4 Seasons, British Paints)1200 × 1200 ~0 40 mm polystyrene
Black painted polystyrene (undercoatwas exterior low sheen black,
4 Seasons, British Paints; top coat wasflat black enamel spray paint, Rust
guard, White Knight)
1200 × 1200 ~0 40 mm polystyrene
* sand = 50 mm thick yellow sand on top of turf grass.
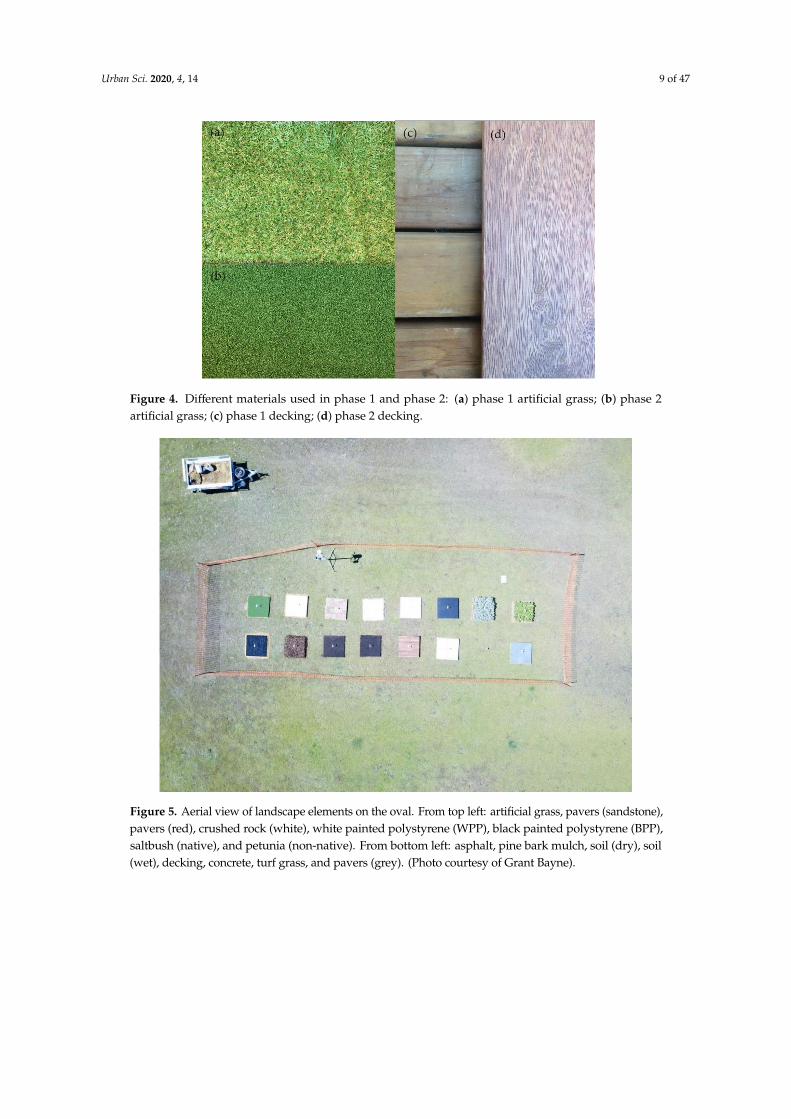
Urban Sci. 2020, 4, 14 9 of 47
Figure 4. Different materials used in phase 1 and phase 2: (a) phase 1 artificial grass; (b) phase 2artificial grass; (c) phase 1 decking; (d) phase 2 decking.
Figure 5. Aerial view of landscape elements on the oval. From top left: artificial grass, pavers (sandstone),pavers (red), crushed rock (white), white painted polystyrene (WPP), black painted polystyrene (BPP),saltbush (native), and petunia (non-native). From bottom left: asphalt, pine bark mulch, soil (dry), soil(wet), decking, concrete, turf grass, and pavers (grey). (Photo courtesy of Grant Bayne).
Urban Sci. 2020, 4, 14 10 of 47
Figure 6. Ground cover (non-native, petunias) (Petunia× hybrid) and pavers (grey), on a bed of yellow sand.
2.2.2. Field Measurement Conditions
Phase 2 was performed on the same oval as the phase 1 tests. The LEs were set up on the oval onthe 19th January 2019 to allow them to equilibrate with the conditions. The test day had clear skiesonly. Thermal images were taken every 30 min and iButton data were logged every 10 min from 06:00to 21:00 on the 21st January 2019 (summer).
2.3. Data Analysis
2.3.1. Energy Balance
The energy balance between the iButtons and the LEs was modelled to determine the unknownparameters of emissivity (described below) and coefficients of convection for the iButtons and theLEs. This would allow for the calculation of the radiosity for each LE. However, the model was notsufficiently robust to provide consistent convective coefficients, possibly due to unaccounted for localweather fluctuations, which varied the amount of convected heat reaching the iButtons. A simplermethod was developed which involved using the iButton temperatures (TiB) alone, and which provideda relative, rather than absolute, measure of the radiosity from the LEs.
2.3.2. iButton Temperatures and Emissivity
The paint on the iButtons was applied manually to the surface of each iButton, resulting in anatural variation in quality and thickness. This variation would result in a slightly different emissivityfor each iButton (εiB), ultimately affecting the TiB. The purpose of this section is to explain why thevariation in emissivity was not significant.
Approximate values of the convective coefficients were used from the previous modelling workto determine how much the variation in the black iButton paint would affect TiB. It was found thatchanging TiB by up to ±1.0 ◦C changed εiB by a maximum of ±0.2. As the emissivities are unlikelyto vary by this large amount, the effect of emissivity variation could be ignored, as it was negligiblewhen compared with the uncertainty in the iButton temperature loggers themselves (given by themanufacturer as ±0.5 ◦C and ±1.0 ◦C for high and low temperature iButtons, respectively). The fact that
Urban Sci. 2020, 4, 14 11 of 47
TiB was so insensitive to the εiB was perhaps another reason why the initial energy balance modellingdescribed above was unsuccessful.
2.3.3. iButton Temperatures and Convection
The resultant iButton temperatures TiB are likely to be more sensitive to the convective heat transferfrom their surface than to the emissivity. The iButtons were used in the downward facing position, andbecause of this, the heat loss due to forced convection (wind speed), was a more significant factor thanthe heat loss due to natural convection, which is of the order of 1 W·m−2
·K−2 under calm conditions [49].However, as the LEs were all measured concurrently, each iButton would have responded similarly tothe changes in wind speed (and in fact, to all weather conditions). The relative iButton temperatures,and hence the relative radiosity measured by the iButtons, would thus be comparable.
2.3.4. View Factors
The height of the iButton above the LE was chosen so that its shadow did not impact significantlyon the LE, but such that the majority of the radiation it received would be from the LE rather than fromthe surrounding grass. The optimisation of height was discussed in terms of the view factor (VF) byCueto et al. [33], who measured net radiation from various LEs using a net radiometer. The VF of theLE to the measurement instrument is defined as the fraction of radiation received by the instrumentfrom the LE as a percentage of the total radiation received. In this case, the temperature of each iButtonwas affected by the field of view (FOV) of its painted face which was pointing directly down at theLE and estimated to be ~150◦. The assumption was that the sides and back of the iButton were wellinsulated within the polystyrene block.
The initial experimental design using phase 1 LEs was developed for measuring surfacetemperature, where interference from nearby LEs was not considered to be significant as longas they were all low-set and located a reasonable distance apart on the ground. However, when usingiButtons, this set up causes the iButton to receive radiosity not only from the LE plus a smaller fractionfrom the surrounding turf grass, but also from the PP bag, the plastic crate, and the nearby LEs. Hence,more complex analyses are required to determine the radiosity purely from the LE alone.
To calculate the approximate VF of each iButton/LE configuration, each LE was assessed to beeither a circular disc, or a rectangle. The iButtons above circular LEs were treated as a circle of radius8 mm; however, for ease of calculation, the iButtons above the rectangular and square LEs wereconsidered to be square with side lengths 7 mm. An online calculator by Howell [50] was used tofind the VFs for each iButton/LE pair plus their surrounding grass, and, where required, the edges ofthe PP bag. The rectangle-to-rectangle in a parallel plane function was used to determine the VFs forthe rectangular LEs, and the disk-to-parallel coaxial disk of unequal radius function was used for thecircular LEs. Anything other than LE, grass, and PP, was termed Other, and the VF was denoted asVFOther. Equation (1) relates the combination of iButton temperatures and VFs.
TiB,LE+grass+PP+Other = VFLETiB,LE + VFgrassTiB,grass + VFPPTiB,PP + VFotherTiB,Other (1)
where TiB,LE+grass+PP+Other is the iButton temperature, TiB,LE is the iButton temperature due to the LEonly, VFLE is the VF of the LE only, with similar nomenclature applying to grass, PP, and Other.
Equation (1) was used to recalculate TiB,LE for each LE, by removing the fraction of energy from thevisible turf grass (using the TiB,grass measured at the same time), and, for some LEs, by also removingthe TiB,PP, which was assumed to have a similar TiB as white shade cloth. VFOther was the remainingfraction of the total FOV once the VFs of the LE, grass and PP were summed. As there were no data forTiB,Other, in these analyses it was assumed to be equal to TiB,grass, i.e., everything other than LE and PPwas assumed to be turf grass. Considering this, Equation (1) became Equation (2):
TiB,LE =TiB,LE+grass+PP+Other − (VFgrass + VFother)TiB,grass −VFPPTiB,PP
VFLE(2)
Urban Sci. 2020, 4, 14 12 of 47
2.3.5. Material Properties Affecting iButton Temperatures
The expected values of each TiB,LE can be estimated based on the material properties of thermalinertia, colour (albedo), roughness, and moisture content. As discussed in the introduction, darker buthigher thermal inertia LEs (such as asphalt and black polished stones) have the capacity to absorb moreincident energy during the day, hence their TiB,LE would be cooler than that of dark LEs with lowerthermal inertia (such as black shade cloth, BPP and artificial grass). Convected heat from the LEs canbe removed by wind currents [29], hence the convected heat received by the iButtons will vary withlocal wind conditions. In comparison, the surface of a white LE reflects most of the incident radiationonto the iButton and is less affected by wind conditions. Hence, the TiB,LE of dark LEs would tend to belower, whilst that of white LEs would tend to be higher. LEs with rough surfaces have a higher specificsurface area, i.e., more surface area available for cooling through forced convection, and would thushave a lower TiB,LE than smooth surfaces under windier conditions due to less radiant LWR. A higherspecific surface area also has a lower albedo, as light has more chances to be internally reflected beforeescaping from the surface. LEs with a high moisture content are able to use that moisture for coolingthrough evaporation (or evapotranspiration in the case of plants), and would have a lower TiB,LE.
2.3.6. Relative Radiosity Ranking
Each LE was compared with the reference material of WPP in order to find its relative rankingwith respect to the other LEs. The temperature of the iButton over the WPP (TiB,WPP,) is always goingto be the hottest during the daytime as it will have the most reflected incident radiation (due to WPPhaving the highest albedo), and because the WPP is insulated, no heat will be conducted away into theground. The other LEs absorb more radiation (than the WPP), which heats their surface. Some of thisis re-emitted as LWR, some is convected away, and some is conducted into the body of the LE and theninto the ground. Consequently, the black iButton above these LEs (TiB,LE) will never be as hot as thatabove the WPP. Thus, WPP was an ideal material to be used as an upper reference point and TiB,WPPwas used to normalise each TiB,LE.
A direct ratio of TiB,LE over the black iButton temperature of the WPP (TiB,WPP) would not beconsistent across the day, because the iButtons are also affected by the varying ambient temperature.Removing Tamb from each iButton temperature removes this diurnal variability from the data. In theevening, the WPP temperature drops below ambient temperature because it has no thermal inertia andis radiating heat to the cold night sky. This method was therefore not used after sunset.
All TiB were first corrected for VFs. Equation (3) was used to determine the daytime ratio (DR) forranking the radiosity of the LEs relative to the WPP.
DR =(TiB,LE − Tamb)
( TiB,WPP − Tamb)(3)
The uncertainties in TiB,WPP were ±1.0 ◦C, whilst the uncertainties in the other iButtons wereeither ±1.0 or ±0.5 ◦C, depending on their type. The uncertainty in Tamb was estimated to be ±0.5◦C. The standard errors (SE) were calculated assuming random errors and a normal distribution [51].DR was averaged (DRav) over the time periods where the SR was greater than 70% of that occurring atsolar noon on that day, in line with the standard for measuring reflected radiation from objects in thefield [38]. For autumn this was 09:30–15:00; for winter, 09:20–15:00; for spring, 09:00–15:00; and forboth summer measurements, 09:00–15:40.
Whilst the iButton and Tamb errors are relatively small, the uncertainty in the mean of the datadue to the methodology used to derive the day−time ranking was expected to be higher than thatcalculated from the instrumentation alone. This is because the factors affecting the measurement andcalculation of DRav relied on physical properties of materials, convection coefficients, and on varyingweather parameters. Hence, the DRav uncertainty was found by calculating the standard error (SE)

Urban Sci. 2020, 4, 14 13 of 47
of the actual DRav data for each LE during the daytime hours, where the SE is equal to the standarddeviation divided by the square root of the number of sampling points.
Microsoft Excel’s Data Analysis package (Microsoft Corporation, Makati, WA, USA) was used toperform multiple two-sample t-tests (assuming equal variances) on both the seasonal DR data fromphase 1, and on the summer DR data from phase 2. The summer 2018 and summer 2019 DR data wasalso compared using this t-test. This analysis tested the null hypothesis that the means between eachLE whose rankings placed them next to each other, were the same (at a significance level α = 0.05).
2.4. Delimitations
This study was performed under clear sky conditions with a high SVF and with minimal wind.The results may not be applicable to measurements made under cloudy skies or where wind gusts arestrong enough to significantly cool LEs and iButtons. Ambient conditions would be best measuredusing a local weather station; however, the local weather station malfunctioned during some of the testwork and data was used from the nearby meteorological station. It is recognized that in reality, someof the hardscape LEs are coupled to the ground using more complex substrates than the sand used inthis study. Furthermore, mechanical compaction of the asphalt LE was not performed according tostandard road surface preparation. The number and type of LEs tested in phase 2 was limited by thetime available for both construction and measurement (LEs were on a school oval), as well as by thecost of these LEs. Hence, replicate LEs were not tested. The moisture content of the LEs and of the turfgrass surrounding them was not measured as it was outside the scope of this study; however, moisturecontent contributes to surface temperature through evaporative cooling.
3. Results and Discussion
3.1. Weather Conditions
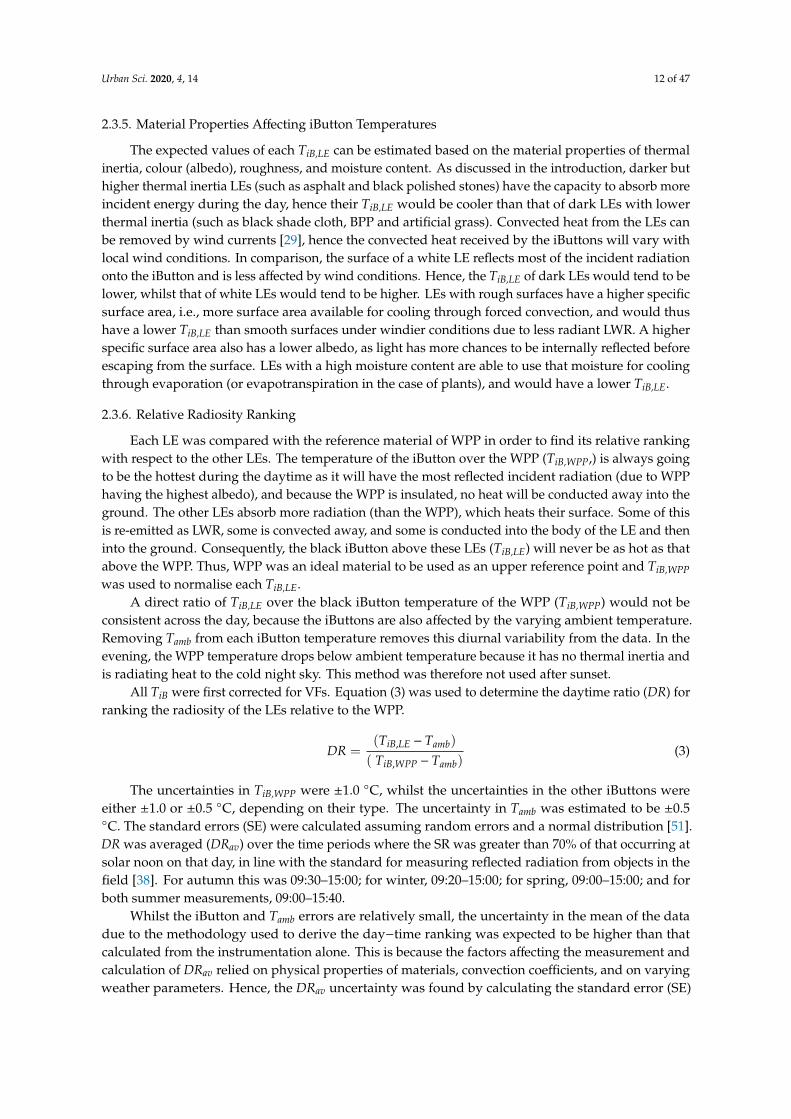
Apart from 21st January, 2019, which had slightly cooler ambient temperatures and a higherrelative humidity than typical for this season, the weather conditions for each of the days measuredwere close to typical for that season, according to data from the Bureau of Meteorology [52]. The rangesand conditions for both studies are given in Table 3, and shown in Figure 7. Smoke haze from a bushfire was present from around 13:30 to the early evening on the spring day (5th October, 2017) andthis can be seen in Figure 7 as a reduction in the SR at these times. This may have led to lower thanexpected LE temperatures for this season. In summer 2018 at ~13:30, the ambient temperature droppedwhilst the relative humidity and the wind speed increased suddenly, possibly due to a weather frontmoving in. The effects of this weather change are seen in results presented later.
Urban Sci. 2020, 4, 14 14 of 47
Figure 7. Summary of the weather conditions during the measurement days; (a) relative humidity (%);(b) solar radiation (W·m−2); (c) ambient temperature (◦C); and (d) mean wind speed at 10 m (m·s−1).Dates were: 9th April 2017 (autumn 2017); 24th August 2017 (winter 2017); 5th October 2017 (spring2017); 9th January 2018 (summer 2018); and 21st January 2019 (summer 2019).
3.2. View Factors
For phase 1 LEs, VFOther ranged from ~1% up to ~8% of the total FOV of the iButton dependingon the LE. Hence the assumption made that TiB,Other was equal to TiB,grass, introduced an uncertainty inthe calculation of TiB,LE, which was dependent on the difference between the radiosity of turf grass andthe radiosity of Other. As the VFs of Other were relatively small, this uncertainty was also expected tobe small.
Table 3. Weather conditions during day within the specified time of measurements (fromMurdoch University).
Date & Season TimeRange
Air Temp.Range (◦C)
RelativeHumidityRange (%)
Max SolarRadiation(W·m−2)
Wind Speed (m·s−1)Average (Standard
Deviation)
9th April 2017Autumn 2017 09:30–15:00 19.4–27.4 25–51 831 2.05 (0.47)
24th August 2017Winter 2017 09:20–15:00 15.0–22.5 43–62 724 3.34 (0.55)
5th October 2017Spring 2017 09:00–15:00 14.9–21.6 33–51 945 2.79 (0.76)
9th January 2018Summer 2018 09:00–15:40 24.5–35.0 23–45 1049 2.61 (0.66)
21st January 2019Summer 2019 09:00–15:40 25.4–27.8 54–67 1009 2.67 (0.75)
The VFs of the phase 1 LEs, where most LEs had an approximate surface area of ~0.13 m2, werebetween 0.43 and 0.75 (Table 4). VFs varied slightly with season as the LEs were re-installed each season

Urban Sci. 2020, 4, 14 15 of 47
and, whilst the order of installation was kept the same, the distances between LEs varied. The largeVFgrass for these LEs (Table 4) introduces further uncertainty due to the natural variability of the turf grassacross the oval and hence around each LE. Whilst the variation in VFs between phase 1 LEs was not ideal,a more significant factor was the variation in the surrounding turf grass quality and the distance to thenearest LEs. To reduce these uncertainties, the height of the iButton over the smaller LEs would have tobe reduced in order to increase the VFLE. However, this would introduce new uncertainties as the size ofthe shadow of the iButton would increase, thus reducing the radiosity from the LE.
For the larger phase 2 LEs, VFLE were all 0.92, as these LEs all had the same surface area of 1.44 m2.Calculations from [53] estimated VFOther to be ~1% of the FOV of the iButton. Hence, everything otherthan the LE was assumed to be turf grass, with a VF of 0.08.
In summary, the uncertainty in the TiB,LE from the phase 1 LEs is much greater than for the phase2 LEs due to the assumptions made regarding the VFs and the variability in the turf grass.
Table 4. Seasonal radiosity view factors to the iButton surfaces from the small phase 1 landscapeelements (LEs), and from the surrounding polypropylene (PP) and turf grass.
Landscape ElementView Factors
Autumn Winter Spring Summer 2018
LE PP Grass LE PP Grass LE PP Grass LE PP Grass
Artificial grass 0.75 0 0.25 0.71 0 0.29 0.71 0 0.29 0.71 0 0.29Artificial grass (laid) 0.00 0 0 0.58 0.1 0.32 0.61 0.04 0.35 0.61 0.04 0.35
Asphalt 0.43 0 0.57 0.43 0 0.57 0.43 0 0.57 0.43 0 0.57Black painted polystyrene 0.56 0 0.44 0.56 0 0.44 0.56 0 0.44 0.56 0 0.44
Concrete (× 40 mm) 0.54 0 0.46 0.52 0 0.48 0.52 0 0.48 0.52 0 0.48Concrete (× 80 mm) 0.58 0 0.42 0.58 0 0.42 0.58 0 0.42 0.58 0 0.42
Crushed rock (white) 0.58 0.06 0.36 0.58 0.06 0.36 0.58 0.06 0.36 0.58 0.06 0.36Decking 0.60 0 0.40 0.56 0 0.44 0.56 0 0.44 0.64 0 0.36
Limestone block 0.45 0 0.55 0.45 0 0.55 0.45 0 0.55 0.45 0 0.55Pavers (grey) 0.54 0 0.46 0.54 0 0.46 0.54 0 0.46 0.54 0 0.46Pavers (red) 0.59 0 0.41 0.59 0 0.41 0.59 0 0.41 0.59 0 0.41
Pavers (sandstone) 0.54 0 0.46 0.54 0 0.46 0.54 0 0.46 0.54 0 0.46Pine bark mulch 0.66 0.01 0.33 0.65 0.04 0.31 0.66 0.01 0.33 0.66 0.01 0.33
Polished stones (black) 0.62 0.07 0.31 0.62 0.07 0.31 0.62 0.07 0.31 0.62 0.07 0.31Sand (grey) 0.56 0.16 0.28 0.56 0.13 0.31 0.56 0.16 0.28 0.56 0.16 0.28
Sand (white) 0.56 0.13 0.31 0.56 0.13 0.31 0.56 0.13 0.31 0.56 0.13 0.31Shade cloth (black) 0.63 0 0.37 0.63 0 0.37 0.63 0 0.37 0.63 0 0.37Shade cloth (cream) 0.61 0 0.39 0.61 0 0.39 0.61 0 0.39 0.61 0 0.39Shade cloth (white) 0.61 0 0.39 0.61 0 0.39 0.61 0 0.39 0.61 0 0.39
Soil (dry) 0.62 0.05 0.33 0.62 0.07 0.31 0.62 0.05 0.33 0.62 0.05 0.33Soil (moist) 0.59 0.05 0.36 0.59 0.05 0.36 0.59 0.05 0.36 0.59 0 0.41Turf grass 0.95 0 0.05 0.95 0 0.05 0.92 0 0.08 0.98 0 0.02
White painted polystyrene 0.61 0 0.39 0.61 0 0.39 0.61 0 0.39 0.61 0 0.39
3.3. Seasonal Comparison—Phase 1
Equation (2) was used to calculate TiB,LE for each LE (data given in Appendix A) based on theVFs given in Table 4. Seasonal data were calculated by normalising all of the TiB,LE with TiB,WPP asper Equation (3). Both seasonal data and the summer 2019 data were analysed using this method.Examples of the temporal daytime ratio data from summer 2018 are shown below, with data separatedfor clarity (Figures 8–10). The standard errors (SE) given in these figures were calculated assumingrandom errors and a normal distribution [51]. Temporal data from other seasons were similar but arenot presented here. The tails of these figures are extremely unstable due to the nature of the ratiocalculation. For example, as the SR decreases to zero at around 18:30, TiB,WPP approaches Tamb, so thedenominator (TiB,WPP−Tamb) approaches zero, and then becomes negative as TiB,WPP begins to reflectthe cold sky temperature. This results in a very large positive ratio just on sunset, followed by a verylarge negative ratio, as seen in the edges of the graph. Hence this method is only valid during the day.
Figures 8–10 illustrate that the normalisation process is able to take account of the weather variabilityand varying solar radiation as seen by the reasonably consistent ratio during the daytime from 09:00 to
Urban Sci. 2020, 4, 14 16 of 47
15:40 (standard errors ≤0.02). This is despite the larger uncertainties in this data due to the experimentaldesign and the corresponding assumptions made around the VFs of these phase 1 LEs.
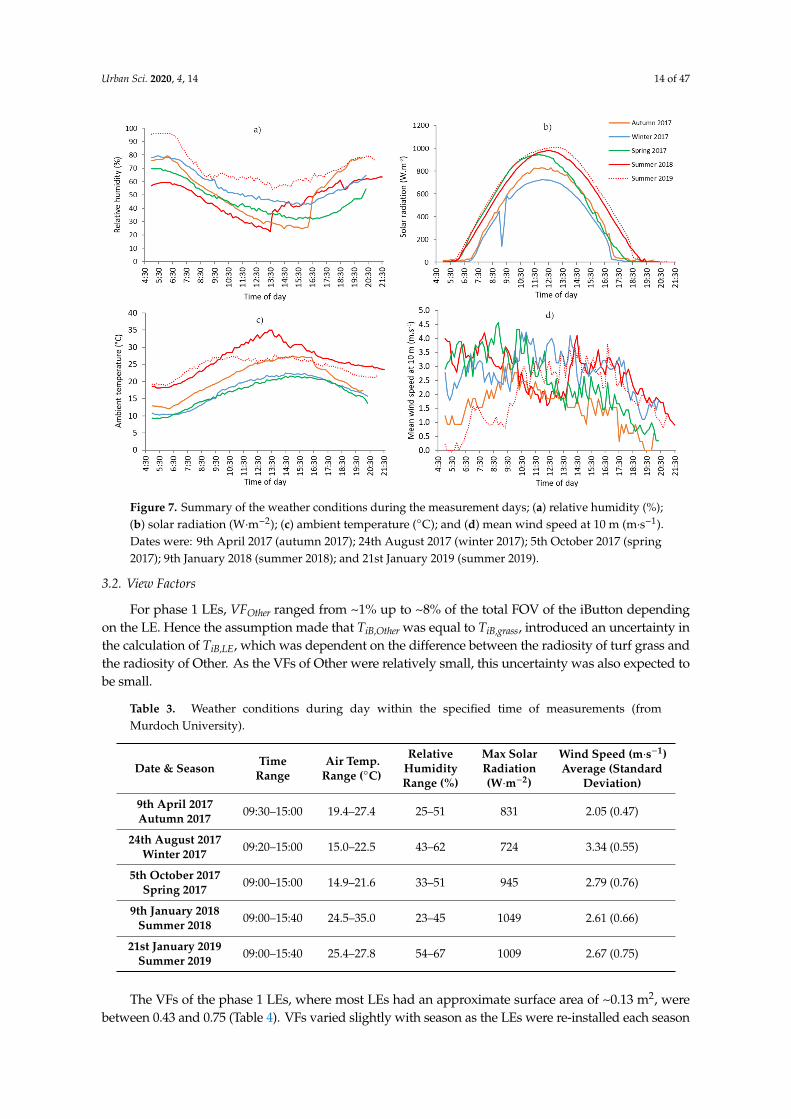
However, some generalisations can be made. The DRs of some of the low albedo, higher thermalinertia LEs (red and grey pavers, and the polished black stones) (Figures 9a and 10a, respectively)have a slight general trend upwards across the day. However, the high albedo, higher thermal inertiaLEs (concrete, sandstone pavers, and limestone) (Figures 8b, 9a and 10a, respectively) have a fairlyconsistent DR through the day. It seems the daytime radiosity may be driven more by albedo than byLWR. This is consistent with results by [12] who found that increases in albedo significantly increasedthe upwards SWR whilst delivering only a minimal difference in the upwards LWR. In the laterafternoon, the accumulated heat from the day is released at a slower rate in the higher thermal inertiaLEs when compared with WPP, and hence the DR increases slowly for these LEs.
In general, the DR of the low thermal inertia LEs and natural materials (Figures 8a, 9b and 10b)are more consistent across the day. The sudden weather change at ~13:30, however, affected theDR of some LEs (in particular sandstone pavers (Figure 9a), white shade cloth (Figure 9b), and drysoil (Figure 10b), but not others, and affected them in different ways. This requires investigation infuture work.
Figure 8. Daytime ratio (TiB,LE–Tamb) over (TiB,WPP–Tamb) for LEs, summer 2018. Comparison of: (a)low thermal inertia artificial grass with higher thermal inertia laid artificial grass; and (b) lower thermalinertia concrete × 40 mm with higher thermal inertia concrete × 80 mm. Data from 09:00 to 15:40 wereaveraged. Standard errors (SE) were calculated assuming random errors and a normal distribution [51].

Urban Sci. 2020, 4, 14 17 of 47
Figure 9. Daytime ratio (TiB,LE–Tamb) over (TiB,WPP–Tamb) for LEs, summer 2018. Comparison of:(a) different coloured pavers; and (b) low thermal inertia LEs. Data from 09:00 to 15:40 were averaged.Standard errors (SE) were calculated assuming random errors and a normal distribution [51].
Figure 10. Daytime ratio (TiB,LE–Tamb) over (TiB,WPP–Tamb) for LEs, summer 2018. Comparison of:(a) rocks, sand, and high thermal inertia LEs; and (b) softscape or natural LEs. Data from 09:00 to15:40 were averaged. Standard errors (SE) were calculated assuming random errors and a normaldistribution [51].
Urban Sci. 2020, 4, 14 18 of 47
Relative Average Radiosity
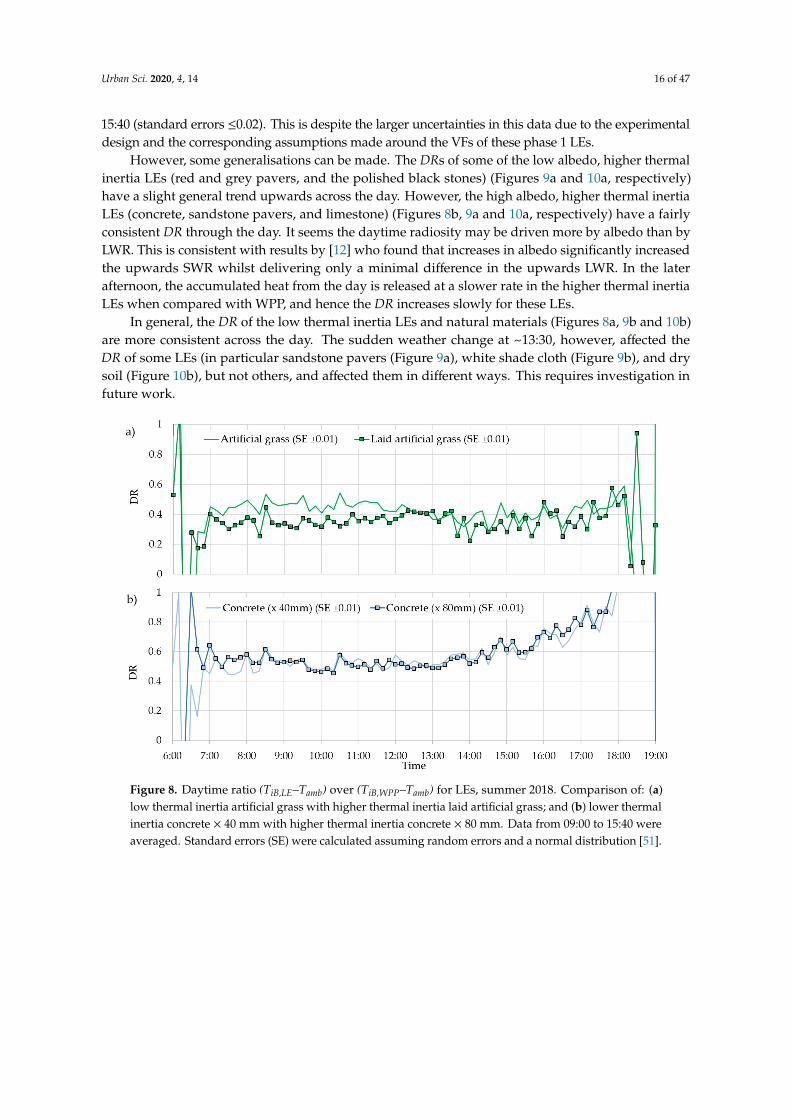
The DR data from phase 1 were averaged for each season over the times given in Table 3, togive DRav (data are given in Appendix B). DRav gave a relative ranking for each LE for each season,based on its radiosity (Figure 11). The cross-seasonal average DRav was calculated and is shown inFigure 11 as the thick black line, with the data sorted from lowest to highest according to this average.The standard errors of the measured data for each season and LE were small (around 1%) and areshown as error bars in Figure 11. Hence, the differences seen between the seasonal DRav of each LEare likely to be significant. However, the uncertainties due to the experimental design are likely tobe more significant, as discussed previously. On inspection of the DRav data, each LE was observedto lie within a band of around ±0.05 across all seasons (an uncertainty of ±5%). As 5% is not a largeuncertainty for real world data, the seasonal differences would not be very significant for all practicalpurposes. Hence, the relative radiosity from the LEs could be considered to be similar across seasons.
Figure 11. Cross-seasonal comparison of the average daytime ratio (DRav) of landscape elementradiosity normalised with white painted polystyrene (WPP). Data were averaged from ~09:00 to 15:40depending on the season. Uncertainties are standard errors (SEs) of the averaged data for each LE.Ranked in order of cross-seasonal average. The outliers were not included in the averages.
When calculating the cross-seasonal average for each LE, the autumn data points for limestoneblock and for asphalt were not included. Both of these LEs have the same DRav in summer, winter, andspring, but their autumn values are quite different and appear to be outliers. The possible reasonsfor this were that the limestone block was bought new for autumn but then stored outside betweenseasons. Aging of the new surface is suspected to have occurred, reducing the albedo for subsequentseasons and causing DRav to reduce. Conversely, asphalt had a lower DRav in autumn, as it was newerin this season and was therefore a darker black, becoming lighter in colour after aging outside betweenseasons. The winter DRav of red pavers and white shade cloth are outside the 5% band, but thesedata points were retained for the cross-seasonal average calculation as they were not significantlyoutside the band and their DRav from other seasons were also not consistent. The variance in the redpavers data may have been due to different arrangements of the six unevenly speckled pavers between

Urban Sci. 2020, 4, 14 19 of 47
seasons. Within the 5% band, the dry and moist soils are also slightly variable across seasons due totheir moisture content, which is assumed to have been different, although this was not measured.
As discussed in Section 2.3.5, the effects of the material properties of the LEs can be seen inFigure 11, where white and lighter coloured LEs cause the highest DRav (white shade cloth, whitecrushed rock, white sand, sandstone pavers, and cream shade cloth). The lowest DRav were from moistsoil, pine bark mulch, polished black stones, asphalt, and laid artificial grass, all of which could beclassified as having higher surface roughness and/or moisture, and/or having a darker colour.
In general, white and lighter LEs had a higher radiosity than the darker LEs, indicating thatduring the daytime, SR is the dominant driver of the radiosity from the LEs. Based on the resultsshown in Figure 11, LEs can be measured at any time of the year using WPP as a reference, and theDRav will provide the relative radiosity of that LE to within ±5%.
Table 5 shows the results from the two-sample t-tests on the LEs ranked next to each other in Figure 11.All LEs, apart from six pairs (p-values given in bold), show a statistically significant difference in theirmeans. The negative value of t-Stat indicates that, moving down the table, each mean is larger than thenext. Where the p-value >0.05, further t-tests were performed, comparing the LE with the two rowsbeneath it in the table, e.g., asphalt was compared with soil (dry), and soil (dry) was compared withturf grass. These further t-tests all had p-values <0.01, indicating that these means were all significantlydifferent, and that the position of each LE in the ranking table would only vary by one place at most.
Table 5. Phase 1 seasonal DR data two sample t-test (assuming equal variances, α=0.05). Results are acomparison of each landscape element (LE) with the LE in the row beneath it in the table. The boldp-values indicate the means of these LEs are not statistically different.
Phase 1 LEs DRav(Mean) Variance Number of
Observations t-Stat p-Value(Two-Tail)
Soil (moist) 0.26 0.00 147 −5.00 <0.001Pine bark mulch 0.30 0.00 147 −2.27 0.02
Polished stones (black) 0.31 0.00 147 −5.26 <0.001Asphalt 0.35 0.00 113 −0.36 0.72
Artificial grass (laid) 0.35 0.00 113 −2.40 0.02Soil (dry) 0.37 0.01 147 −1.93 0.05
Pavers (grey) 0.39 0.00 147 −2.34 0.02Turf grass 0.40 0.00 147 −2.42 0.02
Artificial grass 0.42 0.00 147 −3.17 <0.01Sand (grey) 0.44 0.01 147 −0.85 0.39
Shade cloth (black) 0.44 0.00 147 −1.99 0.05Black card on polystyrene 0.46 0.00 147 −6.46 <0.001
Pavers (red) 0.51 0.01 147 −4.11 <0.001Concrete (× 40 mm) 0.54 0.00 147 −0.75 0.45Concrete (× 80 mm) 0.55 0.00 147 −2.44 0.02
Limestone block 0.56 0.00 113 −3.81 <0.001Decking 0.59 0.00 147 −6.45 <0.001
Shade cloth (cream) 0.63 0.00 147 −2.91 <0.01Pavers (sandstone) 0.65 0.00 147 −5.14 <0.001
Sand (white) 0.69 0.01 147 −15.75 <0.001Crushed rock (white) 0.82 0.00 147 −1.13 0.26Shade cloth (white) 0.83 0.01 147 −25.82 <0.001
White painted polystyrene 1.00 0.00 147
Note: All LE t-Critical two-tail = 1.97.
Whilst the focus of the phase 1 test work was a cross-seasonal comparison, the absolute rankingposition of each LE was potentially affected by the different ways these LEs were placed in contact withthe ground (Section 2.1.1), and the consequential variation in their effective thermal inertia. Althoughall LEs were buffered from the underlying soil by the turf grass, it is assumed that the air volumeunderneath each LE would be dependent on its mass, e.g., heavier LEs such as concrete and pavers
Urban Sci. 2020, 4, 14 20 of 47
would have had the least air volume, whilst lighter LEs such as artificial grass and the shade clothswould have had a greater air volume. Similarly, LEs mounted on the PP alone would also compressthe turf grass by an amount dependent on their mass, but with the added thin layer of PP. LEs on PPand then on plastic crates had the greatest air volume (apart from decking). The effect of this changingair volume beneath the LEs was not able to be quantified.
As each LE was in contact with the ground in the same manner across each season, this varying airvolume does not affect the cross-seasonal result that the relative radiosity of a particular LE will be thesame within ±5% regardless of season. However, the ranking order in Figure 11 may be slightly differentthan if all of the LEs were coupled in the same manner. To remove the variability associated with groundcoupling and to provide a more accurate ranking, the phase 2 investigation was undertaken.
3.4. Summer Comparison of LE Size and Ground coupling—Phase 2
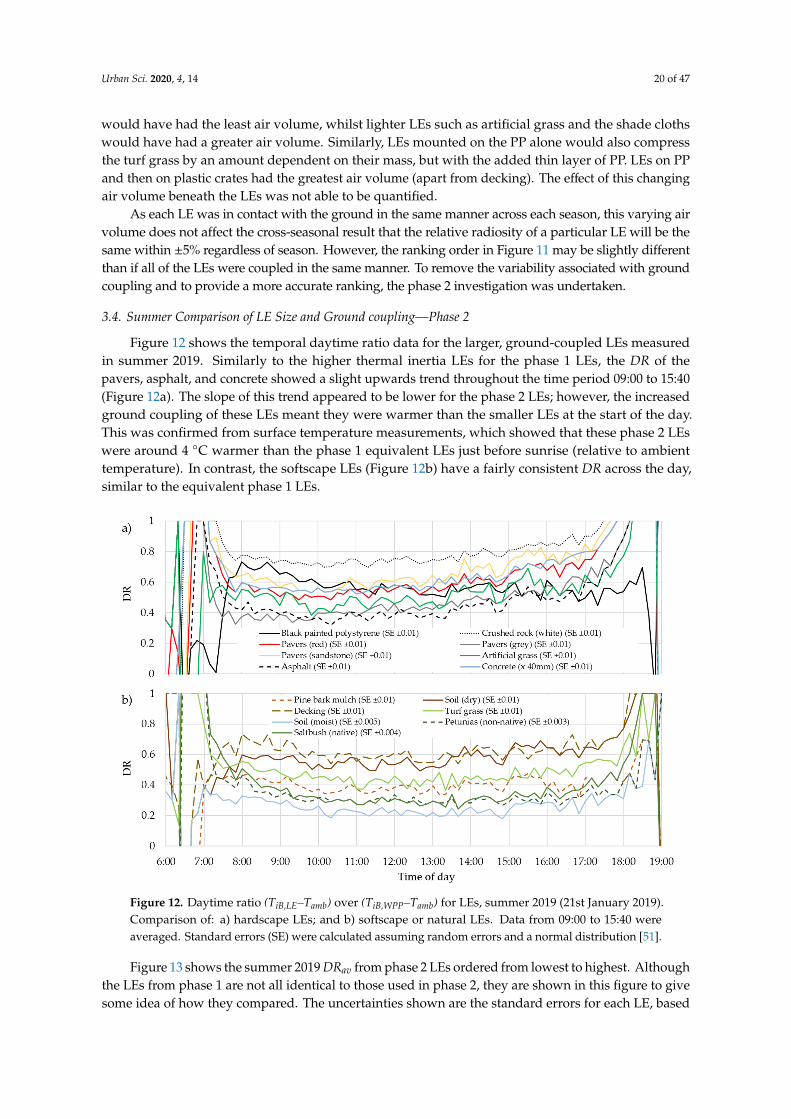
Figure 12 shows the temporal daytime ratio data for the larger, ground-coupled LEs measuredin summer 2019. Similarly to the higher thermal inertia LEs for the phase 1 LEs, the DR of thepavers, asphalt, and concrete showed a slight upwards trend throughout the time period 09:00 to 15:40(Figure 12a). The slope of this trend appeared to be lower for the phase 2 LEs; however, the increasedground coupling of these LEs meant they were warmer than the smaller LEs at the start of the day.This was confirmed from surface temperature measurements, which showed that these phase 2 LEswere around 4 ◦C warmer than the phase 1 equivalent LEs just before sunrise (relative to ambienttemperature). In contrast, the softscape LEs (Figure 12b) have a fairly consistent DR across the day,similar to the equivalent phase 1 LEs.
Figure 12. Daytime ratio (TiB,LE–Tamb) over (TiB,WPP–Tamb) for LEs, summer 2019 (21st January 2019).Comparison of: a) hardscape LEs; and b) softscape or natural LEs. Data from 09:00 to 15:40 wereaveraged. Standard errors (SE) were calculated assuming random errors and a normal distribution [51].
Figure 13 shows the summer 2019 DRav from phase 2 LEs ordered from lowest to highest. Althoughthe LEs from phase 1 are not all identical to those used in phase 2, they are shown in this figure to givesome idea of how they compared. The uncertainties shown are the standard errors for each LE, based

Urban Sci. 2020, 4, 14 21 of 47
on the measured DRav data. However, the uncertainties in the phase 1 LEs are likely to be higher,as discussed previously in the View Factors section.
Figure 13. Comparison of relative total radiation of LEs when normalised with white paintedpolystyrene. Summer 2018 and summer (21st January) 2019 DRav (day−time) comparison of size andground coupling of similar LEs. Uncertainties are the standard errors (SEs).
Although the data are difficult to compare given the variability in product types, the phase 1 LEsgenerally seem to have a lower DRav than the corresponding similar phase 2 LEs. The p-values forthis data are given in Table 6. Only the means of grey and red pavers were the same (p-values > 0.05).The positive values of t-Stat for moist soil, sandstone pavers, and white rocks indicated that for theseLEs, the summer 2018 means were higher than the summer 2019 means. One reason why the 2018DRav data for most of the LEs are generally lower than 2019 data is that the smaller LEs will have lessthermal inertia than the ground-coupled LEs. This means that their response to changes in ambientconditions will be faster and they will follow the WPP changes more closely than the larger LEs will.Hence, the DRav for the smaller LEs would be lower. Another reason is that the LEs are warmer in theircentral area, but become cooler towards their edges [28]. The surface area of the cooler edges makes upa larger proportion of the total surface area of the small LEs than it does of the larger LEs. The iButtonsused in this study measured the whole LE, including the edges. Thus, the thermal radiation receivedby the iButtons from the smaller LEs will be less than that received by the larger LEs, resulting in alower DRav of smaller LEs.
The extremes of the phase 2 LEs presented in Figure 13 show that crushed white rock had the highestDRav, followed by sandstone pavers and decking, whilst the moist soil and the plants had the lowest.Plants use the incident radiation to evaporate water, which reduces the amount of radiation available forheating, hence the plants and similarly the moist soil are ranked lowest. Apart from moisture content,the DRav seems to be largely dominated by the albedo of the LEs rather than other material properties.
It is believed that the radiosity in the evenings, where no SR is present, would be dominatedby the thermal inertia. Evening measurements were taken for all of the LEs across all seasons forthis study; however, the analysis was more complex, and initial results indicate that data should becollected over at least three or more evenings in order to account for the faster changing eveningambient temperature, sky temperature, and wind speed. Hence, this data has not been presented here.

Urban Sci. 2020, 4, 14 22 of 47
In summary, the larger, ground-coupled LEs provided a larger VF of the LE for the iButtons thandid the small LEs, and thus assumptions about the background material had an insignificant effect onthe accuracy of phase 2 DRav. For this reason, the larger LEs are recommended for future radiositytests, given an iButton height of 200 mm.
Table 6. Summer 2018 and summer 2019 DR data, two-sample t-test (assuming equal variances, α =
0.05). A negative t-Stat indicates the 2018 mean is less than the 2019 mean. The bold p-values indicatethe means of these LEs are not statistically different.
LE t-Stat p-Value (Two-Tail)
Soil (moist) 8.15 <0.001Pine bark mulch −11.48 <0.001
Asphalt −5.68 <0.001Pavers (grey) −1.94 0.06
Turf grass −8.75 <0.001Artificial grass −5.50 <0.001
Soil (dry) −18.23 <0.001Pavers (red) −0.39 0.70
black card on polystyrene −8.32 <0.001Concrete (x 40mm) −4.13 <0.001
Decking −4.87 <0.001Pavers (sandstone) 3.30 <0.01
Crushed rock (white) 8.71 <0.001
Note that for all LEs: Number of observations = 41, t Critical two-tail = 1.99.
3.5. Ranking LEs
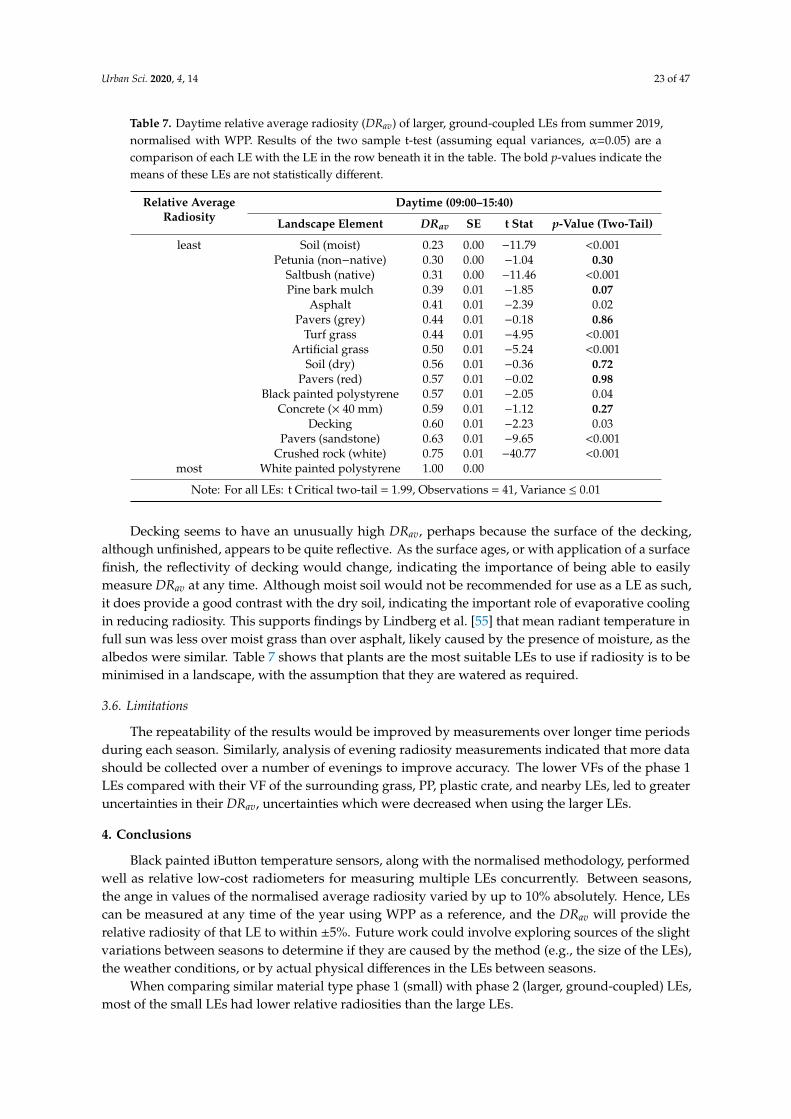
The summer 2019 values of DRav are given in Table 7 and indicate the relative radiosity ranking ofthe LEs. The results from the two-sample t-tests on the LEs ranked next to each other in Figure 13 arealso shown. Six pairs of LEs do not have statistically different means (p-values given in bold). However,similar to the phase 1 seasonal tests, the negative value of t Stat indicates that, moving down the table,each mean is larger than the next. Further t-tests were performed on the six LEs, comparing each ofthese with the LE two rows beneath it in the table. These t-tests all had p-values <0.01, apart from drysoil and red pavers. These LEs were further tested against LEs lower in the table. The mean of thedry soil was not significantly different to red pavers or BPP; however, it was significantly different toconcrete (x40mm), the next LE in the table (p-value = 0.03). Similarly, the result for red pavers was notsignificantly different to BPP or concrete (x40mm), but was significantly different to decking (p-value<0.01). These results indicate that there is some overlap in the ranking order of the LEs in Table 7,particularly in the mid-range of relative radiosities.
The ranking order of the LEs in Table 7 is found to be the same as similar LEs tested by otherauthors. Cueto et al. [33] found day-time upwelling radiation from six surfaces were ordered fromleast to most as: grass, asphalt, concrete, clay, and a white painted polystyrene. Similarly, Montagueand Kjelgren [15] found their six surfaces to be ordered from least to most as: turf, lava rock mulch,asphalt, pine bark mulch, gravel, and concrete.
Table 7 does not give absolute values for radiosity, hence it is unable to be used for calculatinghuman thermal comfort (HTC) levels or indexes such as the physiological equivalent temperature(PET), which are also affected by other parameters such as wind speed, air temperature, age, andclothing type [54]. However, DRav does provide guidance for choosing a more comfortable LE for aparticular location or situation. For example, in areas of high daytime pedestrian use, high radiosityLEs would decrease HTC levels [10,12], and LEs such as plants, mulch or asphalt would be better(depending on the type of usage the surface is required to withstand). Similarly, LEs with highradiosities would not be suitable for use close to buildings, where the higher radiant energy wouldcause increased building envelope temperatures during the time of occupation [40].
Urban Sci. 2020, 4, 14 23 of 47
Table 7. Daytime relative average radiosity (DRav) of larger, ground-coupled LEs from summer 2019,normalised with WPP. Results of the two sample t-test (assuming equal variances, α=0.05) are acomparison of each LE with the LE in the row beneath it in the table. The bold p-values indicate themeans of these LEs are not statistically different.
Relative AverageRadiosity
Daytime (09:00–15:40)
Landscape Element DRav SE t Stat p-Value (Two-Tail)
least Soil (moist) 0.23 0.00 −11.79 <0.001Petunia (non−native) 0.30 0.00 −1.04 0.30
Saltbush (native) 0.31 0.00 −11.46 <0.001Pine bark mulch 0.39 0.01 −1.85 0.07
Asphalt 0.41 0.01 −2.39 0.02Pavers (grey) 0.44 0.01 −0.18 0.86
Turf grass 0.44 0.01 −4.95 <0.001Artificial grass 0.50 0.01 −5.24 <0.001
Soil (dry) 0.56 0.01 −0.36 0.72Pavers (red) 0.57 0.01 −0.02 0.98
Black painted polystyrene 0.57 0.01 −2.05 0.04Concrete (× 40 mm) 0.59 0.01 −1.12 0.27
Decking 0.60 0.01 −2.23 0.03Pavers (sandstone) 0.63 0.01 −9.65 <0.001
Crushed rock (white) 0.75 0.01 −40.77 <0.001most White painted polystyrene 1.00 0.00
Note: For all LEs: t Critical two-tail = 1.99, Observations = 41, Variance ≤ 0.01
Decking seems to have an unusually high DRav, perhaps because the surface of the decking,although unfinished, appears to be quite reflective. As the surface ages, or with application of a surfacefinish, the reflectivity of decking would change, indicating the importance of being able to easilymeasure DRav at any time. Although moist soil would not be recommended for use as a LE as such,it does provide a good contrast with the dry soil, indicating the important role of evaporative coolingin reducing radiosity. This supports findings by Lindberg et al. [55] that mean radiant temperature infull sun was less over moist grass than over asphalt, likely caused by the presence of moisture, as thealbedos were similar. Table 7 shows that plants are the most suitable LEs to use if radiosity is to beminimised in a landscape, with the assumption that they are watered as required.
3.6. Limitations
The repeatability of the results would be improved by measurements over longer time periodsduring each season. Similarly, analysis of evening radiosity measurements indicated that more datashould be collected over a number of evenings to improve accuracy. The lower VFs of the phase 1LEs compared with their VF of the surrounding grass, PP, plastic crate, and nearby LEs, led to greateruncertainties in their DRav, uncertainties which were decreased when using the larger LEs.
4. Conclusions
Black painted iButton temperature sensors, along with the normalised methodology, performedwell as relative low-cost radiometers for measuring multiple LEs concurrently. Between seasons,the ange in values of the normalised average radiosity varied by up to 10% absolutely. Hence, LEscan be measured at any time of the year using WPP as a reference, and the DRav will provide therelative radiosity of that LE to within ±5%. Future work could involve exploring sources of the slightvariations between seasons to determine if they are caused by the method (e.g., the size of the LEs),the weather conditions, or by actual physical differences in the LEs between seasons.
When comparing similar material type phase 1 (small) with phase 2 (larger, ground-coupled) LEs,most of the small LEs had lower relative radiosities than the large LEs.

Urban Sci. 2020, 4, 14 24 of 47
Accuracy of the measured radiosity was improved when using larger, ground-coupled LEs due tothe increased VFLE (0.92). It is therefore recommended that larger, ground-coupled LEs be used infuture measurements.
Daytime radiosity appears to be driven more by albedo than by LWR, consistent with results by [12].During the daytime, white and lighter coloured LEs caused the highest iButton temperatures and wouldtherefore have the most detrimental effect on nearby objects such as buildings and/or people in hotterperiods, potentially increasing energy costs [56,57], and/or heat stress issues, respectively [10,12,55].Conversely, white and lighter coloured LEs would reduce urban heat if they were positioned in openspaces or on rooftops, with a high SVF [58,59]. Plants and moist LEs caused the smallest rise in daytimeiButton temperature and would be most beneficial for managing daytime urban heat [59].
The use of low-cost iButtons to measure relative radiosity from numerous LEs concurrentlypresents a new way to examine the relative effect of different LEs on the urban environment. They maybe a useful tool when using landscape design for urban heat mitigation.
Author Contributions: Conceptualization, J.L., G.K.L., J.J.B. and B.-l.O.; Data curation, J.L.; Formal analysis,J.L. and G.K.L.; Funding acquisition, J.L. and J.J.B.; Investigation, J.L.; Methodology, J.L. and G.K.L.; Projectadministration, J.L. and J.J.B.; Supervision, J.J.B., B.-l.O. and G.M.M.; Writing—original draft, J.L.; Writing—review& editing, J.L., G.K.L. and G.M.M. All authors have read and agreed to the published version of the manuscript.
Funding: This research was supported by an Australian Government Research Training Program Scholarship anda Curtin University Postgraduate Scholarship top up. This research was also partly funded by the CRC for LowCarbon Living Ltd supported by the Cooperative Research Centres program, an Australian Government initiative.
Acknowledgments: Appreciation to Bruce Ivers for his assistance in purchasing some LEs and for the use of hisvehicle and trailer. Thanks to Grant Bayne for his aerial photography, and to the Booragoon Primary school for theuse of their oval.
Conflicts of Interest: The authors declare no conflict of interest.
Nomenclature
DRav Average daytime ratio of the LE’s iButton temperature minus Tamb over the WPP’s iButtontemperature minus Tamb during the hours where SR > 70% of that occurring at solar noon on that day
εiB Emissivity of the painted iButtonFOV Field of viewLE Landscape element; a surface treatment found in a domestic garden or urban landscapeLWR Long-wave radiation; electromagnetic radiation from 2.5 µm–100 µm (W·m−2)NIR Near infra-red radiation, electromagnetic radiation from 0.7 µm–2.5 µm (W·m−2)PP Polypropylene (white Polypropylene bags)Radiosity total radiant energy from a LE, comprising reflected SR and emitted LWR (W·m−2)SE Standard errorSR Solar radiation (W·m−2)SVF Sky view factor; a measure of the degree of site sky visibilitySWR Short-wave radiation, electromagnetic radiation consisting of ultraviolet, visible and near infra-red
radiation ranging from 0.3 µm–2.5 µm (W·m−2)Tamb Temperature of ambient air (◦C)TiB,Other Temperature of the iButton due to objects other than the LE, surrounding turf grass and PP bag (◦C)TiB,grass Temperature of the iButton due to the surrounding turf grass (◦C)TiB,LE Temperature of the iButton due to the landscape element (◦C)TiB,PP Temperature of the iButton due to the white polypropylene (◦C)TiB,WPP Temperature of the iButton due to the white painted polystyrene (◦C)VF View factor (subscripts are as for TiB)WPP White painted polystyrene

Urban Sci. 2020, 4, 14 25 of 47
Appendix A
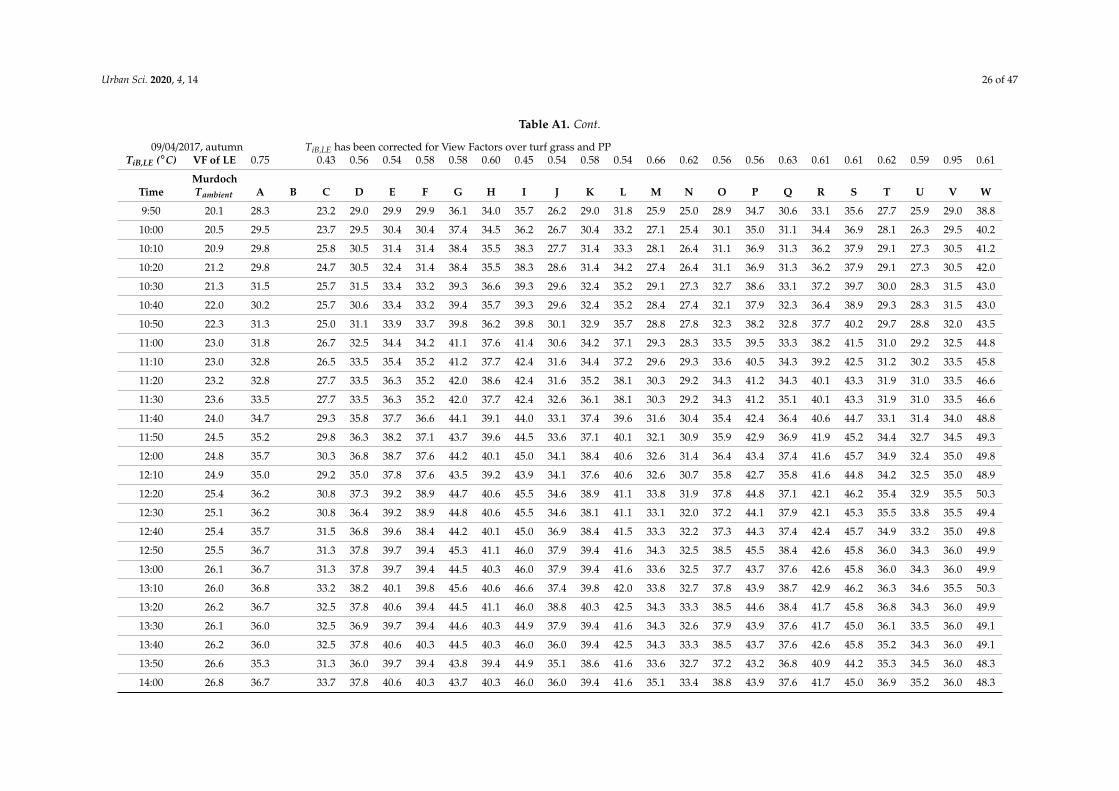
Table A1. iButton temperatures due to the landscape element (LE) only (after correction for VFs of surroundings).
09/04/2017, autumn TiB,LE has been corrected for View Factors over turf grass and PPTiB,LE (◦C) VF of LE 0.75 0.43 0.56 0.54 0.58 0.58 0.60 0.45 0.54 0.58 0.54 0.66 0.62 0.56 0.56 0.63 0.61 0.61 0.62 0.59 0.95 0.61
TimeMurdochTambient A B C D E F G H I J K L M N O P Q R S T U V W
6:00 12.3 12.3 14.5 12.8 11.9 11.9 13.4 12.5 13.2 12.9 12.7 12.9 11.7 13.2 11.4 12.2 12.6 11.8 12.6 11.7 11.7 11.0 12.6
6:10 12.0 12.0 13.2 12.0 12.0 12.9 12.9 12.6 13.1 12.0 12.0 12.0 12.0 12.8 11.1 12.7 12.8 11.2 12.0 12.0 12.0 12.0 12.0
6:20 12.4 11.5 12.7 11.5 11.5 12.4 12.4 12.1 12.6 11.5 11.5 11.5 11.5 12.3 10.6 12.2 11.5 10.7 11.5 10.7 11.5 11.5 10.7
6:30 13.0 11.0 12.2 11.0 11.0 11.9 11.9 11.6 13.2 11.0 11.0 11.0 11.0 11.8 11.0 11.6 11.8 10.2 11.0 11.0 11.0 11.0 11.0
6:40 13.2 10.3 12.2 10.1 11.0 11.9 11.9 11.6 12.1 11.0 11.0 11.0 11.0 11.8 10.1 11.6 11.0 10.2 11.0 10.2 11.0 11.0 10.2
6:50 13.4 11.0 12.2 11.0 11.0 11.9 11.9 11.6 12.1 11.0 11.0 11.0 11.0 11.8 11.0 11.6 11.8 11.0 11.0 11.0 11.0 11.0 11.0
7:00 14.0 11.5 12.7 11.5 11.5 12.4 12.4 12.1 12.6 11.5 11.5 11.5 11.5 11.5 10.6 12.2 12.3 11.5 11.5 11.5 11.5 11.5 11.5
7:10 14.4 11.5 13.8 11.5 11.5 12.4 13.1 12.1 13.7 11.5 11.5 11.5 12.2 12.2 11.3 12.0 12.3 11.5 12.3 11.4 11.4 11.5 12.3
7:20 14.8 12.7 13.2 12.0 12.0 12.9 13.6 12.6 14.2 12.0 12.0 12.0 12.0 12.7 11.8 13.4 12.8 12.0 12.8 11.9 11.9 12.0 12.8
7:30 15.3 12.2 12.3 11.7 12.6 13.5 12.7 12.5 14.6 11.6 11.8 11.6 12.0 12.0 11.1 12.6 12.7 11.9 12.7 12.0 11.9 13.5 11.9
7:40 15.7 13.0 13.0 13.0 13.0 13.9 13.8 13.6 15.2 13.0 13.0 13.0 13.0 12.9 11.9 13.5 13.8 13.0 13.8 12.1 12.9 13.0 13.8
7:50 16.1 12.5 9.5 15.6 13.7 15.6 18.6 15.5 19.8 10.9 13.1 10.9 12.0 14.5 12.3 13.7 11.7 11.6 12.4 12.8 13.5 16.5 18.1
8:00 16.6 15.2 13.8 17.6 16.6 17.6 21.9 18.4 21.8 12.9 15.9 16.6 15.5 16.0 15.6 18.2 14.5 16.9 19.3 16.0 15.9 18.5 21.8
8:10 16.9 17.3 15.3 18.2 18.1 19.1 23.2 21.6 23.3 16.3 17.4 19.1 16.9 16.5 17.5 21.1 16.8 20.0 22.5 17.4 17.2 20.0 23.3
8:20 17.3 19.0 16.3 20.1 19.1 21.0 24.9 23.4 25.4 17.3 19.3 21.0 18.7 18.1 18.9 22.7 18.6 21.8 25.1 19.1 18.1 21.0 25.1
8:30 17.5 19.8 16.7 21.6 20.6 21.6 26.4 25.0 25.8 18.8 20.8 21.6 19.4 18.8 20.4 24.2 19.3 23.3 26.6 19.8 18.8 22.5 26.6
8:40 17.6 20.8 17.7 22.6 21.6 22.6 27.4 26.0 27.9 19.8 21.8 23.5 20.4 19.8 21.4 26.1 20.3 24.3 27.6 20.8 19.8 23.5 28.4
8:50 18.2 22.0 19.3 24.0 24.0 24.0 29.4 28.1 29.6 21.2 23.1 25.9 21.6 20.9 23.3 27.1 22.4 26.5 29.7 21.9 21.0 24.0 30.6
9:00 18.5 23.0 20.3 25.0 25.0 25.0 30.4 29.2 30.6 22.2 24.1 26.9 22.6 21.9 24.3 28.1 23.4 26.6 30.7 22.9 22.0 25.0 32.4
9:10 18.8 24.7 20.2 26.0 26.0 26.0 31.4 30.2 31.6 23.2 25.1 27.9 23.6 22.9 25.3 30.1 26.0 27.6 31.7 23.9 22.1 26.0 33.4
9:20 19.1 24.5 20.7 25.6 26.5 26.5 32.0 30.7 32.1 23.7 25.6 28.4 23.4 22.7 26.0 30.8 25.7 28.1 31.4 24.5 23.5 26.5 33.9
9:30 19.4 26.2 21.7 27.5 27.5 27.5 33.8 31.7 33.1 24.7 27.5 29.4 24.4 23.6 26.8 31.6 27.5 30.0 33.2 25.4 23.6 27.5 35.7
9:40 19.8 27.3 23.3 28.0 28.9 28.9 35.1 33.0 34.7 26.1 28.9 30.8 25.6 24.8 27.9 33.7 29.6 32.1 34.6 26.7 24.9 28.0 37.8
Urban Sci. 2020, 4, 14 26 of 47
Table A1. Cont.
09/04/2017, autumn TiB,LE has been corrected for View Factors over turf grass and PPTiB,LE (◦C) VF of LE 0.75 0.43 0.56 0.54 0.58 0.58 0.60 0.45 0.54 0.58 0.54 0.66 0.62 0.56 0.56 0.63 0.61 0.61 0.62 0.59 0.95 0.61
TimeMurdochTambient A B C D E F G H I J K L M N O P Q R S T U V W
9:50 20.1 28.3 23.2 29.0 29.9 29.9 36.1 34.0 35.7 26.2 29.0 31.8 25.9 25.0 28.9 34.7 30.6 33.1 35.6 27.7 25.9 29.0 38.8
10:00 20.5 29.5 23.7 29.5 30.4 30.4 37.4 34.5 36.2 26.7 30.4 33.2 27.1 25.4 30.1 35.0 31.1 34.4 36.9 28.1 26.3 29.5 40.2
10:10 20.9 29.8 25.8 30.5 31.4 31.4 38.4 35.5 38.3 27.7 31.4 33.3 28.1 26.4 31.1 36.9 31.3 36.2 37.9 29.1 27.3 30.5 41.2
10:20 21.2 29.8 24.7 30.5 32.4 31.4 38.4 35.5 38.3 28.6 31.4 34.2 27.4 26.4 31.1 36.9 31.3 36.2 37.9 29.1 27.3 30.5 42.0
10:30 21.3 31.5 25.7 31.5 33.4 33.2 39.3 36.6 39.3 29.6 32.4 35.2 29.1 27.3 32.7 38.6 33.1 37.2 39.7 30.0 28.3 31.5 43.0
10:40 22.0 30.2 25.7 30.6 33.4 33.2 39.4 35.7 39.3 29.6 32.4 35.2 28.4 27.4 32.1 37.9 32.3 36.4 38.9 29.3 28.3 31.5 43.0
10:50 22.3 31.3 25.0 31.1 33.9 33.7 39.8 36.2 39.8 30.1 32.9 35.7 28.8 27.8 32.3 38.2 32.8 37.7 40.2 29.7 28.8 32.0 43.5
11:00 23.0 31.8 26.7 32.5 34.4 34.2 41.1 37.6 41.4 30.6 34.2 37.1 29.3 28.3 33.5 39.5 33.3 38.2 41.5 31.0 29.2 32.5 44.8
11:10 23.0 32.8 26.5 33.5 35.4 35.2 41.2 37.7 42.4 31.6 34.4 37.2 29.6 29.3 33.6 40.5 34.3 39.2 42.5 31.2 30.2 33.5 45.8
11:20 23.2 32.8 27.7 33.5 36.3 35.2 42.0 38.6 42.4 31.6 35.2 38.1 30.3 29.2 34.3 41.2 34.3 40.1 43.3 31.9 31.0 33.5 46.6
11:30 23.6 33.5 27.7 33.5 36.3 35.2 42.0 37.7 42.4 32.6 36.1 38.1 30.3 29.2 34.3 41.2 35.1 40.1 43.3 31.9 31.0 33.5 46.6
11:40 24.0 34.7 29.3 35.8 37.7 36.6 44.1 39.1 44.0 33.1 37.4 39.6 31.6 30.4 35.4 42.4 36.4 40.6 44.7 33.1 31.4 34.0 48.8
11:50 24.5 35.2 29.8 36.3 38.2 37.1 43.7 39.6 44.5 33.6 37.1 40.1 32.1 30.9 35.9 42.9 36.9 41.9 45.2 34.4 32.7 34.5 49.3
12:00 24.8 35.7 30.3 36.8 38.7 37.6 44.2 40.1 45.0 34.1 38.4 40.6 32.6 31.4 36.4 43.4 37.4 41.6 45.7 34.9 32.4 35.0 49.8
12:10 24.9 35.0 29.2 35.0 37.8 37.6 43.5 39.2 43.9 34.1 37.6 40.6 32.6 30.7 35.8 42.7 35.8 41.6 44.8 34.2 32.5 35.0 48.9
12:20 25.4 36.2 30.8 37.3 39.2 38.9 44.7 40.6 45.5 34.6 38.9 41.1 33.8 31.9 37.8 44.8 37.1 42.1 46.2 35.4 32.9 35.5 50.3
12:30 25.1 36.2 30.8 36.4 39.2 38.9 44.8 40.6 45.5 34.6 38.1 41.1 33.1 32.0 37.2 44.1 37.9 42.1 45.3 35.5 33.8 35.5 49.4
12:40 25.4 35.7 31.5 36.8 39.6 38.4 44.2 40.1 45.0 36.9 38.4 41.5 33.3 32.2 37.3 44.3 37.4 42.4 45.7 34.9 33.2 35.0 49.8
12:50 25.5 36.7 31.3 37.8 39.7 39.4 45.3 41.1 46.0 37.9 39.4 41.6 34.3 32.5 38.5 45.5 38.4 42.6 45.8 36.0 34.3 36.0 49.9
13:00 26.1 36.7 31.3 37.8 39.7 39.4 44.5 40.3 46.0 37.9 39.4 41.6 33.6 32.5 37.7 43.7 37.6 42.6 45.8 36.0 34.3 36.0 49.9
13:10 26.0 36.8 33.2 38.2 40.1 39.8 45.6 40.6 46.6 37.4 39.8 42.0 33.8 32.7 37.8 43.9 38.7 42.9 46.2 36.3 34.6 35.5 50.3
13:20 26.2 36.7 32.5 37.8 40.6 39.4 44.5 41.1 46.0 38.8 40.3 42.5 34.3 33.3 38.5 44.6 38.4 41.7 45.8 36.8 34.3 36.0 49.9
13:30 26.1 36.0 32.5 36.9 39.7 39.4 44.6 40.3 44.9 37.9 39.4 41.6 34.3 32.6 37.9 43.9 37.6 41.7 45.0 36.1 33.5 36.0 49.1
13:40 26.2 36.0 32.5 37.8 40.6 40.3 44.5 40.3 46.0 36.0 39.4 42.5 34.3 33.3 38.5 43.7 37.6 42.6 45.8 35.2 34.3 36.0 49.1
13:50 26.6 35.3 31.3 36.0 39.7 39.4 43.8 39.4 44.9 35.1 38.6 41.6 33.6 32.7 37.2 43.2 36.8 40.9 44.2 35.3 34.5 36.0 48.3
14:00 26.8 36.7 33.7 37.8 40.6 40.3 43.7 40.3 46.0 36.0 39.4 41.6 35.1 33.4 38.8 43.9 37.6 41.7 45.0 36.9 35.2 36.0 48.3
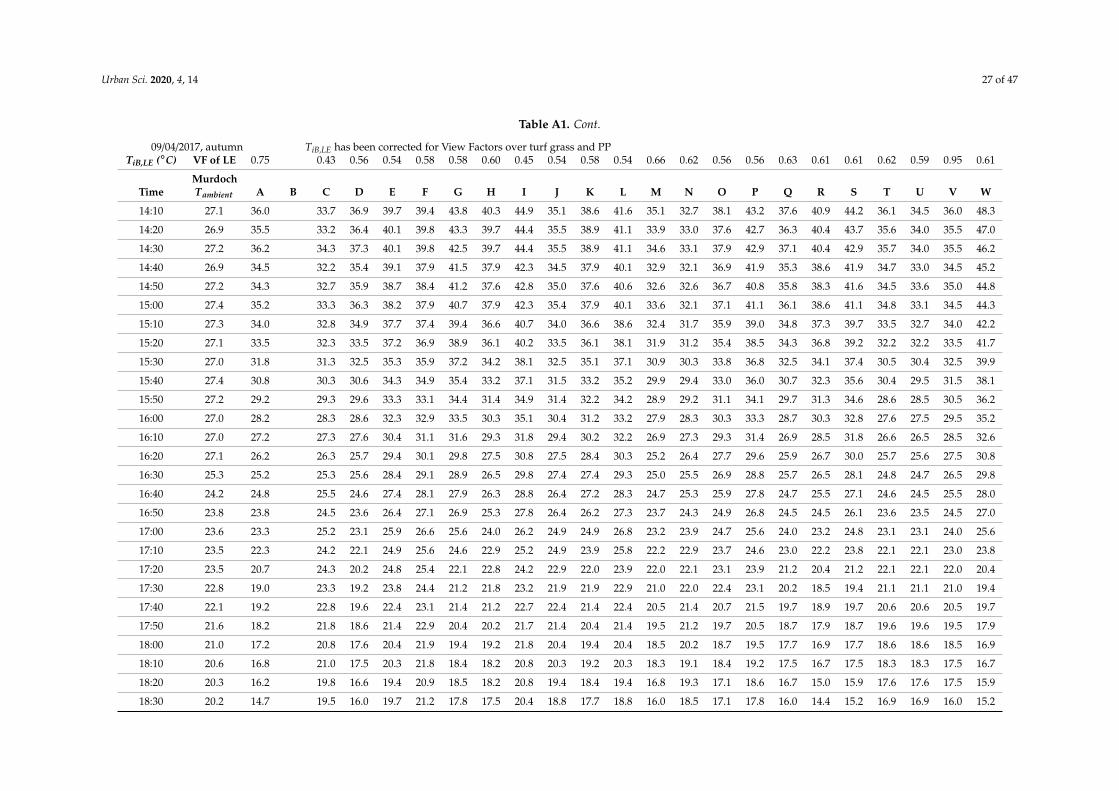
Urban Sci. 2020, 4, 14 27 of 47
Table A1. Cont.
09/04/2017, autumn TiB,LE has been corrected for View Factors over turf grass and PPTiB,LE (◦C) VF of LE 0.75 0.43 0.56 0.54 0.58 0.58 0.60 0.45 0.54 0.58 0.54 0.66 0.62 0.56 0.56 0.63 0.61 0.61 0.62 0.59 0.95 0.61
TimeMurdochTambient A B C D E F G H I J K L M N O P Q R S T U V W
14:10 27.1 36.0 33.7 36.9 39.7 39.4 43.8 40.3 44.9 35.1 38.6 41.6 35.1 32.7 38.1 43.2 37.6 40.9 44.2 36.1 34.5 36.0 48.3
14:20 26.9 35.5 33.2 36.4 40.1 39.8 43.3 39.7 44.4 35.5 38.9 41.1 33.9 33.0 37.6 42.7 36.3 40.4 43.7 35.6 34.0 35.5 47.0
14:30 27.2 36.2 34.3 37.3 40.1 39.8 42.5 39.7 44.4 35.5 38.9 41.1 34.6 33.1 37.9 42.9 37.1 40.4 42.9 35.7 34.0 35.5 46.2
14:40 26.9 34.5 32.2 35.4 39.1 37.9 41.5 37.9 42.3 34.5 37.9 40.1 32.9 32.1 36.9 41.9 35.3 38.6 41.9 34.7 33.0 34.5 45.2
14:50 27.2 34.3 32.7 35.9 38.7 38.4 41.2 37.6 42.8 35.0 37.6 40.6 32.6 32.6 36.7 40.8 35.8 38.3 41.6 34.5 33.6 35.0 44.8
15:00 27.4 35.2 33.3 36.3 38.2 37.9 40.7 37.9 42.3 35.4 37.9 40.1 33.6 32.1 37.1 41.1 36.1 38.6 41.1 34.8 33.1 34.5 44.3
15:10 27.3 34.0 32.8 34.9 37.7 37.4 39.4 36.6 40.7 34.0 36.6 38.6 32.4 31.7 35.9 39.0 34.8 37.3 39.7 33.5 32.7 34.0 42.2
15:20 27.1 33.5 32.3 33.5 37.2 36.9 38.9 36.1 40.2 33.5 36.1 38.1 31.9 31.2 35.4 38.5 34.3 36.8 39.2 32.2 32.2 33.5 41.7
15:30 27.0 31.8 31.3 32.5 35.3 35.9 37.2 34.2 38.1 32.5 35.1 37.1 30.9 30.3 33.8 36.8 32.5 34.1 37.4 30.5 30.4 32.5 39.9
15:40 27.4 30.8 30.3 30.6 34.3 34.9 35.4 33.2 37.1 31.5 33.2 35.2 29.9 29.4 33.0 36.0 30.7 32.3 35.6 30.4 29.5 31.5 38.1
15:50 27.2 29.2 29.3 29.6 33.3 33.1 34.4 31.4 34.9 31.4 32.2 34.2 28.9 29.2 31.1 34.1 29.7 31.3 34.6 28.6 28.5 30.5 36.2
16:00 27.0 28.2 28.3 28.6 32.3 32.9 33.5 30.3 35.1 30.4 31.2 33.2 27.9 28.3 30.3 33.3 28.7 30.3 32.8 27.6 27.5 29.5 35.2
16:10 27.0 27.2 27.3 27.6 30.4 31.1 31.6 29.3 31.8 29.4 30.2 32.2 26.9 27.3 29.3 31.4 26.9 28.5 31.8 26.6 26.5 28.5 32.6
16:20 27.1 26.2 26.3 25.7 29.4 30.1 29.8 27.5 30.8 27.5 28.4 30.3 25.2 26.4 27.7 29.6 25.9 26.7 30.0 25.7 25.6 27.5 30.8
16:30 25.3 25.2 25.3 25.6 28.4 29.1 28.9 26.5 29.8 27.4 27.4 29.3 25.0 25.5 26.9 28.8 25.7 26.5 28.1 24.8 24.7 26.5 29.8
16:40 24.2 24.8 25.5 24.6 27.4 28.1 27.9 26.3 28.8 26.4 27.2 28.3 24.7 25.3 25.9 27.8 24.7 25.5 27.1 24.6 24.5 25.5 28.0
16:50 23.8 23.8 24.5 23.6 26.4 27.1 26.9 25.3 27.8 26.4 26.2 27.3 23.7 24.3 24.9 26.8 24.5 24.5 26.1 23.6 23.5 24.5 27.0
17:00 23.6 23.3 25.2 23.1 25.9 26.6 25.6 24.0 26.2 24.9 24.9 26.8 23.2 23.9 24.7 25.6 24.0 23.2 24.8 23.1 23.1 24.0 25.6
17:10 23.5 22.3 24.2 22.1 24.9 25.6 24.6 22.9 25.2 24.9 23.9 25.8 22.2 22.9 23.7 24.6 23.0 22.2 23.8 22.1 22.1 23.0 23.8
17:20 23.5 20.7 24.3 20.2 24.8 25.4 22.1 22.8 24.2 22.9 22.0 23.9 22.0 22.1 23.1 23.9 21.2 20.4 21.2 22.1 22.1 22.0 20.4
17:30 22.8 19.0 23.3 19.2 23.8 24.4 21.2 21.8 23.2 21.9 21.9 22.9 21.0 22.0 22.4 23.1 20.2 18.5 19.4 21.1 21.1 21.0 19.4
17:40 22.1 19.2 22.8 19.6 22.4 23.1 21.4 21.2 22.7 22.4 21.4 22.4 20.5 21.4 20.7 21.5 19.7 18.9 19.7 20.6 20.6 20.5 19.7
17:50 21.6 18.2 21.8 18.6 21.4 22.9 20.4 20.2 21.7 21.4 20.4 21.4 19.5 21.2 19.7 20.5 18.7 17.9 18.7 19.6 19.6 19.5 17.9
18:00 21.0 17.2 20.8 17.6 20.4 21.9 19.4 19.2 21.8 20.4 19.4 20.4 18.5 20.2 18.7 19.5 17.7 16.9 17.7 18.6 18.6 18.5 16.9
18:10 20.6 16.8 21.0 17.5 20.3 21.8 18.4 18.2 20.8 20.3 19.2 20.3 18.3 19.1 18.4 19.2 17.5 16.7 17.5 18.3 18.3 17.5 16.7
18:20 20.3 16.2 19.8 16.6 19.4 20.9 18.5 18.2 20.8 19.4 18.4 19.4 16.8 19.3 17.1 18.6 16.7 15.0 15.9 17.6 17.6 17.5 15.9
18:30 20.2 14.7 19.5 16.0 19.7 21.2 17.8 17.5 20.4 18.8 17.7 18.8 16.0 18.5 17.1 17.8 16.0 14.4 15.2 16.9 16.9 16.0 15.2

Urban Sci. 2020, 4, 14 28 of 47
Table A1. Cont.
09/04/2017, autumn TiB,LE has been corrected for View Factors over turf grass and PPTiB,LE (◦C) VF of LE 0.75 0.43 0.56 0.54 0.58 0.58 0.60 0.45 0.54 0.58 0.54 0.66 0.62 0.56 0.56 0.63 0.61 0.61 0.62 0.59 0.95 0.61
TimeMurdochTambient A B C D E F G H I J K L M N O P Q R S T U V W
18:40 20.0 14.7 19.5 15.1 18.8 20.3 16.9 16.7 19.3 17.9 17.7 17.9 16.0 17.7 16.2 16.9 15.2 14.4 15.2 16.1 16.9 16.0 15.2
18:50 19.6 15.0 19.7 15.0 17.8 19.3 16.7 16.5 19.4 17.8 17.6 17.8 15.8 17.4 15.9 16.6 15.8 14.2 15.0 15.8 15.8 15.0 15.0
19:00 19.0 13.8 18.0 13.6 17.3 18.8 15.4 15.2 17.8 16.4 16.2 16.4 14.5 16.2 14.7 15.4 13.7 12.9 13.7 14.6 14.6 14.5 13.7
19:10 18.5 12.8 17.0 13.5 16.3 17.8 15.3 15.0 17.9 16.3 15.2 16.3 13.5 16.0 14.6 15.3 12.7 11.9 12.7 14.4 14.4 13.5 12.7
19:20 18.0 12.3 16.5 12.1 15.8 17.3 14.8 13.6 17.4 14.9 14.7 14.9 13.0 15.5 14.1 14.8 12.2 11.4 12.2 13.1 13.9 13.0 12.2
19:30 17.9 11.7 15.3 12.1 14.9 17.3 14.8 13.6 17.4 14.9 14.7 14.9 13.0 14.7 13.2 13.9 12.2 11.4 12.2 13.1 13.1 13.0 12.2
19:40 17.3 11.8 17.2 11.6 15.3 16.8 14.3 14.0 16.9 14.4 14.2 14.4 13.3 15.0 13.6 14.3 12.5 11.7 11.7 13.4 14.3 12.5 11.7
19:50 17.2 12.5 17.2 12.5 15.3 17.7 14.2 14.0 18.1 15.3 15.1 15.3 13.3 14.9 13.4 14.1 12.5 12.5 12.5 13.3 14.2 12.5 12.5
20:00 17.4 12.5 16.0 12.5 15.3 16.8 14.2 14.0 16.9 14.4 14.2 15.3 13.3 14.9 13.4 14.1 12.5 12.5 12.5 13.3 14.2 12.5 12.5
20:10 17.4 12.3 15.3 12.1 14.9 16.4 13.9 13.6 16.3 14.9 14.7 14.9 13.0 14.6 13.0 14.6 12.2 11.4 13.0 13.0 13.8 13.0 12.2
20:20 17.0 11.3 15.5 12.0 14.8 16.3 13.8 12.6 16.4 13.9 13.7 13.9 12.0 13.7 13.1 13.8 11.2 10.4 11.2 12.1 12.9 12.0 12.0
20:30 16.3 10.8 15.0 12.4 14.3 15.8 13.2 13.0 17.1 13.4 13.2 13.4 11.5 13.9 12.4 13.1 11.5 10.7 11.5 12.3 13.2 11.5 11.5
20:40 16.3 10.8 13.8 11.5 13.4 14.9 13.3 12.1 15.9 13.4 12.4 13.4 11.5 13.2 11.7 13.3 10.7 9.9 10.7 11.6 12.4 11.5 11.5
20:50 15.7 11.3 14.3 11.1 13.9 15.4 12.9 12.6 15.3 12.9 12.9 12.9 12.0 13.7 12.2 12.9 11.2 10.4 11.2 12.1 12.9 12.0 11.2
21:00 15.9 12.5 14.8 11.6 14.4 15.9 13.4 13.1 15.8 13.4 13.4 13.4 13.3 13.3 13.4 14.1 12.5 11.7 12.5 12.5 13.3 12.5 11.7
24/08/2017, winter TiB,LE has been corrected for View Factors over turf grass and PP
TiB,LE (◦C) VF of LE 0.71 0.58 0.43 0.56 0.52 0.58 0.58 0.56 0.45 0.54 0.59 0.54 0.65 0.62 0.56 0.56 0.63 0.61 0.61 0.62 0.59 0.95 0.61
TimeMurdochTambient A B C D E F G H I J K L M N O P Q R S T U V W
5:30 10.2 5.8 6.5 7.7 5.6 7.5 7.4 6.6 6.2 7.6 6.5 6.5 6.5 5.8 7.4 5.8 7.2 6.5 5.7 5.7 5.8 6.6 6.5 5.7
5:40 10.5 6.0 5.8 8.3 6.0 7.0 6.9 6.9 6.6 8.2 6.9 6.8 6.9 6.8 6.8 6.9 7.4 7.6 6.0 6.0 6.0 6.8 6.0 5.2
5:50 10.5 5.3 5.8 7.2 6.0 7.0 6.9 6.9 6.6 8.2 6.9 6.0 6.9 5.2 6.8 5.1 6.5 6.8 5.2 6.0 5.2 6.0 6.0 5.2
6:00 10.4 4.8 6.2 6.7 5.5 6.5 6.4 6.4 5.1 7.7 6.4 6.3 6.4 4.7 6.3 4.6 6.0 6.3 4.7 5.5 4.7 5.5 5.5 4.7
6:10 10.5 5.5 5.3 6.7 5.5 6.5 6.4 6.4 5.1 7.7 6.4 6.3 6.4 4.7 6.3 4.6 6.0 6.3 5.5 5.5 4.7 5.5 5.5 4.7
6:20 10.5 6.0 5.8 7.2 6.0 7.0 6.9 6.9 5.7 7.1 6.0 6.0 6.0 5.2 6.8 6.0 6.5 6.8 6.0 6.0 5.2 6.0 6.0 5.2
6:30 10.4 6.3 7.0 8.2 6.1 7.0 7.9 7.1 6.7 8.1 7.0 7.0 7.0 6.3 7.9 6.3 6.9 7.0 6.2 6.2 6.3 7.1 7.0 6.2
6:40 10.5 6.1 6.6 7.5 6.6 7.5 7.5 7.6 6.3 8.6 6.6 6.7 6.6 6.0 7.6 5.9 6.5 7.5 6.7 6.7 6.0 6.7 7.5 6.7

Urban Sci. 2020, 4, 14 29 of 47
Table A1. Cont.
24/08/2017, winter TiB,LE has been corrected for View Factors over turf grass and PP
TiB,LE (◦C) VF of LE 0.71 0.58 0.43 0.56 0.52 0.58 0.58 0.56 0.45 0.54 0.59 0.54 0.65 0.62 0.56 0.56 0.63 0.61 0.61 0.62 0.59 0.95 0.61
TimeMurdochTambient A B C D E F G H I J K L M N O P Q R S T U V W
6:50 10.4 7.3 8.0 8.0 7.1 7.0 8.0 8.1 6.8 8.0 7.1 7.2 7.1 6.5 8.1 6.4 7.0 8.0 7.2 7.2 7.3 7.2 8.0 7.2
7:00 10.7 7.5 7.3 8.7 7.5 7.5 7.5 7.5 7.2 8.6 7.5 7.5 7.5 6.7 8.3 6.6 8.1 8.3 7.5 7.5 7.5 7.5 7.5 6.7
7:10 10.9 7.3 7.0 8.0 8.0 8.0 8.0 8.0 6.8 9.1 7.1 7.2 7.1 7.2 8.0 7.1 7.7 8.0 7.2 8.0 7.2 7.2 8.0 7.2
7:20 11.0 7.8 8.3 8.5 9.4 8.5 8.5 9.4 8.2 9.6 7.6 8.5 8.5 7.7 8.5 7.6 8.2 8.5 7.7 8.5 7.7 8.5 8.5 9.3
7:30 11.3 10.0 9.0 10.0 10.0 9.0 10.0 10.9 9.7 11.1 9.1 8.3 9.1 8.5 9.2 9.1 9.7 10.0 9.2 10.0 9.2 9.2 10.0 10.8
7:40 11.4 8.7 9.9 10.3 10.6 10.5 11.5 11.7 11.3 11.5 8.7 8.1 8.7 9.3 10.1 10.1 11.6 9.1 9.0 9.9 10.1 9.9 11.5 11.5
7:50 11.7 9.7 10.6 11.3 11.6 11.5 12.5 14.2 12.3 12.5 10.6 10.8 11.6 10.2 11.7 10.7 12.3 10.9 10.9 12.5 10.9 10.8 12.5 13.3
8:00 12.0 11.6 11.0 11.8 12.1 12.0 13.0 14.6 11.9 13.0 11.1 11.3 12.1 10.6 12.1 11.0 11.7 12.2 12.2 13.8 10.5 10.4 13.0 13.8
8:10 12.5 13.8 12.4 13.3 13.6 13.5 14.5 16.1 14.3 14.5 12.6 12.8 13.6 12.1 12.7 12.3 13.9 13.7 14.5 16.1 11.9 11.8 14.5 16.1
8:20 13.0 14.3 12.7 13.8 14.1 14.0 15.0 17.3 14.8 16.1 13.1 13.3 15.0 12.5 13.9 13.5 15.2 14.2 15.8 17.5 13.1 12.2 15.0 17.5
8:30 13.2 15.8 14.3 15.3 14.7 15.5 16.5 19.7 16.3 17.6 14.6 14.8 16.5 14.0 14.6 15.0 16.7 15.7 17.3 19.0 14.6 13.7 16.5 19.0
8:40 13.7 15.1 14.4 14.2 14.7 16.5 16.5 19.8 16.3 17.6 14.6 14.8 16.5 13.3 15.5 15.2 16.9 15.7 16.5 18.1 14.7 13.8 16.5 19.8
8:50 14.4 14.1 14.3 14.3 14.6 15.5 15.5 17.9 15.3 16.6 14.6 14.7 15.5 13.1 14.5 14.2 15.9 14.7 15.5 17.1 13.7 13.7 15.5 18.0
9:00 14.4 14.8 14.3 14.3 14.6 15.5 15.5 17.9 15.3 16.6 14.6 14.7 15.5 13.1 14.5 14.2 15.9 14.7 15.5 17.1 13.7 13.7 15.5 18.0
9:10 14.7 17.8 16.1 17.3 16.7 18.5 18.5 21.6 19.3 19.6 16.6 17.7 18.5 16.0 16.5 17.7 20.3 17.7 19.3 21.8 16.5 15.7 18.5 22.6
9:20 15.1 19.3 17.6 18.8 19.1 20.0 20.9 24.0 21.7 21.1 18.1 19.2 20.9 17.5 18.8 19.2 22.7 19.2 21.6 23.3 18.0 17.2 20.0 26.6
9:30 15.0 19.8 18.9 19.3 20.5 20.5 21.4 24.4 22.2 21.6 18.6 19.7 22.4 17.9 19.2 19.5 23.1 20.5 22.1 24.6 19.2 17.6 20.5 27.9
9:40 16.7 20.8 19.9 20.3 21.5 21.5 22.4 25.4 23.2 22.6 19.6 20.7 23.4 18.9 20.2 21.4 24.1 21.5 23.1 25.6 19.4 18.6 21.5 28.1
9:50 17.1 20.3 19.4 19.8 21.0 22.0 21.9 24.9 22.7 22.1 19.1 20.2 22.9 19.2 20.5 20.9 24.5 21.8 22.6 25.1 19.7 19.0 21.0 27.6
10:00 17.7 21.3 20.4 20.8 22.0 23.0 22.9 25.9 24.6 23.1 21.1 21.2 24.8 20.2 21.5 21.9 26.4 22.8 23.6 26.1 20.7 20.0 22.0 29.4
10:10 17.6 21.1 20.3 20.2 21.6 22.5 23.4 25.7 23.3 22.5 20.6 21.7 24.4 20.0 21.4 21.9 25.5 21.7 23.3 25.0 20.6 19.7 22.5 29.1
10:20 17.9 21.8 20.1 21.3 21.6 22.5 23.4 26.5 23.3 23.6 20.6 21.7 24.4 20.0 21.3 22.6 26.2 22.5 24.1 25.8 21.3 19.7 22.5 29.9
10:30 18.3 23.3 21.5 21.7 24.0 24.0 24.9 28.7 25.7 25.1 23.1 23.2 26.8 20.7 22.7 23.9 27.5 24.8 25.6 28.1 22.7 21.1 24.0 32.2
10:40 18.5 24.0 22.2 22.8 24.0 25.0 25.7 29.5 25.7 26.2 23.1 24.0 27.7 21.4 23.4 23.8 27.3 24.8 27.3 28.9 23.4 21.0 24.0 32.2
10:50 18.4 25.0 23.4 23.8 25.0 26.0 25.9 30.6 27.7 27.2 23.1 24.2 26.9 22.4 23.7 25.8 29.4 25.8 27.5 29.1 23.7 21.3 25.0 33.2
11:00 19.1 24.8 23.9 24.3 25.5 25.5 26.4 31.1 27.3 27.7 23.6 24.7 28.3 22.9 24.2 25.4 29.9 26.3 28.0 29.6 24.2 21.8 25.5 34.5

Urban Sci. 2020, 4, 14 30 of 47
Table A1. Cont.
24/08/2017, winter TiB,LE has been corrected for View Factors over turf grass and PP
TiB,LE (◦C) VF of LE 0.71 0.58 0.43 0.56 0.52 0.58 0.58 0.56 0.45 0.54 0.59 0.54 0.65 0.62 0.56 0.56 0.63 0.61 0.61 0.62 0.59 0.95 0.61
TimeMurdochTambient A B C D E F G H I J K L M N O P Q R S T U V W
11:10 19.5 26.2 24.6 25.5 26.4 27.4 27.2 31.9 29.1 27.7 24.6 25.5 29.2 23.7 24.9 27.0 30.6 27.1 28.8 30.4 24.9 22.5 25.5 35.3
11:20 19.5 26.7 25.1 24.8 26.9 27.9 27.7 32.4 28.7 28.2 24.1 26.0 29.7 23.4 24.6 27.5 31.1 26.8 29.3 30.9 25.4 23.0 26.0 35.0
11:30 19.9 27.0 26.1 24.7 27.9 28.0 27.9 33.4 29.7 29.2 25.1 27.0 29.8 24.4 25.6 27.6 31.3 27.8 29.5 31.9 26.4 23.2 27.0 36.8
11:40 20.0 26.0 25.0 26.0 26.0 27.9 27.7 33.2 29.6 28.2 26.0 26.0 29.7 24.1 25.4 27.3 31.0 27.6 29.3 31.7 25.4 23.0 26.0 35.0
11:50 20.3 28.2 27.3 27.5 29.3 29.4 30.1 34.7 31.1 30.8 25.6 28.3 31.2 26.4 26.9 29.7 34.3 29.1 31.6 33.2 27.7 24.5 27.5 38.2
12:00 20.6 28.0 27.8 26.8 28.9 29.0 29.7 34.3 30.7 30.2 26.1 28.0 31.7 26.1 27.4 28.5 33.9 28.8 31.3 33.7 28.2 24.1 28.0 37.8
12:10 20.4 27.0 27.0 27.0 27.0 28.9 28.7 34.2 29.7 29.2 26.1 27.0 30.7 25.2 26.4 28.5 32.2 27.8 30.3 31.9 25.6 23.2 27.0 36.0
12:20 20.4 27.5 27.5 26.3 27.5 29.4 29.2 33.9 30.2 29.7 26.6 27.5 31.2 25.7 26.9 29.0 32.7 28.3 30.0 32.4 26.9 23.7 27.5 36.5
12:30 20.9 28.2 27.3 26.3 28.4 29.4 30.1 34.7 31.1 30.8 26.6 27.5 31.2 25.6 26.9 28.8 32.5 29.1 31.6 33.2 26.9 24.5 27.5 37.3
12:40 20.6 29.2 28.2 28.5 29.4 30.4 31.1 35.6 32.1 31.8 27.6 29.3 33.1 26.6 27.8 30.5 34.2 30.9 32.6 35.1 28.6 25.4 28.5 38.3
12:50 20.8 27.5 27.3 27.5 27.5 29.4 30.1 33.8 31.1 29.7 27.5 27.5 31.2 26.4 26.0 28.8 34.3 28.3 30.8 33.2 26.9 24.5 27.5 36.5
13:00 21.2 27.2 27.2 26.5 28.3 29.4 29.1 34.5 30.1 29.8 27.4 28.2 31.1 25.4 26.7 27.8 31.5 27.3 29.8 32.2 25.0 23.5 26.5 36.3
13:10 21.8 27.0 26.1 25.8 27.0 28.9 29.6 34.2 29.7 29.2 27.0 27.0 29.8 25.2 26.4 28.5 32.2 27.8 29.5 31.9 25.6 23.2 27.0 35.2
13:20 21.4 27.7 26.8 27.0 27.9 29.9 29.6 34.2 29.7 30.3 27.0 27.8 30.7 25.1 26.4 28.3 32.0 28.6 30.3 32.7 26.4 24.8 27.0 36.0
13:30 21.6 28.5 27.6 27.3 28.5 30.4 31.1 34.9 31.2 30.7 27.6 28.5 32.2 26.7 27.9 30.0 33.7 29.3 31.8 33.4 27.9 25.5 28.5 37.5
13:40 21.4 26.8 27.6 27.5 27.5 29.4 30.1 33.1 31.1 29.7 27.5 27.5 31.2 26.5 27.0 29.2 33.8 28.3 30.0 31.6 26.2 24.6 27.5 35.7
13:50 21.8 27.0 27.0 27.0 27.9 29.9 29.6 33.4 30.6 30.3 27.9 27.8 30.7 25.2 26.4 28.5 32.2 27.8 30.3 31.9 26.4 24.0 27.0 35.2
14:00 21.3 27.0 27.0 27.0 27.9 29.9 29.6 33.4 29.7 29.2 27.9 27.8 30.7 25.2 27.3 28.5 31.3 27.8 30.3 31.9 26.4 24.0 27.0 35.2
14:10 21.7 27.0 26.1 27.0 27.0 28.9 29.6 33.4 29.7 29.2 27.9 27.8 31.6 25.9 27.3 28.5 32.2 28.6 30.3 31.9 26.4 24.0 27.0 35.2
14:20 21.7 26.5 25.8 26.5 26.5 28.4 29.1 32.1 28.3 28.7 26.5 27.3 30.2 24.7 26.8 28.2 30.9 27.3 29.0 30.6 26.0 24.5 26.5 34.7
14:30 22.5 26.5 26.5 26.5 27.4 29.4 29.1 32.9 30.1 29.8 27.4 27.3 30.2 25.4 26.8 28.0 31.7 28.1 29.8 31.4 25.9 24.4 26.5 33.9
14:40 22.3 27.0 27.1 27.0 27.9 29.9 29.6 32.6 30.6 30.3 27.9 27.8 30.7 26.0 26.5 28.7 32.4 27.8 30.3 31.1 26.5 25.0 27.0 34.4
14:50 22.4 26.5 25.8 26.5 27.4 28.4 29.1 32.1 28.3 29.8 26.5 27.3 30.2 24.7 26.8 27.3 30.0 27.3 29.0 30.6 26.0 24.5 26.5 33.9
15:00 22.1 26.5 26.6 27.7 26.5 28.4 29.1 32.1 29.2 28.7 27.4 27.3 30.2 25.5 26.0 28.2 30.9 28.1 29.0 30.6 26.0 24.5 26.5 33.1
15:10 22.1 26.5 26.8 26.5 26.5 28.4 28.2 31.3 29.2 28.7 27.4 26.5 30.2 25.5 26.1 27.5 31.1 27.3 29.0 29.8 25.3 24.5 26.5 32.2

Urban Sci. 2020, 4, 14 31 of 47
Table A1. Cont.
24/08/2017, winter TiB,LE has been corrected for View Factors over turf grass and PP
TiB,LE (◦C) VF of LE 0.71 0.58 0.43 0.56 0.52 0.58 0.58 0.56 0.45 0.54 0.59 0.54 0.65 0.62 0.56 0.56 0.63 0.61 0.61 0.62 0.59 0.95 0.61
TimeMurdochTambient A B C D E F G H I J K L M N O P Q R S T U V W
15:20 22.3 25.8 26.0 26.5 25.6 27.5 28.2 30.6 28.3 28.7 26.5 26.5 29.3 24.8 26.2 27.7 30.4 27.3 28.1 29.0 25.4 23.7 26.5 32.2
15:30 22.1 25.5 24.9 25.5 24.6 27.4 27.2 29.5 27.3 27.7 26.4 25.5 28.3 24.5 25.1 26.5 29.2 26.3 27.1 28.8 25.1 23.5 25.5 29.6
15:40 22.1 25.5 25.8 26.7 25.5 27.4 28.1 29.5 27.3 27.7 26.4 26.3 29.2 24.5 25.9 26.5 29.2 26.3 28.0 28.8 25.1 23.5 25.5 31.2
15:50 22.4 25.0 25.4 26.2 25.0 26.9 27.6 28.2 26.8 27.2 25.9 25.8 28.7 24.1 25.5 26.2 28.0 25.8 26.6 27.5 24.7 23.9 25.0 29.9
16:00 22.0 25.0 24.5 25.0 25.0 26.9 27.6 28.2 26.8 27.2 25.9 25.8 27.8 23.3 25.5 25.3 27.1 25.8 26.6 27.5 24.7 23.1 25.0 29.1
16:10 21.7 23.3 24.4 25.2 24.0 25.9 25.7 27.2 25.7 26.2 25.9 24.8 26.8 23.1 24.5 24.3 27.0 24.8 25.6 26.5 23.7 22.9 24.0 28.1
16:20 21.8 23.5 23.9 24.7 23.5 25.4 26.1 26.7 25.2 25.7 24.4 24.3 26.3 22.6 24.0 23.8 25.6 24.3 25.1 26.0 23.2 22.4 23.5 26.8
16:30 21.5 22.8 21.4 23.5 19.9 25.4 25.2 22.5 25.2 23.5 24.4 22.7 26.3 22.6 22.5 24.0 24.9 24.3 24.3 25.1 23.3 22.5 23.5 21.0
16:40 21.4 21.9 21.2 26.3 20.5 23.4 23.1 21.3 22.2 21.6 23.3 21.3 23.3 22.8 21.2 23.9 25.6 22.9 21.3 21.3 22.8 21.3 20.5 20.5
16:50 21.1 19.3 20.8 23.5 20.0 21.9 21.7 20.9 20.8 21.1 21.9 20.8 21.9 20.8 20.8 20.9 21.7 20.8 19.2 20.0 20.8 20.0 20.0 20.0
17:00 21.0 18.8 19.4 21.8 18.6 20.5 21.2 20.4 19.4 20.6 21.4 19.5 20.4 19.5 20.3 19.5 20.3 19.5 18.7 19.5 19.5 18.7 19.5 18.7
17:10 20.8 18.8 19.6 20.7 18.6 20.5 21.2 20.4 19.4 20.6 20.4 19.5 19.5 18.8 19.6 18.8 19.6 19.5 17.9 18.7 18.8 18.7 19.5 18.7
17:20 20.5 18.3 19.8 20.2 19.0 20.0 20.7 19.9 18.9 20.1 19.9 19.8 19.9 18.2 19.8 18.1 19.8 19.8 19.0 19.0 19.0 18.2 19.0 19.0
17:30 20.0 17.8 18.6 19.7 18.5 19.5 20.2 19.4 18.4 19.6 19.4 18.5 19.4 17.8 19.4 17.8 19.5 18.5 17.7 17.7 18.6 17.7 18.5 17.7
17:40 19.7 16.8 18.3 19.8 17.5 18.5 19.2 18.4 17.4 18.6 18.4 17.5 18.4 17.5 18.3 17.5 18.3 18.3 16.7 17.5 17.5 17.5 17.5 16.7
17:50 19.4 16.8 18.4 18.7 17.5 18.5 19.2 18.4 17.4 18.6 18.4 17.5 18.4 17.6 18.4 16.8 18.5 17.5 16.7 16.7 17.6 16.7 17.5 16.7
18:00 19.5 16.3 17.1 18.2 16.1 18.0 18.7 17.1 15.9 18.1 17.0 17.0 17.0 16.3 17.9 16.3 17.0 17.0 16.2 16.2 16.3 16.2 17.0 15.4
18:10 19.0 15.3 16.0 17.2 15.1 17.0 17.7 16.1 15.8 17.1 16.9 16.0 16.9 16.1 16.9 15.3 16.0 16.0 15.2 15.2 16.1 16.1 16.0 14.4
18:20 18.4 15.3 16.0 17.2 15.1 17.0 17.7 16.1 15.8 18.2 16.9 16.0 16.0 15.3 16.9 15.3 16.0 16.0 14.4 15.2 15.3 15.2 16.0 14.4
18:30 18.8 14.8 15.5 17.8 15.5 16.5 17.2 15.6 15.3 17.7 16.4 15.5 16.4 15.6 16.4 15.7 16.4 15.5 14.7 14.7 15.6 15.6 15.5 14.7
18:40 18.3 14.8 15.5 16.7 14.6 16.5 17.2 15.6 15.3 16.6 15.5 15.5 15.5 14.8 15.6 14.8 15.5 15.5 14.7 14.7 15.6 15.6 15.5 13.9
18:50 18.1 14.3 15.9 16.2 15.0 16.0 16.7 15.1 14.8 17.2 15.9 15.0 15.9 14.3 15.9 14.3 15.0 15.0 14.2 14.2 15.1 15.1 15.0 14.2
19:00 17.9 14.3 15.9 16.2 15.0 16.0 16.7 15.9 14.8 17.2 15.9 15.0 15.9 15.1 15.9 14.3 15.0 15.0 14.2 14.2 15.1 15.1 15.0 14.2
19:10 17.4 14.3 15.9 16.2 15.0 15.0 15.9 15.1 14.8 16.1 15.0 15.0 15.0 14.3 15.9 14.3 15.0 15.0 14.2 14.2 14.3 15.1 15.0 14.2
19:20 17.3 13.8 14.5 15.7 13.6 14.5 16.2 14.6 14.3 16.7 15.4 14.5 14.5 14.6 15.4 13.8 15.4 14.5 13.7 13.7 14.6 14.6 14.5 13.7
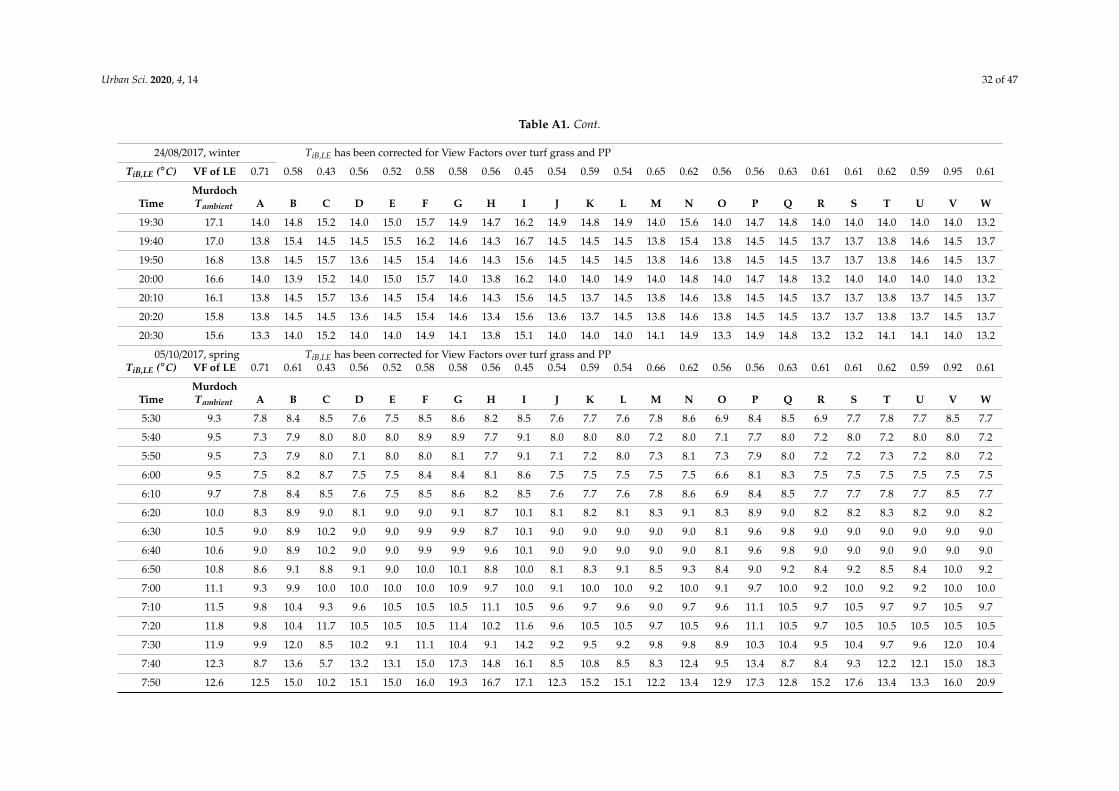
Urban Sci. 2020, 4, 14 32 of 47
Table A1. Cont.
24/08/2017, winter TiB,LE has been corrected for View Factors over turf grass and PP
TiB,LE (◦C) VF of LE 0.71 0.58 0.43 0.56 0.52 0.58 0.58 0.56 0.45 0.54 0.59 0.54 0.65 0.62 0.56 0.56 0.63 0.61 0.61 0.62 0.59 0.95 0.61
TimeMurdochTambient A B C D E F G H I J K L M N O P Q R S T U V W
19:30 17.1 14.0 14.8 15.2 14.0 15.0 15.7 14.9 14.7 16.2 14.9 14.8 14.9 14.0 15.6 14.0 14.7 14.8 14.0 14.0 14.0 14.0 14.0 13.2
19:40 17.0 13.8 15.4 14.5 14.5 15.5 16.2 14.6 14.3 16.7 14.5 14.5 14.5 13.8 15.4 13.8 14.5 14.5 13.7 13.7 13.8 14.6 14.5 13.7
19:50 16.8 13.8 14.5 15.7 13.6 14.5 15.4 14.6 14.3 15.6 14.5 14.5 14.5 13.8 14.6 13.8 14.5 14.5 13.7 13.7 13.8 14.6 14.5 13.7
20:00 16.6 14.0 13.9 15.2 14.0 15.0 15.7 14.0 13.8 16.2 14.0 14.0 14.9 14.0 14.8 14.0 14.7 14.8 13.2 14.0 14.0 14.0 14.0 13.2
20:10 16.1 13.8 14.5 15.7 13.6 14.5 15.4 14.6 14.3 15.6 14.5 13.7 14.5 13.8 14.6 13.8 14.5 14.5 13.7 13.7 13.8 13.7 14.5 13.7
20:20 15.8 13.8 14.5 14.5 13.6 14.5 15.4 14.6 13.4 15.6 13.6 13.7 14.5 13.8 14.6 13.8 14.5 14.5 13.7 13.7 13.8 13.7 14.5 13.7
20:30 15.6 13.3 14.0 15.2 14.0 14.0 14.9 14.1 13.8 15.1 14.0 14.0 14.0 14.1 14.9 13.3 14.9 14.8 13.2 13.2 14.1 14.1 14.0 13.2
05/10/2017, spring TiB,LE has been corrected for View Factors over turf grass and PPTiB,LE (◦C) VF of LE 0.71 0.61 0.43 0.56 0.52 0.58 0.58 0.56 0.45 0.54 0.59 0.54 0.66 0.62 0.56 0.56 0.63 0.61 0.61 0.62 0.59 0.92 0.61
TimeMurdochTambient A B C D E F G H I J K L M N O P Q R S T U V W
5:30 9.3 7.8 8.4 8.5 7.6 7.5 8.5 8.6 8.2 8.5 7.6 7.7 7.6 7.8 8.6 6.9 8.4 8.5 6.9 7.7 7.8 7.7 8.5 7.7
5:40 9.5 7.3 7.9 8.0 8.0 8.0 8.9 8.9 7.7 9.1 8.0 8.0 8.0 7.2 8.0 7.1 7.7 8.0 7.2 8.0 7.2 8.0 8.0 7.2
5:50 9.5 7.3 7.9 8.0 7.1 8.0 8.0 8.1 7.7 9.1 7.1 7.2 8.0 7.3 8.1 7.3 7.9 8.0 7.2 7.2 7.3 7.2 8.0 7.2
6:00 9.5 7.5 8.2 8.7 7.5 7.5 8.4 8.4 8.1 8.6 7.5 7.5 7.5 7.5 7.5 6.6 8.1 8.3 7.5 7.5 7.5 7.5 7.5 7.5
6:10 9.7 7.8 8.4 8.5 7.6 7.5 8.5 8.6 8.2 8.5 7.6 7.7 7.6 7.8 8.6 6.9 8.4 8.5 7.7 7.7 7.8 7.7 8.5 7.7
6:20 10.0 8.3 8.9 9.0 8.1 9.0 9.0 9.1 8.7 10.1 8.1 8.2 8.1 8.3 9.1 8.3 8.9 9.0 8.2 8.2 8.3 8.2 9.0 8.2
6:30 10.5 9.0 8.9 10.2 9.0 9.0 9.9 9.9 8.7 10.1 9.0 9.0 9.0 9.0 9.0 8.1 9.6 9.8 9.0 9.0 9.0 9.0 9.0 9.0
6:40 10.6 9.0 8.9 10.2 9.0 9.0 9.9 9.9 9.6 10.1 9.0 9.0 9.0 9.0 9.0 8.1 9.6 9.8 9.0 9.0 9.0 9.0 9.0 9.0
6:50 10.8 8.6 9.1 8.8 9.1 9.0 10.0 10.1 8.8 10.0 8.1 8.3 9.1 8.5 9.3 8.4 9.0 9.2 8.4 9.2 8.5 8.4 10.0 9.2
7:00 11.1 9.3 9.9 10.0 10.0 10.0 10.0 10.9 9.7 10.0 9.1 10.0 10.0 9.2 10.0 9.1 9.7 10.0 9.2 10.0 9.2 9.2 10.0 10.0
7:10 11.5 9.8 10.4 9.3 9.6 10.5 10.5 10.5 11.1 10.5 9.6 9.7 9.6 9.0 9.7 9.6 11.1 10.5 9.7 10.5 9.7 9.7 10.5 9.7
7:20 11.8 9.8 10.4 11.7 10.5 10.5 10.5 11.4 10.2 11.6 9.6 10.5 10.5 9.7 10.5 9.6 11.1 10.5 9.7 10.5 10.5 10.5 10.5 10.5
7:30 11.9 9.9 12.0 8.5 10.2 9.1 11.1 10.4 9.1 14.2 9.2 9.5 9.2 9.8 9.8 8.9 10.3 10.4 9.5 10.4 9.7 9.6 12.0 10.4
7:40 12.3 8.7 13.6 5.7 13.2 13.1 15.0 17.3 14.8 16.1 8.5 10.8 8.5 8.3 12.4 9.5 13.4 8.7 8.4 9.3 12.2 12.1 15.0 18.3
7:50 12.6 12.5 15.0 10.2 15.1 15.0 16.0 19.3 16.7 17.1 12.3 15.2 15.1 12.2 13.4 12.9 17.3 12.8 15.2 17.6 13.4 13.3 16.0 20.9
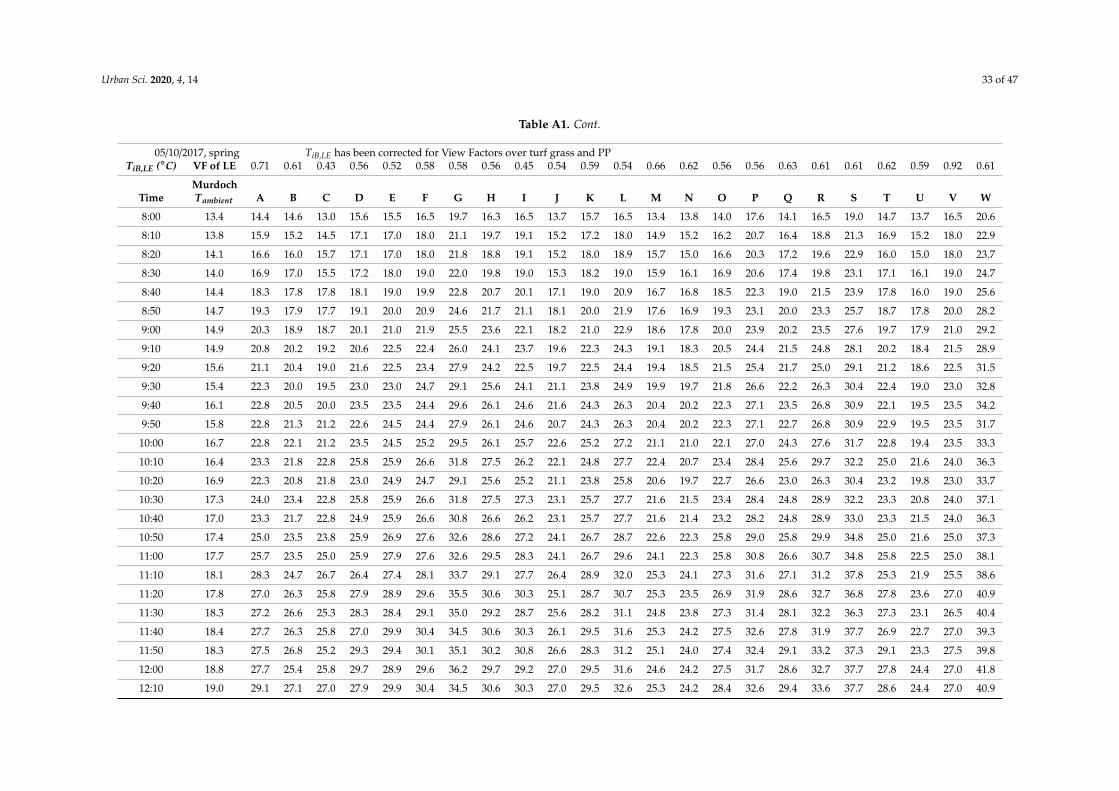
Urban Sci. 2020, 4, 14 33 of 47
Table A1. Cont.
05/10/2017, spring TiB,LE has been corrected for View Factors over turf grass and PPTiB,LE (◦C) VF of LE 0.71 0.61 0.43 0.56 0.52 0.58 0.58 0.56 0.45 0.54 0.59 0.54 0.66 0.62 0.56 0.56 0.63 0.61 0.61 0.62 0.59 0.92 0.61
TimeMurdochTambient A B C D E F G H I J K L M N O P Q R S T U V W
8:00 13.4 14.4 14.6 13.0 15.6 15.5 16.5 19.7 16.3 16.5 13.7 15.7 16.5 13.4 13.8 14.0 17.6 14.1 16.5 19.0 14.7 13.7 16.5 20.6
8:10 13.8 15.9 15.2 14.5 17.1 17.0 18.0 21.1 19.7 19.1 15.2 17.2 18.0 14.9 15.2 16.2 20.7 16.4 18.8 21.3 16.9 15.2 18.0 22.9
8:20 14.1 16.6 16.0 15.7 17.1 17.0 18.0 21.8 18.8 19.1 15.2 18.0 18.9 15.7 15.0 16.6 20.3 17.2 19.6 22.9 16.0 15.0 18.0 23.7
8:30 14.0 16.9 17.0 15.5 17.2 18.0 19.0 22.0 19.8 19.0 15.3 18.2 19.0 15.9 16.1 16.9 20.6 17.4 19.8 23.1 17.1 16.1 19.0 24.7
8:40 14.4 18.3 17.8 17.8 18.1 19.0 19.9 22.8 20.7 20.1 17.1 19.0 20.9 16.7 16.8 18.5 22.3 19.0 21.5 23.9 17.8 16.0 19.0 25.6
8:50 14.7 19.3 17.9 17.7 19.1 20.0 20.9 24.6 21.7 21.1 18.1 20.0 21.9 17.6 16.9 19.3 23.1 20.0 23.3 25.7 18.7 17.8 20.0 28.2
9:00 14.9 20.3 18.9 18.7 20.1 21.0 21.9 25.5 23.6 22.1 18.2 21.0 22.9 18.6 17.8 20.0 23.9 20.2 23.5 27.6 19.7 17.9 21.0 29.2
9:10 14.9 20.8 20.2 19.2 20.6 22.5 22.4 26.0 24.1 23.7 19.6 22.3 24.3 19.1 18.3 20.5 24.4 21.5 24.8 28.1 20.2 18.4 21.5 28.9
9:20 15.6 21.1 20.4 19.0 21.6 22.5 23.4 27.9 24.2 22.5 19.7 22.5 24.4 19.4 18.5 21.5 25.4 21.7 25.0 29.1 21.2 18.6 22.5 31.5
9:30 15.4 22.3 20.0 19.5 23.0 23.0 24.7 29.1 25.6 24.1 21.1 23.8 24.9 19.9 19.7 21.8 26.6 22.2 26.3 30.4 22.4 19.0 23.0 32.8
9:40 16.1 22.8 20.5 20.0 23.5 23.5 24.4 29.6 26.1 24.6 21.6 24.3 26.3 20.4 20.2 22.3 27.1 23.5 26.8 30.9 22.1 19.5 23.5 34.2
9:50 15.8 22.8 21.3 21.2 22.6 24.5 24.4 27.9 26.1 24.6 20.7 24.3 26.3 20.4 20.2 22.3 27.1 22.7 26.8 30.9 22.9 19.5 23.5 31.7
10:00 16.7 22.8 22.1 21.2 23.5 24.5 25.2 29.5 26.1 25.7 22.6 25.2 27.2 21.1 21.0 22.1 27.0 24.3 27.6 31.7 22.8 19.4 23.5 33.3
10:10 16.4 23.3 21.8 22.8 25.8 25.9 26.6 31.8 27.5 26.2 22.1 24.8 27.7 22.4 20.7 23.4 28.4 25.6 29.7 32.2 25.0 21.6 24.0 36.3
10:20 16.9 22.3 20.8 21.8 23.0 24.9 24.7 29.1 25.6 25.2 21.1 23.8 25.8 20.6 19.7 22.7 26.6 23.0 26.3 30.4 23.2 19.8 23.0 33.7
10:30 17.3 24.0 23.4 22.8 25.8 25.9 26.6 31.8 27.5 27.3 23.1 25.7 27.7 21.6 21.5 23.4 28.4 24.8 28.9 32.2 23.3 20.8 24.0 37.1
10:40 17.0 23.3 21.7 22.8 24.9 25.9 26.6 30.8 26.6 26.2 23.1 25.7 27.7 21.6 21.4 23.2 28.2 24.8 28.9 33.0 23.3 21.5 24.0 36.3
10:50 17.4 25.0 23.5 23.8 25.9 26.9 27.6 32.6 28.6 27.2 24.1 26.7 28.7 22.6 22.3 25.8 29.0 25.8 29.9 34.8 25.0 21.6 25.0 37.3
11:00 17.7 25.7 23.5 25.0 25.9 27.9 27.6 32.6 29.5 28.3 24.1 26.7 29.6 24.1 22.3 25.8 30.8 26.6 30.7 34.8 25.8 22.5 25.0 38.1
11:10 18.1 28.3 24.7 26.7 26.4 27.4 28.1 33.7 29.1 27.7 26.4 28.9 32.0 25.3 24.1 27.3 31.6 27.1 31.2 37.8 25.3 21.9 25.5 38.6
11:20 17.8 27.0 26.3 25.8 27.9 28.9 29.6 35.5 30.6 30.3 25.1 28.7 30.7 25.3 23.5 26.9 31.9 28.6 32.7 36.8 27.8 23.6 27.0 40.9
11:30 18.3 27.2 26.6 25.3 28.3 28.4 29.1 35.0 29.2 28.7 25.6 28.2 31.1 24.8 23.8 27.3 31.4 28.1 32.2 36.3 27.3 23.1 26.5 40.4
11:40 18.4 27.7 26.3 25.8 27.0 29.9 30.4 34.5 30.6 30.3 26.1 29.5 31.6 25.3 24.2 27.5 32.6 27.8 31.9 37.7 26.9 22.7 27.0 39.3
11:50 18.3 27.5 26.8 25.2 29.3 29.4 30.1 35.1 30.2 30.8 26.6 28.3 31.2 25.1 24.0 27.4 32.4 29.1 33.2 37.3 29.1 23.3 27.5 39.8
12:00 18.8 27.7 25.4 25.8 29.7 28.9 29.6 36.2 29.7 29.2 27.0 29.5 31.6 24.6 24.2 27.5 31.7 28.6 32.7 37.7 27.8 24.4 27.0 41.8
12:10 19.0 29.1 27.1 27.0 27.9 29.9 30.4 34.5 30.6 30.3 27.0 29.5 32.6 25.3 24.2 28.4 32.6 29.4 33.6 37.7 28.6 24.4 27.0 40.9
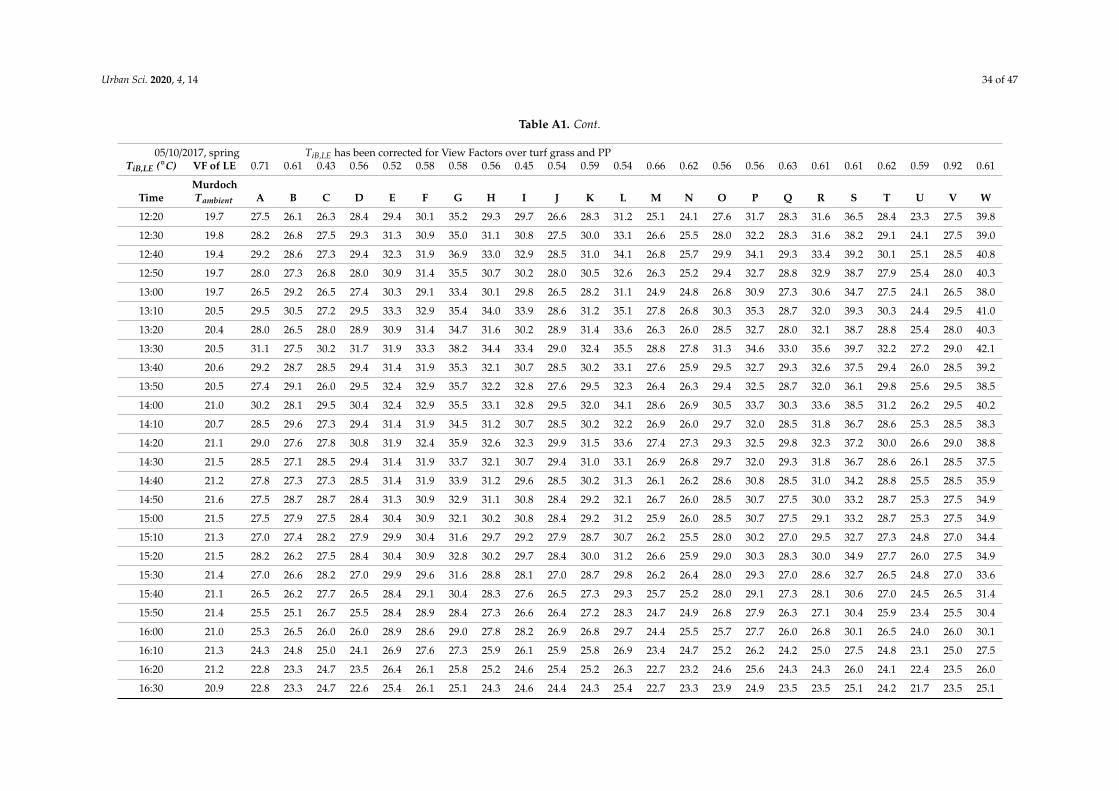
Urban Sci. 2020, 4, 14 34 of 47
Table A1. Cont.
05/10/2017, spring TiB,LE has been corrected for View Factors over turf grass and PPTiB,LE (◦C) VF of LE 0.71 0.61 0.43 0.56 0.52 0.58 0.58 0.56 0.45 0.54 0.59 0.54 0.66 0.62 0.56 0.56 0.63 0.61 0.61 0.62 0.59 0.92 0.61
TimeMurdochTambient A B C D E F G H I J K L M N O P Q R S T U V W
12:20 19.7 27.5 26.1 26.3 28.4 29.4 30.1 35.2 29.3 29.7 26.6 28.3 31.2 25.1 24.1 27.6 31.7 28.3 31.6 36.5 28.4 23.3 27.5 39.8
12:30 19.8 28.2 26.8 27.5 29.3 31.3 30.9 35.0 31.1 30.8 27.5 30.0 33.1 26.6 25.5 28.0 32.2 28.3 31.6 38.2 29.1 24.1 27.5 39.0
12:40 19.4 29.2 28.6 27.3 29.4 32.3 31.9 36.9 33.0 32.9 28.5 31.0 34.1 26.8 25.7 29.9 34.1 29.3 33.4 39.2 30.1 25.1 28.5 40.8
12:50 19.7 28.0 27.3 26.8 28.0 30.9 31.4 35.5 30.7 30.2 28.0 30.5 32.6 26.3 25.2 29.4 32.7 28.8 32.9 38.7 27.9 25.4 28.0 40.3
13:00 19.7 26.5 29.2 26.5 27.4 30.3 29.1 33.4 30.1 29.8 26.5 28.2 31.1 24.9 24.8 26.8 30.9 27.3 30.6 34.7 27.5 24.1 26.5 38.0
13:10 20.5 29.5 30.5 27.2 29.5 33.3 32.9 35.4 34.0 33.9 28.6 31.2 35.1 27.8 26.8 30.3 35.3 28.7 32.0 39.3 30.3 24.4 29.5 41.0
13:20 20.4 28.0 26.5 28.0 28.9 30.9 31.4 34.7 31.6 30.2 28.9 31.4 33.6 26.3 26.0 28.5 32.7 28.0 32.1 38.7 28.8 25.4 28.0 40.3
13:30 20.5 31.1 27.5 30.2 31.7 31.9 33.3 38.2 34.4 33.4 29.0 32.4 35.5 28.8 27.8 31.3 34.6 33.0 35.6 39.7 32.2 27.2 29.0 42.1
13:40 20.6 29.2 28.7 28.5 29.4 31.4 31.9 35.3 32.1 30.7 28.5 30.2 33.1 27.6 25.9 29.5 32.7 29.3 32.6 37.5 29.4 26.0 28.5 39.2
13:50 20.5 27.4 29.1 26.0 29.5 32.4 32.9 35.7 32.2 32.8 27.6 29.5 32.3 26.4 26.3 29.4 32.5 28.7 32.0 36.1 29.8 25.6 29.5 38.5
14:00 21.0 30.2 28.1 29.5 30.4 32.4 32.9 35.5 33.1 32.8 29.5 32.0 34.1 28.6 26.9 30.5 33.7 30.3 33.6 38.5 31.2 26.2 29.5 40.2
14:10 20.7 28.5 29.6 27.3 29.4 31.4 31.9 34.5 31.2 30.7 28.5 30.2 32.2 26.9 26.0 29.7 32.0 28.5 31.8 36.7 28.6 25.3 28.5 38.3
14:20 21.1 29.0 27.6 27.8 30.8 31.9 32.4 35.9 32.6 32.3 29.9 31.5 33.6 27.4 27.3 29.3 32.5 29.8 32.3 37.2 30.0 26.6 29.0 38.8
14:30 21.5 28.5 27.1 28.5 29.4 31.4 31.9 33.7 32.1 30.7 29.4 31.0 33.1 26.9 26.8 29.7 32.0 29.3 31.8 36.7 28.6 26.1 28.5 37.5
14:40 21.2 27.8 27.3 27.3 28.5 31.4 31.9 33.9 31.2 29.6 28.5 30.2 31.3 26.1 26.2 28.6 30.8 28.5 31.0 34.2 28.8 25.5 28.5 35.9
14:50 21.6 27.5 28.7 28.7 28.4 31.3 30.9 32.9 31.1 30.8 28.4 29.2 32.1 26.7 26.0 28.5 30.7 27.5 30.0 33.2 28.7 25.3 27.5 34.9
15:00 21.5 27.5 27.9 27.5 28.4 30.4 30.9 32.1 30.2 30.8 28.4 29.2 31.2 25.9 26.0 28.5 30.7 27.5 29.1 33.2 28.7 25.3 27.5 34.9
15:10 21.3 27.0 27.4 28.2 27.9 29.9 30.4 31.6 29.7 29.2 27.9 28.7 30.7 26.2 25.5 28.0 30.2 27.0 29.5 32.7 27.3 24.8 27.0 34.4
15:20 21.5 28.2 26.2 27.5 28.4 30.4 30.9 32.8 30.2 29.7 28.4 30.0 31.2 26.6 25.9 29.0 30.3 28.3 30.0 34.9 27.7 26.0 27.5 34.9
15:30 21.4 27.0 26.6 28.2 27.0 29.9 29.6 31.6 28.8 28.1 27.0 28.7 29.8 26.2 26.4 28.0 29.3 27.0 28.6 32.7 26.5 24.8 27.0 33.6
15:40 21.1 26.5 26.2 27.7 26.5 28.4 29.1 30.4 28.3 27.6 26.5 27.3 29.3 25.7 25.2 28.0 29.1 27.3 28.1 30.6 27.0 24.5 26.5 31.4
15:50 21.4 25.5 25.1 26.7 25.5 28.4 28.9 28.4 27.3 26.6 26.4 27.2 28.3 24.7 24.9 26.8 27.9 26.3 27.1 30.4 25.9 23.4 25.5 30.4
16:00 21.0 25.3 26.5 26.0 26.0 28.9 28.6 29.0 27.8 28.2 26.9 26.8 29.7 24.4 25.5 25.7 27.7 26.0 26.8 30.1 26.5 24.0 26.0 30.1
16:10 21.3 24.3 24.8 25.0 24.1 26.9 27.6 27.3 25.9 26.1 25.9 25.8 26.9 23.4 24.7 25.2 26.2 24.2 25.0 27.5 24.8 23.1 25.0 27.5
16:20 21.2 22.8 23.3 24.7 23.5 26.4 26.1 25.8 25.2 24.6 25.4 25.2 26.3 22.7 23.2 24.6 25.6 24.3 24.3 26.0 24.1 22.4 23.5 26.0
16:30 20.9 22.8 23.3 24.7 22.6 25.4 26.1 25.1 24.3 24.6 24.4 24.3 25.4 22.7 23.3 23.9 24.9 23.5 23.5 25.1 24.2 21.7 23.5 25.1
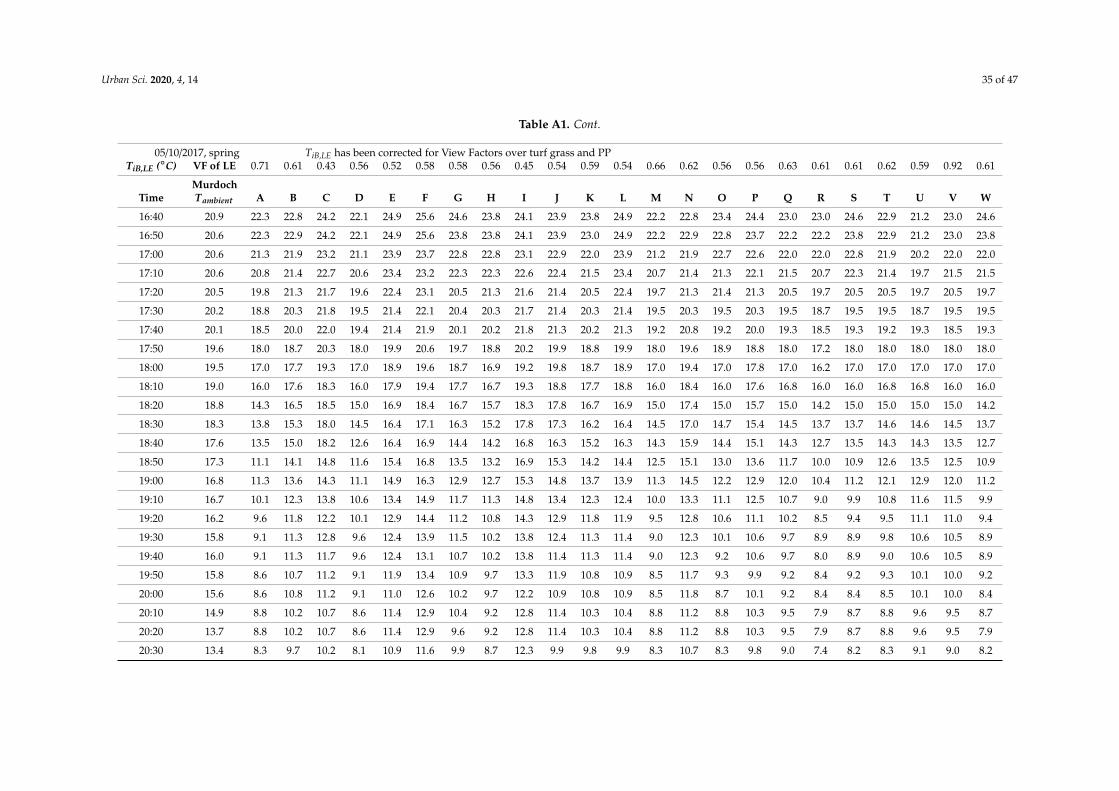
Urban Sci. 2020, 4, 14 35 of 47
Table A1. Cont.
05/10/2017, spring TiB,LE has been corrected for View Factors over turf grass and PPTiB,LE (◦C) VF of LE 0.71 0.61 0.43 0.56 0.52 0.58 0.58 0.56 0.45 0.54 0.59 0.54 0.66 0.62 0.56 0.56 0.63 0.61 0.61 0.62 0.59 0.92 0.61
TimeMurdochTambient A B C D E F G H I J K L M N O P Q R S T U V W
16:40 20.9 22.3 22.8 24.2 22.1 24.9 25.6 24.6 23.8 24.1 23.9 23.8 24.9 22.2 22.8 23.4 24.4 23.0 23.0 24.6 22.9 21.2 23.0 24.6
16:50 20.6 22.3 22.9 24.2 22.1 24.9 25.6 23.8 23.8 24.1 23.9 23.0 24.9 22.2 22.9 22.8 23.7 22.2 22.2 23.8 22.9 21.2 23.0 23.8
17:00 20.6 21.3 21.9 23.2 21.1 23.9 23.7 22.8 22.8 23.1 22.9 22.0 23.9 21.2 21.9 22.7 22.6 22.0 22.0 22.8 21.9 20.2 22.0 22.0
17:10 20.6 20.8 21.4 22.7 20.6 23.4 23.2 22.3 22.3 22.6 22.4 21.5 23.4 20.7 21.4 21.3 22.1 21.5 20.7 22.3 21.4 19.7 21.5 21.5
17:20 20.5 19.8 21.3 21.7 19.6 22.4 23.1 20.5 21.3 21.6 21.4 20.5 22.4 19.7 21.3 21.4 21.3 20.5 19.7 20.5 20.5 19.7 20.5 19.7
17:30 20.2 18.8 20.3 21.8 19.5 21.4 22.1 20.4 20.3 21.7 21.4 20.3 21.4 19.5 20.3 19.5 20.3 19.5 18.7 19.5 19.5 18.7 19.5 19.5
17:40 20.1 18.5 20.0 22.0 19.4 21.4 21.9 20.1 20.2 21.8 21.3 20.2 21.3 19.2 20.8 19.2 20.0 19.3 18.5 19.3 19.2 19.3 18.5 19.3
17:50 19.6 18.0 18.7 20.3 18.0 19.9 20.6 19.7 18.8 20.2 19.9 18.8 19.9 18.0 19.6 18.9 18.8 18.0 17.2 18.0 18.0 18.0 18.0 18.0
18:00 19.5 17.0 17.7 19.3 17.0 18.9 19.6 18.7 16.9 19.2 19.8 18.7 18.9 17.0 19.4 17.0 17.8 17.0 16.2 17.0 17.0 17.0 17.0 17.0
18:10 19.0 16.0 17.6 18.3 16.0 17.9 19.4 17.7 16.7 19.3 18.8 17.7 18.8 16.0 18.4 16.0 17.6 16.8 16.0 16.0 16.8 16.8 16.0 16.0
18:20 18.8 14.3 16.5 18.5 15.0 16.9 18.4 16.7 15.7 18.3 17.8 16.7 16.9 15.0 17.4 15.0 15.7 15.0 14.2 15.0 15.0 15.0 15.0 14.2
18:30 18.3 13.8 15.3 18.0 14.5 16.4 17.1 16.3 15.2 17.8 17.3 16.2 16.4 14.5 17.0 14.7 15.4 14.5 13.7 13.7 14.6 14.6 14.5 13.7
18:40 17.6 13.5 15.0 18.2 12.6 16.4 16.9 14.4 14.2 16.8 16.3 15.2 16.3 14.3 15.9 14.4 15.1 14.3 12.7 13.5 14.3 14.3 13.5 12.7
18:50 17.3 11.1 14.1 14.8 11.6 15.4 16.8 13.5 13.2 16.9 15.3 14.2 14.4 12.5 15.1 13.0 13.6 11.7 10.0 10.9 12.6 13.5 12.5 10.9
19:00 16.8 11.3 13.6 14.3 11.1 14.9 16.3 12.9 12.7 15.3 14.8 13.7 13.9 11.3 14.5 12.2 12.9 12.0 10.4 11.2 12.1 12.9 12.0 11.2
19:10 16.7 10.1 12.3 13.8 10.6 13.4 14.9 11.7 11.3 14.8 13.4 12.3 12.4 10.0 13.3 11.1 12.5 10.7 9.0 9.9 10.8 11.6 11.5 9.9
19:20 16.2 9.6 11.8 12.2 10.1 12.9 14.4 11.2 10.8 14.3 12.9 11.8 11.9 9.5 12.8 10.6 11.1 10.2 8.5 9.4 9.5 11.1 11.0 9.4
19:30 15.8 9.1 11.3 12.8 9.6 12.4 13.9 11.5 10.2 13.8 12.4 11.3 11.4 9.0 12.3 10.1 10.6 9.7 8.9 8.9 9.8 10.6 10.5 8.9
19:40 16.0 9.1 11.3 11.7 9.6 12.4 13.1 10.7 10.2 13.8 11.4 11.3 11.4 9.0 12.3 9.2 10.6 9.7 8.0 8.9 9.0 10.6 10.5 8.9
19:50 15.8 8.6 10.7 11.2 9.1 11.9 13.4 10.9 9.7 13.3 11.9 10.8 10.9 8.5 11.7 9.3 9.9 9.2 8.4 9.2 9.3 10.1 10.0 9.2
20:00 15.6 8.6 10.8 11.2 9.1 11.0 12.6 10.2 9.7 12.2 10.9 10.8 10.9 8.5 11.8 8.7 10.1 9.2 8.4 8.4 8.5 10.1 10.0 8.4
20:10 14.9 8.8 10.2 10.7 8.6 11.4 12.9 10.4 9.2 12.8 11.4 10.3 10.4 8.8 11.2 8.8 10.3 9.5 7.9 8.7 8.8 9.6 9.5 8.7
20:20 13.7 8.8 10.2 10.7 8.6 11.4 12.9 9.6 9.2 12.8 11.4 10.3 10.4 8.8 11.2 8.8 10.3 9.5 7.9 8.7 8.8 9.6 9.5 7.9
20:30 13.4 8.3 9.7 10.2 8.1 10.9 11.6 9.9 8.7 12.3 9.9 9.8 9.9 8.3 10.7 8.3 9.8 9.0 7.4 8.2 8.3 9.1 9.0 8.2
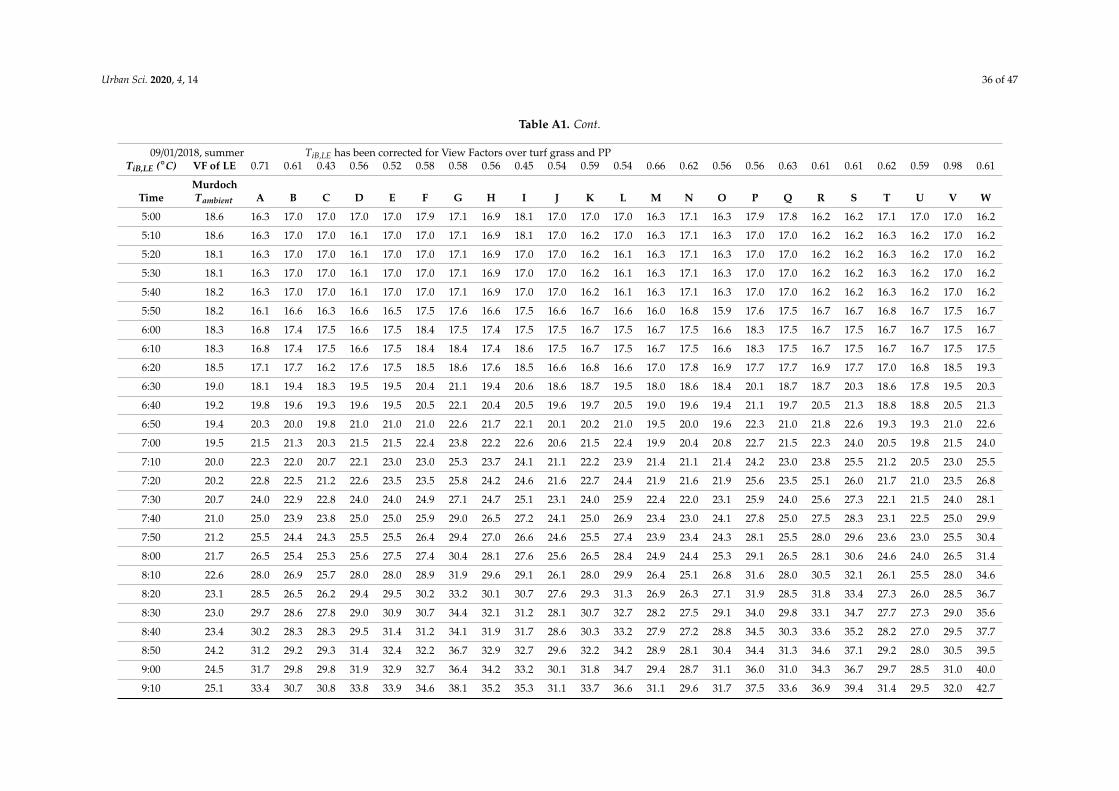
Urban Sci. 2020, 4, 14 36 of 47
Table A1. Cont.
09/01/2018, summer TiB,LE has been corrected for View Factors over turf grass and PPTiB,LE (◦C) VF of LE 0.71 0.61 0.43 0.56 0.52 0.58 0.58 0.56 0.45 0.54 0.59 0.54 0.66 0.62 0.56 0.56 0.63 0.61 0.61 0.62 0.59 0.98 0.61
TimeMurdochTambient A B C D E F G H I J K L M N O P Q R S T U V W
5:00 18.6 16.3 17.0 17.0 17.0 17.0 17.9 17.1 16.9 18.1 17.0 17.0 17.0 16.3 17.1 16.3 17.9 17.8 16.2 16.2 17.1 17.0 17.0 16.2
5:10 18.6 16.3 17.0 17.0 16.1 17.0 17.0 17.1 16.9 18.1 17.0 16.2 17.0 16.3 17.1 16.3 17.0 17.0 16.2 16.2 16.3 16.2 17.0 16.2
5:20 18.1 16.3 17.0 17.0 16.1 17.0 17.0 17.1 16.9 17.0 17.0 16.2 16.1 16.3 17.1 16.3 17.0 17.0 16.2 16.2 16.3 16.2 17.0 16.2
5:30 18.1 16.3 17.0 17.0 16.1 17.0 17.0 17.1 16.9 17.0 17.0 16.2 16.1 16.3 17.1 16.3 17.0 17.0 16.2 16.2 16.3 16.2 17.0 16.2
5:40 18.2 16.3 17.0 17.0 16.1 17.0 17.0 17.1 16.9 17.0 17.0 16.2 16.1 16.3 17.1 16.3 17.0 17.0 16.2 16.2 16.3 16.2 17.0 16.2
5:50 18.2 16.1 16.6 16.3 16.6 16.5 17.5 17.6 16.6 17.5 16.6 16.7 16.6 16.0 16.8 15.9 17.6 17.5 16.7 16.7 16.8 16.7 17.5 16.7
6:00 18.3 16.8 17.4 17.5 16.6 17.5 18.4 17.5 17.4 17.5 17.5 16.7 17.5 16.7 17.5 16.6 18.3 17.5 16.7 17.5 16.7 16.7 17.5 16.7
6:10 18.3 16.8 17.4 17.5 16.6 17.5 18.4 18.4 17.4 18.6 17.5 16.7 17.5 16.7 17.5 16.6 18.3 17.5 16.7 17.5 16.7 16.7 17.5 17.5
6:20 18.5 17.1 17.7 16.2 17.6 17.5 18.5 18.6 17.6 18.5 16.6 16.8 16.6 17.0 17.8 16.9 17.7 17.7 16.9 17.7 17.0 16.8 18.5 19.3
6:30 19.0 18.1 19.4 18.3 19.5 19.5 20.4 21.1 19.4 20.6 18.6 18.7 19.5 18.0 18.6 18.4 20.1 18.7 18.7 20.3 18.6 17.8 19.5 20.3
6:40 19.2 19.8 19.6 19.3 19.6 19.5 20.5 22.1 20.4 20.5 19.6 19.7 20.5 19.0 19.6 19.4 21.1 19.7 20.5 21.3 18.8 18.8 20.5 21.3
6:50 19.4 20.3 20.0 19.8 21.0 21.0 21.0 22.6 21.7 22.1 20.1 20.2 21.0 19.5 20.0 19.6 22.3 21.0 21.8 22.6 19.3 19.3 21.0 22.6
7:00 19.5 21.5 21.3 20.3 21.5 21.5 22.4 23.8 22.2 22.6 20.6 21.5 22.4 19.9 20.4 20.8 22.7 21.5 22.3 24.0 20.5 19.8 21.5 24.0
7:10 20.0 22.3 22.0 20.7 22.1 23.0 23.0 25.3 23.7 24.1 21.1 22.2 23.9 21.4 21.1 21.4 24.2 23.0 23.8 25.5 21.2 20.5 23.0 25.5
7:20 20.2 22.8 22.5 21.2 22.6 23.5 23.5 25.8 24.2 24.6 21.6 22.7 24.4 21.9 21.6 21.9 25.6 23.5 25.1 26.0 21.7 21.0 23.5 26.8
7:30 20.7 24.0 22.9 22.8 24.0 24.0 24.9 27.1 24.7 25.1 23.1 24.0 25.9 22.4 22.0 23.1 25.9 24.0 25.6 27.3 22.1 21.5 24.0 28.1
7:40 21.0 25.0 23.9 23.8 25.0 25.0 25.9 29.0 26.5 27.2 24.1 25.0 26.9 23.4 23.0 24.1 27.8 25.0 27.5 28.3 23.1 22.5 25.0 29.9
7:50 21.2 25.5 24.4 24.3 25.5 25.5 26.4 29.4 27.0 26.6 24.6 25.5 27.4 23.9 23.4 24.3 28.1 25.5 28.0 29.6 23.6 23.0 25.5 30.4
8:00 21.7 26.5 25.4 25.3 25.6 27.5 27.4 30.4 28.1 27.6 25.6 26.5 28.4 24.9 24.4 25.3 29.1 26.5 28.1 30.6 24.6 24.0 26.5 31.4
8:10 22.6 28.0 26.9 25.7 28.0 28.0 28.9 31.9 29.6 29.1 26.1 28.0 29.9 26.4 25.1 26.8 31.6 28.0 30.5 32.1 26.1 25.5 28.0 34.6
8:20 23.1 28.5 26.5 26.2 29.4 29.5 30.2 33.2 30.1 30.7 27.6 29.3 31.3 26.9 26.3 27.1 31.9 28.5 31.8 33.4 27.3 26.0 28.5 36.7
8:30 23.0 29.7 28.6 27.8 29.0 30.9 30.7 34.4 32.1 31.2 28.1 30.7 32.7 28.2 27.5 29.1 34.0 29.8 33.1 34.7 27.7 27.3 29.0 35.6
8:40 23.4 30.2 28.3 28.3 29.5 31.4 31.2 34.1 31.9 31.7 28.6 30.3 33.2 27.9 27.2 28.8 34.5 30.3 33.6 35.2 28.2 27.0 29.5 37.7
8:50 24.2 31.2 29.2 29.3 31.4 32.4 32.2 36.7 32.9 32.7 29.6 32.2 34.2 28.9 28.1 30.4 34.4 31.3 34.6 37.1 29.2 28.0 30.5 39.5
9:00 24.5 31.7 29.8 29.8 31.9 32.9 32.7 36.4 34.2 33.2 30.1 31.8 34.7 29.4 28.7 31.1 36.0 31.0 34.3 36.7 29.7 28.5 31.0 40.0
9:10 25.1 33.4 30.7 30.8 33.8 33.9 34.6 38.1 35.2 35.3 31.1 33.7 36.6 31.1 29.6 31.7 37.5 33.6 36.9 39.4 31.4 29.5 32.0 42.7

Urban Sci. 2020, 4, 14 37 of 47
Table A1. Cont.
09/01/2018, summer TiB,LE has been corrected for View Factors over turf grass and PPTiB,LE (◦C) VF of LE 0.71 0.61 0.43 0.56 0.52 0.58 0.58 0.56 0.45 0.54 0.59 0.54 0.66 0.62 0.56 0.56 0.63 0.61 0.61 0.62 0.59 0.98 0.61
TimeMurdochTambient A B C D E F G H I J K L M N O P Q R S T U V W
9:20 25.1 33.2 30.4 30.2 33.4 34.4 34.2 40.4 34.9 35.8 31.6 33.3 36.2 30.1 30.1 31.5 36.4 32.5 36.6 39.1 31.2 30.0 32.5 42.3
9:30 25.6 34.9 32.2 32.3 34.4 35.4 35.2 40.5 36.7 35.7 32.6 35.2 38.1 31.9 31.1 33.2 38.2 34.3 37.6 40.9 32.1 31.0 33.5 43.3
9:40 26.4 34.2 33.0 31.2 35.3 35.4 35.2 41.4 36.7 36.8 32.6 36.0 38.1 31.9 31.1 33.2 39.1 34.3 38.4 40.9 32.1 31.0 33.5 45.0
9:50 26.6 36.4 33.7 32.7 36.8 36.9 36.7 42.0 38.2 38.3 34.1 37.5 39.6 33.4 31.7 34.7 40.6 35.8 39.9 42.4 33.6 32.5 35.0 48.1
10:00 27.8 36.4 34.5 33.8 37.7 37.9 37.6 43.6 39.8 38.3 35.0 37.5 40.6 33.4 33.3 35.3 41.3 35.8 40.7 43.2 34.3 33.3 35.0 48.9
10:10 27.9 38.1 36.2 36.0 39.6 38.9 38.6 45.4 40.8 40.4 36.0 39.4 41.6 35.1 34.2 37.0 43.0 36.8 41.7 45.0 36.1 34.3 36.0 49.9
10:20 28.5 38.1 36.2 36.0 38.7 38.9 38.6 45.4 40.8 40.4 36.9 39.4 41.6 35.1 34.2 37.0 43.0 37.6 41.7 45.0 36.1 34.3 36.0 50.8
10:30 28.5 38.8 34.6 37.2 36.9 39.8 39.4 45.4 40.0 39.3 36.9 39.4 41.6 35.9 34.2 37.9 42.1 37.6 41.7 45.0 36.1 34.3 36.0 47.5
10:40 28.5 38.6 35.9 36.5 39.2 40.3 39.9 45.9 40.5 40.9 37.4 40.7 42.1 35.6 34.7 37.5 43.5 38.1 43.1 45.5 36.6 34.8 36.5 50.4
10:50 29.9 40.1 39.0 36.8 42.5 41.8 41.4 49.9 42.0 42.4 38.9 42.2 43.6 37.1 36.9 38.8 44.8 38.8 44.6 47.8 37.2 36.3 38.0 52.8
11:00 29.9 40.6 37.9 37.3 41.2 42.3 41.1 49.6 42.5 42.9 39.4 42.7 44.1 36.8 36.6 39.3 44.4 39.3 44.2 48.3 38.5 36.8 38.5 52.4
11:10 29.9 41.3 38.6 37.3 42.1 42.3 41.9 49.5 44.1 42.9 39.4 43.6 45.0 37.6 37.3 39.9 46.0 40.1 45.1 49.2 39.3 36.8 38.5 53.3
11:20 30.9 43.5 40.1 38.8 45.4 43.8 43.4 51.7 44.8 45.6 41.9 45.1 47.4 39.1 38.7 41.2 47.3 42.4 47.4 51.5 41.5 39.2 40.0 57.2
11:30 30.8 43.3 40.6 39.3 45.0 44.3 44.8 52.2 46.1 46.1 42.4 45.6 47.9 39.6 39.2 42.6 47.8 42.1 47.1 52.0 42.8 39.7 40.5 56.9
11:40 31.5 42.3 41.3 39.5 45.8 43.3 43.8 51.3 45.1 45.1 41.4 45.4 46.9 39.3 39.1 41.8 47.9 41.9 46.1 50.2 41.1 38.7 39.5 56.7
11:50 31.2 41.6 39.6 39.5 44.0 43.3 44.7 51.3 42.7 45.1 41.4 45.4 46.9 38.6 38.3 40.9 45.2 40.3 45.2 50.2 41.1 38.7 39.5 55.9
12:00 32.4 42.1 40.9 40.0 44.5 45.8 44.3 52.6 44.8 45.6 42.8 45.9 47.4 39.1 39.5 41.2 46.4 41.6 46.6 51.5 40.7 39.2 40.0 55.6
12:10 31.9 44.3 42.4 41.5 46.9 46.3 45.8 54.1 46.3 47.1 43.4 46.6 48.9 40.6 41.0 43.6 49.7 43.1 48.9 53.0 43.0 40.7 41.5 58.7
12:20 32.9 44.1 43.7 42.0 47.4 45.8 45.4 54.6 46.8 47.6 42.9 47.1 49.4 41.1 41.5 43.2 49.3 43.6 48.6 53.5 42.7 40.3 42.0 58.4
12:30 33.7 43.2 43.5 40.2 46.1 46.3 45.1 55.3 45.7 46.9 42.5 46.7 47.1 39.3 41.4 42.4 47.5 41.7 47.4 52.3 41.7 40.0 42.5 57.3
12:40 32.7 43.6 43.3 41.5 46.9 46.3 45.8 54.3 47.1 47.1 43.4 47.4 48.9 40.6 41.2 43.2 50.1 43.1 48.1 51.3 42.3 40.7 41.5 58.7
12:50 33.4 43.6 43.3 41.5 46.9 45.3 45.8 55.1 46.3 48.2 43.4 46.6 48.9 40.6 42.0 43.2 49.2 43.1 48.1 51.3 41.5 40.7 41.5 57.9
13:00 34.2 42.9 44.2 40.3 46.9 46.3 45.8 54.3 47.1 47.1 44.3 47.4 48.9 39.8 42.0 42.3 49.2 41.5 47.2 51.3 41.5 40.7 41.5 57.9
13:10 34.3 42.9 42.5 40.3 46.0 46.3 45.8 53.4 46.3 47.1 43.4 47.4 48.9 39.8 41.2 42.3 48.3 42.3 47.2 51.3 41.5 40.7 41.5 57.9
13:20 35.0 43.2 43.6 41.3 46.1 46.3 45.9 54.6 46.5 48.1 43.4 46.7 48.1 40.1 42.4 42.8 47.9 42.5 46.6 50.7 41.8 40.8 42.5 56.4
13:30 35.0 42.9 43.3 41.5 44.2 46.3 45.8 52.5 47.1 45.9 44.3 47.4 49.8 39.8 42.7 42.9 49.0 42.3 47.2 52.2 41.4 41.5 41.5 54.6

Urban Sci. 2020, 4, 14 38 of 47
Table A1. Cont.
09/01/2018, summer TiB,LE has been corrected for View Factors over turf grass and PPTiB,LE (◦C) VF of LE 0.71 0.61 0.43 0.56 0.52 0.58 0.58 0.56 0.45 0.54 0.59 0.54 0.66 0.62 0.56 0.56 0.63 0.61 0.61 0.62 0.59 0.98 0.61
TimeMurdochTambient A B C D E F G H I J K L M N O P Q R S T U V W
13:40 33.3 39.0 37.5 39.0 39.9 42.8 42.4 48.2 41.4 43.4 39.9 43.2 45.5 36.6 39.4 37.7 42.9 38.2 43.1 49.7 36.5 37.3 39.0 49.7
13:50 33.0 38.3 39.2 37.8 39.9 42.8 42.4 48.3 42.2 43.4 39.9 42.4 45.5 36.6 39.5 37.1 43.1 37.4 42.3 48.8 36.6 37.3 39.0 49.7
14:00 33.7 39.7 37.4 40.2 40.8 42.8 42.4 49.0 41.4 43.4 41.8 44.1 46.4 38.1 40.1 39.3 43.6 39.0 43.9 50.5 37.3 38.2 39.0 50.5
14:10 32.9 39.9 38.5 39.7 40.3 42.3 41.9 47.6 42.5 42.9 40.4 42.7 46.8 37.6 39.5 38.6 43.8 38.5 44.2 50.8 36.7 37.7 38.5 50.0
14:20 31.5 38.2 36.9 38.7 38.4 41.3 40.9 46.8 40.7 40.8 38.4 40.9 44.0 35.8 38.0 37.4 43.4 37.5 41.6 47.3 35.9 36.7 37.5 47.3
14:30 31.5 35.6 35.6 34.7 37.0 38.9 39.6 43.8 38.6 40.3 37.0 39.5 42.6 33.8 36.8 34.4 40.4 34.6 39.5 46.0 33.9 34.5 37.0 46.0
14:40 30.5 35.8 35.0 36.5 37.4 39.4 39.9 44.1 38.9 39.8 37.4 39.9 43.0 34.1 36.2 35.5 40.6 35.7 39.8 46.3 34.1 34.8 36.5 45.5
14:50 29.8 38.0 35.8 36.8 38.0 41.8 41.4 46.6 40.4 40.2 38.9 41.4 43.6 34.8 37.9 36.6 41.6 37.2 41.3 46.2 35.7 36.3 38.0 47.0
15:00 30.5 36.0 34.6 36.0 36.9 38.9 39.4 43.7 38.4 39.3 36.9 39.4 42.5 33.6 36.6 35.2 39.4 35.2 39.3 45.0 33.7 35.2 36.0 45.0
15:10 30.8 37.0 36.5 37.0 37.0 39.9 40.4 44.8 41.0 39.2 37.9 40.4 42.6 34.6 36.9 36.4 41.5 37.0 41.1 45.2 35.5 36.2 37.0 45.2
15:20 30.8 35.5 35.0 36.7 36.4 38.4 38.9 43.3 37.9 38.8 37.4 38.9 42.0 33.9 36.2 34.9 39.1 35.5 38.8 43.7 34.0 34.7 35.5 44.5
15:30 30.8 36.5 36.0 36.5 36.5 38.4 39.1 43.5 38.9 39.8 37.4 39.0 42.1 34.1 36.5 35.3 40.3 35.7 39.8 43.9 34.3 34.8 36.5 44.7
15:40 30.7 35.3 33.9 34.8 36.0 38.9 38.6 43.1 36.8 38.2 36.9 38.5 40.6 33.6 36.1 35.0 37.3 34.4 38.5 42.6 33.9 34.3 36.0 43.4
15:50 29.8 33.8 33.3 34.5 33.6 36.4 37.1 40.8 35.3 36.7 35.4 37.0 39.1 32.1 34.7 33.8 36.9 33.7 37.0 40.2 32.4 32.8 34.5 40.2
16:00 29.0 34.3 34.6 33.8 34.1 37.9 37.6 41.3 38.2 37.2 35.9 37.5 38.7 32.6 35.2 33.4 38.3 33.4 36.6 40.7 32.9 33.3 35.0 40.7
16:10 29.0 32.8 33.1 34.7 32.6 36.4 36.1 39.8 35.9 35.7 35.4 36.0 38.1 31.9 33.7 32.8 36.7 32.7 36.0 39.2 32.2 32.7 33.5 39.2
16:20 28.5 32.6 32.9 32.8 33.1 35.9 36.6 40.5 35.6 36.2 34.9 35.7 36.8 30.9 33.5 32.8 36.7 32.4 35.6 38.1 32.1 32.3 34.0 38.9
16:30 28.8 31.3 30.8 32.0 31.1 33.9 34.6 36.7 33.6 34.2 32.9 33.7 35.7 29.7 32.3 30.6 34.5 31.2 33.6 36.9 30.0 30.3 32.0 36.9
16:40 27.7 31.3 30.9 32.0 31.1 33.9 34.6 36.7 33.6 34.2 32.9 33.7 35.7 29.7 32.3 31.7 34.7 31.2 33.6 36.1 30.9 31.2 32.0 36.9
16:50 27.3 31.3 30.1 32.0 31.1 33.9 34.6 36.7 32.8 34.2 32.9 33.7 34.8 29.7 31.5 30.8 33.8 31.2 33.6 36.1 30.1 30.3 32.0 36.1
17:00 27.2 30.3 29.9 31.0 30.1 32.9 32.7 34.9 32.6 33.2 31.9 32.7 33.8 29.4 31.3 30.7 33.7 30.2 32.6 35.1 29.9 30.2 31.0 34.3
17:10 26.7 29.8 28.6 31.7 28.7 32.4 32.2 33.5 31.3 31.6 31.4 32.2 33.3 28.9 30.0 30.2 32.3 30.5 32.1 34.6 29.4 29.7 30.5 33.0
17:20 26.6 29.3 29.8 30.0 29.1 31.9 31.7 34.1 30.8 32.2 30.9 30.8 31.9 27.7 30.5 29.3 31.3 29.2 30.8 32.5 28.2 28.3 30.0 33.3
17:30 26.8 29.3 28.9 31.2 29.1 31.0 31.7 32.2 30.8 31.1 30.9 30.8 32.8 28.4 29.6 29.1 32.0 30.0 31.6 33.3 28.9 29.2 30.0 32.5
17:40 26.3 28.8 28.5 30.7 28.6 31.4 31.2 32.7 30.3 30.6 30.4 30.3 32.3 27.9 30.0 28.8 30.8 29.5 30.3 32.0 28.5 28.7 29.5 32.0
17:50 26.4 28.3 28.8 30.2 28.1 30.0 30.7 31.3 29.8 30.1 29.9 29.8 30.9 27.4 28.7 28.3 30.3 29.0 29.8 31.5 28.0 28.2 29.0 30.6

Urban Sci. 2020, 4, 14 39 of 47
Table A1. Cont.
09/01/2018, summer TiB,LE has been corrected for View Factors over turf grass and PPTiB,LE (◦C) VF of LE 0.71 0.61 0.43 0.56 0.52 0.58 0.58 0.56 0.45 0.54 0.59 0.54 0.66 0.62 0.56 0.56 0.63 0.61 0.61 0.62 0.59 0.98 0.61
TimeMurdochTambient A B C D E F G H I J K L M N O P Q R S T U V W
18:00 26.0 27.8 27.5 29.7 26.7 29.5 30.2 30.1 29.3 28.5 29.4 29.3 30.4 27.0 28.3 28.0 29.9 28.5 29.3 30.1 27.6 27.7 28.5 29.3
18:10 25.8 27.0 26.9 28.2 26.1 28.9 28.7 29.4 27.8 28.1 28.9 27.8 28.9 26.2 27.6 26.5 28.4 27.8 27.8 28.6 26.9 27.0 27.0 27.8
18:20 25.5 25.8 25.6 27.7 25.6 27.5 27.4 28.1 26.5 26.5 27.4 26.5 27.4 25.7 26.4 26.3 27.2 26.5 26.5 27.3 25.6 25.7 26.5 26.5
18:30 25.4 25.3 26.0 27.2 25.1 27.0 27.7 27.7 26.0 27.1 26.9 25.2 26.9 25.2 26.0 25.1 26.9 26.0 26.0 26.0 25.2 25.2 26.0 26.0
18:40 25.3 24.8 25.4 26.7 25.5 26.5 27.2 27.1 26.3 26.6 26.4 25.5 26.4 24.7 26.2 25.3 26.2 26.3 25.5 26.3 25.4 25.5 25.5 26.3
18:50 25.5 24.8 25.5 26.7 24.6 26.5 27.2 26.4 25.5 26.6 26.4 25.5 25.5 24.7 25.5 24.6 25.5 25.5 24.7 25.5 24.7 24.7 25.5 25.5
19:00 25.7 23.8 25.3 25.7 24.5 25.5 26.2 25.4 25.2 25.6 25.4 25.3 25.4 23.7 25.3 24.5 25.4 24.5 23.7 24.5 24.5 24.5 24.5 24.5
19:10 25.0 23.3 24.8 25.2 24.0 25.0 25.7 24.9 24.0 25.1 24.9 24.0 24.9 23.3 24.9 24.2 25.1 24.0 23.2 23.2 24.1 24.0 24.0 23.2
19:20 24.9 22.8 24.3 24.7 23.5 24.5 25.2 24.4 23.4 24.6 25.4 24.3 24.4 23.5 24.3 23.5 24.4 24.3 22.7 23.5 23.5 23.5 23.5 22.7
19:30 24.7 22.8 23.5 24.7 22.6 23.5 24.4 23.6 23.4 24.6 24.4 23.5 23.5 22.8 23.6 22.8 23.7 23.5 22.7 22.7 23.6 22.7 23.5 22.7
19:40 24.9 22.8 24.3 24.7 23.5 24.5 25.2 24.4 23.4 24.6 24.4 23.5 24.4 22.8 24.4 22.8 24.6 23.5 22.7 22.7 23.6 23.5 23.5 22.7
19:50 24.7 22.8 24.3 24.7 23.5 23.5 24.4 23.6 23.4 24.6 24.4 23.5 23.5 22.8 23.6 22.8 23.7 24.3 22.7 22.7 23.6 23.5 23.5 22.7
20:00 24.6 23.5 24.3 24.7 23.5 24.5 25.2 23.5 23.4 24.6 24.4 23.5 24.4 23.5 24.3 23.5 24.4 24.3 23.5 23.5 23.5 23.5 23.5 22.7
20:10 24.4 22.8 24.3 24.7 23.5 23.5 24.4 23.6 23.4 24.6 24.4 23.5 23.5 23.5 23.6 22.8 24.6 23.5 22.7 22.7 23.6 23.5 23.5 22.7
20:20 24.3 22.3 23.8 24.2 23.0 24.0 24.7 23.9 22.9 24.1 23.9 23.0 23.0 23.0 23.9 22.3 24.0 23.8 22.2 22.2 23.1 23.0 23.0 22.2
20:30 24.4 22.3 23.0 24.2 22.1 23.0 23.9 23.1 22.9 24.1 23.9 23.0 23.0 23.0 23.1 22.3 23.1 23.8 22.2 22.2 23.1 23.0 23.0 22.2
20:40 24.5 22.3 23.0 23.0 22.1 23.0 23.9 23.1 22.2 24.1 23.0 22.2 23.0 22.3 23.1 22.3 23.1 23.0 22.2 22.2 22.3 22.2 23.0 22.2
20:50 24.0 23.0 23.0 24.2 22.1 23.0 23.9 23.0 22.9 24.1 23.9 23.0 23.0 23.0 23.0 22.1 23.9 23.8 22.2 23.0 23.0 23.0 23.0 22.2
21:00 24.1 22.5 23.3 24.8 22.5 23.5 24.2 23.4 23.2 23.6 23.4 23.3 23.4 23.3 23.3 22.5 23.3 24.1 22.5 22.5 23.3 23.3 22.5 21.7
21:10 23.8 22.5 23.3 23.7 22.5 23.5 24.2 22.5 22.4 23.6 23.4 22.5 23.4 22.5 23.3 22.5 23.3 23.3 22.5 22.5 22.5 22.5 22.5 21.7
21:20 23.7 22.3 23.0 23.0 22.1 23.0 23.9 23.1 22.9 23.0 23.0 23.0 23.0 23.0 23.1 22.3 24.0 23.8 22.2 22.2 23.1 23.0 23.0 21.4
21:30 23.5 22.3 23.0 23.0 22.1 23.0 23.9 23.0 22.9 23.0 23.9 23.0 23.0 22.2 23.0 22.1 23.0 23.8 22.2 23.0 23.0 23.0 23.0 22.2
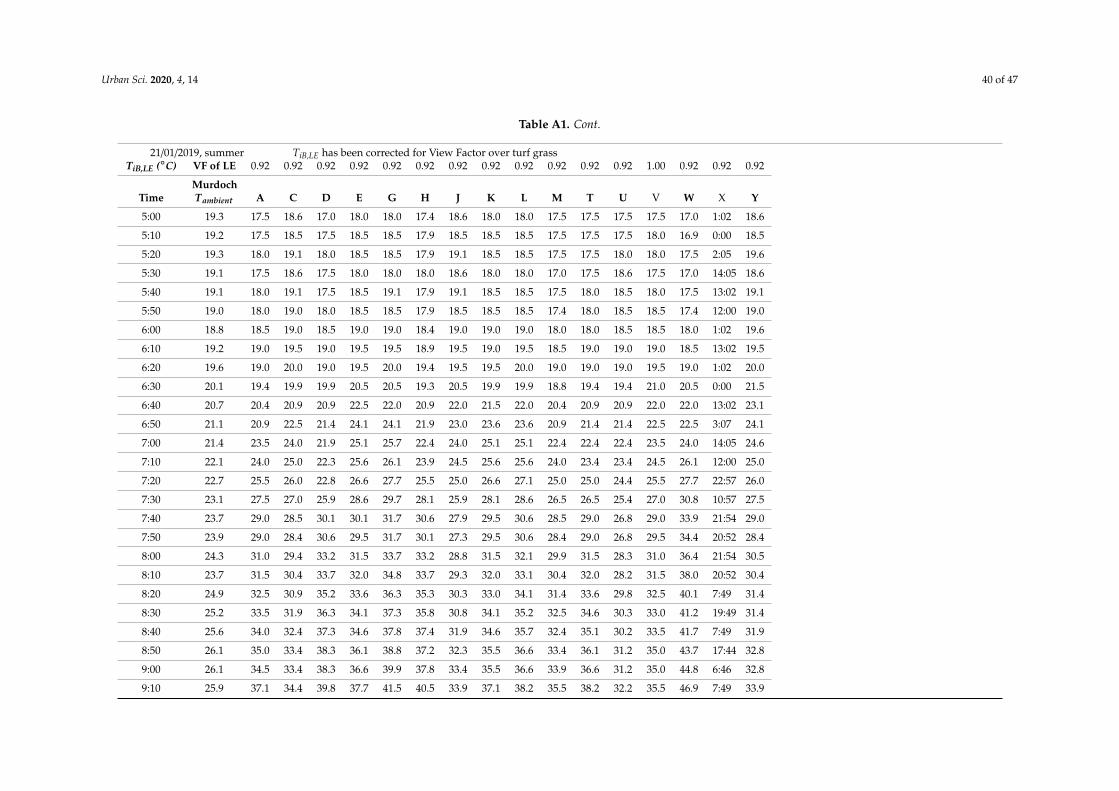
Urban Sci. 2020, 4, 14 40 of 47
Table A1. Cont.
21/01/2019, summer TiB,LE has been corrected for View Factor over turf grassTiB,LE (◦C) VF of LE 0.92 0.92 0.92 0.92 0.92 0.92 0.92 0.92 0.92 0.92 0.92 0.92 1.00 0.92 0.92 0.92
TimeMurdochTambient A C D E G H J K L M T U V W X Y
5:00 19.3 17.5 18.6 17.0 18.0 18.0 17.4 18.6 18.0 18.0 17.5 17.5 17.5 17.5 17.0 1:02 18.6
5:10 19.2 17.5 18.5 17.5 18.5 18.5 17.9 18.5 18.5 18.5 17.5 17.5 17.5 18.0 16.9 0:00 18.5
5:20 19.3 18.0 19.1 18.0 18.5 18.5 17.9 19.1 18.5 18.5 17.5 17.5 18.0 18.0 17.5 2:05 19.6
5:30 19.1 17.5 18.6 17.5 18.0 18.0 18.0 18.6 18.0 18.0 17.0 17.5 18.6 17.5 17.0 14:05 18.6
5:40 19.1 18.0 19.1 17.5 18.5 19.1 17.9 19.1 18.5 18.5 17.5 18.0 18.5 18.0 17.5 13:02 19.1
5:50 19.0 18.0 19.0 18.0 18.5 18.5 17.9 18.5 18.5 18.5 17.4 18.0 18.5 18.5 17.4 12:00 19.0
6:00 18.8 18.5 19.0 18.5 19.0 19.0 18.4 19.0 19.0 19.0 18.0 18.0 18.5 18.5 18.0 1:02 19.6
6:10 19.2 19.0 19.5 19.0 19.5 19.5 18.9 19.5 19.0 19.5 18.5 19.0 19.0 19.0 18.5 13:02 19.5
6:20 19.6 19.0 20.0 19.0 19.5 20.0 19.4 19.5 19.5 20.0 19.0 19.0 19.0 19.5 19.0 1:02 20.0
6:30 20.1 19.4 19.9 19.9 20.5 20.5 19.3 20.5 19.9 19.9 18.8 19.4 19.4 21.0 20.5 0:00 21.5
6:40 20.7 20.4 20.9 20.9 22.5 22.0 20.9 22.0 21.5 22.0 20.4 20.9 20.9 22.0 22.0 13:02 23.1
6:50 21.1 20.9 22.5 21.4 24.1 24.1 21.9 23.0 23.6 23.6 20.9 21.4 21.4 22.5 22.5 3:07 24.1
7:00 21.4 23.5 24.0 21.9 25.1 25.7 22.4 24.0 25.1 25.1 22.4 22.4 22.4 23.5 24.0 14:05 24.6
7:10 22.1 24.0 25.0 22.3 25.6 26.1 23.9 24.5 25.6 25.6 24.0 23.4 23.4 24.5 26.1 12:00 25.0
7:20 22.7 25.5 26.0 22.8 26.6 27.7 25.5 25.0 26.6 27.1 25.0 25.0 24.4 25.5 27.7 22:57 26.0
7:30 23.1 27.5 27.0 25.9 28.6 29.7 28.1 25.9 28.1 28.6 26.5 26.5 25.4 27.0 30.8 10:57 27.5
7:40 23.7 29.0 28.5 30.1 30.1 31.7 30.6 27.9 29.5 30.6 28.5 29.0 26.8 29.0 33.9 21:54 29.0
7:50 23.9 29.0 28.4 30.6 29.5 31.7 30.1 27.3 29.5 30.6 28.4 29.0 26.8 29.5 34.4 20:52 28.4
8:00 24.3 31.0 29.4 33.2 31.5 33.7 33.2 28.8 31.5 32.1 29.9 31.5 28.3 31.0 36.4 21:54 30.5
8:10 23.7 31.5 30.4 33.7 32.0 34.8 33.7 29.3 32.0 33.1 30.4 32.0 28.2 31.5 38.0 20:52 30.4
8:20 24.9 32.5 30.9 35.2 33.6 36.3 35.3 30.3 33.0 34.1 31.4 33.6 29.8 32.5 40.1 7:49 31.4
8:30 25.2 33.5 31.9 36.3 34.1 37.3 35.8 30.8 34.1 35.2 32.5 34.6 30.3 33.0 41.2 19:49 31.4
8:40 25.6 34.0 32.4 37.3 34.6 37.8 37.4 31.9 34.6 35.7 32.4 35.1 30.2 33.5 41.7 7:49 31.9
8:50 26.1 35.0 33.4 38.3 36.1 38.8 37.2 32.3 35.5 36.6 33.4 36.1 31.2 35.0 43.7 17:44 32.8
9:00 26.1 34.5 33.4 38.3 36.6 39.9 37.8 33.4 35.5 36.6 33.9 36.6 31.2 35.0 44.8 6:46 32.8
9:10 25.9 37.1 34.4 39.8 37.7 41.5 40.5 33.9 37.1 38.2 35.5 38.2 32.2 35.5 46.9 7:49 33.9

Urban Sci. 2020, 4, 14 41 of 47
Table A1. Cont.
21/01/2019, summer TiB,LE has been corrected for View Factor over turf grassTiB,LE (◦C) VF of LE 0.92 0.92 0.92 0.92 0.92 0.92 0.92 0.92 0.92 0.92 0.92 0.92 1.00 0.92 0.92 0.92
TimeMurdochTambient A C D E G H J K L M T U V W X Y
9:20 27.2 38.1 35.4 40.8 38.7 42.5 41.5 34.3 38.1 39.8 36.0 39.8 32.7 36.5 48.5 18:46 33.8
9:30 26.8 35.0 33.4 37.7 36.6 39.9 37.8 33.4 35.5 36.6 33.9 36.6 31.2 35.0 44.8 6:46 32.8
9:40 27.1 36.0 34.3 38.7 37.6 40.8 38.2 33.8 37.0 37.6 34.3 37.6 31.6 36.5 46.3 16:41 33.2
9:50 26.8 33.9 33.4 38.3 36.6 39.9 38.3 33.4 36.1 36.6 33.4 36.1 31.2 35.0 45.3 6:46 32.8
10:00 26.5 35.0 33.9 38.2 37.7 40.9 38.3 34.4 36.6 37.7 33.9 37.1 31.7 35.5 46.4 18:46 32.8
10:10 26.5 35.0 33.3 37.7 37.1 40.4 38.3 34.4 36.6 37.1 33.3 36.6 30.6 35.5 46.4 18:46 32.2
10:20 26.9 35.0 33.3 38.2 37.7 40.9 37.7 35.0 36.6 37.7 33.9 37.1 30.6 35.5 46.9 18:46 32.8
10:30 27.0 37.0 34.8 39.7 39.2 43.0 40.3 35.9 38.6 39.2 34.8 39.2 32.1 37.0 49.0 17:44 33.7
10:40 27.5 37.0 35.4 40.3 39.2 43.0 40.4 36.0 38.7 39.8 35.4 39.2 32.7 36.5 49.0 18:46 33.8
10:50 27.0 38.1 35.9 40.3 39.2 43.5 40.3 35.9 39.2 40.8 35.9 39.7 32.1 37.0 49.0 17:44 33.7
11:00 27.4 38.2 36.0 39.3 38.8 43.7 39.4 35.5 39.3 40.4 35.5 39.8 32.2 35.5 49.1 7:49 33.3
11:10 26.7 36.1 34.5 38.3 37.8 41.6 38.9 35.0 37.8 38.8 34.0 37.8 31.2 34.5 47.5 7:49 32.3
11:20 26.4 35.5 33.9 38.2 38.2 41.5 38.8 35.5 37.1 38.2 33.9 37.1 30.6 35.5 48.0 18:46 32.8
11:30 26.0 35.5 33.9 36.6 37.7 41.0 37.8 35.0 37.2 38.3 33.4 36.1 30.7 35.0 46.4 6:46 31.7
11:40 26.1 38.1 36.0 40.3 39.8 44.1 40.4 37.0 39.8 40.8 35.4 39.8 32.2 36.5 50.1 18:46 33.8
11:50 26.9 37.6 34.9 39.3 39.3 43.1 39.9 36.0 38.7 40.3 34.9 38.7 31.7 36.0 49.0 6:46 33.3
12:00 25.9 36.0 34.4 38.7 38.7 42.5 39.3 36.0 38.2 39.3 34.4 37.6 31.1 36.0 48.0 6:46 32.7
12:10 26.3 36.6 35.5 38.8 38.8 42.6 39.4 35.0 38.8 39.8 35.0 38.2 30.6 35.5 48.0 18:46 32.8
12:20 26.7 38.8 36.0 39.8 39.8 44.7 41.5 36.6 40.4 41.5 36.0 40.4 32.2 35.5 50.2 7:49 33.3
12:30 25.4 36.6 34.4 38.2 38.8 42.6 38.3 35.5 38.2 39.8 34.4 37.7 30.6 35.5 48.5 18:46 32.2
12:40 26.1 35.6 34.0 37.2 37.8 41.6 37.8 35.0 37.2 38.3 33.4 36.7 30.7 34.5 47.5 7:49 31.8
12:50 26.2 35.5 33.9 36.6 37.7 41.0 37.2 35.0 37.2 38.3 33.4 36.6 30.1 35.0 46.4 17:44 31.7
13:00 25.9 36.1 34.5 37.2 38.3 42.1 37.8 35.0 38.3 39.9 34.5 37.2 30.7 35.0 47.5 6:46 32.3
13:10 26.9 34.9 33.8 36.5 38.7 40.9 37.7 35.5 37.1 38.2 33.3 36.5 30.6 36.0 45.8 4:41 32.2
13:20 26.3 35.1 33.5 36.2 37.8 41.1 38.4 35.1 37.3 38.4 33.0 36.8 30.2 33.5 46.0 20:52 31.3
13:30 25.7 38.6 35.9 39.7 40.8 44.1 39.8 37.0 39.7 41.3 35.4 39.7 31.6 37.0 49.5 4:41 33.7
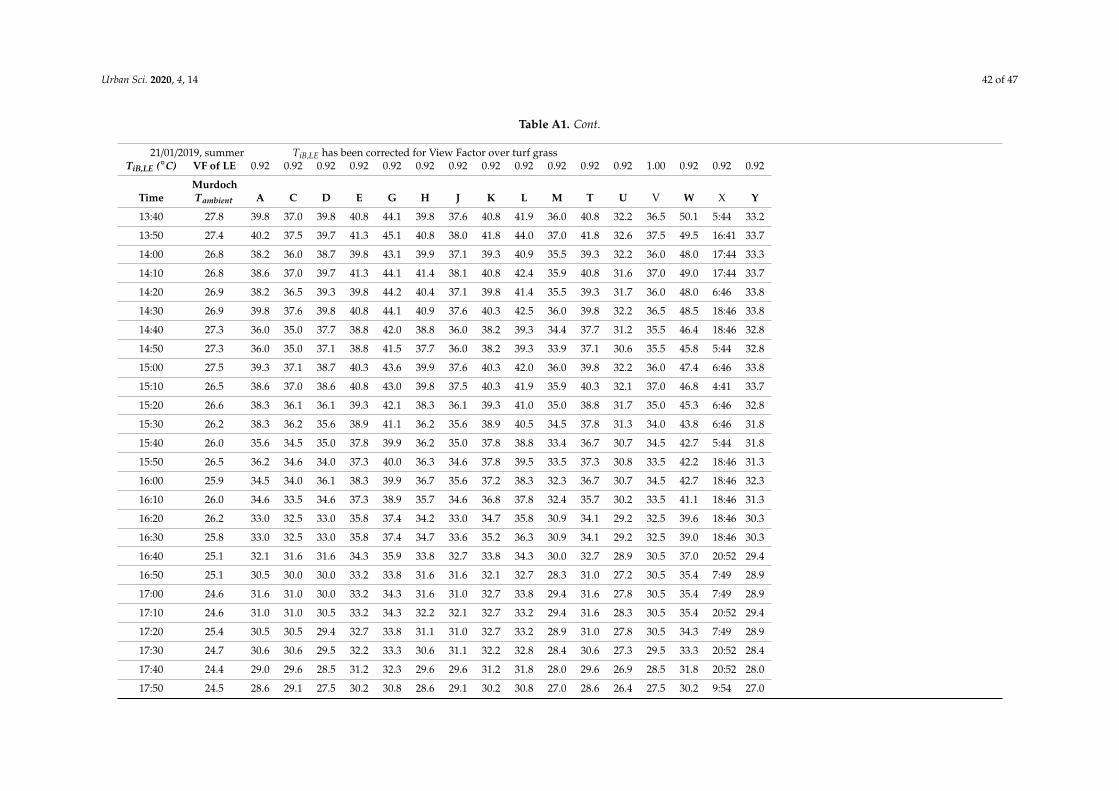
Urban Sci. 2020, 4, 14 42 of 47
Table A1. Cont.
21/01/2019, summer TiB,LE has been corrected for View Factor over turf grassTiB,LE (◦C) VF of LE 0.92 0.92 0.92 0.92 0.92 0.92 0.92 0.92 0.92 0.92 0.92 0.92 1.00 0.92 0.92 0.92
TimeMurdochTambient A C D E G H J K L M T U V W X Y
13:40 27.8 39.8 37.0 39.8 40.8 44.1 39.8 37.6 40.8 41.9 36.0 40.8 32.2 36.5 50.1 5:44 33.2
13:50 27.4 40.2 37.5 39.7 41.3 45.1 40.8 38.0 41.8 44.0 37.0 41.8 32.6 37.5 49.5 16:41 33.7
14:00 26.8 38.2 36.0 38.7 39.8 43.1 39.9 37.1 39.3 40.9 35.5 39.3 32.2 36.0 48.0 17:44 33.3
14:10 26.8 38.6 37.0 39.7 41.3 44.1 41.4 38.1 40.8 42.4 35.9 40.8 31.6 37.0 49.0 17:44 33.7
14:20 26.9 38.2 36.5 39.3 39.8 44.2 40.4 37.1 39.8 41.4 35.5 39.3 31.7 36.0 48.0 6:46 33.8
14:30 26.9 39.8 37.6 39.8 40.8 44.1 40.9 37.6 40.3 42.5 36.0 39.8 32.2 36.5 48.5 18:46 33.8
14:40 27.3 36.0 35.0 37.7 38.8 42.0 38.8 36.0 38.2 39.3 34.4 37.7 31.2 35.5 46.4 18:46 32.8
14:50 27.3 36.0 35.0 37.1 38.8 41.5 37.7 36.0 38.2 39.3 33.9 37.1 30.6 35.5 45.8 5:44 32.8
15:00 27.5 39.3 37.1 38.7 40.3 43.6 39.9 37.6 40.3 42.0 36.0 39.8 32.2 36.0 47.4 6:46 33.8
15:10 26.5 38.6 37.0 38.6 40.8 43.0 39.8 37.5 40.3 41.9 35.9 40.3 32.1 37.0 46.8 4:41 33.7
15:20 26.6 38.3 36.1 36.1 39.3 42.1 38.3 36.1 39.3 41.0 35.0 38.8 31.7 35.0 45.3 6:46 32.8
15:30 26.2 38.3 36.2 35.6 38.9 41.1 36.2 35.6 38.9 40.5 34.5 37.8 31.3 34.0 43.8 6:46 31.8
15:40 26.0 35.6 34.5 35.0 37.8 39.9 36.2 35.0 37.8 38.8 33.4 36.7 30.7 34.5 42.7 5:44 31.8
15:50 26.5 36.2 34.6 34.0 37.3 40.0 36.3 34.6 37.8 39.5 33.5 37.3 30.8 33.5 42.2 18:46 31.3
16:00 25.9 34.5 34.0 36.1 38.3 39.9 36.7 35.6 37.2 38.3 32.3 36.7 30.7 34.5 42.7 18:46 32.3
16:10 26.0 34.6 33.5 34.6 37.3 38.9 35.7 34.6 36.8 37.8 32.4 35.7 30.2 33.5 41.1 18:46 31.3
16:20 26.2 33.0 32.5 33.0 35.8 37.4 34.2 33.0 34.7 35.8 30.9 34.1 29.2 32.5 39.6 18:46 30.3
16:30 25.8 33.0 32.5 33.0 35.8 37.4 34.7 33.6 35.2 36.3 30.9 34.1 29.2 32.5 39.0 18:46 30.3
16:40 25.1 32.1 31.6 31.6 34.3 35.9 33.8 32.7 33.8 34.3 30.0 32.7 28.9 30.5 37.0 20:52 29.4
16:50 25.1 30.5 30.0 30.0 33.2 33.8 31.6 31.6 32.1 32.7 28.3 31.0 27.2 30.5 35.4 7:49 28.9
17:00 24.6 31.6 31.0 30.0 33.2 34.3 31.6 31.0 32.7 33.8 29.4 31.6 27.8 30.5 35.4 7:49 28.9
17:10 24.6 31.0 31.0 30.5 33.2 34.3 32.2 32.1 32.7 33.2 29.4 31.6 28.3 30.5 35.4 20:52 29.4
17:20 25.4 30.5 30.5 29.4 32.7 33.8 31.1 31.0 32.7 33.2 28.9 31.0 27.8 30.5 34.3 7:49 28.9
17:30 24.7 30.6 30.6 29.5 32.2 33.3 30.6 31.1 32.2 32.8 28.4 30.6 27.3 29.5 33.3 20:52 28.4
17:40 24.4 29.0 29.6 28.5 31.2 32.3 29.6 29.6 31.2 31.8 28.0 29.6 26.9 28.5 31.8 20:52 28.0
17:50 24.5 28.6 29.1 27.5 30.2 30.8 28.6 29.1 30.2 30.8 27.0 28.6 26.4 27.5 30.2 9:54 27.0
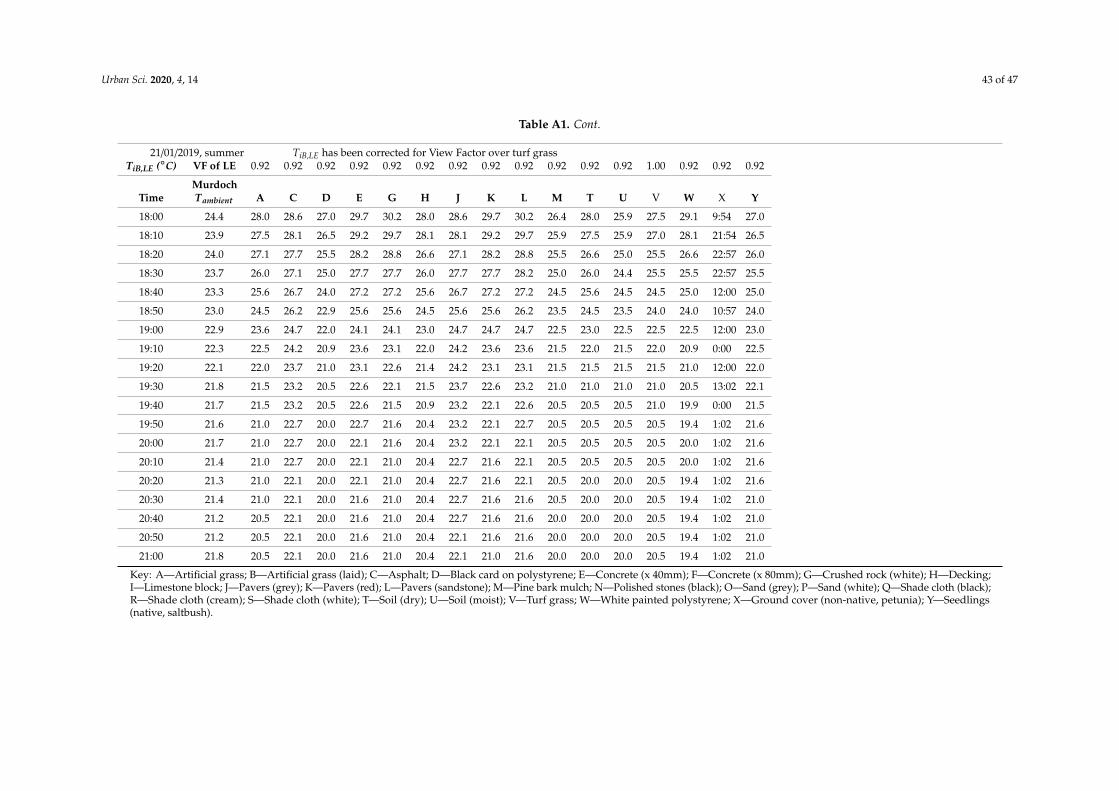
Urban Sci. 2020, 4, 14 43 of 47
Table A1. Cont.
21/01/2019, summer TiB,LE has been corrected for View Factor over turf grassTiB,LE (◦C) VF of LE 0.92 0.92 0.92 0.92 0.92 0.92 0.92 0.92 0.92 0.92 0.92 0.92 1.00 0.92 0.92 0.92
TimeMurdochTambient A C D E G H J K L M T U V W X Y
18:00 24.4 28.0 28.6 27.0 29.7 30.2 28.0 28.6 29.7 30.2 26.4 28.0 25.9 27.5 29.1 9:54 27.0
18:10 23.9 27.5 28.1 26.5 29.2 29.7 28.1 28.1 29.2 29.7 25.9 27.5 25.9 27.0 28.1 21:54 26.5
18:20 24.0 27.1 27.7 25.5 28.2 28.8 26.6 27.1 28.2 28.8 25.5 26.6 25.0 25.5 26.6 22:57 26.0
18:30 23.7 26.0 27.1 25.0 27.7 27.7 26.0 27.7 27.7 28.2 25.0 26.0 24.4 25.5 25.5 22:57 25.5
18:40 23.3 25.6 26.7 24.0 27.2 27.2 25.6 26.7 27.2 27.2 24.5 25.6 24.5 24.5 25.0 12:00 25.0
18:50 23.0 24.5 26.2 22.9 25.6 25.6 24.5 25.6 25.6 26.2 23.5 24.5 23.5 24.0 24.0 10:57 24.0
19:00 22.9 23.6 24.7 22.0 24.1 24.1 23.0 24.7 24.7 24.7 22.5 23.0 22.5 22.5 22.5 12:00 23.0
19:10 22.3 22.5 24.2 20.9 23.6 23.1 22.0 24.2 23.6 23.6 21.5 22.0 21.5 22.0 20.9 0:00 22.5
19:20 22.1 22.0 23.7 21.0 23.1 22.6 21.4 24.2 23.1 23.1 21.5 21.5 21.5 21.5 21.0 12:00 22.0
19:30 21.8 21.5 23.2 20.5 22.6 22.1 21.5 23.7 22.6 23.2 21.0 21.0 21.0 21.0 20.5 13:02 22.1
19:40 21.7 21.5 23.2 20.5 22.6 21.5 20.9 23.2 22.1 22.6 20.5 20.5 20.5 21.0 19.9 0:00 21.5
19:50 21.6 21.0 22.7 20.0 22.7 21.6 20.4 23.2 22.1 22.7 20.5 20.5 20.5 20.5 19.4 1:02 21.6
20:00 21.7 21.0 22.7 20.0 22.1 21.6 20.4 23.2 22.1 22.1 20.5 20.5 20.5 20.5 20.0 1:02 21.6
20:10 21.4 21.0 22.7 20.0 22.1 21.0 20.4 22.7 21.6 22.1 20.5 20.5 20.5 20.5 20.0 1:02 21.6
20:20 21.3 21.0 22.1 20.0 22.1 21.0 20.4 22.7 21.6 22.1 20.5 20.0 20.0 20.5 19.4 1:02 21.6
20:30 21.4 21.0 22.1 20.0 21.6 21.0 20.4 22.7 21.6 21.6 20.5 20.0 20.0 20.5 19.4 1:02 21.0
20:40 21.2 20.5 22.1 20.0 21.6 21.0 20.4 22.7 21.6 21.6 20.0 20.0 20.0 20.5 19.4 1:02 21.0
20:50 21.2 20.5 22.1 20.0 21.6 21.0 20.4 22.1 21.6 21.6 20.0 20.0 20.0 20.5 19.4 1:02 21.0
21:00 21.8 20.5 22.1 20.0 21.6 21.0 20.4 22.1 21.0 21.6 20.0 20.0 20.0 20.5 19.4 1:02 21.0
Key: A—Artificial grass; B—Artificial grass (laid); C—Asphalt; D—Black card on polystyrene; E—Concrete (x 40mm); F—Concrete (x 80mm); G—Crushed rock (white); H—Decking;I—Limestone block; J—Pavers (grey); K—Pavers (red); L—Pavers (sandstone); M—Pine bark mulch; N—Polished stones (black); O—Sand (grey); P—Sand (white); Q—Shade cloth (black);R—Shade cloth (cream); S—Shade cloth (white); T—Soil (dry); U—Soil (moist); V—Turf grass; W—White painted polystyrene; X—Ground cover (non-native, petunia); Y—Seedlings(native, saltbush).
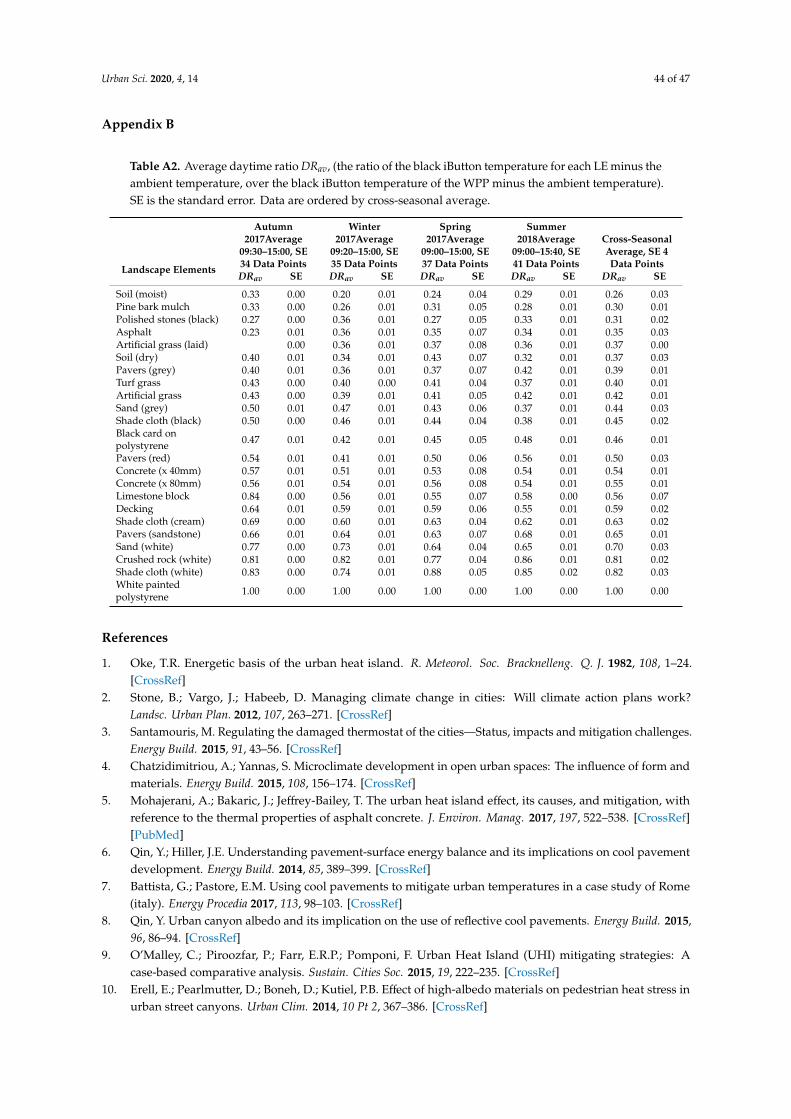
Urban Sci. 2020, 4, 14 44 of 47
Appendix B
Table A2. Average daytime ratio DRav, (the ratio of the black iButton temperature for each LE minus theambient temperature, over the black iButton temperature of the WPP minus the ambient temperature).SE is the standard error. Data are ordered by cross-seasonal average.
Landscape Elements
Autumn2017Average
09:30–15:00, SE34 Data Points
Winter2017Average
09:20–15:00, SE35 Data Points
Spring2017Average
09:00–15:00, SE37 Data Points
Summer2018Average
09:00–15:40, SE41 Data Points
Cross-SeasonalAverage, SE 4Data Points
DRav SE DRav SE DRav SE DRav SE DRav SE
Soil (moist) 0.33 0.00 0.20 0.01 0.24 0.04 0.29 0.01 0.26 0.03Pine bark mulch 0.33 0.00 0.26 0.01 0.31 0.05 0.28 0.01 0.30 0.01Polished stones (black) 0.27 0.00 0.36 0.01 0.27 0.05 0.33 0.01 0.31 0.02Asphalt 0.23 0.01 0.36 0.01 0.35 0.07 0.34 0.01 0.35 0.03Artificial grass (laid) 0.00 0.36 0.01 0.37 0.08 0.36 0.01 0.37 0.00Soil (dry) 0.40 0.01 0.34 0.01 0.43 0.07 0.32 0.01 0.37 0.03Pavers (grey) 0.40 0.01 0.36 0.01 0.37 0.07 0.42 0.01 0.39 0.01Turf grass 0.43 0.00 0.40 0.00 0.41 0.04 0.37 0.01 0.40 0.01Artificial grass 0.43 0.00 0.39 0.01 0.41 0.05 0.42 0.01 0.42 0.01Sand (grey) 0.50 0.01 0.47 0.01 0.43 0.06 0.37 0.01 0.44 0.03Shade cloth (black) 0.50 0.00 0.46 0.01 0.44 0.04 0.38 0.01 0.45 0.02Black card onpolystyrene 0.47 0.01 0.42 0.01 0.45 0.05 0.48 0.01 0.46 0.01
Pavers (red) 0.54 0.01 0.41 0.01 0.50 0.06 0.56 0.01 0.50 0.03Concrete (x 40mm) 0.57 0.01 0.51 0.01 0.53 0.08 0.54 0.01 0.54 0.01Concrete (x 80mm) 0.56 0.01 0.54 0.01 0.56 0.08 0.54 0.01 0.55 0.01Limestone block 0.84 0.00 0.56 0.01 0.55 0.07 0.58 0.00 0.56 0.07Decking 0.64 0.01 0.59 0.01 0.59 0.06 0.55 0.01 0.59 0.02Shade cloth (cream) 0.69 0.00 0.60 0.01 0.63 0.04 0.62 0.01 0.63 0.02Pavers (sandstone) 0.66 0.01 0.64 0.01 0.63 0.07 0.68 0.01 0.65 0.01Sand (white) 0.77 0.00 0.73 0.01 0.64 0.04 0.65 0.01 0.70 0.03Crushed rock (white) 0.81 0.00 0.82 0.01 0.77 0.04 0.86 0.01 0.81 0.02Shade cloth (white) 0.83 0.00 0.74 0.01 0.88 0.05 0.85 0.02 0.82 0.03White paintedpolystyrene 1.00 0.00 1.00 0.00 1.00 0.00 1.00 0.00 1.00 0.00
References
1. Oke, T.R. Energetic basis of the urban heat island. R. Meteorol. Soc. Bracknelleng. Q. J. 1982, 108, 1–24.[CrossRef]
2. Stone, B.; Vargo, J.; Habeeb, D. Managing climate change in cities: Will climate action plans work?Landsc. Urban Plan. 2012, 107, 263–271. [CrossRef]
3. Santamouris, M. Regulating the damaged thermostat of the cities—Status, impacts and mitigation challenges.Energy Build. 2015, 91, 43–56. [CrossRef]
4. Chatzidimitriou, A.; Yannas, S. Microclimate development in open urban spaces: The influence of form andmaterials. Energy Build. 2015, 108, 156–174. [CrossRef]
5. Mohajerani, A.; Bakaric, J.; Jeffrey-Bailey, T. The urban heat island effect, its causes, and mitigation, withreference to the thermal properties of asphalt concrete. J. Environ. Manag. 2017, 197, 522–538. [CrossRef][PubMed]
6. Qin, Y.; Hiller, J.E. Understanding pavement-surface energy balance and its implications on cool pavementdevelopment. Energy Build. 2014, 85, 389–399. [CrossRef]
7. Battista, G.; Pastore, E.M. Using cool pavements to mitigate urban temperatures in a case study of Rome(italy). Energy Procedia 2017, 113, 98–103. [CrossRef]
8. Qin, Y. Urban canyon albedo and its implication on the use of reflective cool pavements. Energy Build. 2015,96, 86–94. [CrossRef]
9. O’Malley, C.; Piroozfar, P.; Farr, E.R.P.; Pomponi, F. Urban Heat Island (UHI) mitigating strategies: Acase-based comparative analysis. Sustain. Cities Soc. 2015, 19, 222–235. [CrossRef]
10. Erell, E.; Pearlmutter, D.; Boneh, D.; Kutiel, P.B. Effect of high-albedo materials on pedestrian heat stress inurban street canyons. Urban Clim. 2014, 10 Pt 2, 367–386. [CrossRef]

Urban Sci. 2020, 4, 14 45 of 47
11. El-Bardisy, W.M.; Fahmy, M.; El-Gohary, G.F. Climatic sensitive landscape design: Towards a bettermicroclimate through plantation in public schools, Cairo, Egypt. In Urban Planning and Architectural Designfor Sustainable Development; Naselli, F., Pollice, F., Amer, M.S., Eds.; Elsevier: Amsterdam, The Netherlands,2016; Volume 216, pp. 206–216.
12. Hardin, A.W.; Vanos, J.K. The influence of surface type on the absorbed radiation by a human under hot, dryconditions. Int. J. Biometeorol. 2018, 62, 43–56. [CrossRef] [PubMed]
13. Li, H. Evaluation of Cool Pavement Strategies for Heat Island Mitigation. Ph.D. Dissertation, University ofCalifornia, Davis, Ann Arbor, MI, USA, 2012.
14. Hong, Y.; Ong, B.L.; Lim, G.T. Vbfred-ivy: The development of a computational tool to model the thermalperformance of plants on buildings in the singapore climate. In In Proceedings of the CAADRIA 2001: TheSixth Conference on Computer Aided Architectural Design Research in Asia, Sydney, Australia, 19–21 April2001; pp. 159–168.
15. Montague, T.; Kjelgren, R. Energy balance of six common landscape surfaces and the influence of surfaceproperties on gas exchange of four containerized tree species. Sci. Hortic. 2004, 100, 229–249. [CrossRef]
16. McPherson, E.G.; Simpson, J.R.; Livingston, M. Effects of three landscape treatments on residential energyand water use in Tucson, Arizona. Energy Build. 1989, 13, 127–138. [CrossRef]
17. Cameron, R.W.F.; Taylor, J.E.; Emmett, M.R. What’s “cool” in the world of green façades? How plant choiceinfluences the cooling properties of green walls. Build. Environ. 2014, 73, 198–207. [CrossRef]
18. Grant, O.M.; Tronina, Ł.; Jones, H.G.; Chaves, M.M. Exploring thermal imaging variables for the detection ofstress responses in grapevine under different irrigation regimes. J. Exp. Bot. 2007, 58, 815–825. [CrossRef][PubMed]
19. Guilioni, L.; Jones, H.G.; Leinonen, I.; Lhomme, J.P. On the relationships between stomatal resistance andleaf temperatures in thermography. Agric. For. Meteorol. 2008, 148, 1908–1912. [CrossRef]
20. Tipler, P.A. Physics; Worth Publishers, Inc.: New York, NY, USA, 1982; p. 1078.21. Doulos, L.; Santamouris, M.; Livada, I. Passive cooling of outdoor urban spaces. The role of materials.
Sol. Energy 2004, 77, 231–249. [CrossRef]22. Radhi, H.; Assem, E.; Sharples, S. On the colours and properties of building surface materials to mitigate
urban heat islands in highly productive solar regions. Build. Environ. 2014, 72, 162–172. [CrossRef]23. Kuang, W.H.; Liu, Y.; Dou, Y.Y.; Chi, W.F.; Chen, G.S.; Gao, C.F.; Yang, T.R.; Liu, J.Y.; Zhang, R.H. What
are hot and what are not in an urban landscape: Quantifying and explaining the land surface temperaturepattern in Beijing, China. Landsc. Ecol. 2015, 30, 357–373. [CrossRef]
24. Brandani, G.; Napoli, M.; Massetti, L.; Petralli, M.; Orlandini, S. Urban Soil: Assessing Ground Cover Impacton Surface Temperature and Thermal Comfort. J. Environ. Qual. 2016, 45, 90–97. [CrossRef]
25. Lin, B.B.; Meyers, J.; Beaty, R.M.; Barnett, G.B. Urban green infrastructure impacts on climate regulationservices in Sydney, Australia. Sustainability 2016, 8, 788. [CrossRef]
26. Hamstead, Z.A.; Kremer, P.; Larondelle, N.; McPhearson, T.; Haase, D. Classification of the heterogeneousstructure of urban landscapes (STURLA) as an indicator of landscape function applied to surface temperaturein New York City. Ecol. Indic. 2016, 70, 574–585. [CrossRef]
27. Wu, H.; Sun, B.; Li, Z.; Yu, J. Characterizing thermal behaviors of various pavement materials and theirthermal impacts on ambient environment. J. Clean. Prod. 2017, 172, 1358–1367. [CrossRef]
28. Loveday, J.; Loveday, G.K.; Byrne, J.J.; Ong, B.-l.; Morrison, G.M. Seasonal and diurnal surface temperaturesof urban landscape elements. Sustainability 2019, 11, 5280. [CrossRef]
29. Palyvos, J.A. A survey of wind convection coefficient correlations for building envelope energy systems’modeling. Appl. Therm. Eng. 2008, 28, 801–808. [CrossRef]
30. Taha, H.; Sailor, D.; Akbari, H. High-Albedo Materials for Reducing Building Cooling Energy Use;DE-AC0376SF00098; Lawrence Berkeley Laboratory University of California: Berkeley, CA, USA, 1992.
31. Wang, F.; Cheng, L.; Mei, H.; Zhang, Q.; Zhang, L. Effect of surface microstructures on the infrared emissivityof graphite. Int. J. Thermophys. 2014, 35, 62–75. [CrossRef]
32. Jim, C.Y. Intense summer heat fluxes in artificial turf harm people and environment. Landsc. Urban Plan.2017, 157, 561–576. [CrossRef]
33. Cueto, R.G.; Soto, N.S.; Rincón, Z.H.; Benítez, S.O.; Morales, G.B. Parameterization of net radiation in an aridcity of northwestern Mexico. Atmósfera 2015, 28, 71–82. [CrossRef]

Urban Sci. 2020, 4, 14 46 of 47
34. Li, H. 4—A comparison of thermal performance of different pavement materials A2—Pacheco-Torgal, F.In Eco-Efficient Materials for Mitigating Building Cooling Needs; Labrincha, J.A., Cabeza, L.F., Granqvist, C.G.,Eds.; Woodhead Publishing: Oxford, UK, 2015; pp. 63–124. [CrossRef]
35. Xie, N.; Li, H.; Abdelhady, A.; Harvey, J. Laboratorial investigation on optical and thermal properties of coolpavement nano-coatings for urban heat island mitigation. Build. Environ. 2019, 147, 231–240. [CrossRef]
36. Kyriakodis, G.E.; Santamouris, M. Using reflective pavements to mitigate urban heat island in warmclimates—Results from a large scale urban mitigation project. Urban Clim. 2018, 24, 326–339. [CrossRef]
37. Akbari, H.; Levinson, R.; Berdahl, P. ASTM Standards for Measuring Solar Reflectance and Infrared Emittance ofConstruction Materials and Comparing Their Steady-State Surface Temperatures; Lawrence Berkeley National Lab:Berkeley, CA, USA, 1996.
38. ASTM-E1918-16. Standard Test Method for Measuring Solar Reflectance of Horizontal and Low-Sloped Surfaces inthe Field; ASTM International: West Conshohocken, PA, USA, 2016. [CrossRef]
39. ASTM-C1371-15. Standard Test Method for Determination of Emittance of Materials Near Room Temperature UsingPortable Emissometers; ASTM International: West Conshohocken, PA, USA, 2015. [CrossRef]
40. Aoki, T.; Mizutani, A. Measurement of the vertical distribution of reflected solar radiation. J. Eng. Technol. Sci.2015, 47, 160–169. [CrossRef]
41. Maxim Integrated. What Is an iButton Device? Available online: https://www.maximintegrated.com/en/app-notes/index.mvp/id/3808 (accessed on 19 August 2019).
42. Chapman, L.; Thornes, J.E. Real-time sky-view factor calculation and approximation. J. Atmos. Ocean. Technol.2004, 21, 730–741. [CrossRef]
43. Peel, M.C.; Finlayson, B.L.; Mcmahon, T.A. Updated world map of the Köppen-Geiger climate classification.Hydrol. Earth Syst. Sci. Discuss. 2007, 11, 1633–1644. [CrossRef]
44. ASTM-E1862. Standard Test Methods for Measuring and Compensating for Reflected Temperature Using InfraredImaging Radiometers; American Society for Testing and Materials: West Conshohocken, PA, USA, 1998.[CrossRef]
45. Loveday, J.; Loveday, G.K.; Byrne, J.J.; Ong, B.-l.; Newman, P. A technique for quantifying the reduction ofsolar radiation due to cloud and tree cover. Procedia Eng. 2017, 180, 403–412. [CrossRef]
46. van Marken Lichtenbelt, W.D.; Daanen, H.A.M.; Wouters, L.; Fronczek, R.; Raymann, R.J.E.M.;Severens, N.M.W.; Van Someren, E.J.W. Evaluation of wireless determination of skin temperature usingiButtons. Physiol. Behav. 2006, 88, 489–497. [CrossRef]
47. Hu, M.; Zhao, B.; Ao, X.; Feng, J.; Cao, J.; Su, Y.; Pei, G. Experimental study on a hybrid photo-thermal andradiative cooling collector using black acrylic paint as the panel coating. Renew. Energy 2019, 139, 1217–1226.[CrossRef]
48. Murdoch University. Murdoch University Weather Station. Available online: http://134.115.224.172/ (accessedon 23 March 2020).
49. Jaffer, A. Convection from a Rectangular Plate. Available online: http://people.csail.mit.edu/jaffer/SimRoof/Convection/ (accessed on 25 January 2016).
50. Howell, J.R. A Catalog of Radiation Heat Transfer Configuration Factors. Available online: http://www.thermalradiation.net/calc/sectionc/C-13.html (accessed on 20 March 2018).
51. University of Pennsylvania. Averaging, Errors and Uncertainty. Available online: http://avntraining.hartrao.ac.za/images/Error_Analysis.pdf (accessed on 22 June 2019).
52. BoM. Bureau of Meteorology Monthly Climate Statistics for Australian Locations. Available online:http://www.bom.gov.au/climate/averages/tables/cw_009225_All.shtml (accessed on 7 October 2019).
53. Loveday, J.; Loveday, G.K.; Byrne, J.J.; Ong, B.-l.; Morrison, G.M. Modified ibuttons: A low-cost instrumentto measure the albedo of landscape elements. Sustainability 2019, 11, 6896. [CrossRef]
54. Taleghani, M. The impact of increasing urban surface albedo on outdoor summer thermal comfort within auniversity campus. Urban Clim. 2018, 24, 175–184. [CrossRef]
55. Lindberg, F.; Onomura, S.; Grimmond, C.S.B. Influence of ground surface characteristics on the mean radianttemperature in urban areas. Int. J. Biometeorol. 2016, 60, 1439–1452. [CrossRef]
56. Yaghoobian, N.; Kleissl, J. Effect of reflective pavements on building energy use. Urban Clim. 2012, 2, 25–42.[CrossRef]
Urban Sci. 2020, 4, 14 47 of 47
57. Santamouris, M.; Haddad, S.; Saliari, M.; Vasilakopoulou, K.; Synnefa, A.; Paolini, R.; Ulpiani, G.; Garshasbi, S.;Fiorito, F. On the energy impact of urban heat island in Sydney: Climate and energy potential of mitigationtechnologies. Energy Build. 2018, 166, 154–164. [CrossRef]
58. Wang, Y.; Berardi, U.; Akbari, H. Comparing the effects of urban heat island mitigation strategies for Toronto,Canada. Energy Build. 2016, 114, 2–19. [CrossRef]
59. Santamouris, M.; Ding, L.; Fiorito, F.; Oldfield, P.; Osmond, P.; Paolini, R.; Prasad, D.; Synnefa, A. Passiveand active cooling for the outdoor built environment—Analysis and assessment of the cooling potential ofmitigation technologies using performance data from 220 large scale projects. Sol. Energy 2017, 154, 14–33.[CrossRef]
© 2020 by the authors. Licensee MDPI, Basel, Switzerland. This article is an open accessarticle distributed under the terms and conditions of the Creative Commons Attribution(CC BY) license (http://creativecommons.org/licenses/by/4.0/).
Related Documents