RADIONUCLIDES IN GROUND WATER AT THE IDAHO NATIONAL ENGINEERING LABORATORY, IDAHO by LeRoy L. Knobel and Larry J. Mann U.S. GEOLOGICAL SURVEY Open-File Report 88-731 Prepared in cooperation with the U.S. DEPARTMENT OF ENERGY Idaho Falls, Idaho December 1988

Welcome message from author
This document is posted to help you gain knowledge. Please leave a comment to let me know what you think about it! Share it to your friends and learn new things together.
Transcript
RADIONUCLIDES IN GROUND WATER AT THE
IDAHO NATIONAL ENGINEERING LABORATORY, IDAHO
by LeRoy L. Knobel and Larry J. Mann
U.S. GEOLOGICAL SURVEY
Open-File Report 88-731
Prepared in cooperation with the
U.S. DEPARTMENT OF ENERGY
Idaho Falls, Idaho
December 1988

DEPARTMENT OF THE INTERIOR
DONALD PAUL MODEL, Secretary
U.S. GEOLOGICAL SURVEY
Dallas L. Peck, Director
For additional information write to:
Project OfficeU.S. Geological SurveyP.O. Box 2230INEL, CF-690, Room 164Idaho Falls, ID 83403-2230
Copies of this report can be purchased from:
Books and Open-File Reports SectionWestern Distribution BranchBox 25425, Federal Center, Bldg. 810Denver, CO 80225Telephone: (303) 844-7476
11
CONTENTS
PageAbstract .............................. 1Introduction ............................ 2
Geohydrologic setting ..................... 2Previous investigations .................... 4Acknowledgments ........................ 6
Methods and quality assurance. ................... 6Sample containers and preservatives .............. 6Sampling locations and decontamination procedures ....... 7Sample collection ....................... 8Reporting of data ....................... 9Field quality assurance .................... 11
Concentrations of radionuclides in ground water. .......... 12Tritium ............................ 16Strontium-90. ......................... 16Plutonium-238, plutonium-239, -240 (undivided)
and americium-241 ...................... 21Cesium-137, cobalt-60 and potassium-40. ............ 21
Summary. .............................. 22Selected references. ........................ 24
ILLUSTRATIONS
Figures 1-7. Maps showing:1. Location of the Idaho National Engineering
Laboratory and selected facilities ....... 32. Locations of wells sampled for selected
radionuclides, September to November 1987. ... 143. Locations of wells sampled for selected
radionuclides in the TRA-ICPP area, Septemberto November, 1987. ............... 15
4. Locations of wells with tritium concentrations above the reporting level, September to November 1987. ................. 17
5. Locations of wells with tritium concentrations above the reporting level in TRA-ICPP area, September to November, 1987. .......... 18
6. Locations of wells with strontium-90 concentra tions above the reporting level, September to November 1987 ................ 19
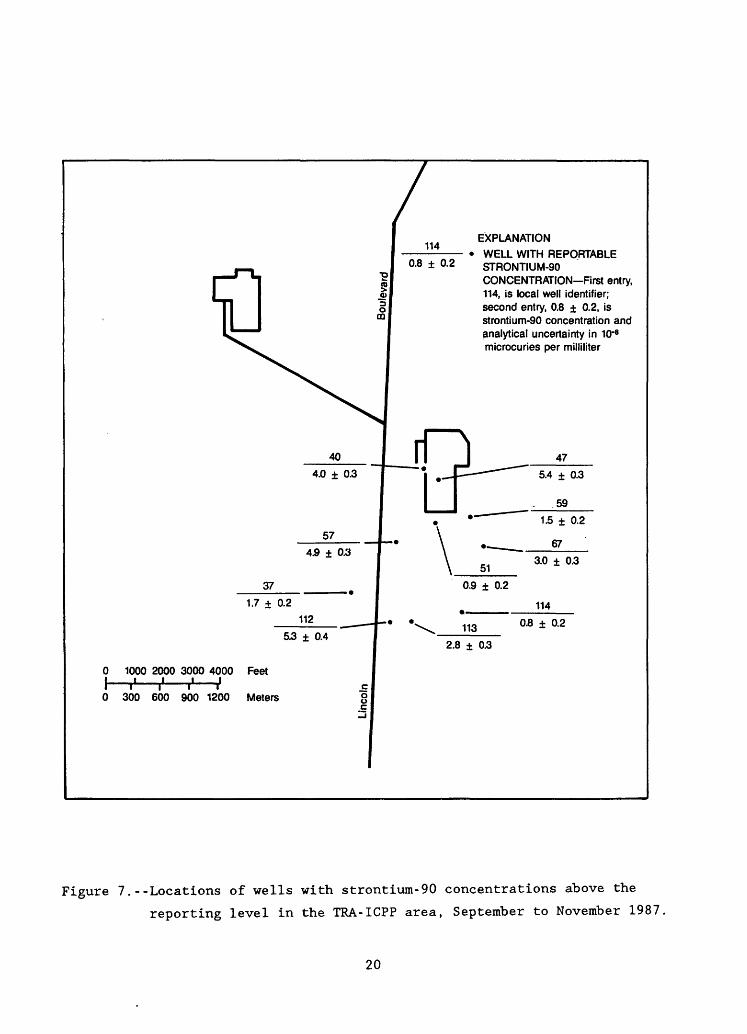
7. Locations of wells with strontium-90 concentra tions above the reporting level in the TRA- ICPP area, September to November 1987. ..... 20
iii
TABLES
PageTable 1. First description of radionuclides or radioactivity
in U.S. Geological Survey Reports by year of publication and author. ................ 5
2. Radionuclides for which analyses were obtained forground-water samples. ................. 13
3. Concentrations of selected radionuclides in groundwater ......................... 28
CONVERSION FACTORS
For readers who prefer to use International System units, conversion factors for terms used in this report are listed below.
Multiply By To obtaininch (in.) 25.4 millimeterfoot (ft) 0.3048 metermile (mi) 1.609 kilometergallon (gal) 3.785 litersquare mile (mi 2 ) 2.590 square kilometermicrocuries per milliliter 3.7X10⁸ becquerel per liter
(jiCi/mL)millirem 0.01 millisievert
IV
RADIONUCLIDES IN GROUND WATER AT THE
IDAHO NATIONAL ENGINEERING LABORATORY, IDAHO
by
LeRoy L. Knobel and Larry J. Mann
ABSTRACT
Sampling for radionuclides in ground water was conducted at the Idaho
National Engineering Laboratory during September to November 1987. Water
samples from 80 wells that obtain water from the Snake River Plain aquifer
and 1 well that obtains water from a shallow, discontinuous perched-water
body at the Radioactive Waste Management Complex were collected and analyzed
for tritium, strontium-90, plutonium-238, plutonium-239, -240 (undivided),
americium-241, cesium-137, cobalt-60, and potassium-40--a naturally
occurring radionuclide. The ground-water samples were analyzed at the U.S.
Department of Energy's Radiological and Environmental Sciences Laboratory at
the Idaho National Engineering Laboratory in Idaho. Methods used to collect
the water samples and quality assurance instituted for the sampling program
are described in detail.
Tritium and strontium-90 concentrations ranged from below the reporting f i Q
level to 80.6-1.5X10" and 193-5X10" /iCi/mL, respectively. Water from a
disposal well at Test Area North which has not been used to dispose of
waste water since September 1972--contained 122-9X10" /iCi/mL of
plutonium-238, 500*20X10 /iCi/mL of plutonium-239, -240 (undivided),
21*4X10~ 1:L /iCi/mL of americium-241, and 750*20X10~ 8 /iCi/mL of cesium-137;
the presence of these radionuclides was verified by resampling and
reanalysis. The disposal well had 8.9+0.9X10~ /iCi/mL of cobalt-60 on
October 28, 1987, but cobalt-60 was not detected when the well was resampled
on January 11, 1988. Potassium-40 concentrations were less than the
reporting level in all wells.
INTRODUCTION
The INEL (Idaho National Engineering Laboratory) includes about 890 mi 2
of the eastern Snake River Plain in southeastern Idaho (fig. 1). The INEL
was established in 1949 and is used by the U.S. Department of Energy to test
different types of nuclear reactors. The INEL is one of the main centers in
the United States for developing peacetime uses of atomic energy, nuclear
safety research, defense programs and development of advanced energy
concepts.
During September to November 1987, a sampling program was conducted to
document the concentration of radionuclides in ground water at the INEL.
Water samples were collected from 30 production wells and 51 ground-water
quality monitoring wells; 80 of these wells obtain water from the Snake
River Plain aquifer and 1 obtains water from a perched-water zone.
Radionuclides historically have been produced in conjunction with the
operation of nuclear reactors and the processing of nuclear fuel. In
addition, low-level and transuranic radioactive material have been disposed
of or stored at the RWMC (Radioactive Waste Management Complex) near the
southern boundary of the INEL (fig. 1). This report describes the methods
used to collect the water samples and the quality assurance instituted for
the sampling program and summarizes the concentrations of radionuclides
in the water samples. The sampling program was conducted by the U.S.
Geological Survey in cooperation with the U.S. Department of Energy.
Geohydrologic Setting
The eastern Snake River Plain is a northeast trending structural basin
about 200 mi long and 50 to 70 mi wide. The plain is underlain by a layered
sequence of basaltic lava flows and cinder beds intercalated with alluvium
and lake bed sedimentary deposits. Individual flows range from 10 to 50 ft
in thickness, although the average thickness may be from 20 to 25 ft
(Mundorff and others, 1964, p. 143). The sedimentary deposits consist
mainly of lenticular beds of sand, silt and clay with lesser amounts of
gravel. Locally, rhyolitic lava flows and tuffs are exposed at the land

112°30'
Atomic City
Big Southern Butte
EXPLANATION Selected Facilities at the Idaho National Engineering Laboratory
Central Facilities Area CFA
Experimental Breeder Reactor No. 1 EBR-IExperimental Breeder Reactor No. 2 EBR-II
Idaho Chemical Processing Plant ICPP
Loss of Fluid Test Facility LOFT
Naval Reactors Facility
Radioactive Waste Management Complex
Test Area North
Test Reactors Area
INEL boundaryFacilitiesTowns
0.^.1 . ? .? MILES
0 2 4 6 8 10 12 KILOMETERS
44°00'-
k'Bitterroot Range
Eastern Snake River Plain Birch Creek Playa
Playa 3
Lost River Sinks
Water Flooding Areas
INELSpreadingArea
43°30'
NRF
RWMC
TAN
TRA
Figure 1.--Location of the Idaho National Engineering Laboratory and selected facilities.

surface or occur at depth. The basaltic lava flows and intercalated
sedimentary deposits combine to form the Snake River Plain aquifer, which is
the main source of ground water on the plain. The depth to water in the
aquifer ranges from about 200 ft in the northern part of the INEL to more
than 900 ft in the southern part.
The INEL obtains its entire water supply from the aquifer. Aqueous
chemical and radioactive wastes--fission and activation products--generated
at the INEL were discharged to ponds and wells from 1952 to 1983. Since
1983, most of the aqueous wastes have been discharged to unlined infiltra
tion ponds. Many of the waste constituents enter the aquifer indirectly
following percolation through the unsaturated zone (Lewis and Jensen, 1984,
p. 17); prior to 1984, much of the waste was injected directly into the
aquifer using deep wells.
Previous Investigations
The U.S. Geological Survey has conducted geologic, hydrologic and
water-quality investigations at the INEL since it was selected as a reactor
testing area in 1949. Ground-water quality studies routinely include
selected common ions, trace elements and radionuclides. Radioactivity in
ground water was first investigated in 1955; results of the investigation
are reported by Nace (1961, p. 37a). The study was limited to detection of
alpha- and beta-activity. Slight beta-contamination was observed in perched
ground water beneath the Materials Test Reactor disposal pond at the TRA
(fig. 1), although the individual beta-emitters were not identified.
Subsequent studies have slowly expanded in scope to include an increasing
number of radionuclides. Table 1 summarizes the first description of
radionuclides or radioactivity in various U.S. Geological Survey reports by
year of publication and author.
Other U.S. Geological Survey reports dealing with radionuclides in
ground water include Morris and others (1964); Barraclough, Teasdale, and
Jensen (1967); Barraclough, Teasdale, Robertson, and Jensen (1967);
Barraclough and others (1982); and Lewis and Jensen (1984; 1985). In the

Table 1.--First description of radlonuclides or radioactivity in U.S. Geological Survey Reports, by year of publication and author
Radionuclide or type of radioactivity
Year of first publication Author(s)
Gross alpha and gross beta 1961
Tritium 1961
Gross gamma 1963
Strontium-90 1965
Cesium-137 1974
Cobalt-60and Chromium-51 1976
Plutonium-238,Plutonium-239,-240 (undivided)and americium-241 1976
Iodine-129 1981
Nace
Jones
Morris and others
Morris and others
Robertson and others
Barraclough and Jensen
Barraclough and others
Barraclough and others
early 1970's when analyses for plutonium and americium began to show
scattered positive results the U.S. Department of Energy initiated a study
to determine: (a) if reproducible background concentrations could be
determined using special sampling and analytical procedures; (b) if positive
analytical results could be reproduced for water from a well with low but
detectable quantities of plutonium; and (c) if reproducible results on
either detectable or nondetectable quantities could be obtained for water
samples collected from the Snake River Plain aquifer. The results of that
study are summarized by Polzer and others (1976). They concluded that Snake
River Plain aquifer mean background concentrations for plutonium-238,
plutonium-239, -240 (undivided), and americium-241 were less than
0.08X10~n , 0.04X10~n , and 0.10X10 -11 /iCi/mL, respectively. Mean
concentrations of 0.65*0.29X10" /iCi/mL for plutonium-238 and
0.24*0.19X10 ~ 11 /iCi/mL for plutonium-239, -240 (undivided) were positively
identified in well 47 (Polzer and others, 1976, p. 8). These concentrations
were approximately one to two million times lower than Federal and State of
Idaho concentration guides for drinking water for continuous use by the
general population (Polzer and others, 1976, p. 8). The U.S. Geological
Survey has published two compilations that include data on radionuclides for
the period 1949 through 1982; Bagby and others (1985) and Lewis and others
(1985).
Acknowledgments
The authors gratefully acknowledge the many employees of the U.S.
Department of Energy and its contractors at the INEL who aided in the
sampling program. A large part of the administrative coordination was
provided by T.F. Gesell and Isamu Aoki of the Department of Energy's Idaho
Operations Office and by J.L. Clark and W.L. Bodily of EG&G Idaho, Inc., a
Department of Energy contractor at the INEL. Analytical work was conducted
by the Department of Energy's RESL (Radiological and Environmental Sciences
Laboratory), Analytical Chemistry Branch Don B. Martin, Chief at the INEL.
Special thanks are due to Messrs. A.C. Miskin and R.E. Prine, and Ms. D.G.
Avery of EG&G for their participation in collecting the water samples and
documenting field conditions.
METHODS AND QUALITY ASSURANCE
The methodology used in sampling for radionuclides generally followed
the guidelines established by the U.S. Geological Survey (Thatcher and
others, 1977; Skougstad and others, 1979; Wood, 1976). Slight modifications
were incorporated into the sampling procedure as a result of the
recommendations of the analyzing laboratory (D.R. Percival, U.S. Dept. of
Energy, oral commun., 1987). The methods used in the field and quality
assurance practices are outlined in following sections.
Sample Containers and Preservatives
Sample containers were purchased for the U.S. Geological Survey by a
U.S. Department of Energy contract supplier and preservatives were supplied
by the RESL. Polyethylene bottles--500-mL and 1000-mL--were used to collect

water samples. Untreated 500-mL samples were collected for tritium
analysis. Samples for analyses of other radionuclides were collected in
either 500-mL or 1000-mL polyethylene bottles depending on the target
radionuclides. Prior to sample collection 10 or 20 mL of reagent-grade
hydrochloric acid was added to the appropriate bottle to make a two-percent
solution by volume; the acid maintains the radionuclides in solution.
Sampling Locations and Decontamination Procedures
Samples were collected at 81 locations as follows: 28 production wells
equipped with sample delivery lines at the well head; 2 production wells
equipped with water spigots located downstream from pressure tanks; 50
ground-water quality monitoring wells equipped with dedicated submersible
pumps; and 1 well that obtains water from a perched-water zone that required
the use of a thief sampling device. The 30 production wells are equipped
with dedicated pumps and supply lines that did not require decontamination.
To divert excess flow and facilitate sample collection, monitoring wells
equipped with dedicated pumps were fitted with a portable discharge line
about 2.5 ft long. The discharge line was 1.5 in. I.D. (inside diameter)
galvanized-steel pipe equipped with a brass valve to control the flow rate.
A galvanized T-joint was inserted into the line between the well head and
the control valve and a series of galvanized pipes, a brass valve to control
the flow rate of the sampling port, and galvanized connectors were attached
to the T-joint to reduce the diameter so that a 9/32 in. I.D. stainless
steel delivery pipe could be attached as the sampling point. The 9/32 in.
I.D. stainless-steel pipe was bent 90 degrees to facilitate sample
collection. All fittings and pipes were rinsed with deionized water before
installation at the well head. Subsequent flushing by several hundred to
thousands of gallons of water pumped from the well ensured that the portable
discharge line was as clean as reasonably possible. The thief sampler used
for sampling the well that penetrates the perched-water zone was washed with
hot water and detergent and rinsed with deionized water prior to use. A
detailed discussion of techniques used for obtaining samples from wells that
represent aquifer water chemistry is presented by Claassen (1982).

Sample Collection
To ensure that water representative of the Snake River Plain aquifer
was sampled, a volume of water equivalent to a minimum of 3 well-bore
volumes was pumped from each well; at most wells, 5 to 10 well-bore volumes
were pumped prior to collecting the samples. The diameter of the well bore,
rather than the volume of the casing, was used to calculate the minimum
volume because of the potentially large difference between the two. In
addition, temperature, specific conductance, and pH were monitored during
pumping, using methods described by Wood (1976). When these measurements
stabilized, indicating probable hydraulic and chemical stability, a water
sample was collected using the following protocol:
1. Field person responsible for collecting the water sample wore
disposable vinyl gloves and stood upwind from the point of
collection.
2. The outside of the sample delivery line was rinsed thoroughly with
well water.
3. An empty 500-mL polyethylene bottle was rinsed with well water at
least three times and filled with sample for tritium analysis.
4. Depending on the target radionuclides, either a pre-acidified
500-mL or 1000-mL polyethylene bottle was filled with sample. The
500-mL bottle is sufficient for all target radionuclides except
plutonium-238, plutonium-239, -240 (undivided), and americium-241.
These require an additional 500 mL of sample.
5. The bottles were capped immediately.
6. The exteriors of the bottles were dried, sealed with laboratory
film, and labeled.
7. The water samples were stored in a mobile field laboratory until
they could be transferred to a secured storage area, where they

remained until they were hand delivered to the laboratory; most of
the samples were delivered on November 17, 1987.
Physical conditions at the well during sample collection were recorded
in a field logbook and a chain-of-custody record was used to track samples
from the time of collection until delivery to the analyzing laboratory.
These records are available for inspection at the U.S. Geological Survey
Project Office at the INEL.
Reporting of Data
Concentrations of selected radionuclides are reported with an estimated
standard deviation, s, that is obtained by propagating sources of analytical
uncertainty in measurements. The following guidelines for interpreting
analytical results are based on an extension of the method described by
Currie (1968).
In the analysis for a selected radionuclide, laboratory measurements
are made on a target sample and a prepared blank. Instrument signals for
the sample and the blank vary randomly. Therefore, it is essential to
distinguish between two key aspects of the problem of detection: (1) The
instrument signal for the sample must be greater than the signal observed
for the blank to make the decision that a selected radionuclide was
detected; and (2) an estimation must be made of the minimum radionuclide
concentration that will yield a sufficiently large observed signal to make
the correct decision for detection or nondetection of that radionuclide most
of the time. The first aspect of the problem is a qualitative decision
based on an observed signal and a definite criterion for detection. The
second aspect of the problem is an intuitive estimation of the detection
capabilities of a given measurement process.
In the laboratory, instrument signals must exceed a critical level to
make the qualitative decision whether a selected radionuclide was detected.
Radionuclide concentrations that equal 1.6s meet this criterion; at 1.6s,
there is a 95 percent probability that the correct decision--not detected--

will be made. Given a large number of samples, up to 5 percent of the
samples with measured concentrations greater than or equal to 1.6s, which
were concluded as being detected, might not contain the selected radio-
nuclide. These measurements are referred to as false positives and are
errors of the first kind in hypothesis testing.
Once the critical level of 1.6s has been defined, the minimum detect
able concentration may be established. Radionuclide concentrations that
equal 3s represent a measurement at the minimum detectable concentration.
For true concentrations of 3s or greater, there is a 95 percent or more
probability of concluding that a selected radionuclide was detected in a
sample. Given a large number of samples, up to 5 percent of the samples
with measured concentrations greater than or equal to 3s, which were
concluded as being non-detected, could contain the selected radionuclide at
the minimum detectable concentration. These measurements are referred to as
false negatives and are errors of the second kind in hypothesis testing.
True radionuclide concentrations between 1.6s and 3s have larger errors
of the second kind. That is, there is a greater than 5 percent probability
of false negative results for samples with true concentrations between 1.6s
and 3s and, although the selected radionuclide might have been detected,
such detection may not be considered reliable; at 1.6s, the probability of a
false negative is about 50 percent.
These guidelines are based on counting statistics alone and do not
include systematic or random errors inherent in laboratory procedures. The
values, 1.6s and 3s, vary slightly with background or blank counts, and with
the number of gross counts for individual analyses and for different
selected radionuclides. In this report, if the selected radionuclide
concentration was less than 3s the concentration was considered to be below
a "reporting level." The use of the critical level, minimum detectable
concentration, and reporting level aid the reader in the interpretation of
analytical results and do not represent absolute concentrations of
radioactivity which may or may not have been detected.
10
Field Quality Assurance
Field quality assurance instituted for this sampling program included:
four blind replicates--duplicate samples with a different sample
identification number sent to the same laboratory; two blank samples
containing deionized water; and five splits--large sample volumes divided
into three equal volumes with the same well-identification number sent to
different laboratories. One of the three equal volumes from each split was
retained by the U.S. Geological Survey as a backup sample in the event that
additional laboratory analyses were needed. Ground-water and quality-
assurance samples were analyzed by RESL using methods described by Bodnar
and Percival (1982). One of the three equal volumes for each of the five
split samples were analyzed by EG&G's RML (Radioactivity Measurements
Laboratory) located at the Test Reactors Area (fig. 1), using methods
similar to those used by RESL (Bodnar and Percival, 1982; D.H. Meikrantz,
EG&G Idaho, Inc., oral commun., 1988).
In October 1987, two blank samples that were prepared with deionized
water contained reportable concentrations of tritium; all other radionuclide
concentrations in the blank samples were less than the reporting level. The
blank samples were obtained from a deionizing exchange column at the Central
Facilities Area, which is supplied by wells CFA-1 and CFA-2. In October
1987, wells CFA-1 and CF
of tritium, respectively.
1987, wells CFA-1 and CFA-2 contained 32.1*0.8x10" 6 and 21.1*0.7x10" 6
The split samples were from wells 87, 88, 89, 90 and the RWMC
production well. Two of the three equal volumes for each of the five splits
were analyzed for strontium-90 by two different laboratories and the
independent results were within the analytical uncertainty of the
measurement; however, the RML split for well 88 had a small but reportablei _ O
concentration--0.6-0.2X10 /jCi/mL. Because of the general agreement of
results from the two laboratories for the split samples, two out of the five
equal volumes--from wells 88 and 89--that were retained as backup samples
were provided to RESL for additional analyses for cesium-137. The remaining
backup samples were discarded after the analytical results had been obtained
from the laboratories and reviewed by the authors.
11

CONCENTRATIONS OF RADIONUCLIDES IN GROUND WATER
Eighty wells that obtain water from the Snake River Plain aquifer at
the INEL and that are equipped with dedicated submersible pumps were sampled
for radionuclides. Well 92, which obtains water from a shallow, discontin
uous perched-water zone at the RWMC, was sampled with a thief sampler. The
eight radionuclides for which analyses were obtained and the number of wells
sampled are shown on table 2. The locations of wells that were sampled are
shown on figures 2 and 3. The concentrations of the eight radionuclides in
ground-water and quality-assurance samples are included in table 3 at the
end of this report. Four wells that showed reportable concentrations of one
or more radionuclides other than tritium or strontium-90, were resampled.
The results of those analyses are also included in table 3--see wells 88 and
89, CFA-1 and the TAN Disposal well. Only the TAN Disposal well--which has
not been used to dispose of waste water since September 1972--showed
reportable concentrations of radionuclides in the follow-up sampling.
Environmental standards, regulations, and permits applicable, in whole
or in part, on the INEL or at the INEL boundary have been discussed by Chew
and Mitchell (1988, p. 33-35). Selected derived concentration guides for
radiation protection, based on an interim standard in effect for U.S.
Department of Energy facilities of 100 millirem per year effective dose
equivalent, are reported by Chew and Mitchell (1988, table X). The derived
concentration guides for the radionuclides discussed in this report are
listed in table 2. The guides follow the recommendations of the Inter
national Commission on Radiological Protection. The derived concentration
guide for potassium-40 was provided by M.L. Walker (U.S. Department of
Energy, written commun., 1988). For comparison, the U.S. Environmental
Protection Agency maximum contaminant level for manmade radionuclides in
community drinking water systems is based on a 4 millirem per year total
body or organ dose equivalent.
12
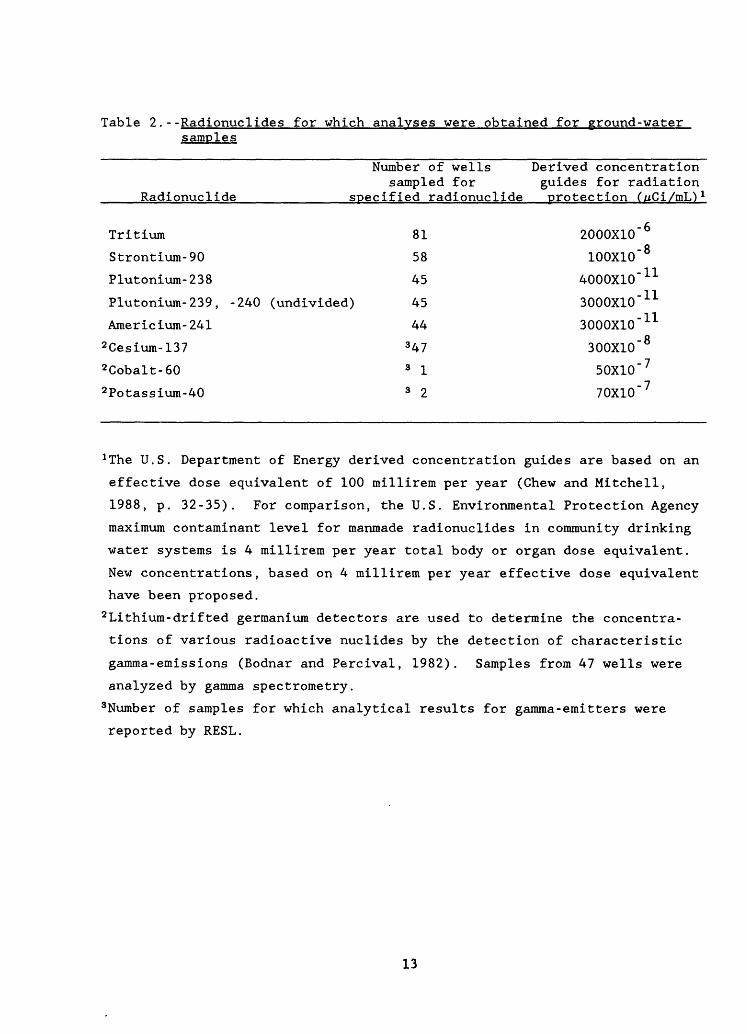
Table 2.--Radionuclides for which analyses were obtained for ground-water samples
Number of wells Derived concentration sampled for guides for radiation
Radionuclide_______________secified radionuclide rotection (/iCimL) 1
Tritium
Strontium- 90
Plutonium- 238
Plutonium- 239, -240 (undivided)
Americium-241
2 Cesium-137
2 Cobalt-60
2 Potassium-40
81
58
45
45
44347
3 ]_
3 2
2000X10 " 6
100X10 " 8
4000X10" U
3000X10 " n3000X10 " ll
300X10 " 850X10 " 7
70X10 " 7
1 The U.S. Department of Energy derived concentration guides are based on an
effective dose equivalent of 100 millirem per year (Chew and Mitchell,
1988, p. 32-35). For comparison, the U.S. Environmental Protection Agency
maximum contaminant level for manmade radionuclides in community drinking
water systems is 4 millirem per year total body or organ dose equivalent.
New concentrations, based on 4 millirem per year effective dose equivalent
have been proposed.
2 Lithium-drifted germanium detectors are used to determine the concentra
tions of various radioactive nuclides by the detection of characteristic
gamma-emissions (Bodnar and Percival, 1982). Samples from 47 wells were
analyzed by gamma spectrometry.
3Number of samples for which analytical results for gamma-emitters were
reported by RESL.
13

15'
44°00'
45'
30'
43°15'
A Arco
113°00 45'
INEL
P4W2
112°30'
I.Monteview
| ..-TAN-1
I TAN disposal' \ANP-8
A Terreton
.NRF-1 /NRF-2
^>NRF-3 8»
99Fire Station 2T_ . Site 4 NpRTes, EBM-2 .. EBR.|HHighways
\
\CFA-2
88 120/
92
/SPERT-1
VSPERT-2
OMRE ! ARA-3
-2 .. EBR.|H j * J
"00 _____ H -1 *
/101
RWMC
" ,06 ««
109 105 l6Tl03
ARA-2
"Badging Facility
_JAtomic City
A Taber
EXPLANATION
10 _L
15 MILES I
I10
I15 20
NRF-1 WELL SAMPLED FORRADIONUCLIDES NRF-1
KILOMETERS IS local we" identifier
ATOWN
44°00'
45'
30'
43°15'
Figure 2.--Locations of wells sampled for selected radionuclides, September
to November 1987.
14

TRA-3 TRA-
TRA-4
Site 19
65
76
1000 2000 3000 4000 Feet i i i i
0 300 600 900 1200 Meters
ICPP-4
ICPP-2.. ICPP-1
4340
4782
51
57
111
113
59
67
116
114 -115
112
EXPLANATION
TRA-1 WELL SAMPLED FORRADIONUCLIDES TRA-1 is local well identifier
Figure 3.--Locations of wells sampled for selected radionuclides in the TRA-
ICPP area, September to November 1987.
15

Tritium
The distribution of tritium at the INEL has been extensively studied by
the U.S. Geological Survey. Jones (1961, figs. 58 and 70) shows the areal
distribution of tritium at the ICPP (fig. 1) and at the Materials Test
Reactor area near the TRA (fig. 1). More recent summaries of tritium dis
tribution at the INEL are given by Barraclough and others (1982) for the
period 1974 to 1978 and by Lewis and Jensen (1985) for the period 1979 to
1981.
During the September to November 1987 sampling program tritium
concentrations ranged from less than the reporting level to 80.6-1.5X10"
jiCi/mL (table 3). The smallest reportable concentration of tritium
was 0.9*0.3X10" jiCi/mL. Except for the TAN Disposal well, all reportable
concentrations of tritium are either in or to the south of the ICPP and TRA
areas. The southernmost occurrence of tritium is at well 106. The
locations of the wells with reportable tritium concentrations are shown on
figures 4 and 5.
Strontium-90
Concentrations of strontium-90 were tabulated by Morris and others
(1965, table 3) for the period December 1963 to January 1965. Since then,
strontium-90 has been described in several reports; recent examples are
Barraclough and others (1982) for the period 1974 to 1978 and Lewis and
Jensen (1985) for the period 1979 to 1981.
The range of strontium-90 concentrations found in the samples collected
during September to November 1987 is from less than the reporting level toi O
193-5X10" jiCi/mL (table 3). The smallest reportable concentration for
strontium-90 is 0.6*0.2X10 jiCi/mL. Except for the TAN Disposal well and
wells 87 and 89, strontium-90 concentrations that are greater than the
reporting level are geographically situated in and just south of the ICPP.
The locations of the wells with reportable strontium-90 concentrations for
the September to November 1987 samples along with their concentrations are
shown on figures 6 and 7.
16

15'
44°00'
45'
30'
43°15'
A Arco
113°QO "1
45'
INEL
112°30'
44°00'
II .Monteview
I TAN Disposal
45'
30'
106 15 ± 0.3
2.2 ± 0.4 , ___in "" A"*
87
10_L
15 MILES
I10
115
I20 KILOMETERS
EXPLANATION
WELL WITH REPORTABLE 0.9 ± 0.3 TRITIUM CONCENTRATION
First entry, 87, is local well identifier; second entry, 0.9 ± 0.3, is tritium concentration and analytical uncertainty in 10*6 microcuries per milliliter
A TOWN
43°15'
Figure 4.--Locations of wells with tritium concentrations above the
reporting level, September to November 1987.
17
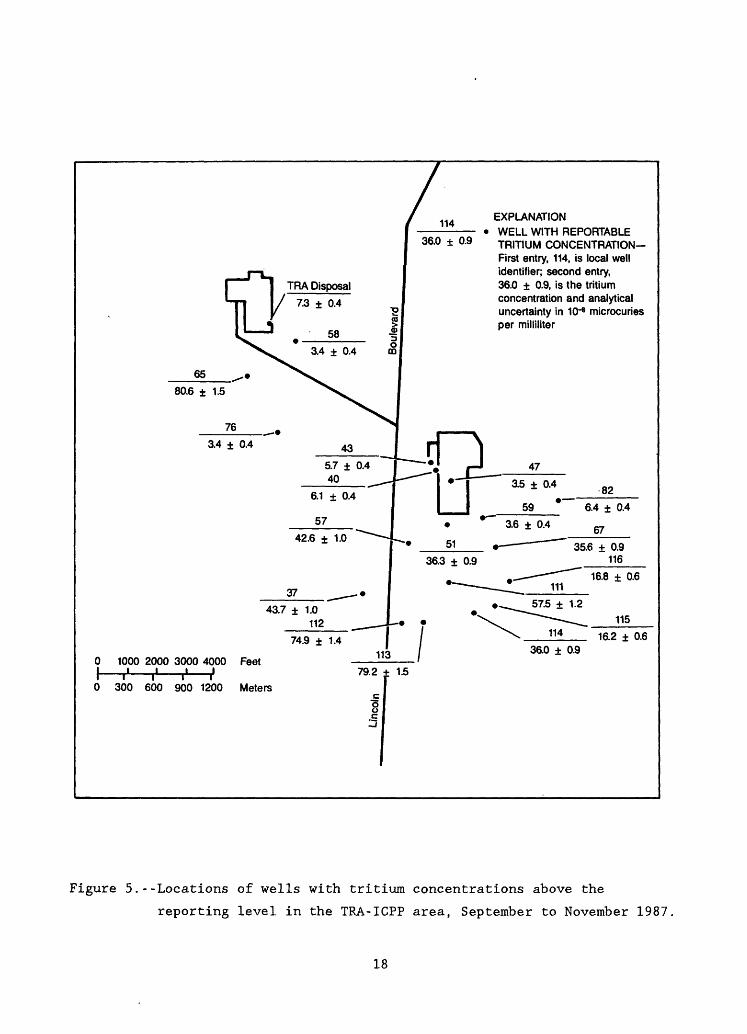
EXPLANATION WELL WITH REPORTABLE TRITIUM CONCENTRATION First entry, 114, is local well identifier; second entry, 36.0 ± 0.9, is the tritium concentration and analytical uncertainty in 10-* microcuries per milliliter
826.4 ± 0.4
67
35.6 ± 0.9 116
16.8 ± 0.6
11516.2 ± 0.6
36.0 ± 0.91000 2000 3000 4000 Feet
i i iir i i i r0 300 600 900 1200
79.2 ± 1.5
Meters
Figure 5.--Locations of wells with tritium concentrations above the
reporting level in the TRA-ICPP area, September to November 1987
18

15' 113°00
44°00'
45'
30'
43°15'
45'
INEL
112°3Q'1
i
I A Monteview
A Howe
JTAN Disposal
193 ± 5*~\
A Terreton
»
A Arco
L.
J
.JAtomic City
87
10 I
15 MILES
I10
I15
I20 KILOMETERS
EXPLANATION
- WELL WITH REPORTABLE 23 ± 0.3 STRONTIUM-90
CONCENTRATION First entry, 87, is local well identifier; second entry, 2.3 ± 0.3, is strontium-90 concentration and analytical uncertainty in 10~8 microcuries per milliliter
A TOWN
44°00'
45'
30'
43*15'
Figure 6.--Locations of wells with strontium-90 concentrations above the
reporting level, September to November 1987.
19
EXPLANATION
WELL WITH REPQRTABLE STRONTIUM-90 CONCENTRATION First entry, 114, is local well identifier; second entry, 0.8 ± 0.2, is strontium-90 concentration and analytical uncertainty in 10'8 microcuries per milliliter
47
0 1000 2000 3000 4000 FeetI .' ,' r1 "0 300 600 900 1200 Meters
5.4 ± 0.3
59
1.5 ± 0.2
67
3.0 ± 0.3
Figure 7.--Locations of wells with strontium-90 concentrations above the
reporting level in the TRA-ICPP area, September to November 1987
20

Plutonium-238. Plutonium-239. -240 (undivided) and Americium-241
Concentrations of plutonium-238, plutonium-239, -240 (undivided) and
americium-241 for samples collected near the RWMC (fig. 1) during the period
1971 to 1974 are tabulated by Barraclough and others (1976, tables III and
IV). Lewis and Jensen (1985) summarized the concentrations of plutonium
isotopes and americium-241 in ground water at the INEL for the period 1979
to 1981. During the current sampling, water from two wells--CFA-1 and the
TAN Disposal well--had concentrations greater than the reporting level for
one or more of the three radionuclides. The concentration of plutonium-238
in water collected from CFA-1 on October 15, 1987, was 11*3X10" juCi/mL
(table 3). CFA-1 was resampled on January 5, 1988 and April 19, 1988. The
results were 13*6X10" and 0.14+0.43X10" juCi/mL, respectively. The cause
of the variation between the three samples is unknown, however, the results
from both of the later samples are less than the reporting level. The
concentrations of plutonium-238, plutonium-239, -240 (undivided) and
americium-241 in water collected from the TAN Disposal well on October 28,
1987, were 122+9X10~ 1:L , SOO^OXIO" 11 and 21*4X10~ 1:L /zCi/mL, respectively
(table 3). On January 11, 1988, the well was resampled and the respective
concentrations were IS^SXIO" 11 , 96*8X10~ 1:L and lotaxiO" 11 /iCi/mL. The
January 11, 1988, concentrations were smaller than the October 28, 1987,
concentrations, however, they are all greater than the reporting level.
Cesium-137. Cobalt-60 and Potassium-40
Gamma spectrometry involves using lithium-drifted germanium detectors
to simultaneously determine the concentrations of a variety of radioactive
nuclides by the detection of characteristic gamma-emission (Bodnar and
Percival, 1982, p. G-2-1). When a gamma spectrometric analysis is
requested, RESL currently reports a result for cesium-137, whether or not it
is detected, together with any other detectable gamma-emitters. In
addition, when analyses for specific gamma-emitters are requested, a result
is reported for each.
21

Early studies of gamma radiation in ground water at the INEL only
measured total gamma activity; 725 samples were collected and measured in
1962 (Morris and others, 1963). Morris and others (1964) gave a more
detailed description of the distribution of total gamma activity in ground
water at the INEL. Studies separating cesium-137 and cobalt-60 from other
gamma-emitting isotopes were reported in the 1970's (Robertson and others,
1974; Barraclough and others, 1976). Current studies routinely separate
gamma-emitting isotopes.
During September to November 1987, three radionuclides were identified
using gamma spectrometry: cesium-137, cobalt-60 and potassium-40 (table 3).
Water from the TAN Disposal well contained reportable concentrations of
cesium-137 and cobalt-60 on October 28, 1987; 750^20X10"® and 8.9*0.9X10~ 7
/iCi/mL, respectively. Subsequent resampling on January 11, 1988, yielded+ 8
water that contained 306-12X10 /jCi/mL of cesium-137 but cobalt-60 was not
detected. The RESL portion of the split samples from wells 88 and 89+ - 8 contained reportable concentrations of cesium-137; 3.0-0.9X10 and
+ - 8 2.5-0.6X10 /iCi/mL, respectively. The parts of the split samples that were
retained by the U.S. Geological Survey as backup samples, for each of these
wells, were analyzed by RESL and cesium-137 was below the reporting level
for both. In all instances, potassium-40 concentrations were less than the
reporting level--potassium-40 is a naturally occurring radionuclide.
SUMMARY
Sampling for selected radionuclides in ground water at the INEL was
conducted by the U.S. Geological Survey during September to November 1987.
The sampling was done in cooperation with the U.S. Department of Energy.
Water samples from the Snake River Plain aquifer were collected at 80 wells
and 1 sample was collected from a discontinuous perched-water zone at the
Radioactive Waste Management Complex. The samples were analyzed for
tritium, strontium-90, plutonium-238, plutonium-239, -240 (undivided),
americium-241 and gamma-emitting isotopes. Gamma emitters identified by
gamma spectrometry were cesium-137, cobalt-60 and potassium-40.
22

A field logbook was maintained to record physical conditions at the
well during sample collection and a chain-of-custody record was used to
track samples from the time of collection until delivery to the U.S.
Department of Energy's Radiological and Environmental Sciences Laboratory
for analysis. Methods used to collect water samples and the quality
assurance procedures instituted for the sampling program are described in
detail.
Tritium concentrations ranged from below the reporting level to
80.6-1.5X10" /iCi/mL. The smallest reportable tritium concentration was
0.9*0.3X10 /iCi/mL. Except for the TAN Disposal well, all reportable
concentrations of tritium were either in or to the south of the ICPP and TRA
areas.
Strontium-90 concentrations ranged from below the reporting level toi _ O
193-5X10 /iCi/mL. The smallest reportable strontium-90 concentration was g
0.6-0.2X10 /iCi/mL. Except for the TAN Disposal well and wells 87 and 89,
all reportable concentrations of strontium-90 were either in or just south
of the ICPP.
The concentration of plutonium-238 in CFA-1 was 11*3X10 /^Ci/mL on
October 15, 1987. The well was resampled on January 5, 1988 and April 19,
1988. Plutonium-238 concentrations for both later samples were below the
reporting level. Water from the TAN Disposal well--which has not been used
to dispose of waste water since September 1972--contained 122-9X10 /^Ci/mL
of plutonium-238, 500+20X10"U /zCi/mL of plutonium-239, -240 (undivided) and
21*4X10" /zCi/mL of americium-241 on October 28, 1987; the presence of
these radionuclides was verified by resampling and reanalysis.
Cesium-137 and cobalt-60 concentrations in water from the TAN Disposali _ O
well were above the reporting level on October 28, 1987; 750-20X10" and
8.9-0.9X10 /iCi/mL, respectively. Subsequent resampling on January 11, O
1988, yielded water that contained 306-12X10" /^Ci/mL of cesium-137 but
cobalt-60 was not detected. The portions of the split samples from wells 88
and 89, that were analyzed by RESL, contained reportable concentrations of
cesium-137, however, when the backup samples from the wells were analyzed
23

cesium-137 was below the reporting level. In all instances, potassium-40
concentrations were less than the reporting level. Potassium-40 is a
naturally occurring radionuclide.
SELECTED REFERENCES
Bagby, J.C., White, L.J., and Jensen, R.G., 1985, Water-quality data for selected wells on or near the Idaho National Engineering Laboratory, 1949 through 1982: U.S. Geological Survey Open-File Report 84-714 (DOE/ID-22068), 800 p.
Barraclough, J.T., and Jensen, R.G., 1976, Hydrologic data for the Idaho National Engineering Laboratory site, Idaho, 1971 to 1973: U.S. Geological Survey Open-File Report 75-318 (IDO-22055), 52 p.
Barraclough, J.T., Lewis, B.D., and Jensen, R.G., 1981, Hydrologicconditions at the Idaho National Engineering Laboratory, Idaho, emphasis: 1974-1978: U.S. Geological Survey Water-Resources Investigations Open-File Report 81-526 (IDO-22060), 77 p.
----- 1982, Hydrologic conditions at the Idaho National EngineeringLaboratory, Idaho, emphasis: 1974-1978: U.S. Geological Survey Water- Supply Paper 2191, 52 p.
Barraclough, J.T., Robertson, J.B., and Janzer, V.J., 1976, Hydrology of the solid waste burial ground, as related to the potential migration of radionuclides, Idaho National Engineering Laboratory, with a section on Drilling and sample analysis, by L.G. Saindon: U.S. Geological Survey Open-File Report 76-471 (IDO-22056), 183 p.
Barraclough, J.T., Teasdale, W.E., and Jensen, R.G., 1967, Hydrology of the National Reactor Testing Station, Idaho, 1965: U.S. Geological Survey Open-File Report IDO-22048, 107 p.
Barraclough, J.T., Teasdale, W.E., Robertson, J.B., and Jensen, R.G., 1967, Hydrology of the National Reactor Testing Station, Idaho, 1966: U.S. Geological Survey Open-File Report IDO-22049, 95 p.
Bodnar, L.Z., and Percival, D.R., eds., 1982, Analytical Chemistry Branch Procedures Manual--Radiological and Environmental Sciences Laboratory: U.S. Department of Energy Report IDO-12096.
Chew, E.W., and Mitchell, R.G., 1988, 1987 Environmental Monitoring Program Report for the Idaho National Engineering Laboratory Site, U.S. Department of Energy, Idaho Operations Office Publication DOE/ID- 12082(87), 37 p.
Claassen, H.C., 1982, Guidelines and techniques for obtaining water samples that accurately represent the water chemistry of an aquifer: U.S. Geological Survey Open-File Report 82-1024, 49 p.
24
Currie, L.A., 1968, Limits for qualatative detection and quantitativedetermination: Application to radiochemistry: Analytical Chemistry, v. 40, no. 3, pp. 586-593.
Friedman, L.C. and Erdmann, D.E., 1982, Quality assurance practices for the chemical and biological analyses of water and fluvial sediments: U.S. Geological Survey Techniques of Water-Resources Investigations, Book 5, Chap. A6, 181 p.
Jones, P.H., 1961, Hydrology of waste disposal, National Reactor Testing Station, Idaho, an interim report: U.S. Atomic Energy Commission, Idaho Operations Office Publication, IDO-22042-USGS, 62 p.
Lewis, B.D., Eagleton, J.M., and Jensen R.G., 1985, Aqueous radioactive- and industrial-waste at the Idaho National Engineering Laboratory through 1982: U.S. Geological Survey Open-File Report 85-636 (DOE/ID-22069), 77 p.
Lewis, B.D., and Jensen, R.G., 1984, Hydrologic conditions at the Idaho National Engineering Laboratory, Idaho: 1979-1981 Update: U.S. Geological Survey Open-File Report 84-230 (IDO-22066), 65 p.
----- 1985, Hydrologic conditions at the Idaho National Engineering Laboratory, Idaho: 1979-1981 Update: U.S. Geological Survey Hydrologic Investigations Atlas HA-674, 2 sheets.
Morris, D.A. Barraclough, J.T., Chase, G.H., Teasdale, W.E., and Jensen, R.G., 1965, Hydrology of subsurface waste disposal, National Reactor Testing Station, Idaho, annual progress report, 1964: U.S. Atomic Energy Commission, Idaho Operations Office Publication, IDO-22047-USGS, 185 p.
Morris, D.A. Barraclough, J.T., Hogenson, G.M., Shuter, Eugene, Teasdale, W.E., Ralston, D.A., and Jensen, R.G., 1964, Hydrology of subsurface waste disposal, National Reactor Testing Station, Idaho, annual progress report, 1963: U.S. Atomic Energy Commission, Idaho Operations Office Publication, IDO-22046-USGS, 97 p.
Morris, D.A., Hogenson, G.M., Shuter, Eugene, and Teasdale, W.E., 1963,Hydrology of waste disposal, National Reactor Testing Station, Idaho, annual progress report, 1962: U.S. Atomic Energy Commission, Idaho Operations Office Publication, IDO-22044-USGS, 99 p.
Mundorff, M.J., Crosthwaite, E.G., and Kilburn, Chabot, 1964, Ground water for irrigation in the Snake River Basin in Idaho: U.S. Geological Survey Water-Supply Paper 1654, 224 p.
Nace, R.L., 1961, Geography, geology and water resources of the National Reactor Testing Station, Idaho. Part 4: Geologic and hydrologic aspects of waste management: U.S. Geological Survey Open-File Report IDO-22035, 223 p. (Revised 1964).
25

Polzer, W.L., Percival, D.R. , and Barraclough, J.T., 1976, Special analyses for plutonium and americium in water from the Snake River Plain aquifer U.S. Department of Energy, Idaho Operations Office Publication IDO-12081, 9 p.
Robertson, J.B., Schoen, Robert, and Barraclough, J.T., 1974, The influence of liquid waste disposal on the geochemistry of water at the National Reactor Testing Station, Idaho: 1952-1970: U.S. Geological Survey Open-File Report IDO-22053, 231 p.
Skougstad, M.W., Fishman, M.J., Friedman, L.C., Erdmann, D.E., and Duncan, S.S., eds., 1979, Methods for determination of inorganic substances in water and fluvial sediments: U.S. Geological Survey Techniques of Water-Resources Investigations, Book 5, Chap. Al, 626 p.
Stevens, H.H. Jr., Ficke, J.F., and Smoot, G.F., 1975, Water temperature-- influential factors, field measurement, and data presentation: U.S. Geological Survey Techniques of Water-Resources Investigations, Book 1, Chap. Dl, 65 p.
Thatcher, L.L. Janzer, V.J., and Edwards, K.W., 1977, Methods fordetermination of radioactive substances in water and fluvial sediments: U.S. Geological Survey Techniques of Water-Resources Investigations, Book 5, Chap. A5, 95 p.
Wood, W.W., 1976, Guidelines for collection and field analysis of ground- water samples for selected unstable constituents: U.S. Geological Survey Techniques of Water-Resources Investigations, Book 1, Chap. D2, 24 p. (Reprinted 1981).
26
Table 3
27
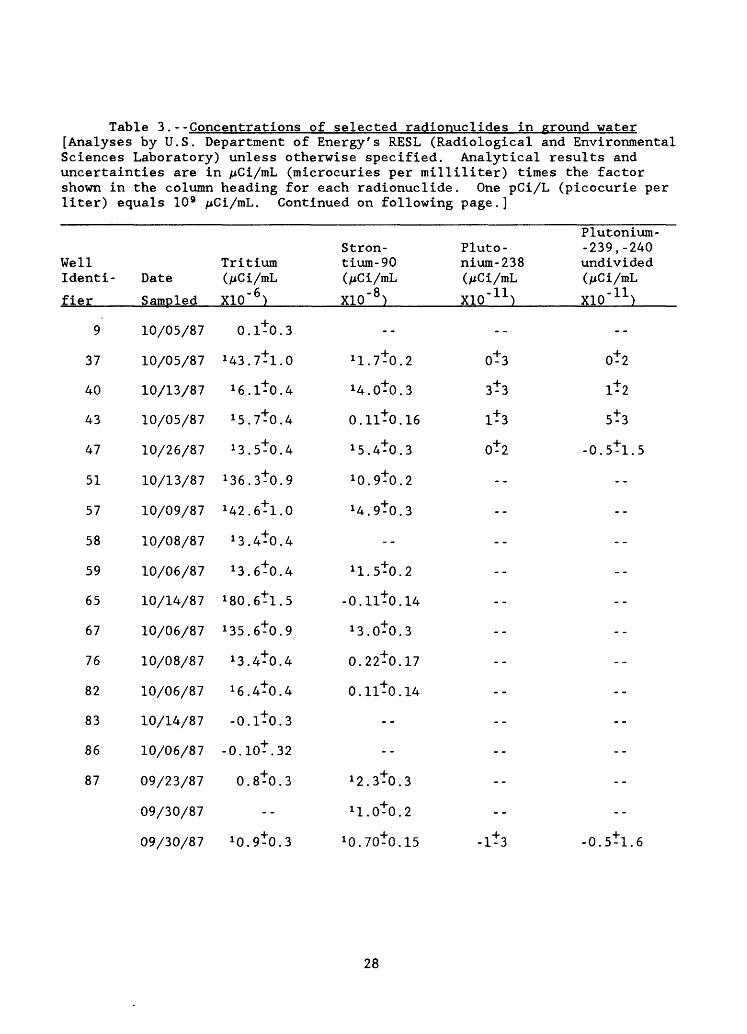
Table 3 . --Concentrations of selected radionuclides in ground water[Analyses by U.S. Department of Energy's RESL (Radiological and Environmental Sciences Laboratory) unless otherwise specified. Analytical results and uncertainties are in /iCi/mL (microcuries per milliliter) times the factor shown in the column heading for each radionuclide. One pCi/L (picocurie per liter) equals 10 9 /*Ci/mL. Continued on following page.]
WellIdenti
fier
9
37
40
43
47
51
57
58
59
65
67
76
82
83
86
87
Date
Sampled
10/05/87
10/05/87
10/13/87
10/05/87
10/26/87
10/13/87
10/09/87
10/08/87
10/06/87
10/14/87
10/06/87
10/08/87
10/06/87
10/14/87
10/06/87
09/23/87
09/30/87
09/30/87
Tritium(AtCi/mL X10" 6 )
0.1*0.3
143.7*1.0
16.1*0.4
15.7*0.4
13.5*0.4
136.3*0.9
142.6*1.0
1 3 . 4*0 . 4
13.6*0.4
180.6*1.5
135.6*0.9
i 3 . 4*0 . 4
16.4*0.4
-0.1*0.3
-0.10*. 32
0 . 8*0 . 3
--
10.9*0.3
Plutonium- Stron- Pluto- -239, -240 tium-90 nium-238 undivided(/iCi/mL (/^Ci/mL (/iCi/mL
X10" 8 ) X10" 11 ) X10" 11 )
i 1 . 7*0 . 2 0*3 0*2
14.0*0.3 3*3 1*2
0.11*0.16 1*3 5*3
15.4*0.3 0*2 -0.5*1.5
10.9*0.2
14.9*0.3
--
11.5*0.2
-0.11*0.14
13.0*0.3
0.22*0.17
0.11*0.14
--
--
12.3*0.3
il.0*0.2
10.70*0.15 -1*3 -0.5*1.6
28

Table 3.--Concentrations of selected radionuclides in ground water-Continued [Well identifier: see figures 2 and 3 for location of wells; Blank--indicates sample bottle contained deionized water. Remarks: QA--indicates a quality assurance sample; RML indicates the analyses was performed by the Radio activity Measurements Laboratory operated by EG&G Idaho, Inc. at the INEL.]
Well Identi
fier
Americium-241(/zCi/mLX10" 11 )
Cesium-137 Cobalt-60 (/zCi/mL (/zCi/mLX10" 8 ) X10" 7 )
Potas-sium-40(/jCi/mL
X10" 7 ) Remarks
9
37
40
43
47
51
57
58
59
65
67
76
82
83
86
87
-23
2+3
2+3
6±3
0 . 31 . 6
.lt3
0 . 8^0 . 7 3 . Q*l . 1
8^3 -1.2^1.4
QA Split-RML
QA Split-RESL
29
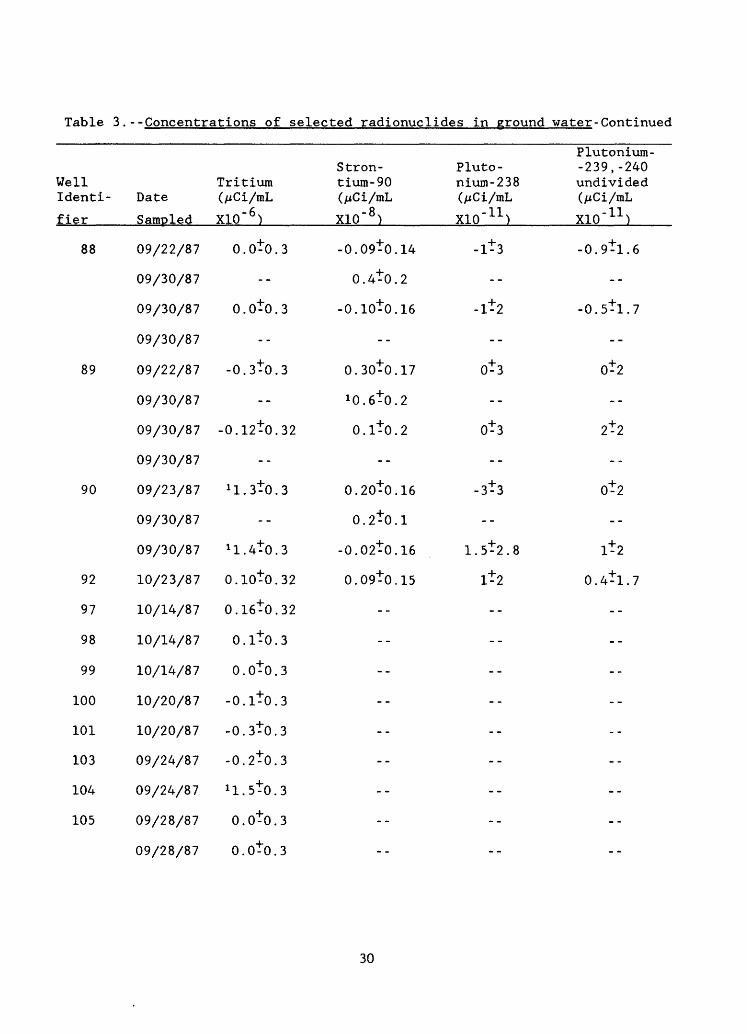
Table 3.--Concentrations of selected radionuclides in Eround water-Continued
Well Identi
fier
88
89
90
92
97
98
99
100
101
103
104
105
Date
Sampled
09/22/87
09/30/87
09/30/87
09/30/87
09/22/87
09/30/87
09/30/87
09/30/87
09/23/87
09/30/87
09/30/87
10/23/87
10/14/87
10/14/87
10/14/87
10/20/87
10/20/87
09/24/87
09/24/87
09/28/87
09/28/87
Tritium (/iCi/mLX10" 6 )
0.0+0.3
--
0.0+0.3
--
-0.3+0.3
--
-0.12+0.32
--
n.sto.s--
1 1 . 4+0 . 3
0.10+0.32
0.16+0.32
0.1+0.3
0.0+0.3
-0.1+0.3
-0.3+0.3
-0.2+0.3
1 1 . 5+0 . 3
0.0+0.3
0.0+0.3
Stron- Pluto- tium-90 nium-238 (jiCi/mL (jiCi/mL
X10" 8 ) X10" 11 )
-0.09+0.14 -1+3
0.4+0.2
-0.10+0.16 -1+2
--
0.30+0.17 0+3
iQ.6+0.2
0.1+0.2 0+3
--
0.20+0.16 -3+3
0.2+0.1
-0.02+0.16 1.5+2.8
0.09+0.15 1+2
--
--
--
--
--
--
--
--
Plutonium- -239, -240 undivided (jiCi/mLX10" 11 )
-0.9+1.6
--
-0.5+1.7
--
0*2
--
2+2
--
0+2
--
1+2
0.4+1.7
--
--
--
--
--
--
--
--
30

Table 3.--Concentrations of selected radionuclldes in ground water-Continued
Well Identi-
fier
Americium-241(/zCi/mLX10" 11 )
Cesium-137 (/zCi/mLX10" 8 )
Cobalt-60 (//Ci/mLX10" 7 )
Potas sium-40
X10" 7 ) Remarks
88
89
90
92
97
98
99
100
101
103
104
105
3*3
3*3
1*4
3*3
1.1*3.3
-3*2
5*3
0*3
3.0^-0.9
2.3*1.4
0.0*0.3
1.1*0.7
2*4
0.7*0.5
1*4
5*2
QA Split-RML
QA Split-RESL
QA Split-Recount
QA Split-RML
QA Split-RESL
QA Split-Recount
QA Split-RML
QA Split-RESL
Thief Sample
QA Replicate
31
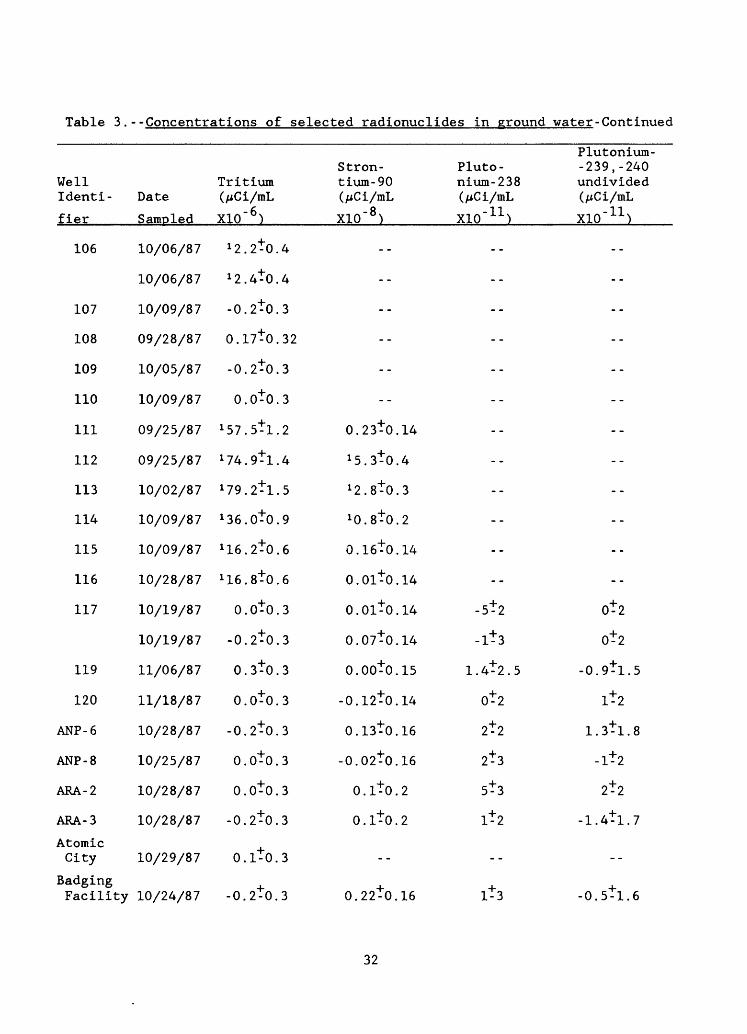
Table 3.--Concentrations of selected radlonuclldes in ground water-Continued
Well Identi
fier
106
107
108
109
110
111
112
113
114
115
116
117
119
120
ANP-6
ANP-8
ARA-2
ARA-3
Atomic City
Badging Facility
Date
Sampled
10/06/87
10/06/87
10/09/87
09/28/87
10/05/87
10/09/87
09/25/87
09/25/87
10/02/87
10/09/87
10/09/87
10/28/87
10/19/87
10/19/87
11/06/87
11/18/87
10/28/87
10/25/87
10/28/87
10/28/87
10/29/87
10/24/87
Tritium (/iCi/mLX10~ 6 )
1 2 . 2+0 . 4
1 2 . 4+0 . 4
-0.2+0.3
0.17+0.32
-0.2+0.3
0.0+0.3
1 57.5+1.2
1 74.9+1.4
1 79.2+1.5
136.0+0.9
U6.2+0.6
1 16. 8+0. 6
0.0+0.3
-0.2+0.3
0.3+0.3
0.0+0.3
-0.2+0.3
0.0+0.3
0.0+0.3
-0.2+0.3
0.1+0.3
-0.2+0.3
Stron tium-90 (/iCi/mLX10" 8 )
--
--
--
--
--
0.23+0.14
^5.3+0.4
12.8+0.3
iQ. 8+0. 2
0.16+0.14
0.01+0.14
0.01+0.14
0.07+0.14
0.00+0.15
-0.12+0.14
0.13+0.16
-0.02+0.16
0.1+0.2
0.1+0.2
0.22+0.16
Pluto nium-238 (/iCi/mLX10" 11 )
--
--
--
--
--
--
--
--
--
--
--
- 5t2-its
1.4t2.5
ot2
2t2
2ts
st3
lt2
its
Plutonium- -239, -240 undivided (/zCi/mLX10" 11 )
--
--
--
--
--
--
--
--
--
--
--
0+2
0+2
-0.9+1.5
1+2
1.3+1.8
-1+2
2+2
-1.4+1.7
-0.5+1.6
32

Table 3.--Concentrations of selected radionuclides in ground water-Continued
Americium Well -241 Cesium-137 Cobalt-60 I dent i- (/zCi/mL (^Ci/mL (^Ci/mL
fier XIO" 11 ) X10" 8 ) X10~ 7 )
106
107
108
109
110
111
112
113
114
115
116
117 6+3 -1.4+3.6
1.5+3.2 -0.6+1.4
119 -3+3 -2+4
120 1.1^3.4 1.3+2.6
ANP-6 1+3 -1.2+2.2
ANP-8 4+3 0+3
ARA-2 3+3 4+4
ARA-3 7+3 -1.1+3.2
Atomic City
Potas sium-40 (juCi/mL
X10 " ) Remarks
QA Replicate
QA Replicate
Badging Facility 4-3
33

Table 3.--Concentrations of selected radionuclldes In ground water-Continued
Well Identi
fier
CFA-1
CFA-2
EBR-I
EBR-II-1
EBR-II-2
Fire Sta tion 2
Highway 3
ICPP-1
ICPP-2
ICPP-4
IET-1
INEL-1WS
LOFT-1
LOFT -2
MTR Test
NPR Test
NRF-1
NRF-2
NRF-3
Date
Sampled
10/15/87
01/05/88
04/19/88
10/14/87
10/14/87
10/15/87
10/15/87
11/03/87
10/29/87
10/22/87
10/22/87
10/22/87
10/27/87
10/26/87
10/25/87
10/26/87
10/07/87
10/15/87
10/15/87
10/29/87
10/29/87
10/29/87
Tritium (/iCi/mLX10" 6 )
*32
*32
I 2l
-0.
-0
-0.
-0.
0
0
0
0
0
-0
0
-0.
-0
0
-0
0
0
-0.
.1+0.
.0+0.
--
.1*0.
10+0.
.1+0.
15+0.
11+0.
.0+0.
.4+0.
.0+0.
.0*0.
.0+0.
.2*0.
.0+0.
12+0.
.1*0.
.1*0.
.1*0.
.1*0.
.1*0.
15*0.
8
8
7
32
3
32
32
3
3
3
3
3
3
3
32
3
3
3
3
3
32
Stron tium-90 (/iCi/mLX10" 8 )
0
0
0
0
0
0
0
0
0
0
-0
0
0
0
0
0
.13*0.
--
.04+0.
. 12+0 .
.02+0.
.20+0.
.20+0.
--
.22+0.
. 10+0 .
.02+0.
.06+0.
--
. 04+0 .
. 16+0 .
--
.19+0.
.03+0.
0.2+0.
.11*0.
.06+0.
Pluto nium-238 (/iCi/mLX10" 11 )
14 ^l+S
0 . 14+0 . 43
14 -3+2
15 -1.6+4.1
14 -6+2
15 -2*2
15 1*2
--
15 0*2
13 -1.4+1.6
14 4+3
15 0+3
--
17 -1*3
15 0+3
--
16 2+3
14 0*3
2 7*3
15 0*2
15 1.0+1.9
Plutonium- -239, -240 undivided (/iCi/mLX10" 11 )
+2
0.12+0
-0.9
1
+
+
1
3
-1.4*1
-0.5
-0.1
-0.9
-1.4
-1
1
+
+
-
+
*
+
+
-
0.4+
-1.4
3
-1.8
0
-1
-1
*
-
t
+
+
+
+
1
1
-
1
1
2
2
-
1
1
-
2
1
2
2
2
.26
.6
.6
.6
.6
.6
.6
.7
.7
.7
34

Table 3.--Concentrations of selected radionuclides in ground water-Continued
Americium Well -241 I dent i- (/iCi/mL
fier X10" 11 )
CFA-1
CFA-2
EBR-I
EBR-II-1
EBR-II-2
Fire Sta tion 2
Highway 3
ICPP-1
ICPP-2
ICPP-4
IET-1
INEL-1WS
LOFT-1
LOFT -2
MTR Test
NPR Test
NRF-1
NRF-2
NRF-3
-2*3
5*4
0.7*0.4
-3*3
-2*5
2*3
-5*3
3*3
--
1*3
-4*2
3*3
1 . 2*3 . 0
--
3*3
-2*4
--
-4*3
1*3
2*3
4*3
5*3
Cesium-137 Cobalt-60 (/iCi/mL (/iCi/mLX10~ 8>> X10" 7 )
-1*4
--
--
6*3
1*4
-1.4*3.7
4*3
-6*4
--
1*3
-2*3
1*3
0.4*1.5
..
1 . 2*2 . 0
4*3
--
3*4
-1.4*3.9
0*3
-6*3
-2*4
Potas sium-40 (AiCi/mL
X10" 7 ) Remarks
--
Resampled
Resampled
--
--
--
--
--
--
--
--
QA Replicate
..
35
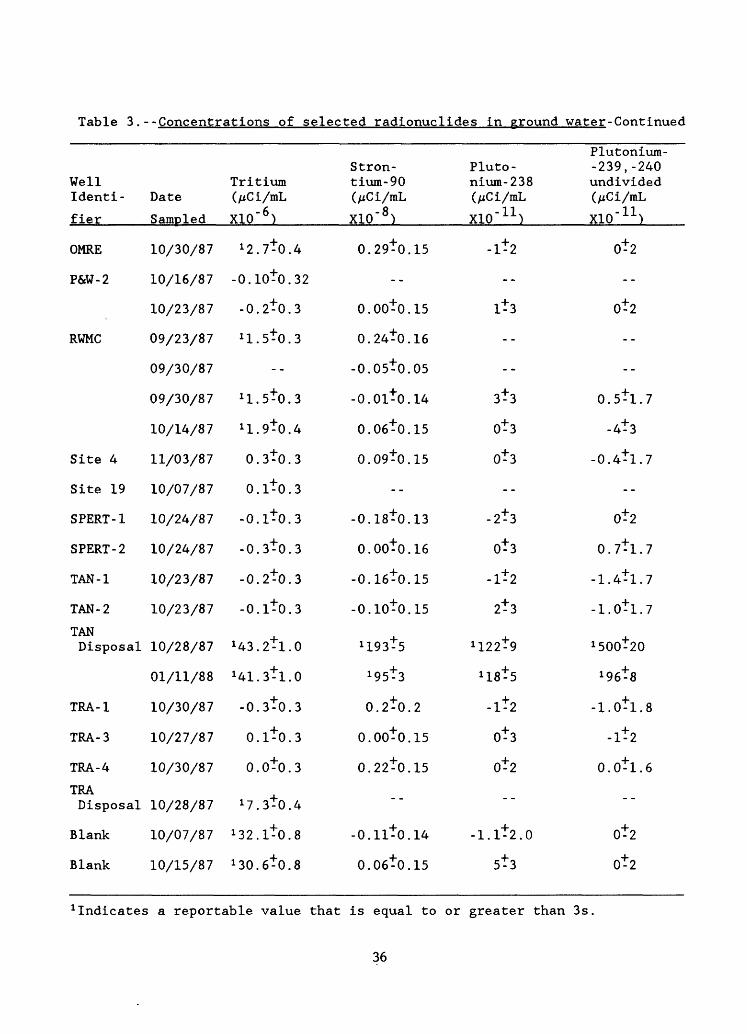
Table 3.--Concentrations of selected radlonuclides in ground water-Continued
Well Identi
fier
OMRE
P&W-2
RWMC
Site 4
Site 19
SPERT-1
S PERT -2
TAN-1
TAN- 2
TAN Disposal
TRA-1
TRA-3
TRA-4
TRA Disposal
Blank
Blank
Date
Sampled
10/30/87
10/16/87
10/23/87
09/23/87
09/30/87
09/30/87
10/14/87
11/03/87
10/07/87
10/24/87
10/24/87
10/23/87
10/23/87
10/28/87
01/11/88
10/30/87
10/27/87
10/30/87
10/28/87
10/07/87
10/15/87
Tritium (AiCi/mLX10" 6 )
1 2.7+-0.b
-0.10+0.32
-0.2+0.3
n.5+0.3
--
^.S+O.S
n.v+o.k0.3+0.3
0.1+0.3
-0.1+0.3
-0.3+0.3
-0.2+0.3
-0.1+0.3
*43. 2+1.0
J 41. 3+1.0
-0.3+0.3
0.1+0.3
0.0+0.3
^.S+O^
1 32.1+0.8
^o.e+o.s
Stron tium-90 (/*Ci/mLX10" 8 )
0.29+0.15
--
0.00+0.15
0.24+0.16
-0.05+0.05
-0.01+0.14
0.06+0.15
0.09+0.15
--
-0.18+0.13
0.00+0.16
-0.16+0.15
-0.10+0.15
!l93+5
^5+3
0.2+0.2
0.00+0.15
0.22+0.15
--
-0.11+0.14
0.06+0.15
Pluto nium-238 (/*Ci/mLX10" 11 )
-1+2
--
its--
--
3+3
0+3
0+3
--
-2t3
0*3
-lt2
2*3
l !22+9
H8+5
-lt2
ot3
ot2--
-1.1+2.0
5t3
Plutonium- -239, -240 undivided (/^Ci/rnLX10" 11 )
0+2
--
0+2
--
--
Q. 5+1.7
-4+3
-0.4+1.7
--
0+2
0.7+1.7
-1.4+1.7
-1.0+1.7
1 500+20
*96+B
-1.0+1.8
-1+2
0.0+1.6
--
o+2
ot2
1 Indicates a reportable value that is equal to or greater than 3s.
36

Table 3.--Concentrations of selected radionuclides in ground water-Continued
Well Identi
fier
OMRE
P&W-2
RWMC
Site 4
Site 19
SPERT-1
S PERT -2
TAN-1
TAN- 2
TAN Disposal
TRA-1
TRA-3
TRA-4
TRA Disposal
Blank
Blank
Americium -241 (/iCi/mLX10" 11 )
5t3
--
3*3
--
--
1 . 1*3 . 0
-2*5
1*3
--
5+34t3
6t3
-lt2
1 21*4
'lots5t3
-1.0*2.8
-3t3
8^3
2t3
Cesium-137 Cobalt-60 (/zCi/mL (/zCi/mL
X10" 8 ) X10" 7 )
-2*2
--
ot3
0.6*0.7
..
-2.8*1.4
-st40+3
--
0*3
0*4
1 . 1*2 . 8
7*3
1 750*20 1 8. 9*0. 9
1 306*12
2*4
2*4
0.6*1.4
3*4
-1.6*3.5
5*3
Potas sium-40 (/iCi/mL
X10 ) Remarks
--
--
--
--
QA Split-RML
QA Split -RESL
--
--
--
Resampled
--
QA-Deionized Blank
QA Deionized Blank
37
Related Documents