RADIOMERIC AND GEOMETRIC ANALYSIS OF WORLDVIEW-2 STEREO SCENES D. Poli a , E. Angiuli a , F. Remondino b a Institute for the Protection and Security of the Citizens (IPSC), Joint Research Center (JRC), via Fermi, Ispra (VA), Italy – (daniela.poli, emanuele.angiuli)@jrc.ec.europa.eu b 3D Optical Metrology Unit, Bruno Kessler Foundation (FBK), Trento, Italy Web: http://3dom.fbk.eu, E-mail: [email protected] Commission I, WG I/4 KEY WORDS: WorldView-2, radiometry, image orientation, DSM, 3D modeling, evaluation ABSTRACT: WorldView-2 (WV-2) is DigitalGlobe's latest very high resolution optical sensor. Launched on October 8, 2009, and fully operational since January 5, 2010, it flies along a sun-synchronous orbit at an altitude of 770km. The sensor is able to acquire panchromatic imagery at 0.46m ground resolution (0.52m at 20° off-nadir) and multispectral images in eight spectral bands at 1.8m resolution. In addition to the four typical multispectral bands (blue, green, red, near infrared), the sensors scans the coastal (400- 450nm), yellow (585-625nm), red edge (705-745nm) and near infrared-2 (860-1040nm) bands. Stereo images can be planned thanks to the ability of the sensor to rotate off-nadir up to +/-45°. This paper describes the preliminary analysis on WV-2 carried out at the EU Joint Research Center (JRC) in Ispra (Italy) by the ISFEREA Team of the Institute for the Protection and Security of the Citizen (IPSC), and in collaboration with the Bruno Kessler Foundation (FBK) in Trento (Italy). The purpose of the study is to evaluate the radiometric and geometric properties of the sensor and its potentials for 3D information extraction. The images used for the analysis are a stereopair over North-West Italy, where ISFEREA is establishing a testfield. The radiometry of the images is evaluated through different methods, including the estimation of the noise level (standard deviation of the digital number) in homogeneous and non-homogeneous areas. The images are oriented with RPC-based approach: using some GCP (ground control points), the given Rational Polynomial Coefficients (RPC) are improved with an affine transformation to compensate residual systematic errors. For automatic 3D information assessment, a Digital Surface Model (DSM) is generated with the SAT-PP software package and 3D building models are extracted semi-automatically with the CyberCity-Modeler (CCM) package. The methodology and preliminary results are described and discussed. 1. INTRODUCTION WorldView-2 (WV2), the latest satellite in DigitalGlobe’s constellation, was launched on 8 th October 2009 from Vandenberg Air Force Base, CA (USA) and is fully operational since 5 th January 2010. WV2 belongs to the family of very high resolution sensors, as it is capable to reach a panchromatic ground resolution of less than half meter (up to 0.46m ground sample distance – GSD- at nadir) and a multispectral resolution up to 1.84m, although images are distributed at 0.50m GSD (panchromatic), and 1.84m (multispectral). The BCP-50000 spacecraft, manufactured by BATC (Ball Aerospace and Technologies Corporation) of Boulder, CO (USA), is 3-axis stabilized using star trackers and solid-state IRU and GPS for sensing. A Control Moment Gyro (CMG) assembly is employed as actuators for highly responsive pointing control. As result, an instantaneous geolocation accuracy of ≤ 500 m is provided at any image start and stop (EoPortal Website, 2010, Figure 1). The satellite flies at an altitude of 770km along a sun- synchronous orbit with 10:30am descending node and 100 minutes period giving an average revisit time of 1.1days. The camera, called WV110, was designed and developed at ITT Corporation's Space Systems Division of Rochester, NY (USA). With respect of other very high resolution sensors, WV110 acquires images in 8 multispectral bands: in addition to the four typical multispectral bands (blue, green, red, near infrared), the sensors scans in the coastal (400-450nm), yellow (585-625nm), red edge (705-745nm) and near infrared-2 (860-1040nm) spectral ranges. The pushbroom sensor consists of a single lens (13.3m focal length) and CCD lines with more than 35000 detectors with 8 m size (panchromatic). It scans the Earth in mono or stereo mode in two directions (forward, reverse). Stereo images are collected in a single pass thanks to the ability of the sensor to rotate off-nadir up to +/-45°. The swath width is 16.4km at nadir. Table 1 summarizes the sensor and spacecraft characteristics. Figure 1. Common spacecraft bus of WorldView-1 and -2 (image credit: DigitalGlobe). The aim of this paper is to report the first investigation carried out in the ISFEREA Action at the EU Joint Research Center

Welcome message from author
This document is posted to help you gain knowledge. Please leave a comment to let me know what you think about it! Share it to your friends and learn new things together.
Transcript
RADIOMERIC AND GEOMETRIC ANALYSIS OF WORLDVIEW-2 STEREO SCENES
D. Polia, E. Angiulia, F. Remondinob
a Institute for the Protection and Security of the Citizens (IPSC), Joint Research Center (JRC), via Fermi, Ispra (VA),
Italy – (daniela.poli, emanuele.angiuli)@jrc.ec.europa.eu b 3D Optical Metrology Unit, Bruno Kessler Foundation (FBK), Trento, Italy
Web: http://3dom.fbk.eu, E-mail: [email protected]
Commission I, WG I/4
KEY WORDS: WorldView-2, radiometry, image orientation, DSM, 3D modeling, evaluation
ABSTRACT:
WorldView-2 (WV-2) is DigitalGlobe's latest very high resolution optical sensor. Launched on October 8, 2009, and fully
operational since January 5, 2010, it flies along a sun-synchronous orbit at an altitude of 770km. The sensor is able to acquire
panchromatic imagery at 0.46m ground resolution (0.52m at 20° off-nadir) and multispectral images in eight spectral bands at 1.8m
resolution. In addition to the four typical multispectral bands (blue, green, red, near infrared), the sensors scans the coastal (400-
450nm), yellow (585-625nm), red edge (705-745nm) and near infrared-2 (860-1040nm) bands. Stereo images can be planned thanks
to the ability of the sensor to rotate off-nadir up to +/-45°.
This paper describes the preliminary analysis on WV-2 carried out at the EU Joint Research Center (JRC) in Ispra (Italy) by the
ISFEREA Team of the Institute for the Protection and Security of the Citizen (IPSC), and in collaboration with the Bruno Kessler
Foundation (FBK) in Trento (Italy). The purpose of the study is to evaluate the radiometric and geometric properties of the sensor
and its potentials for 3D information extraction. The images used for the analysis are a stereopair over North-West Italy, where
ISFEREA is establishing a testfield. The radiometry of the images is evaluated through different methods, including the estimation of
the noise level (standard deviation of the digital number) in homogeneous and non-homogeneous areas. The images are oriented with
RPC-based approach: using some GCP (ground control points), the given Rational Polynomial Coefficients (RPC) are improved with
an affine transformation to compensate residual systematic errors. For automatic 3D information assessment, a Digital Surface Model
(DSM) is generated with the SAT-PP software package and 3D building models are extracted semi-automatically with the
CyberCity-Modeler (CCM) package. The methodology and preliminary results are described and discussed.
1. INTRODUCTION
WorldView-2 (WV2), the latest satellite in DigitalGlobe’s
constellation, was launched on 8th October 2009 from
Vandenberg Air Force Base, CA (USA) and is fully operational
since 5th January 2010.
WV2 belongs to the family of very high resolution sensors, as it
is capable to reach a panchromatic ground resolution of less
than half meter (up to 0.46m ground sample distance – GSD- at
nadir) and a multispectral resolution up to 1.84m, although
images are distributed at 0.50m GSD (panchromatic), and
1.84m (multispectral).
The BCP-50000 spacecraft, manufactured by BATC (Ball
Aerospace and Technologies Corporation) of Boulder, CO
(USA), is 3-axis stabilized using star trackers and solid-state
IRU and GPS for sensing. A Control Moment Gyro (CMG)
assembly is employed as actuators for highly responsive
pointing control. As result, an instantaneous geolocation
accuracy of ≤ 500 m is provided at any image start and stop
(EoPortal Website, 2010, Figure 1).
The satellite flies at an altitude of 770km along a sun-
synchronous orbit with 10:30am descending node and 100
minutes period giving an average revisit time of 1.1days.
The camera, called WV110, was designed and developed at ITT
Corporation's Space Systems Division of Rochester, NY (USA).
With respect of other very high resolution sensors, WV110
acquires images in 8 multispectral bands: in addition to the four
typical multispectral bands (blue, green, red, near infrared), the
sensors scans in the coastal (400-450nm), yellow (585-625nm),
red edge (705-745nm) and near infrared-2 (860-1040nm)
spectral ranges.
The pushbroom sensor consists of a single lens (13.3m focal
length) and CCD lines with more than 35000 detectors with
8 m size (panchromatic). It scans the Earth in mono or stereo
mode in two directions (forward, reverse). Stereo images are
collected in a single pass thanks to the ability of the sensor to
rotate off-nadir up to +/-45°. The swath width is 16.4km at
nadir. Table 1 summarizes the sensor and spacecraft
characteristics.
Figure 1. Common spacecraft bus of WorldView-1 and -2
(image credit: DigitalGlobe).
The aim of this paper is to report the first investigation carried
out in the ISFEREA Action at the EU Joint Research Center
(JRC) in Ispra (Italy) and in collaboration with the Bruno
Kessler Foundation (FBK) in Trento (Italy) on a WV-2
stereopair acquired on January 31st, 2010 over North Italy. The
analysis includes the radiometric and geometric characteristics
of the images, the automatic digital surface modelling and 3D
building extraction. At the time of writing, references to other
WV-2 works were not available in literature for comparison.
Table 1. Characteristics of WorldView-2 spacecraft and
imaging system.
Launch Date October 8, 2009
Launch Site Vandenberg Air Force Base, California
Mission Life 7.25 years
Orbital altitude 770 km
Period 100 minutes
Imager type Pushbroom imager
Imaging mode Panchromatic (Pan) Multispectral (MS)
Spectral range
450-800 nm
400-450 nm (coastal)
450-510 nm (blue)
510-580 nm (green)
585-625 nm (yellow)
630-690 nm (red)
705-745 nm (red edge)
770-895 nm (NIR1)
860-1040 nm (NIR2)
Spatial
resolution at
nadir
0.46 m GSD (0.52 m
at 20º off-nadir)
1.8 m GSD (2.4 m at 20º
off-nadir)
Detectors Si CCD array (8 µm
pixel size) with a row
of > 35,000 detectors
Si CCD 4 arrays (32 µm
pixel size) with a row of
> 9,300 detectors
Swath width
16.4 km (multiple adjoining paths can be
imaged in a target area in a single orbit pass
due to spacecraft agility)
Data
quantization
11 bit
Geolocation
accuracy of
imagery
≤ 3 m (using a GPS receiver, a gyroscope and a
star tracker) without any GCP (Ground Control
Points)
Optics
TMA telescope with an aperture diameter of
1.1 m, focal length = 13.3 m, f/12
TDI 6 selectable levels from 8 to 64
FOV > 1.28º
2. DATA DESCRIPTION
In the Institute for the Protection and Security of the Citizens
(IPSC) at JRC, the ISFEREA Action is establishing a test site in
North Italy, in the province of Varese for algorithm validation
and sensor performance analysis.
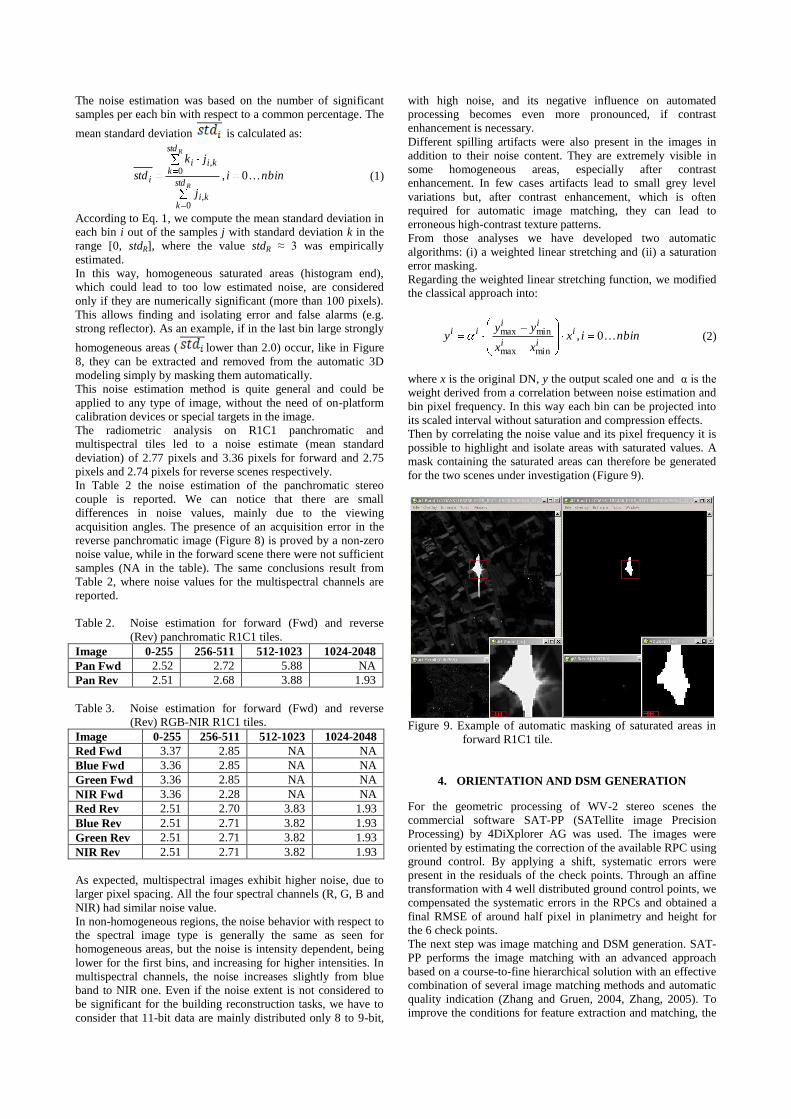
A stereo pair of WV-2 (product level “Stereo1B”) over the test
area was acquired on January 31st, 2010, few weeks after WV-2
reached the fully operational state. The first scene, hereafter
called “forward”, was acquired at 10:33 am in forward scanning
direction with a mean in-track viewing angle of 11.1 deg. The
second scene, hereafter called “reverse”, was acquired in
reverse scanning direction with a mean in-track angle of -33.9
deg. The available channels are the panchromatic and four
multispectral ones: blue, green, red and near infrared. Due to
the different viewing angles, the two scenes have different
GSD. The forward scene has a mean GSD of 0.51m
(panchromatic) and 2.03m (multispectral), while the reverse one
has a mean GSD of 0.66m (panchromatic) and 2.65m
(multispectral). Examples of differences in resolution and
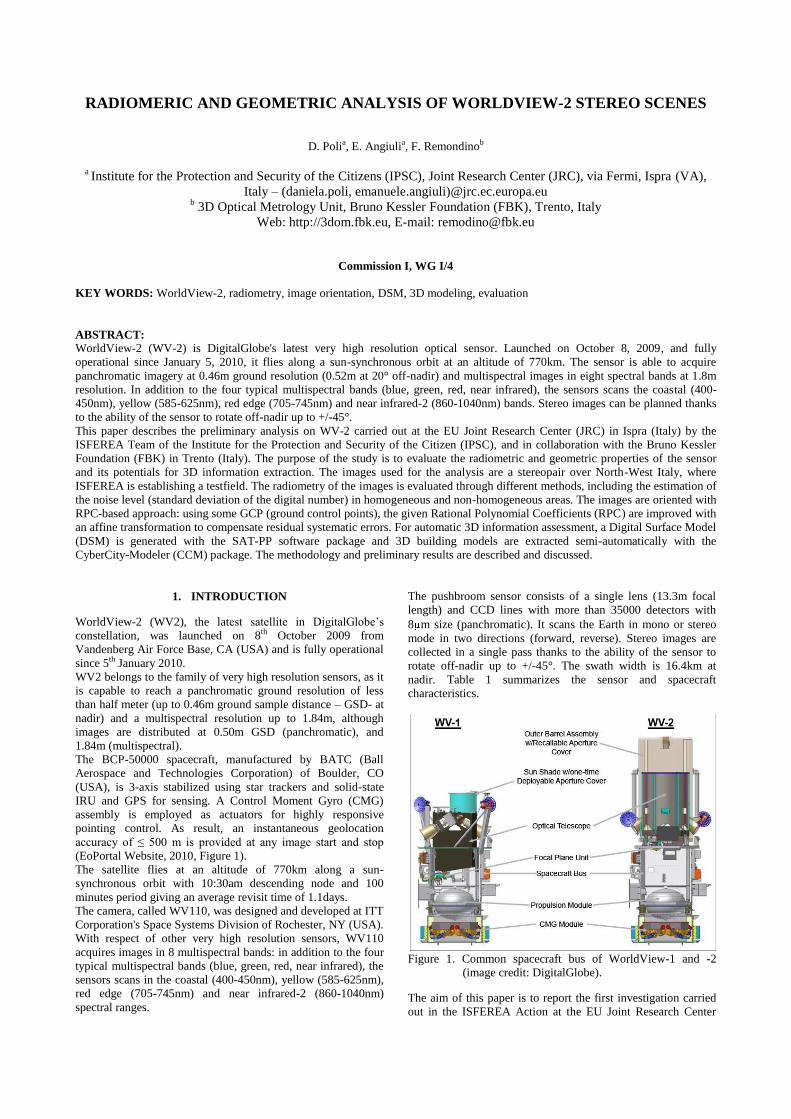
illumination between the two scenes are shown in Figure 4. Due
to the large image size, each scene was provided in three tiles
(R1C1, R2C1 and R3C1), with the corresponding metadata and
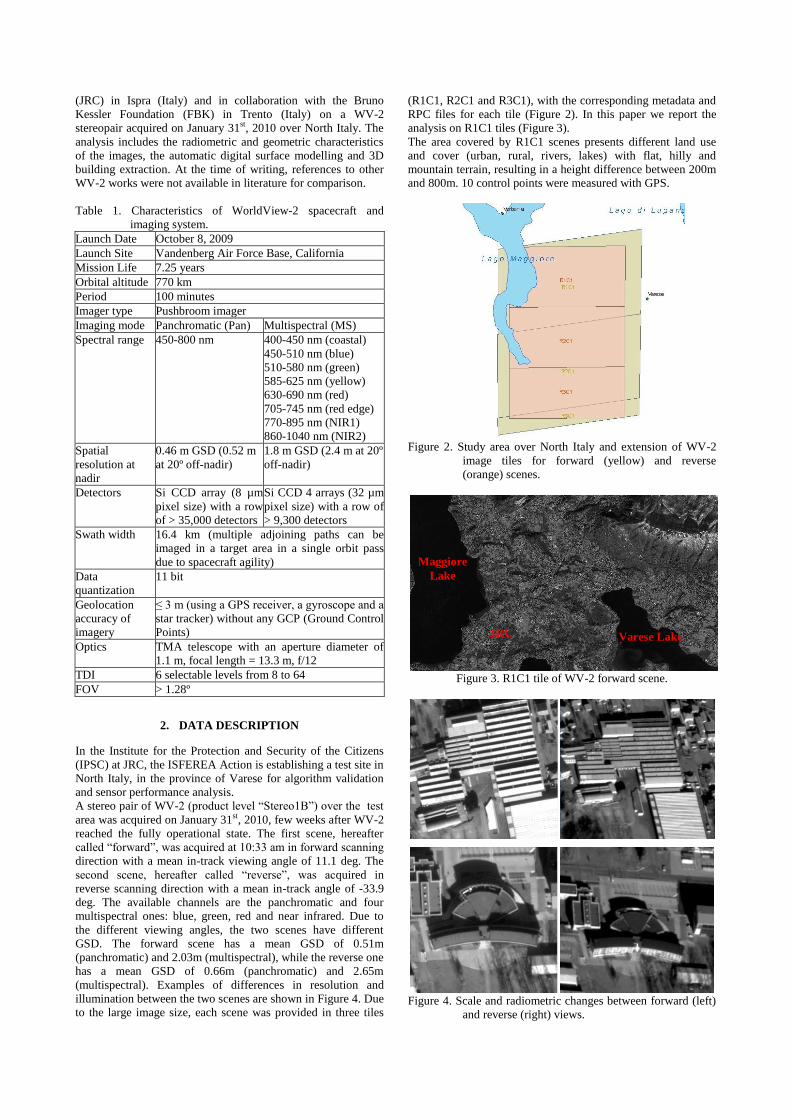
RPC files for each tile (Figure 2). In this paper we report the
analysis on R1C1 tiles (Figure 3).
The area covered by R1C1 scenes presents different land use
and cover (urban, rural, rivers, lakes) with flat, hilly and
mountain terrain, resulting in a height difference between 200m
and 800m. 10 control points were measured with GPS.
Figure 2. Study area over North Italy and extension of WV-2
image tiles for forward (yellow) and reverse
(orange) scenes.
Figure 3. R1C1 tile of WV-2 forward scene.
Figure 4. Scale and radiometric changes between forward (left)
and reverse (right) views.
JRC Varese Lake
Maggiore
Lake

3. RADIOMETRIC ANALYSIS
Operational aspects of the image acquisition have a deeper
effect on the homogeneity, or non-homogeneity, of image
quality than on the specific radiometric characteristics of the
sensor system.
As an example, large changes in image quality and suitability
for automated feature extraction are strongly affected by sensor
view and sun acquisition angles and by atmospheric conditions.
These influences are well-known, but it’s not immediate to
compensate the effects induced by each component.
Even if data is available at 11-bit, we can easily notice from
images histogram that the main information is distributed
between 0 and 10 bit (Figure 5).
Figure 5. Histogram of panchromatic channel (reverse image).
This distribution can cause problems when we represent the
image in an 8-bit mode, leading to saturation effects that false
analysis and 3D modeling.
The stretching of the DN distribution in a more uniform 0-255
scale (8-bit) can easily destroy the absolute radiometric
accuracy of the image. The “classical linear stretching”1, then,
has to be modified in order to compensate and solve, where
possible, saturation problems.
As shown in Figure 6, a linear stretch generates a data value
distribution which compresses the information for low DN and
consequently saturates pixels with high values. In particular, all
the information contained in the DN interval 1-1024 is
compressed in 0-128, while the rest of the histogram, which
contains only a small part of the data, has the same
“quantization” dimension.
Figure 6. Histogram stretching result for reverse image. Left: 11
bit, right: 8bit.
The result of this procedure leads in many cases to evident
problems, as reported in Figure 7. In order to mitigate those
problems we have analyzed noise information on the entire
1 Scaling of the DN using the equation of a straight line:
y=mx+q where x is the original DN, y the output scaled one,
m is the angular coefficient and q is a constant and
corresponds to the minimum scaled DN.
image, identifying “noise-masks” used for a “weighted-linear”
stretching filter. With the term “noise”, we are referring to all
the anomalies and non-homogeneity that can be found in the
image. We have then to distinguish between the “classical”
noise effects, like atmospheric and sensor ones, and the non-
homogeneity ones. This second case can be easily described as
a “filth” analysis of homogeneous areas. From now on, we will
commonly group all the anomalies under the “noise” term.
During the analysis of the stereo couple, some acquisition
problems (Figure 8) were also found, probably due to sensor
saturation.
To define noise characteristics we have examined homogeneous
(smooth surfaces) and non-homogeneous areas (i.e. the whole
image except homogeneous areas). The use of non-
homogeneous areas for image noise evaluation is due to the fact
that large homogeneous areas are not always present. In this
way, we can analyze the noise variation as function of intensity
(noise for CCD-images is not additive but intensity-dependent).
Figure 7. Effects of linear stretching applied to forward scene
for 11-to-8-bit reduction. Left: after linear stretching
(8 bit), right: before linear stretching (11 bit).
The noise analysis was based on the use of standard deviation,
as in (Pateraki, 2005). The homogeneous areas were extracted
automatically in 5x5 pixels windows. Small windows are
justified since homogeneous areas often show low DN value
variations, which would lead to higher standard deviation if it
were computed from the whole area. For non-homogeneous
areas, a small window is necessary for getting small
homogeneous areas between edges.
Each image is divided into 4 bins (0-255, 256-511, 512-1023,
1024-2047) and, for each bin, standard deviation has been
computed.
Figure 8. Sensor saturation problems. Left: forward scene, right:
reverse scene.
The noise estimation was based on the number of significant
samples per each bin with respect to a common percentage. The
mean standard deviation is calculated as:
nbini
j
jk
stdR
R
std
kki
std
kkii
i 0,
0,
0,
(1)
According to Eq. 1, we compute the mean standard deviation in
each bin i out of the samples j with standard deviation k in the
range [0, stdR], where the value stdR ≈ 3 was empirically
estimated.
In this way, homogeneous saturated areas (histogram end),
which could lead to too low estimated noise, are considered
only if they are numerically significant (more than 100 pixels).
This allows finding and isolating error and false alarms (e.g.
strong reflector). As an example, if in the last bin large strongly
homogeneous areas ( lower than 2.0) occur, like in Figure
8, they can be extracted and removed from the automatic 3D
modeling simply by masking them automatically.
This noise estimation method is quite general and could be
applied to any type of image, without the need of on-platform
calibration devices or special targets in the image.
The radiometric analysis on R1C1 panchromatic and
multispectral tiles led to a noise estimate (mean standard
deviation) of 2.77 pixels and 3.36 pixels for forward and 2.75
pixels and 2.74 pixels for reverse scenes respectively.
In Table 2 the noise estimation of the panchromatic stereo
couple is reported. We can notice that there are small
differences in noise values, mainly due to the viewing
acquisition angles. The presence of an acquisition error in the
reverse panchromatic image (Figure 8) is proved by a non-zero
noise value, while in the forward scene there were not sufficient
samples (NA in the table). The same conclusions result from
Table 2, where noise values for the multispectral channels are
reported.
Table 2. Noise estimation for forward (Fwd) and reverse
(Rev) panchromatic R1C1 tiles.
Image 0-255 256-511 512-1023 1024-2048
Pan Fwd 2.52 2.72 5.88 NA
Pan Rev 2.51 2.68 3.88 1.93
Table 3. Noise estimation for forward (Fwd) and reverse
(Rev) RGB-NIR R1C1 tiles.
Image 0-255 256-511 512-1023 1024-2048
Red Fwd 3.37 2.85 NA NA
Blue Fwd 3.36 2.85 NA NA
Green Fwd 3.36 2.85 NA NA
NIR Fwd 3.36 2.28 NA NA
Red Rev 2.51 2.70 3.83 1.93
Blue Rev 2.51 2.71 3.82 1.93
Green Rev 2.51 2.71 3.82 1.93
NIR Rev 2.51 2.71 3.82 1.93
As expected, multispectral images exhibit higher noise, due to
larger pixel spacing. All the four spectral channels (R, G, B and
NIR) had similar noise value.
In non-homogeneous regions, the noise behavior with respect to
the spectral image type is generally the same as seen for
homogeneous areas, but the noise is intensity dependent, being
lower for the first bins, and increasing for higher intensities. In
multispectral channels, the noise increases slightly from blue
band to NIR one. Even if the noise extent is not considered to
be significant for the building reconstruction tasks, we have to
consider that 11-bit data are mainly distributed only 8 to 9-bit,
with high noise, and its negative influence on automated
processing becomes even more pronounced, if contrast
enhancement is necessary.
Different spilling artifacts were also present in the images in
addition to their noise content. They are extremely visible in
some homogeneous areas, especially after contrast
enhancement. In few cases artifacts lead to small grey level
variations but, after contrast enhancement, which is often
required for automatic image matching, they can lead to
erroneous high-contrast texture patterns.
From those analyses we have developed two automatic
algorithms: (i) a weighted linear stretching and (ii) a saturation
error masking.
Regarding the weighted linear stretching function, we modified
the classical approach into:
nbinixxx
yyy i
ii
iiii 0,
minmax
minmax (2)
where x is the original DN, y the output scaled one and α is the
weight derived from a correlation between noise estimation and
bin pixel frequency. In this way each bin can be projected into
its scaled interval without saturation and compression effects.
Then by correlating the noise value and its pixel frequency it is
possible to highlight and isolate areas with saturated values. A
mask containing the saturated areas can therefore be generated
for the two scenes under investigation (Figure 9).
Figure 9. Example of automatic masking of saturated areas in
forward R1C1 tile.
4. ORIENTATION AND DSM GENERATION
For the geometric processing of WV-2 stereo scenes the
commercial software SAT-PP (SATellite image Precision
Processing) by 4DiXplorer AG was used. The images were
oriented by estimating the correction of the available RPC using
ground control. By applying a shift, systematic errors were
present in the residuals of the check points. Through an affine
transformation with 4 well distributed ground control points, we
compensated the systematic errors in the RPCs and obtained a
final RMSE of around half pixel in planimetry and height for
the 6 check points.
The next step was image matching and DSM generation. SAT-
PP performs the image matching with an advanced approach
based on a course-to-fine hierarchical solution with an effective
combination of several image matching methods and automatic
quality indication (Zhang and Gruen, 2004, Zhang, 2005). To
improve the conditions for feature extraction and matching, the
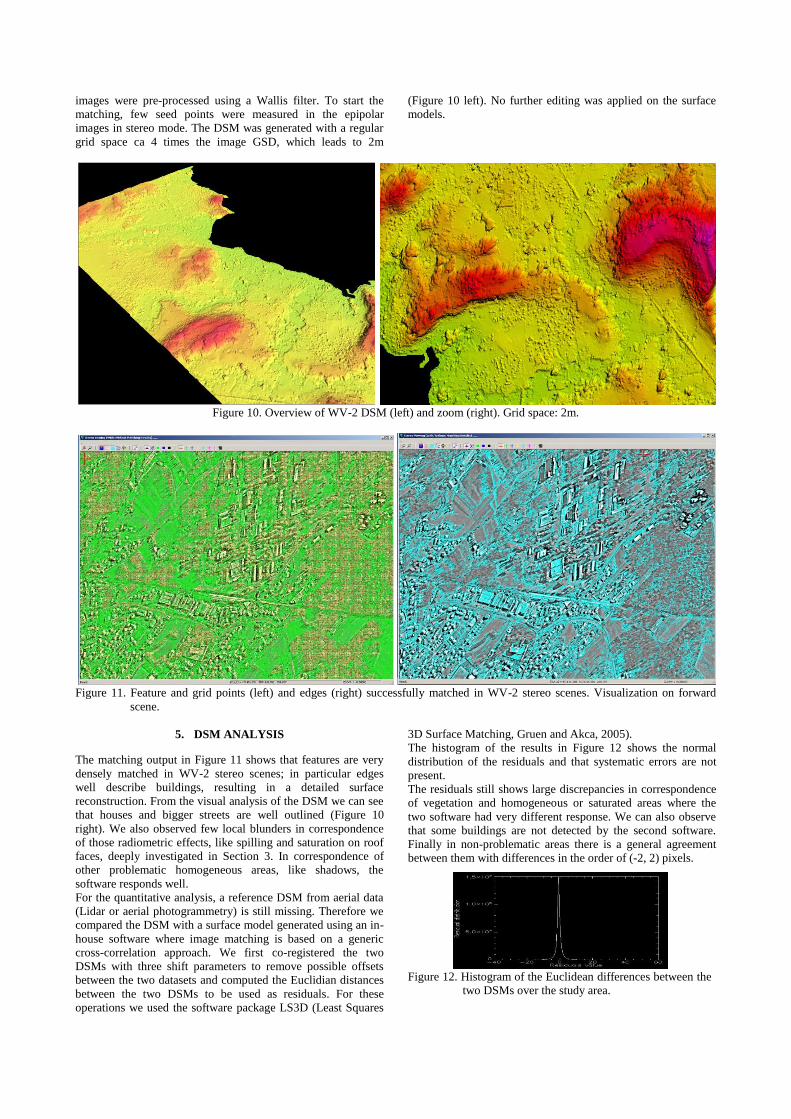
images were pre-processed using a Wallis filter. To start the
matching, few seed points were measured in the epipolar
images in stereo mode. The DSM was generated with a regular
grid space ca 4 times the image GSD, which leads to 2m
(Figure 10 left). No further editing was applied on the surface
models.
Figure 10. Overview of WV-2 DSM (left) and zoom (right). Grid space: 2m.
Figure 11. Feature and grid points (left) and edges (right) successfully matched in WV-2 stereo scenes. Visualization on forward
scene.
5. DSM ANALYSIS
The matching output in Figure 11 shows that features are very
densely matched in WV-2 stereo scenes; in particular edges
well describe buildings, resulting in a detailed surface
reconstruction. From the visual analysis of the DSM we can see
that houses and bigger streets are well outlined (Figure 10
right). We also observed few local blunders in correspondence
of those radiometric effects, like spilling and saturation on roof
faces, deeply investigated in Section 3. In correspondence of
other problematic homogeneous areas, like shadows, the
software responds well.
For the quantitative analysis, a reference DSM from aerial data
(Lidar or aerial photogrammetry) is still missing. Therefore we
compared the DSM with a surface model generated using an in-
house software where image matching is based on a generic
cross-correlation approach. We first co-registered the two
DSMs with three shift parameters to remove possible offsets
between the two datasets and computed the Euclidian distances
between the two DSMs to be used as residuals. For these
operations we used the software package LS3D (Least Squares
3D Surface Matching, Gruen and Akca, 2005).
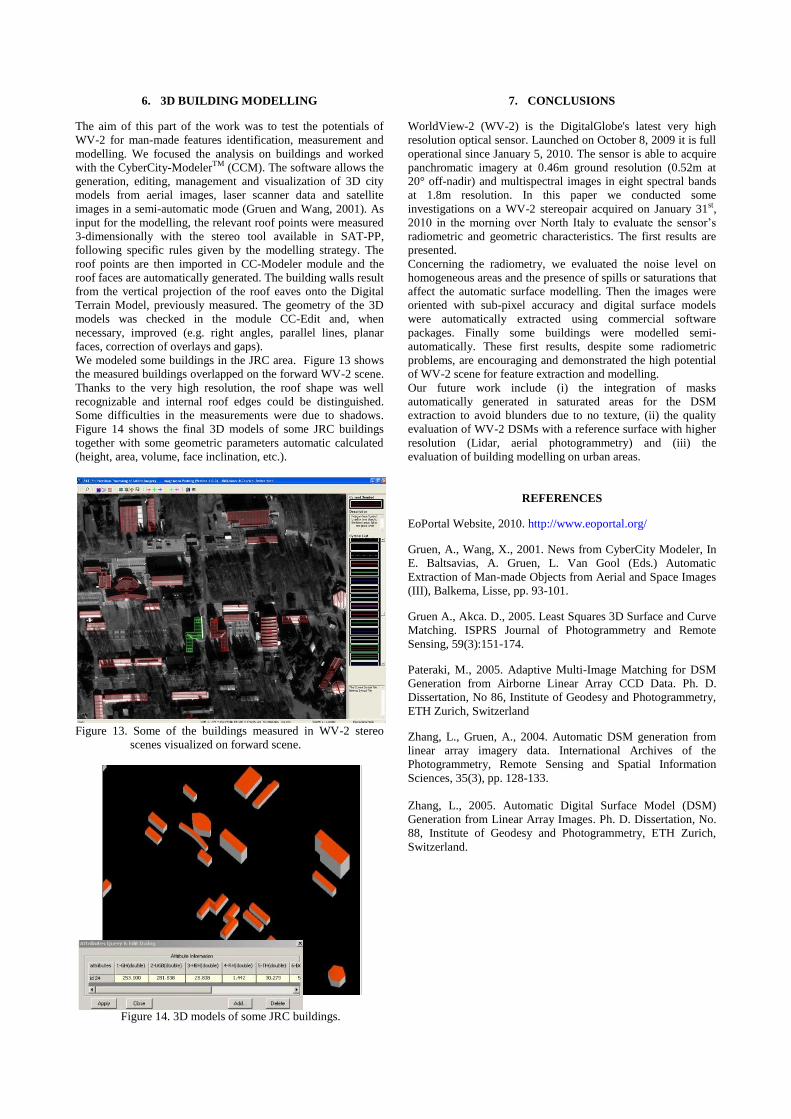
The histogram of the results in Figure 12 shows the normal
distribution of the residuals and that systematic errors are not
present.
The residuals still shows large discrepancies in correspondence
of vegetation and homogeneous or saturated areas where the
two software had very different response. We can also observe
that some buildings are not detected by the second software.
Finally in non-problematic areas there is a general agreement
between them with differences in the order of (-2, 2) pixels.
Figure 12. Histogram of the Euclidean differences between the
two DSMs over the study area.
6. 3D BUILDING MODELLING
The aim of this part of the work was to test the potentials of
WV-2 for man-made features identification, measurement and
modelling. We focused the analysis on buildings and worked
with the CyberCity-ModelerTM (CCM). The software allows the
generation, editing, management and visualization of 3D city
models from aerial images, laser scanner data and satellite
images in a semi-automatic mode (Gruen and Wang, 2001). As
input for the modelling, the relevant roof points were measured
3-dimensionally with the stereo tool available in SAT-PP,
following specific rules given by the modelling strategy. The
roof points are then imported in CC-Modeler module and the
roof faces are automatically generated. The building walls result
from the vertical projection of the roof eaves onto the Digital
Terrain Model, previously measured. The geometry of the 3D
models was checked in the module CC-Edit and, when
necessary, improved (e.g. right angles, parallel lines, planar
faces, correction of overlays and gaps).
We modeled some buildings in the JRC area. Figure 13 shows
the measured buildings overlapped on the forward WV-2 scene.
Thanks to the very high resolution, the roof shape was well
recognizable and internal roof edges could be distinguished.
Some difficulties in the measurements were due to shadows.
Figure 14 shows the final 3D models of some JRC buildings
together with some geometric parameters automatic calculated
(height, area, volume, face inclination, etc.).
Figure 13. Some of the buildings measured in WV-2 stereo
scenes visualized on forward scene.
Figure 14. 3D models of some JRC buildings.
7. CONCLUSIONS
WorldView-2 (WV-2) is the DigitalGlobe's latest very high
resolution optical sensor. Launched on October 8, 2009 it is full
operational since January 5, 2010. The sensor is able to acquire
panchromatic imagery at 0.46m ground resolution (0.52m at
20° off-nadir) and multispectral images in eight spectral bands
at 1.8m resolution. In this paper we conducted some
investigations on a WV-2 stereopair acquired on January 31st,
2010 in the morning over North Italy to evaluate the sensor’s
radiometric and geometric characteristics. The first results are
presented.
Concerning the radiometry, we evaluated the noise level on
homogeneous areas and the presence of spills or saturations that
affect the automatic surface modelling. Then the images were
oriented with sub-pixel accuracy and digital surface models
were automatically extracted using commercial software
packages. Finally some buildings were modelled semi-
automatically. These first results, despite some radiometric
problems, are encouraging and demonstrated the high potential
of WV-2 scene for feature extraction and modelling.
Our future work include (i) the integration of masks
automatically generated in saturated areas for the DSM
extraction to avoid blunders due to no texture, (ii) the quality
evaluation of WV-2 DSMs with a reference surface with higher
resolution (Lidar, aerial photogrammetry) and (iii) the
evaluation of building modelling on urban areas.
REFERENCES
EoPortal Website, 2010. http://www.eoportal.org/
Gruen, A., Wang, X., 2001. News from CyberCity Modeler, In
E. Baltsavias, A. Gruen, L. Van Gool (Eds.) Automatic
Extraction of Man-made Objects from Aerial and Space Images
(III), Balkema, Lisse, pp. 93-101.
Gruen A., Akca. D., 2005. Least Squares 3D Surface and Curve
Matching. ISPRS Journal of Photogrammetry and Remote
Sensing, 59(3):151-174.
Pateraki, M., 2005. Adaptive Multi-Image Matching for DSM
Generation from Airborne Linear Array CCD Data. Ph. D.
Dissertation, No 86, Institute of Geodesy and Photogrammetry,
ETH Zurich, Switzerland
Zhang, L., Gruen, A., 2004. Automatic DSM generation from
linear array imagery data. International Archives of the
Photogrammetry, Remote Sensing and Spatial Information
Sciences, 35(3), pp. 128-133.
Zhang, L., 2005. Automatic Digital Surface Model (DSM)
Generation from Linear Array Images. Ph. D. Dissertation, No.
88, Institute of Geodesy and Photogrammetry, ETH Zurich,
Switzerland.
Related Documents