arXiv:1012.4334v1 [astro-ph.CO] 20 Dec 2010 Radio Properties of Low Redshift Broad Line Active Galactic Nuclei Including Extended Radio Sources Stephen E. Rafter 1 , D. Michael Crenshaw, Paul J. Wiita 2 Department of Physics & Astronomy, Georgia State University, Atlanta, GA 30303 ABSTRACT We present a study of the extended radio emission in a sample of 8434 low redshift (z < 0.35) broad line active galactic nuclei (AGN) from the Sloan Digital Sky Survey (SDSS). To calculate the jet and lobe contributions to the total radio luminosity, we have taken the 846 radio core sources detected in our previous study of this sample and performed a systematic search in the Faint Images of the Radio Sky at Twenty-centimeters (FIRST) database for extended radio emission that is likely associated with the optical counterparts. We found 51 out of 846 radio core sources have extended emission (> 4 ′′ from the optical AGN) that is positively associated with the AGN, and we have identified an additional 12 AGN with extended radio emission but no detectable radio core emission. Among these 63 AGN, we found 6 giant radio galaxies (GRGs), with projected emission exceeding 750 kpc in length, and several other AGN with unusual radio morphologies also seen in higher redshift surveys. The optical spectra of many of the extended sources are similar to that of typical broad line radio galaxy spectra, having broad Hα emission lines with boxy profiles and large M BH . With extended emission taken into account, we find strong evidence for a bimodal distribution in the radio-loudness parameter R (≡ ν radio L radio /ν opt L opt ), where the lower radio luminosity core-only sources appear as a population separate from the extended sources, with a dividing line at log(R) ≈ 1.75. This dividing line ensures that these are indeed the most radio-loud AGN, which may have different or extreme physical conditions in their central engines when compared to the more numerous radio quiet AGN. Subject headings: galaxies: active – galaxies: nuclei – galaxies: Seyfert – radio continuum: galaxies 1 Physics Department, the Technion, Haifa 32000, Israel; e-mail: [email protected] 2 Department of Physics, The College of New Jersey, Ewing, NJ 08628

Welcome message from author
This document is posted to help you gain knowledge. Please leave a comment to let me know what you think about it! Share it to your friends and learn new things together.
Transcript
arX
iv:1
012.
4334
v1 [
astr
o-ph
.CO
] 2
0 D
ec 2
010
Radio Properties of Low Redshift Broad Line Active Galactic
Nuclei Including Extended Radio Sources
Stephen E. Rafter1, D. Michael Crenshaw, Paul J. Wiita2
Department of Physics & Astronomy, Georgia State University, Atlanta, GA 30303
ABSTRACT
We present a study of the extended radio emission in a sample of 8434 low
redshift (z < 0.35) broad line active galactic nuclei (AGN) from the Sloan Digital
Sky Survey (SDSS). To calculate the jet and lobe contributions to the total radio
luminosity, we have taken the 846 radio core sources detected in our previous
study of this sample and performed a systematic search in the Faint Images
of the Radio Sky at Twenty-centimeters (FIRST) database for extended radio
emission that is likely associated with the optical counterparts. We found 51 out
of 846 radio core sources have extended emission (> 4′′ from the optical AGN)
that is positively associated with the AGN, and we have identified an additional
12 AGN with extended radio emission but no detectable radio core emission.
Among these 63 AGN, we found 6 giant radio galaxies (GRGs), with projected
emission exceeding 750 kpc in length, and several other AGN with unusual radio
morphologies also seen in higher redshift surveys. The optical spectra of many of
the extended sources are similar to that of typical broad line radio galaxy spectra,
having broad Hα emission lines with boxy profiles and large MBH. With extended
emission taken into account, we find strong evidence for a bimodal distribution
in the radio-loudness parameter R (≡ νradioLradio/νoptLopt), where the lower radio
luminosity core-only sources appear as a population separate from the extended
sources, with a dividing line at log(R) ≈ 1.75. This dividing line ensures that
these are indeed the most radio-loud AGN, which may have different or extreme
physical conditions in their central engines when compared to the more numerous
radio quiet AGN.
Subject headings: galaxies: active – galaxies: nuclei – galaxies: Seyfert – radio
continuum: galaxies
1Physics Department, the Technion, Haifa 32000, Israel; e-mail: [email protected]
2Department of Physics, The College of New Jersey, Ewing, NJ 08628

– 2 –
.
1. Introduction
It is not uncommon to find a particularly radio luminous active galactic nucleus (AGN)
classified as a broad line radio galaxy (BLRG), a quasar, and a Fanaroff & Riley (1974)
class II object (an FR II’s radio emission is lobe-dominated and edge-brightened, whereas an
FR I is jet-dominated and edge-darkened). Generally, an AGN’s classification can depend
on many factors such as when and in what part of the spectrum it was first discovered,
which particular study it is being used in, and the source of the data. Moving beyond an
often blurred and overlapping system of identification into one based on more quantitative
parameters could allow a more continuous classification scheme that is easier to apply to the
large samples that continue to become available with large area surveys, e.g., in the radio
(VLA’s FIRST survey), infrared (2MASS), optical (SDSS), and X-ray (ROSAT) bands. The
AGN in these large samples can now be classified based on measured quantities in a statistical
fashion that is inherently more continuous than the discrete nomenclature generally used
(e.g., Kewley et al. 2006).
All AGN are believed to be powered by the accretion of matter onto a supermassive
black hole (SMBH), and show strong emission and variability in all wavebands from the
radio to X-ray regimes. Although not a fundamental physical parameter, the inclination
of the BH/accretion disk system to our line of sight is an observational parameter that,
according to accepted unification models, is responsible for the presence or absence of per-
mitted broad lines (BL) (in type 1 and type 2 AGN, respectively) in optical spectra due
to toroidal obscuration by gas and dust when viewed at large inclination angles (Antonucci
1993; Urry & Padovani 1995). Typically we assume that BL AGN have lower inclinations
to our line of sight and we are looking down onto the BL region (BLR) clouds that lie just
outside the immediate vicinity of the BH and accretion disk system.
An important fundamental parameter is black hole mass (MBH), which has been deter-
mined directly through various methods including H2O-maser observations and reverbera-
tion mapping (RM) (e.g., Moran et al. 1995; Peterson et al. 2004). RM becomes a powerful
tool when applied to large spectroscopic samples in that the scaling relations derived from
RM analysis allow single epoch (single spectra) MBH determinations for BL AGN (e.g.,
Kaspi et al. 2000, 2005; Bentz et al. 2009). Another important parameter, the Eddington
ratio, is the ratio of the bolometric luminosity (Lbol) to the Eddington luminosity (LEdd ∝
– 3 –
MBH). Determination of the true Lbol gives a measure of the accretion rate and requires a
full spectral energy distribution (SED) that spans from radio to X-ray emission and beyond
for most AGN. AGN that have an observed SED that spans the entire spectrum provide
normalization relations so that one can use a single continuum measurement in the opti-
cal or X-ray bands to stand in as a reasonable proxy for Lbol (e.g., Elvis et al. 1994, 2002;
McLure & Dunlop 2004).
The degree of radio-loudness is another means by which to classify AGN, and is based
on the amount of radio emission in the form of core emission, jets and/or lobes that can
be positively associated with the central engine and accretion phenomenon. There are
two main characterizations of the radio-loudness of AGN. The first is to set a dividing
line between radio-loud (RL) and radio-quiet (RQ) based on the R parameter defined as
the ratio of the monochromatic 5 GHz radio luminosity to the 4400 A optical luminosity
(ν5GHzL5GHz/ν4400L4400). By convention, RL AGN have R > 10 and RQ AGN have R <
10 (Kellermann et al. 1989). The second way to characterize the degree of radio-loudness is
by using the radio luminosity alone. Fanaroff & Riley (1974) originally found a transition
from the FR I type radio morphology to the FR II type corresponding to a luminosity of
1024.5 Watts Hz−1 at 1.4 GHz (Kawakatu et al. 2009). While this luminosity is not a RL/RQ
dividing line, the distribution in the radio luminosity plane shows that most FR Is have lu-
minosities below this dividing line and FR IIs have luminosities above. However it is well
established that many FR Is are RL when following the classic R convention. Therefore
a lower luminosity dividing line has occasionally been used as an alternate way to classify
AGN as either RL or RQ; e.g., Best et al. (2005) specify 1023 Watts Hz−1 to be this division
for FIRST data at 1.4 GHz.
A quasar radio dichotomy has been postulated because only 5% – 10% of all AGN
are RL according to the R > 10 criterion (Kellermann et al. 1989; Urry & Padovani 1995;
Ivezic et al. 2002; White et al. 2007). This has led to claims that there is a bimodal dis-
tribution in the R parameter for high optical luminosity, high redshift sources (Laor 2003;
Ivezic et al. 2004, and references therein), where usually only the core radio emission is
taken into account. While the RL AGN are usually thought to be powered by the same
phenomenon of matter accreting onto a SMBH, it has been suggested that they may have a
different accretion mode, e.g., advection dominated accretion flow (Narayan & McClintock
2008) versus a standard thin disk, or that their BH’s are more massive or spinning faster, or
some combination of both (e.g., Sikora et al. 2007, and references therein). Other models
propose that powerful jets tap the spin energy of the BH (e.g., Blandford & Znajek 1977)
so the accretion rate is nearly irrelevant. Either case suggests that R, although not a fun-
damental quantity, may be linked to one. Very often the most extreme RL AGN are FR II
types that have giant radio lobes that grow and extend from the host galaxy out to Mpc

– 4 –
scales while being fed by highly collimated jets. Statistically, these AGN are associated most
often with giant elliptical galaxies that tend to have optical spectra with very broad Balmer
line (Hα, Hβ) profiles with a large full widths at half maximum (FWHM), typically > 8000
km s−1 (Osterbrock & Ferland 2006). In studies of high redshift, high luminosity AGN,
it has generally been thought that most RL AGN have MBH > 108 M⊙ (e.g., Laor 2000;
McLure & Jarvis 2004). This clearly manifests itself for most FR IIs when determining MBH
from single epoch measurements, since generically, MBH ∝ FWHM2Hα
L0.5 (e.g., Bentz et al.
2009).
It has been shown in studies by Ho (2002) and Sikora et al. (2007) that there is a
strong correlation between radio-loudness and Eddington ratio, where AGN with very low
accretion rates (corresponding to ∼ 10−5 Lbol/LEdd) are almost exclusively all RL based on
the R parameter, and a clear trend can be seen of decreasing radio-loudness with increasing
Lbol/LEdd. Further, Sikora et al. (2007) find two separate populations of AGN in the R
vs Lbol/LEdd plane, where the upper population consists of FR Is, BLRGs and RL quasars
hosted by giant elliptical galaxies, and the lower population are mostly Seyfert and Low
Ionization Nuclear Emission-line Region (LINER) types hosted by spiral galaxies. While
these studies do show a dependence of radio-loudness on accretion rate, they do not exclude
the possibility that there may be other factors that contribute to the generation of strong
radio emission, such as accretion modes which are directly related to the amount of matter
in the accretion disk, or the spin of the SMBH.
In Rafter, Crenshaw & Wiita (2009) (hereafter Paper I), we investigated these issues
with the low-redshift sample of broad line AGN from Greene & Ho (2007), which was not
selected on the basis of any radio property. We found no clear gap between RL and RQ AGN,
and provided evidence for a significant radio-intermediate population in the local Universe.
Using the above definition, we found that 4.7% of the AGN in a flux-limited subsample were
radio loud (R > 10). We also found evidence that the radio-loud fraction (RLF) decreases
with Eddington ratio, in agreement with the above findings. Finally, we found a significant
number of RL AGN with MBH < 108 M⊙, which indicates that RL AGN are not a product
of only the most massive black holes in the Universe.
In this paper, we reexamine our sample to study the extended radio emission (> 4′′
from the optical AGN). We investigate the FR I/FR II luminosity break and its relation to
the claimed bimodal distribution in radio loudness. We also identify a number of unusual
radio morphologies for future detailed study. Finally, we compare these new results to those
in Paper I, where only the core emission was taken into account when calculating Lradio.

– 5 –
2. Data Sample and Analysis
As discussed in detail in Paper I, we have taken the BL AGN sample from Greene & Ho
(2007), who calculated MBH and Lbol/LEdd from the full width at half maximum of the
broad Hα line (FWHMHα) and the luminosity of Hα (LHα) for 8434 BL AGN from the Sloan
Digital Sky Survey (SDSS) Data Release 4 (DR4). We performed a follow up search for these
objects using the 2008 April version of the Very Large Array’s (VLA) 1.4 GHz Faint Images
of the Radio Sky at Twenty-centimeters (FIRST) survey database (Becker et al. 1995). The
FIRST survey operates at a frequency of 1.4 GHz, has an angular resolution of ∼ 5′′ and a
limiting magnitude of 1 mJy. Ivezic et al. (2002) find that 90% of all SDSS/FIRST matched
AGN only show radio emission at, or close to, the optical source using a 1.′′5 search radius.
Many of these ‘core’ sources only appear to be compact or unresolved, meaning that detailed
structure on scales < 5′′ will not be resolved due to the modest angular resolution of the
FIRST survey. Such unresolved cores could be arising from orientation effects, where the
radio jet is closely aligned with our line of sight, or they could be fairly young radio sources
whose emission has not had time to expand out to a significant distance from the host
galaxy. Therefore AGN with unresolved features, whether FR I or FR II type, will appear
as core-only sources in this sample.
This paper follows our earlier paper in which we used a 4′′ search radius to identify
radio sources associated with the optical AGN in this sample and where we showed this
leads to very few false radio detections with an optical counterpart. We find that of the 8434
objects, 846 have core radio sources inside this radius (we note that this number is updated
from Paper I, where we found 832 objects using the 2003 April 11 version of the FIRST
catalogue). In the study of Paper I, only the core radio emission was taken into account
in order to compare that work with other studies (mentioned above) at higher redshift. In
this work, we have first taken these AGN with radio core emission and performed a search
around a much wider, 60′′ radius, to identify any extended emission (at positions > 4′′ from
the optical AGN) that may be associated with them. The 60′′ search radius was chosen due to
the fact that the largest known FR IIs are on the scale of a Mpc (Saripalli & Subrahmanyan
2009, and references therein), and at the sample redshift limit of z = 0.35, a 60′′ search
radius corresponds to nearly 1 Mpc in diameter. All extended sources were visually inspected
in the SDSS and FIRST images to give us confidence that the radio emission is associated.
This does not mean that any clearly associated emission out past 60′′ was not included,
but that any associated emission out past 60′′ was added to the total by hand after visual
inspection of the FIRST images.
In order to confirm the association of extended emission with the optical counterpart
– 6 –
it is first necessary to make sure that the extended emission is not associated with another
optical source in the field. The majority of cases where this takes place is when there is one
core source within 4′′ and a second radio source within 60′′, and where the second source is
at the same position as another galaxy in the SDSS image. Therefore, any FIRST sources
found in the extended search with obvious optical counterparts in the SDSS images were
eliminated as possible extended source matches (e.g., SDSS J094603.94+013923.6 is a BL
AGN misclassified as a star in SDSS DR7 with a resolved spiral galaxy to the north that is
the likely the source of the extended radio emission).
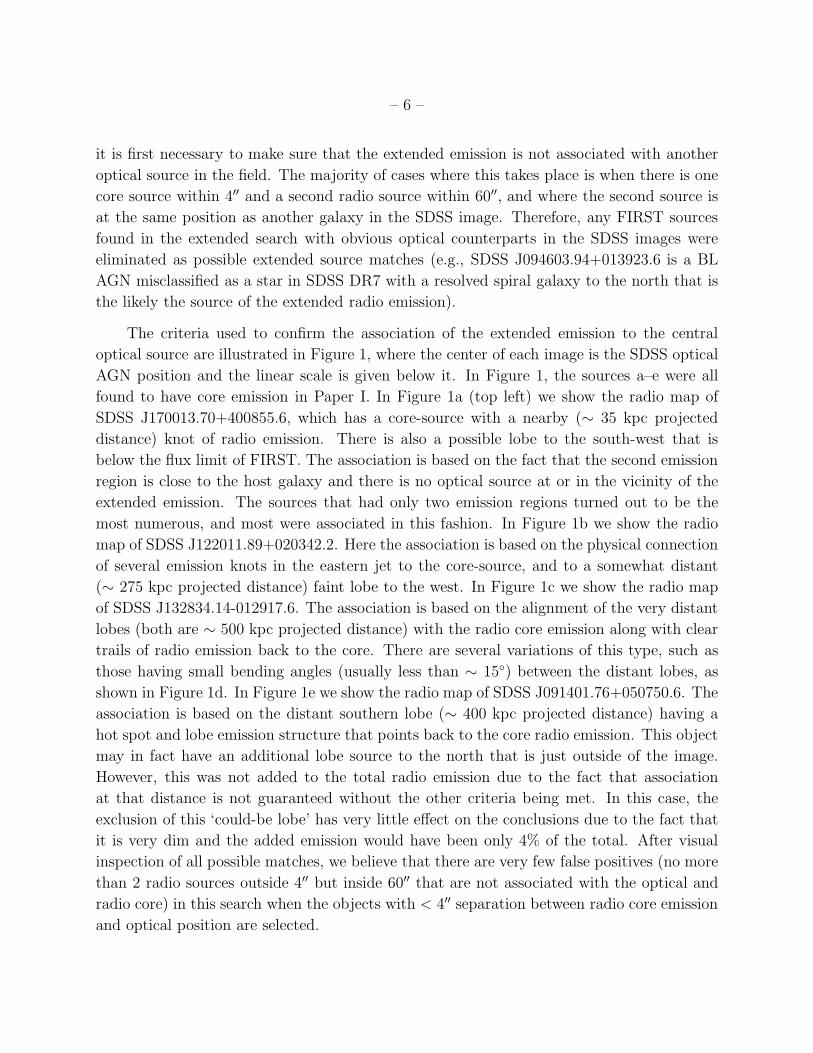
The criteria used to confirm the association of the extended emission to the central
optical source are illustrated in Figure 1, where the center of each image is the SDSS optical
AGN position and the linear scale is given below it. In Figure 1, the sources a–e were all
found to have core emission in Paper I. In Figure 1a (top left) we show the radio map of
SDSS J170013.70+400855.6, which has a core-source with a nearby (∼ 35 kpc projected
distance) knot of radio emission. There is also a possible lobe to the south-west that is
below the flux limit of FIRST. The association is based on the fact that the second emission
region is close to the host galaxy and there is no optical source at or in the vicinity of the
extended emission. The sources that had only two emission regions turned out to be the
most numerous, and most were associated in this fashion. In Figure 1b we show the radio
map of SDSS J122011.89+020342.2. Here the association is based on the physical connection
of several emission knots in the eastern jet to the core-source, and to a somewhat distant
(∼ 275 kpc projected distance) faint lobe to the west. In Figure 1c we show the radio map
of SDSS J132834.14-012917.6. The association is based on the alignment of the very distant
lobes (both are ∼ 500 kpc projected distance) with the radio core emission along with clear
trails of radio emission back to the core. There are several variations of this type, such as
those having small bending angles (usually less than ∼ 15) between the distant lobes, as
shown in Figure 1d. In Figure 1e we show the radio map of SDSS J091401.76+050750.6. The
association is based on the distant southern lobe (∼ 400 kpc projected distance) having a
hot spot and lobe emission structure that points back to the core radio emission. This object
may in fact have an additional lobe source to the north that is just outside of the image.
However, this was not added to the total radio emission due to the fact that association
at that distance is not guaranteed without the other criteria being met. In this case, the
exclusion of this ‘could-be lobe’ has very little effect on the conclusions due to the fact that
it is very dim and the added emission would have been only 4% of the total. After visual
inspection of all possible matches, we believe that there are very few false positives (no more
than 2 radio sources outside 4′′ but inside 60′′ that are not associated with the optical and
radio core) in this search when the objects with < 4′′ separation between radio core emission
and optical position are selected.

– 7 –
We find 51 (6% of the original radio core emission sample and 0.6% of the total sample)
AGN with extended emission that must be taken into account when calculating the total
AGN radio luminosity. Of these 51, we find a large range in the amount of extra emission
that is picked up. Some objects have a bright core and one dimmer lobe (∼ 10%-50% in
added radio emission), but we also find bright FR IIs that have total integrated fluxes in
the 1000 mJy range (∼ 100%-600% in added radio emission). In order to characterize the
amount of flux added due to extended emission, we show in Figure 2 the fraction of extended
flux added with respect to the initial core emission. About half of the sources lie in the 0.01
– 2 range, showing that nearly half of the sources add only a small fraction and up to twice
of the core flux to the total, while the other half of the sample at least doubles the amount
of flux added to the core, and the brightest source adds nearly 70 times more emission when
compared to the core.
We performed a second search using the entire optical sample to find possible FR II
types in which radio emission is only seen from lobes but there is weak (below the 1 mJy
flux limit of FIRST) or no core radio emission. The largest group found in this search
has just one single radio source that is within 60′′. After visual inspection, usually there
is another optical source matched to the extended radio source. Even when there is no
such alternative optical identification it is not possible to claim an association since there
is no discernible jet to lobe connection or double lobe symmetry that would be excellent
indications of association. Most of these were rejected outright. We do however find an
additional 12 objects (not included in the 51 AGN discussed above) that have significant
flux inside the 60′′ search radius, but no core emission inside 4′′, that can be positively
associated with the optical source. All of these were visually inspected to ensure that the
radio emission was not associated with another optical source in the field and any clearly
associated emission at distances > 60′′ was taken into account and added by hand to the
total radio flux. The criteria for establishing association for these objects is the alignment of
two sources of emission out past 4′′ with the optical source (having no detected radio core),
as shown in Figure 1f for SDSS J091519.56+563837.8. We do note that any sources with
radio lobes that have significant bending angles would not satisfy our alignment criteria, and
some true associations may be excluded due to this effect.
3. Results: Properties of the Extended Sources
Table 1 lists the SDSS name of all 63 AGN with extended radio emission along with
their redshifts, projected physical extent and a ‘by eye’ classification of the radio morphology
– 8 –
based on FIRST images. There are 22 sources with no previous radio identification in the
NASA extragalactic database (NED) from other radio surveys and they therefore have no
radio catalogue source name in Table 1. The radio classification column makes use of the
‘giant radio galaxy’ (GRG) classification, where the total projected linear extent exceeds 750
kpc (Saripalli & Subrahmanyan 2009, and references therein), and the hybrid morphology
radio sources (HYMORS) classification, where an FR II lobe is seen on one side and an
FR I jet is seen on the other side of the central source (Gopal-Krishna & Wiita 2000).
We also classify X-shaped radio sources (e.g., Gopal-Krishna et al. 2003), where a possible
reorientation of the jets has taken place to feed two individual sets of lobes, and the double-
double morphology (DDRG) where interruption of the jets can cause two distinct sets of
lobes to form throughout the lifetime of the AGN, where the first and older set is at a larger
distance than the second, younger pair (e.g., Schoenmakers et al. 2000). Table 2 summarizes
the morphologies of the extended sources; the ‘indeterminate’ designation is given to sources
that were unresolved in the FIRST images.
We used the usual flux-luminosity relation with the same cosmology used by Greene & Ho
(2007) from Spergel et al. (2003) (H0 = 71 km s−1 Mpc−1, Ωm = 0.27, and ΩΛ = 0.73) to
calculate the total radio luminosity for each source. From these new data, we update the
R values of the radio detected sample following Paper I, including all associated extended
emission. Since the optical sample is the same, those properties are unchanged. We also
break the sample into subsamples as in Paper I. The ‘detected sample’ consists of all AGN
with radio emission, and contains the core-only sources and the extended sources. The 63
extended sources are all RL (i.e., all have R > 10) with the exception of one (R = 2.39)
that is a face-on spiral galaxy (SDSS J220233.84-073225.0) with a modest LHα = 1042.01 ergs
s−1, but a very low flux radio core (Fint = 2.36 mJy) with an even fainter ‘lobe’ (Fint = 0.97
mJy) offset by 10.′′5. We find that of the 793 remaining core-only sources, 383 are RL and
410 are RQ, based on R. The ‘flux limited sample’ is explicitly defined in Paper I and has
5485 total objects, using an upper limit of 1 mJy for all AGN without radio detections as
an optical flux cutoff. For the flux limited sample we find that 4.9% (270/5485) of the AGN
are RL compared to the 4.7% (259/5485) found in Paper I when extended emission was not
taken into account.
In order to determine how the extended sources differ from the rest of the sample we
first compare the optical properties of the different subsets, namely the core-only sources,
the extended sources and the total flux limited sample. In Figure 3 we show the FWHM
distributions of the broad component of the Hα line (FWHMHα) for the extended, core-
only, and non-radio detected sources in the flux limited sample, where all are normalized
by the number in each group. The extended source distribution has an average FWHM of
5010 km s−1 and the core-only sources have an average FWHM of 3550 km s−1. The peak

– 9 –
of the distribution for the extended sources is at ∼ 4500 km s−1 and is shifted to higher
FWHM values by about 2000 km s−1 when compared to the core-only sources, that peak at
∼ 2500 km s−1. Both histograms have long tails that fall off at about the same rate toward
higher FWHMs. A K-S test between the core-only source distribution and the extended
source distribution yields a probability value of 1.2 ×10⁻⁵ and a maximum difference of
0.35, showing that it is extremely likely these two distributions are from different parent
populations. A K-S test between the core-only sources and the non-radio detected sources
yields a probability value of 0.077 and a maximum difference of 0.05, meaning that the two
have similar enough cumulative distribution functions that they may well be from the same
parent population. Visual inspection of the optical spectra shows that many of the extended
AGN have characteristically wide Hα profiles. This is consistent with the claim that most
BLRGs have intrinsically large MBH (Laor 2003; Dunlop et al. 2003; Chiaberge et al. 2005).
This result is of course favored when calculating MBH based on single epoch MBH relations,
where MBH ∝ FWHM2, but a large MBH determination is not always guaranteed since this
relation also depends on the optical luminosity of the central source (MBH ∝ FWHM2L0.5).
The next optical property we compare between the radio types is the Hα luminosity (∝
L5100). The histogram in Figure 4 shows the normalized distributions for the extended, core-
only, and non-radio detected sources in the flux limited sample. We find that the extended
source distribution is shifted to higher LHα by about 0.5 dex when compared to the core-only
distribution, but overall the full distributions have similar peak values and show significant
overlap. More precisely, the extended sources have an average LHα = 1042.7 ergs s−1 with a
standard deviation of 0.60 dex, and the core-only sources have an average LHα = 1042.3 ergs
s−1 with a standard deviation of 0.68 dex. A K-S test comparing the extended sources and
the core-only sources yields a probability value of 1.4 ×10⁻⁴ and a maximum difference of
0.32 indicating that these two distributions may well be from different parent populations. In
the context of MBH determinations, somewhat similar LHα distributions but systematically
higher FWHM distributions should give larger MBH estimates for the extended AGN when
compared to the core-only sources. This turns out not to always be the case, since our
extended sample has 36 sources with MBH < 108 M⊙ and 27 sources have MBH > 108 M⊙.
The normalized distribution of 1.4 GHz radio luminosity (L1.4GHz) is shown in Figure 5
for the flux limited sample. The peak of the extended sources is shifted to higher luminosities
by a factor of 100 when compared to the core-only sources. This is not surprising given the
high luminosities of FR II lobes. Looking at the region of overlap we find that there are few
sources in these normalized distributions in the 1024.5 Watts Hz−1 region, where the deficit
of sources is at the FR I/FR II transition luminosity originally found by Fanaroff & Riley
(1974); see also Kawakatu et al. (2009). This is important for the log(R) histogram shown in
Figure 6. In the top plot we show the core-only and extended source histograms normalized
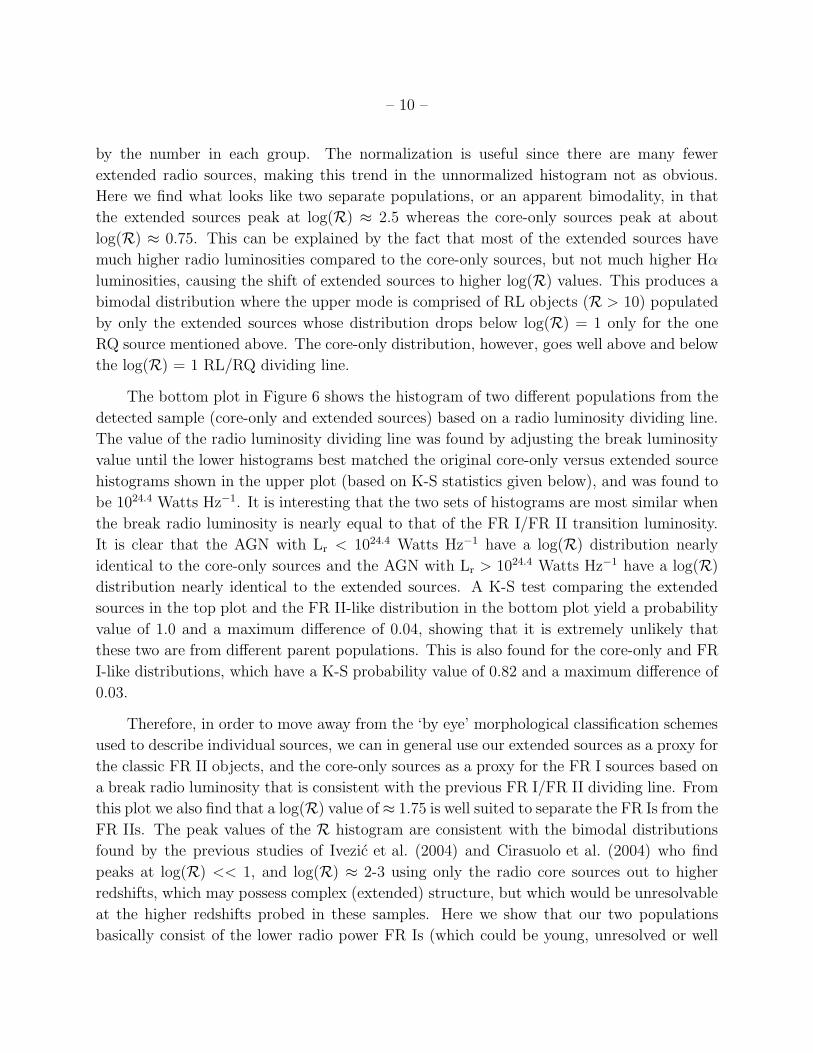
– 10 –
by the number in each group. The normalization is useful since there are many fewer
extended radio sources, making this trend in the unnormalized histogram not as obvious.
Here we find what looks like two separate populations, or an apparent bimodality, in that
the extended sources peak at log(R) ≈ 2.5 whereas the core-only sources peak at about
log(R) ≈ 0.75. This can be explained by the fact that most of the extended sources have
much higher radio luminosities compared to the core-only sources, but not much higher Hα
luminosities, causing the shift of extended sources to higher log(R) values. This produces a
bimodal distribution where the upper mode is comprised of RL objects (R > 10) populated
by only the extended sources whose distribution drops below log(R) = 1 only for the one
RQ source mentioned above. The core-only distribution, however, goes well above and below
the log(R) = 1 RL/RQ dividing line.
The bottom plot in Figure 6 shows the histogram of two different populations from the
detected sample (core-only and extended sources) based on a radio luminosity dividing line.
The value of the radio luminosity dividing line was found by adjusting the break luminosity
value until the lower histograms best matched the original core-only versus extended source
histograms shown in the upper plot (based on K-S statistics given below), and was found to
be 1024.4 Watts Hz−1. It is interesting that the two sets of histograms are most similar when
the break radio luminosity is nearly equal to that of the FR I/FR II transition luminosity.
It is clear that the AGN with Lr < 1024.4 Watts Hz−1 have a log(R) distribution nearly
identical to the core-only sources and the AGN with Lr > 1024.4 Watts Hz−1 have a log(R)
distribution nearly identical to the extended sources. A K-S test comparing the extended
sources in the top plot and the FR II-like distribution in the bottom plot yield a probability
value of 1.0 and a maximum difference of 0.04, showing that it is extremely unlikely that
these two are from different parent populations. This is also found for the core-only and FR
I-like distributions, which have a K-S probability value of 0.82 and a maximum difference of
0.03.
Therefore, in order to move away from the ‘by eye’ morphological classification schemes
used to describe individual sources, we can in general use our extended sources as a proxy for
the classic FR II objects, and the core-only sources as a proxy for the FR I sources based on
a break radio luminosity that is consistent with the previous FR I/FR II dividing line. From
this plot we also find that a log(R) value of ≈ 1.75 is well suited to separate the FR Is from the
FR IIs. The peak values of the R histogram are consistent with the bimodal distributions
found by the previous studies of Ivezic et al. (2004) and Cirasuolo et al. (2004) who find
peaks at log(R) << 1, and log(R) ≈ 2-3 using only the radio core sources out to higher
redshifts, which may possess complex (extended) structure, but which would be unresolvable
at the higher redshifts probed in these samples. Here we show that our two populations
basically consist of the lower radio power FR Is (which could be young, unresolved or well
– 11 –
aligned with the line-of-sight jets and/or lobes) and the higher radio power FR IIs, and that
the R bimodality seen here is likely a manifestation of the FR I/FR II break originally found
by Fanaroff & Riley (1974).
We updated the radio luminosities of the AGN in our sample to determine the effects
of the extended radio emission on our previous results in Paper I. As might be expected, the
additional flux in a small fraction (∼8%) of the radio-detected sample had little effect on the
overall trends that we found between radio loudness and Eddington ratio and/or black-hole
mass (see Rafter (2010) for the updated plots).
4. Conclusions
We have taken the SDSS BL AGN sample from Greene & Ho (2007) and performed
a search for extended associated radio emission using the VLA’s FIRST survey. We find
that 846 of the objects (10%) have core emission and 63 (0.8%) have extended emission that
must be taken into account when calculating the total radio luminosity and radio-loudness.
We compare these results to Rafter, Crenshaw & Wiita (2009) and find that the trends in
radio-loudness with other physical properties are largely unchanged, which is unsurprising as
the detected sample was only modestly enlarged overall. The RLF as a function of Lbol/LEdd
and MBH are essentially the same, and we still find a modest trend of decreasing RLF with
increasing log(Lbol/LEdd), along with an increase of the RLF as MBH increases above ∼ 2×10⁸
M⊙. We do note that about half of the extended RL AGN do not have the most massive
BHs (MBH > 108 M⊙), indicating that even extreme radio-loudness is not based solely on
MBH, but must also be closely tied to other fundamental parameters such as black hole spin
or accretion mode, although our data do not allow us to draw conclusions as to which, if
either, of those theoretical paradigms for radio power is more likely to be correct.
With extended emission taken into account, we find evidence for a distinct population of
RL AGN comprised of the extended sources that is separate from the RL and RQ core-only
sources. We find that most of the extended AGN in this low redshift sample are FR IIs based
on radio morphology and luminosity, using the same FR I/FR II break luminosity defined
by Fanaroff & Riley (1974). We find a bimodal distribution in the R parameter, but at a
value above the classic RL/RQ dividing line and propose that this is a manifestation of the
FR I/FR II break. In the previous high redshift studies mentioned above, where only the
‘core’ radio emission is used, the bimodality in R may again be a manifestation of the FR
I/FR II transition, although what is considered to be core emission may in fact include jets
and/or lobes (or relatively young sources) whose true radio structure is unresolved due to
their extreme distances. We do note that for the sources with just two components, where

– 12 –
one is the core source and the other is not at a large angular distance, the morphology is not
easy to determine based on the resolution of the FIRST survey.
The distributions of optical luminosity for the Hα emission line (Figure 4) are more
similar for both the core-only and extended sources, as well as the total sample, than are
the distributions of radio luminosities (Figure 5). This difference gives rise to the radio
dichotomy seen when evaluating radio-loudness based on the R parameter in this sample.
From our sample we propose that a more interesting dividing line is at a log(R) value of
∼ 1.75 instead of the classical log(R) = 1. This higher break value for log(R) separates
local broad-line AGN into two distinct populations of undetected/core-only radio sources
and extended radio sources in the FIRST survey.
The claims of bimodality between RL and RQ AGN have usually been based on the
somewhat arbitrary log(R) = 1 criteria, and were heavily debated based on sample selection
and inclusion/exclusion criteria (see Section 1 and references therein). While the dichotomy
between RL and RQ AGN is called into question in the studies of White et al. (2007) and
Rafter, Crenshaw & Wiita (2009), the study by Sikora et al. (2007) does find evidence for
this dichotomy and further, postulates physical conditions that may be responsible for its
existence. In this work we can clearly reproduce a dichotomy between the core-only sources,
comprised of RQ and weak/unresolved FR I type AGN, against the most powerful FR I and
FR II type AGN in our sample. Such a distinction may have a more physical and theoretically
compelling basis as opposed to being a distinction between RL and RQ that is influenced
strongly by observational constraints. As shown in Figure 6, all the AGN in the upper
population have extended emission and resolved complex morphologies whose BH/accretion
disk system may have different or extreme physical properties when compared to the much
more numerous undetected and core-only sources. The lower population (core-only) sources
may then be made up of two types. The first type, where the radio emission originates from
coronal emission on subparsec scales, as discussed in Laor & Behar (2008), could constitute
the bulk of objects with log(R) < 1. The second type could contain either unresolved young
jets which emit on a scale of a few pc and/or weak jets with intrinsically weak radio emission
and low kinetic jet power. This second type of object would still fit into our lower population
while having 1.75 > log(R) > 1, thereby satisfying the classic paradigm that FR Is tend to
be RL based on log(R) > 1. Once the threshold of log(R) = 1.75 is crossed in Figure 6, there
is a clear transition to the most radio powerful AGN, with strong jets and bright extended
emission; these are plausibly a result of some difference in accretion mode, accretion rate, or
BH spin in the central engine, whereby the efficiency of jet launching is greatly enhanced.
We thank Jenny Greene and Luis Ho for providing their data set and for helpful advice.
PJW was supported in part by a subcontract to GSU from NSF grant AST05-07529 to the
– 13 –
University of Washington. Funding for the SDSS Archive has been provided by the Alfred P.
Sloan Foundation, the Participating Institutions, the National Aeronautics and Space Ad-
ministration, the National Science Foundation, the U.S. Department of Energy, the Japanese
Monbukagakusho, and the Max Planck Society. The SDSS Web site is http://www.sdss.org/.
The SDSS is managed by the Astrophysical Research Consortium (ARC) for the Participat-
ing Institutions. The Participating Institutions are The University of Chicago, Fermilab,
the Institute for Advanced Study, the Japan Participation Group, The Johns Hopkins Uni-
versity, Los Alamos National Laboratory,the Max-Planck-Institute for Astronomy (MPIA),
the Max-Planck-Institute for Astrophysics (MPA), New Mexico State University, Princeton
University, the United States Naval Observatory, and the University of Washington. The
FIRST Survey is supported by grants from the National Science Foundation, NATO, the
National Geographic Society, Sun Microsystems, and Columbia University.
REFERENCES
Antonucci, R. 1993, ARA&A, 31, 473
Becker, R. H., White, R. L., & Helfand, D. J. 1995, ApJ, 450, 559
Bentz, M. C., Peterson, B. M., Netzer, H., Pogge, R. W., & Vestergaard, M. 2009, ApJ, 697,
160
Best, P. N., Kauffmann, G., Heckman, T. M., Brinchmann, J., Charlot, S., Ivezic, Z., &
White, S. D. M. 2005, MNRAS, 362, 25
Blandford, R. D., & Znajek, R. L. 1977, MNRAS, 179, 433
Chiaberge, M., Capetti, A., & Macchetto, F. D. 2005, ApJ, 625, 716
Cirasuolo, M., Celotti, A., Magliocchetti, M., & Danese, L. 2004, in AGN Physics with the
Sloan Digital Sky Survey, ASP Conf. Ser. Vol. 311, ed. G. T. Richards, P. B. Hall
(San Franscisco: ASP), p. 343
Dunlop, J. S., McLure, R. J., Kukula, M. J., Baum, S. A., O’Dea, C. P., & Hughes, D. H.
2003, MNRAS, 340, 1095
Elvis, M., et al. 1994, ApJS, 95, 1
Elvis, M., Risaliti, G., & Zamorani, G. 2002, ApJ, 565, L75
Fanaroff, B. L., & Riley, J. M. 1974, MNRAS, 167, 31P

– 14 –
Gopal-Krishna, & Wiita, P. J. 2000, A&A, 363, 507
Gopal-Krishna, Biermann, P. L., & Wiita, P. J. 2003, ApJ, 594, L103
Gopal-Krishna, Mangalam, A., & Wiita, P. J. 2008, ApJ, 680, L13
Greene, J. E., & Ho, L. C. 2004, ApJ, 610, 722
Greene, J. E., & Ho, L. C. 2007, ApJ, 667, 131
Ho, L. C. 2002, ApJ, 564, 120
Ivezic, Z., et al. 2002, AJ, 124, 2364
Ivezic, Z., et al. 2004, in AGN Physics with the Sloan Digital Sky Survey, ASP Conf. Ser.
Vol. 311, ed. G. T. Richards, P. B. Hall (San Francisco: ASP), p. 347
Kaspi, S., Smith, P. S., Netzer, H., Maoz, D., Jannuzi, B. T., & Giveon, U. 2000, ApJ, 533,
631
Kaspi, S., Maoz, D., Netzer, H., Peterson, B. M., Vestergaard, M., & Jannuzi, B. T. 2005,
ApJ, 629, 61
Kawakatu, N., Kino, M., & Nagai, H. 2009, ApJ, 697, L173
Kellermann, K. I., Sramek, R., Schmidt, M., Shaffer, D. B., & Green, R. 1989, AJ, 98, 1195
Kewley, L. J., Groves, B., Kauffmann, G., & Heckman, T. 2006, MNRAS, 372, 961
Laor, A. 2000, ApJ, 543, L111
Laor, A. 2003, ArXiv Astrophysics e-prints, arXiv:astro-ph/0312417
Laor, A., & Behar, E. 2008, MNRAS, 390, 847
McLure, R. J., & Dunlop, J. S. 2004, MNRAS, 352, 1390
McLure, R. J., & Jarvis, M. J. 2004, MNRAS, 353, L45
Moran, J., Greenhill, L., Herrnstein, J., Diamond, P., Miyoshi, M., Nakai, N., & Inque, M.
1995, Proceedings of the National Academy of Science, 92, 11427
Narayan, R., & McClintock, J. E. 2008, New A Rev., 51, 733
Osterbrock, D. E., & Ferland, G. J. 2006, Astrophysics of gaseous nebulae and active galactic
nuclei, 2nd. ed. (Sausalito, CA: University Science Books)

– 15 –
Peterson, B. M., et al. 2004, ApJ, 613, 682
Rafter, S. E. 2010, Ph.D. thesis, Georgia State Univ.
Rafter, S. E., Crenshaw, D. M., & Wiita, P. J. 2009, AJ, 137, 42 (Paper I)
Saripalli, L., & Subrahmanyan, R. 2009, ApJ, 695, 156
Schoenmakers, A. P., de Bruyn, A. G., Rottgering, H. J. A., van der Laan, H., & Kaiser,
C. R. 2000, MNRAS, 315, 371
Sikora, M., Stawarz, L., & Lasota, J.-P. 2007, ApJ, 658, 815
Spergel, D. N., et al. 2003, ApJS, 148, 175
Urry, C. M., & Padovani, P. 1995, PASP, 107, 803
White, R. L., Helfand, D. J., Becker, R. H., Glikman, E., & de Vries, W. 2007, ApJ, 654, 99
This preprint was prepared with the AAS LATEX macros v5.2.

–16
–
Table 1. The Matched SDSS and FIRST Sample
SDSS Name Radio Catalogue Redshift Total Integrated Projected Physical Radio Classification
and Source Name Flux (mJy) Size (Mpc)
(1) (2) (3) (4) (5) (6)
J005550.75-101905.6 FBQS J0055-1019 0.3091 48.58 0.94 GRG/FR II
J013352.65+011345.3 87GB 013118.8+005811 0.3081 67.15 0.62 FR II
J072406.79+380348.6 0.2413 203.46 0.58 FR II
J074906.50+451033.9 B3 0745+453,GB6 J0749+4510 0.1921 117.74 0.12 Core + weak jet(5%)
J075244.19+455657.3 B30749+460A,6CB074906.2+460422 0.0518 238.41 0.14 FR I
J075643.09+310248.7 0.2715 22.59 0.14 Classic Triple FR II
J080129.57+462622.8 0.3159 13.37 0.26 Classic Triple FR II
J082133.60+470237.2 3C 197.1, *B3 0818+472A 0.1280 1711.27 0.06 Bright FR II
J082355.36+244830.4 0.2339 2.32 0.06 Faint FR II
J084600.36+070424.6 87GB 084319.4+071534 0.3421 241.53 0.85 GRG/FR II
J085348.18+065447.1 PMN J0853+0654 0.2232 769.90 0.08 Core + 1 Bright lobe
J085627.91+360315.6 0.3449 29.96 0.20 FR II
J091133.85+442250.1 B3 0908+445,GB6 J0911+4422 0.2976 433.23 0.15 FR I
J091401.76+050750.6 4C +05.38 0.3014 328.72 0.46 Large FR II lobe in SW
J091519.55+563837.8 0.2631 19.98 0.56 FR II
J092308.16+561455.3 0.2493 143.01 0.23 FR II
J092837.97+602521.0 8C 0924+606 0.2955 278.21 0.25 FR II
J093200.08+553347.4 6C B092828.4+554656 0.2657 73.43 0.94 GRG/FR II
J094144.82+575123.6 GB6 J0941+5751 0.1585 90.43 0.11 FR II
J094745.14+072520.5 3C 227, PKS 0945+07 0.0858 3117.09 0.40 FR II
J095456.89+092955.8 4C +09.35, PKS 0952+097 0.2984 440.66 0.17 FR II
J100726.10+124856.2 4C +13.41, PKS 1004+13 0.2406 959.14 0.52 FR II
J100819.11+372903.4 0.0522 2.27 0.02 2nd source in host galaxy
J103143.51+522535.1 4C +52.22, GB6 J1031+5225 0.1662 904.01 0.13 FR II
J103458.35+055231.8 0.3002 28.72 0.15 one lobe SW
J105220.30+454322.2 0.2406 112.05 0.26 FR I (asymmetric)

–17
–
Table 1—Continued
SDSS Name Radio Catalogue Redshift Total Integrated Projected Physical Radio Classification
and Source Name Flux (mJy) Size (Mpc)
(1) (2) (3) (4) (5) (6)
J105500.33+520200.9 6C B105202.4+521804 0.1874 461.07 0.21 FR II
J105632.01+430055.9 0.3177 19.37 0.22 FR II
J110845.48+020240.8 PKS 1106+023 0.1574 784.08 0.08 Core + possible lobe
J111432.79+105034.7 0.1931 780.25 0.23 DDRG/FR II
J113021.40+005823.0 4C +01.30, PKS 1127+012 0.1323 566.72 0.16 X-shaped (0.26Mpc)
J114004.35-010527.4 [WB92] 1137-0048 0.3470 34.17 1.12 GRG/HYMORS
J114047.90+462204.8 87GB 113808.0+463858 0.1149 91.99 0.06 core + bent jet
J114958.70+411209.4 6C B114721.6+412848 0.2497 118.46 0.33 FR I
J115409.27+023815.0 87GB 115136.0+025423 0.2106 64.12 0.26 FR I
J115420.72+452329.4 0.1912 964.77 0.29 FR II
J120612.67+490226.2 0.1194 6.30 0.09 Possible core-only source
J122011.89+020342.2 PKS 1217+02 0.2404 482.78 0.57 FR I (asymmetric and bent)
J123807.77+532555.9 87GB123550.3+534219 0.3475 61.60 1.02 GRG/FR II
J123915.39+531414.6 6C B123659.8+533024 0.2013 23.11 0.26 FR II w/ faint core
J130359.47+033932.1 4C +03.26 0.1837 210.85 0.45 FR II
J131827.00+620036.2 87GB131634.0+621623,8C 1316+622 0.3075 133.41 0.38 FR II
J132404.20+433407.1 0.3377 239.62 1.10 GRG/FR II
J132834.14-012917.6 0.1514 158.85 0.98 GRG/FR II
J133253.27+020045.6 3C 287.1 0.2158 1759.16 0.57 FR II
J133437.48+563147.9 87GB133243.4+564710 0.3428 164.18 0.24 FR I
J134545.35+533252.3 87GB 134352.4+534755 0.1354 278.19 0.13 FR II
J134617.54+622045.4 6C B134441.6+623604 0.1164 142.99 0.15 FR I (bent)
J141613.36+021907.8 0.1582 107.70 0.67 DDRG/FR II
J144302.76+520137.2 3C 303 0.1412 2119.27 0.12 FR II
J151640.22+001501.8 GB6 J1516+0015, 4C +00.56 0.0524 1090.21 0.28 FR II
J151913.35+362343.4 6C B151717.1+363448 0.2857 207.25 0.58 HYMORS candidate

–18
–
Table 1—Continued
SDSS Name Radio Catalogue Redshift Total Integrated Projected Physical Radio Classification
and Source Name Flux (mJy) Size (Mpc)
(1) (2) (3) (4) (5) (6)
J152942.20+350851.2 7C 1527+3519,6C B152745.2+35192 0.2873 109.27 0.08 Bright core + 1 lobe
J155206.58-005339.3 0.2977 105.67 0.12 FR I (partially resolved)
J163856.53+433512.5 B3 1637+436A,6CB163723.1+434051 0.3390 133.04 0.45 FR II
J164442.53+261913.2 0.1442 110.36 0.06 Unresolved core structure
J170013.70+400855.6 0.0941 20.68 0.07 faint lobe SW, FR II?
J170425.11+333145.9 0.2902 36.07 0.37 FR II
J171322.58+325628.0 FBQS J171322.6+325628 0.1013 44.80 0.15 faint FR I
J220233.84-073225.0 0.0594 3.33 0.02 RQ,2nd source in host galaxy
J230545.66-003608.6 4C -01.59, PKS 2303-008 0.2689 517.76 0.15 FR II
J233313.16+004911.8 PKS 2330+005 0.1700 317.86 0.17 FR I
J235156.12-010913.3 4C -01.61, PKS 2349-01 0.1740 1460.41 0.09 FR II
Note. — Col.(1): SDSS Name; Col.(2): Radio Catalogue and Source Name: taken from the NASA Extragalactic Database (NED); Col.(3):
Redshift: taken from SDSS spectra; Col.(4): Total Integrated Radio Flux at 1.4 GHz (mJy); Col.(5): Projected Physical Size: these approximate
values are calculated using the FIRST radio maps (Mpc); Col.(6): Radio Classification: Radio Quiet (RQ), Fanaroff & Riley class 1 & 2 (FR I,
FR II respectively), Giant Radio Galaxy (GRG), HYbrid MOrphology Radio Source (HYMORS), Double-Double Radio Galaxy (DDRG), X-shaped
(having radio emission that resembles an ‘x’ pattern, where there are two sets of symmetric emission regions at ∼ 90 to each other).

– 19 –
Table 2. Summary of Radio Morphologies
Radio Morphology Number
FR I 10
FR II 25
FR II/GRG 6
DDRG 2
X−shaped 1
HYMORS 2
Indeterminate 17

– 20 –
Fig. 1.— Images of extended FIRST sources with the optical source at the center of each
frame, north is up and east is to the left. The SDSS name and projected physical size is given
beneath each image. a: The 1.′2 × 1.′2 image shows a double source with one component on
the optical core and one offset from it. b: The 3.′0 × 3.′0 image has a strong jet and lobe to
the east and a weaker lobe to the west. c: The 6.′0 × 6.′0 image shows a giant FR II where
the lobe to the NE is aligned with the radio core and lobe to the SW. d: The 3.′0×3.′0 image
shows a distant lobe to the east, a radio core, and a lobe to the west slightly misaligned. e:
The 3.′0×3.′0 image shows a giant radio lobe with multiple sources to the south that all point
back to the radio core. Not shown in this image is a more distant and slightly misaligned
source to the north that may be an associated lobe, but with very low flux. f: The 3.′0× 3.′0
image shows two lobes that are roughly aligned with the optical center, but with no detected
radio core.
– 21 –
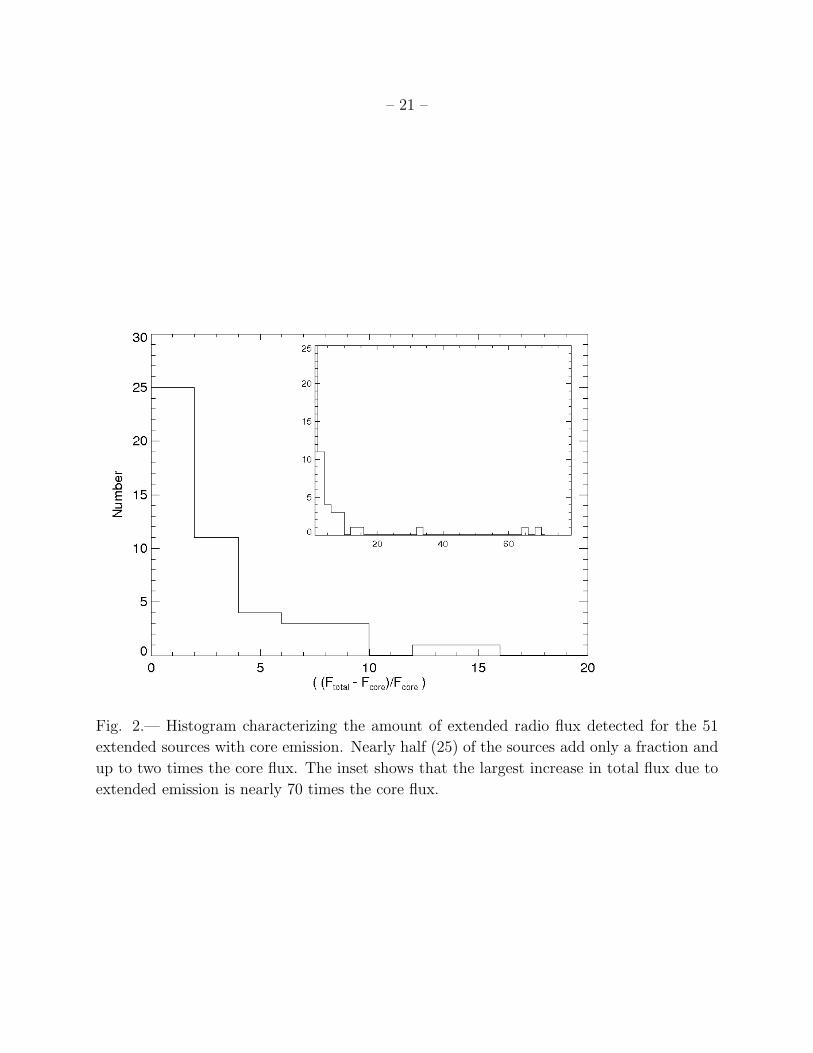
Fig. 2.— Histogram characterizing the amount of extended radio flux detected for the 51
extended sources with core emission. Nearly half (25) of the sources add only a fraction and
up to two times the core flux. The inset shows that the largest increase in total flux due to
extended emission is nearly 70 times the core flux.

– 22 –
Fig. 3.— FWHMHα histogram: the solid line is for the extended sources, the dashed line
is for the core-only sources, and the dotted line is for the non-radio detected sources in the
flux limited sample. The extended source distribution is shifted to higher values by ∼ 2000
km s−1 compared to the core-only and flux limited samples.

– 23 –
Fig. 4.— LHα histogram: the solid line is for the extended sources, the dashed line is for the
core-only sources, and the dotted line is for the non-radio detected sources in the flux limited
sample. The distributions have similar shapes, peak values, and show significant overlap at
luminosities greater than 1042 ergs s−1.

– 24 –
Fig. 5.— L1.4 GHz histogram: the solid line is for the extended sources, the dashed line is for
the core-only sources, and the dotted line is for the full optical sample. The sharp drop off
of the dotted line at 1023.5 Watts Hz−1 is due to normalization and does not actually go to
zero. The relative lack of sources at 1024.5 Watts Hz−1 is a manifestation the FR I/FR II
dividing line.

– 25 –
Fig. 6.— log(R) histogram: Top, the solid line is for the extended sources and the dotted
line is for the core-only sources. Bottom, for the combined sample of core-only and extended
sources the dashed line is for objects with L1.4GHz < 1024.4 Watts Hz−1 and represents an
FR I-like population and the dot-dashed line is for objects with L1.4GHz > 1024.4 Watts Hz−1
and represents an FR II-like population.
Related Documents