Mon. Not. R. Astron. Soc. 412, 223–245 (2011) doi:10.1111/j.1365-2966.2010.17900.x Radio-continuum detections of Galactic Planetary Nebulae – I. MASH PNe detected in large-scale radio surveys I. S. Bojiˇ ci´ c, 1 Q. A. Parker, 1,2 M. D. Filipovi´ c 3 and D. J. Frew 1 1 Department of Physics and Astronomy, Macquarie University, Sydney, NSW 2109, Australia 2 Australian Astronomical Observatory, Epping, NSW 1710, Australia 3 University of Western Sydney, Locked Bag 1797, Penrith South DC, NSW 1797, Australia Accepted 2010 October 21. Received 2010 September 20; in original form 2010 April 21 ABSTRACT We present an updated and newly compiled radio-continuum data base for Mac- quarie/AAO/Strasbourg Hα (MASH) planetary nebulae (PNe) detected in the extant large- scale ‘blind’ radio-continuum surveys [NRAO VLA Sky Survey (NVSS), Sydney University Molonglo Sky Survey/Molonglo Galactic Plane Surveys (SUMSS/MGPS-2) and Parkes-MIT- NRAO (PMN)] and, for a small number of MASH PNe, observed and detected in targeted radio-continuum observations. We found radio counterparts for approximately 250 MASH PNe. In comparison with the percentage of previously known Galactic PNe detected in the NVSS and MGPS-2 radio-continuum surveys and according to their position on the flux den- sity angular diameter and the radio brightness temperature evolutionary diagrams we conclude, unsurprisingly, that the MASH sample presents the radio-faint end of the known Galactic PNe population. Also, we present radio-continuum spectral properties of a small sub-sample of MASH PNe located in the strip between declinations -30 ◦ and -40 ◦ , that are detected in both the NVSS and MGPS-2 radio surveys. Key words: radiation mechanisms: thermal – astronomical data bases: miscellaneous – planetary nebulae: general – radio continuum: ISM. 1 INTRODUCTION Planetary nebulae (PNe) are ionized, gaseous envelopes ejected from intermediate-mass stars (1–8 M ) in the final stage of their evolution. At radio frequencies, the dominant emission mechanism from ionized nebulae is bremsstrahlung (or free–free radiation). Due to the direct dependence of the bremsstrahlung emissivity on the square of the electron density the radio-continuum observations of PNe are an important source of information concerning the over- all physical structure and mass of the ionized gas. Also, the radio brightness is especially effective as an evolutionary tracer due to its intrinsic dependence on the ionized gas density and the degree of ionization. In the initial stage of the post-AGB evolution, the radio flux density will be proportional to the number of ionising photons from the central star (CS; Zijlstra 1990), while from the moment when the shell becomes fully ionized, the radio-evolution starts to be governed mostly by the expansion of the ionized gas. Targeted radio-continuum observations of PNe are usually based on optically identified objects. However, the effects of interstellar reddening, especially in directions where most PNe are expected E-mail: [email protected] to be found (e.g. Galactic plane and Galactic bulge), have strongly biased optically detected PNe towards intrinsically radio brighter objects. The new Macquarie/AAO/Strasbourg Hα (MASH) cata- logues of Galactic PNe (GPNe; Parker et al. 2006; Miszalski et al. 2008a) have increased by nearly 40 per cent the known population of GPNe, which now stands at nearly 3000 in total (Frew & Parker 2010) and made a major impact in the domain of PNe with low and extremely low luminosities which were previously poorly rep- resented. These significant discoveries derived from the innovative AAO/UKST SuperCOSMOS Hα survey of the Southern Galactic plane (SHS; Parker et al. 2005) whose depth, arcsecond resolution, uniformity and 4000 deg 2 areal coverage opened fresh parameter discovery space. Key problems in PN research are some of the main aims of current and future studies of the MASH team which will fully ex- ploit this new large sample (e.g. Frew & Parker 2006; Cohen et al. 2007; Miszalski, Acker & Parker 2008b; Miszalski et al. 2009a,b; Kovacevic & Parker 2009). These problems include the distance problem, unravelling the optical and radio-continuum PN luminos- ity function from significant new samples in the Galactic bulge (Kovacevic et al. 2010), understanding the quantitative differences in the multi-wavelength characteristics of PNe (Cohen et al. 2010) and examination of correlations between evolutionary stage and observable properties of PNe. C 2011 The Authors Monthly Notices of the Royal Astronomical Society C 2011 RAS

Welcome message from author
This document is posted to help you gain knowledge. Please leave a comment to let me know what you think about it! Share it to your friends and learn new things together.
Transcript
Mon. Not. R. Astron. Soc. 412, 223–245 (2011) doi:10.1111/j.1365-2966.2010.17900.x
Radio-continuum detections of Galactic Planetary Nebulae – I. MASHPNe detected in large-scale radio surveys
I. S. Bojicic,1! Q. A. Parker,1,2 M. D. Filipovic3 and D. J. Frew1
1Department of Physics and Astronomy, Macquarie University, Sydney, NSW 2109, Australia2Australian Astronomical Observatory, Epping, NSW 1710, Australia3University of Western Sydney, Locked Bag 1797, Penrith South DC, NSW 1797, Australia
Accepted 2010 October 21. Received 2010 September 20; in original form 2010 April 21
ABSTRACTWe present an updated and newly compiled radio-continuum data base for Mac-quarie/AAO/Strasbourg H" (MASH) planetary nebulae (PNe) detected in the extant large-scale ‘blind’ radio-continuum surveys [NRAO VLA Sky Survey (NVSS), Sydney UniversityMolonglo Sky Survey/Molonglo Galactic Plane Surveys (SUMSS/MGPS-2) and Parkes-MIT-NRAO (PMN)] and, for a small number of MASH PNe, observed and detected in targetedradio-continuum observations. We found radio counterparts for approximately 250 MASHPNe. In comparison with the percentage of previously known Galactic PNe detected in theNVSS and MGPS-2 radio-continuum surveys and according to their position on the flux den-sity angular diameter and the radio brightness temperature evolutionary diagrams we conclude,unsurprisingly, that the MASH sample presents the radio-faint end of the known Galactic PNepopulation. Also, we present radio-continuum spectral properties of a small sub-sample ofMASH PNe located in the strip between declinations !30" and !40", that are detected in boththe NVSS and MGPS-2 radio surveys.
Key words: radiation mechanisms: thermal – astronomical data bases: miscellaneous –planetary nebulae: general – radio continuum: ISM.
1 IN T RO D U C T I O N
Planetary nebulae (PNe) are ionized, gaseous envelopes ejectedfrom intermediate-mass stars (1–8 M#) in the final stage of theirevolution. At radio frequencies, the dominant emission mechanismfrom ionized nebulae is bremsstrahlung (or free–free radiation).Due to the direct dependence of the bremsstrahlung emissivity onthe square of the electron density the radio-continuum observationsof PNe are an important source of information concerning the over-all physical structure and mass of the ionized gas. Also, the radiobrightness is especially effective as an evolutionary tracer due toits intrinsic dependence on the ionized gas density and the degreeof ionization. In the initial stage of the post-AGB evolution, theradio flux density will be proportional to the number of ionisingphotons from the central star (CS; Zijlstra 1990), while from themoment when the shell becomes fully ionized, the radio-evolutionstarts to be governed mostly by the expansion of the ionizedgas.
Targeted radio-continuum observations of PNe are usually basedon optically identified objects. However, the effects of interstellarreddening, especially in directions where most PNe are expected
!E-mail: [email protected]
to be found (e.g. Galactic plane and Galactic bulge), have stronglybiased optically detected PNe towards intrinsically radio brighterobjects. The new Macquarie/AAO/Strasbourg H" (MASH) cata-logues of Galactic PNe (GPNe; Parker et al. 2006; Miszalski et al.2008a) have increased by nearly 40 per cent the known populationof GPNe, which now stands at nearly 3000 in total (Frew & Parker2010) and made a major impact in the domain of PNe with lowand extremely low luminosities which were previously poorly rep-resented. These significant discoveries derived from the innovativeAAO/UKST SuperCOSMOS H" survey of the Southern Galacticplane (SHS; Parker et al. 2005) whose depth, arcsecond resolution,uniformity and 4000 deg2 areal coverage opened fresh parameterdiscovery space.
Key problems in PN research are some of the main aims ofcurrent and future studies of the MASH team which will fully ex-ploit this new large sample (e.g. Frew & Parker 2006; Cohen et al.2007; Miszalski, Acker & Parker 2008b; Miszalski et al. 2009a,b;Kovacevic & Parker 2009). These problems include the distanceproblem, unravelling the optical and radio-continuum PN luminos-ity function from significant new samples in the Galactic bulge(Kovacevic et al. 2010), understanding the quantitative differencesin the multi-wavelength characteristics of PNe (Cohen et al. 2010)and examination of correlations between evolutionary stage andobservable properties of PNe.
C$ 2011 The AuthorsMonthly Notices of the Royal Astronomical Society C$ 2011 RAS
224 I. S. Bojicic et al.
The radio-continuum data form an important component in themulti-wavelength evolutionary scheme for this new large sample ofGPNe. It enables direct calculation of electron densities, degreesof ionization and interstellar extinction in the direction of PNe. Inthis paper we present the newly compiled and complete data baseof radio-continuum-detected MASH PNe.
2 R A D I O - C O N T I N U U M I D E N T I F I C AT I O N SO F P N E F RO M T H E M A S H C ATA L O G U E
Prior to the extensive radio-continuum survey of MASH PNe(Bojicic et al. in preparation ) only a handful of MASH PNe ob-jects have been observed in PNe-targeted radio-continuum surveys.Ratag & Pottasch (1991), using the Westerbork Radio Telescope(WSRT) and the Very Large Array (VLA) radio telescope, ob-served a large set of PN candidates selected from the IRAS PointSource catalogue and placed in the direction of the Galactic bulge.The chosen sample is based on the far-infrared selection criteriadescribed in Pottasch et al. (1988). The authors noted that approx-imately 20 per cent of observed objects were detectable at 6 cmthough not all of detected objects were confirmed PNe. From thatsample some eight objects have been recently identified as likelyPN in SHS H" images and, after confirmatory optical spectroscopy,made their way into the MASH catalogue. Similarly, based on the[S III]#9532 survey of a 4 % 4 degree field centred on the GalacticCentre, Van de Steene & Jacoby (2001) reported on &100 possibleidentifications of PNe. For 63 PN candidates from this sample theobtained spectra appear consistent with highly reddened PN (Vande Steene & Jacoby 2001). Using the Australia Telescope CompactArray (ATCA), some 64 PN candidates were observed and 57 and54 detected at 6 and 3 cm, respectively. The MASH catalogue con-tains five PNe observed in that survey from which only two havebeen positively detected in the radio continuum.
On the other hand, several large-scale radio surveys like theNRAO VLA Sky Survey (NVSS; Condon et al. 1998), theSydney University Molonglo Sky Survey (SUMSS; Bock, Large& Sadler 1999; Mauch et al. 2003) and its complementary Mo-longlo Galactic Plane Surveys (MGPS and MGPS-2; Green et al.1999; Murphy et al. 2007), and the Parkes-MIT-NRAO (PMN) sur-vey (Wright et al. 1994, 1996; Griffith et al. 1994; Gregory et al.1994) have proven to be an excellent source of PNe radio data(e.g. Condon, Kaplan & Terzian 1999; Siodmiak & Tylenda 2001;Morgan, Parker & Cohen 2003; Cohen et al. 2007; Umanaet al. 2008; Viironen et al. 2009; Condon & Kaplan 1998; Luo,Condon & Yin 2005, hereafter CK98 and LCY05, respectively).These surveys form the basis for this study.
2.1 MASH PNe detected in NVSS
The NVSS is a blind radio survey that covers &80 per cent of thesky north of $ = !40" at 1.4 GHz (20 cm). The detection thresholdlimit is &2.5 mJy (for sources with angular size comparable with thefull width at half-maximum (FWHM) of the produced synthesizedbeam) with positional uncertainties of the order of 7 arcsec at thesurvey limit (for sources brighter that 15 mJy the rms uncertaintiesare as low as 1 arcsec). The NVSS is '90 per cent complete at fluxdensities above 5 mJy except near the Galactic bulge, where, for thegiven flux threshold level, the catalogue completeness is estimatedto be '80 per cent (Condon et al. 1998). For unresolved sourcesthe incremental completeness is 50 per cent at 2.5 mJy and it risesrapidly to 99 per cent at 3.4 mJy.
CK98 reported detections of 680 of the 885 known PNe (listedin the Strasbourg-ESO Catalogue of Galactic Planetary Nebulae;Acker et al. 1992) with $ > !40". An additional 22 known PNe and122 PNe candidates satisfying the IR colour criteria from Preite-Martinez (1988) have been presented in Condon et al. (1999).
Another large data set of PNe radio-continuum identifications inthe NVSS catalogue was presented in LCY05. Based on the FirstSupplement to the Strasbourg-ESO Catalogue of Galactic Plane-tary Nebulae (Acker et al. 1992), PNe catalogued in Cappellaroet al. (2001); Kohoutek (2001, 2002); Kerber et al. (2003); Boumiset al. (2003) and on the set of 1047 positions from the preliminaryMASH catalogue they identified 315 correlated radio-continuumdetections.
However, from 178 objects detected from the preliminary MASHlist, some 33 have been subsequently rejected as non-PN by theMASH team prior to the publication of the MASH catalogue.1 Ad-ditionally, the MASH-II supplement (Miszalski et al. 2008a) intro-duced a large set of PNe which have not been previously correlatedwith the NVSS catalogue. Thus, an updated cleaned list of MASH-NVSS radio identifications and fluxes is presented here for the firsttime.
Similarly as in LCY05, we first compared catalogued opticalpositions with NVSS positions. Cross-identifications between thetwo catalogues were considered as ‘possible’ if the offset betweenthe radio peak and the optical centroid was:
(i) less than 25 arcsec for objects with % opt < 25 arcsec,(ii) less than 1.2 % % opt for objects with 25 arcsec ( % opt <
45 arcsec and(iii) less than % opt for objects with % opt ' 45 arcsec,
where % opt is the optically determined angular diameter in MASH(we will use this notation throughout this paper unless stated oth-erwise). All possible identifications were visually inspected usingthe finding charts (approximately 7 % 7 arcmin) created from radio-continuum and H" images. The 1.4 GHz images were obtained fromthe NVSS postage stamp server.2
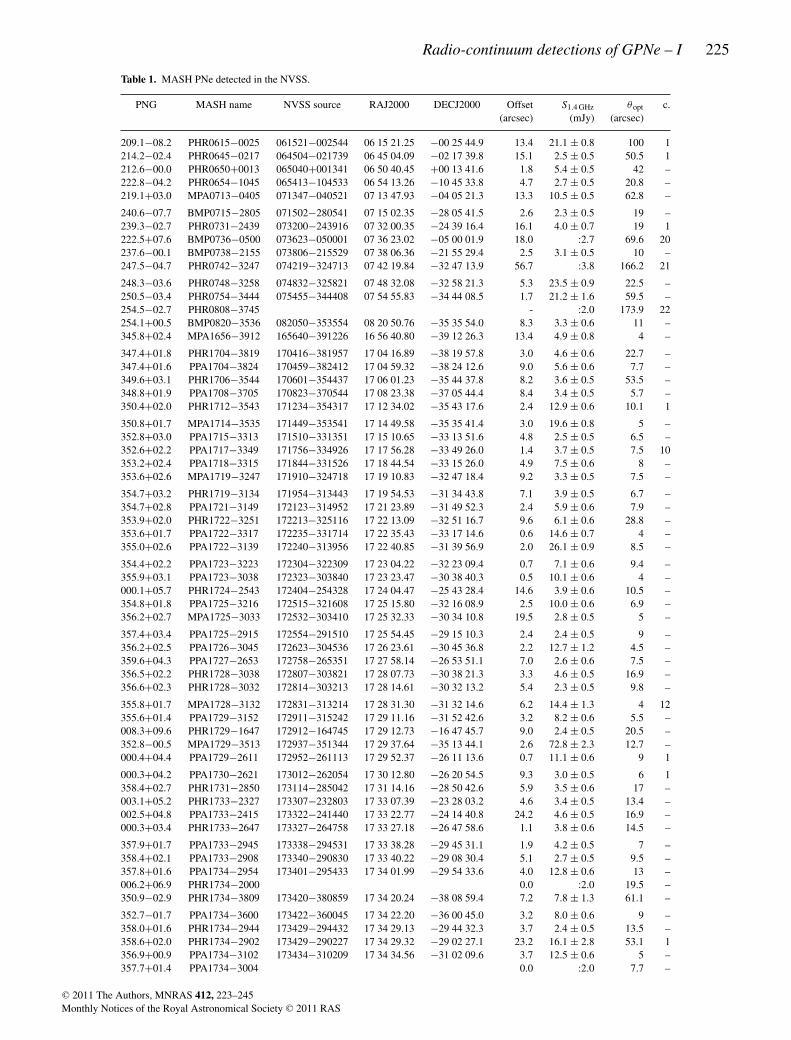
The updated list of positive NVSS radio-continuum identifica-tions now contains 201 MASH PNe. It includes 145 confirmedMASH PNe listed in LCY05 and additional 56 objects mostly fromthe MASH-II supplement. Furthermore, 14 radio detections fromthe updated list have been flagged as suspect due to the larger off-set of the radio-peak position from the optical centroid or becausetheir radio counterparts are just below the threshold level and havenot been picked up by the NVSS cataloguing algorithm. In thelater case, we quote 2 mJy as a rough estimate of the flux density.All detected PNe are presented in Table 1. The first, second andthird rows of Table 1 represent the official IAU PNG designation,the unique MASH catalogue identifier as described in Parker et al.(2006) and designation of the corresponding radio source from theoriginal NVSS catalogue (Condon et al. 1998), respectively. Thefourth, fifth and sixth columns contain the equatorial RAJ2000 andDECJ2000 coordinates of the radio source, and the angular offsetfrom the catalogued optical position of the MASH PN (in arcsec),respectively. The integrated flux density, as given in the NVSS, andoptically determined angular diameter are presented in columnsseven and eight. All suspect detections have been designated witha preceding colon in the flux density column and no uncertainty in
1 Based on control evaluation of their multi-wavelength properties (see Frew& Parker 2010).2 www.cv.nrao.edu/nvss/postage.shtml
C$ 2011 The Authors, MNRAS 412, 223–245Monthly Notices of the Royal Astronomical Society C$ 2011 RAS
Radio-continuum detections of GPNe – I 225
Table 1. MASH PNe detected in the NVSS.
PNG MASH name NVSS source RAJ2000 DECJ2000 Offset S1.4 GHz %opt c.(arcsec) (mJy) (arcsec)
209.1!08.2 PHR0615!0025 061521!002544 06 15 21.25 !00 25 44.9 13.4 21.1 ± 0.8 100 1214.2!02.4 PHR0645!0217 064504!021739 06 45 04.09 !02 17 39.8 15.1 2.5 ± 0.5 50.5 1212.6!00.0 PHR0650+0013 065040+001341 06 50 40.45 +00 13 41.6 1.8 5.4 ± 0.5 42 –222.8!04.2 PHR0654!1045 065413!104533 06 54 13.26 !10 45 33.8 4.7 2.7 ± 0.5 20.8 –219.1+03.0 MPA0713!0405 071347!040521 07 13 47.93 !04 05 21.3 13.3 10.5 ± 0.5 62.8 –
240.6!07.7 BMP0715!2805 071502!280541 07 15 02.35 !28 05 41.5 2.6 2.3 ± 0.5 19 –239.3!02.7 PHR0731!2439 073200!243916 07 32 00.35 !24 39 16.4 16.1 4.0 ± 0.7 19 1222.5+07.6 BMP0736!0500 073623!050001 07 36 23.02 !05 00 01.9 18.0 :2.7 69.6 20237.6!00.1 BMP0738!2155 073806!215529 07 38 06.36 !21 55 29.4 2.5 3.1 ± 0.5 10 –247.5!04.7 PHR0742!3247 074219!324713 07 42 19.84 !32 47 13.9 56.7 :3.8 166.2 21
248.3!03.6 PHR0748!3258 074832!325821 07 48 32.08 !32 58 21.3 5.3 23.5 ± 0.9 22.5 –250.5!03.4 PHR0754!3444 075455!344408 07 54 55.83 !34 44 08.5 1.7 21.2 ± 1.6 59.5 –254.5!02.7 PHR0808!3745 - :2.0 173.9 22254.1+00.5 BMP0820!3536 082050!353554 08 20 50.76 !35 35 54.0 8.3 3.3 ± 0.6 11 –345.8+02.4 MPA1656!3912 165640!391226 16 56 40.80 !39 12 26.3 13.4 4.9 ± 0.8 4 –
347.4+01.8 PHR1704!3819 170416!381957 17 04 16.89 !38 19 57.8 3.0 4.6 ± 0.6 22.7 –347.4+01.6 PPA1704!3824 170459!382412 17 04 59.32 !38 24 12.6 9.0 5.6 ± 0.6 7.7 –349.6+03.1 PHR1706!3544 170601!354437 17 06 01.23 !35 44 37.8 8.2 3.6 ± 0.5 53.5 –348.8+01.9 PPA1708!3705 170823!370544 17 08 23.38 !37 05 44.4 8.4 3.4 ± 0.5 5.7 –350.4+02.0 PHR1712!3543 171234!354317 17 12 34.02 !35 43 17.6 2.4 12.9 ± 0.6 10.1 1
350.8+01.7 MPA1714!3535 171449!353541 17 14 49.58 !35 35 41.4 3.0 19.6 ± 0.8 5 –352.8+03.0 PPA1715!3313 171510!331351 17 15 10.65 !33 13 51.6 4.8 2.5 ± 0.5 6.5 –352.6+02.2 PPA1717!3349 171756!334926 17 17 56.28 !33 49 26.0 1.4 3.7 ± 0.5 7.5 10353.2+02.4 PPA1718!3315 171844!331526 17 18 44.54 !33 15 26.0 4.9 7.5 ± 0.6 8 –353.6+02.6 MPA1719!3247 171910!324718 17 19 10.83 !32 47 18.4 9.2 3.3 ± 0.5 7.5 –
354.7+03.2 PHR1719!3134 171954!313443 17 19 54.53 !31 34 43.8 7.1 3.9 ± 0.5 6.7 –354.7+02.8 PPA1721!3149 172123!314952 17 21 23.89 !31 49 52.3 2.4 5.9 ± 0.6 7.9 –353.9+02.0 PHR1722!3251 172213!325116 17 22 13.09 !32 51 16.7 9.6 6.1 ± 0.6 28.8 –353.6+01.7 PPA1722!3317 172235!331714 17 22 35.43 !33 17 14.6 0.6 14.6 ± 0.7 4 –355.0+02.6 PPA1722!3139 172240!313956 17 22 40.85 !31 39 56.9 2.0 26.1 ± 0.9 8.5 –
354.4+02.2 PPA1723!3223 172304!322309 17 23 04.22 !32 23 09.4 0.7 7.1 ± 0.6 9.4 –355.9+03.1 PPA1723!3038 172323!303840 17 23 23.47 !30 38 40.3 0.5 10.1 ± 0.6 4 –000.1+05.7 PHR1724!2543 172404!254328 17 24 04.47 !25 43 28.4 14.6 3.9 ± 0.6 10.5 –354.8+01.8 PPA1725!3216 172515!321608 17 25 15.80 !32 16 08.9 2.5 10.0 ± 0.6 6.9 –356.2+02.7 MPA1725!3033 172532!303410 17 25 32.33 !30 34 10.8 19.5 2.8 ± 0.5 5 –
357.4+03.4 PPA1725!2915 172554!291510 17 25 54.45 !29 15 10.3 2.4 2.4 ± 0.5 9 –356.2+02.5 PPA1726!3045 172623!304536 17 26 23.61 !30 45 36.8 2.2 12.7 ± 1.2 4.5 –359.6+04.3 PPA1727!2653 172758!265351 17 27 58.14 !26 53 51.1 7.0 2.6 ± 0.6 7.5 –356.5+02.2 PHR1728!3038 172807!303821 17 28 07.73 !30 38 21.3 3.3 4.6 ± 0.5 16.9 –356.6+02.3 PHR1728!3032 172814!303213 17 28 14.61 !30 32 13.2 5.4 2.3 ± 0.5 9.8 –
355.8+01.7 MPA1728!3132 172831!313214 17 28 31.30 !31 32 14.6 6.2 14.4 ± 1.3 4 12355.6+01.4 PPA1729!3152 172911!315242 17 29 11.16 !31 52 42.6 3.2 8.2 ± 0.6 5.5 –008.3+09.6 PHR1729!1647 172912!164745 17 29 12.73 !16 47 45.7 9.0 2.4 ± 0.5 20.5 –352.8!00.5 MPA1729!3513 172937!351344 17 29 37.64 !35 13 44.1 2.6 72.8 ± 2.3 12.7 –000.4+04.4 PPA1729!2611 172952!261113 17 29 52.37 !26 11 13.6 0.7 11.1 ± 0.6 9 1
000.3+04.2 PPA1730!2621 173012!262054 17 30 12.80 !26 20 54.5 9.3 3.0 ± 0.5 6 1358.4+02.7 PHR1731!2850 173114!285042 17 31 14.16 !28 50 42.6 5.9 3.5 ± 0.6 17 –003.1+05.2 PHR1733!2327 173307!232803 17 33 07.39 !23 28 03.2 4.6 3.4 ± 0.5 13.4 –002.5+04.8 PPA1733!2415 173322!241440 17 33 22.77 !24 14 40.8 24.2 4.6 ± 0.5 16.9 –000.3+03.4 PHR1733!2647 173327!264758 17 33 27.18 !26 47 58.6 1.1 3.8 ± 0.6 14.5 –
357.9+01.7 PPA1733!2945 173338!294531 17 33 38.28 !29 45 31.1 1.9 4.2 ± 0.5 7 –358.4+02.1 PPA1733!2908 173340!290830 17 33 40.22 !29 08 30.4 5.1 2.7 ± 0.5 9.5 –357.8+01.6 PPA1734!2954 173401!295433 17 34 01.99 !29 54 33.6 4.0 12.8 ± 0.6 13 –006.2+06.9 PHR1734!2000 0.0 :2.0 19.5 –350.9!02.9 PHR1734!3809 173420!380859 17 34 20.24 !38 08 59.4 7.2 7.8 ± 1.3 61.1 –
352.7!01.7 PPA1734!3600 173422!360045 17 34 22.20 !36 00 45.0 3.2 8.0 ± 0.6 9 –358.0+01.6 PHR1734!2944 173429!294432 17 34 29.13 !29 44 32.3 3.7 2.4 ± 0.5 13.5 –358.6+02.0 PHR1734!2902 173429!290227 17 34 29.32 !29 02 27.1 23.2 16.1 ± 2.8 53.1 1356.9+00.9 PPA1734!3102 173434!310209 17 34 34.56 !31 02 09.6 3.7 12.5 ± 0.6 5 –357.7+01.4 PPA1734!3004 0.0 :2.0 7.7 –
C$ 2011 The Authors, MNRAS 412, 223–245Monthly Notices of the Royal Astronomical Society C$ 2011 RAS
226 I. S. Bojicic et al.
Table 1 – continued
PNG MASH name NVSS source RAJ2000 DECJ2000 Offset S1.4 GHz %opt c.(arcsec) (mJy) (arcsec)
359.4+02.3a PPA1735!2809 173512!280933 17 35 12.30 !28 09 33.2 4.5 2.9 ± 0.5 7.9 –001.7+03.6 PHR1735!2527 173547!252739 17 35 47.34 !25 27 39.1 4.0 3.9 ± 0.6 7 –352.1!02.6 PHR1736!3659 173618!365950 17 36 18.89 !36 59 50.6 19.4 14.6 ± 1.2 15.9 1003.5+04.5 PHR1736!2330 0.0 :2.0 11.4 –359.7+02.0 PPA1736!2804 173657!280441 17 36 57.09 !28 04 41.0 4.0 10.9 ± 0.6 5.7 –
350.8!03.6 MPA1737!3837 173706!383721 17 37 06.13 !38 37 21.8 11.9 4.4 ± 0.7 8 –001.5+03.1 PHR1737!2559 173716!255933 17 37 16.35 !25 59 33.7 4.8 3.5 ± 0.5 16.9 –002.3+03.6 PPA1737!2501 173724!250137 17 37 24.12 !25 01 37.7 5.9 5.6 ± 0.6 7 –354.6!01.4 PPA1737!3414 173753!341424 17 37 53.82 !34 14 24.3 2.9 7.2 ± 0.6 6 11351.1!03.9 PHR1739!3829 173917!382929 17 39 17.20 !38 29 29.8 14.2 :11.2 45.3 1;27
354.5!02.0a PPA1740!3437 174030!343713 17 40 30.17 !34 37 13.3 5.5 3.4 ± 0.6 7 –353.6!02.6 PPA1740!3543 174045!354359 17 40 45.94 !35 43 59.5 4.4 4.7 ± 0.5 9 1355.6!01.4 PHR1740!3324 174054!332418 17 40 54.75 !33 24 18.4 1.9 5.5 ± 0.6 9 –010.1+07.4 PHR1741!1624 174104!162450 17 41 04.87 !16 24 50.2 12.9 3.5 ± 0.5 12.7 –356.0!01.4 PPA1741!3302 174133!330208 17 41 33.52 !33 02 08.6 6.6 4.8 ± 0.5 7.5 –
355.2!02.0 PPA1741!3405 174159!340549 17 41 59.09 !34 05 49.7 15.7 3.5 ± 0.6 6.5 1356.0!01.8 PPA1743!3315 174307!331554 17 43 07.44 !33 15 54.9 3.1 5.8 ± 0.5 5 –003.5+02.6 PHR1743!2431 174338!243158 17 43 38.88 !24 31 58.2 7.7 4.3 ± 0.6 30.4 –352.2!04.3 PHR1743!3749 174348!375000 17 43 48.57 !37 50 00.0 12.1 2.6 ± 0.6 35.5 –356.5!01.8 PPA1744!3252 174427!325211 17 44 27.77 !32 52 11.8 3.0 6.1 ± 0.6 6 13
356.6!01.9 PHR1745!3246 174509!324616 17 45 09.55 !32 46 16.5 3.2 30.3 ± 1.6 43.2 1;18353.8!03.7 PHR1745!3609 174531!361011 17 45 31.56 !36 10 11.3 16.3 3.0 ± 0.6 30.4 1356.1!02.7 PPA1747!3341 174705!334112 17 47 05.46 !33 41 12.0 12.2 4.7 ± 0.8 5.2 1007.8+04.3 PHR1747!1957 174715!195723 17 47 15.74 !19 57 23.3 5.8 2.3 ± 0.5 15.9 –002.0+00.7 MPA1747!2649 174728!264948 17 47 28.15 !26 49 48.1 2.0 4.1 ± 0.5 4 –
357.3!02.0 PPA1747!3215 174728!321546 17 47 28.46 !32 15 46.0 0.5 4.2 ± 0.5 4.5 –354.5!03.9 PHR1748!3538 174815!353846 17 48 15.79 !35 38 46.4 16.6 :3.2 46.7 1;28004.3+01.8a PHR1748!2417 174832!241738 17 48 32.87 !24 17 38.7 3.2 3.8 ± 0.6 13.5 –003.5+01.3 MPA1748!2511 174841!251135 17 48 41.74 !25 11 35.8 1.9 24.9 ± 0.9 4.5 –005.0+02.2 PHR1748!2326 174845!232627 17 48 45.10 !23 26 27.2 12.4 3.7 ± 0.6 10.2 –
357.5!02.4 PPA1749!3216 174938!321630 17 49 38.05 !32 16 30.4 3.1 7.3 ± 0.5 8.4 –009.9+04.5 PHR1750!1803 175047!180334 17 50 47.62 !18 03 34.0 4.0 4.9 ± 0.6 26.2 –358.0!02.4 PPA1750!3152 175048!315224 17 50 48.27 !31 52 24.7 3.7 4.6 ± 0.6 6 –000.0!01.3 PPA1751!2933 175059!293347 17 50 59.46 !29 33 47.7 12.7 4.5 ± 0.8 11 2008.8+03.8 PHR1751!1925 175107!192540 17 51 07.74 !19 25 40.8 14.9 3.0 ± 0.5 10 –
010.0+04.3 PHR1751!1804 175144!180425 17 51 44.84 !18 04 25.5 28.9 :3.8 27.5 1003.7+00.5 PHR1752!2527 175208!252746 17 52 08.55 !25 27 46.8 1.4 23.1 ± 1.2 11.7 1000.1!01.7 PHR1752!2941 175248!294205 17 52 48.74 !29 42 05.7 7.0 2.9 ± 0.6 13.9 –000.3!01.6 PHR1752!2930 175252!293000 17 52 52.19 !29 30 00.6 1.2 4.1 ± 0.5 8 14001.1!01.2 PPA1753!2836 175317!283602 17 53 17.42 !28 36 02.9 3.1 8.8 ± 0.6 10.7 –
355.9!04.4 PHR1753!3443 175339!344340 17 53 39.83 !34 43 40.2 5.9 15.0 ± 0.7 20.1 –006.1+01.5 PHR1753!2254 175345!225402 17 53 45.35 !22 54 02.5 1.6 25.2 ± 1.2 20.6 –357.8!03.3 PHR1753!3228 175354!322847 17 53 54.92 !32 28 47.6 13.9 3.1 ± 0.5 32 –002.1!01.1 MPA1755!2741 175510!274131 17 55 10.19 !27 41 31.9 8.6 2.7 ± 0.5 8 –007.3+01.7 PHR1755!2142 175535!214244 17 55 35.07 !21 42 44.8 8.5 5.0 ± 0.6 16 –
006.9+01.5 MPA1755!2212 175536!221256 17 55 36.72 !22 12 56.8 9.8 4.0 ± 0.5 4 –007.4+01.7 PHR1755!2140 175542!214017 17 55 42.82 !21 40 17.8 3.1 3.1 ± 0.5 16.7 –001.0!01.9 PHR1755!2904 175543!290408 17 55 43.07 !29 04 08.0 3.0 4.8 ± 0.6 13.5 –002.2!01.2 PPA1755!2739 175545!273942 17 55 45.36 !27 39 42.9 3.7 8.0 ± 0.5 12.6 –013.1+05.0 PHR1755!1502 175546!150247 17 55 46.48 !15 02 47.8 4.0 3.7 ± 0.5 17.1 –
012.5+04.3 PHR1757!1556 175710!155620 17 57 10.61 !15 56 20.5 3.0 3.7 ± 0.7 26.9 –011.8+03.7 PHR1757!1649 175740!164915 17 57 40.72 !16 49 15.9 16.4 14.5 ± 1.8 137.7 1010.2+02.7 PHR1758!1841 175814!184125 17 58 14.40 !18 41 25.2 0.8 18.3 ± 0.7 8 1357.8!04.4 PHR1758!3304 175826!330501 17 58 26.50 !33 05 01.6 8.0 2.4 ± 0.5 17.7 –007.8+01.2 MPA1758!2135 175833!213519 17 58 33.95 !21 35 19.6 4.6 8.8 ± 0.6 5 –
003.5!01.2 PPA1758!2628 175837!262848 17 58 37.05 !26 28 48.9 2.0 13.7 ± 0.6 4.5 –008.1+01.3 PHR1758!2112 175840!211240 17 58 40.66 !21 12 40.4 5.7 6.1 ± 0.6 9.9 –010.2+02.4 PHR1759!1853 175905!185337 17 59 05.49 !18 53 37.3 16.3 2.9 ± 0.7 10.8 –003.6!01.3 PHR1759!2630 175912!263026 17 59 12.11 !26 30 26.8 2.8 47.7 ± 1.5 8.5 1003.1!01.6 PHR1759!2706 175926!270623 17 59 26.08 !27 06 23.7 10.3 3.7 ± 0.6 33.8 –
C$ 2011 The Authors, MNRAS 412, 223–245Monthly Notices of the Royal Astronomical Society C$ 2011 RAS
Radio-continuum detections of GPNe – I 227
Table 1 – continued
PNG MASH name NVSS source RAJ2000 DECJ2000 Offset S1.4 GHz %opt c.(arcsec) (mJy) (arcsec)
003.0!01.7 PHR1759!2712 175932!271245 17 59 32.85 !27 12 45.1 6.8 5.0 ± 0.7 65.2 –003.3!01.6 PHR1759!2651 175955!265131 17 59 55.19 !26 51 31.8 17.3 4.2 ± 0.6 8.8 1001.7!02.6 PPA1800!2846 180001!284628 18 00 01.27 !28 46 28.8 9.0 2.5 ± 0.5 14.6 –010.6+02.4 MPA1800!1834 180008!183436 18 00 08.49 !18 34 36.3 4.7 6.3 ± 0.6 9 –003.4!01.8 PHR1800!2653 180042!265334 18 00 42.26 !26 53 34.6 2.5 4.7 ± 0.5 11.5 –
004.8!01.1 PHR1801!2522 180116!252239 18 01 16.90 !25 22 39.6 1.6 67.3 ± 2.5 8.4 3004.3!01.4 PPA1801!2553 180118!255323 18 01 18.92 !25 53 23.2 2.2 12.7 ± 0.7 5.5 –014.7+04.3 MPA1801!1402 180146!140205 18 01 46.34 !14 02 05.2 14.0 2.5 ± 0.6 5 –003.8!01.9 PHR1802!2637 180210!263700 18 02 10.68 !26 37 00.6 10.2 2.7 ± 0.6 8.2 –012.4+02.4 MPA1803!1657 180355!165724 18 03 55.07 !16 57 24.2 2.2 21.5 ± 0.8 11 –
012.9+02.6 MPA1804!1627 180410!162743 18 04 10.45 !16 27 43.7 0.8 5.6 ± 0.5 10 –011.0+01.4 PHR1804!1842 180428!184241 18 04 28.62 !18 42 41.5 8.3 14.1 ± 0.7 17.5 –004.2!02.5 PHR1805!2631 180519!263146 18 05 19.34 !26 31 46.9 10.4 4.6 ± 0.6 9.7 –004.1!03.3 PPA1808!2700 180800!270017 18 08 00.78 !27 00 17.4 8.4 3.6 ± 0.7 11.4 –015.5+02.8 BMP1808!1406 180825!140912 18 08 25.91 !14 09 12.9 200.0 :3.8 470 29
016.6+03.1 PHR1809!1300 180935!130007 18 09 35.34 !13 00 07.6 15.8 6.0 ± 0.7 14.4 –013.3+01.1 PHR1810!1647 181011!164724 18 10 11.64 !16 47 24.1 37.6 >5.3 121 1;19009.4!01.2 PHR1811!2123 181110!212312 18 11 10.78 !21 23 12.7 2.8 18.6 ± 0.8 16.2 –009.8!01.1 PHR1811!2100 181139!210043 18 11 39.20 !21 00 43.6 2.8 3.3 ± 0.6 19.6 –007.5!02.4 PPA1811!2337 181140!233717 18 11 40.65 !23 37 17.9 2.0 9.2 ± 0.6 9.9 –
008.6!02.2 PPA1813!2233 181311!223322 18 13 11.19 !22 33 22.7 9.2 3.2 ± 0.7 7.2 –006.4!03.4 PHR1813!2505 181326!250538 18 13 26.82 !25 05 38.8 13.4 3.7 ± 0.8 26.5 –014.6+01.0 PHR1813!1543 181330!154358 18 13 30.06 !15 43 58.7 42.5 :8.5 23.8 1017.6+02.6 PHR1813!1220 181333!122047 18 13 33.69 !12 20 47.8 0.2 26.6 ± 0.9 8 –010.0!01.5 PHR1813!2057 181335!205705 18 13 35.35 !20 57 05.3 0.8 33.4 ± 1.1 13.4 4
015.5+01.0 PHR1815!1457 181506!145723 18 15 06.61 !14 57 23.1 2.6 9.2 ± 0.6 8.5 –008.4!02.8 PHR1815!2300 181513!230105 18 15 13.07 !23 01 05.2 1.5 3.2 ± 0.6 13 –014.5+00.4 MPA1815!1602 181521!160259 18 15 21.19 !16 02 59.7 3.9 10.5 ± 0.6 5.5 –010.0!02.0 MPA1815!2113 181537!211318 18 15 37.26 !21 13 18.0 4.7 19.0 ± 0.8 8 –010.7!02.3 MPA1818!2044 181804!204411 18 18 04.44 !20 44 11.8 2.3 5.7 ± 0.5 10.8 –
017.5+01.0 MPA1819!1307 181903!130717 18 19 03.37 !13 07 17.2 20.5 :5.2 5.5 –020.4+02.2 PHR1820!1002 182015!100228 18 20 15.28 !10 02 28.9 1.8 4.9 ± 0.7 21.1 –012.1!02.1 PHR1820!1926 182017!192637 18 20 17.95 !19 26 37.1 6.4 4.4 ± 0.5 10.2 –020.4+02.0 MPA1820!1009 182050!100945 18 20 50.75 !10 09 45.9 3.6 3.3 ± 0.7 6 –011.0!02.9 PHR1820!2048 182053!204813 18 20 53.71 !20 48 13.6 2.0 15.0 ± 1.1 14.9 1
012.1!02.5 PHR1821!1939 182143!193944 18 21 43.32 !19 39 44.5 7.6 2.5 ± 0.5 12.2 –021.3+02.2 MPA1822!0914 182206!091401 18 22 06.14 !09 14 01.0 10.3 4.3 ± 0.8 8 –027.7+05.1 PHR1823!0214 182347!021433 18 23 47.85 !02 14 33.3 5.3 2.6 ± 0.6 28.1 –013.4!02.9 PHR1825!1839 182535!183942 18 25 35.63 !18 39 42.8 2.2 4.9 ± 0.6 29.2 –025.9+03.4 PHR1826!0435 182617!043525 18 26 17.94 !04 35 25.6 5.7 18.5 ± 1.3 17.5 5
021.2+00.9 PHR1826!0953 182626!095327 18 26 26.55 !09 53 27.5 6.8 8.4 ± 0.6 47.6 –022.0+01.3 PHR1826!0859 182627!085915 18 26 27.90 !08 59 15.1 7.7 4.5 ± 0.6 44 1018.2!00.9 MPA1827!1328 182729!132819 18 27 29.74 !13 28 19.1 1.2 34.5 ± 1.2 12 –016.8!01.7 BMP1827!1504 182750!150425 18 27 50.72 !15 04 25.4 1.8 11.6 ± 0.7 8 –025.6+02.8 MPA1827!0510 182757!051019 18 27 57.24 !05 10 19.3 4.4 4.7 ± 0.5 10 –
024.2+01.8 MPA1828!0652 182847!065159 18 28 47.85 !06 51 59.9 2.2 3.5 ± 0.5 7 –026.4+02.7 PHR1829!0431 182934!043135 18 29 34.15 !04 31 35.5 2.6 10.2 ± 0.5 18.2 6018.5!01.6 PHR1830!1331 183042!133111 18 30 42.31 !13 31 11.8 3.1 5.9 ± 0.6 18.4 –024.1+01.1 PHR1831!0715 183116!071525 18 31 16.87 !07 15 25.1 4.0 5.9 ± 0.5 16.9 –018.0!02.2 PHR1831!1415 183151!141519 18 31 51.05 !14 15 19.6 11.5 10.9 ± 1.5 56.9 –
019.2!01.6 MPA1831!1256 183152!125613 18 31 52.98 !12 56 13.7 0.4 15.0 ± 0.7 11 –018.7!01.8 PHR1832!1326 183204!132616 18 32 04.70 !13 26 16.3 8.8 5.9 ± 0.6 38.9 –024.4+00.9 MPA1832!0706 183222!070648 18 32 22.93 !07 06 48.0 9.0 5.5 ± 0.5 14 –027.8+02.7 PHR1832!0317 183231!031743 18 32 31.50 !03 17 43.1 3.5 11.3 ± 1.4 19.7 –027.0+01.5 PHR1835!0429 183511!042903 18 35 11.68 !04 29 03.1 3.1 62.0 ± 2.7 39.5 –
027.0+01.3 MPA1835!0440 183553!044009 18 35 53.71 !04 40 09.0 1.7 9.5 ± 0.6 7 –029.0+02.2 MPA1836!0227 183610!022710 18 36 10.77 !02 27 10.8 3.4 12.2 ± 0.6 10 –032.5+03.2 MPA1839+0106 183911+010617 18 39 11.80 +01 06 17.9 7.1 6.1 ± 0.6 10 –022.8!01.9 MPA1839!0953 183944!095313 18 39 44.48 !09 53 13.7 3.5 5.1 ± 0.5 9.4 –030.2+01.5 MPA1841!0140 184104!014044 18 41 04.41 !01 40 44.1 5.1 4.4 ± 0.7 8.9 –
C$ 2011 The Authors, MNRAS 412, 223–245Monthly Notices of the Royal Astronomical Society C$ 2011 RAS
228 I. S. Bojicic et al.
Table 1 – continued
PNG MASH name NVSS source RAJ2000 DECJ2000 Offset S1.4 GHz %opt c.(arcsec) (mJy) (arcsec)
032.6+02.4 MPA1842+0050 184211+005032 18 42 11.43 +00 50 32.8 0.9 15.1 ± 0.7 6 –023.2!02.6 MPA1842!0949 184257!094956 18 42 57.28 !09 49 56.5 9.0 11.1 ± 0.7 9 –032.0+01.7 PHR1843+0002 184345+000222 18 43 45.06 +00 02 22.2 1.3 10.7 ± 0.6 13 –029.8+00.5 PHR1843!0232 184358!023155 18 43 58.05 !02 31 55.4 21.3 :33 57.4 1026.8!01.0 MPA1843!0556 184358!055626 18 43 58.76 !05 56 26.2 14.2 5.5 ± 0.9 11.4 –
026.7!01.2 PHR1844!0603 184428!060326 18 44 28.82 !06 03 26.8 3.2 2.6 ± 0.5 14 –027.6!00.8 PHR1844!0503 184445!050421 18 44 45.91 !05 04 21.7 27.9 :3.2 20.5 1032.5+01.5 PHR1845+0021 184500+002116 18 45 00.37 +00 21 16.4 8.2 3.6 ± 0.5 30.9 –033.8+01.5 PHR1847+0132 184745+013248 18 47 45.45 +01 32 48.1 1.3 13.4 ± 0.6 43.4 –016.0!07.6 PHR1848!1829 184811!182927 18 48 11.46 !18 29 27.4 15.8 3.0 ± 0.6 18.8 –
024.4!03.5 PHR1848!0912 184832!091156 18 48 32.56 !09 11 56.6 5.8 6.0 ± 0.7 16.9 –028.5!01.4 PHR1848!0435 184842!043605 18 48 42.02 !04 36 05.6 21.2 5.6 ± 0.7 43 1026.2!03.4 PHR1851!0732 185131!073238 18 51 31.17 !07 32 38.1 9.3 6.2 ± 0.5 39.7 –032.5!00.4 MPA1852!0033 185225!003323 18 52 25.45 !00 33 23.0 3.1 20.5 ± 0.8 9 –031.1!01.3 MPA1852!0210 185255!021057 18 52 55.87 !02 10 57.5 1.8 11.7 ± 0.6 7.5 –
031.0!02.1 MPA1855!0240 185534!024022 18 55 34.56 !02 40 22.6 4.4 8.7 ± 0.5 7.5 –035.5!00.4 PHR1857+0207 185759+020708 18 57 59.75 +02 07 08.8 4.2 100 ± 4 11 1034.1!01.6 MPA1859+0017 185925+001739 18 59 25.02 +00 17 39.0 12.4 3.7 ± 0.6 8.9 7033.7!02.0a PHR1900!0014 190003!001356 19 00 03.94 !00 13 56.4 14.7 2.5 ± 0.5 41 –034.0!02.2 MPA1901+0000 190136+000012 19 01 36.01 +00 00 12.8 1.8 2.5 ± 0.5 7 –035.6!04.2 MPA1911+0027 191125+002756 19 11 25.57 +00 27 56.1 16.0 3.4 ± 0.6 26.9 –
the radio flux is reported. The final column gives the identificationkey of a comment to some specifics of an object, usually foundin comparison with optical imagery or, if available, in comparisonwith independent observational data. Full comments are given inAppendix A.
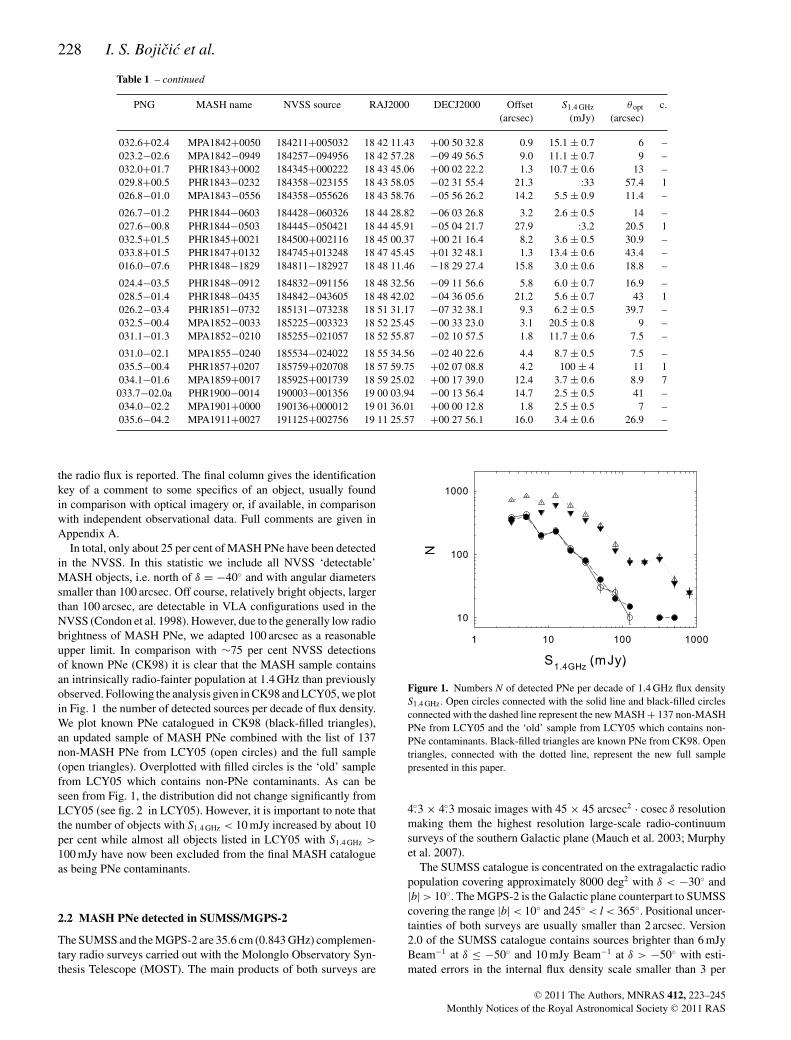
In total, only about 25 per cent of MASH PNe have been detectedin the NVSS. In this statistic we include all NVSS ‘detectable’MASH objects, i.e. north of $ = !40" and with angular diameterssmaller than 100 arcsec. Off course, relatively bright objects, largerthan 100 arcsec, are detectable in VLA configurations used in theNVSS (Condon et al. 1998). However, due to the generally low radiobrightness of MASH PNe, we adapted 100 arcsec as a reasonableupper limit. In comparison with &75 per cent NVSS detectionsof known PNe (CK98) it is clear that the MASH sample containsan intrinsically radio-fainter population at 1.4 GHz than previouslyobserved. Following the analysis given in CK98 and LCY05, we plotin Fig. 1 the number of detected sources per decade of flux density.We plot known PNe catalogued in CK98 (black-filled triangles),an updated sample of MASH PNe combined with the list of 137non-MASH PNe from LCY05 (open circles) and the full sample(open triangles). Overplotted with filled circles is the ‘old’ samplefrom LCY05 which contains non-PNe contaminants. As can beseen from Fig. 1, the distribution did not change significantly fromLCY05 (see fig. 2 in LCY05). However, it is important to note thatthe number of objects with S1.4 GHz < 10 mJy increased by about 10per cent while almost all objects listed in LCY05 with S1.4 GHz >
100 mJy have now been excluded from the final MASH catalogueas being PNe contaminants.
2.2 MASH PNe detected in SUMSS/MGPS-2
The SUMSS and the MGPS-2 are 35.6 cm (0.843 GHz) complemen-tary radio surveys carried out with the Molonglo Observatory Syn-thesis Telescope (MOST). The main products of both surveys are
Figure 1. Numbers N of detected PNe per decade of 1.4 GHz flux densityS1.4 GHz. Open circles connected with the solid line and black-filled circlesconnected with the dashed line represent the new MASH + 137 non-MASHPNe from LCY05 and the ‘old’ sample from LCY05 which contains non-PNe contaminants. Black-filled triangles are known PNe from CK98. Opentriangles, connected with the dotted line, represent the new full samplepresented in this paper.
4."3 % 4."3 mosaic images with 45 % 45 arcsec2 · cosec $ resolutionmaking them the highest resolution large-scale radio-continuumsurveys of the southern Galactic plane (Mauch et al. 2003; Murphyet al. 2007).
The SUMSS catalogue is concentrated on the extragalactic radiopopulation covering approximately 8000 deg2 with $ < !30" and|b| > 10". The MGPS-2 is the Galactic plane counterpart to SUMSScovering the range |b| < 10" and 245" < l < 365". Positional uncer-tainties of both surveys are usually smaller than 2 arcsec. Version2.0 of the SUMSS catalogue contains sources brighter than 6 mJyBeam!1 at $ ( !50" and 10 mJy Beam!1 at $ > !50" with esti-mated errors in the internal flux density scale smaller than 3 per
C$ 2011 The Authors, MNRAS 412, 223–245Monthly Notices of the Royal Astronomical Society C$ 2011 RAS
Radio-continuum detections of GPNe – I 229
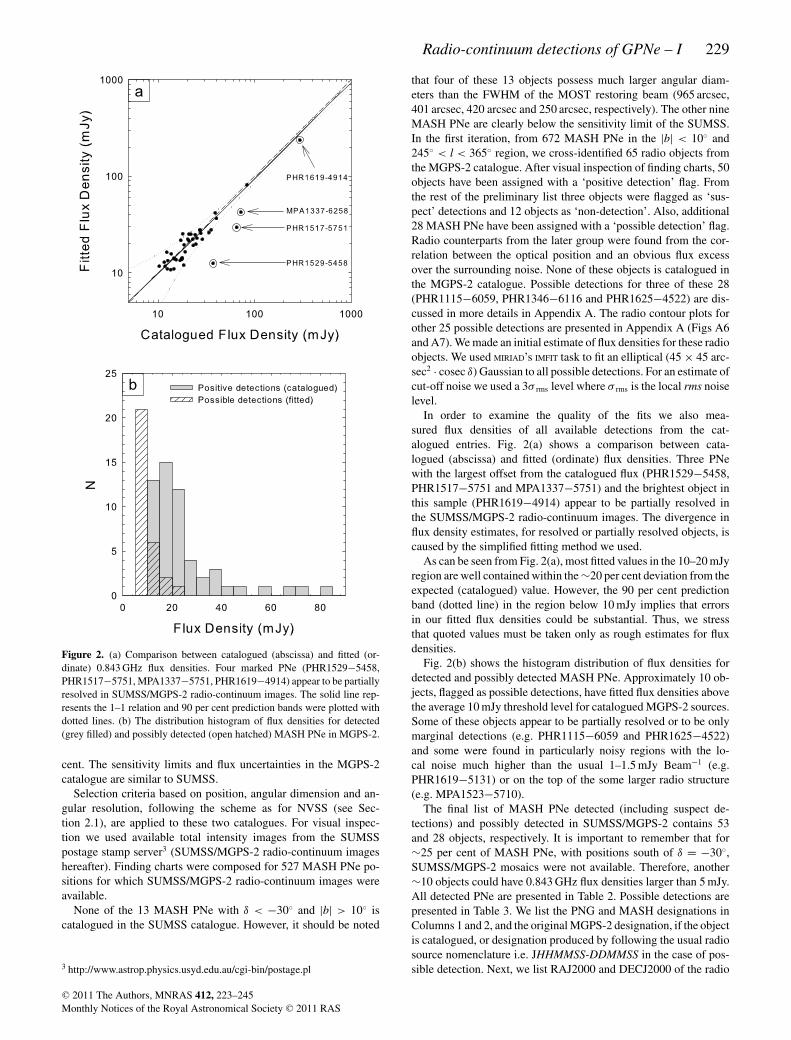
Figure 2. (a) Comparison between catalogued (abscissa) and fitted (or-dinate) 0.843 GHz flux densities. Four marked PNe (PHR1529!5458,PHR1517!5751, MPA1337!5751, PHR1619!4914) appear to be partiallyresolved in SUMSS/MGPS-2 radio-continuum images. The solid line rep-resents the 1–1 relation and 90 per cent prediction bands were plotted withdotted lines. (b) The distribution histogram of flux densities for detected(grey filled) and possibly detected (open hatched) MASH PNe in MGPS-2.
cent. The sensitivity limits and flux uncertainties in the MGPS-2catalogue are similar to SUMSS.
Selection criteria based on position, angular dimension and an-gular resolution, following the scheme as for NVSS (see Sec-tion 2.1), are applied to these two catalogues. For visual inspec-tion we used available total intensity images from the SUMSSpostage stamp server3 (SUMSS/MGPS-2 radio-continuum imageshereafter). Finding charts were composed for 527 MASH PNe po-sitions for which SUMSS/MGPS-2 radio-continuum images wereavailable.
None of the 13 MASH PNe with $ < !30" and |b| > 10" iscatalogued in the SUMSS catalogue. However, it should be noted
3 http://www.astrop.physics.usyd.edu.au/cgi-bin/postage.pl
that four of these 13 objects possess much larger angular diam-eters than the FWHM of the MOST restoring beam (965 arcsec,401 arcsec, 420 arcsec and 250 arcsec, respectively). The other nineMASH PNe are clearly below the sensitivity limit of the SUMSS.In the first iteration, from 672 MASH PNe in the |b| < 10" and245" < l < 365" region, we cross-identified 65 radio objects fromthe MGPS-2 catalogue. After visual inspection of finding charts, 50objects have been assigned with a ‘positive detection’ flag. Fromthe rest of the preliminary list three objects were flagged as ‘sus-pect’ detections and 12 objects as ‘non-detection’. Also, additional28 MASH PNe have been assigned with a ‘possible detection’ flag.Radio counterparts from the later group were found from the cor-relation between the optical position and an obvious flux excessover the surrounding noise. None of these objects is catalogued inthe MGPS-2 catalogue. Possible detections for three of these 28(PHR1115!6059, PHR1346!6116 and PHR1625!4522) are dis-cussed in more details in Appendix A. The radio contour plots forother 25 possible detections are presented in Appendix A (Figs A6and A7). We made an initial estimate of flux densities for these radioobjects. We used MIRIAD’s IMFIT task to fit an elliptical (45 % 45 arc-sec2 · cosec $) Gaussian to all possible detections. For an estimate ofcut-off noise we used a 3& rms level where & rms is the local rms noiselevel.
In order to examine the quality of the fits we also mea-sured flux densities of all available detections from the cat-alogued entries. Fig. 2(a) shows a comparison between cata-logued (abscissa) and fitted (ordinate) flux densities. Three PNewith the largest offset from the catalogued flux (PHR1529!5458,PHR1517!5751 and MPA1337!5751) and the brightest object inthis sample (PHR1619!4914) appear to be partially resolved inthe SUMSS/MGPS-2 radio-continuum images. The divergence influx density estimates, for resolved or partially resolved objects, iscaused by the simplified fitting method we used.
As can be seen from Fig. 2(a), most fitted values in the 10–20 mJyregion are well contained within the &20 per cent deviation from theexpected (catalogued) value. However, the 90 per cent predictionband (dotted line) in the region below 10 mJy implies that errorsin our fitted flux densities could be substantial. Thus, we stressthat quoted values must be taken only as rough estimates for fluxdensities.
Fig. 2(b) shows the histogram distribution of flux densities fordetected and possibly detected MASH PNe. Approximately 10 ob-jects, flagged as possible detections, have fitted flux densities abovethe average 10 mJy threshold level for catalogued MGPS-2 sources.Some of these objects appear to be partially resolved or to be onlymarginal detections (e.g. PHR1115!6059 and PHR1625!4522)and some were found in particularly noisy regions with the lo-cal noise much higher than the usual 1–1.5 mJy Beam!1 (e.g.PHR1619!5131) or on the top of the some larger radio structure(e.g. MPA1523!5710).
The final list of MASH PNe detected (including suspect de-tections) and possibly detected in SUMSS/MGPS-2 contains 53and 28 objects, respectively. It is important to remember that for&25 per cent of MASH PNe, with positions south of $ = !30",SUMSS/MGPS-2 mosaics were not available. Therefore, another&10 objects could have 0.843 GHz flux densities larger than 5 mJy.All detected PNe are presented in Table 2. Possible detections arepresented in Table 3. We list the PNG and MASH designations inColumns 1 and 2, and the original MGPS-2 designation, if the objectis catalogued, or designation produced by following the usual radiosource nomenclature i.e. JHHMMSS-DDMMSS in the case of pos-sible detection. Next, we list RAJ2000 and DECJ2000 of the radio
C$ 2011 The Authors, MNRAS 412, 223–245Monthly Notices of the Royal Astronomical Society C$ 2011 RAS
230 I. S. Bojicic et al.
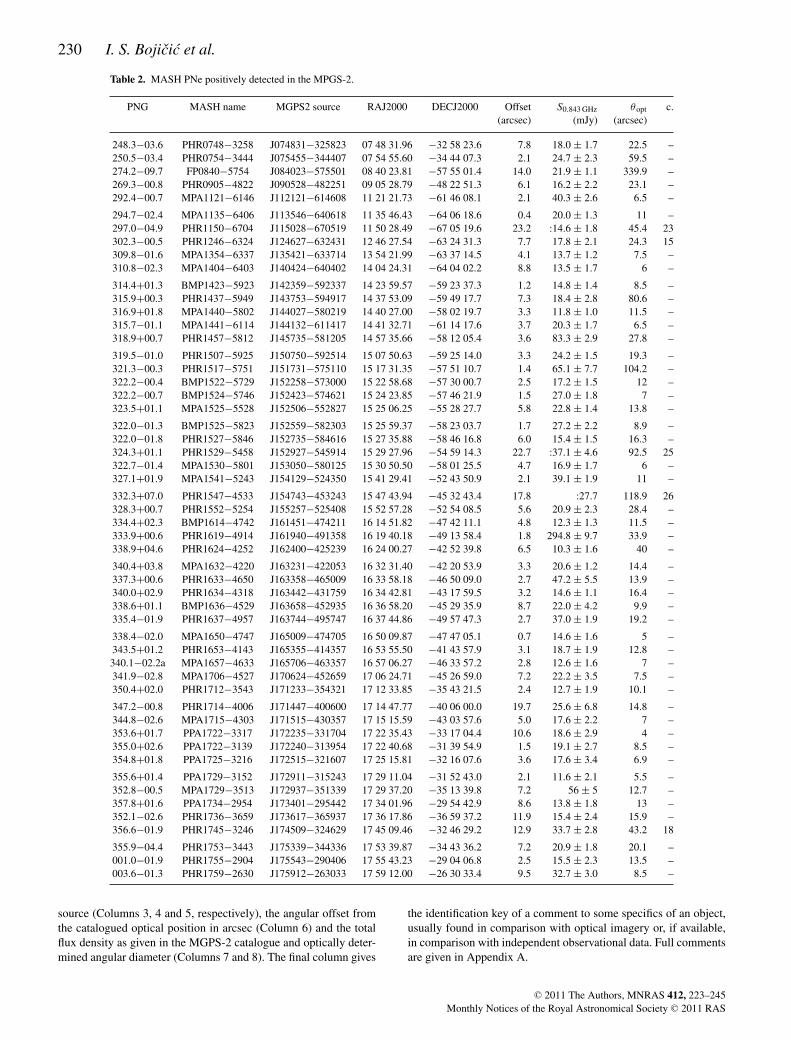
Table 2. MASH PNe positively detected in the MPGS-2.
PNG MASH name MGPS2 source RAJ2000 DECJ2000 Offset S0.843 GHz %opt c.(arcsec) (mJy) (arcsec)
248.3!03.6 PHR0748!3258 J074831!325823 07 48 31.96 !32 58 23.6 7.8 18.0 ± 1.7 22.5 –250.5!03.4 PHR0754!3444 J075455!344407 07 54 55.60 !34 44 07.3 2.1 24.7 ± 2.3 59.5 –274.2!09.7 FP0840!5754 J084023!575501 08 40 23.81 !57 55 01.4 14.0 21.9 ± 1.1 339.9 –269.3!00.8 PHR0905!4822 J090528!482251 09 05 28.79 !48 22 51.3 6.1 16.2 ± 2.2 23.1 –292.4!00.7 MPA1121!6146 J112121!614608 11 21 21.73 !61 46 08.1 2.1 40.3 ± 2.6 6.5 –
294.7!02.4 MPA1135!6406 J113546!640618 11 35 46.43 !64 06 18.6 0.4 20.0 ± 1.3 11 –297.0!04.9 PHR1150!6704 J115028!670519 11 50 28.49 !67 05 19.6 23.2 :14.6 ± 1.8 45.4 23302.3!00.5 PHR1246!6324 J124627!632431 12 46 27.54 !63 24 31.3 7.7 17.8 ± 2.1 24.3 15309.8!01.6 MPA1354!6337 J135421!633714 13 54 21.99 !63 37 14.5 4.1 13.7 ± 1.2 7.5 –310.8!02.3 MPA1404!6403 J140424!640402 14 04 24.31 !64 04 02.2 8.8 13.5 ± 1.7 6 –
314.4+01.3 BMP1423!5923 J142359!592337 14 23 59.57 !59 23 37.3 1.2 14.8 ± 1.4 8.5 –315.9+00.3 PHR1437!5949 J143753!594917 14 37 53.09 !59 49 17.7 7.3 18.4 ± 2.8 80.6 –316.9+01.8 MPA1440!5802 J144027!580219 14 40 27.00 !58 02 19.7 3.3 11.8 ± 1.0 11.5 –315.7!01.1 MPA1441!6114 J144132!611417 14 41 32.71 !61 14 17.6 3.7 20.3 ± 1.7 6.5 –318.9+00.7 PHR1457!5812 J145735!581205 14 57 35.66 !58 12 05.4 3.6 83.3 ± 2.9 27.8 –
319.5!01.0 PHR1507!5925 J150750!592514 15 07 50.63 !59 25 14.0 3.3 24.2 ± 1.5 19.3 –321.3!00.3 PHR1517!5751 J151731!575110 15 17 31.35 !57 51 10.7 1.4 65.1 ± 7.7 104.2 –322.2!00.4 BMP1522!5729 J152258!573000 15 22 58.68 !57 30 00.7 2.5 17.2 ± 1.5 12 –322.2!00.7 BMP1524!5746 J152423!574621 15 24 23.85 !57 46 21.9 1.5 27.0 ± 1.8 7 –323.5+01.1 MPA1525!5528 J152506!552827 15 25 06.25 !55 28 27.7 5.8 22.8 ± 1.4 13.8 –
322.0!01.3 BMP1525!5823 J152559!582303 15 25 59.37 !58 23 03.7 1.7 27.2 ± 2.2 8.9 –322.0!01.8 PHR1527!5846 J152735!584616 15 27 35.88 !58 46 16.8 6.0 15.4 ± 1.5 16.3 –324.3+01.1 PHR1529!5458 J152927!545914 15 29 27.96 !54 59 14.3 22.7 :37.1 ± 4.6 92.5 25322.7!01.4 MPA1530!5801 J153050!580125 15 30 50.50 !58 01 25.5 4.7 16.9 ± 1.7 6 –327.1+01.9 MPA1541!5243 J154129!524350 15 41 29.41 !52 43 50.9 2.1 39.1 ± 1.9 11 –
332.3+07.0 PHR1547!4533 J154743!453243 15 47 43.94 !45 32 43.4 17.8 :27.7 118.9 26328.3+00.7 PHR1552!5254 J155257!525408 15 52 57.28 !52 54 08.5 5.6 20.9 ± 2.3 28.4 –334.4+02.3 BMP1614!4742 J161451!474211 16 14 51.82 !47 42 11.1 4.8 12.3 ± 1.3 11.5 –333.9+00.6 PHR1619!4914 J161940!491358 16 19 40.18 !49 13 58.4 1.8 294.8 ± 9.7 33.9 –338.9+04.6 PHR1624!4252 J162400!425239 16 24 00.27 !42 52 39.8 6.5 10.3 ± 1.6 40 –
340.4+03.8 MPA1632!4220 J163231!422053 16 32 31.40 !42 20 53.9 3.3 20.6 ± 1.2 14.4 –337.3+00.6 PHR1633!4650 J163358!465009 16 33 58.18 !46 50 09.0 2.7 47.2 ± 5.5 13.9 –340.0+02.9 PHR1634!4318 J163442!431759 16 34 42.81 !43 17 59.5 3.2 14.6 ± 1.1 16.4 –338.6+01.1 BMP1636!4529 J163658!452935 16 36 58.20 !45 29 35.9 8.7 22.0 ± 4.2 9.9 –335.4!01.9 PHR1637!4957 J163744!495747 16 37 44.86 !49 57 47.3 2.7 37.0 ± 1.9 19.2 –
338.4!02.0 MPA1650!4747 J165009!474705 16 50 09.87 !47 47 05.1 0.7 14.6 ± 1.6 5 –343.5+01.2 PHR1653!4143 J165355!414357 16 53 55.50 !41 43 57.9 3.1 18.7 ± 1.9 12.8 –340.1!02.2a MPA1657!4633 J165706!463357 16 57 06.27 !46 33 57.2 2.8 12.6 ± 1.6 7 –341.9!02.8 MPA1706!4527 J170624!452659 17 06 24.71 !45 26 59.0 7.2 22.2 ± 3.5 7.5 –350.4+02.0 PHR1712!3543 J171233!354321 17 12 33.85 !35 43 21.5 2.4 12.7 ± 1.9 10.1 –
347.2!00.8 PHR1714!4006 J171447!400600 17 14 47.77 !40 06 00.0 19.7 25.6 ± 6.8 14.8 –344.8!02.6 MPA1715!4303 J171515!430357 17 15 15.59 !43 03 57.6 5.0 17.6 ± 2.2 7 –353.6+01.7 PPA1722!3317 J172235!331704 17 22 35.43 !33 17 04.4 10.6 18.6 ± 2.9 4 –355.0+02.6 PPA1722!3139 J172240!313954 17 22 40.68 !31 39 54.9 1.5 19.1 ± 2.7 8.5 –354.8+01.8 PPA1725!3216 J172515!321607 17 25 15.81 !32 16 07.6 3.6 17.6 ± 3.4 6.9 –
355.6+01.4 PPA1729!3152 J172911!315243 17 29 11.04 !31 52 43.0 2.1 11.6 ± 2.1 5.5 –352.8!00.5 MPA1729!3513 J172937!351339 17 29 37.20 !35 13 39.8 7.2 56 ± 5 12.7 –357.8+01.6 PPA1734!2954 J173401!295442 17 34 01.96 !29 54 42.9 8.6 13.8 ± 1.8 13 –352.1!02.6 PHR1736!3659 J173617!365937 17 36 17.86 !36 59 37.2 11.9 15.4 ± 2.4 15.9 –356.6!01.9 PHR1745!3246 J174509!324629 17 45 09.46 !32 46 29.2 12.9 33.7 ± 2.8 43.2 18
355.9!04.4 PHR1753!3443 J175339!344336 17 53 39.87 !34 43 36.2 7.2 20.9 ± 1.8 20.1 –001.0!01.9 PHR1755!2904 J175543!290406 17 55 43.23 !29 04 06.8 2.5 15.5 ± 2.3 13.5 –003.6!01.3 PHR1759!2630 J175912!263033 17 59 12.00 !26 30 33.4 9.5 32.7 ± 3.0 8.5 –
source (Columns 3, 4 and 5, respectively), the angular offset fromthe catalogued optical position in arcsec (Column 6) and the totalflux density as given in the MGPS-2 catalogue and optically deter-mined angular diameter (Columns 7 and 8). The final column gives
the identification key of a comment to some specifics of an object,usually found in comparison with optical imagery or, if available,in comparison with independent observational data. Full commentsare given in Appendix A.
C$ 2011 The Authors, MNRAS 412, 223–245Monthly Notices of the Royal Astronomical Society C$ 2011 RAS
Radio-continuum detections of GPNe – I 231
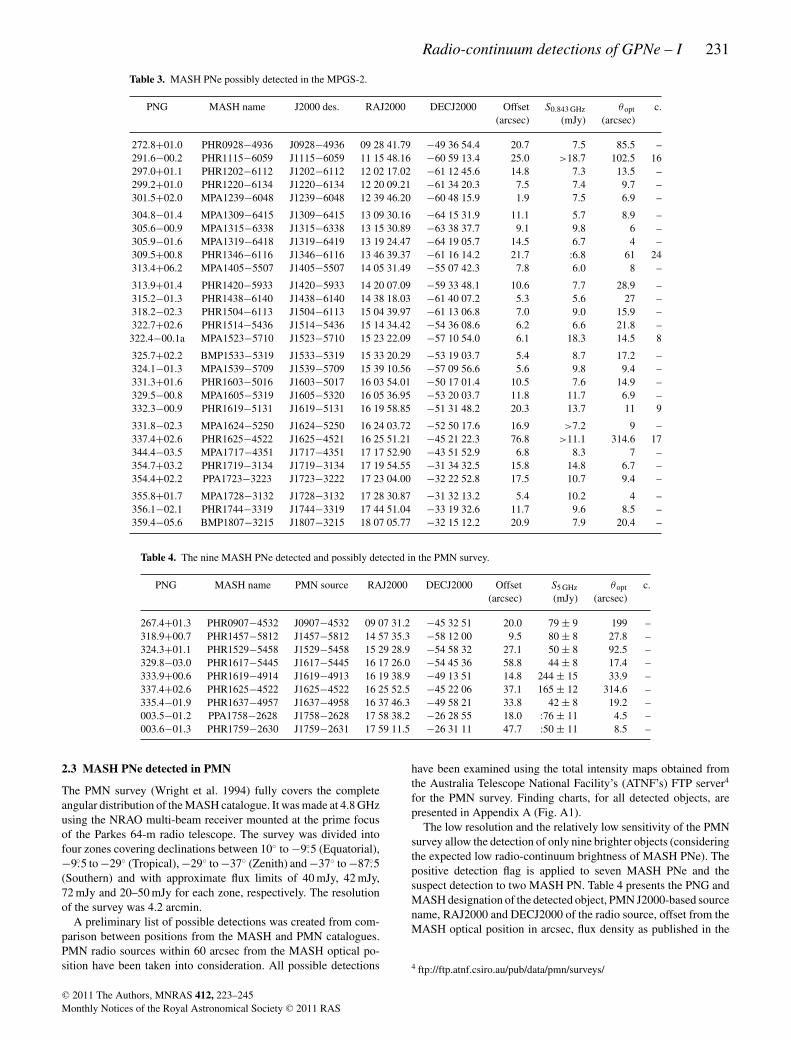
Table 3. MASH PNe possibly detected in the MPGS-2.
PNG MASH name J2000 des. RAJ2000 DECJ2000 Offset S0.843 GHz %opt c.(arcsec) (mJy) (arcsec)
272.8+01.0 PHR0928!4936 J0928!4936 09 28 41.79 !49 36 54.4 20.7 7.5 85.5 –291.6!00.2 PHR1115!6059 J1115!6059 11 15 48.16 !60 59 13.4 25.0 >18.7 102.5 16297.0+01.1 PHR1202!6112 J1202!6112 12 02 17.02 !61 12 45.6 14.8 7.3 13.5 –299.2+01.0 PHR1220!6134 J1220!6134 12 20 09.21 !61 34 20.3 7.5 7.4 9.7 –301.5+02.0 MPA1239!6048 J1239!6048 12 39 46.20 !60 48 15.9 1.9 7.5 6.9 –
304.8!01.4 MPA1309!6415 J1309!6415 13 09 30.16 !64 15 31.9 11.1 5.7 8.9 –305.6!00.9 MPA1315!6338 J1315!6338 13 15 30.89 !63 38 37.7 9.1 9.8 6 –305.9!01.6 MPA1319!6418 J1319!6419 13 19 24.47 !64 19 05.7 14.5 6.7 4 –309.5+00.8 PHR1346!6116 J1346!6116 13 46 39.37 !61 16 14.2 21.7 :6.8 61 24313.4+06.2 MPA1405!5507 J1405!5507 14 05 31.49 !55 07 42.3 7.8 6.0 8 –
313.9+01.4 PHR1420!5933 J1420!5933 14 20 07.09 !59 33 48.1 10.6 7.7 28.9 –315.2!01.3 PHR1438!6140 J1438!6140 14 38 18.03 !61 40 07.2 5.3 5.6 27 –318.2!02.3 PHR1504!6113 J1504!6113 15 04 39.97 !61 13 06.8 7.0 9.0 15.9 –322.7+02.6 PHR1514!5436 J1514!5436 15 14 34.42 !54 36 08.6 6.2 6.6 21.8 –322.4!00.1a MPA1523!5710 J1523!5710 15 23 22.09 !57 10 54.0 6.1 18.3 14.5 8
325.7+02.2 BMP1533!5319 J1533!5319 15 33 20.29 !53 19 03.7 5.4 8.7 17.2 –324.1!01.3 MPA1539!5709 J1539!5709 15 39 10.56 !57 09 56.6 5.6 9.8 9.4 –331.3+01.6 PHR1603!5016 J1603!5017 16 03 54.01 !50 17 01.4 10.5 7.6 14.9 –329.5!00.8 MPA1605!5319 J1605!5320 16 05 36.95 !53 20 03.7 11.8 11.7 6.9 –332.3!00.9 PHR1619!5131 J1619!5131 16 19 58.85 !51 31 48.2 20.3 13.7 11 9
331.8!02.3 MPA1624!5250 J1624!5250 16 24 03.72 !52 50 17.6 16.9 >7.2 9 –337.4+02.6 PHR1625!4522 J1625!4521 16 25 51.21 !45 21 22.3 76.8 >11.1 314.6 17344.4!03.5 MPA1717!4351 J1717!4351 17 17 52.90 !43 51 52.9 6.8 8.3 7 –354.7+03.2 PHR1719!3134 J1719!3134 17 19 54.55 !31 34 32.5 15.8 14.8 6.7 –354.4+02.2 PPA1723!3223 J1723!3222 17 23 04.00 !32 22 52.8 17.5 10.7 9.4 –
355.8+01.7 MPA1728!3132 J1728!3132 17 28 30.87 !31 32 13.2 5.4 10.2 4 –356.1!02.1 PHR1744!3319 J1744!3319 17 44 51.04 !33 19 32.6 11.7 9.6 8.5 –359.4!05.6 BMP1807!3215 J1807!3215 18 07 05.77 !32 15 12.2 20.9 7.9 20.4 –
Table 4. The nine MASH PNe detected and possibly detected in the PMN survey.
PNG MASH name PMN source RAJ2000 DECJ2000 Offset S5 GHz %opt c.(arcsec) (mJy) (arcsec)
267.4+01.3 PHR0907!4532 J0907!4532 09 07 31.2 !45 32 51 20.0 79 ± 9 199 –318.9+00.7 PHR1457!5812 J1457!5812 14 57 35.3 !58 12 00 9.5 80 ± 8 27.8 –324.3+01.1 PHR1529!5458 J1529!5458 15 29 28.9 !54 58 32 27.1 50 ± 8 92.5 –329.8!03.0 PHR1617!5445 J1617!5445 16 17 26.0 !54 45 36 58.8 44 ± 8 17.4 –333.9+00.6 PHR1619!4914 J1619!4913 16 19 38.9 !49 13 51 14.8 244 ± 15 33.9 –337.4+02.6 PHR1625!4522 J1625!4522 16 25 52.5 !45 22 06 37.1 165 ± 12 314.6 –335.4!01.9 PHR1637!4957 J1637!4958 16 37 46.3 !49 58 21 33.8 42 ± 8 19.2 –003.5!01.2 PPA1758!2628 J1758!2628 17 58 38.2 !26 28 55 18.0 :76 ± 11 4.5 –003.6!01.3 PHR1759!2630 J1759!2631 17 59 11.5 !26 31 11 47.7 :50 ± 11 8.5 –
2.3 MASH PNe detected in PMN
The PMN survey (Wright et al. 1994) fully covers the completeangular distribution of the MASH catalogue. It was made at 4.8 GHzusing the NRAO multi-beam receiver mounted at the prime focusof the Parkes 64-m radio telescope. The survey was divided intofour zones covering declinations between 10" to !9."5 (Equatorial),!9."5 to !29" (Tropical), !29" to !37" (Zenith) and !37" to !87."5(Southern) and with approximate flux limits of 40 mJy, 42 mJy,72 mJy and 20–50 mJy for each zone, respectively. The resolutionof the survey was 4.2 arcmin.
A preliminary list of possible detections was created from com-parison between positions from the MASH and PMN catalogues.PMN radio sources within 60 arcsec from the MASH optical po-sition have been taken into consideration. All possible detections
have been examined using the total intensity maps obtained fromthe Australia Telescope National Facility’s (ATNF’s) FTP server4
for the PMN survey. Finding charts, for all detected objects, arepresented in Appendix A (Fig. A1).
The low resolution and the relatively low sensitivity of the PMNsurvey allow the detection of only nine brighter objects (consideringthe expected low radio-continuum brightness of MASH PNe). Thepositive detection flag is applied to seven MASH PNe and thesuspect detection to two MASH PN. Table 4 presents the PNG andMASH designation of the detected object, PMN J2000-based sourcename, RAJ2000 and DECJ2000 of the radio source, offset from theMASH optical position in arcsec, flux density as published in the
4 ftp://ftp.atnf.csiro.au/pub/data/pmn/surveys/
C$ 2011 The Authors, MNRAS 412, 223–245Monthly Notices of the Royal Astronomical Society C$ 2011 RAS
232 I. S. Bojicic et al.
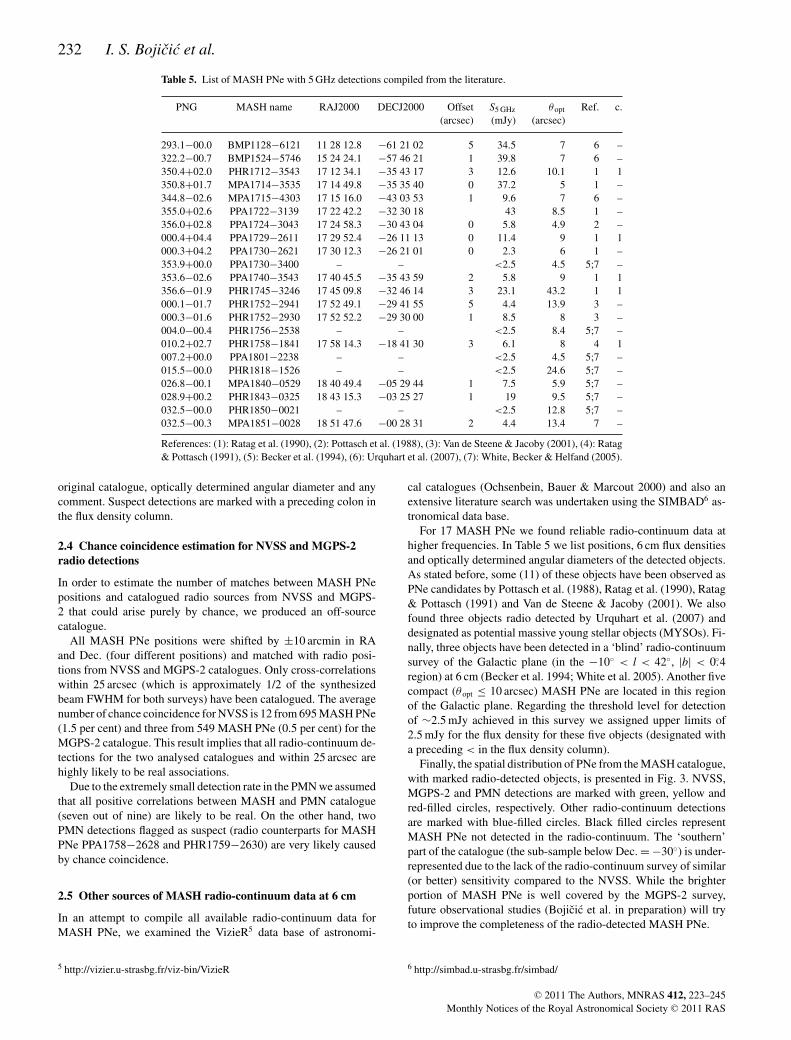
Table 5. List of MASH PNe with 5 GHz detections compiled from the literature.
PNG MASH name RAJ2000 DECJ2000 Offset S5 GHz %opt Ref. c.(arcsec) (mJy) (arcsec)
293.1!00.0 BMP1128!6121 11 28 12.8 !61 21 02 5 34.5 7 6 –322.2!00.7 BMP1524!5746 15 24 24.1 !57 46 21 1 39.8 7 6 –350.4+02.0 PHR1712!3543 17 12 34.1 !35 43 17 3 12.6 10.1 1 1350.8+01.7 MPA1714!3535 17 14 49.8 !35 35 40 0 37.2 5 1 –344.8!02.6 MPA1715!4303 17 15 16.0 !43 03 53 1 9.6 7 6 –355.0+02.6 PPA1722!3139 17 22 42.2 !32 30 18 43 8.5 1 –356.0+02.8 PPA1724!3043 17 24 58.3 !30 43 04 0 5.8 4.9 2 –000.4+04.4 PPA1729!2611 17 29 52.4 !26 11 13 0 11.4 9 1 1000.3+04.2 PPA1730!2621 17 30 12.3 !26 21 01 0 2.3 6 1 –353.9+00.0 PPA1730!3400 – – <2.5 4.5 5;7 –353.6!02.6 PPA1740!3543 17 40 45.5 !35 43 59 2 5.8 9 1 1356.6!01.9 PHR1745!3246 17 45 09.8 !32 46 14 3 23.1 43.2 1 1000.1!01.7 PHR1752!2941 17 52 49.1 !29 41 55 5 4.4 13.9 3 –000.3!01.6 PHR1752!2930 17 52 52.2 !29 30 00 1 8.5 8 3 –004.0!00.4 PHR1756!2538 – – <2.5 8.4 5;7 –010.2+02.7 PHR1758!1841 17 58 14.3 !18 41 30 3 6.1 8 4 1007.2+00.0 PPA1801!2238 – – <2.5 4.5 5;7 –015.5!00.0 PHR1818!1526 – – <2.5 24.6 5;7 –026.8!00.1 MPA1840!0529 18 40 49.4 !05 29 44 1 7.5 5.9 5;7 –028.9+00.2 PHR1843!0325 18 43 15.3 !03 25 27 1 19 9.5 5;7 –032.5!00.0 PHR1850!0021 – – <2.5 12.8 5;7 –032.5!00.3 MPA1851!0028 18 51 47.6 !00 28 31 2 4.4 13.4 7 –
References: (1): Ratag et al. (1990), (2): Pottasch et al. (1988), (3): Van de Steene & Jacoby (2001), (4): Ratag& Pottasch (1991), (5): Becker et al. (1994), (6): Urquhart et al. (2007), (7): White, Becker & Helfand (2005).
original catalogue, optically determined angular diameter and anycomment. Suspect detections are marked with a preceding colon inthe flux density column.
2.4 Chance coincidence estimation for NVSS and MGPS-2radio detections
In order to estimate the number of matches between MASH PNepositions and catalogued radio sources from NVSS and MGPS-2 that could arise purely by chance, we produced an off-sourcecatalogue.
All MASH PNe positions were shifted by ±10 arcmin in RAand Dec. (four different positions) and matched with radio posi-tions from NVSS and MGPS-2 catalogues. Only cross-correlationswithin 25 arcsec (which is approximately 1/2 of the synthesizedbeam FWHM for both surveys) have been catalogued. The averagenumber of chance coincidence for NVSS is 12 from 695 MASH PNe(1.5 per cent) and three from 549 MASH PNe (0.5 per cent) for theMGPS-2 catalogue. This result implies that all radio-continuum de-tections for the two analysed catalogues and within 25 arcsec arehighly likely to be real associations.
Due to the extremely small detection rate in the PMN we assumedthat all positive correlations between MASH and PMN catalogue(seven out of nine) are likely to be real. On the other hand, twoPMN detections flagged as suspect (radio counterparts for MASHPNe PPA1758!2628 and PHR1759!2630) are very likely causedby chance coincidence.
2.5 Other sources of MASH radio-continuum data at 6 cm
In an attempt to compile all available radio-continuum data forMASH PNe, we examined the VizieR5 data base of astronomi-
5 http://vizier.u-strasbg.fr/viz-bin/VizieR
cal catalogues (Ochsenbein, Bauer & Marcout 2000) and also anextensive literature search was undertaken using the SIMBAD6 as-tronomical data base.
For 17 MASH PNe we found reliable radio-continuum data athigher frequencies. In Table 5 we list positions, 6 cm flux densitiesand optically determined angular diameters of the detected objects.As stated before, some (11) of these objects have been observed asPNe candidates by Pottasch et al. (1988), Ratag et al. (1990), Ratag& Pottasch (1991) and Van de Steene & Jacoby (2001). We alsofound three objects radio detected by Urquhart et al. (2007) anddesignated as potential massive young stellar objects (MYSOs). Fi-nally, three objects have been detected in a ‘blind’ radio-continuumsurvey of the Galactic plane (in the !10" < l < 42", |b| < 0."4region) at 6 cm (Becker et al. 1994; White et al. 2005). Another fivecompact (% opt ( 10 arcsec) MASH PNe are located in this regionof the Galactic plane. Regarding the threshold level for detectionof &2.5 mJy achieved in this survey we assigned upper limits of2.5 mJy for the flux density for these five objects (designated witha preceding < in the flux density column).
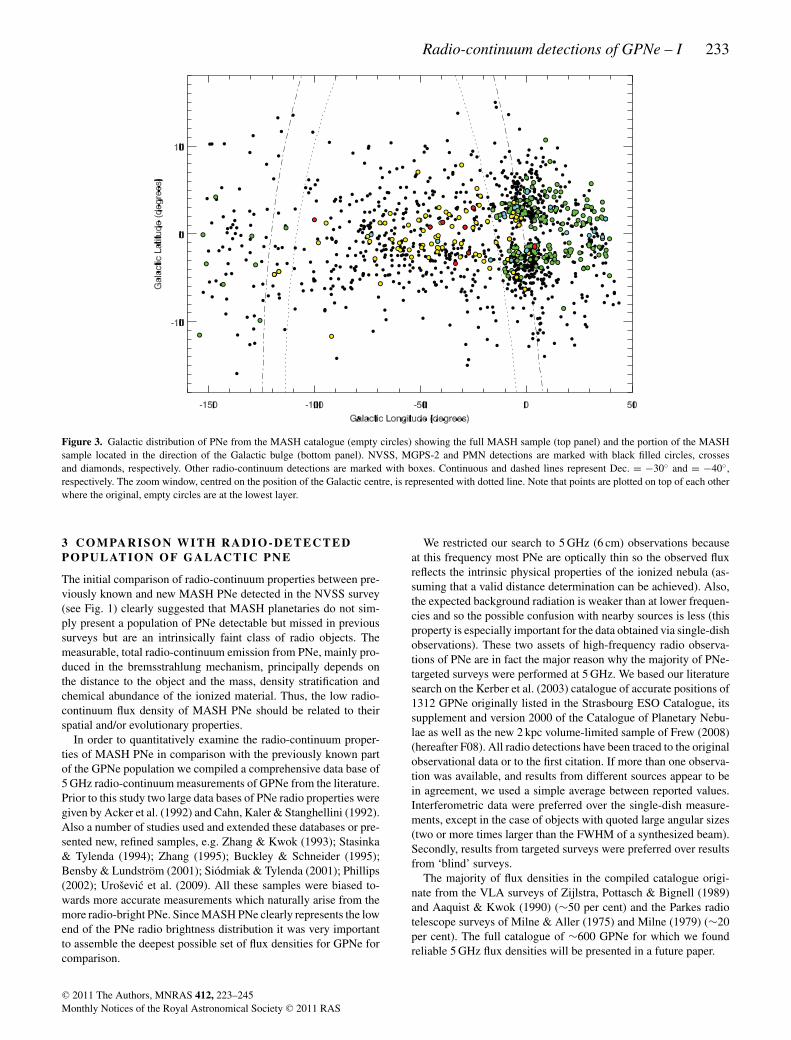
Finally, the spatial distribution of PNe from the MASH catalogue,with marked radio-detected objects, is presented in Fig. 3. NVSS,MGPS-2 and PMN detections are marked with green, yellow andred-filled circles, respectively. Other radio-continuum detectionsare marked with blue-filled circles. Black filled circles representMASH PNe not detected in the radio-continuum. The ‘southern’part of the catalogue (the sub-sample below Dec. = !30") is under-represented due to the lack of the radio-continuum survey of similar(or better) sensitivity compared to the NVSS. While the brighterportion of MASH PNe is well covered by the MGPS-2 survey,future observational studies (Bojicic et al. in preparation) will tryto improve the completeness of the radio-detected MASH PNe.
6 http://simbad.u-strasbg.fr/simbad/
C$ 2011 The Authors, MNRAS 412, 223–245Monthly Notices of the Royal Astronomical Society C$ 2011 RAS
Radio-continuum detections of GPNe – I 233
Figure 3. Galactic distribution of PNe from the MASH catalogue (empty circles) showing the full MASH sample (top panel) and the portion of the MASHsample located in the direction of the Galactic bulge (bottom panel). NVSS, MGPS-2 and PMN detections are marked with black filled circles, crossesand diamonds, respectively. Other radio-continuum detections are marked with boxes. Continuous and dashed lines represent Dec. = !30" and = !40",respectively. The zoom window, centred on the position of the Galactic centre, is represented with dotted line. Note that points are plotted on top of each otherwhere the original, empty circles are at the lowest layer.
3 C O M PA R I S O N W I T H R A D I O - D E T E C T E DPOPULATION OF GALACTIC PNE
The initial comparison of radio-continuum properties between pre-viously known and new MASH PNe detected in the NVSS survey(see Fig. 1) clearly suggested that MASH planetaries do not sim-ply present a population of PNe detectable but missed in previoussurveys but are an intrinsically faint class of radio objects. Themeasurable, total radio-continuum emission from PNe, mainly pro-duced in the bremsstrahlung mechanism, principally depends onthe distance to the object and the mass, density stratification andchemical abundance of the ionized material. Thus, the low radio-continuum flux density of MASH PNe should be related to theirspatial and/or evolutionary properties.
In order to quantitatively examine the radio-continuum proper-ties of MASH PNe in comparison with the previously known partof the GPNe population we compiled a comprehensive data base of5 GHz radio-continuum measurements of GPNe from the literature.Prior to this study two large data bases of PNe radio properties weregiven by Acker et al. (1992) and Cahn, Kaler & Stanghellini (1992).Also a number of studies used and extended these databases or pre-sented new, refined samples, e.g. Zhang & Kwok (1993); Stasinka& Tylenda (1994); Zhang (1995); Buckley & Schneider (1995);Bensby & Lundstrom (2001); Siodmiak & Tylenda (2001); Phillips(2002); Urosevic et al. (2009). All these samples were biased to-wards more accurate measurements which naturally arise from themore radio-bright PNe. Since MASH PNe clearly represents the lowend of the PNe radio brightness distribution it was very importantto assemble the deepest possible set of flux densities for GPNe forcomparison.
We restricted our search to 5 GHz (6 cm) observations becauseat this frequency most PNe are optically thin so the observed fluxreflects the intrinsic physical properties of the ionized nebula (as-suming that a valid distance determination can be achieved). Also,the expected background radiation is weaker than at lower frequen-cies and so the possible confusion with nearby sources is less (thisproperty is especially important for the data obtained via single-dishobservations). These two assets of high-frequency radio observa-tions of PNe are in fact the major reason why the majority of PNe-targeted surveys were performed at 5 GHz. We based our literaturesearch on the Kerber et al. (2003) catalogue of accurate positions of1312 GPNe originally listed in the Strasbourg ESO Catalogue, itssupplement and version 2000 of the Catalogue of Planetary Nebu-lae as well as the new 2 kpc volume-limited sample of Frew (2008)(hereafter F08). All radio detections have been traced to the originalobservational data or to the first citation. If more than one observa-tion was available, and results from different sources appear to bein agreement, we used a simple average between reported values.Interferometric data were preferred over the single-dish measure-ments, except in the case of objects with quoted large angular sizes(two or more times larger than the FWHM of a synthesized beam).Secondly, results from targeted surveys were preferred over resultsfrom ‘blind’ surveys.
The majority of flux densities in the compiled catalogue origi-nate from the VLA surveys of Zijlstra, Pottasch & Bignell (1989)and Aaquist & Kwok (1990) (&50 per cent) and the Parkes radiotelescope surveys of Milne & Aller (1975) and Milne (1979) (&20per cent). The full catalogue of &600 GPNe for which we foundreliable 5 GHz flux densities will be presented in a future paper.
C$ 2011 The Authors, MNRAS 412, 223–245Monthly Notices of the Royal Astronomical Society C$ 2011 RAS
234 I. S. Bojicic et al.
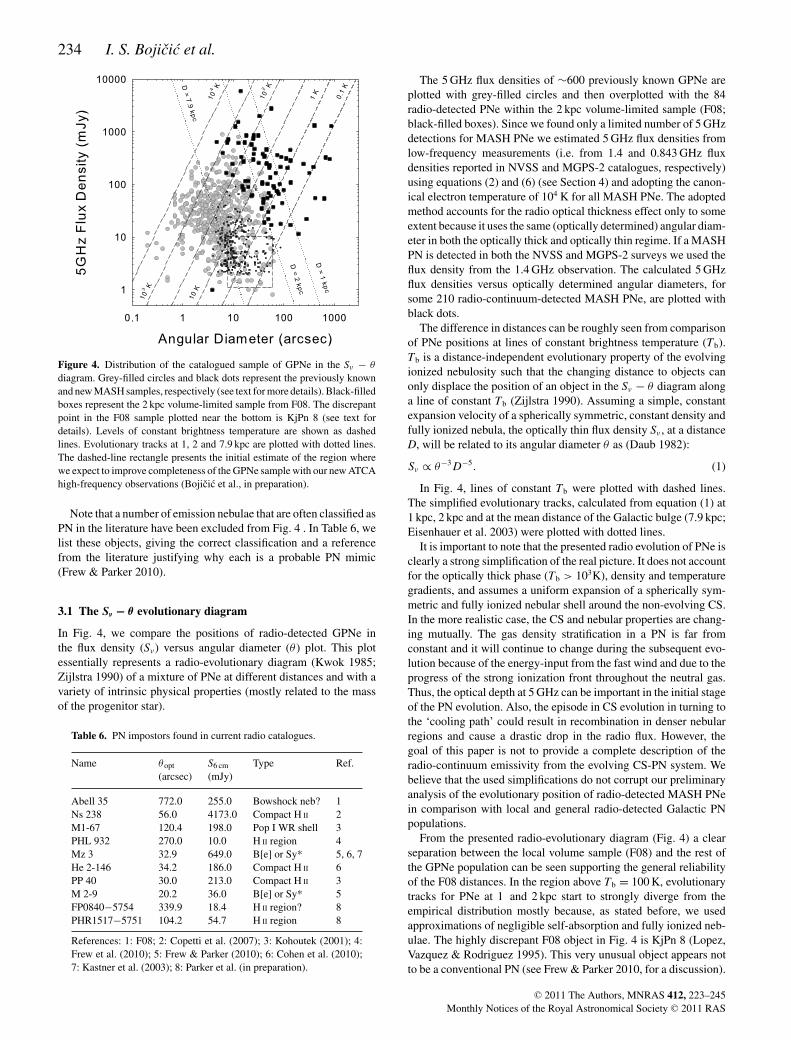
Figure 4. Distribution of the catalogued sample of GPNe in the S' ! %
diagram. Grey-filled circles and black dots represent the previously knownand new MASH samples, respectively (see text for more details). Black-filledboxes represent the 2 kpc volume-limited sample from F08. The discrepantpoint in the F08 sample plotted near the bottom is KjPn 8 (see text fordetails). Levels of constant brightness temperature are shown as dashedlines. Evolutionary tracks at 1, 2 and 7.9 kpc are plotted with dotted lines.The dashed-line rectangle presents the initial estimate of the region wherewe expect to improve completeness of the GPNe sample with our new ATCAhigh-frequency observations (Bojicic et al., in preparation).
Note that a number of emission nebulae that are often classified asPN in the literature have been excluded from Fig. 4 . In Table 6, welist these objects, giving the correct classification and a referencefrom the literature justifying why each is a probable PN mimic(Frew & Parker 2010).
3.1 The S! ! " evolutionary diagram
In Fig. 4, we compare the positions of radio-detected GPNe inthe flux density (S') versus angular diameter (% ) plot. This plotessentially represents a radio-evolutionary diagram (Kwok 1985;Zijlstra 1990) of a mixture of PNe at different distances and with avariety of intrinsic physical properties (mostly related to the massof the progenitor star).
Table 6. PN impostors found in current radio catalogues.
Name %opt S6 cm Type Ref.(arcsec) (mJy)
Abell 35 772.0 255.0 Bowshock neb? 1Ns 238 56.0 4173.0 Compact H II 2M1-67 120.4 198.0 Pop I WR shell 3PHL 932 270.0 10.0 H II region 4Mz 3 32.9 649.0 B[e] or Sy* 5, 6, 7He 2-146 34.2 186.0 Compact H II 6PP 40 30.0 213.0 Compact H II 3M 2-9 20.2 36.0 B[e] or Sy* 5FP0840!5754 339.9 18.4 H II region? 8PHR1517!5751 104.2 54.7 H II region 8
References: 1: F08; 2: Copetti et al. (2007); 3: Kohoutek (2001); 4:Frew et al. (2010); 5: Frew & Parker (2010); 6: Cohen et al. (2010);7: Kastner et al. (2003); 8: Parker et al. (in preparation).
The 5 GHz flux densities of &600 previously known GPNe areplotted with grey-filled circles and then overplotted with the 84radio-detected PNe within the 2 kpc volume-limited sample (F08;black-filled boxes). Since we found only a limited number of 5 GHzdetections for MASH PNe we estimated 5 GHz flux densities fromlow-frequency measurements (i.e. from 1.4 and 0.843 GHz fluxdensities reported in NVSS and MGPS-2 catalogues, respectively)using equations (2) and (6) (see Section 4) and adopting the canon-ical electron temperature of 104 K for all MASH PNe. The adoptedmethod accounts for the radio optical thickness effect only to someextent because it uses the same (optically determined) angular diam-eter in both the optically thick and optically thin regime. If a MASHPN is detected in both the NVSS and MGPS-2 surveys we used theflux density from the 1.4 GHz observation. The calculated 5 GHzflux densities versus optically determined angular diameters, forsome 210 radio-continuum-detected MASH PNe, are plotted withblack dots.
The difference in distances can be roughly seen from comparisonof PNe positions at lines of constant brightness temperature (Tb).Tb is a distance-independent evolutionary property of the evolvingionized nebulosity such that the changing distance to objects canonly displace the position of an object in the S' ! % diagram alonga line of constant Tb (Zijlstra 1990). Assuming a simple, constantexpansion velocity of a spherically symmetric, constant density andfully ionized nebula, the optically thin flux density S' , at a distanceD, will be related to its angular diameter % as (Daub 1982):
S' ) %!3D!5. (1)
In Fig. 4, lines of constant Tb were plotted with dashed lines.The simplified evolutionary tracks, calculated from equation (1) at1 kpc, 2 kpc and at the mean distance of the Galactic bulge (7.9 kpc;Eisenhauer et al. 2003) were plotted with dotted lines.
It is important to note that the presented radio evolution of PNe isclearly a strong simplification of the real picture. It does not accountfor the optically thick phase (Tb > 103K), density and temperaturegradients, and assumes a uniform expansion of a spherically sym-metric and fully ionized nebular shell around the non-evolving CS.In the more realistic case, the CS and nebular properties are chang-ing mutually. The gas density stratification in a PN is far fromconstant and it will continue to change during the subsequent evo-lution because of the energy-input from the fast wind and due to theprogress of the strong ionization front throughout the neutral gas.Thus, the optical depth at 5 GHz can be important in the initial stageof the PN evolution. Also, the episode in CS evolution in turning tothe ‘cooling path’ could result in recombination in denser nebularregions and cause a drastic drop in the radio flux. However, thegoal of this paper is not to provide a complete description of theradio-continuum emissivity from the evolving CS-PN system. Webelieve that the used simplifications do not corrupt our preliminaryanalysis of the evolutionary position of radio-detected MASH PNein comparison with local and general radio-detected Galactic PNpopulations.
From the presented radio-evolutionary diagram (Fig. 4) a clearseparation between the local volume sample (F08) and the rest ofthe GPNe population can be seen supporting the general reliabilityof the F08 distances. In the region above Tb = 100 K, evolutionarytracks for PNe at 1 and 2 kpc start to strongly diverge from theempirical distribution mostly because, as stated before, we usedapproximations of negligible self-absorption and fully ionized neb-ulae. The highly discrepant F08 object in Fig. 4 is KjPn 8 (Lopez,Vazquez & Rodriguez 1995). This very unusual object appears notto be a conventional PN (see Frew & Parker 2010, for a discussion).
C$ 2011 The Authors, MNRAS 412, 223–245Monthly Notices of the Royal Astronomical Society C$ 2011 RAS
Radio-continuum detections of GPNe – I 235
The compact, PN-like core (detected at 6 cm) is surrounded by avery large, shock-excited, bipolar nebula, which has an emissionmeasure too low to have been detected in extant radio surveys. Thesmall core is very underluminous at both optical and radio wave-lengths at the accepted distance of 1.6 kpc (Meaburn 1997), fallingoff the H" surface brightness–radius relation (Frew & Parker 2006,2010).
More importantly, we can also see a gradual increase in the num-ber of MASH PNe below Tb* 100 K and with no MASH objectswith brightness temperatures above that value. If MASH PNe followthe same CS mass distribution as the rest of the GPNe population,then this implies that the MASH samples do not contain (at leastnot a significant number) young PNe and that radio ‘faintness’ isstrictly correlated to evolutionary properties. However, we cannoteliminate the possibility that some of these nebulae are related tolow-mass CSs (MCS < 0.6 M#). In that case the ejected layers ofgas could already be highly dispersed at the point when the CSincreases the effective temperature enough to produce a significantnumber of photons in the Lyman continuum. The starting point inthe Tb evolution of these PNe will be way below 103–104 K asexpected for ‘normal’ PNe.
The expected excess of the number of low brightness PNe around7.9 kpc can also be seen. Obviously, the large density of MASHPNe along the 7.9 kpc evolutionary track is mostly caused by sam-pling bias. As we mentioned before the NVSS fully covers thebulge region, where the concentration of MASH PNe is the largest,while the southern sample is only covered above 10 mJy with theMGPS-2.
3.2 The radio surface brightness distribution
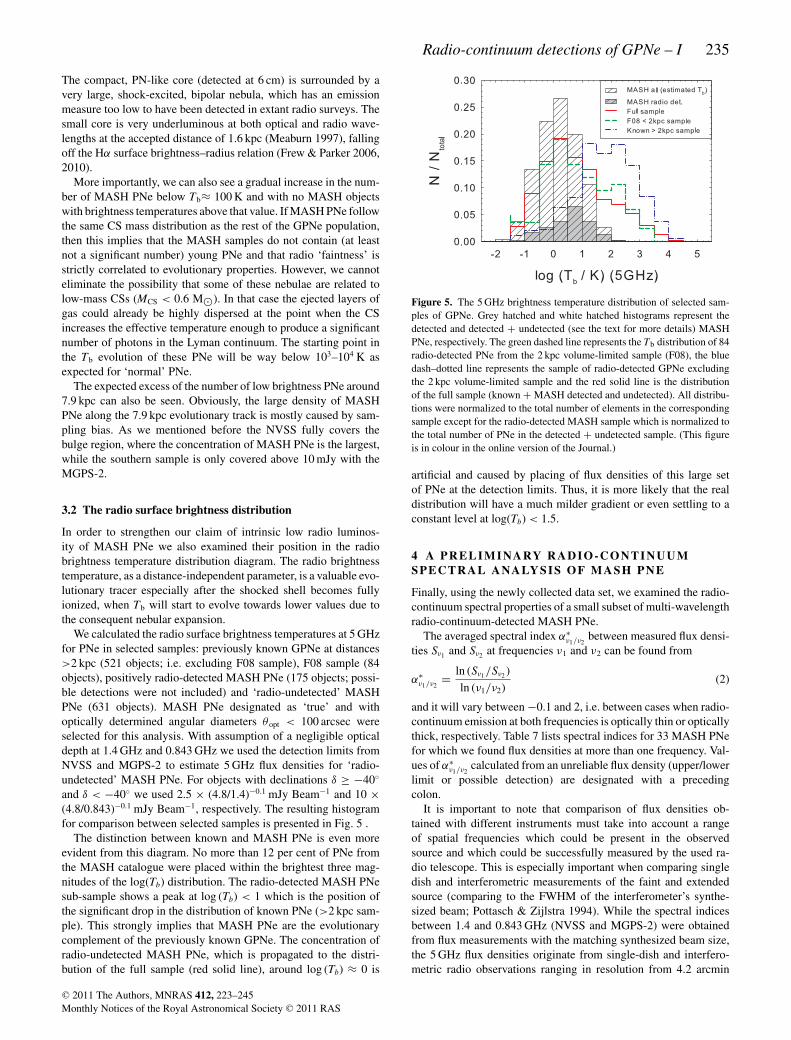
In order to strengthen our claim of intrinsic low radio luminos-ity of MASH PNe we also examined their position in the radiobrightness temperature distribution diagram. The radio brightnesstemperature, as a distance-independent parameter, is a valuable evo-lutionary tracer especially after the shocked shell becomes fullyionized, when Tb will start to evolve towards lower values due tothe consequent nebular expansion.
We calculated the radio surface brightness temperatures at 5 GHzfor PNe in selected samples: previously known GPNe at distances>2 kpc (521 objects; i.e. excluding F08 sample), F08 sample (84objects), positively radio-detected MASH PNe (175 objects; possi-ble detections were not included) and ‘radio-undetected’ MASHPNe (631 objects). MASH PNe designated as ‘true’ and withoptically determined angular diameters % opt < 100 arcsec wereselected for this analysis. With assumption of a negligible opticaldepth at 1.4 GHz and 0.843 GHz we used the detection limits fromNVSS and MGPS-2 to estimate 5 GHz flux densities for ‘radio-undetected’ MASH PNe. For objects with declinations $ ' !40"
and $ < !40" we used 2.5 % (4.8/1.4)!0.1 mJy Beam!1 and 10 %(4.8/0.843)!0.1 mJy Beam!1, respectively. The resulting histogramfor comparison between selected samples is presented in Fig. 5 .
The distinction between known and MASH PNe is even moreevident from this diagram. No more than 12 per cent of PNe fromthe MASH catalogue were placed within the brightest three mag-nitudes of the log(Tb) distribution. The radio-detected MASH PNesub-sample shows a peak at log (Tb) < 1 which is the position ofthe significant drop in the distribution of known PNe (>2 kpc sam-ple). This strongly implies that MASH PNe are the evolutionarycomplement of the previously known GPNe. The concentration ofradio-undetected MASH PNe, which is propagated to the distri-bution of the full sample (red solid line), around log (Tb) * 0 is
Figure 5. The 5 GHz brightness temperature distribution of selected sam-ples of GPNe. Grey hatched and white hatched histograms represent thedetected and detected + undetected (see the text for more details) MASHPNe, respectively. The green dashed line represents the Tb distribution of 84radio-detected PNe from the 2 kpc volume-limited sample (F08), the bluedash–dotted line represents the sample of radio-detected GPNe excludingthe 2 kpc volume-limited sample and the red solid line is the distributionof the full sample (known + MASH detected and undetected). All distribu-tions were normalized to the total number of elements in the correspondingsample except for the radio-detected MASH sample which is normalized tothe total number of PNe in the detected + undetected sample. (This figureis in colour in the online version of the Journal.)
artificial and caused by placing of flux densities of this large setof PNe at the detection limits. Thus, it is more likely that the realdistribution will have a much milder gradient or even settling to aconstant level at log(Tb) < 1.5.
4 A P R E L I M I NA RY R A D I O - C O N T I N U U MSPECTRAL ANALYSI S OF MASH PNE
Finally, using the newly collected data set, we examined the radio-continuum spectral properties of a small subset of multi-wavelengthradio-continuum-detected MASH PNe.
The averaged spectral index "+'1/'2
between measured flux densi-ties S'1 and S'2 at frequencies '1 and '2 can be found from
"+'1/'2
= ln (S'1/S'2 )ln ('1/'2)
(2)
and it will vary between !0.1 and 2, i.e. between cases when radio-continuum emission at both frequencies is optically thin or opticallythick, respectively. Table 7 lists spectral indices for 33 MASH PNefor which we found flux densities at more than one frequency. Val-ues of "+
'1/'2calculated from an unreliable flux density (upper/lower
limit or possible detection) are designated with a precedingcolon.
It is important to note that comparison of flux densities ob-tained with different instruments must take into account a rangeof spatial frequencies which could be present in the observedsource and which could be successfully measured by the used ra-dio telescope. This is especially important when comparing singledish and interferometric measurements of the faint and extendedsource (comparing to the FWHM of the interferometer’s synthe-sized beam; Pottasch & Zijlstra 1994). While the spectral indicesbetween 1.4 and 0.843 GHz (NVSS and MGPS-2) were obtainedfrom flux measurements with the matching synthesized beam size,the 5 GHz flux densities originate from single-dish and interfero-metric radio observations ranging in resolution from 4.2 arcmin
C$ 2011 The Authors, MNRAS 412, 223–245Monthly Notices of the Royal Astronomical Society C$ 2011 RAS
236 I. S. Bojicic et al.
Table 7. Spectral indices of multi-wavelength radio-continuum-detected MASH PNe. The averaged spectral index between fre-quencies '1 and '2 ("+
'1/'2) is calculated using equation (2). Values
of "+'1/'2
calculated from an unreliable flux density (upper/lowerlimit or possible detection) are designated with a preceding colon.
Name "+0.843/1.4 "+
0.843/5 "+1.4/5
PHR0748!3258 0.5 ± 0.2 – –PHR0754!3444 !0.3 ± 0.2 – –PHR1457!5812 – 0.0 ± 0.1 –BMP1524!5746 – 0.2 ± 0.1 –PHR1529!5458 – :0.2 ± 0.1 –PHR1619!4914 – !0.11 ± 0.05 –PHR1637!4957 – 0.1 ± 0.1 –PHR1712!3543 0.0 ± 0.3 0.0 ± 0.1 0.0 ± 0.1MPA1714!3535 – – 0.5 ± 0.1MPA1715!4303 – !0.3 ± 0.1 –PHR1719!3134 :!2.6 ± 0.5 – –PPA1722!3317 !0.5 ± 0.3 – –PPA1722!3139 0.6 ± 0.3 0.5 ± 0.1 0.4 ± 0.1PPA1723!3223 :!0.8 ± 0.6 – –PPA1725!3216 !1.1 ± 0.4 – –MPA1728!3132 :0.7 ± 0.6 – –PPA1729!3152 !0.7 ± 0.4 – –MPA1729!3513 0.5 ± 0.2 – –PPA1729!2611 – – 0.0 ± 0.1PPA1730!2621 – – -0.2 ± 0.4PPA1734!2954 !0.1 ± 0.3 – –PHR1736!3659 !0.1 ± 0.3 – –PPA1740!3543 – – 0.2 ± 0.2PHR1745!3246 !0.2 ± 0.2 !0.2 ± 0.1 !0.2 ± 0.1PHR1752!2941 – – 0.3 ± 0.3PHR1752!2930 – – 0.6 ± 0.1PHR1753!3443 !0.6 ± 0.2 – –PHR1755!2904 !2.3 ± 0.4 – –PHR1758!1841 – – !0.9 ± 0.2PPA1758!2628 – – 1.4 ± 0.1PHR1759!2630 0.7 ± 0.2 0.2 ± 0.1 0.0 ± 0.2
(PMN) to 2 arcsec (ATCA in the 6A configuration). Except forPHR1529!5358 (% opt = 114 arcsec), for which we already markedthe 0.843 GHz flux density as suspect, the rest of the PMN-detectedsub-sample is comparable or much smaller than the NVSS and
MGPS-2 synthesized beams. Thus, we believe that our compari-son of NVSS and MGPS-2 flux densities with those from PMNis valid. However, we stress that the accuracy of spectral indicesobtained from comparison of NVSS and MGPS-2 flux densitieswith those from interferometric observations could suffer from fil-tering out of flux from larger structures and should be taken withcaution.
Assuming that the observed radiation at '1 and '2 is comingfrom the same solid angle, the S'1/S'2 ratio can be calculated from(Siodmiak & Tylenda 2001)
S'1
S'2
=!
'1
'2
"21 ! e!('1
1 ! e!('2. (3)
The optical depth through the ionized envelope, at frequency '1,can be approximated with (Pottasch 1984)
('1 = 8.235 % 10!2
!Te
K
"!1.35!'1
GHz
"!2.1!E
cm!6 pc
", (4)
where E is the emission measure in cm!6 pc. Thus, at frequency '2,the optical depth will be
('2 = ('1 ('2/'1)!2.1. (5)
With the usual adopted approximations, it can be proved that
"+'1/'2
= 2 ! 2.1ln )
ln1 ! *)
1 ! *, (6)
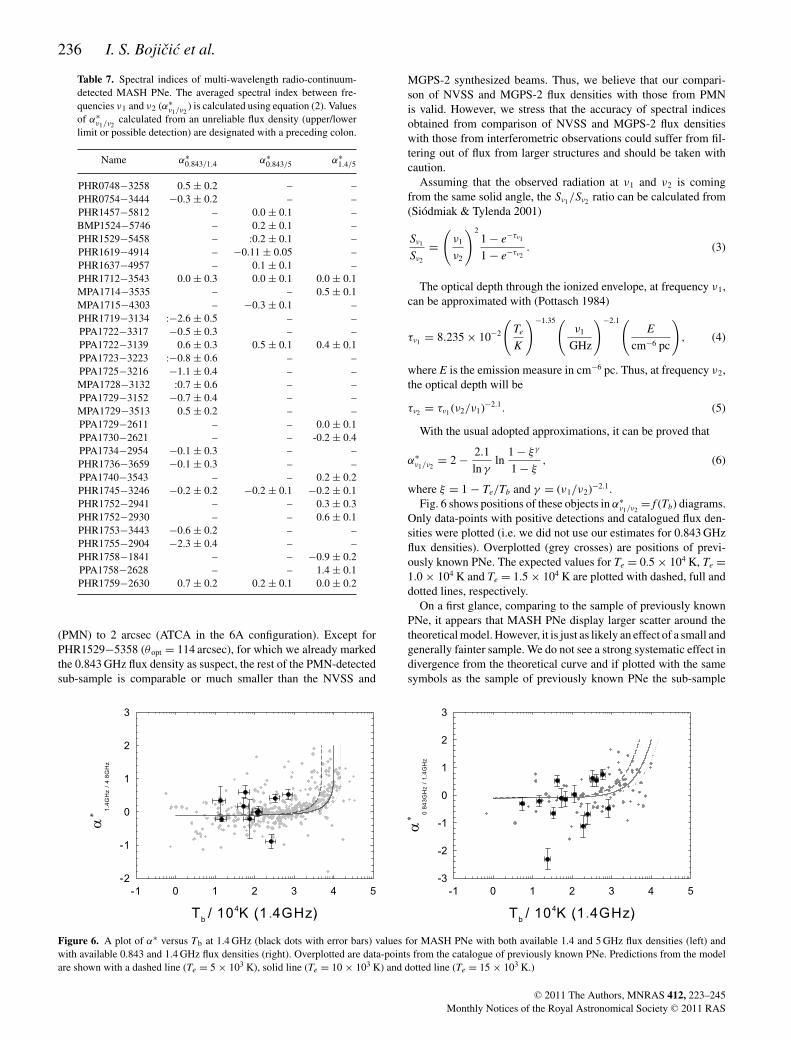
where * = 1 ! Te/Tb and ) = ('1/'2)!2.1.Fig. 6 shows positions of these objects in "+
'1/'2= f (Tb) diagrams.
Only data-points with positive detections and catalogued flux den-sities were plotted (i.e. we did not use our estimates for 0.843 GHzflux densities). Overplotted (grey crosses) are positions of previ-ously known PNe. The expected values for Te = 0.5 % 104 K, Te =1.0 % 104 K and Te = 1.5 % 104 K are plotted with dashed, full anddotted lines, respectively.
On a first glance, comparing to the sample of previously knownPNe, it appears that MASH PNe display larger scatter around thetheoretical model. However, it is just as likely an effect of a small andgenerally fainter sample. We do not see a strong systematic effect indivergence from the theoretical curve and if plotted with the samesymbols as the sample of previously known PNe the sub-sample
Figure 6. A plot of "+ versus Tb at 1.4 GHz (black dots with error bars) values for MASH PNe with both available 1.4 and 5 GHz flux densities (left) andwith available 0.843 and 1.4 GHz flux densities (right). Overplotted are data-points from the catalogue of previously known PNe. Predictions from the modelare shown with a dashed line (Te = 5 % 103 K), solid line (Te = 10 % 103 K) and dotted line (Te = 15 % 103 K.)
C$ 2011 The Authors, MNRAS 412, 223–245Monthly Notices of the Royal Astronomical Society C$ 2011 RAS
Radio-continuum detections of GPNe – I 237
of MASH PNe is practically indistinguishable. We examined sev-eral objects with apparent steep negative radio-continuum spectra,uncommon for PNe, in more detail in Appendix B.
5 SU M M A RY
In this paper, we present freshly compiled and re-examined radio-continuum data for MASH PNe. In searching for radio-detectionswe examined three large ‘blind’ radio-continuum surveys: NVSS,SUMSS/MGPS-2 and PMN. In the most sensitive survey of thesethree (NVSS with detection threshold level of about 2.5 mJy) wefound radio counterparts for 201 MASH PNe (25 per cent). Thisnumber fell significantly, to 81 positive and possible detections(10 per cent), for the southern part of the MASH catalogue coveredwith MGPS-2 (with catalogue detection threshold level of about10 mJy). The radio detection rates of MASH PNe are considerablysmaller than what we see for the previously known population (ofabout 75 and 50 per cent for NVSS and MGPS-2, respectively).
Also, as we can see from the S' ! % plot (Fig. 4) and radiobrightness temperature distribution (Fig. 5), radio-detected MASHPNe are concentrated at the faint end of the current PN radio-continuum brightness distribution and appear to be the evolutionarycomplement of the previously known GPNe. This finding posesan important question: where, in these two evolutionary diagrams,should we expect to see the rest of the MASH PNe? We believe thatour deep ATCA observations (Bojicic et al. in preparation) at leastpartially answers this question.
Finally, we examine, in some detail, radio-continuum spectralproperties of several MASH PNe with available multi-wavelengthradio data. Except for five objects from this sub-sample, for whichwe found a divergence from the expected radio-continuum spectraldistribution (a steep negative radio-continuum spectra), we did notfind any strong evidence that radio-detected MASH PNe differ inradio-continuum spectral properties from their previously known‘cousins’.
ACKNOWLEDGMENTS
We used the MIRIAD software package developed by the ATNF andthe KARMA software package developed by Richard Gooch (Gooch1996). This research has made use of the SIMBAD data baseand VizieR catalogue access tool, operated at CDS, Strasbourg,France. This research has been supported by the International Mac-quarie University Research Scholarship (iMURS) and University ofWestern Sydney research grant (project number 20721.80758). Theauthors thank the referee for helpful comments that significantlyimproved this paper.
RE FERENCES
Aaquist O. B., Kwok S., 1990, A&AS, 84, 229Acker A., Marcout J., Ochsenbein F., Stenholm B., Tylenda R., 1992,
Strasbourg-ESO Catalogue of Galactic Planetary Nebulae. EuropeanSouthern Observatory, Garching
Becker R. H., White R. L., Helfand D. J., Zoonematkermani S., 1994, ApJS,91, 347
Bensby T., Lundstrom I., 2001, A&A, 374, 599Bock D. C.-J., Large M. I., Sadler E. M., 1999, AJ, 117, 1578Boumis P., Paleologou E. V., Mavromatakis F., Papamastorakis J., 2003,
MNRAS, 339, 735Buckley D., Schneider S. E., 1995, ApJ, 446, 279Cahn J. H., Kaler J. B., Stanghellini L., 1992, A&AS, 94, 399Cappellaro E., Sabbadin F., Benetti S., Turatto M., 2001, A&A, 377, 1035
Cohen M. et al., 2007, ApJ, 669, 343Cohen M., Parker Q., Green A., Miszalski B., Frew D. J., Murphy T., 2010,
(arXiv:1012.2370)Condon J. J., Kaplan D. L., 1998, ApJS, 117, 361 (CK98)Condon J. J., Cotton W. D., Greisen E. W., Yin Q. F., Perley R. A., Taylor
G. B., Broderick J. J., 1998, AJ, 115, 1693Condon J. J., Kaplan D. L., Terzian Y., 1999, ApJS, 123, 219Copetti M. V. F., Oliveira V. A., Riffel R., Castaneda H. O., Sanmartim D.,
2007, A&A, 472, 847Daub C. T., 1982, ApJ, 260, 612Eisenhauer F., Schodel R., Genzel R., Ott T., Tecza M., Abuter R., Eckart
A., Alexander T., 2003, ApJ, 597, L121Frew D., 2008, PhD thesis, Macquarie University (F08)Frew D. J., Parker Q. A., 2006, Proc. IAU Symp. 234. Planetary Nebulae
in Our Galaxy and Beyond. Cambridge University Press, Cambridge,p. 49
Frew D. J., Parker Q. A., 2010, PASA, 27, 129Frew D. J., Madsen G. J., O’Toole S. J., Parker Q. A., 2010, PASA, 27,
203Gooch R., 1996, ASP Conf. Ser. Vol. 101 Astronomical Data Analysis
Software and Systems. Astron. Soc. Pac., San Francisco, p. 80Green A. J., Cram L. E., Large M. I., Ye T., 1999, ApJS, 122, 207Gregory P. C., Vavasour J. D., Scott W. K., Condon J. J., 1994, ApJS, 90,
173Griffith M. R., Wright A. E., Burke B. F., Ekers R. D., 1994, ApJS, 90, 179Kastner J. H., Balick B., Blackman E. G., Frank A., Soker N., Vrtılek S. D.,
Li J., 2003, ApJ, 591, L37Kerber F., Mignani R. P., Guglielmetti F., Wicenec A., 2003, A&A, 408,
1029Kohoutek L., 2001, A&A, 378, 843Kohoutek L., 2002, Astron. Nachr., 323, 57Kovacevic A., Parker Q., 2009, ASP Conf. Ser. Vol. 404. An Emission Line
Analysis of MASH Galactic PNe. Astron. Soc. Pac., San Francisco,p. 337
Kovacevic A. V., Parker Q. A., Jacoby G. H., Sharp R., Miszalski B., FrewD. J., arXiv:1012.4718
Kwok S., 1985, ApJ, 290, 568Lopez J. A., Vazquez R., Rodriguez L. F., 1995, ApJ, 455, L63Luo S. G., Condon J. J., Yin Q. F., 2005, ApJS, 159, 282 (LCY05)Mauch T., Murphy T., Buttery H. J., Curran J., Hunstead R. W., Piestrzynski
B., Robertson J. G., Sadler E. M., 2003, MNRAS, 342, 1117Meaburn J., 1997, MNRAS, 292, L11Milne D. K., 1979, A&AS, 36, 227Milne D. K., Aller L. H., 1975, A&A, 38, 183Miszalski B., Parker Q. A., Acker A., Birkby J. L., Frew D. J., Kovacevic
A., 2008a, MNRAS, 384, 525Miszalski B., Acker A., Parker Q. A., 2008b, Hydrogen-Deficient Stars,
391, 181Miszalski B., Acker A., Moffat A. F. J., Parker Q. A., Udalski A., 2009a,
A&A, 496, 813Miszalski B., Acker A., Parker Q. A., Moffat A. F. J., 2009b, A&A, 505,
249Morgan D. H., Parker Q. A., Cohen M., 2003, MNRAS, 346, 719Murphy T., Mauch T., Green A., Hunstead R. W., Piestrzynska B., Kels
A. P., Sztajer P., 2007, MNRAS, 382, 382Ochsenbein F., Bauer P., Marcout J., 2000, A&AS, 143, 23Parker Q. A. et al., 2005, MNRAS, 362, 689Parker Q. A. et al., 2006, MNRAS, 373, 79Phillips J. P., 2002, ApJS, 139, 199Pottasch S. R., 1984, Astrophys . Space Sci. Library, 107Pottasch S. R., Zijlstra A. A., 1994, A&A, 289, 261Pottasch S. R., Olling R., Bignell C., Zijlstra A. A., 1988, A&A, 205, 248Preite-Martinez A., 1988, A&AS, 76, 317Ratag M. A., Pottasch S. R., 1991, A&AS, 91, 481Ratag M. A., Pottasch S. R., Zijlstra A. A., Menzies J., 1990, A&A, 233,
181Siodmiak N., Tylenda R., 2001, A&A, 373, 1032Stasinka G., Tylenda R., 1994, A&A, 289, 225
C$ 2011 The Authors, MNRAS 412, 223–245Monthly Notices of the Royal Astronomical Society C$ 2011 RAS
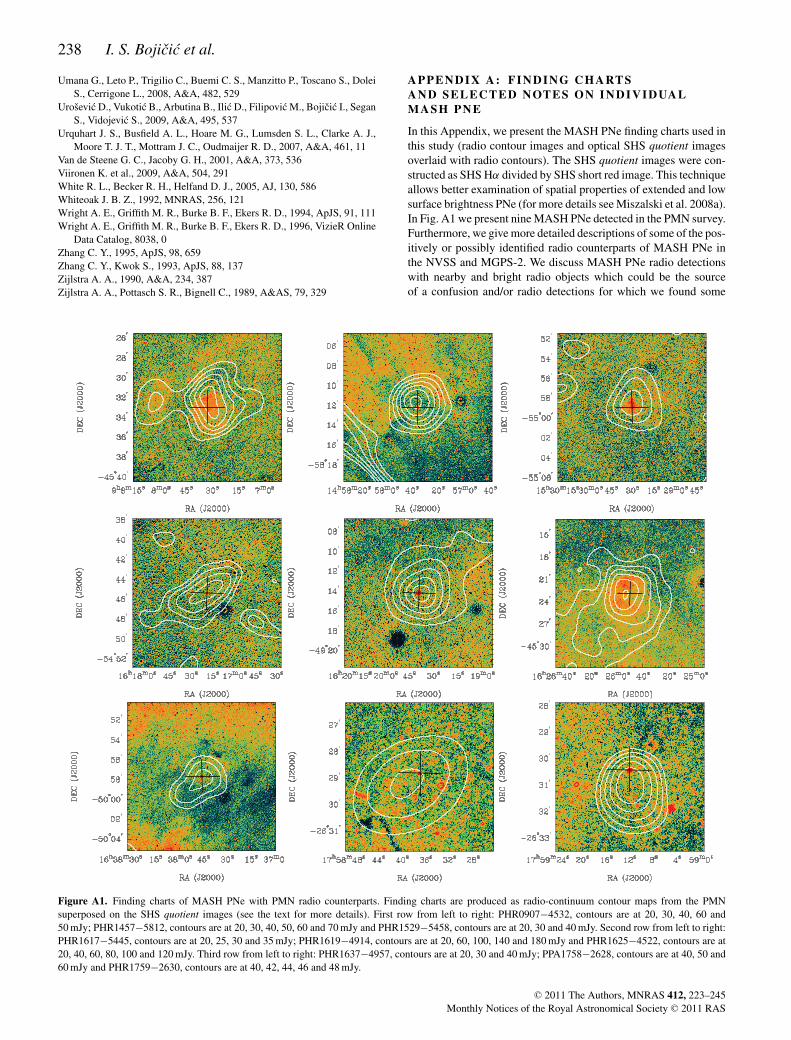
238 I. S. Bojicic et al.
Umana G., Leto P., Trigilio C., Buemi C. S., Manzitto P., Toscano S., DoleiS., Cerrigone L., 2008, A&A, 482, 529
Urosevic D., Vukotic B., Arbutina B., Ilic D., Filipovic M., Bojicic I., SeganS., Vidojevic S., 2009, A&A, 495, 537
Urquhart J. S., Busfield A. L., Hoare M. G., Lumsden S. L., Clarke A. J.,Moore T. J. T., Mottram J. C., Oudmaijer R. D., 2007, A&A, 461, 11
Van de Steene G. C., Jacoby G. H., 2001, A&A, 373, 536Viironen K. et al., 2009, A&A, 504, 291White R. L., Becker R. H., Helfand D. J., 2005, AJ, 130, 586Whiteoak J. B. Z., 1992, MNRAS, 256, 121Wright A. E., Griffith M. R., Burke B. F., Ekers R. D., 1994, ApJS, 91, 111Wright A. E., Griffith M. R., Burke B. F., Ekers R. D., 1996, VizieR Online
Data Catalog, 8038, 0Zhang C. Y., 1995, ApJS, 98, 659Zhang C. Y., Kwok S., 1993, ApJS, 88, 137Zijlstra A. A., 1990, A&A, 234, 387Zijlstra A. A., Pottasch S. R., Bignell C., 1989, A&AS, 79, 329
APPENDI X A: FI NDI NG CHARTSA N D S E L E C T E D N OT E S O N I N D I V I D UA LMASH PNE
In this Appendix, we present the MASH PNe finding charts used inthis study (radio contour images and optical SHS quotient imagesoverlaid with radio contours). The SHS quotient images were con-structed as SHS H" divided by SHS short red image. This techniqueallows better examination of spatial properties of extended and lowsurface brightness PNe (for more details see Miszalski et al. 2008a).In Fig. A1 we present nine MASH PNe detected in the PMN survey.Furthermore, we give more detailed descriptions of some of the pos-itively or possibly identified radio counterparts of MASH PNe inthe NVSS and MGPS-2. We discuss MASH PNe radio detectionswith nearby and bright radio objects which could be the sourceof a confusion and/or radio detections for which we found some
Figure A1. Finding charts of MASH PNe with PMN radio counterparts. Finding charts are produced as radio-continuum contour maps from the PMNsuperposed on the SHS quotient images (see the text for more details). First row from left to right: PHR0907!4532, contours are at 20, 30, 40, 60 and50 mJy; PHR1457!5812, contours are at 20, 30, 40, 50, 60 and 70 mJy and PHR1529!5458, contours are at 20, 30 and 40 mJy. Second row from left to right:PHR1617!5445, contours are at 20, 25, 30 and 35 mJy; PHR1619!4914, contours are at 20, 60, 100, 140 and 180 mJy and PHR1625!4522, contours are at20, 40, 60, 80, 100 and 120 mJy. Third row from left to right: PHR1637!4957, contours are at 20, 30 and 40 mJy; PPA1758!2628, contours are at 40, 50 and60 mJy and PHR1759!2630, contours are at 40, 42, 44, 46 and 48 mJy.
C$ 2011 The Authors, MNRAS 412, 223–245Monthly Notices of the Royal Astronomical Society C$ 2011 RAS
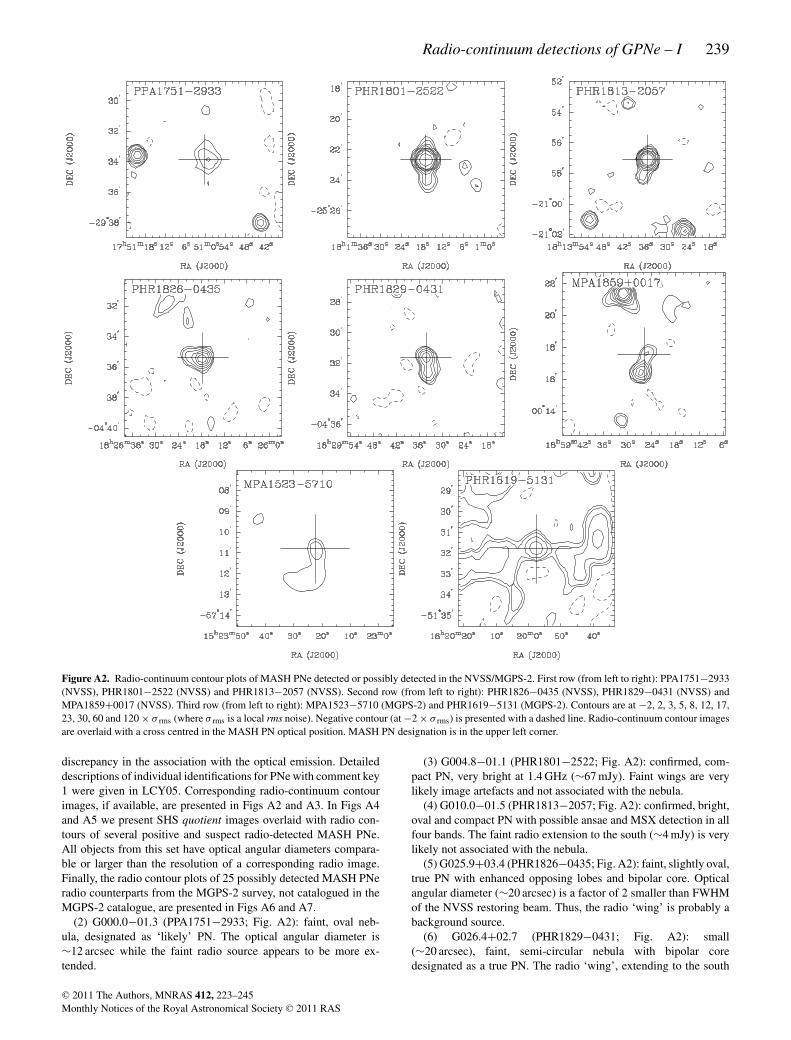
Radio-continuum detections of GPNe – I 239
Figure A2. Radio-continuum contour plots of MASH PNe detected or possibly detected in the NVSS/MGPS-2. First row (from left to right): PPA1751!2933(NVSS), PHR1801!2522 (NVSS) and PHR1813!2057 (NVSS). Second row (from left to right): PHR1826!0435 (NVSS), PHR1829!0431 (NVSS) andMPA1859+0017 (NVSS). Third row (from left to right): MPA1523!5710 (MGPS-2) and PHR1619!5131 (MGPS-2). Contours are at !2, 2, 3, 5, 8, 12, 17,23, 30, 60 and 120 % & rms (where & rms is a local rms noise). Negative contour (at !2 % & rms) is presented with a dashed line. Radio-continuum contour imagesare overlaid with a cross centred in the MASH PN optical position. MASH PN designation is in the upper left corner.
discrepancy in the association with the optical emission. Detaileddescriptions of individual identifications for PNe with comment key1 were given in LCY05. Corresponding radio-continuum contourimages, if available, are presented in Figs A2 and A3. In Figs A4and A5 we present SHS quotient images overlaid with radio con-tours of several positive and suspect radio-detected MASH PNe.All objects from this set have optical angular diameters compara-ble or larger than the resolution of a corresponding radio image.Finally, the radio contour plots of 25 possibly detected MASH PNeradio counterparts from the MGPS-2 survey, not catalogued in theMGPS-2 catalogue, are presented in Figs A6 and A7.
(2) G000.0!01.3 (PPA1751!2933; Fig. A2): faint, oval neb-ula, designated as ‘likely’ PN. The optical angular diameter is&12 arcsec while the faint radio source appears to be more ex-tended.
(3) G004.8!01.1 (PHR1801!2522; Fig. A2): confirmed, com-pact PN, very bright at 1.4 GHz (&67 mJy). Faint wings are verylikely image artefacts and not associated with the nebula.
(4) G010.0!01.5 (PHR1813!2057; Fig. A2): confirmed, bright,oval and compact PN with possible ansae and MSX detection in allfour bands. The faint radio extension to the south (&4 mJy) is verylikely not associated with the nebula.
(5) G025.9+03.4 (PHR1826!0435; Fig. A2): faint, slightly oval,true PN with enhanced opposing lobes and bipolar core. Opticalangular diameter (&20 arcsec) is a factor of 2 smaller than FWHMof the NVSS restoring beam. Thus, the radio ‘wing’ is probably abackground source.
(6) G026.4+02.7 (PHR1829!0431; Fig. A2): small(&20 arcsec), faint, semi-circular nebula with bipolar coredesignated as a true PN. The radio ‘wing’, extending to the south
C$ 2011 The Authors, MNRAS 412, 223–245Monthly Notices of the Royal Astronomical Society C$ 2011 RAS
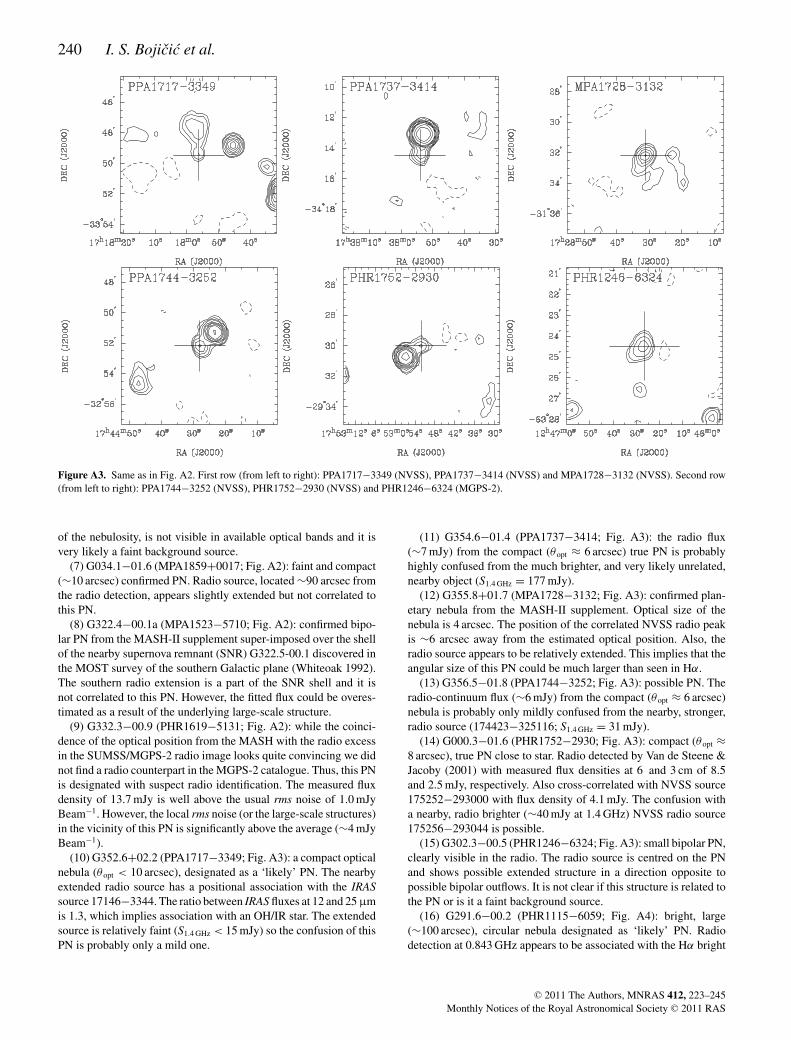
240 I. S. Bojicic et al.
Figure A3. Same as in Fig. A2. First row (from left to right): PPA1717!3349 (NVSS), PPA1737!3414 (NVSS) and MPA1728!3132 (NVSS). Second row(from left to right): PPA1744!3252 (NVSS), PHR1752!2930 (NVSS) and PHR1246!6324 (MGPS-2).
of the nebulosity, is not visible in available optical bands and it isvery likely a faint background source.
(7) G034.1!01.6 (MPA1859+0017; Fig. A2): faint and compact(&10 arcsec) confirmed PN. Radio source, located &90 arcsec fromthe radio detection, appears slightly extended but not correlated tothis PN.
(8) G322.4!00.1a (MPA1523!5710; Fig. A2): confirmed bipo-lar PN from the MASH-II supplement super-imposed over the shellof the nearby supernova remnant (SNR) G322.5-00.1 discovered inthe MOST survey of the southern Galactic plane (Whiteoak 1992).The southern radio extension is a part of the SNR shell and it isnot correlated to this PN. However, the fitted flux could be overes-timated as a result of the underlying large-scale structure.
(9) G332.3!00.9 (PHR1619!5131; Fig. A2): while the coinci-dence of the optical position from the MASH with the radio excessin the SUMSS/MGPS-2 radio image looks quite convincing we didnot find a radio counterpart in the MGPS-2 catalogue. Thus, this PNis designated with suspect radio identification. The measured fluxdensity of 13.7 mJy is well above the usual rms noise of 1.0 mJyBeam!1. However, the local rms noise (or the large-scale structures)in the vicinity of this PN is significantly above the average (&4 mJyBeam!1).
(10) G352.6+02.2 (PPA1717!3349; Fig. A3): a compact opticalnebula (% opt < 10 arcsec), designated as a ‘likely’ PN. The nearbyextended radio source has a positional association with the IRASsource 17146!3344. The ratio between IRAS fluxes at 12 and 25 µmis 1.3, which implies association with an OH/IR star. The extendedsource is relatively faint (S1.4 GHz < 15 mJy) so the confusion of thisPN is probably only a mild one.
(11) G354.6!01.4 (PPA1737!3414; Fig. A3): the radio flux(&7 mJy) from the compact (% opt * 6 arcsec) true PN is probablyhighly confused from the much brighter, and very likely unrelated,nearby object (S1.4 GHz = 177 mJy).
(12) G355.8+01.7 (MPA1728!3132; Fig. A3): confirmed plan-etary nebula from the MASH-II supplement. Optical size of thenebula is 4 arcsec. The position of the correlated NVSS radio peakis &6 arcsec away from the estimated optical position. Also, theradio source appears to be relatively extended. This implies that theangular size of this PN could be much larger than seen in H".
(13) G356.5!01.8 (PPA1744!3252; Fig. A3): possible PN. Theradio-continuum flux (&6 mJy) from the compact (% opt * 6 arcsec)nebula is probably only mildly confused from the nearby, stronger,radio source (174423!325116; S1.4 GHz = 31 mJy).
(14) G000.3!01.6 (PHR1752!2930; Fig. A3): compact (% opt *8 arcsec), true PN close to star. Radio detected by Van de Steene &Jacoby (2001) with measured flux densities at 6 and 3 cm of 8.5and 2.5 mJy, respectively. Also cross-correlated with NVSS source175252!293000 with flux density of 4.1 mJy. The confusion witha nearby, radio brighter (&40 mJy at 1.4 GHz) NVSS radio source175256!293044 is possible.
(15) G302.3!00.5 (PHR1246!6324; Fig. A3): small bipolar PN,clearly visible in the radio. The radio source is centred on the PNand shows possible extended structure in a direction opposite topossible bipolar outflows. It is not clear if this structure is related tothe PN or is it a faint background source.
(16) G291.6!00.2 (PHR1115!6059; Fig. A4): bright, large(&100 arcsec), circular nebula designated as ‘likely’ PN. Radiodetection at 0.843 GHz appears to be associated with the H" bright
C$ 2011 The Authors, MNRAS 412, 223–245Monthly Notices of the Royal Astronomical Society C$ 2011 RAS
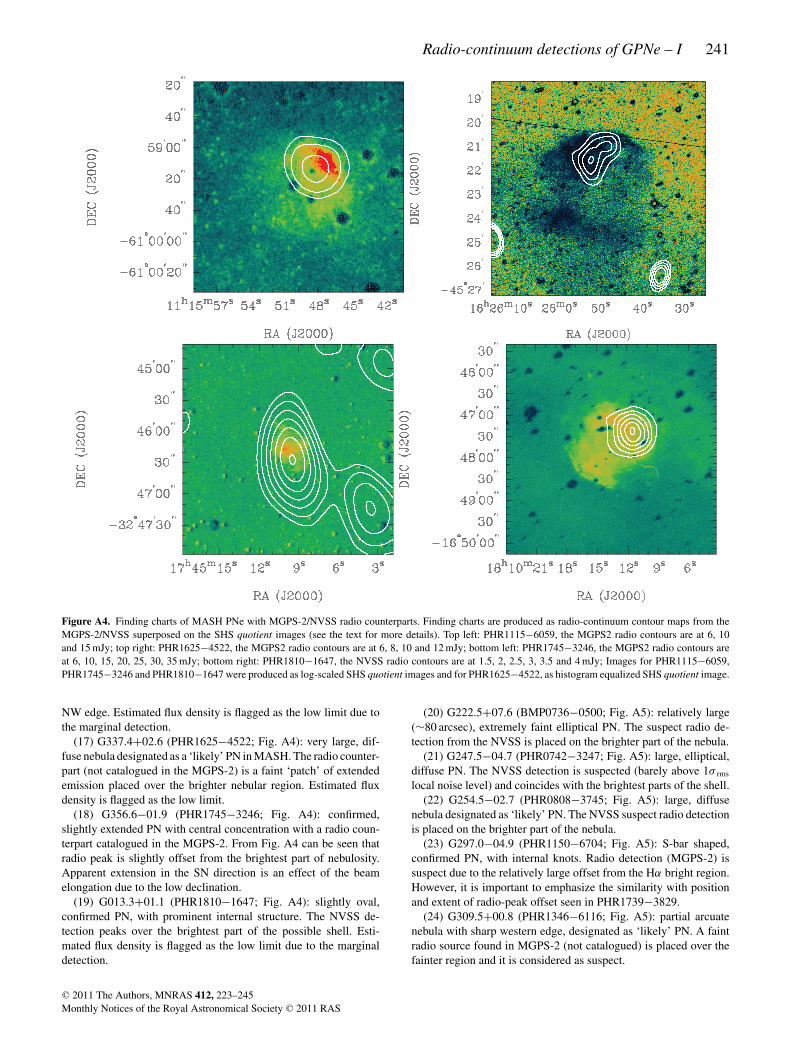
Radio-continuum detections of GPNe – I 241
Figure A4. Finding charts of MASH PNe with MGPS-2/NVSS radio counterparts. Finding charts are produced as radio-continuum contour maps from theMGPS-2/NVSS superposed on the SHS quotient images (see the text for more details). Top left: PHR1115!6059, the MGPS2 radio contours are at 6, 10and 15 mJy; top right: PHR1625!4522, the MGPS2 radio contours are at 6, 8, 10 and 12 mJy; bottom left: PHR1745!3246, the MGPS2 radio contours areat 6, 10, 15, 20, 25, 30, 35 mJy; bottom right: PHR1810!1647, the NVSS radio contours are at 1.5, 2, 2.5, 3, 3.5 and 4 mJy; Images for PHR1115!6059,PHR1745!3246 and PHR1810!1647 were produced as log-scaled SHS quotient images and for PHR1625!4522, as histogram equalized SHS quotient image.
NW edge. Estimated flux density is flagged as the low limit due tothe marginal detection.
(17) G337.4+02.6 (PHR1625!4522; Fig. A4): very large, dif-fuse nebula designated as a ‘likely’ PN in MASH. The radio counter-part (not catalogued in the MGPS-2) is a faint ‘patch’ of extendedemission placed over the brighter nebular region. Estimated fluxdensity is flagged as the low limit.
(18) G356.6!01.9 (PHR1745!3246; Fig. A4): confirmed,slightly extended PN with central concentration with a radio coun-terpart catalogued in the MGPS-2. From Fig. A4 can be seen thatradio peak is slightly offset from the brightest part of nebulosity.Apparent extension in the SN direction is an effect of the beamelongation due to the low declination.
(19) G013.3+01.1 (PHR1810!1647; Fig. A4): slightly oval,confirmed PN, with prominent internal structure. The NVSS de-tection peaks over the brightest part of the possible shell. Esti-mated flux density is flagged as the low limit due to the marginaldetection.
(20) G222.5+07.6 (BMP0736!0500; Fig. A5): relatively large(&80 arcsec), extremely faint elliptical PN. The suspect radio de-tection from the NVSS is placed on the brighter part of the nebula.
(21) G247.5!04.7 (PHR0742!3247; Fig. A5): large, elliptical,diffuse PN. The NVSS detection is suspected (barely above 1& rms
local noise level) and coincides with the brightest parts of the shell.(22) G254.5!02.7 (PHR0808!3745; Fig. A5): large, diffuse
nebula designated as ‘likely’ PN. The NVSS suspect radio detectionis placed on the brighter part of the nebula.
(23) G297.0!04.9 (PHR1150!6704; Fig. A5): S-bar shaped,confirmed PN, with internal knots. Radio detection (MGPS-2) issuspect due to the relatively large offset from the H" bright region.However, it is important to emphasize the similarity with positionand extent of radio-peak offset seen in PHR1739!3829.
(24) G309.5+00.8 (PHR1346!6116; Fig. A5): partial arcuatenebula with sharp western edge, designated as ‘likely’ PN. A faintradio source found in MGPS-2 (not catalogued) is placed over thefainter region and it is considered as suspect.
C$ 2011 The Authors, MNRAS 412, 223–245Monthly Notices of the Royal Astronomical Society C$ 2011 RAS
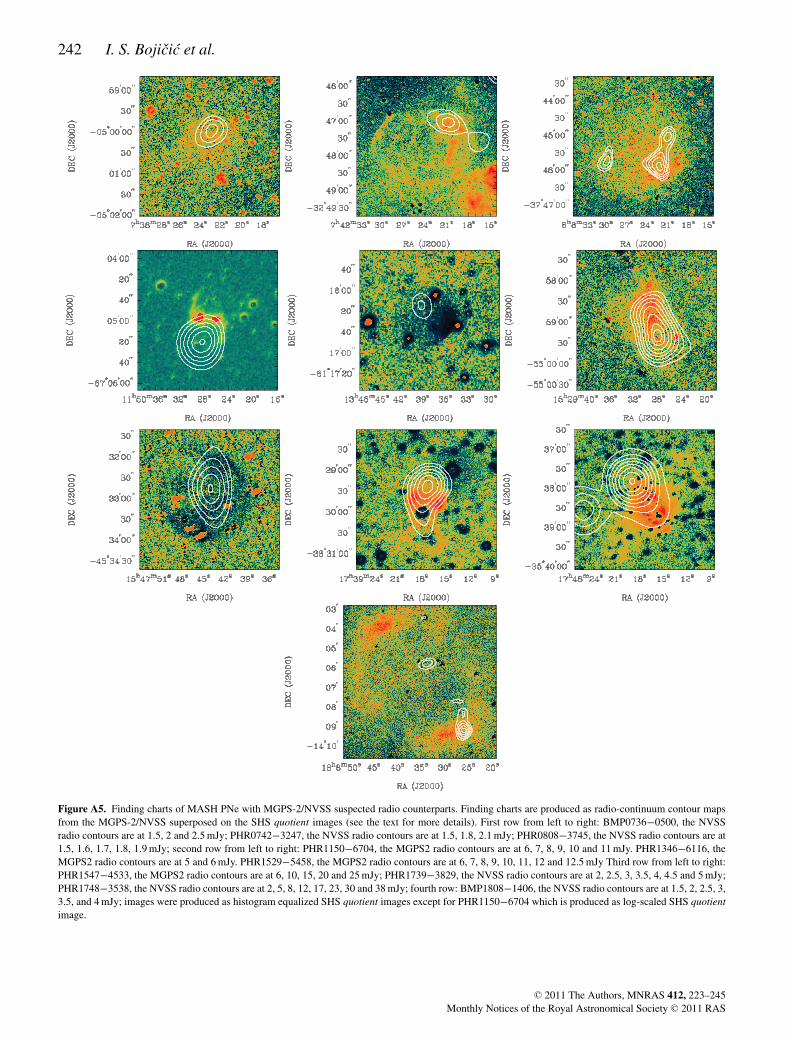
242 I. S. Bojicic et al.
Figure A5. Finding charts of MASH PNe with MGPS-2/NVSS suspected radio counterparts. Finding charts are produced as radio-continuum contour mapsfrom the MGPS-2/NVSS superposed on the SHS quotient images (see the text for more details). First row from left to right: BMP0736!0500, the NVSSradio contours are at 1.5, 2 and 2.5 mJy; PHR0742!3247, the NVSS radio contours are at 1.5, 1.8, 2.1 mJy; PHR0808!3745, the NVSS radio contours are at1.5, 1.6, 1.7, 1.8, 1.9 mJy; second row from left to right: PHR1150!6704, the MGPS2 radio contours are at 6, 7, 8, 9, 10 and 11 mJy. PHR1346!6116, theMGPS2 radio contours are at 5 and 6 mJy. PHR1529!5458, the MGPS2 radio contours are at 6, 7, 8, 9, 10, 11, 12 and 12.5 mJy Third row from left to right:PHR1547!4533, the MGPS2 radio contours are at 6, 10, 15, 20 and 25 mJy; PHR1739!3829, the NVSS radio contours are at 2, 2.5, 3, 3.5, 4, 4.5 and 5 mJy;PHR1748!3538, the NVSS radio contours are at 2, 5, 8, 12, 17, 23, 30 and 38 mJy; fourth row: BMP1808!1406, the NVSS radio contours are at 1.5, 2, 2.5, 3,3.5, and 4 mJy; images were produced as histogram equalized SHS quotient images except for PHR1150!6704 which is produced as log-scaled SHS quotientimage.
C$ 2011 The Authors, MNRAS 412, 223–245Monthly Notices of the Royal Astronomical Society C$ 2011 RAS
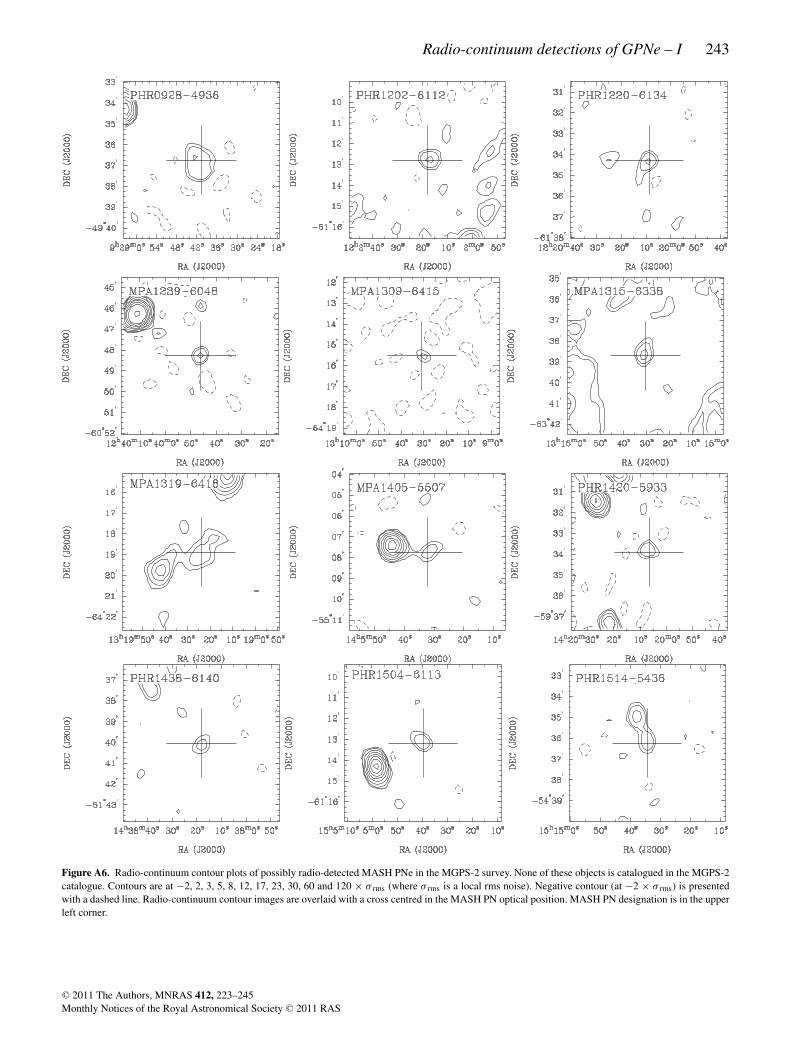
Radio-continuum detections of GPNe – I 243
Figure A6. Radio-continuum contour plots of possibly radio-detected MASH PNe in the MGPS-2 survey. None of these objects is catalogued in the MGPS-2catalogue. Contours are at !2, 2, 3, 5, 8, 12, 17, 23, 30, 60 and 120 % & rms (where & rms is a local rms noise). Negative contour (at !2 % & rms) is presentedwith a dashed line. Radio-continuum contour images are overlaid with a cross centred in the MASH PN optical position. MASH PN designation is in the upperleft corner.
C$ 2011 The Authors, MNRAS 412, 223–245Monthly Notices of the Royal Astronomical Society C$ 2011 RAS
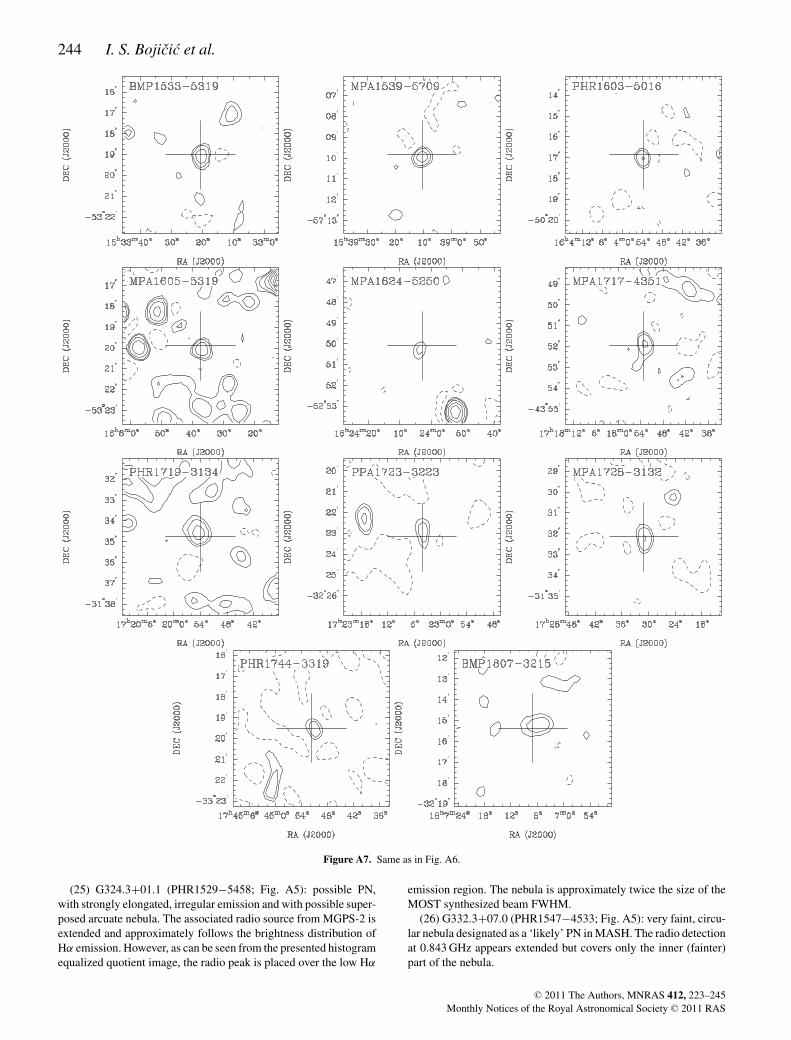
244 I. S. Bojicic et al.
Figure A7. Same as in Fig. A6.
(25) G324.3+01.1 (PHR1529!5458; Fig. A5): possible PN,with strongly elongated, irregular emission and with possible super-posed arcuate nebula. The associated radio source from MGPS-2 isextended and approximately follows the brightness distribution ofH" emission. However, as can be seen from the presented histogramequalized quotient image, the radio peak is placed over the low H"
emission region. The nebula is approximately twice the size of theMOST synthesized beam FWHM.
(26) G332.3+07.0 (PHR1547!4533; Fig. A5): very faint, circu-lar nebula designated as a ‘likely’ PN in MASH. The radio detectionat 0.843 GHz appears extended but covers only the inner (fainter)part of the nebula.
C$ 2011 The Authors, MNRAS 412, 223–245Monthly Notices of the Royal Astronomical Society C$ 2011 RAS
Radio-continuum detections of GPNe – I 245
(27) G351.1!03.9 (PHR1739!3829; Fig. A5): bright, bipolar,confirmed PN. As in the case of PHR1748!3538, the radio emissionat 1.4 GHz appears to be generally correlated with the H" but witha radio peak &20 arcsec from the brightest parts of the nebula. Incontrast to of the PHR1748!3538, the radio ‘wings’ are, in thiscase, in the direction of possible bipolar outflows. It is flagged as asuspect radio detection.
(28) G354.5!03.9 (PHR1748!3538; Fig. A5): oval ring PNwith faint outer extensions, designated as a true PN with opticaldimensions 56 % 39 arcsec. As stated in LCY05, the bright radiopeak is about 60 arcsec away from the optical centroid. A brightoffset radio source is catalogued in NVSS as a possible complexobject 174818!35375 with a flux density estimate of S1.4 GHz =44.4 ± 1.8 mJy. The flux density of the nebula itself is estimated tobe S1.4 GHz = 3.2 ± 0.6 mJy. Fig. A5 (left-hand panel in the bottomrow) shows the histogram equalized quotient image overlaid withcontours from the 1.4 GHz NVSS image. A bright, ring-like struc-ture is visible, with possible bipolar outflows. While the radio emis-sion is extended in the direction of the bright region of nebulosity,the radio peak does not appear to be correlated with H" emission.We also found a nearby bright radio source in cross-correlation withthe MGPS-2 catalogue. It peaks at a similar position to the NVSSbright source with a flux density at 0.843 GHz of 70.8 ± 2.6 mJy.The spectral index (" * !0.8) of this object clearly points outto the non-thermal origin. Thus, we can definitely conclude non-association with the PN. Unfortunately, the mosaic containing thisregion (J1742M36) was not available, and we have not been ableto examine if similar extended emission, seen at 1.4 GHz, exists at0.843 GHz. A faint radio source, to the left of the nebulosity, alsodoes not appear to be associated with this PN.
(29) G015.5+02.8 (BMP1808!1406; Fig. A5): very large(&470 arcsec), confirmed elliptical PN with enhanced opposingedges. The detection of the NVSS source placed over the brightSW H" emission region is flagged as a suspect and, regarding verylow surface brightness of this PN, it is very likely that it is due tochance coincidence.
APPENDIX B: MASH PNE WITH STEEPN E G AT I V E R A D I O SP E C T R A
Several, apparently ‘true’ MASH PNe show a steep negative radio-continuum spectra. The negative spectral index implies non-thermalor strongly variable radio-continuum emission, both uncommon forPNe. We examined this set of objects in more detail.
PPA1722!3317 (PNG353.6+01.7; "+0.843/1.4 = !0.5 ± 0.3) is a
compact (4 arcsec) true PN. It is detected in NVSS with flux densityS1.4 GHz = 14.6 ± 0.7 mJy, and it has a catalogued counterpart inMGPS-2 with a flux density S0.843 GHz = 18.6 ± 2.9 mJy (F0.843 GHz =17.9 ± 2.7 mJy Beam!1). The peak position of the NVSS source iswithin 1 arcsec from its optical counterpart. However, the MGPS-2detection appears to be offset with distance from the optical centroidby more than 10 arcsec. The radio object has a high brightnesstemperature of more than 103 K at frequencies below 1 GHz. Thus,if this object is a true PN, as seems likely, then, according to itshigh brightness temperature, it is very likely a young and compactnebula. Thus, we would expect to see a rapid rise in flux densitiestowards higher frequencies. In order to resolve this discrepancy thisobject is scheduled to be observed at 3 and 6 cm (Bojicic et al. inpreparation).
PPA1725!3216 (PNG354.8+01.8; "+0.843/1.4 = !1.1 ± 0.4) is a
confirmed, compact (% opt * 8 % 6 arcsec) PN with strong emissionlines. Radio-continuum detections at 1.4 GHz (S1.4 GHz = 10.0 ±0.6 mJy) and 0.843 GHz (S0.843 GHz = 17.6 ± 3.4 mJy) are wellaligned with the optical position with small angular offsets of &2.5and &3.5 arcsec. The steep negative radio spectra point to non-thermal emission as the main emission mechanism at cm wave-lengths. Additional observations are needed to resolve the true na-ture of this object.
PPA1729!3152 (PNG355.6+01.4; "+0.843/1.4 = !0.7 ± 0.4) is
a compact (6 % 5 arcsec), probable very low excitation (VLE) PNwith very strong lines in the red including [Ar III]. This object is des-ignated only as ‘likely’ PN. The radio counterpart seen at 1.4 GHz(S1.4 GHz = 8.2 ± 0.6 mJy) and at 0.843 GHz (S0.843 GHz = 11.6 ±2.1 mJy and peak flux F0.843 GHz = 11.2 ± 2.1 mJy Beam!1) is within3 arcsec radius from the optical centroid. The MGPS-2 detection isclose to the catalogue detection threshold and, additionally, the ob-ject appears to be placed in a noisy region. In order to resolve thetrue nature of the radio-continuum emission mechanism from thisobject additional observations are needed.
PHR1753!3443 (PNG355.9!04.4; "+0.843/1.4 = !0.6 ± 0.2) is a
confirmed, bipolar PN with newly identified WR spectral featuresfrom the CS (DePew et al., in preparation) and an angular sizeof 27 % 15 arcsec. The found flux densities are S1.4 GHz = 15.0 ±0.7 mJy and S0.843 GHz = 20.9 ± 1.8 mJy. Both NVSS and MPGS-2peak positions are slightly offset from the optical centroid (&6 and&7 arcsec, respectively) but still well within the visible nebulosity.Even though a possibility of chance coincidence detection exists it isvery likely that the radio-continuum detections are genuine. A smalloffset indicates the possibility that the detected radio-continuumemission is coming from a region much smaller than the visiblenebular extent.
PHR1755!2904 (PNG001.0!01.9; "+0.843/1.4 = !2.3 ± 0.4) is
a compact, bright, slightly oval true PN with faint outer halo andangular diameter of 14.5 % 12.5 arcsec. It is detected in NVSSwith measured flux density S1.4 GHz = 4.8 ± 0.6 mJy and it has acatalogued counterpart in MGPS-2 with a flux density S0.843 GHz =15.5 ± 2.3 mJy. Radio peak offsets, for both radio-continuum de-tections, are smaller than 3 arcsec. Unfortunately, the SUMSS/MGPS-2 mosaic cut-out is not available from the postage stampserver so we could not examine the possibility of some confusingsource at 0.843 GHz. In order to resolve this discrepancy this objectwas observed at 3 and 6 cm (Bojicic et al. in preparation).
PHR1758!1841 (PNG010.2+02.7; "+1.4/5 = !0.9 ± 0.2) is a
spectroscopically confirmed, compact, circular PN with angular di-ameter of 8 arcsec. The NVSS detection, with flux density S1.4 GHz =18.3 ± 0.7 mJy, and detection at 5 GHz, with flux density S5 GHz =6.1 ± 1.5 mJy (Ratag & Pottasch 1991) are placed over the cen-tral part of this nebula with offsets between the radio peak andoptical centroid of 1 and 3 s of arc, respectively. The WSRT obser-vation (5 GHz) was performed with the synthesized beam FWHMof about 3–6 arcsec in " and 15–35 arcsec in $ (Ratag & Pottasch1991). Thus, due to the small angular diameter of this PN, we be-lieve that the large negative spectral index cannot be accounted tothe missing flux problem. In order to resolve the true nature of thisobject additional observations are needed.
This paper has been typeset from a TEX/LATEX file prepared by the author.
C$ 2011 The Authors, MNRAS 412, 223–245Monthly Notices of the Royal Astronomical Society C$ 2011 RAS
Related Documents