Radiation in the Natural World W. Udo Schröder, 2010 ANSEL Expt 1: Gamma Spectroscopy 1 ANSEL EXPERIMENT 1 PHOTON SPECTROSCOPY

Radiation in the Natural World W. Udo Schröder, 2010 ANSEL Expt 1: Gamma Spectroscopy 1.
Dec 14, 2015
Welcome message from author
This document is posted to help you gain knowledge. Please leave a comment to let me know what you think about it! Share it to your friends and learn new things together.
Transcript

Radiation in the Natural World
W. Udo Schröder, 2010
AN
SEL
Exp
t 1
: G
am
ma S
pect
rosc
op
y 1
ANSEL EXPERIMENT 1
PHOTON SPECTROSCOPY

Scope of ANSEL Experiment 1
• Ubiquitous presence of radiation on Earth, e.g., g-ray photons
• Concepts of absorption coefficient and cross section
• Introduction to g-interactions with matterPhoto electric effectCompton scatteringPair production
• Operational principles of inorganic scintillation detectors
• Examples of energy spectra with NaI(Tl) detectors• Experimental setup with a 3”x3” NaI(Tl) detector• Lab measurements in Expt. 1
W. Udo Schröder, 2010
AN
SEL
Exp
t 1
: G
am
ma S
pect
rosc
op
y 2

AN
SEL
Exp
t 1
: G
am
ma S
pect
rosc
op
y
W. Udo Schröder, 2010
3

W. U
do S
chrö
der,
20
10
ANSEL Expt 1: Gamma Spectroscopy
4
Probability and Cross Section
Absorption upon intersection of nuclear cross section area s
j beam current density (#part.time x area)A area illuminated by beamL= 6.022 1023/mol Loschmidt# NT # target nuclei in beamMT target molar weightrT target densityx target thickness[s]=1barn = 10-24cm2
Target
x
Beam
0N j A
Transmitted
0xN N e
absorption
TT
P
per nucl
#nuclei
in eus
A
beam
LA x
M
x
Mass absorption coefficient m
0 0 1 xabsN N N N e
00abs
T
T
T
NN N x
A
L Ax
j current density j
M
N
Thin target approximation
abs
nucl
NN j
elementary absorption cross
section per nucleus
Beam area A
Nucleus area s
Differential Cross Section/Probability
W. U
do S
chrö
der,
20
10
ANSEL Expt 1: Gamma Spectroscopy
5
b 0 T
d
b0 T
Flux of particles b
d ,dN , j N d
d
dN , d ,j N
d d
A( a ,b )B
Reaction A a B b
Projectile current j0
d Ejectile numbers
TN
bdN ,
Projectile current j0
DetectorDWdet
b detbd
,dN
N,,
dd
Ejectile numbers measured
A( a,b )B
Reaction cross section :
Spherical Coordinates
W. U
do S
chrö
der,
20
10
ANSEL Expt 1: Gamma Spectroscopy
6
q
f
dq
df
rrsinq
rsin q df
r dq
x
y
z
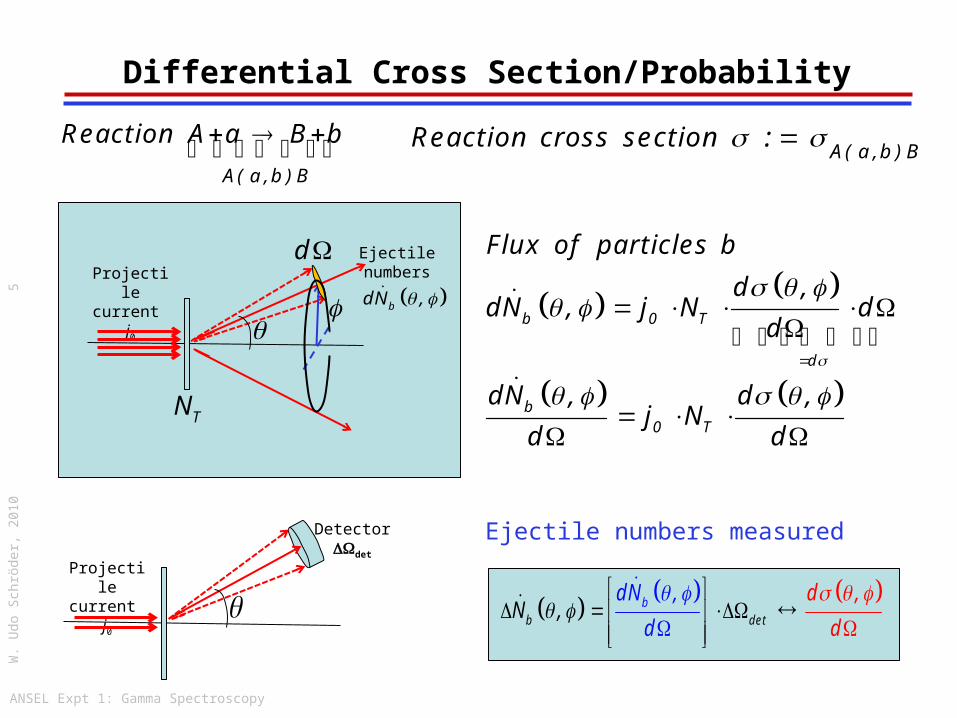
Spherical Coordinates
x r sin cos
y r sin sin
z r cos
dr
dA
Volume Element dV=dA·dr
3
2
2
2
0 0
Volume Element
d r dx dy dz
r dr d sin d
Solid angle element
dAd d sin d
rIntegral :
d d sin d 4
2
2 2sphere
Total Solid Angle :
dA 4 rd 4
r r Unit of s.a. = sr (steradian)

Scope of ANSEL Experiment 1
• Ubiquitous presence of radiation on Earth, e.g., g-ray photons
• Concepts of absorption coefficient and cross section
• Introduction to g-interactions with matterPhoto electric effectCompton scatteringPair production
• Operational principles of inorganic scintillation detectors
• Examples of energy spectra with NaI(Tl) detectors• Experimental setup with a 3”x3” NaI(Tl) detector• Lab measurements in Expt. 1
W. Udo Schröder, 2010
AN
SEL
Exp
t 1
: G
am
ma S
pect
rosc
op
y 7

W. Udo Schröder, 2010
AN
SE
L E
xpt 1
: Gam
ma
Spe
ctro
scop
y 8
g-Induced Processes in Matter
g-rays (photons): from electromagnetic transitions between different nuclear energy states detect indirectly (charged particles, e-, e+)Detection of secondary particles from: 1. Photo-electric
absorption2. Compton scattering3. Pair production4. g-induced reactions
1. Photo-electric absorption (Photo-effect)
ħw photon is completely absorbed by e-, which is kicked out of atom
2
2
;
'
13.6
3, 5,
kin n n
n
K L
E E E binding energy
ZE Rhc Moseley s Law
nRhc eV Rydberg constant
screening constants
different subshells
ħw A
Electronic vacancies are filled by low-energy “Auger” transitions of electrons from higher orbits

W. Udo Schröder, 2010
AN
SE
L E
xpt 1
: Gam
ma
Spe
ctro
scop
y 9
1. Photo-Absorption Coefficient
5 7 4
5 1 2
( , )
( , )
PE
PE
E Z Z E low E
E Z Z E high E
g g g
g g g
Absorption coefficient m (1/cm)
“Mass absorption” is measured per density r
/m r (cm2/g)
“Cross section” is measured per atom
s (cm2/atom)
Abso
rpti
on C
oeffi
cient
/m
r (c
m2/g
)
Pt
Wave Length l (Å)
Absorption of light is quantal resonance phenomenon: Strongest when photon energy coincides with transition energy (at K,L,… “edges”)
Probabilities for independent processes are additive:
mPE = mPE(K)+mPE(L)+…
W. Udo Schröder, 2010
AN
SE
L E
xpt 1
: Gam
ma
Spe
ctro
scop
y 1
0
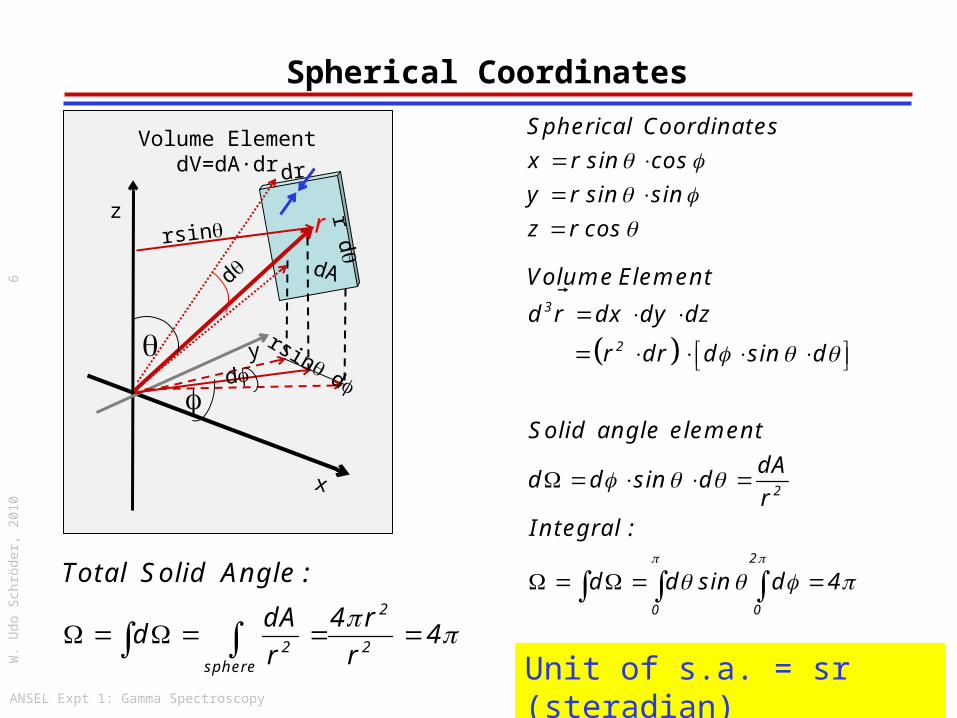
2. Photon Scattering (Compton Effect)2 2 2 2
0 0( ) ( ) : 0Relativistic E pc m c photons m m
E p c
g
g g g
22
2 2 2 2
222 2
2
2
:
2 cos
:
0.511
1 1 cos
g g g g
g g g g
g g
gg
g
e e
e
e e e
e
e
Momentum balance
p p p p c p p c
p c E E E E
Energy balance
E m c E p c m c
m c MeV
EE
E m c
q
f
l l’
1 cos
" "
22.426
C
C
Ce
Compton wave length
pmm c
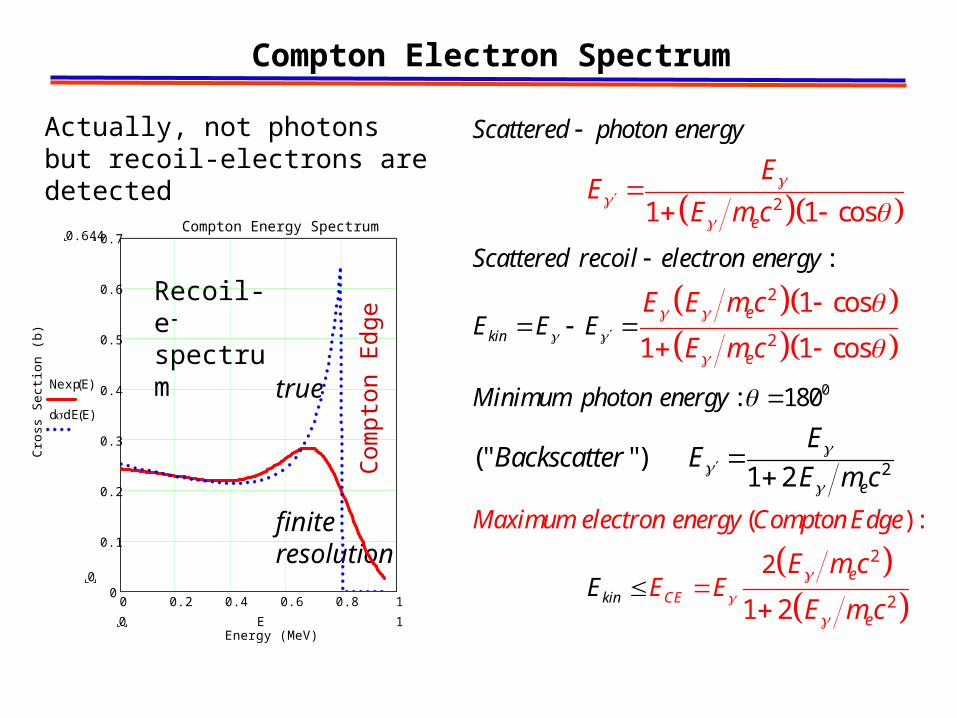
Compton Electron Spectrum
0 0.2 0.4 0.6 0.8 10
0.1
0.2
0.3
0.4
0.5
0.6
0.7Compton Energy Spectrum
Energy (MeV)
Cro
ss S
ectio
n (b
)
0.644
0
Nexp E( )
ddE E( )
10 E
0
2
2
2
2
:
: 1
(
80
1 1 cos
1 cos
1 1 cos
(" ")1 2
kin
e
e
e
e
Maximum electron energy Compton Ed
Scattered photon energy
Scattered recoil electron energy
E E E
Minimum photon energy
EBackscatter E
EE
E m c
E E m c
m
E
c
m
E
c
g g
gg
g
g g
g
gg
g
2
2
) :
2
1 2kin CE
e
e
ge
EE EE m c
E m cg
g
g
Actually, not photons but recoil-electrons are detected
Recoil-e-
spectrum
true
finite resolution
Com
pto
n E
dge

W. Udo Schröder, 2010
AN
SE
L E
xpt 1
: Gam
ma
Spe
ctro
scop
y 1
2
3. Pair Creation by High-Energy g-rays
{e+, e-,e-} triplet and one doublet in H bubble chamber
Magnetic field provides momentum/charge analysis
Event A) g-ray (photon) hits atomic electron and produces {e-,e+} pair
Event B) one photon converts into a {e-,e+} pair
In each case, the photon leaves no trace in the bubble chamber, before a first interaction with a charged particle (electron or nucleus).
Magnetic field
e-
e-
e-
e+
e+
g-rays
A
B
W. Udo Schröder, 2010
AN
SE
L E
xpt 1
: Gam
ma
Spe
ctro
scop
y 1
3
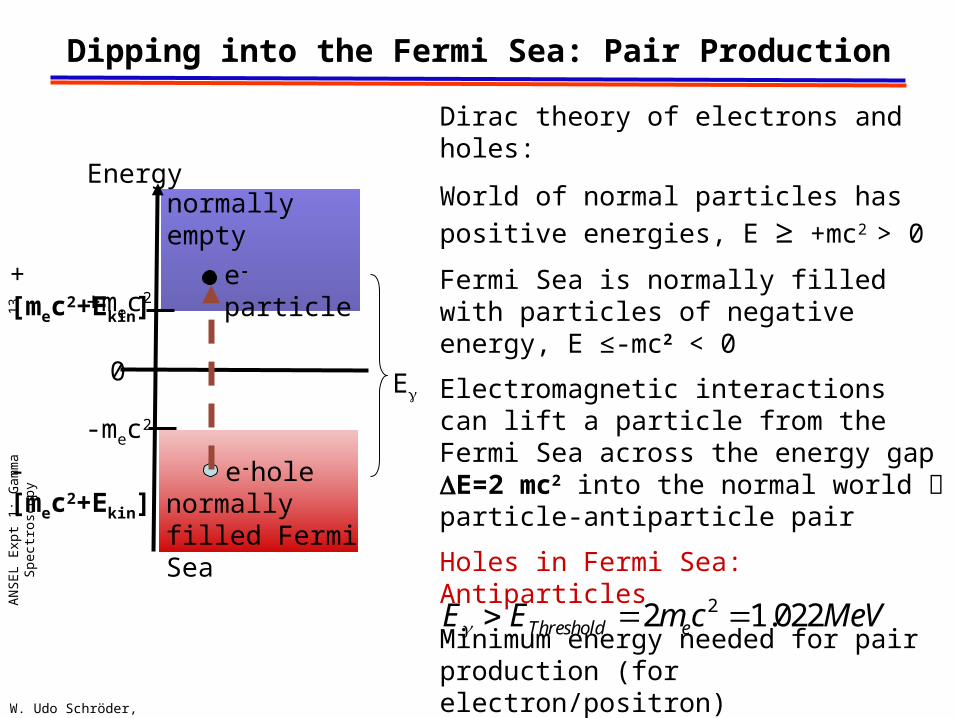
Dipping into the Fermi Sea: Pair Production
22 1.022Threshold eE E m c MeVg
Dirac theory of electrons and holes:
World of normal particles has positive energies, E ≥ +mc2 > 0
Fermi Sea is normally filled with particles of negative energy, E ≤-mc2 < 0
Electromagnetic interactions can lift a particle from the Fermi Sea across the energy gap DE=2 mc2 into the normal world particle-antiparticle pair
Holes in Fermi Sea: Antiparticles
Minimum energy needed for pair production (for electron/positron)
Energy
0
-mec2
+mec2
normally filled Fermi Sea
normally empty
e-hole
e-particle
Eg
-[mec2+Eki
n]
+[mec2+Eki
n]

W. Udo Schröder, 2010
AN
SE
L E
xpt 1
: Gam
ma
Spe
ctro
scop
y 1
4
The Nucleus as Collision Partner
2
2
2
: 2 ....
Threshold e
e kin kin
E E m c
Actually converted E m c E E
g
g
28 2 2
222
2 2
5.8 10 2
( , )1
137 2
e
PP
kin e e
cm E m c
P Z Ed eZ
dE m c E m c
P slowly varyingg
g
g
Increase with Eg because interaction sufficient at larger distance from nucleus
Eventual saturation because of screening of charge at larger distances
Excess momentum requires presence of nucleus as additional charged body.
e+
e-
recoil nucleus
g
Pb
1barn = 10-
24cm2
W. Udo Schröder, 2010
AN
SE
L E
xpt 1
: Gam
ma
Spe
ctro
scop
y 1
5
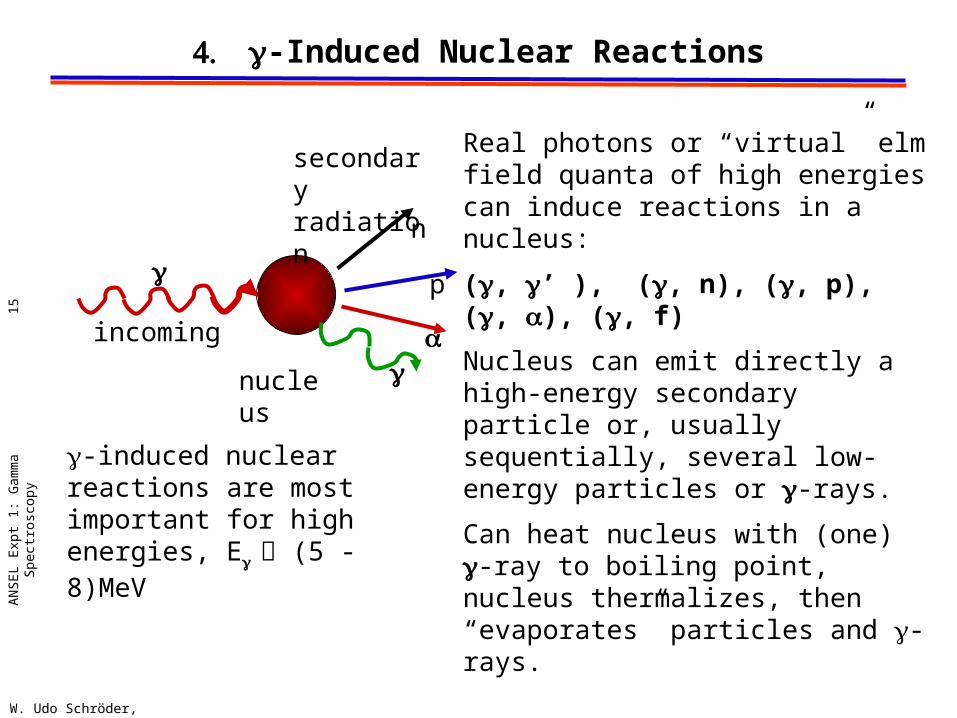
4. g-Induced Nuclear Reactions
Real photons or “virtual” elm field quanta of high energies can induce reactions in a nucleus:
(g, g’ ), (g, n), (g, p), (g, a), (g, f)
Nucleus can emit directly a high-energy secondary particle or, usually sequentially, several low-energy particles or g-rays.
Can heat nucleus with (one) g-ray to boiling point, nucleus thermalizes, then “evaporates” particles and g-rays.
n
a
nucleus
g
g
secondary radiation
p
incoming
g-induced nuclear reactions are most important for high energies, Eg (5 - 8)MeV

W. Udo Schröder, 2010
AN
SE
L E
xpt 1
: Gam
ma
Spe
ctro
scop
y 1
6
Efficiencies of g-Induced Processes
Different processes are dominant at different g energies:
Photo absorption at low Eg
Pair production at high Eg > 5 MeV
Compton scattering at intermediate Eg.
Z dependence important: Ge(Z=32) has higher efficiency for all processes than Si(Z=14). Take high-Z for large photo-absorption coefficient
Response of detector depends on
• detector material
• detector shape
• Eg
Scope of ANSEL Experiment 1
• Ubiquitous presence of radiation on Earth, e.g., g-ray photons
• Concepts of absorption coefficient and cross section
• Introduction to g-interactions with matterPhoto electric effectCompton scatteringPair production
• Operational principles of inorganic scintillation detectors
• Examples of energy spectra with NaI(Tl) detectors• Experimental setup with a 3”x3” NaI(Tl) detector• Lab measurements in Expt. 1
W. Udo Schröder, 2010
AN
SEL
Exp
t 1
: G
am
ma S
pect
rosc
op
y 1
7
Sci
ntill
atio
nDet
W. Udo Schröder, 2007
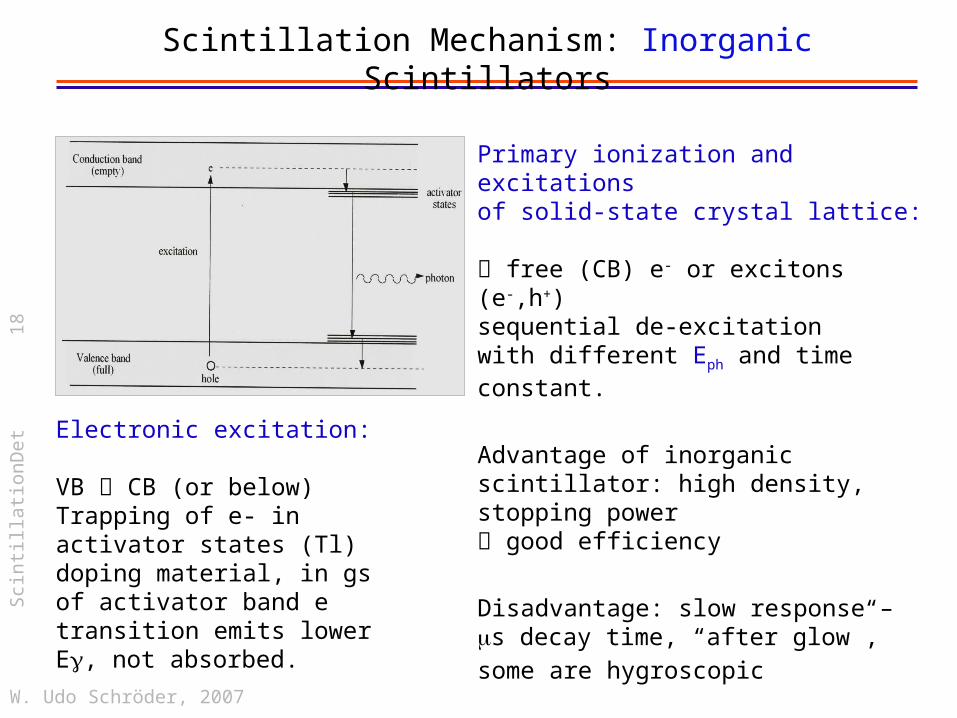
Scintillation Mechanism: Inorganic Scintillators
Primary ionization and excitations of solid-state crystal lattice: free (CB) e- or excitons (e-,h+)sequential de-excitation with different Eph and time constant.
Advantage of inorganic scintillator: high density, stopping power good efficiency
Disadvantage: slow response – ms decay time, “after glow”,some are hygroscopic
Electronic excitation: VB CB (or below)Trapping of e- in activator states (Tl) doping material, in gs of activator band e transition emits lower Eg, not absorbed.
18

Sci
ntill
atio
nDet
W. Udo Schröder, 2007
Environment of g Scintillation Measurement
19
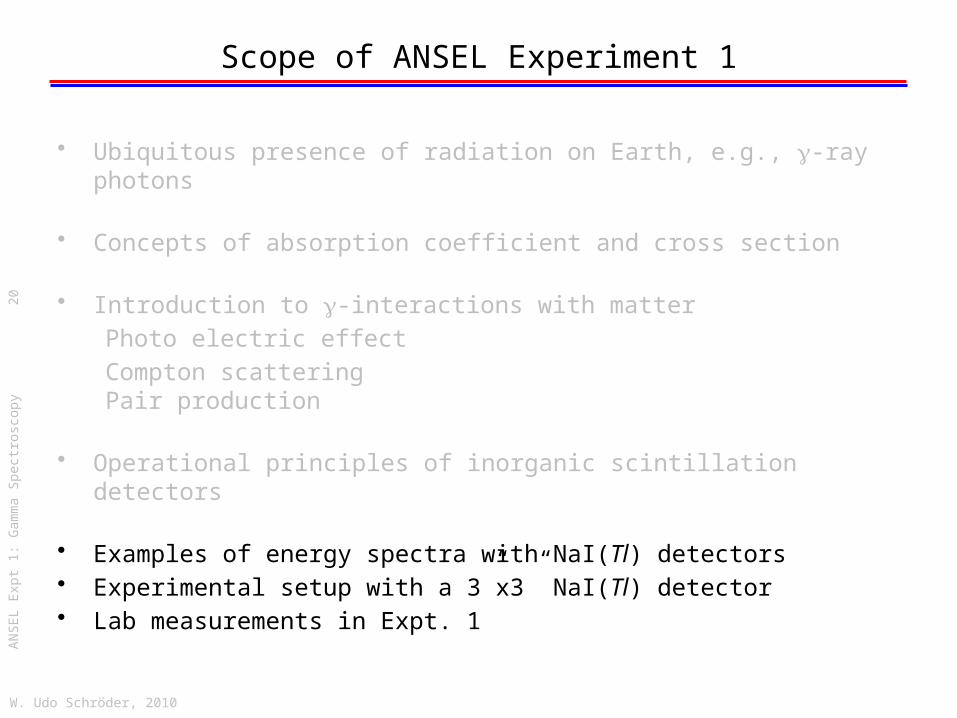
Scope of ANSEL Experiment 1
• Ubiquitous presence of radiation on Earth, e.g., g-ray photons
• Concepts of absorption coefficient and cross section
• Introduction to g-interactions with matterPhoto electric effectCompton scatteringPair production
• Operational principles of inorganic scintillation detectors
• Examples of energy spectra with NaI(Tl) detectors• Experimental setup with a 3”x3” NaI(Tl) detector• Lab measurements in Expt. 1
W. Udo Schröder, 2010
AN
SEL
Exp
t 1
: G
am
ma S
pect
rosc
op
y 2
0

W. Udo Schröder, 2010
AN
SE
L E
xpt 1
: Gam
ma
Spe
ctro
scop
y 2
1
Shapes of Low-Energy g Spectra
Photons/g-rays are measured only via their interactions with charged particles, mainly with the electrons of the detector material. The energies of these e- are measured by a detector.
The energy Eg of an incoming photon can be completely converted into charged particles which are all absorbed by the detector, measured energy spectrum shows only the full-energy peak (FE, red) Example: photo effect with absorption of struck e-
The incoming photon may only scatter off an atomic e- and then leave the detector Compton-e- energy spectrum (CE, dark blue)An incoming g-ray may come from back-scattering off
materials outside the detector backscatter bump (BSc)
measured energy
measu
red
in
ten
sit
y

W. Udo Schröder, 2010
AN
SE
L E
xpt 1
: Gam
ma
Spe
ctro
scop
y 2
2
measured energy (MeV)
measu
red
in
ten
sit
yShapes of High-Energy g Spectra
High-Eg can lead to e+/e- pair production,
e-: stopped in the detector
e+: annihilates with another e- producing 2 g-rays, each with Eg = 511 keV.
One of the 511 keV can escape detector single escape peak (SE) at FE-511 keV
Both of them can escape detector double escape peak (DE) at FE-1.022 MeV
The energy spectra of high-energy g-rays have all of the features of low-energy g-ray spectra
e+/e- annihilation in detector or its vicinity produces 511keV g-rays
FE

W. Udo Schröder, 2010
AN
SE
L E
xpt 1
: Gam
ma
Spe
ctro
scop
y 2
3
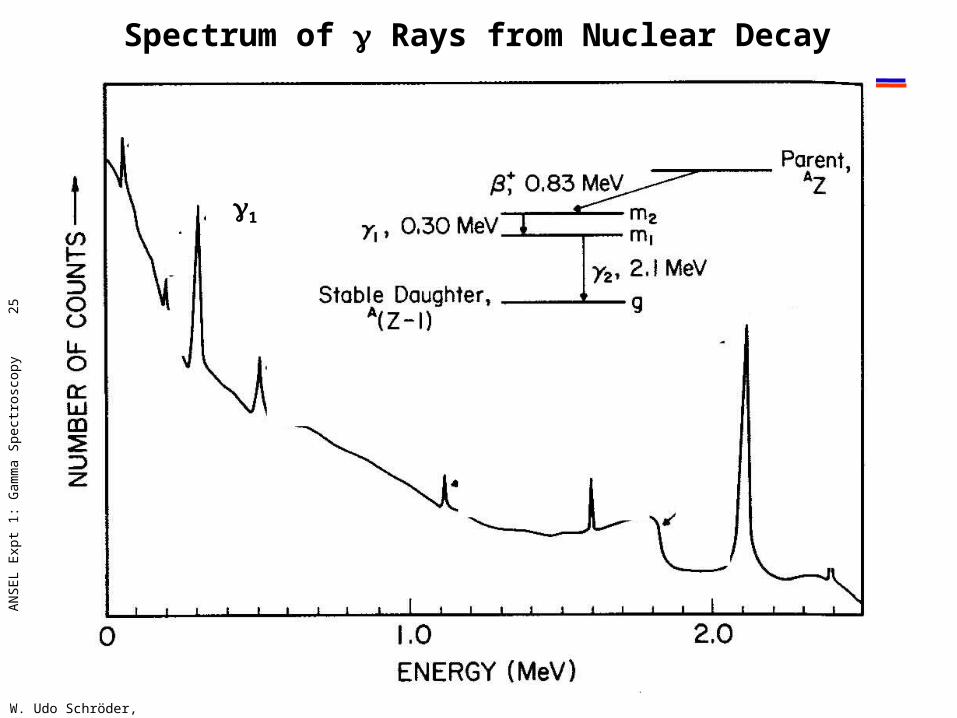
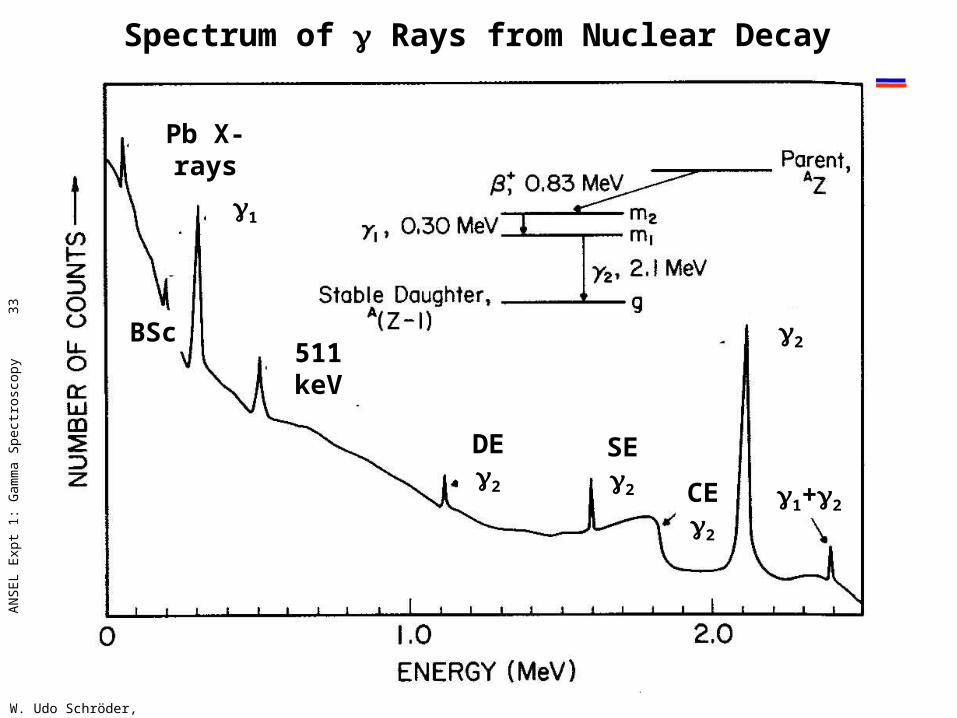
Quiz
• Try to identify the various features of the g spectrum shown next (well, it is really the spectrum of electrons hit or created by the incoming or secondary photons), as measured with a highly efficient detector and a radio-active AZ source in a Pb housing.
• The g spectrum is the result of a decay in cascade of the radio-active daughter isotope A(Z-1) with the photons g1 and g2 emitted (practically) together
• Start looking for the full-energy peaks for g1, g2,…; then identify Compton edges, single- and double-escape peaks, followed by other spectral features to be expected.
• The individual answers are given in sequence on the following slides.

W. Udo Schröder, 2010
AN
SE
L E
xpt 1
: Gam
ma
Spe
ctro
scop
y 2
4
Spectrum of g Rays from Nuclear Decay
W. Udo Schröder, 2010
AN
SE
L E
xpt 1
: Gam
ma
Spe
ctro
scop
y 2
5
Spectrum of g Rays from Nuclear Decay
g1

W. Udo Schröder, 2010
AN
SE
L E
xpt 1
: Gam
ma
Spe
ctro
scop
y 2
6
Spectrum of g Rays from Nuclear Decay
g2
g1

W. Udo Schröder, 2010
AN
SE
L E
xpt 1
: Gam
ma
Spe
ctro
scop
y 2
7
Spectrum of g Rays from Nuclear Decay
g2
g1
CE g2

W. Udo Schröder, 2010
AN
SE
L E
xpt 1
: Gam
ma
Spe
ctro
scop
y 2
8
Spectrum of g Rays from Nuclear Decay
g2
g1
SE g2
CE g2

W. Udo Schröder, 2010
AN
SE
L E
xpt 1
: Gam
ma
Spe
ctro
scop
y 2
9
Spectrum of g Rays from Nuclear Decay
g2
g1
SE g2
DE g2 C
E g2

W. Udo Schröder, 2010
AN
SE
L E
xpt 1
: Gam
ma
Spe
ctro
scop
y 3
0
Spectrum of g Rays from Nuclear Decay
g2
g1
SE g2
DE g2
511 keV
CE g2

W. Udo Schröder, 2010
AN
SE
L E
xpt 1
: Gam
ma
Spe
ctro
scop
y 3
1
Spectrum of g Rays from Nuclear Decay
g2
g1
BSc
SE g2
DE g2
511 keV
CE g2
W. Udo Schröder, 2010
AN
SE
L E
xpt 1
: Gam
ma
Spe
ctro
scop
y 3
2
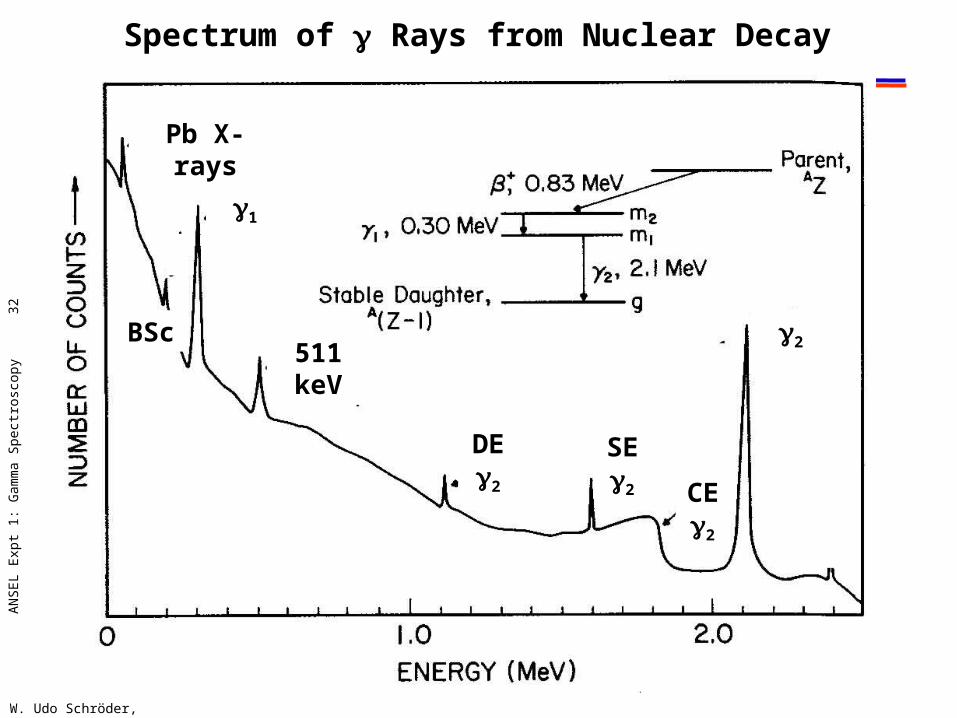
Spectrum of g Rays from Nuclear Decay
g2
g1
BSc
SE g2
DE g2
511 keV
CE g2
Pb X-rays
W. Udo Schröder, 2010
AN
SE
L E
xpt 1
: Gam
ma
Spe
ctro
scop
y 3
3
Spectrum of g Rays from Nuclear Decay
g1+g
2
g2
g1
BSc
SE g2
DE g2
511 keV
CE g2
Pb X-rays
Scope of ANSEL Experiment 1
• Ubiquitous presence of radiation on Earth, e.g., g-ray photons
• Concepts of absorption coefficient and cross section
• Introduction to g-interactions with matterPhoto electric effectCompton scatteringPair production
• Operational principles of inorganic scintillation detectors
• Examples of energy spectra with NaI(Tl) detectors• Experimental setup with a 3”x3” NaI(Tl) detector• Lab measurements in Expt. 1
W. Udo Schröder, 2010
AN
SEL
Exp
t 1
: G
am
ma S
pect
rosc
op
y 3
4

Prin
cipl
es M
eas
W. Udo Schröder, 2004
35
Slow
Fast
Produce logical signal
Principle of Fast-Slow Signal Processing
DiscrimCFTD
PreAmp
Amp
Gate Generator
Data Acquisition System
Energy
Gate
0
0t
t
CFTD Output
CFTD Internal
t
CFTD Input
Principle of a Constant-Fraction Timing Discriminator:
t independent of E
here f = 0.5
Source
Produce analog signal Binary
data to computer
NaI Det.
Scope of ANSEL Experiment 1
• Ubiquitous presence of radiation on Earth, e.g., g-ray photons
• Concepts of absorption coefficient and cross section
• Introduction to g-interactions with matterPhoto electric effectCompton scatteringPair production
• Operational principles of inorganic scintillation detectors
• Examples of energy spectra with NaI(Tl) detectors• Experimental setup with a 3”x3” NaI(Tl) detector• Lab measurements in Expt. 1
W. Udo Schröder, 2010
AN
SEL
Exp
t 1
: G
am
ma S
pect
rosc
op
y 3
6
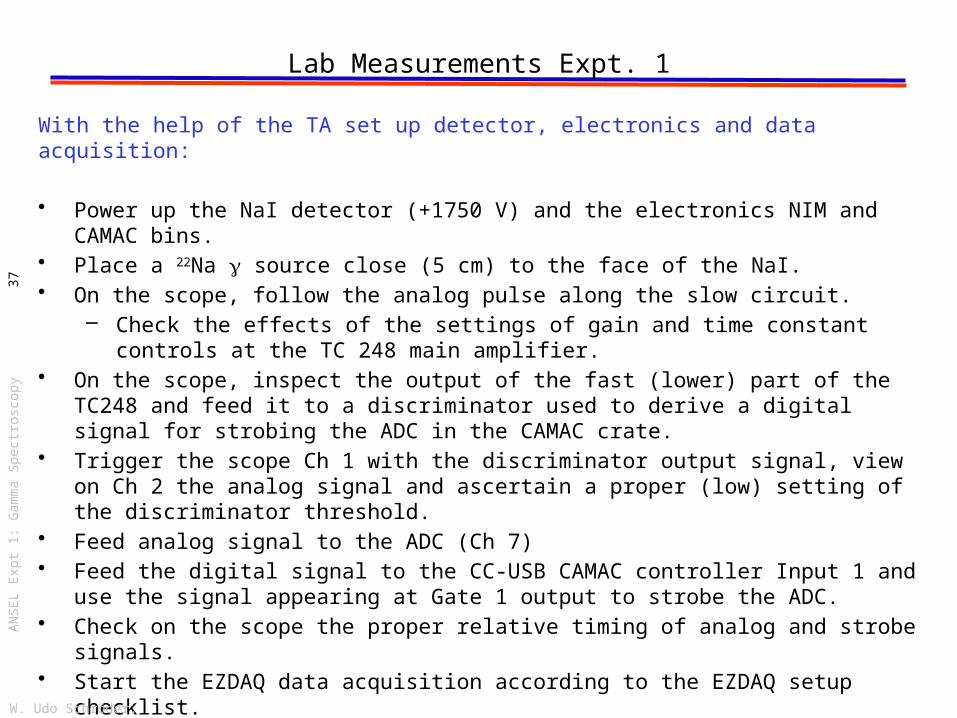
Lab Measurements Expt. 1
With the help of the TA set up detector, electronics and data acquisition:
• Power up the NaI detector (+1750 V) and the electronics NIM and CAMAC bins.• Place a 22Na g source close (5 cm) to the face of the NaI. • On the scope, follow the analog pulse along the slow circuit.
– Check the effects of the settings of gain and time constant controls at the TC 248 main amplifier.
• On the scope, inspect the output of the fast (lower) part of the TC248 and feed it to a discriminator used to derive a digital signal for strobing the ADC in the CAMAC crate.
• Trigger the scope Ch 1 with the discriminator output signal, view on Ch 2 the analog signal and ascertain a proper (low) setting of the discriminator threshold.
• Feed analog signal to the ADC (Ch 7)• Feed the digital signal to the CC-USB CAMAC controller Input 1 and use the
signal appearing at Gate 1 output to strobe the ADC.• Check on the scope the proper relative timing of analog and strobe signals.• Start the EZDAQ data acquisition according to the EZDAQ setup checklist.
• Accumulate, display and save a 22Na g energy spectrum in histogram form.
W. Udo Schröder, 2010
AN
SE
L E
xpt 1
: Gam
ma
Spe
ctro
scop
y 3
7

Source Info
W. Udo Schröder, 2010
AN
SE
L E
xpt 1
: Gam
ma
Spe
ctro
scop
y 3
8
Counts
/keV
Set of typical Calibration g-ray sources
Semi-log plot of a calibrated 22Na g-ray spectrum taken with a 3”x3’ NaI(Tl) detector
Lab Measurements Expt. 1 (cont’d)
• Check the appearance of the NaI spectrum for the 22Na g source and place the dominant structure in the middle of the spectrum by adjusting fine and coarse gain of the main amplifier.
• After the above choice of gain (and previous integration) parameters, do not change the amplifier settings for any of the additional measurements.
• Take a final measurement for the Na source (5 min). Then remove this source and place it far away from the detector (in the cabinet).
• Based on the 22Na g energy spectrum, perform a coarse calibration of the ADC channel numbers in g-ray energy. In this task utilize the well measured channel # positions of the full-energy peak (1.275 MeV), of the associated Compton edge (ECE = ?? MeV) and of the 0.511 MeV annihilation peak.
• Perform similar, individual measurements for the 60Co and 54Mn sources. • Verify that the main g lines for these sources appear in the spectrum
approximately at the expected locations.• Measure the g-ray energy spectrum for the unknown source. • Remove all sources from the vicinity of the NaI detector and perform a
measurement of g-ray energy spectrum of the room background. To accumulate sufficient intensity, accumulate data for at least several hours (possibly overnight).
W. Udo Schröder, 2010
AN
SE
L E
xpt 1
: Gam
ma
Spe
ctro
scop
y 3
9

Data Analysis Expt. 1
• Identify in the measured spectra for the three known sources the prominent spectral features and correlate their channel positions (ch#) with the known energies (Eg or ECE). In the fits keep track of experimental errors. Use Gaussians for g lines and half-Gaussians for Compton edges.
• Generate a calibration table and a plot of energies of the positively identified prominent spectral features from the three known sources (22Na, 60Co, 54Mn) vs. the experimental channel numbers for these features.
• Perform a least-squares fit for the calibration data E g (ch#) and include the best-fit line in the calibration table and plot.
• Generate plots of all measured energy spectra as Counts/keV vs. Energy/MeV. • Identify the g-ray energies of prominent features in the spectrum for the
unknown source. Based on the provided search table, suggest the identity of the unknown source (or source mix).
• Identify the g-ray energies of prominent features in the spectrum for the room background. Based on the provided search table, suggest the identities of the various components.
W. Udo Schröder, 2010
AN
SE
L E
xpt 1
: Gam
ma
Spe
ctro
scop
y 4
0

Sample Spectrum
W. Udo Schröder, 2010
AN
SE
L E
xpt 1
: Gam
ma
Spe
ctro
scop
y 4
1
Counts
/channel
Related Documents